Kort testrapport Lenovo IdeaPad Gaming 3i 15IMH05: Core i5 op volle toeren
Evaluatie | Datum | Model | Gewicht | Hoogte | Formaat | Resolutie | Beste prijs |
|---|---|---|---|---|---|---|---|
| 78.4 % v7 (old) | 07-2020 | Lenovo IdeaPad Gaming 3i 15IMH05 i5-10300H, GeForce GTX 1650 Mobile | 2.2 kg | 24.9 mm | 15.60" | 1920x1080 | |
| 80.4 % v6 (old) | 07-2019 | Asus TUF FX505DT-EB73 R7 3750H, GeForce GTX 1650 Mobile | 2.2 kg | 26.8 mm | 15.60" | 1920x1080 | |
| 79.3 % v7 (old) | 10-2019 | Dell G3 3590 i5-9300H, GeForce GTX 1650 Mobile | 2.5 kg | 21.6 mm | 15.60" | 1920x1080 | |
| 77.6 % v7 (old) | 01-2020 | MSI GF63 Thin 9SC i5-9300H, GeForce GTX 1650 Max-Q | 1.8 kg | 22 mm | 15.60" | 1920x1080 | |
| 75.4 % v7 (old) | HP Pavilion Gaming 15-ec0002ng R5 3550H, GeForce GTX 1050 Mobile | 2.3 kg | 23.5 mm | 15.60" | 1920x1080 | ||
| 78.8 % v7 (old) | 02-2020 | MSI Alpha 15 A3DDK-034 R7 3750H, Radeon RX 5500M | 2.3 kg | 27.5 mm | 15.60" | 1920x1080 | |
| 79.8 % v7 (old) | 07-2020 | Acer Nitro 5 AN515-44-R5FT R5 4600H, GeForce GTX 1650 Ti Mobile | 2.2 kg | 24 mm | 15.60" | 1920x1080 |

| Networking | |
| iperf3 transmit AX12 | |
| Acer Nitro 5 AN515-44-R5FT | |
| MSI GF63 Thin 9SC | |
| Gemiddeld Intel Wireless-AC 9560 (309 - 1350, n=182) | |
| HP Pavilion Gaming 15-ec0002ng | |
| MSI Alpha 15 A3DDK-034 | |
| Lenovo IdeaPad Gaming 3i 15IMH05 | |
| Asus TUF FX505DT-EB73 | |
| Lenovo IdeaPad L340-15IRH 81LK00BMGE | |
| Dell G3 3590 | |
| iperf3 receive AX12 | |
| Acer Nitro 5 AN515-44-R5FT | |
| MSI GF63 Thin 9SC | |
| Gemiddeld Intel Wireless-AC 9560 (288 - 1390, n=183) | |
| MSI Alpha 15 A3DDK-034 | |
| Lenovo IdeaPad Gaming 3i 15IMH05 | |
| HP Pavilion Gaming 15-ec0002ng | |
| Asus TUF FX505DT-EB73 | |
| Dell G3 3590 | |
| Lenovo IdeaPad L340-15IRH 81LK00BMGE | |


| |||||||||||||||||||||||||
Helderheidsverdeling: 70 %
Helderheid in Batterij-modus: 300 cd/m²
Contrast: 753:1 (Zwart: 0.405 cd/m²)
ΔE ColorChecker Calman: 6.01 | ∀{0.5-29.43 Ø4.71}
calibrated: 5.12
ΔE Greyscale Calman: 3.23 | ∀{0.09-98 Ø4.96}
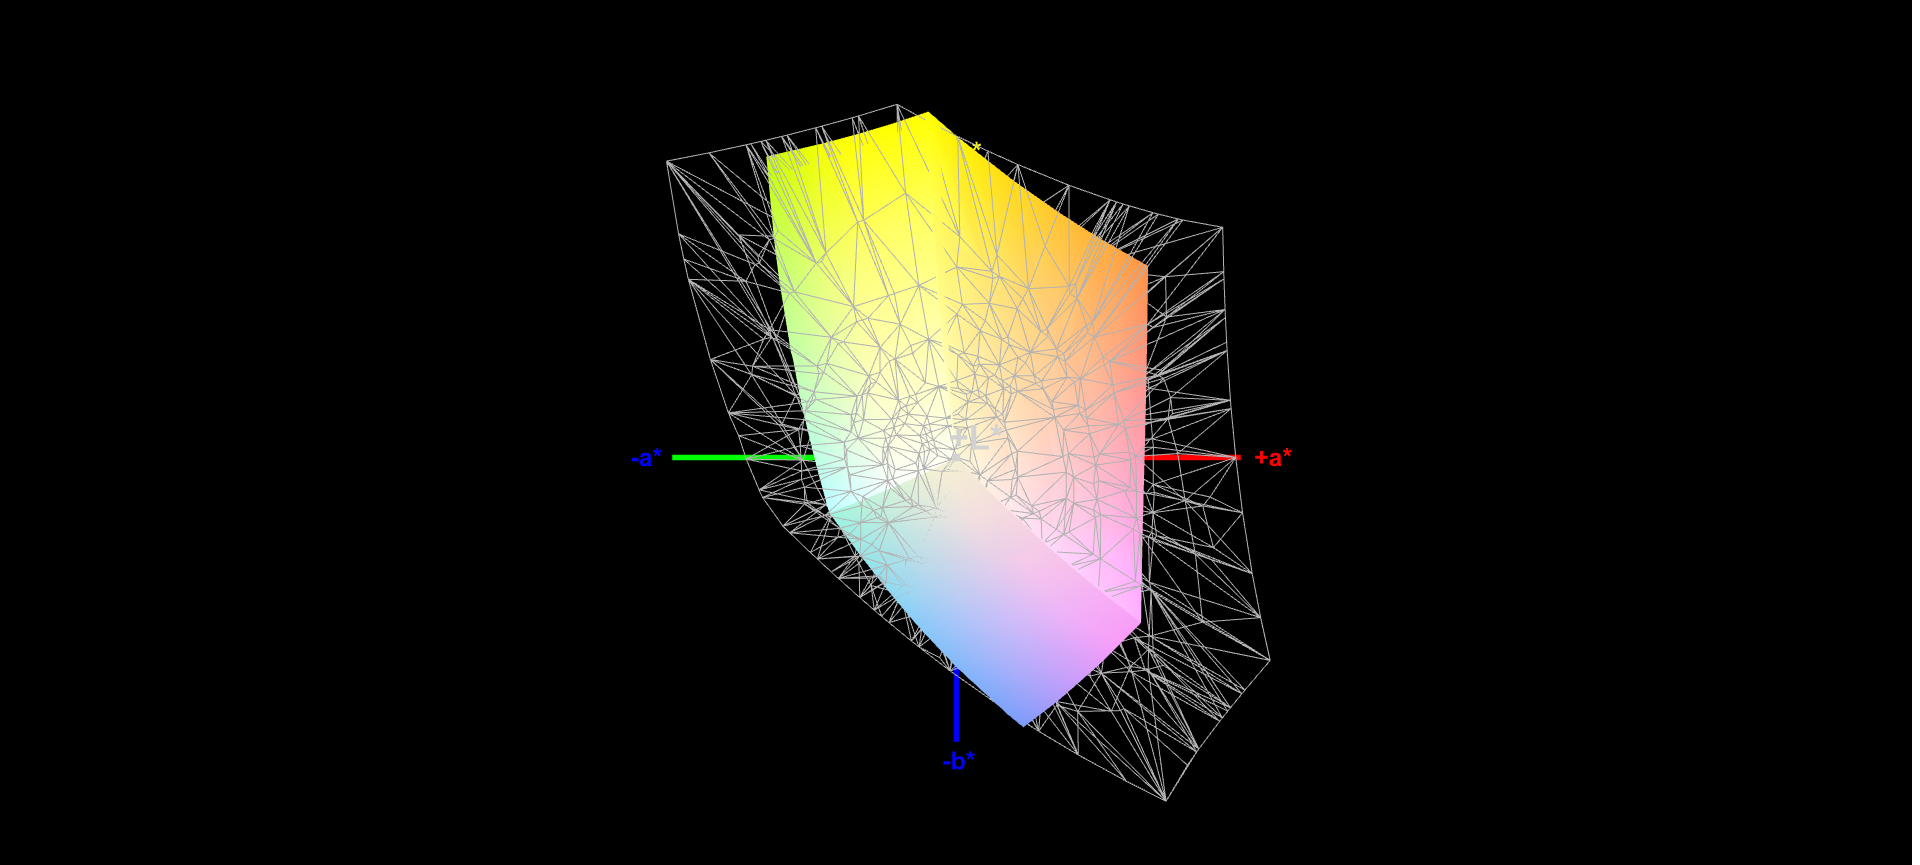
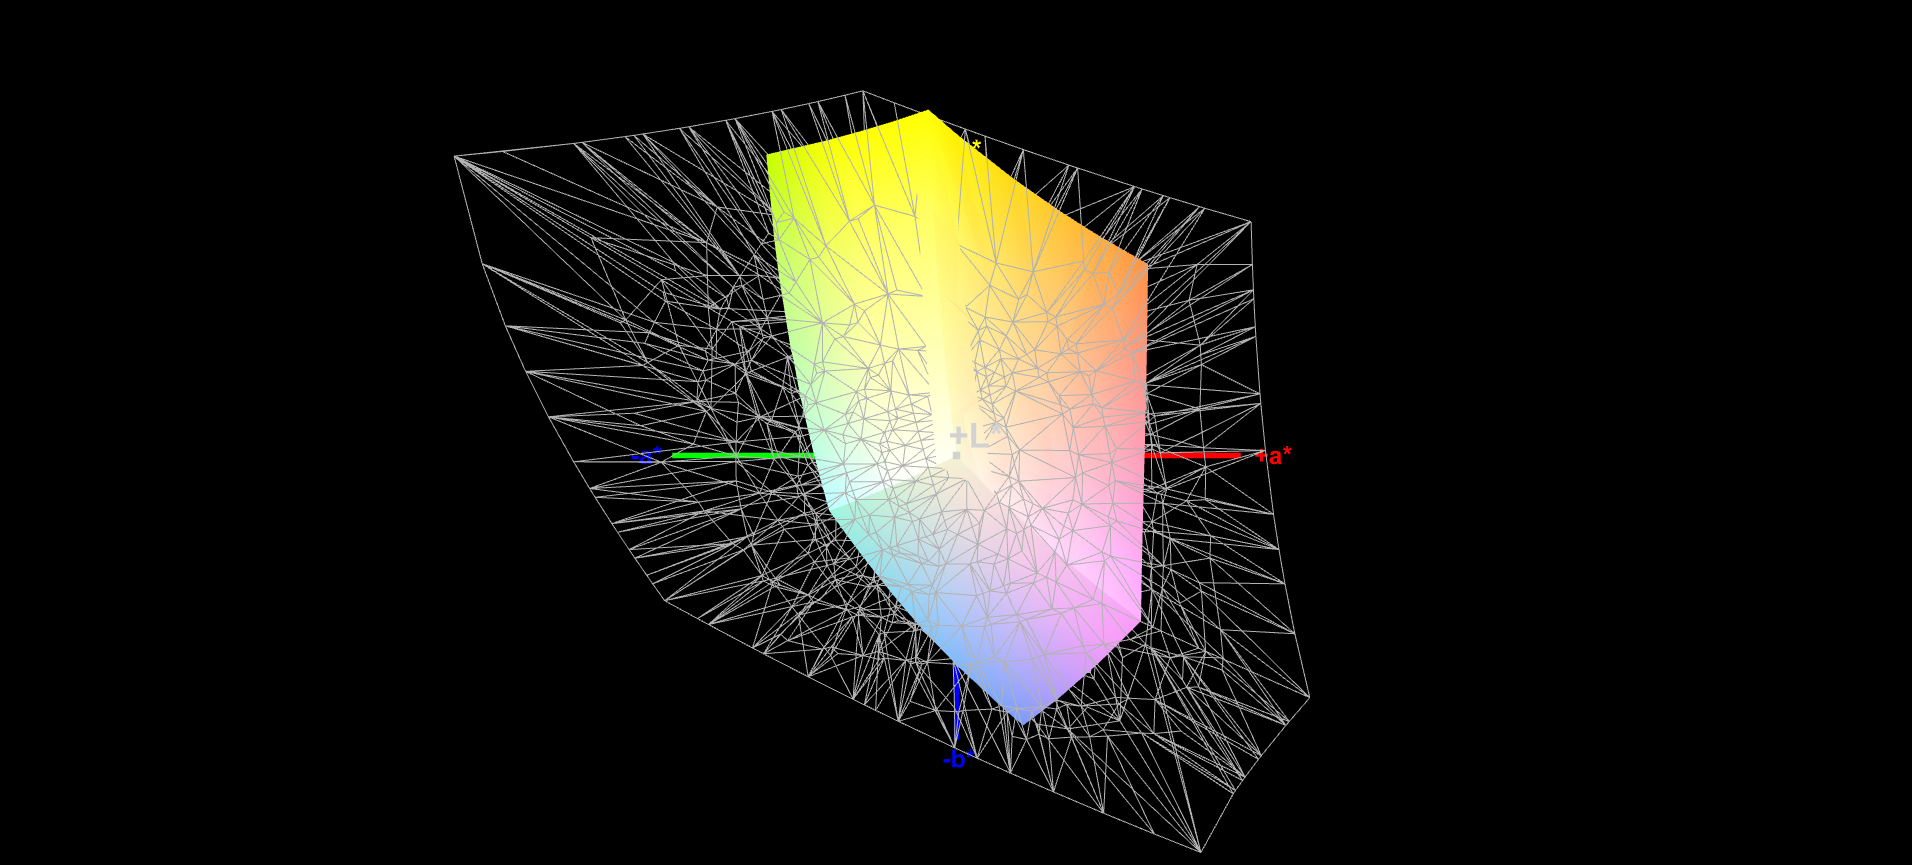
56% sRGB (Argyll 1.6.3 3D)
36% AdobeRGB 1998 (Argyll 1.6.3 3D)
39.3% AdobeRGB 1998 (Argyll 3D)
56.6% sRGB (Argyll 3D)
38.04% Display P3 (Argyll 3D)
Gamma: 2.43
CCT: 6818 K
| Lenovo IdeaPad Gaming 3i 15IMH05 IPS, 1920x1080, 15.6" | Asus TUF FX505DT-EB73 IPS, 1920x1080, 15.6" | Dell G3 3590 IPS, 1920x1080, 15.6" | MSI GF63 Thin 9SC IPS, 1920x1080, 15.6" | HP Pavilion Gaming 15-ec0002ng TN LED, 1920x1080, 15.6" | MSI Alpha 15 A3DDK-034 IPS, 1920x1080, 15.6" | Acer Nitro 5 AN515-44-R5FT IPS, 1920x1080, 15.6" | Lenovo IdeaPad L340-15IRH 81LK00BMGE IPS, 1920x1080, 15.6" | |
|---|---|---|---|---|---|---|---|---|
| Display | 4% | 6% | -1% | 8% | 68% | 8% | 13% | |
| Display P3 Coverage (%) | 38.04 | 39.56 4% | 40.13 5% | 37.76 -1% | 41.22 8% | 66.4 75% | 41.16 8% | 42.81 13% |
| sRGB Coverage (%) | 56.6 | 59.5 5% | 59.8 6% | 56.5 0% | 61.8 9% | 91 61% | 61.8 9% | 63.8 13% |
| AdobeRGB 1998 Coverage (%) | 39.3 | 40.91 4% | 41.47 6% | 39.01 -1% | 42.62 8% | 66.6 69% | 42.56 8% | 44.31 13% |
| Response Times | -42% | -88% | -83% | -32% | 56% | -70% | -82% | |
| Response Time Grey 50% / Grey 80% * (ms) | 25 ? | 30.4 ? -22% | 46 ? -84% | 44.8 ? -79% | 44 ? -76% | 7 ? 72% | 40.8 ? -63% | 45.6 ? -82% |
| Response Time Black / White * (ms) | 17 ? | 27.6 ? -62% | 32.4 ? -91% | 31.6 ? -86% | 15 ? 12% | 10.4 ? 39% | 30 ? -76% | 30.8 ? -81% |
| PWM Frequency (Hz) | 200 ? | 250 ? | 25910 ? | |||||
| Screen | 2% | 11% | 21% | -28% | 29% | 20% | 18% | |
| Brightness middle (cd/m²) | 305 | 286.2 -6% | 276.2 -9% | 260 -15% | 233 -24% | 310 2% | 287 -6% | 275 -10% |
| Brightness (cd/m²) | 294 | 267 -9% | 261 -11% | 249 -15% | 211 -28% | 310 5% | 271 -8% | 253 -14% |
| Brightness Distribution (%) | 70 | 84 20% | 86 23% | 92 31% | 82 17% | 86 23% | 88 26% | 83 19% |
| Black Level * (cd/m²) | 0.405 | 0.33 19% | 0.24 41% | 0.23 43% | 0.405 -0% | 0.29 28% | 0.25 38% | 0.18 56% |
| Contrast (:1) | 753 | 867 15% | 1151 53% | 1130 50% | 575 -24% | 1069 42% | 1148 52% | 1528 103% |
| Colorchecker dE 2000 * | 6.01 | 5.45 9% | 5.56 7% | 4.1 32% | 8.22 -37% | 4.78 20% | 4.77 21% | 5.4 10% |
| Colorchecker dE 2000 max. * | 21.9 | 18.08 17% | 23.45 -7% | 7.93 64% | 18.6 15% | 8.1 63% | 17.15 22% | 21.3 3% |
| Colorchecker dE 2000 calibrated * | 5.12 | 4.47 13% | 5.23 -2% | 3.56 30% | 2.36 54% | 3.73 27% | 4.4 14% | |
| Greyscale dE 2000 * | 3.23 | 5.3 -64% | 2.8 13% | 2.83 12% | 10.13 -214% | 4.78 -48% | 2.7 16% | 3.7 -15% |
| Gamma | 2.43 91% | 2.1 105% | 2.37 93% | 2.53 87% | 2.27 97% | 2.43 91% | 2.115 104% | 2.12 104% |
| CCT | 6818 95% | 7679 85% | 6710 97% | 6158 106% | 11323 57% | 7739 84% | 7187 90% | 6376 102% |
| Color Space (Percent of AdobeRGB 1998) (%) | 36 | 37.6 4% | 37.8 5% | 36 0% | 39 8% | 59 64% | 43 19% | 40.8 13% |
| Color Space (Percent of sRGB) (%) | 56 | 59.1 6% | 59 5% | 56 0% | 62 11% | 91 63% | 61 9% | 63.6 14% |
| Totaal Gemiddelde (Programma / Instellingen) | -12% /
-3% | -24% /
-3% | -21% /
4% | -17% /
-21% | 51% /
40% | -14% /
6% | -17% /
4% |
* ... kleiner is beter
Responstijd Scherm
| ↔ Responstijd Zwart naar Wit | ||
|---|---|---|
| 17 ms ... stijging ↗ en daling ↘ gecombineerd | ↗ 9 ms stijging | 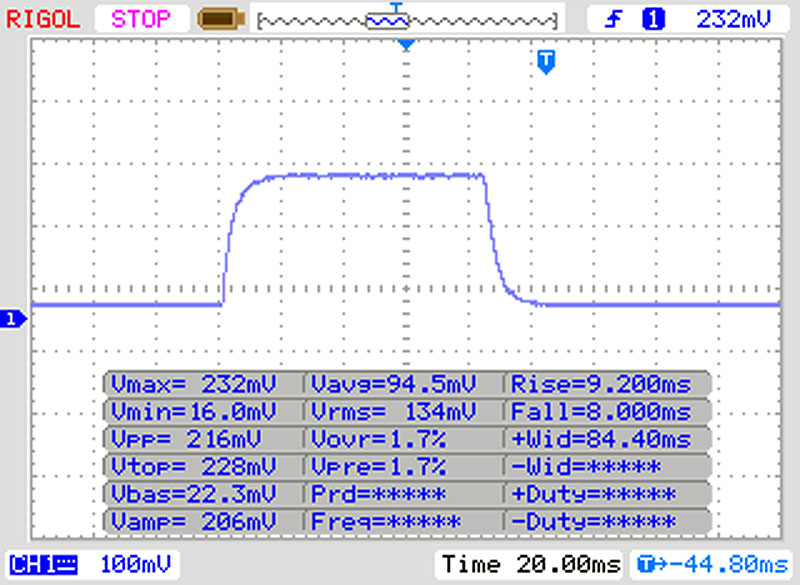 |
| ↘ 8 ms daling | ||
| Het scherm vertoonde prima responstijden in onze tests maar is misschien wat te traag voor competitieve games. Ter vergelijking: alle testtoestellen variëren van 0.1 (minimum) tot 240 (maximum) ms. » 39 % van alle toestellen zijn beter. Dit betekent dat de gemeten responstijd beter is dan het gemiddelde (19.8 ms) van alle geteste toestellen. | ||
| ↔ Responstijd 50% Grijs naar 80% Grijs | ||
| 25 ms ... stijging ↗ en daling ↘ gecombineerd | ↗ 13 ms stijging | 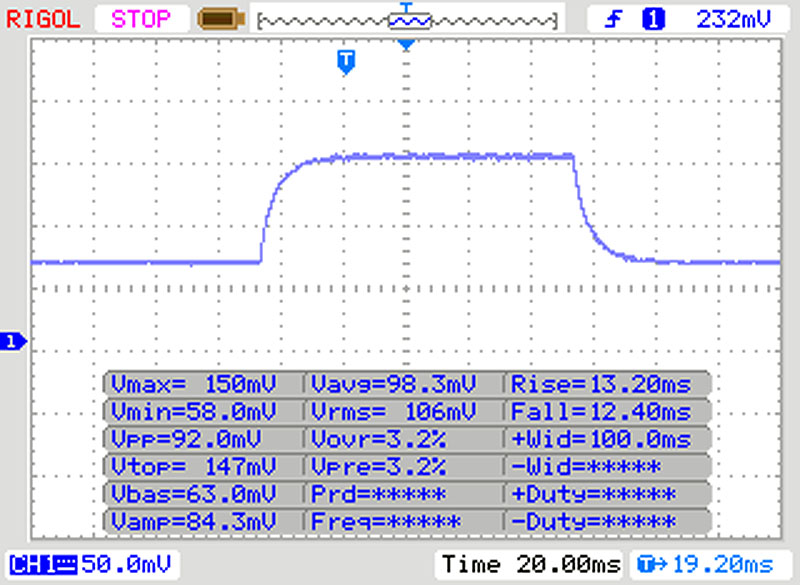 |
| ↘ 12 ms daling | ||
| Het scherm vertoonde relatief trage responstijden in onze tests en is misschien te traag voor games. Ter vergelijking: alle testtoestellen variëren van 0.165 (minimum) tot 636 (maximum) ms. » 35 % van alle toestellen zijn beter. Dit betekent dat de gemeten responstijd beter is dan het gemiddelde (31 ms) van alle geteste toestellen. | ||
Screen Flickering / PWM (Pulse-Width Modulation)
| Screen flickering / PWM niet waargenomen | 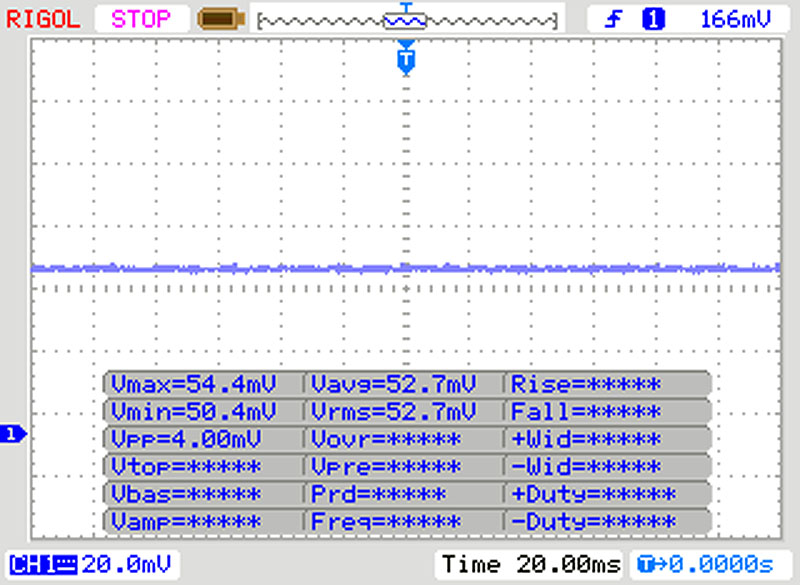 | ||
Ter vergelijking: 52 % van alle geteste toestellen maakten geen gebruik van PWM om de schermhelderheid te verlagen. Als het wel werd gebruikt, werd een gemiddelde van 7757 (minimum: 5 - maximum: 343500) Hz waargenomen. | |||
| Geekbench 5.5 | |
| Single-Core | |
| Gemiddelde van klas Gaming (986 - 2474, n=105, laatste 2 jaar) | |
| Lenovo IdeaPad Gaming 3i 15IMH05 | |
| Gemiddeld Intel Core i5-10300H (703 - 1241, n=16) | |
| Acer Nitro 5 AN515-44-R5FT | |
| HP Pavilion Gaming 15-ec0002ng | |
| MSI Alpha 15 A3DDK-034 | |
| Multi-Core | |
| Gemiddelde van klas Gaming (6460 - 28263, n=105, laatste 2 jaar) | |
| Acer Nitro 5 AN515-44-R5FT | |
| Lenovo IdeaPad Gaming 3i 15IMH05 | |
| Gemiddeld Intel Core i5-10300H (2783 - 4728, n=16) | |
| MSI Alpha 15 A3DDK-034 | |
| HP Pavilion Gaming 15-ec0002ng | |
* ... kleiner is beter
| PCMark 8 Home Score Accelerated v2 | 3841 punten | |
| PCMark 8 Creative Score Accelerated v2 | 3644 punten | |
| PCMark 8 Work Score Accelerated v2 | 5210 punten | |
| PCMark 10 Score | 4612 punten | |
Help | ||
| PCMark 8 | |
| Home Score Accelerated v2 | |
| Gemiddelde van klas Gaming (n=1laatste 2 jaar) | |
| MSI Alpha 15 A3DDK-034 | |
| Asus TUF FX505DT-EB73 | |
| Lenovo IdeaPad Gaming 3i 15IMH05 | |
| Dell G3 3590 | |
| Gemiddeld Intel Core i5-10300H, NVIDIA GeForce GTX 1650 Mobile (3181 - 3971, n=5) | |
| Lenovo IdeaPad L340-15IRH 81LK00BMGE | |
| HP Pavilion Gaming 15-ec0002ng | |
| Work Score Accelerated v2 | |
| Lenovo IdeaPad Gaming 3i 15IMH05 | |
| Dell G3 3590 | |
| MSI Alpha 15 A3DDK-034 | |
| Gemiddeld Intel Core i5-10300H, NVIDIA GeForce GTX 1650 Mobile (4265 - 5276, n=5) | |
| HP Pavilion Gaming 15-ec0002ng | |
| Asus TUF FX505DT-EB73 | |
| Lenovo IdeaPad L340-15IRH 81LK00BMGE | |
| Gemiddelde van klas Gaming (n=1laatste 2 jaar) | |
| DPC Latencies / LatencyMon - interrupt to process latency (max), Web, Youtube, Prime95 | |
| Acer Nitro 5 AN515-44-R5FT | |
| Lenovo IdeaPad Gaming 3i 15IMH05 | |
* ... kleiner is beter

| Lenovo IdeaPad Gaming 3i 15IMH05 SK hynix BC511 HFM512GDHTNI-87A0B | Asus TUF FX505DT-EB73 Intel SSD 660p SSDPEKNW512G8 | MSI GF63 Thin 9SC Toshiba KBG30ZMV512G | HP Pavilion Gaming 15-ec0002ng Intel SSD 660p SSDPEKNW512G8 | MSI Alpha 15 A3DDK-034 Kingston RBUSNS8154P3512GJ | Acer Nitro 5 AN515-44-R5FT SK Hynix BC511 HFM512GDJTNI | Lenovo IdeaPad L340-15IRH 81LK00BMGE WDC PC SN520 SDAPMUW-512 | Gemiddeld SK hynix BC511 HFM512GDHTNI-87A0B | |
|---|---|---|---|---|---|---|---|---|
| CrystalDiskMark 5.2 / 6 | -1% | -25% | 0% | -12% | 1% | -6% | 5% | |
| Write 4K (MB/s) | 130 | 137.5 6% | 80.6 -38% | 136.9 5% | 105.4 -19% | 94.7 -27% | 103.6 -20% | 135.9 ? 5% |
| Read 4K (MB/s) | 44.44 | 57 28% | 41.82 -6% | 57 28% | 33.24 -25% | 38.91 -12% | 39.91 -10% | 45.3 ? 2% |
| Write Seq (MB/s) | 1059 | 984 -7% | 597 -44% | 968 -9% | 1029 -3% | 1056 0% | 1160 10% | 1057 ? 0% |
| Read Seq (MB/s) | 1105 | 1564 42% | 963 -13% | 1631 48% | 1098 -1% | 1183 7% | 990 -10% | 1144 ? 4% |
| Write 4K Q32T1 (MB/s) | 490.3 | 237.4 -52% | 188.8 -61% | 237 -52% | 322.1 -34% | 445.3 -9% | 283.4 -42% | 458 ? -7% |
| Read 4K Q32T1 (MB/s) | 309.2 | 340.7 10% | 403.7 31% | 337.1 9% | 352 14% | 477.7 54% | 344.5 11% | 425 ? 37% |
| Write Seq Q32T1 (MB/s) | 1053 | 959 -9% | 689 -35% | 963 -9% | 1036 -2% | 1063 1% | 1455 38% | 1040 ? -1% |
| Read Seq Q32T1 (MB/s) | 2261 | 1732 -23% | 1583 -30% | 1863 -18% | 1606 -29% | 2154 -5% | 1690 -25% | 2274 ? 1% |
Continuous load read: DiskSpd Read Loop, Queue Depth 8
| 3DMark 11 Performance | 11788 punten | |
| 3DMark Ice Storm Standard Score | 118141 punten | |
| 3DMark Cloud Gate Standard Score | 27773 punten | |
| 3DMark Fire Strike Score | 8526 punten | |
| 3DMark Time Spy Score | 3621 punten | |
Help | ||
| 3DMark 11 - 1280x720 Performance GPU | |
| Gemiddelde van klas Gaming (21841 - 80022, n=104, laatste 2 jaar) | |
| MSI Alpha 15 A3DDK-034 | |
| Acer Nitro 5 AN515-44-R5FT | |
| Asus TUF FX505DT-EB73 | |
| Lenovo IdeaPad L340-15IRH 81LK00BMGE | |
| Dell G3 3590 | |
| Gemiddeld NVIDIA GeForce GTX 1650 Mobile (10885 - 13575, n=30) | |
| Lenovo IdeaPad Gaming 3i 15IMH05 | |
| MSI GF63 Thin 9SC | |
| HP Pavilion Gaming 15-ec0002ng | |
| BioShock Infinite - 1920x1080 Ultra Preset, DX11 (DDOF) | |
| Lenovo IdeaPad Gaming 3i 15IMH05 | |
| MSI Alpha 15 A3DDK-034 | |
| Gemiddeld NVIDIA GeForce GTX 1650 Mobile (68.5 - 99.4, n=18) | |
| Dell G3 3590 | |
| Lenovo IdeaPad L340-15IRH 81LK00BMGE | |
| Asus TUF FX505DT-EB73 | |
| HP Pavilion Gaming 15-ec0002ng | |
| The Witcher 3 - 1920x1080 Ultra Graphics & Postprocessing (HBAO+) | |
| Gemiddelde van klas Gaming (104.7 - 240, n=7, laatste 2 jaar) | |
| MSI Alpha 15 A3DDK-034 | |
| Acer Nitro 5 AN515-44-R5FT | |
| Lenovo IdeaPad Gaming 3i 15IMH05 | |
| Asus TUF FX505DT-EB73 | |
| Dell G3 3590 | |
| Gemiddeld NVIDIA GeForce GTX 1650 Mobile (29.9 - 40.3, n=31) | |
| Lenovo IdeaPad L340-15IRH 81LK00BMGE | |
| MSI GF63 Thin 9SC | |
| HP Pavilion Gaming 15-ec0002ng | |
| Escape from Tarkov - 1920x1080 Ultra Preset | |
| Lenovo IdeaPad Gaming 3i 15IMH05 | |
| Gemiddeld NVIDIA GeForce GTX 1650 Mobile (45.8 - 62.2, n=2) | |
| Shadow of the Tomb Raider - 1920x1080 Highest Preset AA:T | |
| Gemiddelde van klas Gaming (96 - 116, n=2, laatste 2 jaar) | |
| Acer Nitro 5 AN515-44-R5FT | |
| Lenovo IdeaPad Gaming 3i 15IMH05 | |
| Gemiddeld NVIDIA GeForce GTX 1650 Mobile (34 - 47, n=15) | |
| Asus TUF FX505DT-EB73 | |
| HP Pavilion Gaming 15-ec0002ng | |
| Doom Eternal - 1920x1080 High Preset | |
| Lenovo IdeaPad Gaming 3i 15IMH05 | |
| Gemiddeld NVIDIA GeForce GTX 1650 Mobile (62.6 - 69.2, n=4) | |
| Gears Tactics - 1920x1080 Ultra Preset | |
| Acer Nitro 5 AN515-44-R5FT | |
| Lenovo IdeaPad Gaming 3i 15IMH05 | |
| Gemiddeld NVIDIA GeForce GTX 1650 Mobile (41.9 - 48.3, n=5) | |
| Call of Duty Modern Warfare 2019 - 1920x1080 Maximum Settings AA:T2X Filmic SM | |
| Acer Nitro 5 AN515-44-R5FT | |
| Gemiddeld NVIDIA GeForce GTX 1650 Mobile (43.3 - 53.5, n=4) | |
| Lenovo IdeaPad Gaming 3i 15IMH05 | |
| MSI GF63 Thin 9SC | |
| HP Pavilion Gaming 15-ec0002ng | |
| Far Cry 5 - 1920x1080 Ultra Preset AA:T | |
| Gemiddelde van klas Gaming (70 - 151, n=6, laatste 2 jaar) | |
| Lenovo IdeaPad Gaming 3i 15IMH05 | |
| Gemiddeld NVIDIA GeForce GTX 1650 Mobile (44 - 57, n=9) | |
| HP Pavilion Gaming 15-ec0002ng | |
| lage | gem. | hoge | ultra | |
|---|---|---|---|---|
| BioShock Infinite (2013) | 288.3 | 242.3 | 224.2 | 96.5 |
| The Witcher 3 (2015) | 184.5 | 119.2 | 66 | 37.4 |
| Dota 2 Reborn (2015) | 133.9 | 121.5 | 113.2 | 107.5 |
| X-Plane 11.11 (2018) | 82.8 | 74.1 | 64.8 | |
| Far Cry 5 (2018) | 97 | 66 | 61 | 57 |
| Shadow of the Tomb Raider (2018) | 101 | 63 | 53 | 47 |
| Metro Exodus (2019) | 98.9 | 46.1 | 34.2 | 26.6 |
| Control (2019) | 138.5 | 46 | 33.5 | |
| Borderlands 3 (2019) | 115.7 | 60.1 | 39.2 | 34.6 |
| Call of Duty Modern Warfare 2019 (2019) | 99.6 | 64.3 | 53.3 | 45.4 |
| Need for Speed Heat (2019) | 75.6 | 57.8 | 51 | 48.7 |
| Star Wars Jedi Fallen Order (2019) | 69.6 | 59.8 | 52.1 | |
| Red Dead Redemption 2 (2019) | 93.6 | 50.8 | 33.1 | 21.2 |
| Escape from Tarkov (2020) | 121.2 | 78.6 | 67.9 | 62.2 |
| Hunt Showdown (2020) | 144.4 | 56.8 | 46.4 | |
| Doom Eternal (2020) | 151.5 | 84.6 | 68.1 | |
| Gears Tactics (2020) | 191.1 | 94 | 65.2 | 48.3 |
Geluidsniveau
| Onbelast |
| 30.7 / 30.7 / 30.7 dB (A) |
| HDD |
| 30.7 dB (A) |
| Belasting |
| 49.7 / 50.3 dB (A) |
 | ||
30 dB stil 40 dB(A) hoorbaar 50 dB(A) luid |
||
min: | ||
| Lenovo IdeaPad Gaming 3i 15IMH05 i5-10300H, GeForce GTX 1650 Mobile | Lenovo IdeaPad L340-15IRH 81LK00BMGE i5-9300H, GeForce GTX 1650 Mobile | Asus TUF FX505DT-EB73 R7 3750H, GeForce GTX 1650 Mobile | Dell G3 3590 i5-9300H, GeForce GTX 1650 Mobile | MSI GF63 Thin 9SC i5-9300H, GeForce GTX 1650 Max-Q | HP Pavilion Gaming 15-ec0002ng R5 3550H, GeForce GTX 1050 Mobile | Acer Nitro 5 AN515-44-R5FT R5 4600H, GeForce GTX 1650 Ti Mobile | MSI Alpha 15 A3DDK-034 R7 3750H, Radeon RX 5500M | Gemiddeld NVIDIA GeForce GTX 1650 Mobile | Gemiddelde van klas Gaming | |
|---|---|---|---|---|---|---|---|---|---|---|
| Noise | 14% | 6% | 5% | -2% | 7% | -0% | -15% | 8% | 9% | |
| uit / omgeving * (dB) | 30.7 | 28.4 7% | 28.2 8% | 28.4 7% | 30 2% | 30.3 1% | 30 2% | 29 6% | 27.6 ? 10% | 24.1 ? 21% |
| Idle Minimum * (dB) | 30.7 | 28.4 7% | 28.2 8% | 29.2 5% | 35 -14% | 30.3 1% | 30 2% | 36 -17% | 28.1 ? 8% | 26 ? 15% |
| Idle Average * (dB) | 30.7 | 28.4 7% | 28.2 8% | 29.4 4% | 36 -17% | 30.3 1% | 32 -4% | 37 -21% | 28.8 ? 6% | 27.4 ? 11% |
| Idle Maximum * (dB) | 30.7 | 28.4 7% | 31.4 -2% | 29.4 4% | 37 -21% | 31 -1% | 34 -11% | 46 -50% | 31 ? -1% | 30.1 ? 2% |
| Load Average * (dB) | 49.7 | 30.1 39% | 39.8 20% | 39 22% | 44 11% | 39.3 21% | 46 7% | 50 -1% | 41.7 ? 16% | 43.6 ? 12% |
| Witcher 3 ultra * (dB) | 47 | 40.2 14% | 47 -0% | 49.5 -5% | 41 13% | 42.9 9% | 47 -0% | 51 -9% | ||
| Load Maximum * (dB) | 50.3 | 40.2 20% | 50.2 -0% | 49.7 1% | 43 15% | 43.3 14% | 49 3% | 57 -13% | 46.4 ? 8% | 54.2 ? -8% |
* ... kleiner is beter
(±) De maximumtemperatuur aan de bovenzijde bedraagt 43 °C / 109 F, vergeleken met het gemiddelde van 40.4 °C / 105 F, variërend van 21.2 tot 68.8 °C voor de klasse Gaming.
(-) De bodem warmt op tot een maximum van 50.6 °C / 123 F, vergeleken met een gemiddelde van 43.2 °C / 110 F
(+) Bij onbelast gebruik bedraagt de gemiddelde temperatuur voor de bovenzijde 25.7 °C / 78 F, vergeleken met het apparaatgemiddelde van 33.9 °C / 93 F.
(±) Bij het spelen van The Witcher 3 is de gemiddelde temperatuur voor de bovenzijde 34.2 °C / 94 F, vergeleken met het apparaatgemiddelde van 33.9 °C / 93 F.
(+) De handpalmsteunen en het touchpad bereiken maximaal de huidtemperatuur (32.4 °C / 90.3 F) en zijn dus niet heet.
(-) De gemiddelde temperatuur van de handpalmsteun van soortgelijke toestellen bedroeg 28.8 °C / 83.8 F (-3.6 °C / -6.5 F).
| Lenovo IdeaPad Gaming 3i 15IMH05 i5-10300H, GeForce GTX 1650 Mobile | Lenovo IdeaPad L340-15IRH 81LK00BMGE i5-9300H, GeForce GTX 1650 Mobile | Asus TUF FX505DT-EB73 R7 3750H, GeForce GTX 1650 Mobile | Dell G3 3590 i5-9300H, GeForce GTX 1650 Mobile | MSI GF63 Thin 9SC i5-9300H, GeForce GTX 1650 Max-Q | HP Pavilion Gaming 15-ec0002ng R5 3550H, GeForce GTX 1050 Mobile | Acer Nitro 5 AN515-44-R5FT R5 4600H, GeForce GTX 1650 Ti Mobile | MSI Alpha 15 A3DDK-034 R7 3750H, Radeon RX 5500M | Gemiddeld NVIDIA GeForce GTX 1650 Mobile | Gemiddelde van klas Gaming | |
|---|---|---|---|---|---|---|---|---|---|---|
| Heat | -6% | -7% | -15% | 2% | 9% | -5% | 1% | -3% | -10% | |
| Maximum Upper Side * (°C) | 43 | 44.8 -4% | 41.2 4% | 49 -14% | 47 -9% | 41 5% | 49 -14% | 44 -2% | 46 ? -7% | 45.2 ? -5% |
| Maximum Bottom * (°C) | 50.6 | 58.1 -15% | 40 21% | 49.8 2% | 47 7% | 39.1 23% | 50 1% | 49 3% | 49.2 ? 3% | 48.1 ? 5% |
| Idle Upper Side * (°C) | 27.2 | 27.9 -3% | 34.6 -27% | 32.4 -19% | 26 4% | 26 4% | 28 -3% | 26 4% | 28.3 ? -4% | 31 ? -14% |
| Idle Bottom * (°C) | 27.5 | 27.9 -1% | 34.4 -25% | 35.6 -29% | 26 5% | 26.5 4% | 28 -2% | 28 -2% | 28.9 ? -5% | 34.2 ? -24% |
* ... kleiner is beter
Lenovo IdeaPad Gaming 3i 15IMH05 audioanalyse
(-) | niet erg luide luidsprekers (70 dB)
Bas 100 - 315 Hz
(-) | bijna geen lage tonen - gemiddeld 21.8% lager dan de mediaan
(±) | lineariteit van de lage tonen is gemiddeld (11.9% delta ten opzichte van de vorige frequentie)
Midden 400 - 2000 Hz
(±) | hogere middens - gemiddeld 5.9% hoger dan de mediaan
(±) | lineariteit van de middentonen is gemiddeld (9.4% delta ten opzichte van de vorige frequentie)
Hoog 2 - 16 kHz
(+) | evenwichtige hoogtepunten - slechts 1.1% verwijderd van de mediaan
(+) | de hoge tonen zijn lineair (4.6% delta naar de vorige frequentie)
Algemeen 100 - 16.000 Hz
(±) | lineariteit van het totale geluid is gemiddeld (22.8% verschil met de mediaan)
Vergeleken met dezelfde klasse
» 82% van alle geteste apparaten in deze klasse waren beter, 5% vergelijkbaar, 13% slechter
» De beste had een delta van 6%, het gemiddelde was 18%, de slechtste was 132%
Vergeleken met alle geteste toestellen
» 68% van alle geteste apparaten waren beter, 5% gelijk, 27% slechter
» De beste had een delta van 4%, het gemiddelde was 23%, de slechtste was 134%
| Uit / Standby | |
| Inactief | |
| Belasting |
|
Key:
min: | |
| Lenovo IdeaPad Gaming 3i 15IMH05 i5-10300H, GeForce GTX 1650 Mobile | Lenovo IdeaPad L340-15IRH 81LK00BMGE i5-9300H, GeForce GTX 1650 Mobile | Asus TUF FX505DT-EB73 R7 3750H, GeForce GTX 1650 Mobile | Dell G3 3590 i5-9300H, GeForce GTX 1650 Mobile | MSI GF63 Thin 9SC i5-9300H, GeForce GTX 1650 Max-Q | HP Pavilion Gaming 15-ec0002ng R5 3550H, GeForce GTX 1050 Mobile | Acer Nitro 5 AN515-44-R5FT R5 4600H, GeForce GTX 1650 Ti Mobile | MSI Alpha 15 A3DDK-034 R7 3750H, Radeon RX 5500M | Gemiddeld NVIDIA GeForce GTX 1650 Mobile | Gemiddelde van klas Gaming | |
|---|---|---|---|---|---|---|---|---|---|---|
| Power Consumption | 24% | 0% | -22% | -1% | 29% | 12% | -82% | 1% | -96% | |
| Idle Minimum * (Watt) | 5.1 | 3.8 25% | 7 -37% | 6.2 -22% | 7 -37% | 1.9 63% | 5 2% | 14 -175% | 4.96 ? 3% | 13 ? -155% |
| Idle Average * (Watt) | 8.2 | 6.6 20% | 9.9 -21% | 8.4 -2% | 9 -10% | 7.2 12% | 8 2% | 18 -120% | 8.61 ? -5% | 19 ? -132% |
| Idle Maximum * (Watt) | 10.6 | 8.9 16% | 12 -13% | 27.7 -161% | 13 -23% | 9.6 9% | 13 -23% | 32 -202% | 14.8 ? -40% | 24.6 ? -132% |
| Load Average * (Watt) | 128 | 78.4 39% | 68.4 47% | 91 29% | 79 38% | 74 42% | 69 46% | 64 50% | 81.7 ? 36% | 110.7 ? 14% |
| Witcher 3 ultra * (Watt) | 109 | 82 25% | 94.9 13% | 94.4 13% | 73 33% | 75 31% | 78 28% | 123 -13% | ||
| Load Maximum * (Watt) | 150 | 124 17% | 130.9 13% | 131.5 12% | 164 -9% | 124 17% | 124 17% | 193 -29% | 131.9 ? 12% | 259 ? -73% |
* ... kleiner is beter
| Lenovo IdeaPad Gaming 3i 15IMH05 i5-10300H, GeForce GTX 1650 Mobile, 45 Wh | Asus TUF FX505DT-EB73 R7 3750H, GeForce GTX 1650 Mobile, 48 Wh | Dell G3 3590 i5-9300H, GeForce GTX 1650 Mobile, 51 Wh | MSI GF63 Thin 9SC i5-9300H, GeForce GTX 1650 Max-Q, 51 Wh | HP Pavilion Gaming 15-ec0002ng R5 3550H, GeForce GTX 1050 Mobile, 52.5 Wh | MSI Alpha 15 A3DDK-034 R7 3750H, Radeon RX 5500M, 51 Wh | Acer Nitro 5 AN515-44-R5FT R5 4600H, GeForce GTX 1650 Ti Mobile, 57.48 Wh | Lenovo IdeaPad L340-15IRH 81LK00BMGE i5-9300H, GeForce GTX 1650 Mobile, 45 Wh | Gemiddelde van klas Gaming | |
|---|---|---|---|---|---|---|---|---|---|
| Batterijduur | -26% | -2% | -31% | 33% | -48% | 9% | -28% | -6% | |
| Reader / Idle (h) | 12.4 | 7.8 -37% | 13.5 9% | 8.5 -31% | 5.8 -53% | 13.8 11% | 7.8 -37% | 8.27 ? -33% | |
| H.264 (h) | 7.3 | 3.9 -47% | 8.32 ? 14% | ||||||
| WiFi v1.3 (h) | 6.3 | 4.8 -24% | 6.7 6% | 4.4 -30% | 8.4 33% | 4.1 -35% | 8.7 38% | 6.1 -3% | 7.11 ? 13% |
| Load (h) | 1.8 | 1.5 -17% | 1.4 -22% | 1.2 -33% | 0.8 -56% | 1.4 -22% | 1 -44% | 1.502 ? -17% |
Pro
Contra
Dit is de verkorte versie van het originele artikel. Het volledige, Engelse testrapport vind je hier.
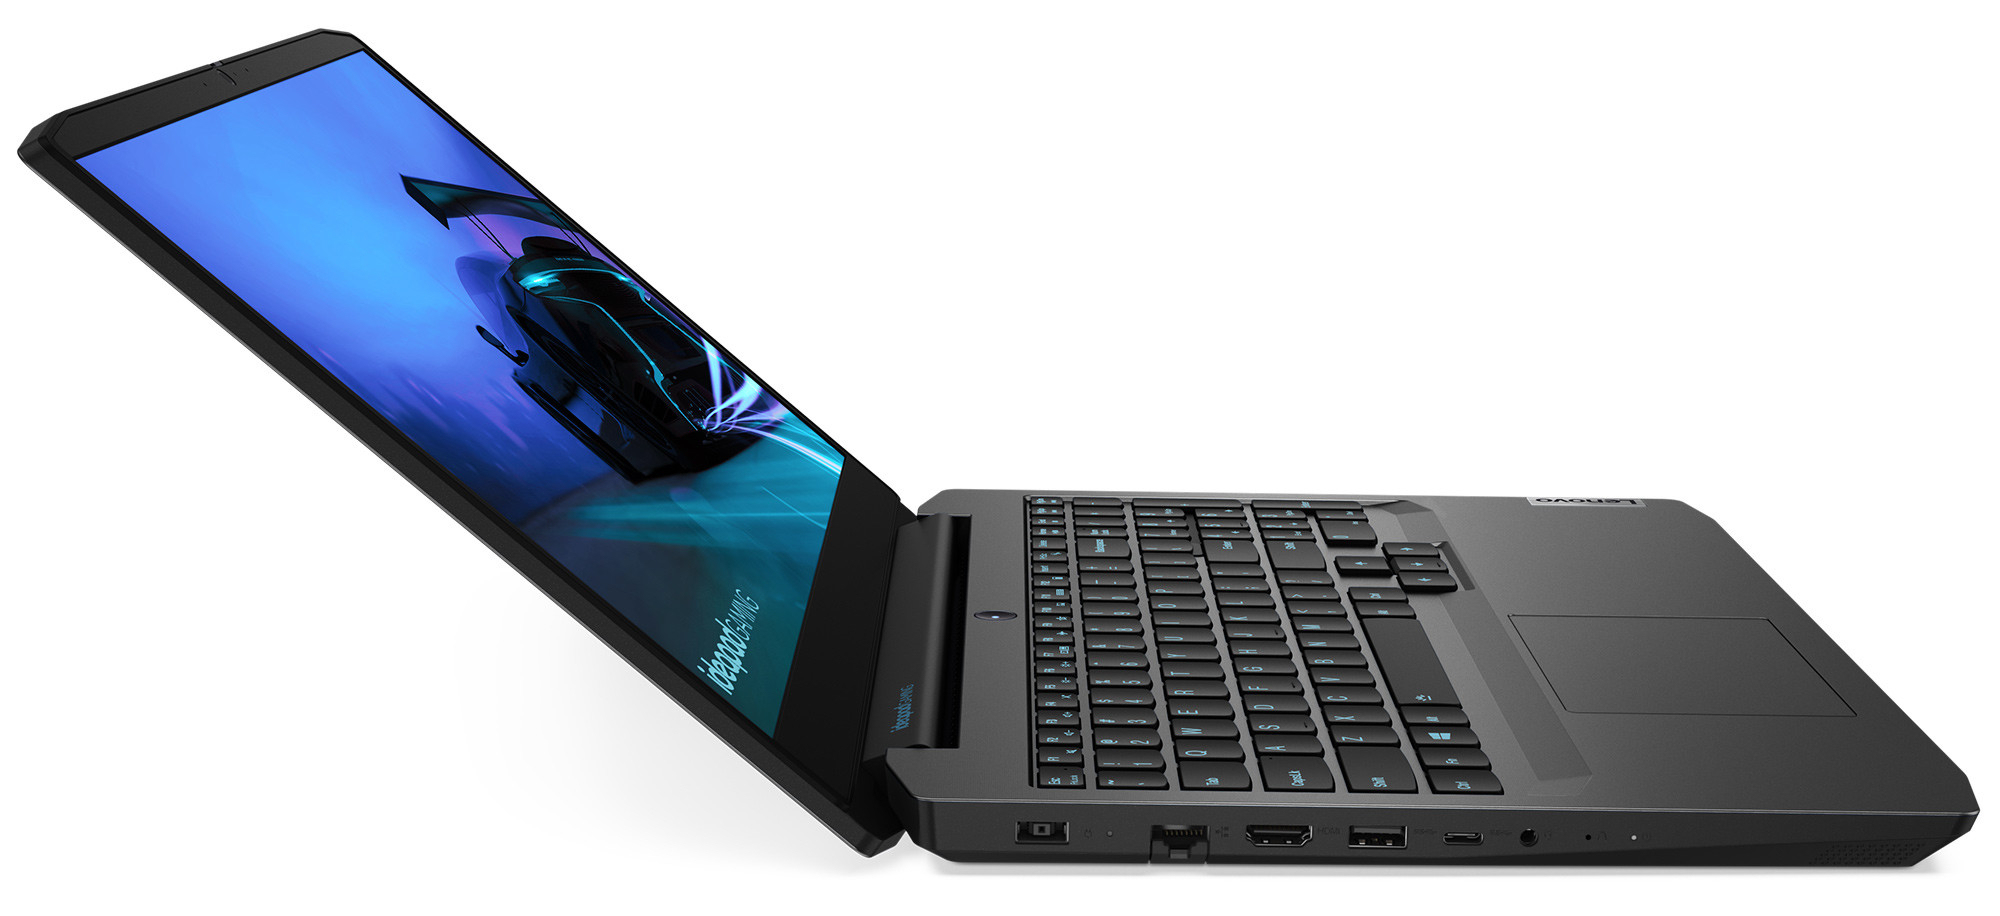
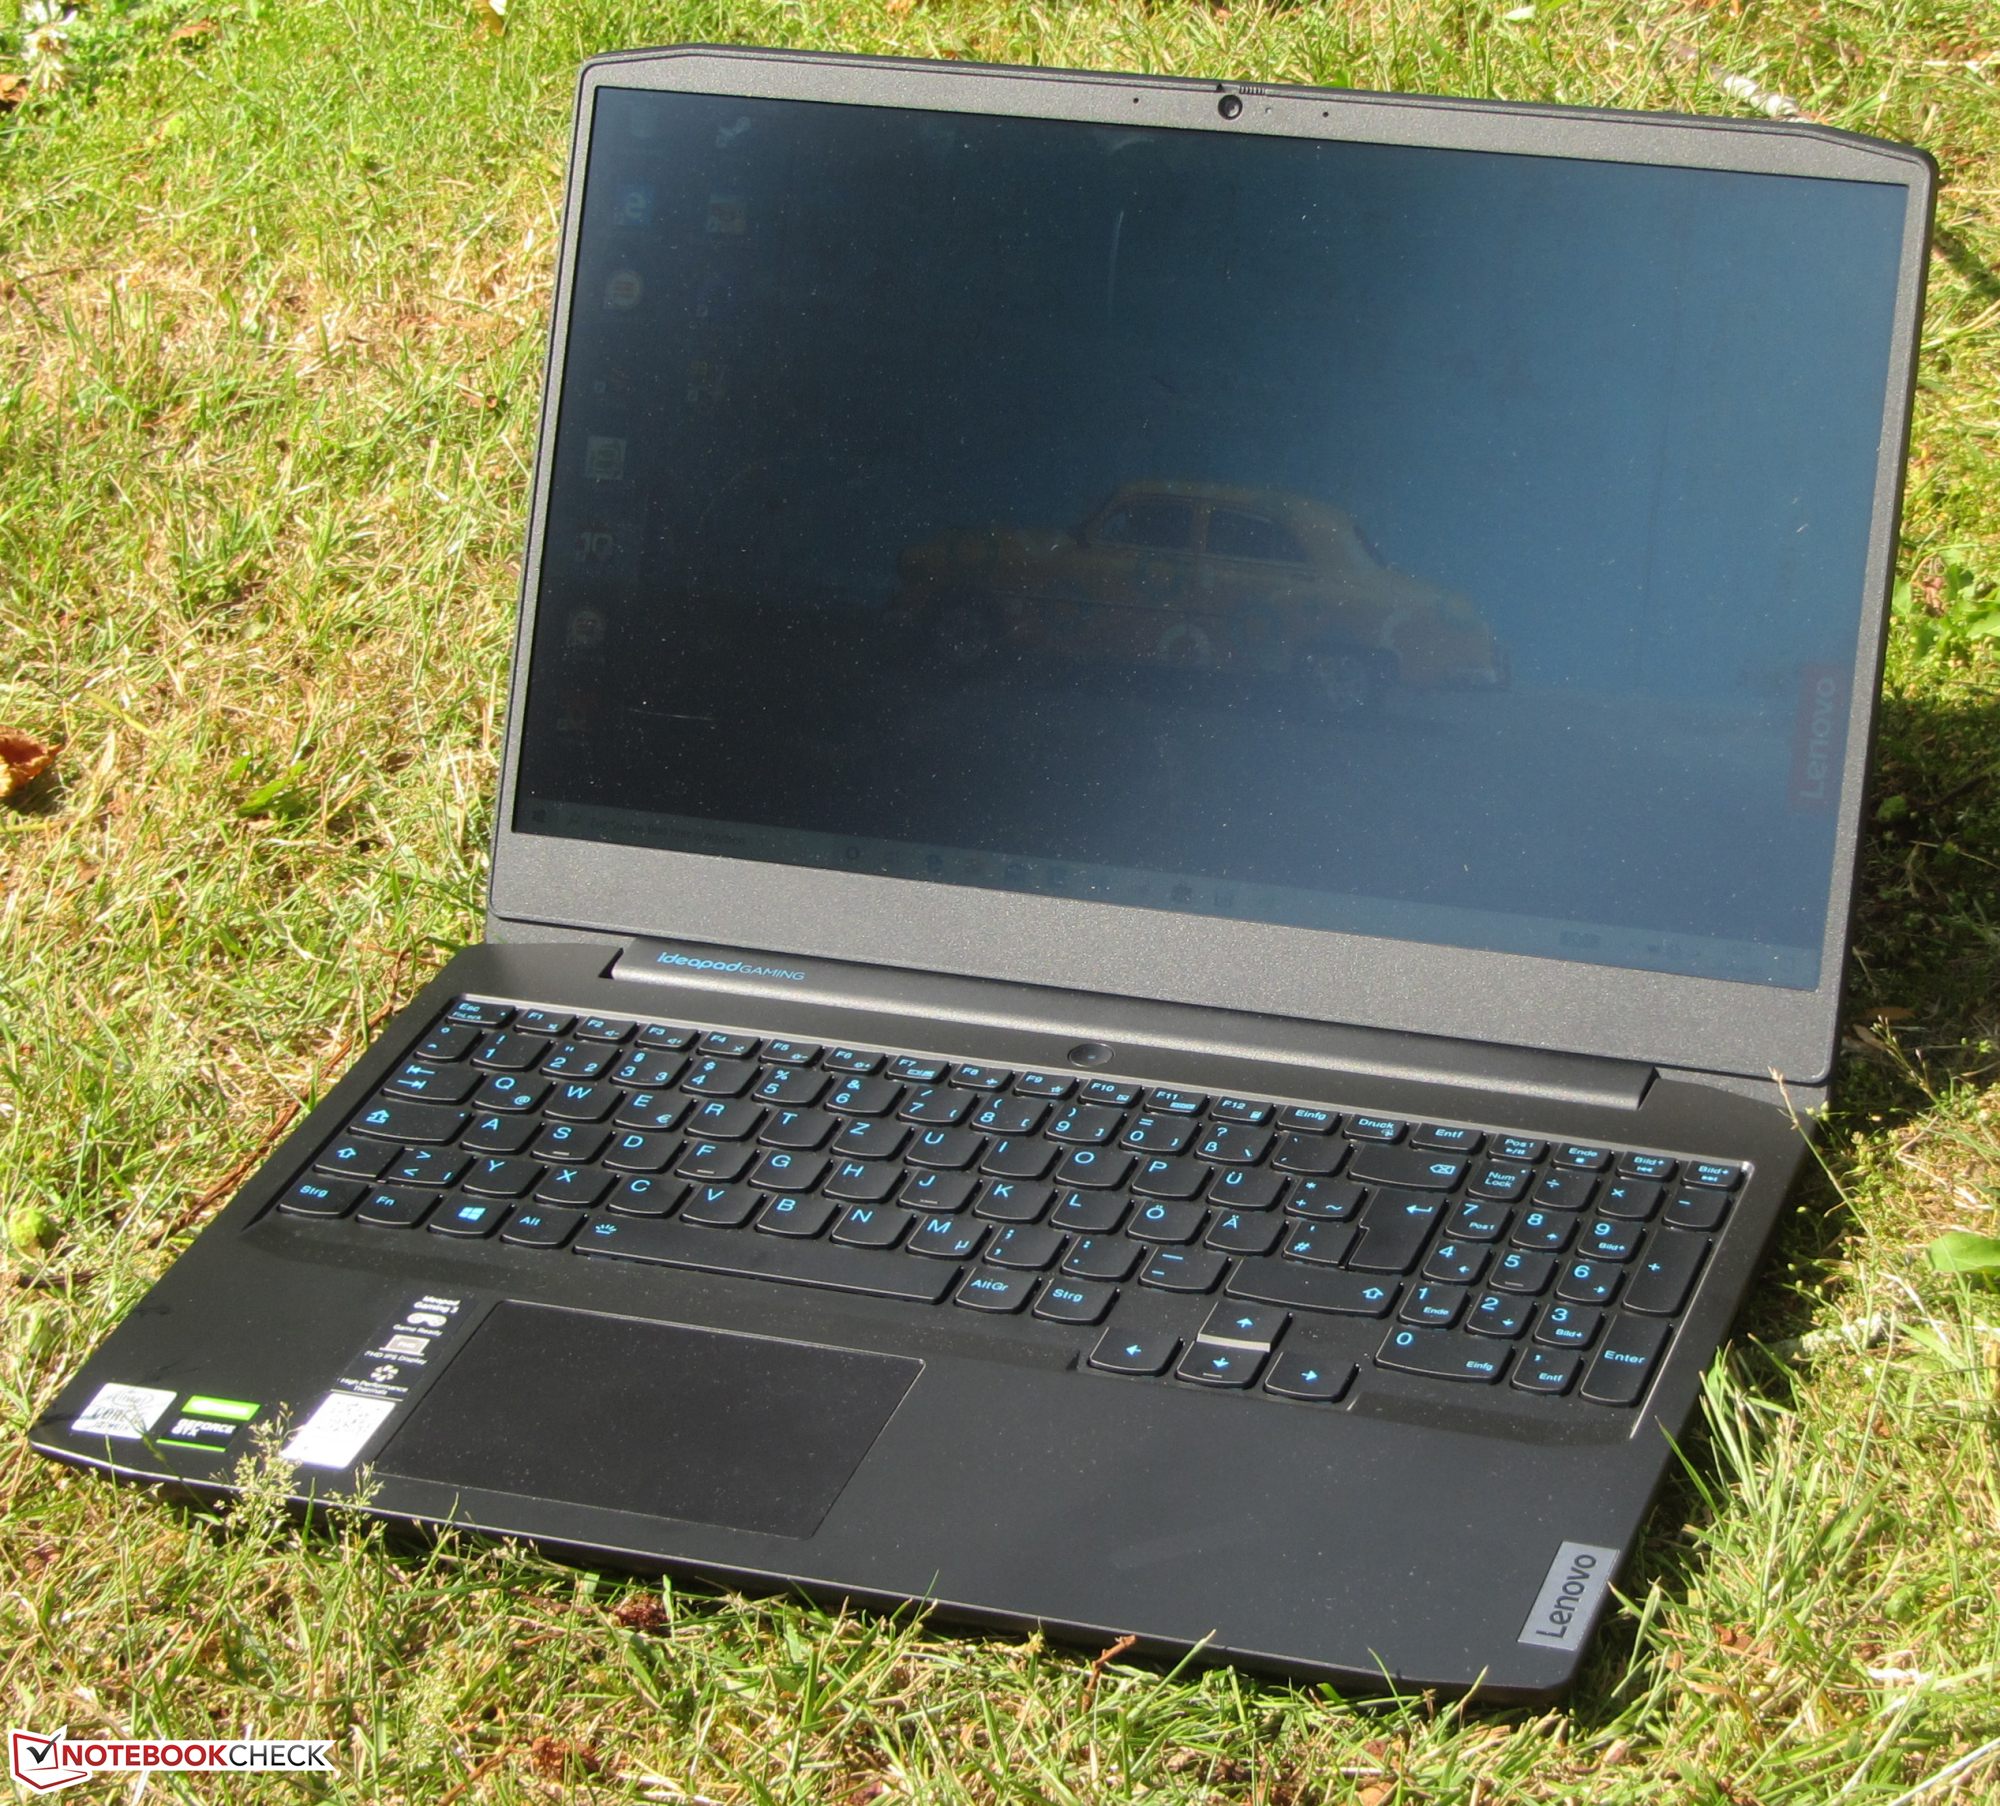
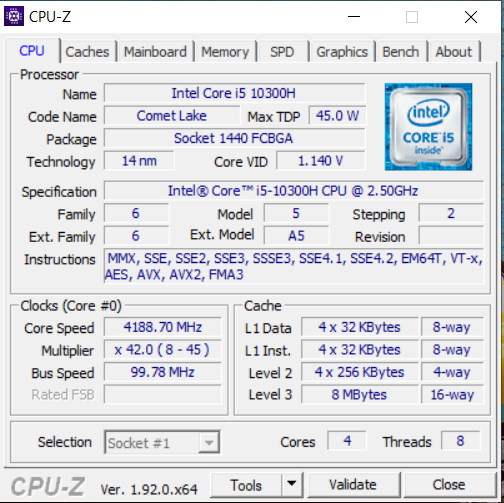
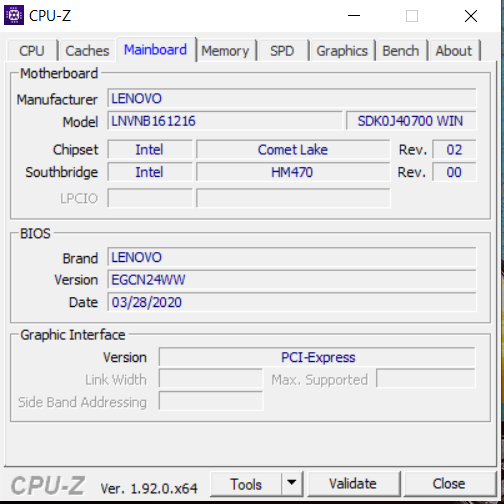
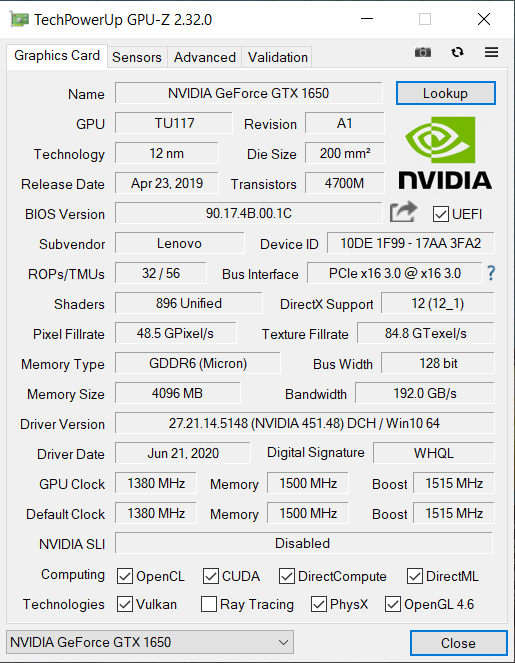
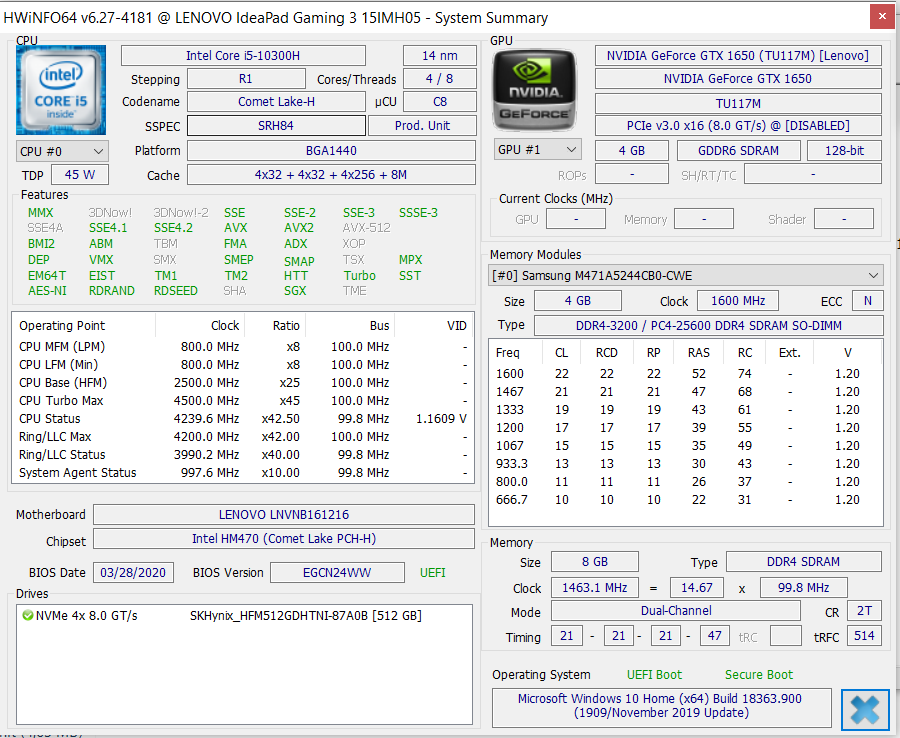
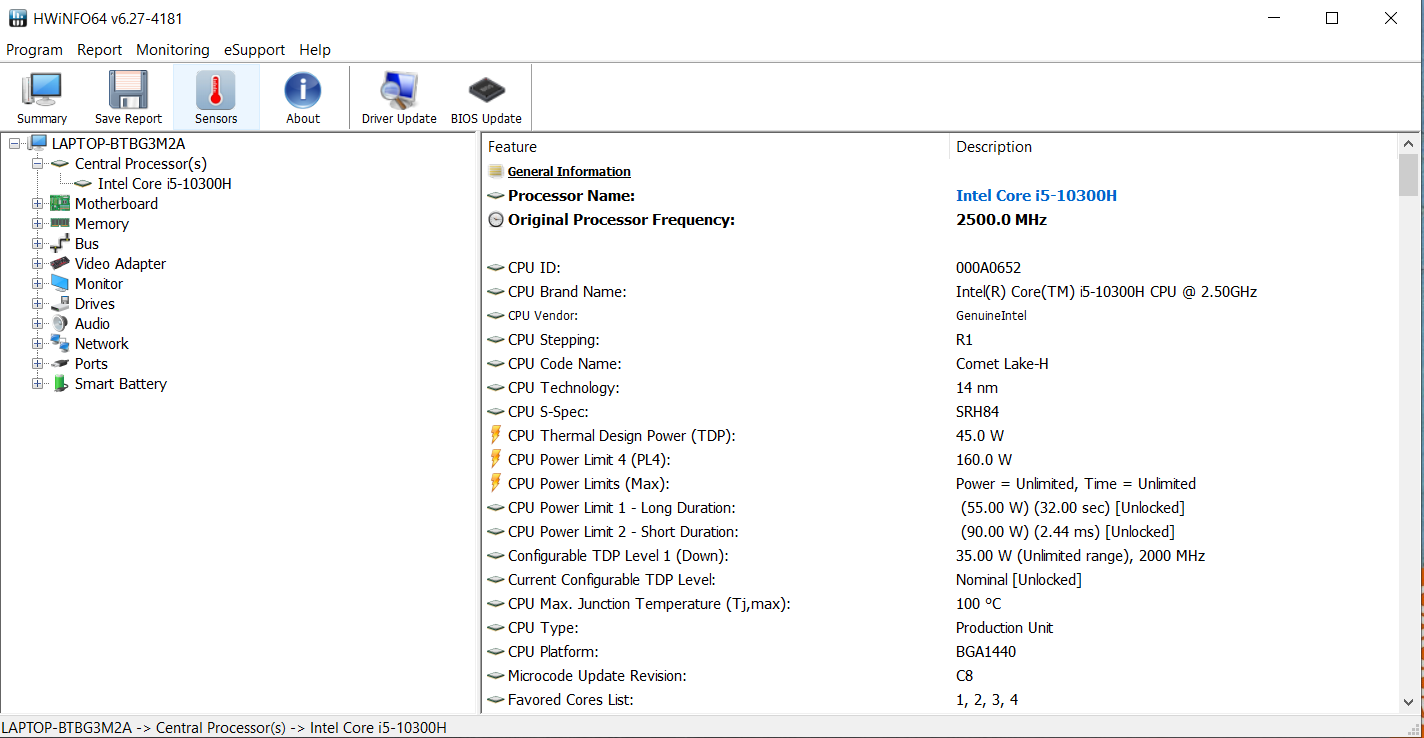
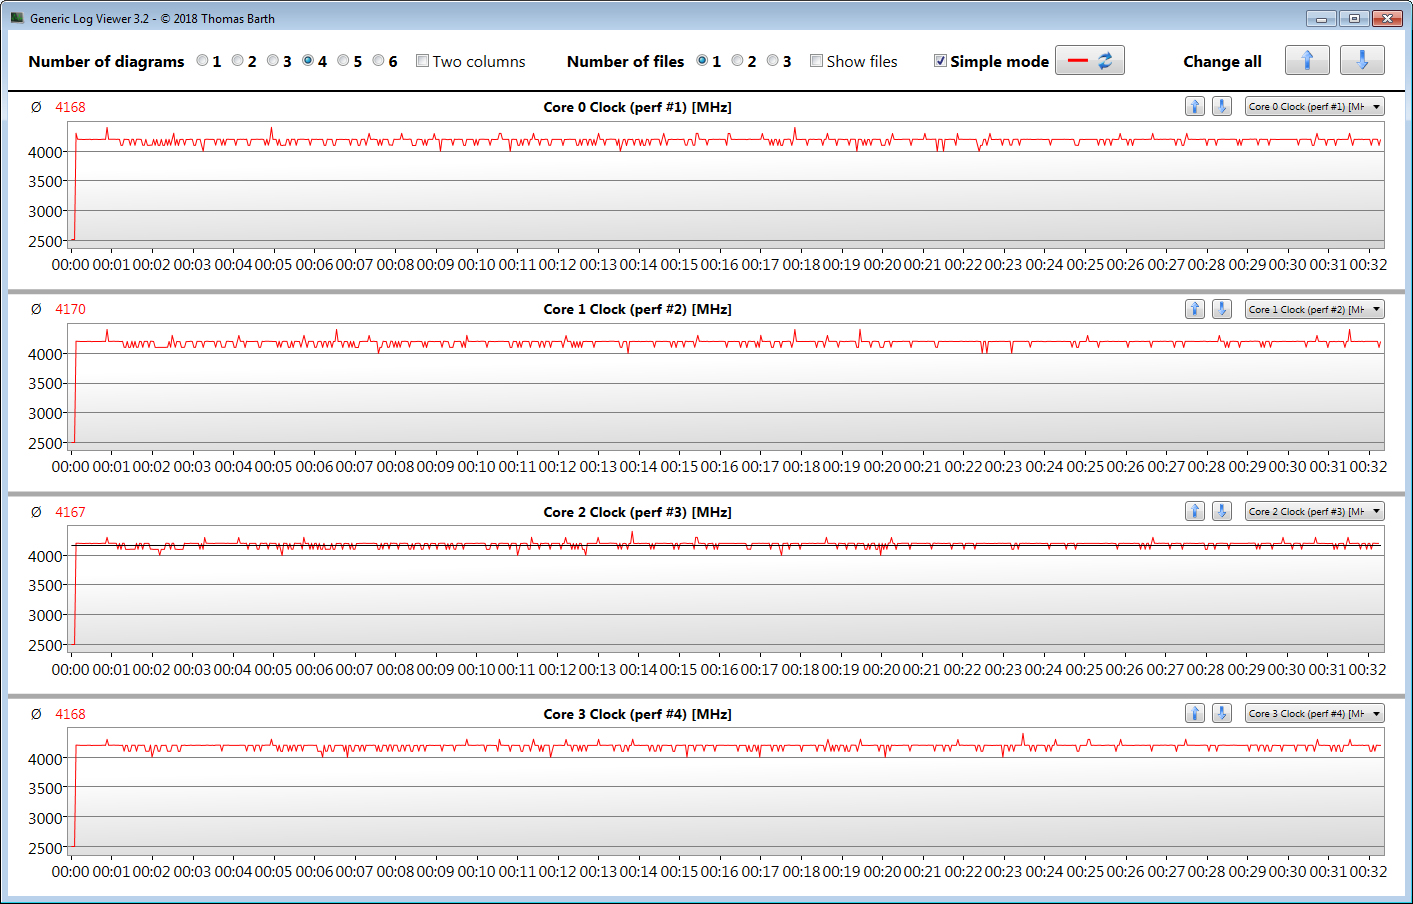
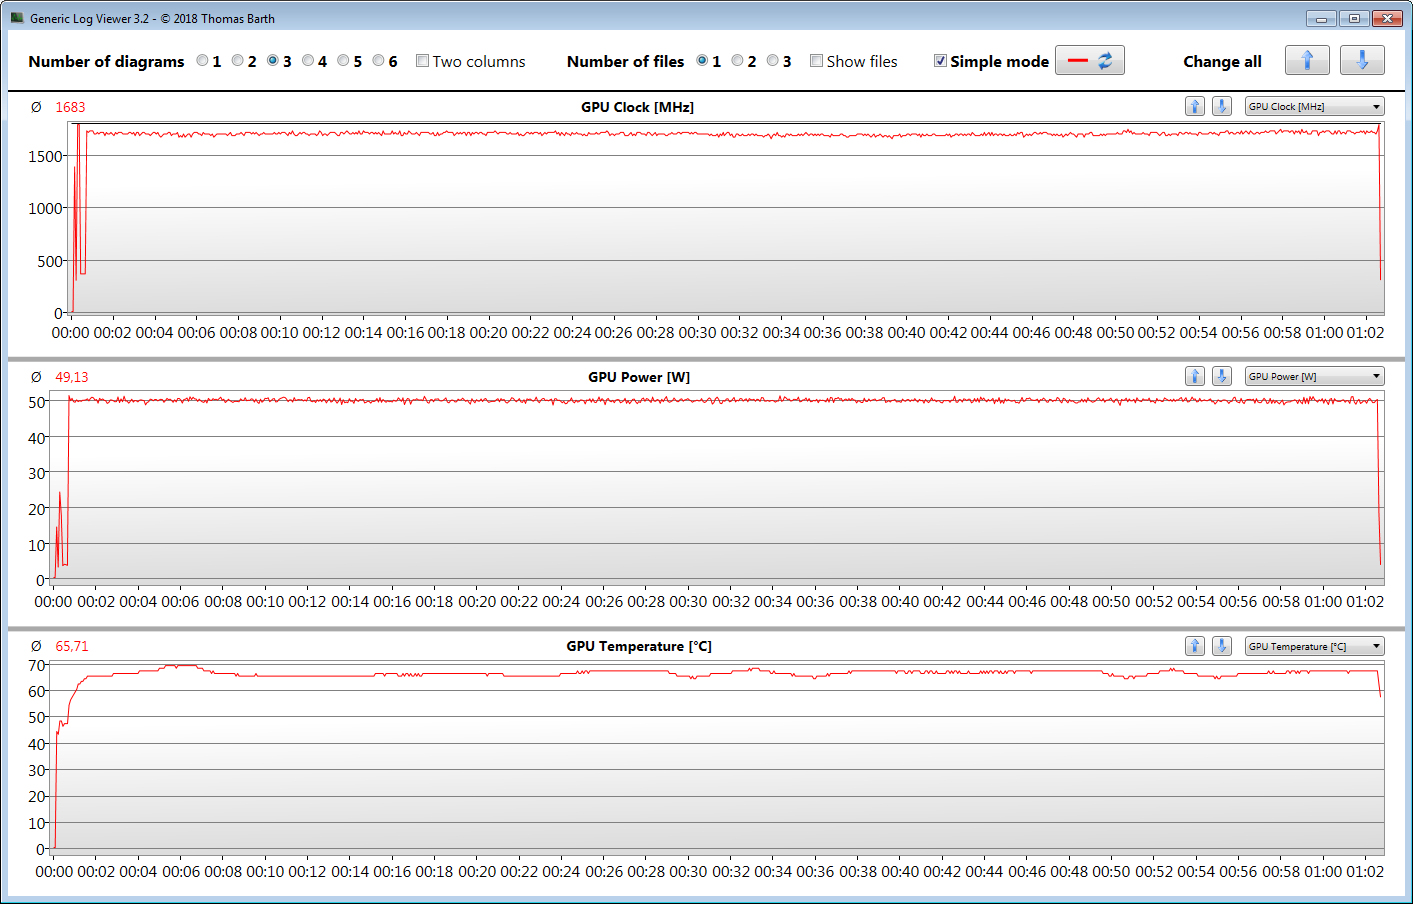
De goedkope 15,6-inch gaming-laptop van Lenovo (ongeveer 800 euro) heeft een Core i5-10300H-processor (Comet Lake) aan boord die voldoende rekenkracht biedt voor alle gangbare toepassingsgebieden. In combinatie met de speciale GeForce GTX 1650 grafische kaart brengt de CPU alle moderne computerspellen vlotjes op het scherm. Positief: zowel de CPU als de GPU kunnen gedurende lange tijd op hoge snelheid werken.
De IdeaPad Gaming 3i 15IMH05 is een evenwichtige gaming-laptop in het instapsegment met een goede prijs-prestatieverhouding.
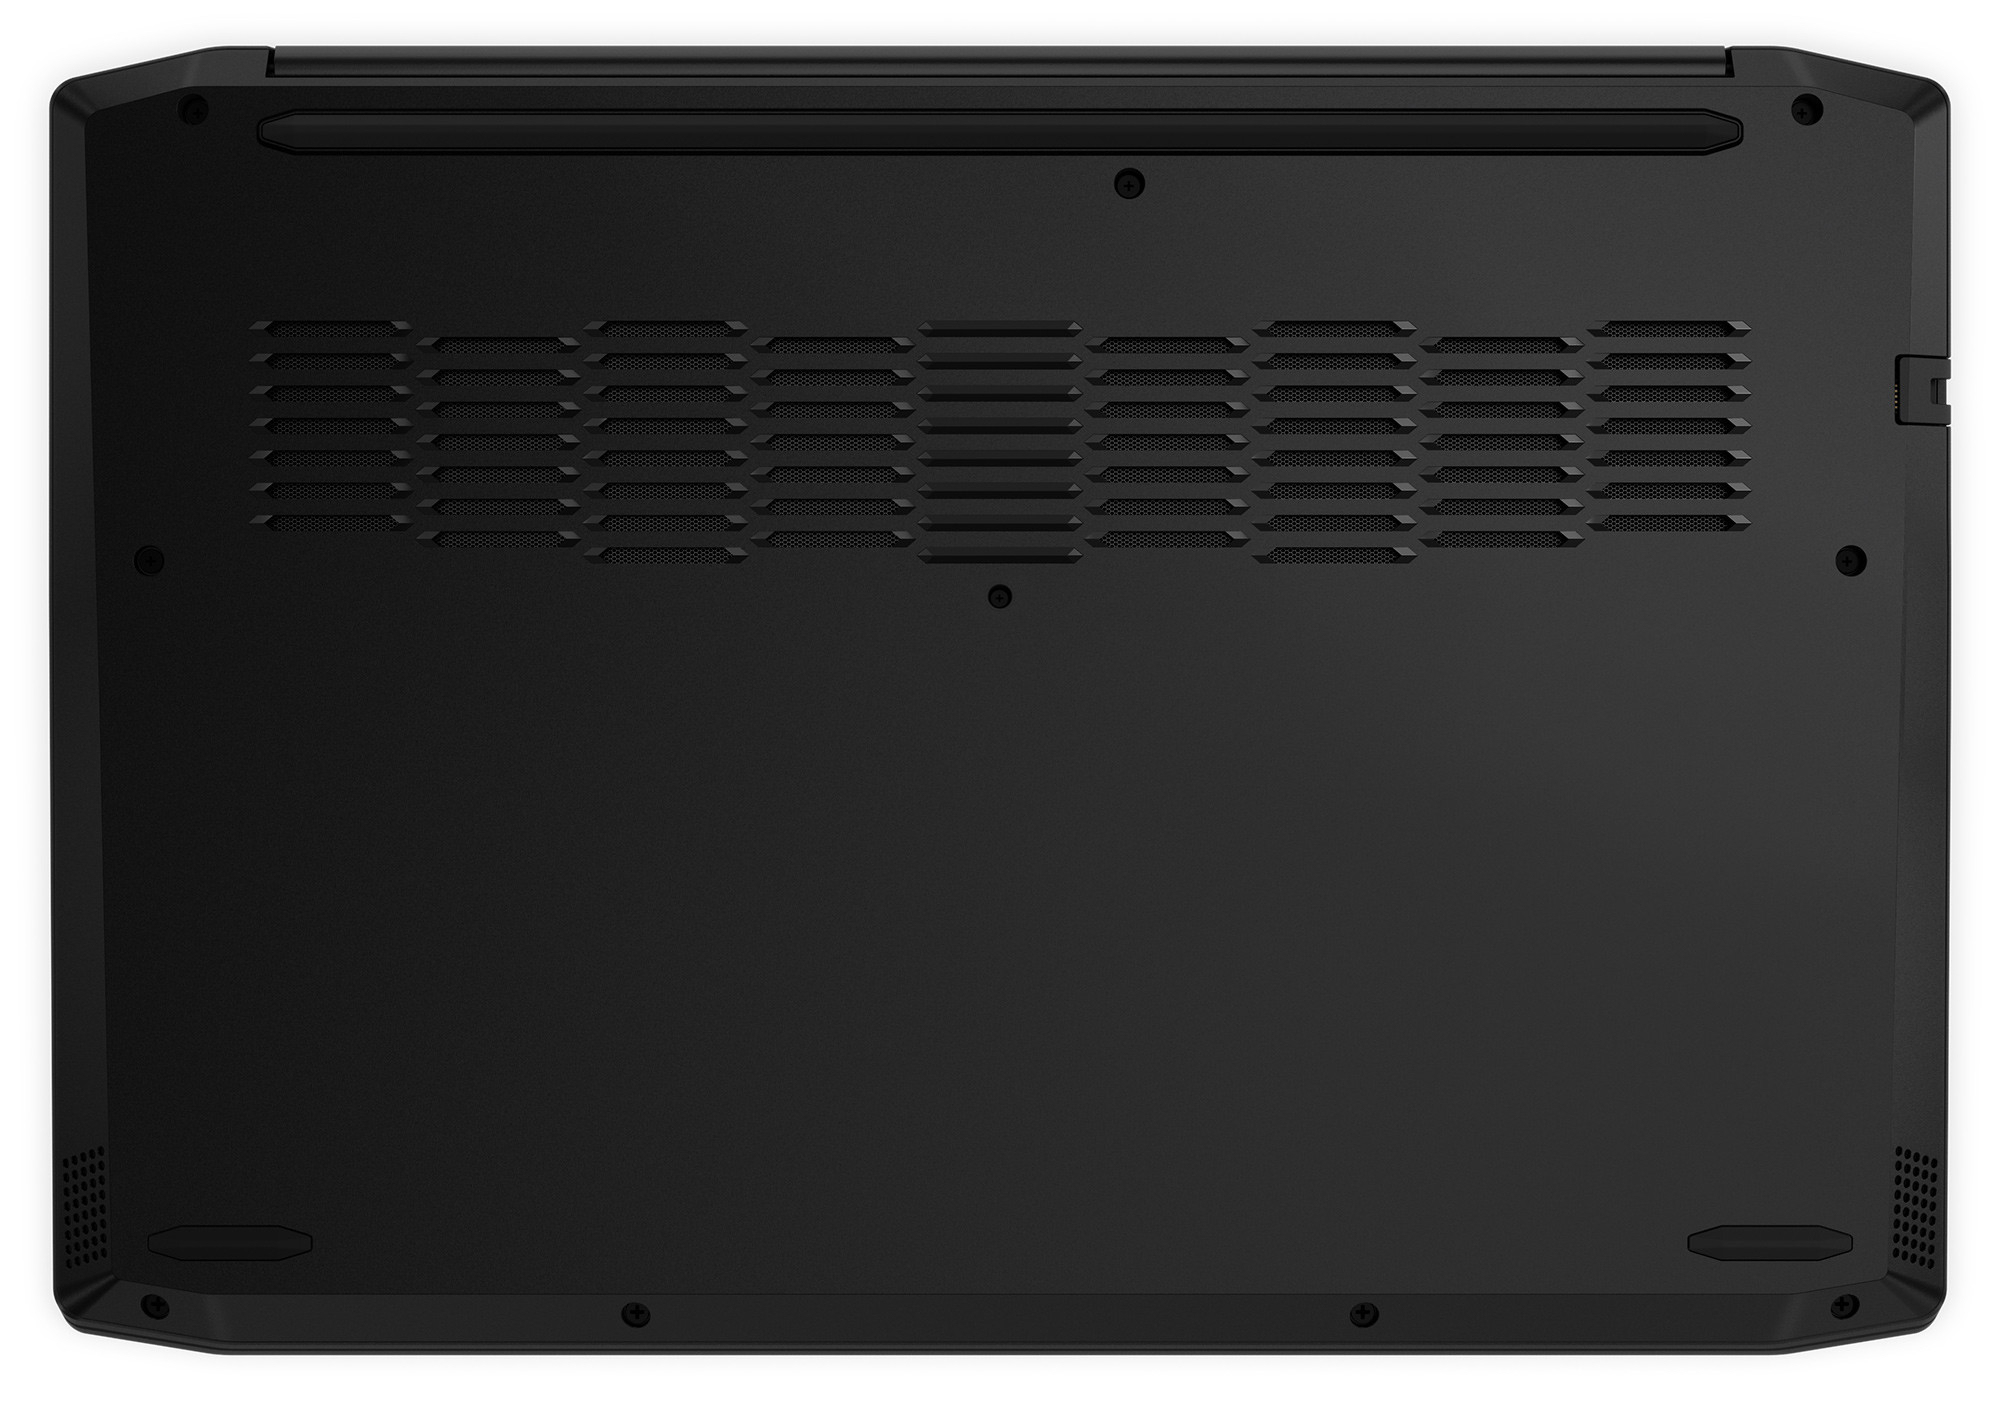
Een NVMe SSD van 512 GB (M.2 2242) zorgt voor snelle systeemprestaties. Mocht de opslagruimte opraken, dan kan deze probleemloos worden uitgebreid. De laptop wordt geleverd met een tweede M.2-sleuf, die plaats biedt aan een NVMe-SSD in het formaat 2280 of 2230. Aangezien de computer geen onderhoudsklep heeft, moet de behuizing worden geopend voor de installatie.
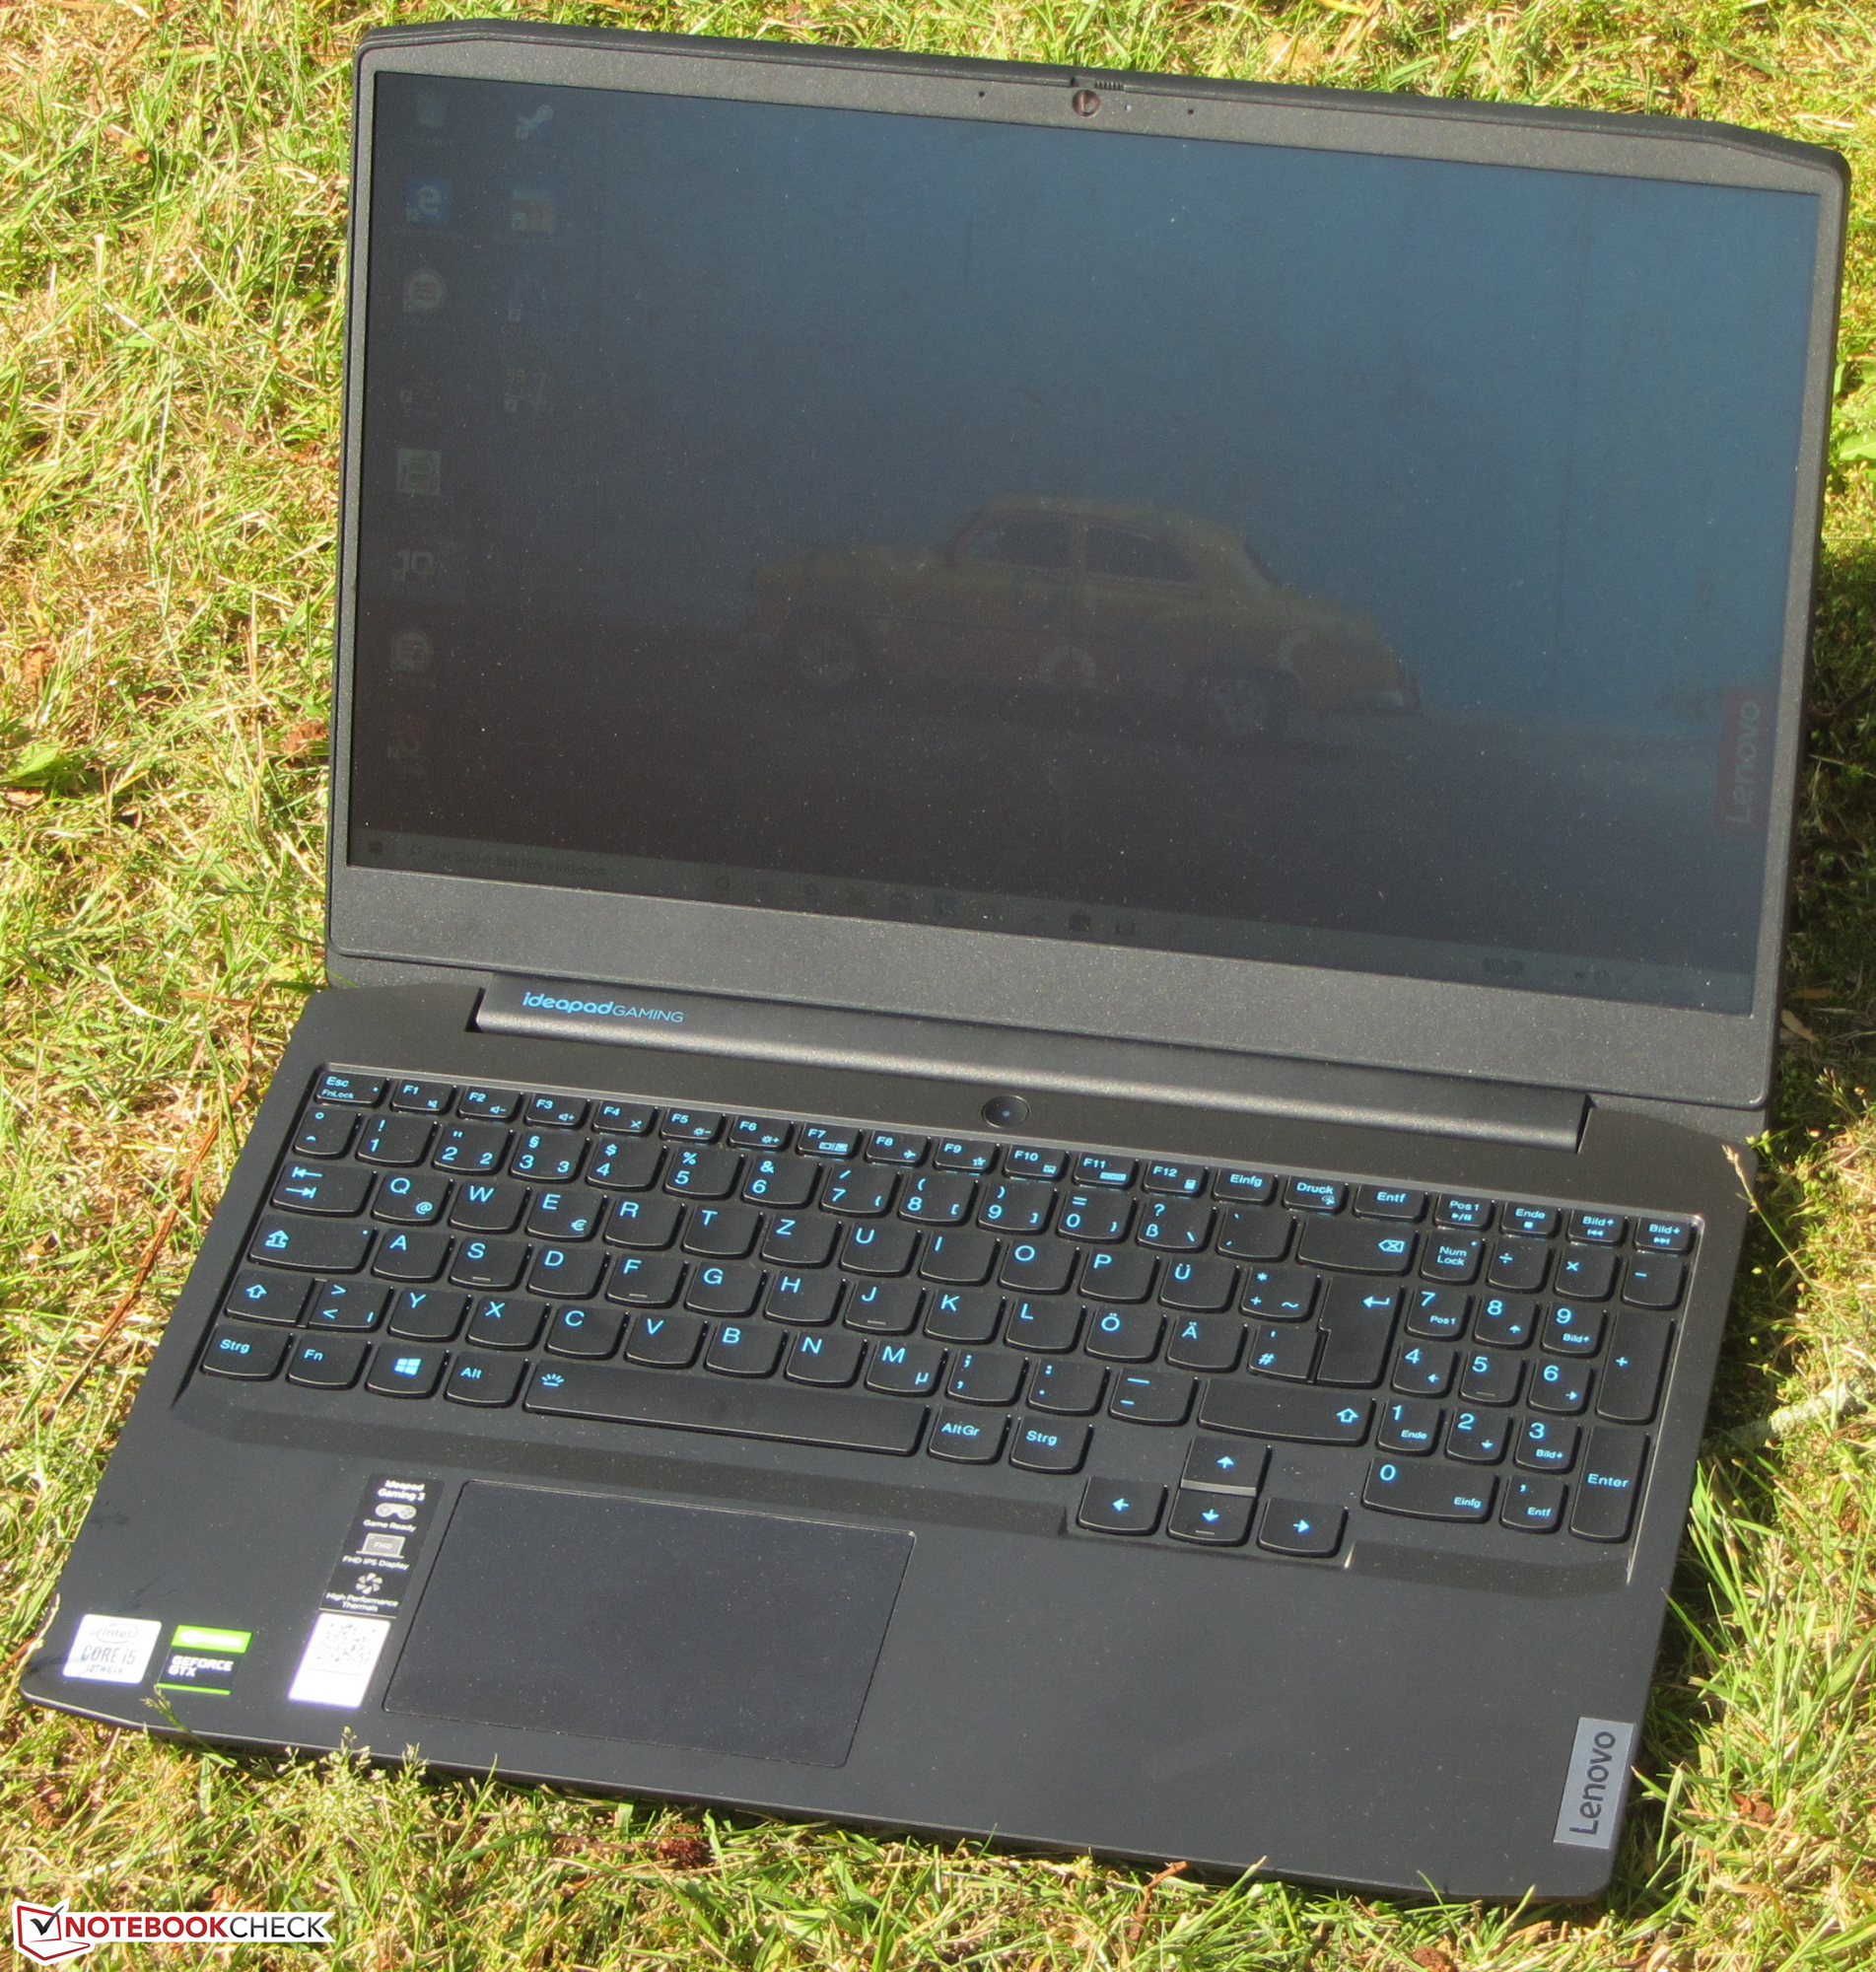
Het 120-Hz Full HD IPS-scherm biedt stabiele kijkhoeken, een mat oppervlak, aanvaardbare reactietijden en degelijke kleurweergave. Hoewel de maximale helderheid nog kan worden omschreven als juist voldoende, zijn het contrast en de dekking van de kleurruimte te laag. Zelfs een instaplaptop zou hier meer moeten bieden.
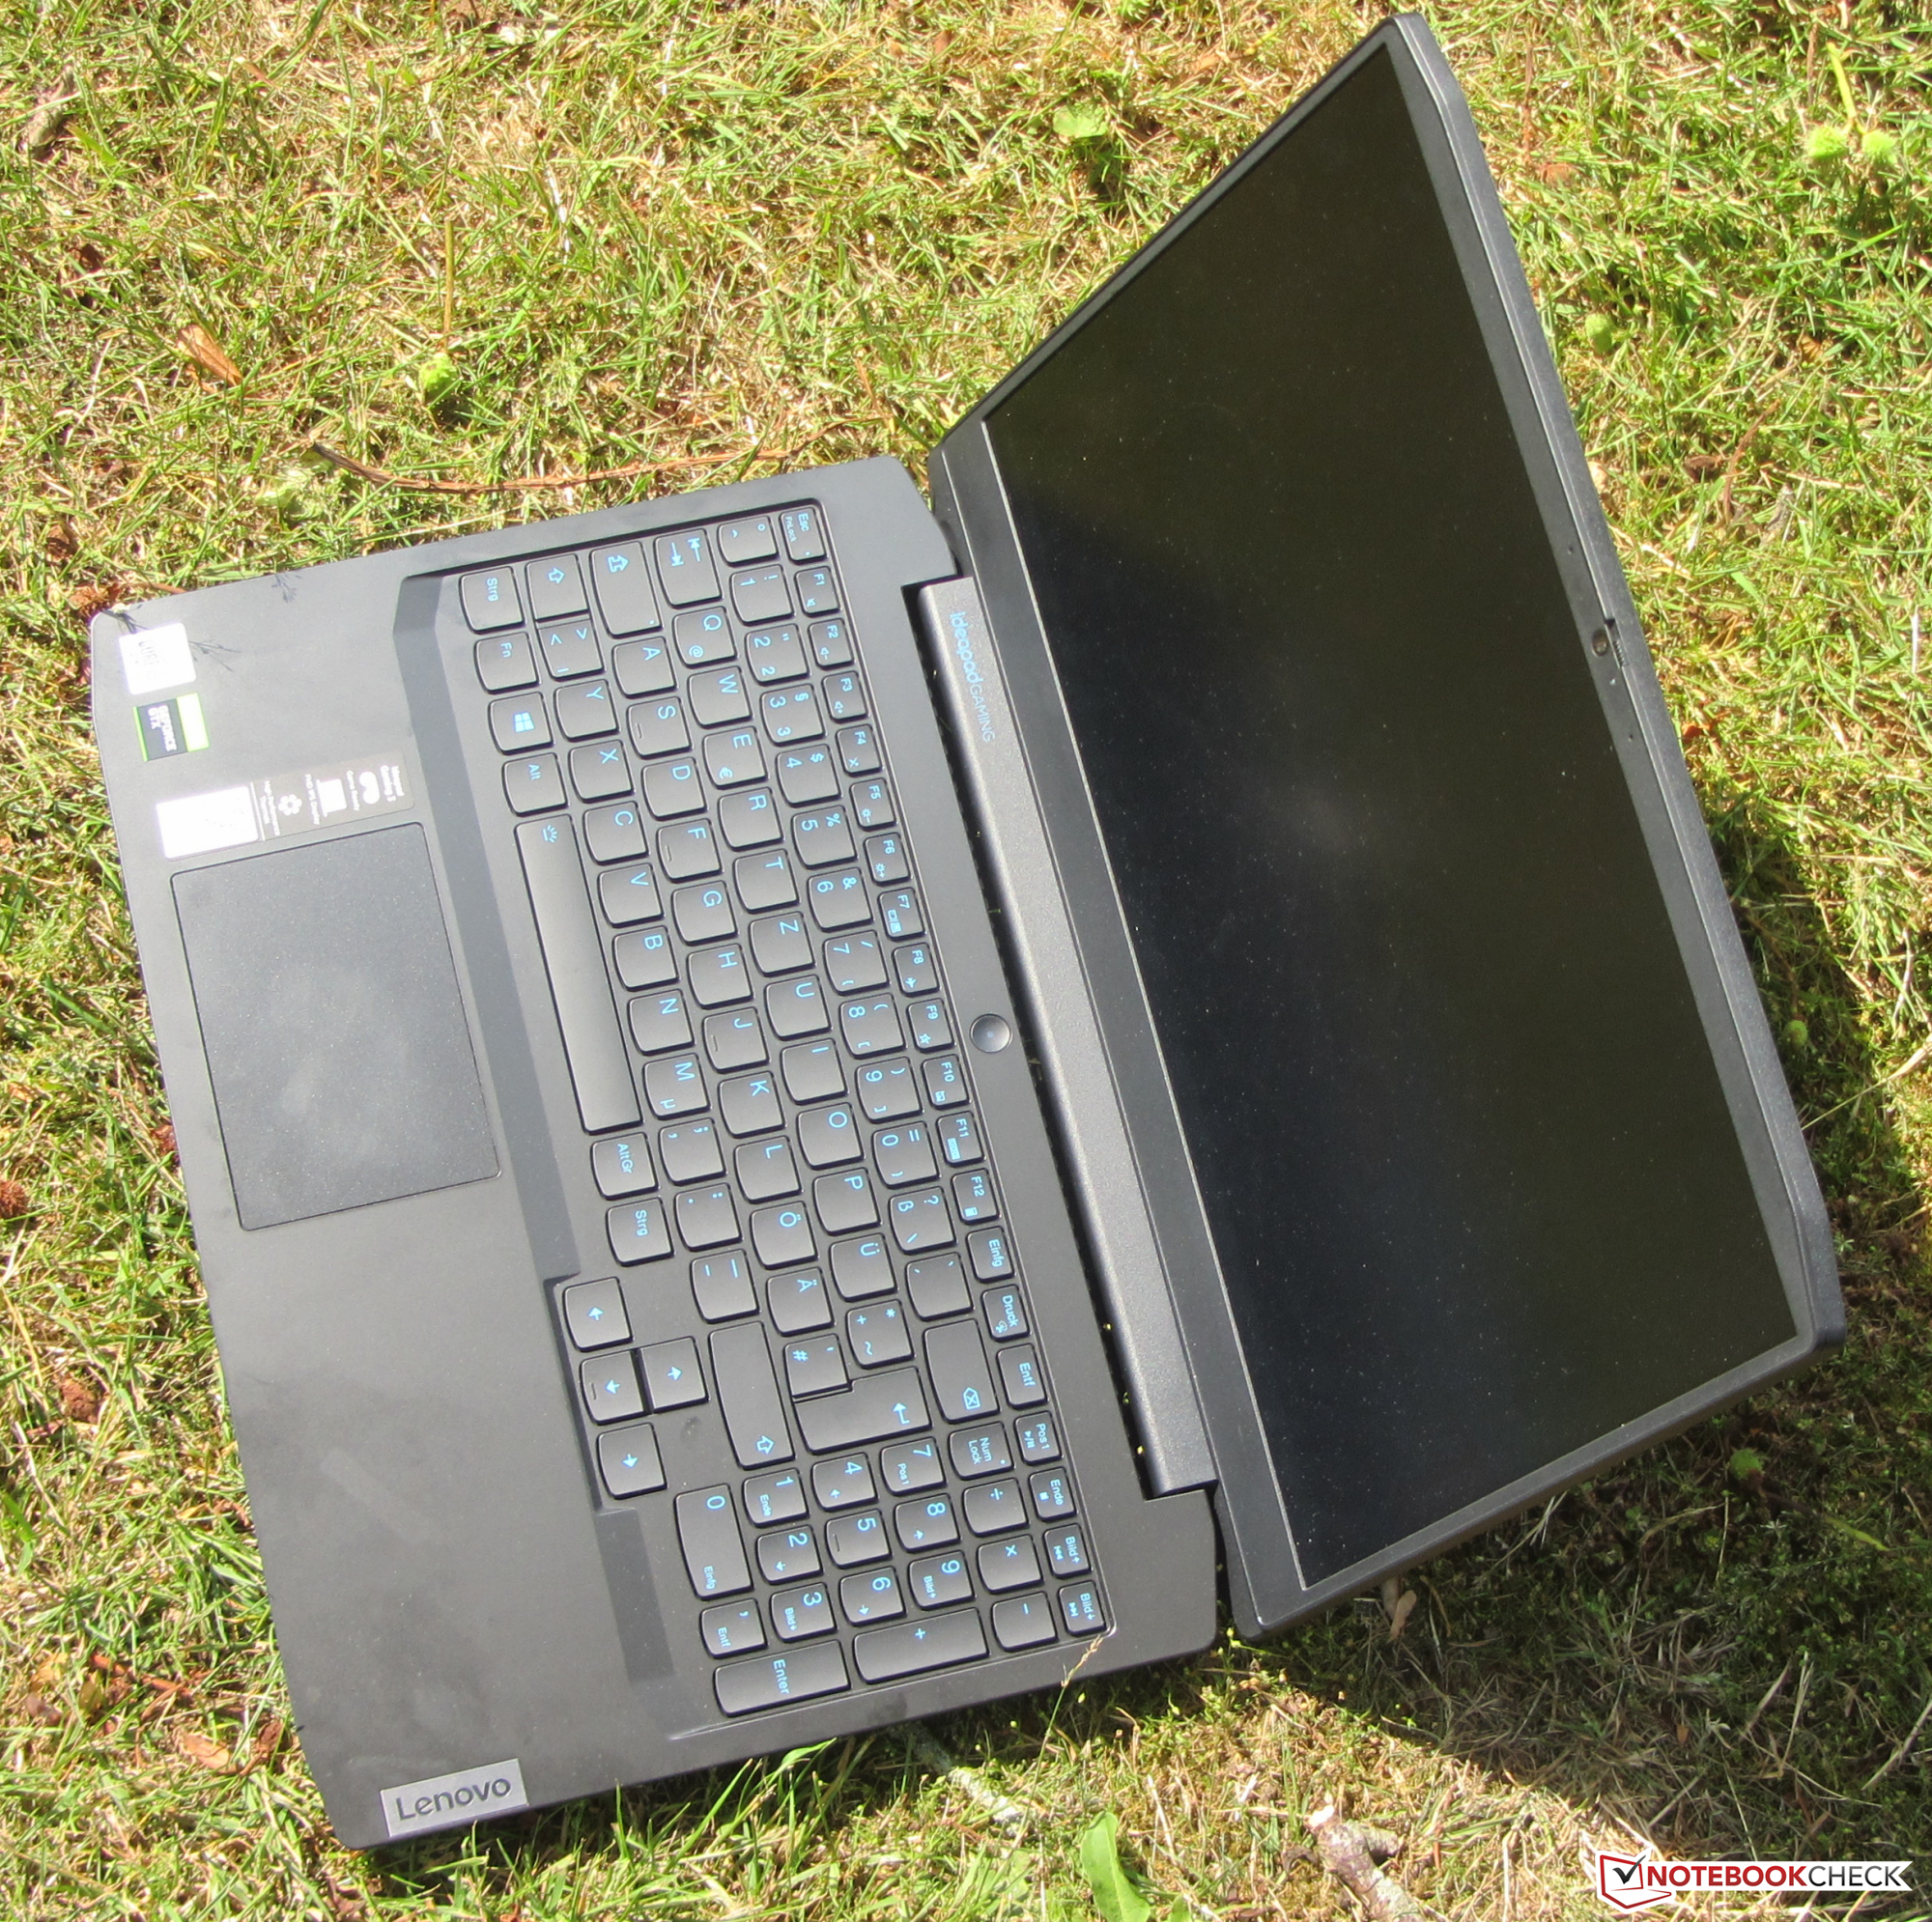
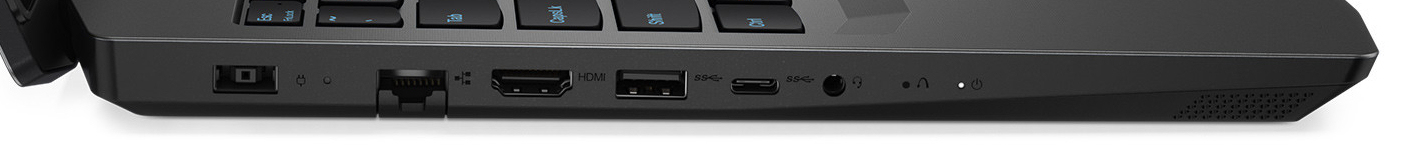
De computer biedt geen overvloed aan connecties. Zo is er geen geheugenkaartlezer of een Thunderbolt 3-poort. De beschikbare USB Type-C 3.2 Gen 1-poort ondersteunt de DisplayPort via USB C-functie niet. Het ingebouwde toetsenbord (achtergrondverlichting in twee niveaus) is geschikt gebleken voor dagelijks gebruik. Daarnaast is de batterijduur prima.
Lenovo IdeaPad Gaming 3i 15IMH05
- 02-07-2020 v7 (old)
Sascha Mölck
Price comparison
