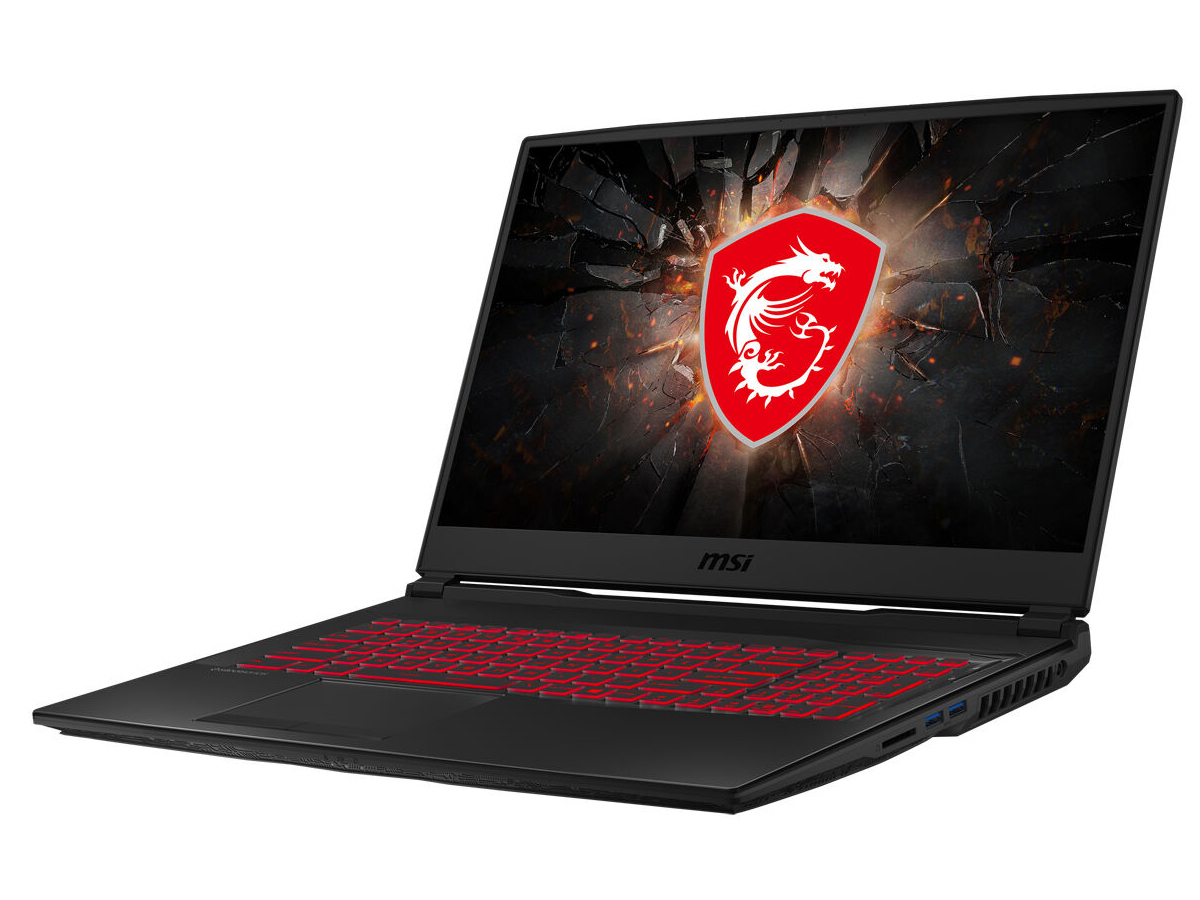
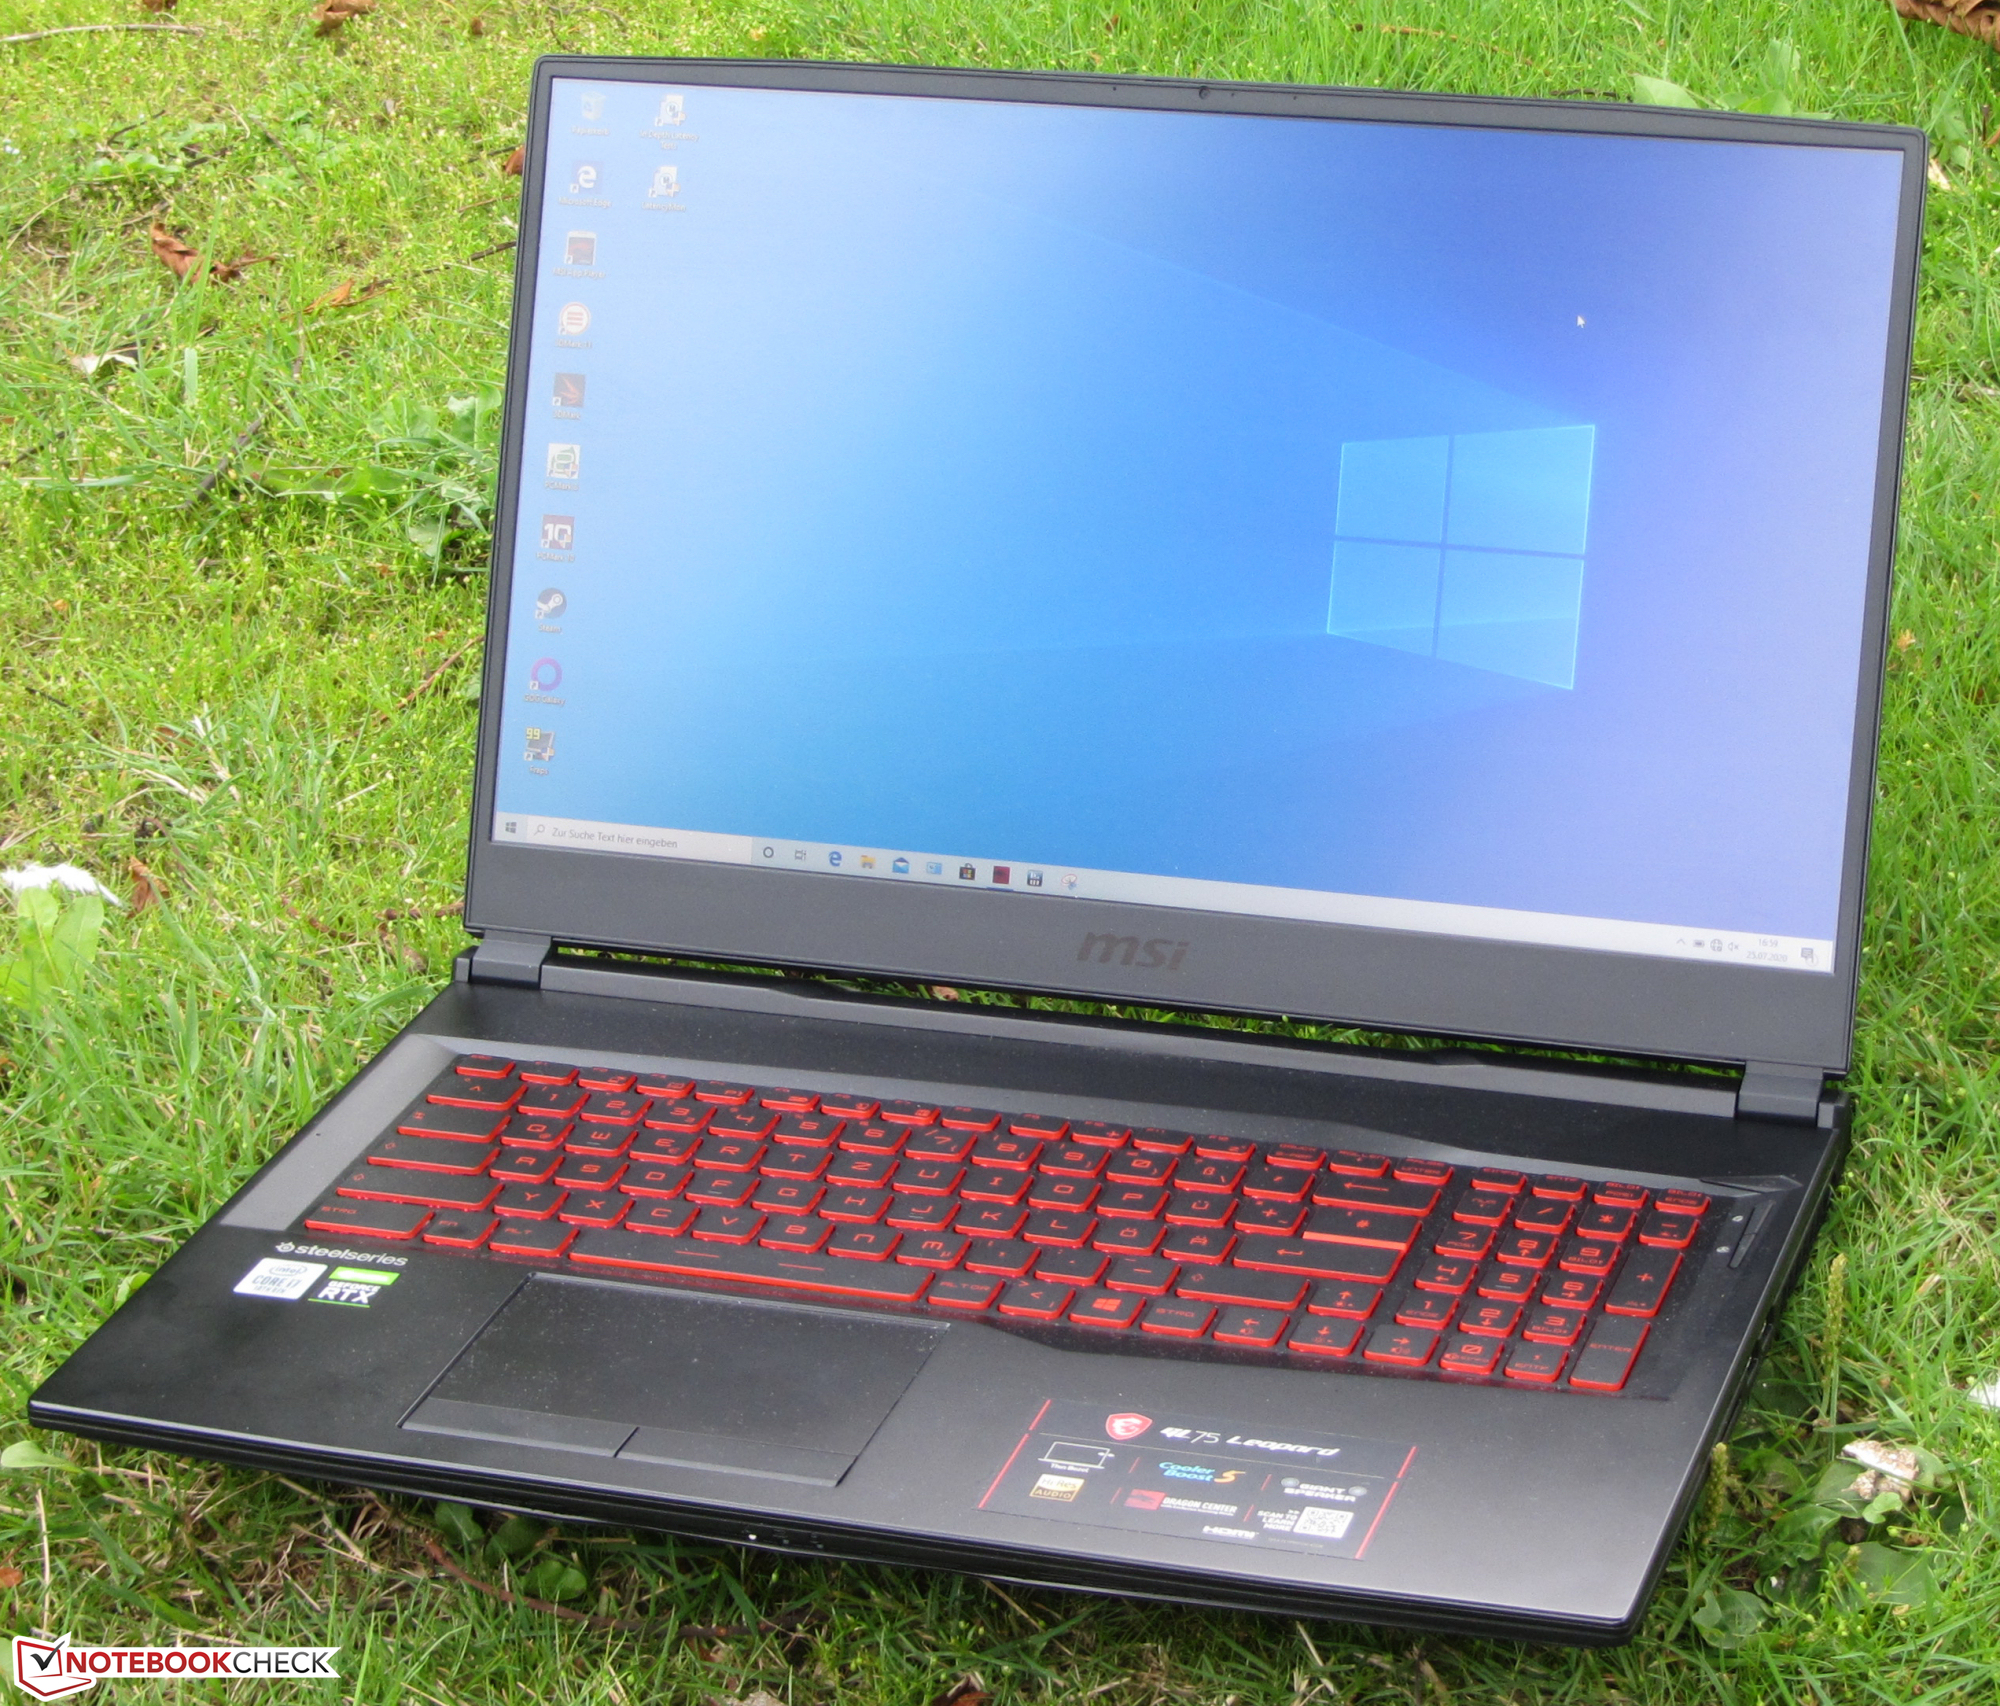
Kort testrapport MSI GL75 Leopard: succesvolle game notebook met een 144 Hz beeldscherm
Evaluatie | Datum | Model | Gewicht | Hoogte | Formaat | Resolutie | Beste prijs |
|---|---|---|---|---|---|---|---|
| 83.5 % v7 (old) | 08-2020 | MSI GL75 10SFR i7-10750H, GeForce RTX 2070 Mobile | 2.6 kg | 28 mm | 17.30" | 1920x1080 | |
| 80.6 % v7 (old) | 06-2020 | Acer Nitro 5 AN517-52-77DS i7-10750H, GeForce RTX 2060 Mobile | 2.2 kg | 24.9 mm | 17.30" | 1920x1080 | |
| 83.2 % v7 (old) | 12-2019 | Schenker XMG Neo 17 XNE17M19 i7-9750H, GeForce RTX 2060 Mobile | 2.5 kg | 27 mm | 17.30" | 1920x1080 | |
| 84 % v7 (old) | 05-2020 | Lenovo Legion Y740-17IRHg-81UJ001VGE i7-9750H, GeForce RTX 2080 Max-Q | 3 kg | 25.5 mm | 17.30" | 1920x1080 |
| SD Card Reader | |
| average JPG Copy Test (av. of 3 runs) | |
| Gemiddelde van klas Gaming (20.9 - 210, n=54, laatste 2 jaar) | |
| Schenker XMG Neo 17 (Toshiba Exceria Pro SDXC 64 GB UHS-II) | |
| Schenker XMG Neo 17 XNE17M19 (Toshiba Exceria Pro SDXC 64 GB UHS-II) | |
| MSI GP75 Leopard 9SD (Toshiba Exceria Pro SDXC 64 GB UHS-II) | |
| MSI GL75 9SEK-056US | |
| MSI GL75 10SFR (Toshiba Exceria Pro SDXC 64 GB UHS-II) | |
| maximum AS SSD Seq Read Test (1GB) | |
| Gemiddelde van klas Gaming (25.5 - 261, n=51, laatste 2 jaar) | |
| Schenker XMG Neo 17 (Toshiba Exceria Pro SDXC 64 GB UHS-II) | |
| Schenker XMG Neo 17 XNE17M19 (Toshiba Exceria Pro SDXC 64 GB UHS-II) | |
| MSI GL75 9SEK-056US | |
| MSI GP75 Leopard 9SD (Toshiba Exceria Pro SDXC 64 GB UHS-II) | |
| MSI GL75 10SFR (Toshiba Exceria Pro SDXC 64 GB UHS-II) | |


| |||||||||||||||||||||||||
Helderheidsverdeling: 86 %
Helderheid in Batterij-modus: 337 cd/m²
Contrast: 1549:1 (Zwart: 0.215 cd/m²)
ΔE ColorChecker Calman: 1.98 | ∀{0.5-29.43 Ø4.72}
calibrated: 2.01
ΔE Greyscale Calman: 2.97 | ∀{0.09-98 Ø4.97}
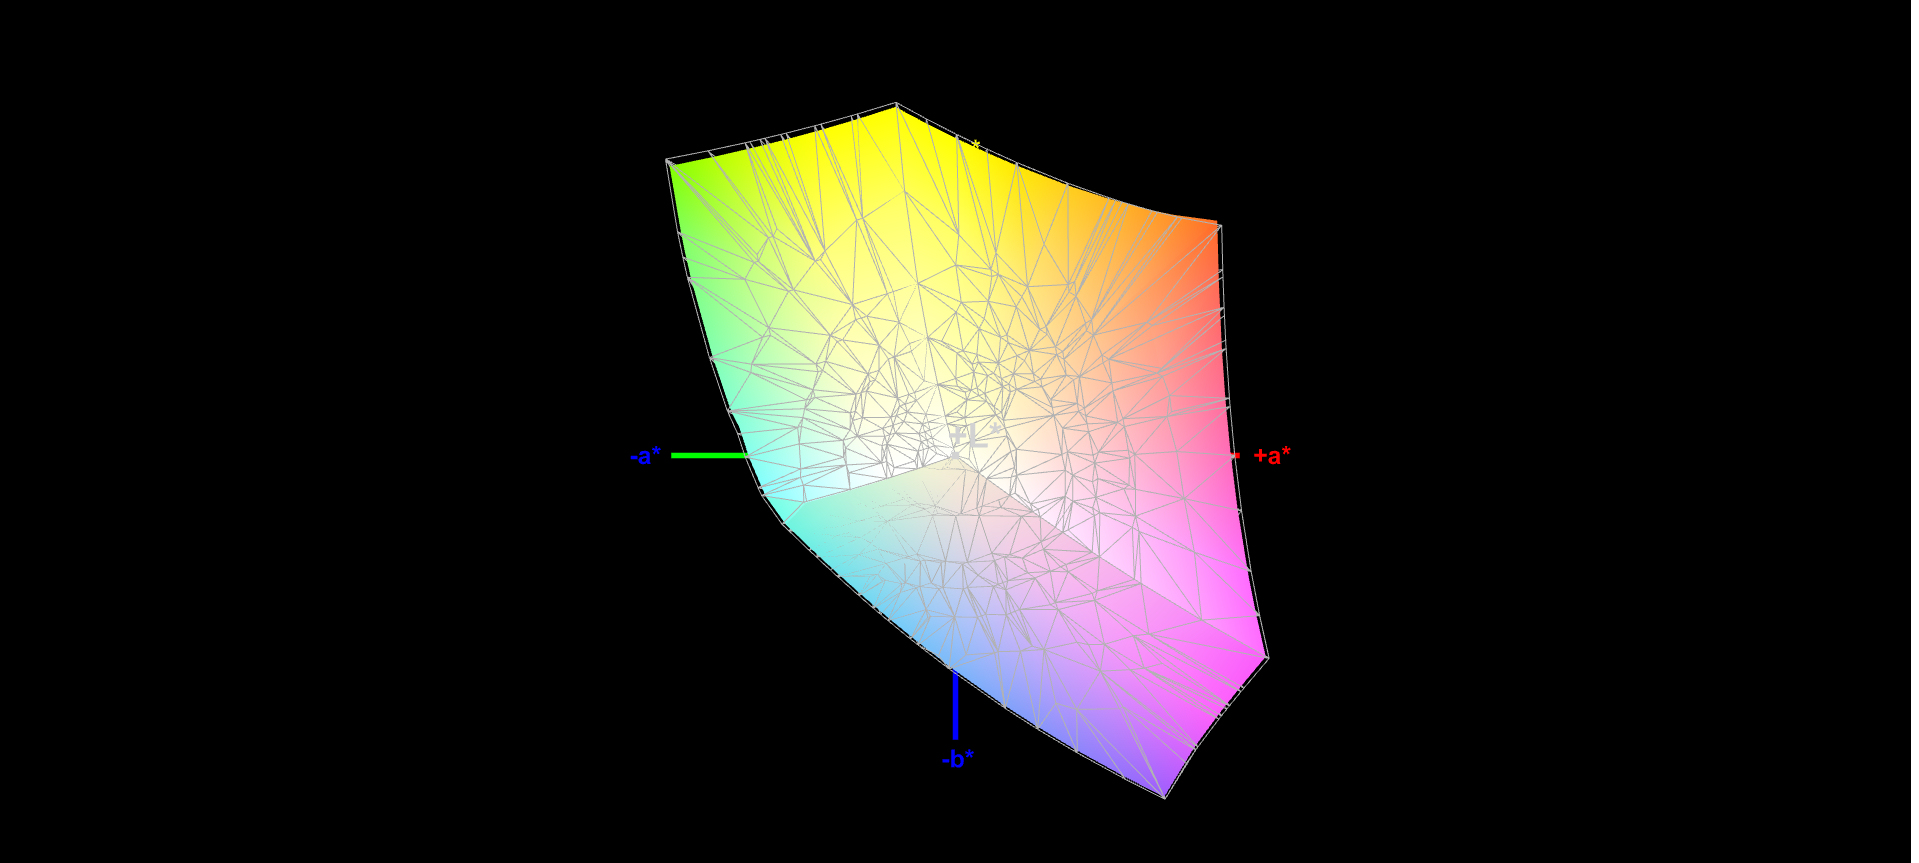
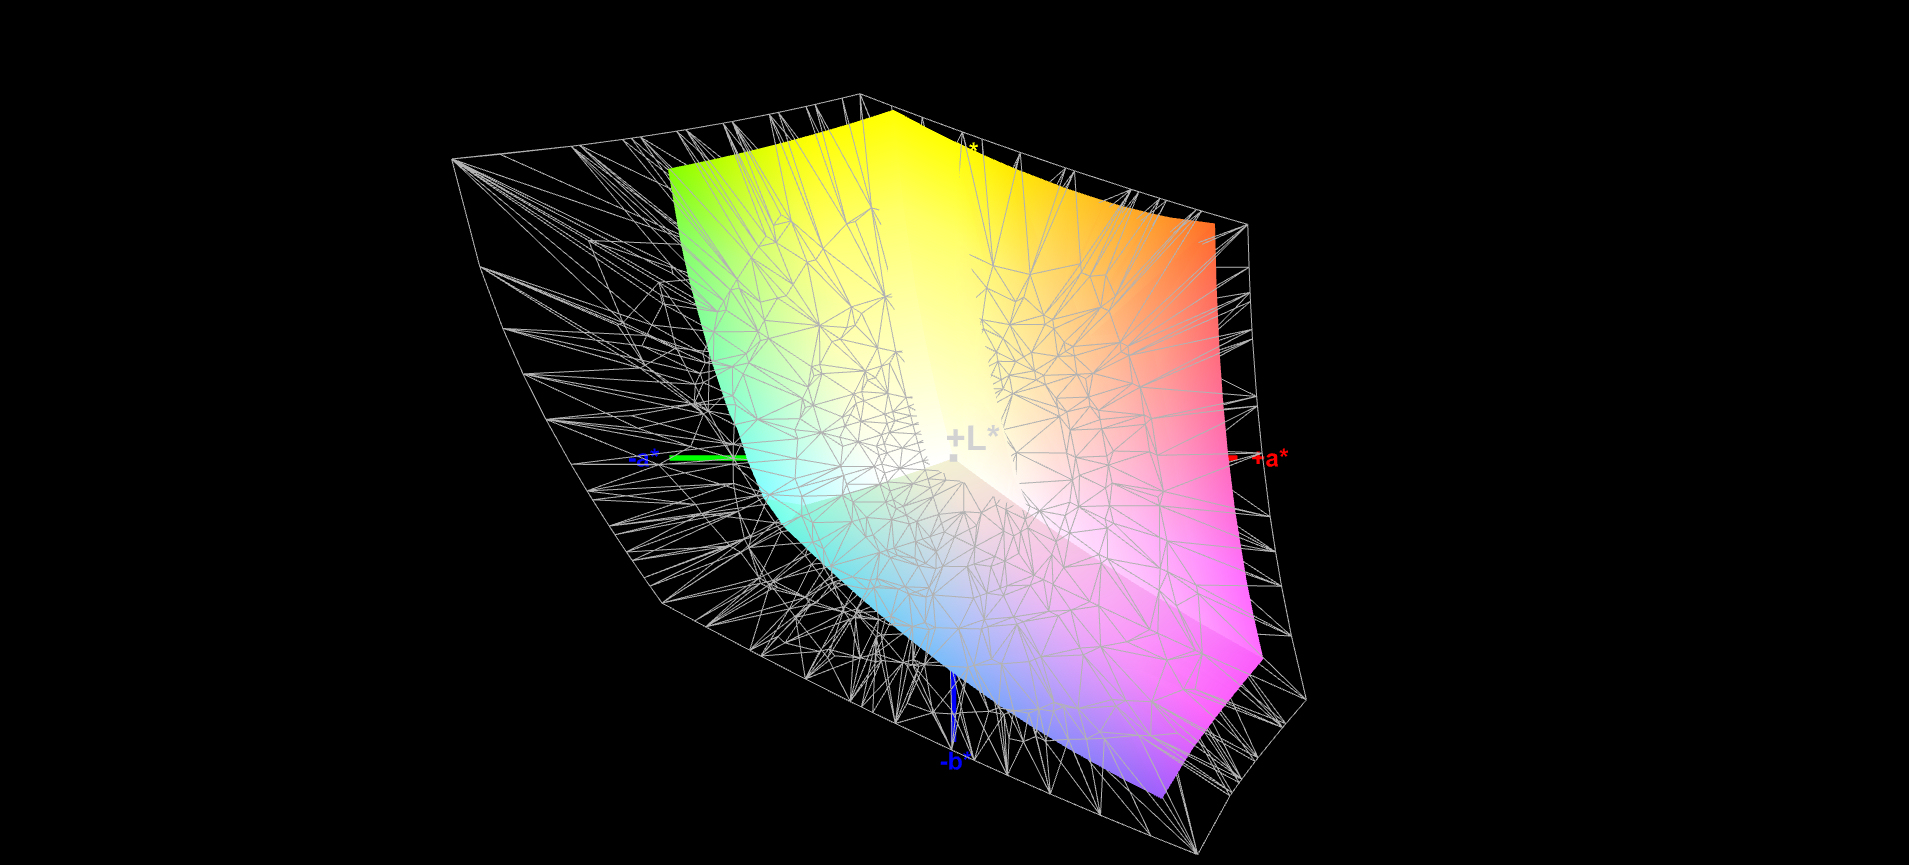
96% sRGB (Argyll 1.6.3 3D)
61% AdobeRGB 1998 (Argyll 1.6.3 3D)
66% AdobeRGB 1998 (Argyll 3D)
96.2% sRGB (Argyll 3D)
63.9% Display P3 (Argyll 3D)
Gamma: 2.41
CCT: 6750 K
| MSI GL75 10SFR Chi Mei N173HCE-G33, IPS, 1920x1080, 17.3" | Acer Nitro 5 AN517-52-77DS AU Optronics B173HAN04.7, IPS, 1920x1080, 17.3" | Schenker XMG Neo 17 XNE17M19 LG LP173WFG-SPB1 (LGD0615), IPS, 1920x1080, 17.3" | Lenovo Legion Y740-17IRHg-81UJ001VGE AUO_B173HAN03, IPS, 1920x1080, 17.3" | MSI GL75 9SEK-056US AU Optronics AUO479D (B173HAN04.7), IPS, 1920x1080, 17.3" | MSI GP75 Leopard 9SD Chi Mei N173HCE-G33 (CMN175C), IPS, 1920x1080, 17.3" | |
|---|---|---|---|---|---|---|
| Display | -38% | -0% | -2% | -36% | -1% | |
| Display P3 Coverage (%) | 63.9 | 39.47 -38% | 64.6 1% | 63.8 0% | 41.12 -36% | 63.4 -1% |
| sRGB Coverage (%) | 96.2 | 58.9 -39% | 95.6 -1% | 92.7 -4% | 61.1 -36% | 94.9 -1% |
| AdobeRGB 1998 Coverage (%) | 66 | 40.77 -38% | 65.6 -1% | 65.3 -1% | 42.49 -36% | 65.1 -1% |
| Response Times | -191% | -30% | -28% | -144% | 18% | |
| Response Time Grey 50% / Grey 80% * (ms) | 12 ? | 35 ? -192% | 15.6 ? -30% | 16 ? -33% | 26 ? -117% | 8 ? 33% |
| Response Time Black / White * (ms) | 9 ? | 26 ? -189% | 11.6 ? -29% | 11 ? -22% | 24.4 ? -171% | 8.8 ? 2% |
| PWM Frequency (Hz) | 208 ? | 25510 ? | ||||
| Screen | -87% | -27% | -33% | -67% | -9% | |
| Brightness middle (cd/m²) | 333 | 263 -21% | 318 -5% | 310 -7% | 259.1 -22% | 420 26% |
| Brightness (cd/m²) | 309 | 246 -20% | 286 -7% | 281 -9% | 261 -16% | 393 27% |
| Brightness Distribution (%) | 86 | 85 -1% | 86 0% | 85 -1% | 93 8% | 91 6% |
| Black Level * (cd/m²) | 0.215 | 0.47 -119% | 0.23 -7% | 0.31 -44% | 0.25 -16% | 0.32 -49% |
| Contrast (:1) | 1549 | 560 -64% | 1383 -11% | 1000 -35% | 1036 -33% | 1313 -15% |
| Colorchecker dE 2000 * | 1.98 | 5.07 -156% | 3.89 -96% | 3.86 -95% | 4.23 -114% | 3.04 -54% |
| Colorchecker dE 2000 max. * | 4.34 | 20.5 -372% | 10.56 -143% | 7.8 -80% | 23.39 -439% | 7.22 -66% |
| Colorchecker dE 2000 calibrated * | 2.01 | 4.9 -144% | 1.03 49% | 3.9 -94% | 0.89 56% | |
| Greyscale dE 2000 * | 2.97 | 2.55 14% | 5.3 -78% | 4.48 -51% | 1.3 56% | 3.91 -32% |
| Gamma | 2.41 91% | 2.37 93% | 2.46 89% | 2.5 88% | 2.076 106% | 2.26 97% |
| CCT | 6750 96% | 6446 101% | 7462 87% | 7542 86% | 6542 99% | 7138 91% |
| Color Space (Percent of AdobeRGB 1998) (%) | 61 | 37 -39% | 60 -2% | 60 -2% | 39 -36% | 60 -2% |
| Color Space (Percent of sRGB) (%) | 96 | 59 -39% | 96 0% | 93 -3% | 61 -36% | 95 -1% |
| Totaal Gemiddelde (Programma / Instellingen) | -105% /
-91% | -19% /
-23% | -21% /
-26% | -82% /
-71% | 3% /
-5% |
* ... kleiner is beter
Responstijd Scherm
| ↔ Responstijd Zwart naar Wit | ||
|---|---|---|
| 9 ms ... stijging ↗ en daling ↘ gecombineerd | ↗ 5 ms stijging | 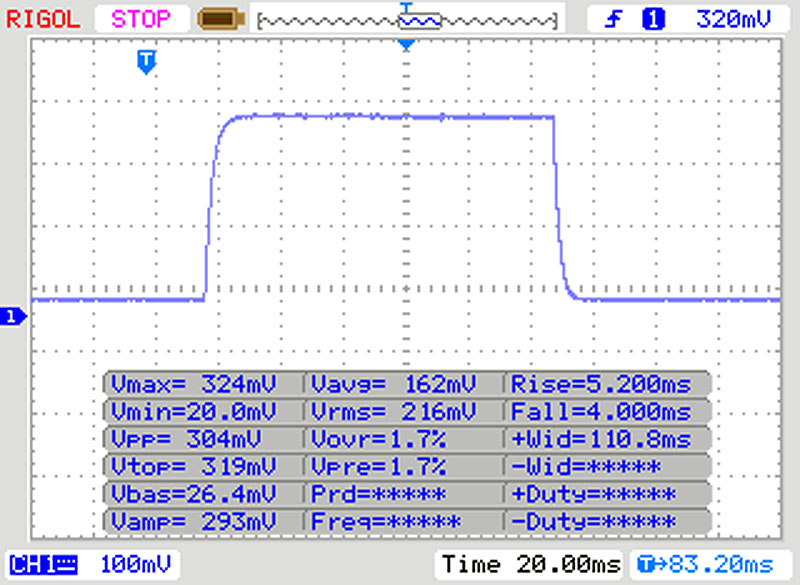 |
| ↘ 4 ms daling | ||
| Het scherm vertoonde snelle responstijden in onze tests en zou geschikt moeten zijn voor games. Ter vergelijking: alle testtoestellen variëren van 0.1 (minimum) tot 240 (maximum) ms. » 25 % van alle toestellen zijn beter. Dit betekent dat de gemeten responstijd beter is dan het gemiddelde (19.8 ms) van alle geteste toestellen. | ||
| ↔ Responstijd 50% Grijs naar 80% Grijs | ||
| 12 ms ... stijging ↗ en daling ↘ gecombineerd | ↗ 6 ms stijging | 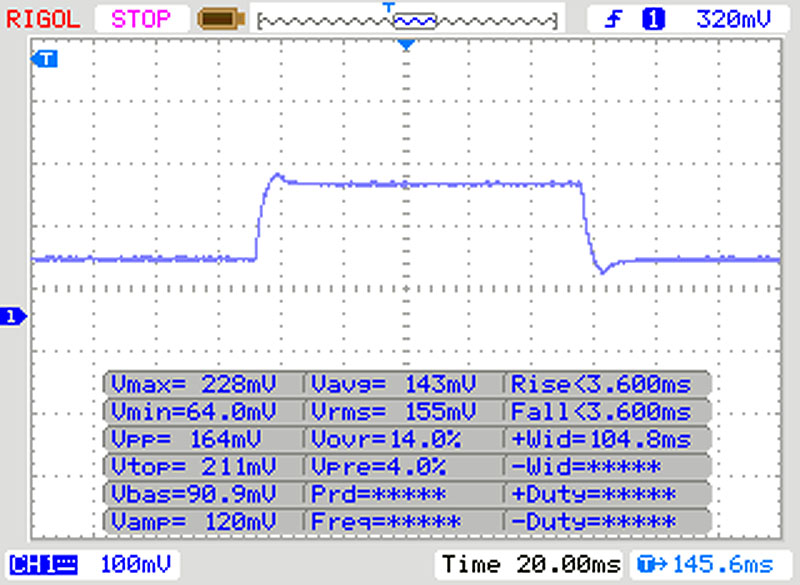 |
| ↘ 6 ms daling | ||
| Het scherm vertoonde prima responstijden in onze tests maar is misschien wat te traag voor competitieve games. Ter vergelijking: alle testtoestellen variëren van 0.165 (minimum) tot 636 (maximum) ms. » 25 % van alle toestellen zijn beter. Dit betekent dat de gemeten responstijd beter is dan het gemiddelde (31 ms) van alle geteste toestellen. | ||
Screen Flickering / PWM (Pulse-Width Modulation)
| Screen flickering / PWM waargenomen | 208 Hz | ≤ 30 % helderheid instelling | 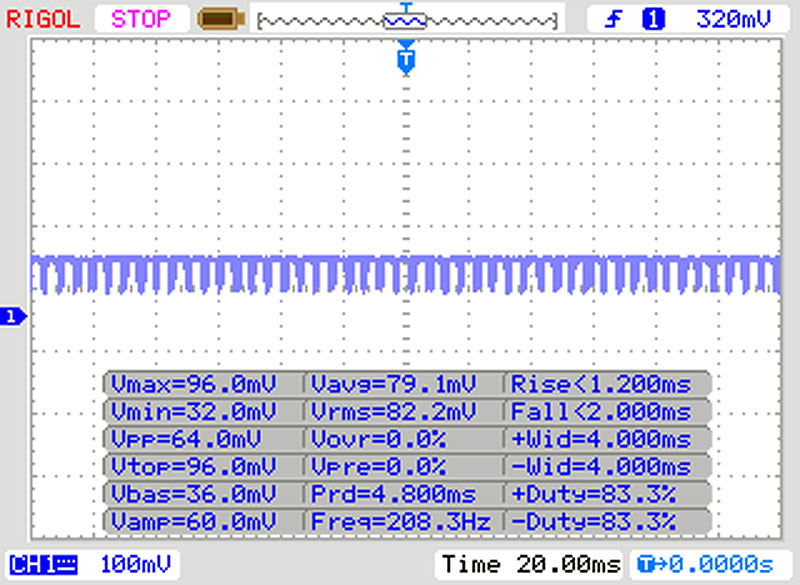 |
De achtergrondverlichting van het scherm flikkert op 208 Hz (in het slechtste geval, bijvoorbeeld bij gebruik van PWM) aan een helderheid van 30 % en lager. Boven deze helderheid zou er geen flickering / PWM mogen optreden. De frequentie van 208 Hz is redelijk laag en de meeste mensen die gevoelig zijn aan flickering kunnen dit dus waarnemen of geïrriteerde ogen krijgen (gebruikmakend van de vermelde helderheid en lager). Ter vergelijking: 52 % van alle geteste toestellen maakten geen gebruik van PWM om de schermhelderheid te verlagen. Als het wel werd gebruikt, werd een gemiddelde van 7763 (minimum: 5 - maximum: 343500) Hz waargenomen. | |||
* ... kleiner is beter
| PCMark 8 Home Score Accelerated v2 | 3372 punten | |
| PCMark 8 Creative Score Accelerated v2 | 3874 punten | |
| PCMark 8 Work Score Accelerated v2 | 5678 punten | |
| PCMark 10 Score | 5179 punten | |
Help | ||
| DPC Latencies / LatencyMon - interrupt to process latency (max), Web, Youtube, Prime95 | |
| Asus TUF A17 FA706IU-AS76 | |
| MSI GL75 10SFR | |
| MSI Bravo 17 A4DDR | |
| Acer Nitro 5 AN517-52-77DS | |
* ... kleiner is beter

| MSI GL75 10SFR Lite-On CL1-8D512 | Acer Nitro 5 AN517-52-77DS WDC PC SN530 SDBPNPZ-1T00 | Schenker XMG Neo 17 XNE17M19 Samsung SSD 970 EVO Plus 500GB | Lenovo Legion Y740-17IRHg-81UJ001VGE Samsung SSD PM981 MZVLB1T0HALR | Schenker XMG Neo 17 Samsung SSD 970 EVO Plus 1TB | MSI GL75 9SEK-056US WDC PC SN520 SDAPNUW-512G | MSI GP75 Leopard 9SD Kingston RBUSNS8154P3256GJ1 | MSI Bravo 17 A4DDR Toshiba KBG30ZMV512G | Asus TUF A17 FA706IU-AS76 Intel SSD 660p 1TB SSDPEKNW010T8 | Gemiddeld Lite-On CL1-8D512 | |
|---|---|---|---|---|---|---|---|---|---|---|
| CrystalDiskMark 5.2 / 6 | 5% | 11% | 21% | 7% | 7% | -45% | -24% | 15% | -16% | |
| Write 4K (MB/s) | 132.2 | 140 6% | 103.2 -22% | 101.2 -23% | 92.7 -30% | 149.1 13% | 105.8 -20% | 94.6 -28% | 189.7 43% | 119 ? -10% |
| Read 4K (MB/s) | 45.62 | 49.04 7% | 42.11 -8% | 44.61 -2% | 41.4 -9% | 48.58 6% | 27.89 -39% | 47.12 3% | 62.3 37% | 35.6 ? -22% |
| Write Seq (MB/s) | 1511 | 1963 30% | 1087 -28% | 2295 52% | 1363 -10% | 270.8 -82% | 850 -44% | 1681 11% | 1099 ? -27% | |
| Read Seq (MB/s) | 1890 | 1455 -23% | 974 -48% | 2174 15% | 1259 -33% | 879 -53% | 1157 -39% | 1608 -15% | 1806 ? -4% | |
| Write 4K Q32T1 (MB/s) | 375.9 | 398.2 6% | 404.7 8% | 401.2 7% | 289.7 -23% | 462 23% | 273.3 -27% | 277.7 -26% | 468.6 25% | 390 ? 4% |
| Read 4K Q32T1 (MB/s) | 525 | 461.9 -12% | 469.8 -11% | 475.5 -9% | 337.5 -36% | 606 15% | 361.2 -31% | 546 4% | 541 3% | 371 ? -29% |
| Write Seq Q32T1 (MB/s) | 1505 | 1969 31% | 3279 118% | 2397 59% | 3332 121% | 1454 -3% | 253 -83% | 908 -40% | 1770 18% | 965 ? -36% |
| Read Seq Q32T1 (MB/s) | 2008 | 1927 -4% | 3513 75% | 3337 66% | 3477 73% | 1724 -14% | 1505 -25% | 1632 -19% | 1898 -5% | 1998 ? 0% |
| Write 4K Q8T8 (MB/s) | 1562 | 1211 | ||||||||
| Read 4K Q8T8 (MB/s) | 1373 | 1104 | ||||||||
| AS SSD | 51% | 119% | 89% | 130% | 49% | -53% | 6% | 30% | -13% | |
| Seq Read (MB/s) | 1923 | 1804 -6% | 2274 18% | 2800 46% | 2359 23% | 1296 -33% | 748 -61% | 1420 -26% | 1320 -31% | 1795 ? -7% |
| Seq Write (MB/s) | 1065 | 1922 80% | 2522 137% | 2424 128% | 2469 132% | 1391 31% | 219 -79% | 922 -13% | 1539 45% | 706 ? -34% |
| 4K Read (MB/s) | 25.43 | 38.21 50% | 49.72 96% | 42.77 68% | 53.5 110% | 29.67 17% | 25.7 1% | 48.51 91% | 56.3 121% | 24.8 ? -2% |
| 4K Write (MB/s) | 101.9 | 105 3% | 118.2 16% | 94.8 -7% | 117.6 15% | 82.4 -19% | 116.8 15% | 158.5 56% | 92.6 ? -9% | |
| 4K-64 Read (MB/s) | 477.9 | 976 104% | 1209 153% | 1406 194% | 1579 230% | 1042 118% | 259.3 -46% | 928 94% | 586 23% | 379 ? -21% |
| 4K-64 Write (MB/s) | 563 | 1150 104% | 2218 294% | 1697 201% | 2048 264% | 1284 128% | 190.2 -66% | 345.4 -39% | 820 46% | 472 ? -16% |
| Access Time Read * (ms) | 0.053 | 0.055 -4% | 0.05 6% | 0.048 9% | 0.108 -104% | 0.159 -200% | 0.089 -68% | 0.043 19% | 0.069 ? -30% | |
| Access Time Write * (ms) | 0.126 | 0.045 64% | 0.031 75% | 0.039 69% | 0.03 76% | 0.031 75% | 0.058 54% | 0.189 -50% | 0.113 10% | 0.134 ? -6% |
| Score Read (Points) | 696 | 1194 72% | 1486 114% | 1729 148% | 1869 169% | 1201 73% | 360 -48% | 1119 61% | 775 11% | 584 ? -16% |
| Score Write (Points) | 771 | 1747 127% | 2588 236% | 2034 164% | 2413 213% | 1542 100% | 294 -62% | 554 -28% | 1132 47% | 635 ? -18% |
| Score Total (Points) | 1785 | 3563 100% | 4855 172% | 4630 159% | 5248 194% | 3363 88% | 821 -54% | 2232 25% | 2333 31% | 1469 ? -18% |
| Copy ISO MB/s (MB/s) | 1710 | 1305 -24% | 2148 26% | 1736 2% | 1710 ? 0% | |||||
| Copy Program MB/s (MB/s) | 465.3 | 467.5 0% | 582 25% | 553 19% | 465 ? 0% | |||||
| Copy Game MB/s (MB/s) | 1042 | 872 -16% | 1278 23% | 1264 21% | 1042 ? 0% | |||||
| Totaal Gemiddelde (Programma / Instellingen) | 28% /
33% | 65% /
73% | 55% /
64% | 69% /
78% | 28% /
33% | -49% /
-49% | -9% /
-7% | 23% /
24% | -15% /
-14% |
* ... kleiner is beter
Continuous load read: DiskSpd Read Loop, Queue Depth 8
| 3DMark 11 Performance | 21006 punten | |
| 3DMark Cloud Gate Standard Score | 36210 punten | |
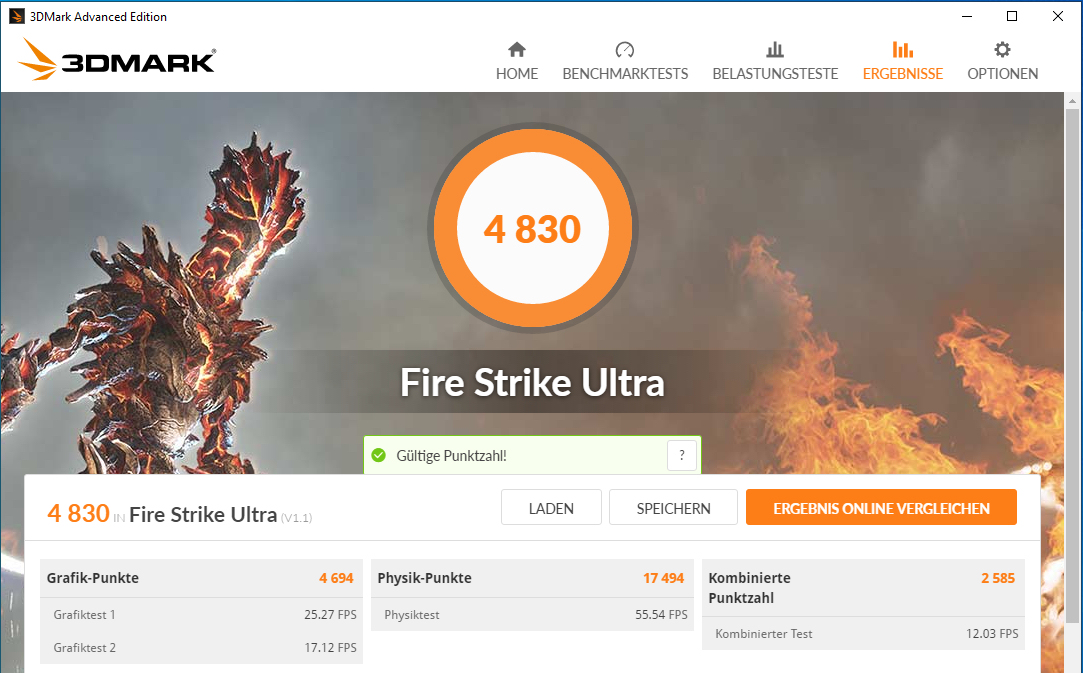
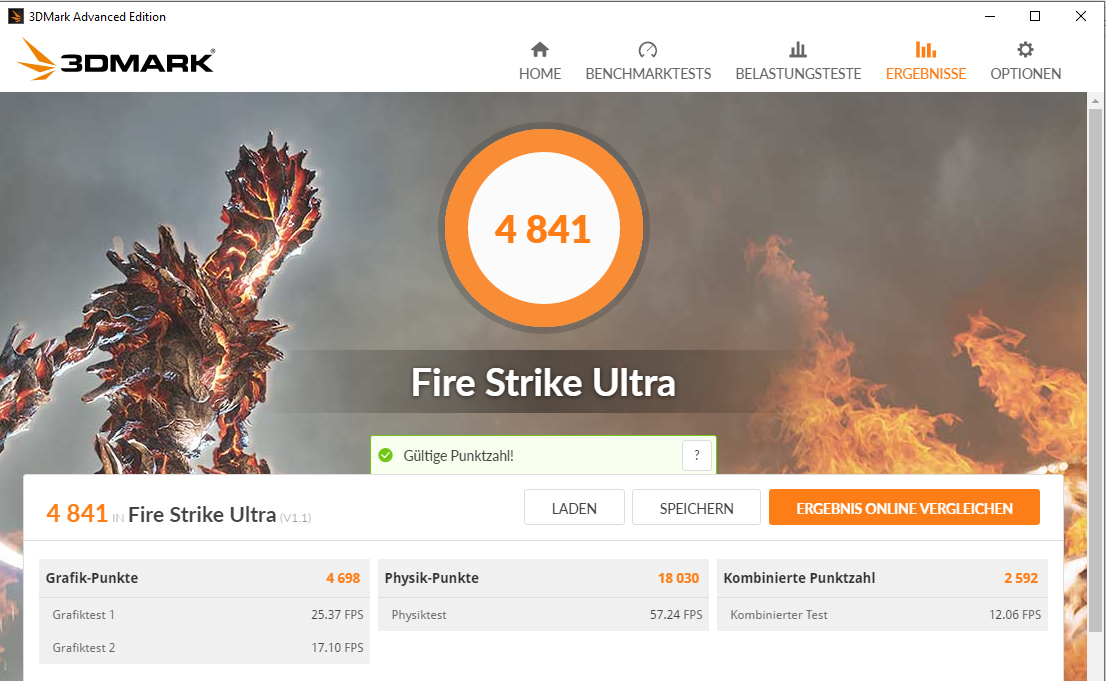
| 3DMark Fire Strike Score | 17529 punten | |
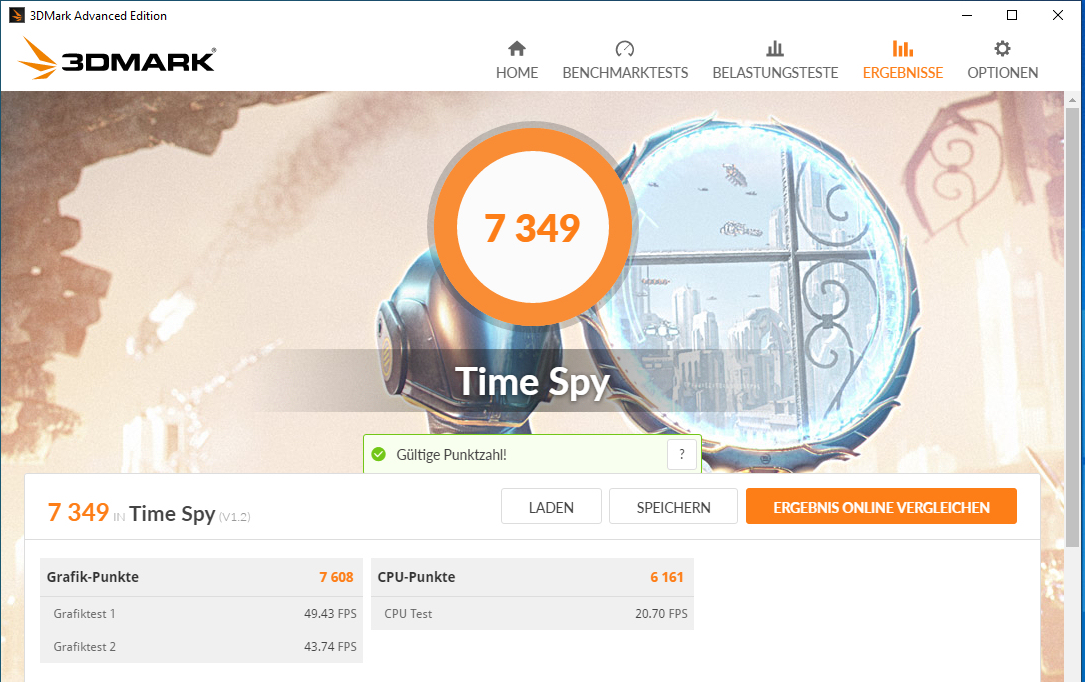
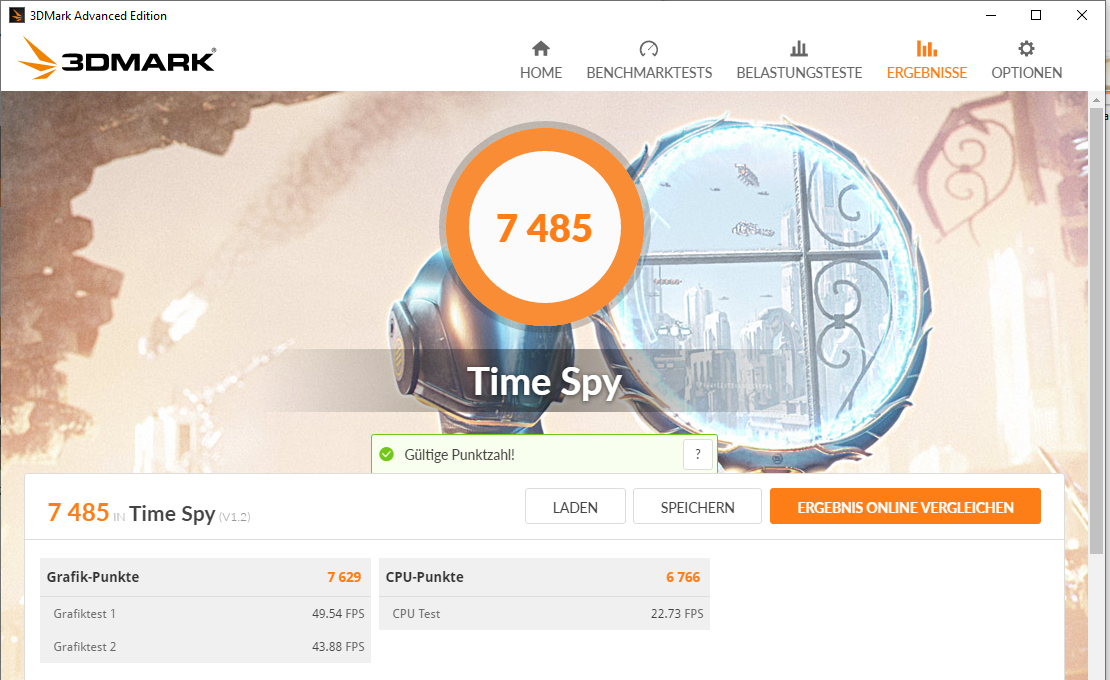
| 3DMark Time Spy Score | 7349 punten | |
Help | ||
| BioShock Infinite - 1920x1080 Ultra Preset, DX11 (DDOF) | |
| Gemiddeld NVIDIA GeForce RTX 2070 Mobile (136.9 - 187.8, n=9) | |
| Lenovo Legion Y740-17IRHg-81UJ001VGE | |
| MSI GL75 10SFR | |
| MSI GP75 Leopard 9SD | |
| Acer Nitro 5 AN517-52-77DS | |
| Shadow of the Tomb Raider - 1920x1080 Highest Preset AA:T | |
| Gemiddelde van klas Gaming (96 - 116, n=2, laatste 2 jaar) | |
| MSI GL75 10SFR | |
| Gemiddeld NVIDIA GeForce RTX 2070 Mobile (74.2 - 97, n=11) | |
| MSI GL75 9SEK-056US | |
| Asus TUF A17 FA706IU-AS76 | |
| Acer Nitro 5 AN517-52-77DS | |
| MSI Bravo 17 A4DDR | |
| Total War: Three Kingdoms - 1920x1080 Ultra (incl textures) | |
| MSI GL75 10SFR | |
| Gemiddeld NVIDIA GeForce RTX 2070 Mobile (n=1) | |
| Acer Nitro 5 AN517-52-77DS | |
| Red Dead Redemption 2 - 1920x1080 Maximum Settings | |
| MSI GL75 10SFR | |
| Gemiddeld NVIDIA GeForce RTX 2070 Mobile (42.4 - 43, n=3) | |
| Acer Nitro 5 AN517-52-77DS | |
| Doom Eternal - 1920x1080 Ultra Preset | |
| Gemiddeld NVIDIA GeForce RTX 2070 Mobile (145.1 - 157, n=3) | |
| MSI GL75 10SFR | |
| Acer Nitro 5 AN517-52-77DS | |
| MSI Bravo 17 A4DDR | |
| lage | gem. | hoge | ultra | |
|---|---|---|---|---|
| BioShock Infinite (2013) | 332.8 | 294.5 | 276.3 | 163.7 |
| The Witcher 3 (2015) | 286.3 | 226.7 | 147.1 | 79.9 |
| Dota 2 Reborn (2015) | 147.2 | 129.4 | 121.8 | 115 |
| X-Plane 11.11 (2018) | 107 | 92.3 | 79.6 | |
| Shadow of the Tomb Raider (2018) | 118 | 104 | 100 | 93 |
| Total War: Three Kingdoms (2019) | 232.7 | 129.9 | 88.5 | 63.1 |
| Red Dead Redemption 2 (2019) | 127.9 | 97.5 | 66.4 | 43 |
| Hunt Showdown (2020) | 184.2 | 124 | 101.7 | |
| Doom Eternal (2020) | 217.6 | 162 | 148.9 | 145.1 |
| Gears Tactics (2020) | 226.5 | 169.9 | 115.2 | 90.9 |
| F1 2020 (2020) | 230 | 177 | 148 | 115 |
| Death Stranding (2020) | 149.3 | 126 | 114.6 | 112 |
Geluidsniveau
| Onbelast |
| 32.2 / 32.2 / 32.2 dB (A) |
| Belasting |
| 52.8 / 53.2 dB (A) |
 | ||
30 dB stil 40 dB(A) hoorbaar 50 dB(A) luid |
||
min: | ||
| MSI GL75 10SFR i7-10750H, GeForce RTX 2070 Mobile | Acer Nitro 5 AN517-52-77DS i7-10750H, GeForce RTX 2060 Mobile | Schenker XMG Neo 17 XNE17M19 i7-9750H, GeForce RTX 2060 Mobile | Lenovo Legion Y740-17IRHg-81UJ001VGE i7-9750H, GeForce RTX 2080 Max-Q | MSI GL75 9SEK-056US i7-9750H, GeForce RTX 2060 Mobile | MSI GP75 Leopard 9SD i7-9750H, GeForce GTX 1660 Ti Mobile | Gemiddeld NVIDIA GeForce RTX 2070 Mobile | Gemiddelde van klas Gaming | |
|---|---|---|---|---|---|---|---|---|
| Noise | 10% | 5% | 12% | 6% | -1% | 2% | 13% | |
| uit / omgeving * (dB) | 30.1 | 30.2 -0% | 31 -3% | 30.3 -1% | 28.1 7% | 29 4% | 28.8 ? 4% | 24.1 ? 20% |
| Idle Minimum * (dB) | 32.2 | 30.2 6% | 31 4% | 30.3 6% | 30.9 4% | 29 10% | 30.4 ? 6% | 25.9 ? 20% |
| Idle Average * (dB) | 32.2 | 30.2 6% | 33 -2% | 30.3 6% | 30.9 4% | 34 -6% | 31.7 ? 2% | 27.4 ? 15% |
| Idle Maximum * (dB) | 32.2 | 30.2 6% | 35 -9% | 30.5 5% | 31 4% | 37 -15% | 34.9 ? -8% | 30 ? 7% |
| Load Average * (dB) | 52.8 | 41.5 21% | 43 19% | 40.8 23% | 39 26% | 53 -0% | 46.8 ? 11% | 42.9 ? 19% |
| Witcher 3 ultra * (dB) | 53.8 | 44.5 17% | 45 16% | 40.5 25% | 53.5 1% | 51 5% | ||
| Load Maximum * (dB) | 53.2 | 44.6 16% | 47 12% | 40.8 23% | 53.5 -1% | 55 -3% | 55.8 ? -5% | 54.1 ? -2% |
* ... kleiner is beter
(±) De maximumtemperatuur aan de bovenzijde bedraagt 44 °C / 111 F, vergeleken met het gemiddelde van 40.4 °C / 105 F, variërend van 21.2 tot 68.8 °C voor de klasse Gaming.
(±) De bodem warmt op tot een maximum van 42.5 °C / 109 F, vergeleken met een gemiddelde van 43.2 °C / 110 F
(+) Bij onbelast gebruik bedraagt de gemiddelde temperatuur voor de bovenzijde 27.4 °C / 81 F, vergeleken met het apparaatgemiddelde van 33.9 °C / 93 F.
(±) Bij het spelen van The Witcher 3 is de gemiddelde temperatuur voor de bovenzijde 36.4 °C / 98 F, vergeleken met het apparaatgemiddelde van 33.9 °C / 93 F.
(+) De handpalmsteunen en het touchpad bereiken maximaal de huidtemperatuur (33.3 °C / 91.9 F) en zijn dus niet heet.
(-) De gemiddelde temperatuur van de handpalmsteun van soortgelijke toestellen bedroeg 28.8 °C / 83.8 F (-4.5 °C / -8.1 F).
| MSI GL75 10SFR i7-10750H, GeForce RTX 2070 Mobile | Acer Nitro 5 AN517-52-77DS i7-10750H, GeForce RTX 2060 Mobile | Schenker XMG Neo 17 XNE17M19 i7-9750H, GeForce RTX 2060 Mobile | Lenovo Legion Y740-17IRHg-81UJ001VGE i7-9750H, GeForce RTX 2080 Max-Q | MSI GL75 9SEK-056US i7-9750H, GeForce RTX 2060 Mobile | MSI GP75 Leopard 9SD i7-9750H, GeForce GTX 1660 Ti Mobile | Gemiddeld NVIDIA GeForce RTX 2070 Mobile | Gemiddelde van klas Gaming | |
|---|---|---|---|---|---|---|---|---|
| Heat | -7% | -4% | -4% | -27% | -3% | -14% | -10% | |
| Maximum Upper Side * (°C) | 44 | 50.6 -15% | 48 -9% | 40.7 7% | 49.4 -12% | 45 -2% | 47.1 ? -7% | 45.2 ? -3% |
| Maximum Bottom * (°C) | 42.5 | 53.8 -27% | 54 -27% | 42.2 1% | 50.6 -19% | 42 1% | 51 ? -20% | 48.2 ? -13% |
| Idle Upper Side * (°C) | 29.1 | 26.6 9% | 26 11% | 31.9 -10% | 39 -34% | 30 -3% | 31.8 ? -9% | 31 ? -7% |
| Idle Bottom * (°C) | 29.5 | 27.8 6% | 27 8% | 33.9 -15% | 42 -42% | 32 -8% | 34.8 ? -18% | 34.4 ? -17% |
* ... kleiner is beter
MSI GL75 10SFR audioanalyse
(±) | luidspreker luidheid is gemiddeld maar goed (75.6 dB)
Bas 100 - 315 Hz
(-) | bijna geen lage tonen - gemiddeld 20.3% lager dan de mediaan
(±) | lineariteit van de lage tonen is gemiddeld (13.1% delta ten opzichte van de vorige frequentie)
Midden 400 - 2000 Hz
(+) | evenwichtige middens - slechts 1.9% verwijderd van de mediaan
(±) | lineariteit van de middentonen is gemiddeld (7% delta ten opzichte van de vorige frequentie)
Hoog 2 - 16 kHz
(+) | evenwichtige hoogtepunten - slechts 2.3% verwijderd van de mediaan
(+) | de hoge tonen zijn lineair (3.7% delta naar de vorige frequentie)
Algemeen 100 - 16.000 Hz
(+) | het totale geluid is lineair (13.9% verschil met de mediaan)
Vergeleken met dezelfde klasse
» 22% van alle geteste apparaten in deze klasse waren beter, 7% vergelijkbaar, 71% slechter
» De beste had een delta van 6%, het gemiddelde was 18%, de slechtste was 132%
Vergeleken met alle geteste toestellen
» 16% van alle geteste apparaten waren beter, 4% gelijk, 80% slechter
» De beste had een delta van 4%, het gemiddelde was 23%, de slechtste was 134%
| Uit / Standby | |
| Inactief | |
| Belasting |
|
Key:
min: | |
| MSI GL75 10SFR i7-10750H, GeForce RTX 2070 Mobile | Acer Nitro 5 AN517-52-77DS i7-10750H, GeForce RTX 2060 Mobile | Schenker XMG Neo 17 XNE17M19 i7-9750H, GeForce RTX 2060 Mobile | Lenovo Legion Y740-17IRHg-81UJ001VGE i7-9750H, GeForce RTX 2080 Max-Q | MSI GL75 9SEK-056US i7-9750H, GeForce RTX 2060 Mobile | MSI GP75 Leopard 9SD i7-9750H, GeForce GTX 1660 Ti Mobile | Gemiddeld NVIDIA GeForce RTX 2070 Mobile | Gemiddelde van klas Gaming | |
|---|---|---|---|---|---|---|---|---|
| Power Consumption | 34% | 14% | -18% | 15% | 11% | -42% | -10% | |
| Idle Minimum * (Watt) | 12 | 5.4 55% | 11 8% | 15.7 -31% | 10.7 11% | 10 17% | 21.4 ? -78% | 13 ? -8% |
| Idle Average * (Watt) | 16.6 | 9.8 41% | 14 16% | 26.3 -58% | 15.2 8% | 15 10% | 26.3 ? -58% | 18.7 ? -13% |
| Idle Maximum * (Watt) | 18 | 10.9 39% | 20 -11% | 28 -56% | 17.8 1% | 22 -22% | 32.2 ? -79% | 24.3 ? -35% |
| Load Average * (Watt) | 130 | 104 20% | 100 23% | 136 -5% | 88.2 32% | 92 29% | 114.8 ? 12% | 108.2 ? 17% |
| Witcher 3 ultra * (Watt) | 203 | 134.3 34% | 151 26% | 160 21% | 147.8 27% | 153 25% | ||
| Load Maximum * (Watt) | 224 | 193 14% | 174 22% | 177 21% | 206.5 8% | 216 4% | 238 ? -6% | 254 ? -13% |
* ... kleiner is beter
| MSI GL75 10SFR i7-10750H, GeForce RTX 2070 Mobile, 51 Wh | Acer Nitro 5 AN517-52-77DS i7-10750H, GeForce RTX 2060 Mobile, 57.48 Wh | Schenker XMG Neo 17 XNE17M19 i7-9750H, GeForce RTX 2060 Mobile, 46 Wh | Lenovo Legion Y740-17IRHg-81UJ001VGE i7-9750H, GeForce RTX 2080 Max-Q, 76 Wh | MSI GL75 9SEK-056US i7-9750H, GeForce RTX 2060 Mobile, 51 Wh | MSI GP75 Leopard 9SD i7-9750H, GeForce GTX 1660 Ti Mobile, 51 Wh | Gemiddelde van klas Gaming | |
|---|---|---|---|---|---|---|---|
| Batterijduur | 83% | 17% | -15% | 19% | -23% | 69% | |
| Reader / Idle (h) | 6.4 | 11 72% | 6.7 5% | 3.8 -41% | 7.9 23% | 4.8 -25% | 8.71 ? 36% |
| H.264 (h) | 5.2 | 7.3 40% | 2.8 -46% | 8.9 ? 71% | |||
| WiFi v1.3 (h) | 3.9 | 6.6 69% | 4.7 21% | 3 -23% | 4.2 8% | 3.2 -18% | 7 ? 79% |
| Load (h) | 0.8 | 2 150% | 1 25% | 1.2 50% | 1 25% | 0.6 -25% | 1.51 ? 89% |
Pro
Contra
Voor het volledige, Engelse testrapport, klik hier.
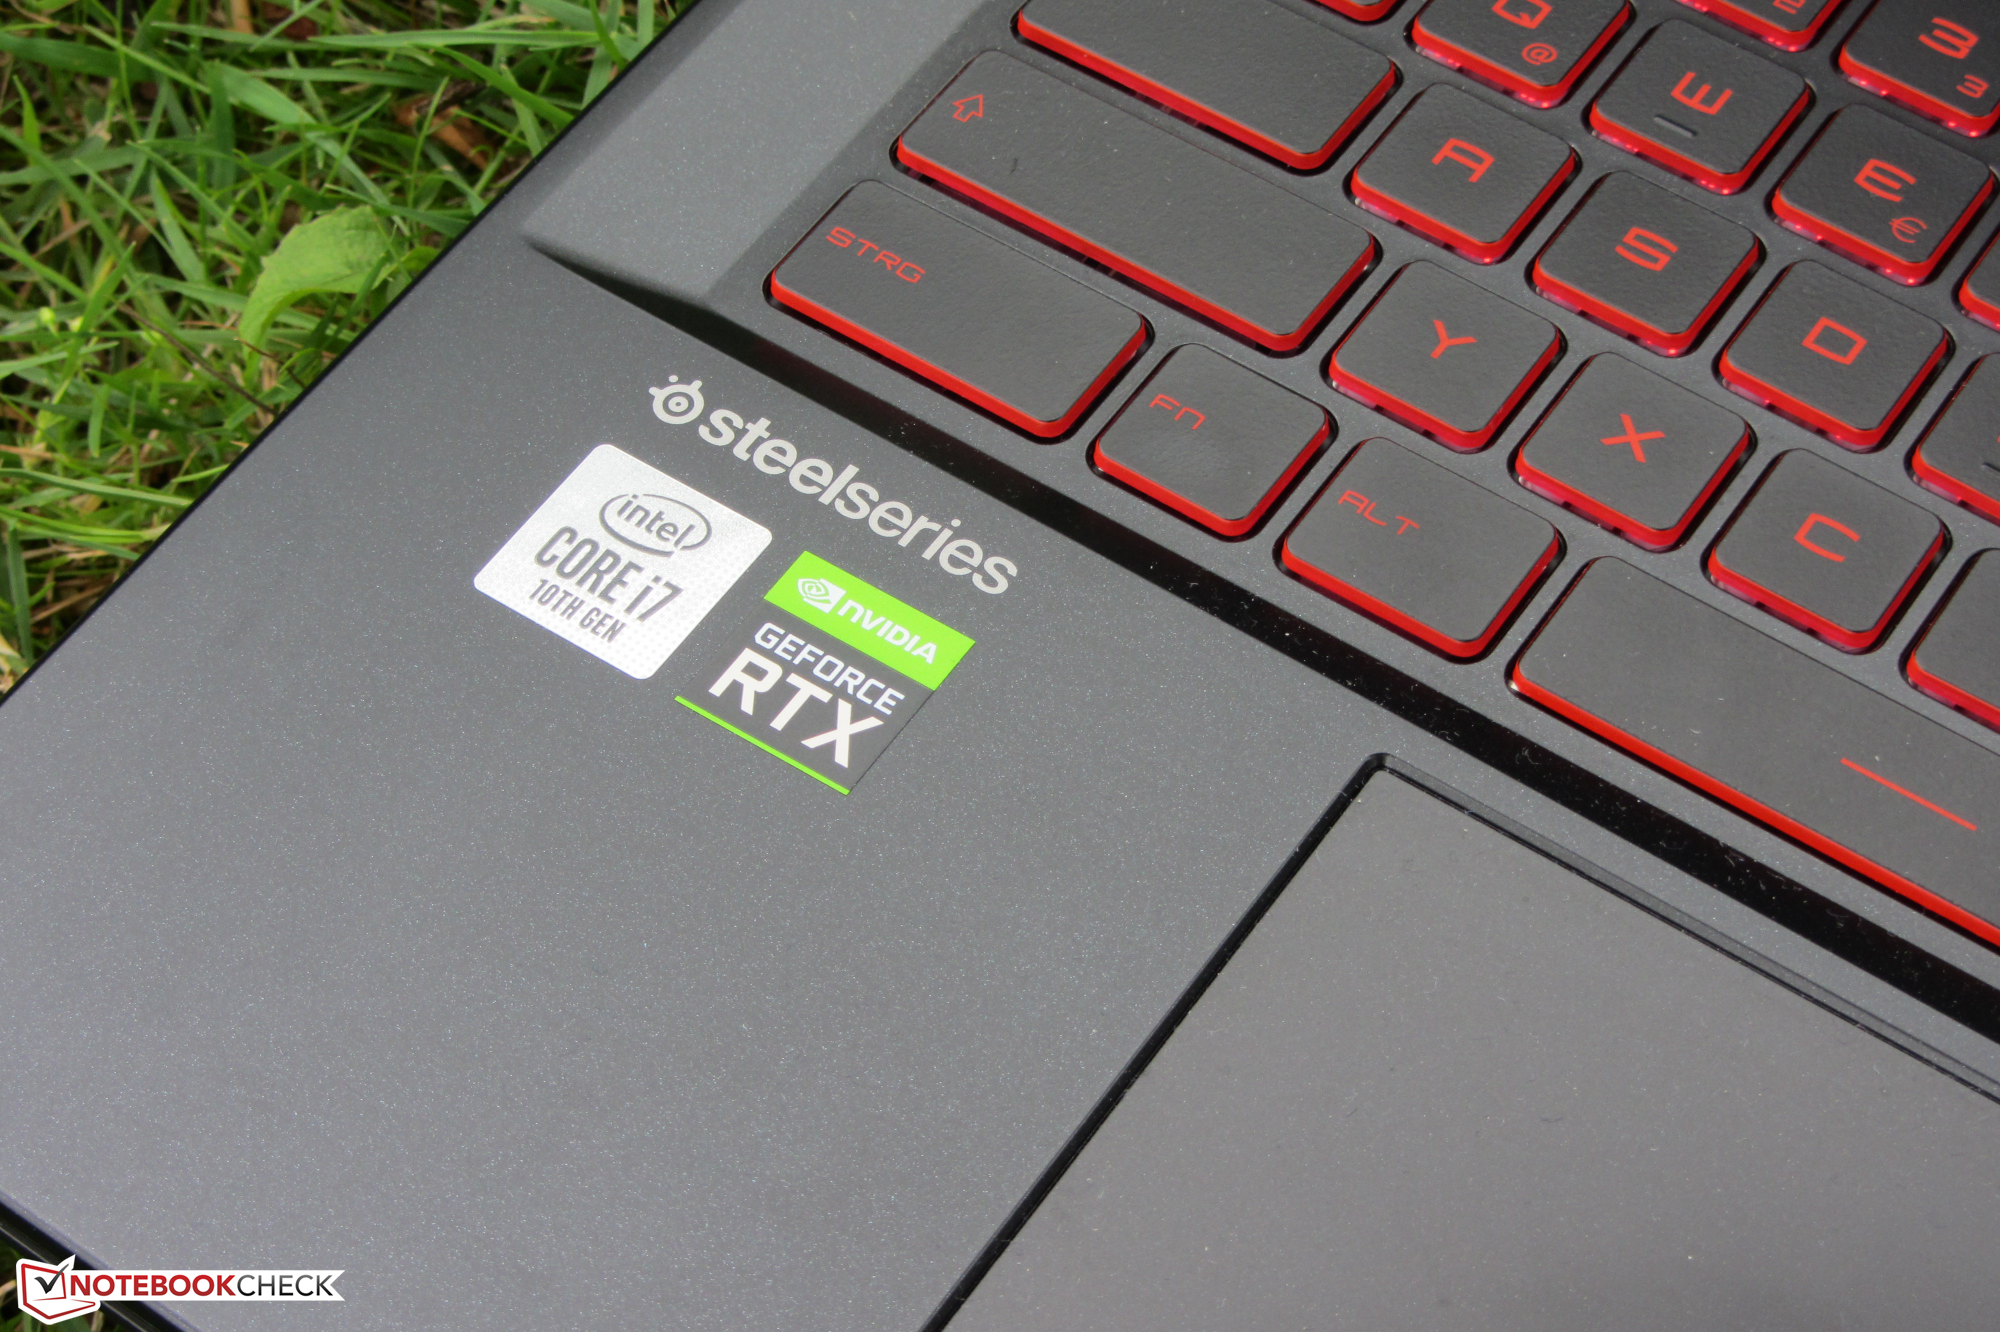
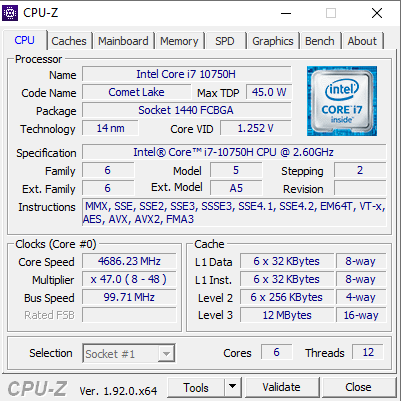
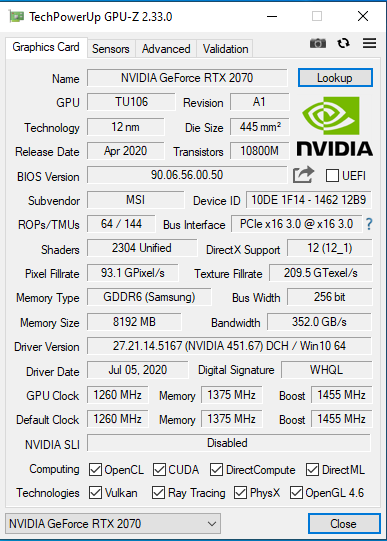
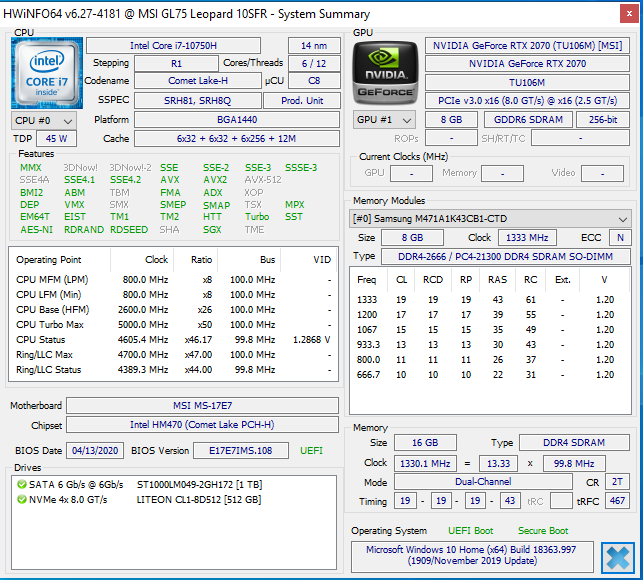
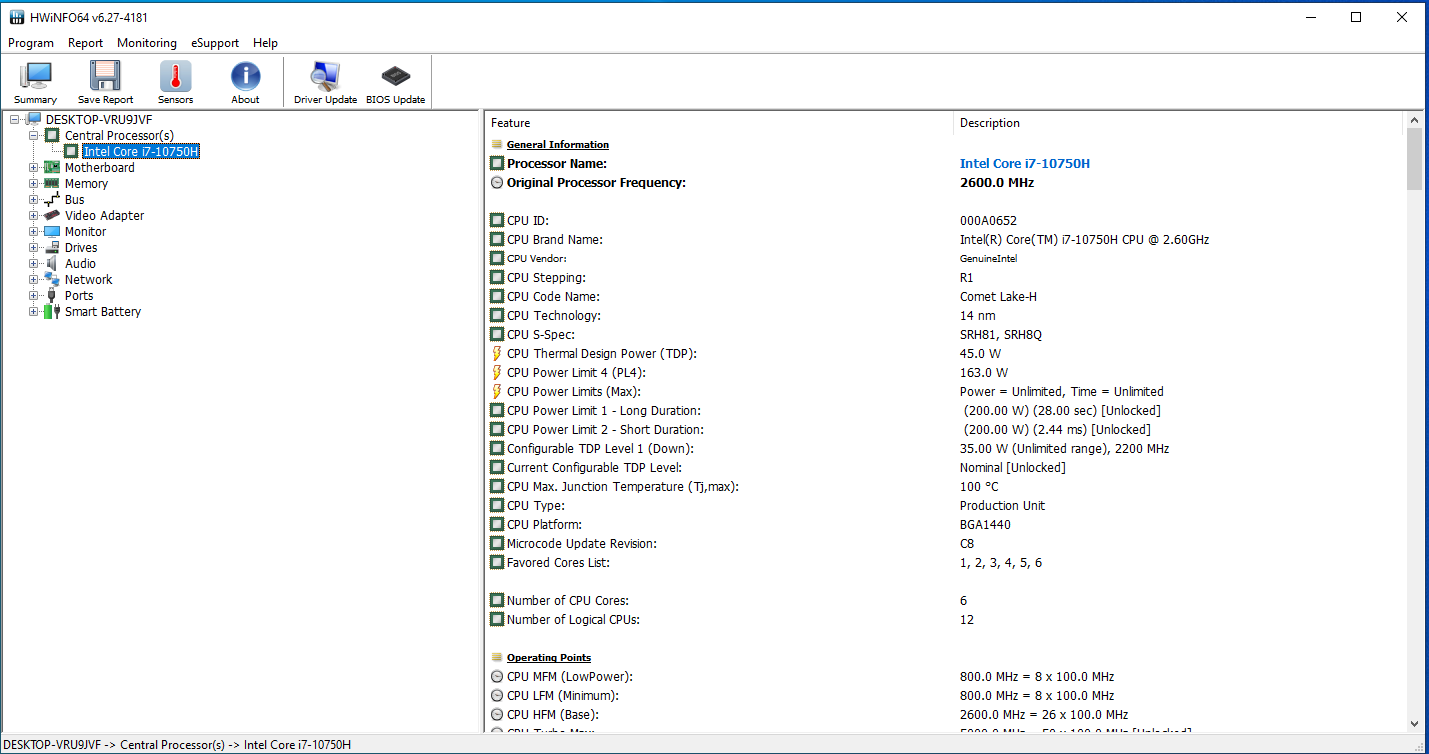
De MSI GL75 doet wat er van hem verwacht wordt. Hij brengt alle moderne spellen vlot op het scherm. Hiervoor hoeven geen compromissen te worden gesloten op het gebied van resolutie en kwaliteitsniveau. De combinatie van een Core i7-10750H hexa-core processor en een GeForce RTX 2070 GPU maakt dit mogelijk.
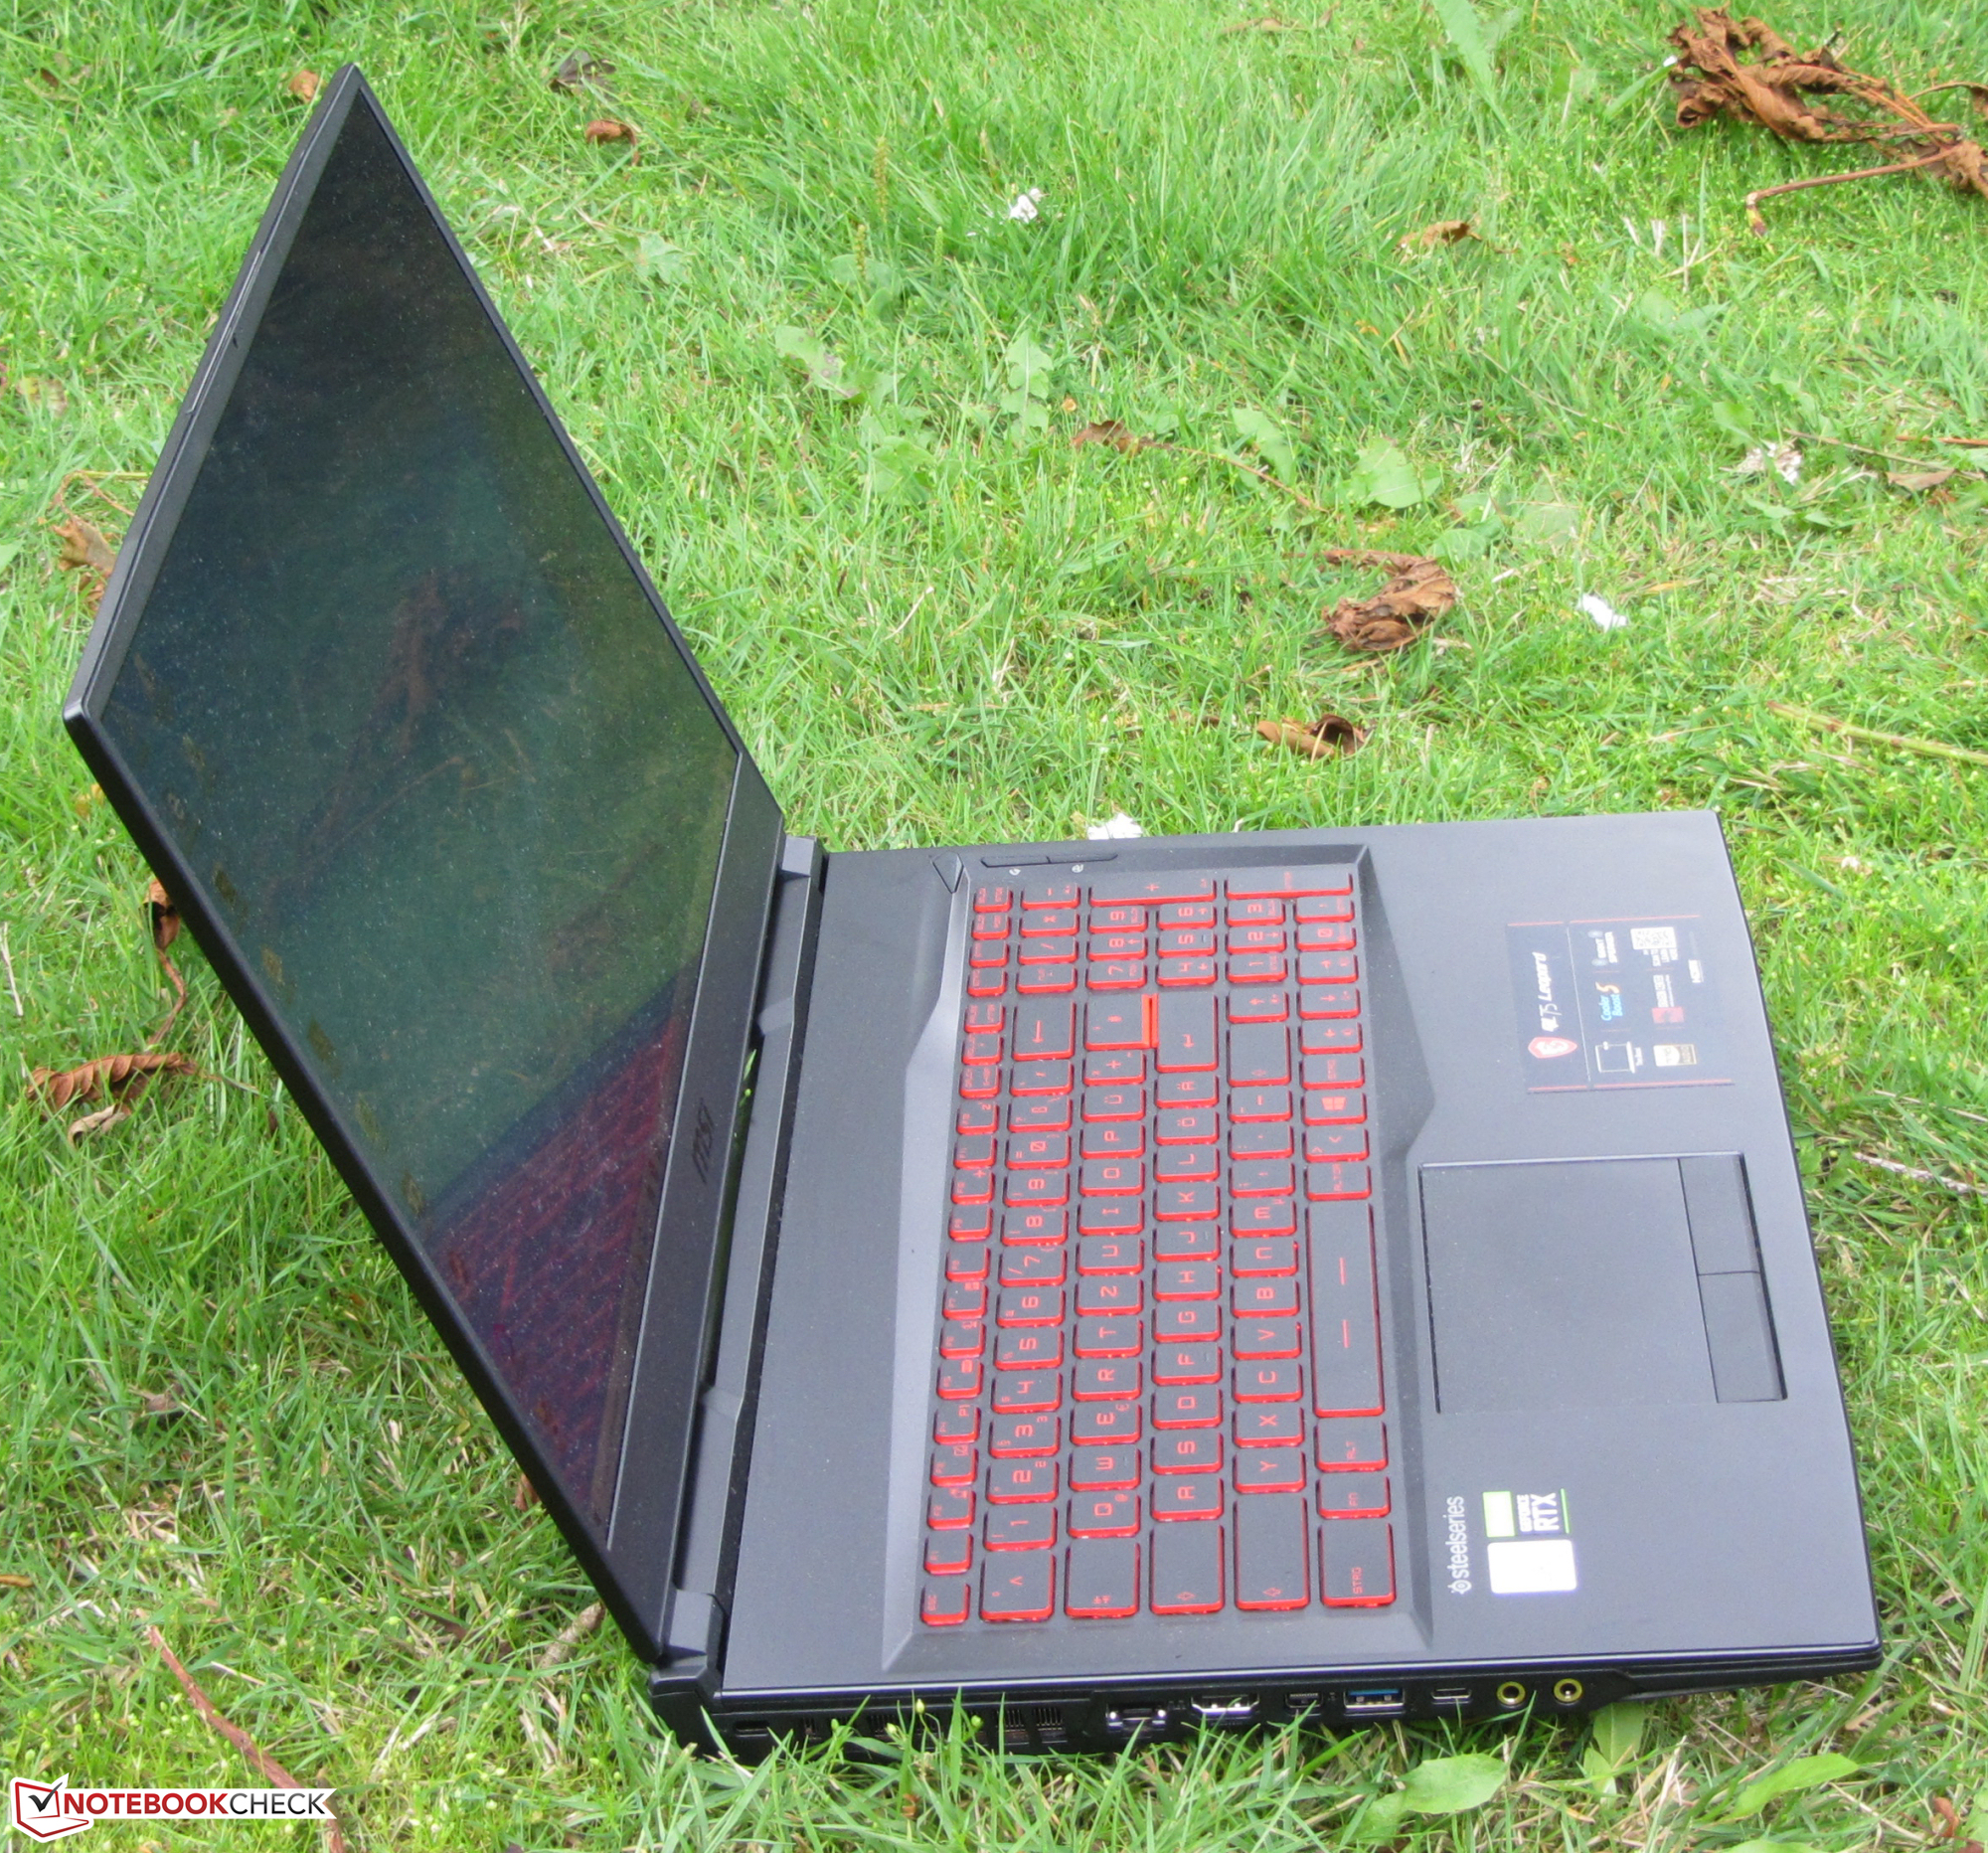
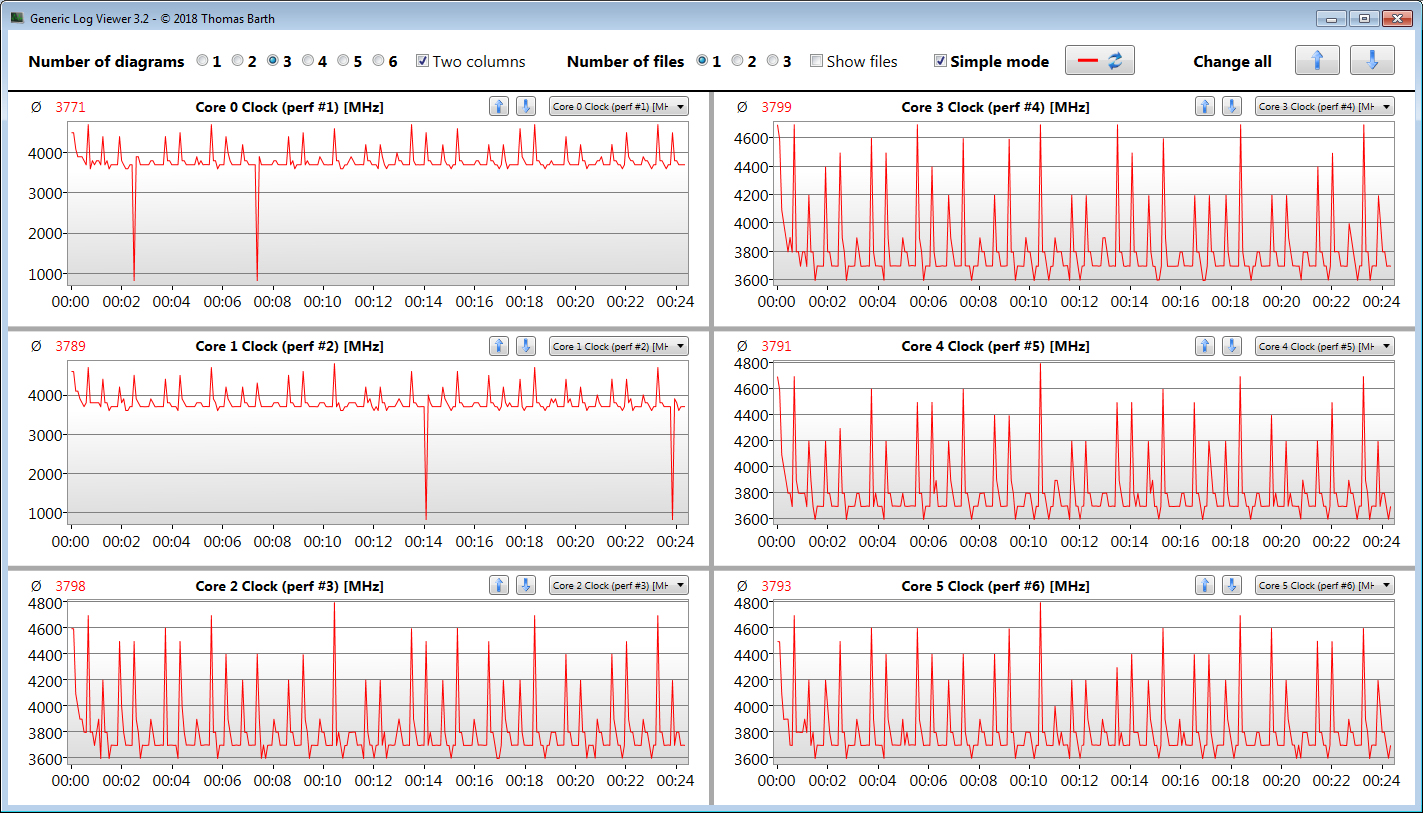
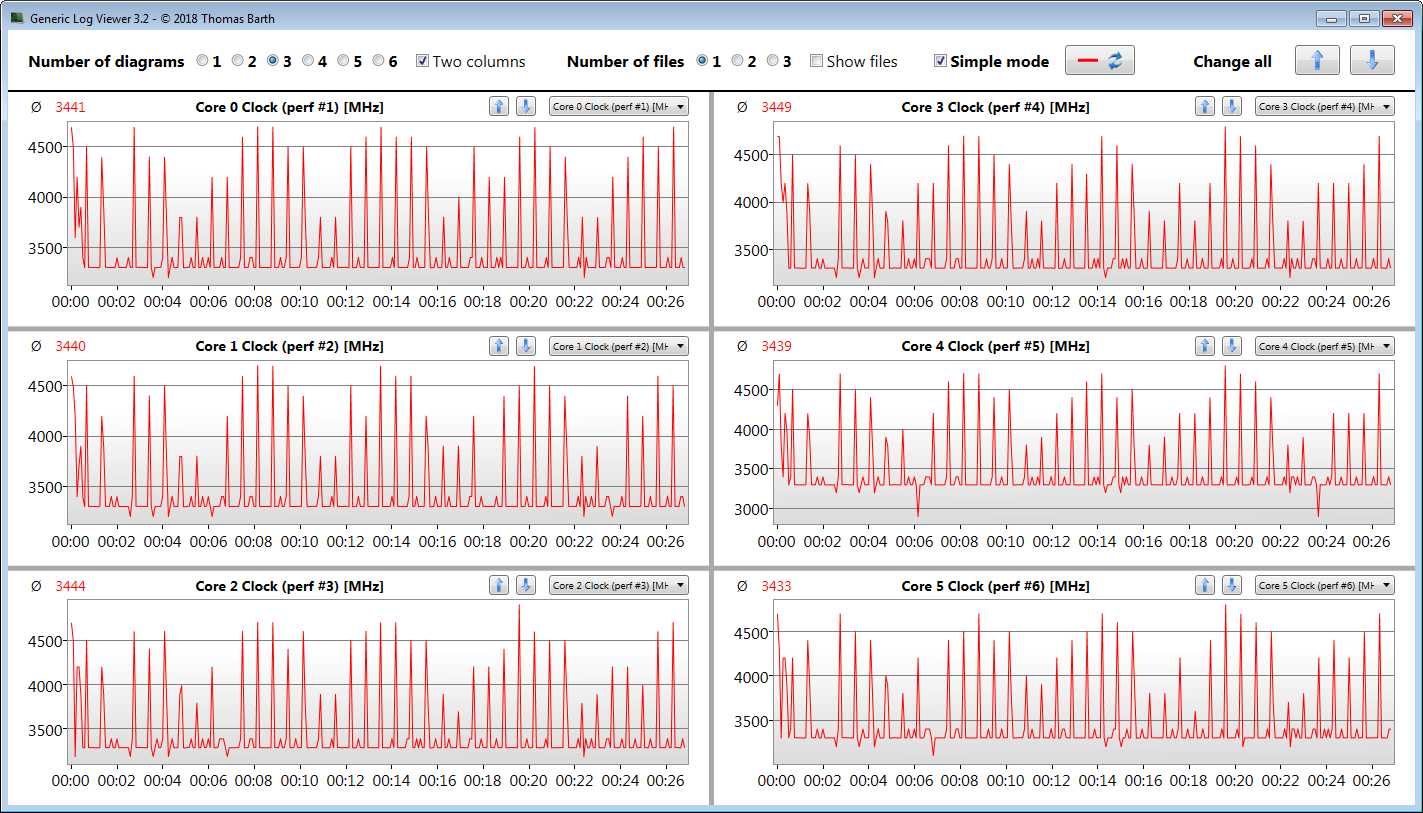
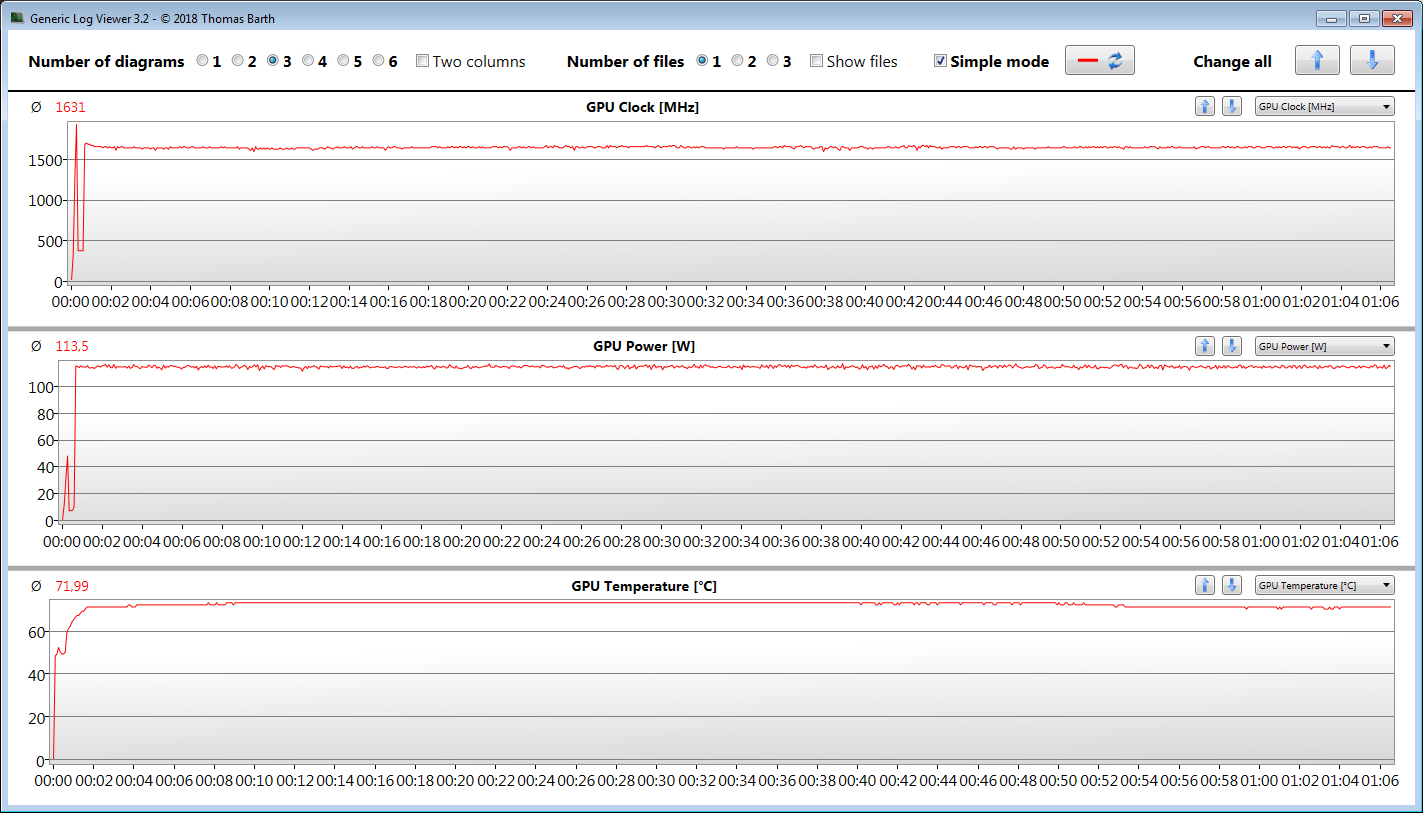
De krachtige hardware moet gekoeld worden. Daarom draaien de twee ventilatoren van de laptop zwaar onder belasting en produceren ze veel lawaai. Positief gevolg: De koffer warmt maar matig op.
MSI levert een goed afgeronde gamelaptop voor een redelijke prijs met de GL75 Leopard 10SFR-221.
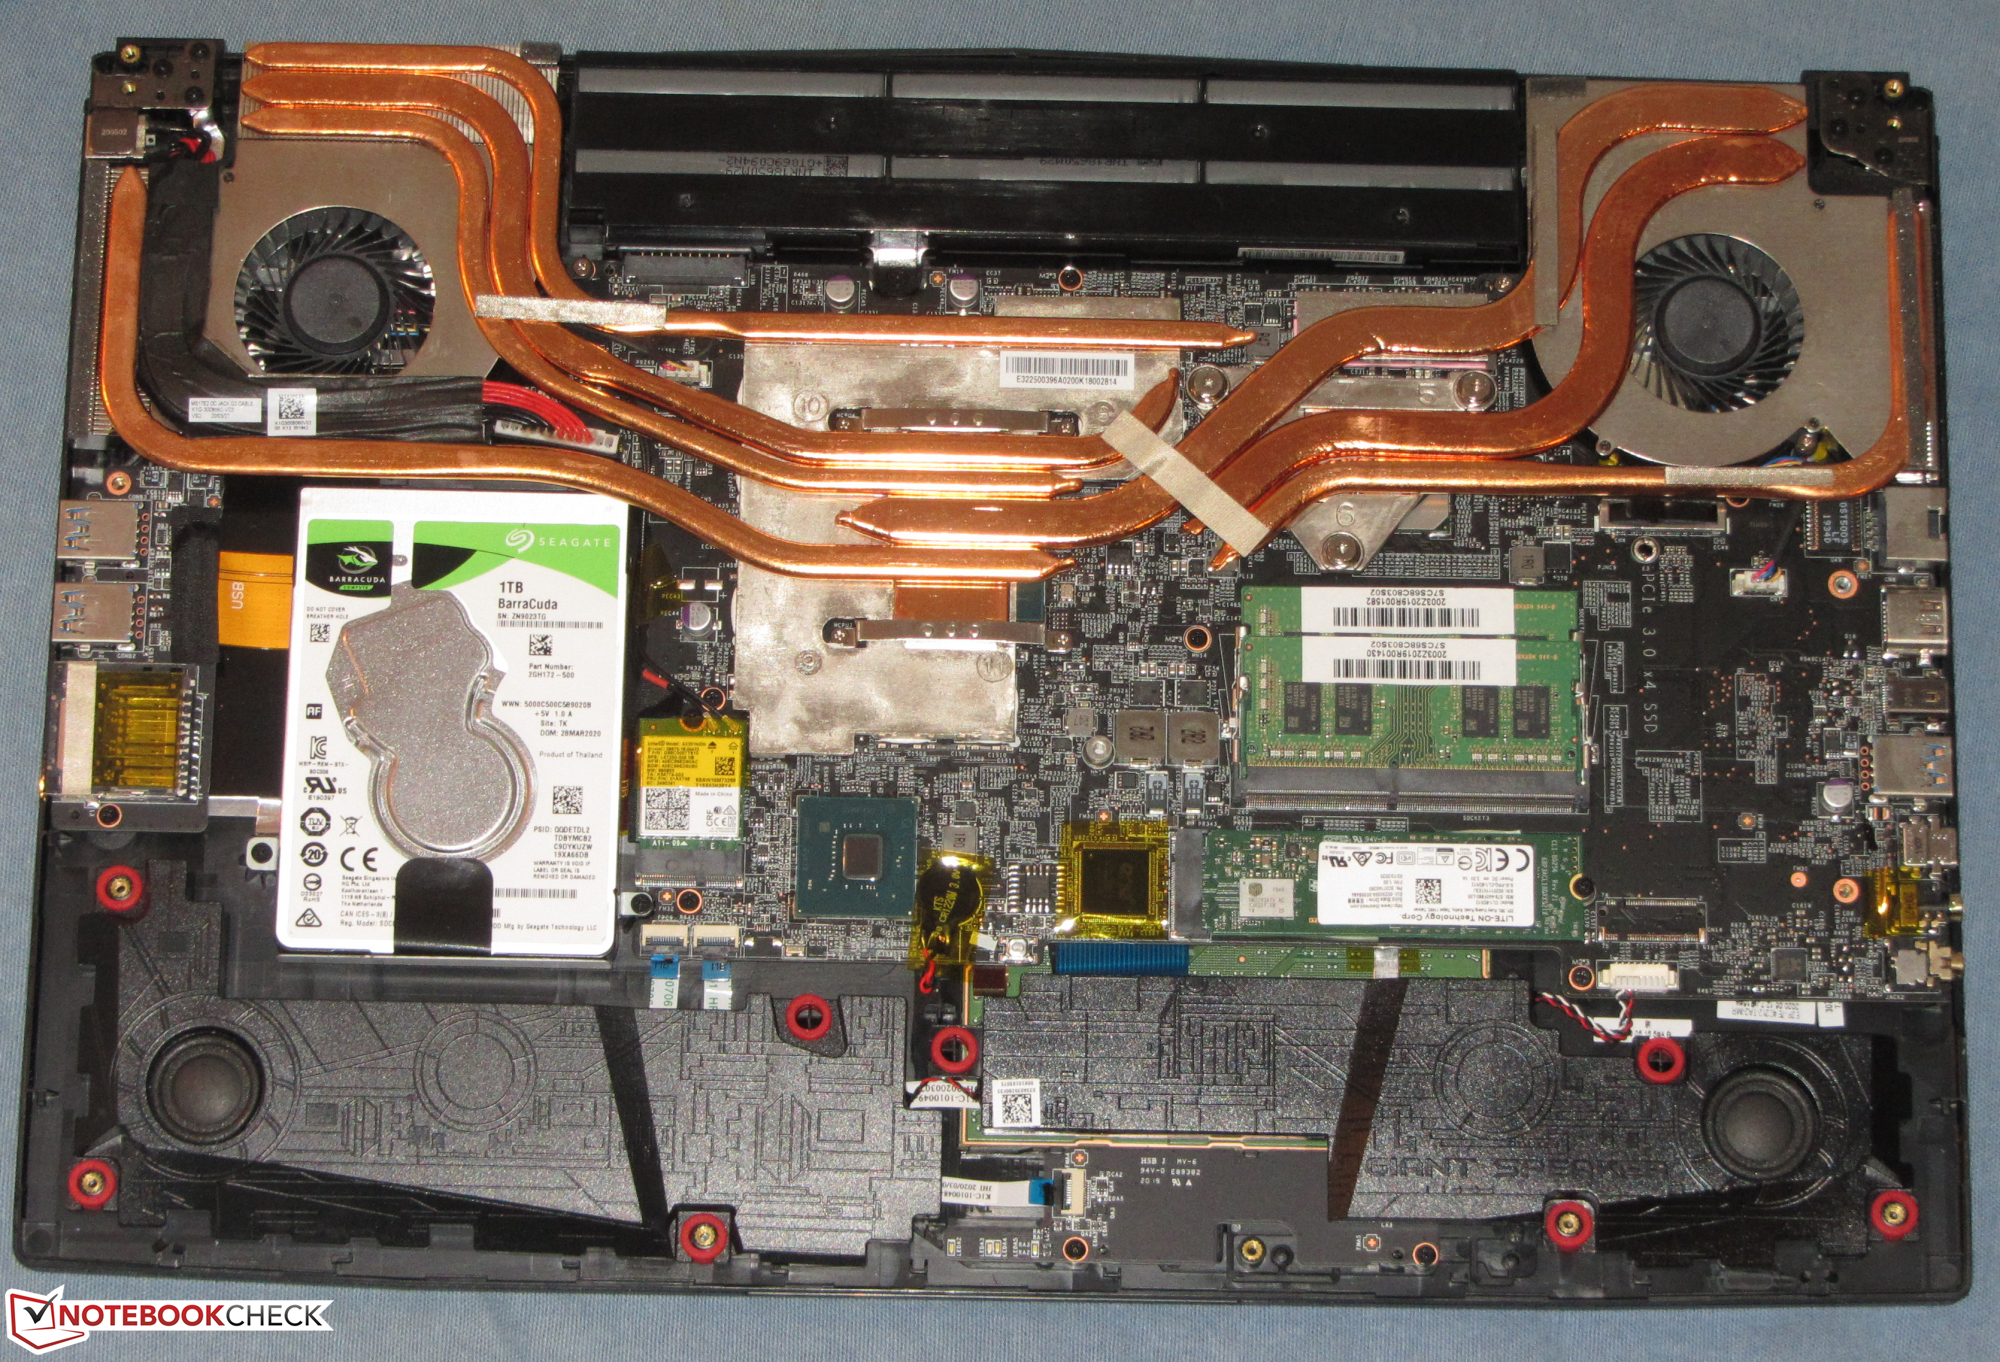
De laptop wordt geleverd met een snelle NVMe SSD die in totaal 512 GB aan opslagruimte biedt. Aangezien een gaminglaptop nooit te veel opslagruimte kan hebben, heeft MSI ook een harde schijf van 1 TB (7.200 rpm) inbegrepen. Beide opslagapparaten kunnen worden vervangen. Hiervoor zou de onderkant van de behuizing moeten worden verwijderd.
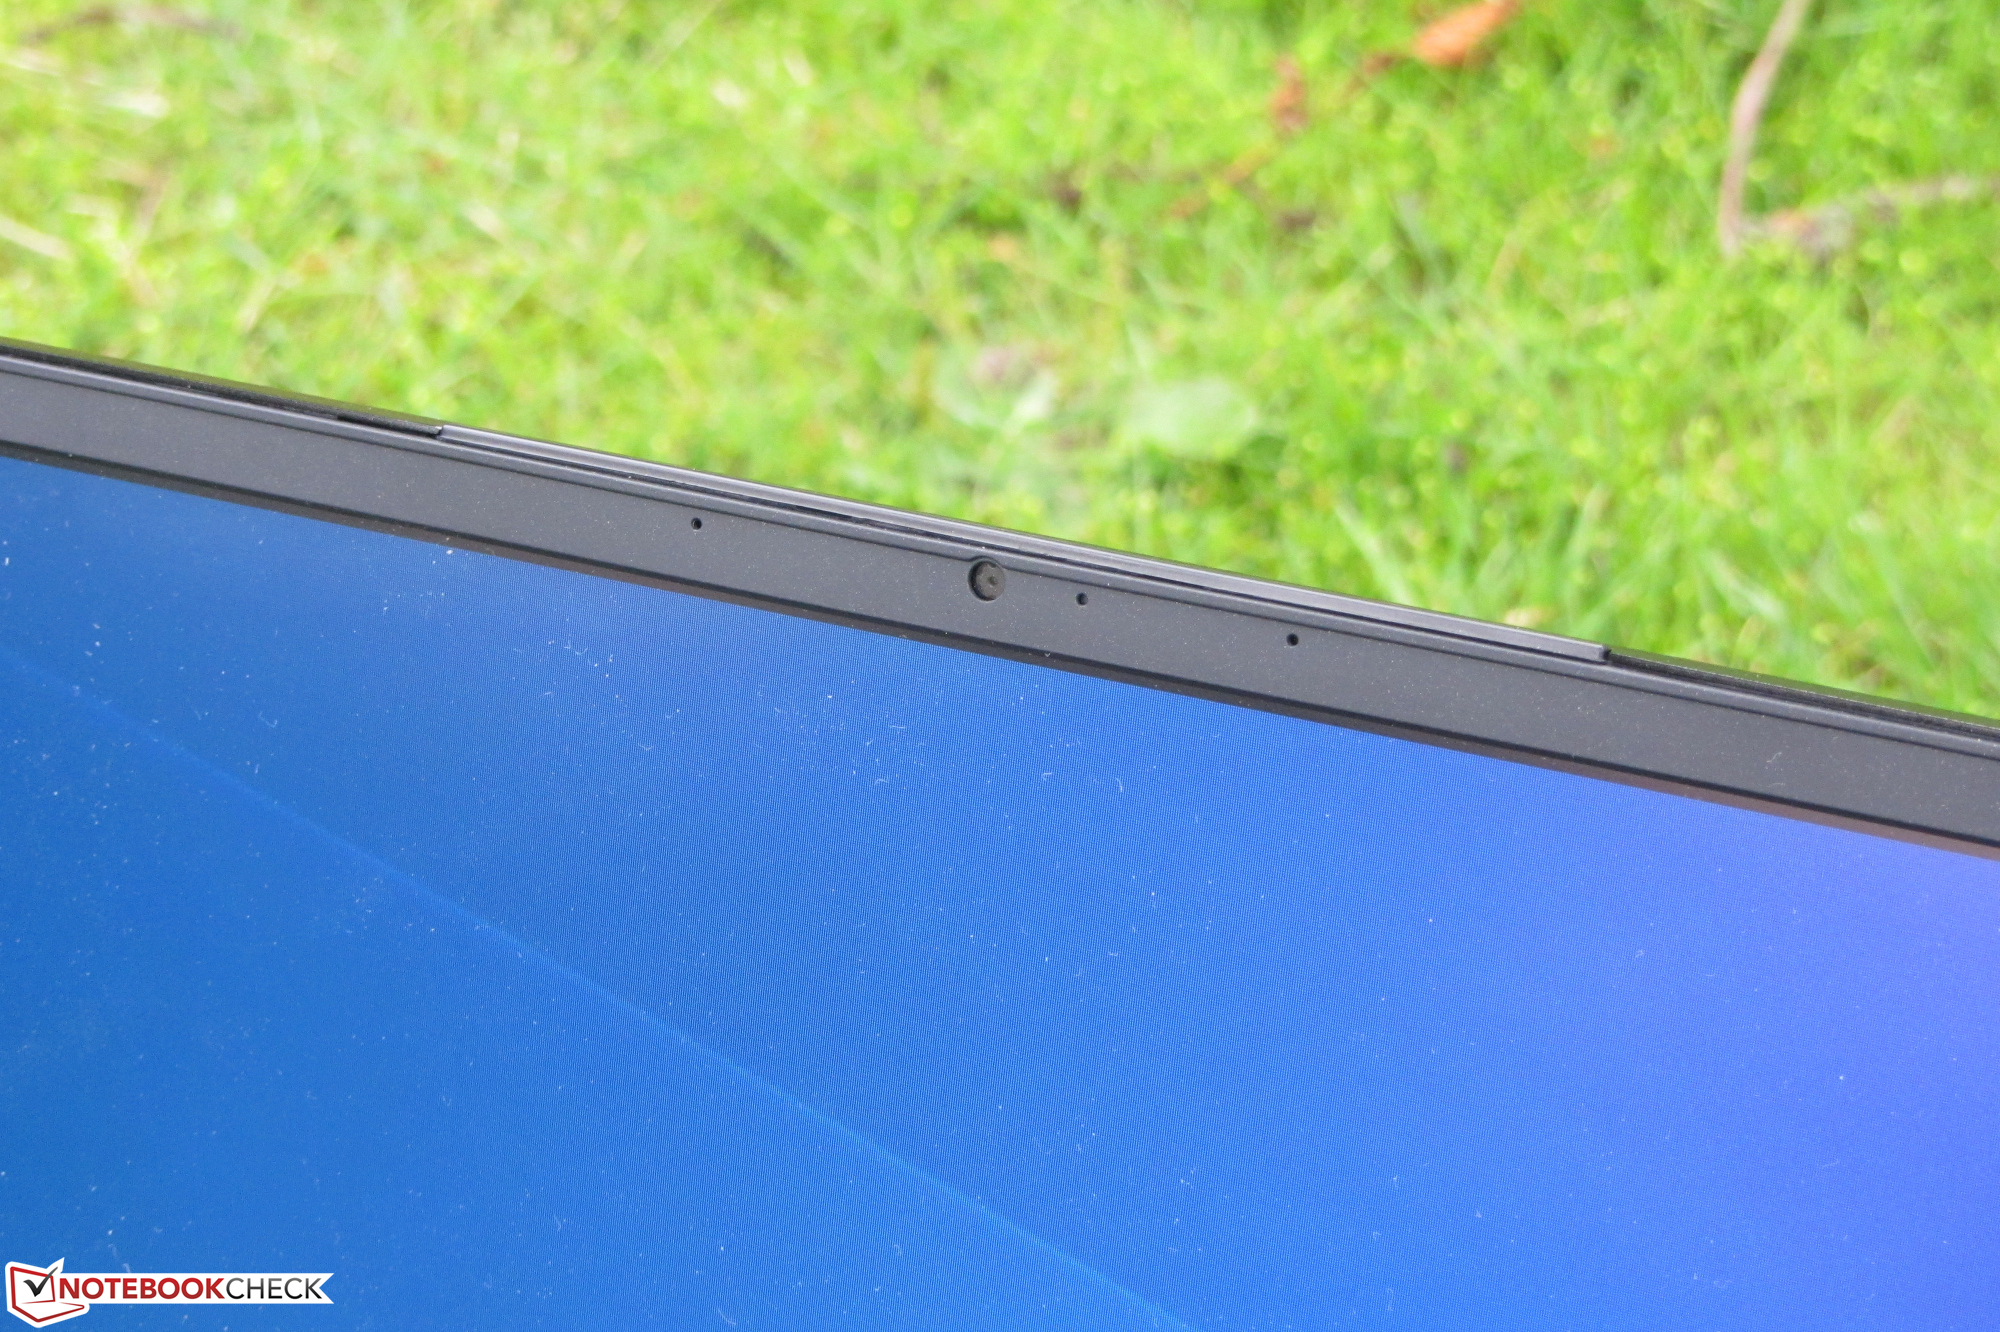
Het matte 144 Hz Full HD IPS-scherm scoort punten met stabiele kijkhoeken, voldoende helderheid, goed contrast, korte reactietijden en een geweldige kleurweergave. De kleur-ruimte dekking is ook aangenaam.
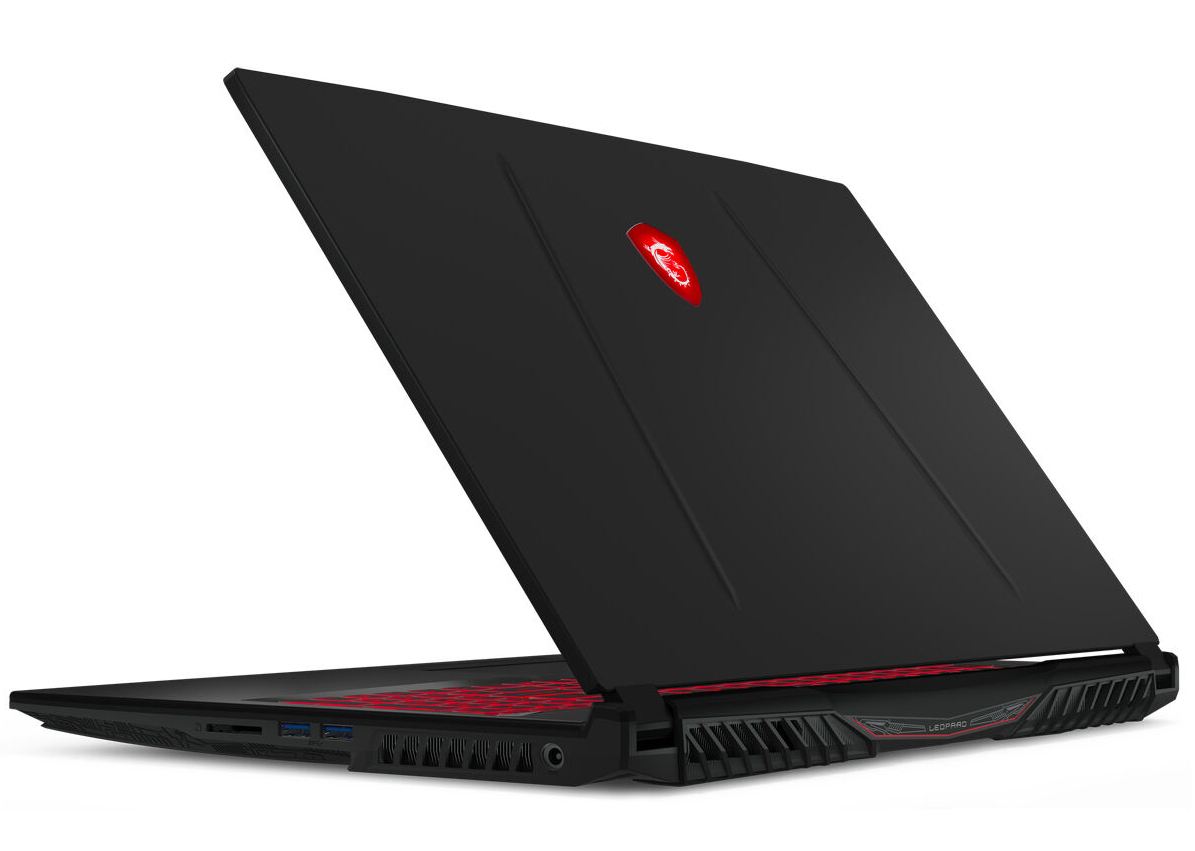
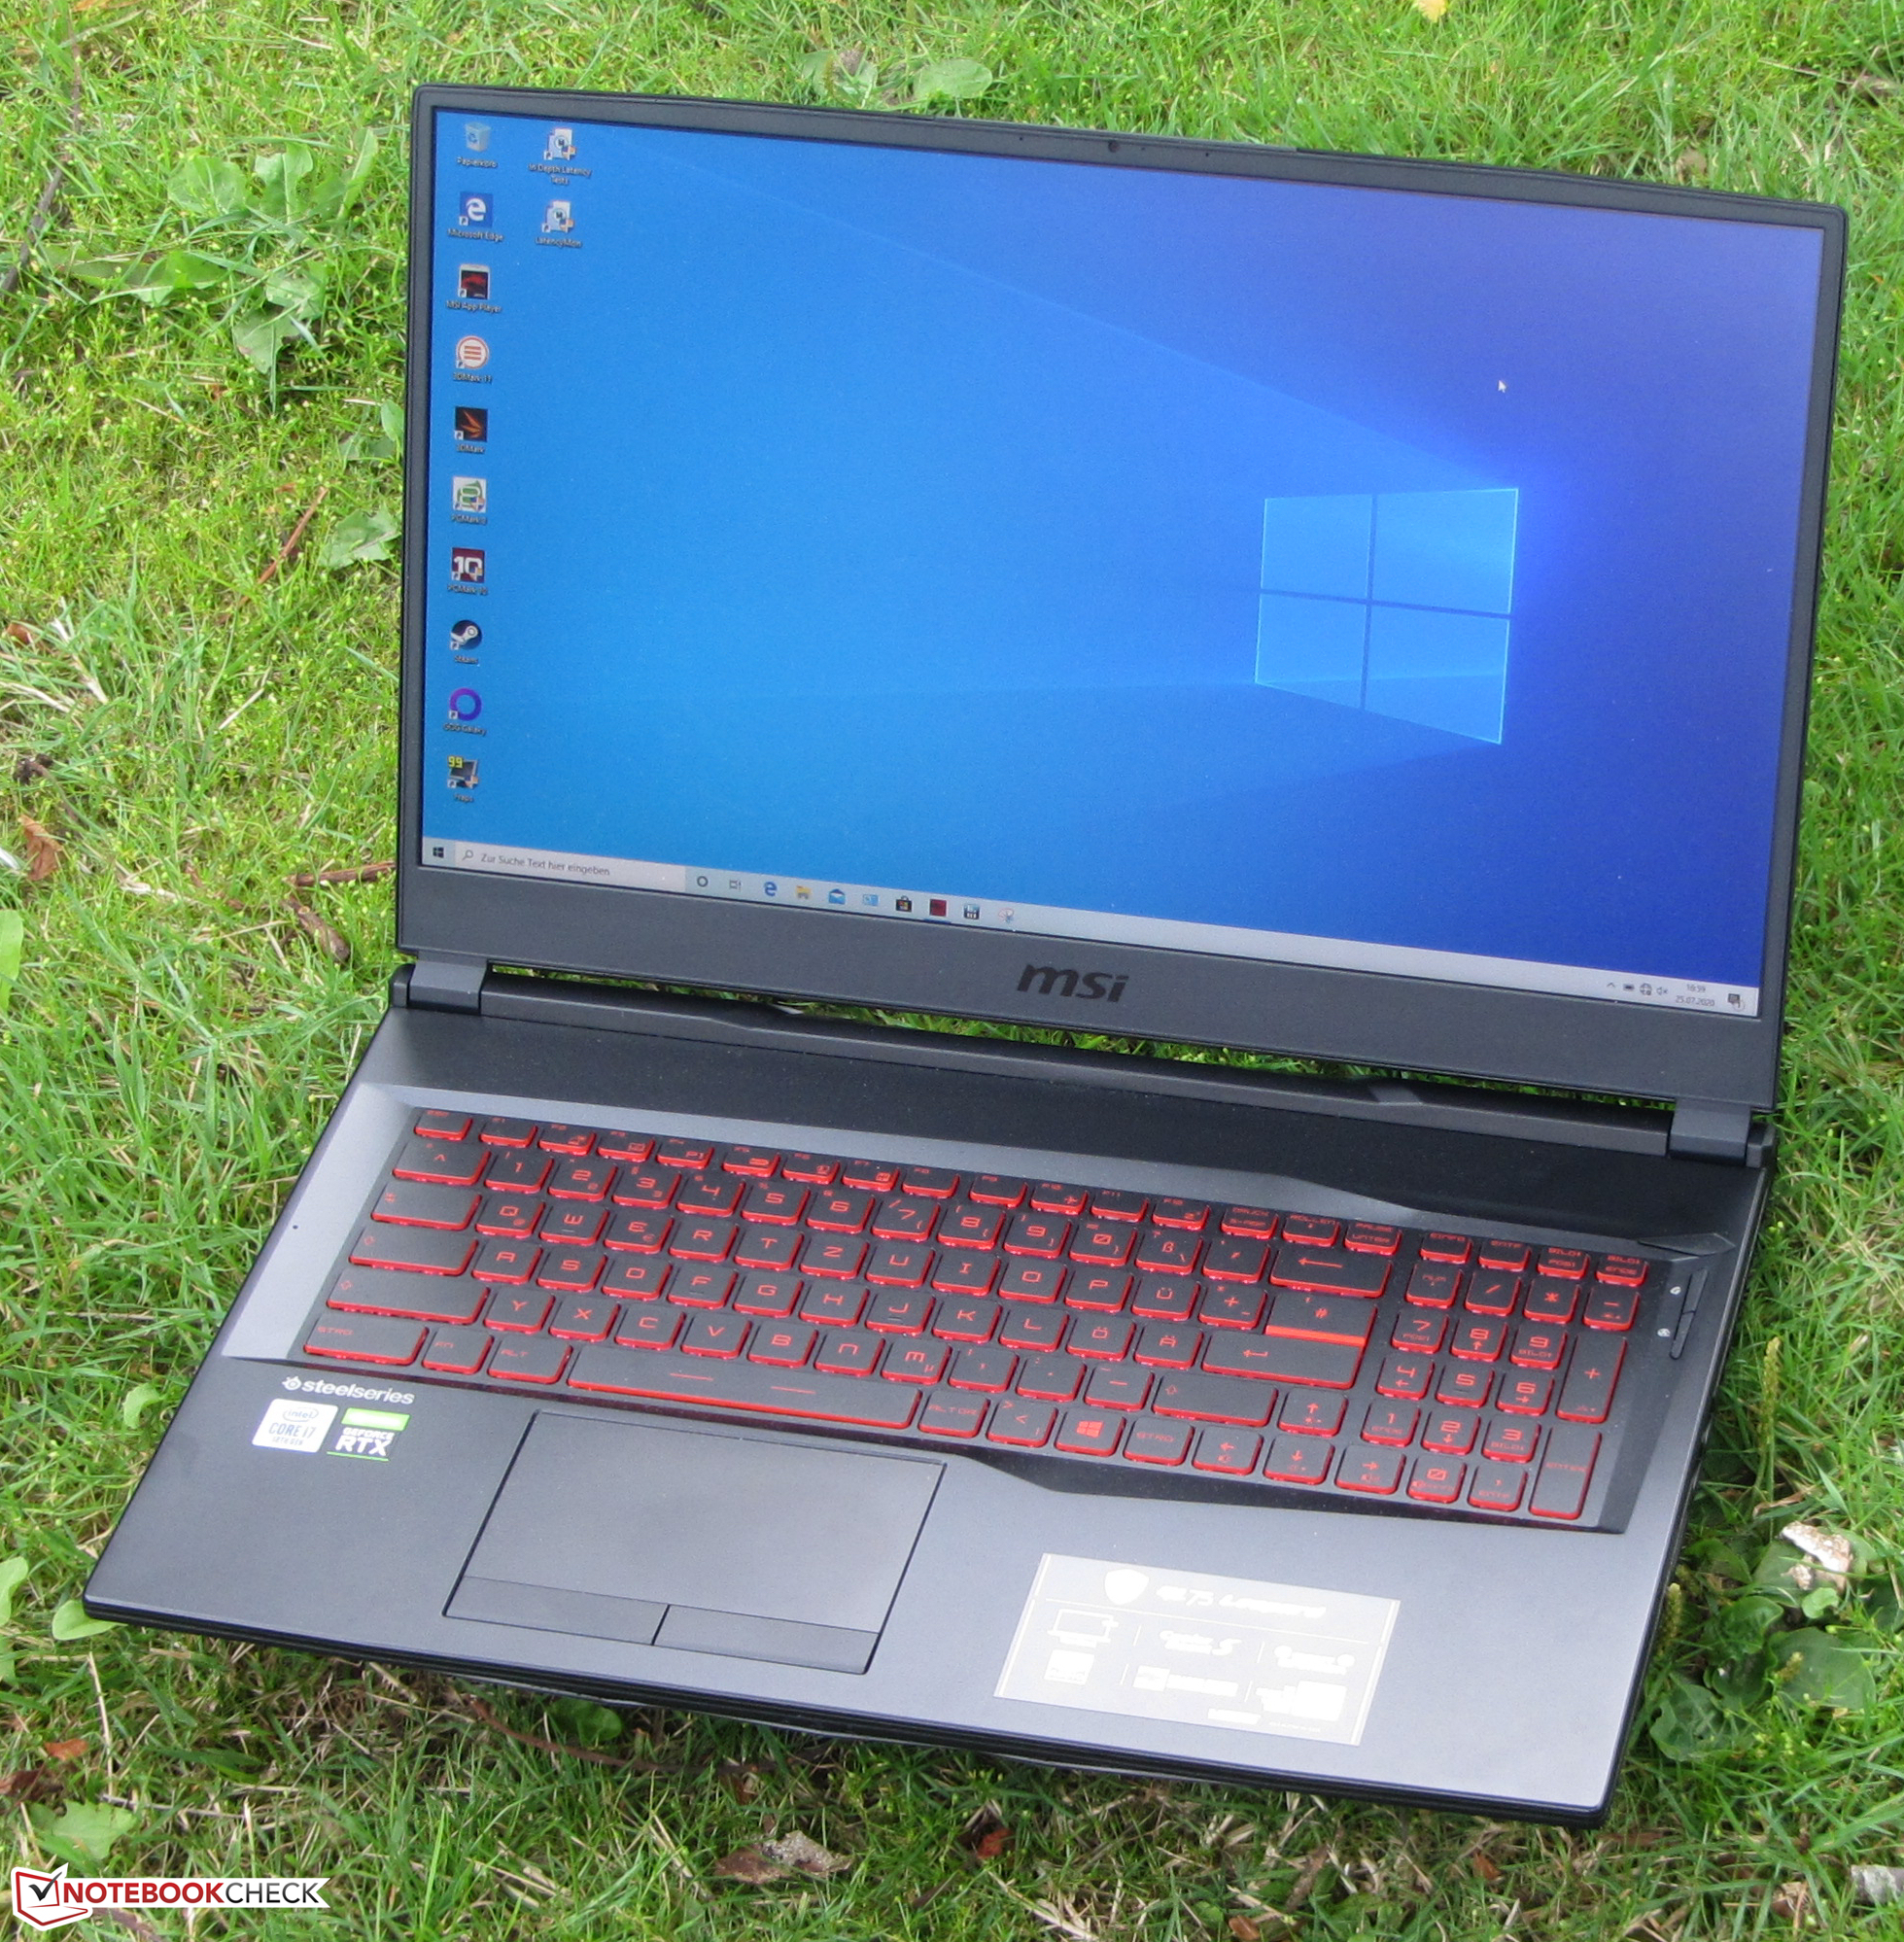
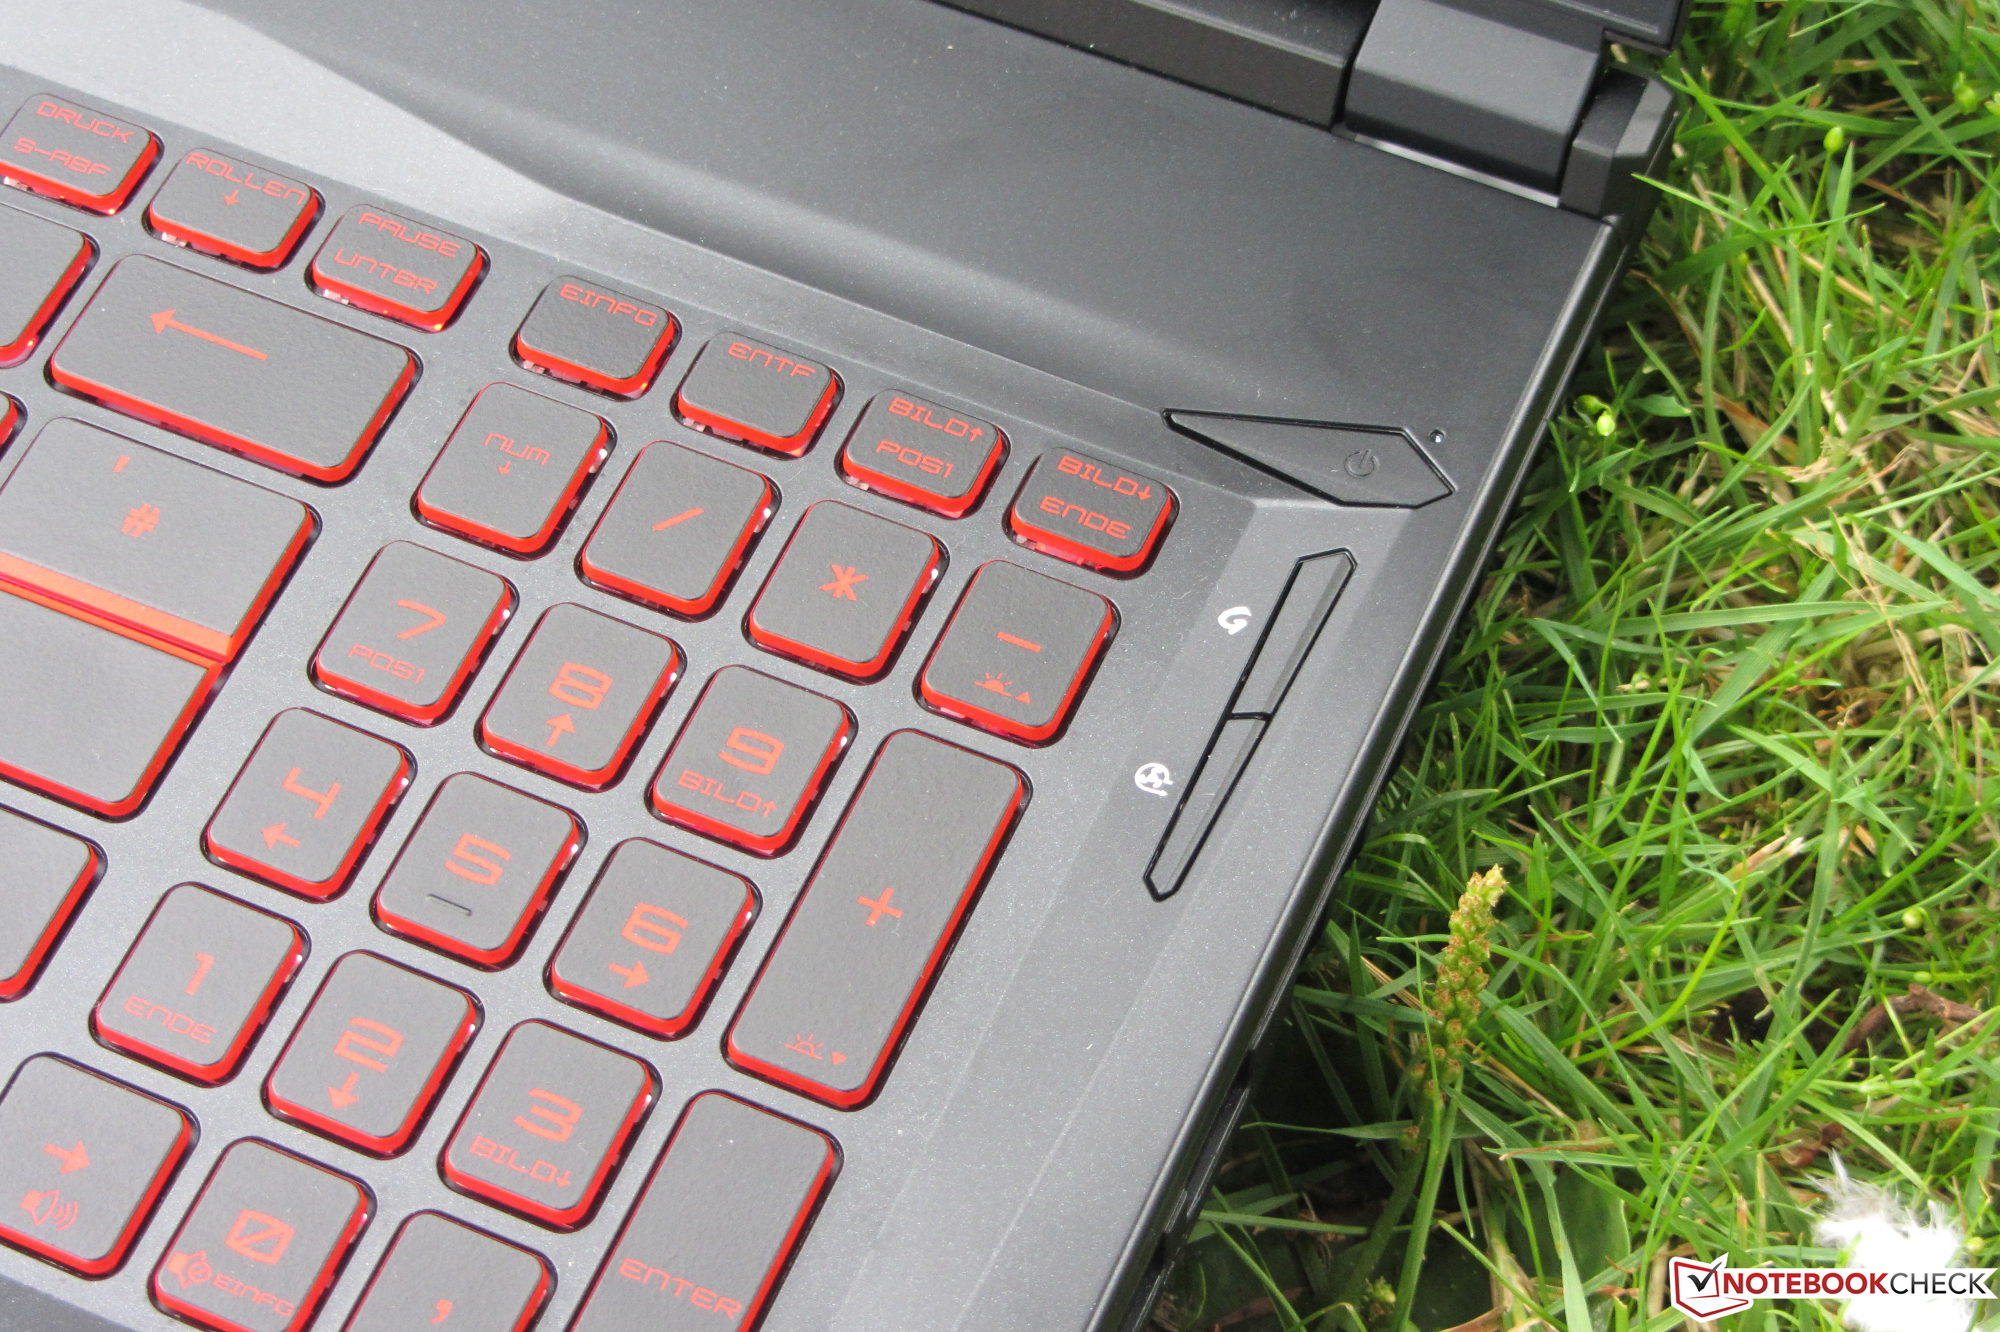
De batterijduur zal niemand verbazen, maar is goed voor een gaming laptop. Het toetsenbord met achtergrondverlichting heeft zijn alledaagse geschiktheid bewezen. Het biedt echter geen RGB-verlichting zoals zijn voorganger en het zuster model, maar alleen een monochrome verlichting in het rood. Bovendien biedt de laptop geen Thunderbolt 3 poort. MSI heeft alleen een USB Type-C 3.2 Gen 2 poort geïnstalleerd die geen DisplayPort via USB-C of Power Delivery ondersteunt.
MSI GL75 10SFR
- 31-07-2020 v7 (old)
Sascha Mölck
Price comparison
