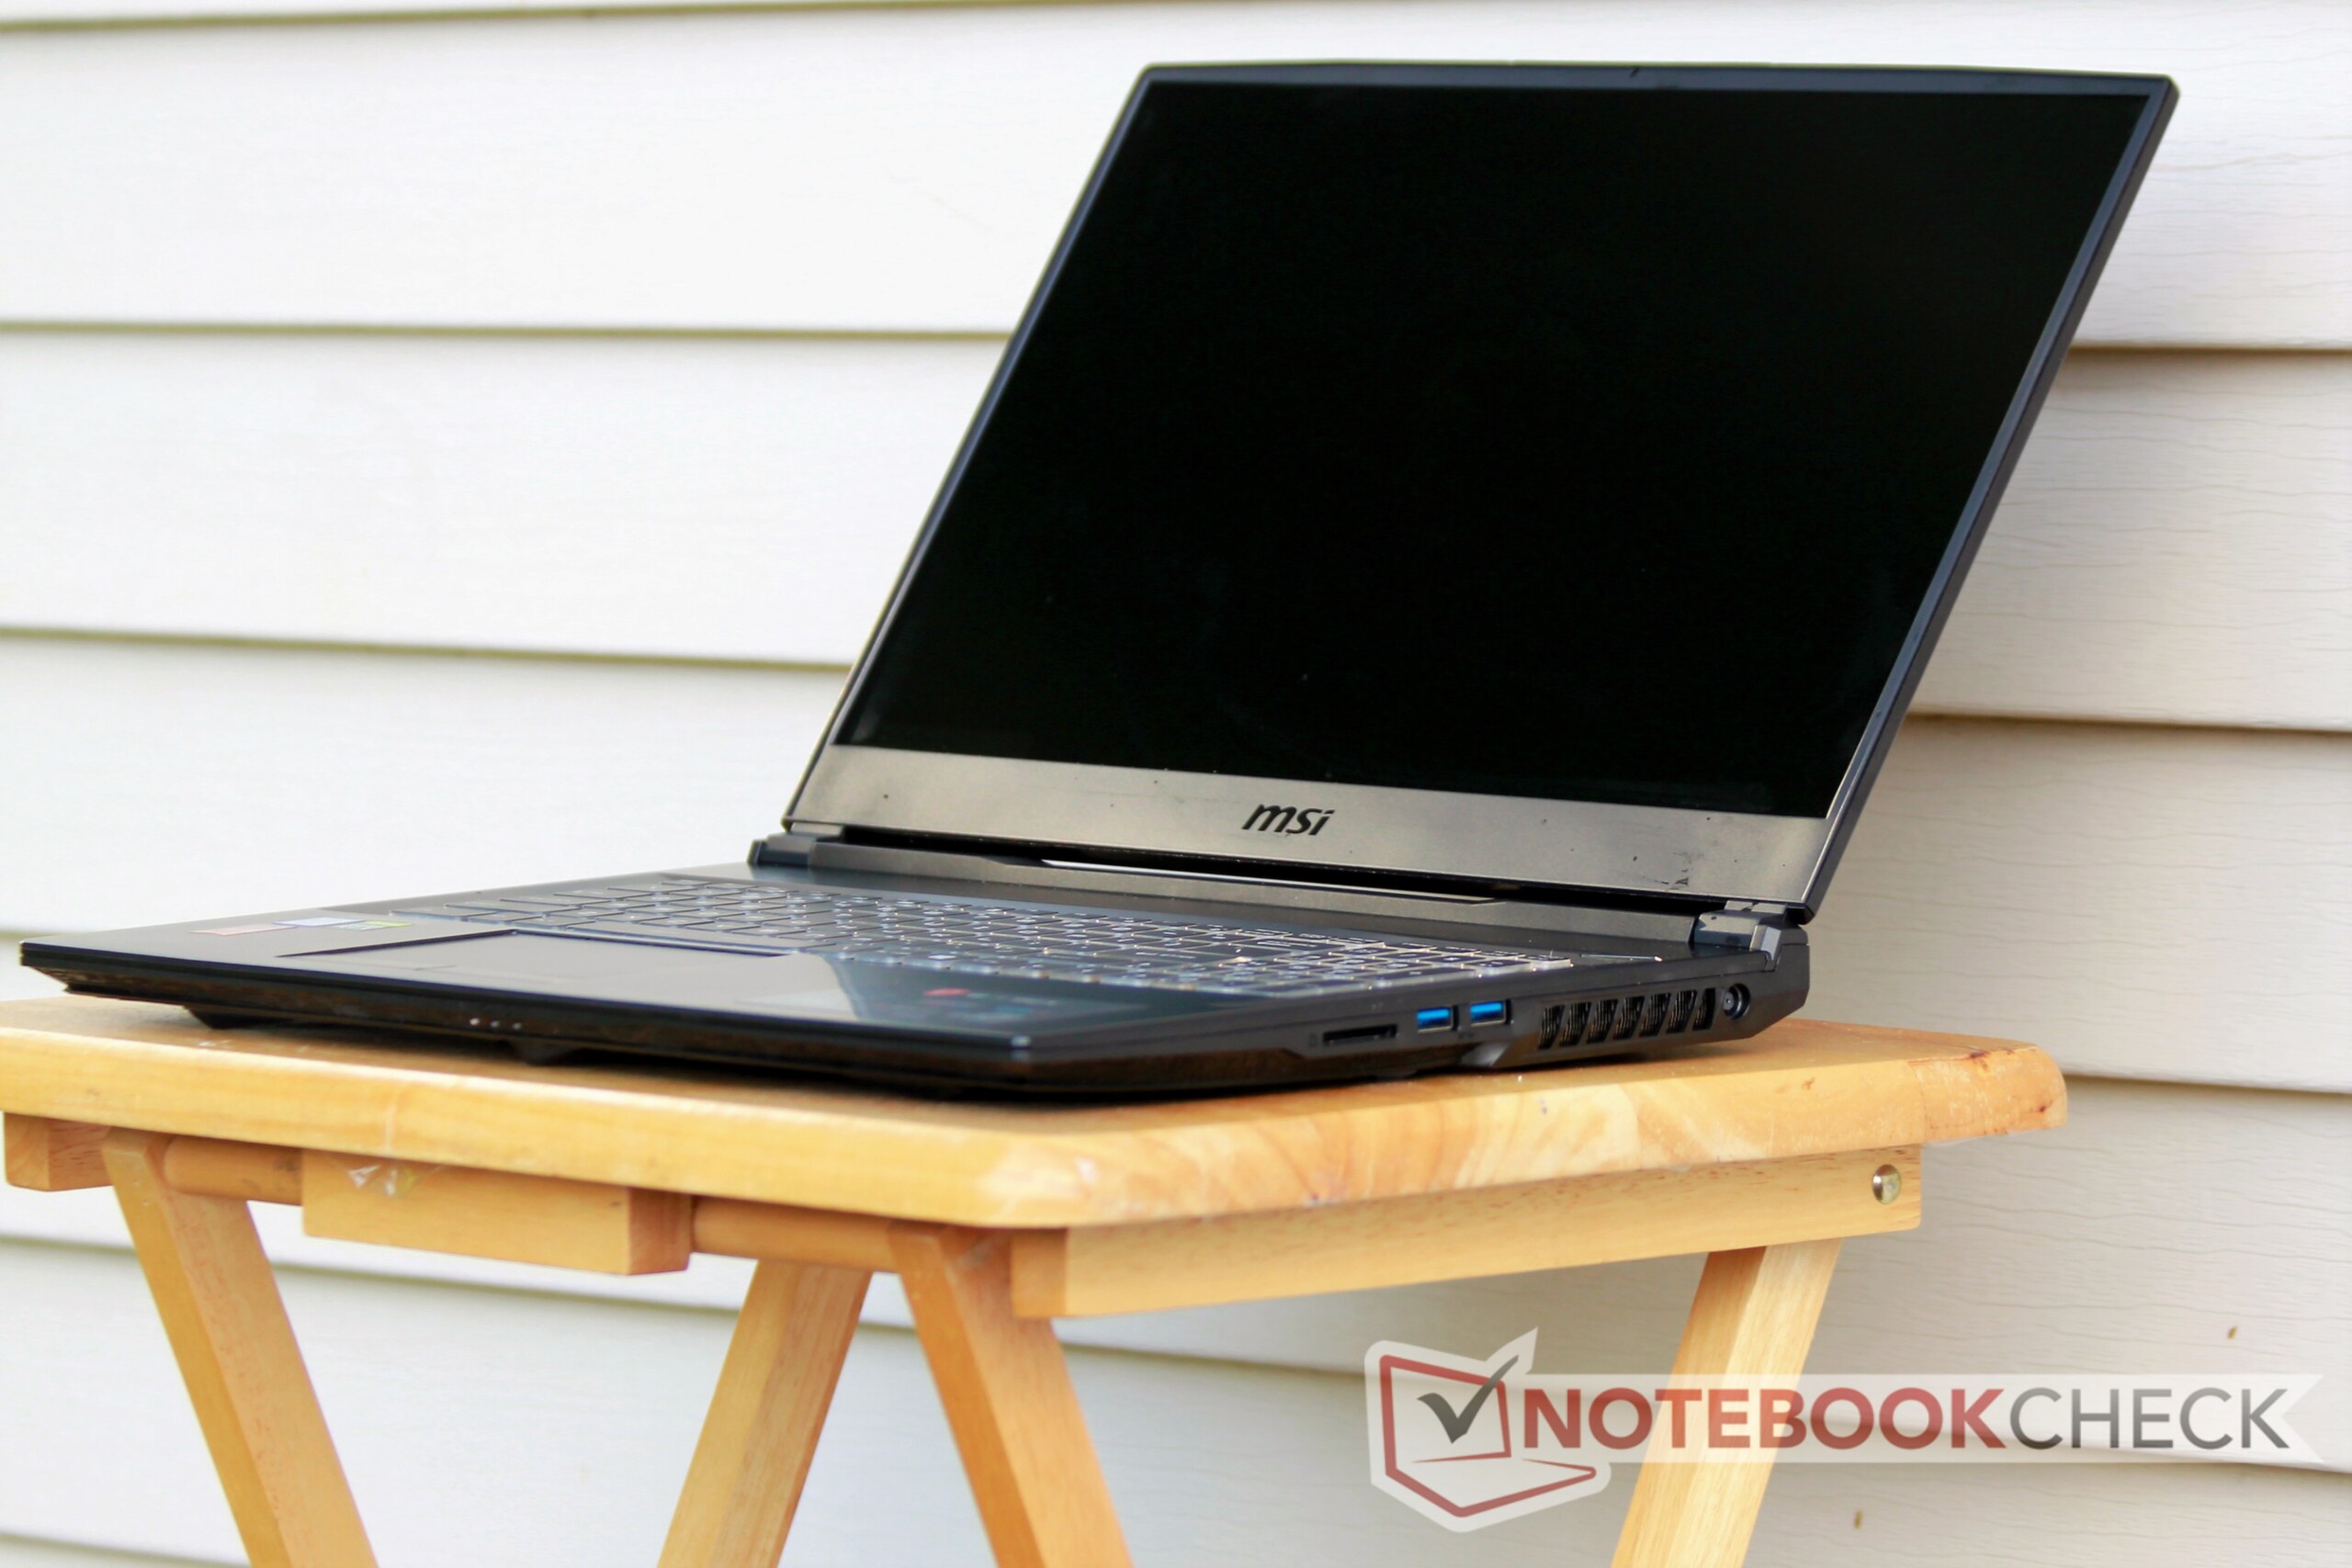
Kort testrapport MSI GL75 9SEK Laptop- een middenklasse gaminglaptop met luide ventilatoren


| SD Card Reader | |
| average JPG Copy Test (av. of 3 runs) | |
| Gemiddelde van klas Gaming (20.9 - 210, n=55, laatste 2 jaar) | |
| HP Omen 17t-3AW55AV_1 (Toshiba Exceria Pro SDXC 64 GB UHS-II) | |
| HP Omen 15-dc1020ng (Toshiba Exceria Pro SDXC 64 GB UHS-II) | |
| HP Pavilion Gaming 17-cd0085cl (Toshiba Exceria Pro SDXC 64 GB UHS-II) | |
| MSI GL73 8SE-010US (Toshiba Exceria Pro SDXC 64 GB UHS-II) | |
| MSI GL75 9SEK-056US | |
| maximum AS SSD Seq Read Test (1GB) | |
| Gemiddelde van klas Gaming (25.5 - 261, n=52, laatste 2 jaar) | |
| HP Omen 15-dc1020ng (Toshiba Exceria Pro SDXC 64 GB UHS-II) | |
| HP Omen 17t-3AW55AV_1 (Toshiba Exceria Pro SDXC 64 GB UHS-II) | |
| HP Pavilion Gaming 17-cd0085cl (Toshiba Exceria Pro SDXC 64 GB UHS-II) | |
| MSI GL73 8SE-010US (Toshiba Exceria Pro SDXC 64 GB UHS-II) | |
| MSI GL75 9SEK-056US | |
| |||||||||||||||||||||||||
Helderheidsverdeling: 93 %
Helderheid in Batterij-modus: 259.1 cd/m²
Contrast: 1036:1 (Zwart: 0.25 cd/m²)
ΔE ColorChecker Calman: 4.23 | ∀{0.5-29.43 Ø4.71}
calibrated: 3.9
ΔE Greyscale Calman: 1.3 | ∀{0.09-98 Ø4.96}
61% sRGB (Argyll 1.6.3 3D)
39% AdobeRGB 1998 (Argyll 1.6.3 3D)
42.49% AdobeRGB 1998 (Argyll 3D)
61.1% sRGB (Argyll 3D)
41.12% Display P3 (Argyll 3D)
Gamma: 2.076
CCT: 6542 K
| MSI GL75 9SEK-056US AU Optronics AUO479D (B173HAN04.7), IPS, 17.3", 1920x1080 | Asus Strix Hero III G731GV AU Optronics AUO B173HAN04.0, IPS, 17.3", 1920x1080 | MSI GL73 8SE-010US CMN1747, TN LED, 17.3", 1920x1080 | Acer Predator Helios 500 PH517-51-79BY AUO_B173HAN03, IPS, 17.3", 1920x1080 | HP Omen 17t-3AW55AV_1 AU Optronics AUO309D, IPS, 17.3", 1920x1080 | HP Omen 15-dc1020ng LGD05CE, IPS, 15.6", 1920x1080 | HP Pavilion Gaming 17-cd0085cl BOE0825, IPS, 17.3", 1920x1080 | |
|---|---|---|---|---|---|---|---|
| Display | 49% | 96% | 53% | 54% | -7% | 51% | |
| Display P3 Coverage (%) | 41.12 | 62.9 53% | 91.1 122% | 64.4 57% | 65.4 59% | 38.37 -7% | 63.3 54% |
| sRGB Coverage (%) | 61.1 | 87.2 43% | 100 64% | 91.3 49% | 90 47% | 57.6 -6% | 90.2 48% |
| AdobeRGB 1998 Coverage (%) | 42.49 | 63.8 50% | 85.4 101% | 65.6 54% | 65.8 55% | 39.69 -7% | 64.3 51% |
| Response Times | 63% | 59% | 55% | 46% | -38% | -1% | |
| Response Time Grey 50% / Grey 80% * (ms) | 26 ? | 6.8 ? 74% | 12.8 ? 51% | 14 ? 46% | 17.6 ? 32% | 40 ? -54% | 31.6 ? -22% |
| Response Time Black / White * (ms) | 24.4 ? | 12 ? 51% | 8.2 ? 66% | 9 ? 63% | 10 ? 59% | 29.6 ? -21% | 19.6 ? 20% |
| PWM Frequency (Hz) | 25770 ? | ||||||
| Screen | 12% | -50% | -28% | 2% | -22% | -2% | |
| Brightness middle (cd/m²) | 259.1 | 312.3 21% | 326.4 26% | 335 29% | 343.6 33% | 251 -3% | 299.6 16% |
| Brightness (cd/m²) | 261 | 297 14% | 317 21% | 300 15% | 320 23% | 232 -11% | 285 9% |
| Brightness Distribution (%) | 93 | 91 -2% | 90 -3% | 82 -12% | 87 -6% | 76 -18% | 86 -8% |
| Black Level * (cd/m²) | 0.25 | 0.21 16% | 0.28 -12% | 0.7 -180% | 0.34 -36% | 0.17 32% | 0.33 -32% |
| Contrast (:1) | 1036 | 1487 44% | 1166 13% | 479 -54% | 1011 -2% | 1476 42% | 908 -12% |
| Colorchecker dE 2000 * | 4.23 | 3.6 15% | 7.83 -85% | 4.99 -18% | 3.74 12% | 6.2 -47% | 3.68 13% |
| Colorchecker dE 2000 max. * | 23.39 | 6.74 71% | 13.36 43% | 9.32 60% | 5.33 77% | 18.6 20% | 8.05 66% |
| Colorchecker dE 2000 calibrated * | 3.9 | 3.95 -1% | 2.83 27% | 1.93 51% | 3.49 11% | 4.8 -23% | 3.15 19% |
| Greyscale dE 2000 * | 1.3 | 3.1 -138% | 10.9 -738% | 5.2 -300% | 3.7 -185% | 4.2 -223% | 3.8 -192% |
| Gamma | 2.076 106% | 2.26 97% | 1.97 112% | 2.49 88% | 2.36 93% | 2.32 95% | 2.12 104% |
| CCT | 6542 99% | 7002 93% | 11056 59% | 7719 84% | 6388 102% | 7454 87% | 7240 90% |
| Color Space (Percent of AdobeRGB 1998) (%) | 39 | 56.6 45% | 75.8 94% | 59 51% | 58 49% | 36.5 -6% | 58.1 49% |
| Color Space (Percent of sRGB) (%) | 61 | 86.6 42% | 100 64% | 91 49% | 90 48% | 57.4 -6% | 89.8 47% |
| Totaal Gemiddelde (Programma / Instellingen) | 41% /
25% | 35% /
-9% | 27% /
-3% | 34% /
17% | -22% /
-21% | 16% /
8% |
* ... kleiner is beter
Responstijd Scherm
| ↔ Responstijd Zwart naar Wit | ||
|---|---|---|
| 24.4 ms ... stijging ↗ en daling ↘ gecombineerd | ↗ 12.8 ms stijging | 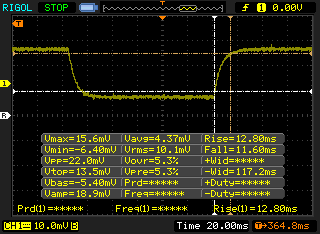 |
| ↘ 11.6 ms daling | ||
| Het scherm vertoonde prima responstijden in onze tests maar is misschien wat te traag voor competitieve games. Ter vergelijking: alle testtoestellen variëren van 0.1 (minimum) tot 240 (maximum) ms. » 58 % van alle toestellen zijn beter. Dit betekent dat de gemeten responstijd slechter is dan het gemiddelde (19.8 ms) van alle geteste toestellen. | ||
| ↔ Responstijd 50% Grijs naar 80% Grijs | ||
| 26 ms ... stijging ↗ en daling ↘ gecombineerd | ↗ 11.6 ms stijging | 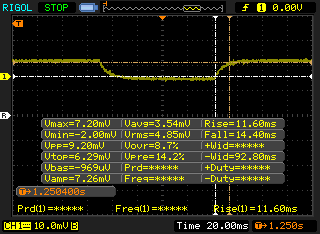 |
| ↘ 14.4 ms daling | ||
| Het scherm vertoonde relatief trage responstijden in onze tests en is misschien te traag voor games. Ter vergelijking: alle testtoestellen variëren van 0.165 (minimum) tot 636 (maximum) ms. » 36 % van alle toestellen zijn beter. Dit betekent dat de gemeten responstijd beter is dan het gemiddelde (30.9 ms) van alle geteste toestellen. | ||
Screen Flickering / PWM (Pulse-Width Modulation)
| Screen flickering / PWM niet waargenomen |  | ||
Ter vergelijking: 52 % van alle geteste toestellen maakten geen gebruik van PWM om de schermhelderheid te verlagen. Als het wel werd gebruikt, werd een gemiddelde van 7748 (minimum: 5 - maximum: 343500) Hz waargenomen. | |||
| Cinebench R10 | |
| Rendering Multiple CPUs 32Bit | |
| Gemiddelde van klas Gaming (42932 - 102066, n=9, laatste 2 jaar) | |
| Gemiddeld Intel Core i7-9750H (28251 - 36304, n=13) | |
| Lenovo Legion Y540-17IRH | |
| Rendering Single 32Bit | |
| Gemiddelde van klas Gaming (7457 - 12575, n=9, laatste 2 jaar) | |
| Gemiddeld Intel Core i7-9750H (6659 - 7214, n=13) | |
| Lenovo Legion Y540-17IRH | |
| PCMark 8 Home Score Accelerated v2 | 4241 punten | |
| PCMark 8 Work Score Accelerated v2 | 5428 punten | |
| PCMark 10 Score | 5748 punten | |
Help | ||
| MSI GL75 9SEK-056US WDC PC SN520 SDAPNUW-512G | Asus Strix Hero III G731GV Intel SSD 660p SSDPEKNW512G8 | MSI GL73 8SE-010US Kingston RBUSNS8154P3128GJ | Acer Predator Helios 500 PH517-51-79BY SK hynix SSD Canvas SC300 HFS256GD9MNE-6200A | HP Omen 17t-3AW55AV_1 Samsung SSD PM981 MZVLB512HAJQ | HP Pavilion Gaming 17-cd0085cl Samsung SSD PM981 MZVLB256HAHQ | |
|---|---|---|---|---|---|---|
| AS SSD | -29% | -79% | -33% | 17% | 5% | |
| Seq Read (MB/s) | 1296 | 940 -27% | 794 -39% | 972 -25% | 1473 14% | 1709 32% |
| Seq Write (MB/s) | 1391 | 921 -34% | 427.6 -69% | 838 -40% | 1962 41% | 1345 -3% |
| 4K Read (MB/s) | 29.67 | 48.05 62% | 21.91 -26% | 38.57 30% | 31.66 7% | 49.73 68% |
| 4K Write (MB/s) | 104.3 | 56.6 | 80.7 | 84.4 | 108.2 | |
| 4K-64 Read (MB/s) | 1042 | 320.1 -69% | 354.3 -66% | 723 -31% | 1125 8% | 731 -30% |
| 4K-64 Write (MB/s) | 1284 | 703 -45% | 285.7 -78% | 647 -50% | 1866 45% | 1233 -4% |
| Access Time Read * (ms) | 0.108 | 0.079 27% | 0.237 -119% | 0.071 34% | 0.073 32% | |
| Access Time Write * (ms) | 0.031 | 0.046 -48% | 0.09 -190% | 0.054 -74% | 0.047 -52% | 0.034 -10% |
| Score Read (Points) | 1201 | 462 -62% | 456 -62% | 859 -28% | 1304 9% | 951 -21% |
| Score Write (Points) | 1542 | 900 -42% | 385 -75% | 812 -47% | 2147 39% | 1476 -4% |
| Score Total (Points) | 3363 | 1616 -52% | 1061 -68% | 4142 23% | 2909 -13% | |
| Copy ISO MB/s (MB/s) | 1416 | 811 | 868 | 1080 | 1284 | |
| Copy Program MB/s (MB/s) | 569 | 278 | 337 | 481.1 | 589 | |
| Copy Game MB/s (MB/s) | 971 | 556 | 590 | 875 | 1107 | |
| CrystalDiskMark 5.2 / 6 | -13% | -49% | -37% | -6% | 22% | |
| Write 4K (MB/s) | 149.1 | 129.3 -13% | 71.2 -52% | 79.2 -47% | 110.7 -26% | 135.3 -9% |
| Read 4K (MB/s) | 48.58 | 54.4 12% | 32.7 -33% | 39.69 -18% | 35.49 -27% | 63.7 31% |
| Write Seq (MB/s) | 978 | 404.5 | 950 | 1665 | 1337 | |
| Read Seq (MB/s) | 1447 | 8.3 | 1087 | 1284 | 1617 | |
| Write 4K Q32T1 (MB/s) | 462 | 476.8 3% | 204 -56% | 189.6 -59% | 340.2 -26% | 568 23% |
| Read 4K Q32T1 (MB/s) | 606 | 338.1 -44% | 303.2 -50% | 304 -50% | 407.5 -33% | 645 6% |
| Write Seq Q32T1 (MB/s) | 1454 | 982 -32% | 386.5 -73% | 948 -35% | 2038 40% | 1428 -2% |
| Read Seq Q32T1 (MB/s) | 1724 | 1622 -6% | 1214 -30% | 1488 -14% | 2367 37% | 3184 85% |
| Write 4K Q8T8 (MB/s) | 1211 | |||||
| Read 4K Q8T8 (MB/s) | 1104 | |||||
| Totaal Gemiddelde (Programma / Instellingen) | -21% /
-23% | -64% /
-68% | -35% /
-35% | 6% /
8% | 14% /
11% |
* ... kleiner is beter

| 3DMark 11 | |
| 1280x720 Performance GPU | |
| Gemiddelde van klas Gaming (21841 - 80022, n=105, laatste 2 jaar) | |
| Asus Strix Scar III G531GW-AZ062T | |
| MSI GL75 9SEK-056US | |
| Gemiddeld NVIDIA GeForce RTX 2060 Mobile (19143 - 24662, n=40) | |
| Razer Blade 15 GTX 1660 Ti | |
| HP Omen X 2S 15-dg0075cl | |
| Asus ZenBook 15 UX534FT-DB77 | |
| Asus TUF FX705DY-AU072 | |
| Asus ZenBook Flip 14 UM462DA-AI023T | |
| 1280x720 Performance Combined | |
| Gemiddelde van klas Gaming (10258 - 30851, n=105, laatste 2 jaar) | |
| MSI GL75 9SEK-056US | |
| HP Omen X 2S 15-dg0075cl | |
| Gemiddeld NVIDIA GeForce RTX 2060 Mobile (1107 - 14726, n=40) | |
| Razer Blade 15 GTX 1660 Ti | |
| Asus Strix Scar III G531GW-AZ062T | |
| Asus ZenBook 15 UX534FT-DB77 | |
| Asus TUF FX705DY-AU072 | |
| Asus ZenBook Flip 14 UM462DA-AI023T | |
| 3DMark 11 Performance | 18769 punten | |
| 3DMark Cloud Gate Standard Score | 38284 punten | |
| 3DMark Fire Strike Score | 15035 punten | |
| 3DMark Time Spy Score | 6245 punten | |
Help | ||
| lage | gem. | hoge | ultra | |
|---|---|---|---|---|
| The Witcher 3 (2015) | 262 | 182 | 115 | 58 |
| Rocket League (2017) | 252 | 249 | 246 | |
| Shadow of the Tomb Raider (2018) | 120 | 96 | 90 | 80 |
| F1 2019 (2019) | 209 | 166 | 138 | 99 |
| MSI GL75 9SEK-056US GeForce RTX 2060 Mobile, i7-9750H, WDC PC SN520 SDAPNUW-512G | Asus Strix Hero III G731GV GeForce RTX 2060 Mobile, i7-9750H, Intel SSD 660p SSDPEKNW512G8 | MSI GL73 8SE-010US GeForce RTX 2060 Mobile, i7-8750H, Kingston RBUSNS8154P3128GJ | Acer Predator Helios 500 PH517-51-79BY GeForce GTX 1070 Mobile, i7-8750H, SK hynix SSD Canvas SC300 HFS256GD9MNE-6200A | HP Omen 17t-3AW55AV_1 GeForce GTX 1070 Mobile, i7-8750H, Samsung SSD PM981 MZVLB512HAJQ | HP Omen 15-dc1020ng GeForce GTX 1650 Mobile, i5-9300H, WDC PC SN720 SDAQNTW-512G | HP Pavilion Gaming 17-cd0085cl GeForce GTX 1660 Ti Max-Q, i7-9750H, Samsung SSD PM981 MZVLB256HAHQ | |
|---|---|---|---|---|---|---|---|
| Noise | -2% | -2% | -2% | 1% | 11% | 11% | |
| uit / omgeving * (dB) | 28.1 | 28.2 -0% | 28.6 -2% | 30.4 -8% | 27.8 1% | 28.8 -2% | 28.2 -0% |
| Idle Minimum * (dB) | 30.9 | 29.5 5% | 33.8 -9% | 31.2 -1% | 31.1 -1% | 28.8 7% | 30.1 3% |
| Idle Average * (dB) | 30.9 | 30.3 2% | 34 -10% | 35.3 -14% | 31.1 -1% | 29.5 5% | 30.1 3% |
| Idle Maximum * (dB) | 31 | 31.9 -3% | 34.1 -10% | 35.3 -14% | 35 -13% | 31.1 -0% | 30.1 3% |
| Load Average * (dB) | 39 | 50.4 -29% | 36.5 6% | 44.4 -14% | 42 -8% | 35.2 10% | 34.2 12% |
| Witcher 3 ultra * (dB) | 53.5 | 50.1 6% | 47.8 11% | 41 23% | 44.5 17% | 35.2 34% | 34.2 36% |
| Load Maximum * (dB) | 53.5 | 50.1 6% | 52.2 2% | 45.2 16% | 46.5 13% | 41 23% | 43.8 18% |
* ... kleiner is beter
Geluidsniveau
| Onbelast |
| 30.9 / 30.9 / 31 dB (A) |
| Belasting |
| 39 / 53.5 dB (A) |
 | ||
30 dB stil 40 dB(A) hoorbaar 50 dB(A) luid |
||
min: | ||
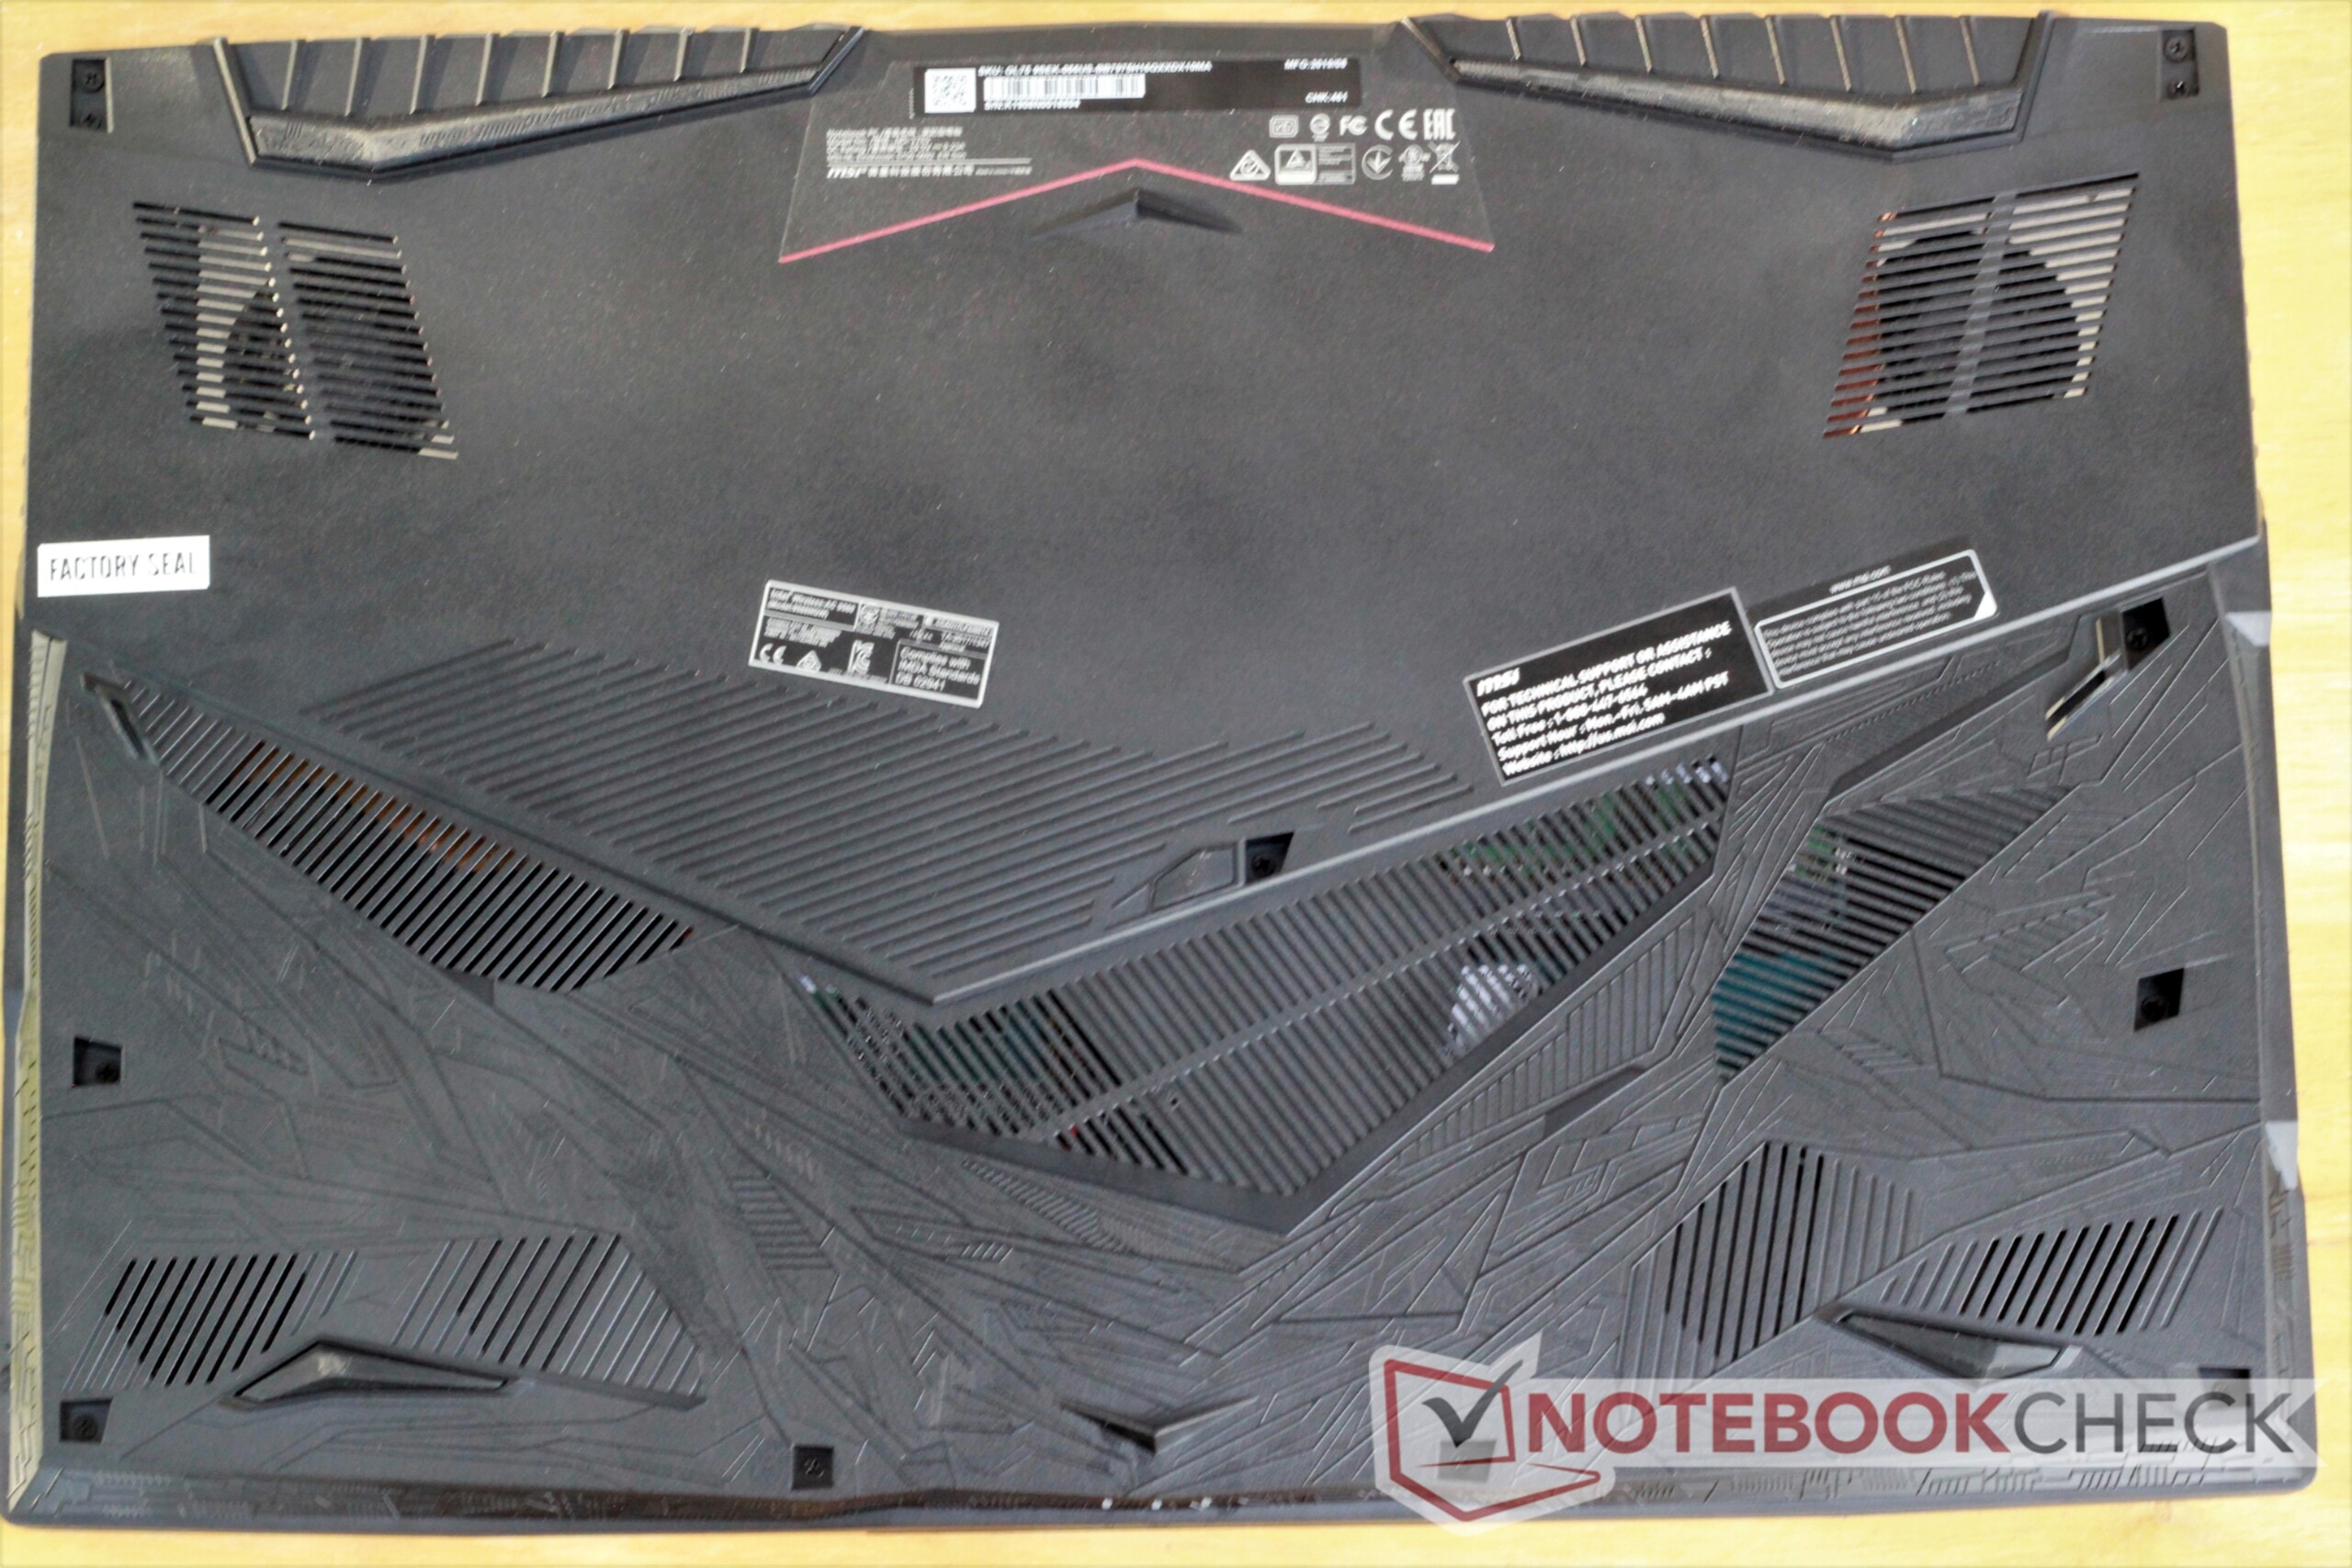
(-) De maximumtemperatuur aan de bovenzijde bedraagt 49.4 °C / 121 F, vergeleken met het gemiddelde van 40.4 °C / 105 F, variërend van 21.2 tot 68.8 °C voor de klasse Gaming.
(-) De bodem warmt op tot een maximum van 50.6 °C / 123 F, vergeleken met een gemiddelde van 43.2 °C / 110 F
(±) Bij onbelast gebruik bedraagt de gemiddelde temperatuur voor de bovenzijde 35 °C / 95 F, vergeleken met het apparaatgemiddelde van 33.9 °C / 93 F.
(-) Bij het spelen van The Witcher 3 is de gemiddelde temperatuur voor de bovenzijde 39.2 °C / 103 F, vergeleken met het apparaatgemiddelde van 33.9 °C / 93 F.
(+) De palmsteunen en het touchpad zijn met een maximum van ###max## °C / 88.9 F koeler dan de huidtemperatuur en voelen daarom koel aan.
(-) De gemiddelde temperatuur van de handpalmsteun van soortgelijke toestellen bedroeg 28.8 °C / 83.8 F (-2.8 °C / -5.1 F).
MSI GL75 9SEK-056US audioanalyse
(±) | luidspreker luidheid is gemiddeld maar goed (81.7 dB)
Bas 100 - 315 Hz
(-) | bijna geen lage tonen - gemiddeld 19% lager dan de mediaan
(±) | lineariteit van de lage tonen is gemiddeld (10.3% delta ten opzichte van de vorige frequentie)
Midden 400 - 2000 Hz
(+) | evenwichtige middens - slechts 2.9% verwijderd van de mediaan
(+) | de middentonen zijn lineair (6.7% delta ten opzichte van de vorige frequentie)
Hoog 2 - 16 kHz
(+) | evenwichtige hoogtepunten - slechts 1.5% verwijderd van de mediaan
(+) | de hoge tonen zijn lineair (3.4% delta naar de vorige frequentie)
Algemeen 100 - 16.000 Hz
(+) | het totale geluid is lineair (14.5% verschil met de mediaan)
Vergeleken met dezelfde klasse
» 27% van alle geteste apparaten in deze klasse waren beter, 7% vergelijkbaar, 66% slechter
» De beste had een delta van 6%, het gemiddelde was 18%, de slechtste was 132%
Vergeleken met alle geteste toestellen
» 19% van alle geteste apparaten waren beter, 4% gelijk, 77% slechter
» De beste had een delta van 4%, het gemiddelde was 23%, de slechtste was 134%
Asus Strix Hero III G731GV audioanalyse
(±) | luidspreker luidheid is gemiddeld maar goed (81 dB)
Bas 100 - 315 Hz
(±) | verminderde zeebaars - gemiddeld 6.6% lager dan de mediaan
(±) | lineariteit van de lage tonen is gemiddeld (11.8% delta ten opzichte van de vorige frequentie)
Midden 400 - 2000 Hz
(+) | evenwichtige middens - slechts 2.8% verwijderd van de mediaan
(+) | de middentonen zijn lineair (6.7% delta ten opzichte van de vorige frequentie)
Hoog 2 - 16 kHz
(+) | evenwichtige hoogtepunten - slechts 1.8% verwijderd van de mediaan
(+) | de hoge tonen zijn lineair (5.4% delta naar de vorige frequentie)
Algemeen 100 - 16.000 Hz
(+) | het totale geluid is lineair (13.4% verschil met de mediaan)
Vergeleken met dezelfde klasse
» 19% van alle geteste apparaten in deze klasse waren beter, 7% vergelijkbaar, 74% slechter
» De beste had een delta van 6%, het gemiddelde was 18%, de slechtste was 132%
Vergeleken met alle geteste toestellen
» 14% van alle geteste apparaten waren beter, 4% gelijk, 82% slechter
» De beste had een delta van 4%, het gemiddelde was 23%, de slechtste was 134%
HP Omen 17t-3AW55AV_1 audioanalyse
(±) | luidspreker luidheid is gemiddeld maar goed (72.8 dB)
Bas 100 - 315 Hz
(-) | bijna geen lage tonen - gemiddeld 17.6% lager dan de mediaan
(±) | lineariteit van de lage tonen is gemiddeld (14.3% delta ten opzichte van de vorige frequentie)
Midden 400 - 2000 Hz
(+) | evenwichtige middens - slechts 2% verwijderd van de mediaan
(+) | de middentonen zijn lineair (5.2% delta ten opzichte van de vorige frequentie)
Hoog 2 - 16 kHz
(+) | evenwichtige hoogtepunten - slechts 2.4% verwijderd van de mediaan
(+) | de hoge tonen zijn lineair (6.5% delta naar de vorige frequentie)
Algemeen 100 - 16.000 Hz
(±) | lineariteit van het totale geluid is gemiddeld (16% verschil met de mediaan)
Vergeleken met dezelfde klasse
» 39% van alle geteste apparaten in deze klasse waren beter, 6% vergelijkbaar, 55% slechter
» De beste had een delta van 6%, het gemiddelde was 18%, de slechtste was 132%
Vergeleken met alle geteste toestellen
» 25% van alle geteste apparaten waren beter, 5% gelijk, 69% slechter
» De beste had een delta van 4%, het gemiddelde was 23%, de slechtste was 134%
| Uit / Standby | |
| Inactief | |
| Belasting |
|
Key:
min: | |
| MSI GL75 9SEK-056US i7-9750H, GeForce RTX 2060 Mobile, WDC PC SN520 SDAPNUW-512G, IPS, 1920x1080, 17.3" | Asus Strix Hero III G731GV i7-9750H, GeForce RTX 2060 Mobile, Intel SSD 660p SSDPEKNW512G8, IPS, 1920x1080, 17.3" | MSI GL73 8SE-010US i7-8750H, GeForce RTX 2060 Mobile, Kingston RBUSNS8154P3128GJ, TN LED, 1920x1080, 17.3" | Acer Predator Helios 500 PH517-51-79BY i7-8750H, GeForce GTX 1070 Mobile, SK hynix SSD Canvas SC300 HFS256GD9MNE-6200A, IPS, 1920x1080, 17.3" | HP Omen 17t-3AW55AV_1 i7-8750H, GeForce GTX 1070 Mobile, Samsung SSD PM981 MZVLB512HAJQ, IPS, 1920x1080, 17.3" | HP Omen 15-dc1020ng i5-9300H, GeForce GTX 1650 Mobile, WDC PC SN720 SDAQNTW-512G, IPS, 1920x1080, 15.6" | HP Pavilion Gaming 17-cd0085cl i7-9750H, GeForce GTX 1660 Ti Max-Q, Samsung SSD PM981 MZVLB256HAHQ, IPS, 1920x1080, 17.3" | |
|---|---|---|---|---|---|---|---|
| Power Consumption | -37% | 4% | -58% | -37% | 38% | 26% | |
| Idle Minimum * (Watt) | 10.7 | 16.2 -51% | 8.8 18% | 20.4 -91% | 17.8 -66% | 4.04 62% | 5.4 50% |
| Idle Average * (Watt) | 15.2 | 24.8 -63% | 16.2 -7% | 26.5 -74% | 24.7 -63% | 7.2 53% | 9.2 39% |
| Idle Maximum * (Watt) | 17.8 | 28.6 -61% | 18.3 -3% | 37 -108% | 29.6 -66% | 11.4 36% | 13 27% |
| Load Average * (Watt) | 88.2 | 127.6 -45% | 86.1 2% | 129 -46% | 110 -25% | 80.8 8% | 85.9 3% |
| Witcher 3 ultra * (Watt) | 147.8 | 147.1 -0% | 146.7 1% | 186 -26% | 167.8 -14% | 93.6 37% | 107.9 27% |
| Load Maximum * (Watt) | 206.5 | 212.7 -3% | 186.4 10% | 216 -5% | 178.6 14% | 144.5 30% | 182.2 12% |
* ... kleiner is beter
| MSI GL75 9SEK-056US i7-9750H, GeForce RTX 2060 Mobile, 51 Wh | MSI GL73 8SE-010US i7-8750H, GeForce RTX 2060 Mobile, 41 Wh | Acer Predator Helios 500 PH517-51-79BY i7-8750H, GeForce GTX 1070 Mobile, 72 Wh | HP Omen 17t-3AW55AV_1 i7-8750H, GeForce GTX 1070 Mobile, 86 Wh | HP Pavilion Gaming 17-cd0085cl i7-9750H, GeForce GTX 1660 Ti Max-Q, 52.5 Wh | Asus Strix Hero III G731GV i7-9750H, GeForce RTX 2060 Mobile, 66 Wh | |
|---|---|---|---|---|---|---|
| Batterijduur | -30% | -9% | 6% | 28% | 7% | |
| Reader / Idle (h) | 7.9 | 6.5 -18% | 4.2 -47% | 4.5 -43% | 11.6 47% | |
| WiFi v1.3 (h) | 4.2 | 2.8 -33% | 2.9 -31% | 4.2 0% | 5.7 36% | 4.5 7% |
| Load (h) | 1 | 0.6 -40% | 1.5 50% | 1.6 60% | 1 0% | |
| Witcher 3 ultra (h) | 1.1 |
Pro
Contra

Voor het volledige, Engelse testrapport, klik hier.
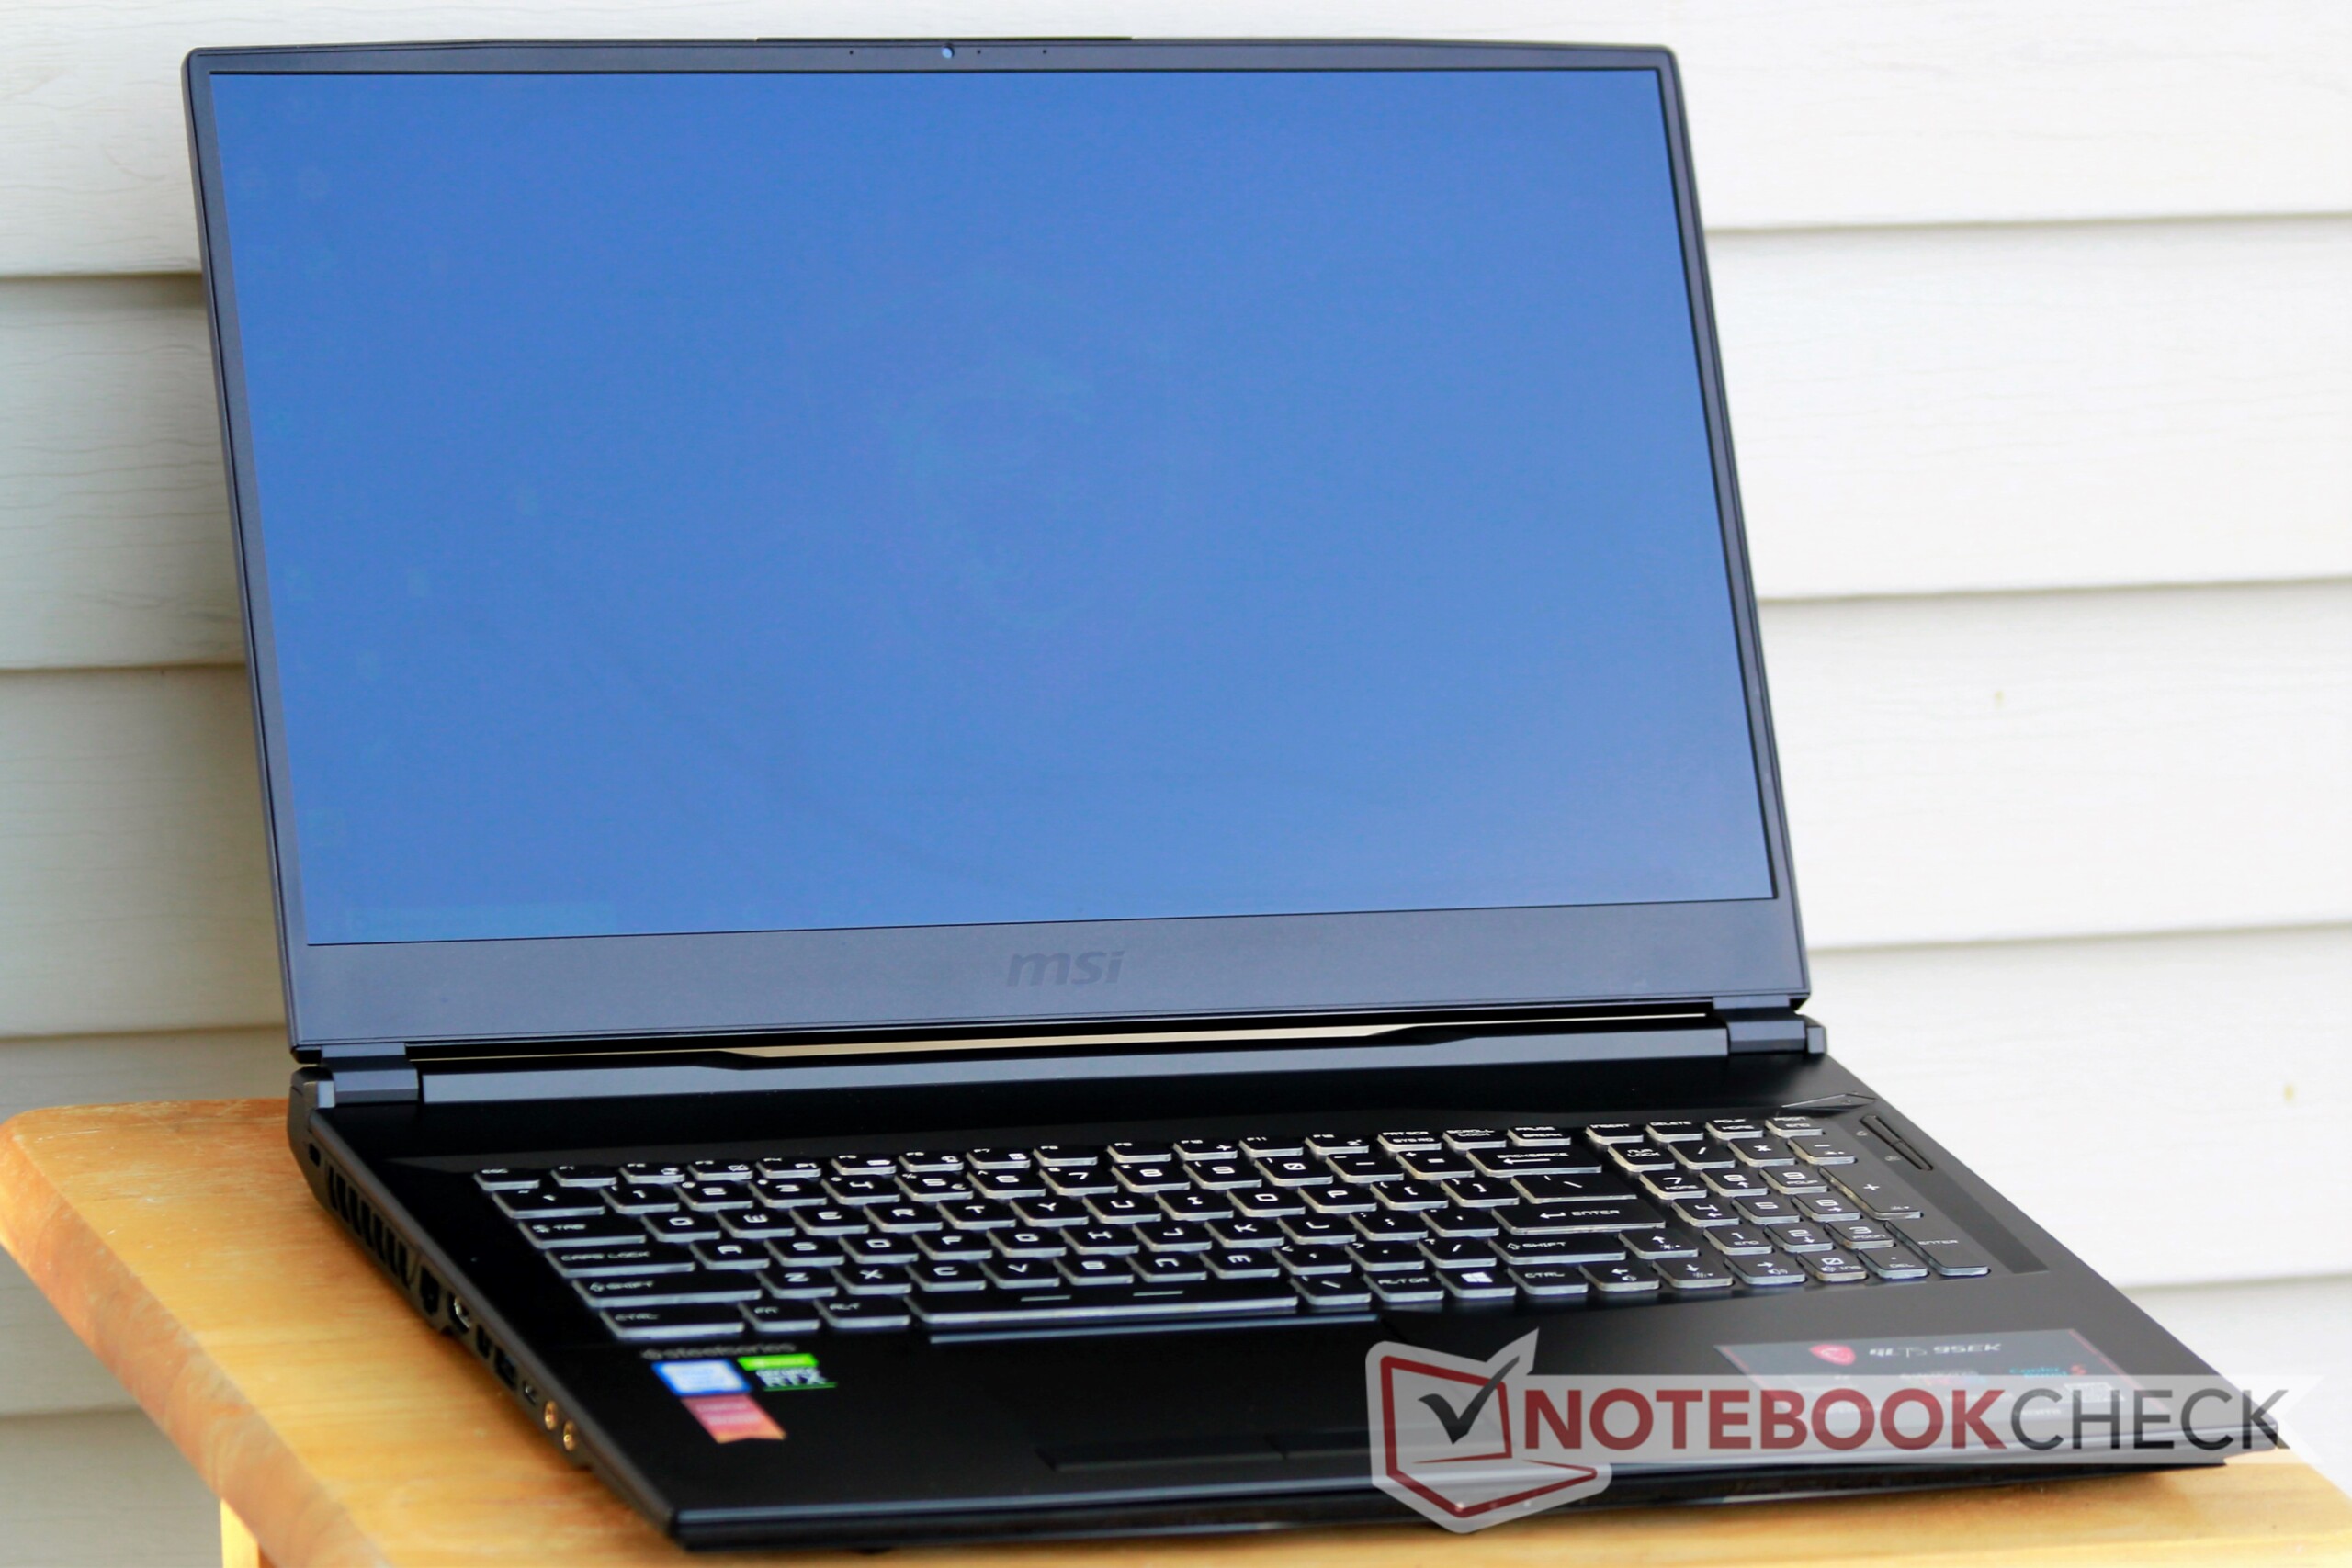
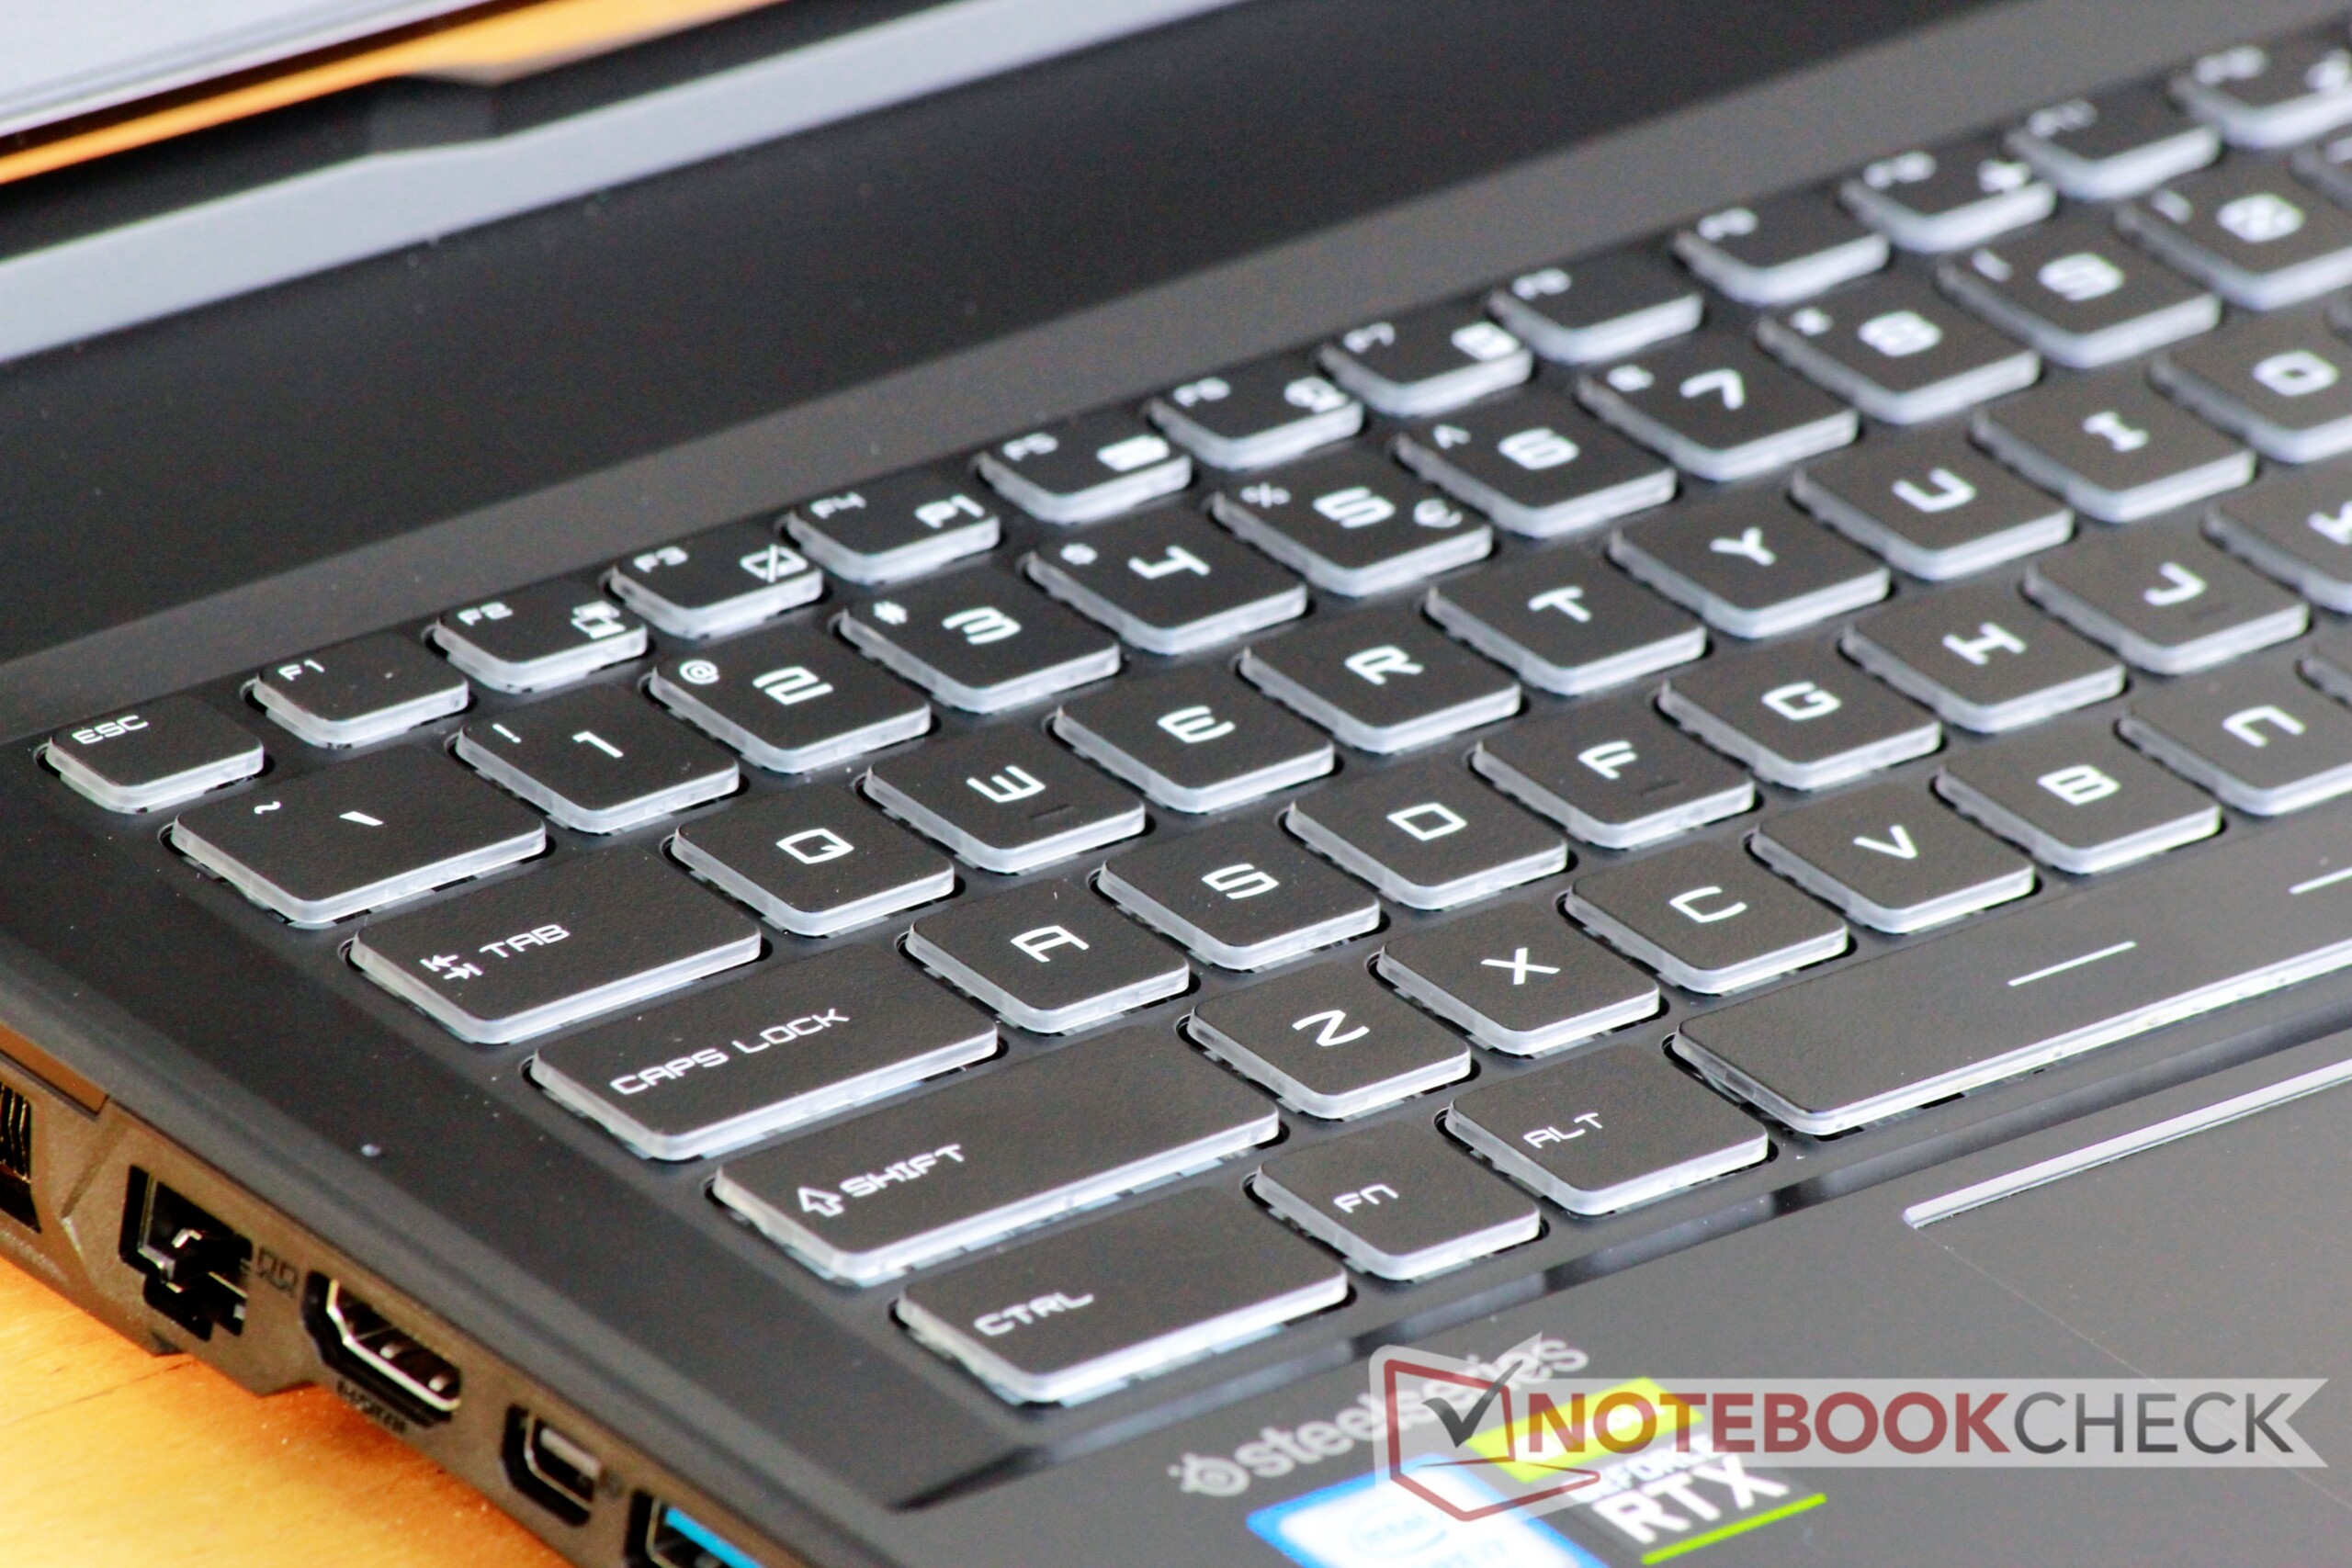
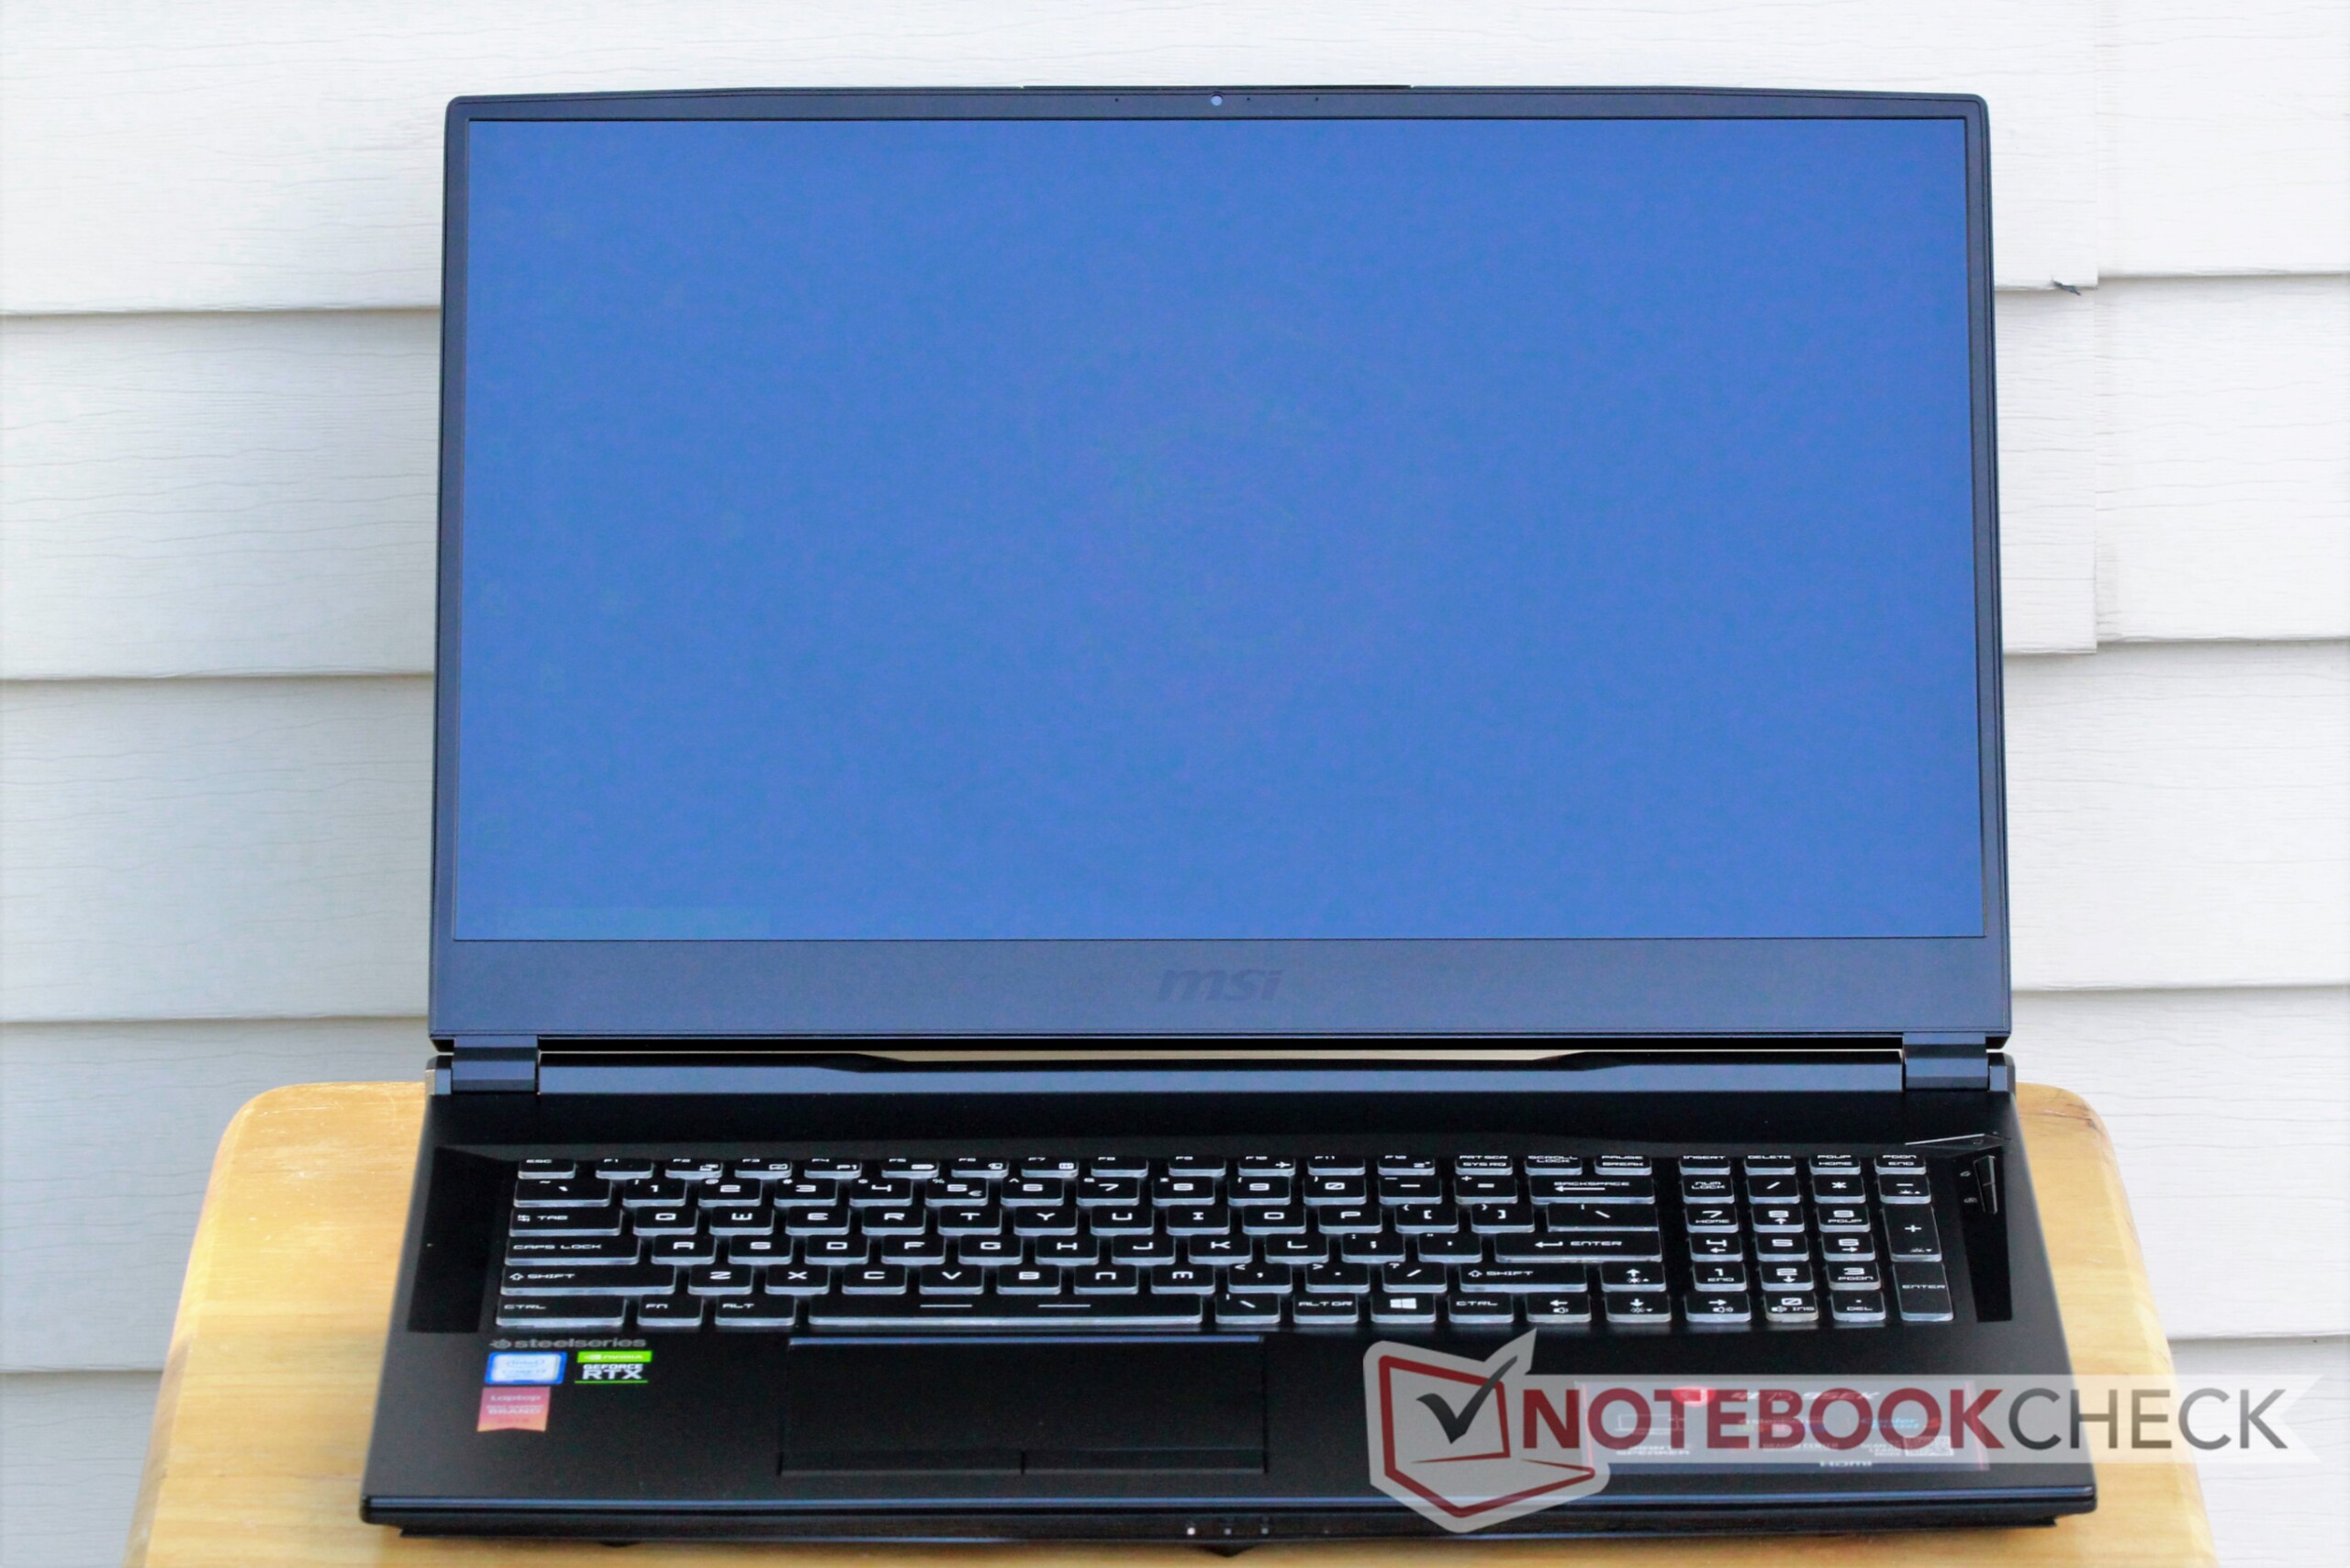
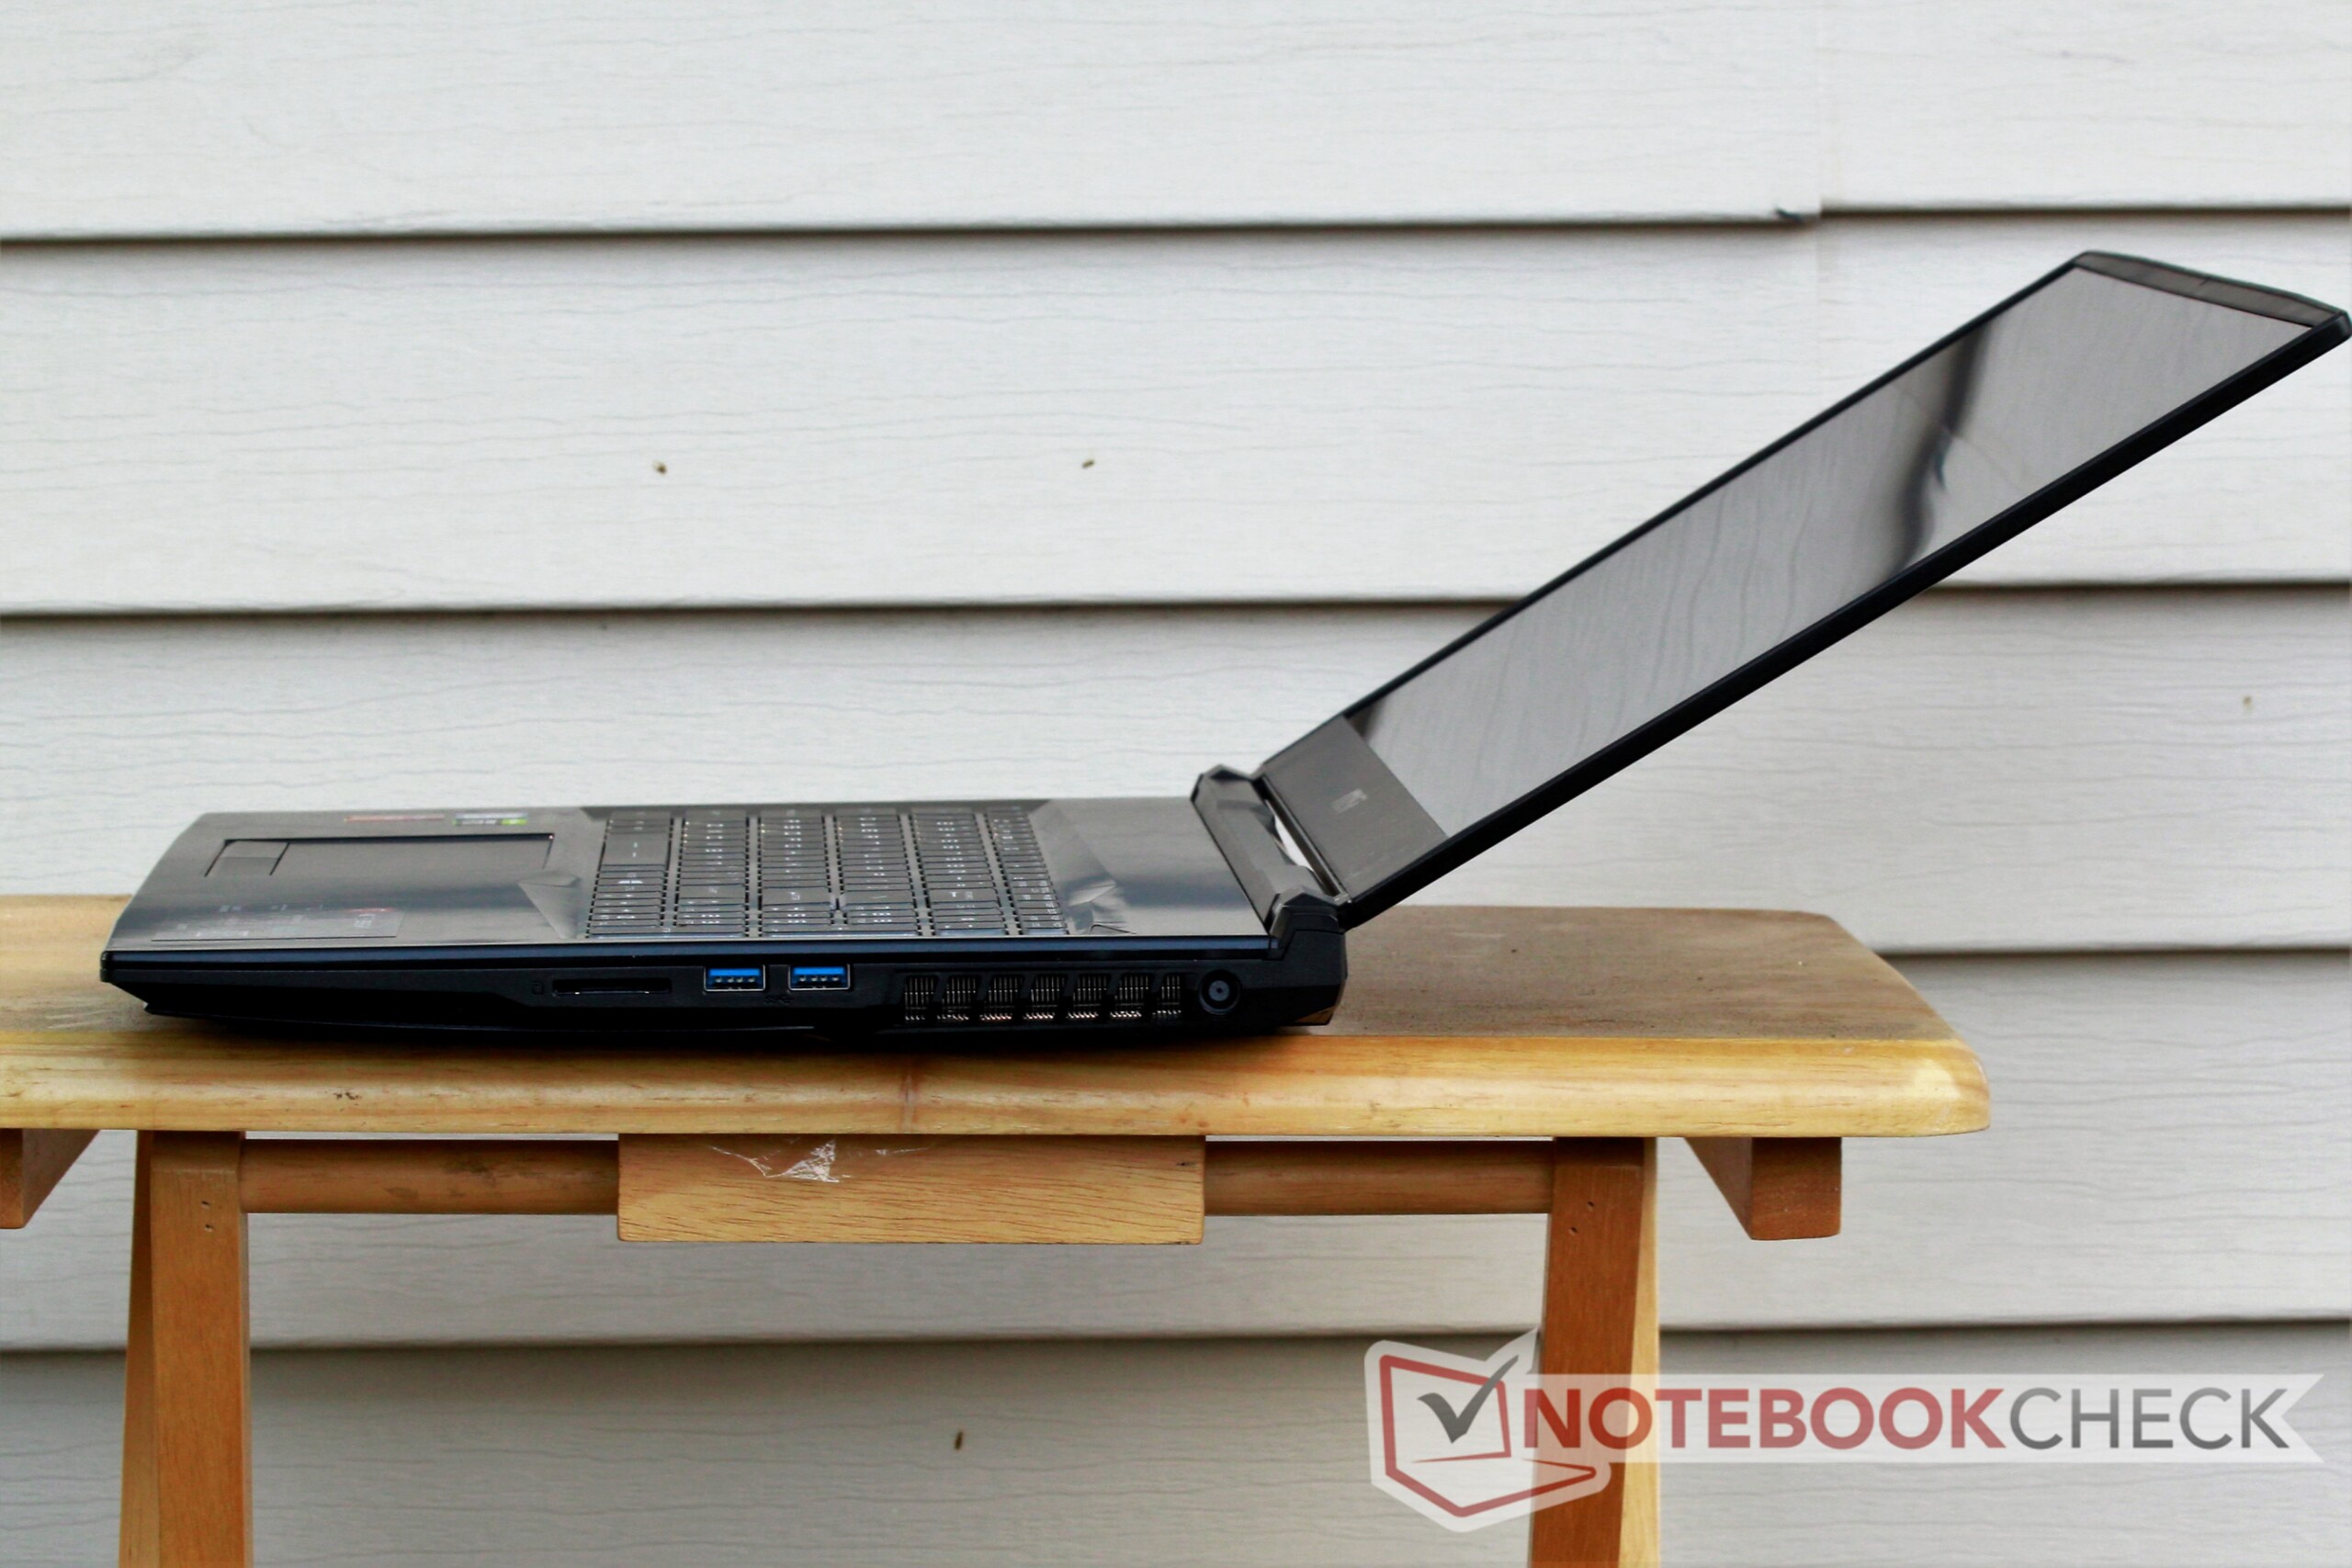
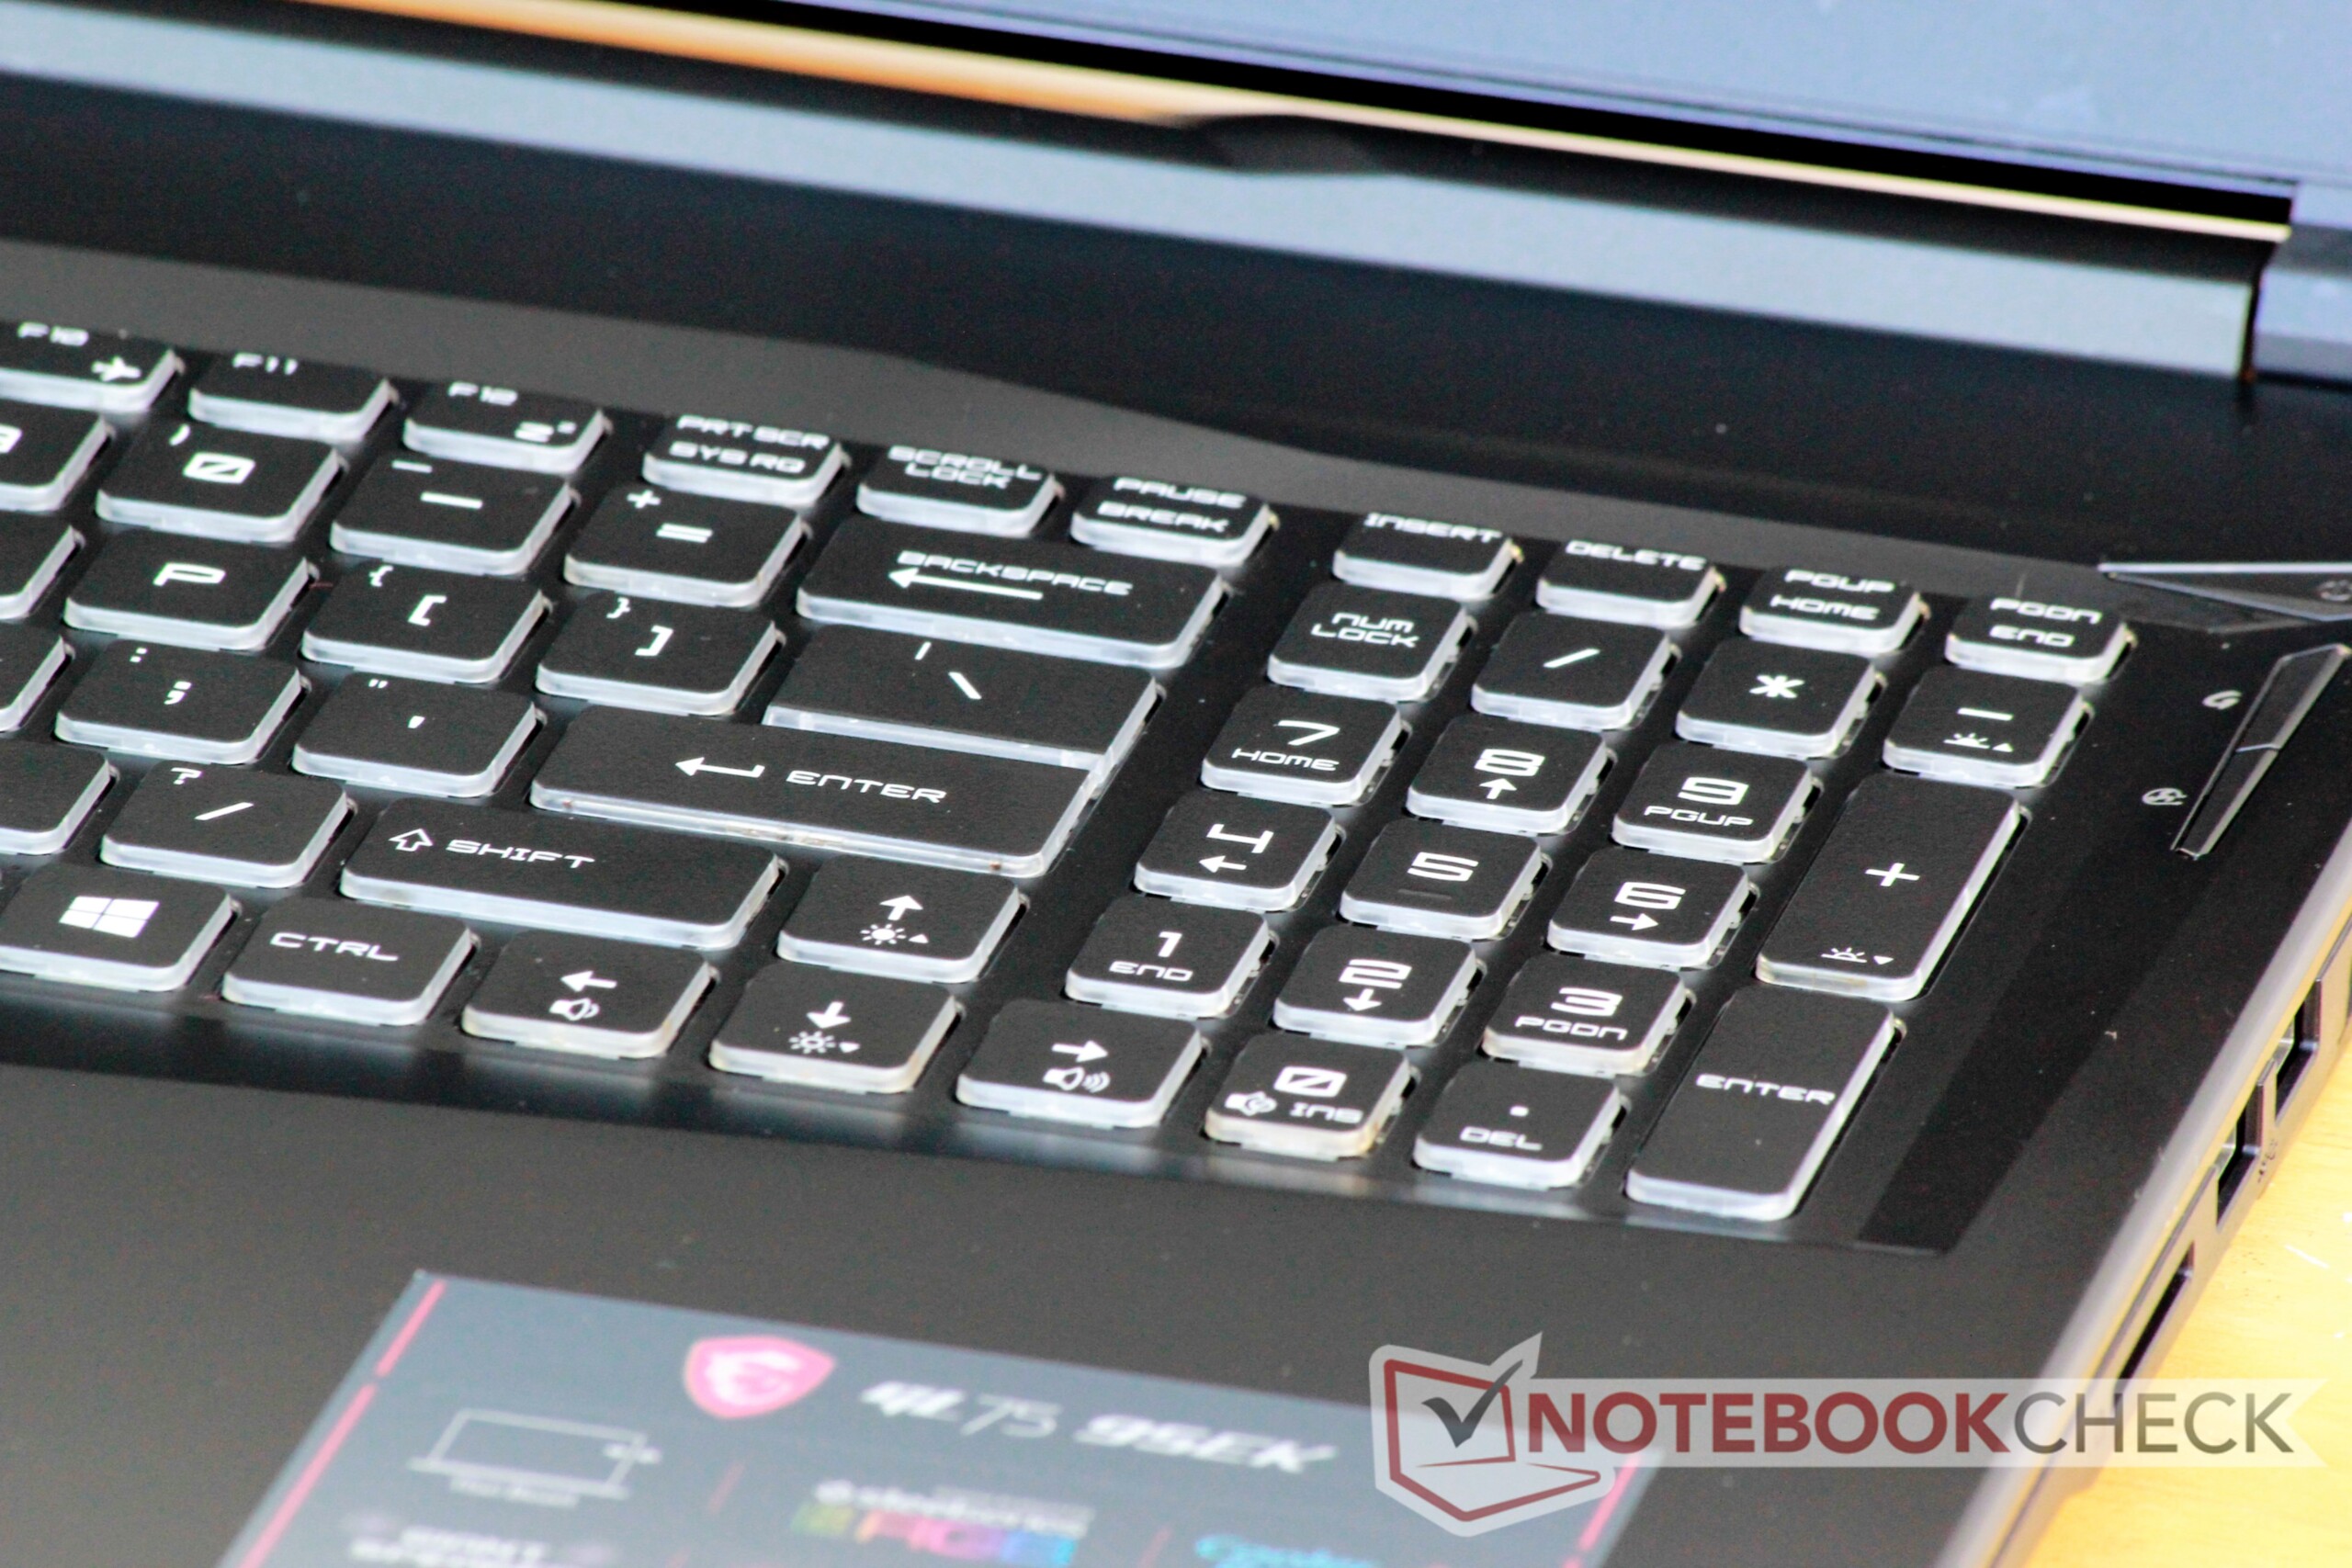
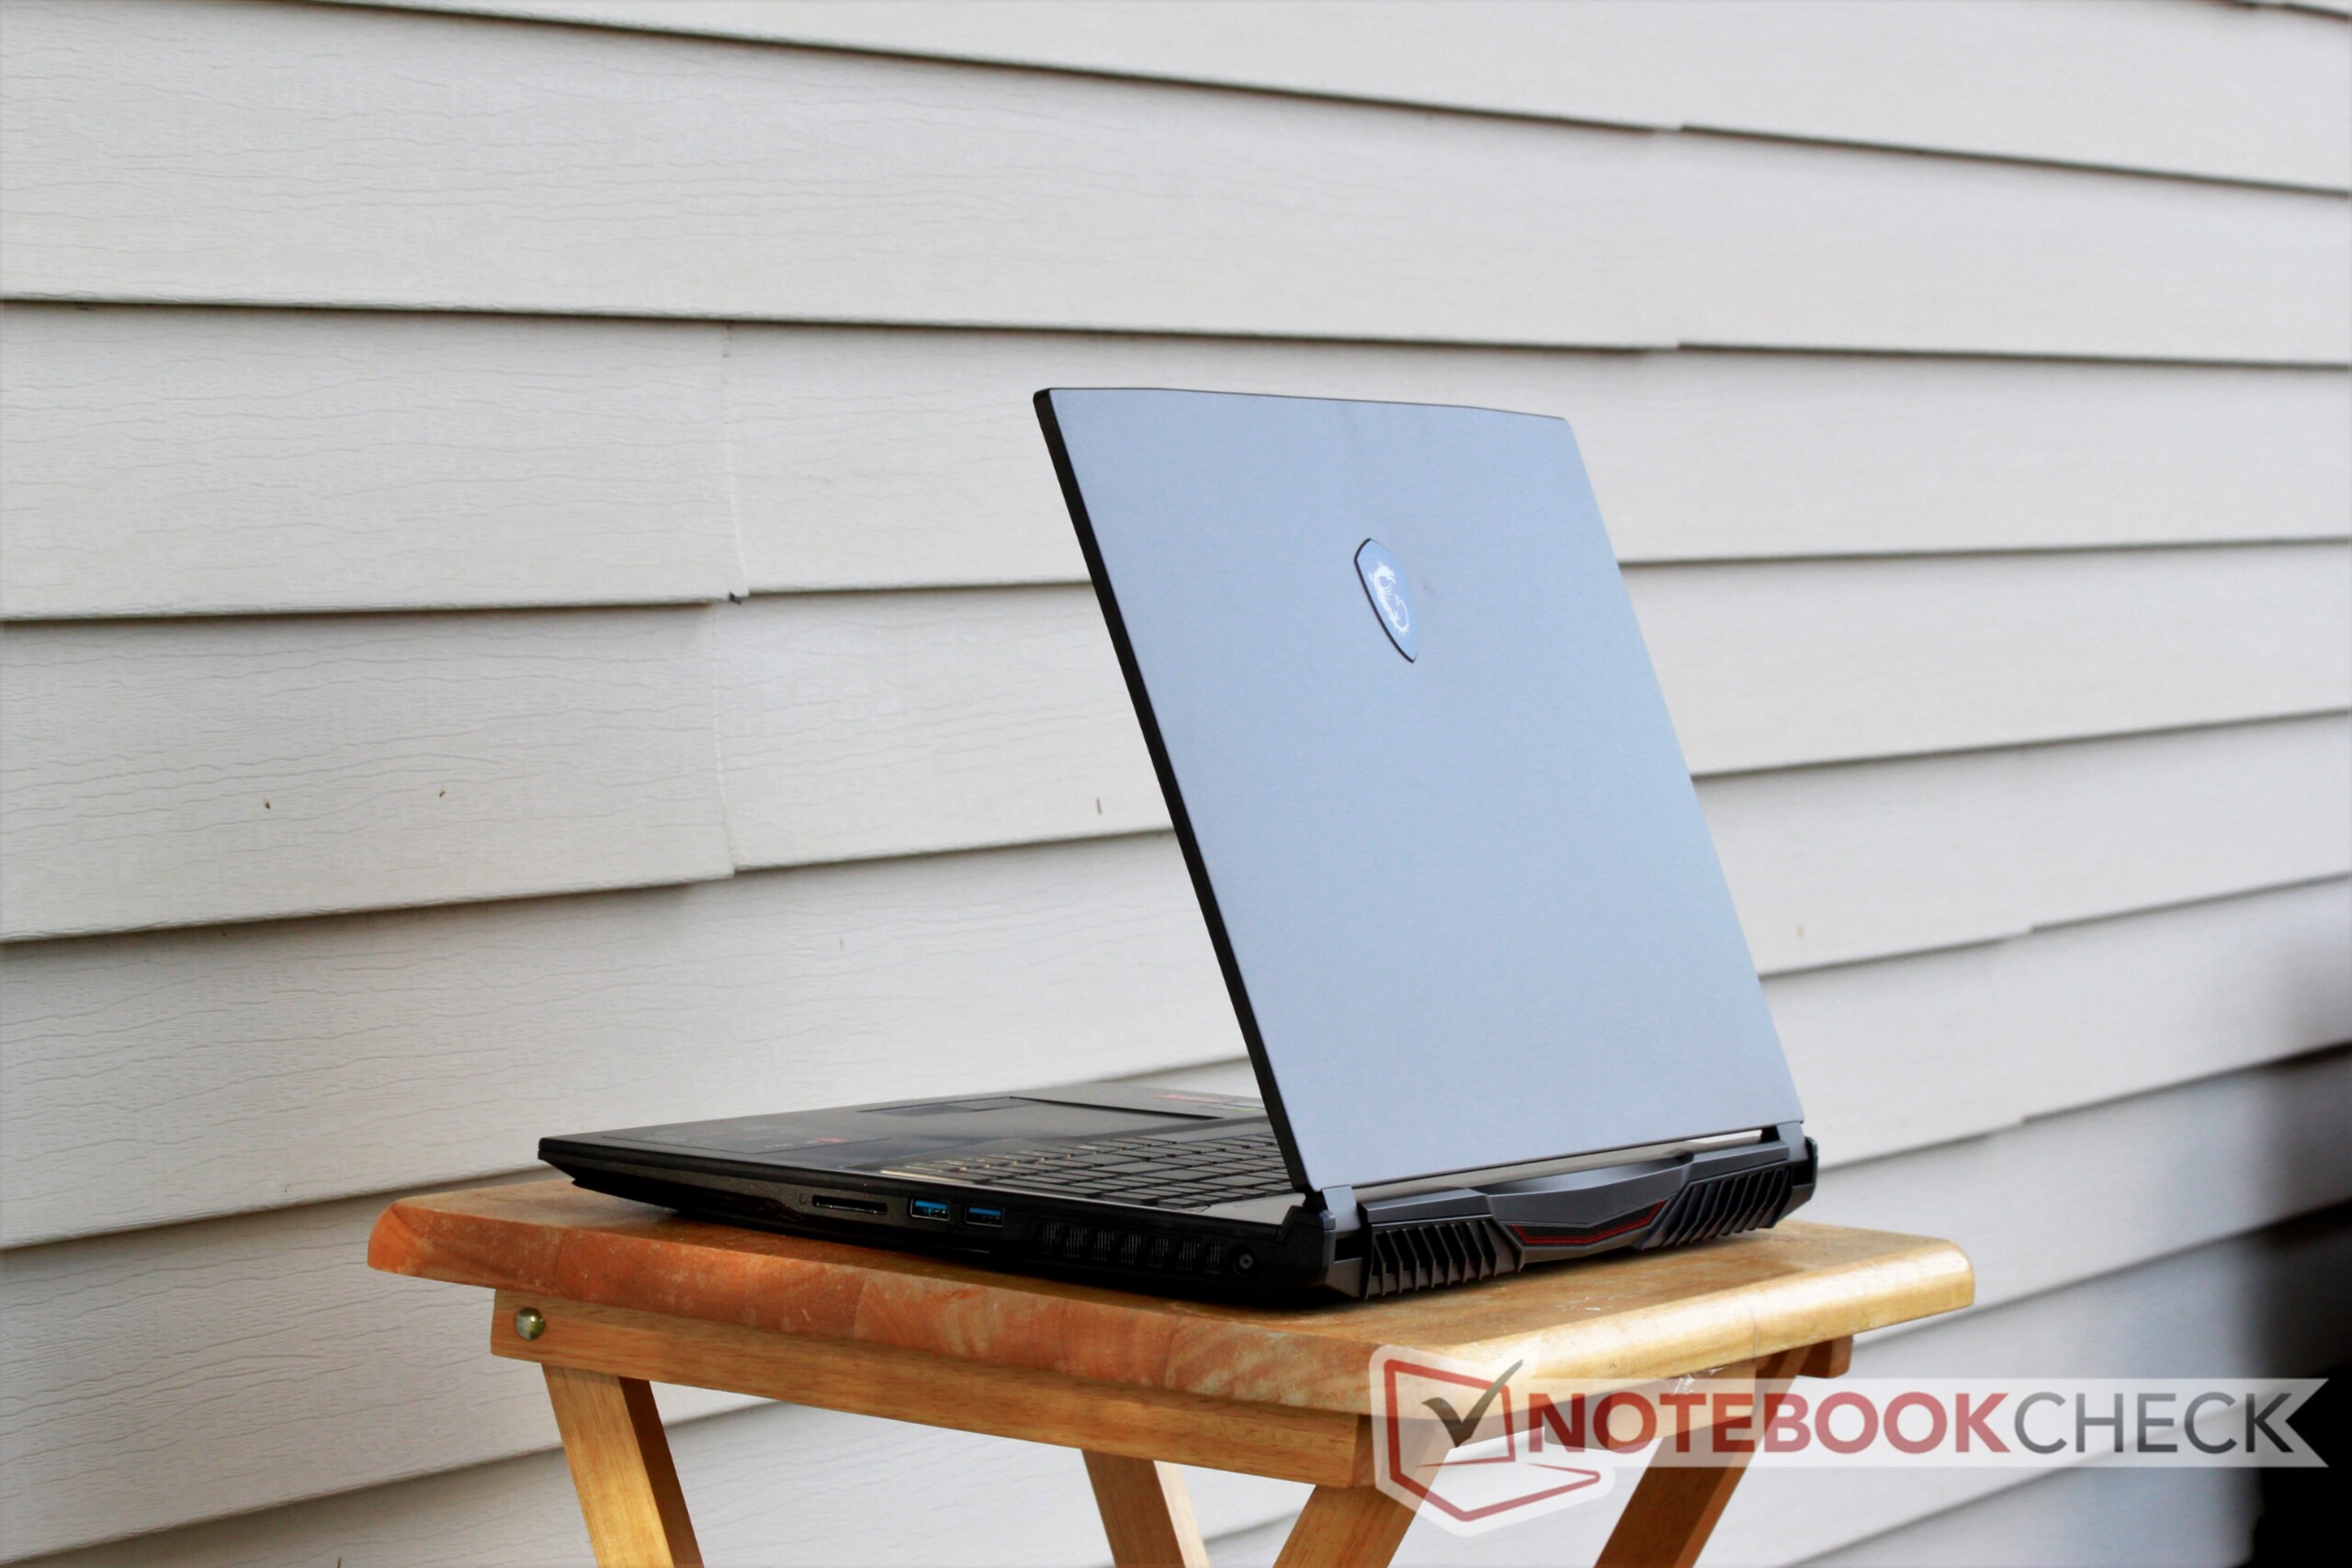
De MSI GL75 is misschien de definitie van dubbele gevoelens. Voor $1500 heeft het apparaat nogal wat leuks te bieden. De 120 Hz verversingssnelheid van het beeldschermscherm past goed bij de krachtige hardware om een geweldige FHD-gaming ervaring te bieden. Het uitstekende toetsenbord en de RGB-achtergrondverlichting per toets zijn uitstekende details voor deze prijs, en de luidsprekers maken het consumeren van media aangenaam.
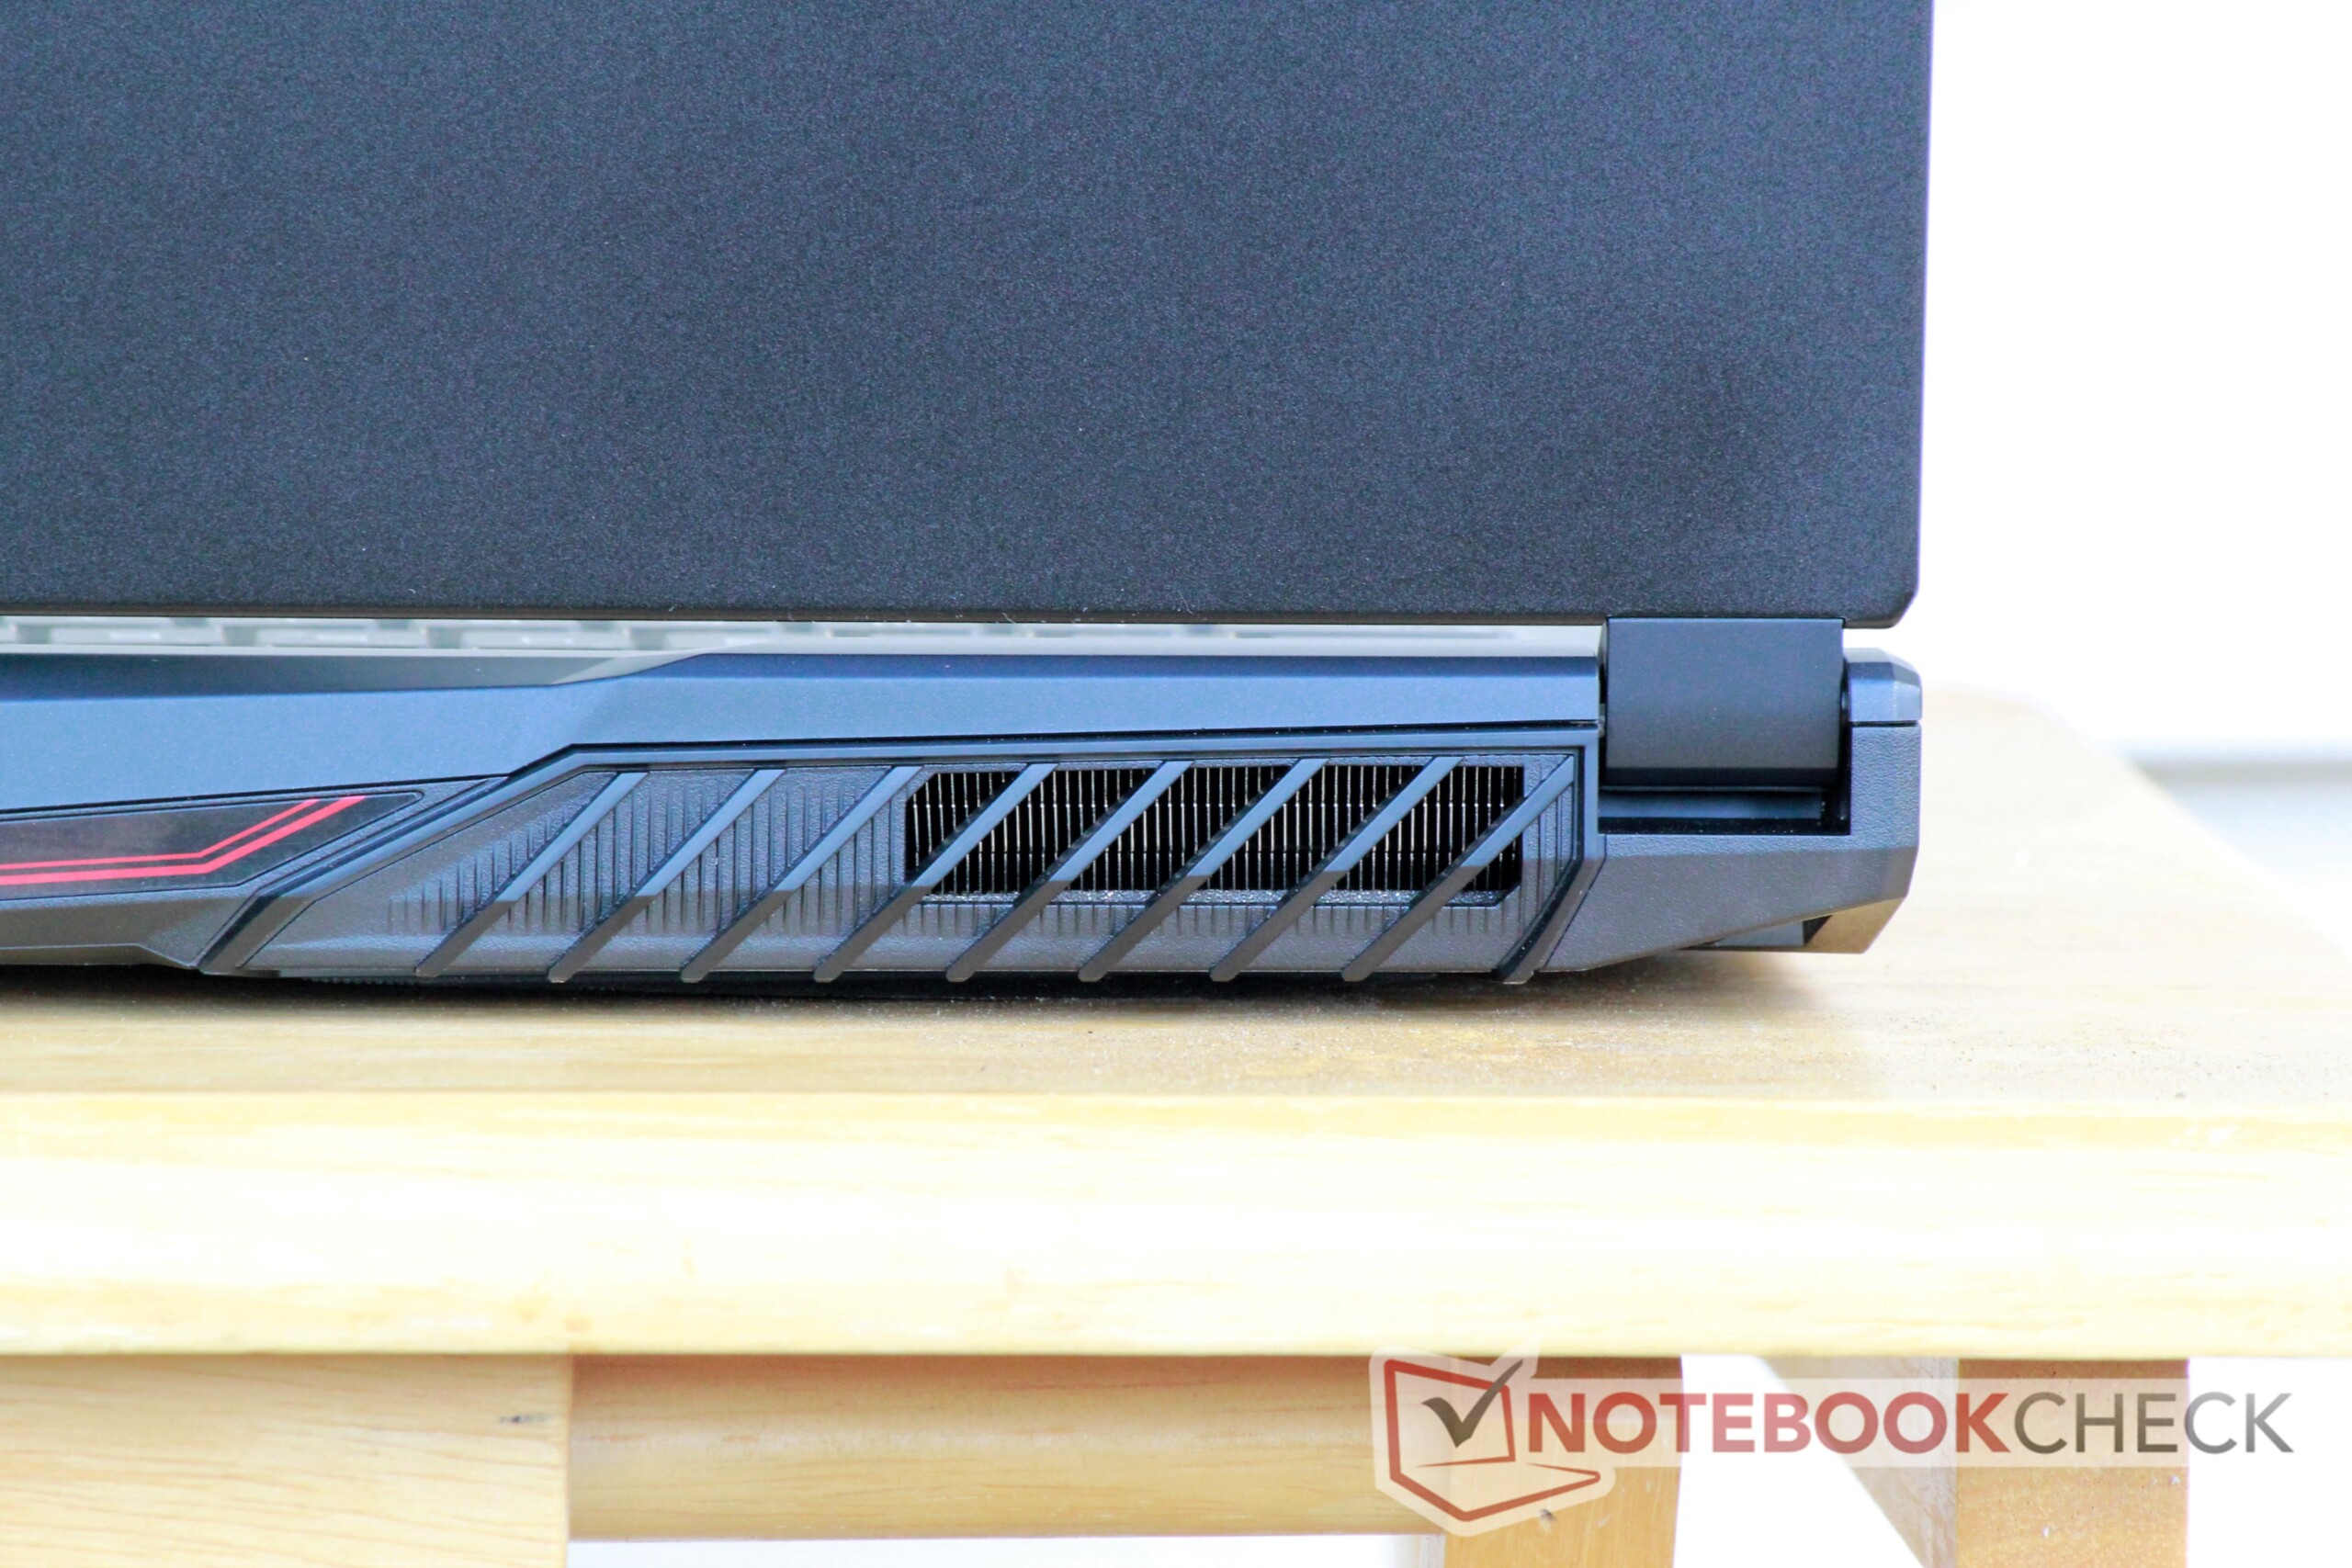
Een paar eigenschappen weerhouden de laptop echter van een toppositie. De ventilatoren maken lawaai en hotspots langs de onderkant van de behuizing maken het gebruik op schoot oncomfortabel. Verder is de achtergrondverlichting van het scherm zwak.
Vanwege deze knelpunten bevelen we potentiële kopers aan om ook naar concurrenten te kijken. De Asus ROG Strix G GL731GU biedt een veel betere bouwkwaliteit, beter warmtebeheer en meer gelijkmatige ventilatoren ten koste van iets lagere grafische prestaties. MSI's eigen GP65 Leopard biedt vergelijkbare prestaties, hetzelfde toetsenbord en een veel beter beeldscherm in een kleinere behuizing, hoewel dat apparaat ook last heeft van hotspots en luide ventilatoren. Deze twee apparaten bewijzen dat gamers voor deze prijs genoeg opties hebben, wat hun beslissing des te moeilijker maakt.
Alles bij elkaar bezorgt de GL75 ons geen "wauw". De laptop is een prima machine, maar tenzij je een 17,3-inch gaminglaptop met een goed RGB-toetsenbord en luide luidsprekers nodig hebt, zijn er betere opties verkrijgbaar.
MSI GL75 9SEK-056US
- 30-09-2019 v7 (old)
Sam Medley
Price comparison
