Kort testrapport Asus ROG Zephyrus Duo 15 GX550LXS: unieke game notebook met veel prestaties onder de motorkap
Evaluatie | Datum | Model | Gewicht | Hoogte | Formaat | Resolutie | Beste prijs |
|---|---|---|---|---|---|---|---|
| 84.5 % v7 (old) | 07-2020 | Asus ROG Zephyrus Duo 15 GX550LXS i9-10980HK, GeForce RTX 2080 Super Max-Q | 2.5 kg | 20 mm | 15.60" | 3840x2160 | |
v (old) | 04-2020 | Acer Predator Triton 500 PT515-52-70N3 i7-10750H, GeForce RTX 2080 Super Max-Q | 2.1 kg | 18 mm | 15.60" | 1920x1080 | |
| 82.8 % v7 (old) | 05-2020 | MSI GS66 Stealth 10SFS i9-10980HK, GeForce RTX 2070 Super Max-Q | 2.2 kg | 20 mm | 15.60" | 1920x1080 | |
| 85.8 % v7 (old) | 05-2020 | Gigabyte Aero 15 OLED XB-8DE51B0SP i7-10875H, GeForce RTX 2070 Super Max-Q | 2.2 kg | 20 mm | 15.60" | 3840x2160 |
| |||||||||||||||||||||||||
Helderheidsverdeling: 90 %
Helderheid in Batterij-modus: 398 cd/m²
Contrast: 1421:1 (Zwart: 0.28 cd/m²)
ΔE ColorChecker Calman: 1.53 | ∀{0.5-29.43 Ø4.71}
calibrated: 0.77
ΔE Greyscale Calman: 2.4 | ∀{0.09-98 Ø4.96}
100% sRGB (Argyll 1.6.3 3D)
100% AdobeRGB 1998 (Argyll 1.6.3 3D)
99.9% AdobeRGB 1998 (Argyll 3D)
100% sRGB (Argyll 3D)
87% Display P3 (Argyll 3D)
Gamma: 2.19
CCT: 6996 K
| Asus ROG Zephyrus Duo 15 GX550LXS AU Optronics B156ZAN03.1, IPS, 3840x2160, 15.6" | Acer Predator Triton 500 PT515-52-70N3 AUO B156HAN12.0 (AUO7A8C), IPS, 1920x1080, 15.6" | MSI GS66 Stealth 10SFS AUO B156HAN12.0 (AUO328E), IPS, 1920x1080, 15.6" | Gigabyte Aero 15 OLED XB-8DE51B0SP Samsung SDCA029, OLED, 3840x2160, 15.6" | |
|---|---|---|---|---|
| Display | -16% | -16% | 4% | |
| Display P3 Coverage (%) | 87 | 70.3 -19% | 69.5 -20% | 99.9 15% |
| sRGB Coverage (%) | 100 | 99.5 0% | 99.6 0% | 100 0% |
| AdobeRGB 1998 Coverage (%) | 99.9 | 72.2 -28% | 70.8 -29% | 98.2 -2% |
| Response Times | 66% | 68% | 95% | |
| Response Time Grey 50% / Grey 80% * (ms) | 56.4 ? | 14.4 ? 74% | 14 ? 75% | 2.2 ? 96% |
| Response Time Black / White * (ms) | 24.4 ? | 10.4 ? 57% | 9.6 ? 61% | 1.8 ? 93% |
| PWM Frequency (Hz) | 60 ? | |||
| Screen | -48% | -31% | -30% | |
| Brightness middle (cd/m²) | 398 | 320 -20% | 316 -21% | 385 -3% |
| Brightness (cd/m²) | 385 | 318 -17% | 311 -19% | 390 1% |
| Brightness Distribution (%) | 90 | 88 -2% | 92 2% | 93 3% |
| Black Level * (cd/m²) | 0.28 | 0.24 14% | 0.21 25% | |
| Contrast (:1) | 1421 | 1333 -6% | 1505 6% | |
| Colorchecker dE 2000 * | 1.53 | 4.03 -163% | 3.03 -98% | 2.46 -61% |
| Colorchecker dE 2000 max. * | 3.69 | 8.43 -128% | 7.32 -98% | 4.01 -9% |
| Colorchecker dE 2000 calibrated * | 0.77 | 0.98 -27% | 1.1 -43% | 2.6 -238% |
| Greyscale dE 2000 * | 2.4 | 5.94 -148% | 3.9 -63% | 1.39 42% |
| Gamma | 2.19 100% | 2.42 91% | 2.42 91% | 2.31 95% |
| CCT | 6996 93% | 6751 96% | 7439 87% | 6395 102% |
| Color Space (Percent of AdobeRGB 1998) (%) | 100 | 66 -34% | 65 -35% | 98 -2% |
| Color Space (Percent of sRGB) (%) | 100 | 99 -1% | 100 0% | 100 0% |
| Totaal Gemiddelde (Programma / Instellingen) | 1% /
-28% | 7% /
-16% | 23% /
-5% |
* ... kleiner is beter
Responstijd Scherm
| ↔ Responstijd Zwart naar Wit | ||
|---|---|---|
| 24.4 ms ... stijging ↗ en daling ↘ gecombineerd | ↗ 10 ms stijging | 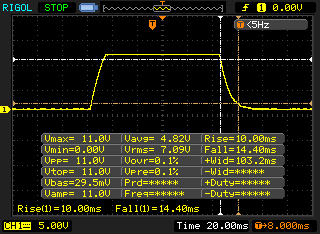 |
| ↘ 14.4 ms daling | ||
| Het scherm vertoonde prima responstijden in onze tests maar is misschien wat te traag voor competitieve games. Ter vergelijking: alle testtoestellen variëren van 0.1 (minimum) tot 240 (maximum) ms. » 58 % van alle toestellen zijn beter. Dit betekent dat de gemeten responstijd slechter is dan het gemiddelde (19.8 ms) van alle geteste toestellen. | ||
| ↔ Responstijd 50% Grijs naar 80% Grijs | ||
| 56.4 ms ... stijging ↗ en daling ↘ gecombineerd | ↗ 26.4 ms stijging | 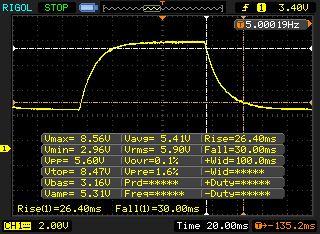 |
| ↘ 30 ms daling | ||
| Het scherm vertoonde trage responstijden in onze tests en is misschien te traag voor games. Ter vergelijking: alle testtoestellen variëren van 0.165 (minimum) tot 636 (maximum) ms. » 93 % van alle toestellen zijn beter. Dit betekent dat de gemeten responstijd slechter is dan het gemiddelde (30.9 ms) van alle geteste toestellen. | ||
Screen Flickering / PWM (Pulse-Width Modulation)
| Screen flickering / PWM niet waargenomen | 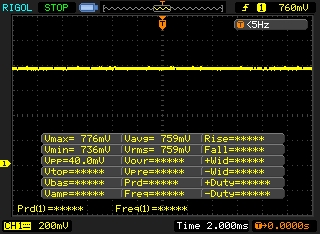 | ||
Ter vergelijking: 52 % van alle geteste toestellen maakten geen gebruik van PWM om de schermhelderheid te verlagen. Als het wel werd gebruikt, werd een gemiddelde van 7744 (minimum: 5 - maximum: 343500) Hz waargenomen. | |||

| Cinebench R15 | |
| CPU Single 64Bit | |
| Gemiddelde van klas Gaming (188.8 - 350, n=103, laatste 2 jaar) | |
| Asus ROG Zephyrus Duo 15 GX550LXS (Turbo) | |
| Gigabyte Aero 15 OLED XB-8DE51B0SP | |
| Gemiddeld Intel Core i9-10980HK (198 - 219, n=15) | |
| Asus ROG Zephyrus Duo 15 GX550LXS | |
| MSI GS66 Stealth 10SFS | |
| Acer Predator Triton 500 PT515-52-70N3 | |
| CPU Multi 64Bit | |
| Gemiddelde van klas Gaming (1578 - 6330, n=102, laatste 2 jaar) | |
| Asus ROG Zephyrus Duo 15 GX550LXS (Turbo) | |
| Gigabyte Aero 15 OLED XB-8DE51B0SP | |
| Asus ROG Zephyrus Duo 15 GX550LXS | |
| Gemiddeld Intel Core i9-10980HK (1606 - 1862, n=15) | |
| MSI GS66 Stealth 10SFS | |
| Acer Predator Triton 500 PT515-52-70N3 | |
| Blender - v2.79 BMW27 CPU | |
| Acer Predator Triton 500 PT515-52-70N3 | |
| MSI GS66 Stealth 10SFS | |
| Asus ROG Zephyrus Duo 15 GX550LXS (Turbo) | |
| Asus ROG Zephyrus Duo 15 GX550LXS | |
| Gigabyte Aero 15 OLED XB-8DE51B0SP | |
| Gemiddeld Intel Core i9-10980HK (239 - 299, n=13) | |
| Gemiddelde van klas Gaming (79 - 330, n=101, laatste 2 jaar) | |
| 7-Zip 18.03 | |
| 7z b 4 -mmt1 | |
| Gemiddelde van klas Gaming (4824 - 7436, n=102, laatste 2 jaar) | |
| Gigabyte Aero 15 OLED XB-8DE51B0SP | |
| Gemiddeld Intel Core i9-10980HK (5081 - 5542, n=13) | |
| Asus ROG Zephyrus Duo 15 GX550LXS | |
| MSI GS66 Stealth 10SFS | |
| Asus ROG Zephyrus Duo 15 GX550LXS (Turbo) | |
| Acer Predator Triton 500 PT515-52-70N3 | |
| 7z b 4 | |
| Gemiddelde van klas Gaming (33491 - 148086, n=102, laatste 2 jaar) | |
| Asus ROG Zephyrus Duo 15 GX550LXS | |
| Gigabyte Aero 15 OLED XB-8DE51B0SP | |
| Gemiddeld Intel Core i9-10980HK (43786 - 49275, n=13) | |
| Asus ROG Zephyrus Duo 15 GX550LXS (Turbo) | |
| MSI GS66 Stealth 10SFS | |
| Acer Predator Triton 500 PT515-52-70N3 | |
| HWBOT x265 Benchmark v2.2 - 4k Preset | |
| Gemiddelde van klas Gaming (11.5 - 44.4, n=102, laatste 2 jaar) | |
| Gigabyte Aero 15 OLED XB-8DE51B0SP | |
| Gemiddeld Intel Core i9-10980HK (12 - 14.6, n=13) | |
| Asus ROG Zephyrus Duo 15 GX550LXS | |
| Asus ROG Zephyrus Duo 15 GX550LXS (Turbo) | |
| MSI GS66 Stealth 10SFS | |
| Acer Predator Triton 500 PT515-52-70N3 | |
| LibreOffice - 20 Documents To PDF | |
| Asus ROG Zephyrus Duo 15 GX550LXS | |
| Gemiddeld Intel Core i9-10980HK (44 - 89, n=13) | |
| MSI GS66 Stealth 10SFS | |
| Gigabyte Aero 15 OLED XB-8DE51B0SP | |
| Acer Predator Triton 500 PT515-52-70N3 | |
| Gemiddelde van klas Gaming (33.2 - 88.8, n=102, laatste 2 jaar) | |
| Asus ROG Zephyrus Duo 15 GX550LXS (Turbo) | |
| R Benchmark 2.5 - Overall mean | |
| Acer Predator Triton 500 PT515-52-70N3 | |
| Asus ROG Zephyrus Duo 15 GX550LXS (Turbo) | |
| MSI GS66 Stealth 10SFS | |
| Asus ROG Zephyrus Duo 15 GX550LXS | |
| Gemiddeld Intel Core i9-10980HK (0.561 - 0.596, n=13) | |
| Gigabyte Aero 15 OLED XB-8DE51B0SP | |
| Gemiddelde van klas Gaming (0.3439 - 0.59, n=102, laatste 2 jaar) | |
* ... kleiner is beter
| PCMark 8 Home Score Accelerated v2 | 3821 punten | |
| PCMark 8 Creative Score Accelerated v2 | 4210 punten | |
| PCMark 8 Work Score Accelerated v2 | 4762 punten | |
| PCMark 10 Score | 5277 punten | |
Help | ||
| DPC Latencies / LatencyMon - interrupt to process latency (max), Web, Youtube, Prime95 | |
| Acer Predator Triton 500 PT515-52-70N3 | |
| Asus ROG Zephyrus Duo 15 GX550LXS | |
| MSI GS66 Stealth 10SFS | |
| Gigabyte Aero 15 OLED XB-8DE51B0SP | |
* ... kleiner is beter

| Asus ROG Zephyrus Duo 15 GX550LXS 2x Samsung PM981a MZVLB1T0HBLR (RAID 0) | Acer Predator Triton 500 PT515-52-70N3 Samsung SSD PM981a MZVLB512HBJQ | MSI GS66 Stealth 10SFS Samsung SSD PM981 MZVLB1T0HALR | Gigabyte Aero 15 OLED XB-8DE51B0SP Intel Optane Memory H10 with Solid State Storage 32GB + 512GB HBRPEKNX0202A(L/H) | Gemiddeld 2x Samsung PM981a MZVLB1T0HBLR (RAID 0) | |
|---|---|---|---|---|---|
| CrystalDiskMark 5.2 / 6 | -8% | -13% | -4% | 23% | |
| Write 4K (MB/s) | 127.6 | 131.7 3% | 131.3 3% | 127.4 0% | 175.9 ? 38% |
| Read 4K (MB/s) | 48.4 | 47.34 -2% | 45.84 -5% | 147.5 205% | 49.7 ? 3% |
| Write Seq (MB/s) | 2958 | 2884 -3% | 2370 -20% | 485.9 -84% | 4078 ? 38% |
| Read Seq (MB/s) | 2984 | 2303 -23% | 1509 -49% | 1352 -55% | 3653 ? 22% |
| Write 4K Q32T1 (MB/s) | 472.7 | 423.9 -10% | 481.5 2% | 476.5 1% | 540 ? 14% |
| Read 4K Q32T1 (MB/s) | 529 | 487.7 -8% | 560 6% | 531 0% | 456 ? -14% |
| Write Seq Q32T1 (MB/s) | 3431 | 2822 -18% | 2392 -30% | 1061 -69% | 4457 ? 30% |
| Read Seq Q32T1 (MB/s) | 3536 | 3478 -2% | 3232 -9% | 2552 -28% | 5307 ? 50% |
| AS SSD | 2% | -1% | -36% | 9% | |
| Seq Read (MB/s) | 2981 | 2767 -7% | 1065 -64% | 1200 -60% | 3515 ? 18% |
| Seq Write (MB/s) | 2783 | 2613 -6% | 2360 -15% | 836 -70% | 2878 ? 3% |
| 4K Read (MB/s) | 43.98 | 47.55 8% | 48.09 9% | 65.8 50% | 48.4 ? 10% |
| 4K Write (MB/s) | 113.9 | 98.9 -13% | 110.7 -3% | 103.8 -9% | 165.6 ? 45% |
| 4K-64 Read (MB/s) | 1519 | 1205 -21% | 1635 8% | 789 -48% | 1419 ? -7% |
| 4K-64 Write (MB/s) | 1296 | 2007 55% | 1829 41% | 929 -28% | 1348 ? 4% |
| Access Time Read * (ms) | 0.062 | 0.065 -5% | 0.071 -15% | 0.103 -66% | 0.0455 ? 27% |
| Access Time Write * (ms) | 0.033 | 0.038 -15% | 0.034 -3% | 0.045 -36% | 0.04375 ? -33% |
| Score Read (Points) | 1861 | 1529 -18% | 1790 -4% | 975 -48% | 1818 ? -2% |
| Score Write (Points) | 1688 | 2367 40% | 2176 29% | 1117 -34% | 1801 ? 7% |
| Score Total (Points) | 4492 | 4677 4% | 4950 10% | 2594 -42% | 4521 ? 1% |
| Copy ISO MB/s (MB/s) | 2438 | 2919 ? 20% | |||
| Copy Program MB/s (MB/s) | 604 | 706 ? 17% | |||
| Copy Game MB/s (MB/s) | 1404 | 1560 ? 11% | |||
| Totaal Gemiddelde (Programma / Instellingen) | -3% /
-2% | -7% /
-6% | -20% /
-22% | 16% /
14% |
* ... kleiner is beter
Continuous read performance: DiskSpd Read Loop, Queue Depth 8
| 3DMark 11 Performance | 23526 punten | |
| 3DMark Cloud Gate Standard Score | 44534 punten | |
| 3DMark Fire Strike Score | 17714 punten | |
| 3DMark Time Spy Score | 7780 punten | |
Help | ||
| 3DMark 11 - 1280x720 Performance GPU | |
| Gemiddelde van klas Gaming (21841 - 80022, n=103, laatste 2 jaar) | |
| Asus ROG Zephyrus Duo 15 GX550LXS (Turbo) | |
| Acer Predator Triton 500 PT515-52-70N3 | |
| Gemiddeld NVIDIA GeForce RTX 2080 Super Max-Q (26292 - 32995, n=10) | |
| Gigabyte Aero 15 OLED XB-8DE51B0SP | |
| Asus ROG Zephyrus Duo 15 GX550LXS | |
| MSI GS66 Stealth 10SFS | |
| 3DMark | |
| 1920x1080 Fire Strike Graphics | |
| Gemiddelde van klas Gaming (18629 - 62849, n=112, laatste 2 jaar) | |
| Asus ROG Zephyrus Duo 15 GX550LXS (Turbo) | |
| Acer Predator Triton 500 PT515-52-70N3 | |
| Gemiddeld NVIDIA GeForce RTX 2080 Super Max-Q (19655 - 23649, n=10) | |
| Gigabyte Aero 15 OLED XB-8DE51B0SP | |
| Asus ROG Zephyrus Duo 15 GX550LXS | |
| MSI GS66 Stealth 10SFS | |
| 2560x1440 Time Spy Graphics | |
| Gemiddelde van klas Gaming (6387 - 26212, n=112, laatste 2 jaar) | |
| Asus ROG Zephyrus Duo 15 GX550LXS (Turbo) | |
| Acer Predator Triton 500 PT515-52-70N3 | |
| Gemiddeld NVIDIA GeForce RTX 2080 Super Max-Q (7372 - 8979, n=11) | |
| Gigabyte Aero 15 OLED XB-8DE51B0SP | |
| Asus ROG Zephyrus Duo 15 GX550LXS | |
| MSI GS66 Stealth 10SFS | |
| The Witcher 3 - 1920x1080 Ultra Graphics & Postprocessing (HBAO+) | |
| Gemiddelde van klas Gaming (104.7 - 240, n=7, laatste 2 jaar) | |
| Asus ROG Zephyrus Duo 15 GX550LXS (Turbo) | |
| Gemiddeld NVIDIA GeForce RTX 2080 Super Max-Q (74.3 - 96, n=11) | |
| Acer Predator Triton 500 PT515-52-70N3 | |
| Gigabyte Aero 15 OLED XB-8DE51B0SP | |
| Asus ROG Zephyrus Duo 15 GX550LXS | |
| MSI GS66 Stealth 10SFS | |
| BioShock Infinite - 1920x1080 Ultra Preset, DX11 (DDOF) | |
| Asus ROG Zephyrus Duo 15 GX550LXS (Turbo) | |
| Gemiddeld NVIDIA GeForce RTX 2080 Super Max-Q (170.2 - 181.1, n=4) | |
| Asus ROG Zephyrus Duo 15 GX550LXS | |
| Doom Eternal - 1920x1080 Ultra Preset | |
| Asus ROG Zephyrus Duo 15 GX550LXS (Turbo) | |
| Gemiddeld NVIDIA GeForce RTX 2080 Super Max-Q (140 - 177.7, n=8) | |
| Asus ROG Zephyrus Duo 15 GX550LXS | |
| Acer Predator Triton 500 PT515-52-70N3 | |
| MSI GS66 Stealth 10SFS | |
| Red Dead Redemption 2 - 1920x1080 Maximum Settings | |
| Asus ROG Zephyrus Duo 15 GX550LXS | |
| Acer Predator Triton 500 PT515-52-70N3 | |
| Gemiddeld NVIDIA GeForce RTX 2080 Super Max-Q (40.6 - 45, n=5) | |
| Gigabyte Aero 15 OLED XB-8DE51B0SP | |
| Call of Duty Modern Warfare 2019 - 1920x1080 Maximum Settings AA:T2X Filmic SM | |
| Acer Predator Triton 500 PT515-52-70N3 | |
| Gemiddeld NVIDIA GeForce RTX 2080 Super Max-Q (91.2 - 107, n=4) | |
| Asus ROG Zephyrus Duo 15 GX550LXS | |
| Far Cry 5 - 1920x1080 Ultra Preset AA:T | |
| Gemiddelde van klas Gaming (70 - 151, n=6, laatste 2 jaar) | |
| Asus ROG Zephyrus Duo 15 GX550LXS | |
| Gemiddeld NVIDIA GeForce RTX 2080 Super Max-Q (91 - 110, n=4) | |
| Shadow of the Tomb Raider - 1920x1080 Highest Preset AA:T | |
| Gemiddelde van klas Gaming (96 - 116, n=2, laatste 2 jaar) | |
| Gigabyte Aero 15 OLED XB-8DE51B0SP | |
| Acer Predator Triton 500 PT515-52-70N3 | |
| Gemiddeld NVIDIA GeForce RTX 2080 Super Max-Q (89 - 106, n=10) | |
| MSI GS66 Stealth 10SFS | |
| Asus ROG Zephyrus Duo 15 GX550LXS (Turbo) | |
| Asus ROG Zephyrus Duo 15 GX550LXS | |
| lage | gem. | hoge | ultra | QHD | 4K | |
|---|---|---|---|---|---|---|
| BioShock Infinite (2013) | 425.1 | 349.2 | 324.2 | 173.1 | ||
| The Witcher 3 (2015) | 330.5 | 237 | 143.4 | 75.8 | 53.5 | |
| Far Cry 5 (2018) | 143 | 115 | 108 | 102 | 77 | 42 |
| Shadow of the Tomb Raider (2018) | 103 | 95 | 93 | 89 | 67 | 36 |
| Total War: Three Kingdoms (2019) | 245.5 | 136.4 | 86.5 | 62.5 | 39.9 | 19.6 |
| Ghost Recon Breakpoint (2019) | 128 | 93 | 87 | 65 | 49 | 29 |
| Call of Duty Modern Warfare 2019 (2019) | 172.3 | 123.6 | 104.3 | 91.2 | 64.7 | 36.3 |
| Red Dead Redemption 2 (2019) | 131.4 | 99.7 | 68.3 | 44.9 | 36.2 | 23.5 |
| Doom Eternal (2020) | 205 | 168.3 | 154 | 152.1 | 116.7 | 64 |
| Gears Tactics (2020) | 210.4 | 161.2 | 110.6 | 89.7 | 57.9 | 30.3 |
| F1 2020 (2020) | 253 | 167 | 149 | 118 | 89 | 51 |
Geluidsniveau
| Onbelast |
| 33 / 34 / 35 dB (A) |
| Belasting |
| 48 / 49 dB (A) |
 | ||
30 dB stil 40 dB(A) hoorbaar 50 dB(A) luid |
||
min: | ||
| Asus ROG Zephyrus Duo 15 GX550LXS i9-10980HK, GeForce RTX 2080 Super Max-Q | Acer Predator Triton 500 PT515-52-70N3 i7-10750H, GeForce RTX 2080 Super Max-Q | MSI GS66 Stealth 10SFS i9-10980HK, GeForce RTX 2070 Super Max-Q | Gigabyte Aero 15 OLED XB-8DE51B0SP i7-10875H, GeForce RTX 2070 Super Max-Q | Gemiddeld NVIDIA GeForce RTX 2080 Super Max-Q | Gemiddelde van klas Gaming | |
|---|---|---|---|---|---|---|
| Noise | 0% | -4% | -5% | 4% | 12% | |
| uit / omgeving * (dB) | 30 | 30 -0% | 30 -0% | 30 -0% | 27.9 ? 7% | 24.1 ? 20% |
| Idle Minimum * (dB) | 33 | 30 9% | 32 3% | 34 -3% | 29.7 ? 10% | 25.9 ? 22% |
| Idle Average * (dB) | 34 | 33 3% | 34 -0% | 36 -6% | 30.8 ? 9% | 27.4 ? 19% |
| Idle Maximum * (dB) | 35 | 36 -3% | 39 -11% | 41 -17% | 35.4 ? -1% | 30.1 ? 14% |
| Load Average * (dB) | 48 | 50 -4% | 53 -10% | 48 -0% | 47.2 ? 2% | 43.7 ? 9% |
| Witcher 3 ultra * (dB) | 48 | 48 -0% | 48 -0% | 48 -0% | ||
| Load Maximum * (dB) | 49 | 50 -2% | 53 -8% | 54 -10% | 49.6 ? -1% | 54.3 ? -11% |
* ... kleiner is beter
(±) De maximumtemperatuur aan de bovenzijde bedraagt 43 °C / 109 F, vergeleken met het gemiddelde van 40.4 °C / 105 F, variërend van 21.2 tot 68.8 °C voor de klasse Gaming.
(-) De bodem warmt op tot een maximum van 53 °C / 127 F, vergeleken met een gemiddelde van 43.2 °C / 110 F
(+) Bij onbelast gebruik bedraagt de gemiddelde temperatuur voor de bovenzijde 29.4 °C / 85 F, vergeleken met het apparaatgemiddelde van 33.9 °C / 93 F.
(-) Bij het spelen van The Witcher 3 is de gemiddelde temperatuur voor de bovenzijde 40.1 °C / 104 F, vergeleken met het apparaatgemiddelde van 33.9 °C / 93 F.
(-) De palmsteunen en het touchpad kunnen zeer heet aanvoelen met een maximum van ###max## °C / 111.2 F.
(-) De gemiddelde temperatuur van de handpalmsteun van soortgelijke toestellen bedroeg 28.8 °C / 83.8 F (-15.2 °C / -27.4 F).
| Asus ROG Zephyrus Duo 15 GX550LXS i9-10980HK, GeForce RTX 2080 Super Max-Q | Acer Predator Triton 500 PT515-52-70N3 i7-10750H, GeForce RTX 2080 Super Max-Q | MSI GS66 Stealth 10SFS i9-10980HK, GeForce RTX 2070 Super Max-Q | Gigabyte Aero 15 OLED XB-8DE51B0SP i7-10875H, GeForce RTX 2070 Super Max-Q | Gemiddeld NVIDIA GeForce RTX 2080 Super Max-Q | Gemiddelde van klas Gaming | |
|---|---|---|---|---|---|---|
| Heat | 3% | -2% | -2% | -1% | -1% | |
| Maximum Upper Side * (°C) | 43 | 44 -2% | 53 -23% | 49 -14% | 47.9 ? -11% | 45.1 ? -5% |
| Maximum Bottom * (°C) | 53 | 50 6% | 55 -4% | 61 -15% | 51.9 ? 2% | 48.1 ? 9% |
| Idle Upper Side * (°C) | 32 | 29 9% | 28 12% | 27 16% | 30 ? 6% | 31 ? 3% |
| Idle Bottom * (°C) | 31 | 31 -0% | 29 6% | 29 6% | 31 ? -0% | 34.2 ? -10% |
* ... kleiner is beter
Asus ROG Zephyrus Duo 15 GX550LXS audioanalyse
(+) | luidsprekers kunnen relatief luid spelen (87 dB)
Bas 100 - 315 Hz
(-) | bijna geen lage tonen - gemiddeld 15.2% lager dan de mediaan
(+) | de lage tonen zijn lineair (6.2% delta naar de vorige frequentie)
Midden 400 - 2000 Hz
(+) | evenwichtige middens - slechts 3.8% verwijderd van de mediaan
(+) | de middentonen zijn lineair (5.2% delta ten opzichte van de vorige frequentie)
Hoog 2 - 16 kHz
(±) | higher highs - on average 5.6% higher than median
(+) | de hoge tonen zijn lineair (4.5% delta naar de vorige frequentie)
Algemeen 100 - 16.000 Hz
(+) | het totale geluid is lineair (14.5% verschil met de mediaan)
Vergeleken met dezelfde klasse
» 27% van alle geteste apparaten in deze klasse waren beter, 7% vergelijkbaar, 66% slechter
» De beste had een delta van 6%, het gemiddelde was 18%, de slechtste was 132%
Vergeleken met alle geteste toestellen
» 18% van alle geteste apparaten waren beter, 4% gelijk, 77% slechter
» De beste had een delta van 4%, het gemiddelde was 23%, de slechtste was 134%
| Uit / Standby | |
| Inactief | |
| Belasting |
|
Key:
min: | |
| Asus ROG Zephyrus Duo 15 GX550LXS i9-10980HK, GeForce RTX 2080 Super Max-Q | Acer Predator Triton 500 PT515-52-70N3 i7-10750H, GeForce RTX 2080 Super Max-Q | MSI GS66 Stealth 10SFS i9-10980HK, GeForce RTX 2070 Super Max-Q | Gigabyte Aero 15 OLED XB-8DE51B0SP i7-10875H, GeForce RTX 2070 Super Max-Q | Gemiddeld NVIDIA GeForce RTX 2080 Super Max-Q | Gemiddelde van klas Gaming | |
|---|---|---|---|---|---|---|
| Power Consumption | 31% | 23% | 10% | 28% | 24% | |
| Idle Minimum * (Watt) | 23 | 11 52% | 13 43% | 18 22% | 12.9 ? 44% | 13.1 ? 43% |
| Idle Average * (Watt) | 30 | 15 50% | 16 47% | 21 30% | 17.3 ? 42% | 19 ? 37% |
| Idle Maximum * (Watt) | 39 | 25 36% | 27 31% | 38 3% | 26.9 ? 31% | 24.6 ? 37% |
| Load Average * (Watt) | 156 | 95 39% | 109 30% | 113 28% | 123.9 ? 21% | 111.3 ? 29% |
| Witcher 3 ultra * (Watt) | 152 | 140 8% | 155 -2% | 149 2% | ||
| Load Maximum * (Watt) | 208 | 211 -1% | 236 -13% | 256 -23% | 205 ? 1% | 260 ? -25% |
* ... kleiner is beter
| Asus ROG Zephyrus Duo 15 GX550LXS i9-10980HK, GeForce RTX 2080 Super Max-Q, 90 Wh | Acer Predator Triton 500 PT515-52-70N3 i7-10750H, GeForce RTX 2080 Super Max-Q, 84 Wh | MSI GS66 Stealth 10SFS i9-10980HK, GeForce RTX 2070 Super Max-Q, 99.99 Wh | Gigabyte Aero 15 OLED XB-8DE51B0SP i7-10875H, GeForce RTX 2070 Super Max-Q, 94.2 Wh | Gemiddelde van klas Gaming | |
|---|---|---|---|---|---|
| Batterijduur | 38% | 48% | 79% | 51% | |
| Reader / Idle (h) | 8 | 8.3 4% | 8.4 5% | 8.6 8% | 7.84 ? -2% |
| H.264 (h) | 5.4 | 8.27 ? 53% | |||
| WiFi v1.3 (h) | 3.1 | 6.3 103% | 6.1 97% | 6.1 97% | 7.08 ? 128% |
| Load (h) | 1.2 | 1.3 8% | 1.7 42% | 2.8 133% | 1.496 ? 25% |
Pro
Contra
Voor het volledige, Engelse testrapport, klik hier.
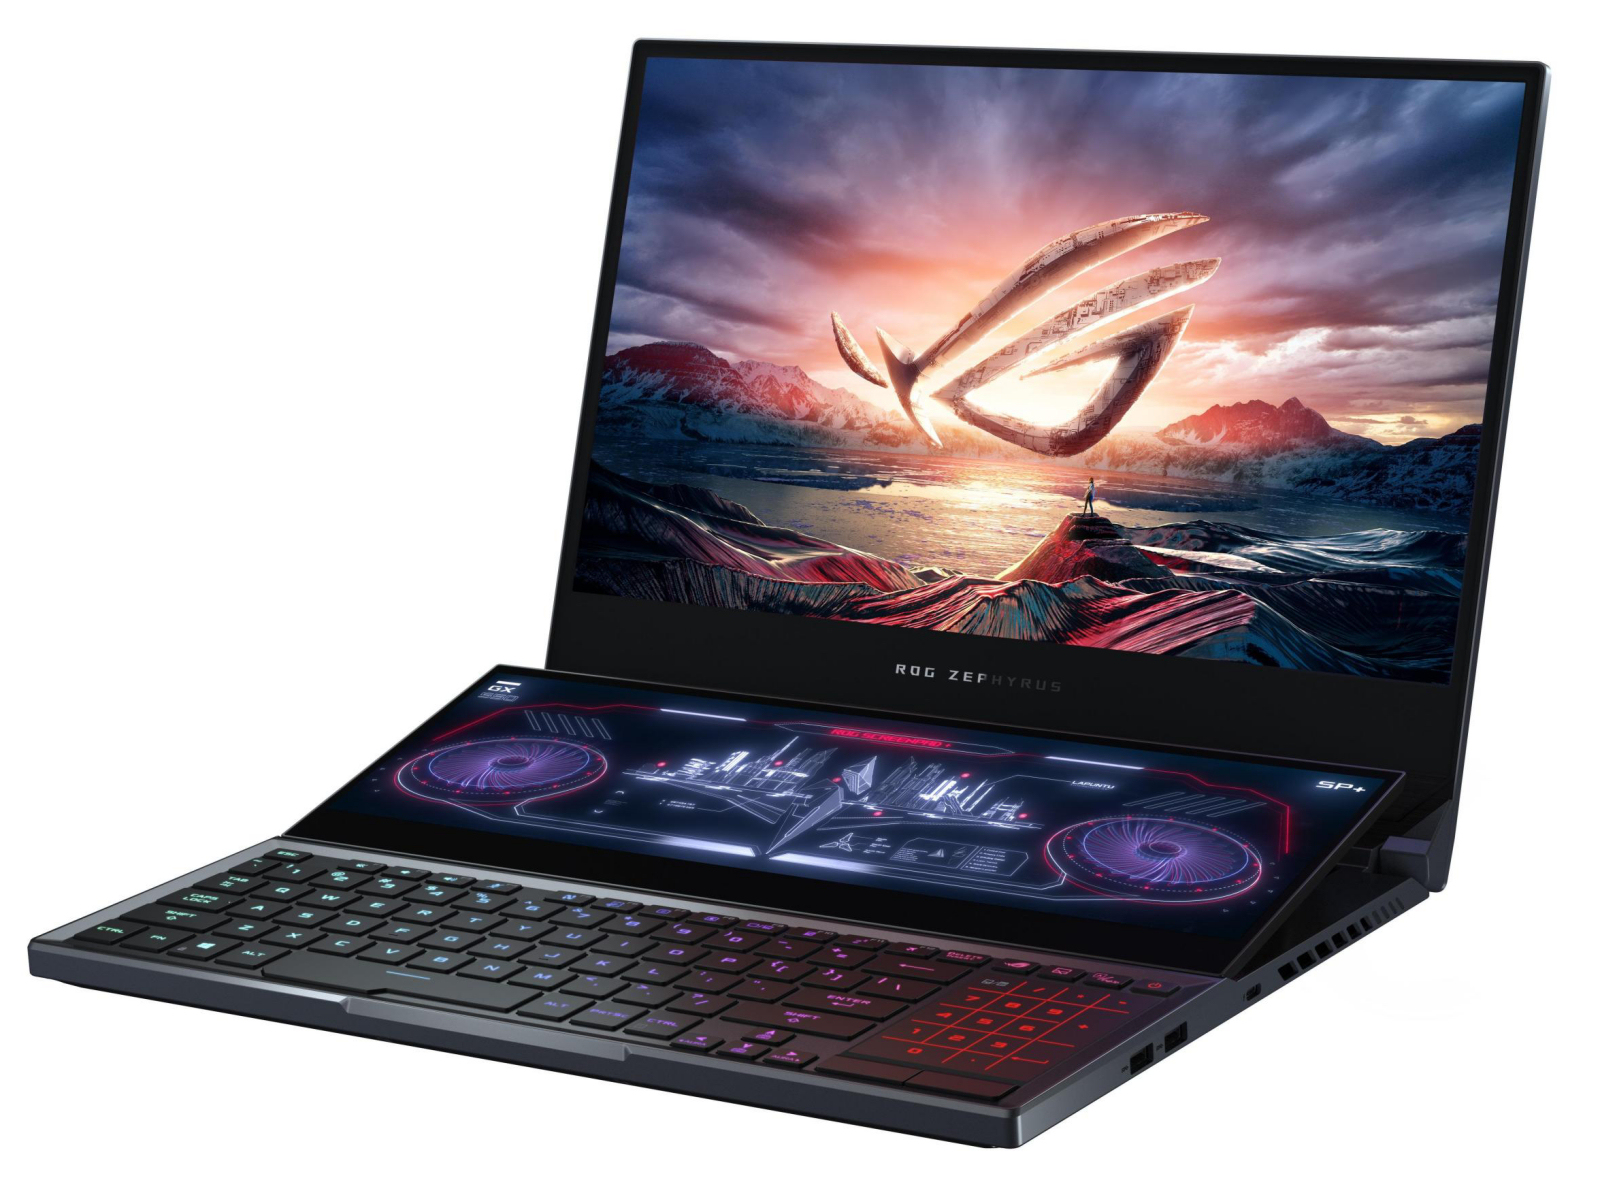
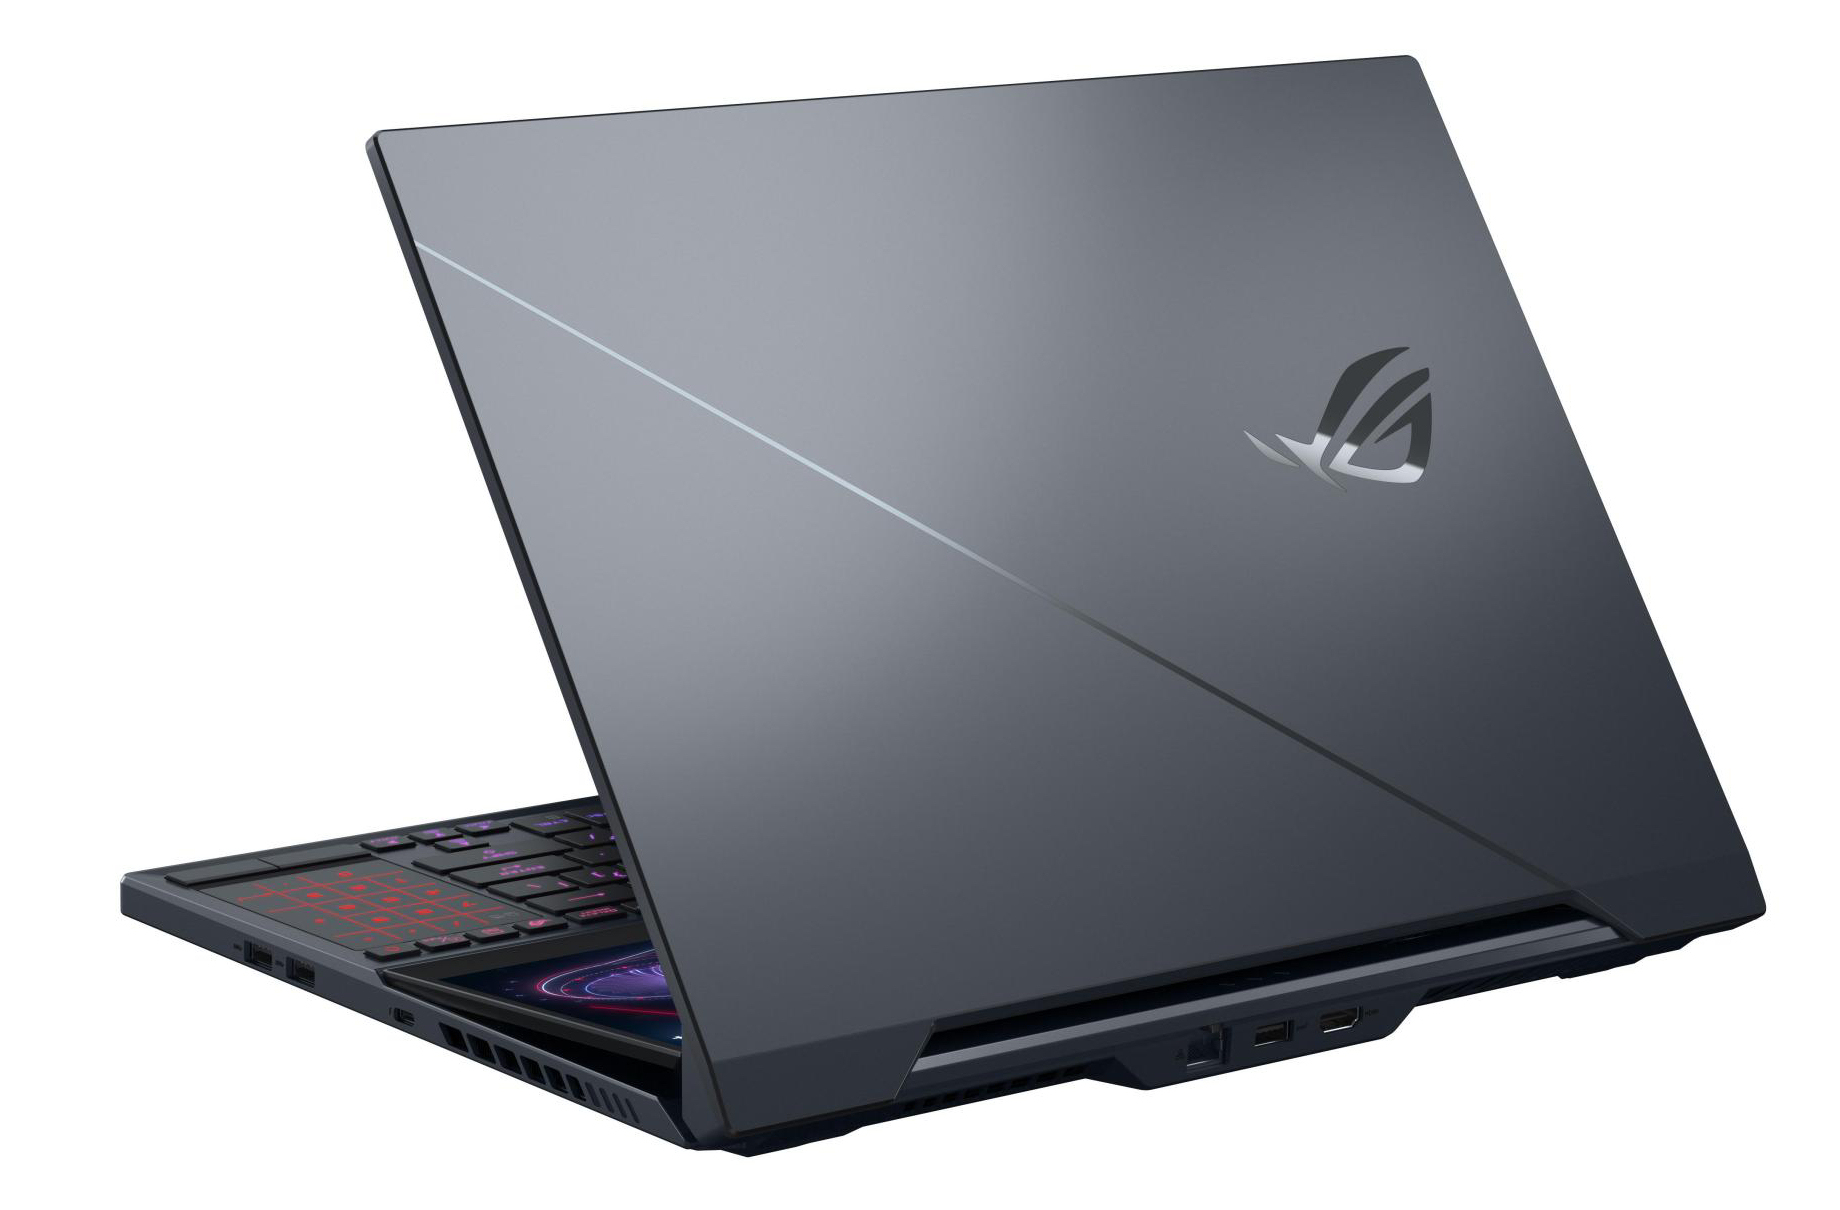
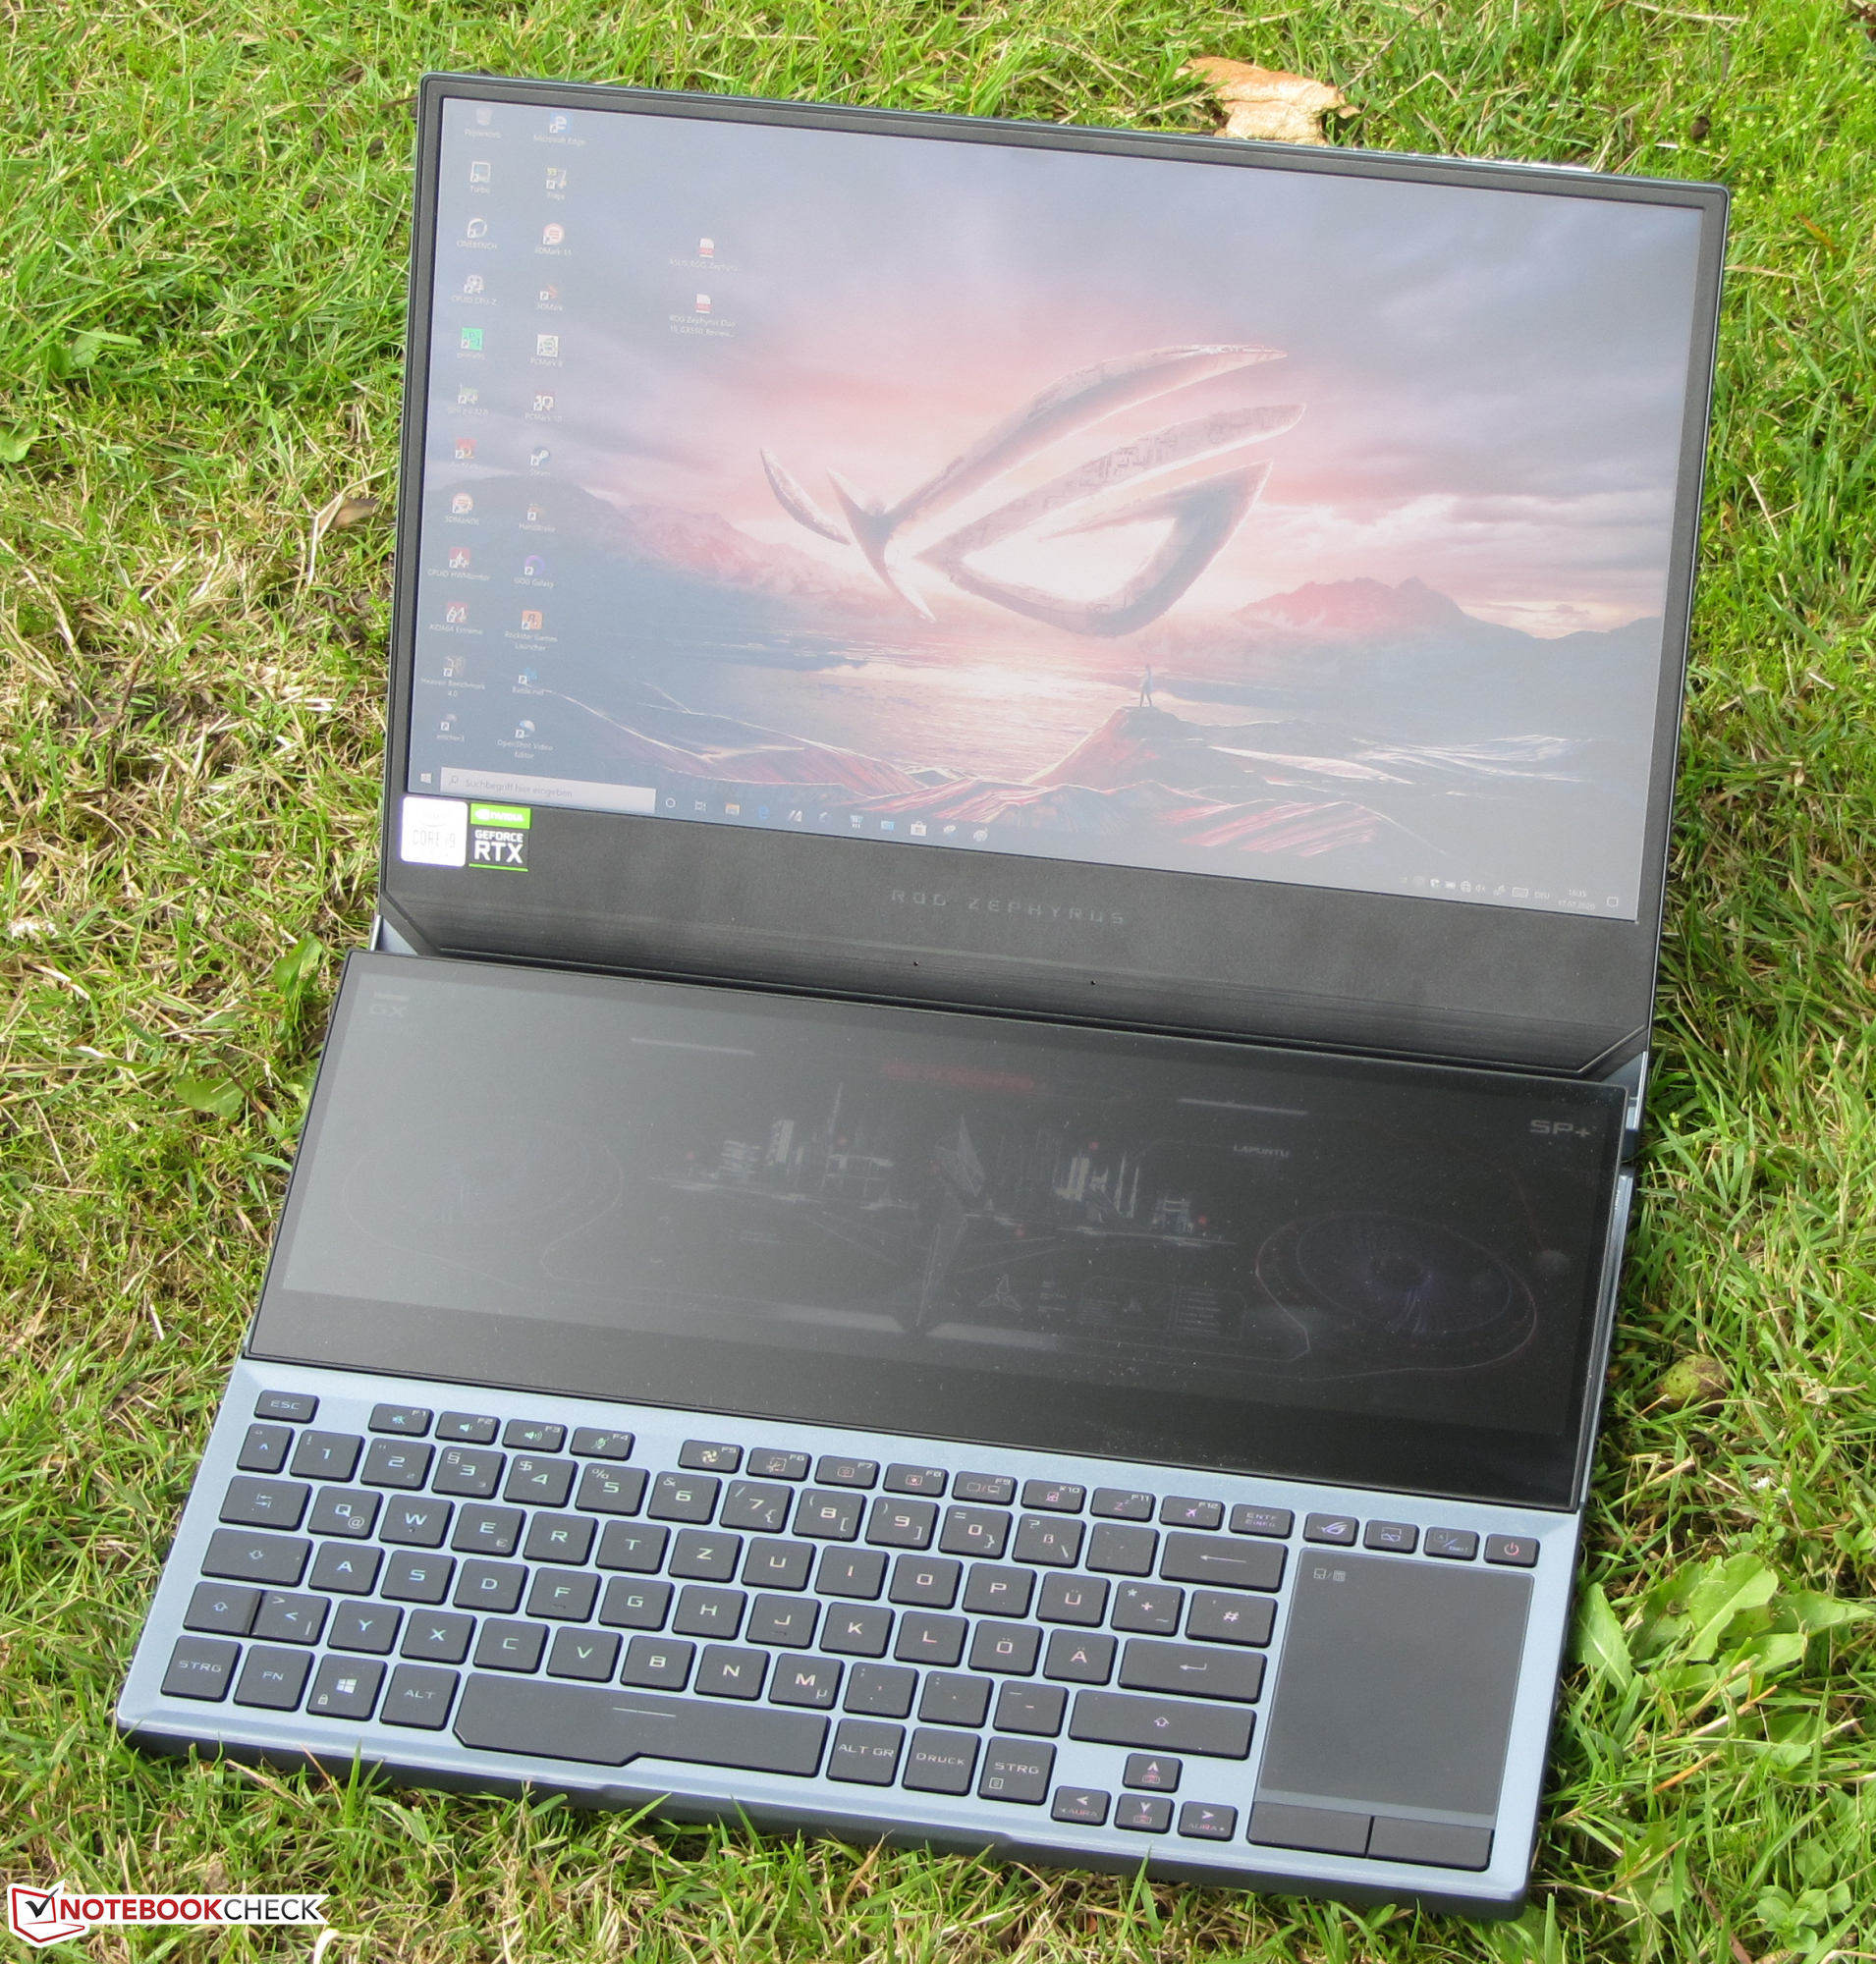
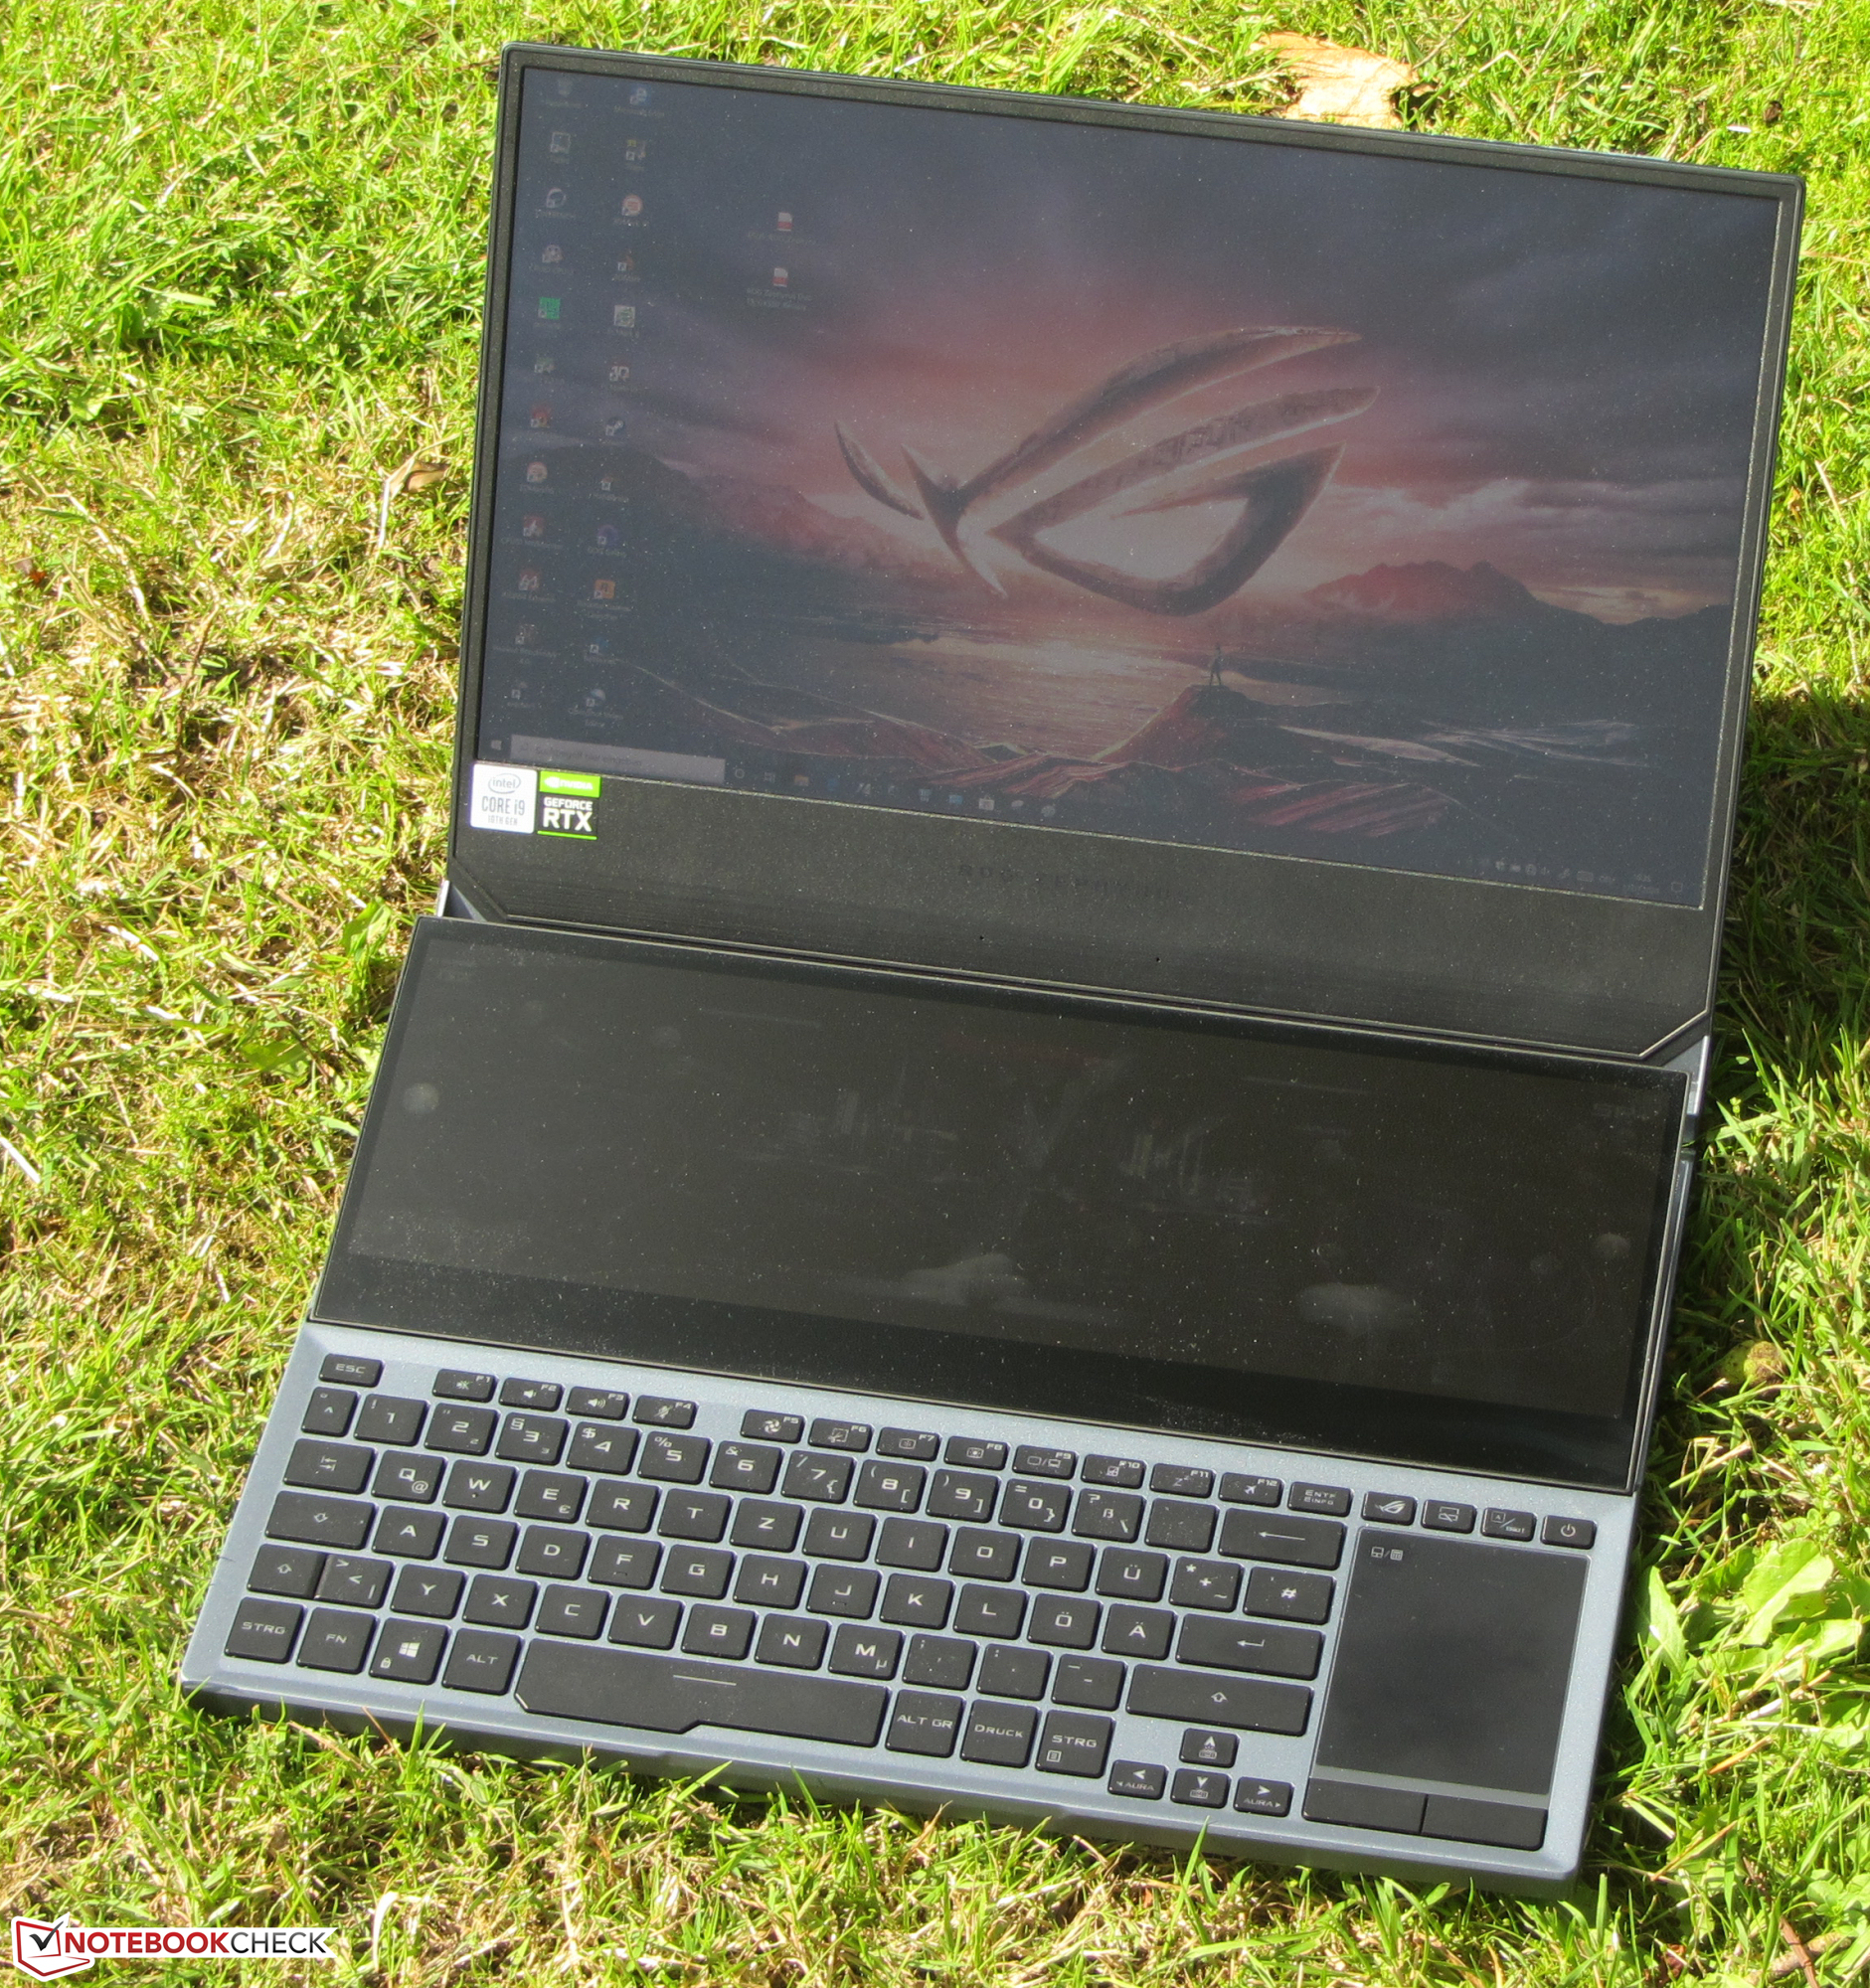
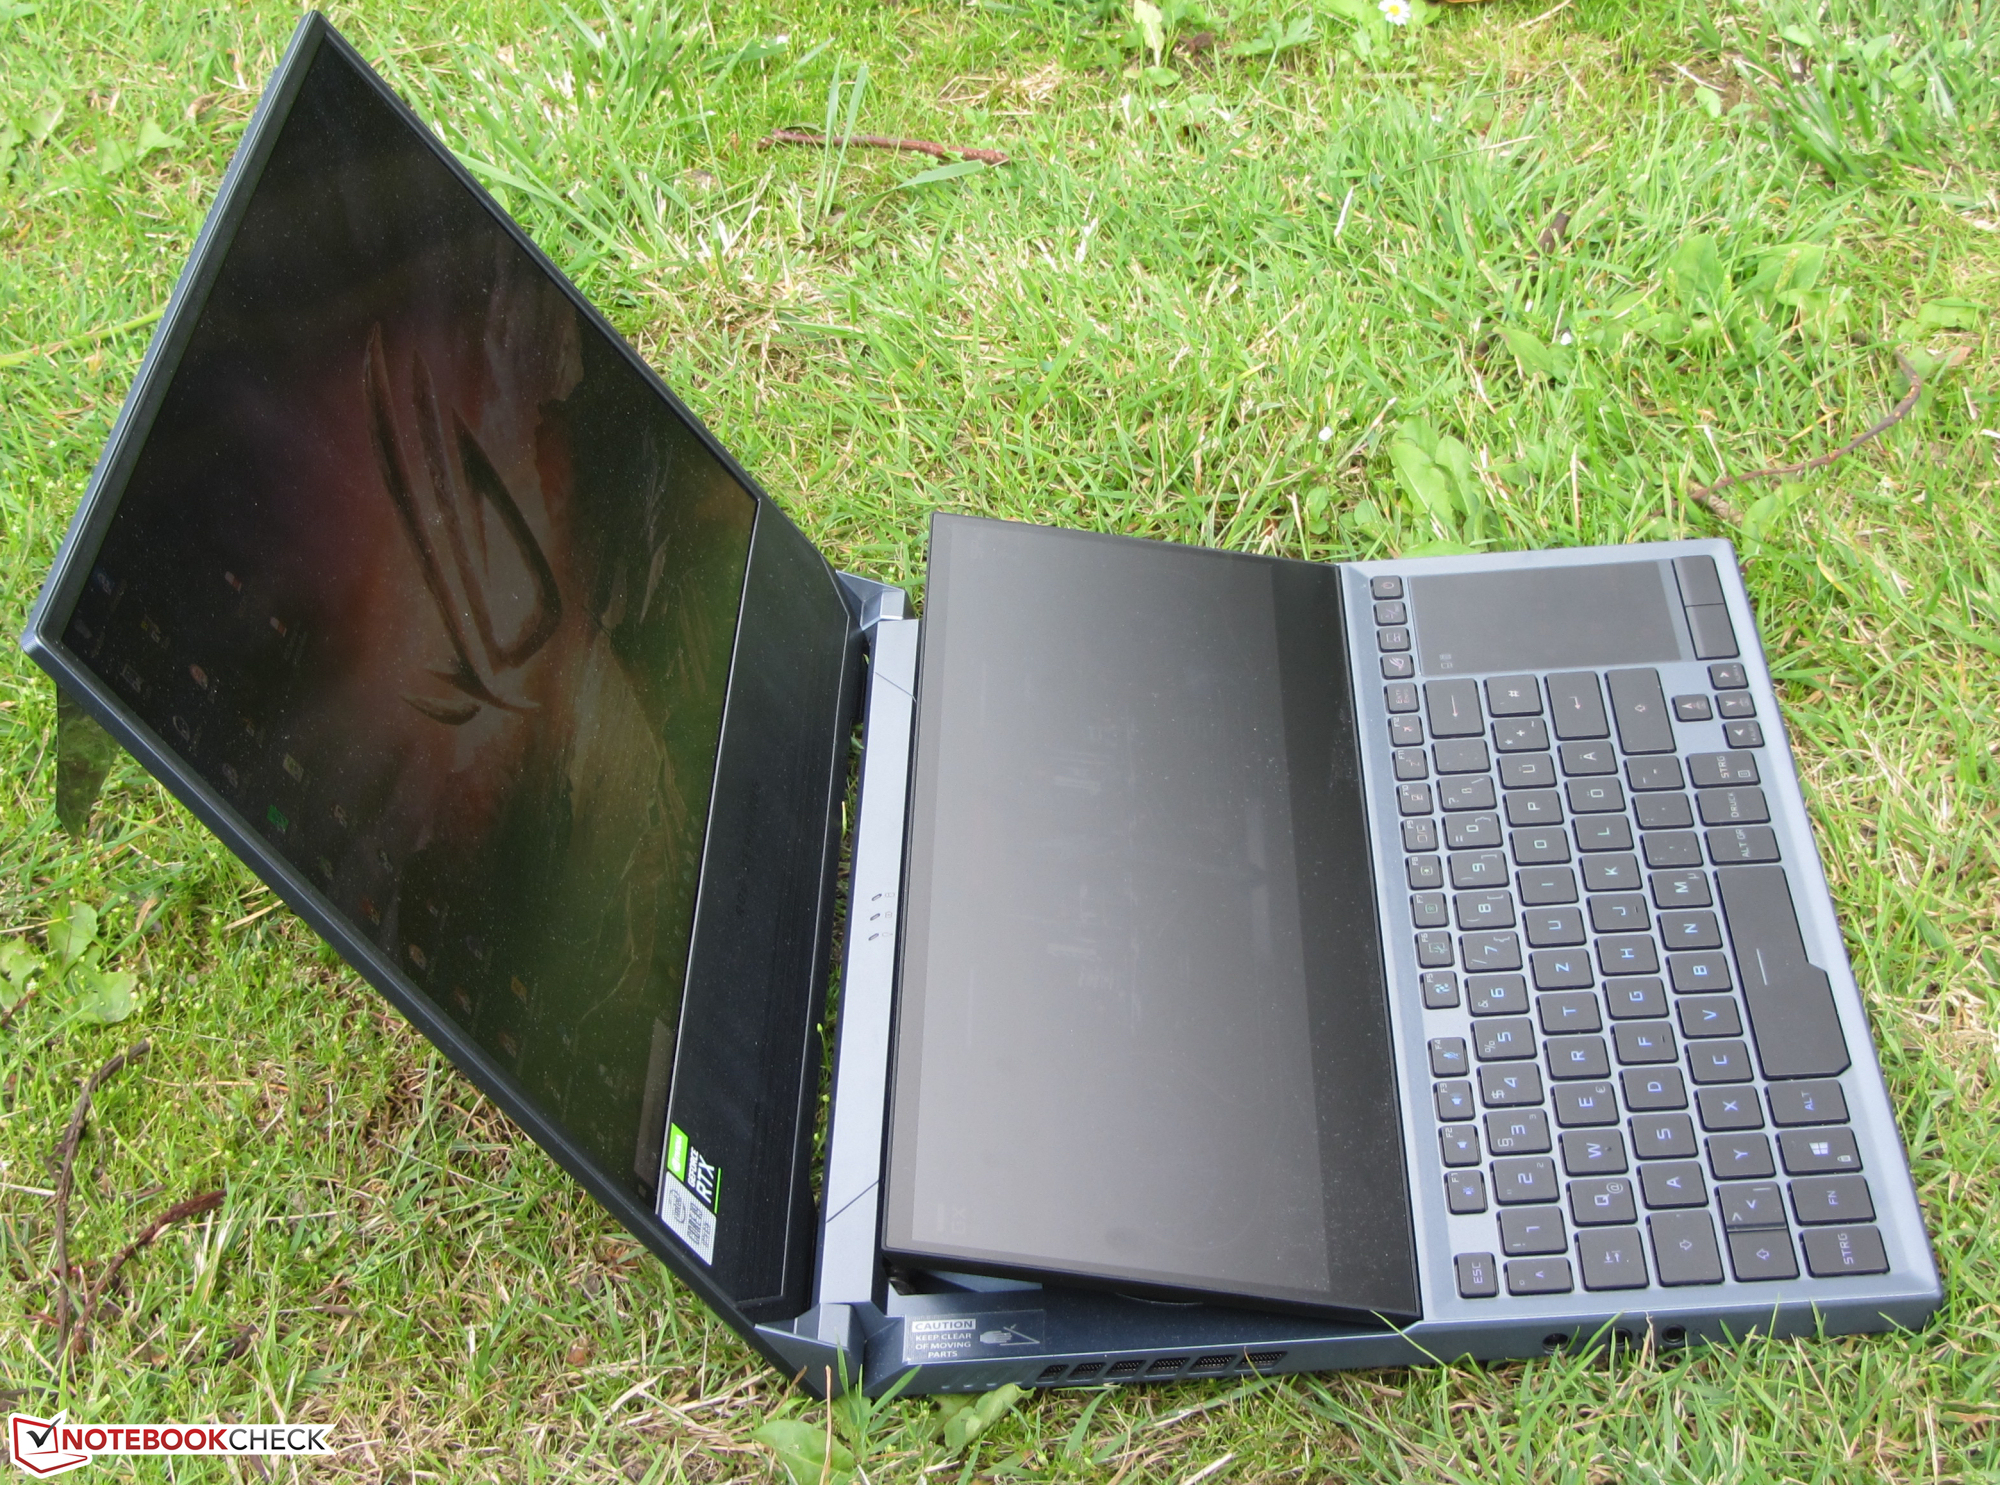
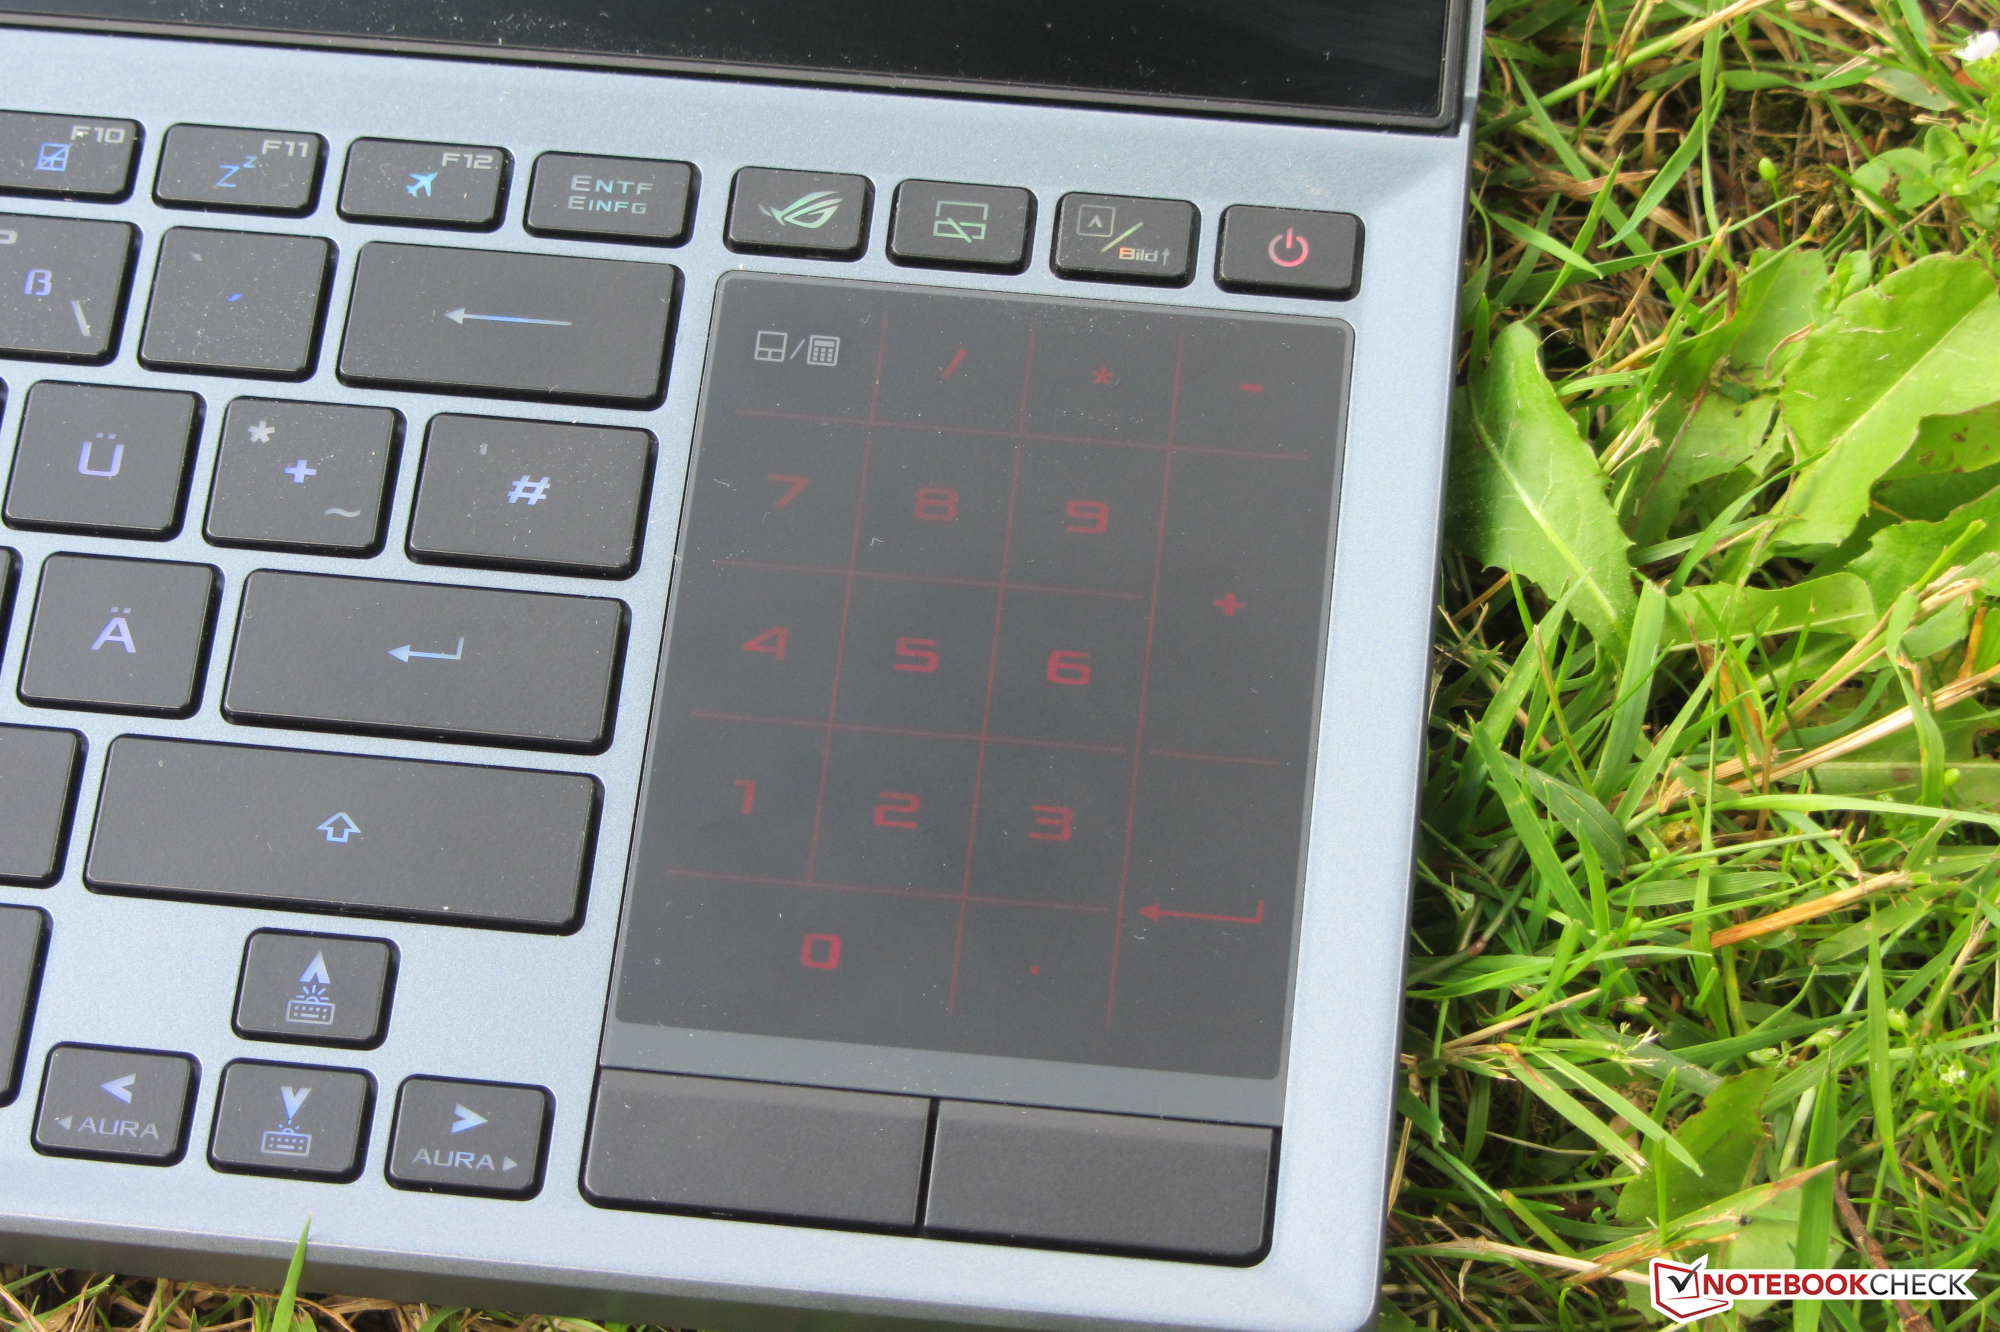
Met dit Zephyrus notebook en zijn Screenpad Plus probeert Asus extra waarde te bieden aan de doelgroep van gamers, streamers en contentmakers. Over het algemeen heeft de Screenpad de neiging om op een of andere manier nuttig te zijn. Dit gaat gepaard met een prijskaartje: Vergeleken met andere gaminglaptops zonder secundair beeldscherm is het gewicht van de Zephyrus hoger en zijn de afmetingen groter.
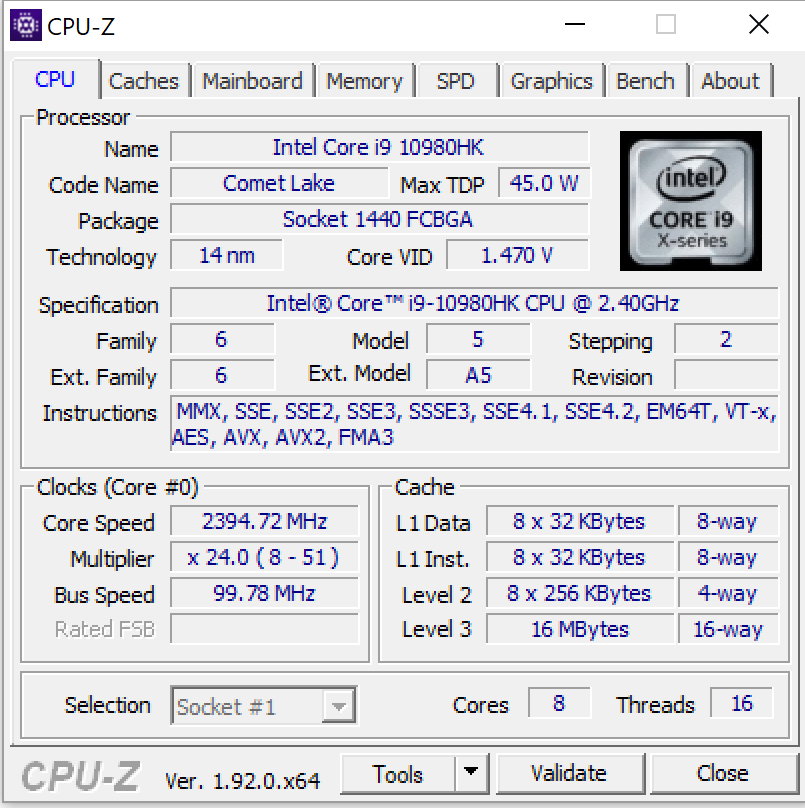
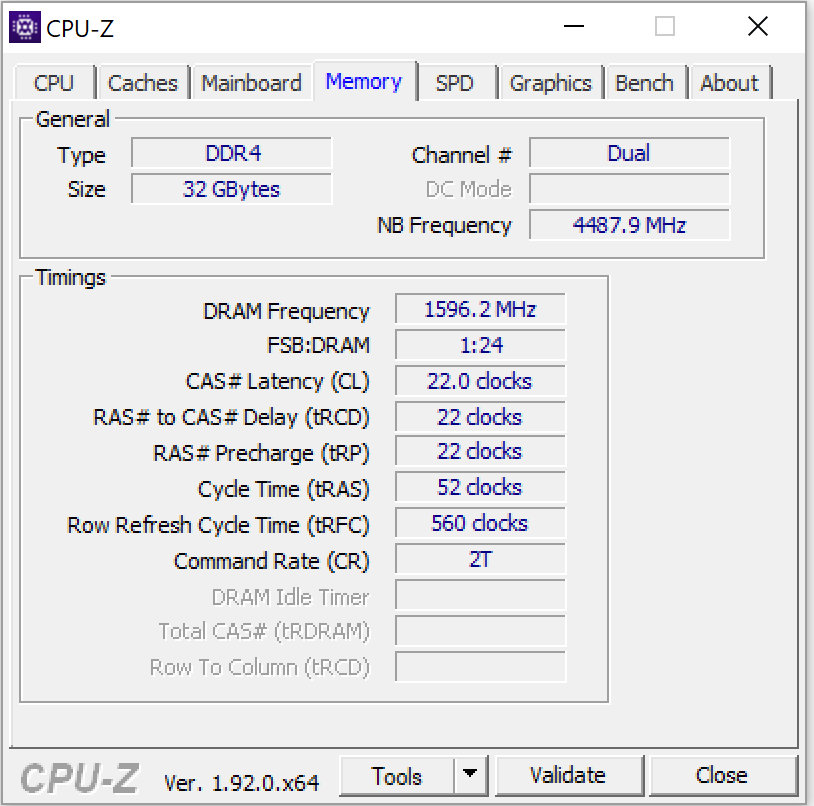
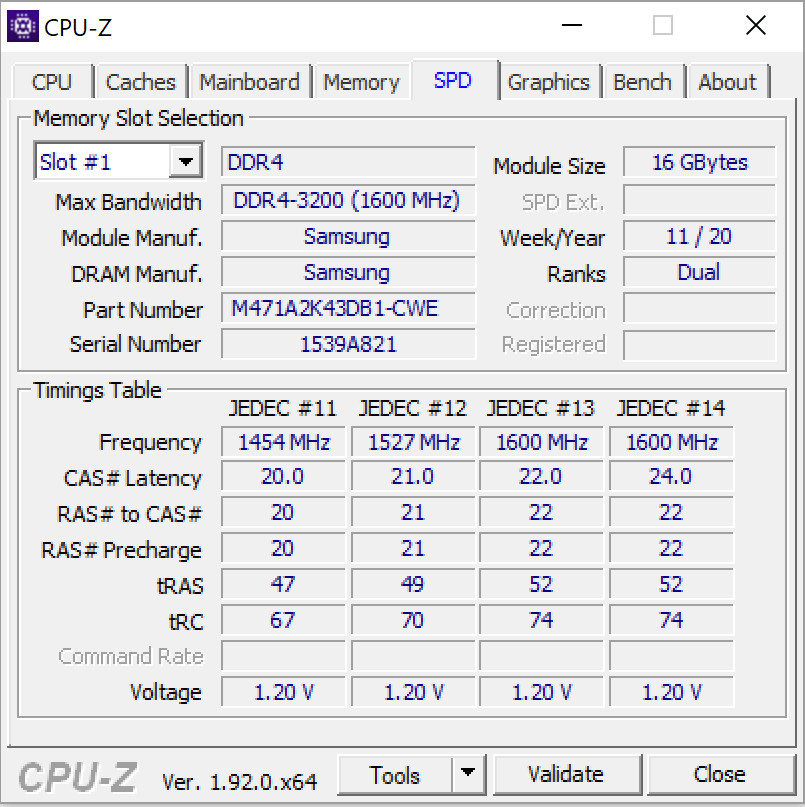
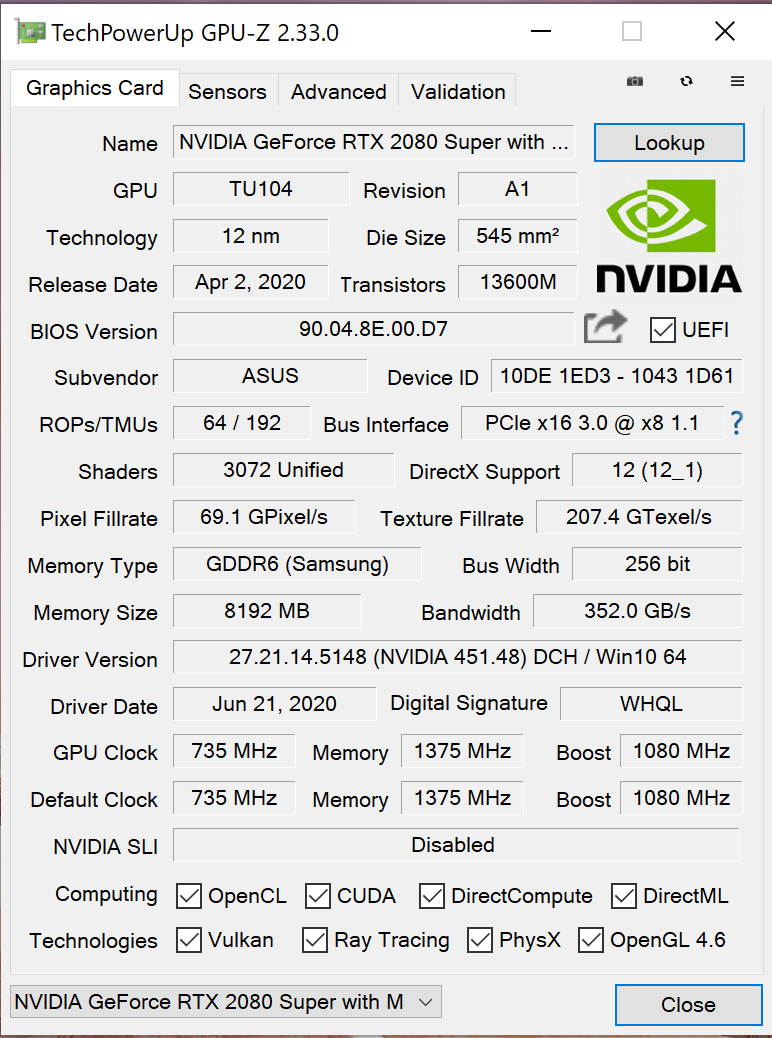
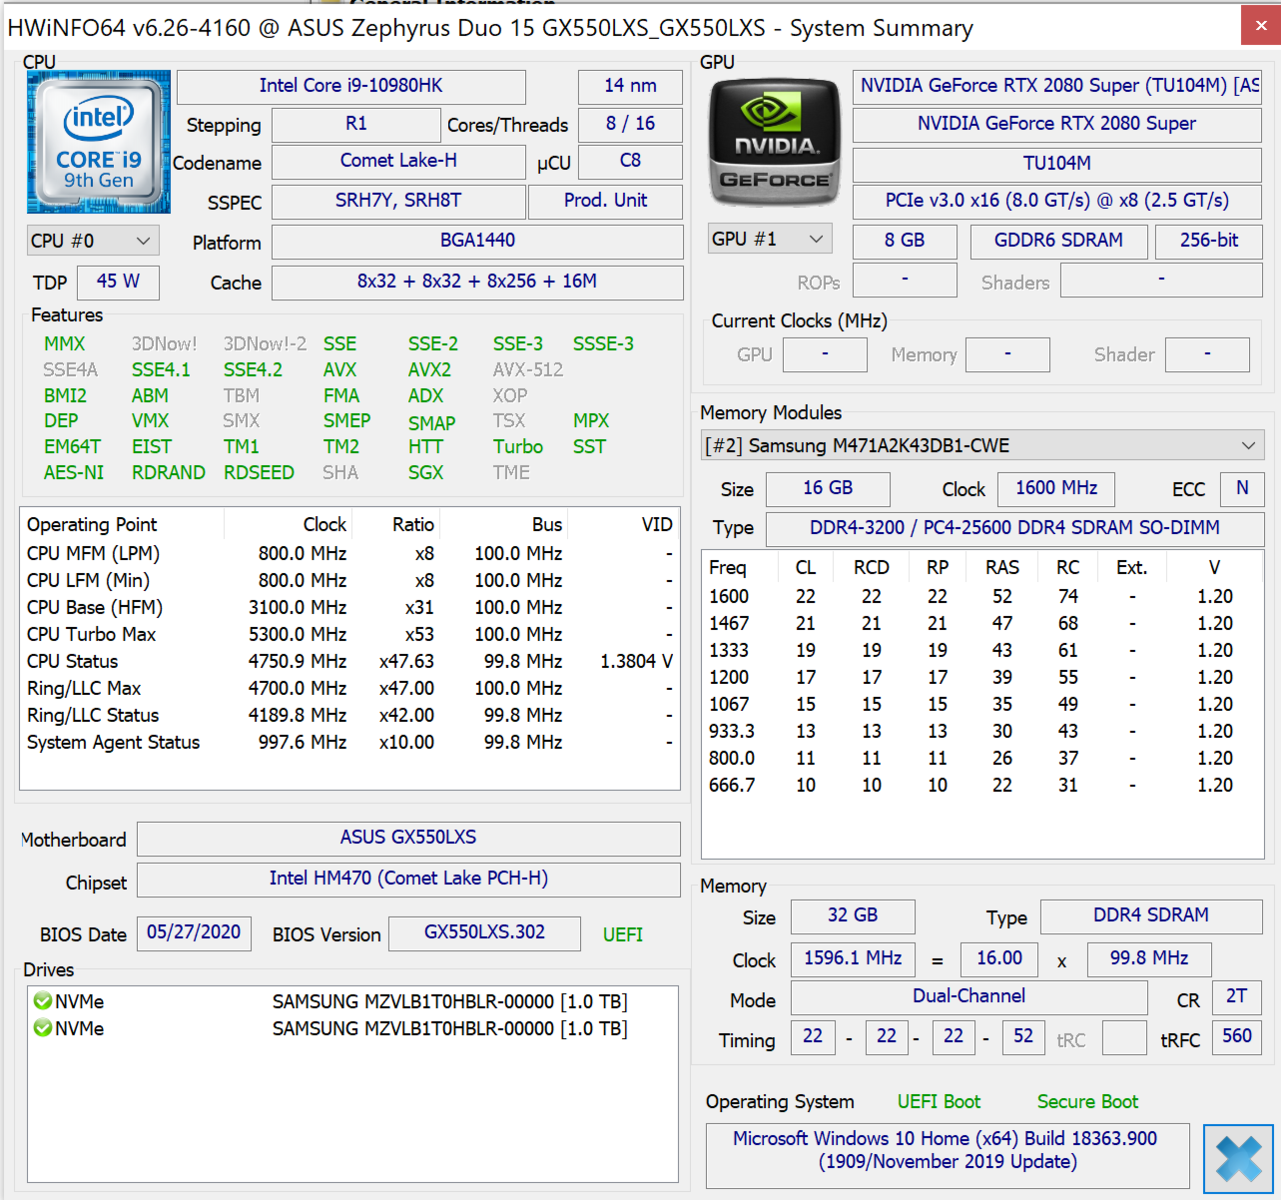
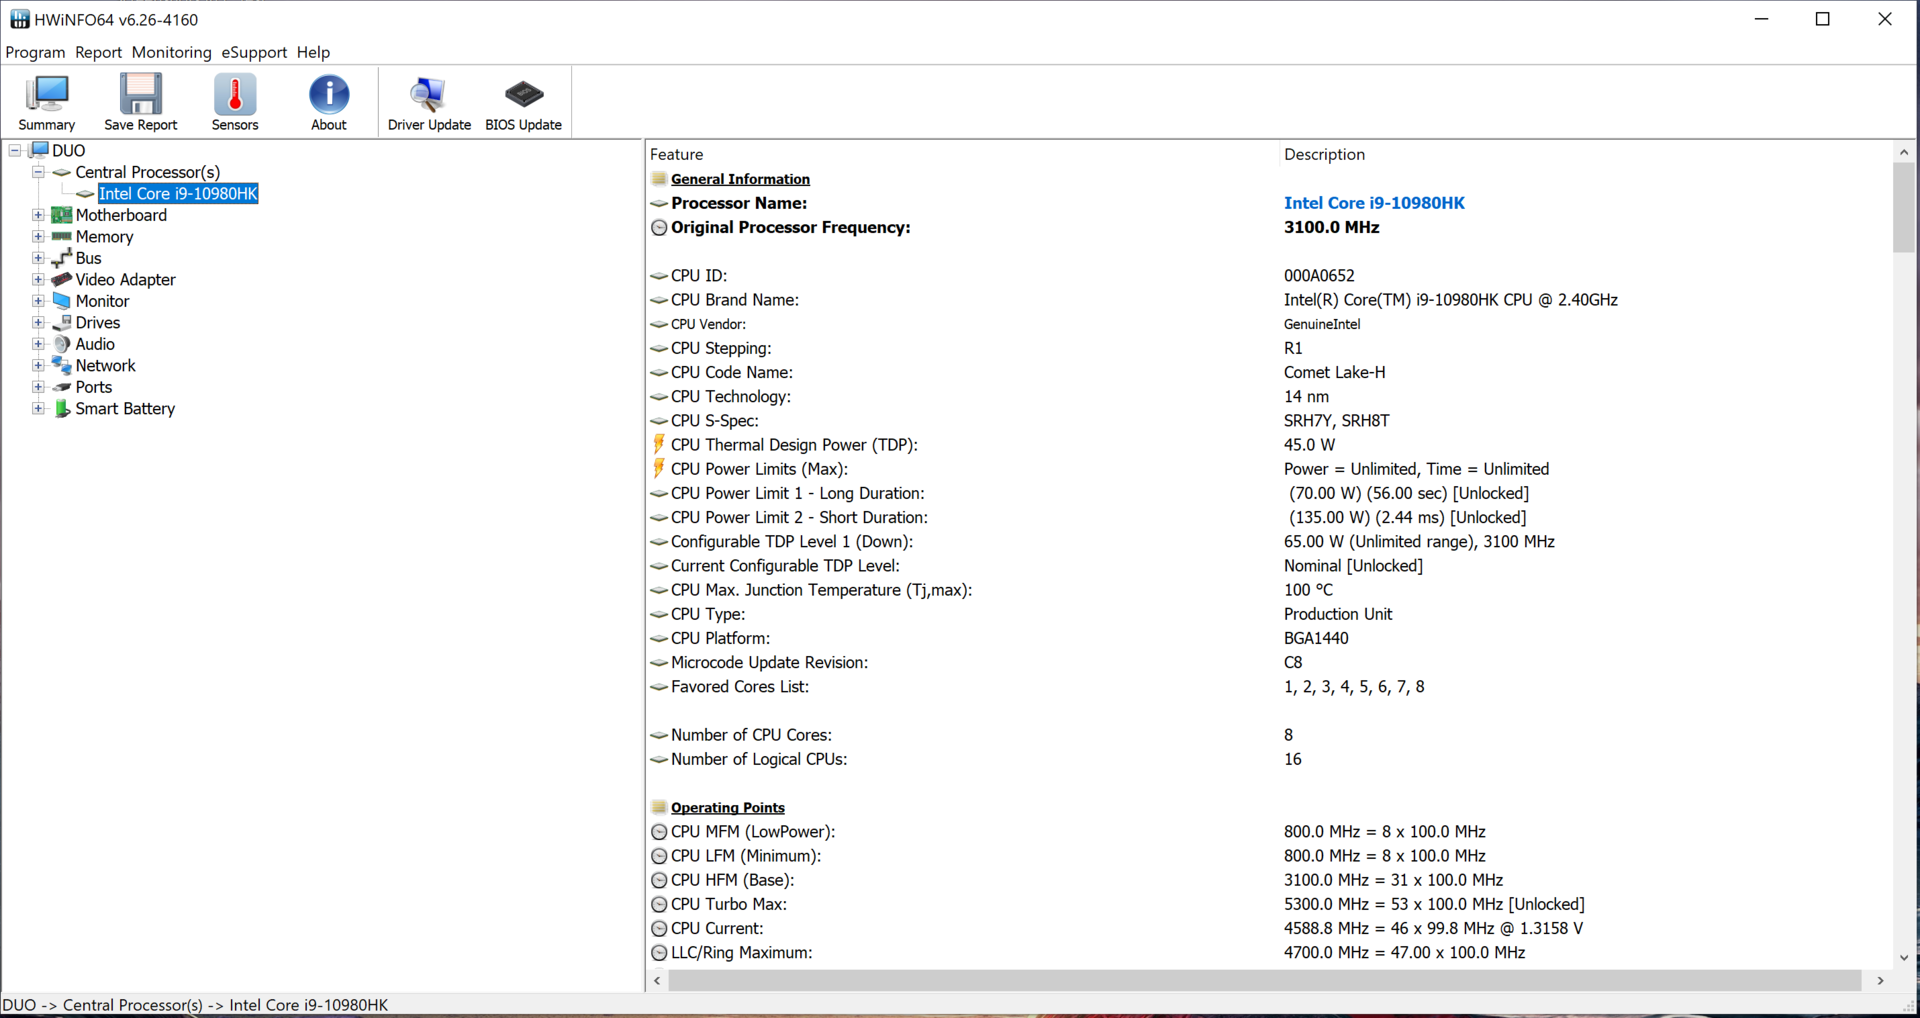
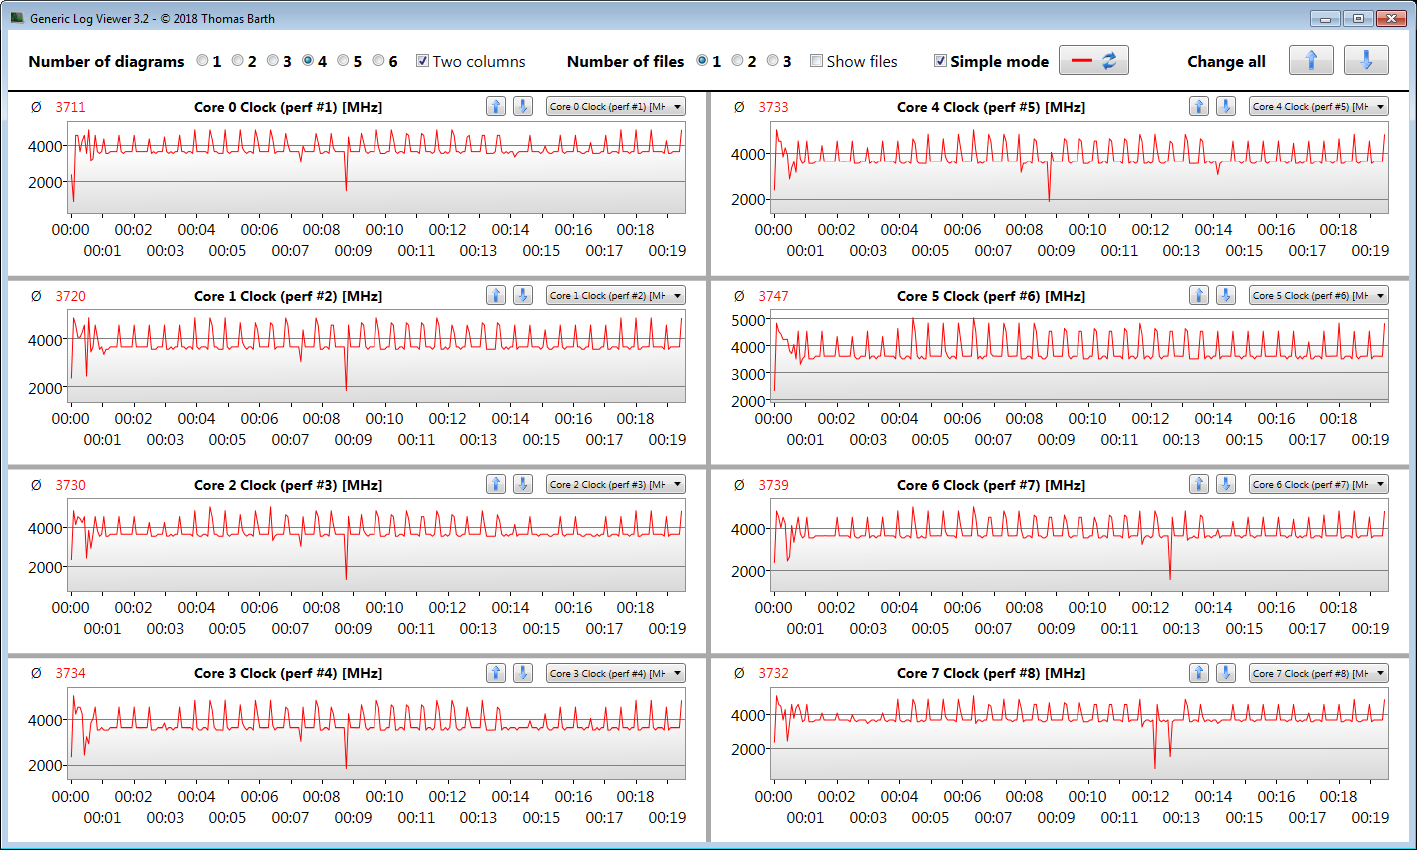
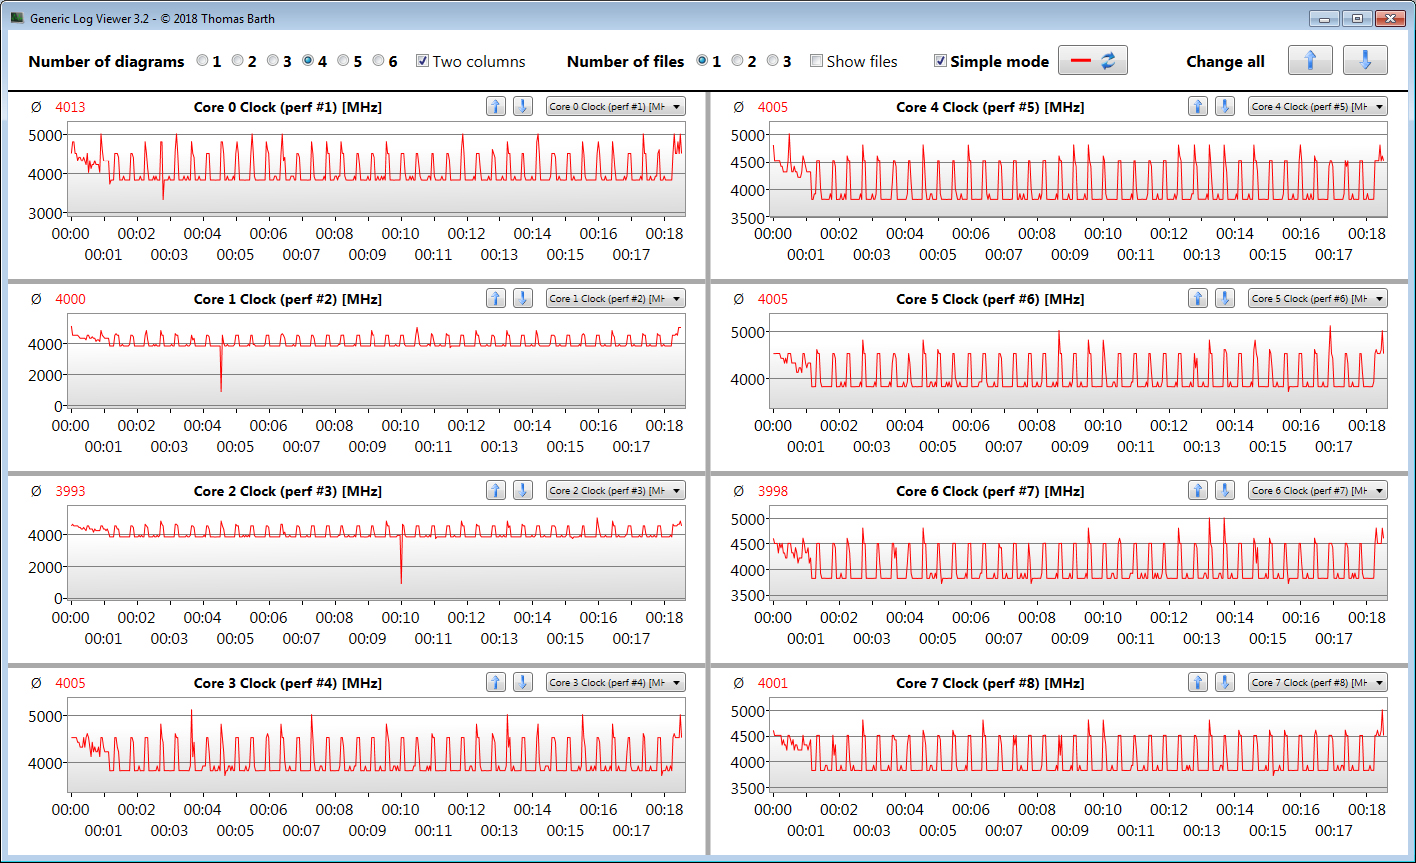
Dankzij de octa-core Core i9-10980HK CPU en de GeForce RTX 2080 Super Max-Q GPU ontbreekt het de laptop niet aan prestaties. De processorkernen gaan vergezeld met 32 GB RAM (in dual-channel mode), die bestaat uit een 16-GB module en 16 GB gesoldeerd geheugen. Upgrades tot 48 GB zijn mogelijk. De twee NVMe SSD's in RAID 0 bieden hoge overdrachtssnelheden en veel opslagruimte (2 TB).
Alle nieuwste spellen lopen soepel op de Asus Zephyrus Duo 15 GX550LXS.
Het G-Sync-compatibele IPS 4K-display schittert met een hoge helderheid, een goede contrastverhouding, goede kijkhoeken en - dankzij de Pantone-validatie - geweldige kleuren. Bovendien beslaat het de volledige AdobeRGB-kleurruimte. De responstijden zijn middelmatig. Voor betere responstijden is er ook een alternatieve 300-Hz Full HD-displayoptie beschikbaar.
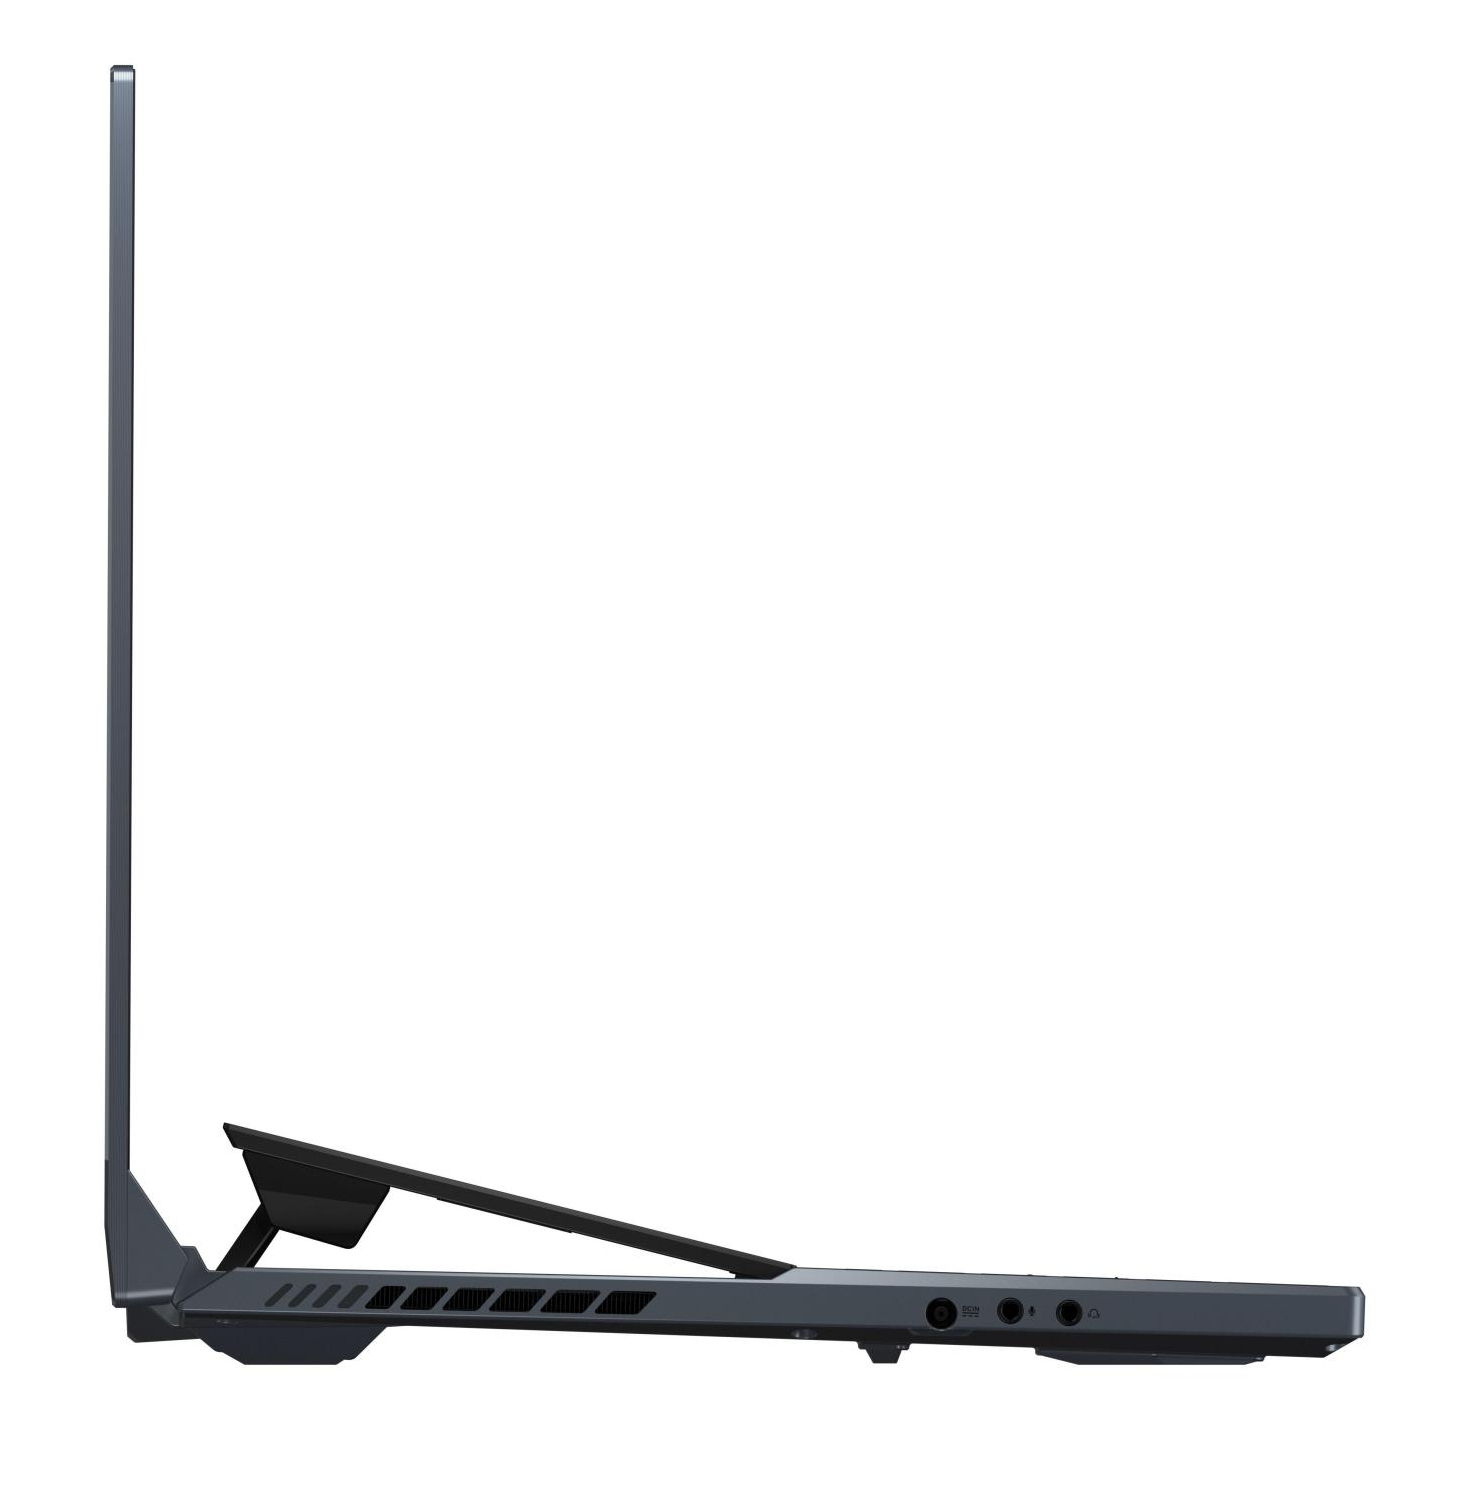
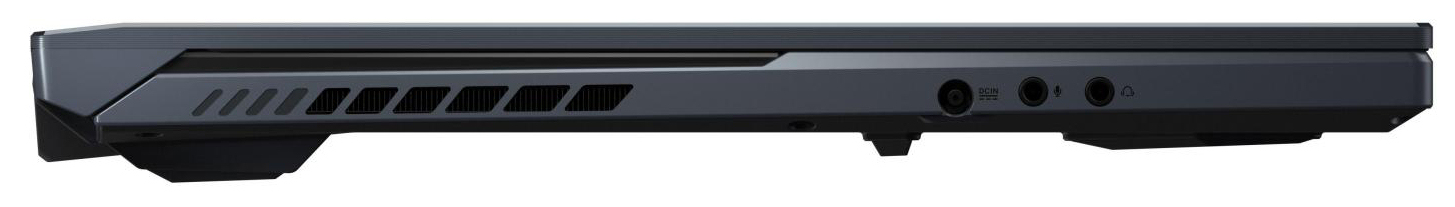
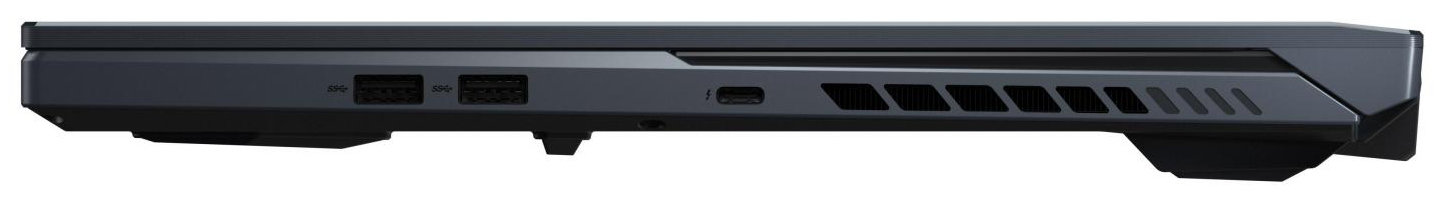
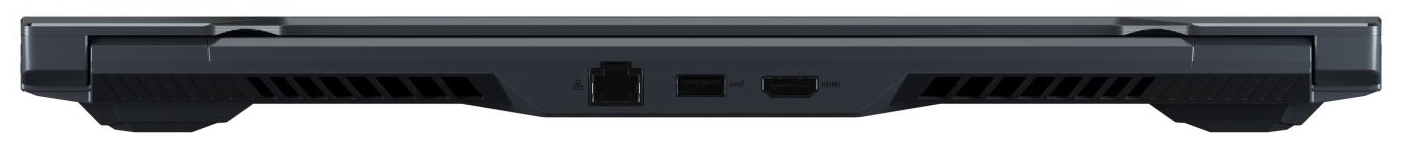
De ruime keuze aan poorten omvat met name een Thunderbolt 3 poort. Deze kan worden gebruikt voor het aansluiten van functie-rijke dokken of externe GPU's. Bovendien kan de poort worden gebruikt om het apparaat op een lager prestatieniveau te voeden, bijvoorbeeld tijdens het reizen, met de bijgeleverde tweede AC-adapter (65 watt).
Asus ROG Zephyrus Duo 15 GX550LXS
- 22-07-2020 v7 (old)
Sascha Mölck
Price comparison
