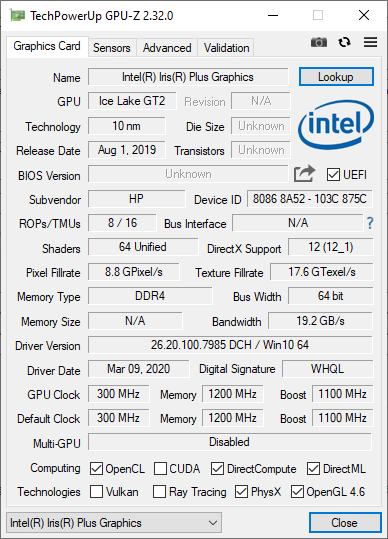
Kort testrapport HP Envy 17t (Core i7-1065G7, Nvidia MX330, 4K) Laptop
Evaluatie | Datum | Model | Gewicht | Hoogte | Formaat | Resolutie | Beste prijs |
|---|---|---|---|---|---|---|---|
| 80.9 % v7 (old) | 06-2020 | HP Envy 17t-cg000 i7-1065G7, GeForce MX330 | 2.7 kg | 19.3 mm | 17.30" | 3840x2160 | |
| 79.3 % v7 (old) | Medion Akoya P17605 i7-10510U, GeForce MX250 | 2.3 kg | 18.45 mm | 17.30" | 1920x1080 | ||
| 75.6 % v7 (old) | 05-2020 | Asus VivoBook 17 M712DA-AU017T R5 3500U, Vega 8 | 2.3 kg | 21 mm | 17.30" | 1920x1080 | |
| 78.5 % v7 (old) | 11-2019 | HP Envy 17-ce1004ng i7-10510U, GeForce MX250 | 2.8 kg | 23 mm | 17.30" | 1920x1080 | |
| 78.9 % v6 (old) | 05-2019 | Dell Inspiron 17 3780 i7-8565U, Radeon 520 | 2.8 kg | 25 mm | 17.30" | 1920x1080 | |
| 83.5 % v6 (old) | 04-2019 | LG Gram 17Z990-R.AAS7U1 i7-8565U, UHD Graphics 620 | 1.3 kg | 17.8 mm | 17.00" | 2560x1600 |


| SD Card Reader | |
| average JPG Copy Test (av. of 3 runs) | |
| Dell XPS 15 9500 Core i7 4K UHD (Toshiba Exceria Pro SDXC 64 GB UHS-II) | |
| HP Envy 17t-cg000 (Toshiba Exceria Pro SDXC 64 GB UHS-II) | |
| LG Gram 17Z990-R.AAS7U1 (Toshiba Exceria Pro M501 64 GB UHS-II) | |
| HP Envy 17-ce1004ng (Toshiba Exceria Pro SDXC 64 GB UHS-II) | |
| Asus VivoBook 17 M712DA-AU017T (Toshiba Exceria Pro M501 microSDXC 64GB) | |
| Dell Inspiron 17 3780 (Toshiba Exceria Pro SDXC 64 GB UHS-II) | |
| Medion Akoya P17605 (Toshiba Exceria Pro SDXC 64 GB UHS-II) | |
| maximum AS SSD Seq Read Test (1GB) | |
| Dell XPS 15 9500 Core i7 4K UHD (Toshiba Exceria Pro SDXC 64 GB UHS-II) | |
| LG Gram 17Z990-R.AAS7U1 (Toshiba Exceria Pro M501 64 GB UHS-II) | |
| HP Envy 17t-cg000 (Toshiba Exceria Pro SDXC 64 GB UHS-II) | |
| HP Envy 17-ce1004ng (Toshiba Exceria Pro SDXC 64 GB UHS-II) | |
| Asus VivoBook 17 M712DA-AU017T (Toshiba Exceria Pro M501 microSDXC 64GB) | |
| Dell Inspiron 17 3780 (Toshiba Exceria Pro SDXC 64 GB UHS-II) | |
| Medion Akoya P17605 (Toshiba Exceria Pro SDXC 64 GB UHS-II) | |
| Networking | |
| iperf3 transmit AX12 | |
| Medion Akoya P17605 | |
| HP Envy 17t-cg000 | |
| LG Gram 17Z990-R.AAS7U1 | |
| HP Envy 17-ce1004ng | |
| Asus VivoBook 17 M712DA-AU017T | |
| Dell Inspiron 17 3780 | |
| iperf3 receive AX12 | |
| HP Envy 17t-cg000 | |
| Medion Akoya P17605 | |
| HP Envy 17-ce1004ng | |
| LG Gram 17Z990-R.AAS7U1 | |
| Asus VivoBook 17 M712DA-AU017T | |
| Dell Inspiron 17 3780 | |


| |||||||||||||||||||||||||
Helderheidsverdeling: 86 %
Helderheid in Batterij-modus: 383.4 cd/m²
Contrast: 1128:1 (Zwart: 0.34 cd/m²)
ΔE ColorChecker Calman: 6.24 | ∀{0.5-29.43 Ø4.73}
calibrated: 3.7
ΔE Greyscale Calman: 6.6 | ∀{0.09-98 Ø4.97}
100% sRGB (Argyll 1.6.3 3D)
88% AdobeRGB 1998 (Argyll 1.6.3 3D)
99.8% AdobeRGB 1998 (Argyll 3D)
100% sRGB (Argyll 3D)
86.2% Display P3 (Argyll 3D)
Gamma: 2.272
CCT: 5973 K
| HP Envy 17t-cg000 AU Optronics AUO168E, IPS, 17.3", 3840x2160 | Medion Akoya P17605 AU Optronics AUO429D, IPS, 17.3", 1920x1080 | Asus VivoBook 17 M712DA-AU017T BOE084E, IPS, 17.3", 1920x1080 | HP Envy 17-ce1004ng BOE0825, IPS, 17.3", 1920x1080 | Dell Inspiron 17 3780 AU Optronics B173HAN01.3, IPS, 17.3", 1920x1080 | LG Gram 17Z990-R.AAS7U1 LG Philips LP170WQ1-SPA1, IPS, 17", 2560x1600 | Dell XPS 15 9500 Core i7 4K UHD Sharp LQ156R1, IPS, 15.6", 3840x2400 | |
|---|---|---|---|---|---|---|---|
| Display | -25% | -50% | -23% | -24% | -21% | 1% | |
| Display P3 Coverage (%) | 86.2 | 62.3 -28% | 40.76 -53% | 63.3 -27% | 63.7 -26% | 64.2 -26% | 89.7 4% |
| sRGB Coverage (%) | 100 | 88.6 -11% | 59.7 -40% | 91.5 -8% | 88.9 -11% | 96.3 -4% | 100 0% |
| AdobeRGB 1998 Coverage (%) | 99.8 | 63.7 -36% | 42.11 -58% | 64.6 -35% | 64.6 -35% | 66.3 -34% | 99.8 0% |
| Response Times | -3% | 43% | 37% | -11% | 1% | -16% | |
| Response Time Grey 50% / Grey 80% * (ms) | 45.2 ? | 45 ? -0% | 24 ? 47% | 30 ? 34% | 46 ? -2% | 42 ? 7% | 54 ? -19% |
| Response Time Black / White * (ms) | 29.6 ? | 31 ? -5% | 18 ? 39% | 18 ? 39% | 35.2 ? -19% | 31.2 ? -5% | 33.2 ? -12% |
| PWM Frequency (Hz) | |||||||
| Screen | 14% | -14% | -5% | 5% | 17% | 19% | |
| Brightness middle (cd/m²) | 383.4 | 298 -22% | 262 -32% | 293 -24% | 322.9 -16% | 370.6 -3% | 557.9 46% |
| Brightness (cd/m²) | 382 | 294 -23% | 234 -39% | 280 -27% | 322 -16% | 356 -7% | 541 42% |
| Brightness Distribution (%) | 86 | 88 2% | 84 -2% | 83 -3% | 84 -2% | 89 3% | 91 6% |
| Black Level * (cd/m²) | 0.34 | 0.255 25% | 0.265 22% | 0.335 1% | 0.26 24% | 0.28 18% | 0.39 -15% |
| Contrast (:1) | 1128 | 1169 4% | 989 -12% | 875 -22% | 1242 10% | 1324 17% | 1431 27% |
| Colorchecker dE 2000 * | 6.24 | 3.01 52% | 5.13 18% | 4.79 23% | 4.19 33% | 3.28 47% | 4.54 27% |
| Colorchecker dE 2000 max. * | 10.18 | 4.59 55% | 19.16 -88% | 11.42 -12% | 7.04 31% | 5.85 43% | 7.92 22% |
| Colorchecker dE 2000 calibrated * | 3.7 | 2.1 43% | 3.96 -7% | 1.76 52% | 3.55 4% | 1.03 72% | 3.82 -3% |
| Greyscale dE 2000 * | 6.6 | 2.29 65% | 1.22 82% | 6.32 4% | 4.5 32% | 4.9 26% | 3.2 52% |
| Gamma | 2.272 97% | 2.62 84% | 2.42 91% | 2.49 88% | 1.97 112% | 2.19 100% | 1.99 111% |
| CCT | 5973 109% | 6655 98% | 6584 99% | 8002 81% | 7041 92% | 6376 102% | 6451 101% |
| Color Space (Percent of AdobeRGB 1998) (%) | 88 | 58 -34% | 38 -57% | 59 -33% | 57.6 -35% | 60.8 -31% | 89.5 2% |
| Color Space (Percent of sRGB) (%) | 100 | 89 -11% | 59 -41% | 91 -9% | 88.4 -12% | 96.6 -3% | 100 0% |
| Totaal Gemiddelde (Programma / Instellingen) | -5% /
5% | -7% /
-14% | 3% /
-3% | -10% /
-3% | -1% /
8% | 1% /
11% |
* ... kleiner is beter
Responstijd Scherm
| ↔ Responstijd Zwart naar Wit | ||
|---|---|---|
| 29.6 ms ... stijging ↗ en daling ↘ gecombineerd | ↗ 16.4 ms stijging | 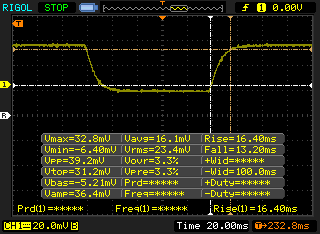 |
| ↘ 13.2 ms daling | ||
| Het scherm vertoonde relatief trage responstijden in onze tests en is misschien te traag voor games. Ter vergelijking: alle testtoestellen variëren van 0.1 (minimum) tot 240 (maximum) ms. » 79 % van alle toestellen zijn beter. Dit betekent dat de gemeten responstijd slechter is dan het gemiddelde (19.9 ms) van alle geteste toestellen. | ||
| ↔ Responstijd 50% Grijs naar 80% Grijs | ||
| 45.2 ms ... stijging ↗ en daling ↘ gecombineerd | ↗ 24 ms stijging | 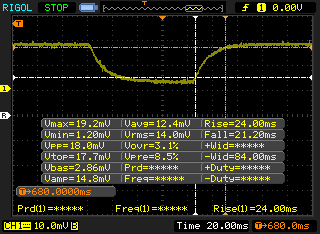 |
| ↘ 21 ms daling | ||
| Het scherm vertoonde trage responstijden in onze tests en is misschien te traag voor games. Ter vergelijking: alle testtoestellen variëren van 0.165 (minimum) tot 636 (maximum) ms. » 77 % van alle toestellen zijn beter. Dit betekent dat de gemeten responstijd slechter is dan het gemiddelde (31.1 ms) van alle geteste toestellen. | ||
Screen Flickering / PWM (Pulse-Width Modulation)
| Screen flickering / PWM niet waargenomen | 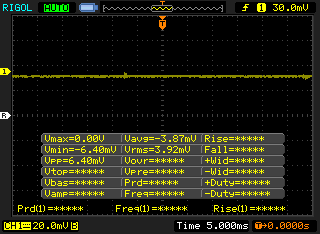 | ||
Ter vergelijking: 52 % van alle geteste toestellen maakten geen gebruik van PWM om de schermhelderheid te verlagen. Als het wel werd gebruikt, werd een gemiddelde van 7798 (minimum: 5 - maximum: 343500) Hz waargenomen. | |||
Cinebench R15: CPU Single 64Bit | CPU Multi 64Bit
Blender: v2.79 BMW27 CPU
7-Zip 18.03: 7z b 4 -mmt1 | 7z b 4
Geekbench 5.5: Single-Core | Multi-Core
HWBOT x265 Benchmark v2.2: 4k Preset
LibreOffice : 20 Documents To PDF
R Benchmark 2.5: Overall mean
| Cinebench R20 / CPU (Single Core) | |
| Gemiddelde van klas Multimedia (425 - 853, n=64, laatste 2 jaar) | |
| HP Envy 17t-cg000 | |
| Acer Swift 3 SF314-42-R4XJ | |
| HP ProBook 445 G7 175W4EA | |
| Dell XPS 15 9500 Core i5 | |
| Gemiddeld Intel Core i7-1065G7 (358 - 474, n=31) | |
| Cinebench R20 / CPU (Multi Core) | |
| Gemiddelde van klas Multimedia (1887 - 12912, n=64, laatste 2 jaar) | |
| Acer Swift 3 SF314-42-R4XJ | |
| HP ProBook 445 G7 175W4EA | |
| Dell XPS 15 9500 Core i5 | |
| HP Envy 17t-cg000 | |
| Gemiddeld Intel Core i7-1065G7 (1081 - 2024, n=31) | |
| Cinebench R15 / CPU Single 64Bit | |
| Gemiddelde van klas Multimedia (184.8 - 326, n=66, laatste 2 jaar) | |
| HP Envy 17-ce1004ng | |
| HP Envy 17t-cg000 | |
| Dell XPS 15 9500 Core i5 | |
| Acer Swift 3 SF314-42-R4XJ | |
| HP ProBook 445 G7 175W4EA | |
| Gemiddeld Intel Core i7-1065G7 (141 - 190, n=35) | |
| LG Gram 17Z990-R.AAS7U1 | |
| Dell Inspiron 17 3780 | |
| Asus VivoBook 17 M712DA-AU017T | |
| Cinebench R15 / CPU Multi 64Bit | |
| Gemiddelde van klas Multimedia (856 - 5224, n=68, laatste 2 jaar) | |
| Acer Swift 3 SF314-42-R4XJ | |
| HP ProBook 445 G7 175W4EA | |
| Dell XPS 15 9500 Core i5 | |
| HP Envy 17t-cg000 | |
| Gemiddeld Intel Core i7-1065G7 (288 - 836, n=36) | |
| Asus VivoBook 17 M712DA-AU017T | |
| Dell Inspiron 17 3780 | |
| HP Envy 17-ce1004ng | |
| LG Gram 17Z990-R.AAS7U1 | |
| Blender / v2.79 BMW27 CPU | |
| Gemiddeld Intel Core i7-1065G7 (675 - 1650, n=23) | |
| HP Envy 17t-cg000 | |
| HP ProBook 445 G7 175W4EA | |
| Acer Swift 3 SF314-42-R4XJ | |
| Dell XPS 15 9500 Core i5 | |
| Gemiddelde van klas Multimedia (100 - 557, n=65, laatste 2 jaar) | |
| 7-Zip 18.03 / 7z b 4 -mmt1 | |
| Gemiddelde van klas Multimedia (3666 - 7545, n=63, laatste 2 jaar) | |
| Dell XPS 15 9500 Core i5 | |
| HP Envy 17t-cg000 | |
| HP ProBook 445 G7 175W4EA | |
| Acer Swift 3 SF314-42-R4XJ | |
| Gemiddeld Intel Core i7-1065G7 (3289 - 4589, n=24) | |
| 7-Zip 18.03 / 7z b 4 | |
| Gemiddelde van klas Multimedia (29095 - 130368, n=62, laatste 2 jaar) | |
| Acer Swift 3 SF314-42-R4XJ | |
| Dell XPS 15 9500 Core i5 | |
| HP ProBook 445 G7 175W4EA | |
| Gemiddeld Intel Core i7-1065G7 (10406 - 22898, n=24) | |
| HP Envy 17t-cg000 | |
| Geekbench 5.5 / Single-Core | |
| Gemiddelde van klas Multimedia (805 - 2974, n=62, laatste 2 jaar) | |
| HP Envy 17t-cg000 | |
| Gemiddeld Intel Core i7-1065G7 (948 - 1348, n=18) | |
| Dell XPS 15 9500 Core i5 | |
| Acer Swift 3 SF314-42-R4XJ | |
| HP ProBook 445 G7 175W4EA | |
| Geekbench 5.5 / Multi-Core | |
| Gemiddelde van klas Multimedia (4652 - 20422, n=62, laatste 2 jaar) | |
| Acer Swift 3 SF314-42-R4XJ | |
| HP ProBook 445 G7 175W4EA | |
| Dell XPS 15 9500 Core i5 | |
| Gemiddeld Intel Core i7-1065G7 (2464 - 4855, n=18) | |
| HP Envy 17t-cg000 | |
| HWBOT x265 Benchmark v2.2 / 4k Preset | |
| Gemiddelde van klas Multimedia (5.26 - 36.1, n=63, laatste 2 jaar) | |
| Acer Swift 3 SF314-42-R4XJ | |
| Dell XPS 15 9500 Core i5 | |
| HP Envy 17t-cg000 | |
| Gemiddeld Intel Core i7-1065G7 (2.2 - 6.38, n=22) | |
| LibreOffice / 20 Documents To PDF | |
| HP ProBook 445 G7 175W4EA | |
| Dell XPS 15 9500 Core i5 | |
| Gemiddeld Intel Core i7-1065G7 (46.9 - 85.3, n=19) | |
| Acer Swift 3 SF314-42-R4XJ | |
| HP Envy 17t-cg000 | |
| Gemiddelde van klas Multimedia (23.9 - 146.7, n=64, laatste 2 jaar) | |
| R Benchmark 2.5 / Overall mean | |
| Gemiddeld Intel Core i7-1065G7 (0.661 - 0.798, n=18) | |
| HP Envy 17t-cg000 | |
| Dell XPS 15 9500 Core i5 | |
| Acer Swift 3 SF314-42-R4XJ | |
| Gemiddelde van klas Multimedia (0.3604 - 0.947, n=63, laatste 2 jaar) | |
* ... kleiner is beter
| PCMark 8 Home Score Accelerated v2 | 3762 punten | |
| PCMark 8 Work Score Accelerated v2 | 5267 punten | |
| PCMark 10 Score | 4102 punten | |
Help | ||
| DPC Latencies / LatencyMon - interrupt to process latency (max), Web, Youtube, Prime95 | |
| Dell XPS 15 9500 Core i7 4K UHD | |
| Razer Blade Stealth Core i7 GTX 1650 Ti Max-Q 4K | |
| HP Envy 17t-cg000 | |
* ... kleiner is beter
| HP Envy 17t-cg000 WDC PC SN520 SDAPNUW-512G | Medion Akoya P17605 Phison E12-256G-Phison-SSD-B16-BB1 | Asus VivoBook 17 M712DA-AU017T Intel SSD 660p SSDPEKNW512G8 | HP Envy 17-ce1004ng Intel SSD 660p SSDPEKNW512G8 | Dell Inspiron 17 3780 SK Hynix BC501 NVMe 256 GB | LG Gram 17Z990-R.AAS7U1 Samsung SSD PM871b MZNLN256HAJQ | |
|---|---|---|---|---|---|---|
| AS SSD | 38% | -20% | -24% | -33% | -52% | |
| Seq Read (MB/s) | 1161 | 2482 114% | 1592 37% | 1620 40% | 1061 -9% | 454.5 -61% |
| Seq Write (MB/s) | 809 | 1079 33% | 900 11% | 373.7 -54% | 491.4 -39% | 461 -43% |
| 4K Read (MB/s) | 40.63 | 59.3 46% | 45.24 11% | 53.8 32% | 39.13 -4% | 30.18 -26% |
| 4K Write (MB/s) | 138.6 | 194.6 40% | 104.3 -25% | 170.3 23% | 104 -25% | 71 -49% |
| 4K-64 Read (MB/s) | 857 | 1180 38% | 324 -62% | 321.5 -62% | 505 -41% | 369.6 -57% |
| 4K-64 Write (MB/s) | 1041 | 1058 2% | 835 -20% | 715 -31% | 314.8 -70% | 305.5 -71% |
| Access Time Read * (ms) | 0.067 | 0.047 30% | 0.058 13% | 0.081 -21% | 0.063 6% | 0.084 -25% |
| Access Time Write * (ms) | 0.026 | 0.019 27% | 0.047 -81% | 0.046 -77% | 0.034 -31% | 0.05 -92% |
| Score Read (Points) | 1013 | 1488 47% | 528 -48% | 537 -47% | 650 -36% | 445 -56% |
| Score Write (Points) | 1260 | 1361 8% | 1030 -18% | 923 -27% | 468 -63% | 423 -66% |
| Score Total (Points) | 2783 | 3552 28% | 1810 -35% | 1693 -39% | 1434 -48% | 1106 -60% |
| Copy ISO MB/s (MB/s) | 1350 | 876 -35% | 816 -40% | |||
| Copy Program MB/s (MB/s) | 766 | 653 -15% | 614 -20% | |||
| Copy Game MB/s (MB/s) | 1190 | 512 -57% | 414.9 -65% | |||
| CrystalDiskMark 5.2 / 6 | 44% | -12% | -5% | -7% | -36% | |
| Write 4K (MB/s) | 124.2 | 213.2 72% | 132 6% | 134.8 9% | 120.3 -3% | 89.7 -28% |
| Read 4K (MB/s) | 46.11 | 59.2 28% | 52 13% | 54.7 19% | 41.81 -9% | 36.59 -21% |
| Write Seq (MB/s) | 1124 | 973 | 872 | 619 | 422.4 | |
| Read Seq (MB/s) | 1156 | 1606 | 1447 | 1119 | 454.9 | |
| Write 4K Q32T1 (MB/s) | 447 | 588 32% | 210.4 -53% | 392.2 -12% | 492.2 10% | 321.1 -28% |
| Read 4K Q32T1 (MB/s) | 350.1 | 612 75% | 312.2 -11% | 331.6 -5% | 398.8 14% | 340.1 -3% |
| Write Seq Q32T1 (MB/s) | 1463 | 1112 -24% | 982 -33% | 920 -37% | 812 -44% | 509 -65% |
| Read Seq Q32T1 (MB/s) | 1751 | 3121 78% | 1847 5% | 1723 -2% | 1616 -8% | 545 -69% |
| Write 4K Q8T8 (MB/s) | 445.5 | |||||
| Read 4K Q8T8 (MB/s) | 926 | |||||
| Totaal Gemiddelde (Programma / Instellingen) | 41% /
40% | -16% /
-17% | -15% /
-17% | -20% /
-25% | -44% /
-47% |
* ... kleiner is beter

Disk Throttling: DiskSpd Read Loop, Queue Depth 8
| 3DMark 11 Performance | 5180 punten | |
| 3DMark Ice Storm Standard Score | 22597 punten | |
| 3DMark Cloud Gate Standard Score | 15382 punten | |
| 3DMark Fire Strike Score | 3470 punten | |
| 3DMark Fire Strike Extreme Score | 1773 punten | |
| 3DMark Time Spy Score | 1293 punten | |
Help | ||
| BioShock Infinite | |
| 1920x1080 Ultra Preset, DX11 (DDOF) | |
| MSI Prestige 15 A10SC | |
| HP Envy 17t-cg000 | |
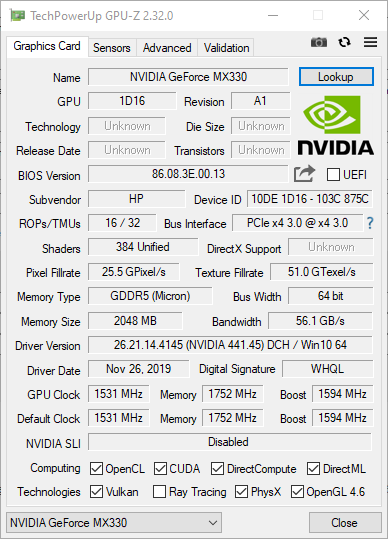
| Gemiddeld NVIDIA GeForce MX330 (n=1) | |
| HP Envy 17-ce1004ng | |
| Microsoft Surface Laptop 3 15 i7-1065G7 | |
| 1366x768 High Preset | |
| MSI Prestige 15 A10SC | |
| HP Envy 17-ce1004ng | |
| HP Envy 17t-cg000 | |
| Gemiddeld NVIDIA GeForce MX330 (n=1) | |
| Microsoft Surface Laptop 3 15 i7-1065G7 | |
| 1366x768 Medium Preset | |
| MSI Prestige 15 A10SC | |
| HP Envy 17-ce1004ng | |
| HP Envy 17t-cg000 | |
| Gemiddeld NVIDIA GeForce MX330 (n=1) | |
| Microsoft Surface Laptop 3 15 i7-1065G7 | |
| 1280x720 Very Low Preset | |
| MSI Prestige 15 A10SC | |
| HP Envy 17t-cg000 | |
| Gemiddeld NVIDIA GeForce MX330 (n=1) | |
| HP Envy 17-ce1004ng | |
| Microsoft Surface Laptop 3 15 i7-1065G7 | |
| lage | gem. | hoge | ultra | 4K | |
|---|---|---|---|---|---|
| BioShock Infinite (2013) | 173.9 | 113.8 | 96 | 37.9 | |
| The Witcher 3 (2015) | 17 | ||||
| Dota 2 Reborn (2015) | 110 | 104 | 73.2 | 65.3 | 25.4 |
| X-Plane 11.11 (2018) | 71 | 56.5 | 51.3 | 23.9 | |
| Shadow of the Tomb Raider (2018) | 42 | 17 | 10 | 8 | |
| F1 2019 (2019) | 73 | 31 | 24 | 19 |
| HP Envy 17t-cg000 GeForce MX330, i7-1065G7, WDC PC SN520 SDAPNUW-512G | Medion Akoya P17605 GeForce MX250, i7-10510U, Phison E12-256G-Phison-SSD-B16-BB1 | Asus VivoBook 17 M712DA-AU017T Vega 8, R5 3500U, Intel SSD 660p SSDPEKNW512G8 | HP Envy 17-ce1004ng GeForce MX250, i7-10510U, Intel SSD 660p SSDPEKNW512G8 | Dell Inspiron 17 3780 Radeon 520, i7-8565U, SK Hynix BC501 NVMe 256 GB | LG Gram 17Z990-R.AAS7U1 UHD Graphics 620, i7-8565U, Samsung SSD PM871b MZNLN256HAJQ | |
|---|---|---|---|---|---|---|
| Noise | -2% | 4% | 2% | -5% | 7% | |
| uit / omgeving * (dB) | 28.2 | 30.3 -7% | 30.3 -7% | 30 -6% | 28.1 -0% | 28.1 -0% |
| Idle Minimum * (dB) | 28.2 | 32.4 -15% | 30.3 -7% | 30 -6% | 31.7 -12% | 28.1 -0% |
| Idle Average * (dB) | 28.2 | 32.4 -15% | 30.3 -7% | 30 -6% | 31.8 -13% | 28.1 -0% |
| Idle Maximum * (dB) | 29.5 | 32.7 -11% | 30.3 -3% | 30 -2% | 31.8 -8% | 28.1 5% |
| Load Average * (dB) | 43.9 | 36.4 17% | 31.6 28% | 36.4 17% | 38.7 12% | 35 20% |
| Witcher 3 ultra * (dB) | 43.9 | |||||
| Load Maximum * (dB) | 43.9 | 36 18% | 35.7 19% | 36.5 17% | 48.5 -10% | 37.4 15% |
* ... kleiner is beter
Geluidsniveau
| Onbelast |
| 28.2 / 28.2 / 29.5 dB (A) |
| Belasting |
| 43.9 / 43.9 dB (A) |
 | ||
30 dB stil 40 dB(A) hoorbaar 50 dB(A) luid |
||
min: | ||
(±) De maximumtemperatuur aan de bovenzijde bedraagt 42 °C / 108 F, vergeleken met het gemiddelde van 36.8 °C / 98 F, variërend van 21 tot 71 °C voor de klasse Multimedia.
(±) De bodem warmt op tot een maximum van 44.2 °C / 112 F, vergeleken met een gemiddelde van 39.1 °C / 102 F
(+) Bij onbelast gebruik bedraagt de gemiddelde temperatuur voor de bovenzijde 29.3 °C / 85 F, vergeleken met het apparaatgemiddelde van 31.3 °C / 88 F.
(±) Bij het spelen van The Witcher 3 is de gemiddelde temperatuur voor de bovenzijde 32.2 °C / 90 F, vergeleken met het apparaatgemiddelde van 31.3 °C / 88 F.
(+) De palmsteunen en het touchpad zijn met een maximum van ###max## °C / 82.4 F koeler dan de huidtemperatuur en voelen daarom koel aan.
(±) De gemiddelde temperatuur van de handpalmsteun van soortgelijke toestellen bedroeg 28.7 °C / 83.7 F (+0.7 °C / 1.3 F).
| Uit / Standby | |
| Inactief | |
| Belasting |
|
Key:
min: | |
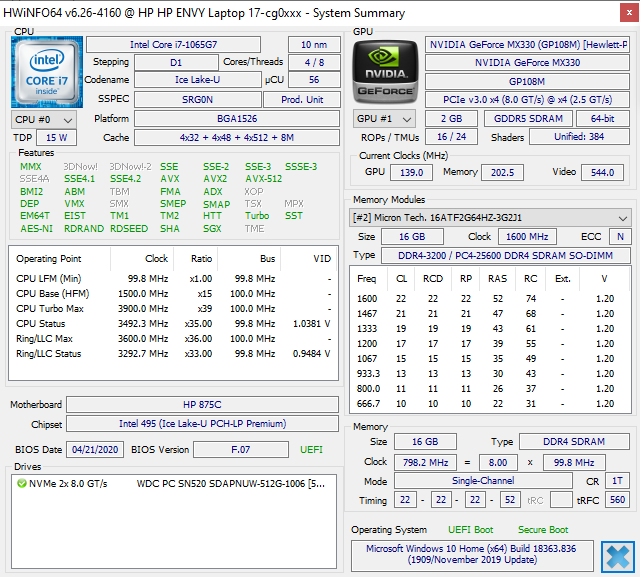
| HP Envy 17t-cg000 i7-1065G7, GeForce MX330, WDC PC SN520 SDAPNUW-512G, IPS, 3840x2160, 17.3" | Medion Akoya P17605 i7-10510U, GeForce MX250, Phison E12-256G-Phison-SSD-B16-BB1, IPS, 1920x1080, 17.3" | Asus VivoBook 17 M712DA-AU017T R5 3500U, Vega 8, Intel SSD 660p SSDPEKNW512G8, IPS, 1920x1080, 17.3" | HP Envy 17-ce1004ng i7-10510U, GeForce MX250, Intel SSD 660p SSDPEKNW512G8, IPS, 1920x1080, 17.3" | Dell Inspiron 17 3780 i7-8565U, Radeon 520, SK Hynix BC501 NVMe 256 GB, IPS, 1920x1080, 17.3" | LG Gram 17Z990-R.AAS7U1 i7-8565U, UHD Graphics 620, Samsung SSD PM871b MZNLN256HAJQ, IPS, 2560x1600, 17" | |
|---|---|---|---|---|---|---|
| Power Consumption | 24% | 43% | 33% | 22% | 47% | |
| Idle Minimum * (Watt) | 6.1 | 4.2 31% | 4.2 31% | 3.6 41% | 5 18% | 2.7 56% |
| Idle Average * (Watt) | 13 | 9.9 24% | 7.9 39% | 8.5 35% | 10.9 16% | 8.1 38% |
| Idle Maximum * (Watt) | 13.5 | 11.6 14% | 8.4 38% | 10.4 23% | 12 11% | 10.2 24% |
| Load Average * (Watt) | 72.7 | 60 17% | 34 53% | 52.6 28% | 49.6 32% | 32.7 55% |
| Witcher 3 ultra * (Watt) | 62.2 | |||||
| Load Maximum * (Watt) | 97.1 | 64.1 34% | 43.7 55% | 61 37% | 66.9 31% | 34.8 64% |
* ... kleiner is beter
| HP Envy 17t-cg000 i7-1065G7, GeForce MX330, 55 Wh | Medion Akoya P17605 i7-10510U, GeForce MX250, 42.2 Wh | Asus VivoBook 17 M712DA-AU017T R5 3500U, Vega 8, 37 Wh | HP Envy 17-ce1004ng i7-10510U, GeForce MX250, 52 Wh | Dell Inspiron 17 3780 i7-8565U, Radeon 520, 42 Wh | LG Gram 17Z990-R.AAS7U1 i7-8565U, UHD Graphics 620, 72 Wh | |
|---|---|---|---|---|---|---|
| Batterijduur | 2% | -28% | 11% | -23% | 107% | |
| Reader / Idle (h) | 15.4 | 17 10% | 9.6 -38% | 34.8 126% | ||
| WiFi v1.3 (h) | 4.6 | 4.7 2% | 3.3 -28% | 4 -13% | 4.2 -9% | 11.9 159% |
| Load (h) | 1.4 | 1.9 36% | 1.1 -21% | 1.9 36% |
Pro
Contra
Dit is de verkorte versie van het originele artikel. Het volledige, Engelse testrapport vind je hier.
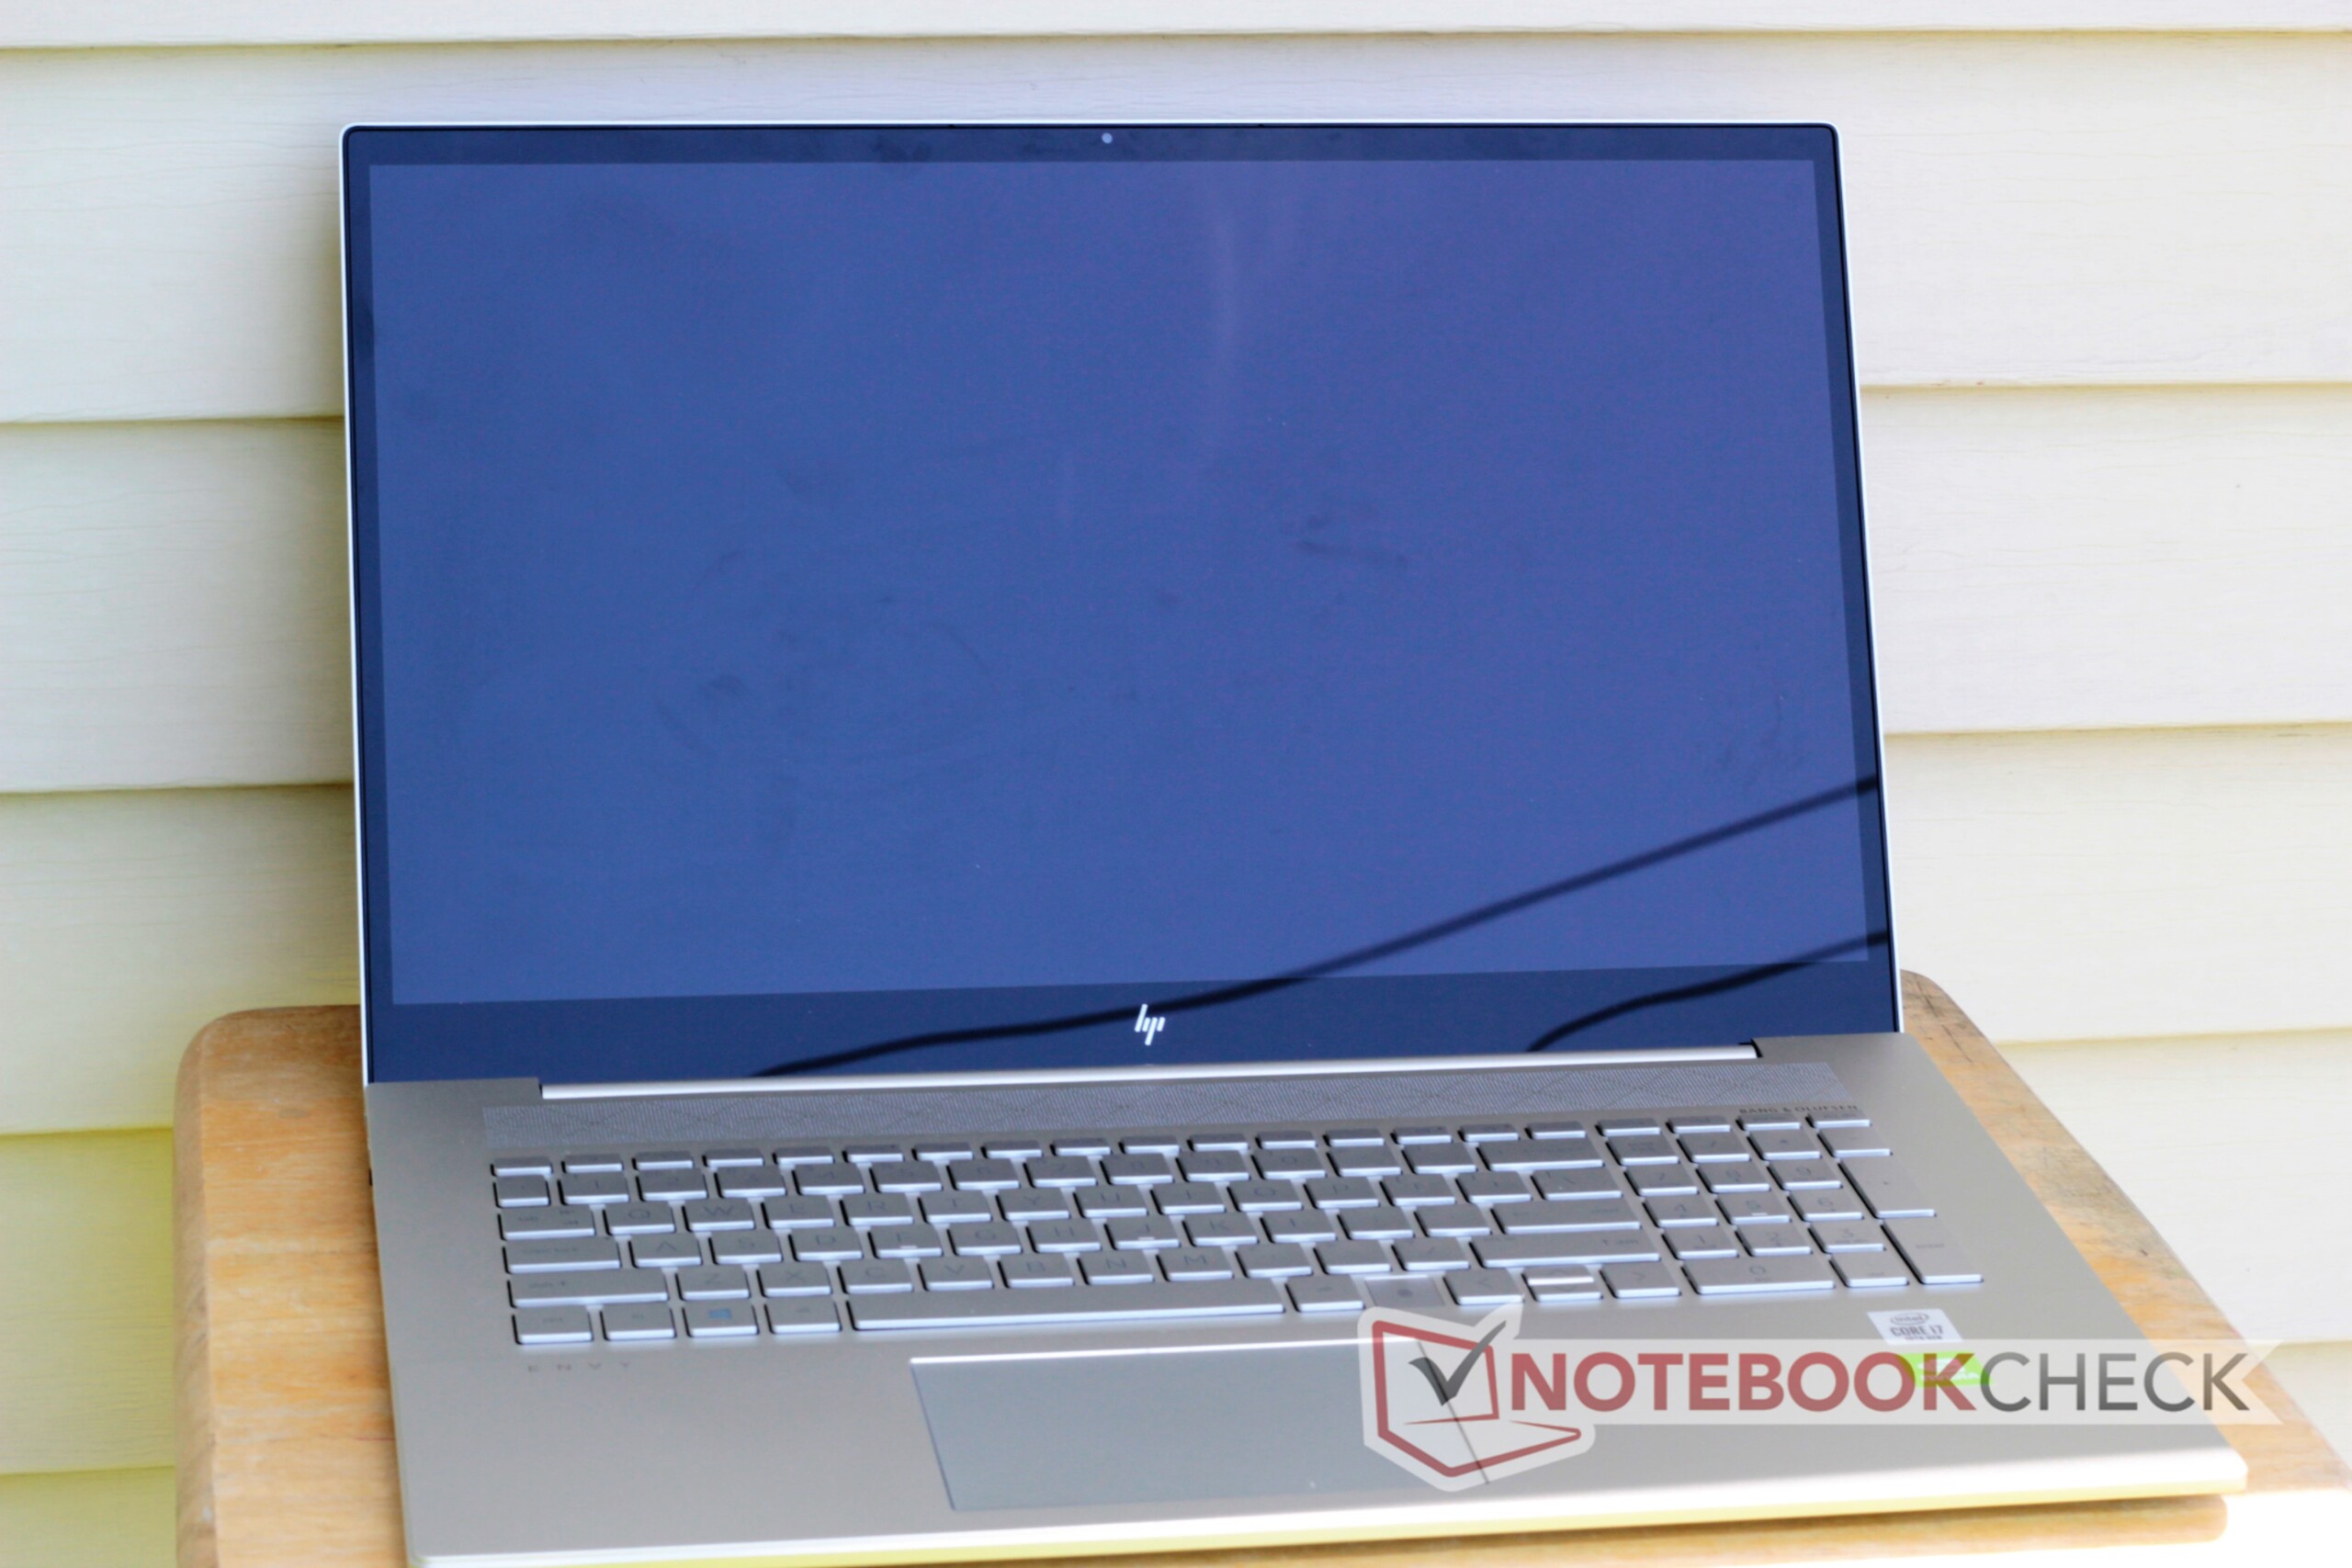
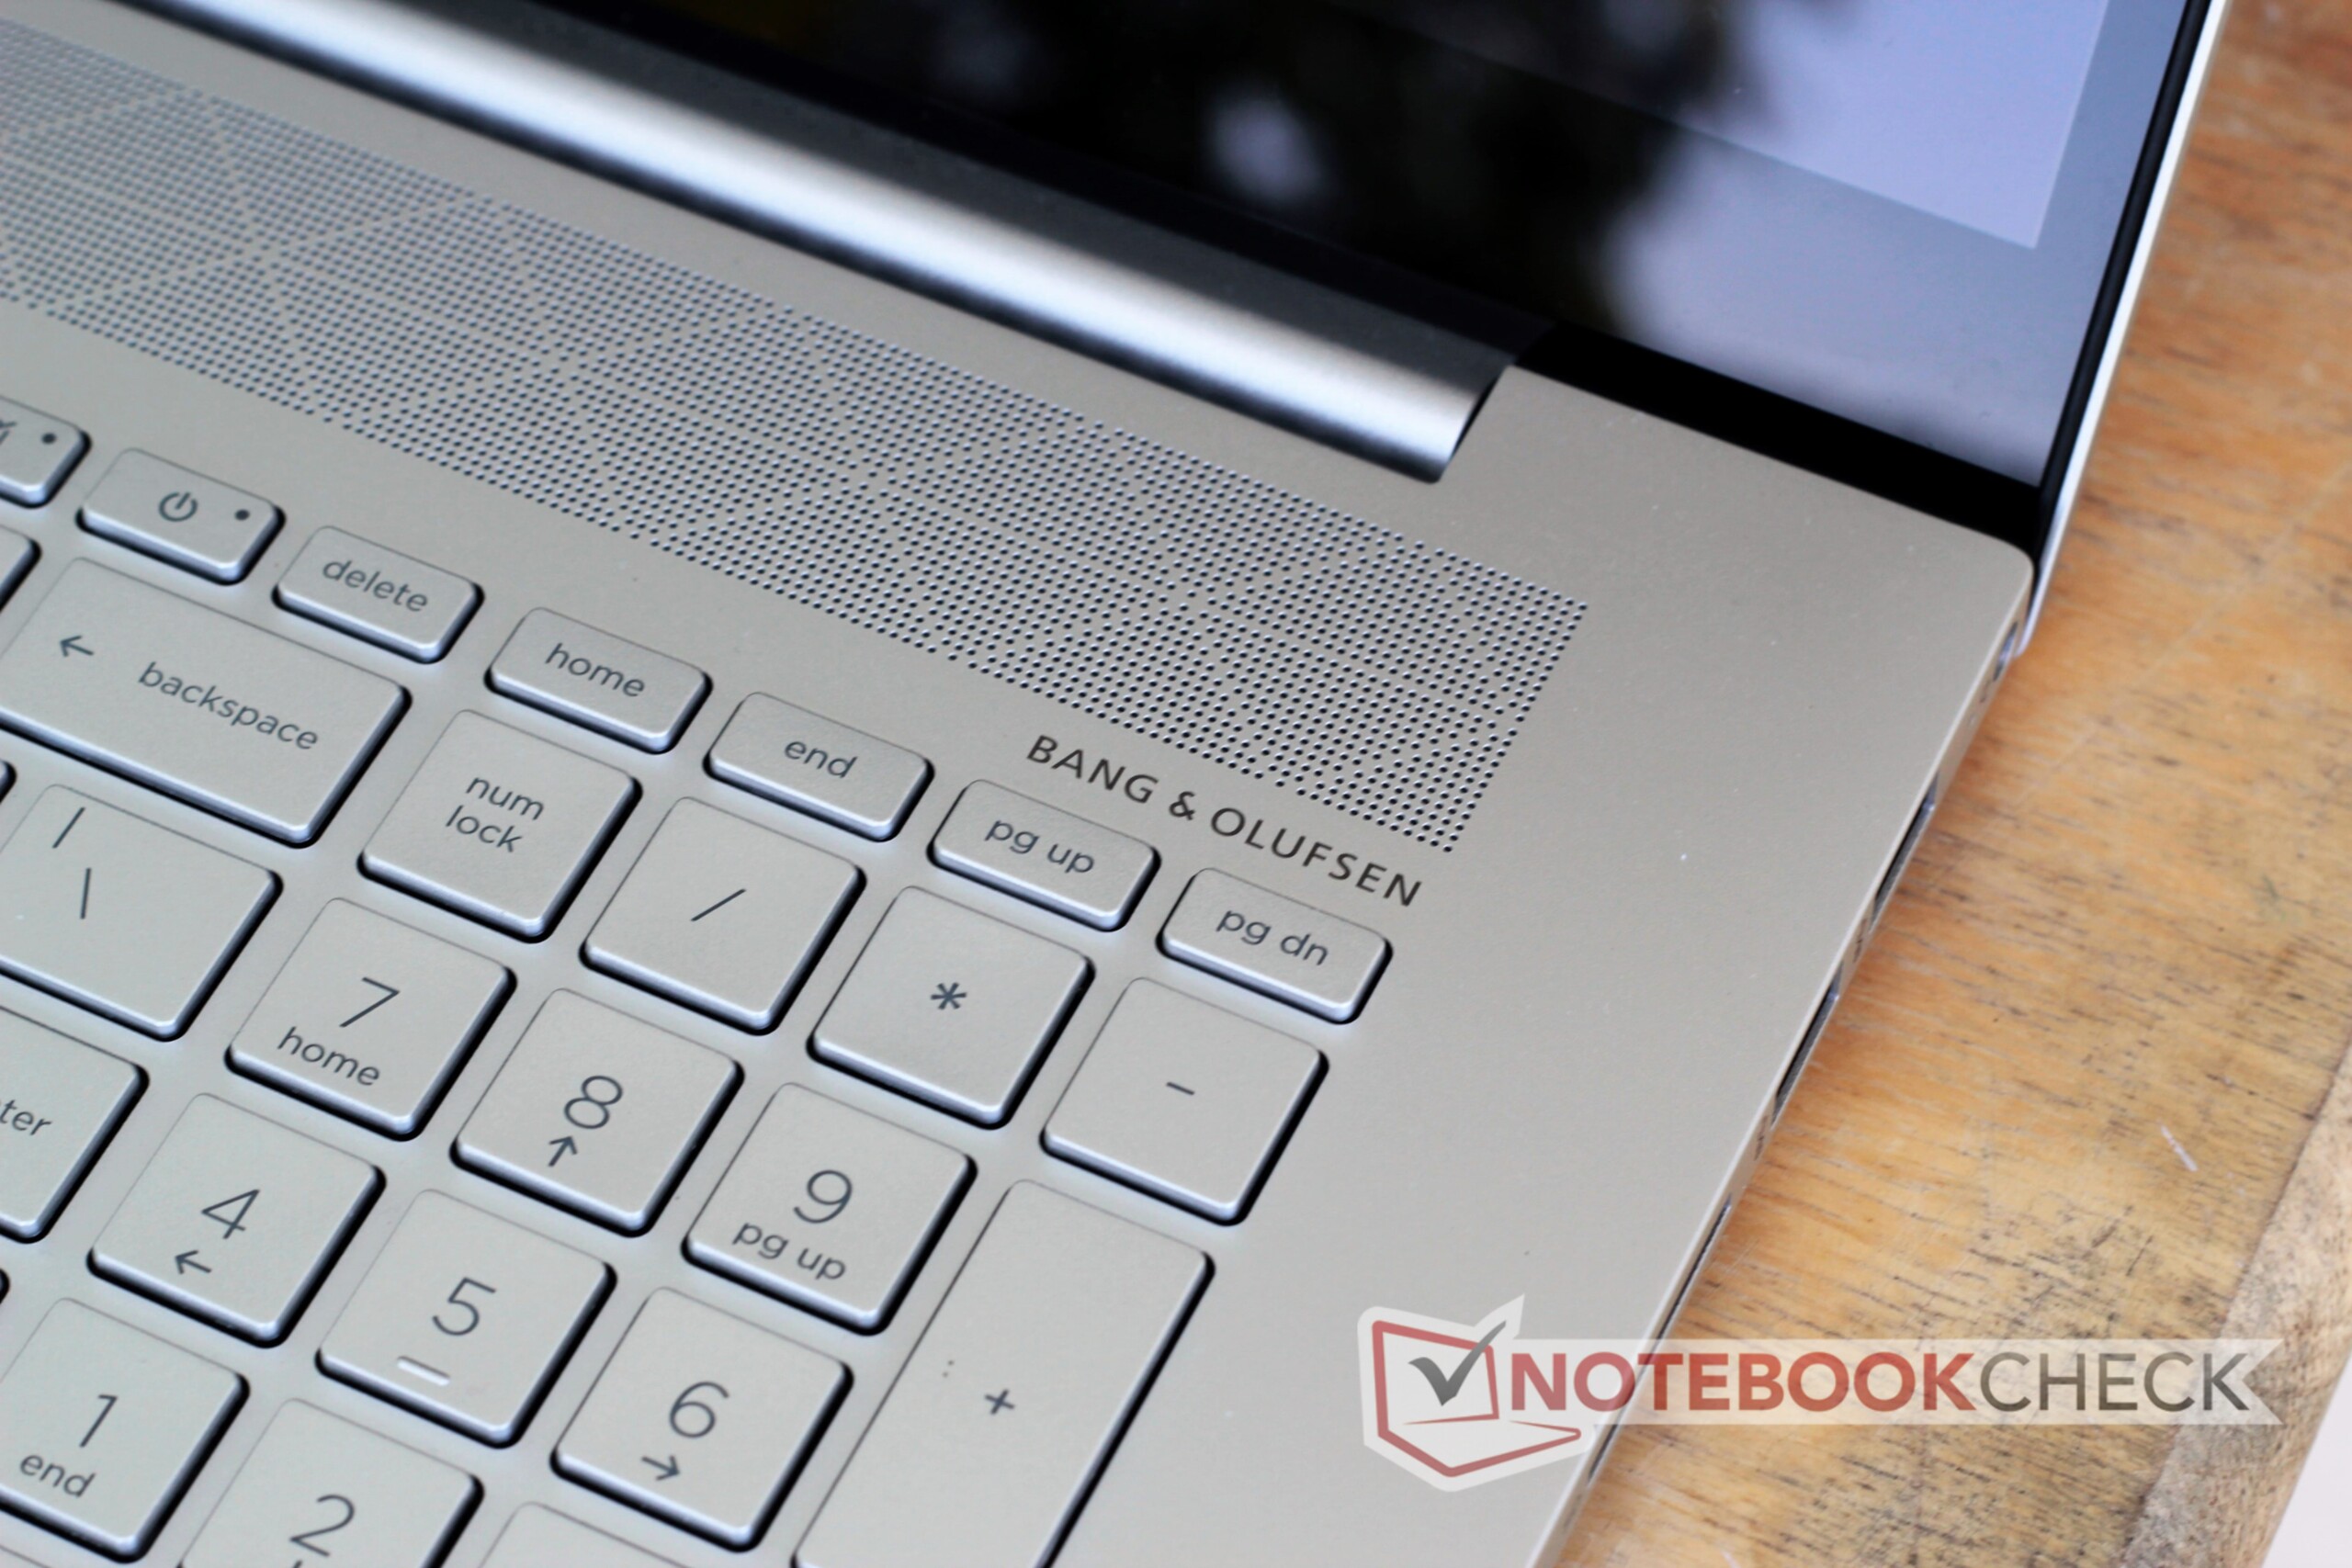
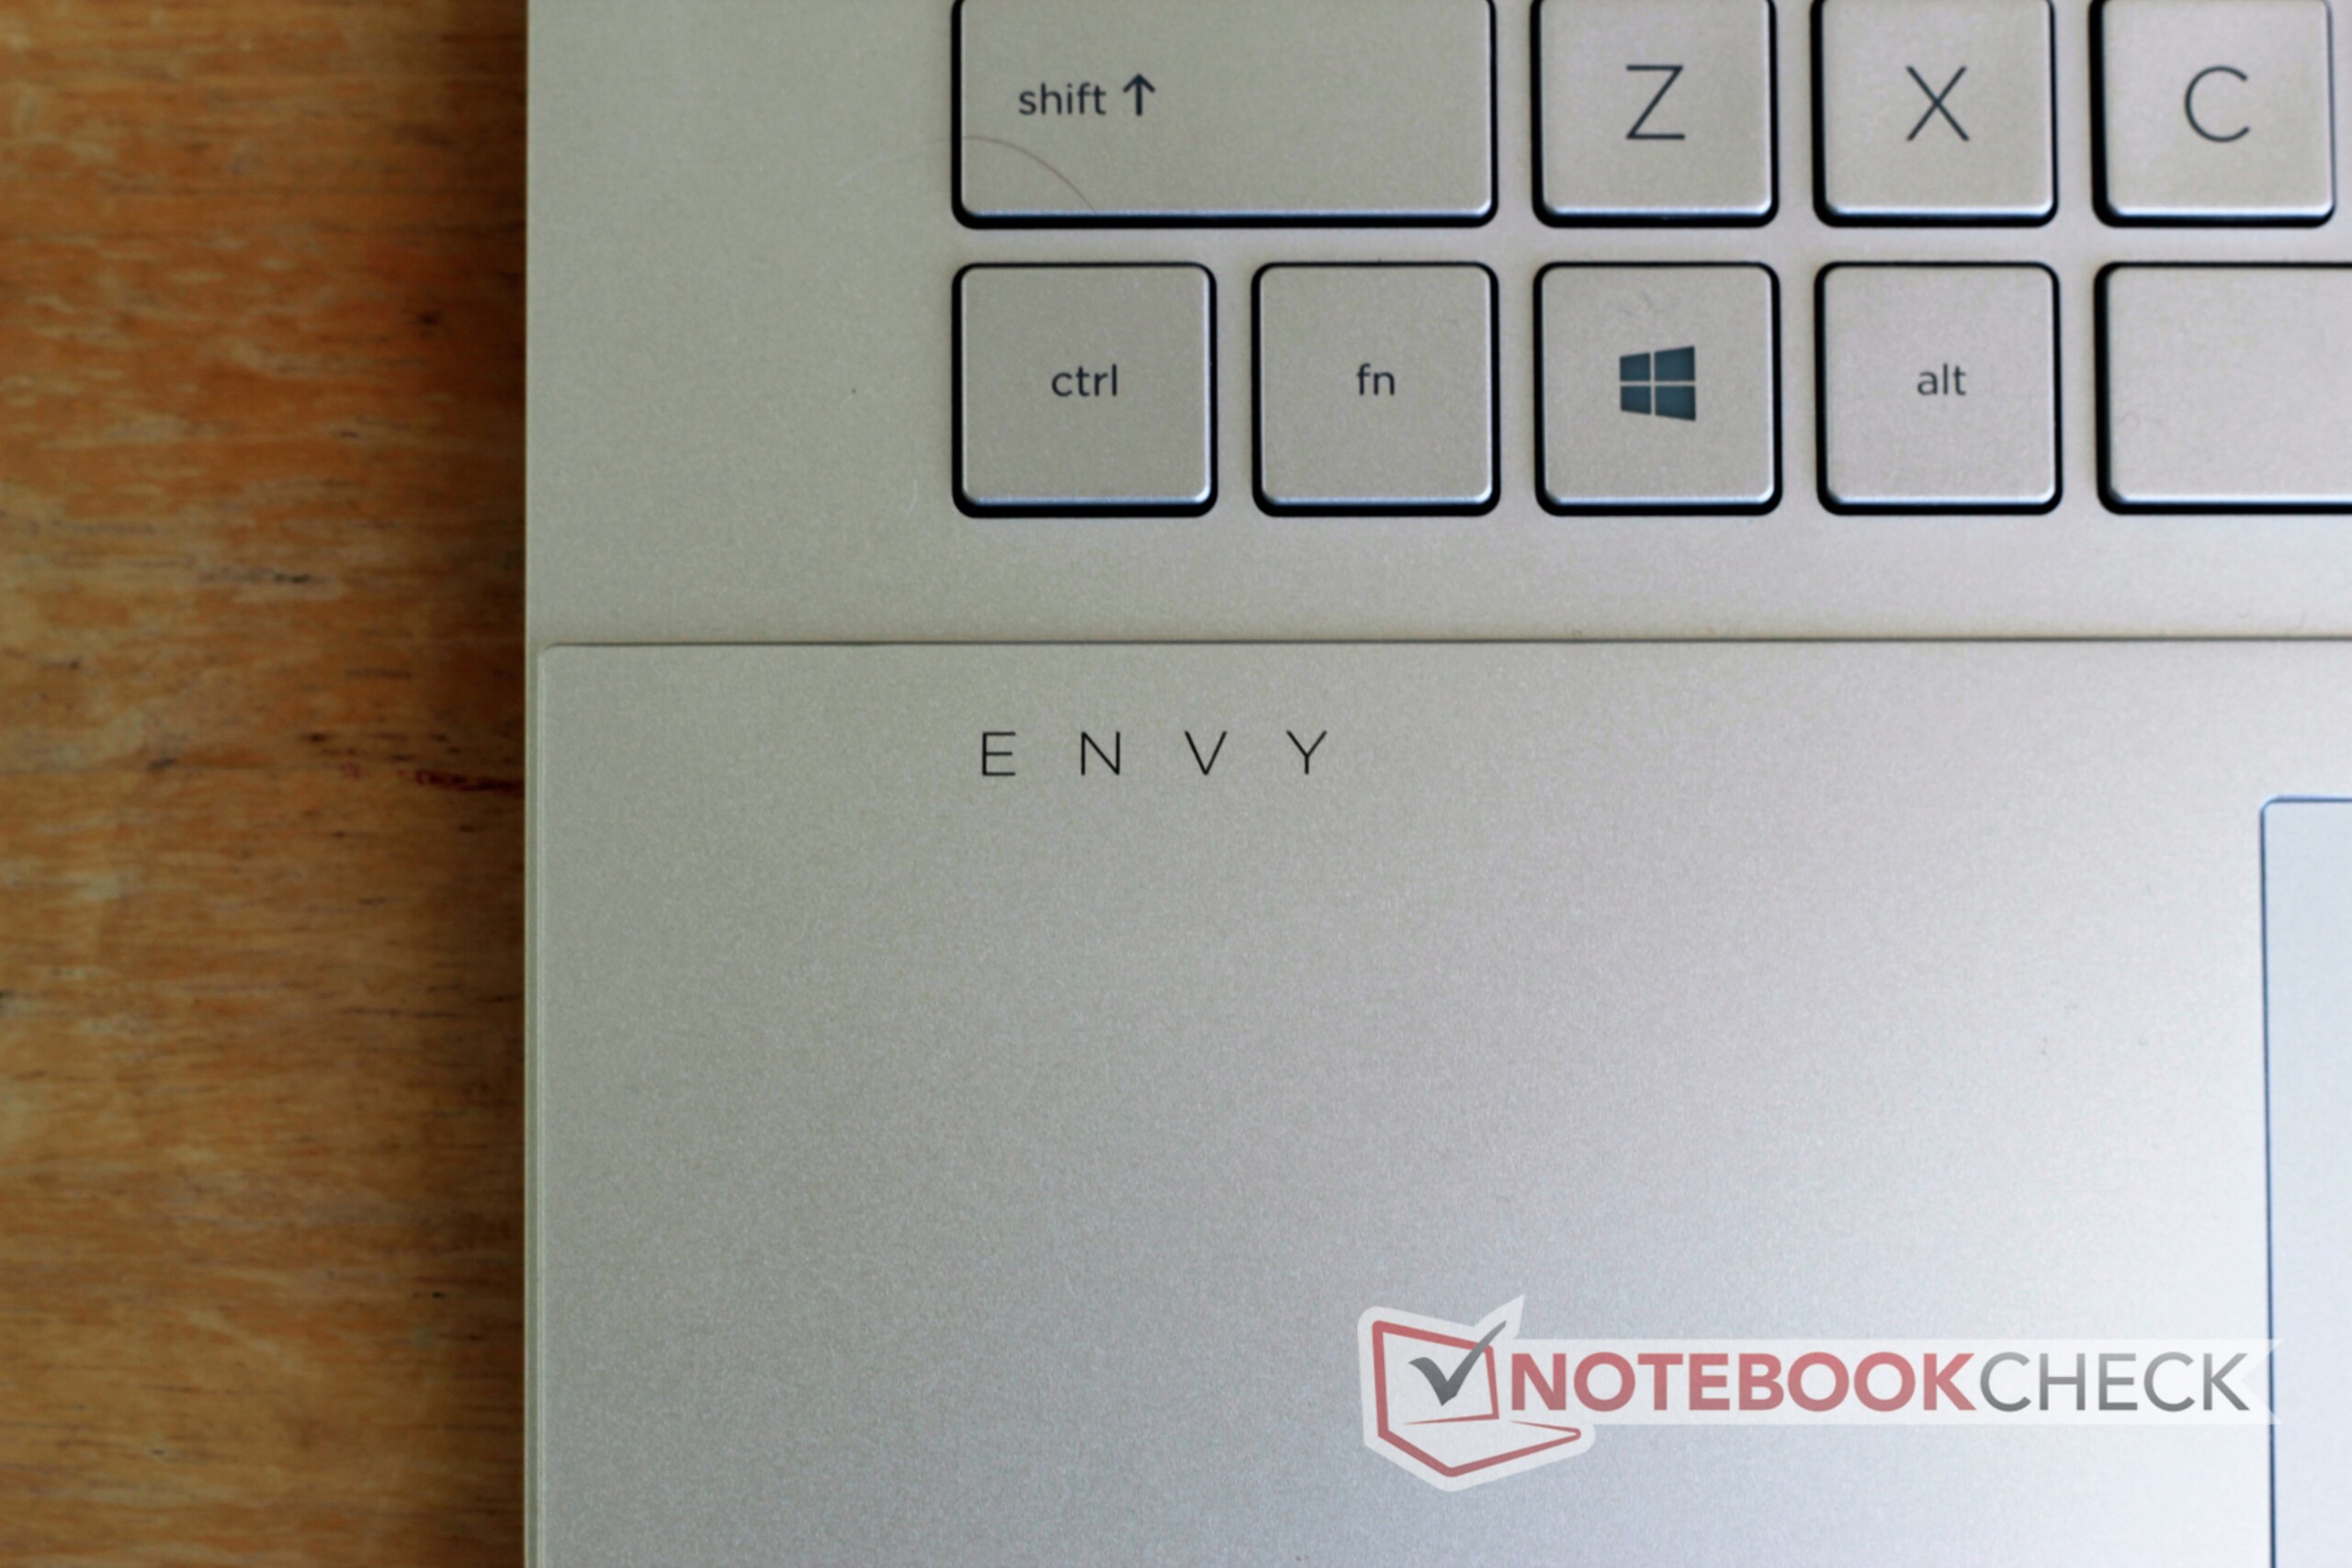
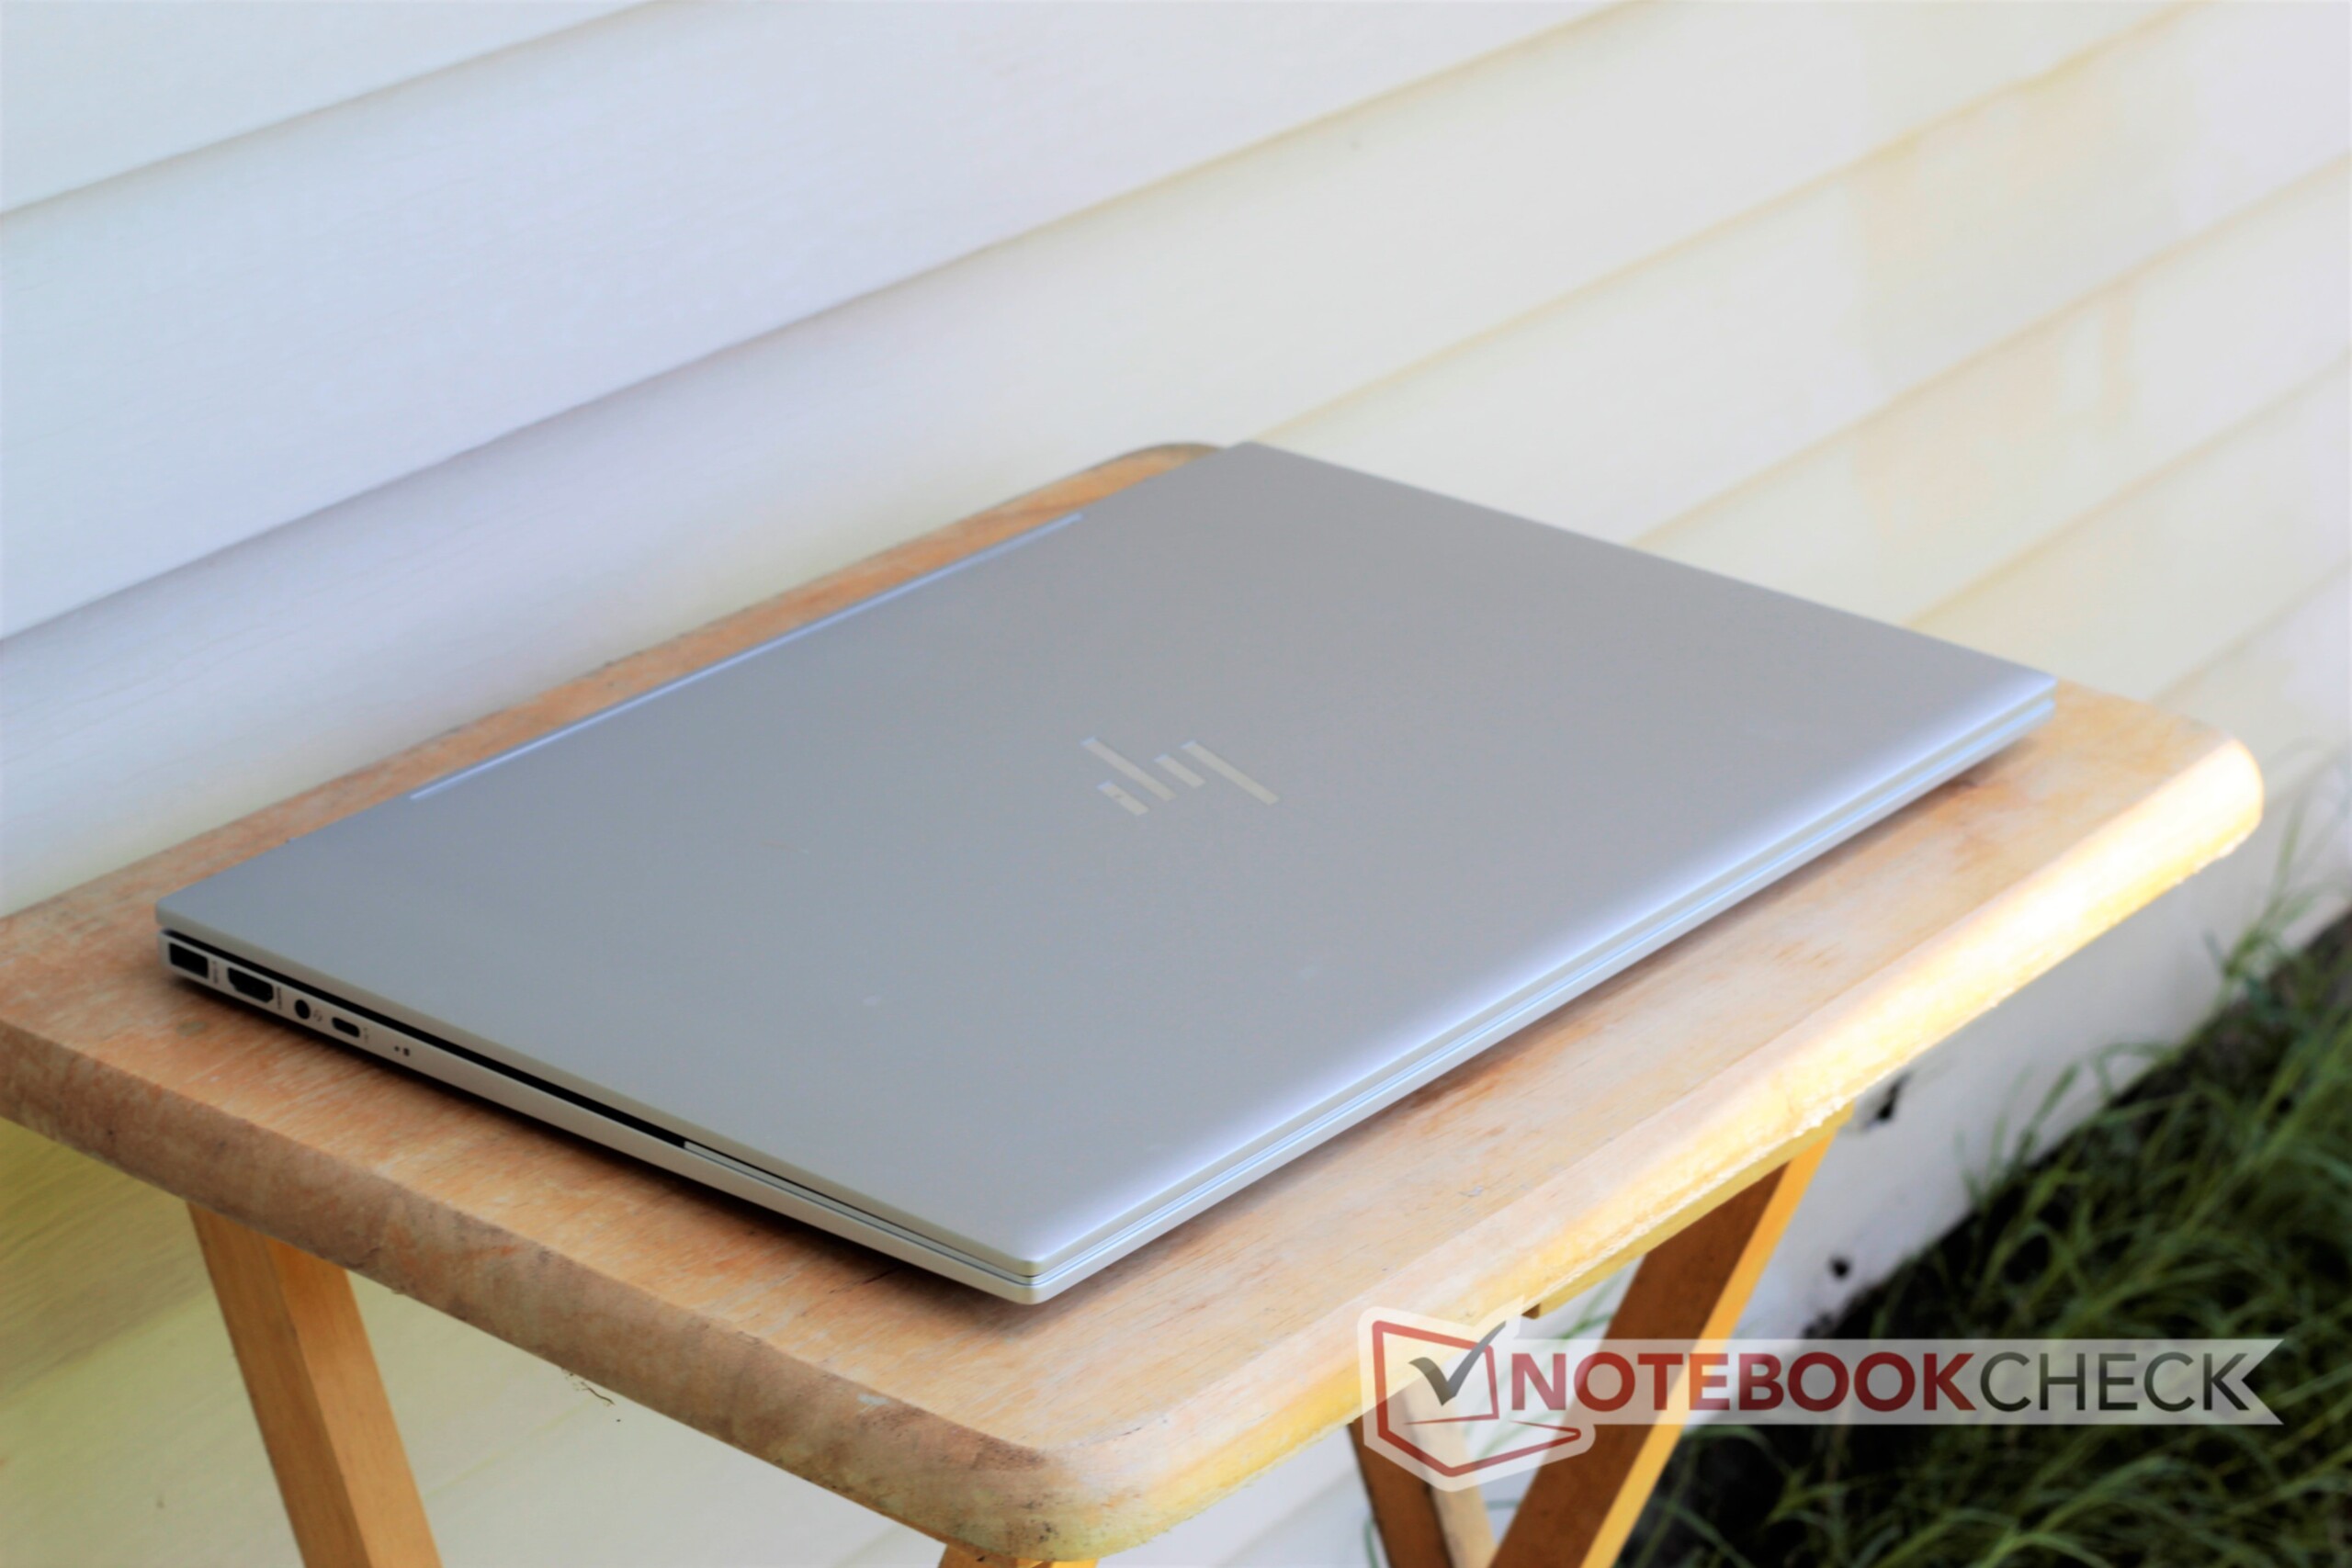
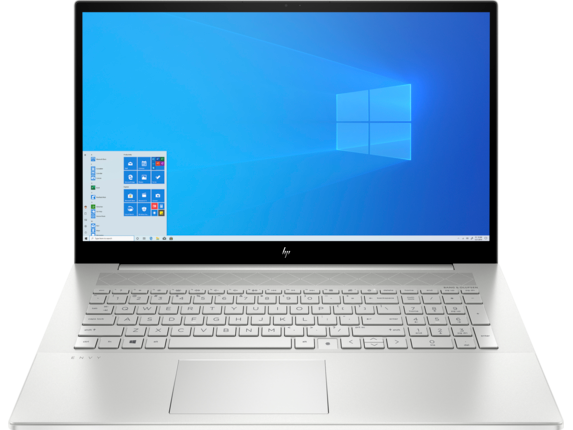
HP slaat verschillende homeruns met zijn Envy 17t. Zijn aluminium chassis is goed geconstrueerd en ziet er geweldig uit. De geanodiseerde afwerking moet hem een tijdje scherp houden. Het heldere 4K beeldscherm is prachtig en kleurecht. De Ice Lake Core i7 CPU en de NVIDIA GeForce MX330 GPU zorgen voor een soepele mediastroom en kunnen wat gamen aan. Het toetsenbord en touchpad zijn goed, de luidsprekers zijn pittig en de algehele ervaring is plezierig... voor het grootste deel.
Er zijn verschillende kleine ergernissen die afleiden van de hoogtepunten. Zo is de vervanging van de rechter Ctrl-knop door een vingerafdruklezer verbijsterend. Gezien hoe veel voorkomend vele sneltoetscombinaties zijn, is het verbijsterend hoe HP dacht dat deze configuratie een goed idee was. De ventilator, hoewel stil onder lichte belasting, maakt een raspend geluid wanneer de belasting oploopt. Tot slot is de batterijduur van de machine teleurstellend.
De Envy 17t is vrij goed voor wat het is, maar bij een gemiddelde verkoopprijs van €1600 zijn de ergernissen die we opmerkten meer dan niet ter zake doende. Ondanks deze gebreken is de Envy 17t een van de betere laptops van 17,3 inch die vandaag de dag beschikbaar zijn. Toch zijn er op dit prijspunt een aantal betere opties. Dell's Inspiron 17-7786 convertible biedt vergelijkbare hardware tegen een iets lagere prijs. De HP Pavilion Gaming 17 mist de bouwkwaliteit van de Envy 17t maar biedt een veel krachtigere GPU en een snellere processor voor ongeveer €300 minder.
HP Envy 17t-cg000
- 10-06-2020 v7 (old)
Sam Medley
Price comparison
