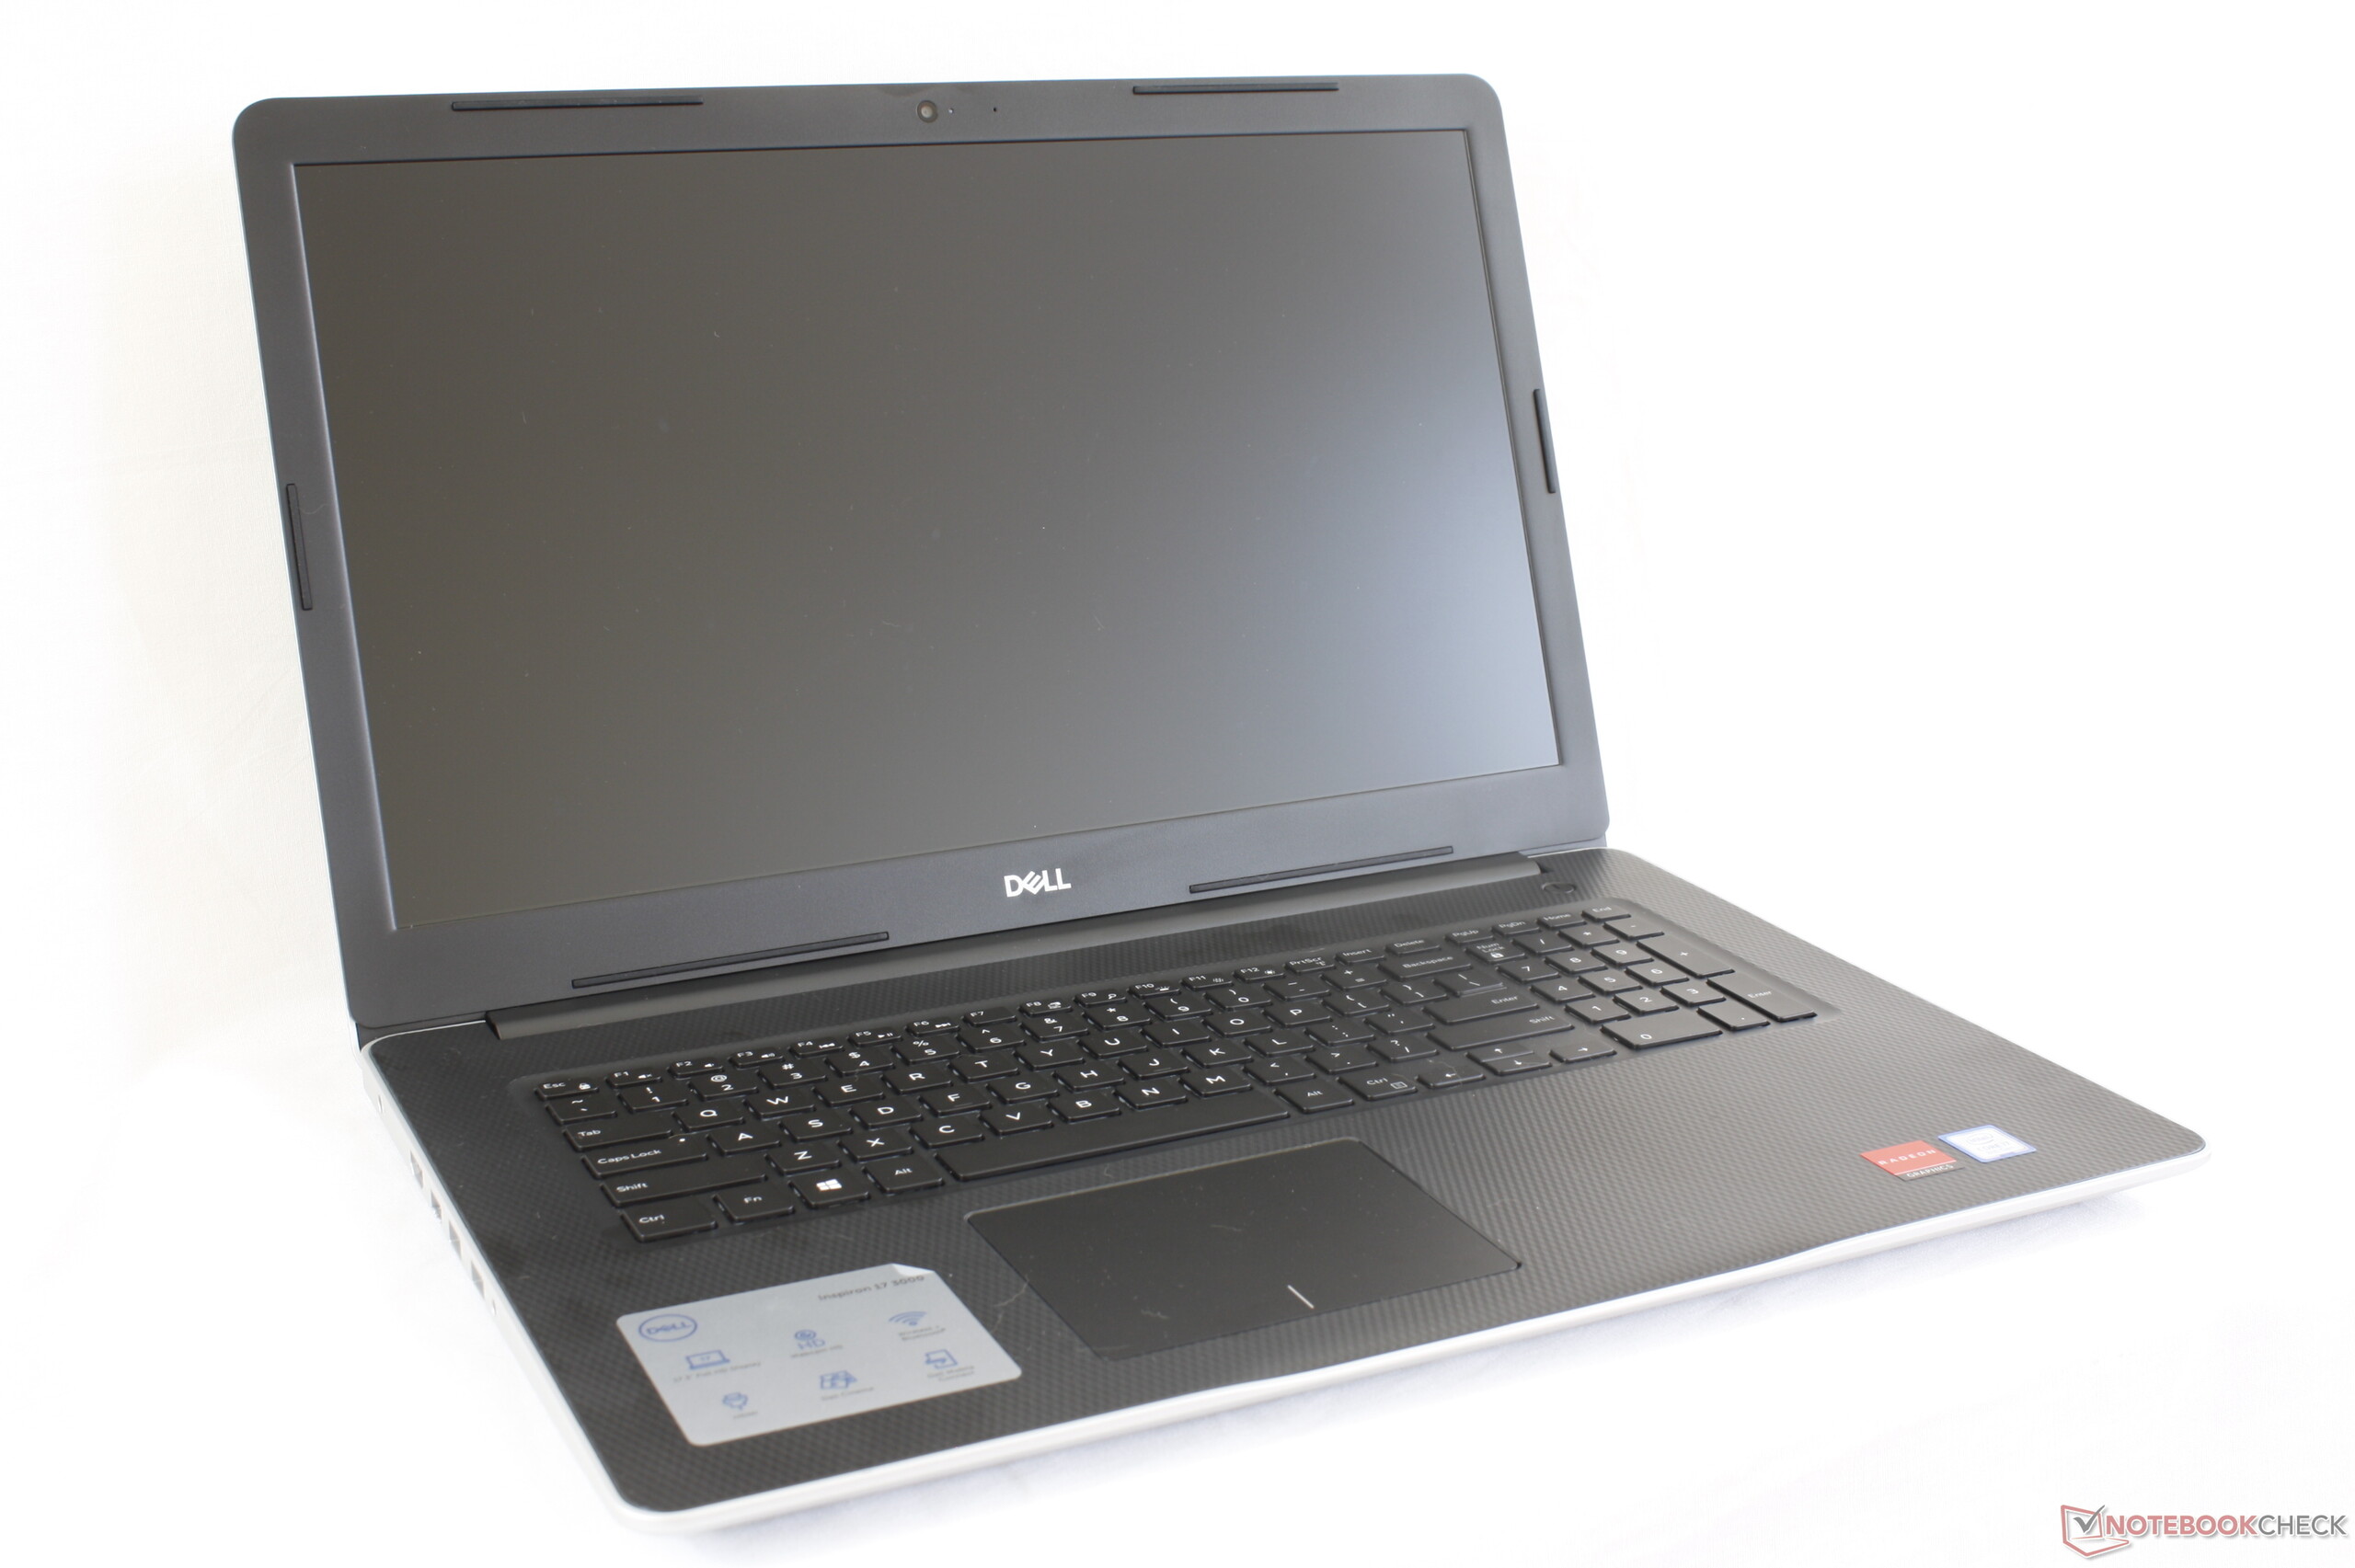
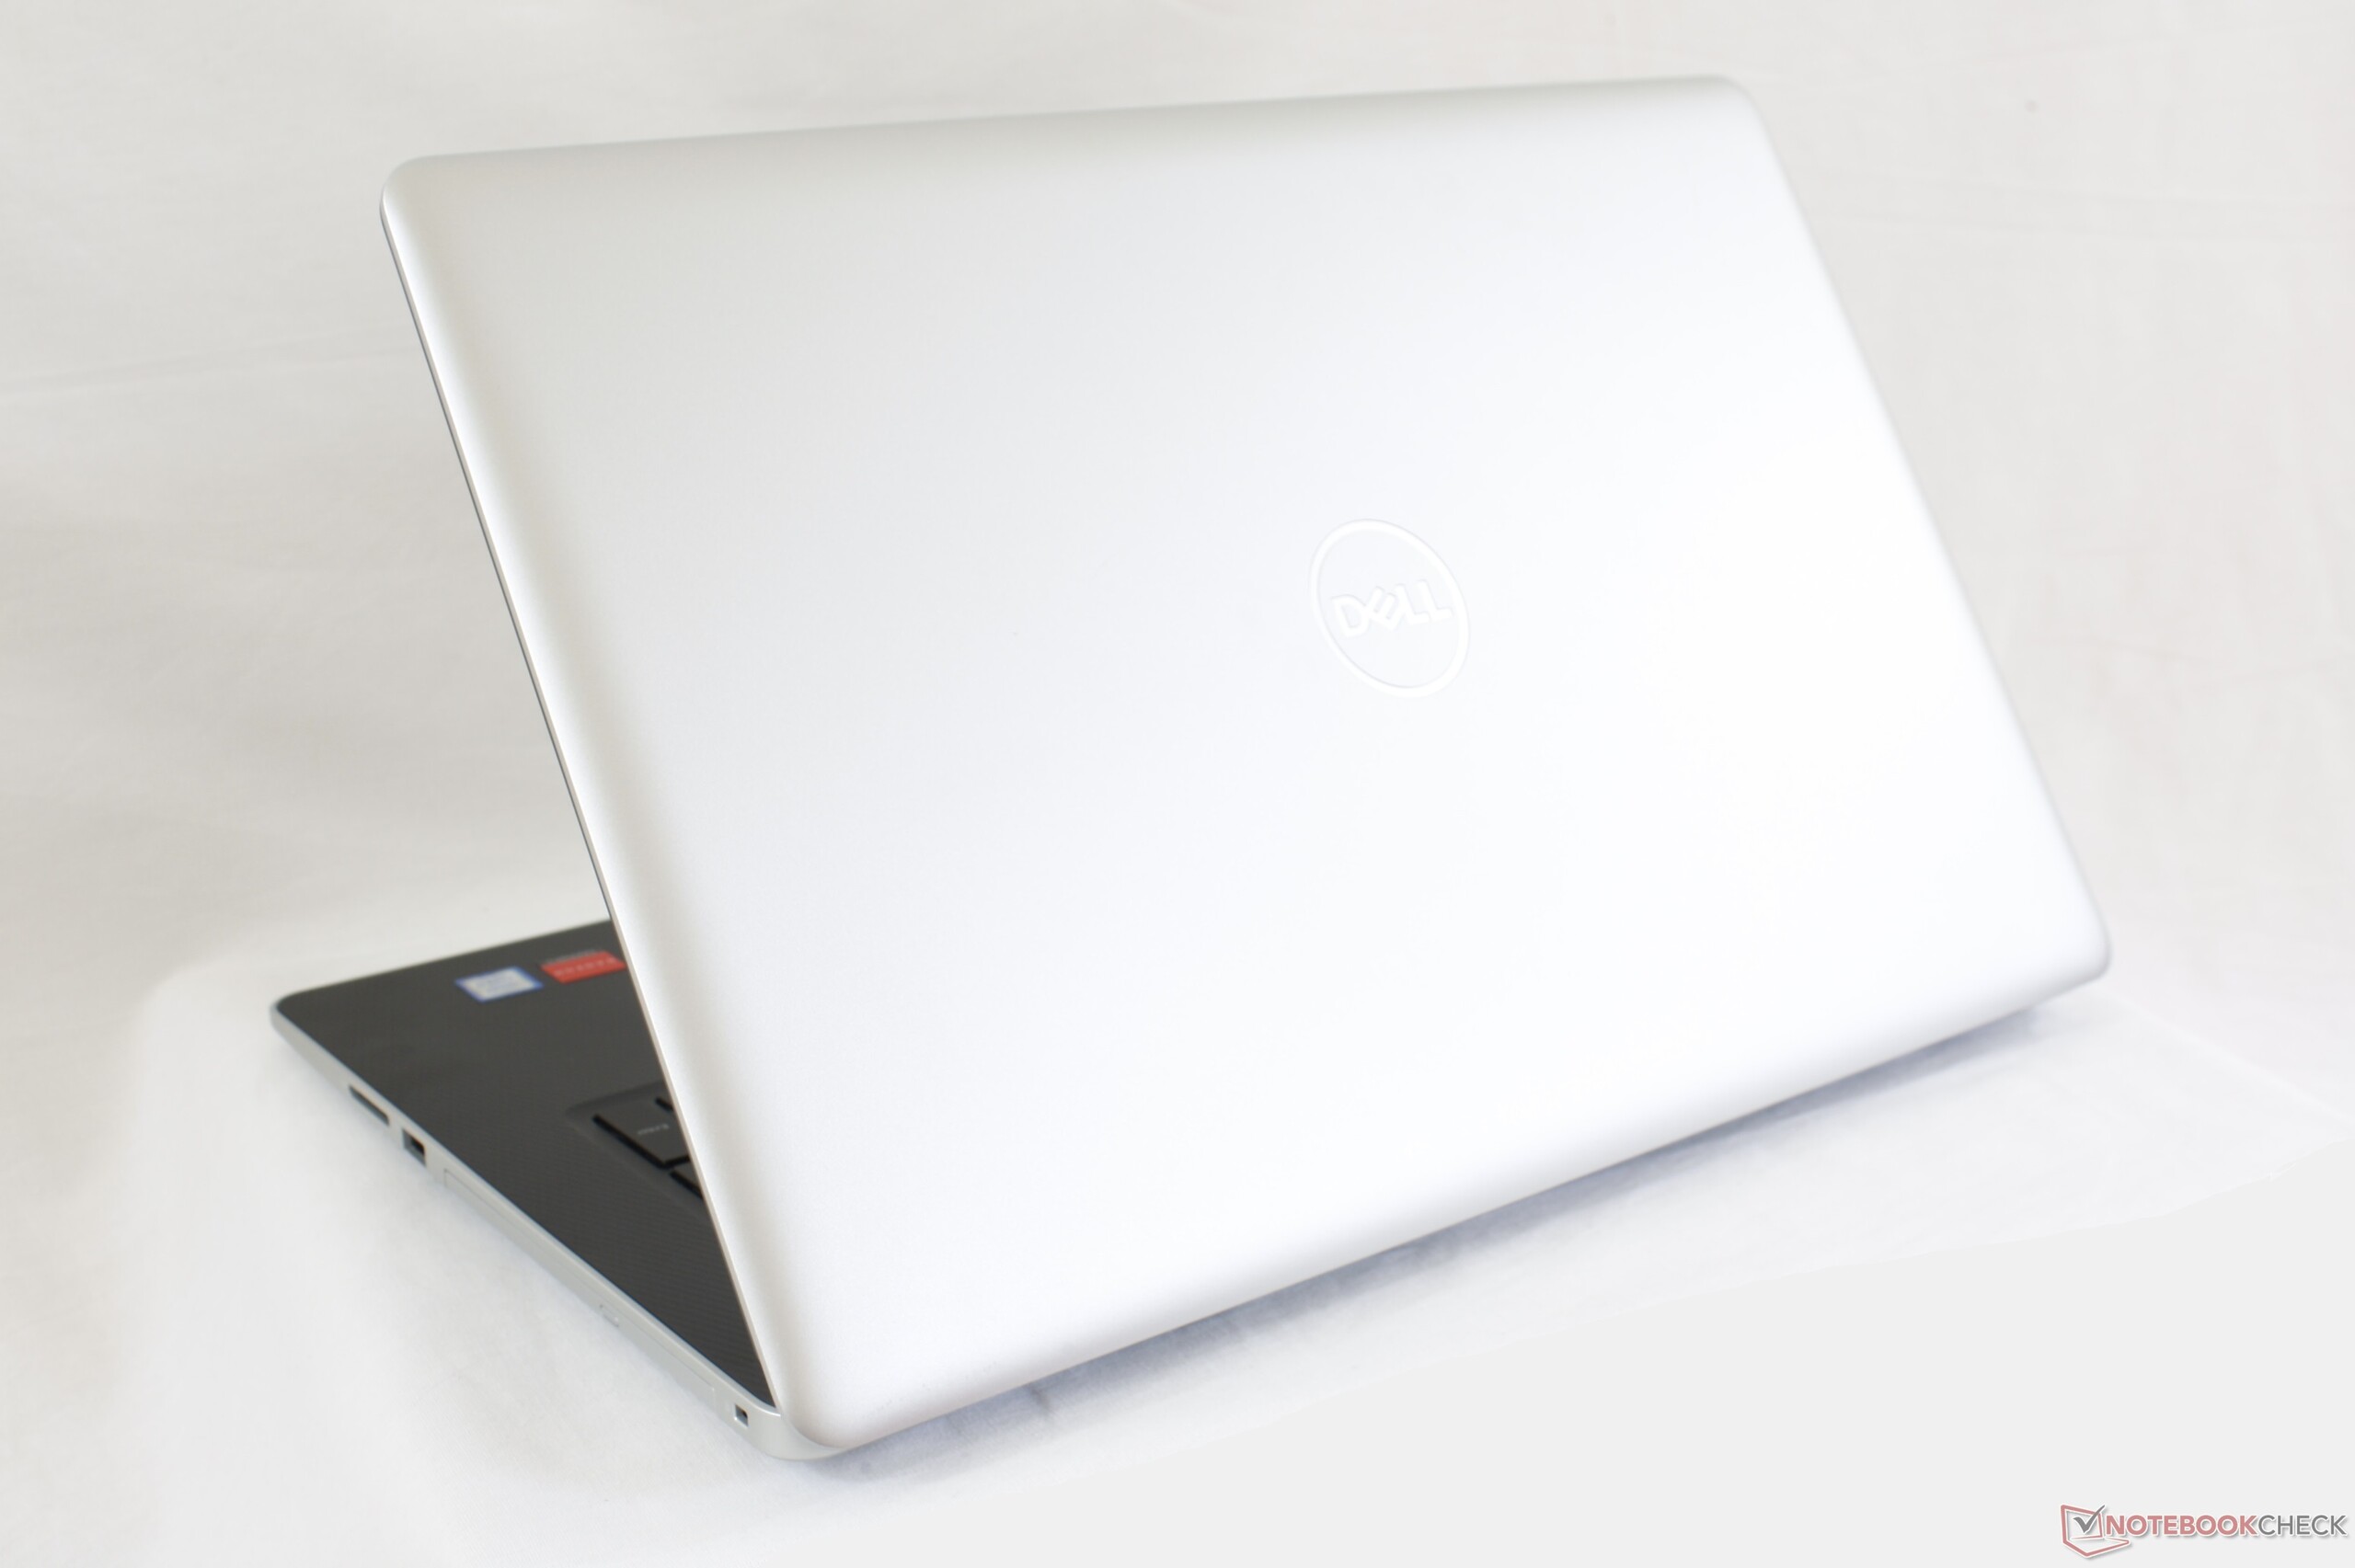
Kort testrapport Dell Inspiron 17 3000 3780 (i7-8565U, Radeon 520) Laptop
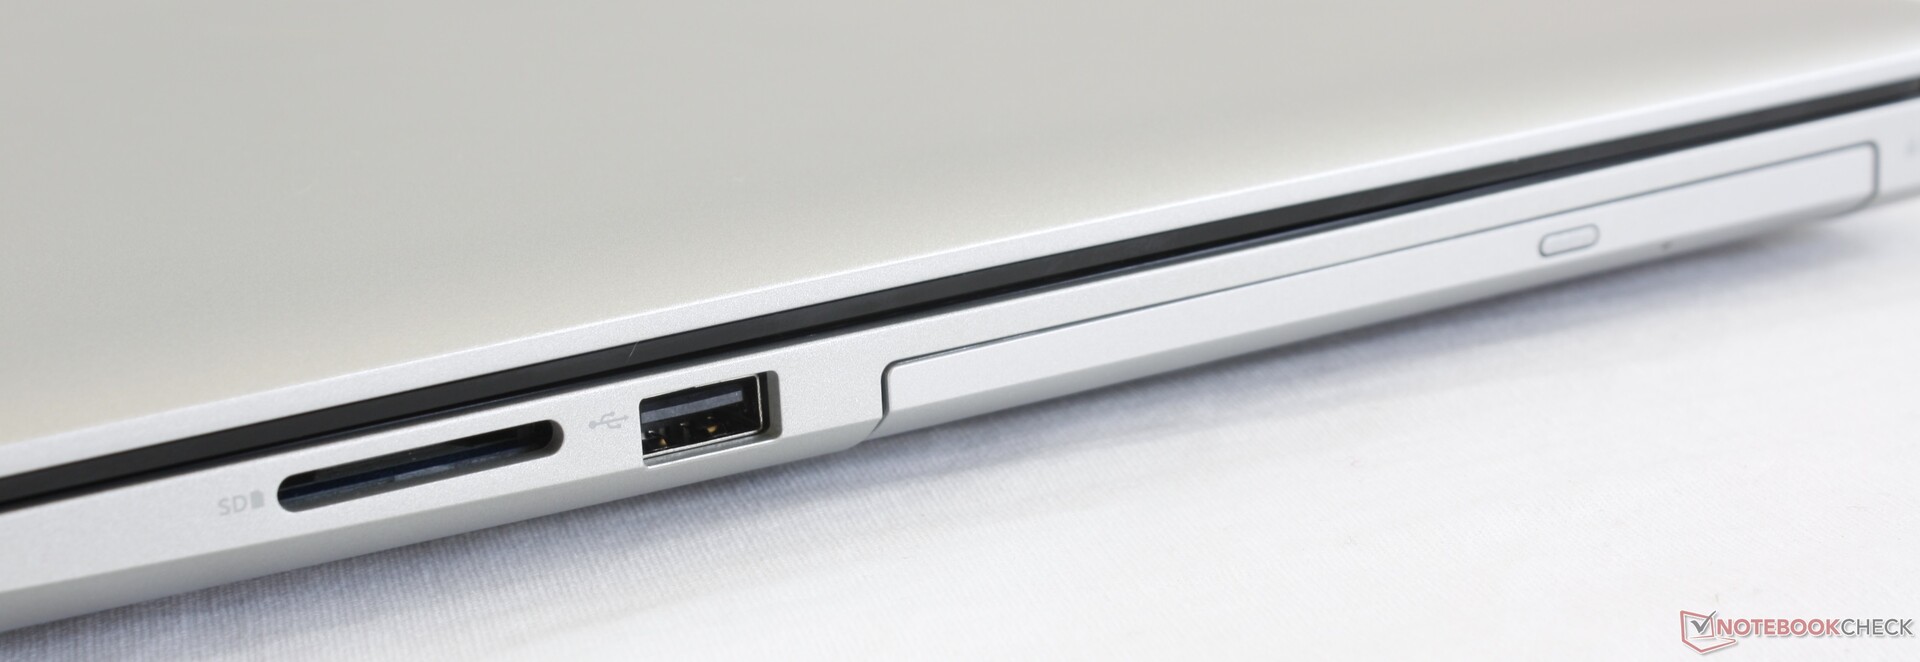
| SD Card Reader | |
| average JPG Copy Test (av. of 3 runs) | |
| Lenovo ThinkPad P71-20HK0004GE | |
| HP ProBook 470 G5 (Toshiba Exceria Pro SDXC 64 GB UHS-II) | |
| Dell Inspiron 17 3780 (Toshiba Exceria Pro SDXC 64 GB UHS-II) | |
| Dell Inspiron 17-7786 (Toshiba Exceria Pro SDXC 64 GB UHS-II) | |
| Lenovo V320-17IKB-81CN000MGE (Toshiba Exceria Pro SDXC 64 GB UHS-II) | |
| maximum AS SSD Seq Read Test (1GB) | |
| Lenovo ThinkPad P71-20HK0004GE | |
| HP ProBook 470 G5 (Toshiba Exceria Pro SDXC 64 GB UHS-II) | |
| Dell Inspiron 17 3780 (Toshiba Exceria Pro SDXC 64 GB UHS-II) | |
| Dell Inspiron 17-7786 (Toshiba Exceria Pro SDXC 64 GB UHS-II) | |
| Lenovo V320-17IKB-81CN000MGE (Toshiba Exceria Pro SDXC 64 GB UHS-II) | |
| Networking | |
| iperf3 transmit AX12 | |
| HP ProBook 470 G5 | |
| Dell Inspiron 17-7786 | |
| Lenovo ThinkPad P71-20HK0004GE | |
| Dell Inspiron 17 3780 | |
| Lenovo V320-17IKB-81CN000MGE | |
| iperf3 receive AX12 | |
| Lenovo ThinkPad P71-20HK0004GE | |
| Dell Inspiron 17-7786 | |
| HP ProBook 470 G5 | |
| Dell Inspiron 17 3780 | |
| Lenovo V320-17IKB-81CN000MGE | |
| |||||||||||||||||||||||||
Helderheidsverdeling: 84 %
Helderheid in Batterij-modus: 322.9 cd/m²
Contrast: 1242:1 (Zwart: 0.26 cd/m²)
ΔE ColorChecker Calman: 4.19 | ∀{0.5-29.43 Ø4.73}
calibrated: 3.55
ΔE Greyscale Calman: 4.5 | ∀{0.09-98 Ø4.97}
88.4% sRGB (Argyll 1.6.3 3D)
57.6% AdobeRGB 1998 (Argyll 1.6.3 3D)
64.6% AdobeRGB 1998 (Argyll 3D)
88.9% sRGB (Argyll 3D)
63.7% Display P3 (Argyll 3D)
Gamma: 1.97
CCT: 7041 K
| Dell Inspiron 17 3780 AU Optronics B173HAN01.3, IPS, 17.3", 1920x1080 | Dell Inspiron 17-7786 LG Philips, 173W4F, IPS, 17.3", 1920x1080 | Lenovo V320-17IKB-81CN000MGE LG Philips LP173WF4-SPF5, IPS, 17.3", 1920x1080 | HP ProBook 470 G5 LG Philips, IPS, 17.3", 1920x1080 | Dell Inspiron 17-5770-0357 AUO109D (AU Optronics), IPS, 17.3", 1920x1080 | HP 17-ca0013ng LG Philips LGD059E, IPS, 17.3", 1920x1080 | |
|---|---|---|---|---|---|---|
| Display | -5% | -4% | -2% | 0% | 0% | |
| Display P3 Coverage (%) | 63.7 | 64.8 2% | 65.4 3% | 66.1 4% | 63.9 0% | 67 5% |
| sRGB Coverage (%) | 88.9 | 81.6 -8% | 82 -8% | 84.4 -5% | 88.7 0% | 86.4 -3% |
| AdobeRGB 1998 Coverage (%) | 64.6 | 59.7 -8% | 60 -7% | 61.8 -4% | 64.8 0% | 63.2 -2% |
| Response Times | 20% | 24% | 21% | 23% | 30% | |
| Response Time Grey 50% / Grey 80% * (ms) | 46 ? | 38 ? 17% | 33 ? 28% | 36 ? 22% | 38 ? 17% | 33 ? 28% |
| Response Time Black / White * (ms) | 35.2 ? | 27 ? 23% | 28 ? 20% | 28 ? 20% | 25 ? 29% | 24 ? 32% |
| PWM Frequency (Hz) | 119000 ? | |||||
| Screen | -12% | -8% | -16% | 9% | -14% | |
| Brightness middle (cd/m²) | 322.9 | 343 6% | 414 28% | 400 24% | 279 -14% | 394 22% |
| Brightness (cd/m²) | 322 | 313 -3% | 375 16% | 374 16% | 262 -19% | 352 9% |
| Brightness Distribution (%) | 84 | 82 -2% | 82 -2% | 87 4% | 85 1% | 83 -1% |
| Black Level * (cd/m²) | 0.26 | 0.37 -42% | 0.41 -58% | 0.63 -142% | 0.18 31% | 0.35 -35% |
| Contrast (:1) | 1242 | 927 -25% | 1010 -19% | 635 -49% | 1550 25% | 1126 -9% |
| Colorchecker dE 2000 * | 4.19 | 4.8 -15% | 4.5 -7% | 4.34 -4% | 3.58 15% | 6.08 -45% |
| Colorchecker dE 2000 max. * | 7.04 | 10.35 -47% | 9.59 -36% | 8.29 -18% | 5.98 15% | 10.88 -55% |
| Colorchecker dE 2000 calibrated * | 3.55 | 4.57 -29% | 2.8 21% | |||
| Greyscale dE 2000 * | 4.5 | 3.51 22% | 3.13 30% | 3.51 22% | 2.75 39% | 7.22 -60% |
| Gamma | 1.97 112% | 2.19 100% | 2.41 91% | 2.45 90% | 2.57 86% | 2.48 89% |
| CCT | 7041 92% | 6188 105% | 6198 105% | 6570 99% | 6836 95% | 7997 81% |
| Color Space (Percent of AdobeRGB 1998) (%) | 57.6 | 54 -6% | 54 -6% | 55 -5% | 58 1% | 57 -1% |
| Color Space (Percent of sRGB) (%) | 88.4 | 81 -8% | 82 -7% | 84 -5% | 88 0% | 86 -3% |
| Totaal Gemiddelde (Programma / Instellingen) | 1% /
-6% | 4% /
-3% | 1% /
-8% | 11% /
9% | 5% /
-6% |
* ... kleiner is beter
Responstijd Scherm
| ↔ Responstijd Zwart naar Wit | ||
|---|---|---|
| 35.2 ms ... stijging ↗ en daling ↘ gecombineerd | ↗ 22 ms stijging | 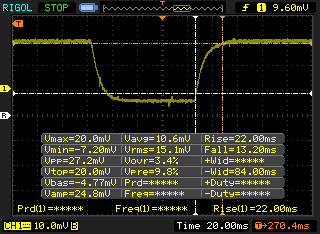 |
| ↘ 13.2 ms daling | ||
| Het scherm vertoonde trage responstijden in onze tests en is misschien te traag voor games. Ter vergelijking: alle testtoestellen variëren van 0.1 (minimum) tot 240 (maximum) ms. » 93 % van alle toestellen zijn beter. Dit betekent dat de gemeten responstijd slechter is dan het gemiddelde (19.9 ms) van alle geteste toestellen. | ||
| ↔ Responstijd 50% Grijs naar 80% Grijs | ||
| 46 ms ... stijging ↗ en daling ↘ gecombineerd | ↗ 24.4 ms stijging | 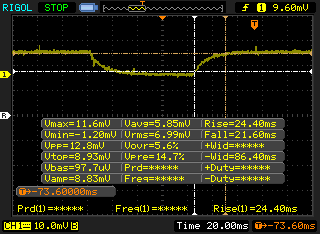 |
| ↘ 21.6 ms daling | ||
| Het scherm vertoonde trage responstijden in onze tests en is misschien te traag voor games. Ter vergelijking: alle testtoestellen variëren van 0.165 (minimum) tot 636 (maximum) ms. » 79 % van alle toestellen zijn beter. Dit betekent dat de gemeten responstijd slechter is dan het gemiddelde (31.1 ms) van alle geteste toestellen. | ||
Screen Flickering / PWM (Pulse-Width Modulation)
| Screen flickering / PWM niet waargenomen | 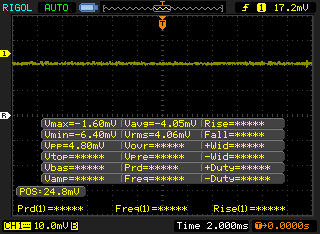 | ||
Ter vergelijking: 52 % van alle geteste toestellen maakten geen gebruik van PWM om de schermhelderheid te verlagen. Als het wel werd gebruikt, werd een gemiddelde van 7801 (minimum: 5 - maximum: 343500) Hz waargenomen. | |||
| PCMark 10 | |
| Score | |
| Dell Inspiron 17 3780 | |
| Dell Inspiron 17-7786 | |
| Lenovo V320-17IKB-81CN000MGE | |
| HP ProBook 470 G5 | |
| Dell Inspiron 17-5770-0357 | |
| Essentials | |
| Dell Inspiron 17 3780 | |
| Dell Inspiron 17-7786 | |
| Lenovo V320-17IKB-81CN000MGE | |
| Dell Inspiron 17-5770-0357 | |
| HP ProBook 470 G5 | |
| Productivity | |
| Dell Inspiron 17 3780 | |
| Dell Inspiron 17-7786 | |
| Lenovo V320-17IKB-81CN000MGE | |
| Dell Inspiron 17-5770-0357 | |
| HP ProBook 470 G5 | |
| Digital Content Creation | |
| Dell Inspiron 17-7786 | |
| Dell Inspiron 17 3780 | |
| Lenovo V320-17IKB-81CN000MGE | |
| Dell Inspiron 17-5770-0357 | |
| HP ProBook 470 G5 | |
| PCMark 8 | |
| Home Score Accelerated v2 | |
| Dell Inspiron 17-7786 | |
| Lenovo V320-17IKB-81CN000MGE | |
| HP ProBook 470 G5 | |
| Dell Inspiron 17-5770-0357 | |
| Dell Inspiron 17 3780 | |
| HP 17-ca0013ng | |
| Work Score Accelerated v2 | |
| Dell Inspiron 17 3780 | |
| Dell Inspiron 17-7786 | |
| HP ProBook 470 G5 | |
| Lenovo V320-17IKB-81CN000MGE | |
| Dell Inspiron 17-5770-0357 | |
| PCMark 8 Home Score Accelerated v2 | 3509 punten | |
| PCMark 8 Work Score Accelerated v2 | 5260 punten | |
| PCMark 10 Score | 4594 punten | |
Help | ||
| Dell Inspiron 17 3780 SK Hynix BC501 NVMe 256 GB | Lenovo V320-17IKB-81CN000MGE Liteonit CV3-DE256 | HP ProBook 470 G5 Intel SSD 600p SSDPEKKW256G7 | Dell Inspiron 17-5770-0357 SK hynix SC311 M.2 | HP 17-ca0013ng Toshiba KBG30ZMV256G | |
|---|---|---|---|---|---|
| AS SSD | -53% | -23% | -68% | -42% | |
| Seq Read (MB/s) | 1061 | 520 -51% | 1257 18% | 492.1 -54% | 1334 26% |
| Seq Write (MB/s) | 491.4 | 259.4 -47% | 461.8 -6% | 182.1 -63% | 760 55% |
| 4K Read (MB/s) | 39.13 | 21.59 -45% | 26.95 -31% | 25.6 -35% | 37.67 -4% |
| 4K Write (MB/s) | 104 | 53.6 -48% | 90.6 -13% | 68.8 -34% | 72 -31% |
| 4K-64 Read (MB/s) | 505 | 329.4 -35% | 279.4 -45% | 159.1 -68% | 629 25% |
| 4K-64 Write (MB/s) | 314.8 | 215.4 -32% | 429.4 36% | 73.4 -77% | 259 -18% |
| Access Time Read * (ms) | 0.063 | 0.084 -33% | 0.109 -73% | 0.128 -103% | 0.085 -35% |
| Access Time Write * (ms) | 0.034 | 0.072 -112% | 0.039 -15% | 0.061 -79% | 0.204 -500% |
| Score Read (Points) | 650 | 403 -38% | 432 -34% | 234 -64% | 800 23% |
| Score Write (Points) | 468 | 295 -37% | 566 21% | 160 -66% | 407 -13% |
| Score Total (Points) | 1434 | 897 -37% | 1188 -17% | 509 -65% | 1596 11% |
| Copy ISO MB/s (MB/s) | 876 | 305 -65% | 549 -37% | 162.8 -81% | 574 -34% |
| Copy Program MB/s (MB/s) | 653 | 99.2 -85% | 209.2 -68% | 107.8 -83% | 219.2 -66% |
| Copy Game MB/s (MB/s) | 512 | 147.8 -71% | 248.6 -51% | 130.9 -74% | 374 -27% |
* ... kleiner is beter

| 3DMark 11 Performance | 2409 punten | |
| 3DMark Cloud Gate Standard Score | 8971 punten | |
| 3DMark Fire Strike Score | 1511 punten | |
| 3DMark Time Spy Score | 526 punten | |
Help | ||
| The Witcher 3 | |
| 1024x768 Low Graphics & Postprocessing | |
| Gemiddelde van klas Multimedia (68 - 380, n=10, laatste 2 jaar) | |
| Dell Inspiron 17 3780 | |
| Gemiddeld AMD Radeon 520 (n=1) | |
| 1366x768 Medium Graphics & Postprocessing | |
| Gemiddelde van klas Multimedia (41 - 93, n=4, laatste 2 jaar) | |
| Dell Inspiron 17 3780 | |
| Gemiddeld AMD Radeon 520 (n=1) | |
| 1920x1080 High Graphics & Postprocessing (Nvidia HairWorks Off) | |
| Gemiddelde van klas Multimedia (22 - 224, n=13, laatste 2 jaar) | |
| Dell Inspiron 17 3780 | |
| Gemiddeld AMD Radeon 520 (n=1) | |
| 1920x1080 Ultra Graphics & Postprocessing (HBAO+) | |
| Gemiddelde van klas Multimedia (11 - 121, n=13, laatste 2 jaar) | |
| Dell Inspiron 17 3780 | |
| Gemiddeld AMD Radeon 520 (n=1) | |
| lage | gem. | hoge | ultra | |
|---|---|---|---|---|
| BioShock Infinite (2013) | 82.4 | 43.7 | 36.3 | 11.7 |
| The Witcher 3 (2015) | 29.7 | 18.7 | 10.2 | 5.8 |
| Rise of the Tomb Raider (2016) | 36 | 20.8 | 9.8 | 7.4 |
| Dell Inspiron 17 3780 Radeon 520, i7-8565U, SK Hynix BC501 NVMe 256 GB | Dell Inspiron 17-7786 GeForce MX150, i7-8565U, KBG30ZMS128G | Lenovo V320-17IKB-81CN000MGE UHD Graphics 620, i5-8250U, Liteonit CV3-DE256 | HP ProBook 470 G5 GeForce 930MX, i5-8250U, Intel SSD 600p SSDPEKKW256G7 | Dell Inspiron 17-5770-0357 UHD Graphics 620, i5-8250U, SK hynix SC311 M.2 | HP 17-ca0013ng Vega 8, R5 2500U, Toshiba KBG30ZMV256G | |
|---|---|---|---|---|---|---|
| Noise | 6% | 7% | 7% | -0% | 3% | |
| uit / omgeving * (dB) | 28.1 | 30.3 -8% | 30.4 -8% | 30.5 -9% | 30.1 -7% | 30.6 -9% |
| Idle Minimum * (dB) | 31.7 | 30.7 3% | 30.4 4% | 30.5 4% | 31.1 2% | 32.8 -3% |
| Idle Average * (dB) | 31.8 | 30.7 3% | 30 6% | 30.5 4% | 31.1 2% | 32.8 -3% |
| Idle Maximum * (dB) | 31.8 | 30.7 3% | 31.4 1% | 30.5 4% | 31.1 2% | 32.8 -3% |
| Load Average * (dB) | 38.7 | 33.4 14% | 34.1 12% | 33 15% | 44.4 -15% | 34.2 12% |
| Load Maximum * (dB) | 48.5 | 38.7 20% | 36.4 25% | 38 22% | 41.7 14% | 36.4 25% |
* ... kleiner is beter
Geluidsniveau
| Onbelast |
| 31.7 / 31.8 / 31.8 dB (A) |
| Belasting |
| 38.7 / 48.5 dB (A) |
 | ||
30 dB stil 40 dB(A) hoorbaar 50 dB(A) luid |
||
min: | ||
(-) De maximumtemperatuur aan de bovenzijde bedraagt 49 °C / 120 F, vergeleken met het gemiddelde van 36.8 °C / 98 F, variërend van 21 tot 71 °C voor de klasse Multimedia.
(+) De bodem warmt op tot een maximum van 39.6 °C / 103 F, vergeleken met een gemiddelde van 39.1 °C / 102 F
(+) Bij onbelast gebruik bedraagt de gemiddelde temperatuur voor de bovenzijde 27.4 °C / 81 F, vergeleken met het apparaatgemiddelde van 31.3 °C / 88 F.
(+) De palmsteunen en het touchpad zijn met een maximum van ###max## °C / 81.3 F koeler dan de huidtemperatuur en voelen daarom koel aan.
(±) De gemiddelde temperatuur van de handpalmsteun van soortgelijke toestellen bedroeg 28.7 °C / 83.7 F (+1.3 °C / 2.4 F).
Apple MacBook 12 (Early 2016) 1.1 GHz audioanalyse
(+) | luidsprekers kunnen relatief luid spelen (83.6 dB)
Bas 100 - 315 Hz
(±) | verminderde zeebaars - gemiddeld 11.3% lager dan de mediaan
(±) | lineariteit van de lage tonen is gemiddeld (14.2% delta ten opzichte van de vorige frequentie)
Midden 400 - 2000 Hz
(+) | evenwichtige middens - slechts 2.4% verwijderd van de mediaan
(+) | de middentonen zijn lineair (5.5% delta ten opzichte van de vorige frequentie)
Hoog 2 - 16 kHz
(+) | evenwichtige hoogtepunten - slechts 2% verwijderd van de mediaan
(+) | de hoge tonen zijn lineair (4.5% delta naar de vorige frequentie)
Algemeen 100 - 16.000 Hz
(+) | het totale geluid is lineair (10.2% verschil met de mediaan)
Vergeleken met dezelfde klasse
» 7% van alle geteste apparaten in deze klasse waren beter, 2% vergelijkbaar, 91% slechter
» De beste had een delta van 5%, het gemiddelde was 18%, de slechtste was 53%
Vergeleken met alle geteste toestellen
» 5% van alle geteste apparaten waren beter, 1% gelijk, 94% slechter
» De beste had een delta van 4%, het gemiddelde was 24%, de slechtste was 134%
| Uit / Standby | |
| Inactief | |
| Belasting |
|
Key:
min: | |
| Dell Inspiron 17 3780 i7-8565U, Radeon 520, SK Hynix BC501 NVMe 256 GB, IPS, 1920x1080, 17.3" | Dell Inspiron 17-7786 i7-8565U, GeForce MX150, KBG30ZMS128G, IPS, 1920x1080, 17.3" | Lenovo V320-17IKB-81CN000MGE i5-8250U, UHD Graphics 620, Liteonit CV3-DE256, IPS, 1920x1080, 17.3" | HP ProBook 470 G5 i5-8250U, GeForce 930MX, Intel SSD 600p SSDPEKKW256G7, IPS, 1920x1080, 17.3" | Dell Inspiron 17-5770-0357 i5-8250U, UHD Graphics 620, SK hynix SC311 M.2, IPS, 1920x1080, 17.3" | HP 17-ca0013ng R5 2500U, Vega 8, Toshiba KBG30ZMV256G, IPS, 1920x1080, 17.3" | |
|---|---|---|---|---|---|---|
| Power Consumption | 3% | 20% | 14% | 23% | -12% | |
| Idle Minimum * (Watt) | 5 | 4.2 16% | 4.3 14% | 3.4 32% | 4.08 18% | 7.6 -52% |
| Idle Average * (Watt) | 10.9 | 9.4 14% | 10.2 6% | 9.6 12% | 8.45 22% | 12.9 -18% |
| Idle Maximum * (Watt) | 12 | 12.9 -8% | 10.5 12% | 11.8 2% | 9.6 20% | 13.7 -14% |
| Load Average * (Watt) | 49.6 | 56 -13% | 34 31% | 43 13% | 40.2 19% | 44 11% |
| Load Maximum * (Watt) | 66.9 | 63.4 5% | 42 37% | 61 9% | 41.4 38% | 57.1 15% |
* ... kleiner is beter
| Dell Inspiron 17 3780 i7-8565U, Radeon 520, 42 Wh | Dell Inspiron 17-7786 i7-8565U, GeForce MX150, 56 Wh | Lenovo V320-17IKB-81CN000MGE i5-8250U, UHD Graphics 620, 30 Wh | HP ProBook 470 G5 i5-8250U, GeForce 930MX, 48 Wh | Dell Inspiron 17-5770-0357 i5-8250U, UHD Graphics 620, 42 Wh | HP 17-ca0013ng R5 2500U, Vega 8, 40.6 Wh | |
|---|---|---|---|---|---|---|
| Batterijduur | 105% | 2% | 99% | 34% | -10% | |
| Reader / Idle (h) | 9.6 | 16.6 73% | 10.5 9% | 18.7 95% | 11.7 22% | |
| WiFi v1.3 (h) | 4.2 | 9 114% | 4.4 5% | 8.1 93% | 6.1 45% | 3.8 -10% |
| Load (h) | 1.1 | 2.5 127% | 1 -9% | 2.3 109% | 1.5 36% |
Pro
Contra
Dit is de verkorte versie van het originele artikel. Het volledige, Engelse testrapport vind je hier.
De aantrekkelijkste feature van de Inspiron 17 3780 is het standaard 1080p-IPS-scherm en de lage prijs. Concurrerende systemen zoals de Asus VivoBook 17 hebben meestal een scherm met lagere resolutie en bieden alleen 1080p-opties voor een onnodig hoge meerprijs.
Als je de Inspiron 17 3780 in overweging neemt, raden we aan om de duurdere optie met Radeon 520-GPU over te slaan, aangezien zowel de grafische prestaties als de efficiëntie veel te wensen overlaten. Als je meer GPU-rekenkracht wenst, kan de Lenovo IdeaPad 330-17IKB met GeForce MX150 een waardig alternatief zijn. Als je vooral je laptop gebruikt voor tekstverwerking, web-browsing en video-streaming, dan zullen de basisconfiguraties met Core i5-8265U of Ryzen 5 2500U zeker volstaan.
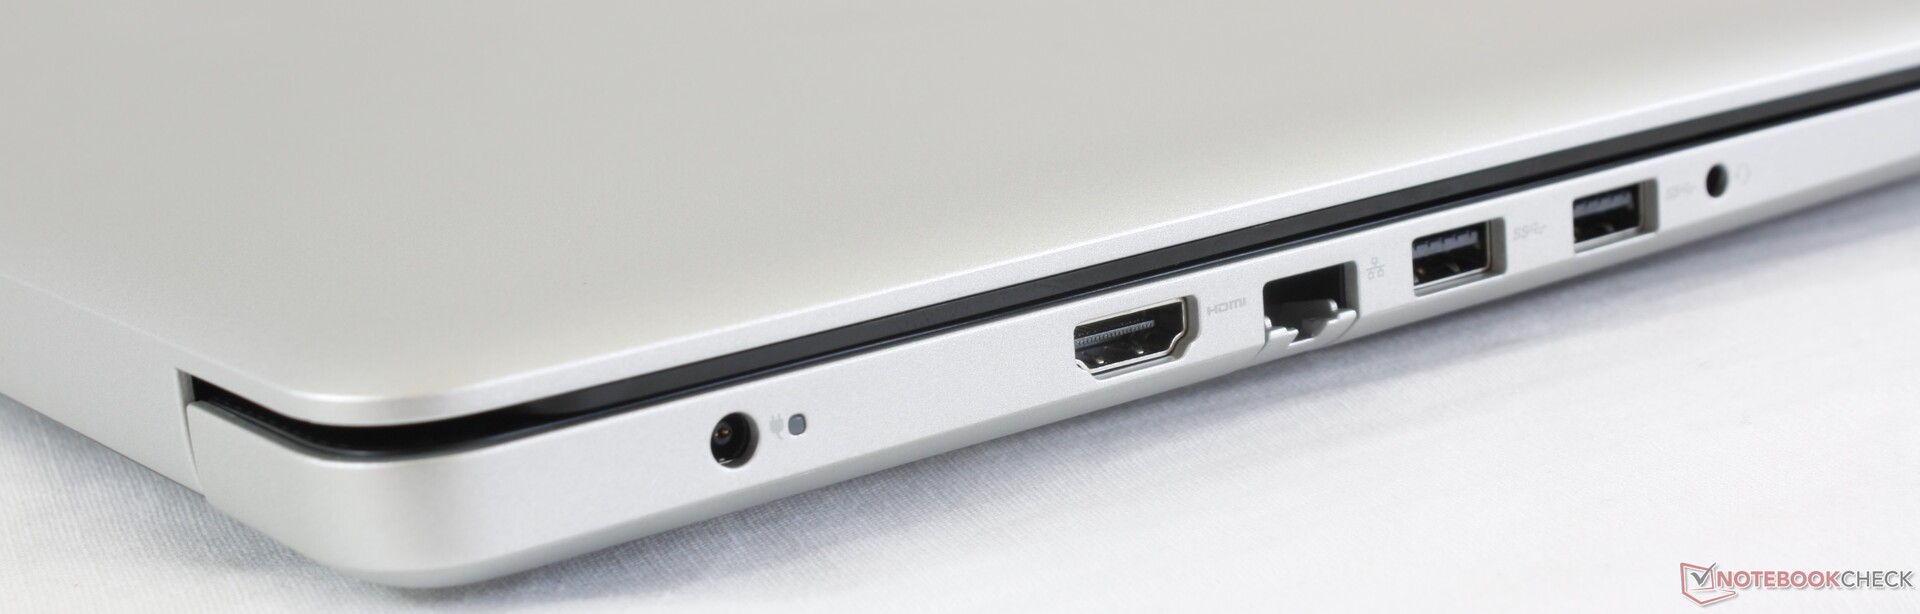
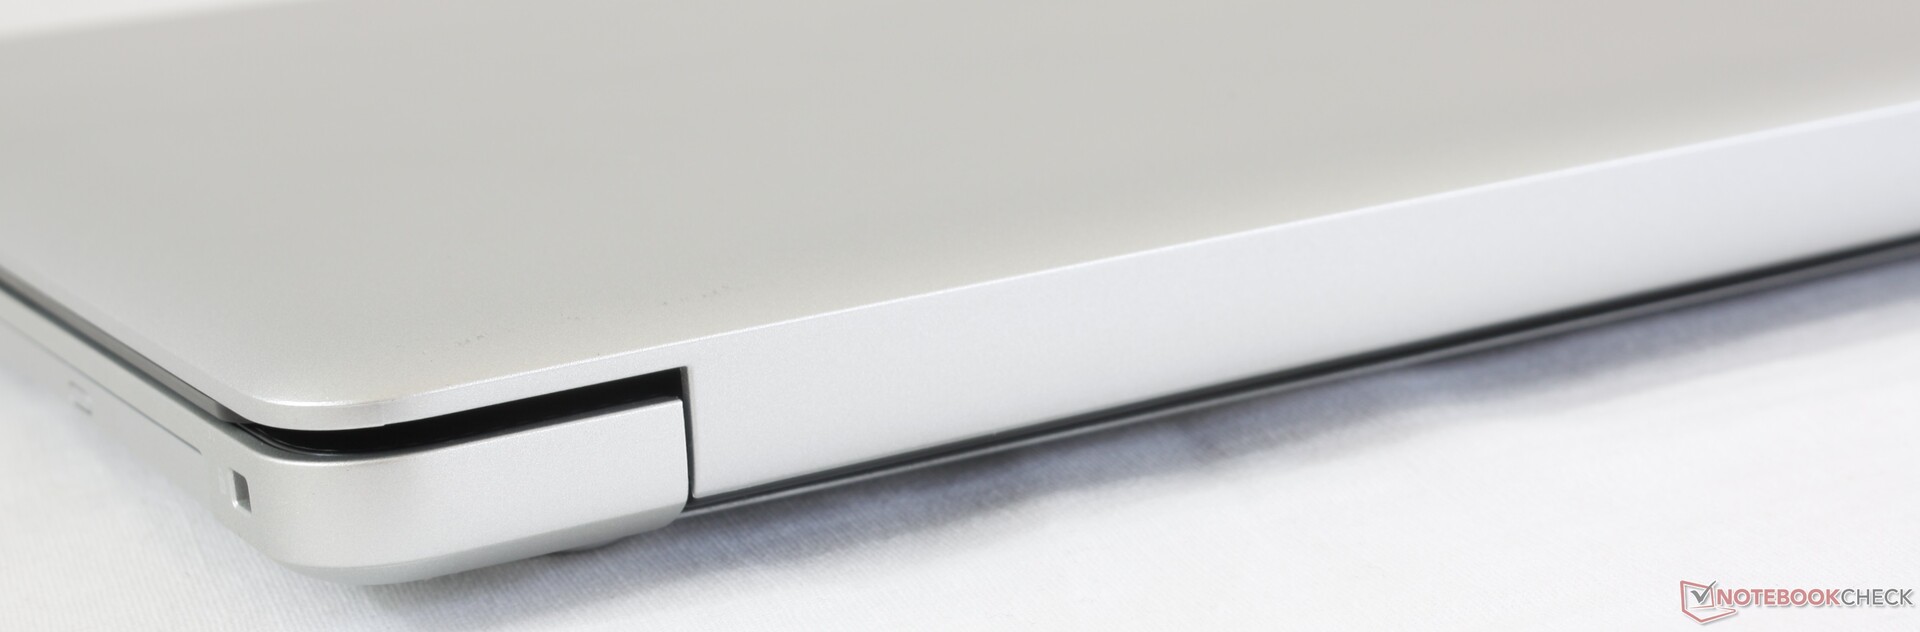
We hopen dat toekomstige revisies enkele van de grote tekortkomingen van het toestel zullen aanpakken zonder de prijs op te drijven. Meer bepaald tasten de dikke schermranden, de numpad-toetsen met weinig feedback en het ontbreken van USB Type-C de gebruikerservaring en de veelzijdigheid van het toestel aan.
Blijf weg van de configuratie met Radeon 520 en de betaalbare Inspiron 17 3780 zal een degelijke thuislaptop zijn voor eenvoudige taken en het afspelen van video's. Om de prestaties merkbaar te verhogen raden we aan om te investeren in een primaire SSD in plaats van de optie met de Core i7.
Dell Inspiron 17 3780
- 11-05-2019 v6 (old)
Allen Ngo
Price comparison
