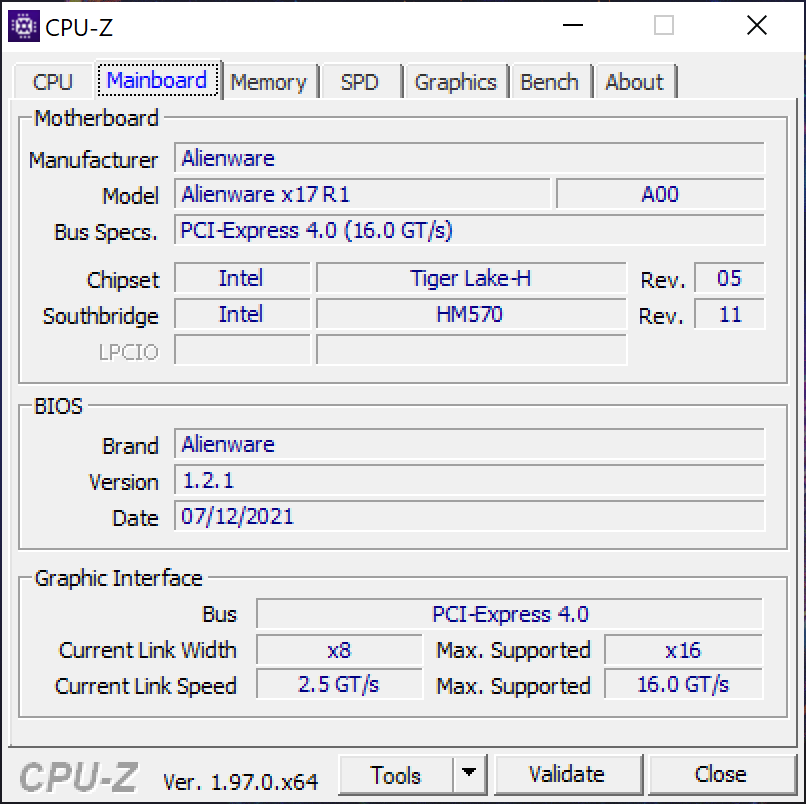
Alienware x17 R1 RTX 3080 laptop review: Een nieuw begin

De 17,3-inch Alienware-laptopserie heeft de afgelopen jaren een lawine aan veranderingen gehad. Dell introduceerde een gloednieuw Alienware m17 R1-chassis in 2019 om het slechts een jaar later in 2020 te vervangen door een volledig opnieuw ontworpen m17 R2-chassis. Voor 2021 heeft de fabrikant nog een ander volledig herontworpen chassis geïntroduceerd om de m17-serie helemaal te vervangen, genaamd de Alienware x17
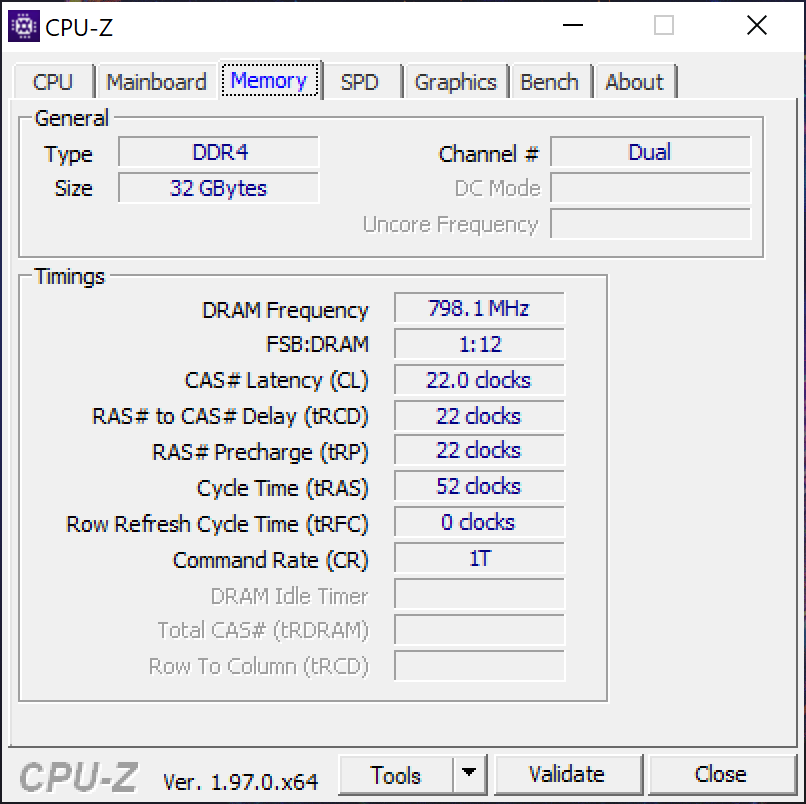
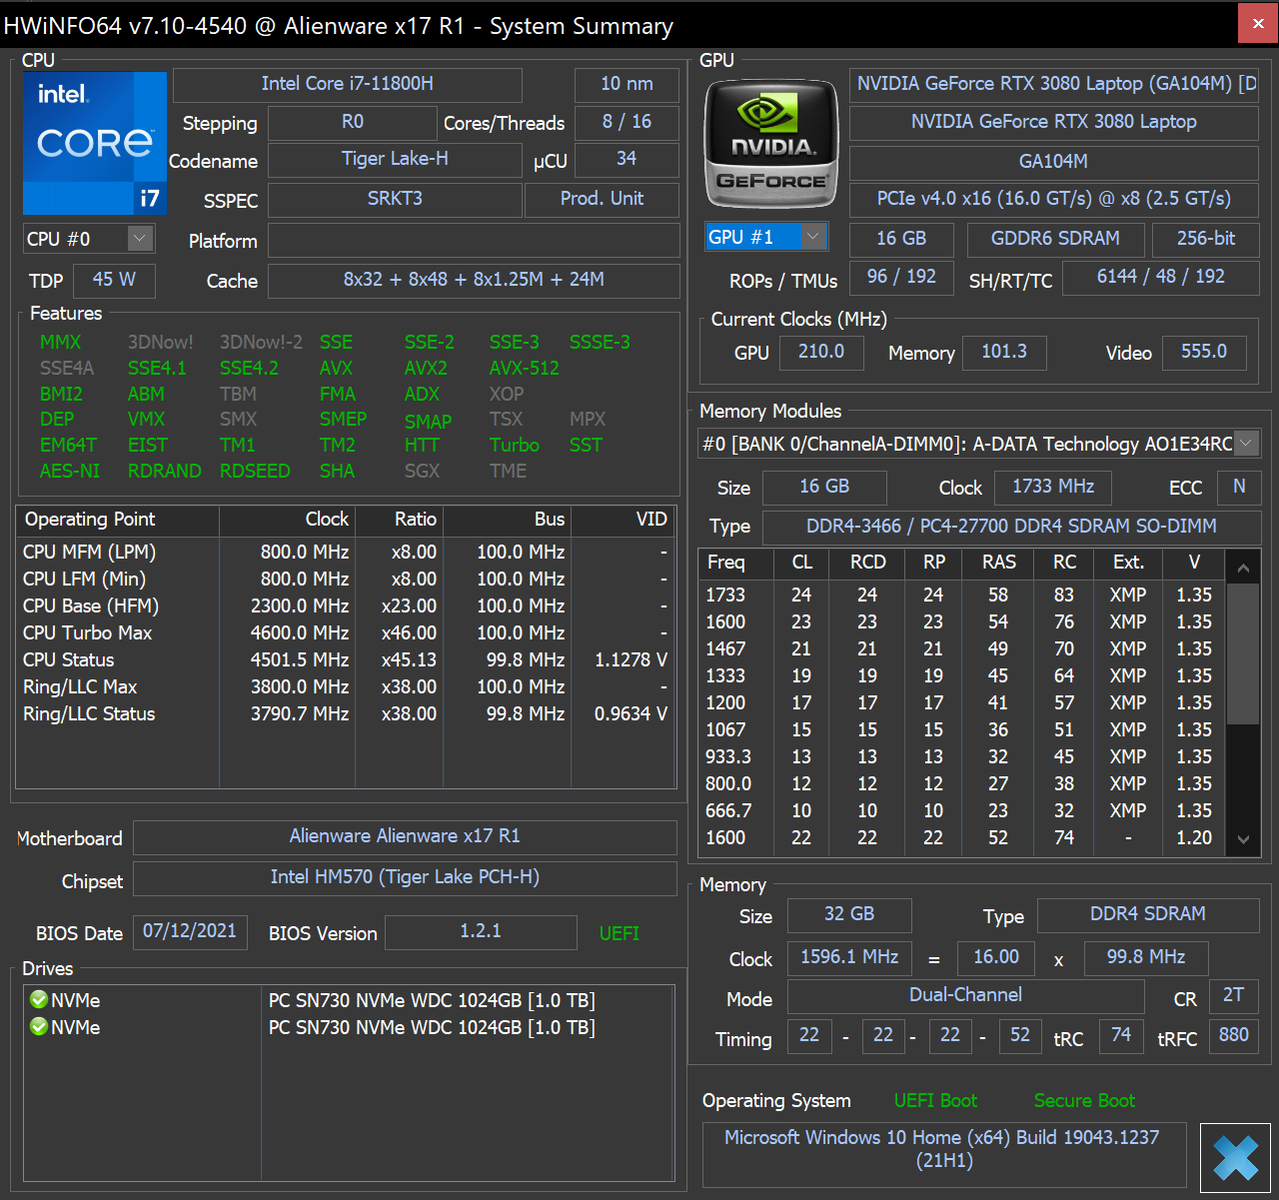
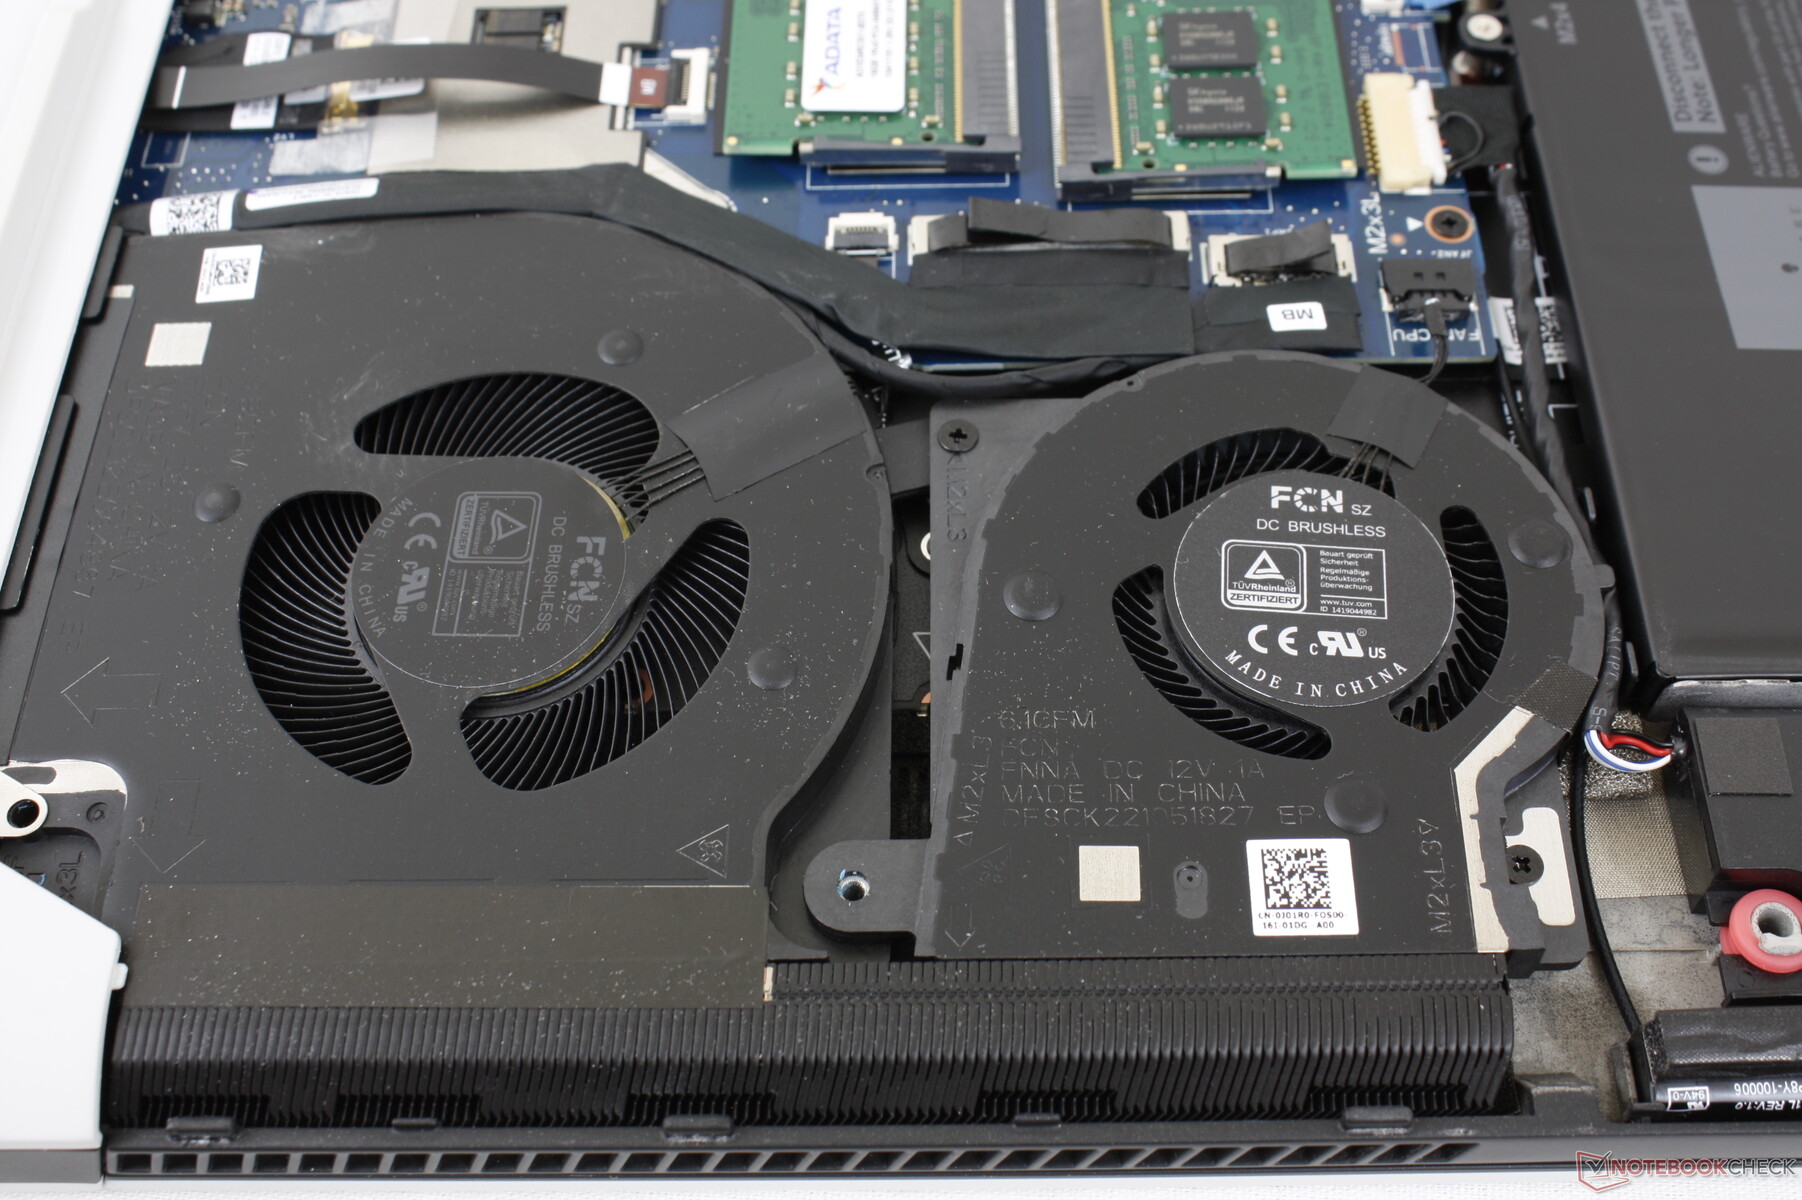
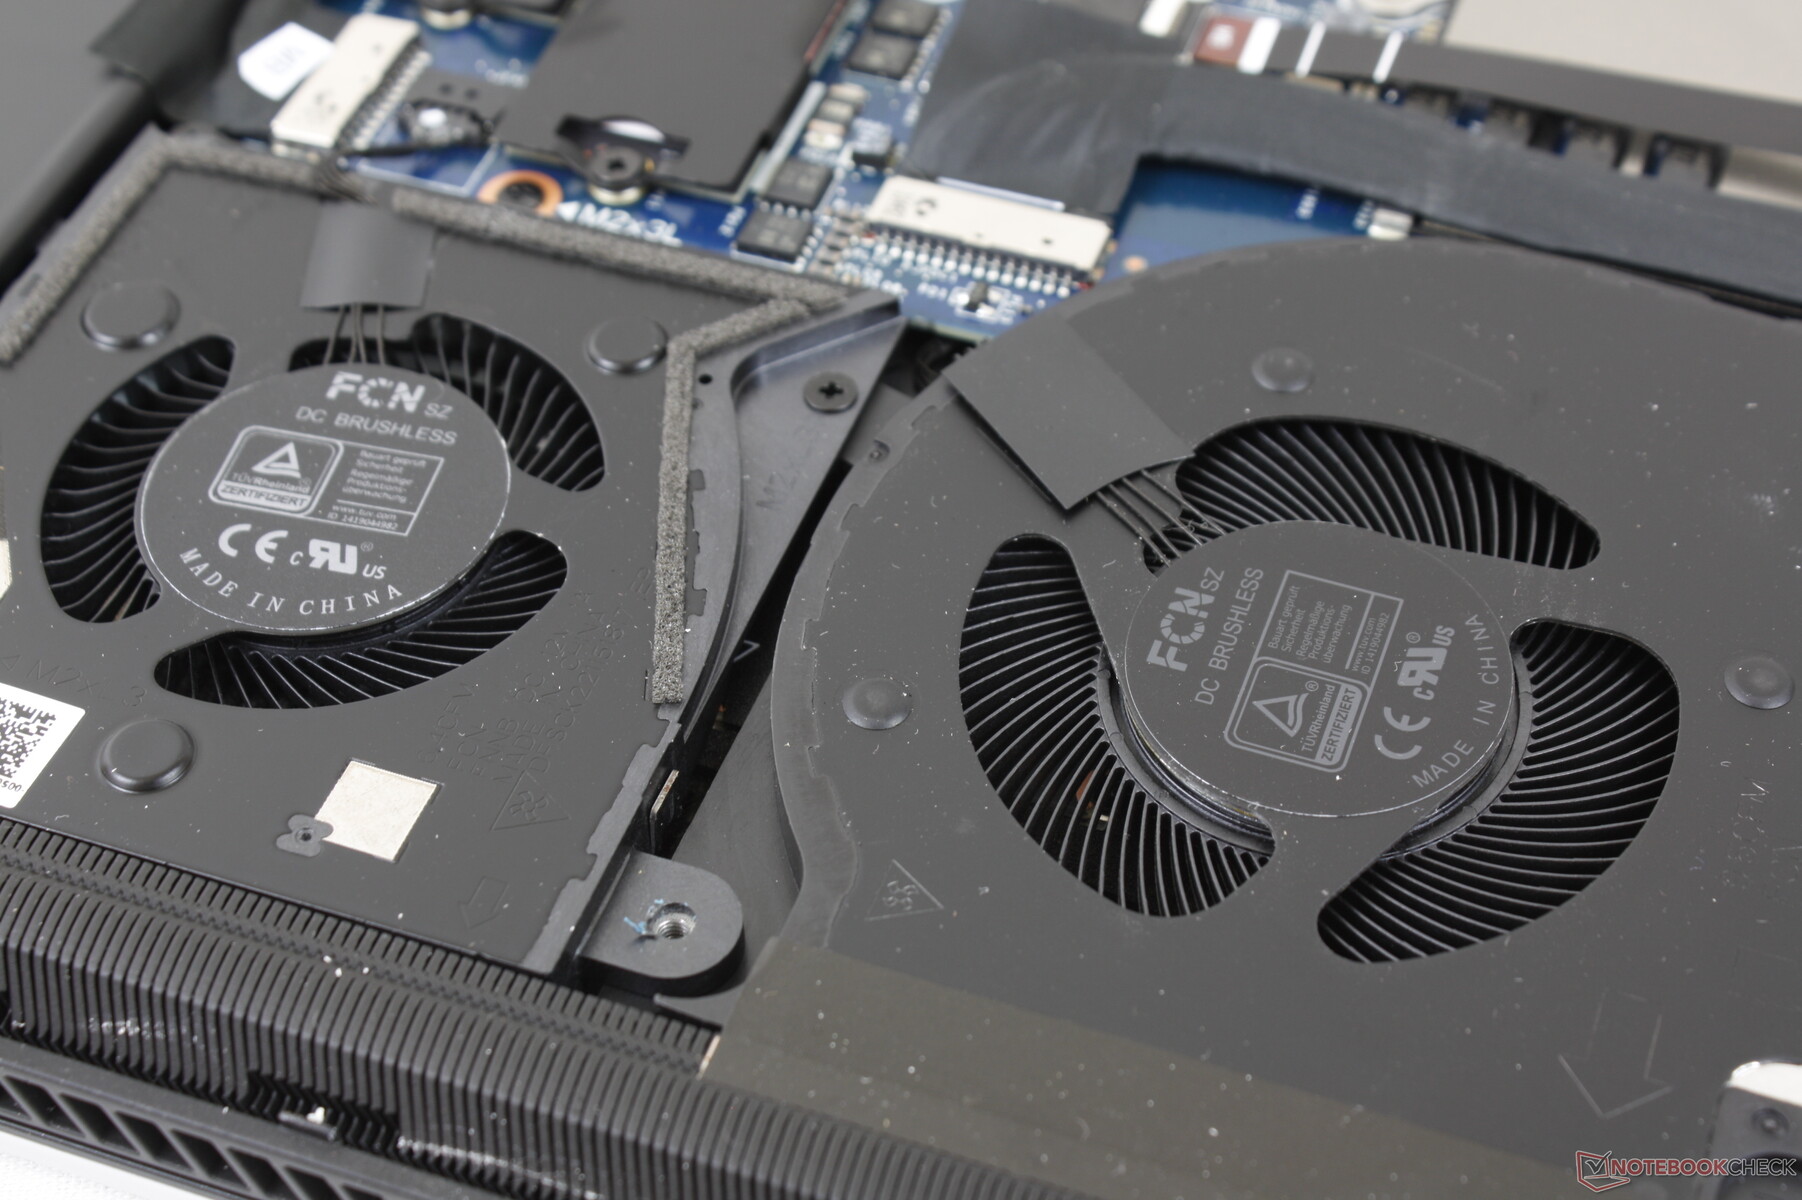
Onze testeenheid is een high-end configuratie uitgerust met de Core i7-11800H CPU, GeForce RTX 3080 GPU, 120 Hz 4K UHD beeldscherm, CherryMX mechanische toetsen, en 32 GB RAM voor ongeveer $3200 USD. Lagere en hogere opties zijn beschikbaar met de RTX 3060 of Core i9-11980HKrespectievelijk. Misschien wel het belangrijkste kenmerk van het nieuwe chassis is de opnieuw ontworpen koeloplossing met meer ventilatoren dan voorheen en een nieuwe thermische pasta op basis van gallium-silicium over de CPU. Er is ook een 15,6-inch versie beschikbaar, de Alienware x15 R1
Concurrenten van de Alienware x17 R1 zijn andere ultradunne 17,3-inch gaming laptops zoals de MSI GS76, Razer Blade 17,Asus ROG Zephyrus S17, en de Tongfang-gebaseerdeMaingear Vector Pro.
Meer Dell reviews:
potential competitors in comparison
Evaluatie | Datum | Model | Gewicht | Hoogte | Formaat | Resolutie | Beste prijs |
|---|---|---|---|---|---|---|---|
| 89 % v7 (old) | 09-2021 | Alienware x17 RTX 3080 P48E i7-11800H, GeForce RTX 3080 Laptop GPU | 3.2 kg | 21.4 mm | 17.30" | 3840x2160 | |
| 85.3 % v7 (old) | 04-2021 | Alienware m17 R4 i9-10980HK, GeForce RTX 3080 Laptop GPU | 3 kg | 22 mm | 17.30" | 1920x1080 | |
| 89.4 % v7 (old) | 09-2021 | Razer Blade 17 RTX 3070 i7-11800H, GeForce RTX 3070 Laptop GPU | 2.8 kg | 19.9 mm | 17.30" | 1920x1080 | |
| 90.1 % v7 (old) | 07-2021 | Asus ROG Zephyrus S17 GX703HSD i9-11900H, GeForce RTX 3080 Laptop GPU | 2.8 kg | 19.9 mm | 17.30" | 2560x1440 | |
| 86.2 % v7 (old) | 09-2021 | MSI GS76 Stealth 11UH i9-11900H, GeForce RTX 3080 Laptop GPU | 2.4 kg | 20 mm | 17.30" | 3840x2160 | |
| 88 % v7 (old) | 05-2021 | Gigabyte Aero 17 HDR YD i9-11980HK, GeForce RTX 3080 Laptop GPU | 2.8 kg | 22 mm | 17.30" | 3840x2160 |
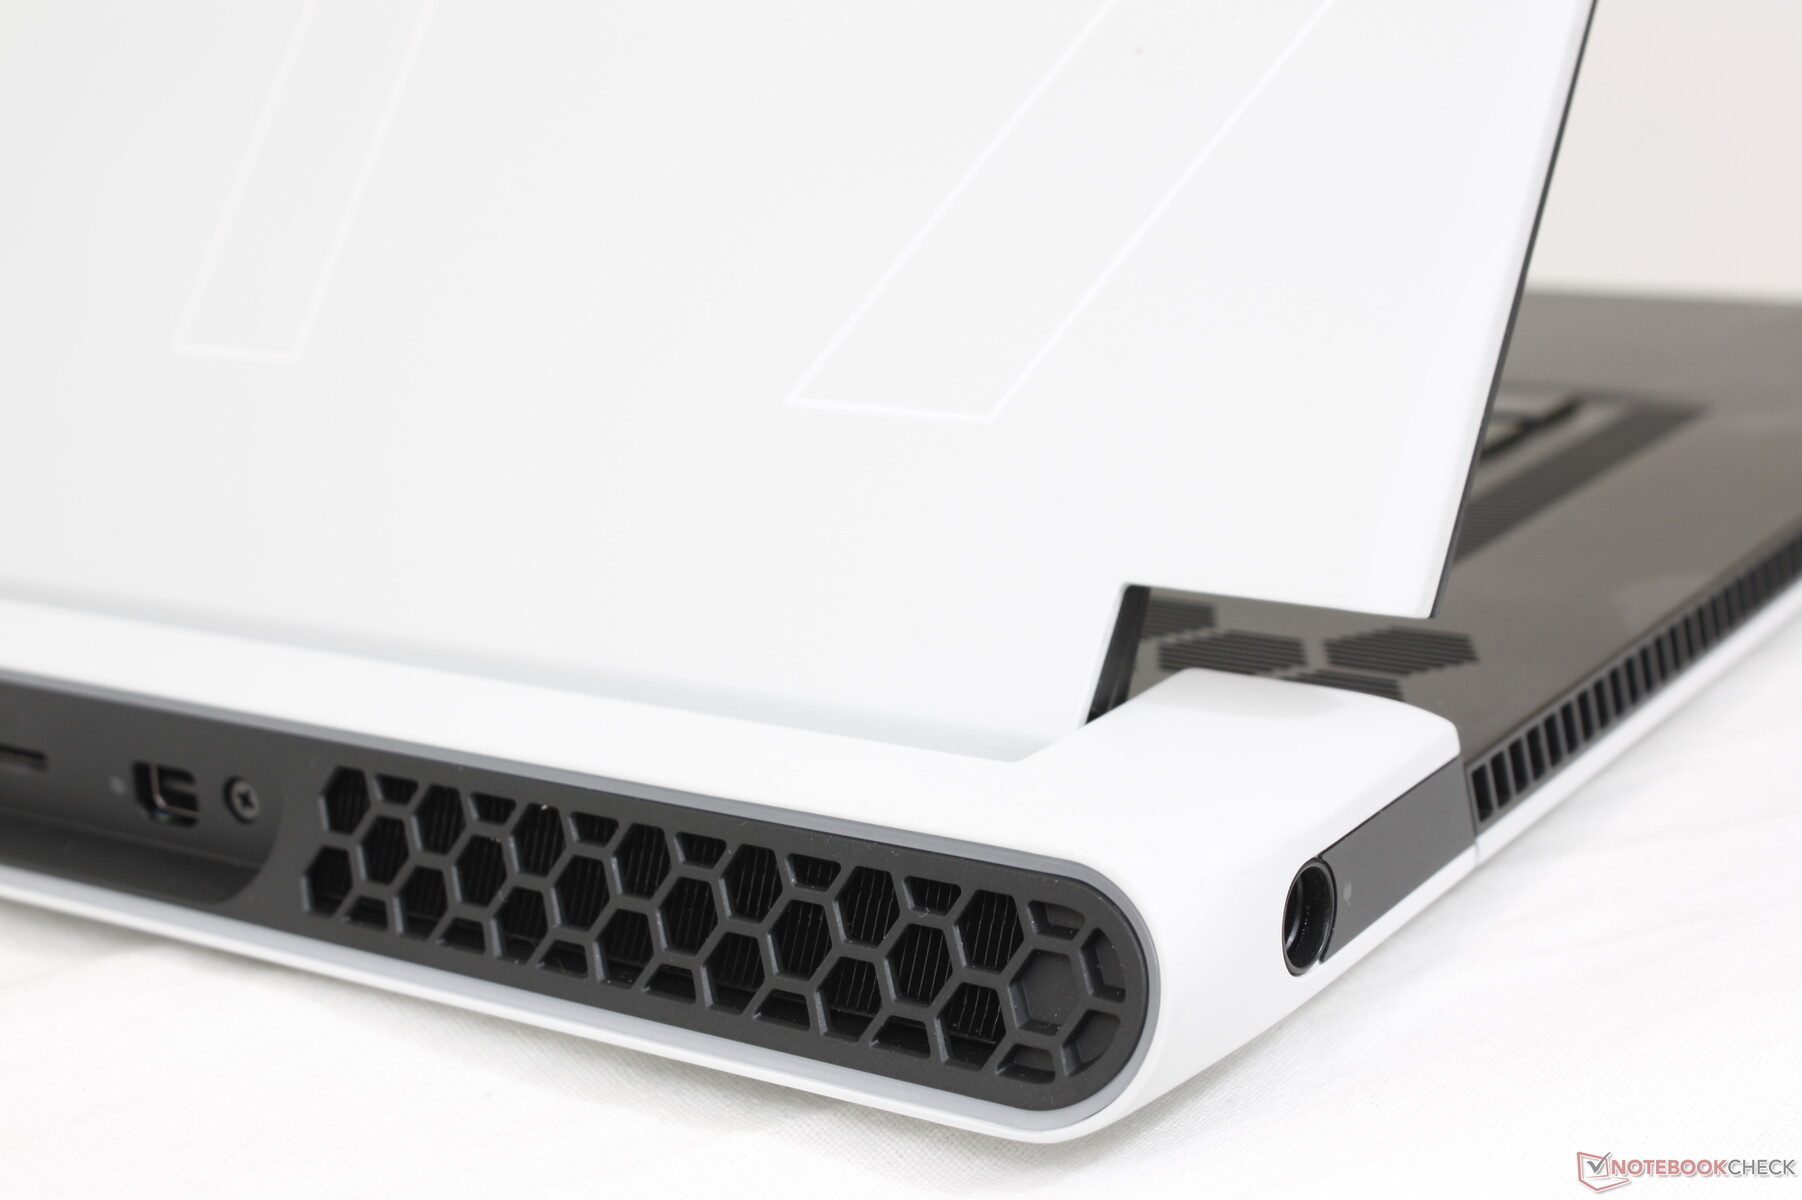
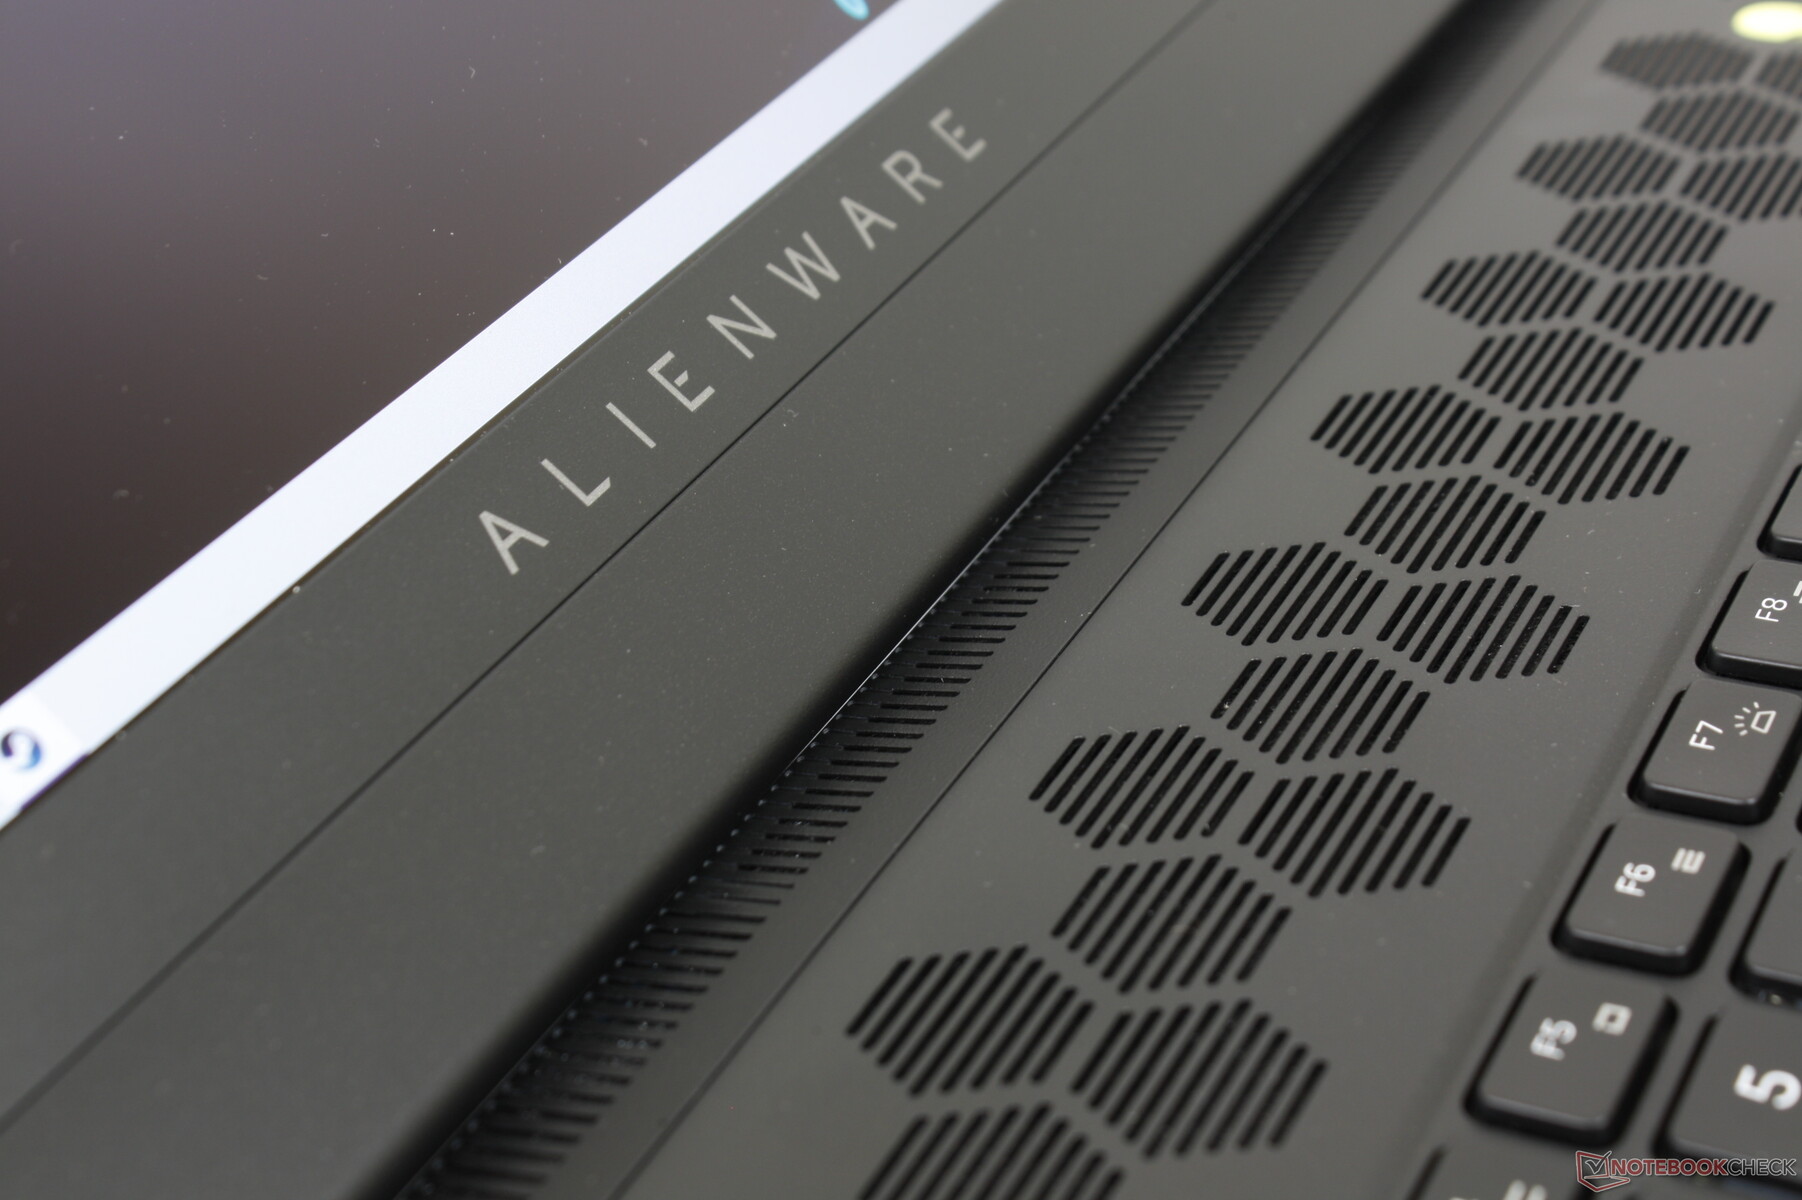
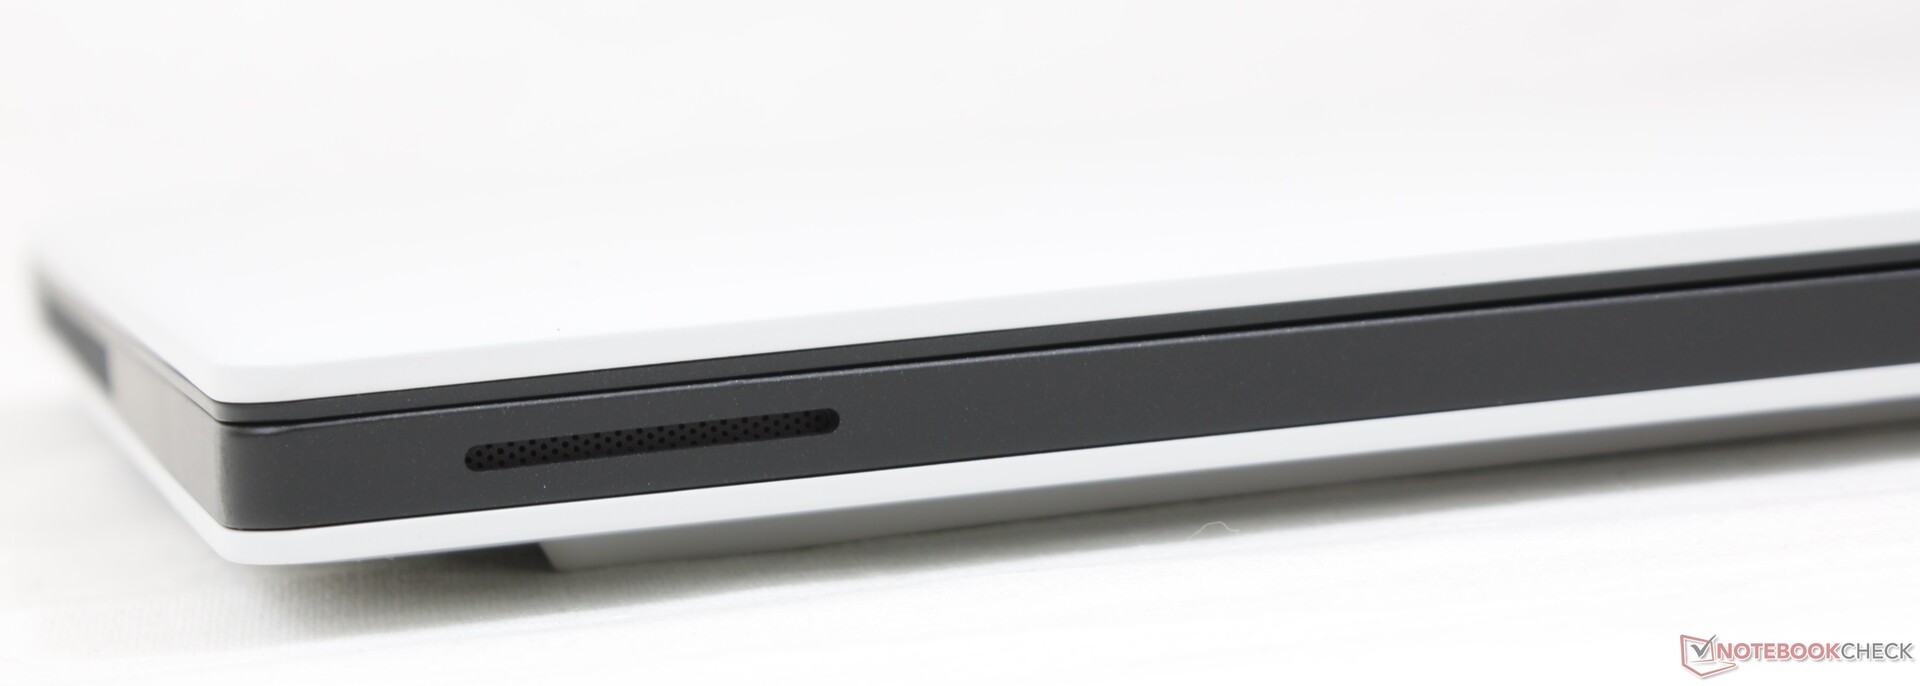
Case - Legend Reborn
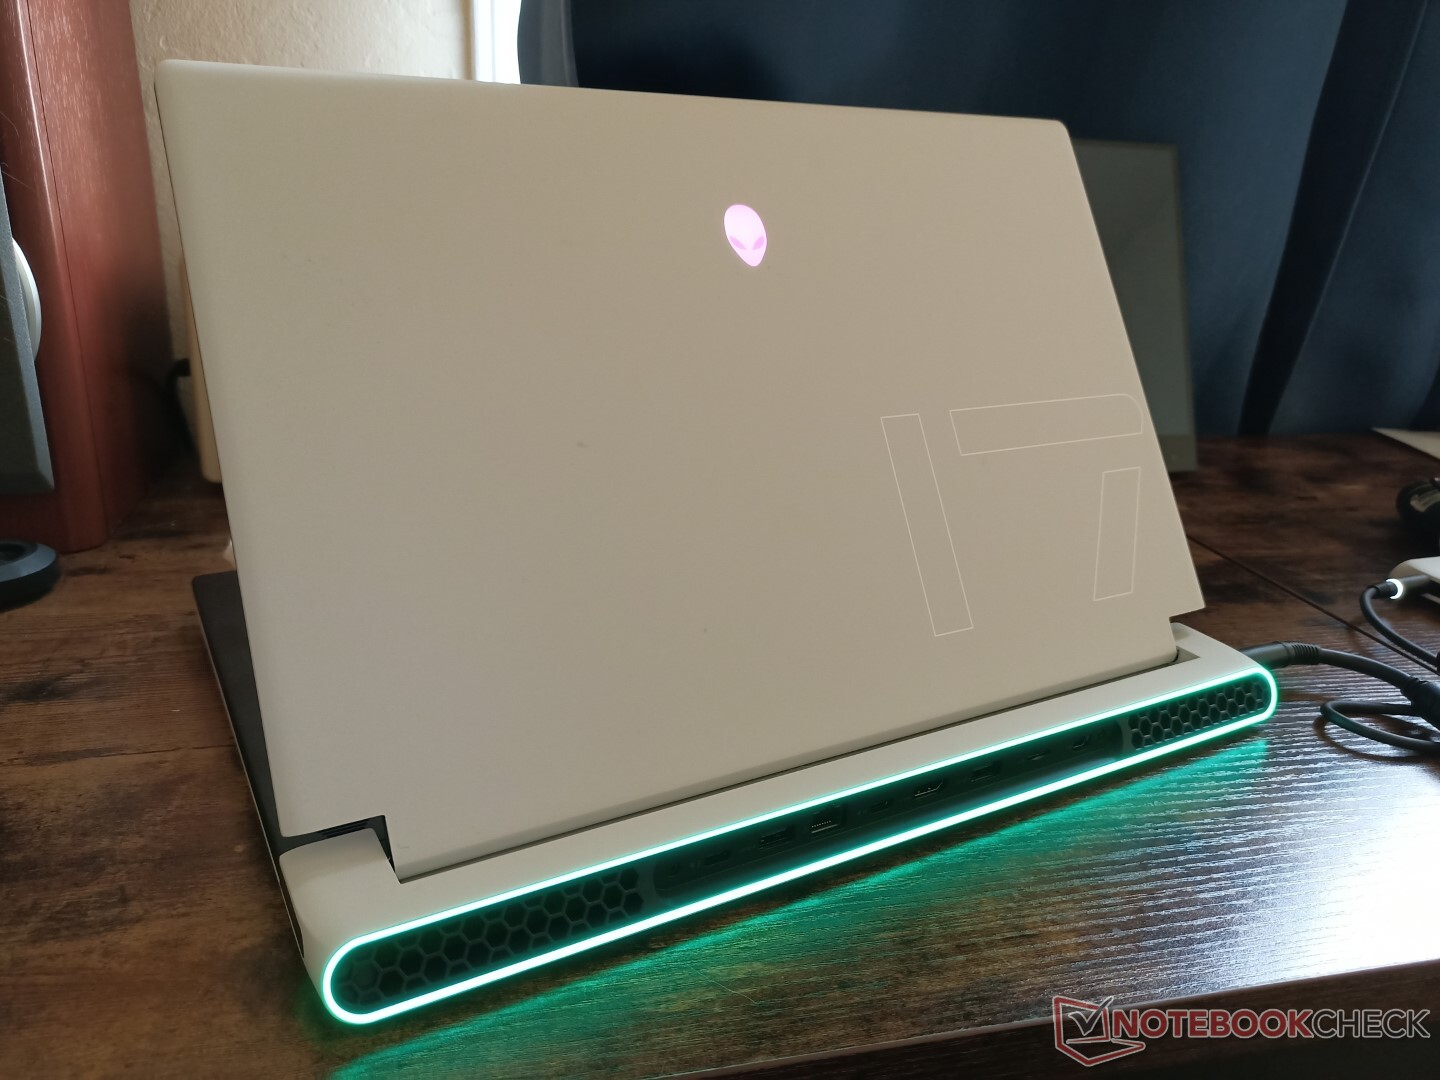
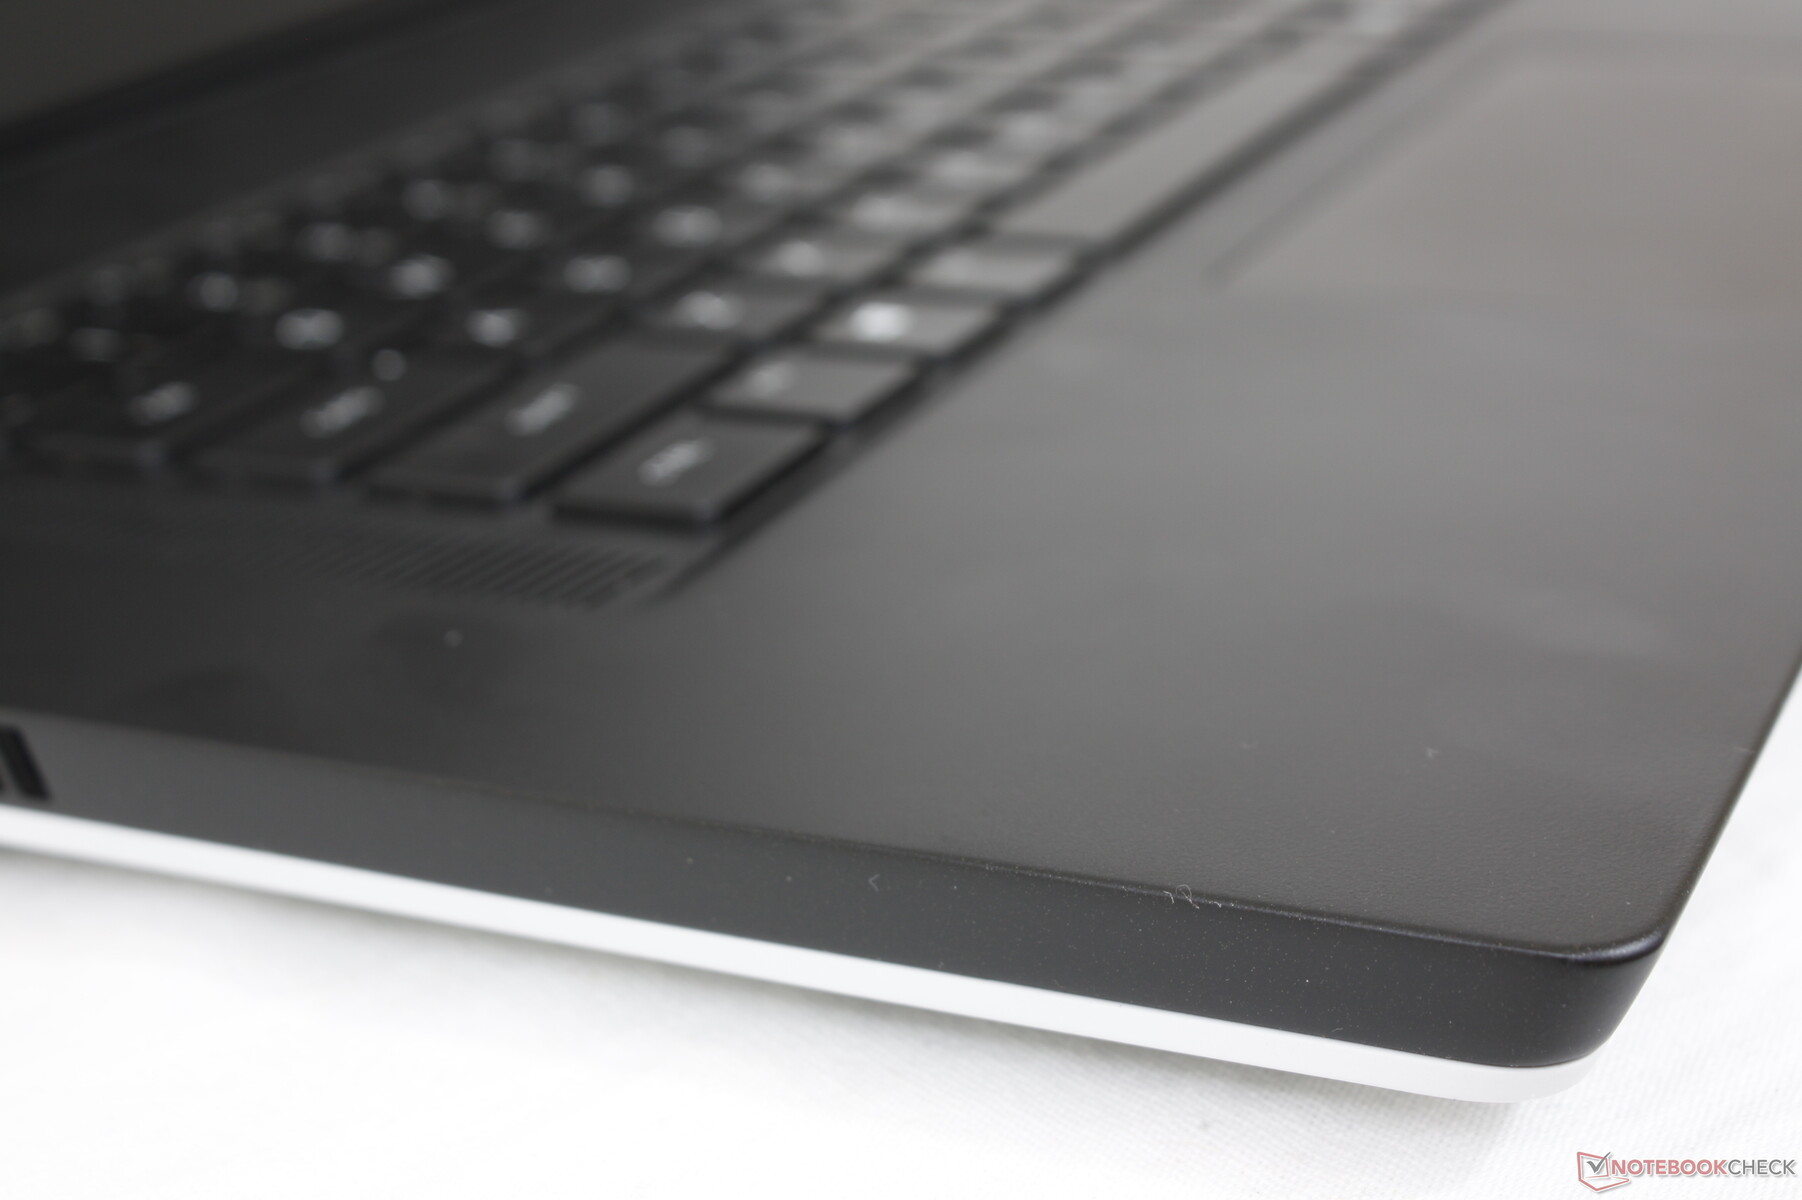
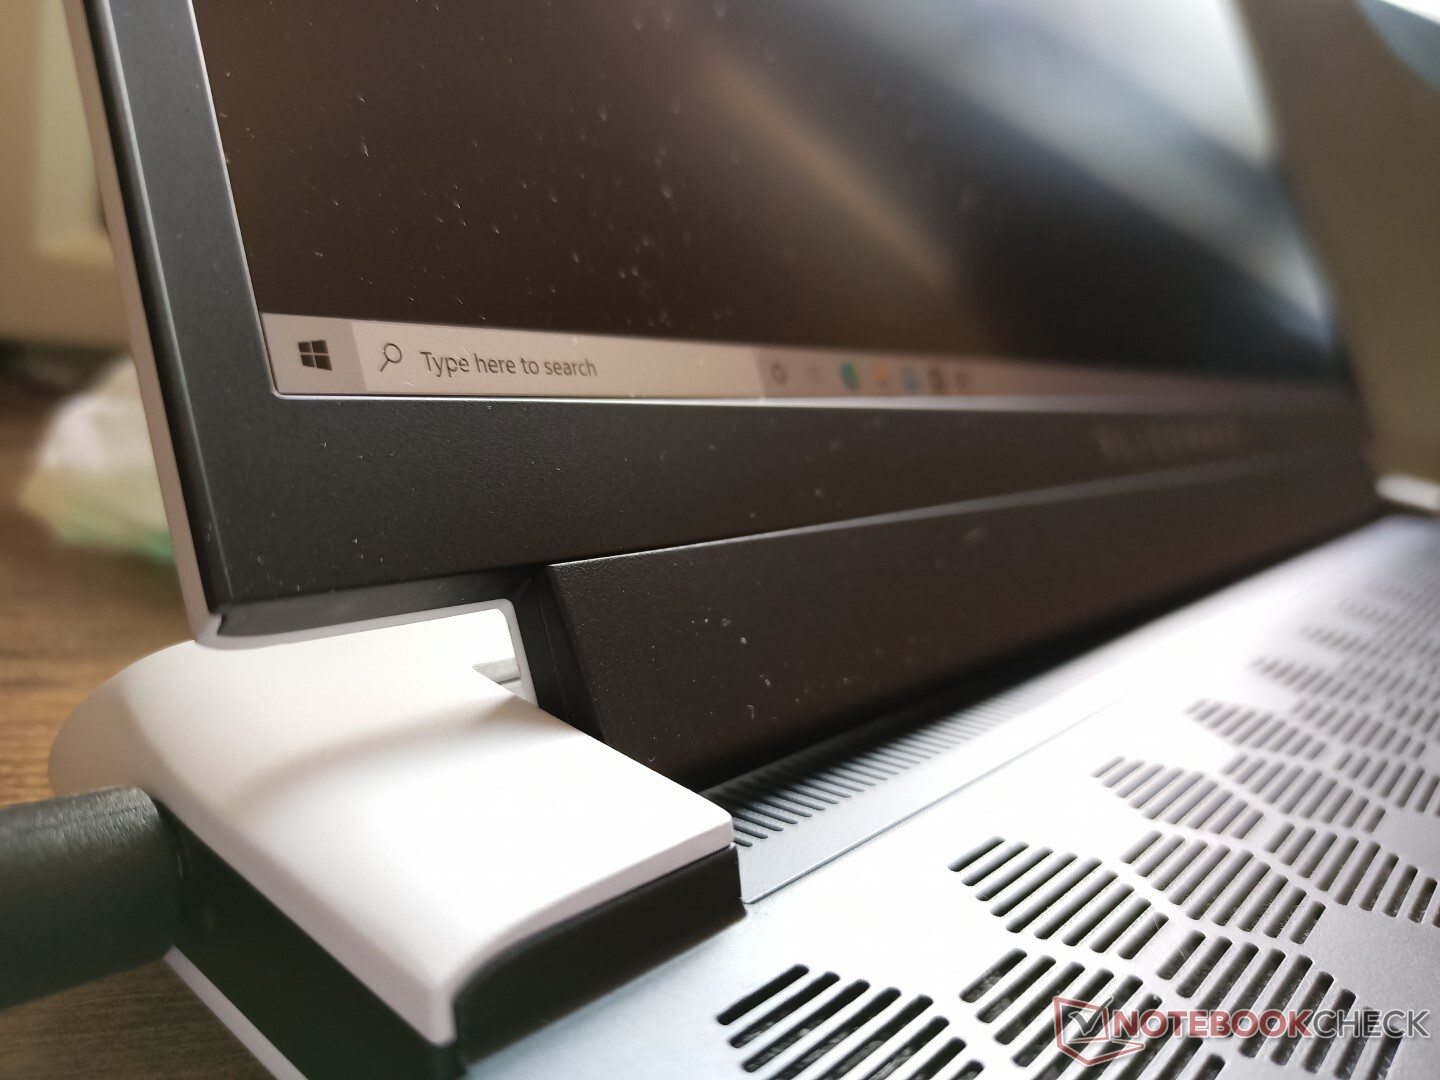
Het vernieuwde "Legend" chassisontwerp maakt gebruik van dezelfde zacht aanvoelende kunststoffen als op de m17 R2, maar in andere en over het algemeen plattere proporties om een dunnere look te accentueren. De witte buitenklep en honingraatroosters blijven bijvoorbeeld allemaal, terwijl het toetsenbord nu zwart is en scherper rond de randen. De stijfheid is nog steeds uitstekend, vooral rond de basis, met zeer weinig vervorming en geen gekraak te melden.
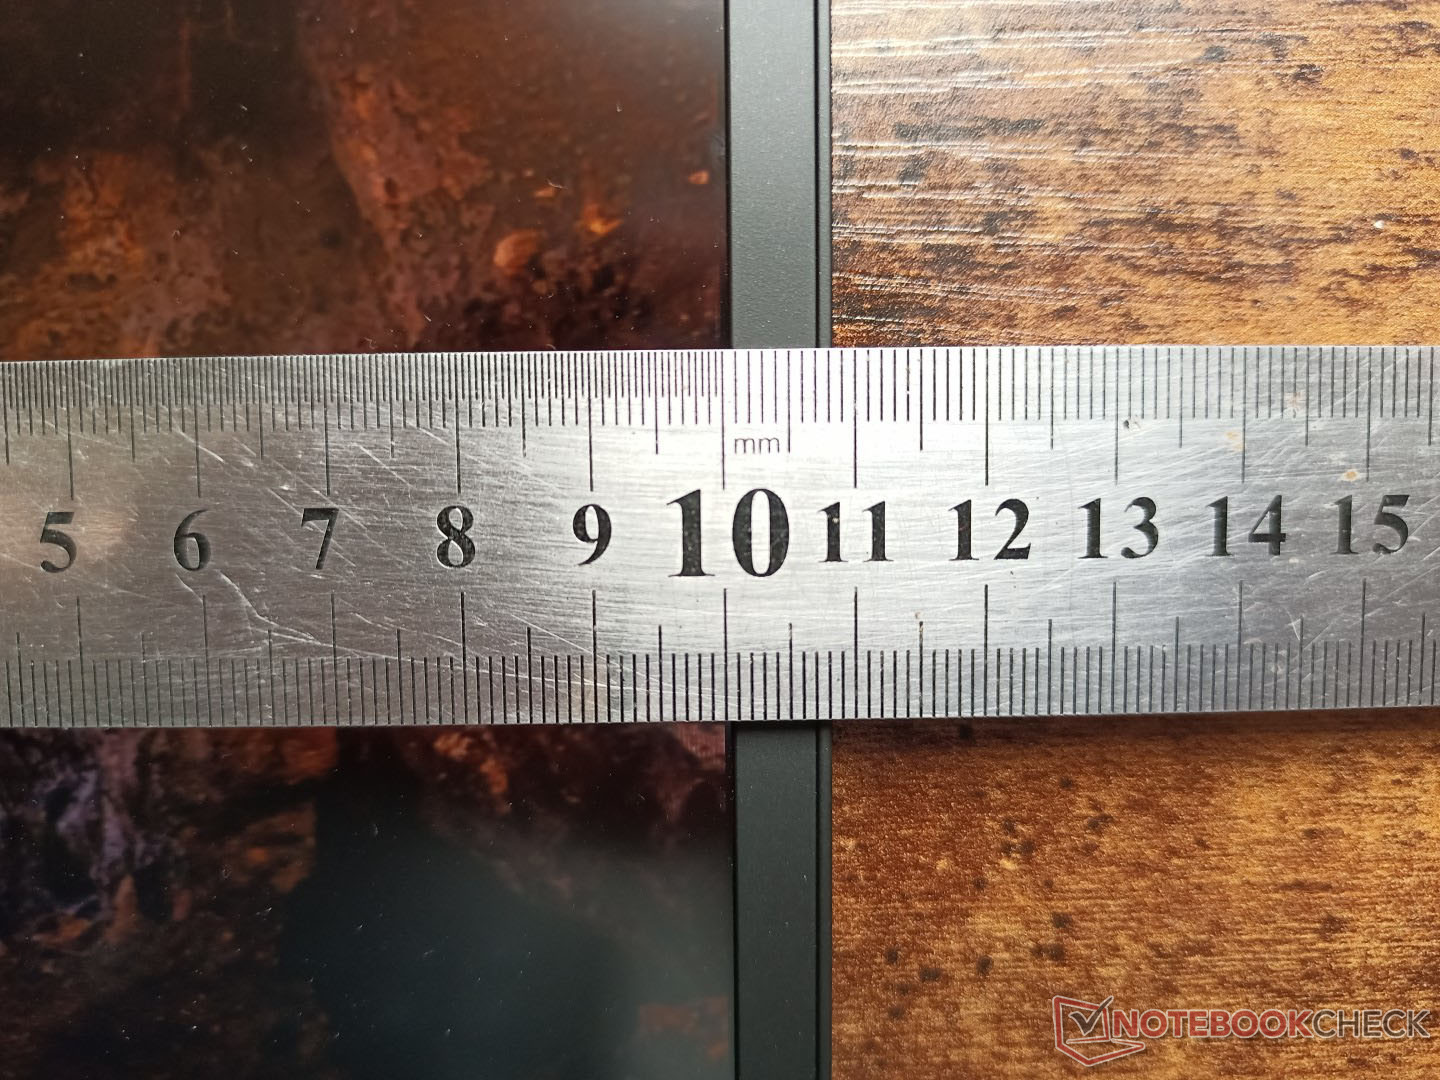
Het deksel buigt meer dan het deksel op de Blade 17 maar niet zo veel als bij de MSI GS75. Het heeft ook een van de dikste bezels langs de onderrand voor een 17,3-inch gaming laptop die we hebben gezien, die deels verantwoordelijk zijn voor de extra grote voetafdruk.
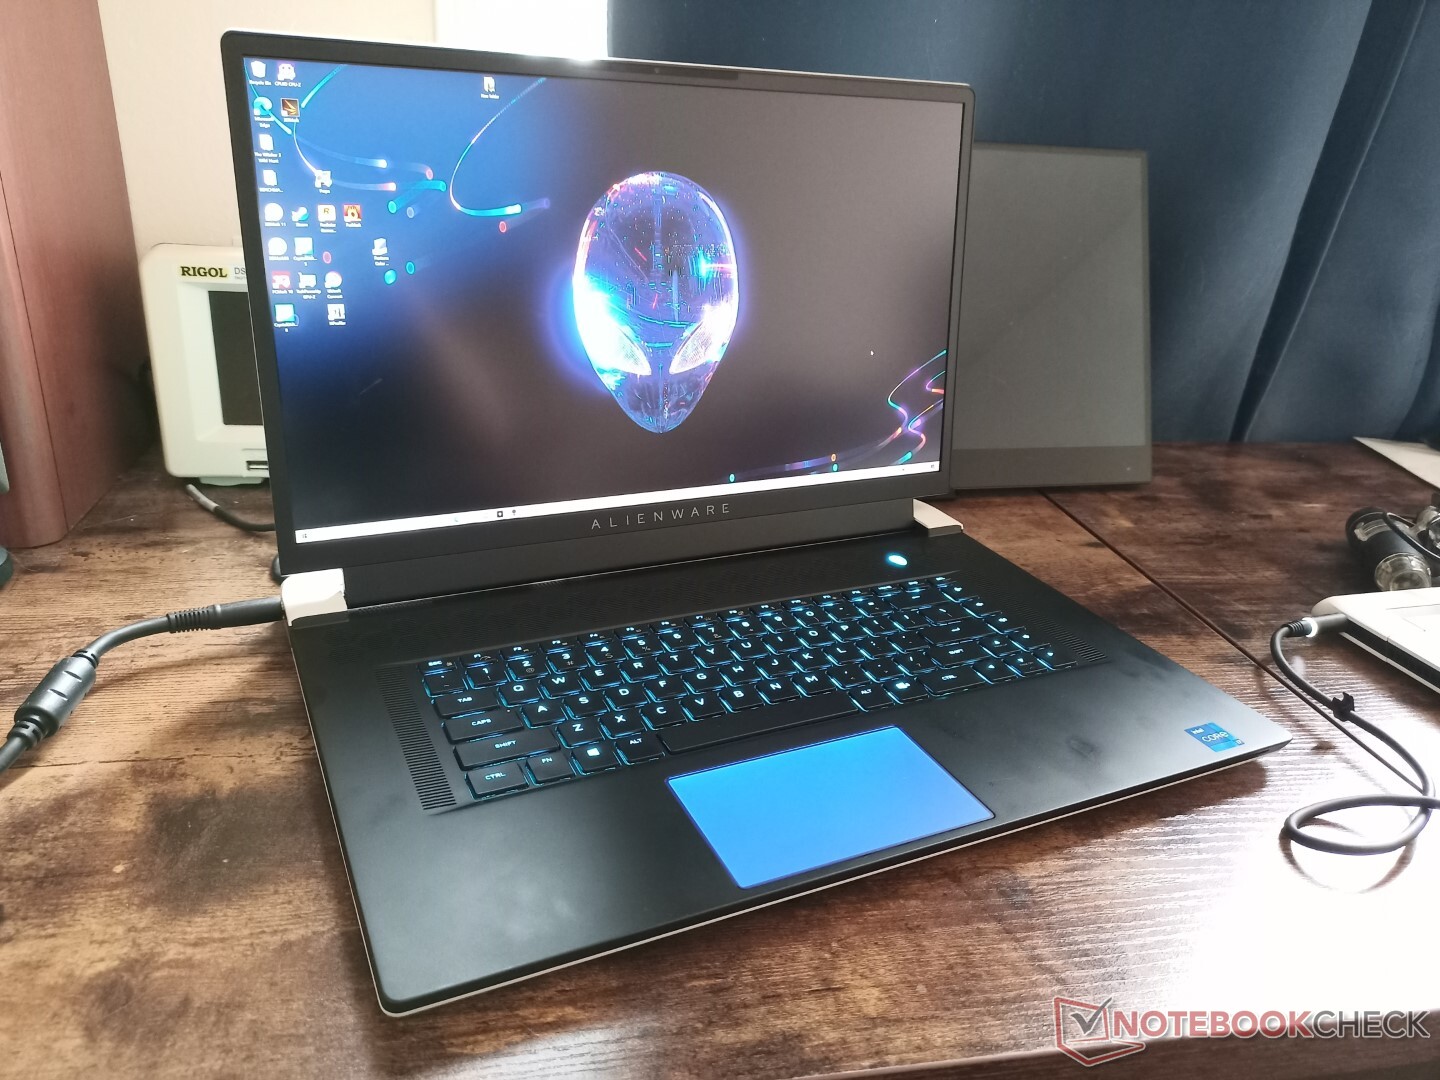
Alienware laptops zijn niet bang om groot te zijn en de x17 R1 is nog steeds een groot systeem, ongeacht hoe "dun" Dell het model op de markt wil brengen. De waarheid is dat het systeem merkbaar groter en zwaarder is dan de meeste concurrerende modellen zoals de MSI GS76, Blade 17, of Zephyrus S17. Zelfs de oudere Alienware m17 R4 is ongeveer 200 gram lichter dan de x17 R1, ondanks hun bijna identieke volumes. Het extra gewicht draagt echter bij aan een sterkere en stijvere basis.
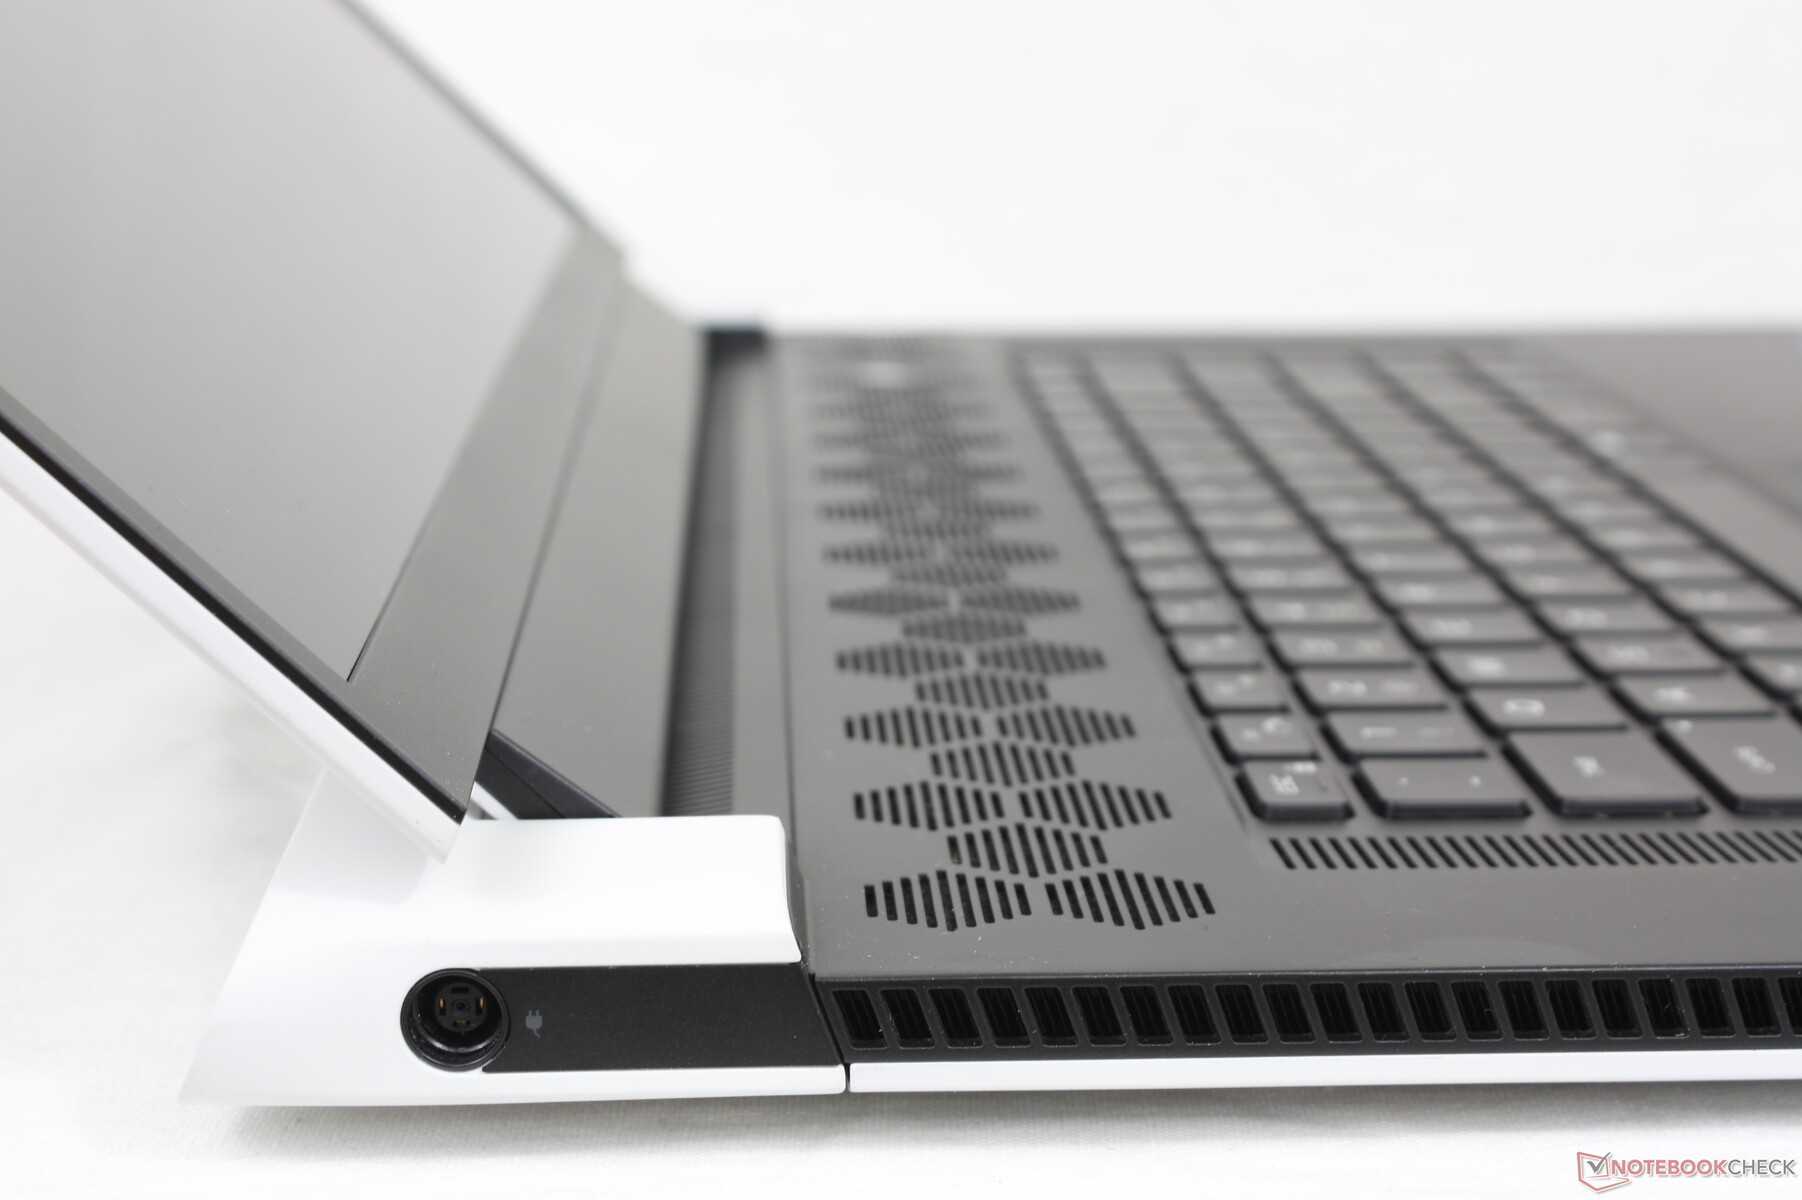
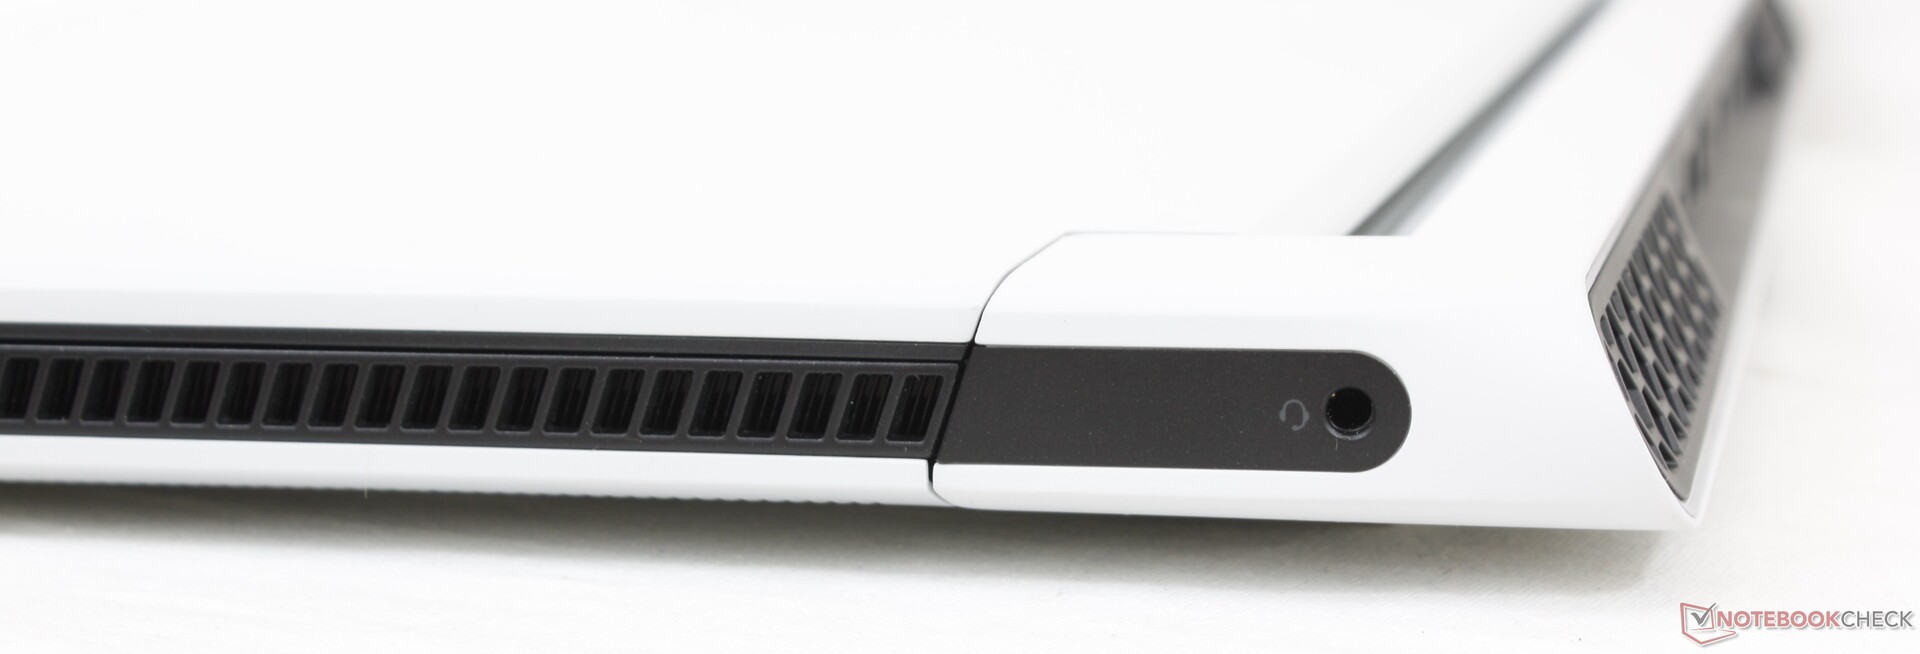
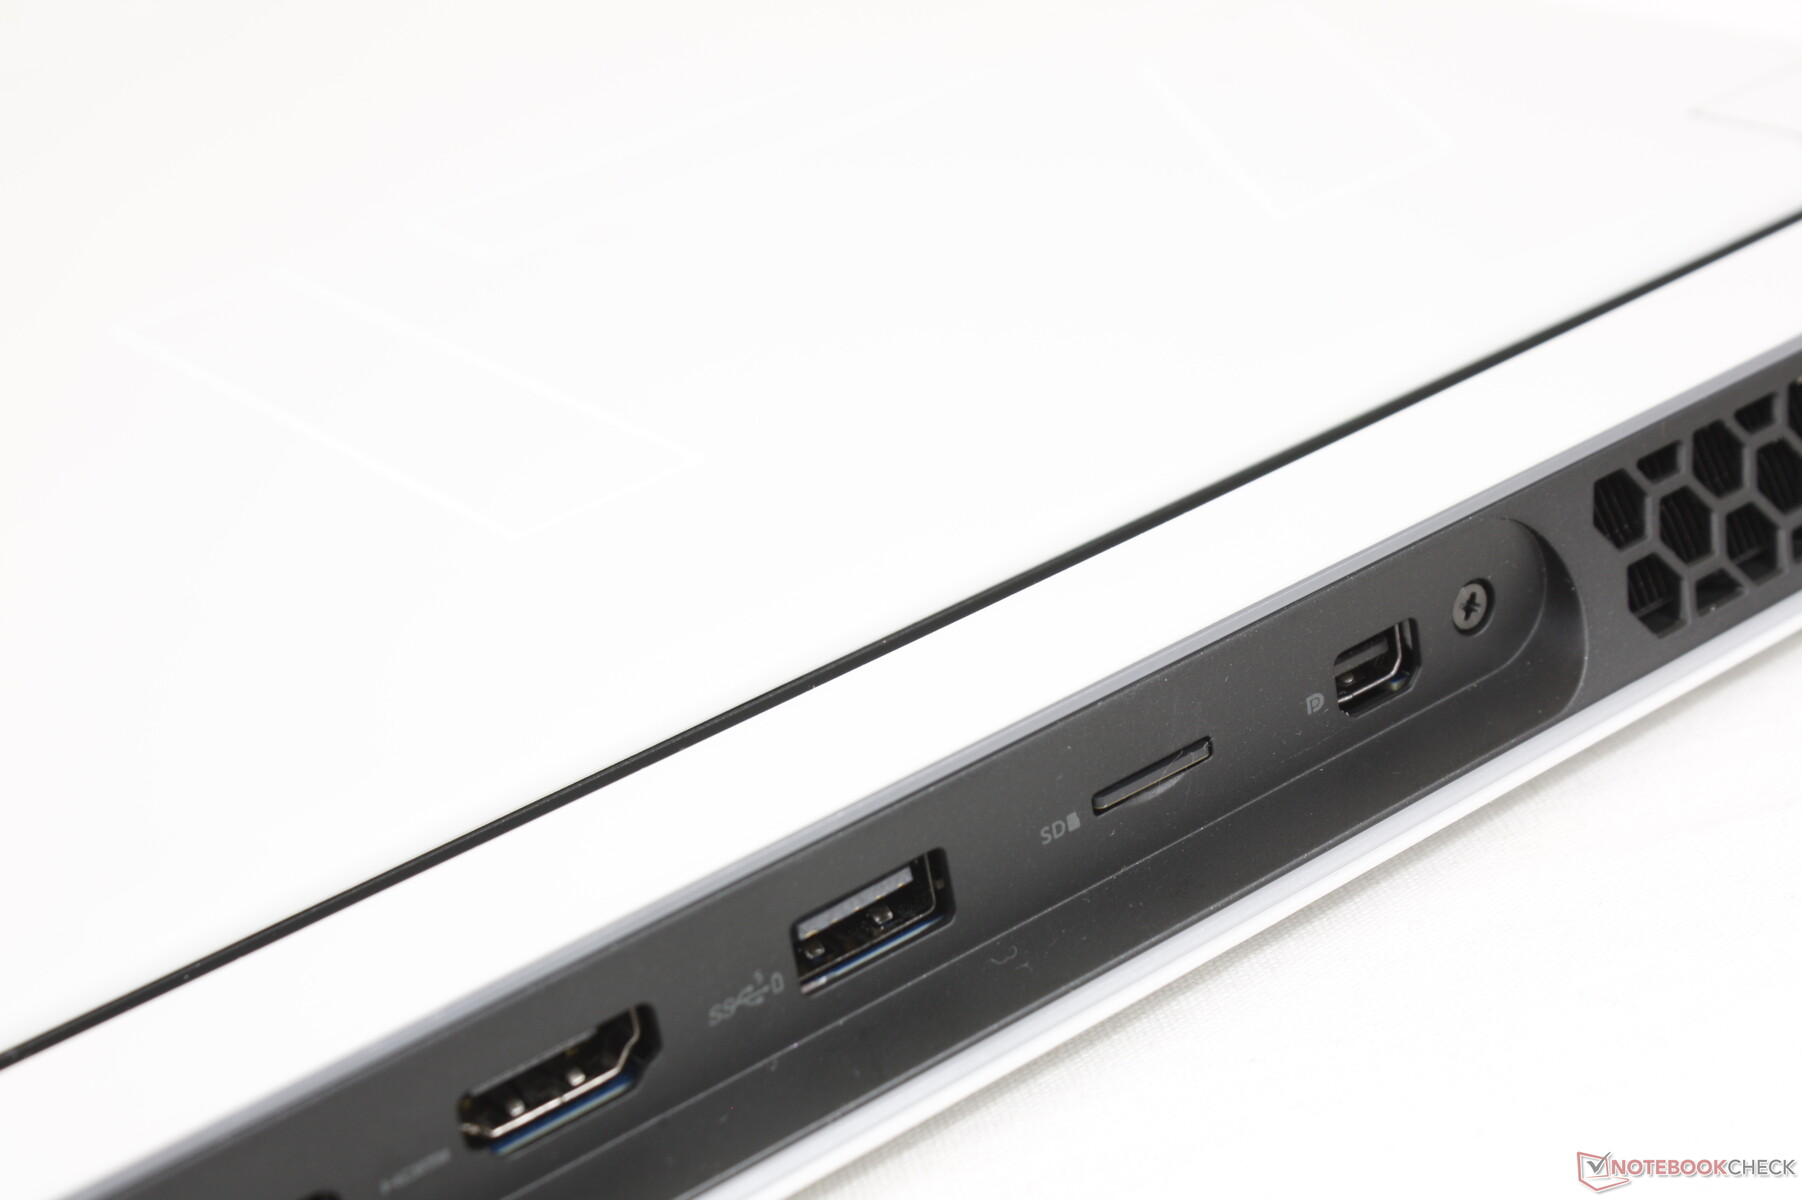
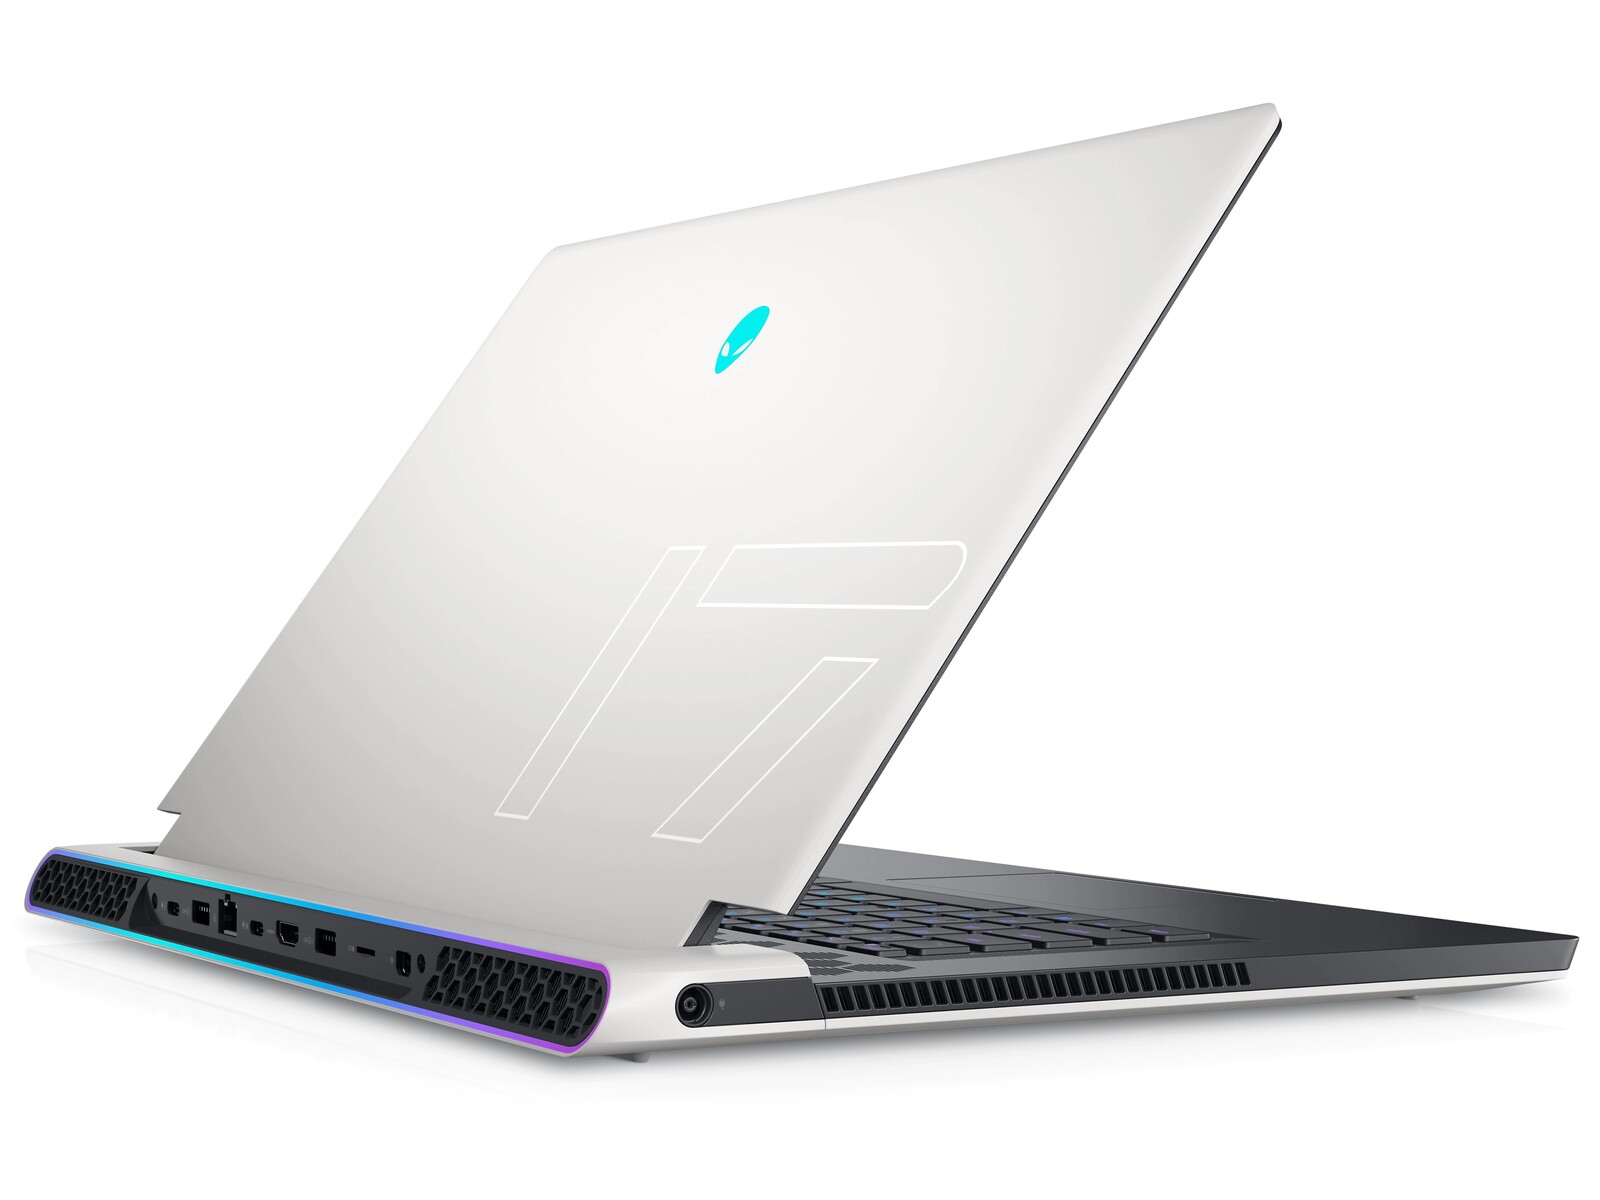
Connectiviteit - Langs de hele achterkant
De poortopties zijn grotendeels hetzelfde als op de Alienware m17 R4 van vorig jaar, maar met een paar belangrijke wijzigingen. De zelden gebruikte eigen Graphics Amplifier-poort is bijvoorbeeld vervallen ten gunste van een handigere tweede USB-C-poort. Er is deze keer ook een USB-A poort minder om mee te werken. Voor de rest zijn alle andere poorten terug, zij het anders gerangschikt langs de achterzijde van het chassis, zodat ze over het algemeen moeilijker te bereiken en te zien zijn dan op de meeste andere laptops
Merk op dat beide USB-C poorten DisplayPort en Power Delivery ondersteunen, maar dat slechts één daadwerkelijk compatibel is met Thunderbolt 4.


SD-kaartlezer
Overdrachtssnelheden van de geïntegreerde MicroSD-lezer zijn zeer snel met bijna 250 MB/s met onze UHS-II testkaart. De sleuf is een beetje moeilijk toegankelijk omdat hij aan de achterkant zit, maar het is zeker beter dan helemaal geen sleuf hebben.
| SD Card Reader | |
| average JPG Copy Test (av. of 3 runs) | |
| Razer Blade 17 RTX 3070 (AV Pro V60) | |
| MSI GS76 Stealth 11UH (AV PRO microSD 128 GB V60) | |
| Alienware m17 R4 (AV PRO microSD 128 GB V60) | |
| Gigabyte Aero 17 HDR YD (AV PRO microSD 128 GB V60) | |
| Asus ROG Zephyrus S17 GX703HSD | |
| Alienware x17 RTX 3080 P48E (AV Pro V60) | |
| maximum AS SSD Seq Read Test (1GB) | |
| Asus ROG Zephyrus S17 GX703HSD | |
| Alienware x17 RTX 3080 P48E (AV Pro V60) | |
| Alienware m17 R4 (AV PRO microSD 128 GB V60) | |
| MSI GS76 Stealth 11UH (AV PRO microSD 128 GB V60) | |
| Razer Blade 17 RTX 3070 (AV Pro V60) | |
| Gigabyte Aero 17 HDR YD (AV PRO microSD 128 GB V60) | |
Communicatie
De Wi-Fi 6-enabled Killer AX1675x module wordt gesoldeerd geleverd, net als op de laatste generatie m17 ontwerpen. Interessant is dat de WLAN-module verwijderbaar is op de Alienware x15, ook al is het een kleinere 15,6-inch form factor.
Webcam - IR, maar geen sluiter
De camerakwaliteit is niet echt verbeterd van generatie op generatie, aangezien het systeem alleen een 720p sensor heeft. Een paar andere laptops zoals de Razer Blade 17 hebben sindsdien een upgrade naar 1080p. Een webcam sluiter ontbreekt ook.

")
")
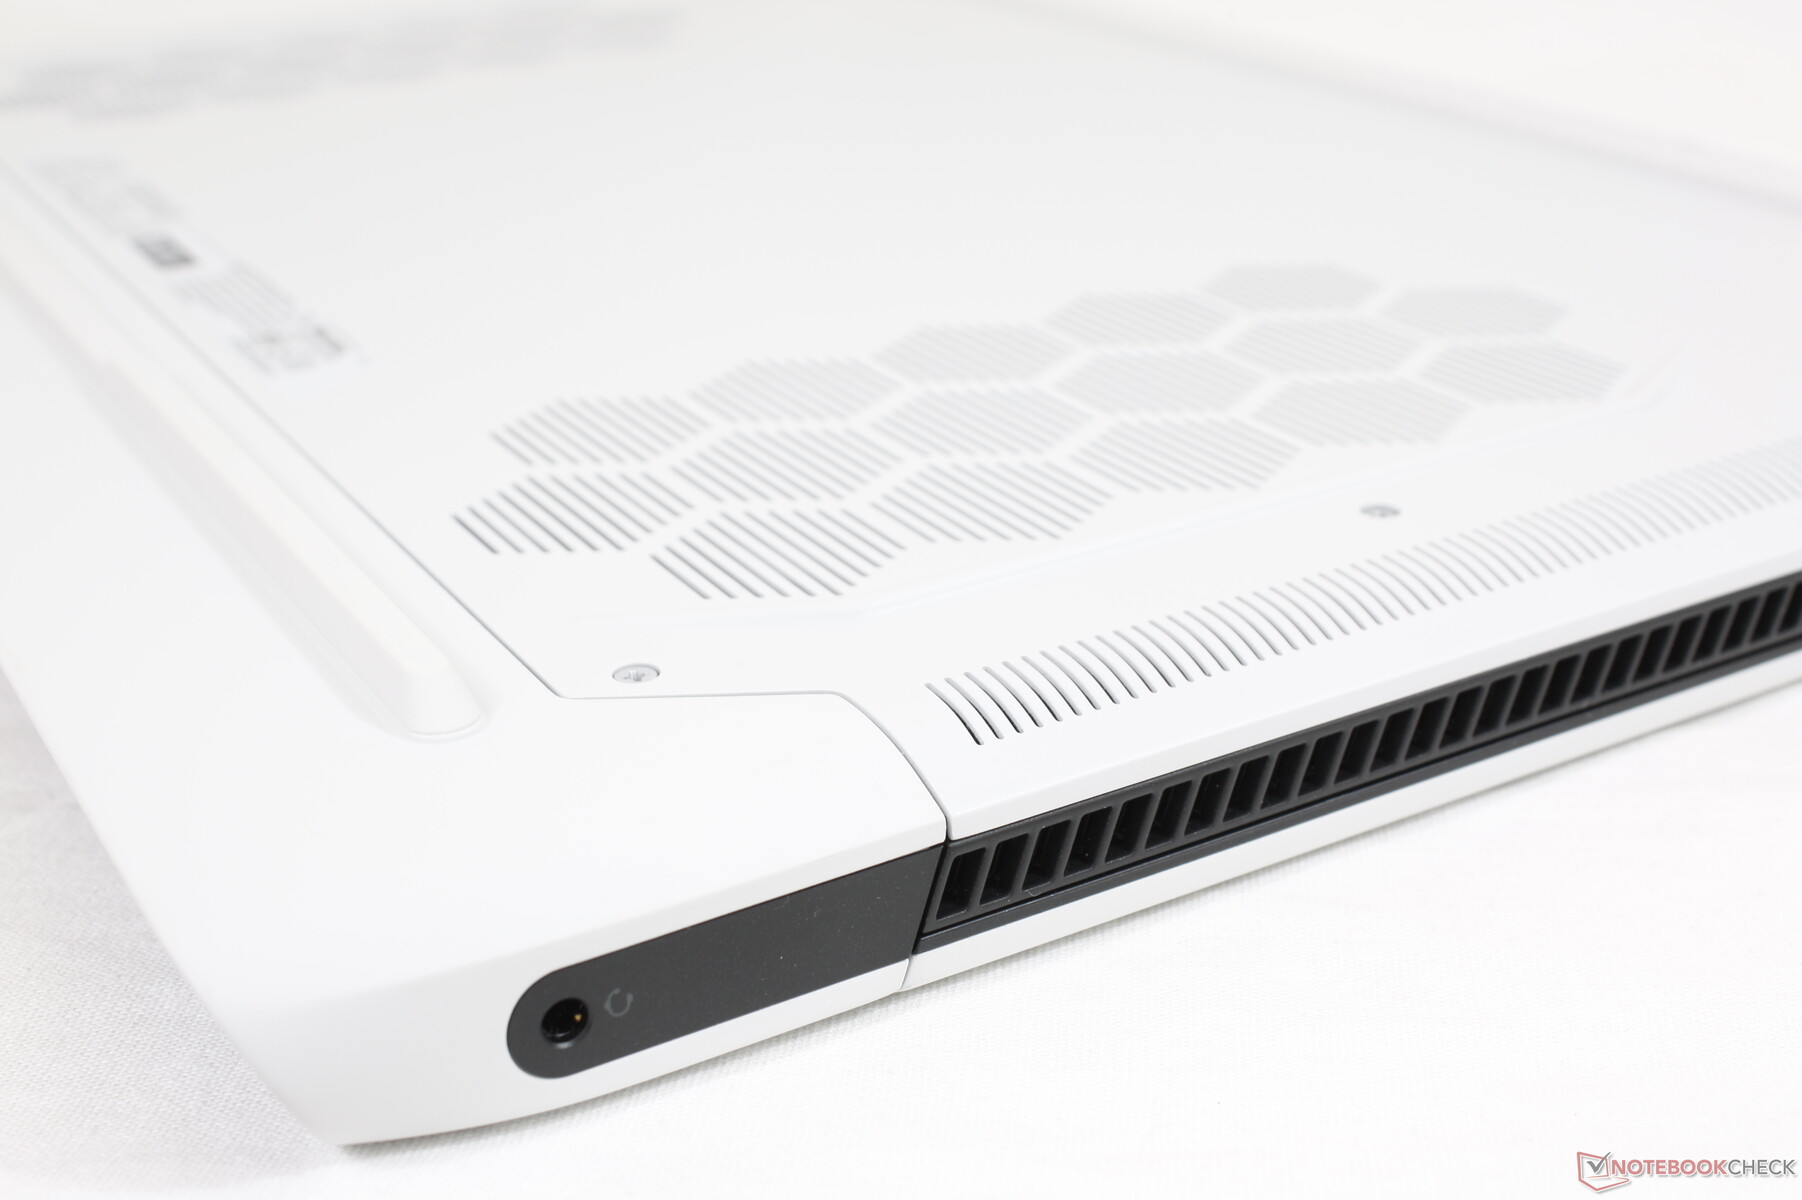
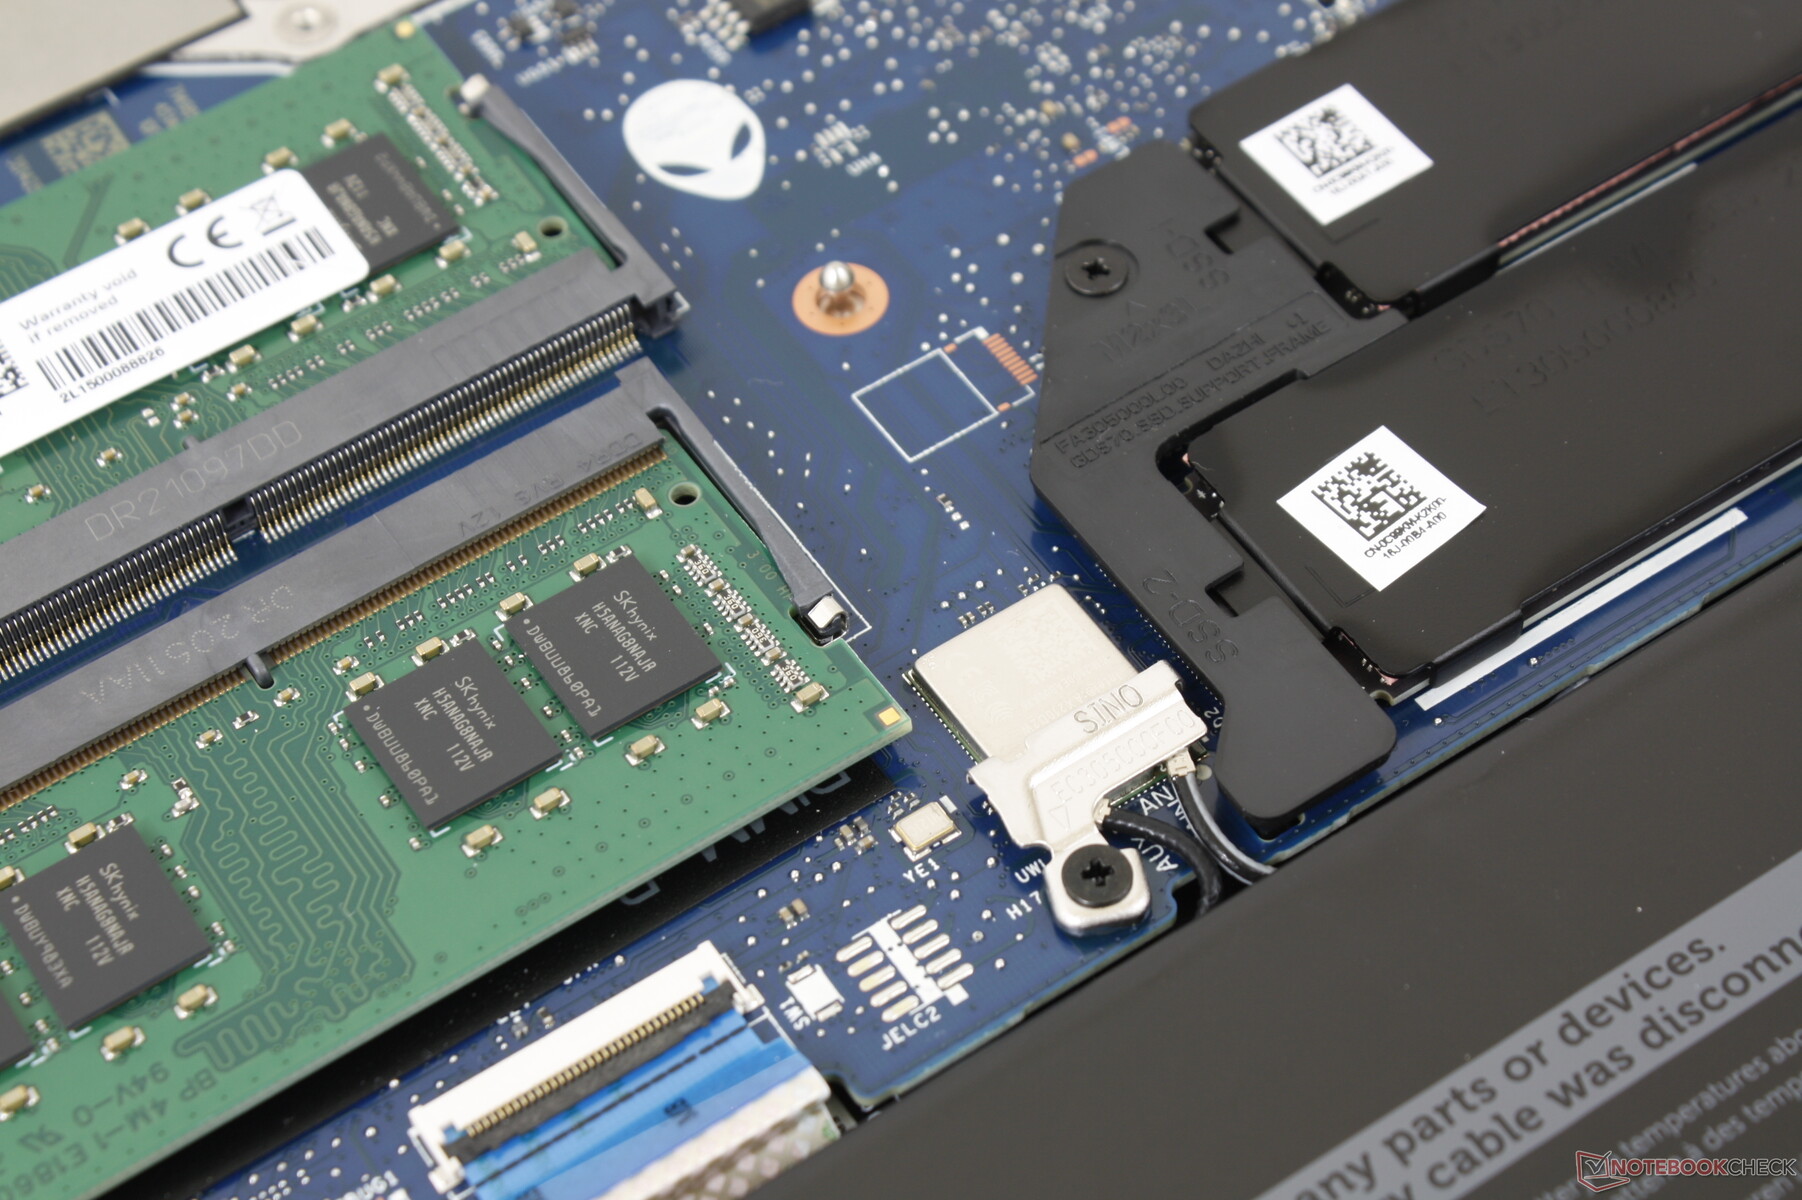
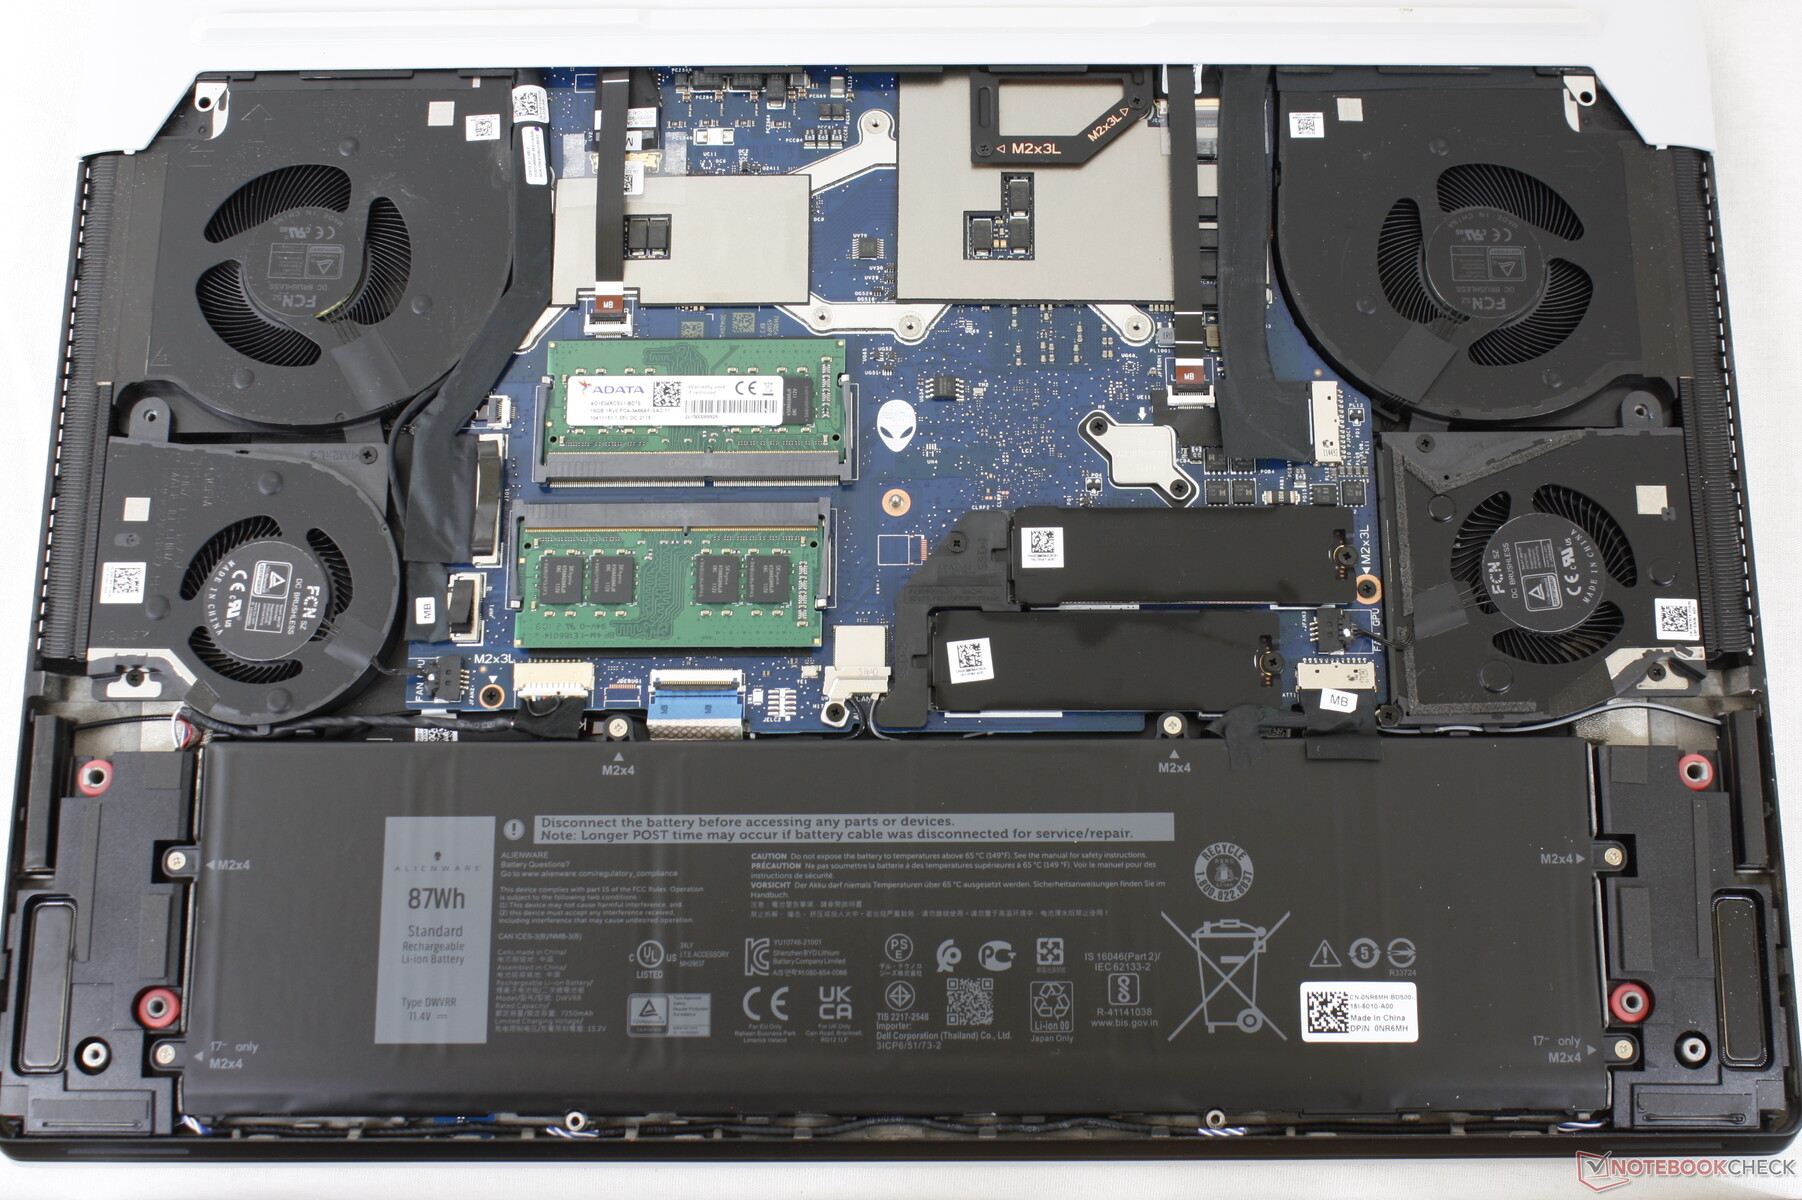
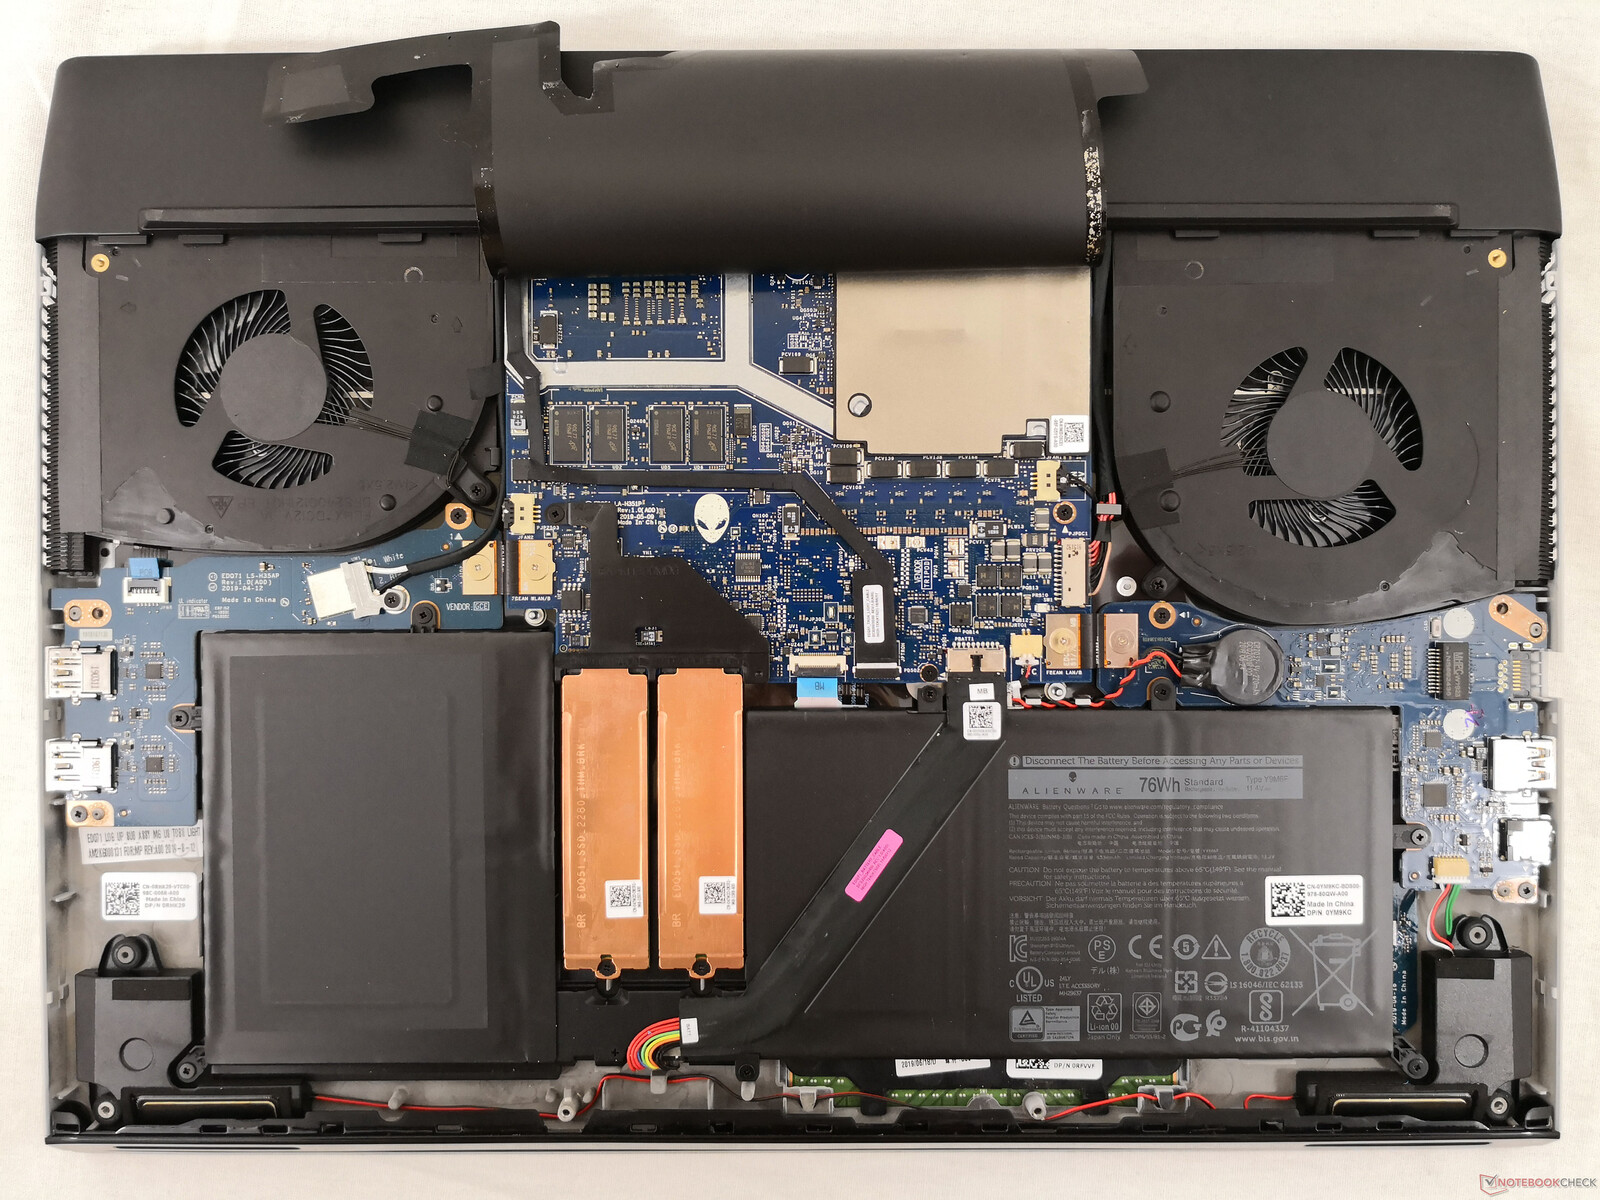
Onderhoud
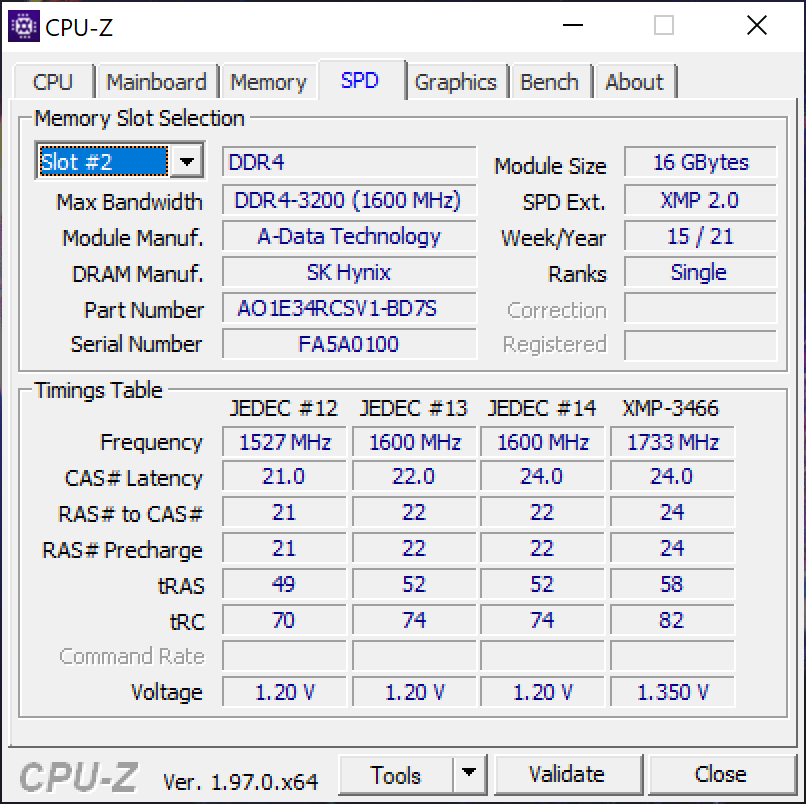
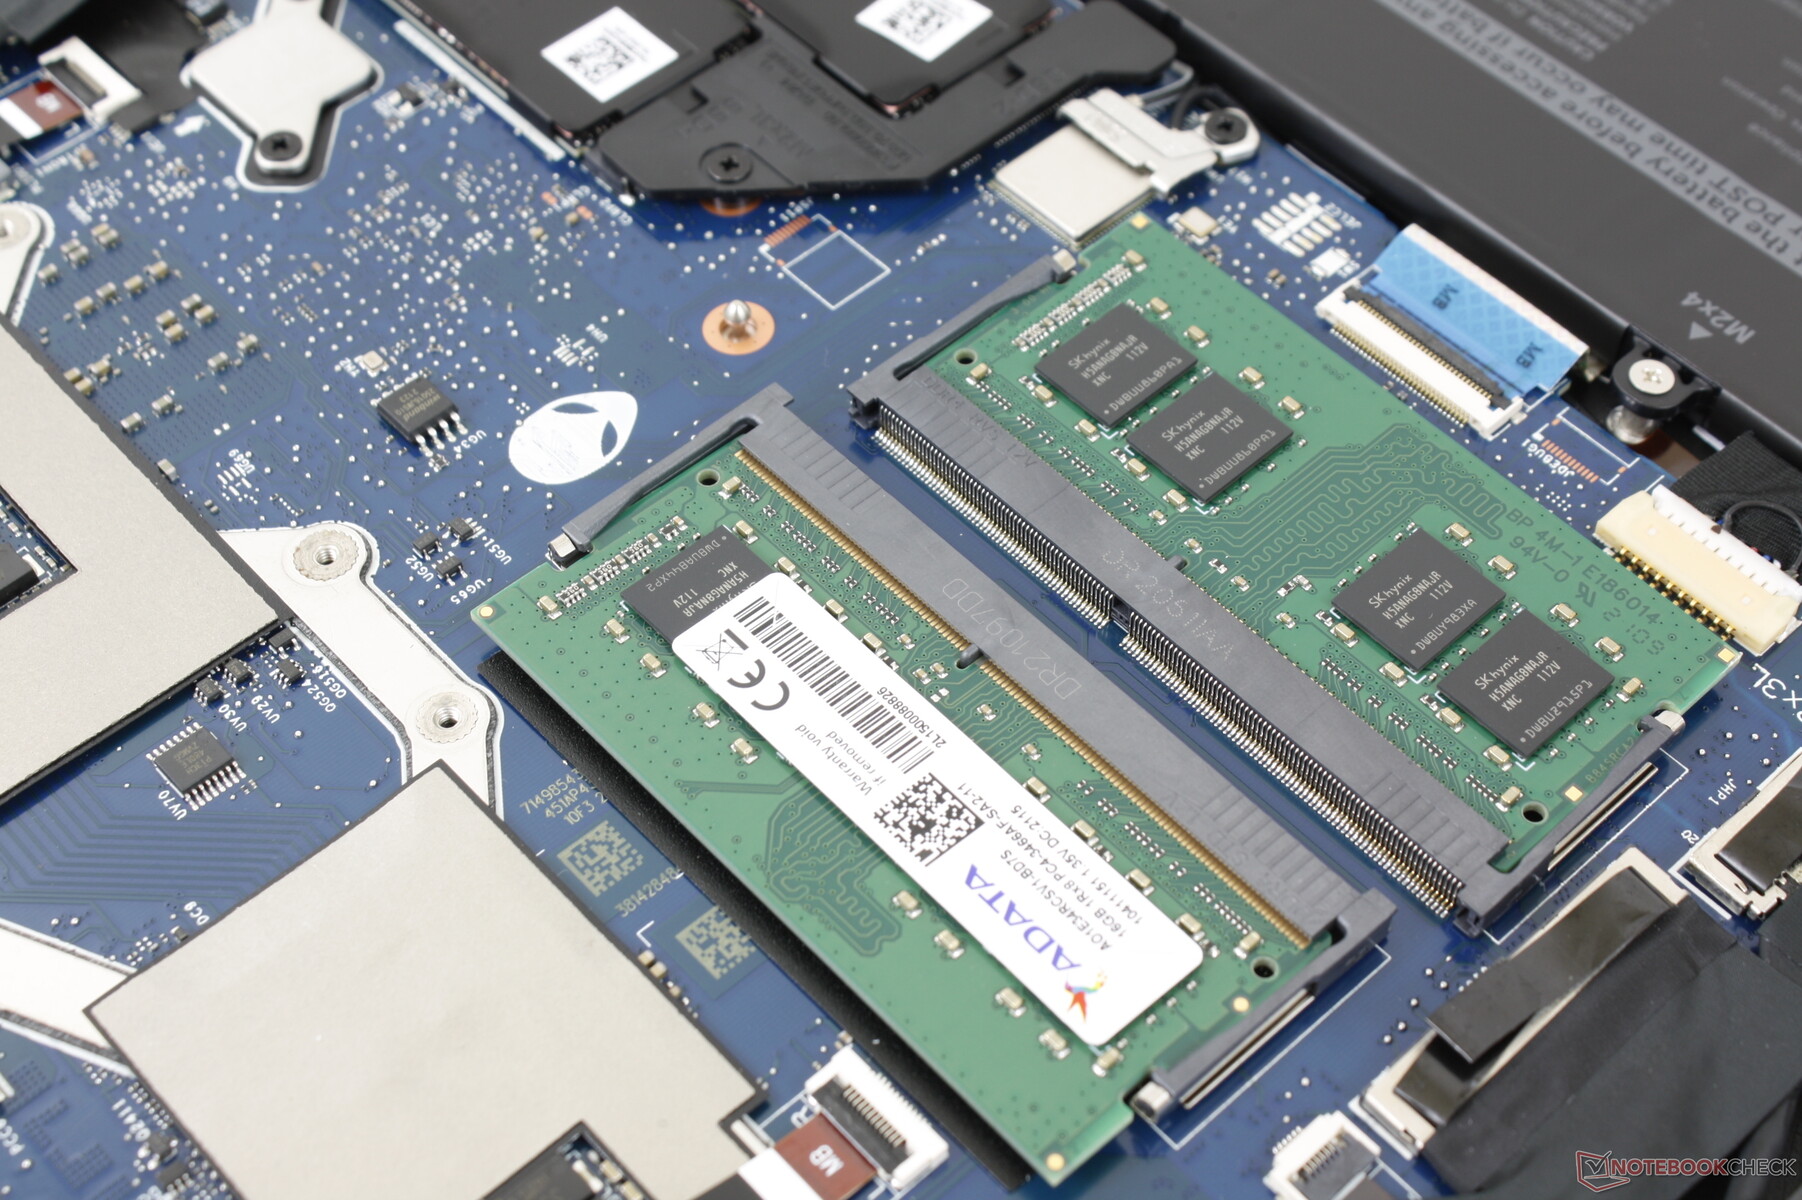
Het onderste paneel kan gemakkelijk worden verwijderd met een Philips schroevendraaier en een scherpe rand. RAM is nu uitbreidbaar via 2x SODIMM slots terwijl ze gesoldeerd zijn op het oudere m17 R2 ontwerp.
Accessoires en garantie
Er zitten geen extra's in de doos buiten de netstroomadapter en het papierwerk. De standaard beperkte garantie van één jaar is van toepassing met uitbreidingsopties indien rechtstreeks bij Dell gekocht.
Invoerapparaten - CherryMX voor de redding
Toetsenbord
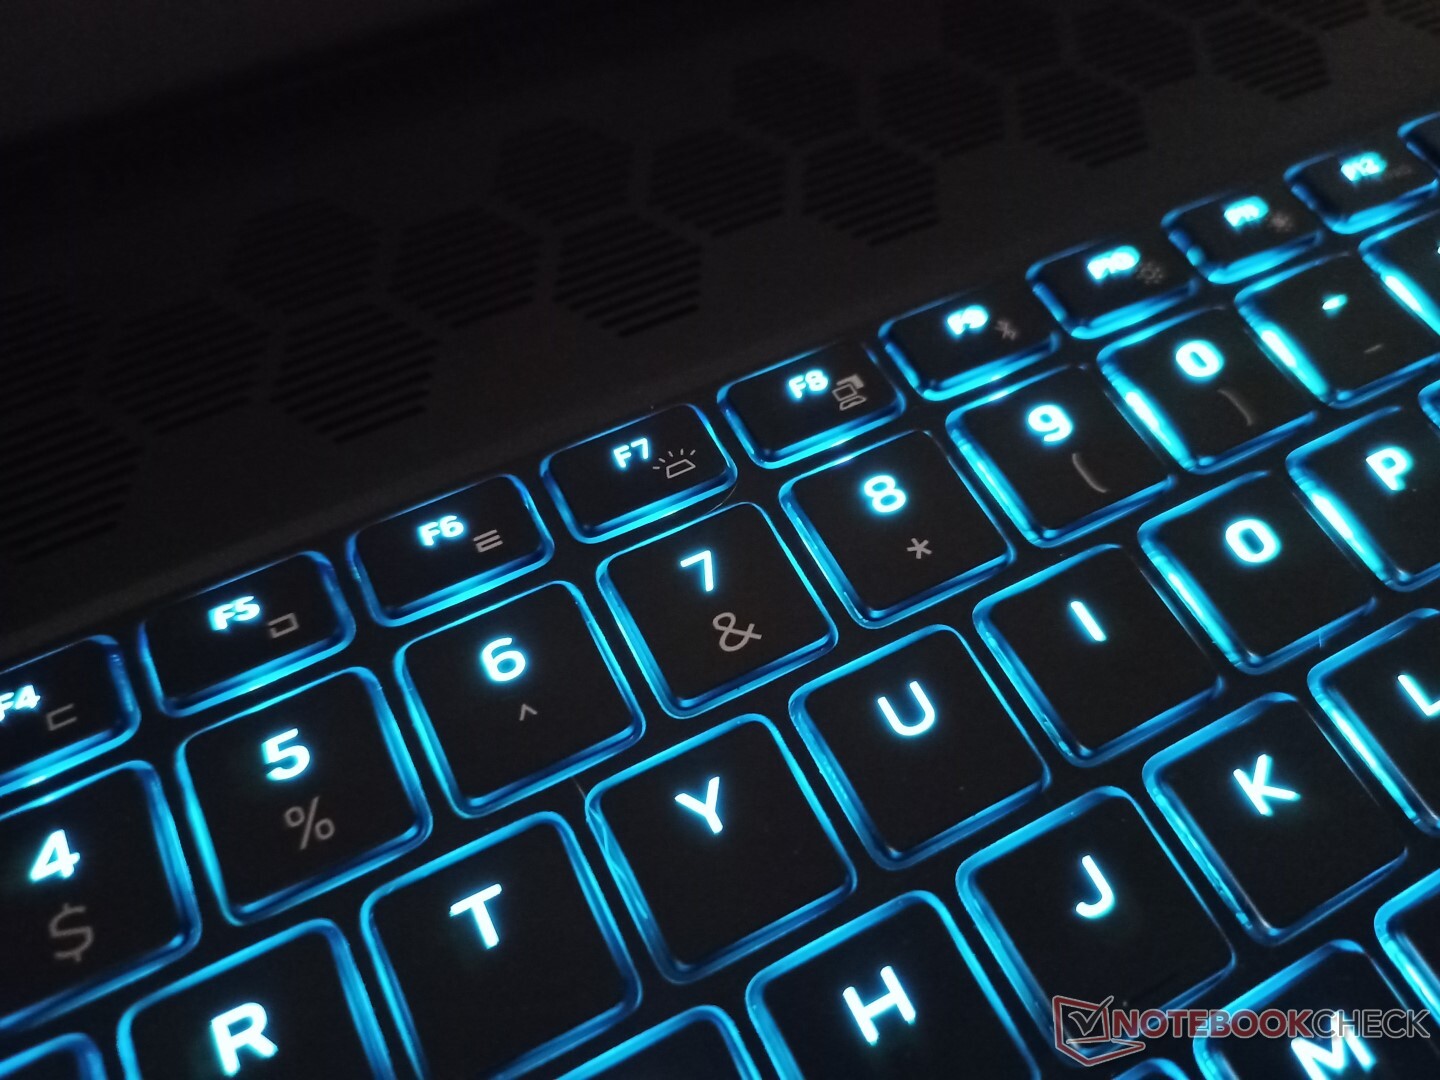
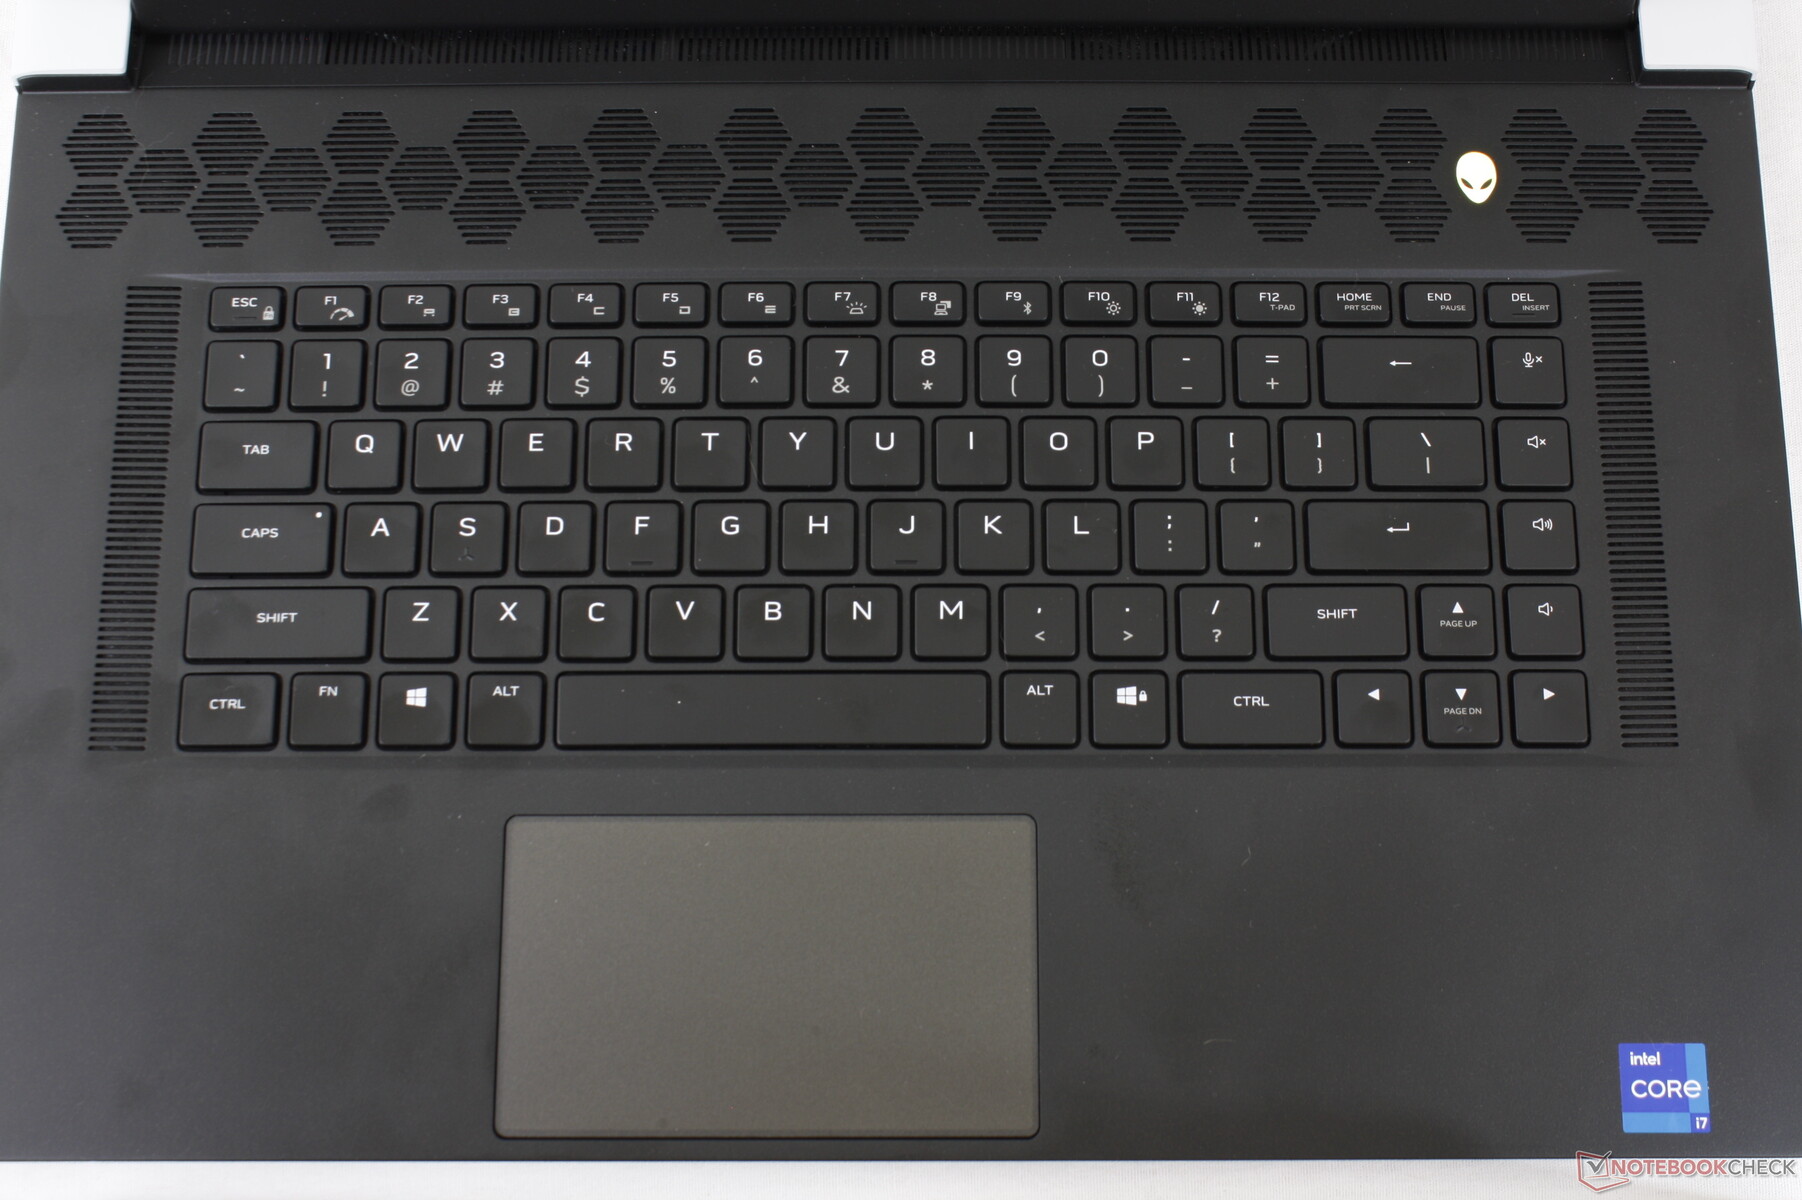
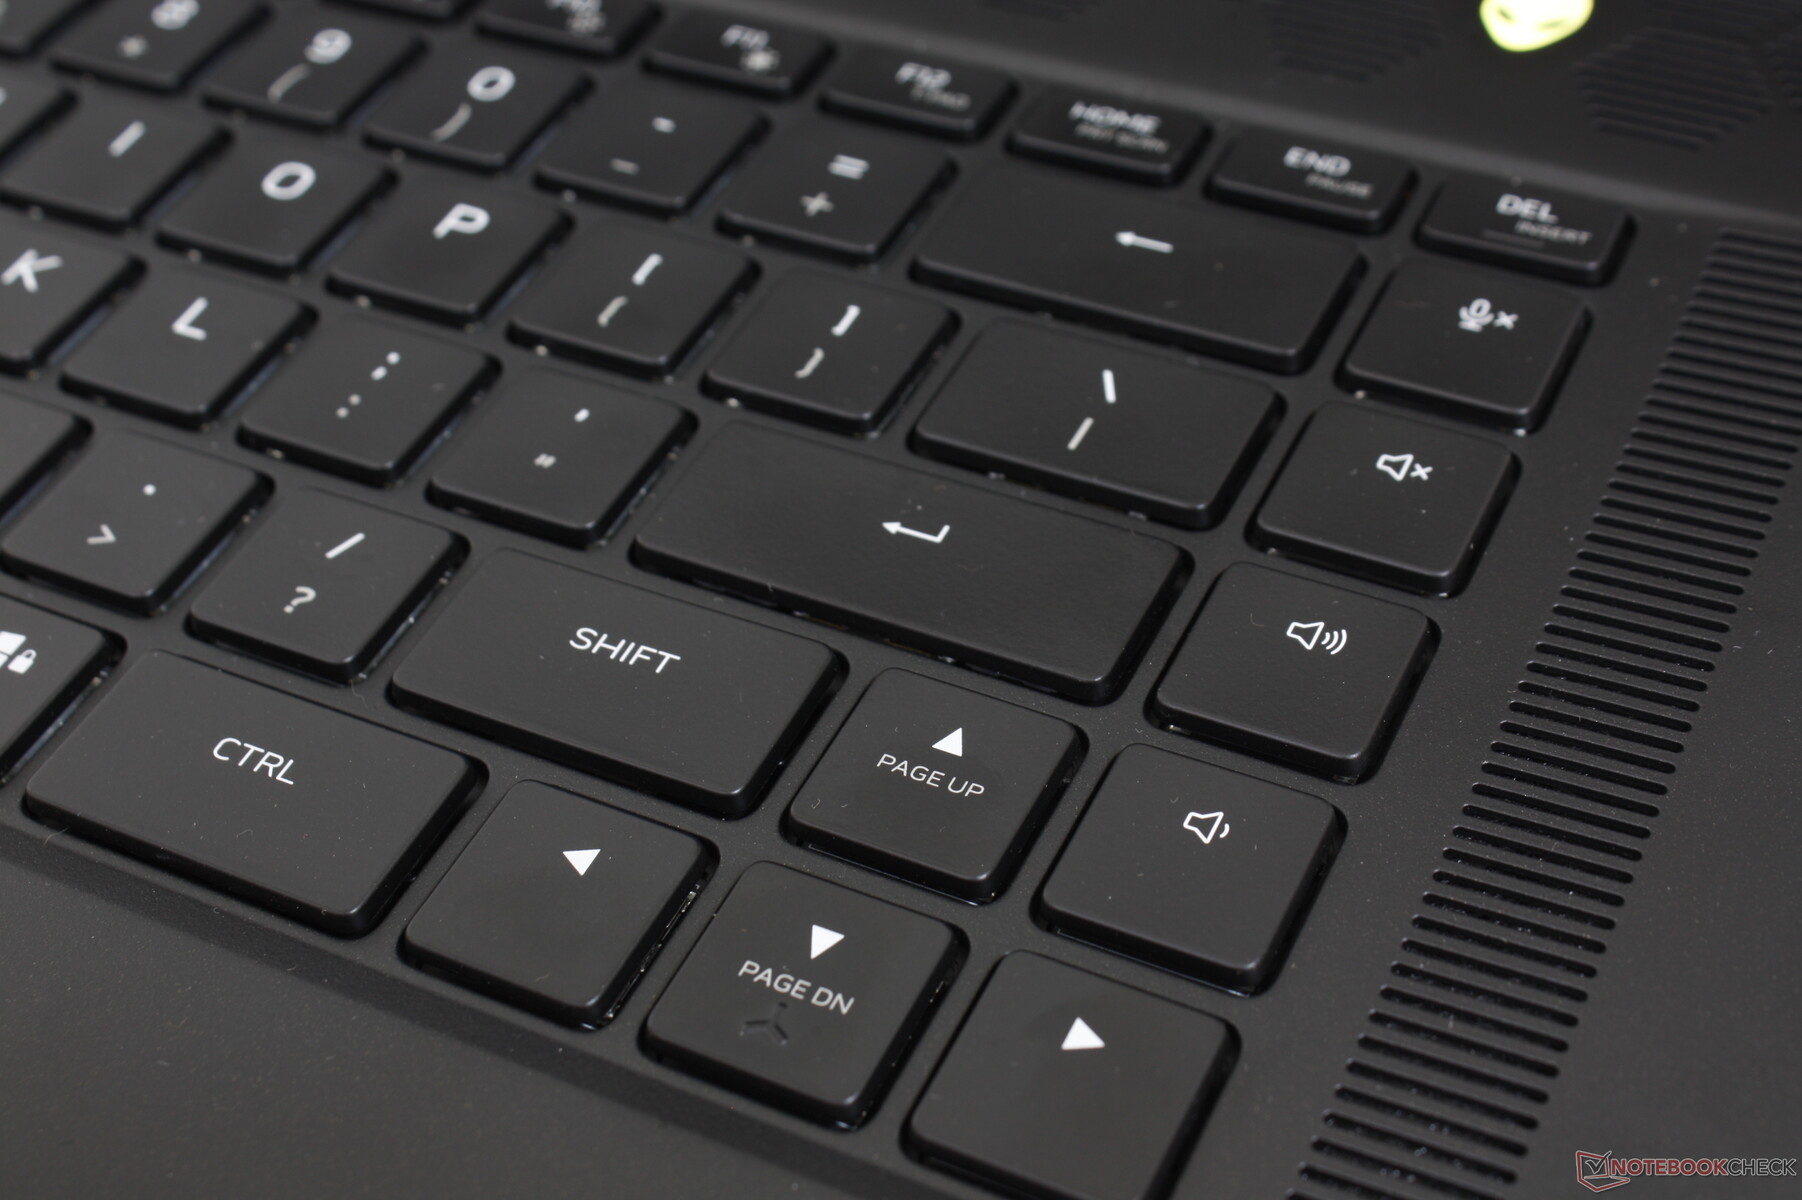
Geïntroduceerd op vorig jaar geïntroduceerd op de Alienware m17 R4, zijn de ultra-lage CherryMX mechanische toetsen teruggekeerd op de x17 R1 als een optionele functie. We waren aanvankelijk huiverig voor de toetsen, omdat mechanische of optische schakelaars meestal ontbreken op laptops als de MSI GT80 Titan, 2019 Razer Blade 15, of Lenovo Legion Y920. Deze nieuwe CherryMX-toetsen worden echter al snel onze favoriet op elke gaming-laptop. Feedback is uniform, scherper, en met zowel diepere reis en een meer bevredigende klik in vergelijking met laptops zoals de Razer Blade 17 of MSI GS76. De RGB-toetsen per toets werken goed voor zowel tekstverwerking als gaming, zij het ten koste van luid, hoog gekletter dat huisgenoten of klasgenoten misschien niet op prijs stellen. In deze scenario's raden we aan om in plaats daarvan te kiezen voor de SKU's met traditionele membraan-gebaseerde schakelaars.
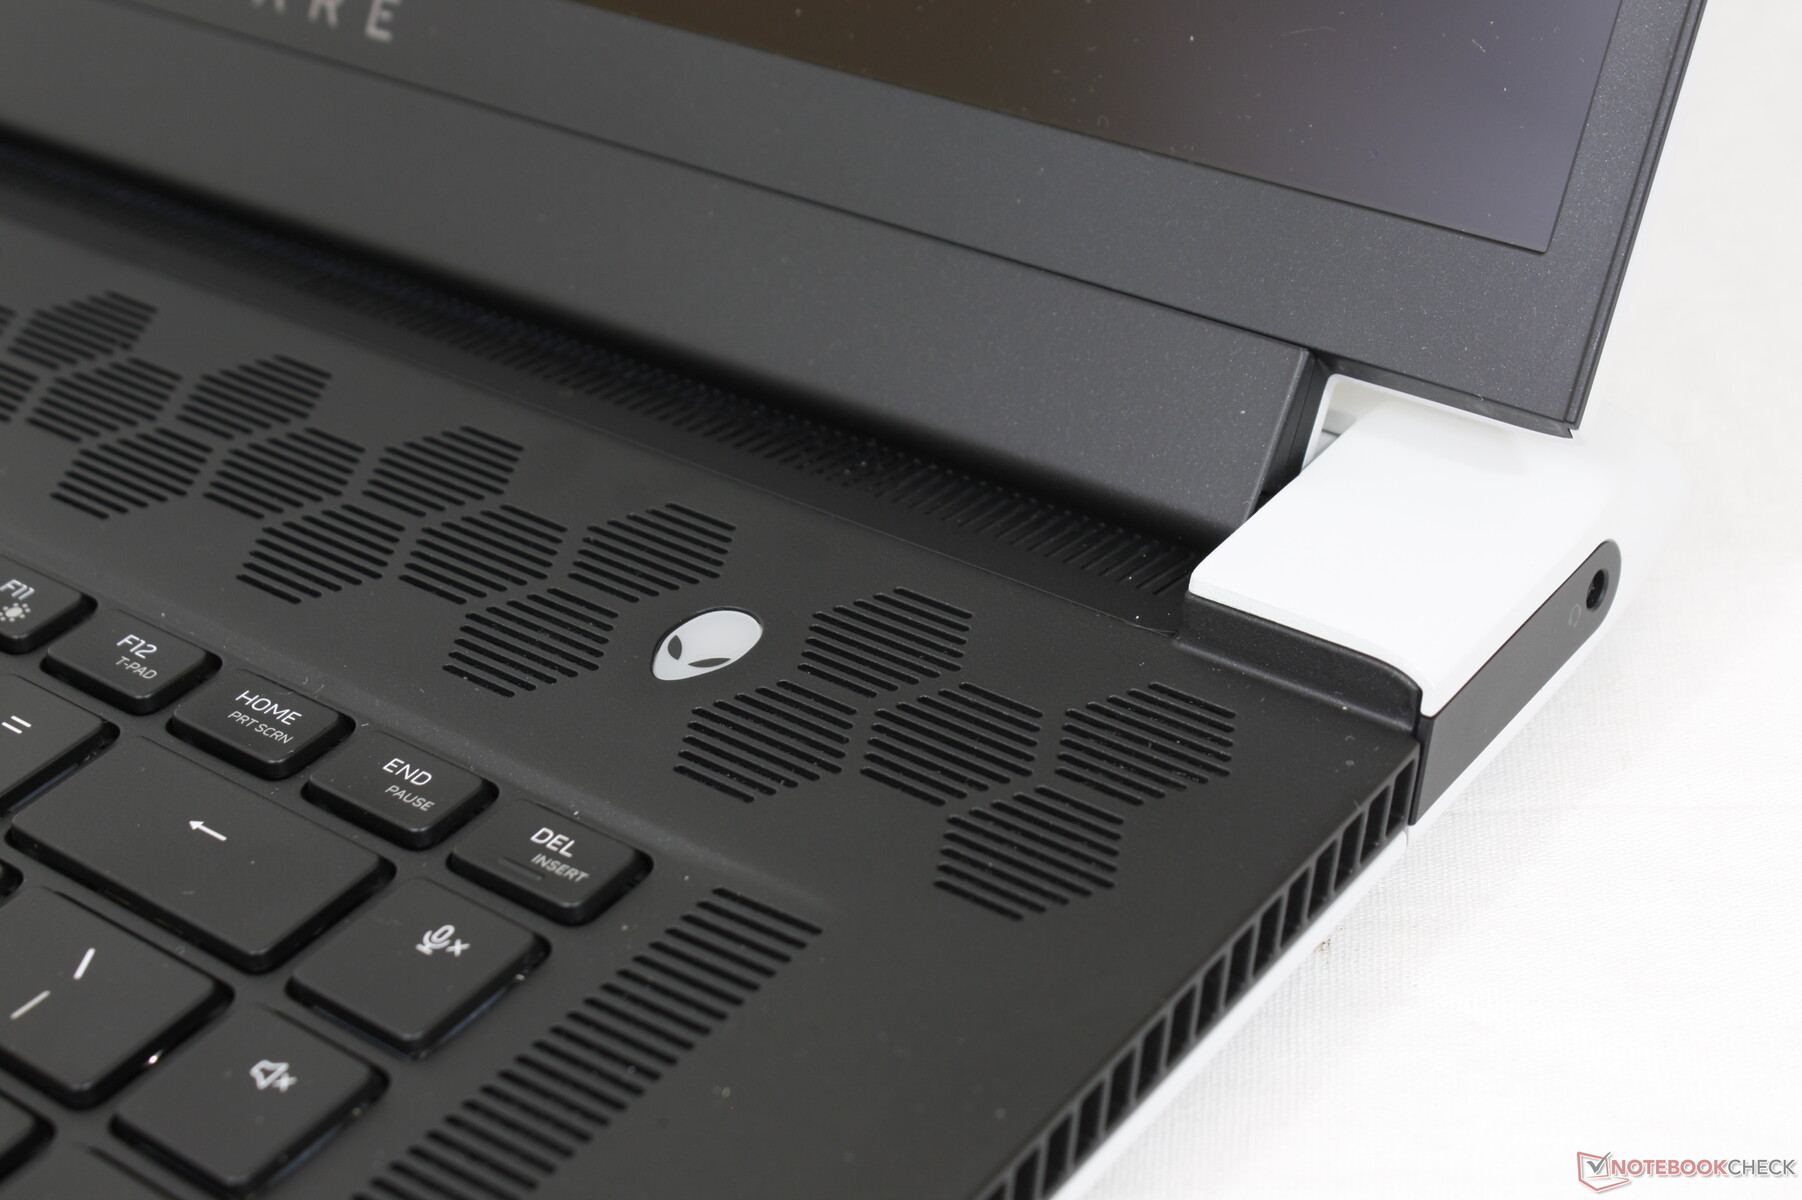
Misschien wel ons grootste probleem met het toetsenbord is dat de secundaire symbolen op de meeste toetsen niet van achtergrondverlichting zijn voorzien. Zo zijn de toetsen voor helderheidsregeling, Print Screen, Pause, Insert, en meer bijna onmogelijk te zien als je werkt of gamet onder zwak omgevingslicht. Alle toetsen en symbolen zijn verlicht op de Blade 17 in vergelijking. Merk op dat de eerste rij functietoetsen ook niet mechanisch zijn.
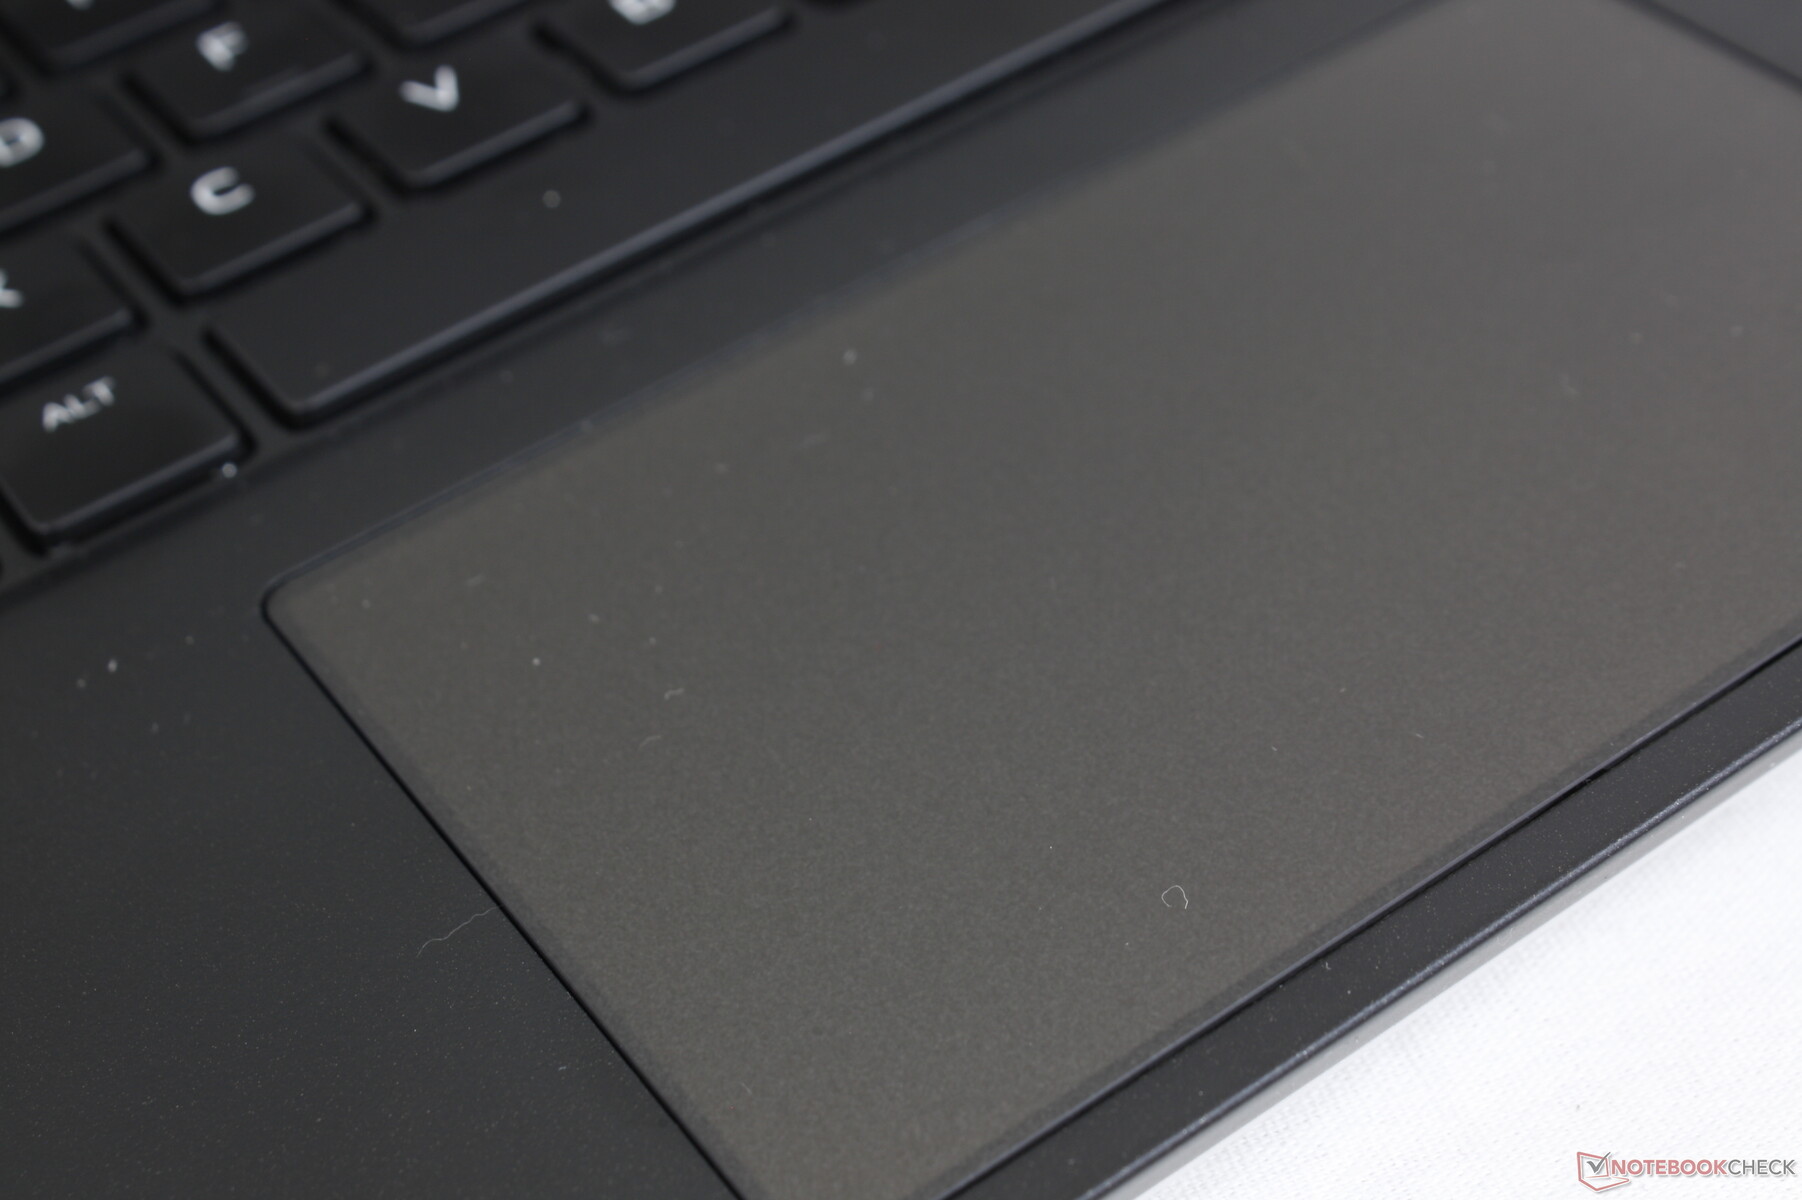
Touchpad
Het Precision clickpad is relatief klein met 11,3 x 6,8 cm, vergeleken met 14 x 6,5 cm op de MSI GS75. Het oppervlak is verder glad bij het glijden op gemiddelde snelheden met slechts een beetje kleven bij lagere snelheden voor meer nauwkeurige klikken. De travel is erg ondiep en de feedback is aan de zachtere kant bij het indrukken. Hoewel een groter oppervlak gemakkelijker multi-touch inputs mogelijk zou hebben gemaakt, is het clickpad in ieder geval niet zo sponzig als dat van de Razer Blade serie.
Dell biedt een RGB achtergrondverlichting voor het clickpad op bepaalde SKU's, wat een terugkerende oppervlakkige optie is van oudere Alienware laptops. Deze functie is niet beschikbaar op de kleinere 15,6-inch Alienware x15 R1.

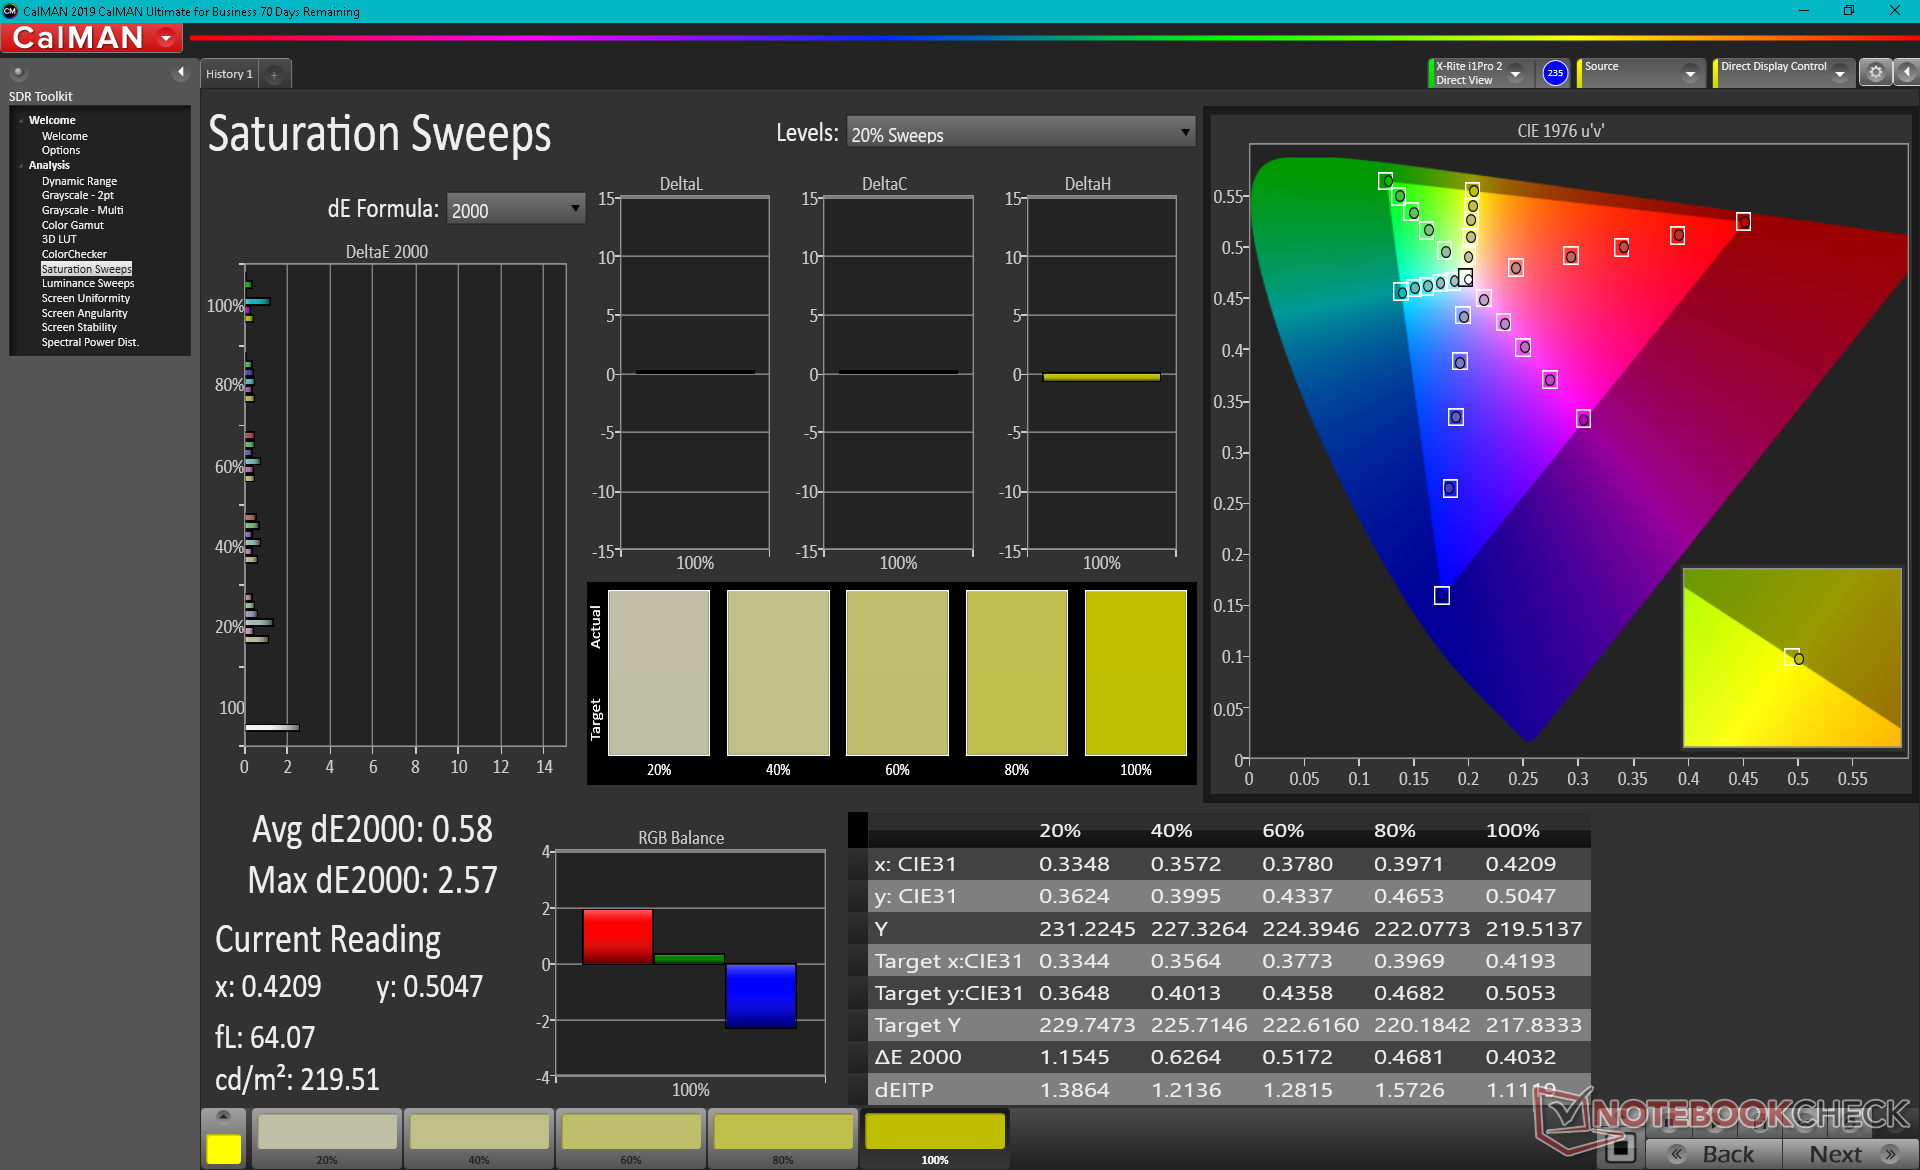
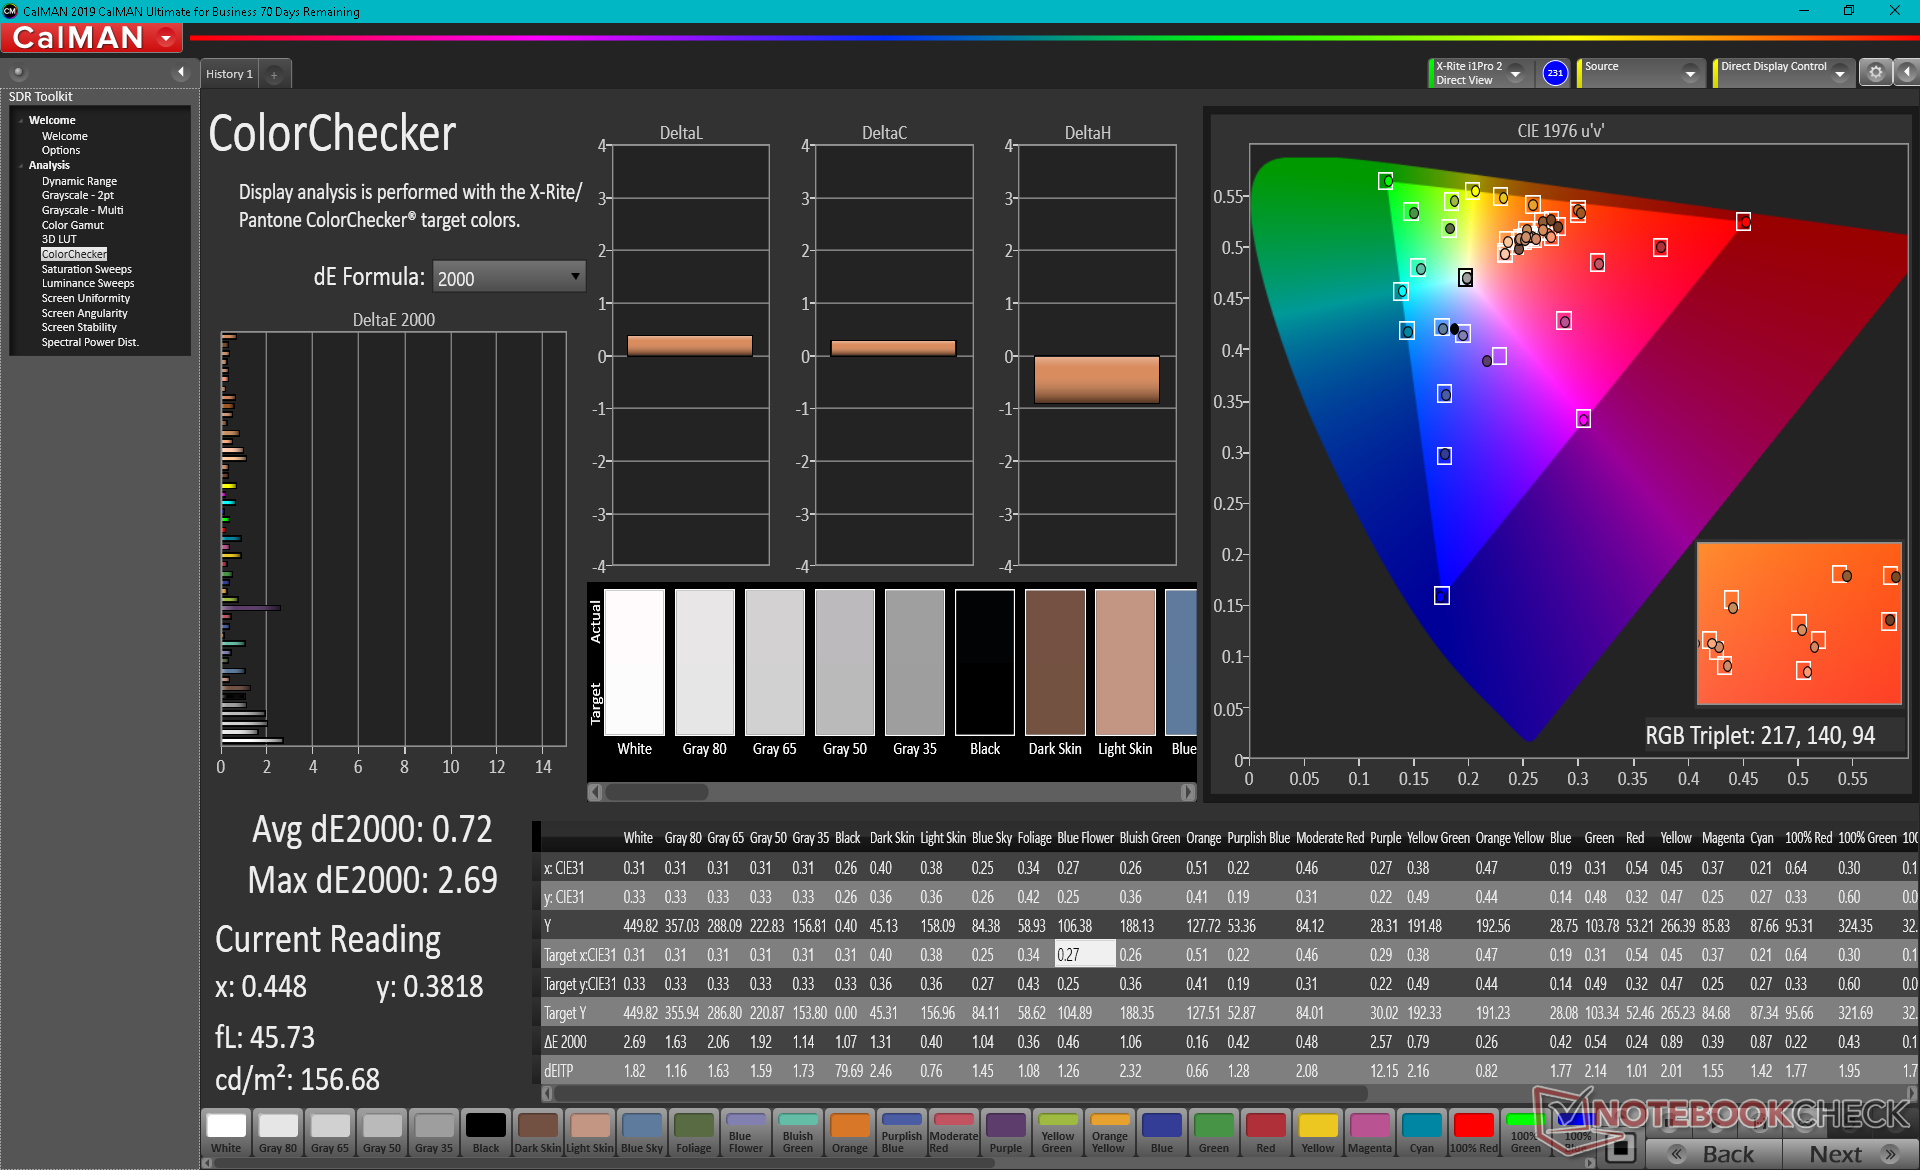
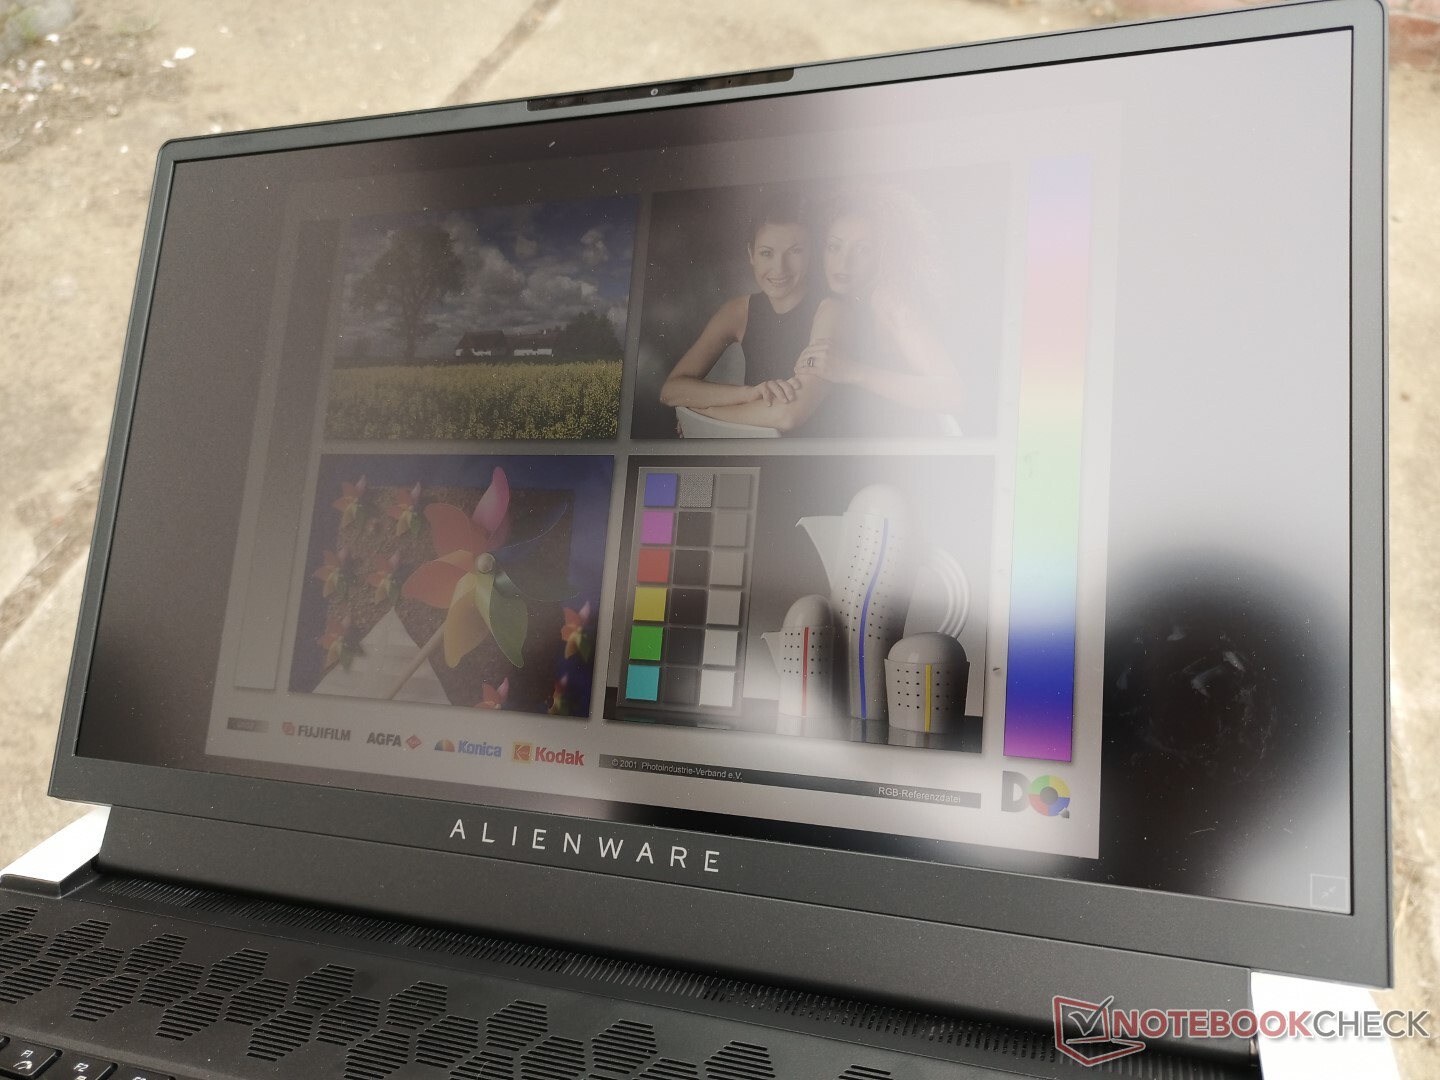
Beeldscherm - 4K, 120 Hz, 100% AdobeRGB, 5 ms
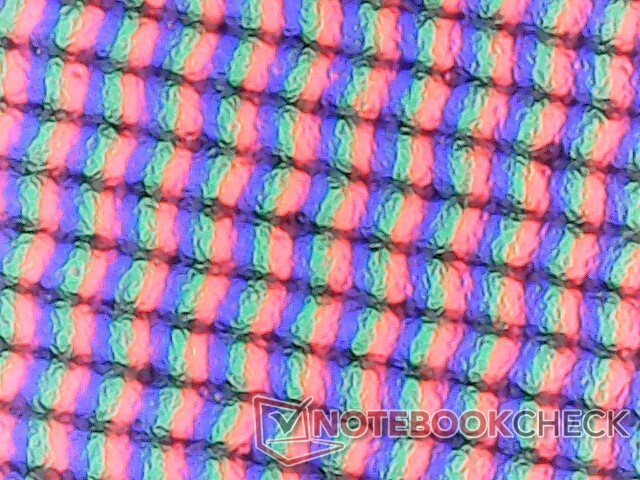
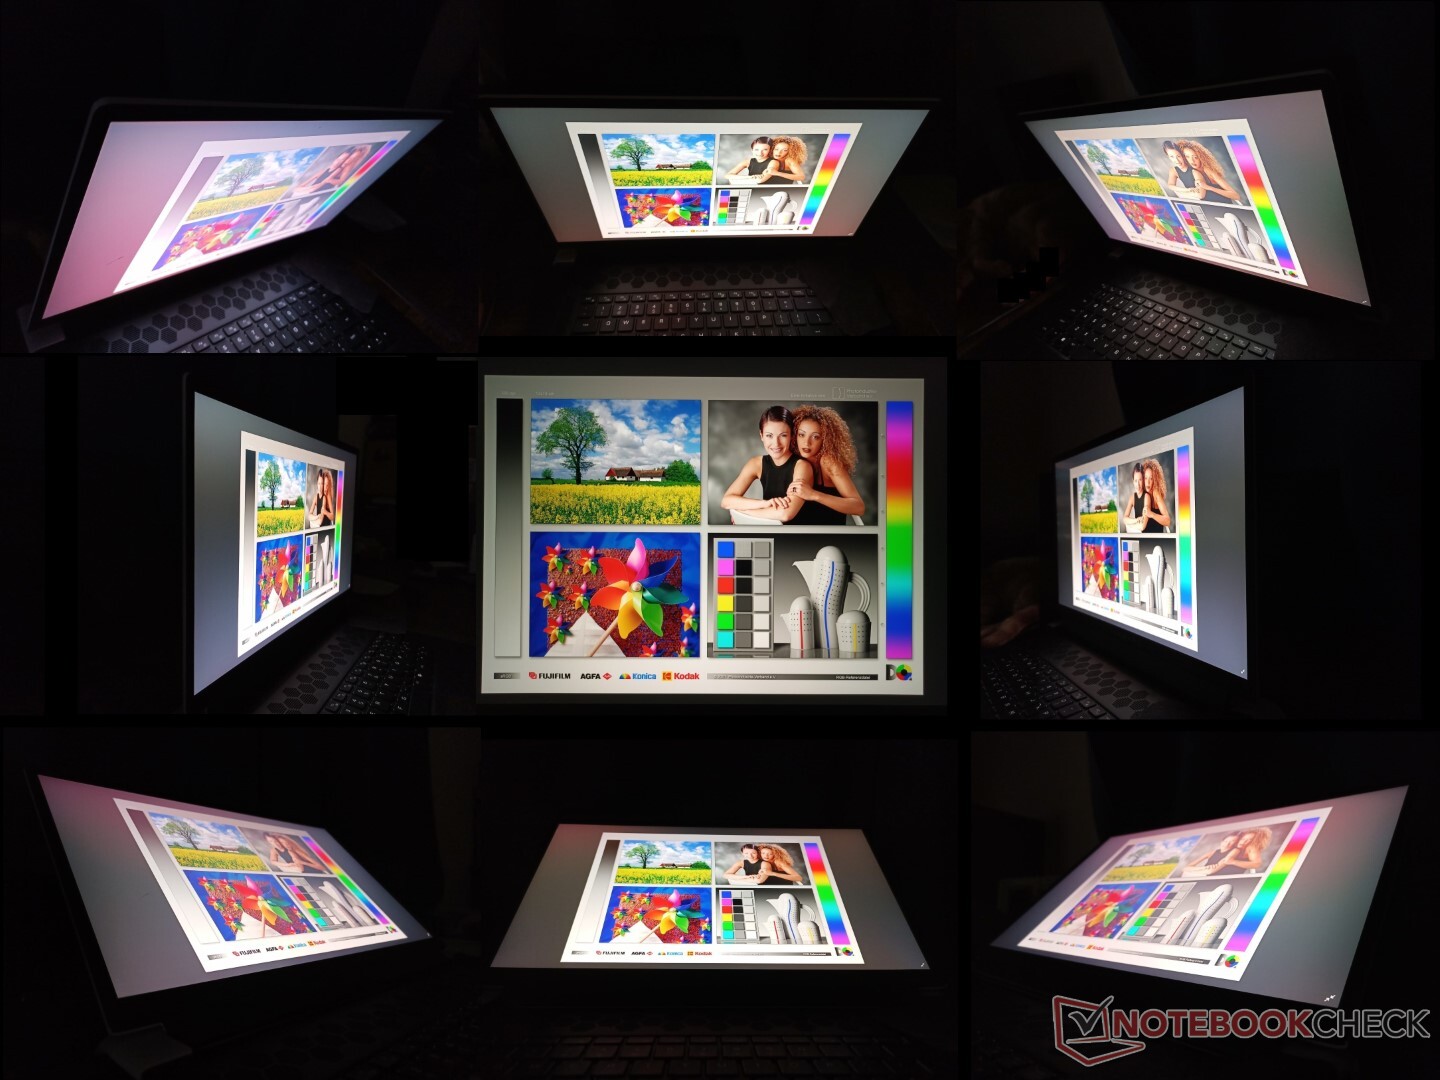
Terwijl het AU Optronics B173ZAN paneel te vinden is op andere laptops zoals deSchenker XMG Ultra 17heeft het paneel op onze Alienware een native verversingssnelheid van 120 Hz in plaats van 60 Hz. Verder zijn de zwart-wit en grijs-grijs reactietijden zeer snel in het één-cijferige bereik en is de maximale helderheid ook merkbaar helderder dan op de meeste andere gaming laptops. De MSI GS76 heeft een vergelijkbaar 4K-paneel met nog snellere responstijden dan onze Alienware, zij het ten koste van een kleiner gamma. Dit maakt het Alienware-beeldscherm een van de weinige die we hebben gezien die schijnbaar aan alle eisen voldoet met betrekking tot verversingssnelheid, resolutie, responstijden, kleurdekking en helderheid.
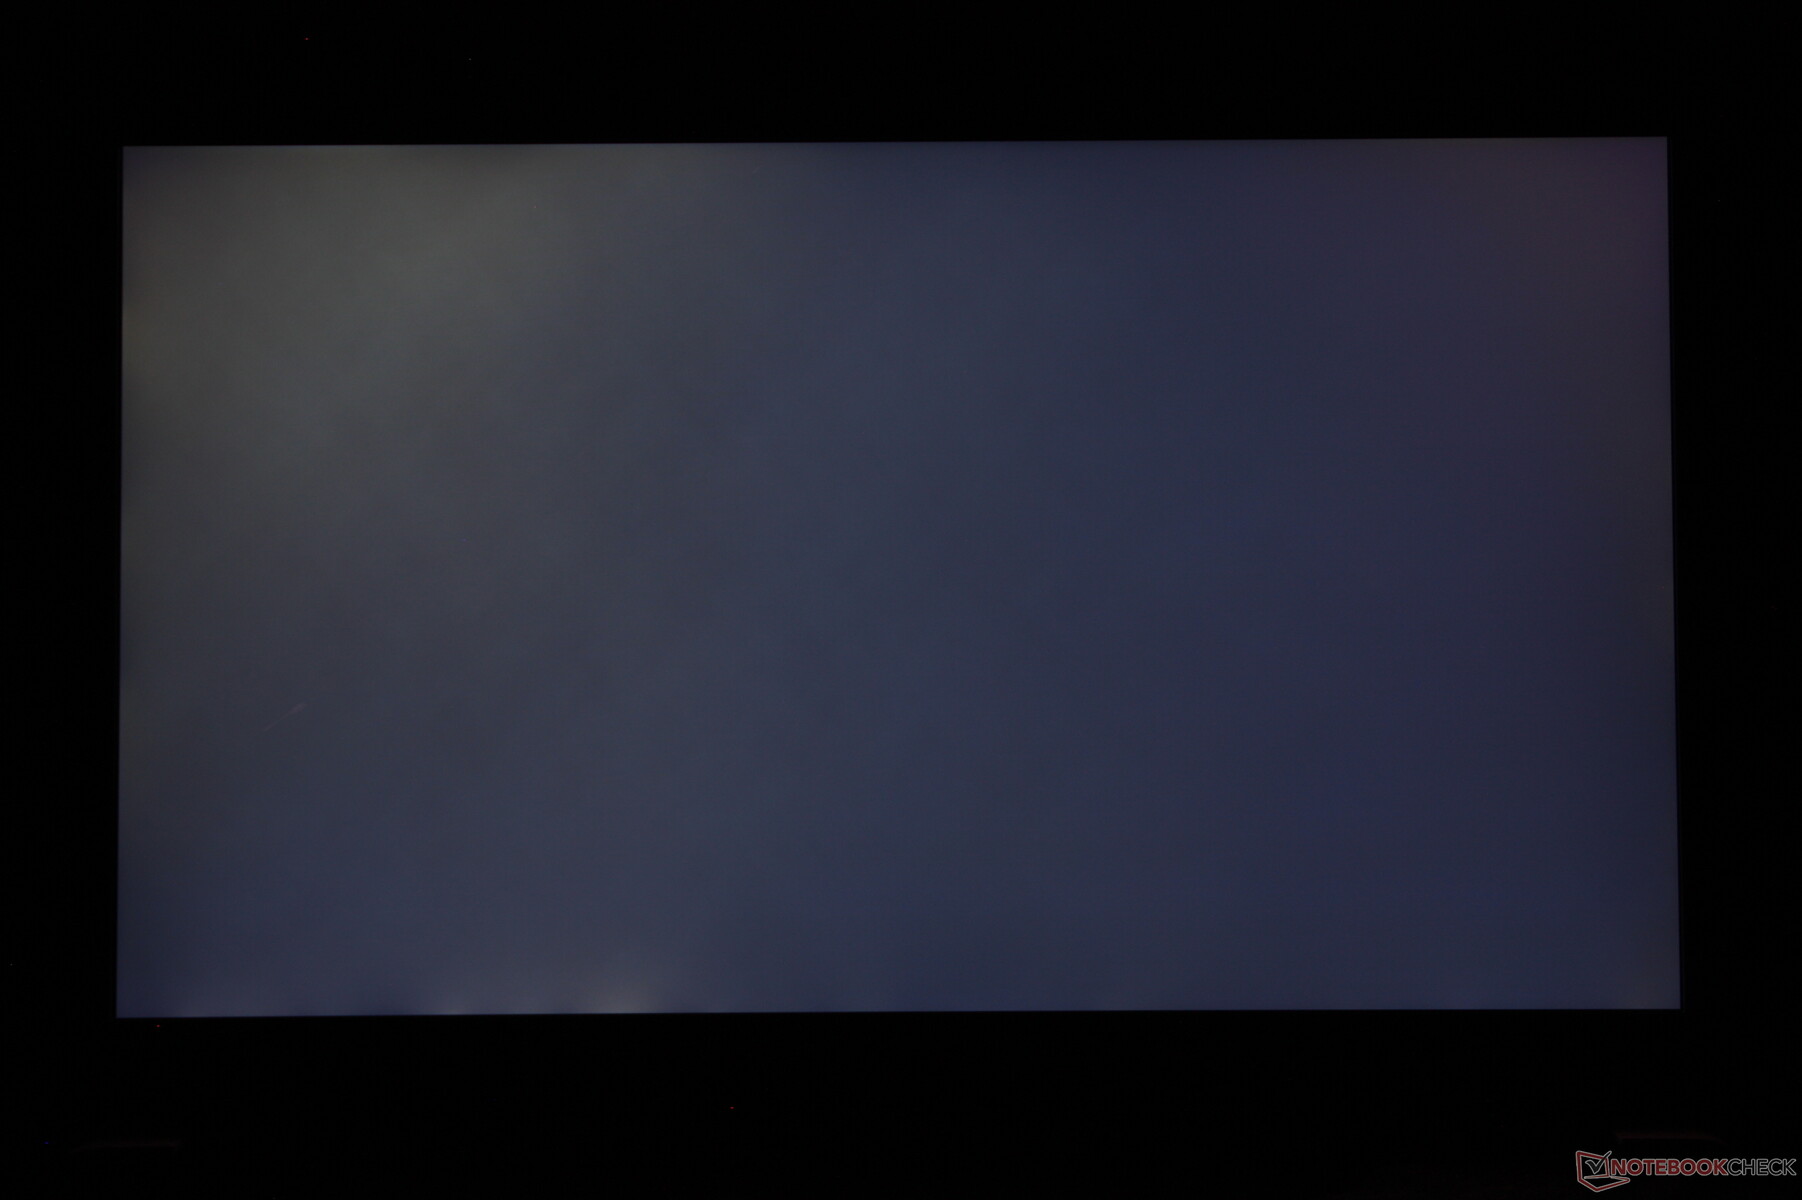
De matte overlay is iets korreliger dan een glanzend alternatief en de backlight bleeding had beter gekund op ons specifieke toestel. Onze metingen hieronder hebben alleen betrekking op het 4K 120 Hz paneel en niet op een van de andere schermopties die beschikbaar zijn voor de Alienware x17, die naar verwachting andere kenmerken hebben.
Merk op dat Advanced Optimus alleen beschikbaar is op FHD 360 Hz SKU's. Andere SKU's zoals de onze hebben Optimus 1.0 met een handmatige discrete GPU optie in het BIOS.
| |||||||||||||||||||||||||
Helderheidsverdeling: 91 %
Helderheid in Batterij-modus: 438.7 cd/m²
Contrast: 914:1 (Zwart: 0.48 cd/m²)
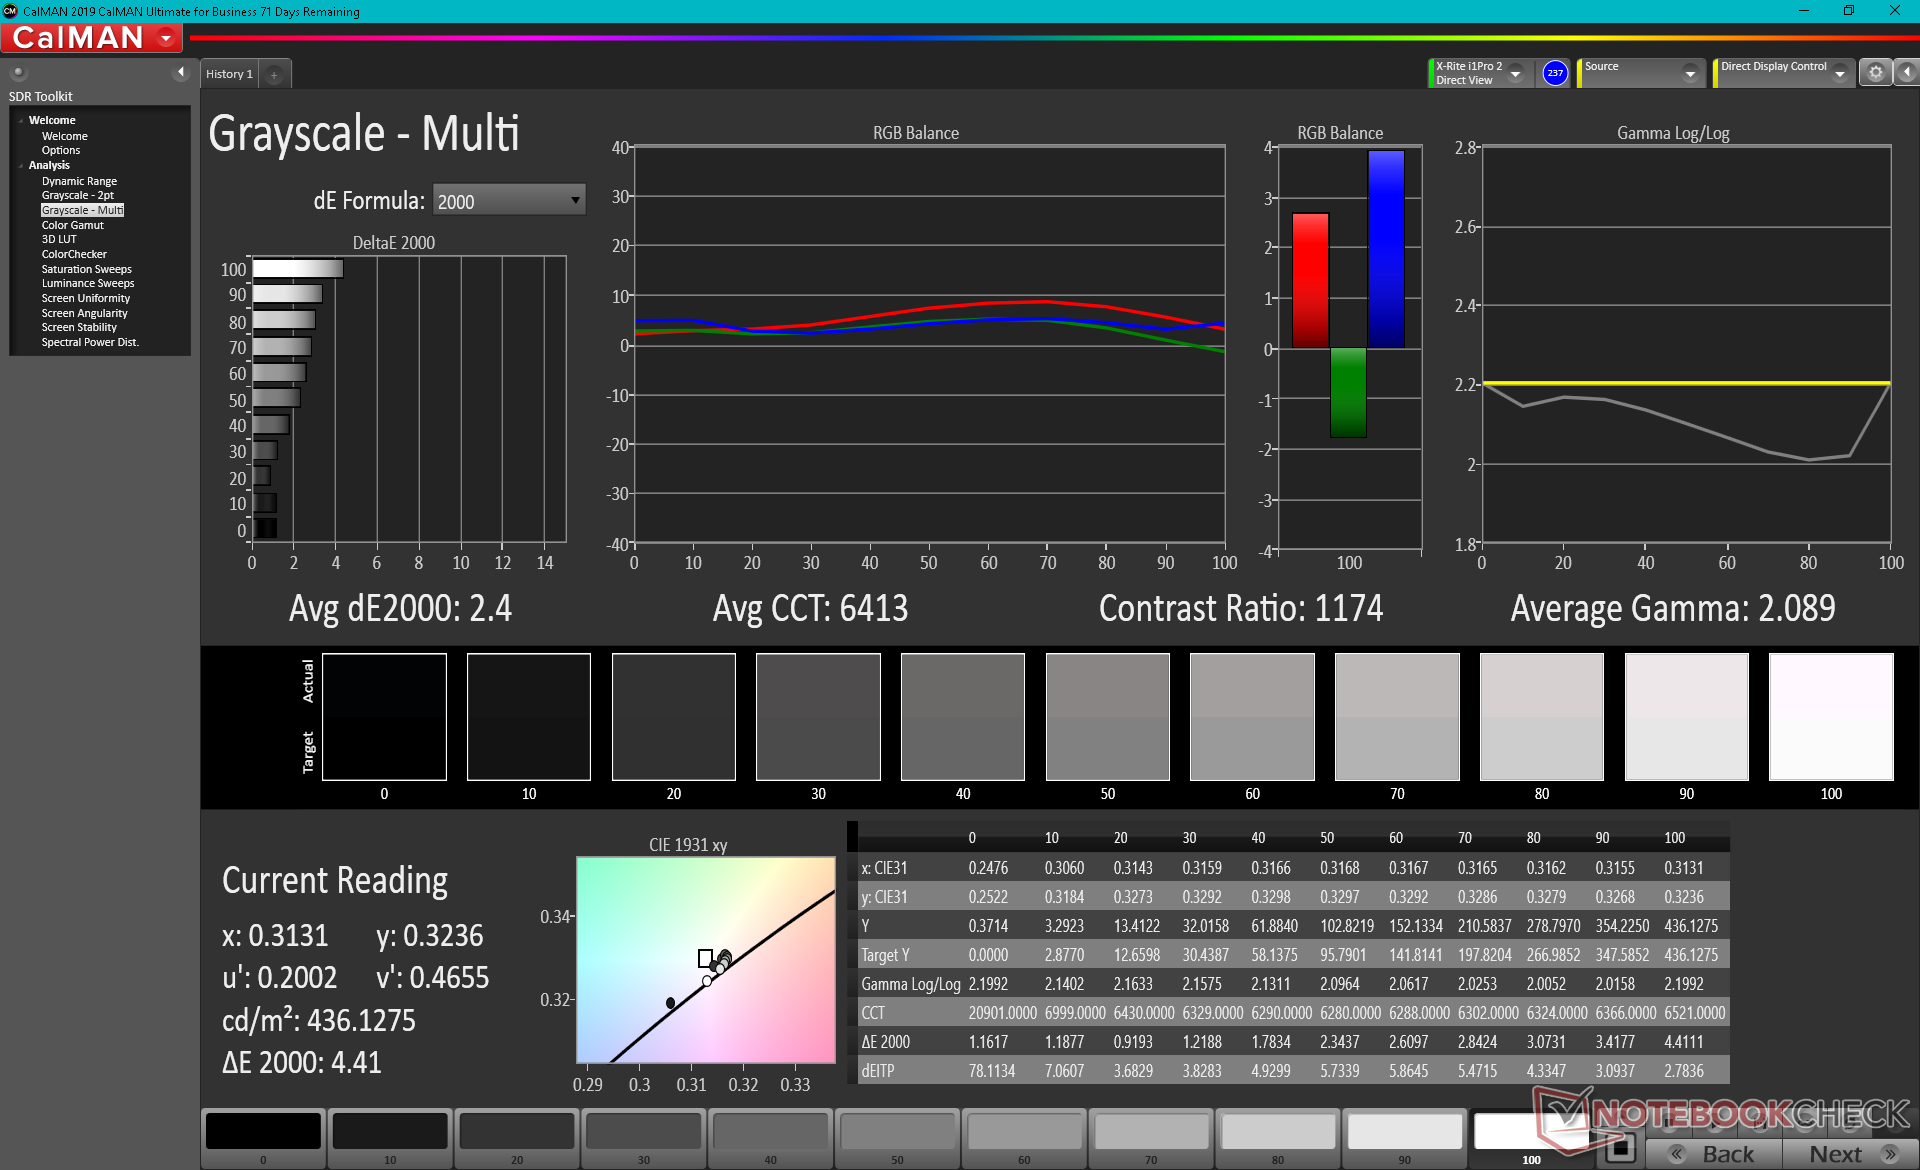
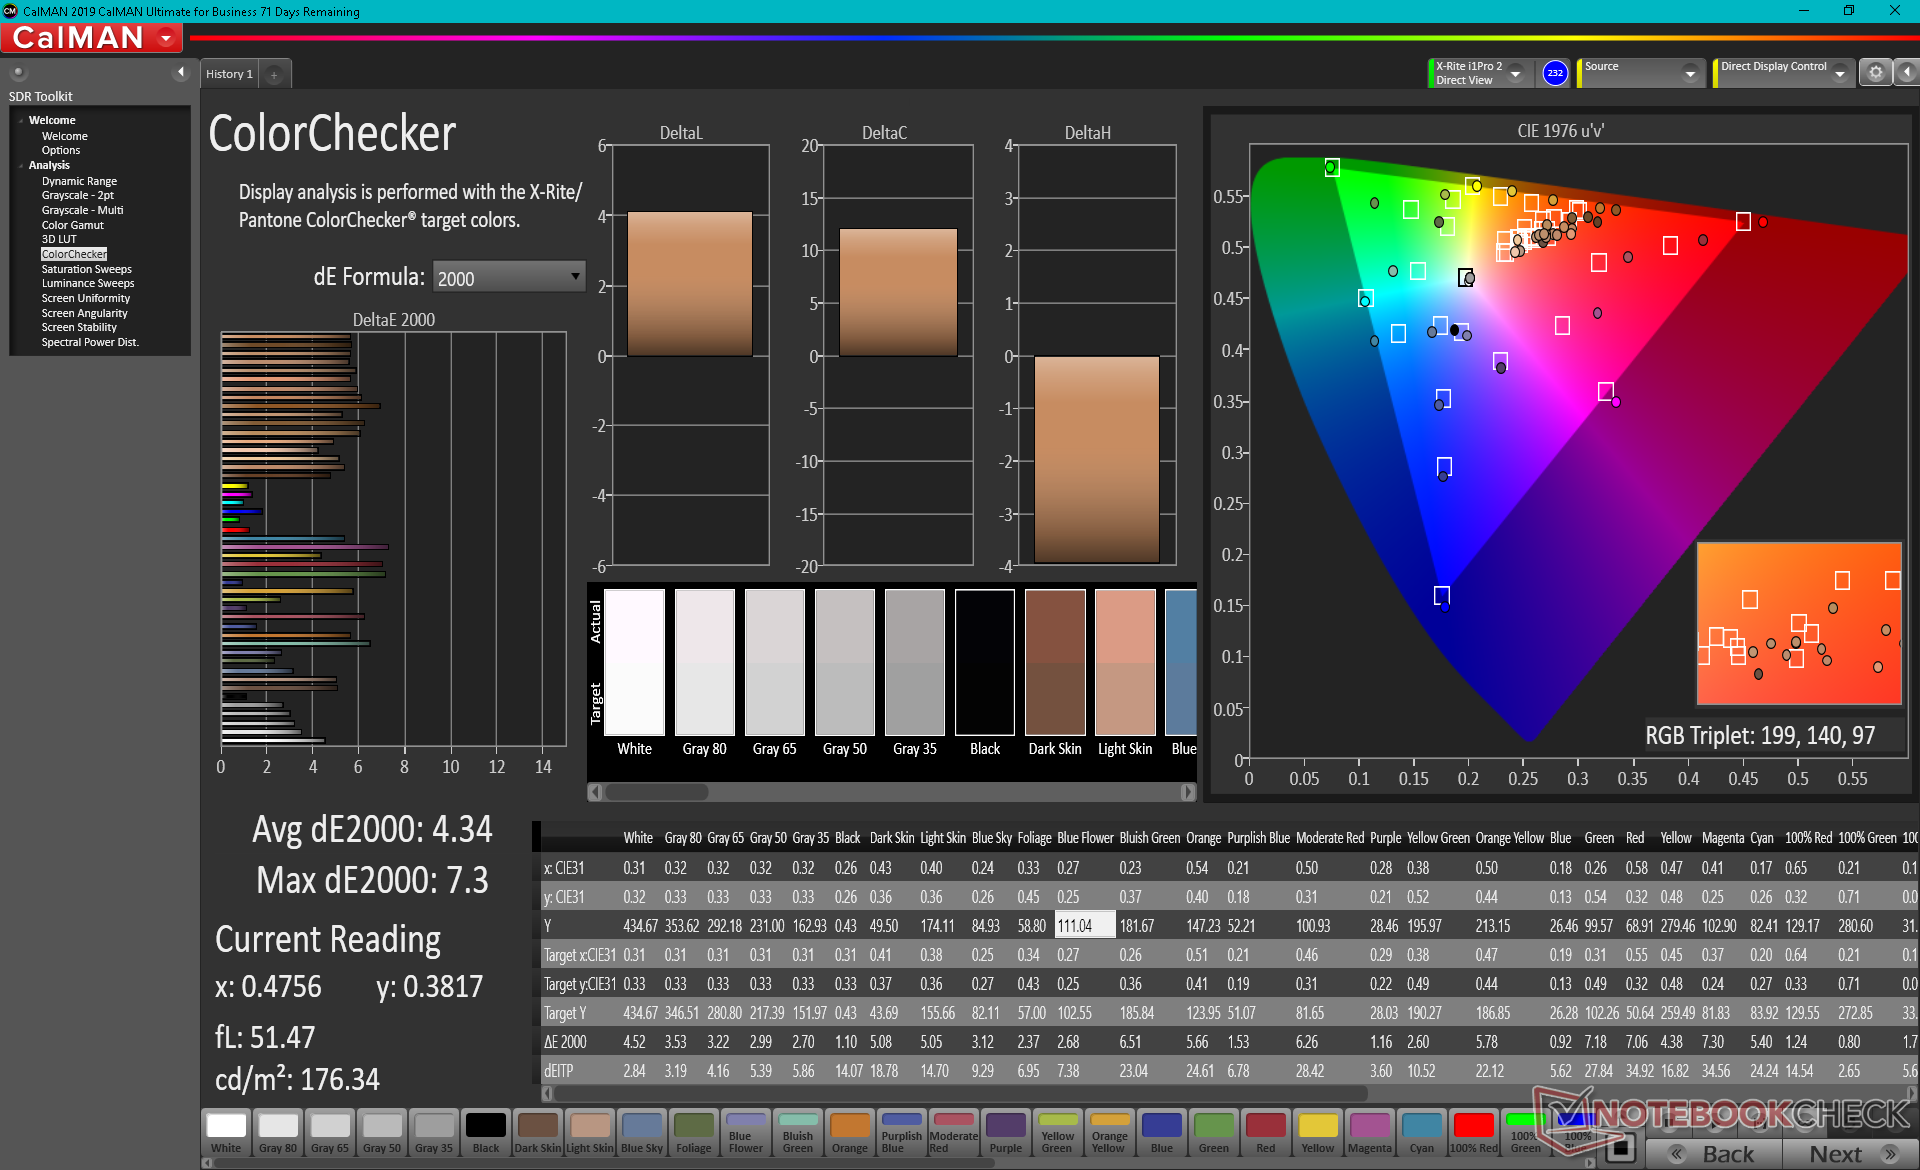
ΔE ColorChecker Calman: 4.34 | ∀{0.5-29.43 Ø4.72}
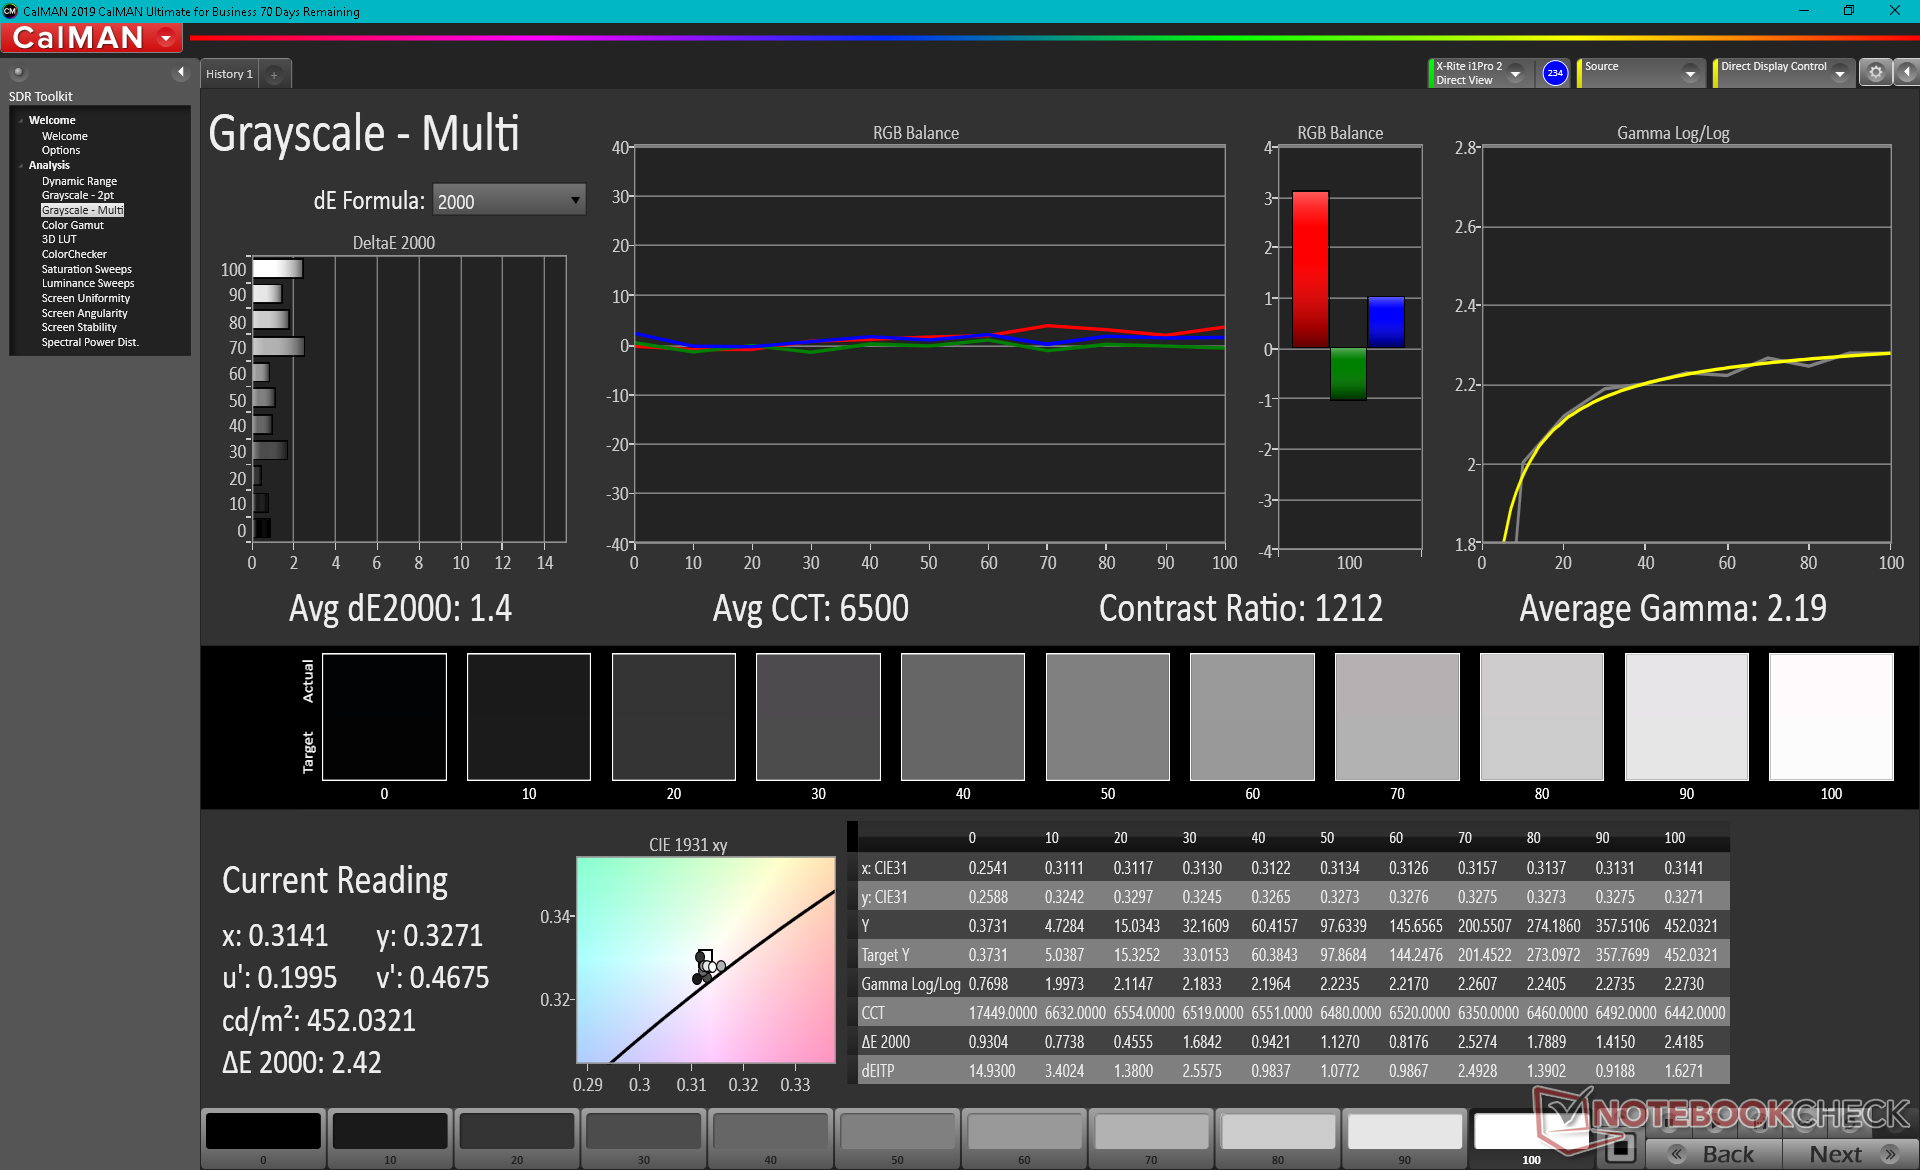
calibrated: 0.72
ΔE Greyscale Calman: 2.4 | ∀{0.09-98 Ø4.97}
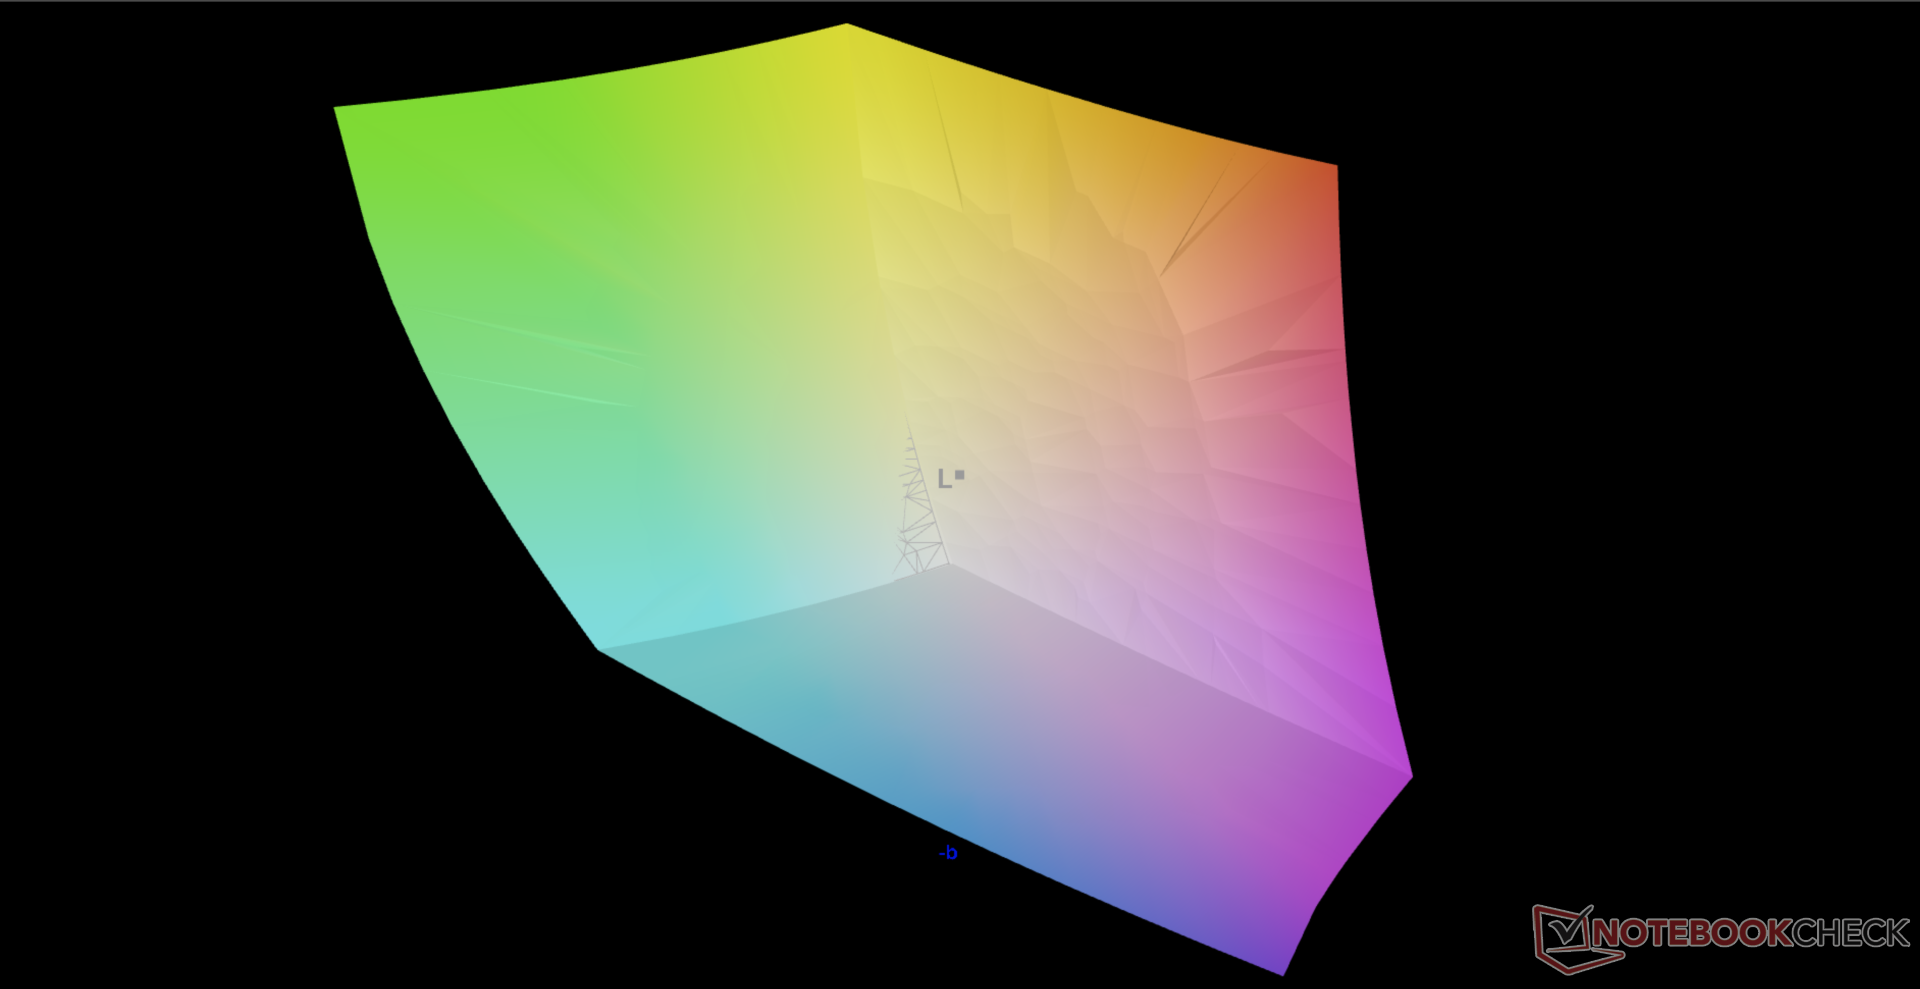
100% AdobeRGB 1998 (Argyll 3D)
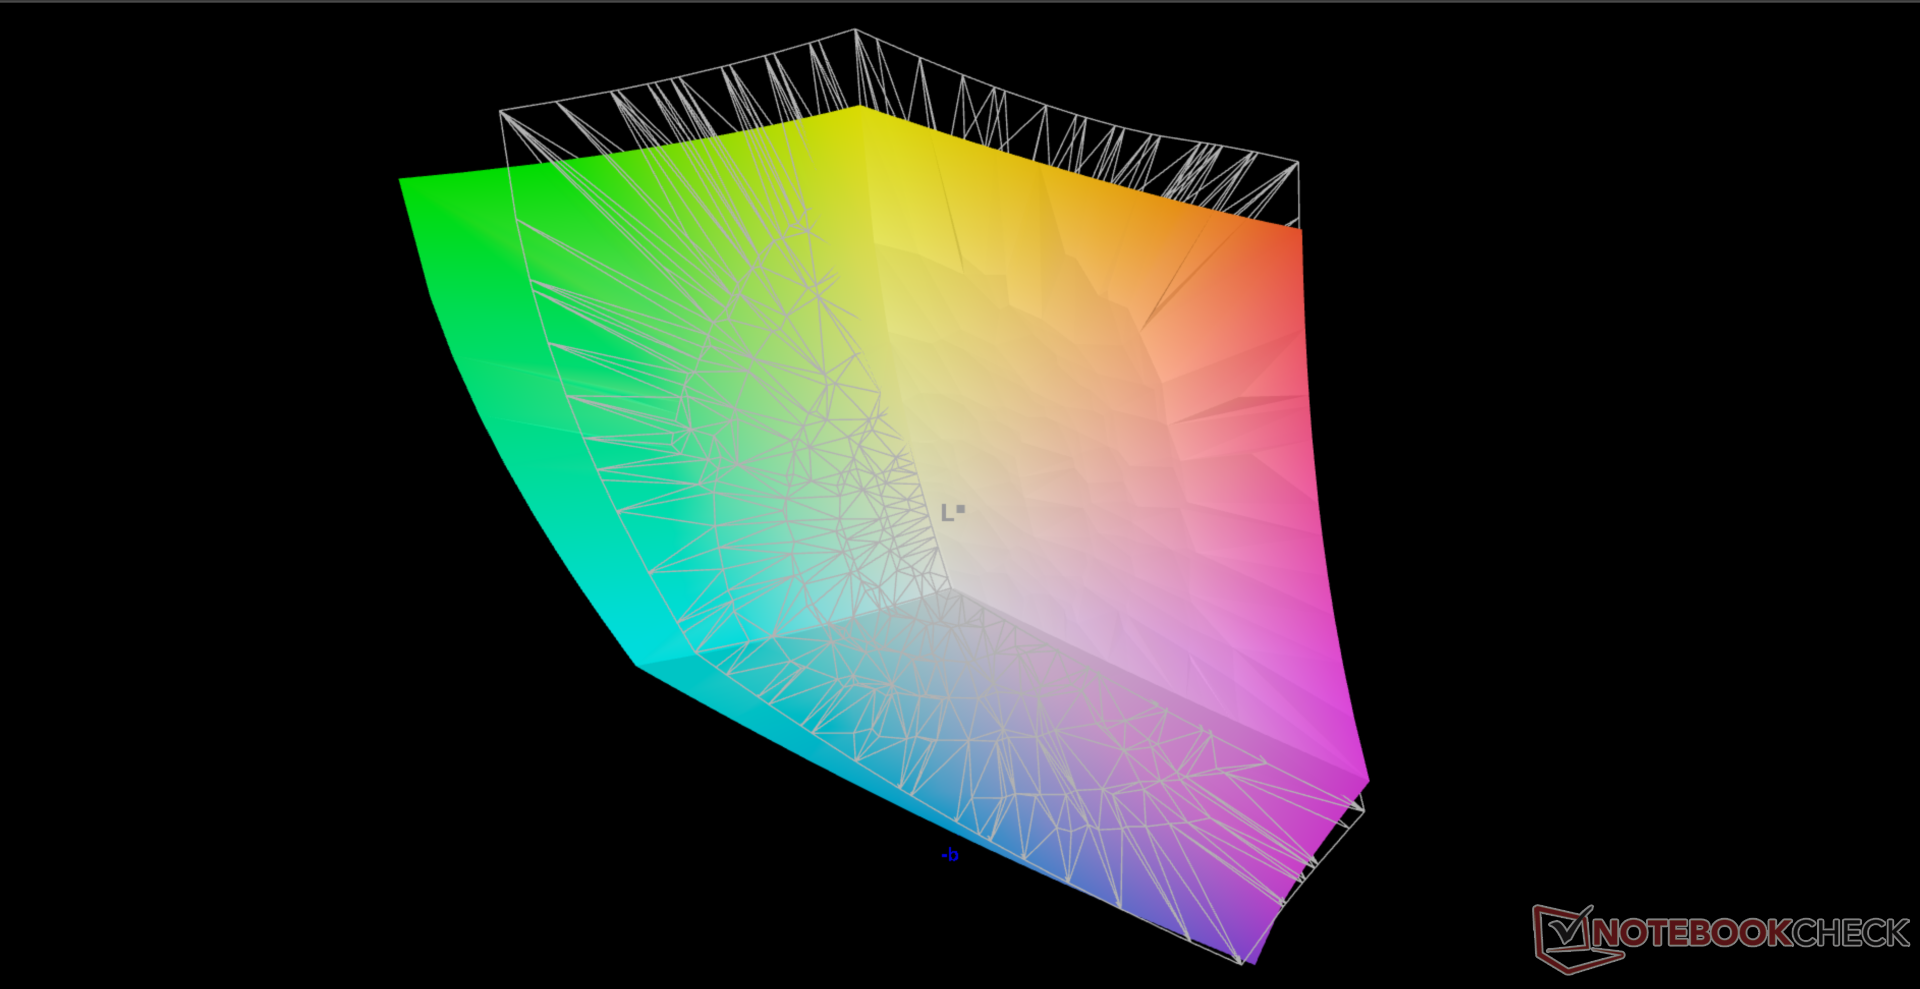
100% sRGB (Argyll 3D)
88.3% Display P3 (Argyll 3D)
Gamma: 2.09
CCT: 6413 K
| Alienware x17 RTX 3080 P48E AU Optronics B173ZAN, IPS, 17.3", 3840x2160 | Alienware m17 R4 AU Optronics AUOEC91, IPS, 17.3", 1920x1080 | Razer Blade 17 RTX 3070 AU Optronics B173HAN05.4, IPS, 17.3", 1920x1080 | Asus ROG Zephyrus S17 GX703HSD BOE099D (BOE CQ NE173QHM-NY3), IPS, 17.3", 2560x1440 | MSI GS76 Stealth 11UH AUO B173ZAN06.1 (AUODE95), IPS, 17.3", 3840x2160 | Gigabyte Aero 17 HDR YD AU Optronics AUO329B, IPS, 17.3", 3840x2160 | |
|---|---|---|---|---|---|---|
| Display | -16% | -15% | -3% | -23% | -1% | |
| Display P3 Coverage (%) | 88.3 | 69.8 -21% | 71.7 -19% | 94.2 7% | 63 -29% | 86.9 -2% |
| sRGB Coverage (%) | 100 | 99.7 0% | 98.8 -1% | 98.7 -1% | 94.8 -5% | 100 0% |
| AdobeRGB 1998 Coverage (%) | 100 | 71.6 -28% | 73.6 -26% | 84.4 -16% | 65 -35% | 99.6 0% |
| Response Times | 10% | 43% | 45% | 39% | -206% | |
| Response Time Grey 50% / Grey 80% * (ms) | 14.4 ? | 13.2 ? 8% | 4.2 ? 71% | 4.8 67% | 8.8 ? 39% | 52 ? -261% |
| Response Time Black / White * (ms) | 10.4 ? | 9.2 ? 12% | 8.8 ? 15% | 8 23% | 6.4 ? 38% | 26 ? -150% |
| PWM Frequency (Hz) | ||||||
| Screen | 21% | -44% | -19% | 9% | 30% | |
| Brightness middle (cd/m²) | 438.7 | 305 -30% | 323.3 -26% | 322 -27% | 474 8% | 488 11% |
| Brightness (cd/m²) | 435 | 301 -31% | 315 -28% | 288 -34% | 454 4% | 467 7% |
| Brightness Distribution (%) | 91 | 93 2% | 91 0% | 72 -21% | 88 -3% | 86 -5% |
| Black Level * (cd/m²) | 0.48 | 0.19 60% | 0.33 31% | 0.3 37% | 0.46 4% | 0.33 31% |
| Contrast (:1) | 914 | 1605 76% | 980 7% | 1073 17% | 1030 13% | 1479 62% |
| Colorchecker dE 2000 * | 4.34 | 1.31 70% | 4.59 -6% | 3.05 30% | 1.5 65% | 1.23 72% |
| Colorchecker dE 2000 max. * | 7.3 | 2.32 68% | 10.82 -48% | 5.23 28% | 5.59 23% | 2.94 60% |
| Colorchecker dE 2000 calibrated * | 0.72 | 0.91 -26% | 1.4 -94% | 1.92 -167% | 0.86 -19% | 0.77 -7% |
| Greyscale dE 2000 * | 2.4 | 2.3 4% | 7.9 -229% | 3.11 -30% | 2.8 -17% | 1.5 37% |
| Gamma | 2.09 105% | 2.281 96% | 2.28 96% | 2.13 103% | 2.158 102% | 2.169 101% |
| CCT | 6413 101% | 6449 101% | 5941 109% | 6553 99% | 6597 99% | 6614 98% |
| Color Space (Percent of AdobeRGB 1998) (%) | 72 | 84 | 99 | |||
| Color Space (Percent of sRGB) (%) | 94 | 99 | 99 | |||
| Totaal Gemiddelde (Programma / Instellingen) | 5% /
12% | -5% /
-25% | 8% /
-6% | 8% /
6% | -59% /
-10% |
* ... kleiner is beter
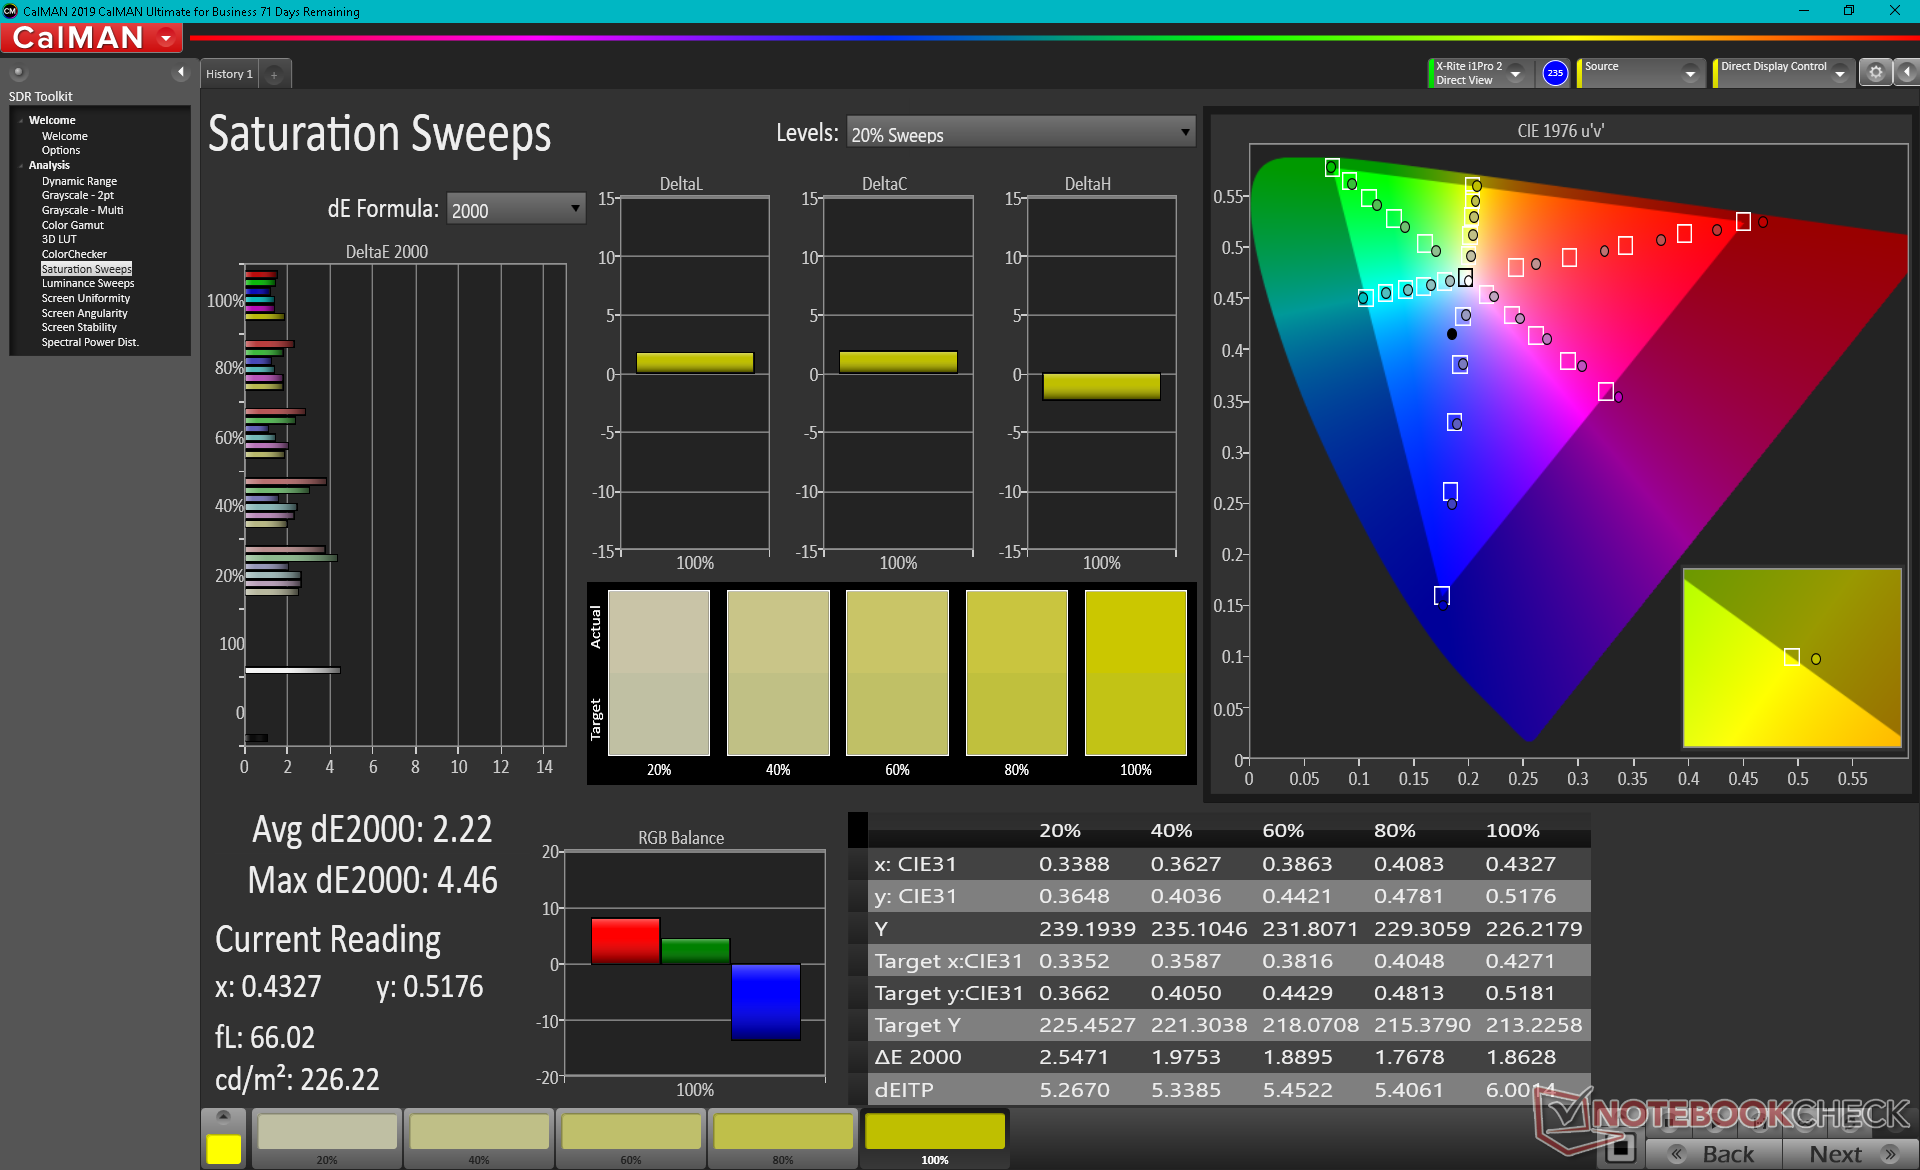
De kleurruimte omvat alle sRGB en AdobeRGB zoals geadverteerd door de fabrikant, terwijl de DCI-P3-dekking ongeveer 88 procent bedraagt. De diepe kleuren, snelle responstijden en snelle verversingssnelheid maken dit 4K-paneel geschikt voor zowel gaming als grafische bewerking.
X-Rite colorimetermetingen tonen aan dat het beeldscherm uit de doos behoorlijk gekalibreerd is, met gemiddelde grijswaarden en kleur DeltaE-waarden van respectievelijk slechts 2,4 en 4,34, vergeleken met de AdobeRGB standaard. Als het beeldscherm op sRGB wordt ingesteld en de kleuren vervolgens worden gekalibreerd, zou dat over de hele linie uitstekende DeltaE-waarden van minder dan 2 opleveren.
Responstijd Scherm
| ↔ Responstijd Zwart naar Wit | ||
|---|---|---|
| 10.4 ms ... stijging ↗ en daling ↘ gecombineerd | ↗ 5.2 ms stijging | 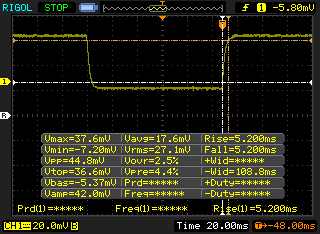 |
| ↘ 5.2 ms daling | ||
| Het scherm vertoonde prima responstijden in onze tests maar is misschien wat te traag voor competitieve games. Ter vergelijking: alle testtoestellen variëren van 0.1 (minimum) tot 240 (maximum) ms. » 28 % van alle toestellen zijn beter. Dit betekent dat de gemeten responstijd beter is dan het gemiddelde (19.9 ms) van alle geteste toestellen. | ||
| ↔ Responstijd 50% Grijs naar 80% Grijs | ||
| 14.4 ms ... stijging ↗ en daling ↘ gecombineerd | ↗ 7.6 ms stijging | 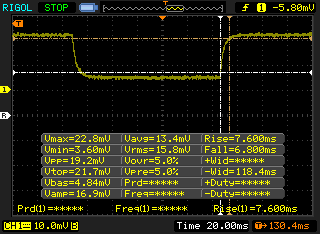 |
| ↘ 6.8 ms daling | ||
| Het scherm vertoonde prima responstijden in onze tests maar is misschien wat te traag voor competitieve games. Ter vergelijking: alle testtoestellen variëren van 0.165 (minimum) tot 636 (maximum) ms. » 28 % van alle toestellen zijn beter. Dit betekent dat de gemeten responstijd beter is dan het gemiddelde (31.1 ms) van alle geteste toestellen. | ||
Screen Flickering / PWM (Pulse-Width Modulation)
| Screen flickering / PWM niet waargenomen | 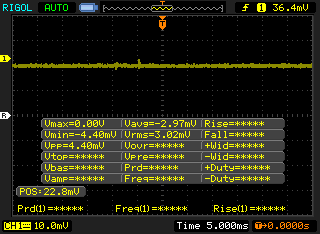 | ||
Ter vergelijking: 52 % van alle geteste toestellen maakten geen gebruik van PWM om de schermhelderheid te verlagen. Als het wel werd gebruikt, werd een gemiddelde van 7784 (minimum: 5 - maximum: 343500) Hz waargenomen. | |||
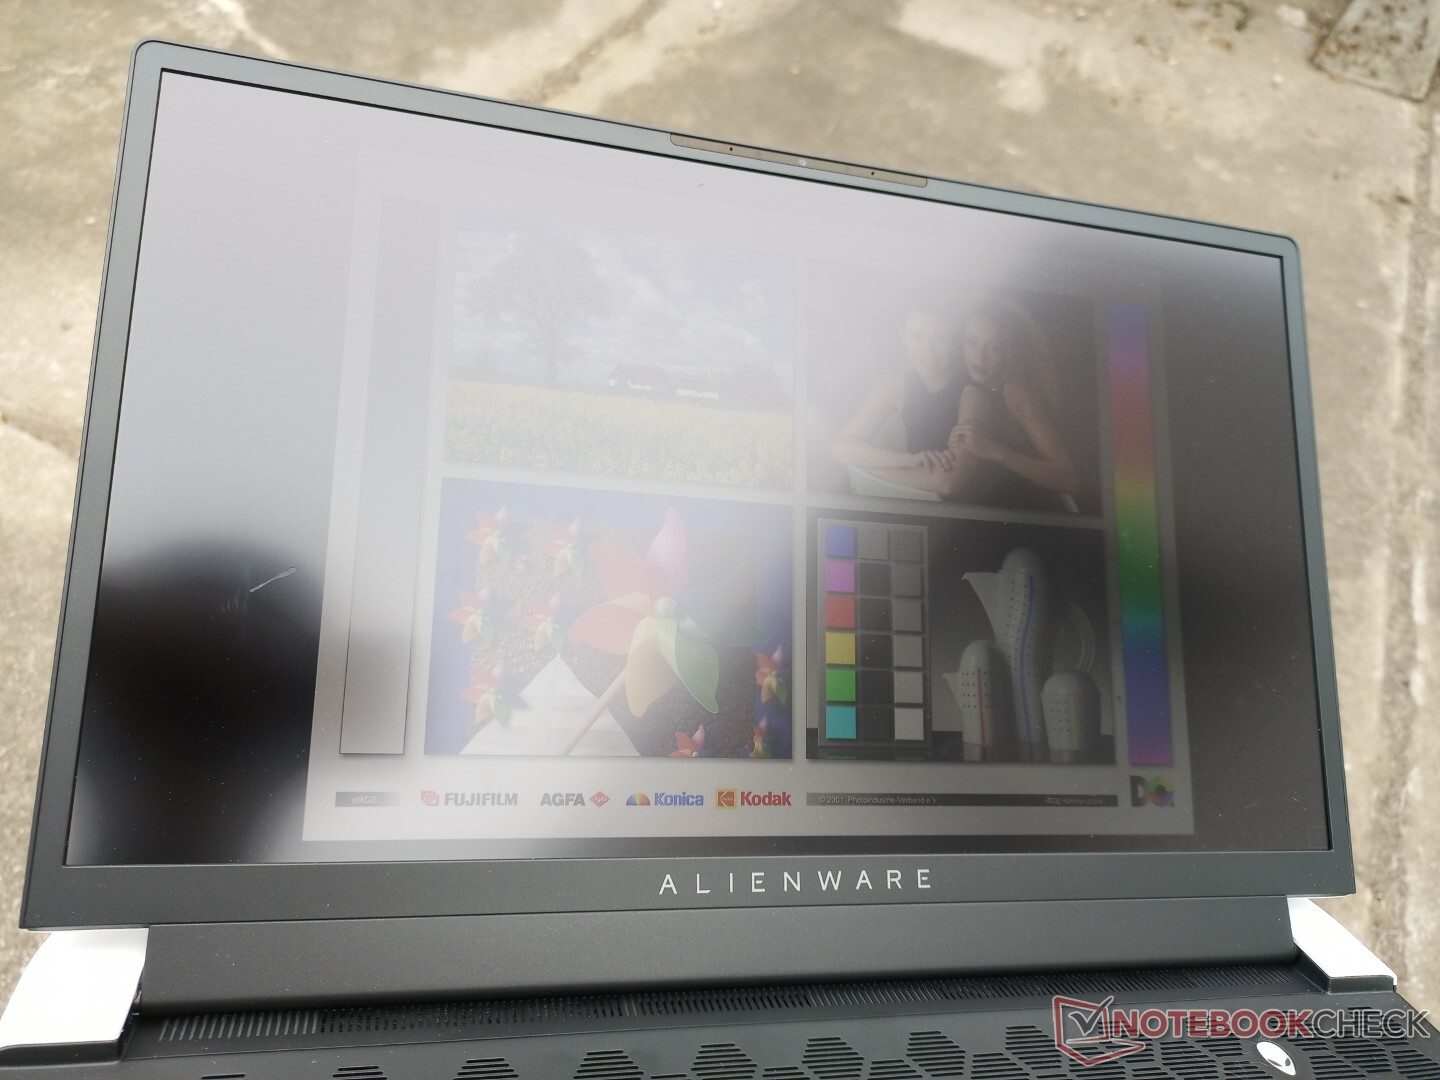
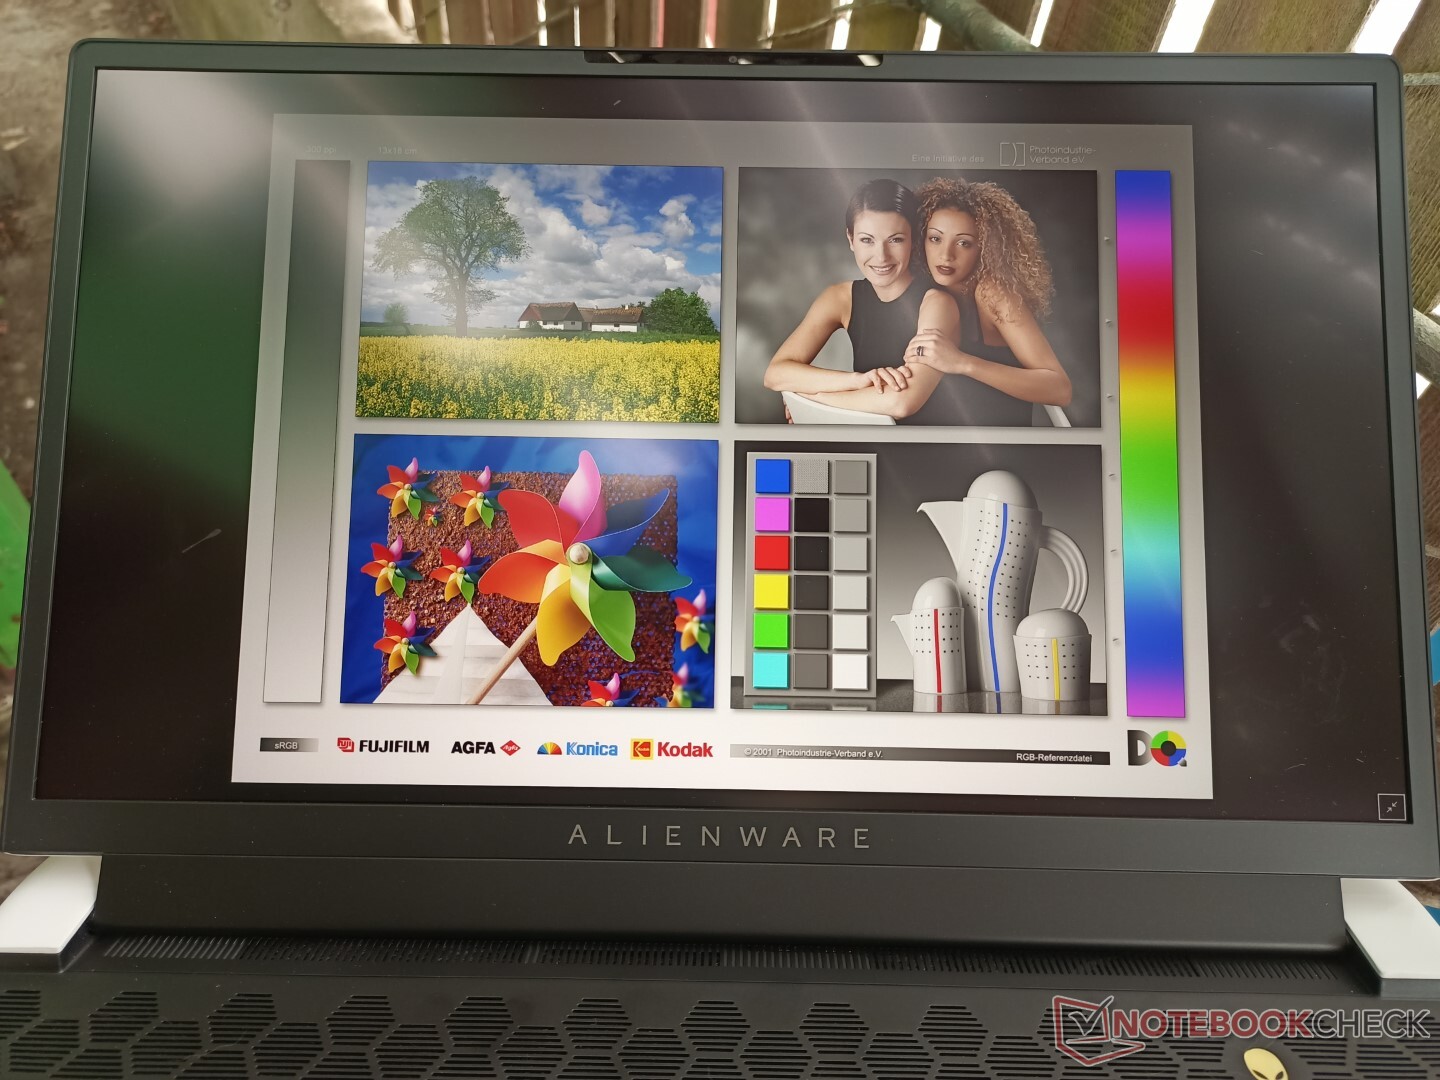
De zichtbaarheid buitenshuis is iets beter dan op veel andere 17,3-inch gaminglaptops, omdat het matte beeldscherm van 400 nit helderder is dan de typische 300-nit doelstelling. Het zware gewicht en formaat zijn echter moeilijk te negeren, en dus zul je waarschijnlijk op een plat bureau willen werken, ongeacht de omgeving.
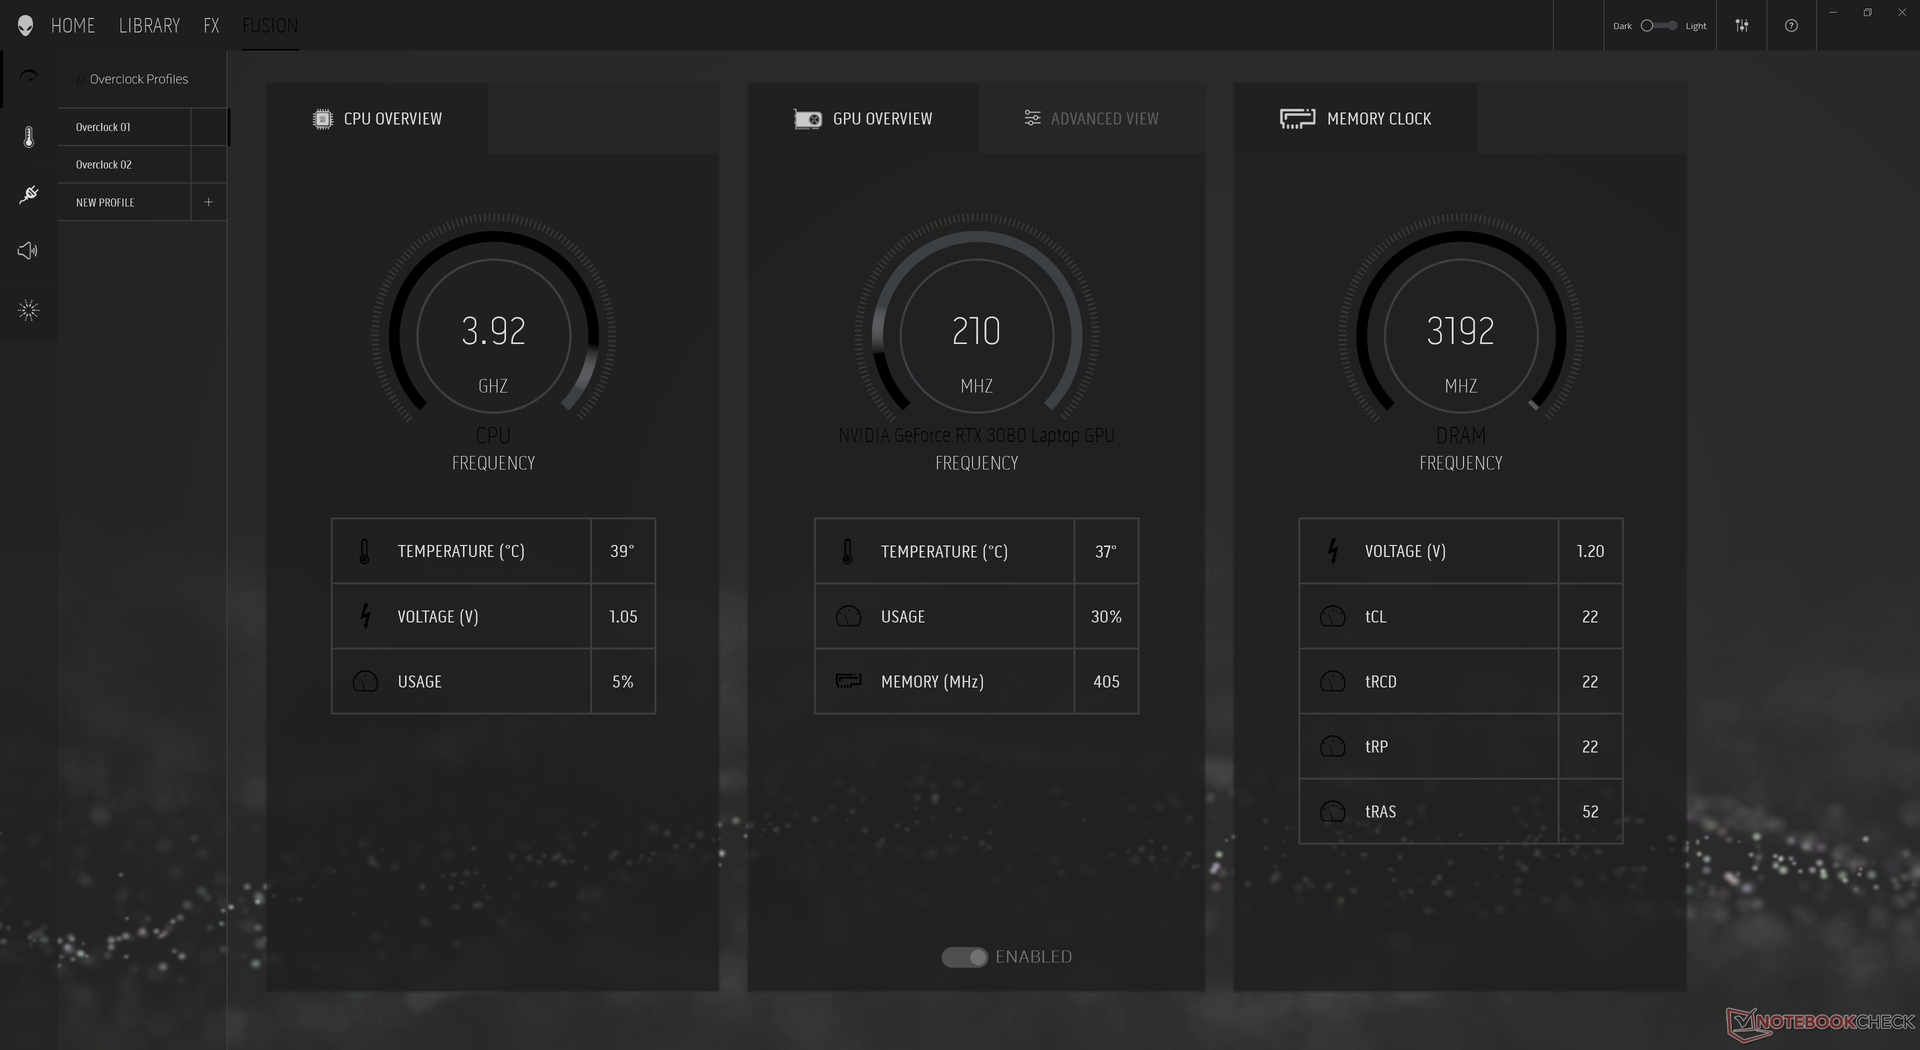
Prestaties - Indrukwekkende processorkloksnelheden
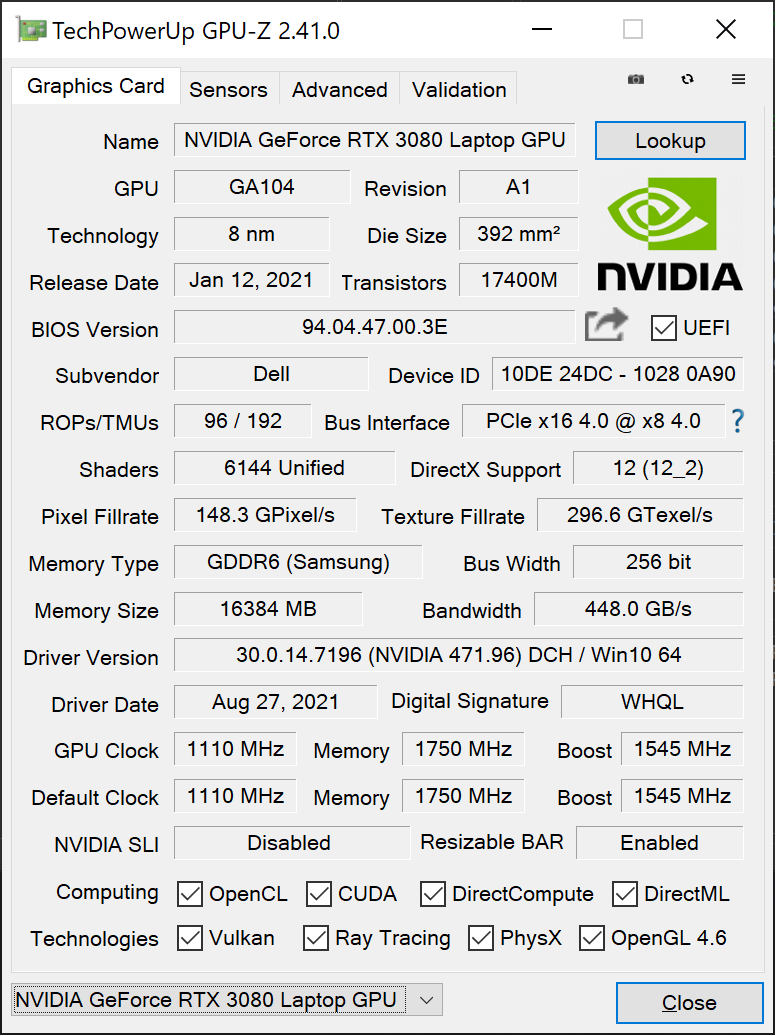
Twee CPU-opties (Core i7-11800H, Core i9-11980HK) en drie GeForce grafische opties (RTX 3060, RTX 3070, RTX 3080) zijn beschikbaar. We verwachten geen grote verschillen tussen de twee CPU's, aangezien onze i7-11800H al ruim boven de 90 C draait bij belasting, maar de drie GPU's draaien elk op verschillende TGP doelen van respectievelijk 130 W, 140 W, en 165 W. Ter vergelijking, de RTX 3080 in de Razer Blade 17 mikt op "slechts" 130 W
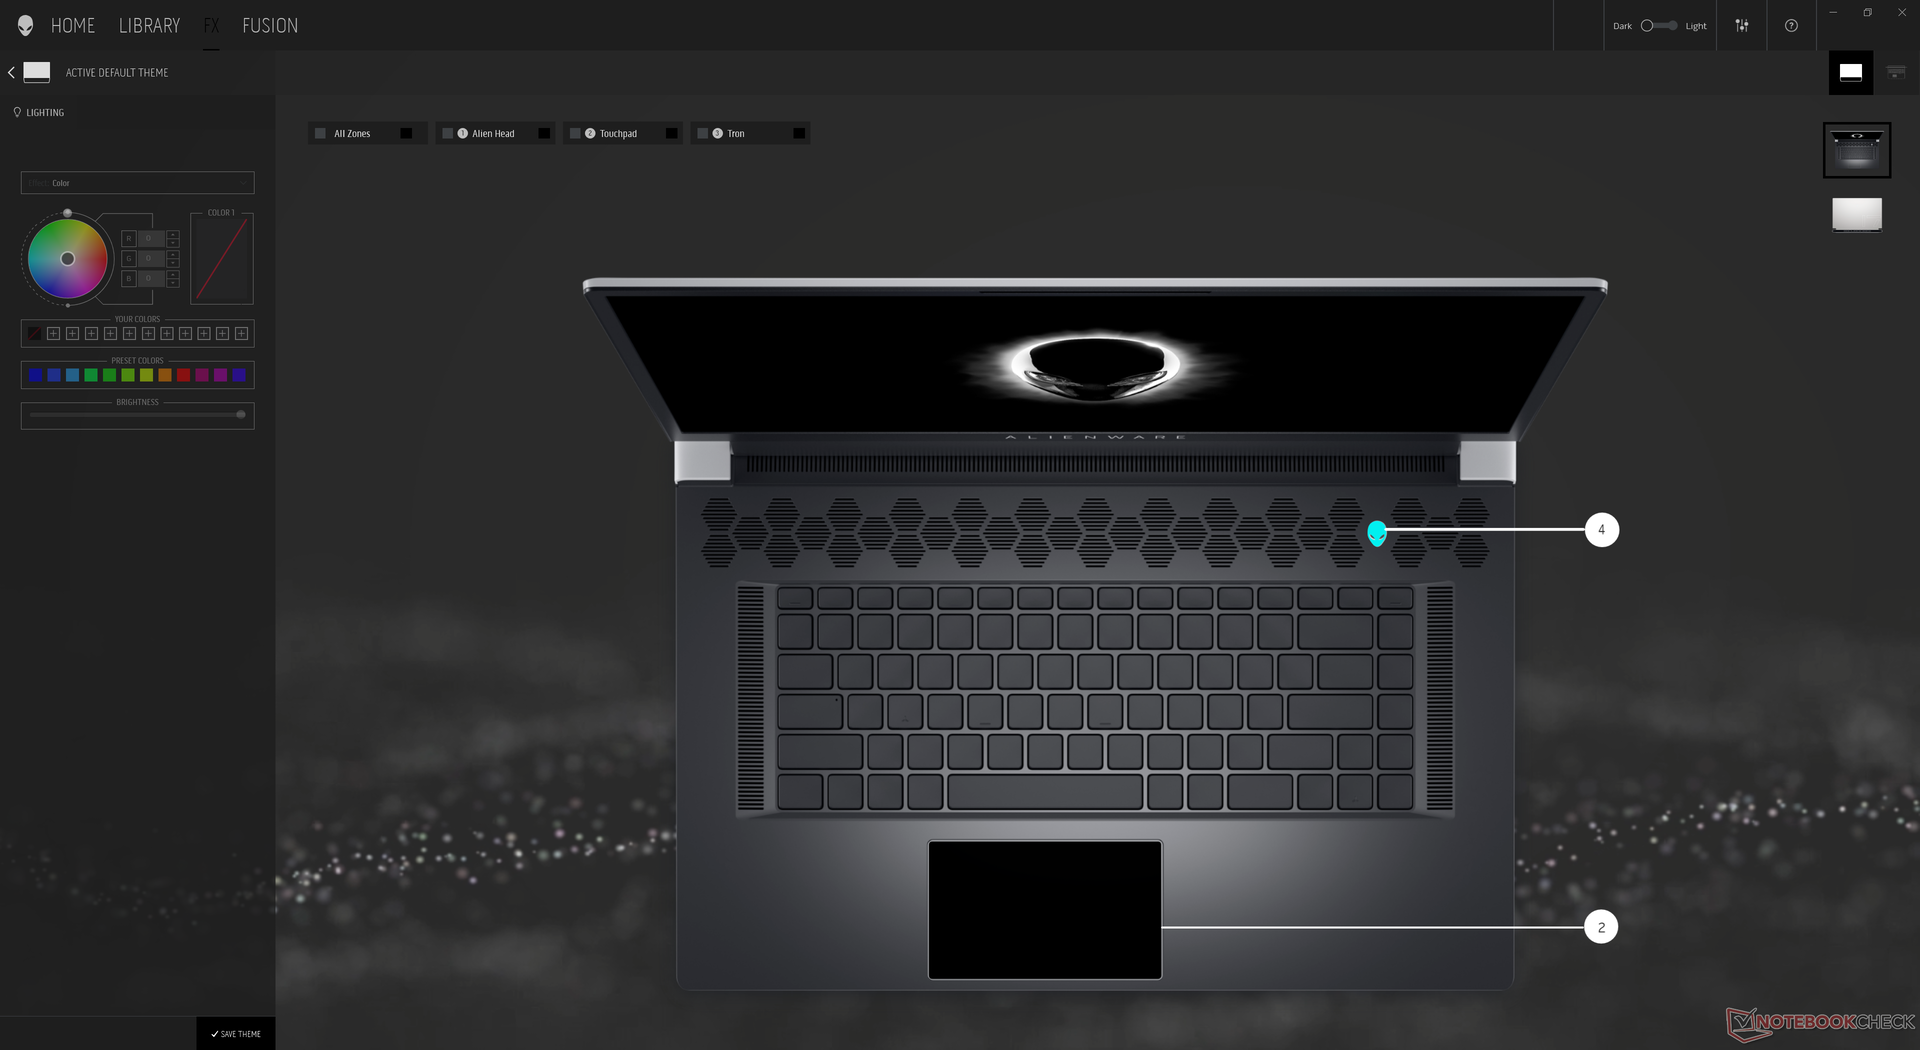
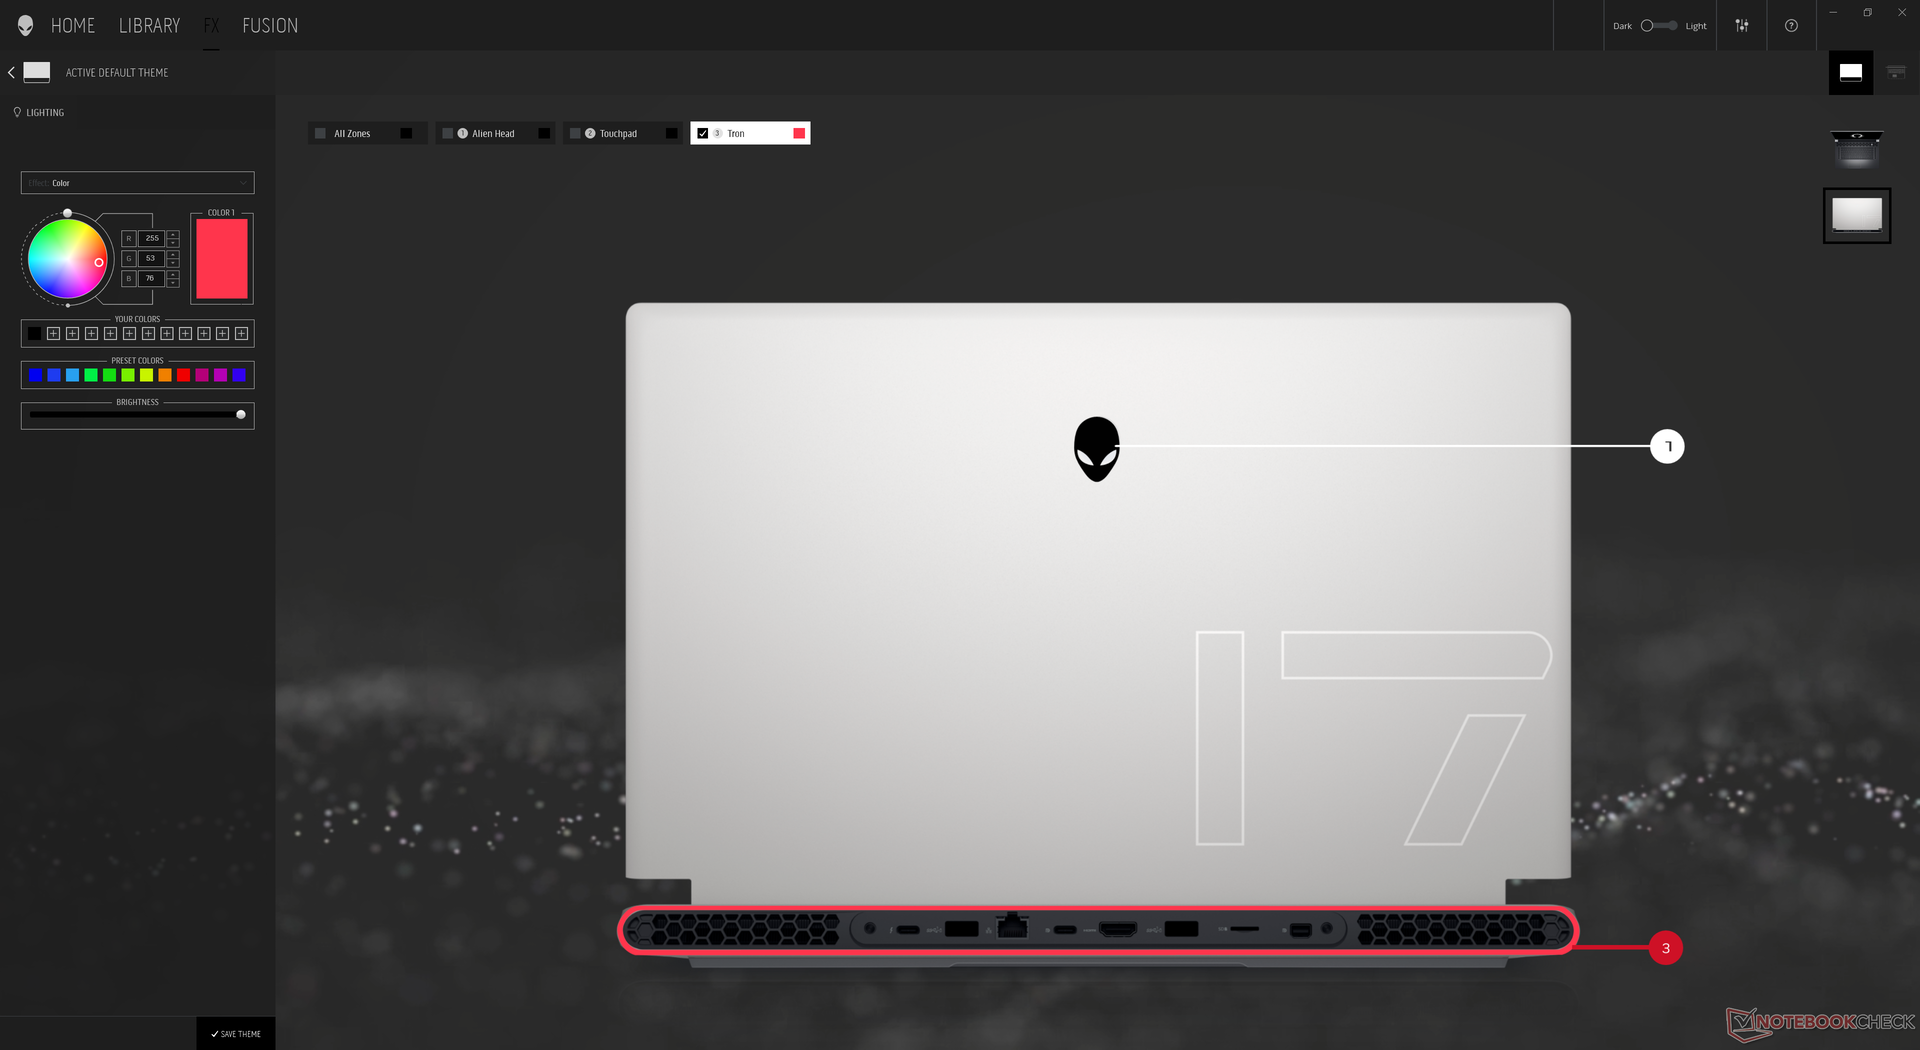
Ons systeem werd via de Alienware Command Center software op High Performance modus gezet, voordat we onze benchmarks hieronder uitvoerden, voor de hoogst mogelijke scores. We raden gebruikers aan vertrouwd te raken met deze software, aangezien alle verlichtings- en prestatiekenmerken hier te vinden zijn. Bovendien kunnen gebruikers het systeem via het BIOS instellen op Optimus of discrete GPU-modus.
Advanced Optimus en dus G-Sync worden alleen ondersteund op de 360 Hz FHD SKU's.
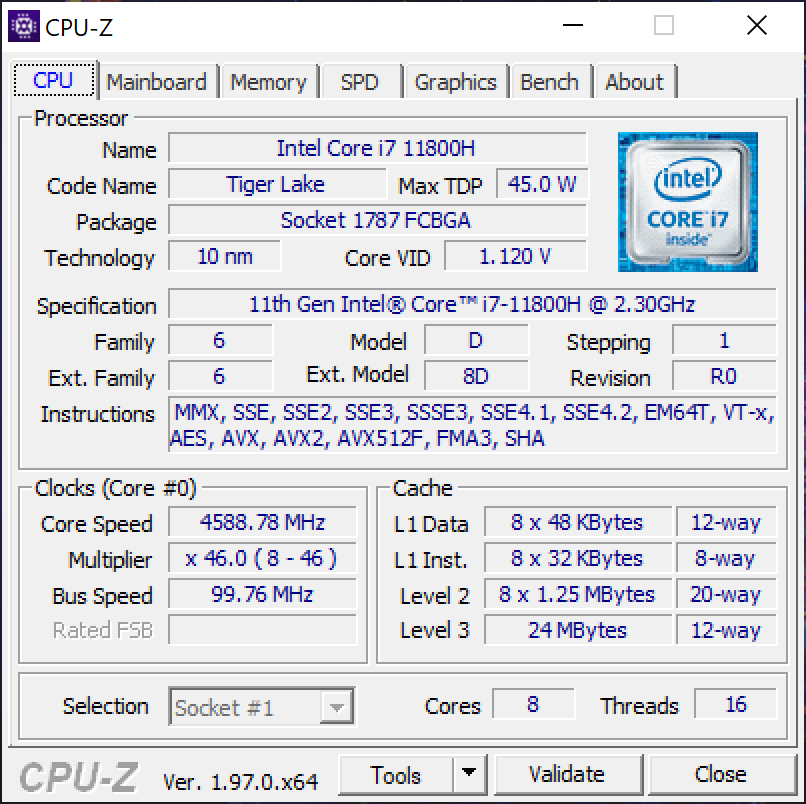
Processor
De CPU-prestaties zijn uitstekend met CineBench xT-scores die tot 20 procent sneller zijn dan de gemiddelde laptop in onze database met dezelfde Core i7-11800H CPU. In feite is de Alienware x17 een van de snelste laptops die je op de markt kunt krijgen met deze specifieke processor. De sneller dan verwachte prestaties van ons systeem zetten het zelfs iets voor op de Ryzen 9 5900HX of Core i9-11900K in multi-threaded belastingen, hoewel de i7-11800H over het algemeen achterloopt op de meeste andere laptops
De hoge CPU prestaties van de Alienware kunnen worden toegeschreven aan de zeer hoge PL1 en PL2 doelen van 165 W elk, vergeleken met 65 W en 90 W, respectievelijk, op andere laptops zoals de Razer Blade 17. Het systeem is ook uitstekend in het handhaven van hoge Turbo Boost kloksnelheden gedurende langere perioden, zoals blijkt uit onze CineBench R15 xT loop test hieronder. Zulke hoge prestatieresultaten zijn echter niet gratis, zoals onze Stress Test en Stroomverbruik secties hieronder zullen laten zien.
Cinebench R15 Multi Loop
Cinebench R23: Multi Core | Single Core
Cinebench R15: CPU Multi 64Bit | CPU Single 64Bit
Blender: v2.79 BMW27 CPU
7-Zip 18.03: 7z b 4 -mmt1 | 7z b 4
Geekbench 5.5: Single-Core | Multi-Core
HWBOT x265 Benchmark v2.2: 4k Preset
LibreOffice : 20 Documents To PDF
R Benchmark 2.5: Overall mean
| Cinebench R23 / Multi Core | |
| Schenker XMG Ultra 17 Rocket Lake | |
| Alienware x17 RTX 3080 P48E | |
| Asus Strix Scar 17 G733QSA-XS99 | |
| MSI GS76 Stealth 11UH | |
| Asus ROG Strix G17 G713QE-RB74 | |
| Gemiddeld Intel Core i7-11800H (6508 - 14088, n=48) | |
| Alienware m17 R4 | |
| Medion Erazer Beast X20 | |
| Cinebench R23 / Single Core | |
| Schenker XMG Ultra 17 Rocket Lake | |
| MSI GS76 Stealth 11UH | |
| Alienware x17 RTX 3080 P48E | |
| Asus Strix Scar 17 G733QSA-XS99 | |
| Gemiddeld Intel Core i7-11800H (1386 - 1522, n=45) | |
| Asus ROG Strix G17 G713QE-RB74 | |
| Alienware m17 R4 | |
| Medion Erazer Beast X20 | |
| Geekbench 5.5 / Single-Core | |
| Schenker XMG Ultra 17 Rocket Lake | |
| MSI GS76 Stealth 11UH | |
| Gemiddeld Intel Core i7-11800H (1429 - 1625, n=40) | |
| Asus Strix Scar 17 G733QSA-XS99 | |
| Alienware m17 R4 | |
| MSI GS75 10SF-609US | |
| Medion Erazer Beast X20 | |
| Eluktronics RP-17 | |
| Schenker XMG Pro 17 PB71RD-G | |
| Lenovo Legion 5 17IMH05 | |
| Geekbench 5.5 / Multi-Core | |
| Schenker XMG Ultra 17 Rocket Lake | |
| MSI GS76 Stealth 11UH | |
| Asus Strix Scar 17 G733QSA-XS99 | |
| Gemiddeld Intel Core i7-11800H (4655 - 9851, n=40) | |
| MSI GS75 10SF-609US | |
| Alienware m17 R4 | |
| Eluktronics RP-17 | |
| Medion Erazer Beast X20 | |
| Schenker XMG Pro 17 PB71RD-G | |
| Lenovo Legion 5 17IMH05 | |
| LibreOffice / 20 Documents To PDF | |
| Lenovo Legion 5 17IMH05 | |
| Eluktronics RP-17 | |
| Asus ROG Strix G17 G713QE-RB74 | |
| Medion Erazer Beast X20 | |
| Alienware m17 R4 | |
| MSI GS75 10SF-609US | |
| MSI GS76 Stealth 11UH | |
| Alienware x17 RTX 3080 P48E | |
| Gemiddeld Intel Core i7-11800H (38.6 - 59.9, n=45) | |
| Asus Strix Scar 17 G733QSA-XS99 | |
| Schenker XMG Ultra 17 Rocket Lake | |
* ... kleiner is beter
Systeemprestaties
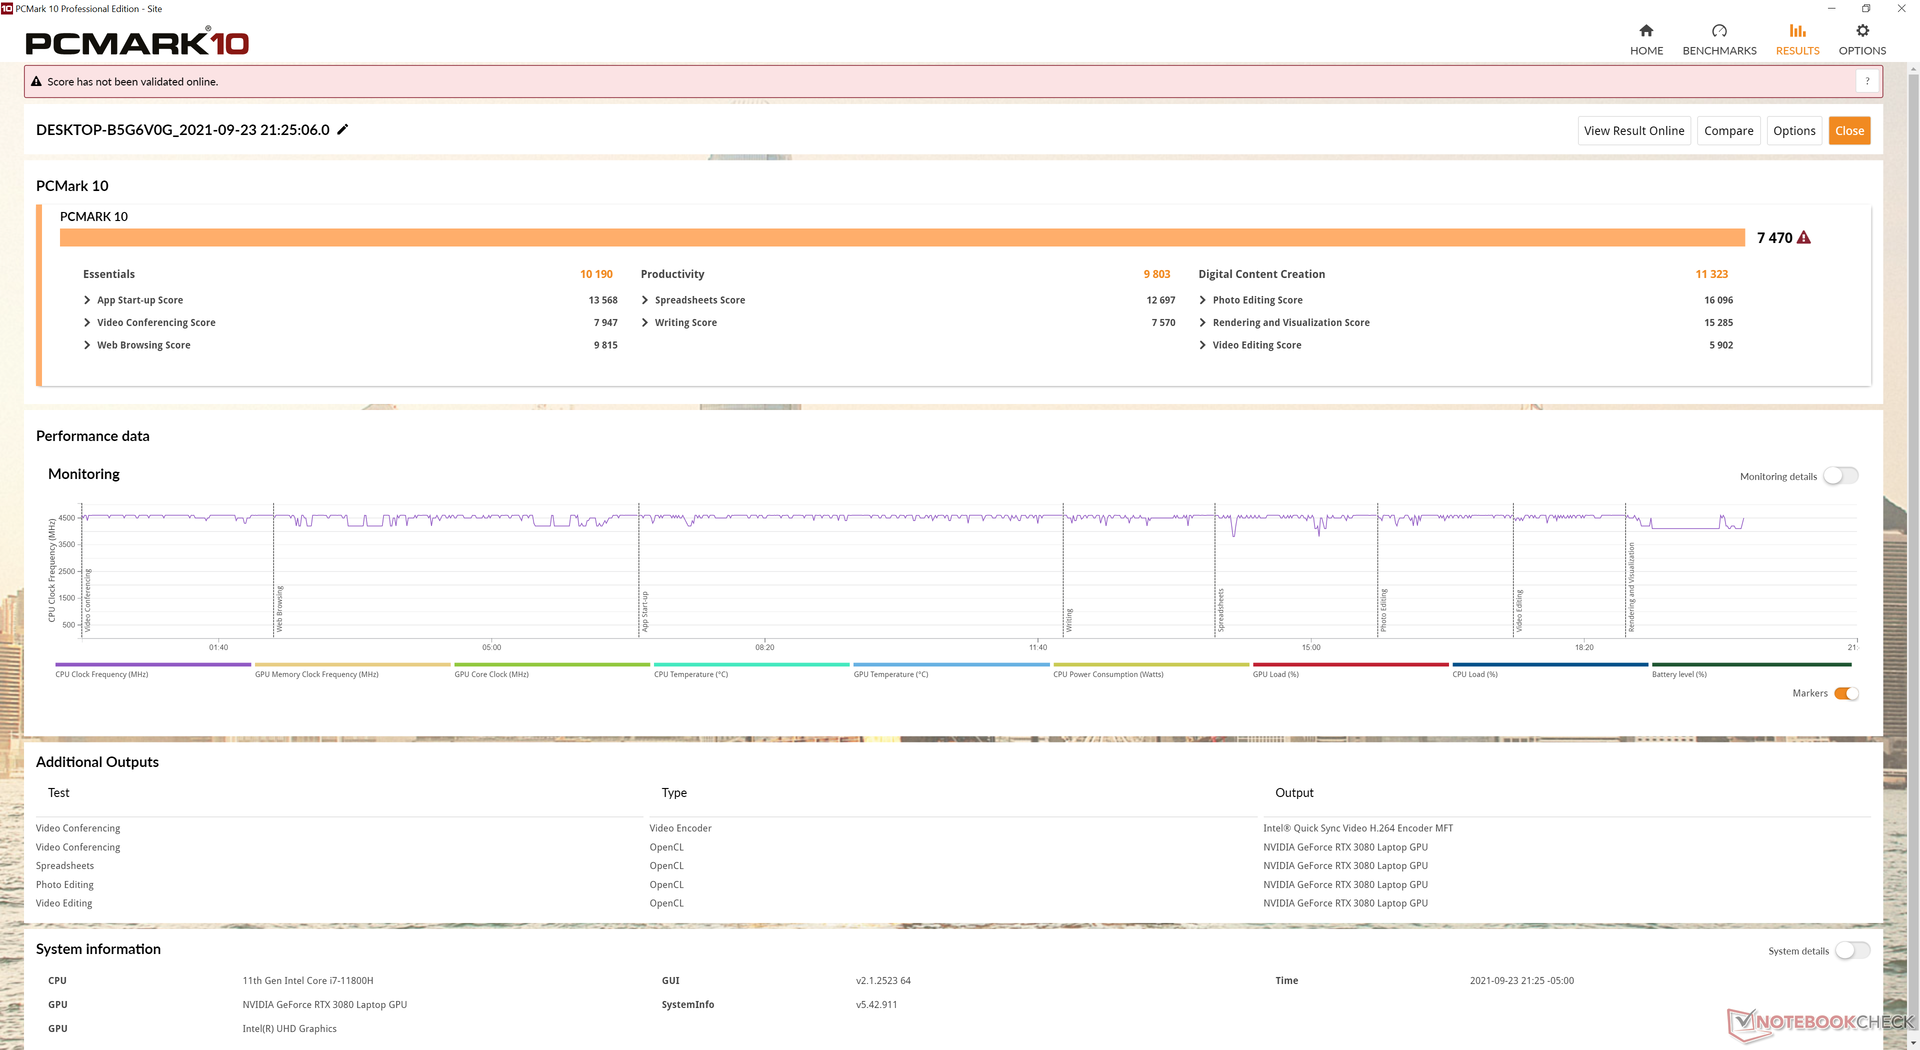
PCMark scores zijn waar we verwachten dat ze zijn in vergelijking met andere high-performance gaming laptops. De algehele resultaten zijn net iets beter dan de Razer Blade 17, uitgerust met dezelfde CPU en GPU.
| PCMark 10 / Score | |
| Alienware x17 RTX 3080 P48E | |
| Razer Blade 17 RTX 3070 | |
| Asus ROG Zephyrus S17 GX703HSD | |
| Gemiddeld Intel Core i7-11800H, NVIDIA GeForce RTX 3080 Laptop GPU (6673 - 7470, n=11) | |
| Gigabyte Aero 17 HDR YD | |
| MSI GS76 Stealth 11UH | |
| Alienware m17 R4 | |
| PCMark 10 / Essentials | |
| Razer Blade 17 RTX 3070 | |
| Asus ROG Zephyrus S17 GX703HSD | |
| Gemiddeld Intel Core i7-11800H, NVIDIA GeForce RTX 3080 Laptop GPU (9862 - 11064, n=11) | |
| Gigabyte Aero 17 HDR YD | |
| Alienware x17 RTX 3080 P48E | |
| MSI GS76 Stealth 11UH | |
| Alienware m17 R4 | |
| PCMark 10 / Productivity | |
| Alienware x17 RTX 3080 P48E | |
| Asus ROG Zephyrus S17 GX703HSD | |
| Razer Blade 17 RTX 3070 | |
| Gemiddeld Intel Core i7-11800H, NVIDIA GeForce RTX 3080 Laptop GPU (8278 - 9803, n=11) | |
| Gigabyte Aero 17 HDR YD | |
| MSI GS76 Stealth 11UH | |
| Alienware m17 R4 | |
| PCMark 10 / Digital Content Creation | |
| Alienware x17 RTX 3080 P48E | |
| Razer Blade 17 RTX 3070 | |
| Asus ROG Zephyrus S17 GX703HSD | |
| Gemiddeld Intel Core i7-11800H, NVIDIA GeForce RTX 3080 Laptop GPU (9881 - 11323, n=11) | |
| Gigabyte Aero 17 HDR YD | |
| MSI GS76 Stealth 11UH | |
| Alienware m17 R4 | |
| PCMark 10 Score | 7470 punten | |
Help | ||
DPC latentie
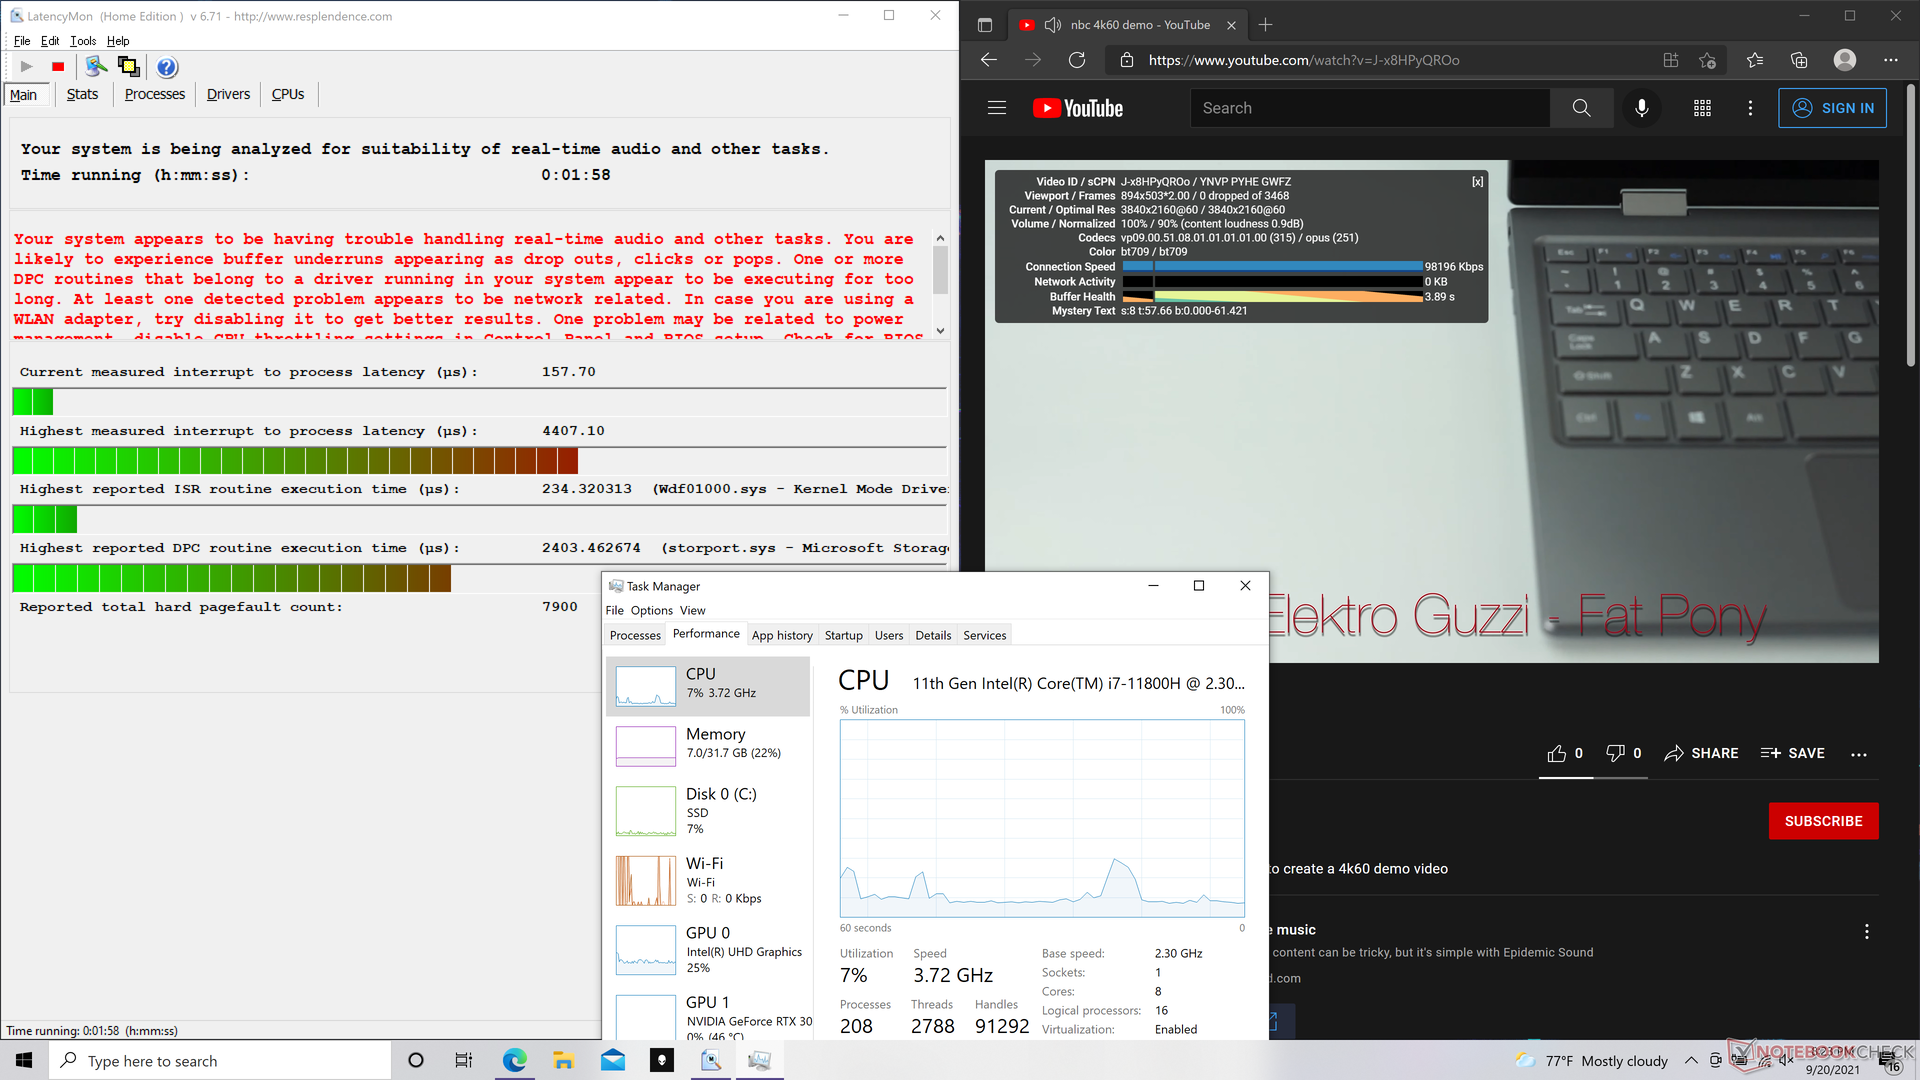
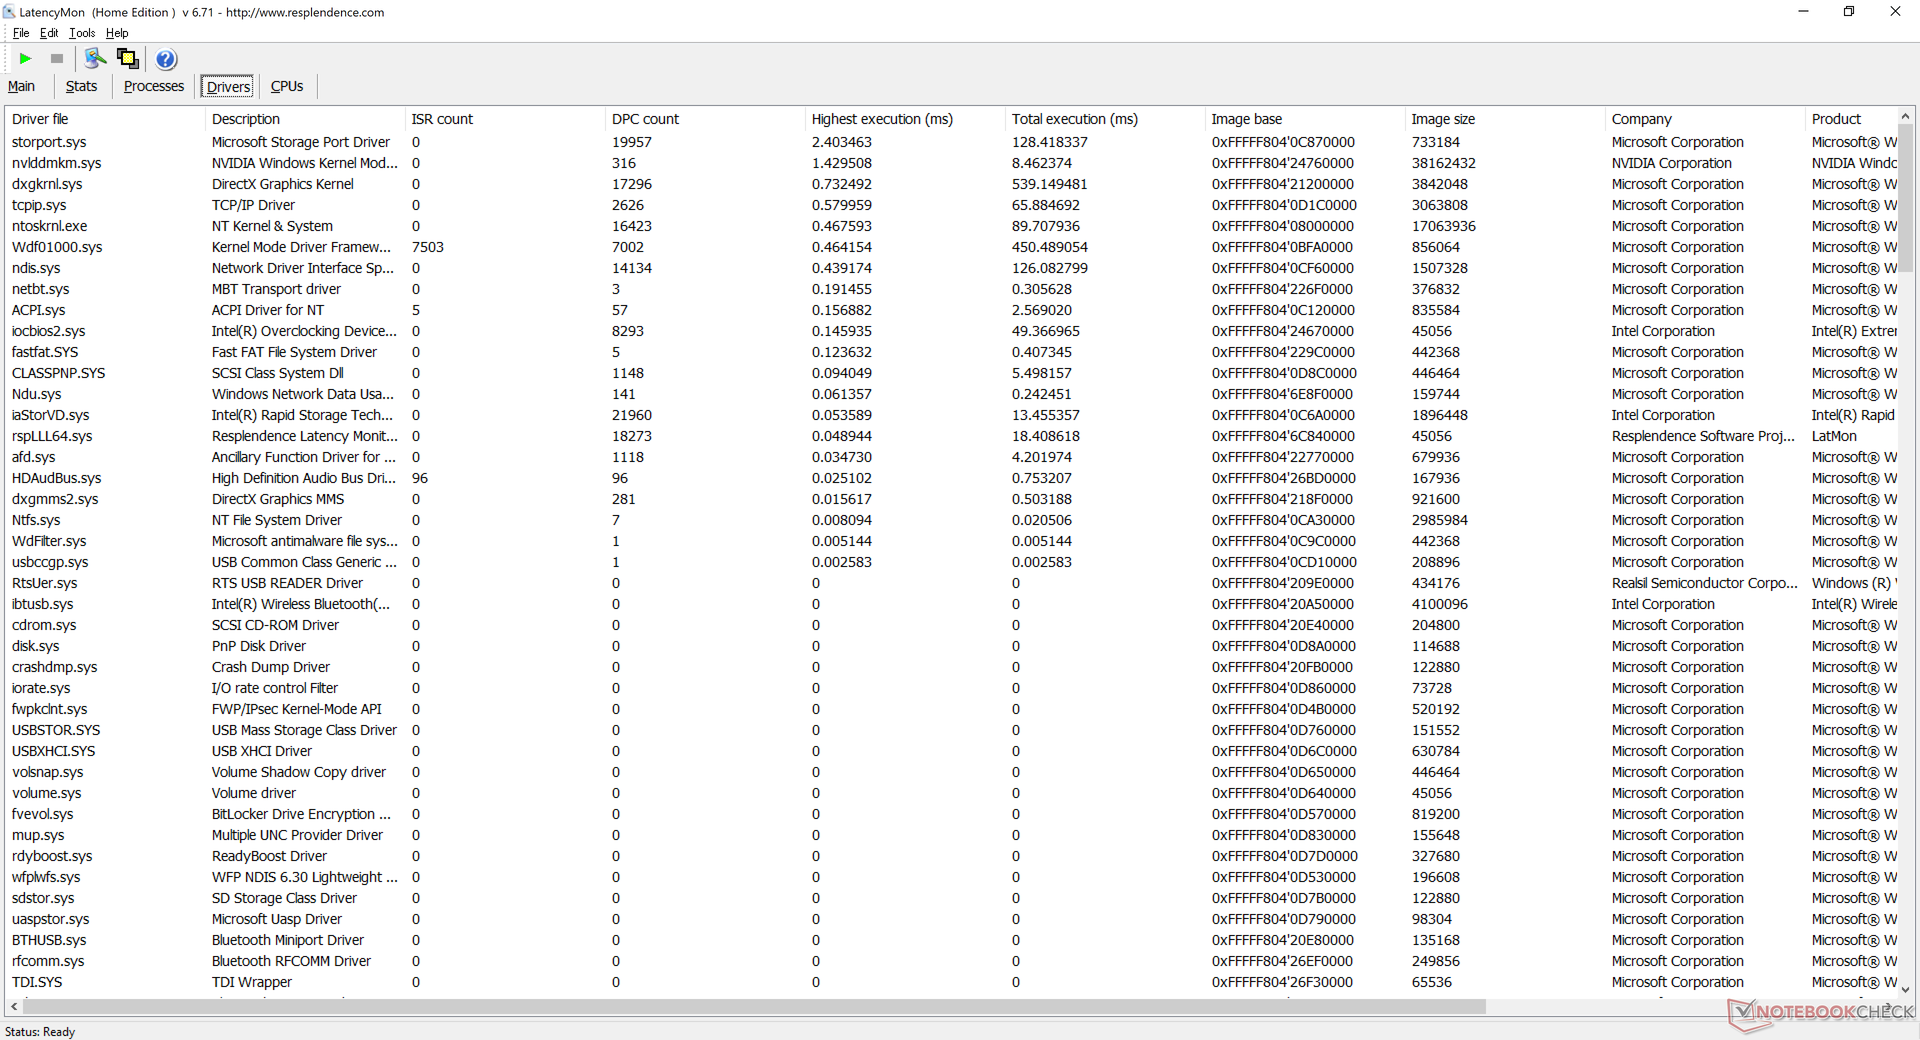
LatencyMon onthult DPC latency problemen bij het openen van meerdere browser tabs op onze homepage en bij het draaien van Prime95 stress. 4K video afspelen op 60 FPS is verder perfect zonder dropped frames.
| DPC Latencies / LatencyMon - interrupt to process latency (max), Web, Youtube, Prime95 | |
| Alienware x17 RTX 3080 P48E | |
| Gigabyte Aero 17 HDR YD | |
| Asus ROG Zephyrus S17 GX703HSD | |
| MSI GS76 Stealth 11UH | |
| Alienware m17 R4 | |
| Razer Blade 17 RTX 3070 | |
* ... kleiner is beter
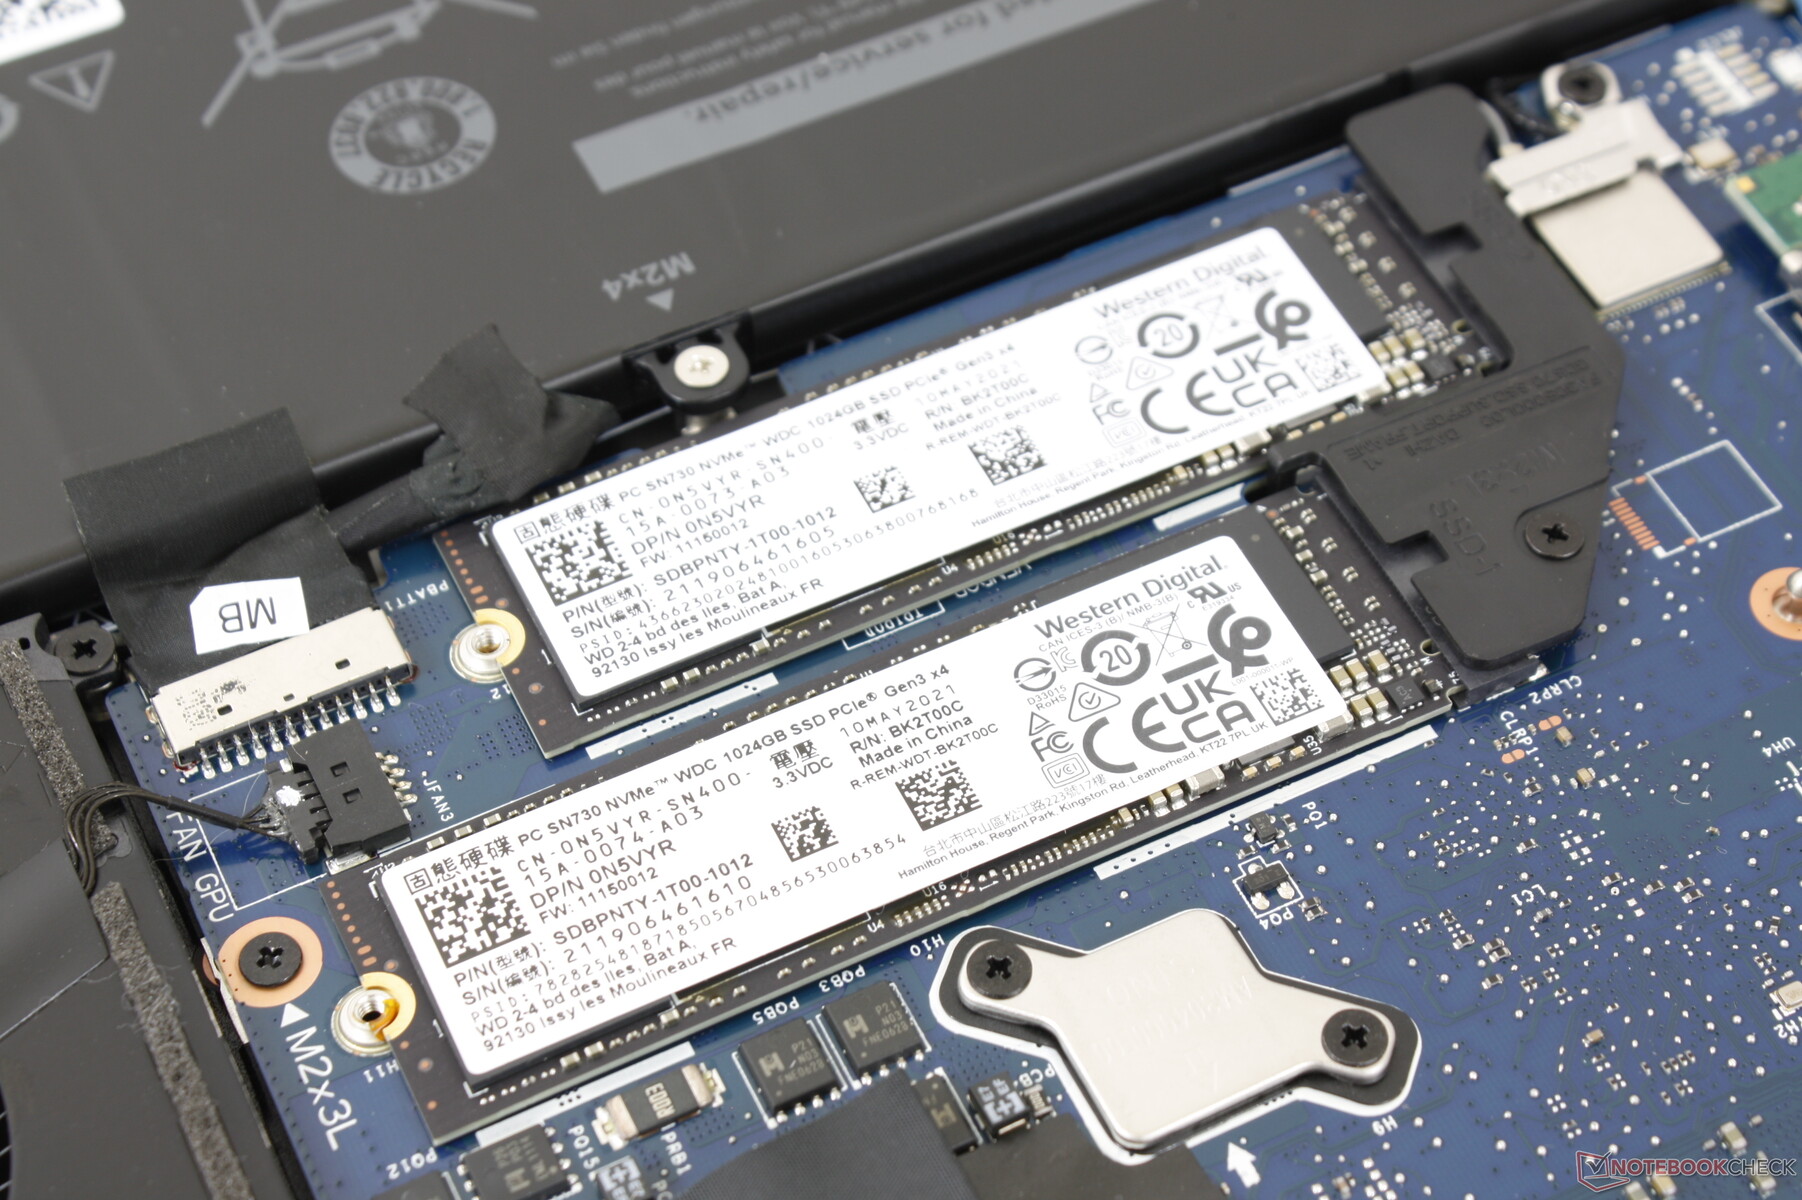
Opslagapparatuur - één PCIe4 en één PCIe3
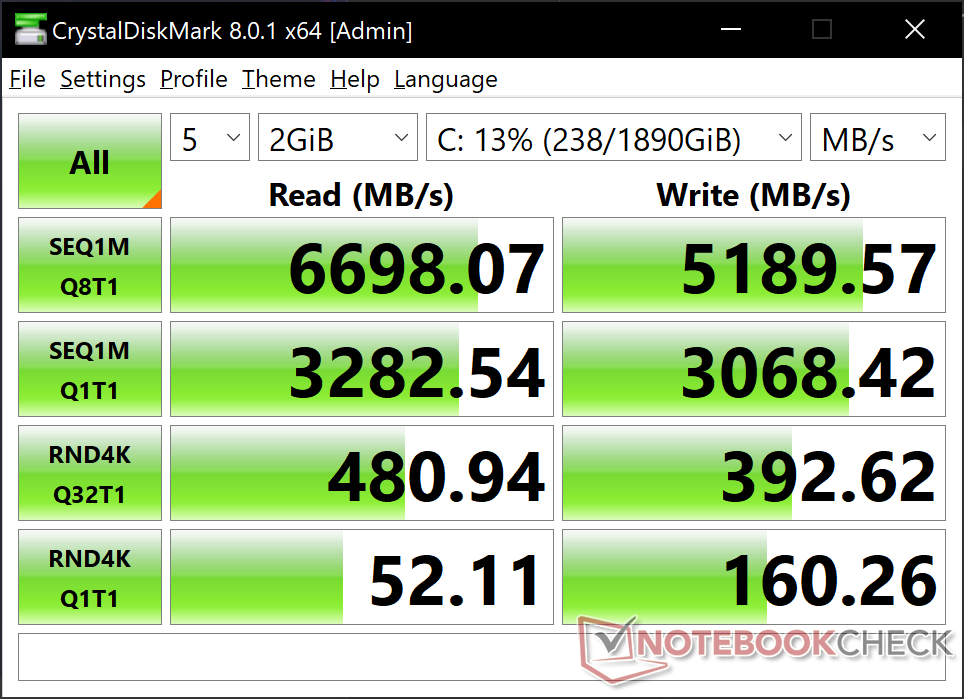
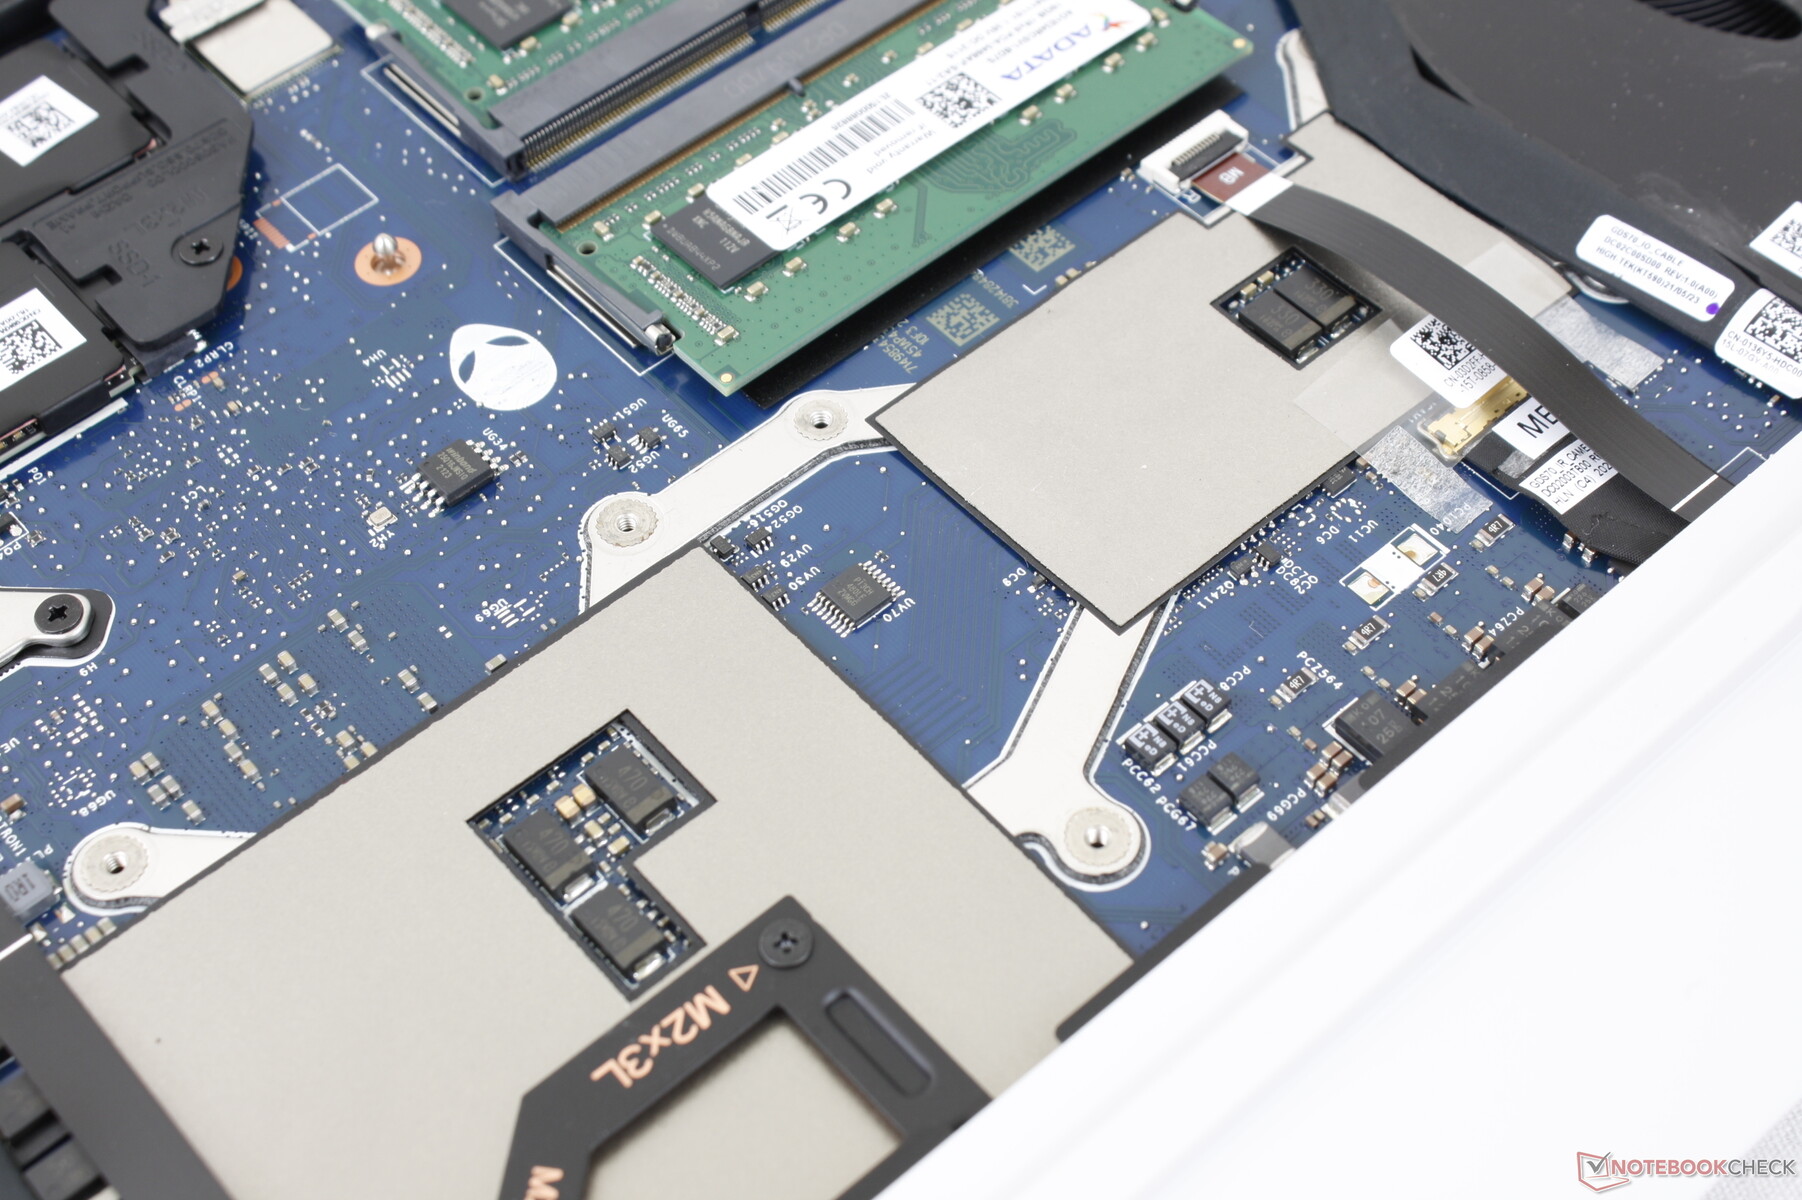
Onze testeenheid wordt geleverd met twee 1 TB WD SN730 NVMe SSD's in RAID 0 voor sequentiële lees- en schrijfsnelheden tot respectievelijk 6700 MB/s en 4300 MB/s, wat sneller is dan elke afzonderlijke PCIe3 SSD die beschikbaar is. Niettemin is een enkeleSamsung PM9A1 PCIe4 SSD nog steeds sneller dan onze PCIe3 RAID 0 opstelling. Dell zegt dat het systeem tot één PCIe4 SSD kan ondersteunen als gebruikers er zelf één willen installeren.
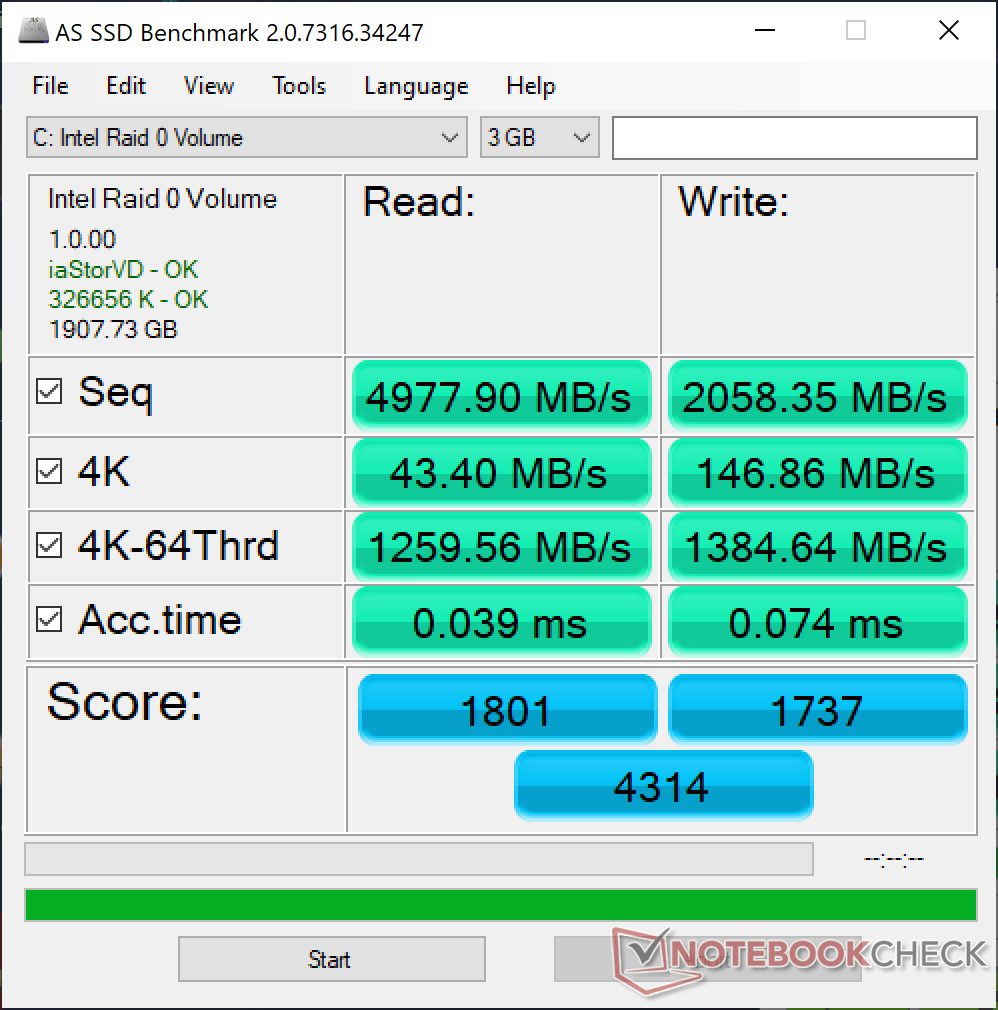
| Alienware x17 RTX 3080 P48E 2x WDC PC SN730 SDBPNTY-1T00 (RAID 0) | Alienware m17 R4 2x Micron 2300 512 GB (RAID 0) | Razer Blade 17 RTX 3070 Samsung PM9A1 MZVL21T0HCLR | Asus ROG Zephyrus S17 GX703HSD Samsung PM9A1 MZVL22T0HBLB | MSI GS76 Stealth 11UH Samsung PM9A1 MZVL22T0HBLB | Gigabyte Aero 17 HDR YD Samsung PM9A1 MZVL2512HCJQ | |
|---|---|---|---|---|---|---|
| AS SSD | -12% | 52% | 67% | 68% | 66% | |
| Seq Read (MB/s) | 4978 | 2733 -45% | 5302 7% | 5085 2% | 5408 9% | 5438 9% |
| Seq Write (MB/s) | 2058 | 2822 37% | 3977 93% | 4434 115% | 3863 88% | 3904 90% |
| 4K Read (MB/s) | 43.4 | 45.04 4% | 55 27% | 80.3 85% | 52.7 21% | 56.2 29% |
| 4K Write (MB/s) | 146.9 | 88.4 -40% | 148.7 1% | 214.7 46% | 153.1 4% | 165.8 13% |
| 4K-64 Read (MB/s) | 1260 | 1388 10% | 2715 115% | 2573 104% | 2692 114% | 2489 98% |
| 4K-64 Write (MB/s) | 1385 | 1227 -11% | 3416 147% | 2972 115% | 3414 146% | 3480 151% |
| Access Time Read * (ms) | 0.039 | 0.079 -103% | 0.044 -13% | 0.018 54% | 0.046 -18% | 0.054 -38% |
| Access Time Write * (ms) | 0.074 | 0.095 -28% | 0.085 -15% | 0.02 73% | 0.027 64% | 0.026 65% |
| Score Read (Points) | 1801 | 1706 -5% | 3300 83% | 3161 76% | 3285 82% | 3089 72% |
| Score Write (Points) | 1737 | 1598 -8% | 3963 128% | 3631 109% | 3953 128% | 4036 132% |
| Score Total (Points) | 4314 | 4184 -3% | 8874 106% | 8380 94% | 8830 105% | 8620 100% |
| Copy ISO MB/s (MB/s) | 2009 | 2414 20% | 2710 35% | 3239 61% | ||
| Copy Program MB/s (MB/s) | 1099 | 1030 -6% | 1114 1% | 899 -18% | ||
| Copy Game MB/s (MB/s) | 1881 | 1991 6% | 2095 11% | 2171 15% | ||
| CrystalDiskMark 5.2 / 6 | -16% | 38% | 41% | 39% | 42% | |
| Write 4K (MB/s) | 159.2 | 93.1 -42% | 233.5 47% | 244.2 53% | 230.7 45% | 230.4 45% |
| Read 4K (MB/s) | 51.9 | 46.79 -10% | 90.1 74% | 89.8 73% | 87.9 69% | 91.6 76% |
| Write Seq (MB/s) | 3115 | 2853 -8% | 4263 37% | 4300 38% | 4216 35% | |
| Read Seq (MB/s) | 3298 | 2556 -22% | 4468 35% | 4392 33% | 4543 38% | |
| Write 4K Q32T1 (MB/s) | 392.6 | 475 21% | 538 37% | 607 55% | 582 48% | 667 70% |
| Read 4K Q32T1 (MB/s) | 474.7 | 529 11% | 703 48% | 658 39% | 730 54% | 728 53% |
| Write Seq Q32T1 (MB/s) | 4331 | 3331 -23% | 5097 18% | 5270 22% | 5152 19% | 5043 16% |
| Read Seq Q32T1 (MB/s) | 6746 | 3319 -51% | 7065 5% | 7091 5% | 7094 5% | 6821 1% |
| Write 4K Q8T8 (MB/s) | 2270 | |||||
| Read 4K Q8T8 (MB/s) | 2490 | |||||
| Totaal Gemiddelde (Programma / Instellingen) | -14% /
-13% | 45% /
47% | 54% /
59% | 54% /
55% | 54% /
56% |
* ... kleiner is beter

Disk Throttling: DiskSpd Read Loop, Queue Depth 8
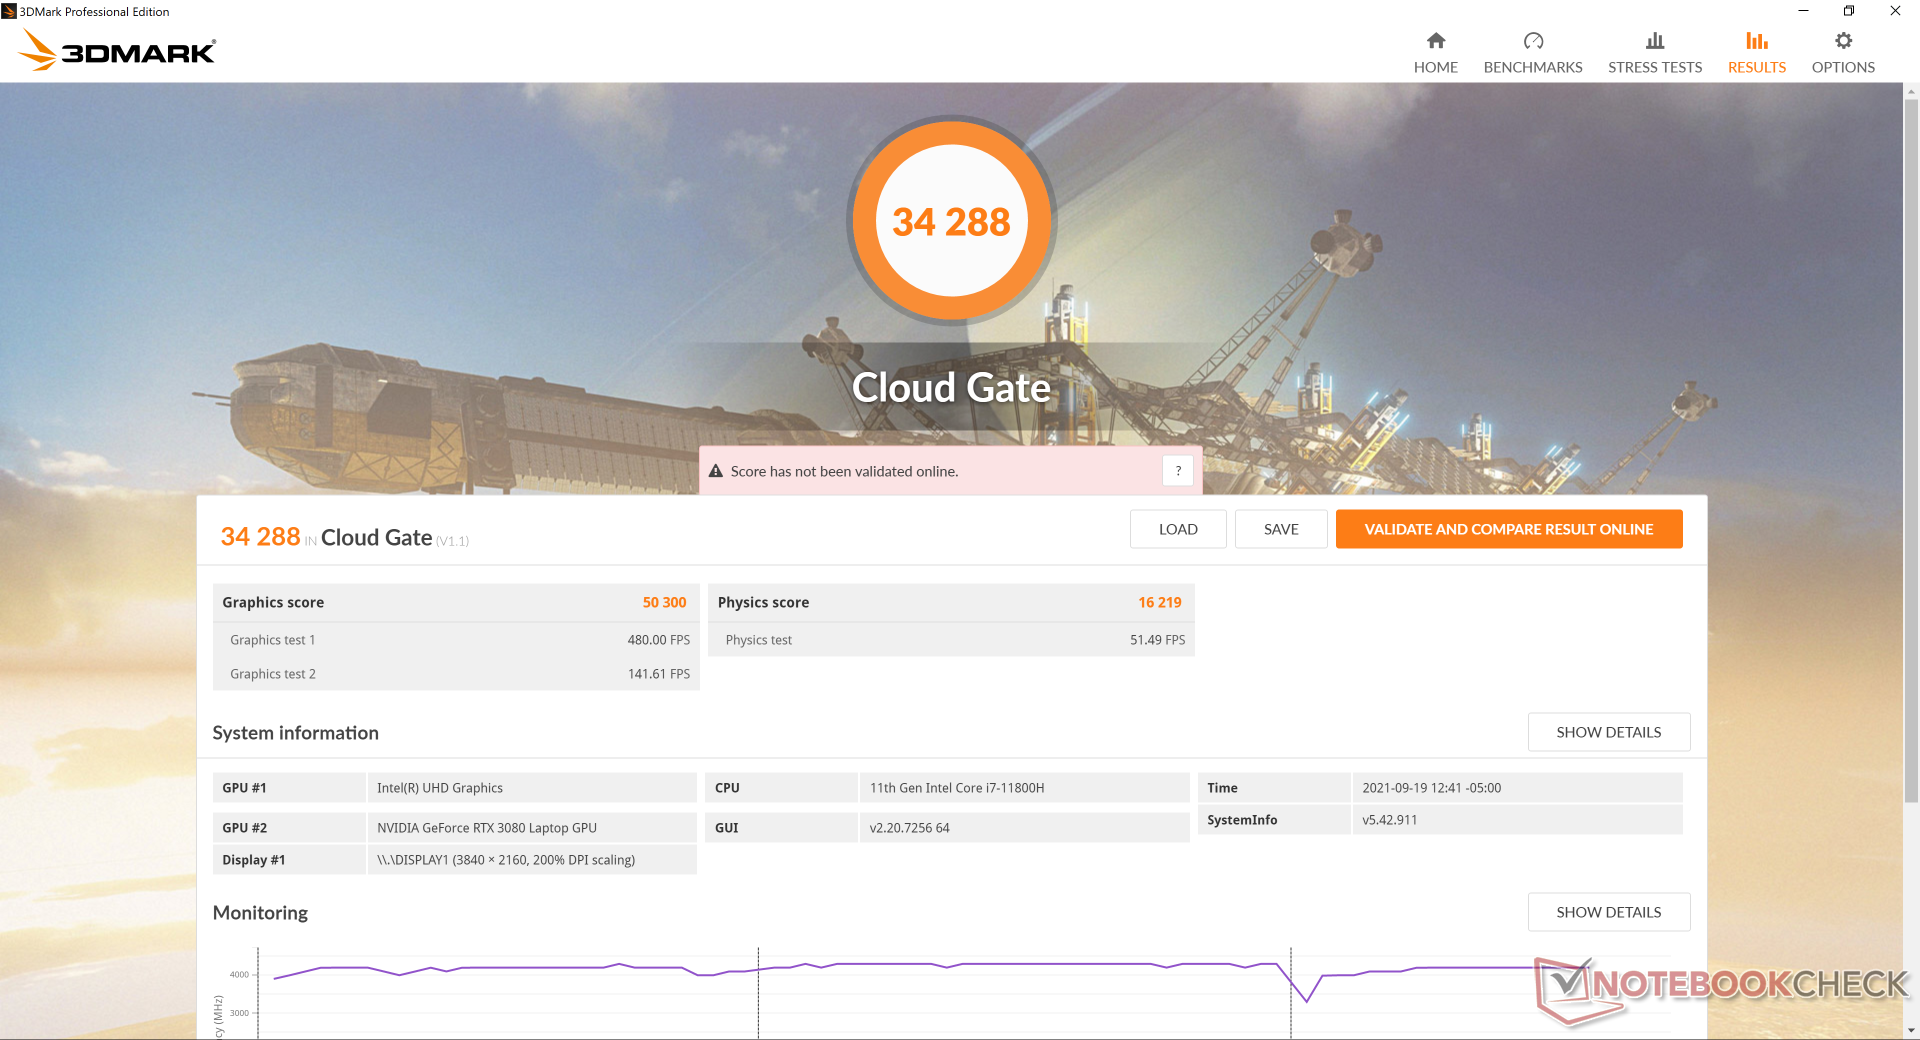
GPU-prestaties - net iets hoger dan gemiddeld
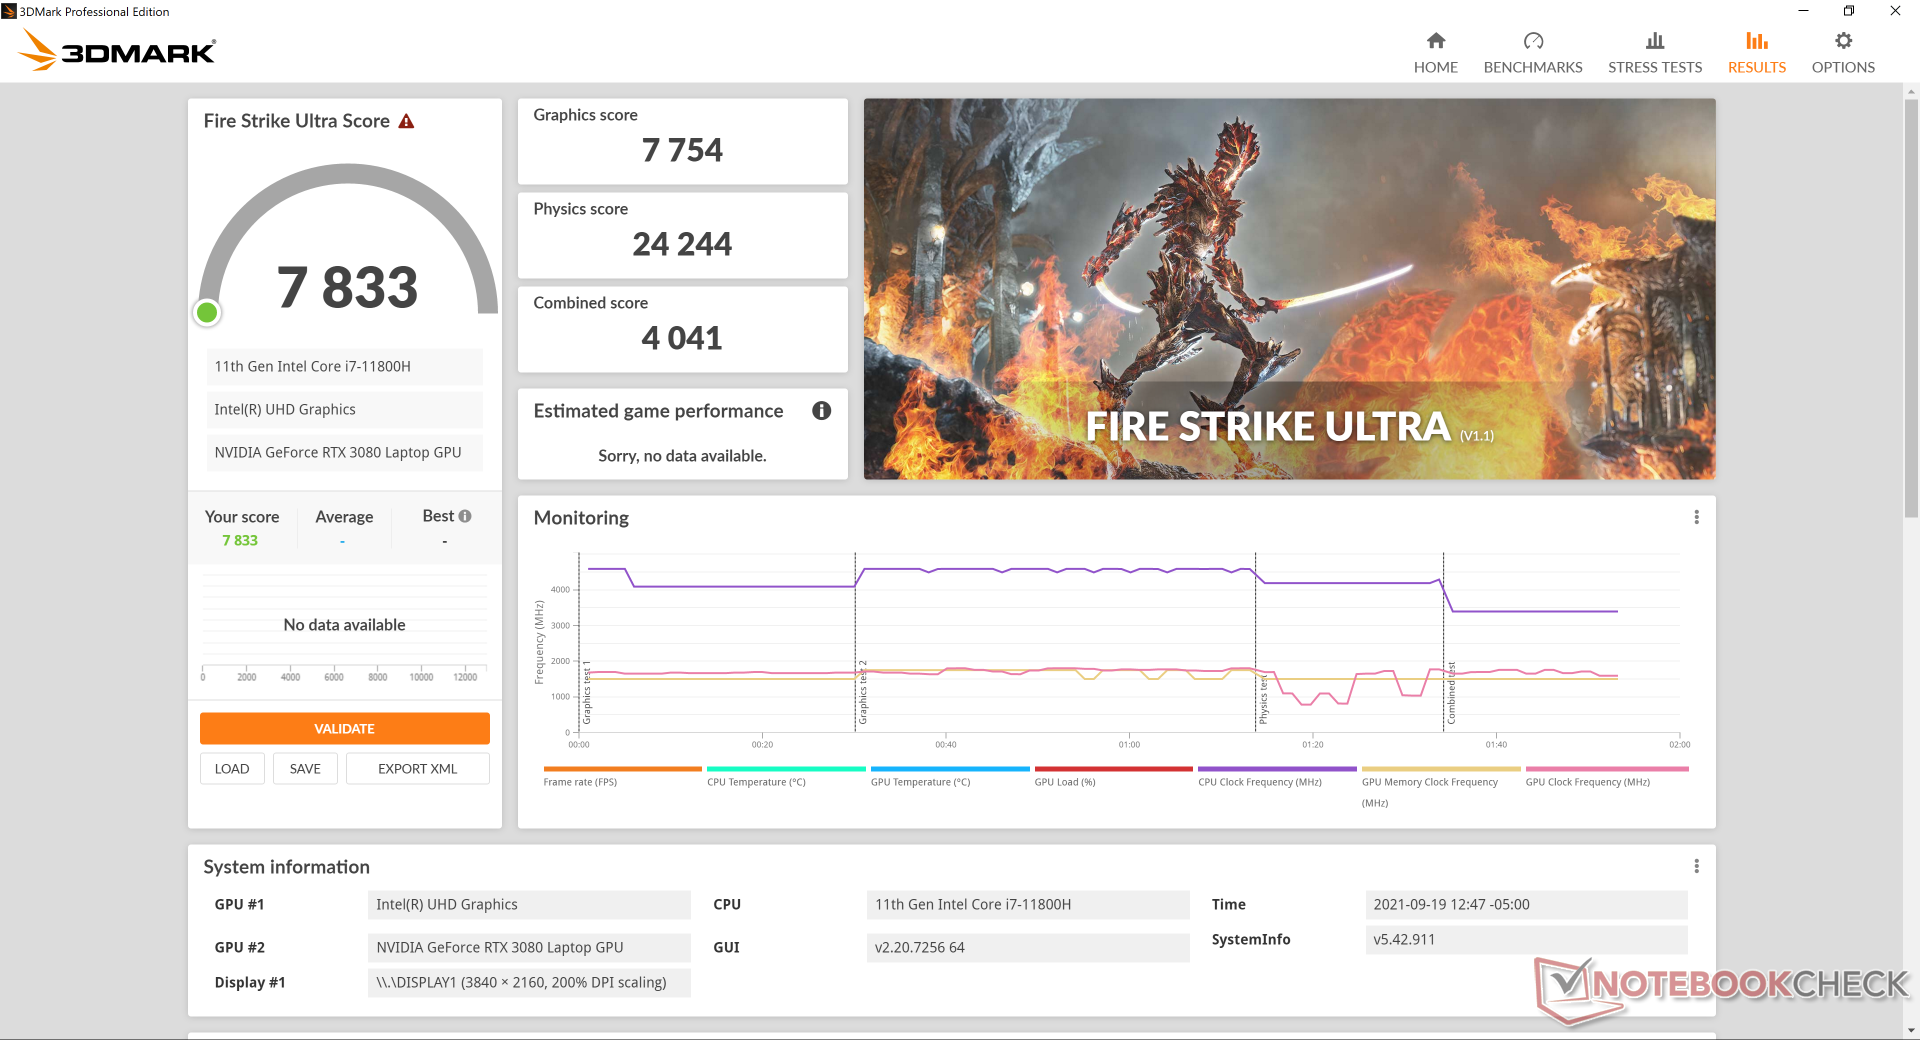
Ondanks de 165 W RTX 3080 graphics, zijn de ruwe prestaties slechts 2 tot 9 procent sneller dan de gemiddelde RTX 3080 laptop in onze database, waarschijnlijk als gevolg van afnemende opbrengsten bij hogere TGP-doelen. Het kleine voordeel is ook te zien bij het draaien van games, aangezien de framerates gemiddeld weer slechts een paar procentpunten hoger liggen. Het prestatieverschil wordt echter duidelijker in vergelijking met de 90 W RTX 3080 in de MSI GS76, waar onze Alienware ruwweg 15 tot 30 procent sneller kan zijn in bepaalde titels. A desktop PC met RTX 3080 graphics zal nog steeds beter presteren dan elke RTX 3080 laptop met ongeveer 40 tot 45 procent.
Stationair draaien op Witcher 3 gedurende meer dan een uur toont stabiele framerates zonder willekeurige dalingen om te suggereren dat er geen onderbrekende achtergrondactiviteit is tijdens het gamen, in tegenstelling tot wat we waarnamen op sommige oudere Alienware m15-modellen.
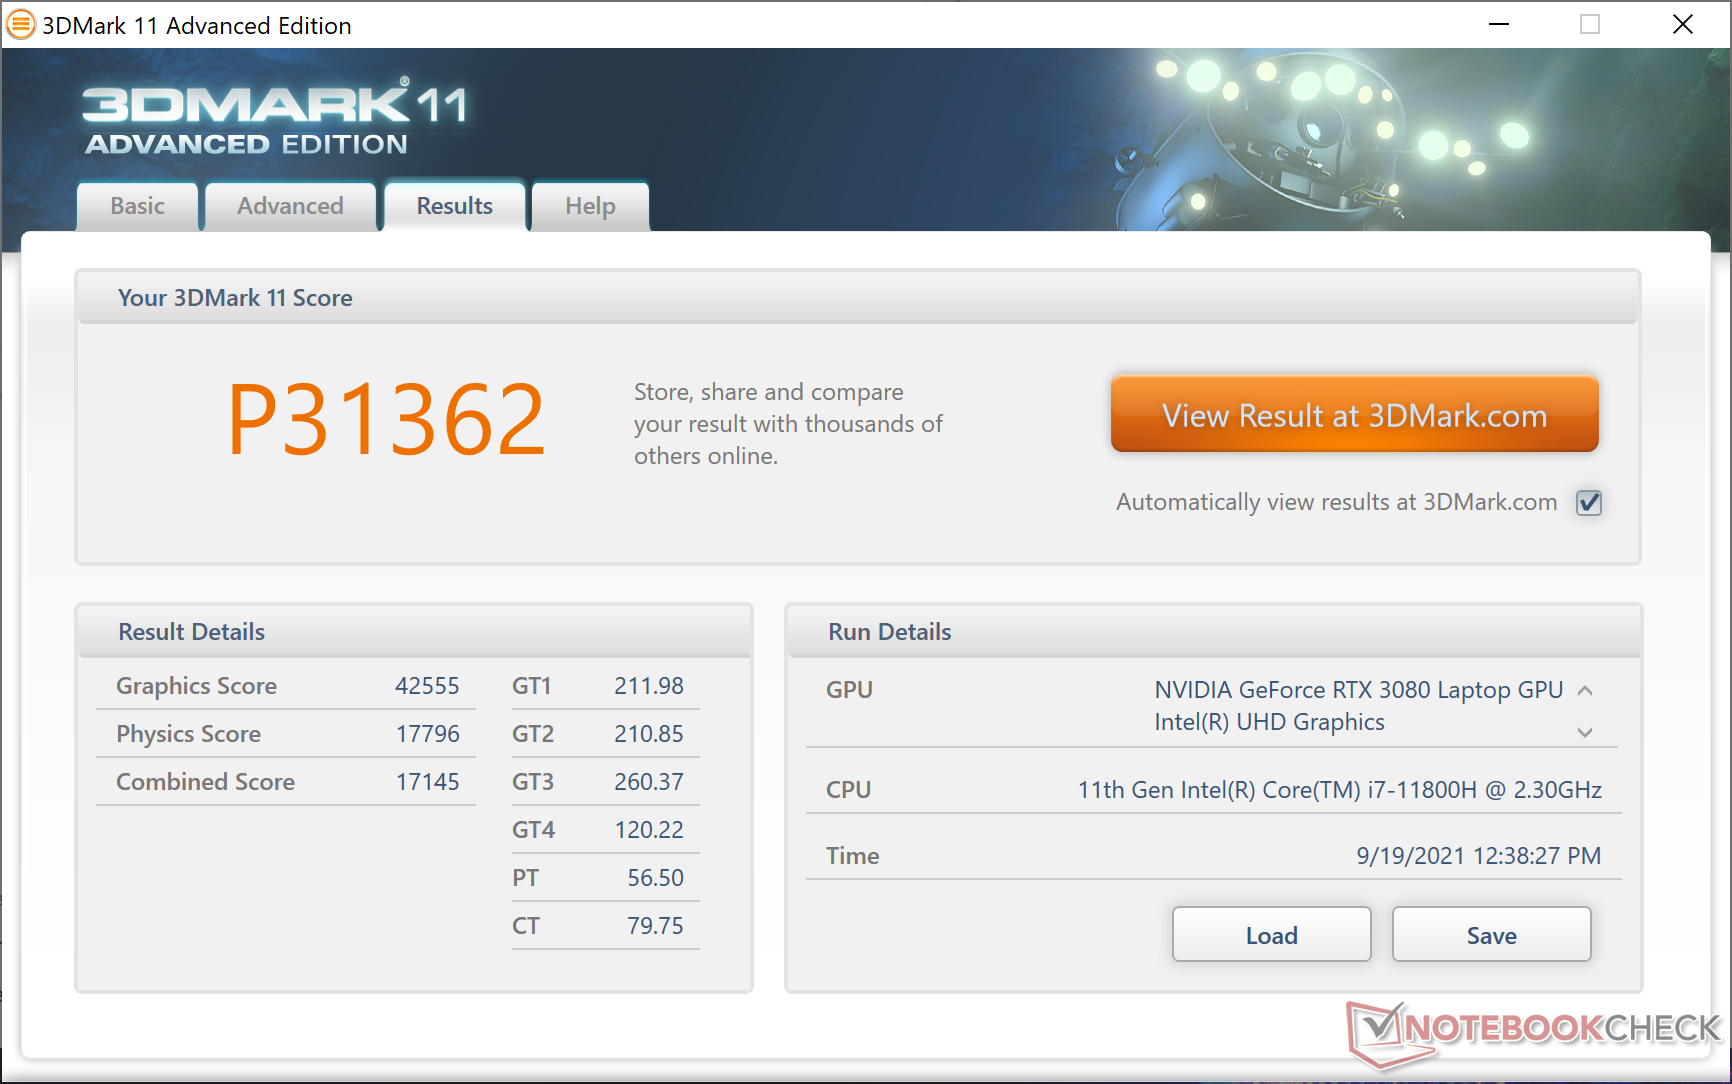
| 3DMark 11 Performance | 31362 punten | |
| 3DMark Cloud Gate Standard Score | 34288 punten | |
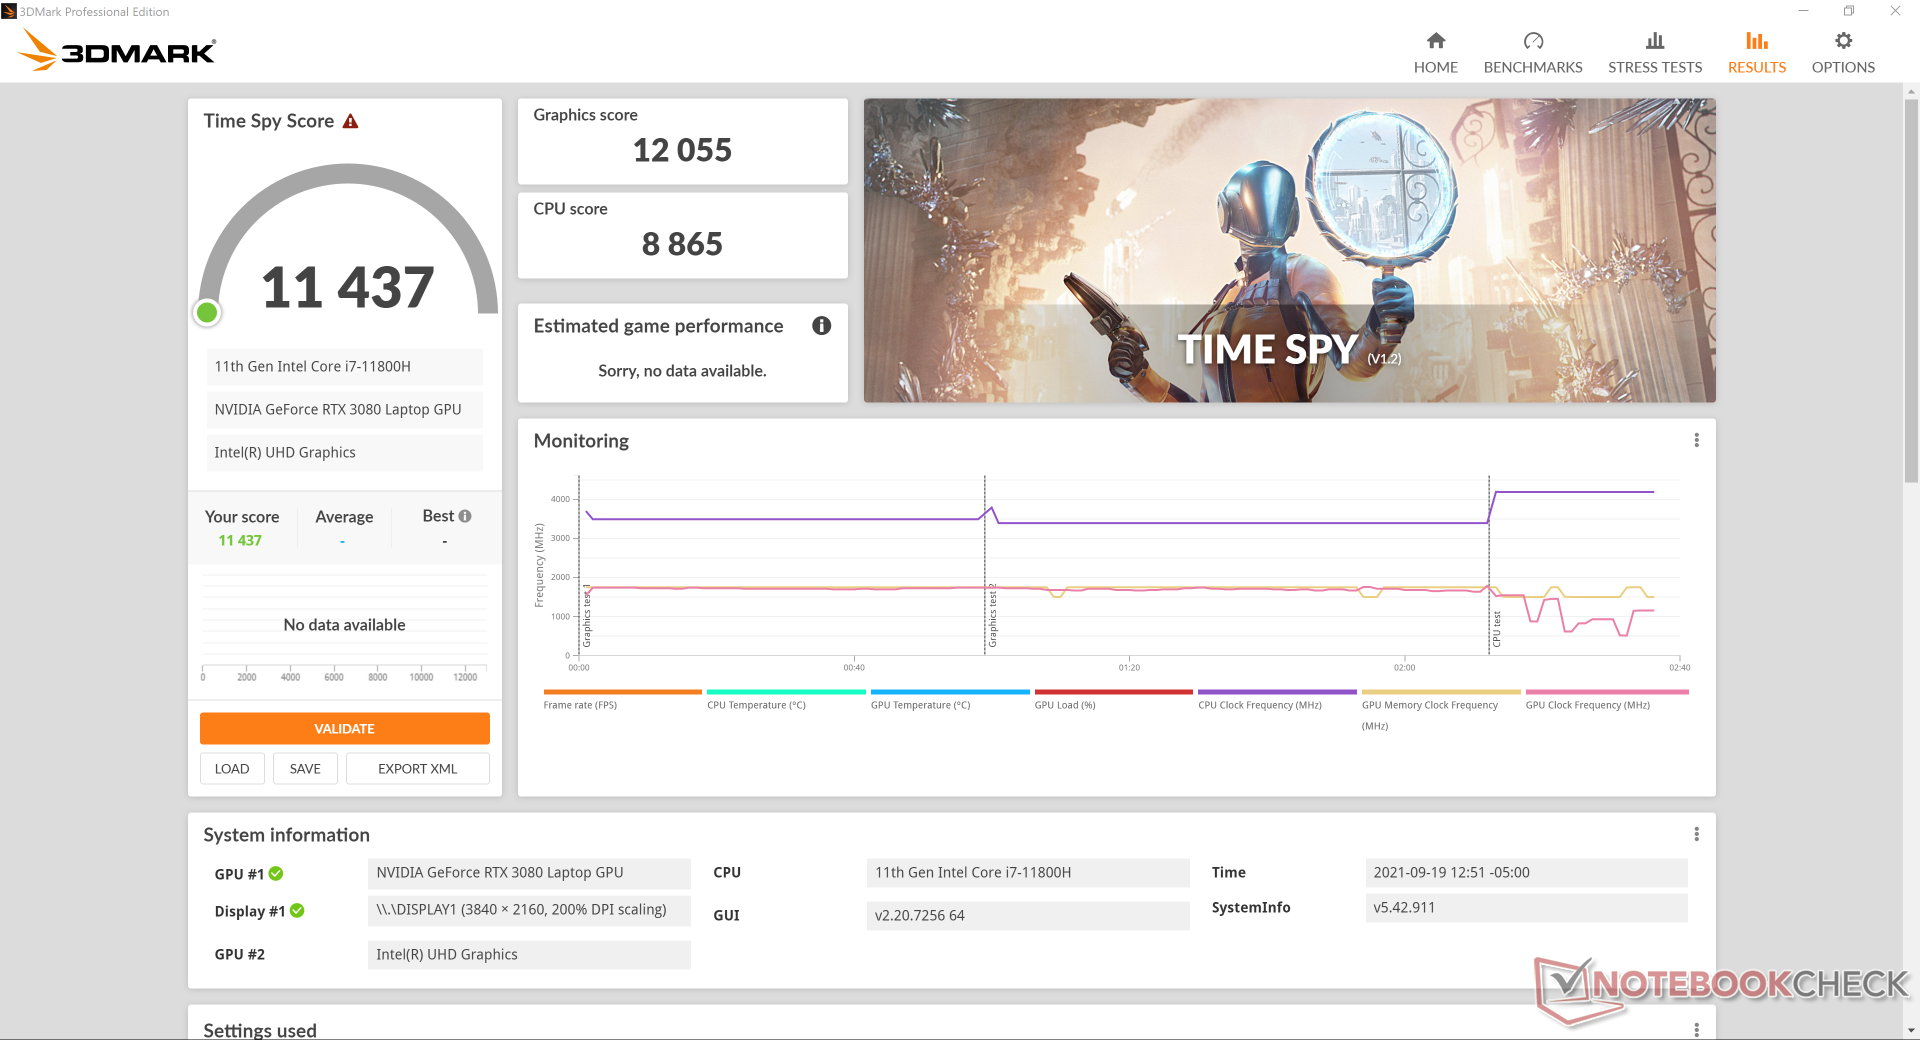
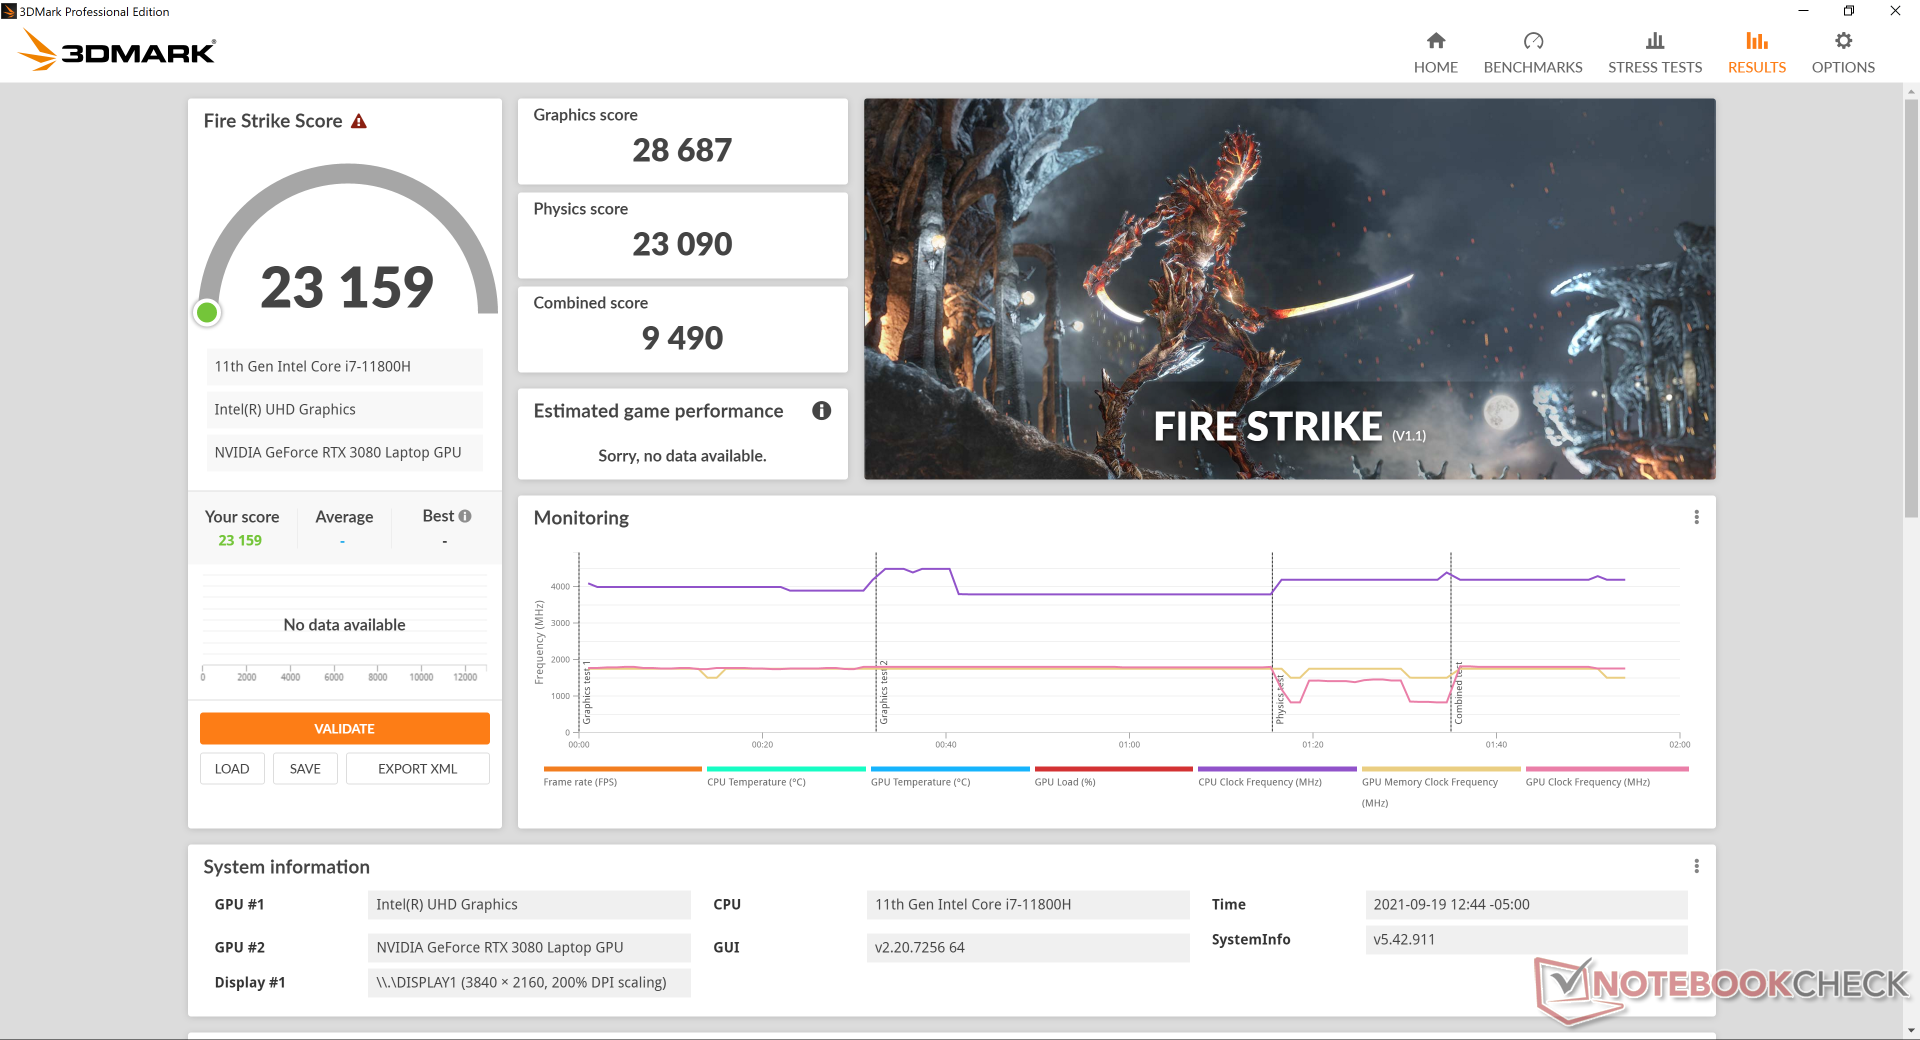
| 3DMark Fire Strike Score | 23159 punten | |
| 3DMark Time Spy Score | 11437 punten | |
Help | ||
Witcher 3 FPS Chart
| lage | gem. | hoge | ultra | QHD | 4K | |
|---|---|---|---|---|---|---|
| GTA V (2015) | 183 | 176 | 163 | 98.1 | 89.2 | 98.1 |
| The Witcher 3 (2015) | 370.2 | 294 | 192 | 105.2 | 80.2 | |
| Dota 2 Reborn (2015) | 164 | 148 | 143 | 135 | 111 | |
| Final Fantasy XV Benchmark (2018) | 181 | 134 | 106 | 81.8 | 50.8 | |
| X-Plane 11.11 (2018) | 118 | 99.3 | 79.7 | 56.9 | ||
| Far Cry 5 (2018) | 144 | 125 | 120 | 112 | 98 | 63 |
| Strange Brigade (2018) | 456 | 269 | 225 | 199 | 152 | 91.6 |
Emissions
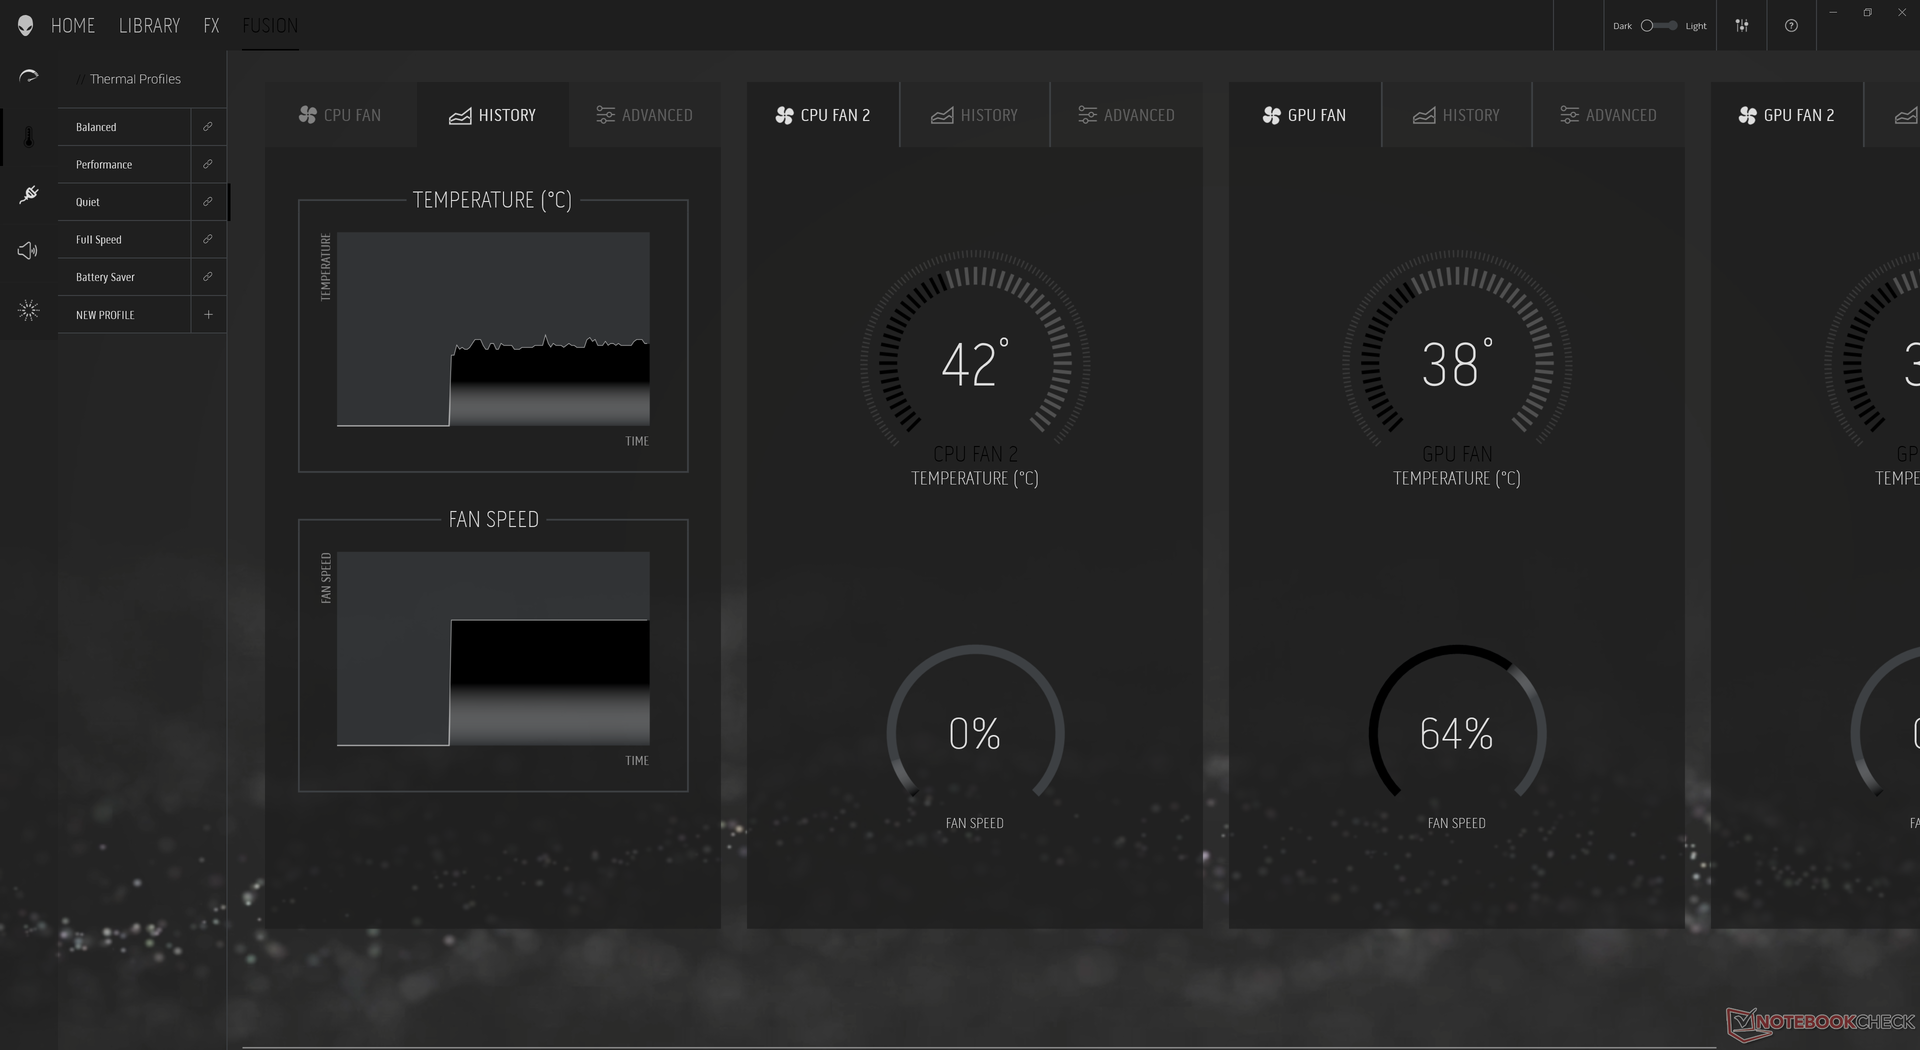
Systeemgeluid - Dampkamer + Gallium-silicone warmtepasta
Het geluid van de ventilator is sterk afhankelijk van de instellingen van het Alienware Command Center (Stil, Prestaties en Volle snelheid). Ondanks het feit dat de Alienware x17 twee keer zoveel ventilatoren heeft als de meeste andere gaming laptops, is hij over het algemeen erg stil tijdens lage belastingen zoals browsen of video streamen, zelfs als hij is ingesteld op de Prestaties-modus. We registreren een ventilatorgeluid van slechts 31,3 dB(A) tegen een achtergrond van 24,9 dB(A) wanneer we 3DMark 06 gedurende 90 seconden draaien. Langer, echter, en het geluid van de ventilator zou uiteindelijk stijgen tot 43,8 dB(A), wat vergelijkbaar is met wat we hebben geregistreerd op andere gaming laptops.
Het draaien van Witcher 3 in de prestatiemodus resulteerde in een gestaag ventilatorgeluid van 49,7 dB(A). Interessant genoeg zou dit niveau hetzelfde blijven, zelfs in de gebalanceerde modus, dus gamers zouden het systeem indien mogelijk in de prestatiemodus moeten zetten. Als de ventilatoren op de Full Speed modus worden gezet, stijgt het ventilatorgeluid tot maar liefst 55 dB(A), ongeacht de belasting op het scherm. De Alienware x17 is over het algemeen stiller dan de Gigabyte Aero 17 of de laatste generatie m17 R4 tijdens lage belastingen, maar ze zijn bijna gelijk zodra hogere belastingen worden geïntroduceerd.
| Alienware x17 RTX 3080 P48E GeForce RTX 3080 Laptop GPU, i7-11800H, 2x WDC PC SN730 SDBPNTY-1T00 (RAID 0) | Alienware m17 R4 GeForce RTX 3080 Laptop GPU, i9-10980HK, 2x Micron 2300 512 GB (RAID 0) | Razer Blade 17 RTX 3070 GeForce RTX 3070 Laptop GPU, i7-11800H, Samsung PM9A1 MZVL21T0HCLR | Asus ROG Zephyrus S17 GX703HSD GeForce RTX 3080 Laptop GPU, i9-11900H, Samsung PM9A1 MZVL22T0HBLB | MSI GS76 Stealth 11UH GeForce RTX 3080 Laptop GPU, i9-11900H, Samsung PM9A1 MZVL22T0HBLB | Gigabyte Aero 17 HDR YD GeForce RTX 3080 Laptop GPU, i9-11980HK, Samsung PM9A1 MZVL2512HCJQ | |
|---|---|---|---|---|---|---|
| Noise | -6% | -3% | 4% | -10% | -20% | |
| uit / omgeving * (dB) | 24.9 | 24 4% | 24.2 3% | 23 8% | 24 4% | 25 -0% |
| Idle Minimum * (dB) | 24.9 | 24 4% | 24.7 1% | 23 8% | 24 4% | 30 -20% |
| Idle Average * (dB) | 24.9 | 25 -0% | 24.7 1% | 23 8% | 25 -0% | 32 -29% |
| Idle Maximum * (dB) | 29.6 | 36 -22% | 24.7 17% | 23 22% | 42 -42% | 41 -39% |
| Load Average * (dB) | 31.1 | 45 -45% | 44.3 -42% | 41 -32% | 46 -48% | 43 -38% |
| Witcher 3 ultra * (dB) | 49.7 | 47 5% | 56.3 -13% | 45 9% | 48 3% | 51 -3% |
| Load Maximum * (dB) | 54.8 | 50 9% | 47.7 13% | 52 5% | 48 12% | 59 -8% |
* ... kleiner is beter
Geluidsniveau
| Onbelast |
| 24.9 / 24.9 / 29.6 dB (A) |
| Belasting |
| 31.1 / 54.8 dB (A) |
 | ||
30 dB stil 40 dB(A) hoorbaar 50 dB(A) luid |
||
min: | ||
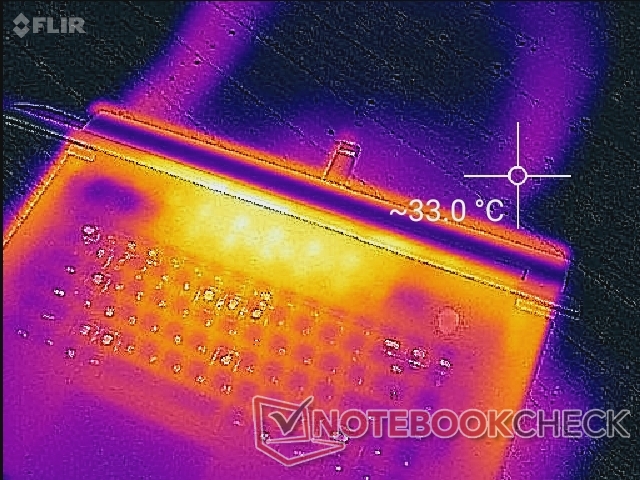
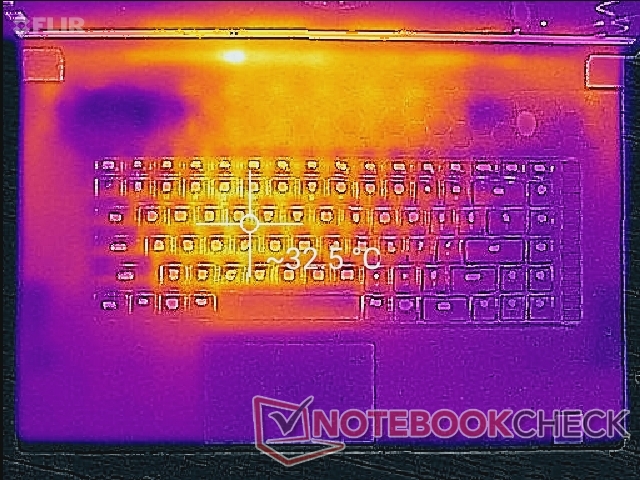
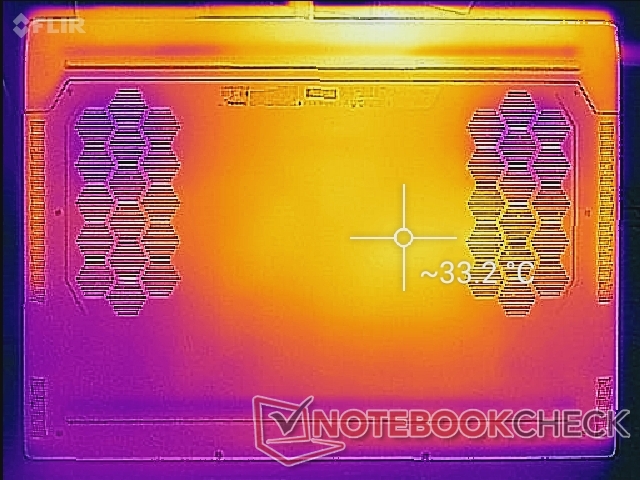
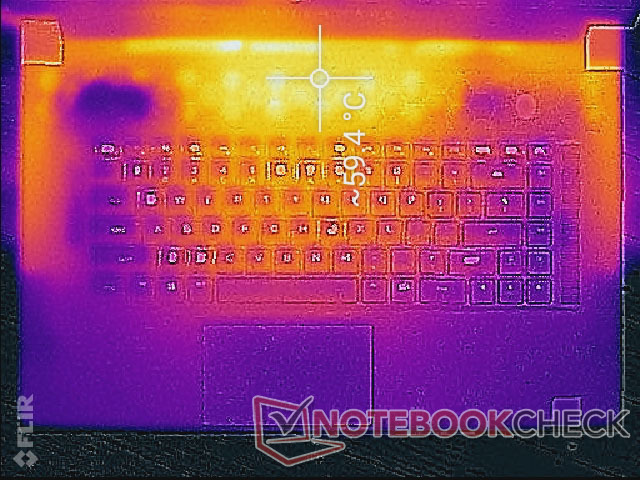
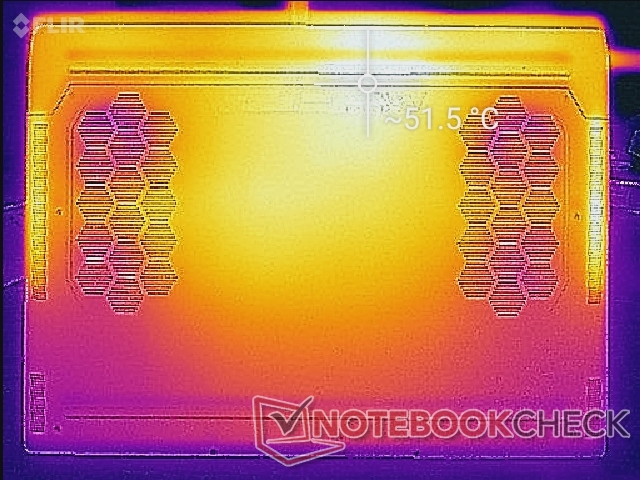
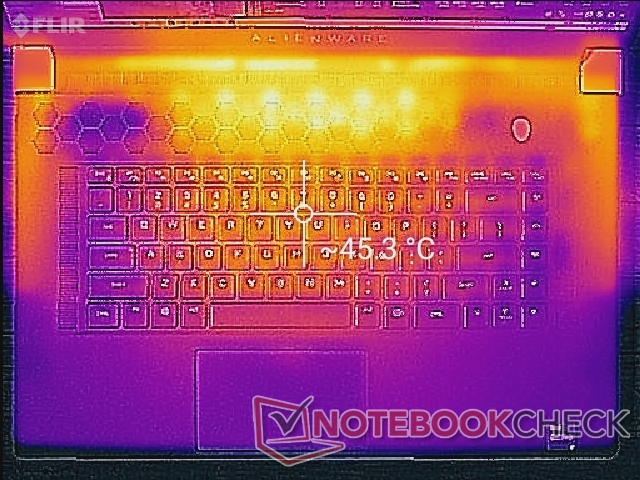
Temperatuur
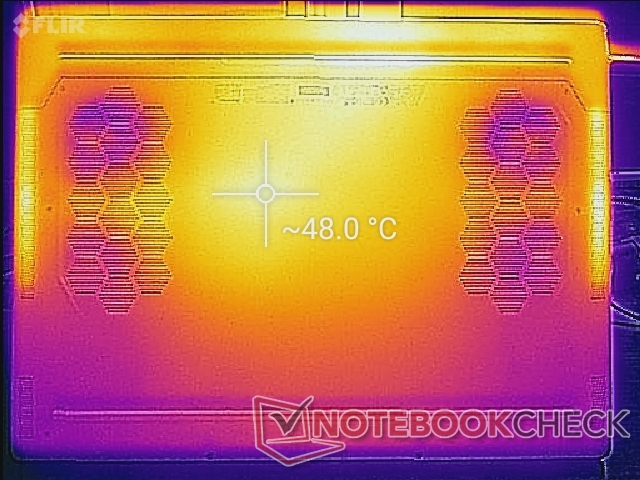
De oppervlaktetemperaturen bij stationair draaien zijn relatief koel op de palmsteunen, terwijl het midden en de onderkant van het toetsenbord merkbaar warmer kunnen worden met ongeveer 33 C elk, omdat de ventilatoren op lage snelheid staan. Tijdens het gamen kunnen de warme plekken op de boven- en onderkant oplopen tot respectievelijk 59 C en 52 C, of zelfs 39 C langs de zijkanten van het toetsenbord. Deze warme plekken zijn over het algemeen weg van de handpalmen en vingers van gebruikers, zodat ze minder storend zijn tijdens het gamen, maar het is zeker aan te raden om geen van de verschillende ventilatieroosters rondom het systeem te blokkeren
Over het algemeen zijn de temperaturen zelfs koeler dan wat we waarnamen bij de Asus Zephyrus S17 waarschijnlijk door de dikkere en grotere afmetingen van ons Alienware chassis.
(-) De maximumtemperatuur aan de bovenzijde bedraagt 58.4 °C / 137 F, vergeleken met het gemiddelde van 40.4 °C / 105 F, variërend van 21.2 tot 68.8 °C voor de klasse Gaming.
(-) De bodem warmt op tot een maximum van 49 °C / 120 F, vergeleken met een gemiddelde van 43.2 °C / 110 F
(+) Bij onbelast gebruik bedraagt de gemiddelde temperatuur voor de bovenzijde 29.5 °C / 85 F, vergeleken met het apparaatgemiddelde van 33.9 °C / 93 F.
(-) Bij het spelen van The Witcher 3 is de gemiddelde temperatuur voor de bovenzijde 41.4 °C / 107 F, vergeleken met het apparaatgemiddelde van 33.9 °C / 93 F.
(+) De handpalmsteunen en het touchpad bereiken maximaal de huidtemperatuur (32.4 °C / 90.3 F) en zijn dus niet heet.
(-) De gemiddelde temperatuur van de handpalmsteun van soortgelijke toestellen bedroeg 28.8 °C / 83.8 F (-3.6 °C / -6.5 F).
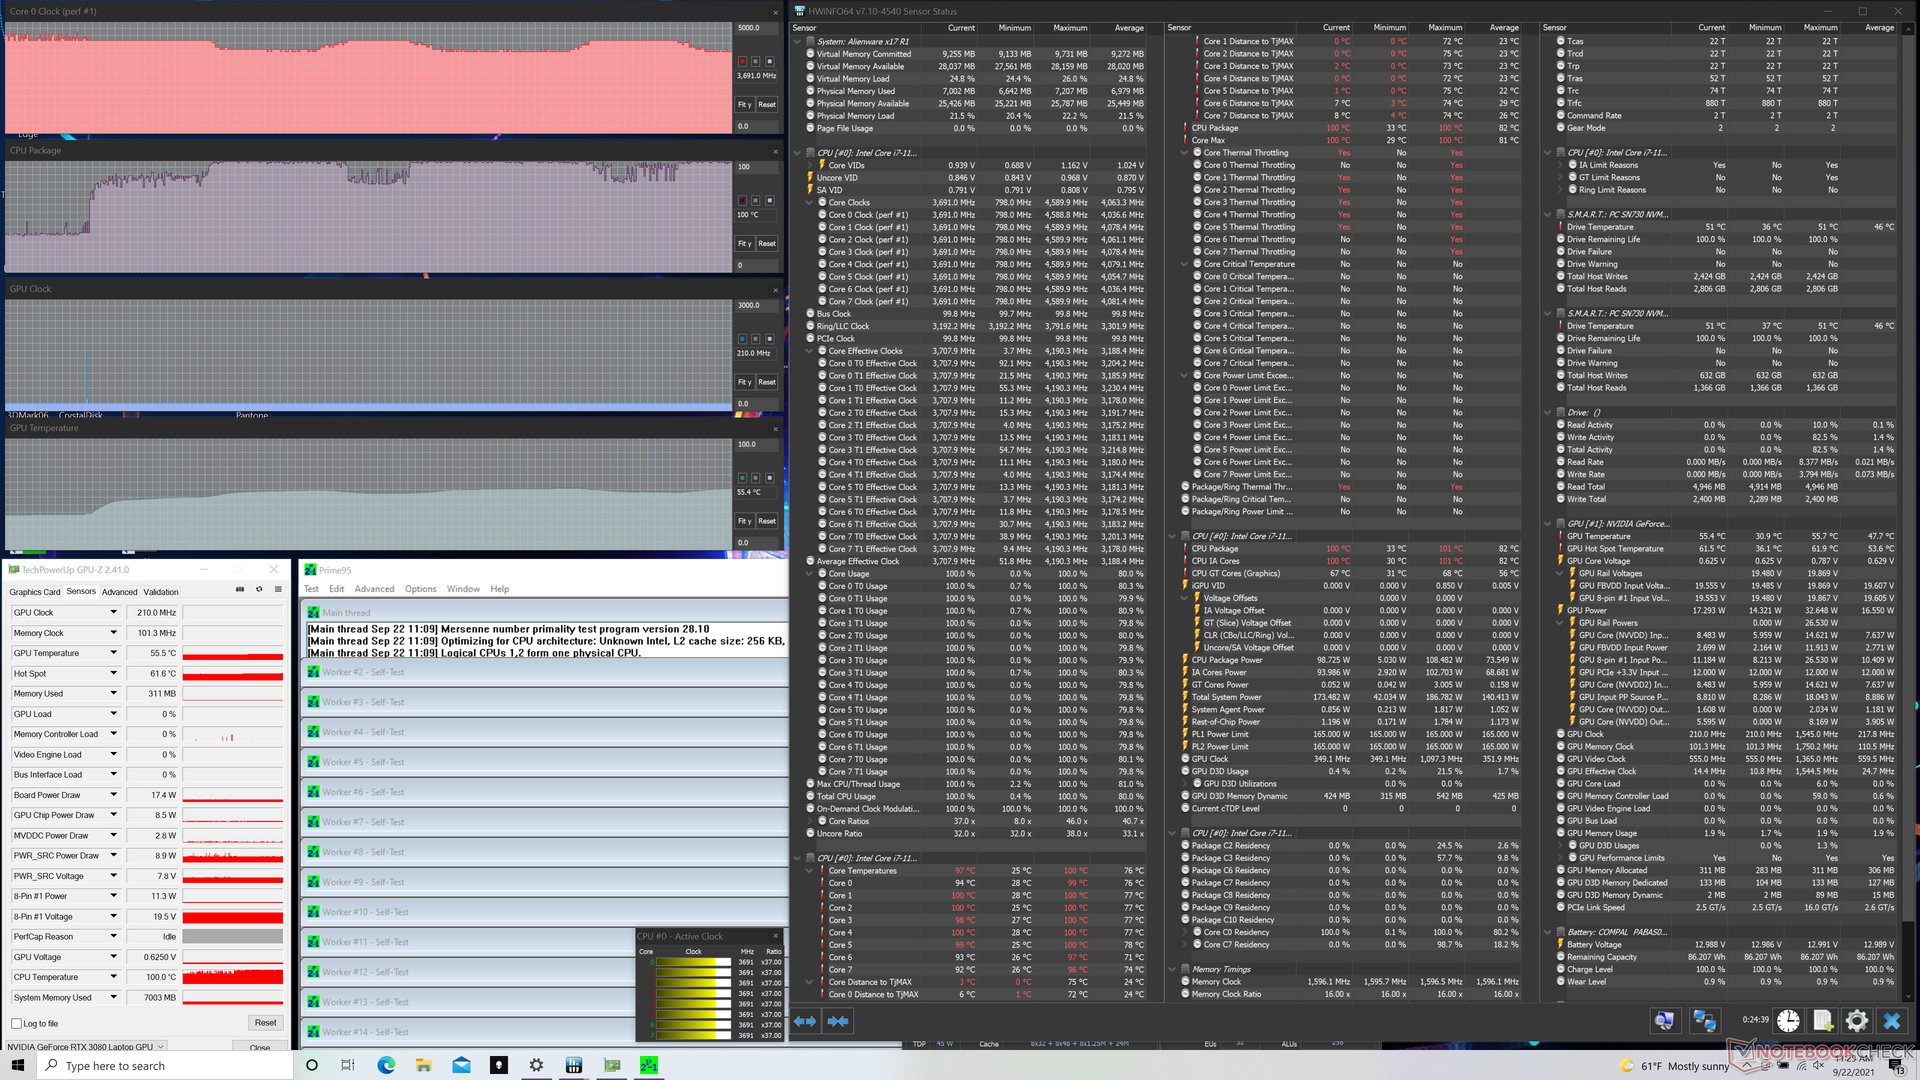
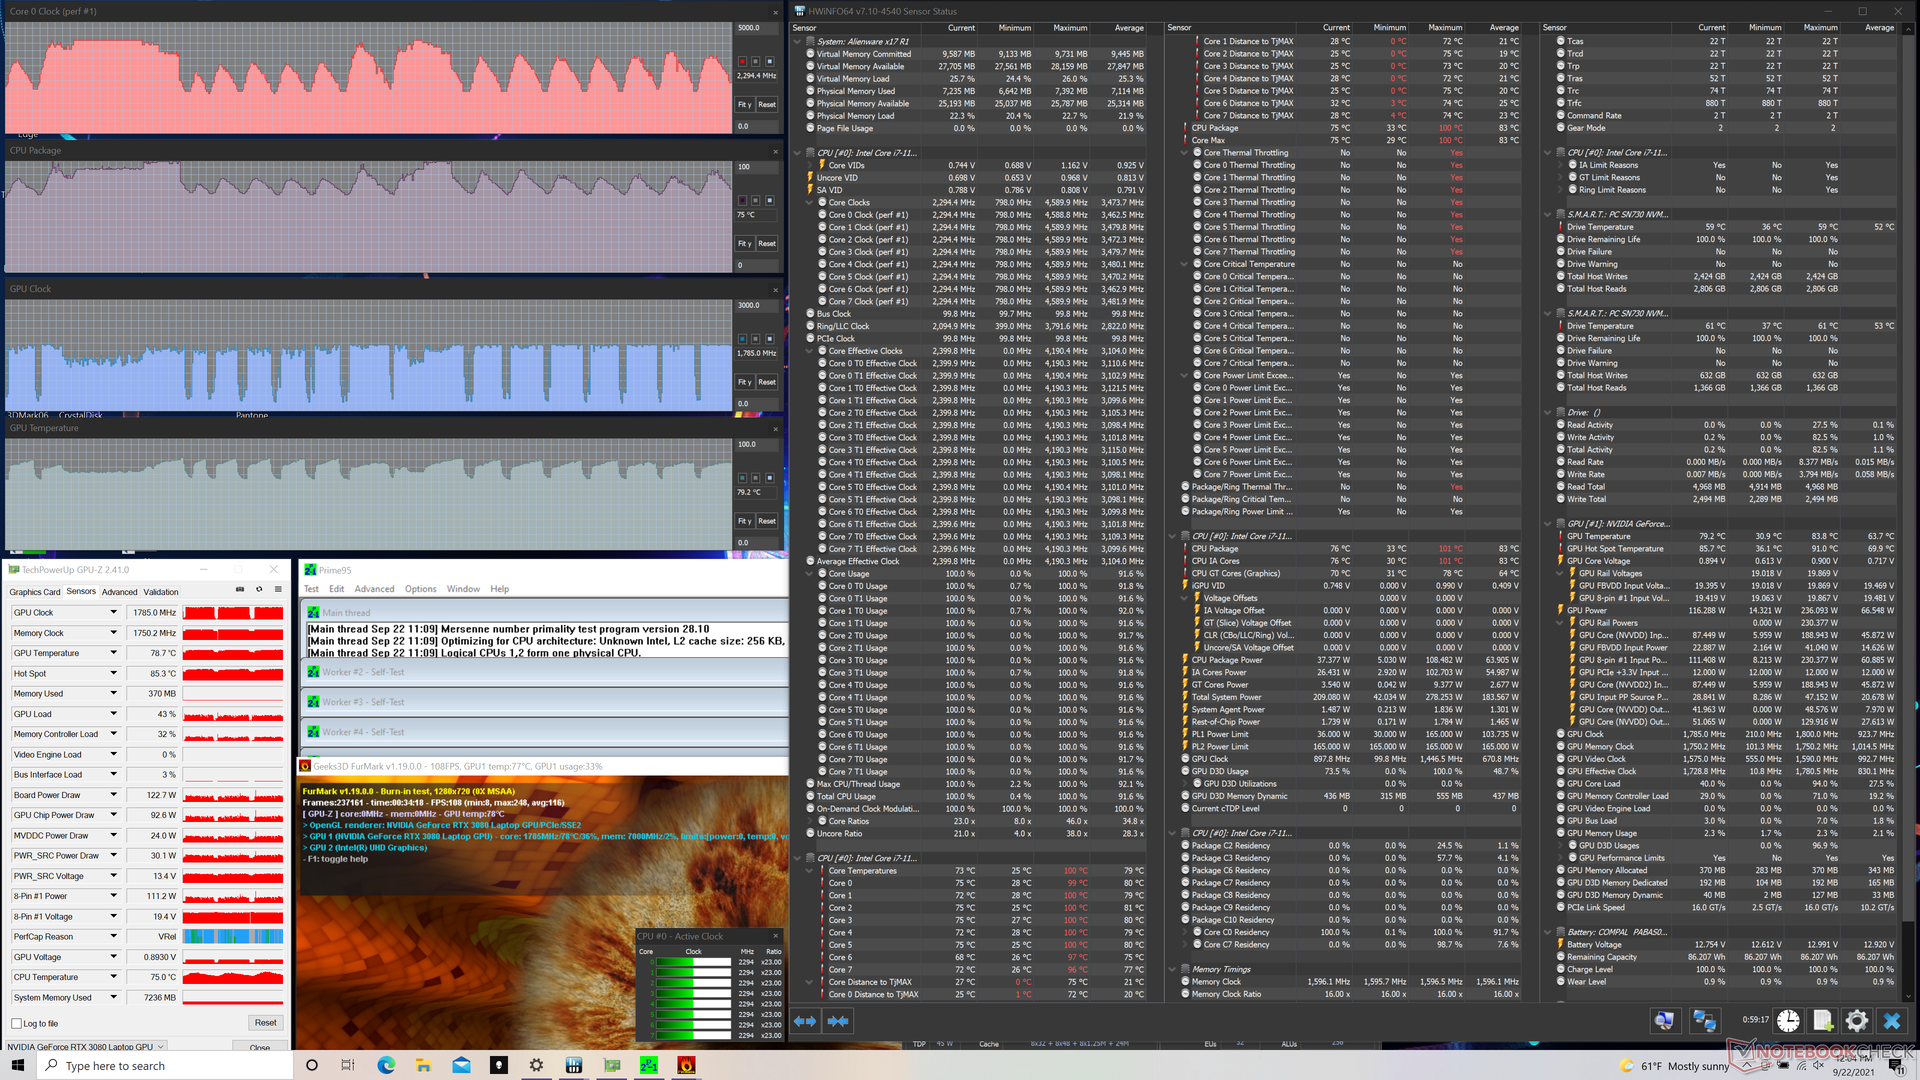
Stresstest
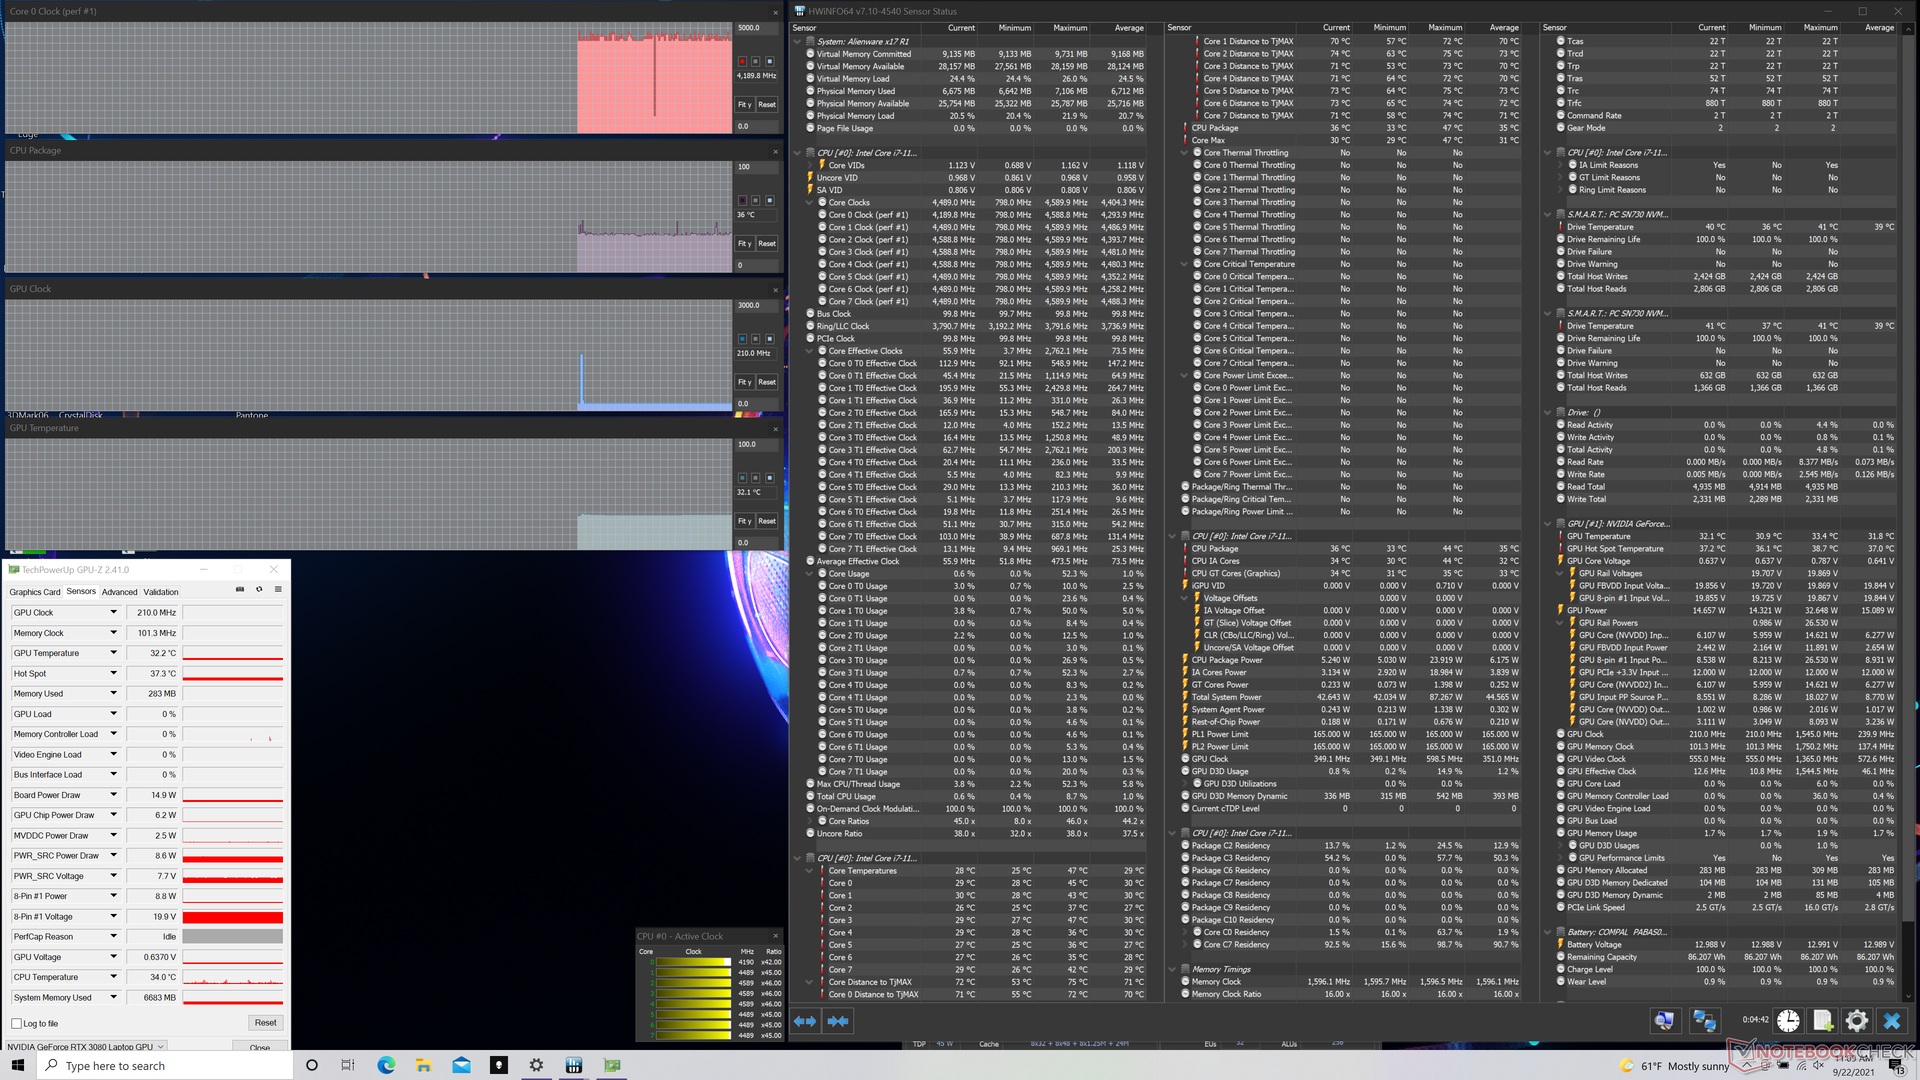
Onder stress met Prime95, cycli CPU kloksnelheden en temperatuur tussen 3,8 GHz tot 4,2 GHz en 85 C tot 100 C om de paar minuten, wat over het algemeen zeer hoge waarden zijn. Ter vergelijking, de Razer Blade 17 wordt geleverd met exact dezelfde Core i7-11800H processor en toch zou deze stabiliseren op slechts 2,8 GHz en 78 C wanneer deze wordt onderworpen aan dezelfde omstandigheden. Zowel CPU als GPU kloksnelheden zullen afnemen wanneer beide op 100% gebruik zijn via Prime95 en FurMark.
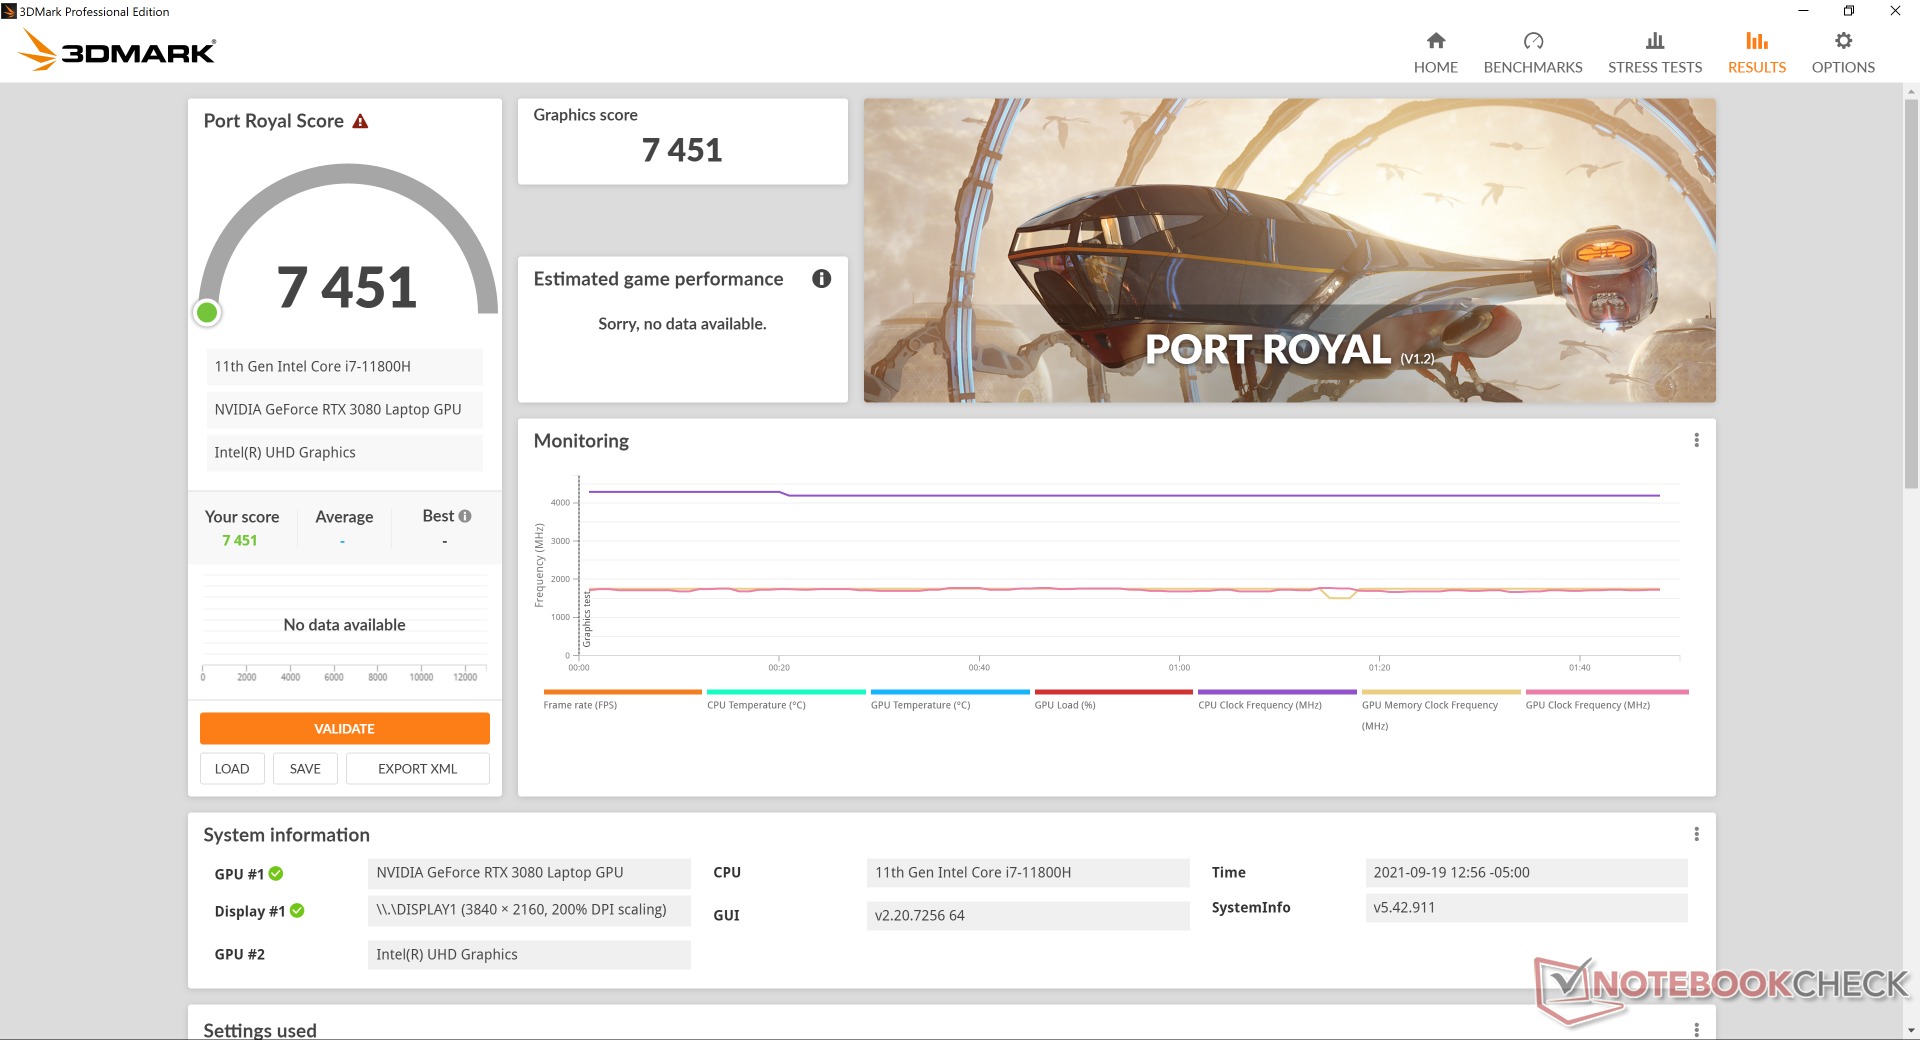
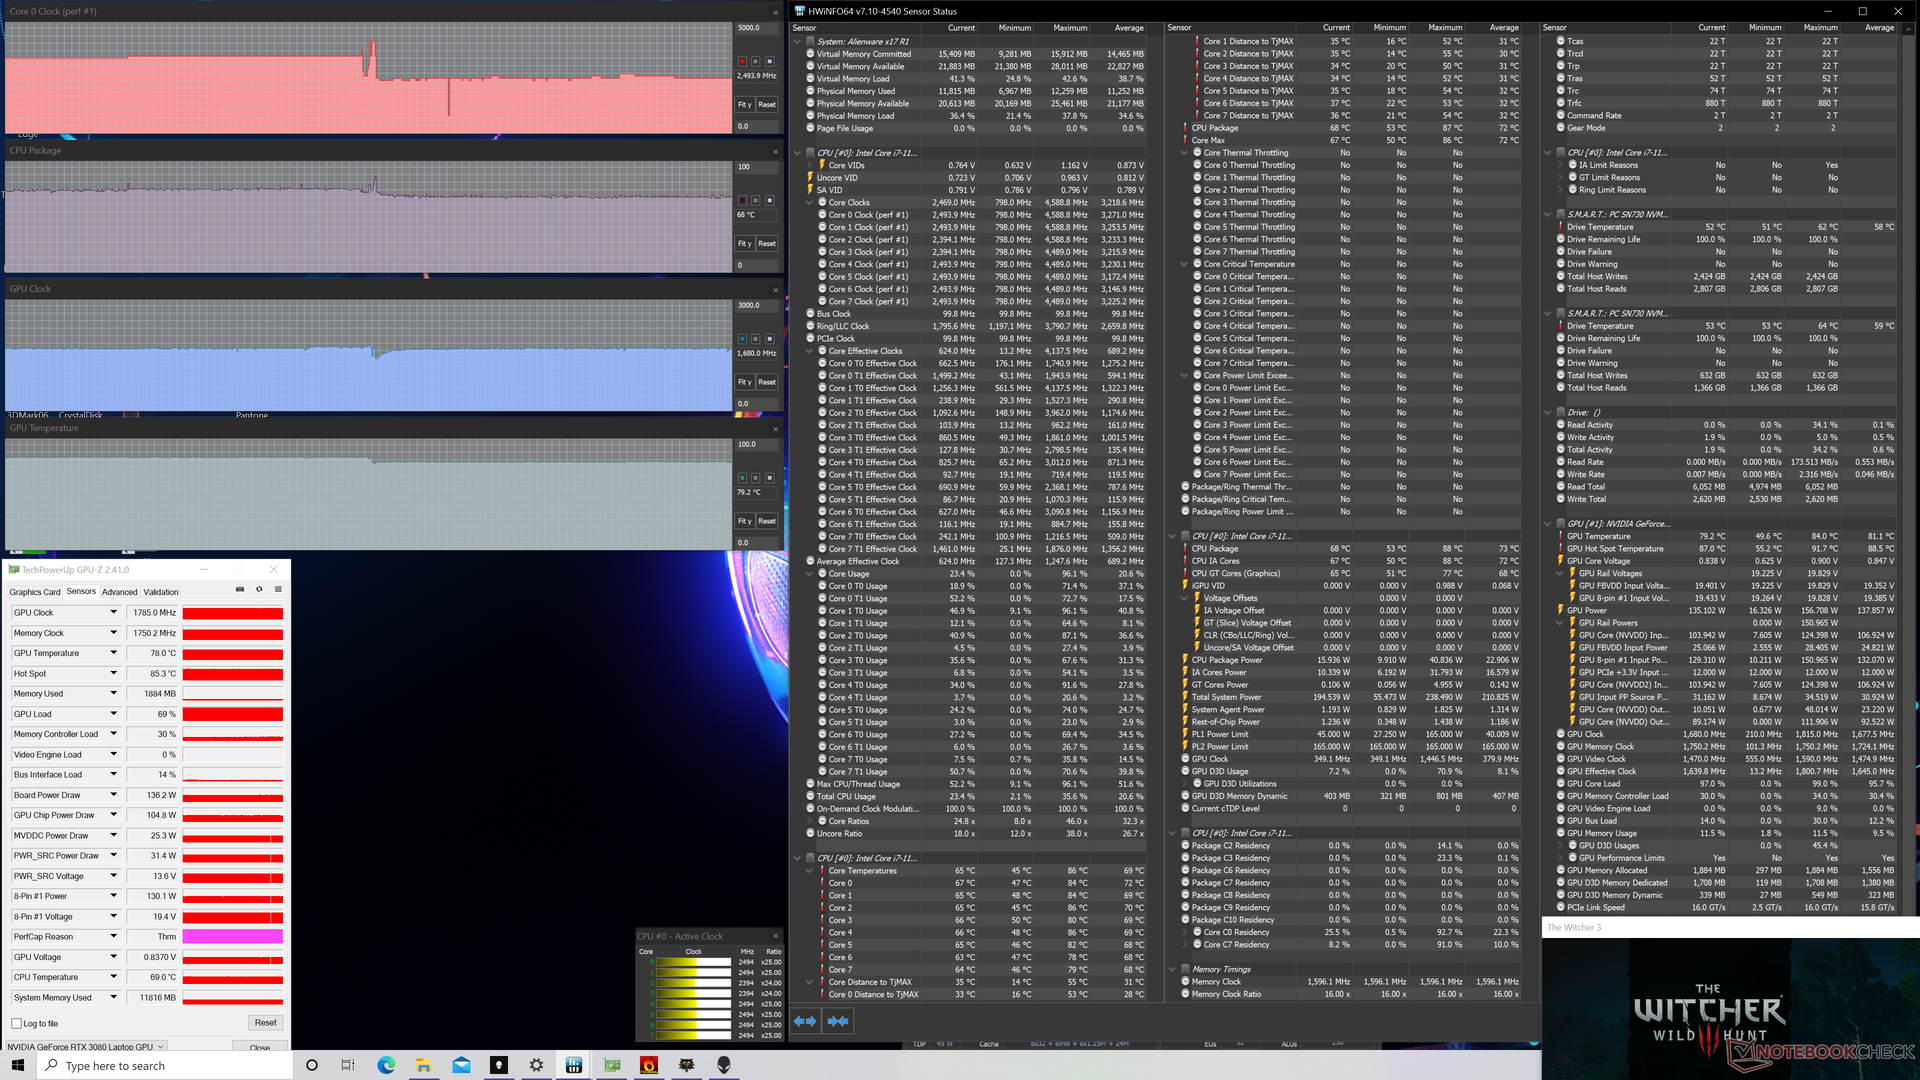
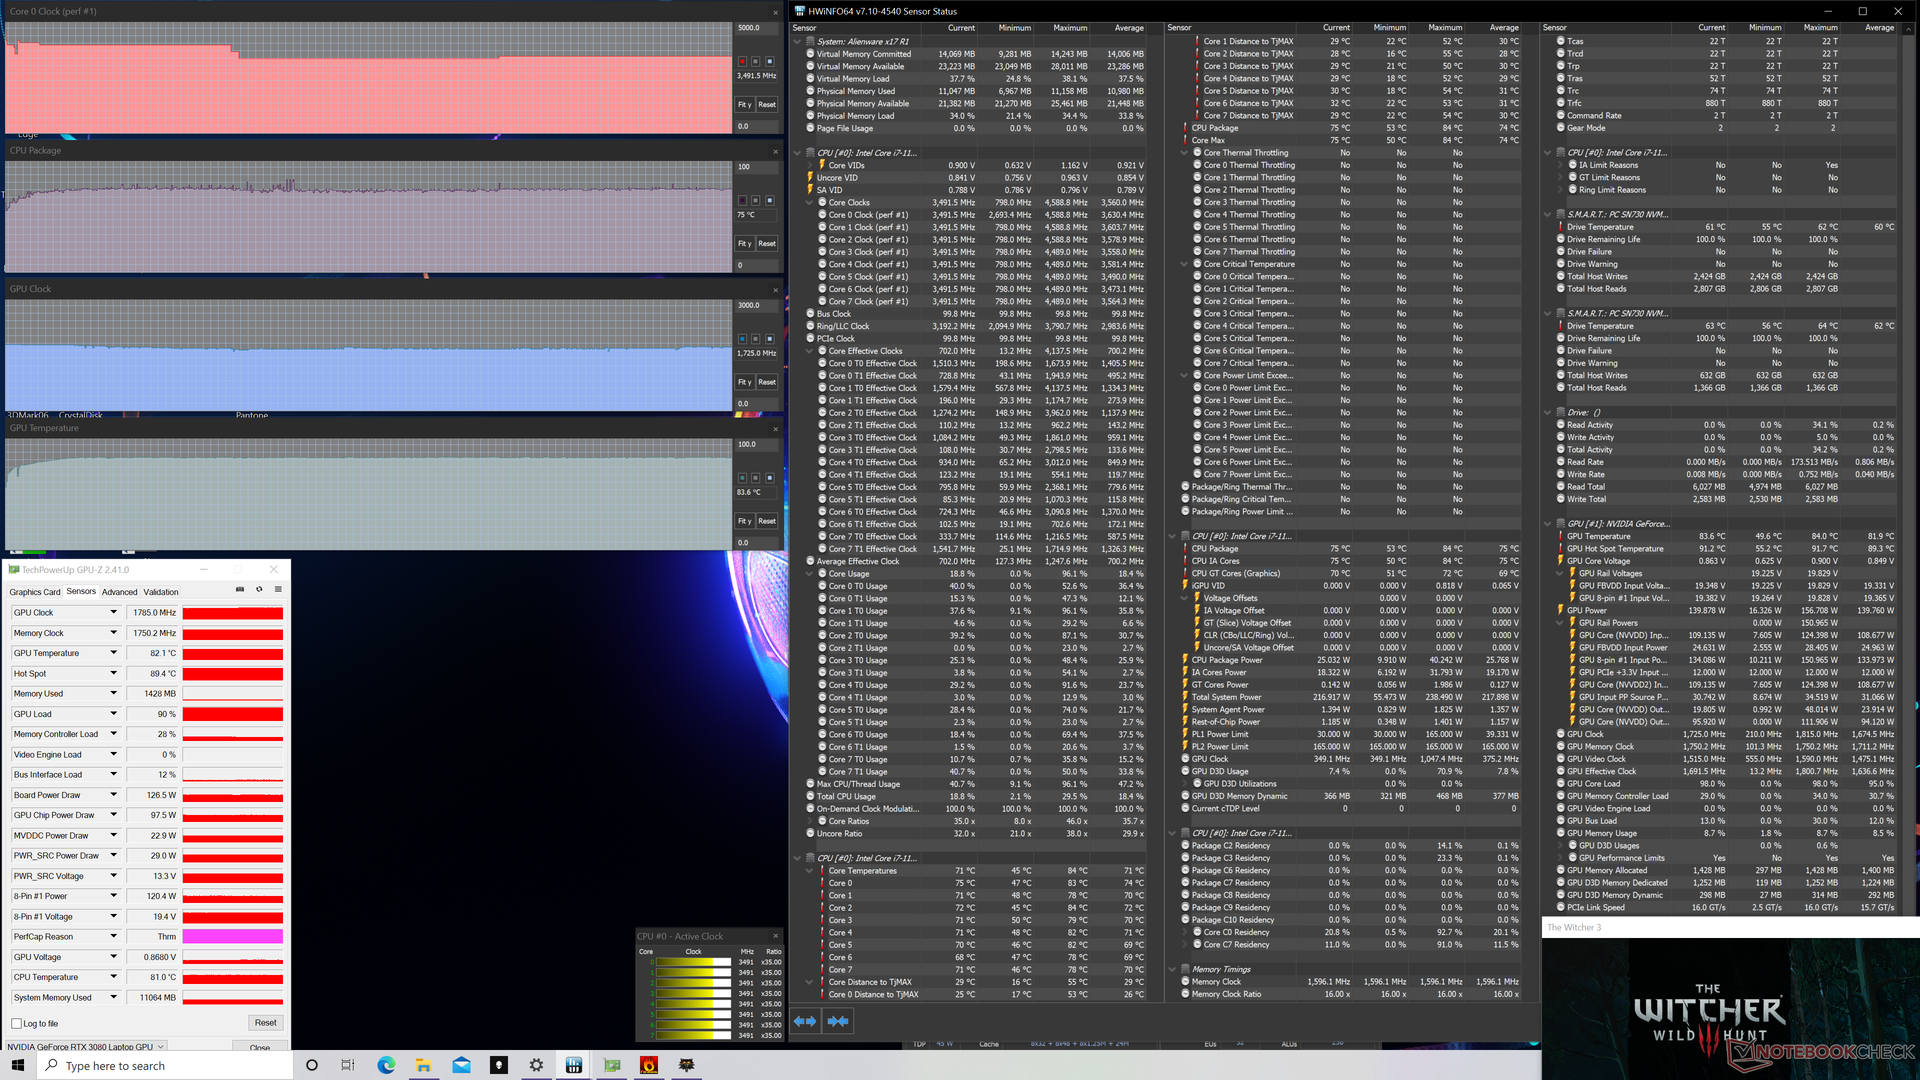
Het draaien van Witcher 3 in de modus Hoge prestaties stabiliseren de CPU en GPU zich op respectievelijk 3,5 GHz en 1785 MHz, met een constante GPU-voeding van ongeveer 145 W. In de modus Gebalanceerd daalt de CPU-kloksnelheid naar slechts 2,5 GHz, terwijl de GPU-kloksnelheid iets daalt naar 1680 MHz en een voeding van ~135 W. Als u gamet en het maximale uit uw laptop wilt halen, moet u de modus Hoge prestaties inschakelen via de Alienware-software. De GPU kloksnelheden zijn in beide gevallen sneller dan verwacht in vergelijking met de meeste andere laptops met dezelfde GPU zoals de Maingear Vector Pro.
Draaien op batterijvoeding zal de grafische prestaties beperken. Een Fire Strike test op batterijen zou een Physics en Graphics score opleveren van respectievelijk 24602 en 13281 punten, vergeleken met 22907 en 29194 punten op netstroom.
| CPUklok (GHz) GPUklok (MHz) GemiddeldeCPU temperatuur (°C) GemiddeldeGPU temperatuur (°C) |
| Systeem in ruststand |
| Prime95 Stress (Hoge prestatie modus) 3.8 - 4.2 85 - 100 55 |
| Prime95 + FurMark Stress(hoge prestatie-modus) |
| Witcher 3 Stress (Uitgebalanceerde modus) |
| Witcher 3 Stress (Hoge prestatie-modus) |
Sprekers


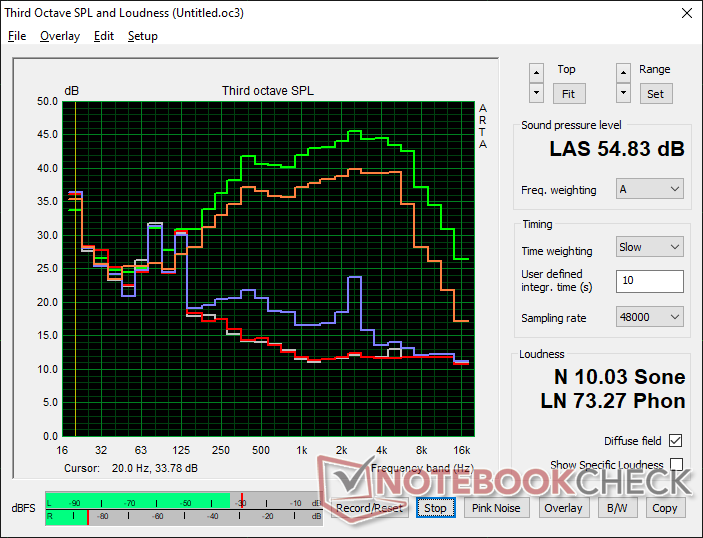
Alienware x17 RTX 3080 P48E audioanalyse
(+) | luidsprekers kunnen relatief luid spelen (88 dB)
Bas 100 - 315 Hz
(-) | bijna geen lage tonen - gemiddeld 23% lager dan de mediaan
(±) | lineariteit van de lage tonen is gemiddeld (9.8% delta ten opzichte van de vorige frequentie)
Midden 400 - 2000 Hz
(+) | evenwichtige middens - slechts 2.7% verwijderd van de mediaan
(+) | de middentonen zijn lineair (4% delta ten opzichte van de vorige frequentie)
Hoog 2 - 16 kHz
(+) | evenwichtige hoogtepunten - slechts 4.4% verwijderd van de mediaan
(±) | lineariteit van de hoogtepunten is gemiddeld (7% delta ten opzichte van de vorige frequentie)
Algemeen 100 - 16.000 Hz
(±) | lineariteit van het totale geluid is gemiddeld (17.3% verschil met de mediaan)
Vergeleken met dezelfde klasse
» 47% van alle geteste apparaten in deze klasse waren beter, 12% vergelijkbaar, 41% slechter
» De beste had een delta van 6%, het gemiddelde was 18%, de slechtste was 132%
Vergeleken met alle geteste toestellen
» 32% van alle geteste apparaten waren beter, 8% gelijk, 59% slechter
» De beste had een delta van 4%, het gemiddelde was 24%, de slechtste was 134%
Apple MacBook 12 (Early 2016) 1.1 GHz audioanalyse
(+) | luidsprekers kunnen relatief luid spelen (83.6 dB)
Bas 100 - 315 Hz
(±) | verminderde zeebaars - gemiddeld 11.3% lager dan de mediaan
(±) | lineariteit van de lage tonen is gemiddeld (14.2% delta ten opzichte van de vorige frequentie)
Midden 400 - 2000 Hz
(+) | evenwichtige middens - slechts 2.4% verwijderd van de mediaan
(+) | de middentonen zijn lineair (5.5% delta ten opzichte van de vorige frequentie)
Hoog 2 - 16 kHz
(+) | evenwichtige hoogtepunten - slechts 2% verwijderd van de mediaan
(+) | de hoge tonen zijn lineair (4.5% delta naar de vorige frequentie)
Algemeen 100 - 16.000 Hz
(+) | het totale geluid is lineair (10.2% verschil met de mediaan)
Vergeleken met dezelfde klasse
» 7% van alle geteste apparaten in deze klasse waren beter, 2% vergelijkbaar, 91% slechter
» De beste had een delta van 5%, het gemiddelde was 18%, de slechtste was 53%
Vergeleken met alle geteste toestellen
» 5% van alle geteste apparaten waren beter, 1% gelijk, 94% slechter
» De beste had een delta van 4%, het gemiddelde was 24%, de slechtste was 134%
Energy Management
Energieverbruik - Hoge energierekeningen
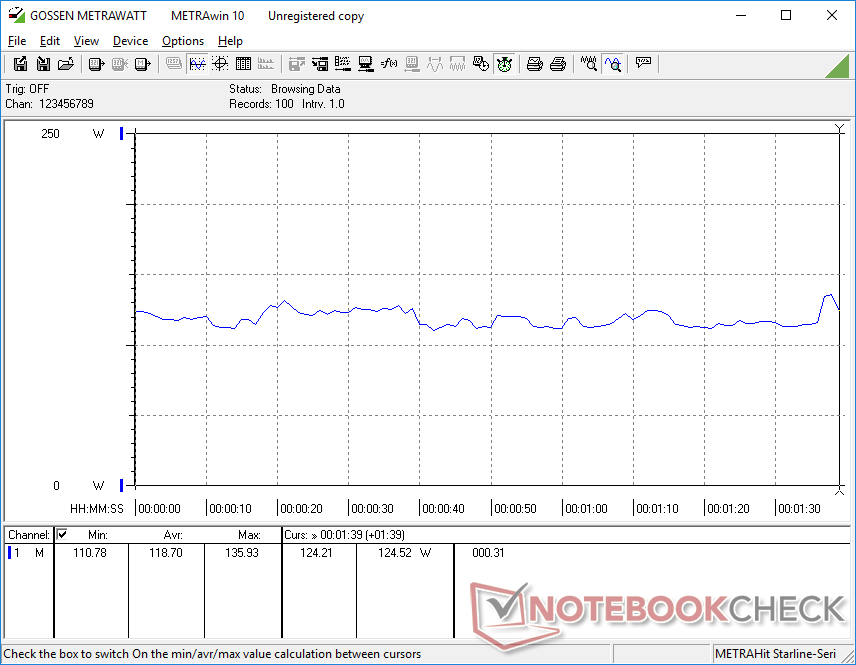
Dell heeft het stroomverbruik van het systeem bij lage belasting verbeterd in vergelijking met de m17 R4, wat de langere batterijlevensduur in ons volgende deel kan verklaren. Ons systeem trok slechts 10 W wanneer het stationair draaide op de desktop bij de minimale helderheidsinstelling, wat 4x efficiënter is dan wat we registreerden op de m17 R4 van vorig jaar.
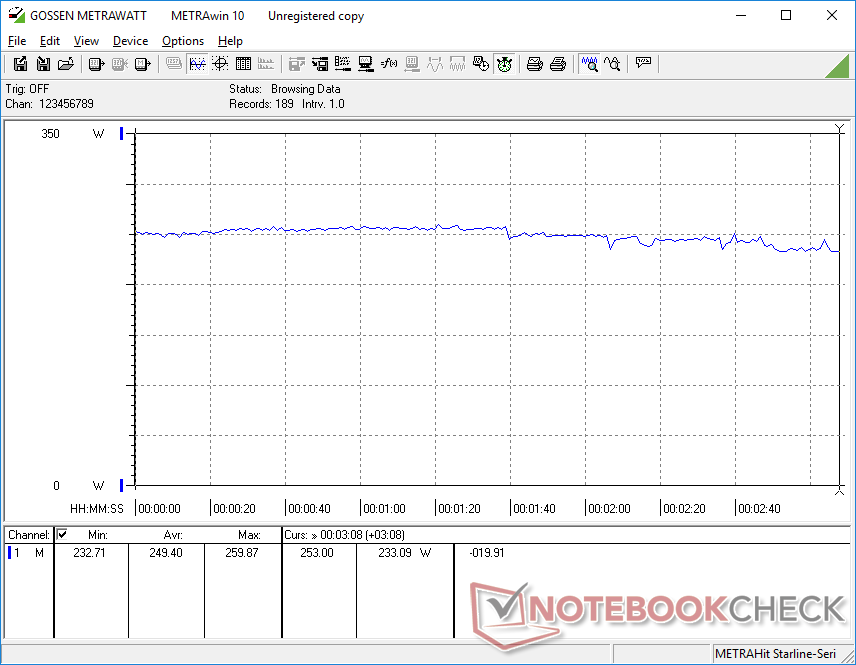
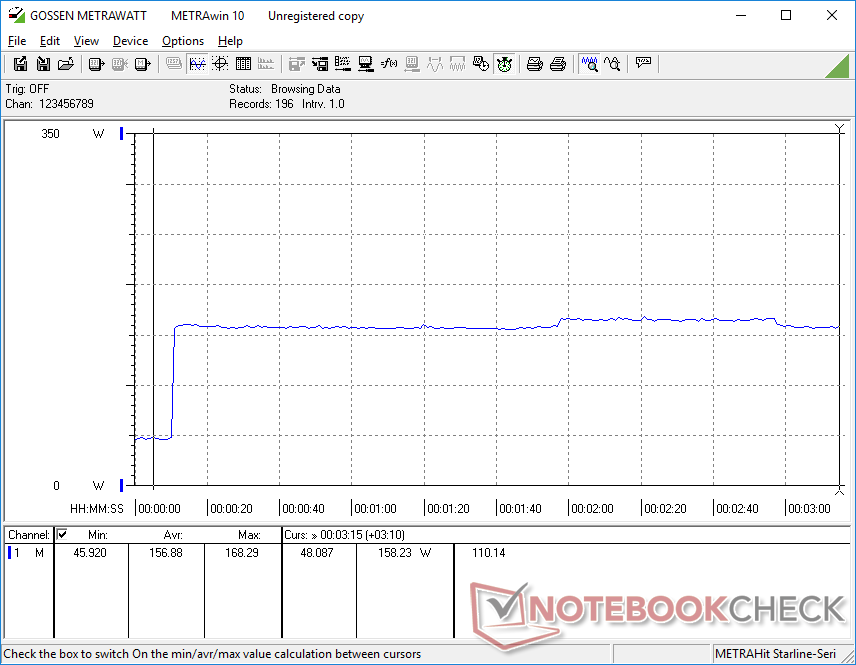
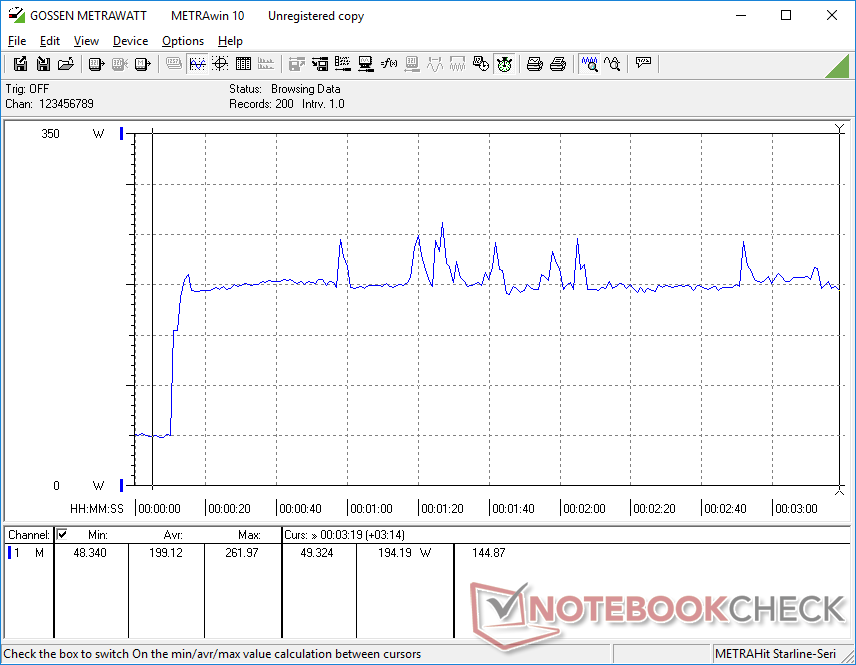
Het stroomverbruik tijdens gamen blijft hoger dan normaal, net als bij de m17 serie. Het draaien van Witcher 3 zou een gemiddelde van 249 W verbruiken, vergeleken met slechts 195 W of 156 W op respectievelijk de Asus ROG Zephyrus S17 of MSI GS76. De hogere CPU TDP en GPU TGP doelen van het Alienware systeem zijn waarschijnlijk verantwoordelijk voor zijn hogere energiebehoefte.
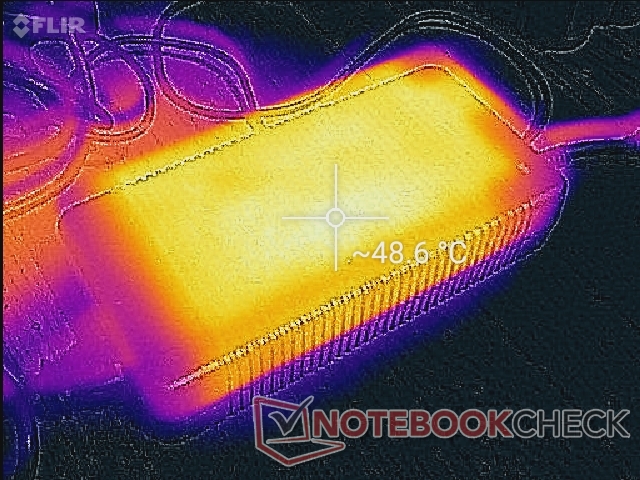
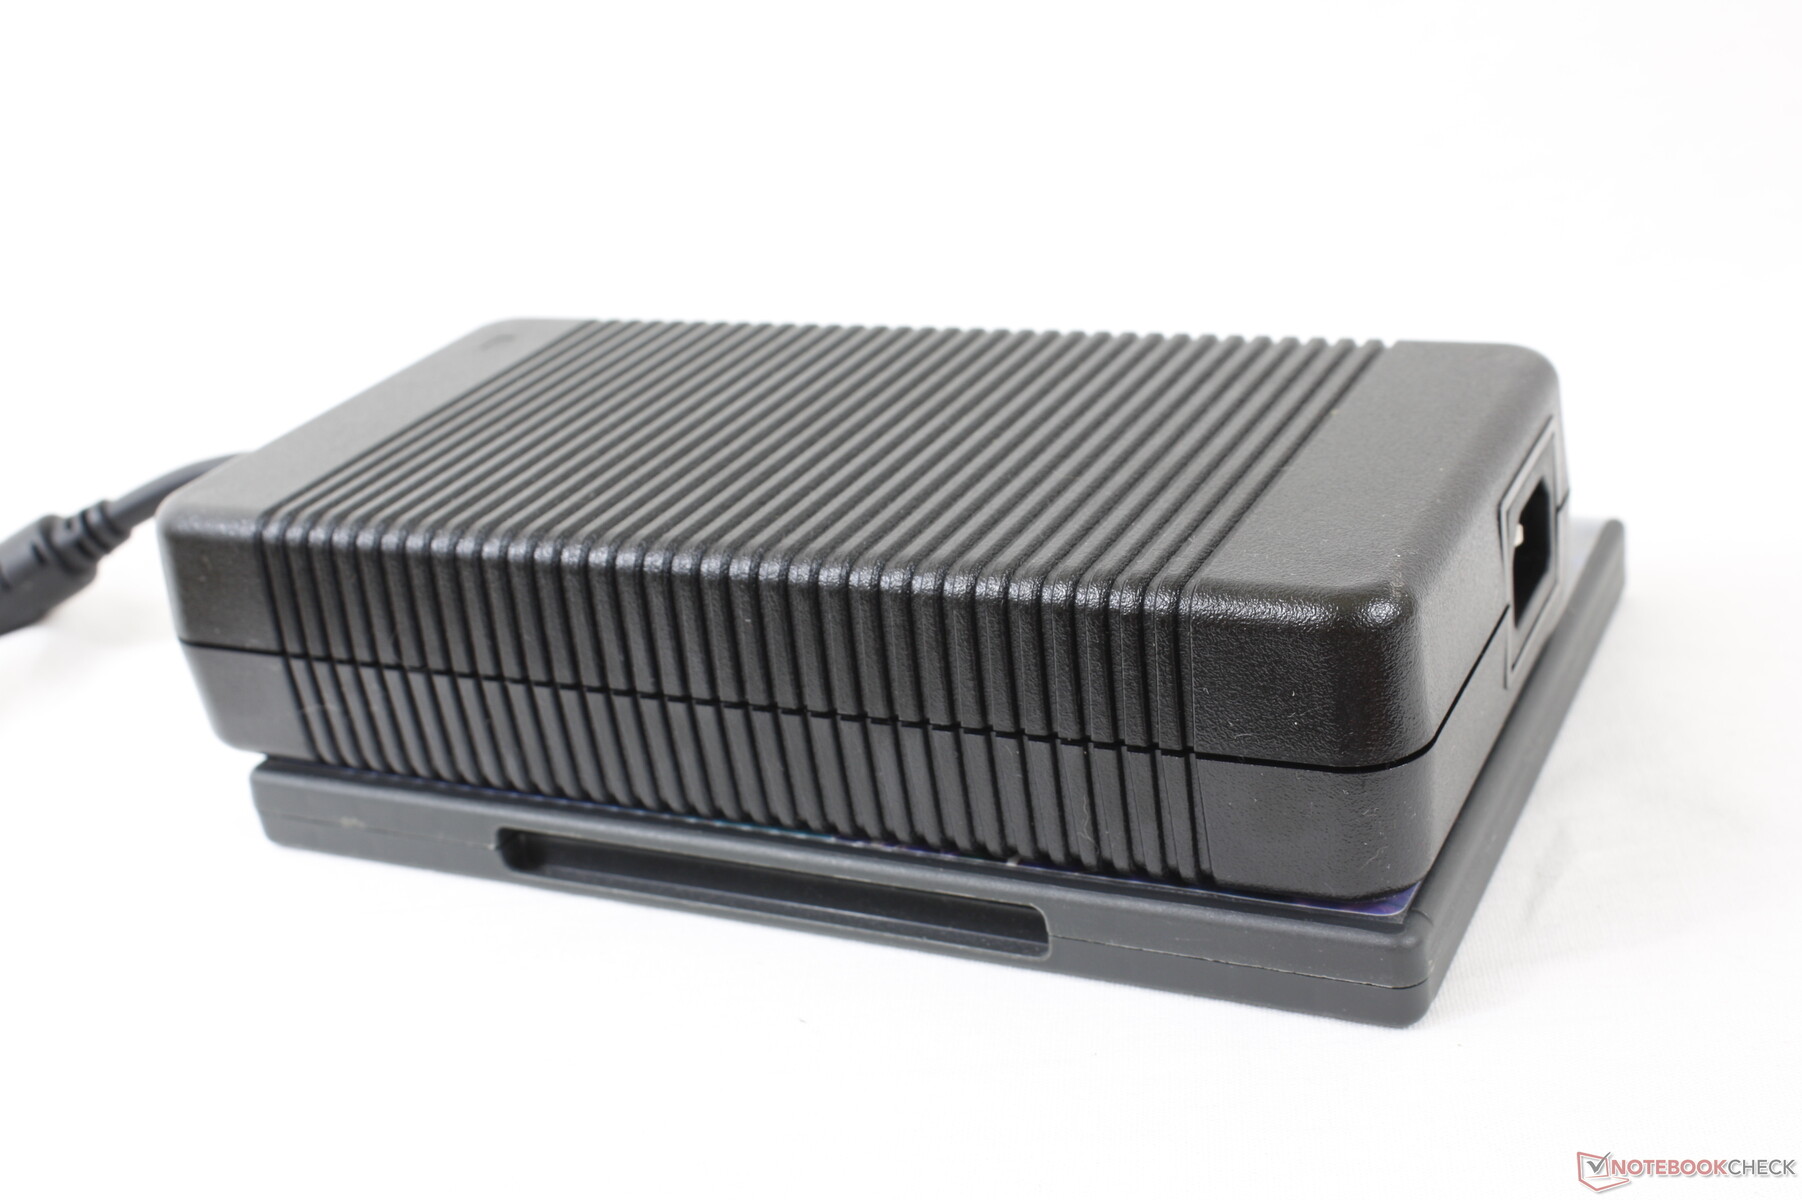
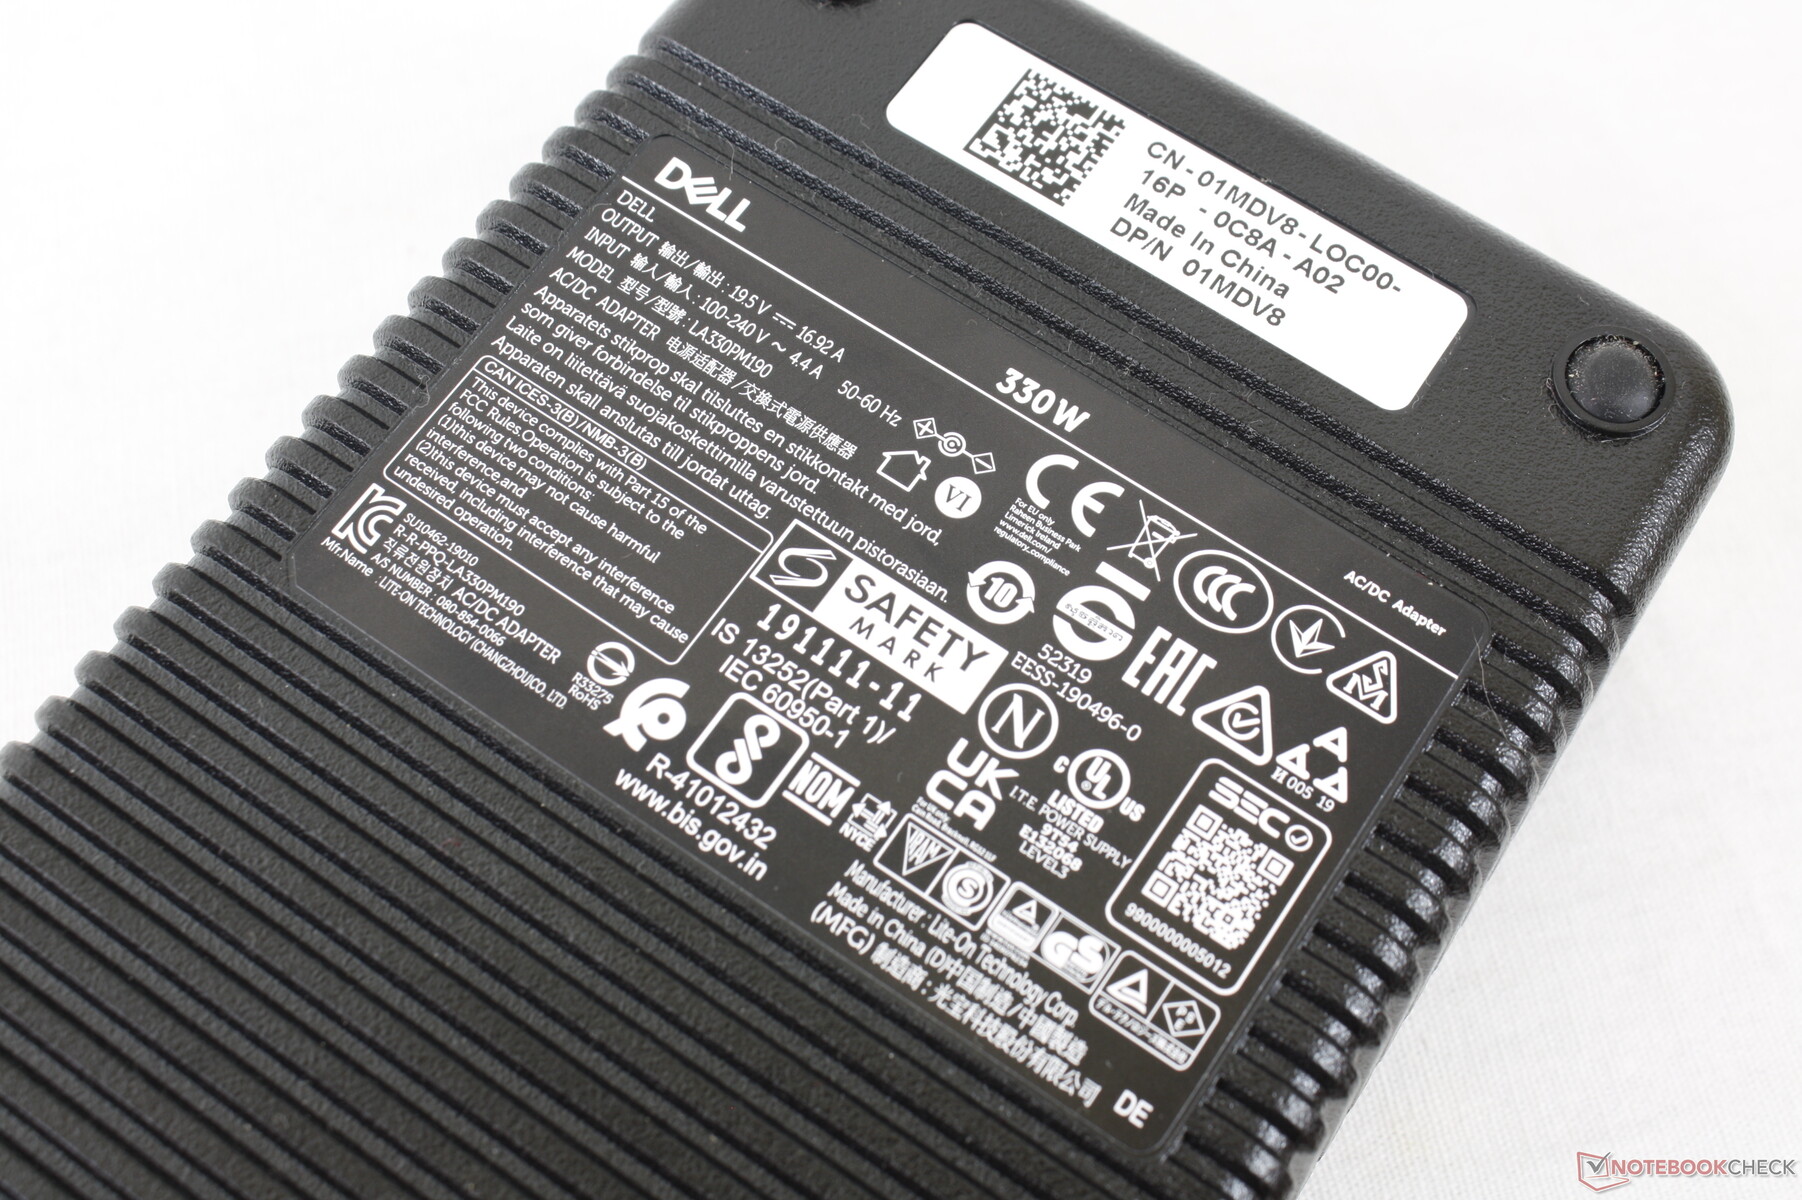
Onze testeenheid wordt geleverd met een grote en zware (~20 x 9,9 x 4,3 cm, 1,5 kg) 330 W wisselstroomadapter, vergeleken met de kleinere 280 W of 230 W wisselstroomadapters van de ROG Zephyrus S17 of Razer Blade 17, respectievelijk. We vermoeden dat de oversized AC adapter is om de eerder genoemde hogere TDP en TGP doelen van het systeem beter te ondersteunen, evenals de oplaadsnelheid van de batterij tijdens het gamen. Dell biedt een kleinere 240 W AC-adapter voor de mindere RTX 3060 SKU's.
| Uit / Standby | |
| Inactief | |
| Belasting |
|
Key:
min: | |
| Alienware x17 RTX 3080 P48E i7-11800H, GeForce RTX 3080 Laptop GPU, 2x WDC PC SN730 SDBPNTY-1T00 (RAID 0), IPS, 3840x2160, 17.3" | Alienware m17 R4 i9-10980HK, GeForce RTX 3080 Laptop GPU, 2x Micron 2300 512 GB (RAID 0), IPS, 1920x1080, 17.3" | Razer Blade 17 RTX 3070 i7-11800H, GeForce RTX 3070 Laptop GPU, Samsung PM9A1 MZVL21T0HCLR, IPS, 1920x1080, 17.3" | Asus ROG Zephyrus S17 GX703HSD i9-11900H, GeForce RTX 3080 Laptop GPU, Samsung PM9A1 MZVL22T0HBLB, IPS, 2560x1440, 17.3" | MSI GS76 Stealth 11UH i9-11900H, GeForce RTX 3080 Laptop GPU, Samsung PM9A1 MZVL22T0HBLB, IPS, 3840x2160, 17.3" | Gigabyte Aero 17 HDR YD i9-11980HK, GeForce RTX 3080 Laptop GPU, Samsung PM9A1 MZVL2512HCJQ, IPS, 3840x2160, 17.3" | |
|---|---|---|---|---|---|---|
| Power Consumption | -80% | -11% | -10% | 13% | -20% | |
| Idle Minimum * (Watt) | 10.2 | 42 -312% | 20.9 -105% | 21.7 -113% | 14 -37% | 25 -145% |
| Idle Average * (Watt) | 21.2 | 48 -126% | 25.1 -18% | 27 -27% | 19 10% | 28 -32% |
| Idle Maximum * (Watt) | 48.4 | 58 -20% | 45 7% | 33 32% | 31 36% | 40 17% |
| Load Average * (Watt) | 118.7 | 124 -4% | 102 14% | 108 9% | 97 18% | 114 4% |
| Witcher 3 ultra * (Watt) | 249 | 219 12% | 189 24% | 195 22% | 156 37% | 176 29% |
| Load Maximum * (Watt) | 262 | 337 -29% | 234.8 10% | 210 20% | 231 12% | 236 10% |
* ... kleiner is beter
Power Consumption Witcher 3 / Stresstest
Batterijlevensduur - niet slecht voor het formaat
De runtimes waren verschrikkelijk op de vorige generatie m17-serie, zelfs wanneer alle prestatie-instellingen op minimum waren ingesteld. Gelukkig is de batterijduur op de x17 aanzienlijk verbeterd zonder dat de batterijcapaciteit omhoog hoefde. Gebruikers kunnen nu iets minder dan 6 uur real-world WLAN gebruik verwachten, vergeleken met ~2,5 uur op de m17 R4, wat fatsoenlijk is voor een high-performance gaming laptop. De resultaten zijn over het algemeen vergelijkbaar met de MSI GS76 of Gigabyte Aero 17 die worden geleverd met grotere 99 Wh batterijen.
Het opladen van leeg naar vol is zeer snel met ongeveer 75 minuten met de meegeleverde AC adapter.
| Alienware x17 RTX 3080 P48E i7-11800H, GeForce RTX 3080 Laptop GPU, 87 Wh | Alienware m17 R4 i9-10980HK, GeForce RTX 3080 Laptop GPU, 86 Wh | Razer Blade 17 RTX 3070 i7-11800H, GeForce RTX 3070 Laptop GPU, 70 Wh | Asus ROG Zephyrus S17 GX703HSD i9-11900H, GeForce RTX 3080 Laptop GPU, 90 Wh | MSI GS76 Stealth 11UH i9-11900H, GeForce RTX 3080 Laptop GPU, 99.9 Wh | Gigabyte Aero 17 HDR YD i9-11980HK, GeForce RTX 3080 Laptop GPU, 99 Wh | |
|---|---|---|---|---|---|---|
| Batterijduur | -5% | 24% | 133% | 37% | 23% | |
| Reader / Idle (h) | 7 | 6.7 -4% | 9.9 41% | |||
| WiFi v1.3 (h) | 5.9 | 2.4 -59% | 5.2 -12% | 7.5 27% | 6.4 8% | 5.6 -5% |
| Load (h) | 0.8 | 1.2 50% | 1.5 88% | 2.7 238% | 1.3 63% | 1.2 50% |
| Witcher 3 ultra (h) | 1 |
Pro
Contra
Verdict - Groter en zwaarder om de juiste redenen
De meest overtuigende eigenschappen van de Alienware x17 zijn de processorprestaties en de CherryMX mechanische toetsen. De Core i7-11800H CPU hier loopt merkbaar sneller dan op andere laptops uitgerust met exact dezelfde chip, terwijl de klikkende mechanische toetsen behoren tot de meest comfortabele die we hebben gebruikt op een gaming laptop.
Dell's Alienware x17 is niet bang om de prestaties te maximaliseren, zelfs als dat betekent dat hij iets groter en zwaarder is dan de rest.
Al die prestaties gaan ten koste van de kerntemperatuur, het stroomverbruik, de afmetingen en het gewicht, zoals alternatieve modellen als deRazer Blade 17,MSI GS76 Stealth, of Asus ROG Zephyrus S17 zijn allemaal kleiner, lichter en energiezuiniger, terwijl ze vergelijkbare Intel- en Nvidia-opties bieden. Deze systemen hebben echter de neiging iets langzamer te werken, dus het is aan gebruikers om de prestaties af te wegen tegen hun persoonlijke voorkeuren voor draagbaarheid. Als je tevreden bent met RTX 3060-prestaties, dan zijn de lichtere Razer of MSI misschien de betere optie, terwijl RTX 3080-prestatiejagers veel meer kunnen halen uit de Alienware x17 en zijn relatief grotere koelsysteem.
Prijs en beschikbaarheid
Verschillende configuraties van de Alienware x17 R1 zijn nu verkrijgbaar bij Best Buy en Newegg vanaf $2399 USD op het moment van schrijven. Als alternatief kunnen gebruikers rechtstreeks bestellen bij Dell die uiteraard meer SKU's en opties zal hebben.
Alienware x17 RTX 3080 P48E
- 24-09-2021 v7 (old)
Allen Ngo
Price comparison

