Testrapporten voor de Intel Core i7-1280P processor
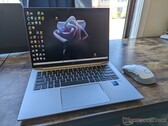
HP EliteBook 840 G9 laptop review: Het Lenovo ThinkPad X1 Carbon alternatief
In tegenstelling tot de meeste andere zakelijke subnotebooks komt de EliteBook 840/845 G9 met Intel vPro en AMD PRO opties om fans aan beide kanten van het hek aan te spreken. Na een recente review van de high-end Ryzen 9 PRO 6950HS AMD SKU, kunnen we het nu eindelijk vergelijken met de high-end Intel Core i7-1280P optie.
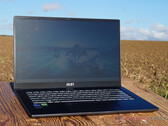
Intel Core i7-1280P, Iris Xe G7 96EUs, 14", 1.5 kgMSI Prestige 15 laptop review: Oogverblindende 4K-beeldkwaliteit, solide prestaties
MSI's Creator notebook combineert uitstekende beeldwaarden met een efficiënte en krachtige processor en een aparte grafische chip met geïmplementeerde ray tracing. De combinatie lijkt bijzonder geschikt voor beeldbewerking/verwerking op een hoger niveau
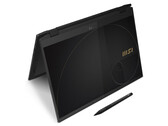
Intel Core i7-1280P, NVIDIA GeForce RTX 3050 Ti Laptop GPU, 15.6", 1.8 kgMSI Summit E16 Flip review: 2-in-1 laptop met pen, 16:10 scherm en RTX 3050 Ti
De Summit E16 Flip biedt een 16-inch touchscreen display in het meer kantoorvriendelijke 16:10 formaat, Thunderbolt 4, en een speciale GeForce RTX 3050 Ti Laptop GPU. Het touchscreen kan worden bediend met vingers of de meegeleverde MSI-invoerpen.
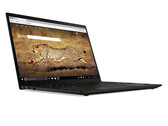
Intel Core i7-1280P, NVIDIA GeForce RTX 3050 Ti Laptop GPU, 16", 1.9 kgLenovo Yoga Slim 9i review: Ongetwijfeld de snelste Evo-laptop
Intel's Core i7-1280P maakt de Lenovo Yoga Slim 9i de vermoedelijk snelste ultrabook van dit moment. Dankzij het 3K 90 Hz OLED-scherm, de lage emissies en de hoogwaardige quad-speakers krijg je een stevige en vernuftige laptop.
Intel Core i7-1280P, Iris Xe G7 96EUs, 14", 1.4 kgLenovo ThinkPad X1 Nano Gen 2 review: Kleinste X1 laptop ooit
450 nits, volledige sRGB-kleuren, 16:10 beeldverhouding, 5G Sub 6 WAN, en 12e generatie Core P CPU allemaal in een systeem dat lichter is dan 1 kg. Kun je echt al deze functies in een kleine 13-inch form factor passen zonder te bezuinigen?
Intel Core i7-1280P, Iris Xe G7 96EUs, 13", 958 gDell XPS 13 Plus 9320 i7-1280P OLED: Intel Iris Xe Graphics G7 96EUs, 13.40", 1.3 kg
Testrapport » Alle drie de Dell XPS 13 Plus 9320 SKU's onder de loep: Core i5-1240P, i7-1260P, of i7-1280P OLED?
Getac B360 G2: Intel Iris Xe Graphics G7 96EUs, 13.30", 2.3 kg
Extern testrapport » Getac B360 G2
MSI Prestige 13 Evo A12M: Intel Iris Xe Graphics G7 96EUs, 13.30", 1 kg
Extern testrapport » MSI Prestige 13 Evo A12M
Lenovo ThinkPad P16s G1, i7-1280P: NVIDIA T550 Laptop GPU, 16.00", 1.7 kg
Extern testrapport » Lenovo ThinkPad P16s G1, i7-1280P
HP EliteBook 840 G9: Intel Iris Xe Graphics G7 96EUs, 14.00", 1.5 kg
Extern testrapport » HP EliteBook 840 G9
MSI Summit E13 Flip Evo A12MT-059RU: Intel Iris Xe Graphics G7 96EUs, 13.40", 1.4 kg
Extern testrapport » MSI Summit E13 Flip Evo A12MT-059RU
MSI Prestige 14 Evo A12M-248RU: Intel Iris Xe Graphics G7 96EUs, 14.00", 1.3 kg
Extern testrapport » MSI Prestige 14 Evo A12M-248RU
Lenovo Yoga 9 14IAP7-82LU007FGE: Intel Iris Xe Graphics G7 96EUs, 14.00", 1.4 kg
Extern testrapport » Lenovo Yoga 9 14IAP7-82LU007FGE
Lenovo ThinkPad X1 Nano Gen 2 Core i7-1280P: Intel Iris Xe Graphics G7 96EUs, 13.00", 1 kg
Extern testrapport » Lenovo ThinkPad X1 Nano Gen 2 Core i7-1280P
MSI Summit E16 Flip Evo A12MT: Intel Iris Xe Graphics G7 96EUs, 16.00", 1.9 kg
Extern testrapport » MSI Summit E16 Flip Evo A12MT
Lenovo Yoga Slim 9 14IAP7: Intel Iris Xe Graphics G7 96EUs, 14.00", 1.4 kg
Extern testrapport » Lenovo Yoga Slim 9 14IAP7
MSI Summit E13 Flip Evo A12MT-023: Intel Iris Xe Graphics G7 96EUs, 13.40", 1.4 kg
Extern testrapport » MSI Summit E13 Flip Evo A12MT-023
MSI Prestige 14 A12SC-086CA: NVIDIA GeForce GTX 1650 Mobile, 14.00", 1.6 kg
Extern testrapport » MSI Prestige 14 A12SC-086CA
MSI Stealth 17M A12UE: NVIDIA GeForce RTX 3060 Laptop GPU, 17.30", 2.2 kg
Extern testrapport » MSI Stealth 17M A12UE
MSI Prestige 14 Evo A12M-089: Intel Iris Xe Graphics G7 96EUs, 14.00", 1.3 kg
Extern testrapport » MSI Prestige 14 Evo A12M-089
MSI Summit E16 Flip A12UDT-031: NVIDIA GeForce RTX 3050 Ti Laptop GPU, 16.00", 1.9 kg
Extern testrapport » MSI Summit E16 Flip A12UDT-031
MSI Prestige 15 A12UD-049ES: NVIDIA GeForce RTX 3050 Ti Laptop GPU, 15.60", 1.7 kg
Extern testrapport » MSI Prestige 15 A12UD-049ES
Dell XPS 13 Plus 9320 i7-1280P FHD: Intel Iris Xe Graphics G7 96EUs, 13.40", 1.3 kg
Extern testrapport » Dell XPS 13 Plus 9320 i7-1280P FHD
Dell XPS 13 Plus 9320 i7-1280P OLED: Intel Iris Xe Graphics G7 96EUs, 13.40", 1.3 kg
Extern testrapport » Dell XPS 13 Plus 9320 i7-1280P OLED
MSI Prestige 14 A12UC, i7-1280P: NVIDIA GeForce RTX 3050 4GB Laptop GPU, 14.00", 1.3 kg
Extern testrapport » MSI Prestige 14 A12UC, i7-1280P
MSI Stealth 15M B12UE: NVIDIA GeForce RTX 3060 Laptop GPU, 15.60", 1.9 kg
Extern testrapport » MSI Stealth 15M B12UE
MSI Prestige 15 A12UC: NVIDIA GeForce RTX 3050 4GB Laptop GPU, 15.60", 1.7 kg
Extern testrapport » MSI Prestige 15 A12UC
MSI Prestige 15 A12UD-093: NVIDIA GeForce RTX 3050 Ti Laptop GPU, 15.60", 1.8 kg
Extern testrapport » MSI Prestige 15 A12UD-093
MSI Summit E14 Evo A12M-050: Intel Iris Xe Graphics G7 96EUs, 14.00", 1.6 kg
Extern testrapport » MSI Summit E14 Evo A12M-050