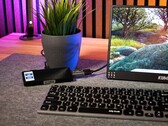
Intel Celeron J4125
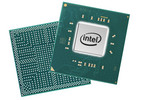
De Intel Celeron J4125 is een quad-core SoC voornamelijk voor goedkope mini-pc's en werd eind 2019 aangekondigd. Hij draait op 2-2,7 GHz (Single Core Burst) en is gebaseerd op het Gemini Lake platform (2019 refresh). Vergeleken met de voorganger biedt de refresh een iets hogere kloksnelheid. Net als de Apollo Lake voorgangers is de chip vervaardigd in een 14 nm proces met FinFET's, maar biedt hij iets betere processorkernen, een verdubbeling van de hoeveelheid L2 cache, een kleiner pakket, een nieuwe generatie monitoruitgangen (Gen 10) en een gedeeltelijk geïntegreerde WiFi-chip. Naast vier CPU-cores bevat de chip ook een DirectX 12 capabele GPU en een DDR4/LPDDR4-geheugencontroller (tweekanaals, tot 2400 MHz). De processor is niet vervangbaar omdat deze direct aan het moederbord wordt gesoldeerd.
De processorarchitectuur wordt nog steeds Goldmont Plus genoemd. Vergeleken met de oudere Goldmont cores in Apollo Lake hebben ze een verhoogde cache van niveau 2 (tot 4 MB). Dat betekent dat de prestaties per klok iets beter zouden moeten zijn, maar niet in de buurt van de Core CPU's zoals Kaby Lake Y.
De CPU-prestaties van de Celeron J4125 zijn in onze tests vergelijkbaar met een mobiele Pentium Silver N5000 (1,1 - 2,7 GHz Quad-Core bij 6W). De prestaties zijn gepositioneerd in het lagere instapniveau van de processoren van 2020. Nog steeds voor basistaken zoals kantoorpakken, zou het browsen met matige multitasking de processorprestaties prima moeten zijn.
De UHD Graphics 600 (Gemini Lake) is gebaseerd op de Gen9-architectuur van Intel, die DirectX 12 ondersteunt en ook wordt gebruikt voor de Kaby Lake / Skylake / Apollo Lake grafische adapters (zoals HD Graphics 520). Uitgerust met 12 EU's en een klok tot 750 MHz, zouden de prestaties ongeveer gelijk moeten zijn aan die van de oudere HD Graphics 500 (Apollo Lake).
De chip bevat ook een geavanceerde video-engine met hardware-ondersteuning voor het afspelen van VP9- en H.265-materiaal (8-bits kleurdiepte).
Net als de voorganger specificeert Intel de TDP met 10 Watt (tegenover 6 Watt voor bijvoorbeeld de mobiele N4120). De chip kan dus in theorie passief gekoeld worden, maar ook SKU's met ventilatoren zijn mogelijk.
Serie Intel Gemini Lake Codenaam Gemini Lake Refresh Serie: Gemini Lake Gemini Lake Refresh Kloksnelheid 2000 - 2700 MHz Level 2 Cache 4 MB Aantal Cores / Threads 4 / 4 Stroomverbruik (TDP = Thermal Design Power) 10 Watt Productietechnologie 14 nm Max. Temperatuur 105 °C Socket BGA1090 Features DDR4-2400/LPDDR4-2400 RAM, PCIe 2, MMX, SSE, SSE2, SSE3, SSSE3, SSE4.1, SSE4.2, VMX, SMEP, SMAP, MPX, EIST, TM1, TM2, Turbo, AES-NI, RDRAND, RDSEED, SHA, SGX GPU Intel UHD Graphics 600 (250 - 750 MHz)64-Bit 64-Bit-ondersteuning Architecture x86 Aankondigingsdatum 04-11-2019 Productlink (extern) ark.intel.com
Benchmarks Performance Rating - CB R15 + R20 + 7-Zip + X265 + Blender + 3DM11 CPU
17.2 pt (28%)
...
Intel Celeron N4100
Intel Core i3-5005U
...
max:
Cinebench R23 - Cinebench R23 Multi Core
min: 860 gem: 1203 mediaan: 1186 (1%) max: 1563 Points
CPU TDP ? TDP 10 W 100% 65%
...
Intel Celeron N4100
Intel Pentium Gold 4425Y
Intel Core i3-5005U
Intel Core m3-7Y32
...
max:
Cinebench R23 - Cinebench R23 Single Core
min: 392 gem: 425.3 mediaan: 438 (19%) max: 446 Points
CPU TDP ? TDP 10 W 100% 93%
...
Intel Celeron N4100
Intel Pentium Gold 4425Y
Intel Core i3-5010U
Intel Core i3-5005U
...
max:
Cinebench R20 - Cinebench R20 CPU (Single Core)
min: 155 gem: 166.2 mediaan: 170 (19%) max: 174 Points
CPU TDP ? TDP 10 W 100% 96%
...
Intel Pentium Gold 4425Y
Intel Celeron N4100
Intel Core i3-5005U
...
max:
Cinebench R20 - Cinebench R20 CPU (Multi Core)
min: 304 gem: 449.2 mediaan: 430 (1%) max: 610 Points
CPU TDP ? TDP 10 W 100% 79%
...
Intel Celeron N4100
Intel Core i3-5005U
Intel Core i3-5010U
...
max:
Cinebench R15 - Cinebench R15 CPU Multi 64 Bit
min: 148 gem: 223.4 mediaan: 243 (2%) max: 271 Points
CPU TDP ? TDP 10 W 100% 70%
...
AMD A10-9600P
Intel Core i3-5015U
Intel Core m5-6Y54
Intel Core i3-5010U
AMD PRO A12-9800B
Intel Core i3-7020U
...
max:
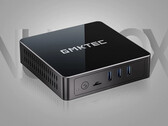
0 15 30 45 60 75 90 105 120 135 150 165 180 195 210 225 240 255 270 Tooltip Higole PC Stick-J4125: Ø148.3 (140.86-153.19)
GMK NucBox 3: Ø203 (171.15-207.16)
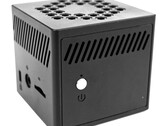
GMK NucBox K1: Ø238 (199.13-242.53)
AC6-M Mini-PC: Ø247 (245.01-250.05)
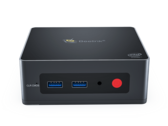
Beelink GK Mini: Ø268 (263.32-271.42)
Cinebench R15 - Cinebench R15 CPU Single 64 Bit
min: 63.1 gem: 72.5 mediaan: 75.3 (22%) max: 79.1 Points
CPU TDP ? TDP 10 W 100% 85%
...
AMD Pro A8-8600B
AMD Pro A10-8700B
AMD PRO A8-9600B
Intel Celeron 3865U
AMD A10-9620P
AMD A10-9600P
...
max:
Cinebench R11.5 - Cinebench R11.5 CPU Multi 64 Bit
min: 2.13 gem: 2.8 mediaan: 3.1 (4%) max: 3.09 Points
CPU TDP ? TDP 10 W 100% 69%
...
Intel Core i3-6100U
Intel Core i5-5250U
Intel Core i5-2520M
Intel Core i3-7100U
...
max:
Cinebench R11.5 - Cinebench R11.5 CPU Single 64 Bit
min: 0.84 gem: 0.9 mediaan: 0.9 (21%) max: 0.92 Points
CPU TDP ? TDP 10 W 100% 97%
...
AMD PRO A8-9600B
Intel Core M-5Y10c
Intel Celeron 3865U
AMD PRO A12-9800B
AMD A10-9600P
Intel Pentium 3825U
...
max:
Cinebench R10 - Cinebench R10 Rend. Single (32bit)
min: 2070 gem: 2159 mediaan: 2112 (13%) max: 2295 punten
CPU TDP ? TDP 10 W 100% 97%
...
AMD Turion II Ultra M600
AMD A8-7410
AMD Turion II P540
Intel Core 2 Duo T5850
Intel Core 2 Duo P7370
AMD Pro A10-8700B
...
max:
Cinebench R10 - Cinebench R10 Rend. Multi (32bit)
min: 4102 gem: 6188 mediaan: 7128 (5%) max: 7335 punten
CPU TDP ? TDP 10 W 100% 57%
...
AMD A8-3510MX
Intel Core i3-2310M
Intel Core i3-370M
Intel Core i7-2657M
Intel Celeron 2970M
...
max:
Cinebench R10 - Cinebench R10 Rend. Multi (64bit)
min: 9697 gem: 10201 mediaan: 10201 (7%) max: 10705 Points
CPU TDP ? TDP 10 W 100% 91%
...
AMD PRO A12-9800B
Intel Core i5-2520M
...
max:
Cinebench R10 - Cinebench R10 Rend. Single (64bit)
min: 3669 gem: 3690 mediaan: 3690 (4%) max: 3711 Points
CPU TDP ? TDP 10 W 100% 99%
...
Intel Core i5-2537M
Intel Core i3-5005U
...
max:
wPrime 2.10 - wPrime 2.0 1024m *
min: 566 gem: 608 mediaan: 603 (7%) max: 654.159 s
CPU TDP ? TDP 10 W 101% 100%
...
AMD Pro A8-8600B
Intel Core i5-5250U
Intel Core i3-380M
Intel Core i5-2415M
...
VIA C3-M C3-M-1200
wPrime 2.10 - wPrime 2.0 32m *
min: 17.3 gem: 18 mediaan: 17.4 (3%) max: 19.42 s
CPU TDP ? TDP 10 W 100% 100%
...
Intel Core i5-5300U
Intel Core i5-6200U
Intel Core i5-6198DU
Intel Core i5-6260U
Intel Core i3-7130U
Intel Core i5-2520M
Intel Core i5-6360U
...
Transmeta Crusoe TM-5800
min: 1019 gem: 1069 mediaan: 1048 (2%) max: 1140 punten
CPU TDP ? TDP 10 W 100% 93%
...
AMD A4-6210
Intel Pentium N3700
Intel Celeron 2957U
AMD E2-7110
Intel Celeron 3865U
Intel Pentium 3558U
Intel Celeron N4100
...
max:
7-Zip 18.03 - 7-Zip 18.03 Multli Thread 4 runs
min: 5694 gem: 7248 mediaan: 7494 (4%) max: 8399 MIPS
CPU TDP ? TDP 10 W 100% 80%
...
Intel Celeron N4100
AMD Ryzen Embedded R1505G
Intel Core i5-5250U
Intel Core i3-6157U
Intel Core i5-8210Y
...
max:
7-Zip 18.03 - 7-Zip 18.03 Single Thread 4 runs
min: 2237 gem: 2358 mediaan: 2369 (28%) max: 2444 MIPS
CPU TDP ? TDP 10 W 100% 96%
...
Intel Core i3-5010U
Intel Celeron N4100
Intel Core i3-5005U
Intel Core i7-6770HQ
AMD Ryzen Embedded R1505G
...
max:
X264 HD Benchmark 4.0 - x264 Pass 2
min: 11.31 gem: 13.7 mediaan: 13.1 (5%) max: 16.75 fps
CPU TDP ? TDP 10 W 100% 93%
...
Intel Celeron N4100
AMD PRO A8-9600B
Intel Core i3-5015U
AMD Pro A8-8600B
Intel Core i3-5010U
Intel Core i7-8500Y
...
max:
X264 HD Benchmark 4.0 - x264 Pass 1
min: 52.6 gem: 64.3 mediaan: 61.4 (14%) max: 78.9 fps
CPU TDP ? TDP 10 W 100% 93%
...
Intel Celeron 2970M
Intel Pentium 3825U
Intel Core m5-6Y54
Intel Celeron N4100
AMD Pro A8-8600B
Intel Core i3-5015U
...
max:
HWBOT x265 Benchmark v2.2 - HWBOT x265 4k Preset
min: 0.95 gem: 1.4 mediaan: 1.5 (3%) max: 1.61 fps
CPU TDP ? TDP 10 W 100% 73%
...
Intel Pentium Gold 4425Y
Intel Celeron N4100
...
max:
0 0.2 0.3 0.5 0.6 0.8 0.9 1.1 1.2 1.4 1.5 1.7 1.8 2 2.1 2.3 2.4 2.6 2.7 2.9 Tooltip Higole PC Stick-J4125: Ø1.098 (0.16-2.51)
GMK NucBox 3: Ø1.319 (0.29-2.21)
GMK NucBox K1: Ø1.529 (0.24-2.61)
AC6-M Mini-PC: Ø1.566 (0.28-2.77)
Beelink GK Mini: Ø1.712 (0.31-3.03)
TrueCrypt - TrueCrypt Serpent
min: 0.163 gem: 0.2 mediaan: 0.2 (0%) max: 0.182 GB/s
CPU TDP ? TDP 10 W 100% 91%
...
Intel Core i3-7130U
Intel Core i5-6200U
Intel Core i3-6100H
Intel Core i5-4310M
Intel Core i7-5650U
Intel Core i7-5600U
Intel Core i5-5257U
Intel Core i5-4210H
Intel Core i5-6360U
Intel Core i5-6300U
Intel Core i5-7Y57
...
max:
TrueCrypt - TrueCrypt Twofish
min: 0.196 gem: 0.2 mediaan: 0.3 (5%) max: 0.266 GB/s
CPU TDP ? TDP 10 W 100% 74%
...
Intel Core i5-7Y54
Intel Core i3-7020U
Intel Core i3-6100U
Intel Core i5-5250U
Intel Core i7-2640M
Intel Core i5-4310U
...
max:
TrueCrypt - TrueCrypt AES
min: 1.8 gem: 1.8 mediaan: 1.8 (5%) max: 1.9 GB/s
CPU TDP ? TDP 10 W 100% 97%
...
Intel Core i3-7100H
Intel Core i5-6360U
AMD A12-9720P
AMD PRO A12-9800B
Intel Core i5-7Y57
Intel Core i7-6500U
Intel Core i5-7200U
Intel Core i7-5600U
Intel Core i7-6560U
Intel Core i5-5257U
Intel Core i5-6267U
Intel Core i7-6567U
...
max:
Blender - Blender 3.3 Classroom CPU *
7856 Seconds (100%)
...
Intel Core i3-6157U
Intel Core i5-5250U
Intel Core i3-5010U
Blender - Blender 2.79 BMW27 CPU *
min: 2198 gem: 2772 mediaan: 2391 (17%) max: 3860 Seconds
CPU TDP ? TDP 10 W 110% 100%
...
Intel Celeron N4100
Intel Celeron 2970M
...
R Benchmark 2.5 - R Benchmark 2.5 *
min: 1.525 gem: 1.6 mediaan: 1.6 (34%) max: 1.579 sec
CPU TDP ? TDP 10 W 100% 101%
...
Intel Core i3-5005U
Intel Pentium Gold 4425Y
Intel Celeron N4100
...
3DMark 06 - CPU - 3DMark 06 - CPU
min: 2373 gem: 3327 mediaan: 3740 (8%) max: 3869 Points
CPU TDP ? TDP 10 W 100% 62%
...
AMD PRO A12-9800B
Intel Core 2 Quad Q9100
Intel Core i5-5250U
...
max:
Super Pi mod 1.5 XS 1M - Super Pi mod 1.5 XS 1M *
min: 24.57 gem: 31.6 mediaan: 24.6 (5%) max: 45.52 s
CPU TDP ? TDP 10 W 100% 102%
...
AMD Turion II N530
Intel Core 2 Duo T7100
AMD A6-3420M
Intel Celeron M 585
AMD Turion II P540
AMD A6 Pro-7050B
Intel Core 2 Duo T5470
Intel Core Duo T2400
AMD Turion II Ultra M600
Intel Celeron N3050
...
VIA C3-M C3-M-1200
Super Pi mod 1.5 XS 2M - Super Pi mod 1.5 XS 2M *
min: 55.9 gem: 68.9 mediaan: 57.4 (2%) max: 93.4 s
CPU TDP ? TDP 10 W 100% 101%
...
Intel Core 2 Duo T7250
Intel Core 2 Duo T7100
AMD A6-3420M
Intel Pentium N3540
Intel Core Duo T2600
...
Intel Celeron Dual-Core T1400
Super Pi Mod 1.5 XS 32M - Super Pi mod 1.5 XS 32M *
min: 1332.53 gem: 3652 mediaan: 1845 (8%) max: 7778 s
CPU TDP ? TDP 10 W 100% 120%
...
Intel Celeron M 410
AMD Mobile Athlon 64 2700+
Intel Celeron M 370
Intel Pentium M 738
Intel Pentium M 710
Intel Pentium M 705
Intel Core Solo T1400
Intel Atom 230
Intel Atom N570
Intel Celeron M 360
Intel Pentium M 753
Intel Celeron M 320
Intel Atom N475
AMD Athlon 64 L110
AMD Mobile Sempron 3100+
Intel Atom D525
Intel Atom N550
...
VIA C3-M C3-M-1200
3DMark Vantage - 3DM Vant. Perf. CPU no Physx
min: 3522 gem: 5431 mediaan: 5430.5 (5%) max: 7339 Points
CPU TDP ? TDP 10 W 100% 48%
...
AMD A6-3420M
AMD A8-3500M
AMD A4-7210
AMD A8-3520M
...
max:
3DMark 11 - 3DM11 Performance Physics
min: 2348 gem: 2705 mediaan: 2706 (7%) max: 2986 Points
CPU TDP ? TDP 10 W 100% 89%
...
Intel Core i3-2310M
Intel Core i3-5015U
Intel Core m5-6Y57
Intel Core m3-7Y32
...
max:
3DMark - 3DMark Ice Storm Physics
min: 10102 gem: 19782 mediaan: 19782 (16%) max: 29462 Points
CPU TDP ? TDP 10 W 100% 34%
...
AMD A8-3520M
Intel Pentium Gold 4425Y
Intel Pentium N3530
Intel Core M-5Y51
Intel Pentium N3540
...
max:
3DMark - 3DMark Ice Storm Extreme Physics
min: 11105 gem: 23313 mediaan: 29231 (24%) max: 29602 Points
CPU TDP ? TDP 10 W 100% 38%
...
AMD A10-9600P
Intel Core i5-8279U
Intel Core m5-6Y54
AMD PRO A8-9600B
AMD A10-9620P
Intel Core m5-6Y57
...
max:
3DMark - 3DMark Ice Storm Unlimited Physics
min: 17507 gem: 26606 mediaan: 26606 (22%) max: 35705 Points
CPU TDP ? TDP 10 W 100% 49%
...
AMD A10-9600P
Intel Core m5-6Y57
AMD A12-9720P
AMD PRO A12-9800B
Intel Core M-5Y10c
Intel Core M-5Y31
...
max:
3DMark - 3DMark Cloud Gate Physics
min: 1196 gem: 2273 mediaan: 2485 (6%) max: 2804 Points
CPU TDP ? TDP 10 W 100% 65%
...
Intel Pentium 3825U
Intel Core i5-8210Y
AMD A12-9720P
AMD A10-9620P
Intel Core i3-5005U
...
max:
3DMark - 3DMark Fire Strike Standard Physics
min: 1602 gem: 3372 mediaan: 3689 (7%) max: 4271 Points
CPU TDP ? TDP 10 W 100% 64%
...
AMD A12-9720P
Intel Core i3-5005U
Intel Core i3-5010U
Intel Core i5-7Y54
...
max:
3DMark - 3DMark Time Spy CPU
min: 876 gem: 994 mediaan: 984 (4%) max: 1122 Points
CPU TDP ? TDP 10 W 100% 83%
...
AMD Pro A10-8700B
Intel Celeron N4100
Intel Celeron 2970M
AMD A10-9600P
Intel Core i5-5250U
Intel Core i3-5010U
...
max:
Geekbench 5.5 - Geekbench 5.1 - 5.5 64 Bit Single-Core
min: 435 gem: 454.2 mediaan: 455 (18%) max: 466 punten
CPU TDP ? TDP 10 W 99% 100%
...
Intel Pentium Gold 4425Y
Intel Celeron 3867U
Intel Celeron 5205U
Qualcomm Snapdragon 850
Intel Core i3-5005U
...
max:
Geekbench 5.5 - Geekbench 5.1 - 5.5 64 Bit Multi-Core
min: 1198 gem: 1367 mediaan: 1394 (2%) max: 1512 punten
CPU TDP ? TDP 10 W 100% 83%
...
Intel Celeron N4100
Intel Pentium Gold 6405U
AMD Ryzen Embedded R1505G
Intel Core i5-5250U
Intel Core i3-6157U
...
max:
Geekbench 5.0 - Geekbench 5.0 64 Bit Single-Core
min: 451 gem: 455.7 mediaan: 453 (2%) max: 463 punten
CPU TDP ? TDP 10 W 100% 98%
...
Intel Celeron N4100
Intel Core i5-8260U
AMD Ryzen Embedded R1505G
...
max:
Geekbench 5.0 - Geekbench 5.0 64 Bit Multi-Core
min: 1163 gem: 1388 mediaan: 1482 (5%) max: 1519 punten
CPU TDP ? TDP 10 W 100% 78%
...
Intel Celeron N4100
AMD Ryzen Embedded R1505G
Intel Core i5-8210Y
Intel Core i5-8260U
Intel Core i7-8500Y
Intel Core i3-6157U
...
max:
AMD Ryzen Threadripper PRO 3995WX
Geekbench 4.4 - Geekbench 4.1 - 4.4 64 Bit Single-Core
min: 1922 gem: 1948 mediaan: 1924 (19%) max: 1997 punten
CPU TDP ? TDP 10 W 100% 98%
...
AMD E2-9010
Intel Celeron N4100
Intel Pentium 3558U
AMD PRO A8-9600B
Intel Pentium Gold 4425Y
...
max:
Geekbench 4.4 - Geekbench 4.1 - 4.4 64 Bit Multi-Core
min: 4246 gem: 5158 mediaan: 5468 (6%) max: 5761 punten
CPU TDP ? TDP 10 W 100% 76%
...
Intel Core i7-6770HQ
Intel Core i3-5010U
Intel Celeron N4100
AMD Ryzen Embedded R1505G
Intel Core i5-5250U
...
max:
Mozilla Kraken 1.1 - Kraken 1.1 Total Score *
min: 2216 gem: 2258 mediaan: 2276 (3%) max: 2291 ms
CPU TDP ? TDP 10 W 100% 100%
...
Intel Celeron 3205U
AMD PRO A12-9800B
AMD A10-9600P
Intel Core i3-6100U
Intel Pentium 3825U
...
max:
WebXPRT 4 - WebXPRT 4 Score
68.2 Points (20%)
Intel Pentium Gold 4425Y
Intel Core i5-5250U
Intel Core i3-5010U
Intel Core i3-6157U
...
max:
WebXPRT 3 - WebXPRT 3 Score
min: 86.2 gem: 89.2 mediaan: 88.7 (18%) max: 93.2 Points
CPU TDP ? TDP 10 W 95% 100%
...
Intel Pentium Gold 4425Y
Intel Core i3-5005U
...
CrossMark - CrossMark Overall
340 Points (13%)
Intel Pentium Gold 4425Y
...
max:
Power Consumption - Prime95 Power Consumption - external Monitor *
min: 7.87 gem: 12.5 mediaan: 12.4 (2%) max: 17.4 Watt
CPU TDP ? TDP 10 W 100% 101%
...
Intel Celeron N4100
Intel Atom x7-E3950
...
max:
AMD Ryzen Threadripper PRO 3975WX
0 1 2 3 4 5 6 7 8 9 10 11 12 13 14 15 16 17 18 19 Tooltip Higole PC Stick-J4125: Ø7.87 (6.3-15.1)
GMK NucBox 3: Ø10.5 (9.95-19.3)
AC6-M Mini-PC: Ø17.4 (15.8-18)
Power Consumption - Cinebench R15 Multi Power Consumption - external Monitor *
min: 9.24 gem: 11 mediaan: 11.4 (2%) max: 12.3 Watt
CPU TDP ? TDP 10 W 100% 100%
...
Intel Celeron N4100
Intel Atom x7-Z8750
Intel Atom x7-E3950
Intel Core i3-5005U
...
max:
0 1 2 3 4 5 6 7 8 9 10 11 12 13 14 15 Tooltip GMK NucBox 3: Ø9.24 (8.88-15.3)
Higole PC Stick-J4125: Ø11.4 (10.9-12.8)
Power Consumption - Idle Power Consumption - external Monitor *
3.2 Watt (2%)
Apple M2
Apple M1
...
max:
0 1 2 3 4 5 6 7 Tooltip Higole PC Stick-J4125: Ø3.21 (2.77-7.5)
Power Consumption - Cinebench R15 Multi Power Efficiency - external Monitor
min: 13 gem: 18.4 mediaan: 19.8 (15%) max: 22.4 Points per Watt
CPU TDP ? TDP 10 W 100% 89%
...
Intel Core i7-1065G7
...
- Benchmarkresultaten voor deze videokaart
- Gemiddelde benchmarkresultaten voor deze videokaart
* Kleinere getallen betekenen een hogere prestatie
v1.28
log 09. 01:08:01
#0 ran 0s before starting gpusingle class +0s ... 0s
#1 no ids found in url (should be separated by "_") +0s ... 0s
#2 not redirecting to Ajax server +0s ... 0s
#3 did not recreate cache, as it is less than 5 days old! Created at Sat, 07 Sep 2024 05:32:05 +0200 +0.001s ... 0.001s
#4 no comparison url found in template nbc.compare_page_2 needed +0.008s ... 0.009s
#5 no comparison url found in template nbc.compare_page_2 needed +0s ... 0.009s
#6 no comparison url found in template nbc.compare_page_2 needed +0s ... 0.009s
#7 no comparison url found in template nbc.compare_page_2 needed +0s ... 0.009s
#8 no comparison url found in template nbc.compare_page_2 needed +0s ... 0.01s
#9 composed specs +0s ... 0.01s
#10 did output specs +0s ... 0.01s
#11 getting avg benchmarks for device 12749 +0.018s ... 0.028s
#12 got single benchmarks 12749 +0.018s ... 0.045s
#13 got avg benchmarks for devices +0s ... 0.045s
#14 min, max, avg, median took s +1.12s ... 1.166s
#15 no comparison url found in template nbc.compare_page_2 needed +0s ... 1.166s
#16 return log +0s ... 1.166s