Lenovo IdeaPad Gaming 3 15IAH7 review: Een van de krachtigste RTX 3050 Ti laptops

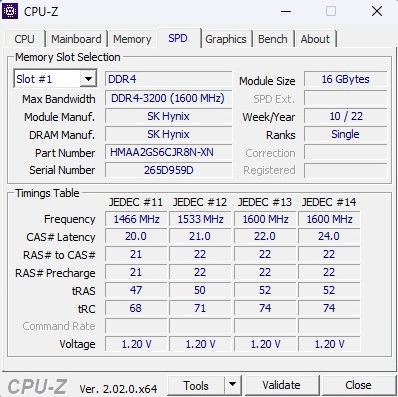
Hoewel er verschillende gaming laptops beschikbaar zijn in de prijsklasse rond de 1.000 euro (~$978), zien de meeste daarvan af van een beeldscherm met een fatsoenlijke helderheid en solide kleurruimte dekking. Van tijd tot tijd kunnen we echter een positieve uitzondering vinden, zoals de IdeaPad Gaming 3 15IAH7 die we getest hebben, en die een Core i5-12500H, aGeForce RTX 3050 Ti, 16 GB DDR4 RAM (helaas alleen in single-channel modus), en een 512 GB NVMe SSD. Het 15,6-inch IPS-scherm heeft een verversingssnelheid van 165 Hz, wat goede responstijden belooft, en een resolutie van 1920 x 1080 pixels.
Tot de concurrenten van de IdeaPad Gaming 3 15IAH7 behoren andere laptops met de RTX 3050 Ti zoals de HP Victus 16-e0145ng, deDell G15 5515, en de Dell Inspiron 16 Plus 7620. We nemen ook het 15ARH7 zustermodel (Ryzen 5 6600H & RTX 3050) in onze grafieken als vergelijkingstoestel.
Potentiële concurrenten in vergelijking
Evaluatie | Datum | Model | Gewicht | Hoogte | Formaat | Resolutie | Beste prijs |
|---|---|---|---|---|---|---|---|
| 82.8 % v7 (old) | 10-2022 | Lenovo IdeaPad Gaming 3 15IAH7 i5-12500H, GeForce RTX 3050 Ti Laptop GPU | 2.4 kg | 26 mm | 15.60" | 1920x1080 | |
| 80.8 % v7 (old) | 09-2022 | Lenovo IdeaPad Gaming 3 15ARH7 R5 6600H, GeForce RTX 3050 4GB Laptop GPU | 2.4 kg | 21.8 mm | 15.60" | 1920x1080 | |
| 82.7 % v7 (old) | 10-2021 | Dell G15 5515 R7 5800H, GeForce RTX 3050 Ti Laptop GPU | 2.4 kg | 24.9 mm | 15.60" | 1920x1080 | |
| 82.3 % v7 (old) | 05-2022 | HP Victus 16-e0145ng R5 5600H, GeForce RTX 3050 Ti Laptop GPU | 2.4 kg | 23.5 mm | 16.10" | 1920x1080 | |
| 87.4 % v7 (old) | 08-2022 | Dell Inspiron 16 Plus 7620 i7-12700H, GeForce RTX 3050 Ti Laptop GPU | 2.1 kg | 18.99 mm | 16.00" | 3072x1920 |
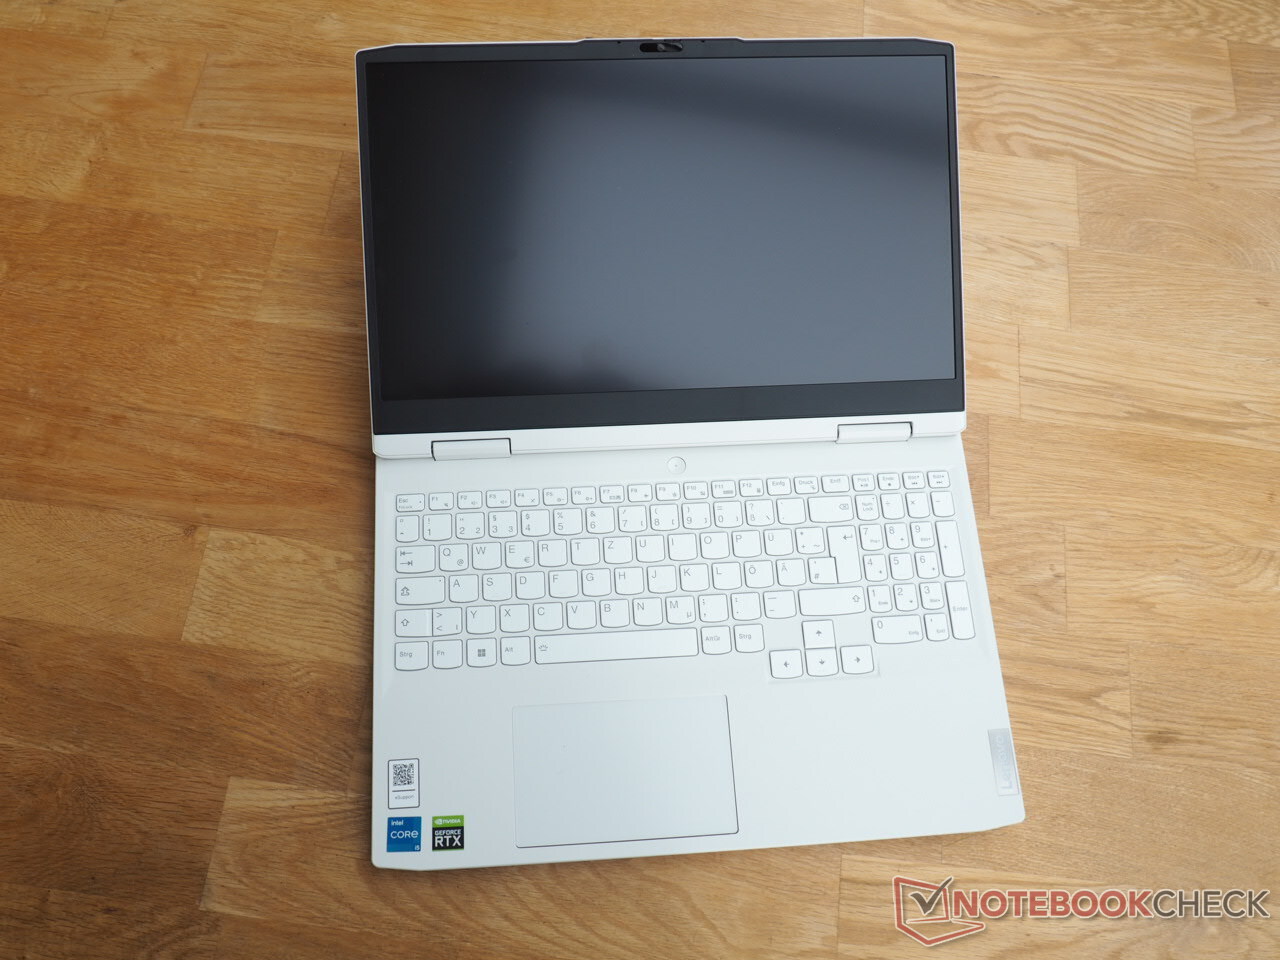
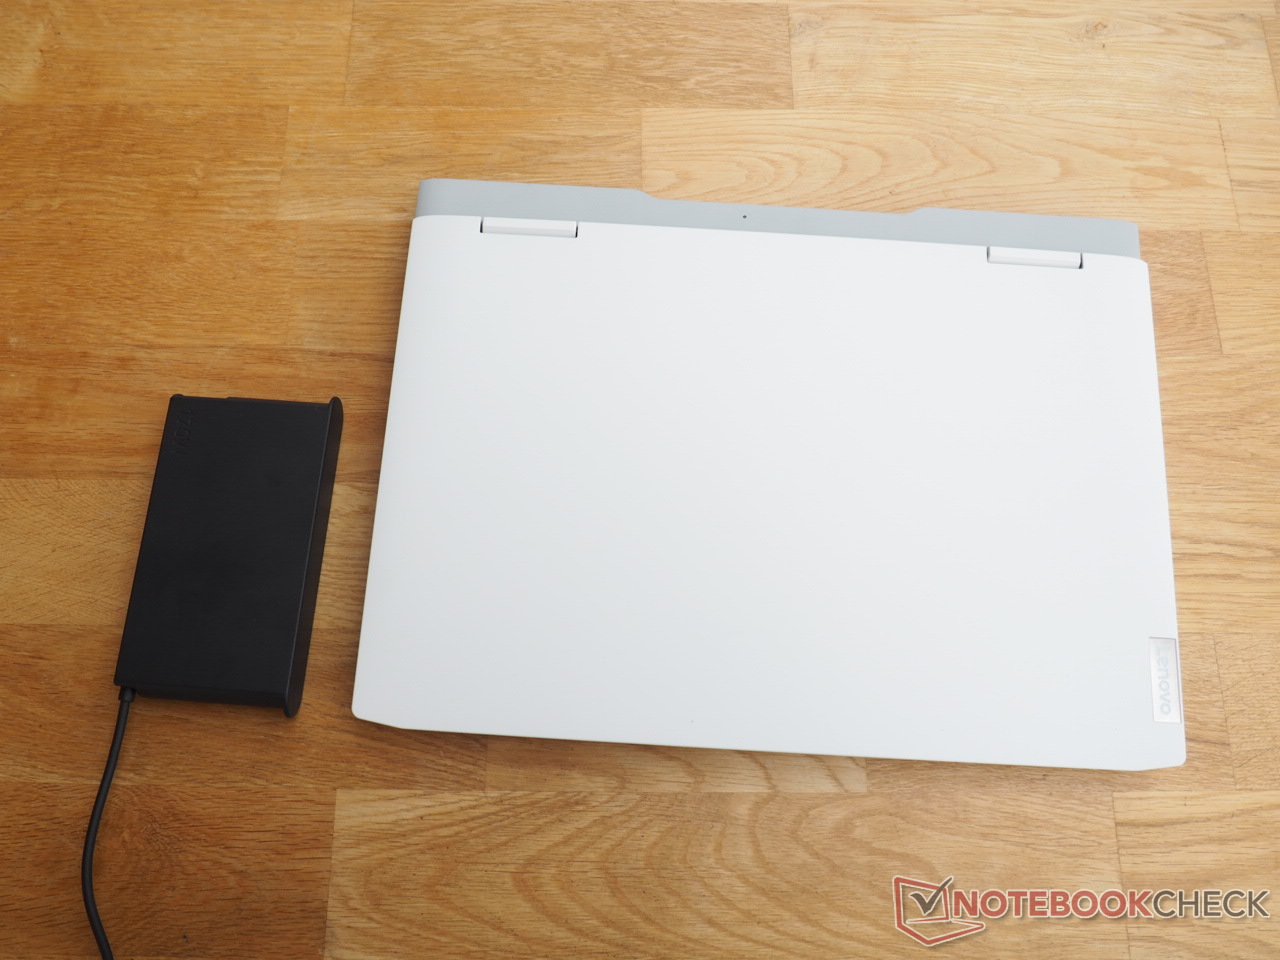
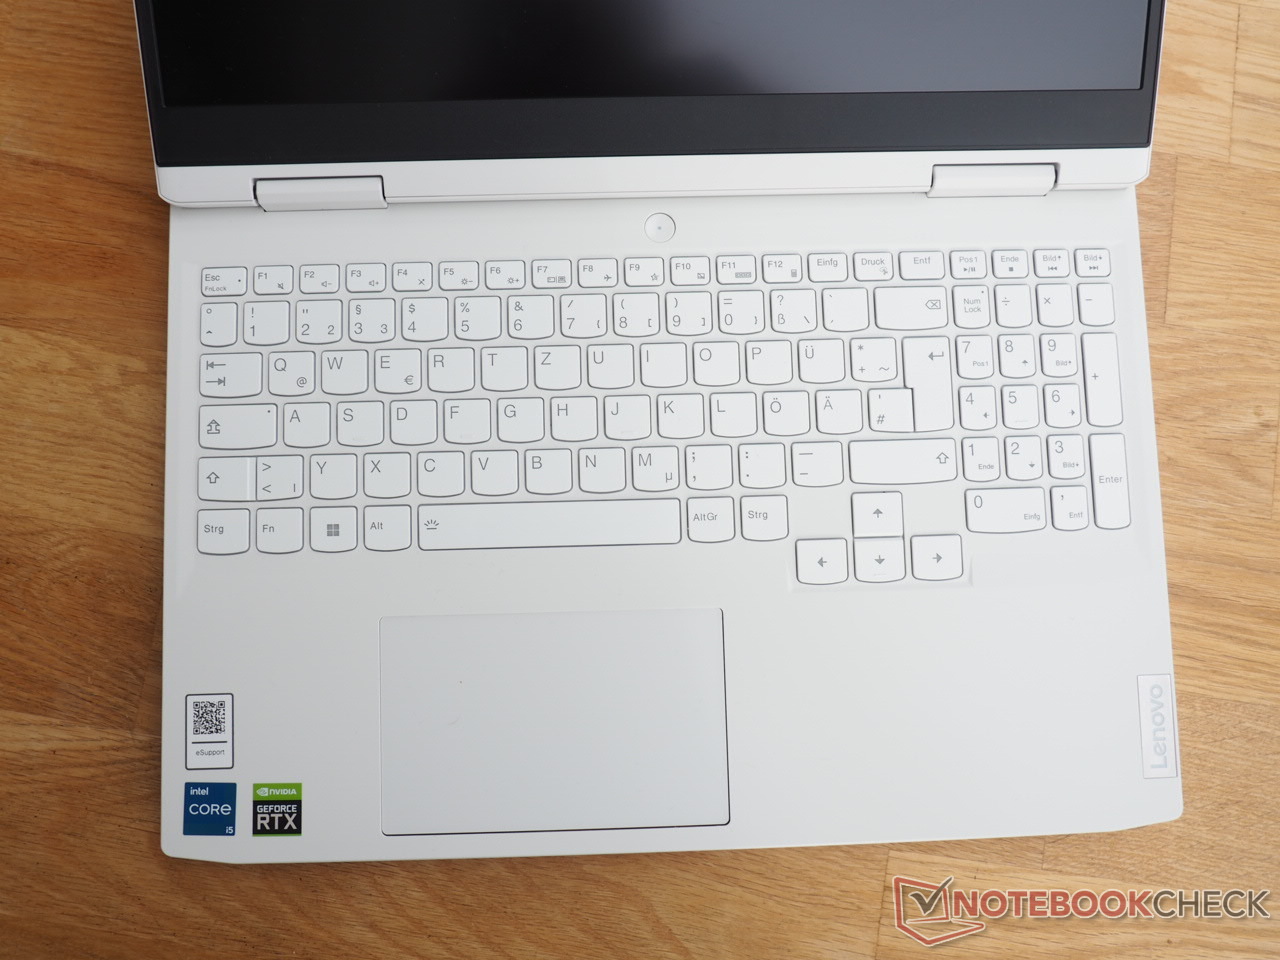
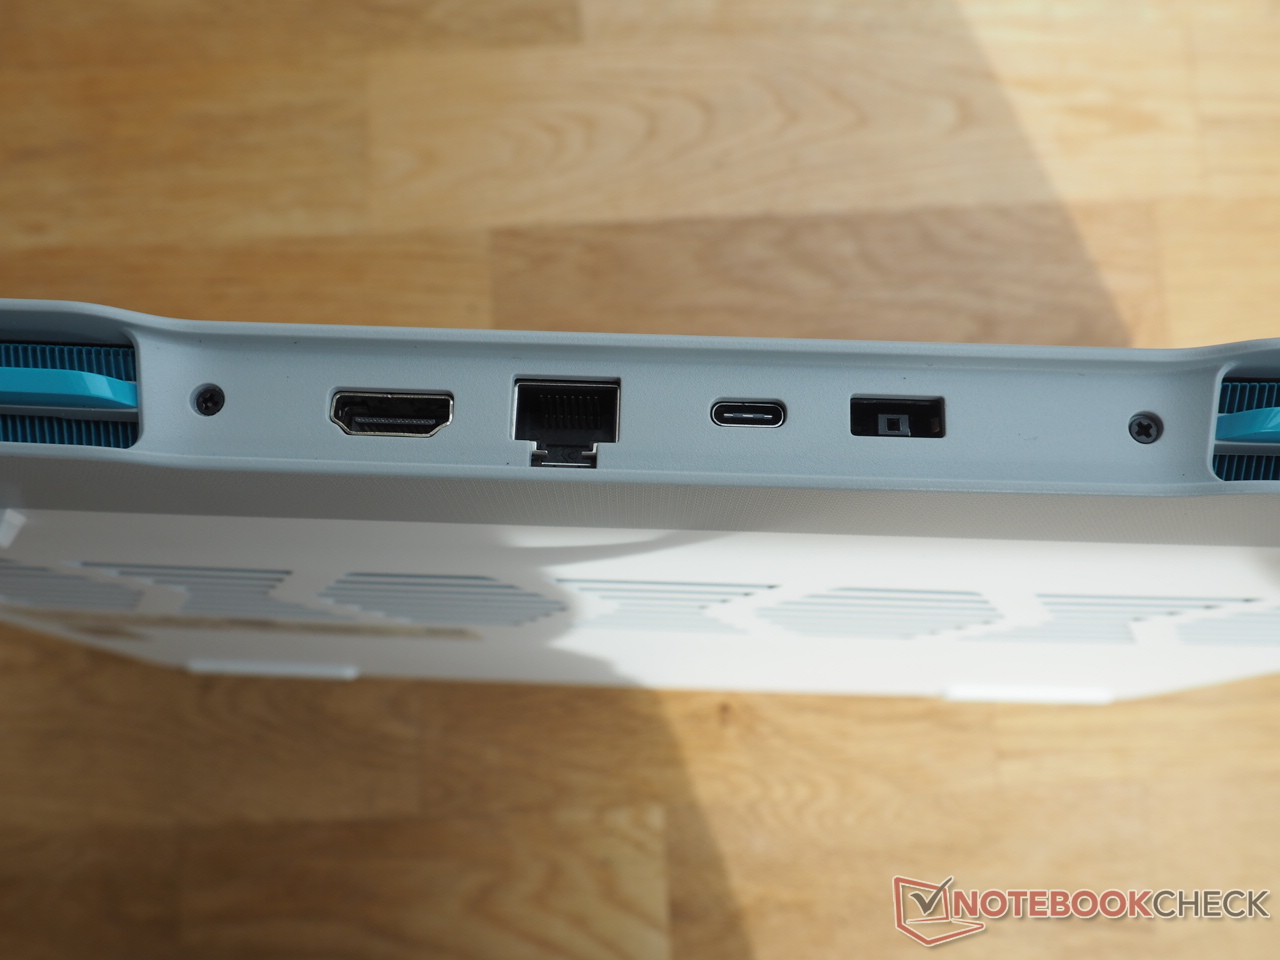
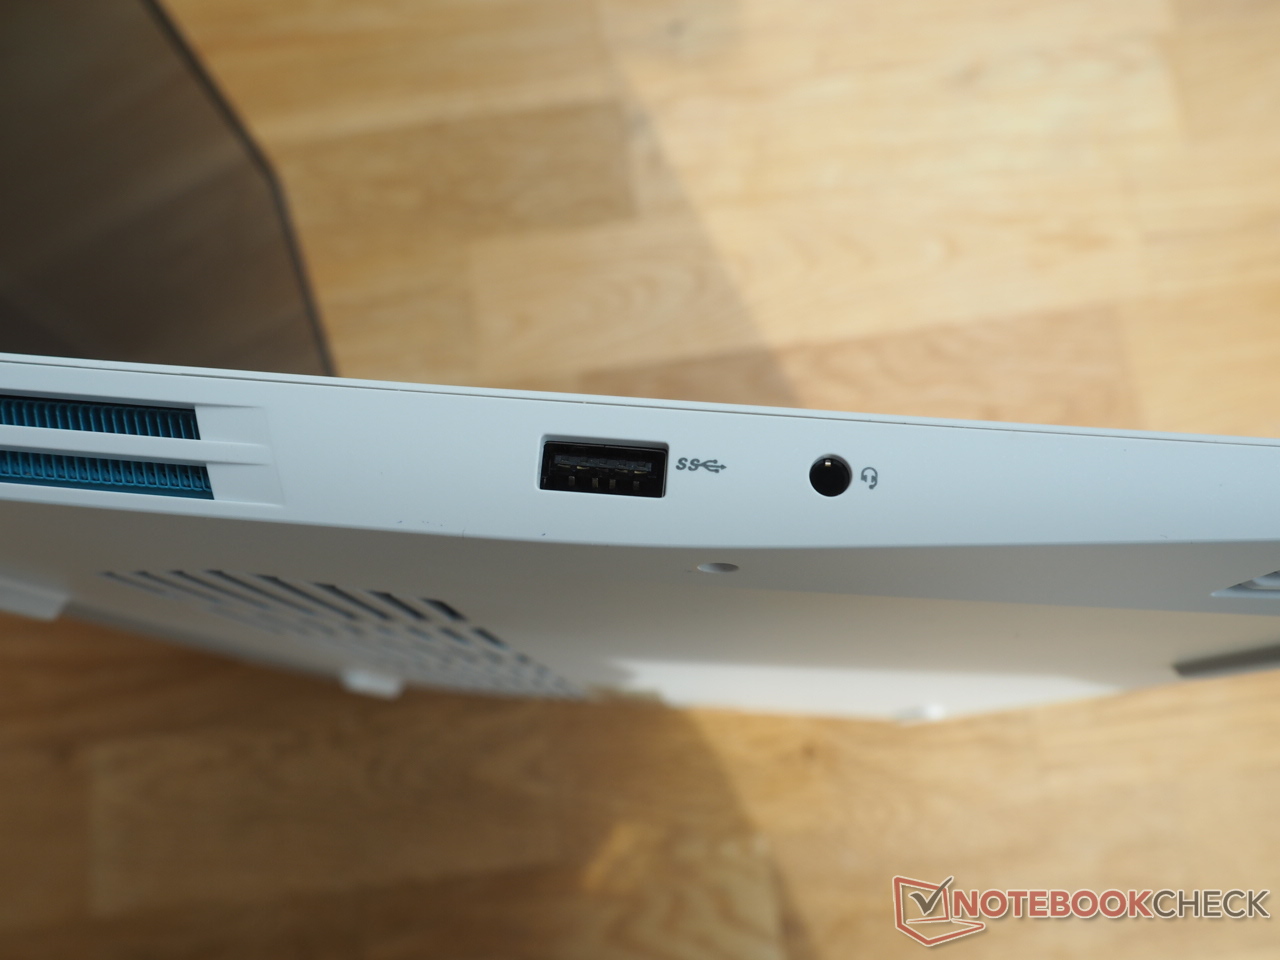
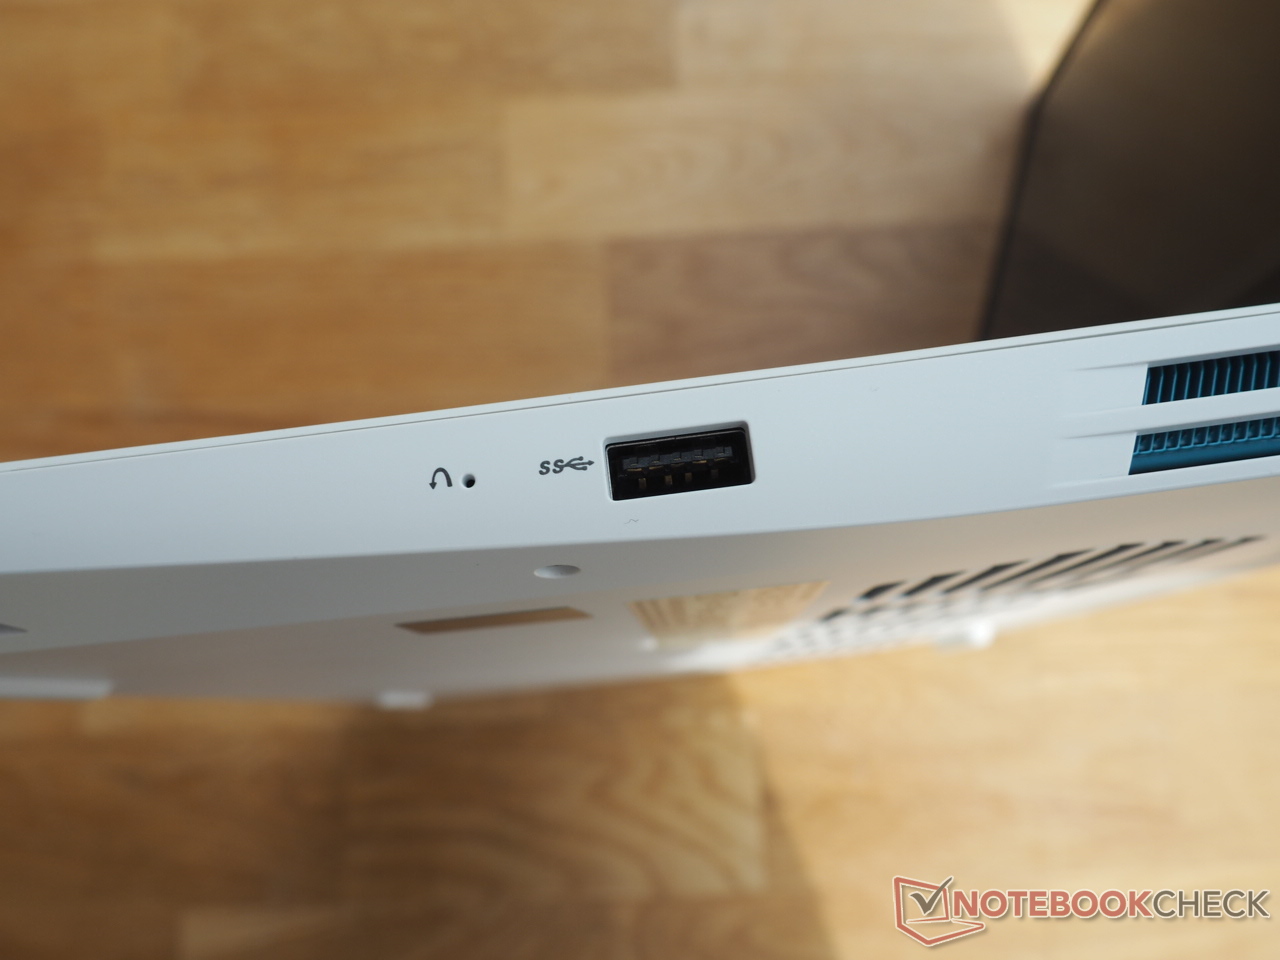
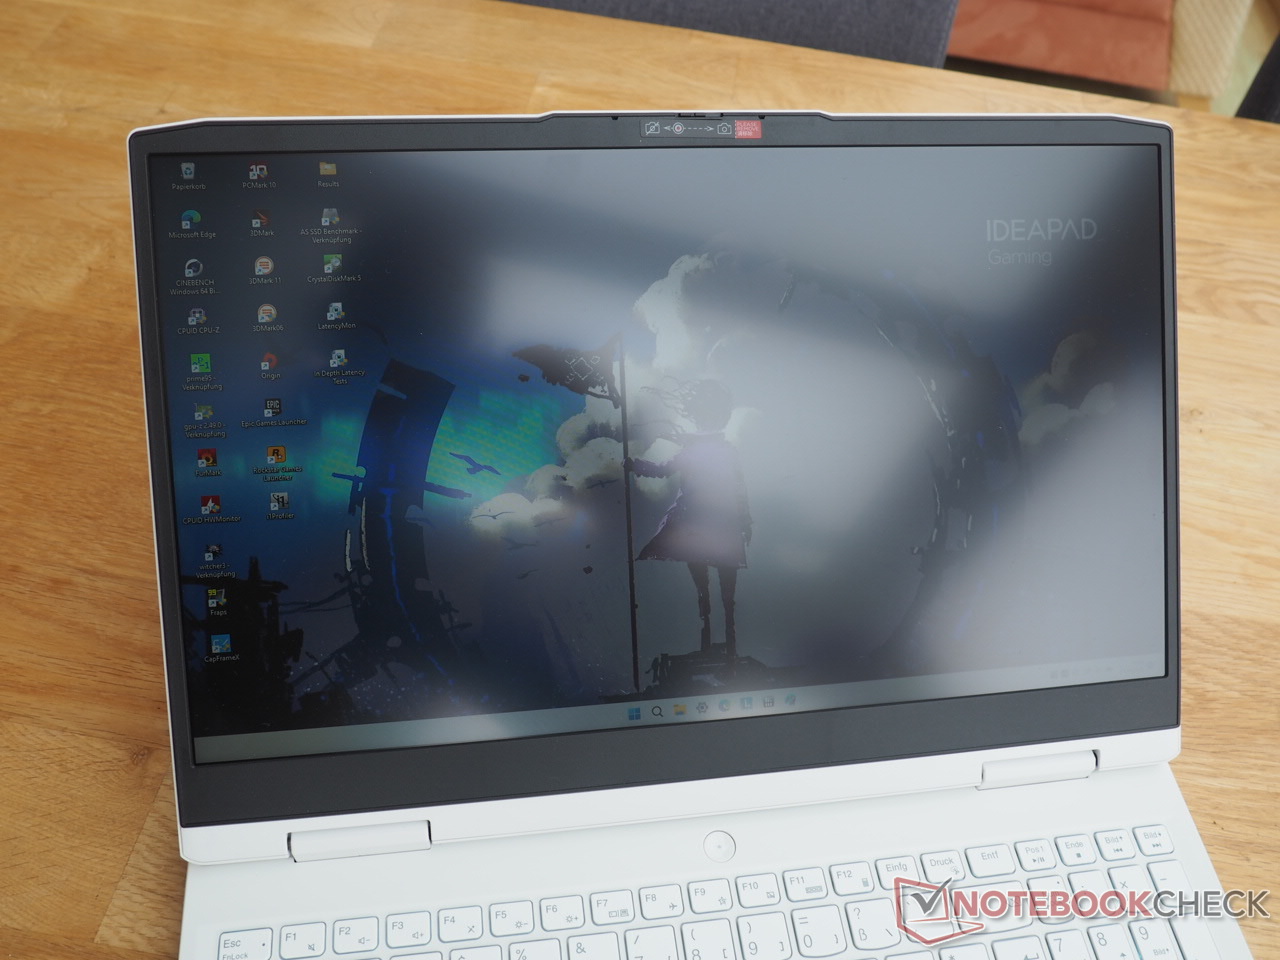
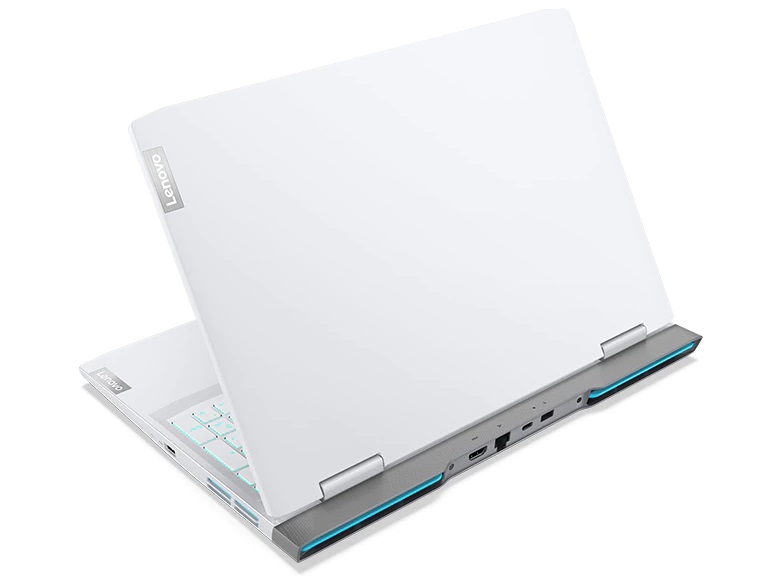
Aangezien afgezien van de kleur (Glacier White in plaats van Onyx Grey) en de toetsenbordindeling (Duits in plaats van US), de behuizing identiek is aan het hierboven genoemde zustermodel, zullen we de behuizing, apparatuur en invoerapparaten hier niet verder bespreken. U kunt de overeenkomstige informatie vinden in de review van het zustermodel.
Webcam


Display
Als je het vergelijkingsveld bekijkt, zie je gemakkelijk dat betaalbare gaming laptops vaak met een mager beeldscherm worden geleverd.
| |||||||||||||||||||||||||
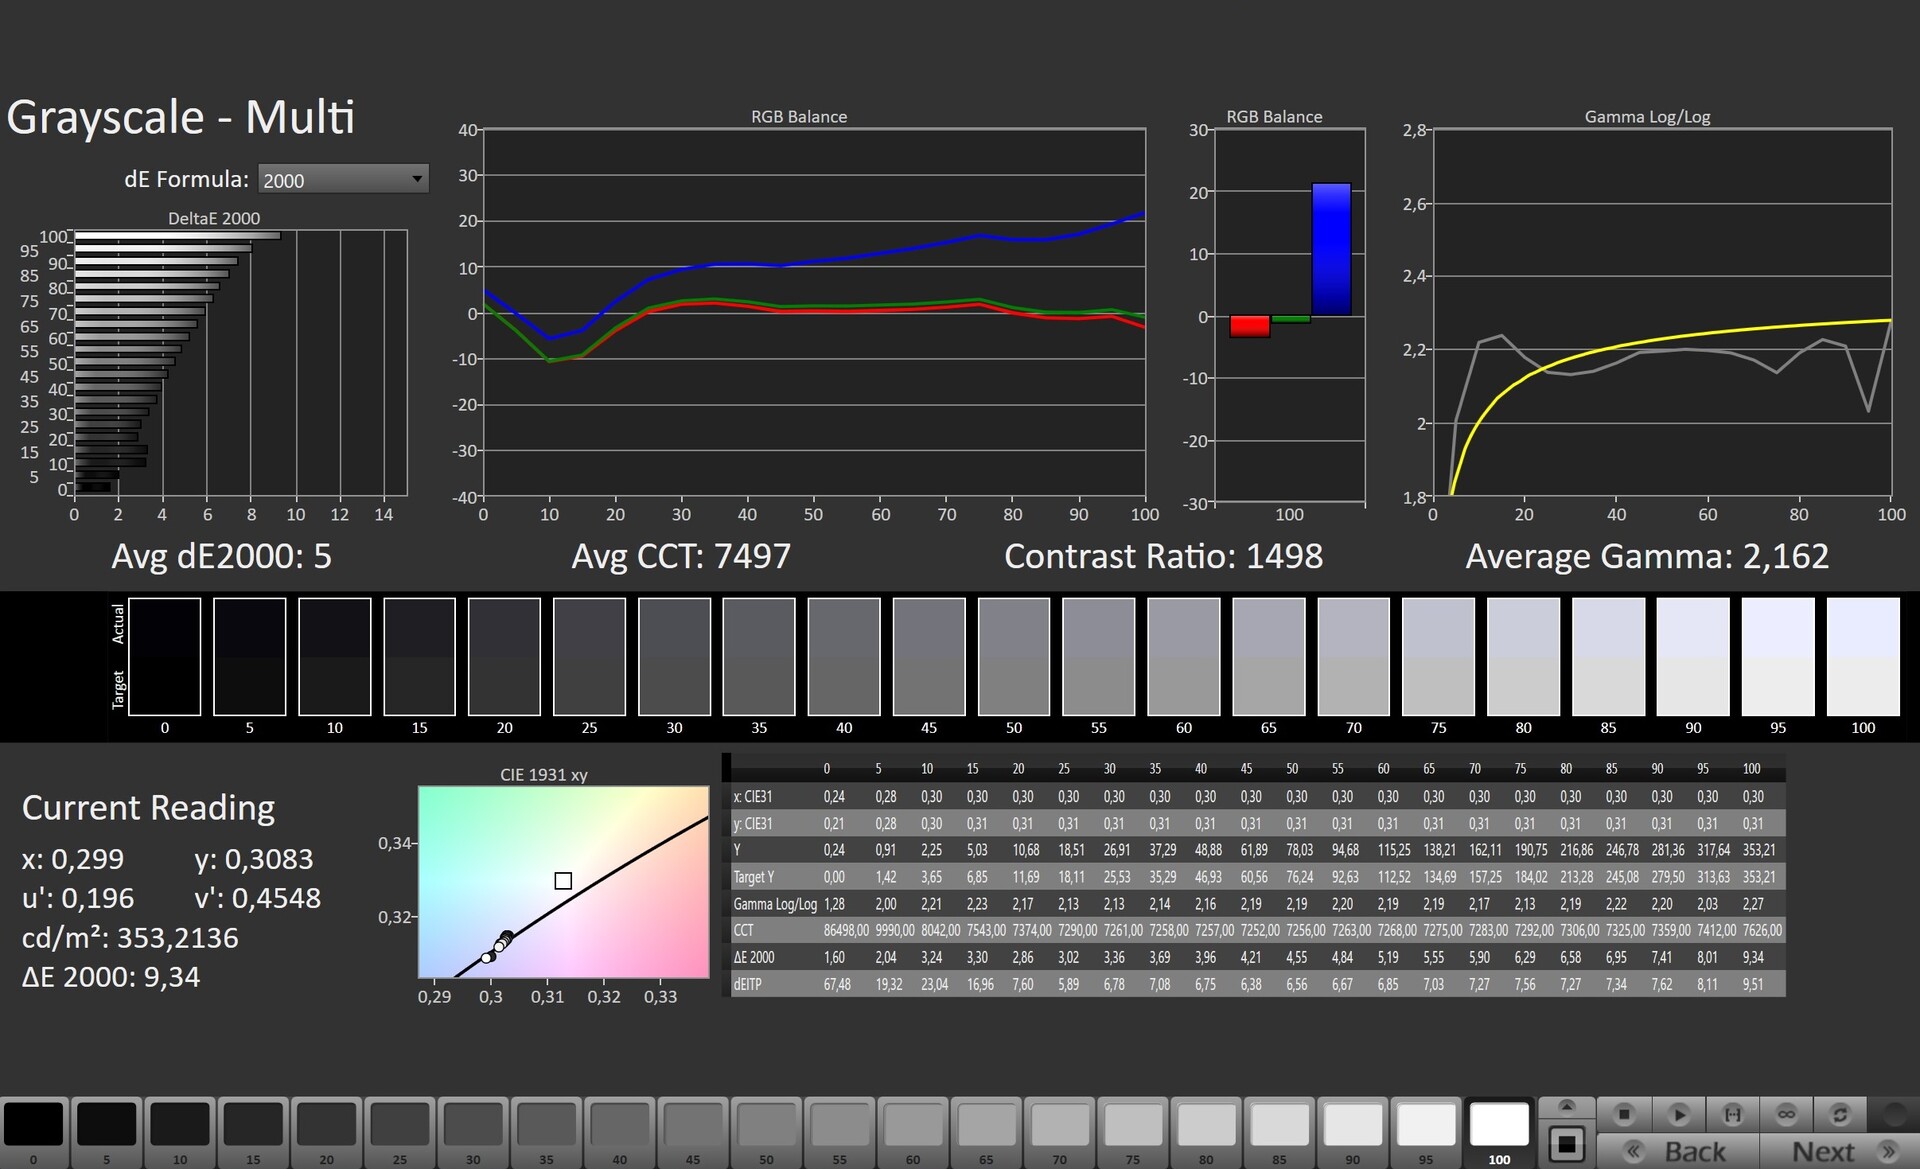
Helderheidsverdeling: 92 %
Helderheid in Batterij-modus: 338 cd/m²
Contrast: 1252:1 (Zwart: 0.27 cd/m²)
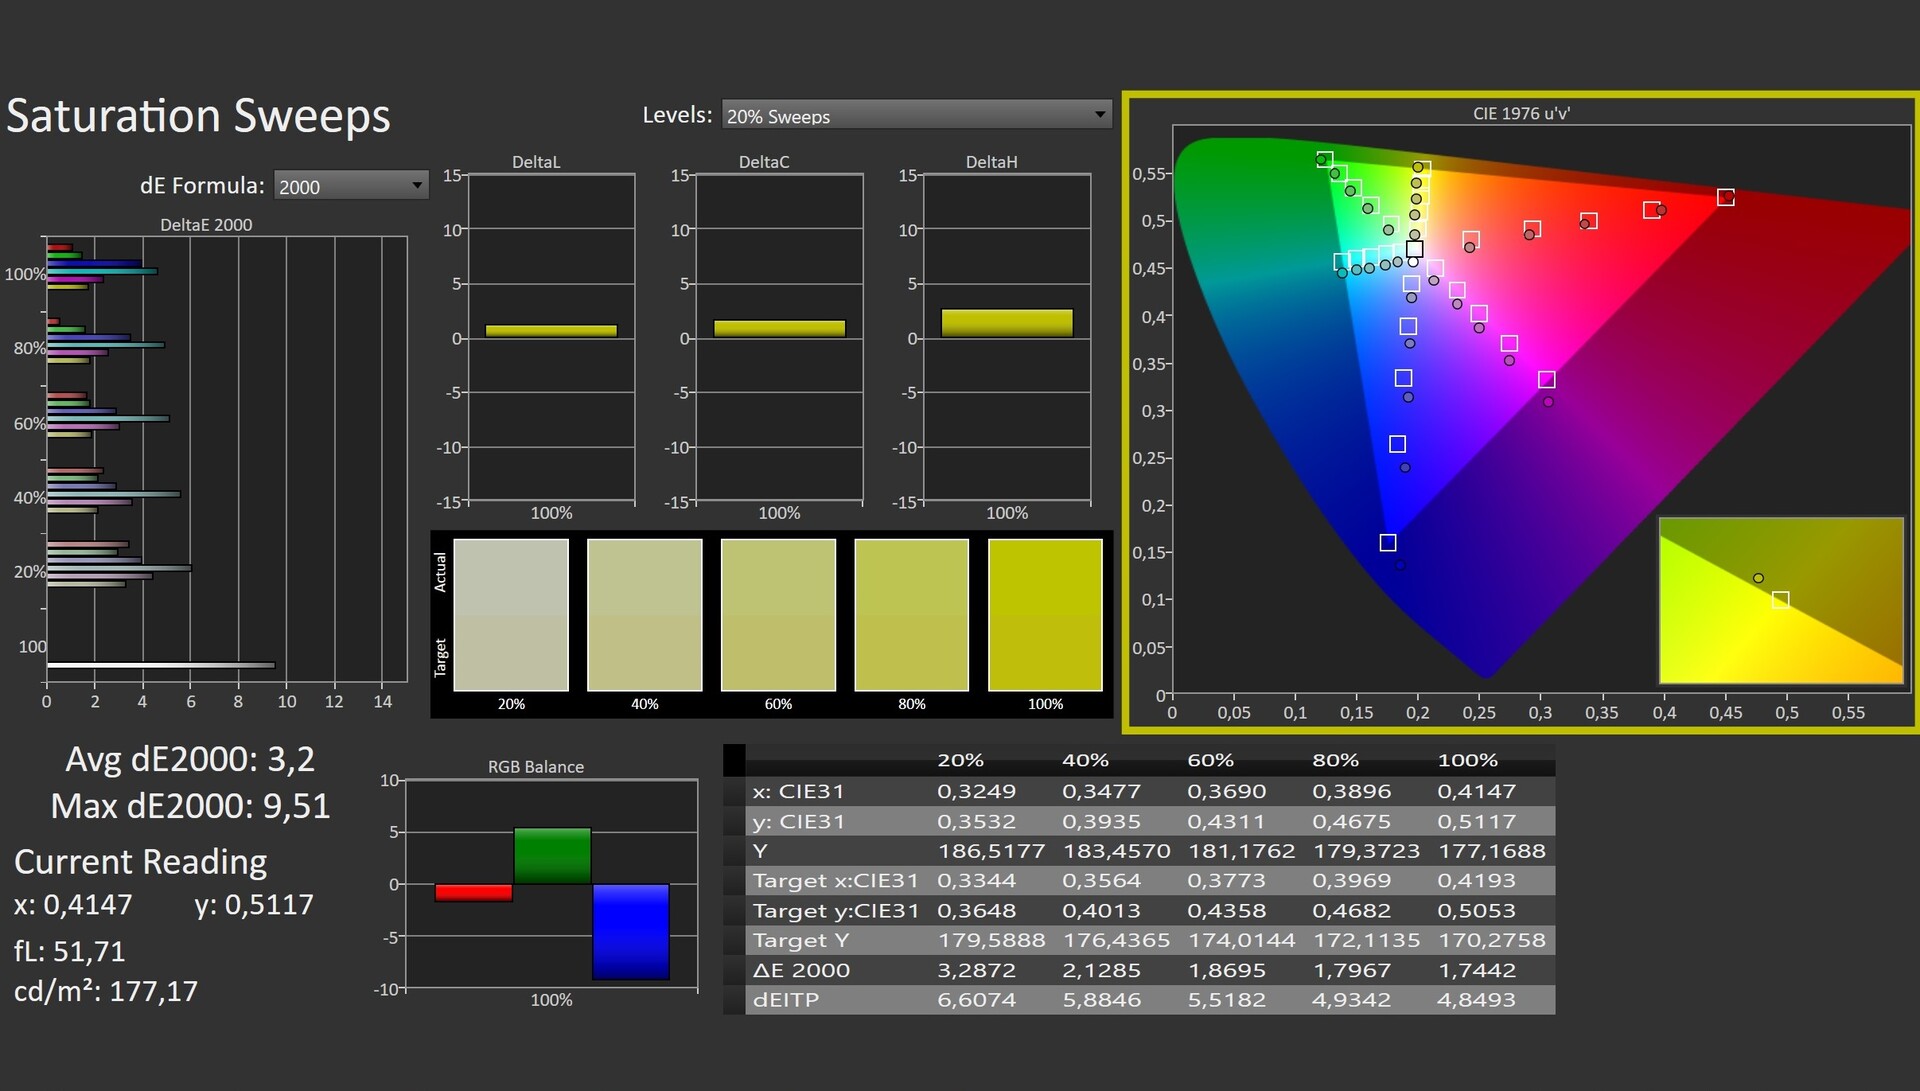
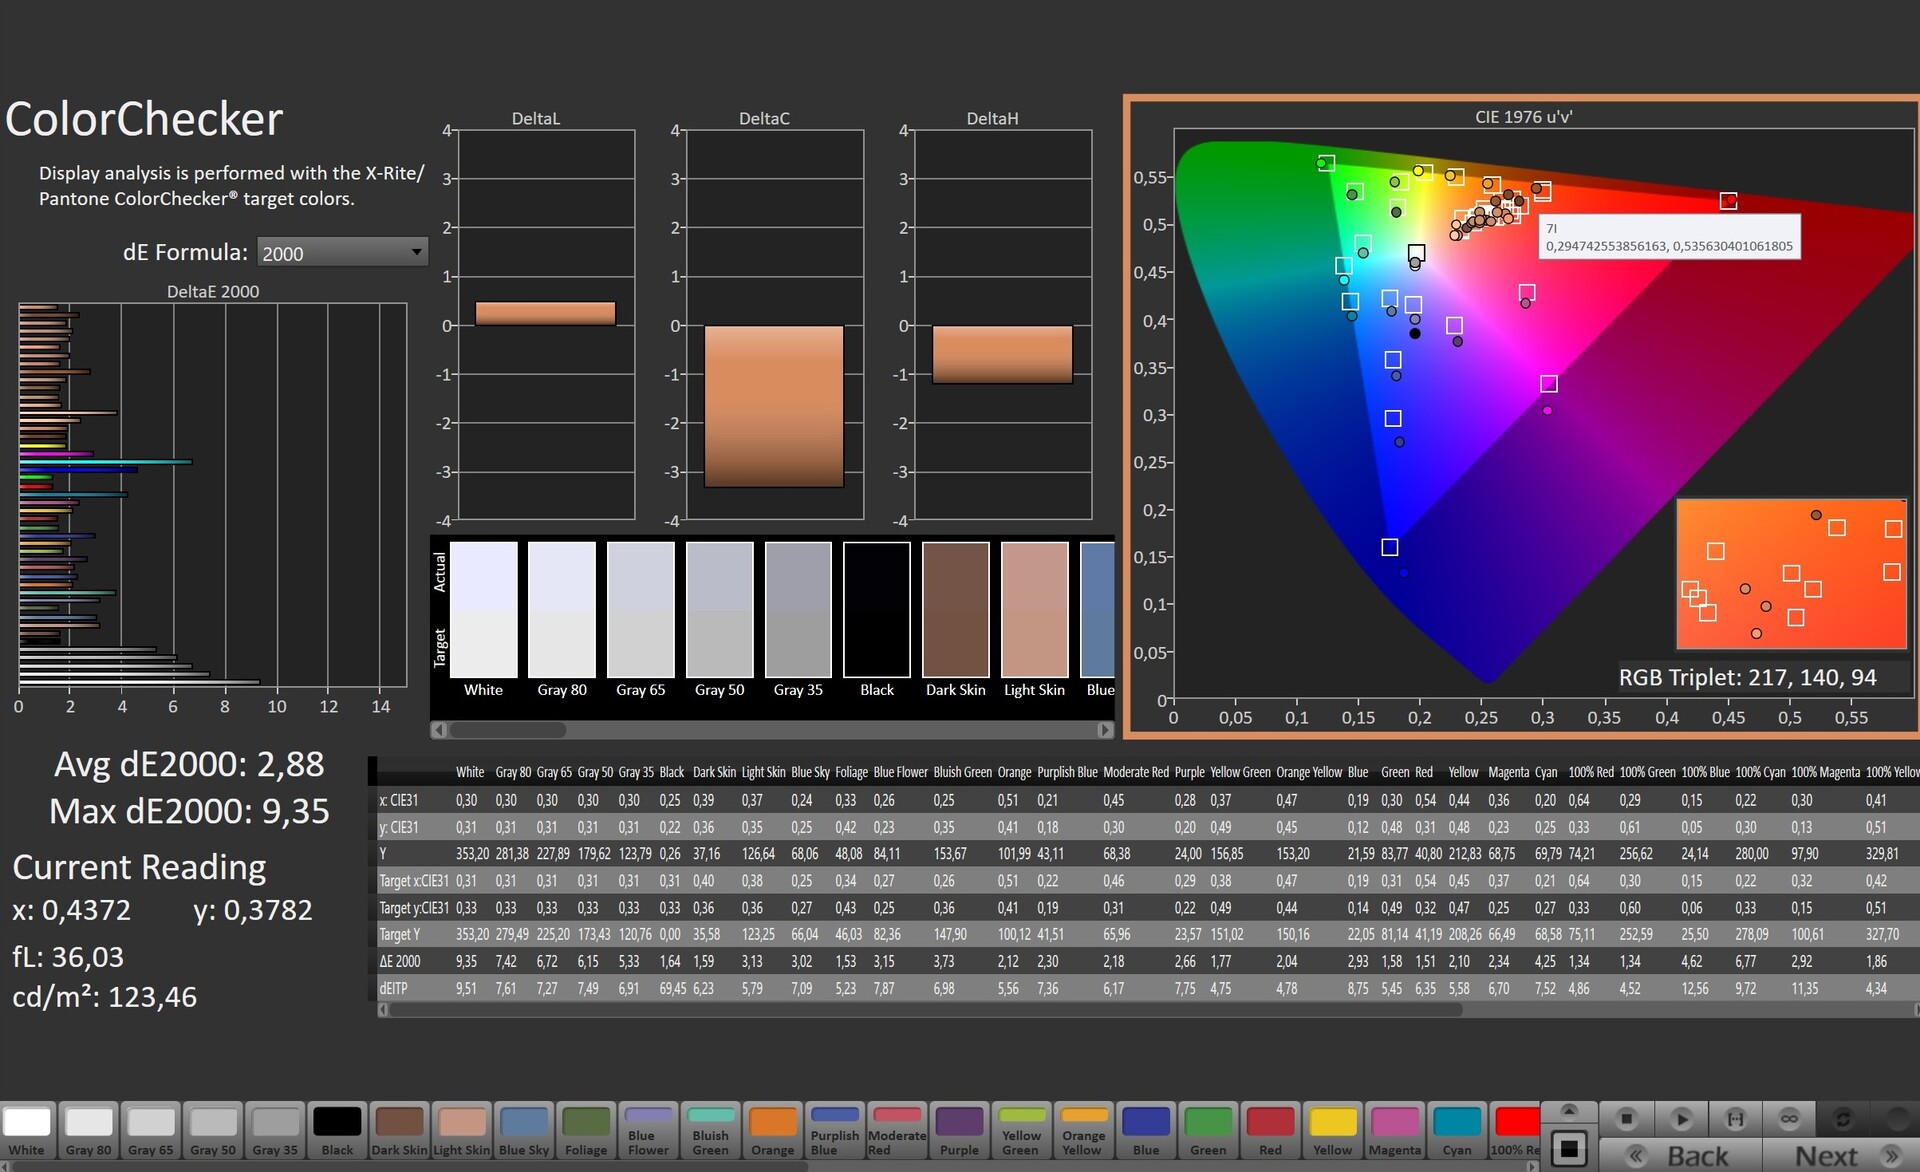
ΔE ColorChecker Calman: 2.88 | ∀{0.5-29.43 Ø4.71}
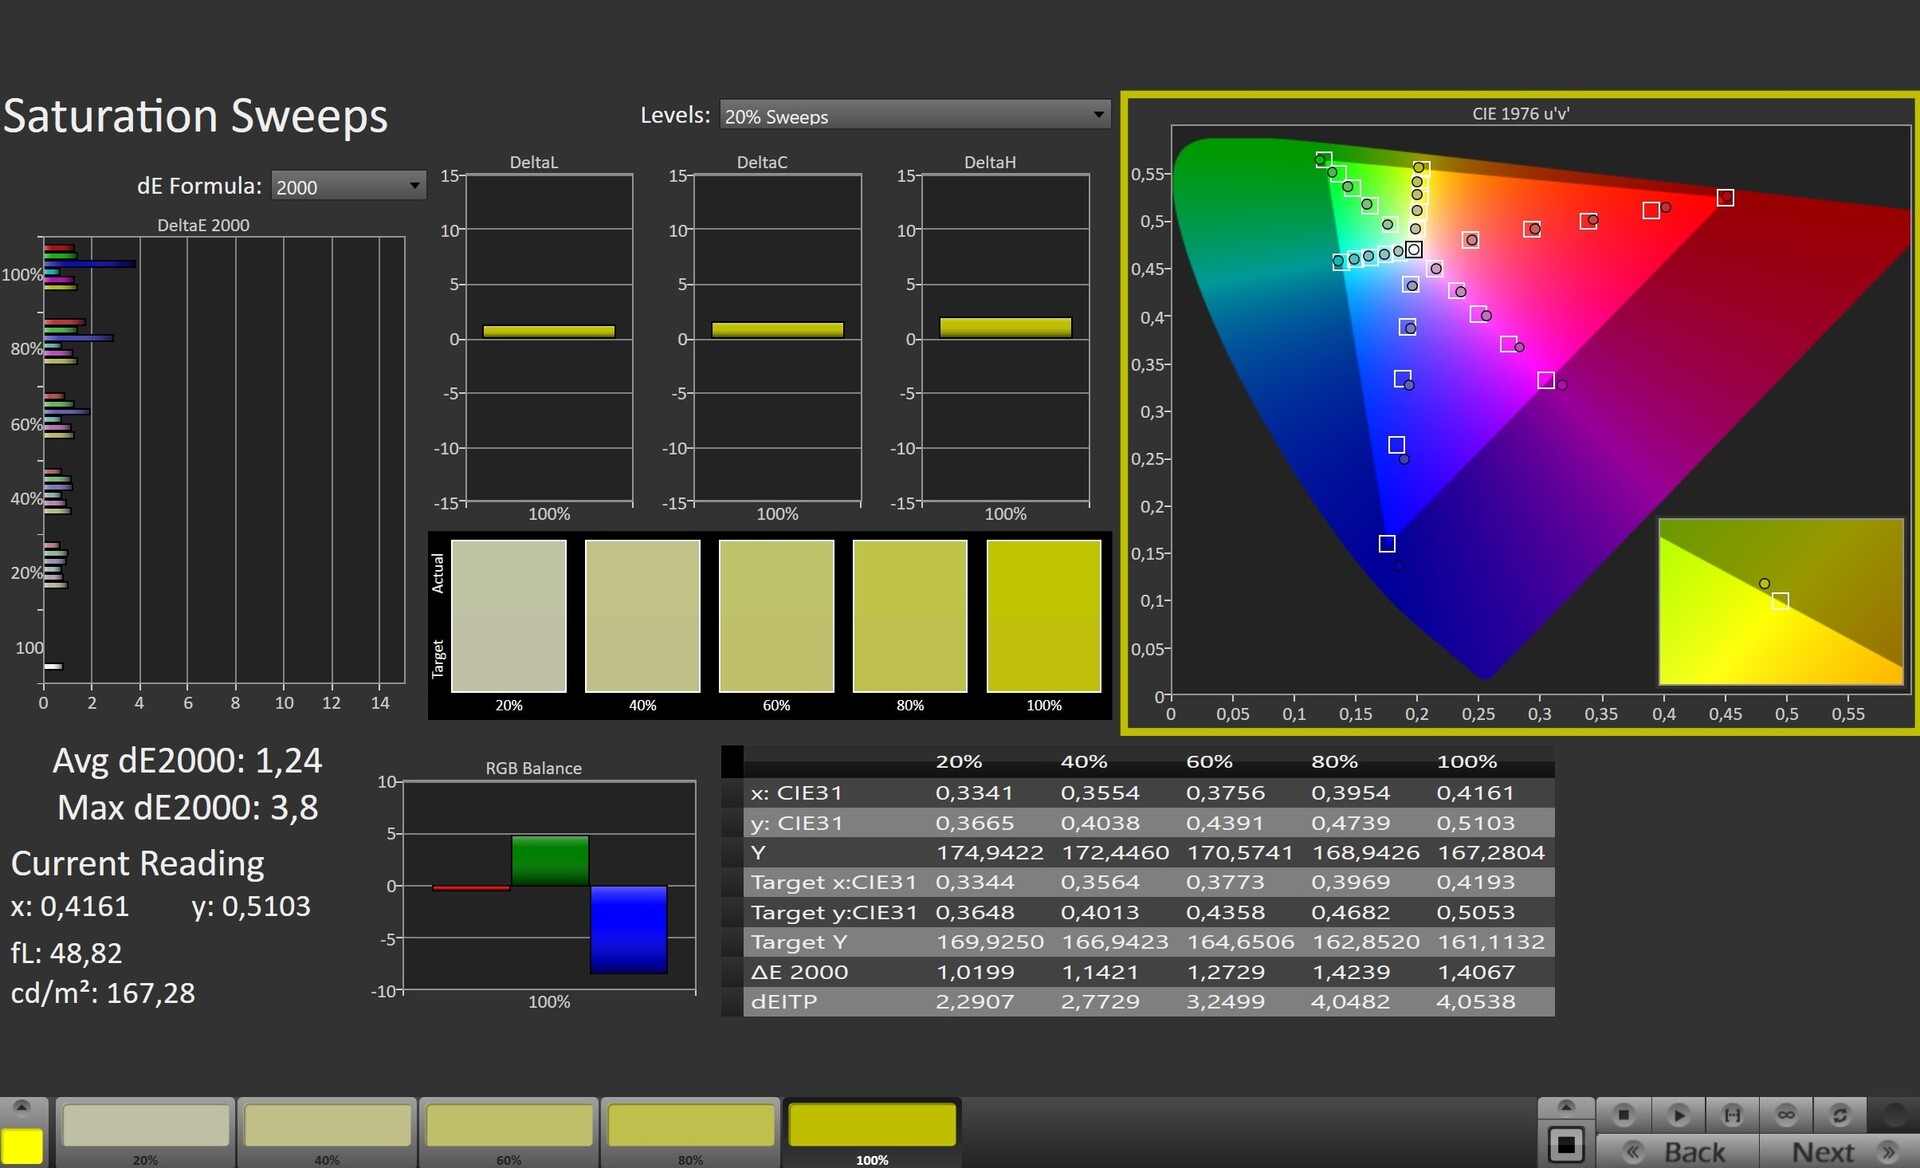
calibrated: 1.22
ΔE Greyscale Calman: 5 | ∀{0.09-98 Ø4.96}
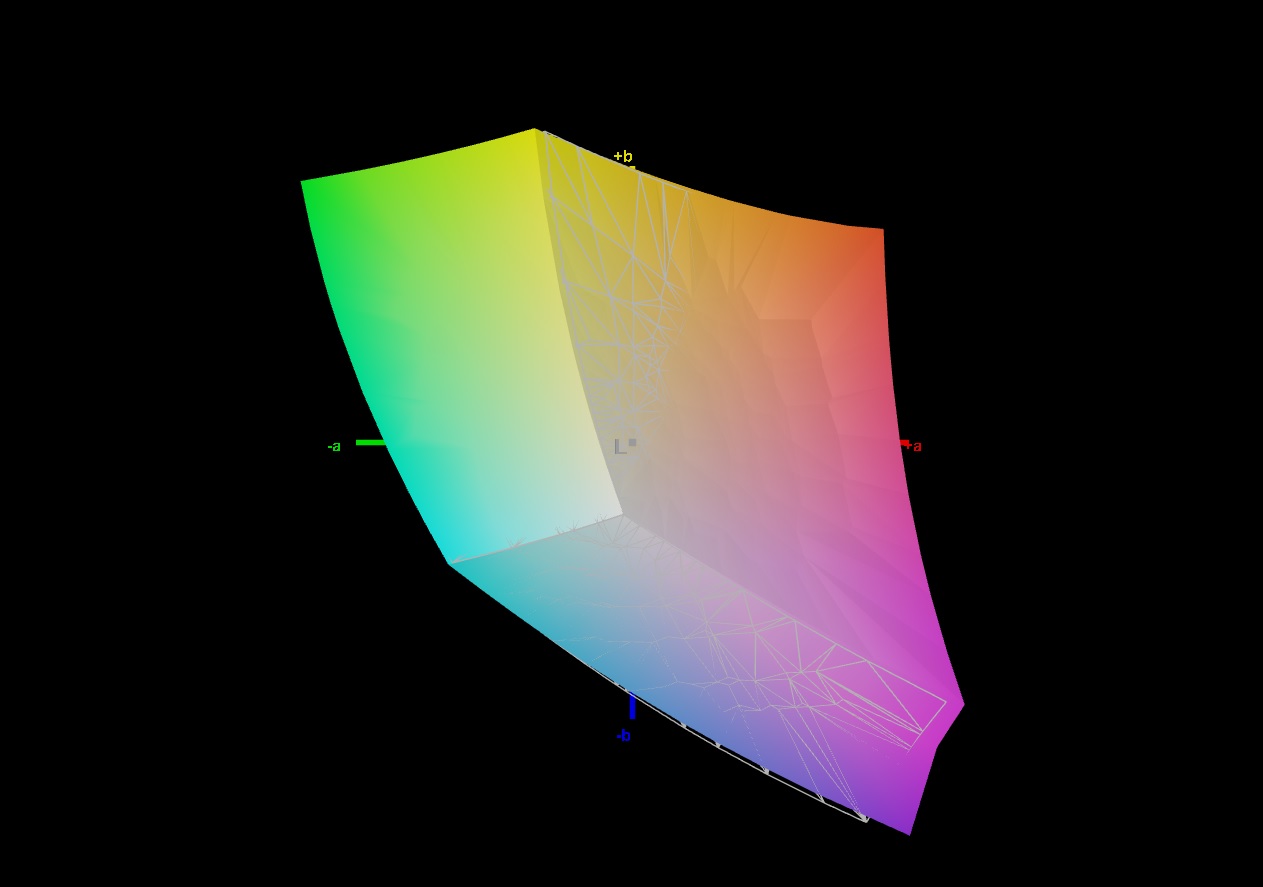
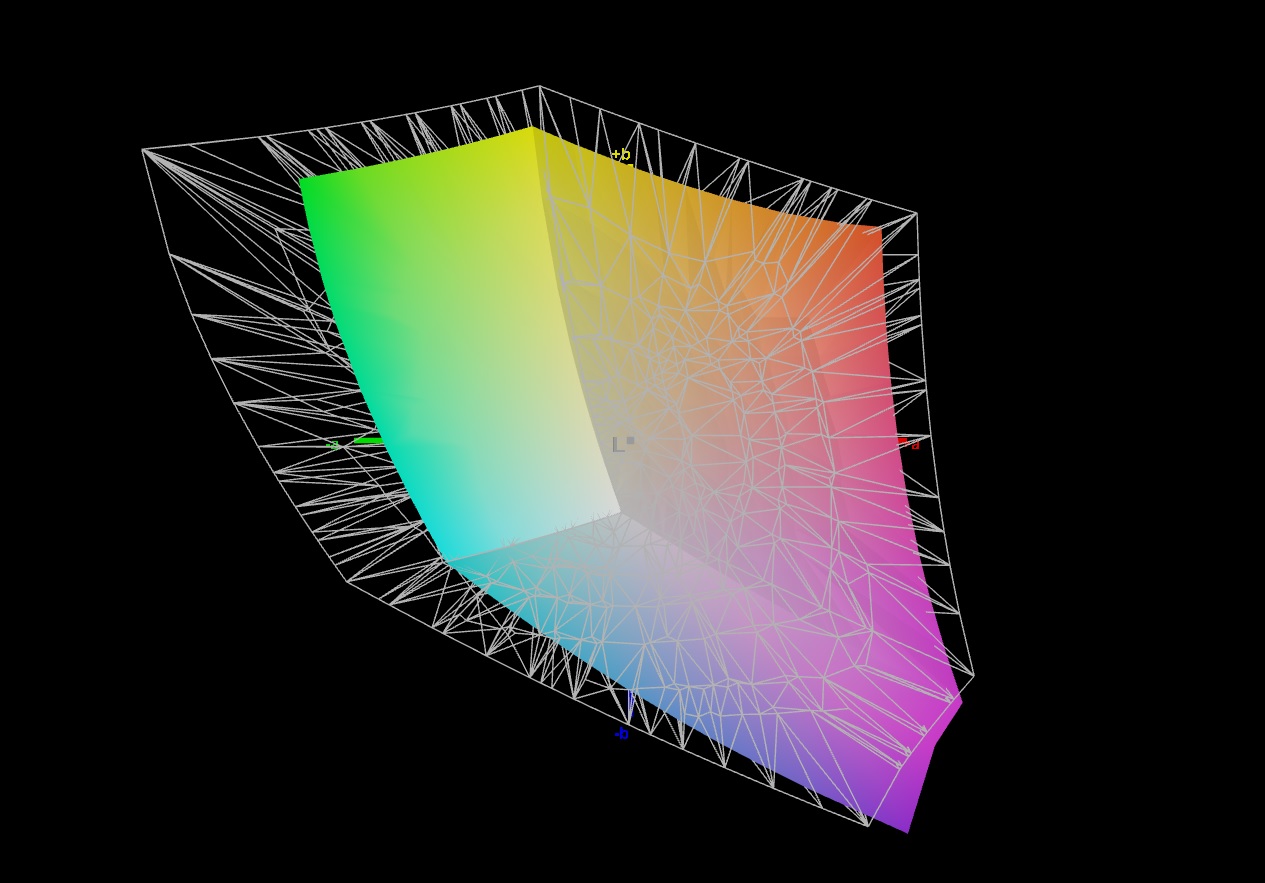
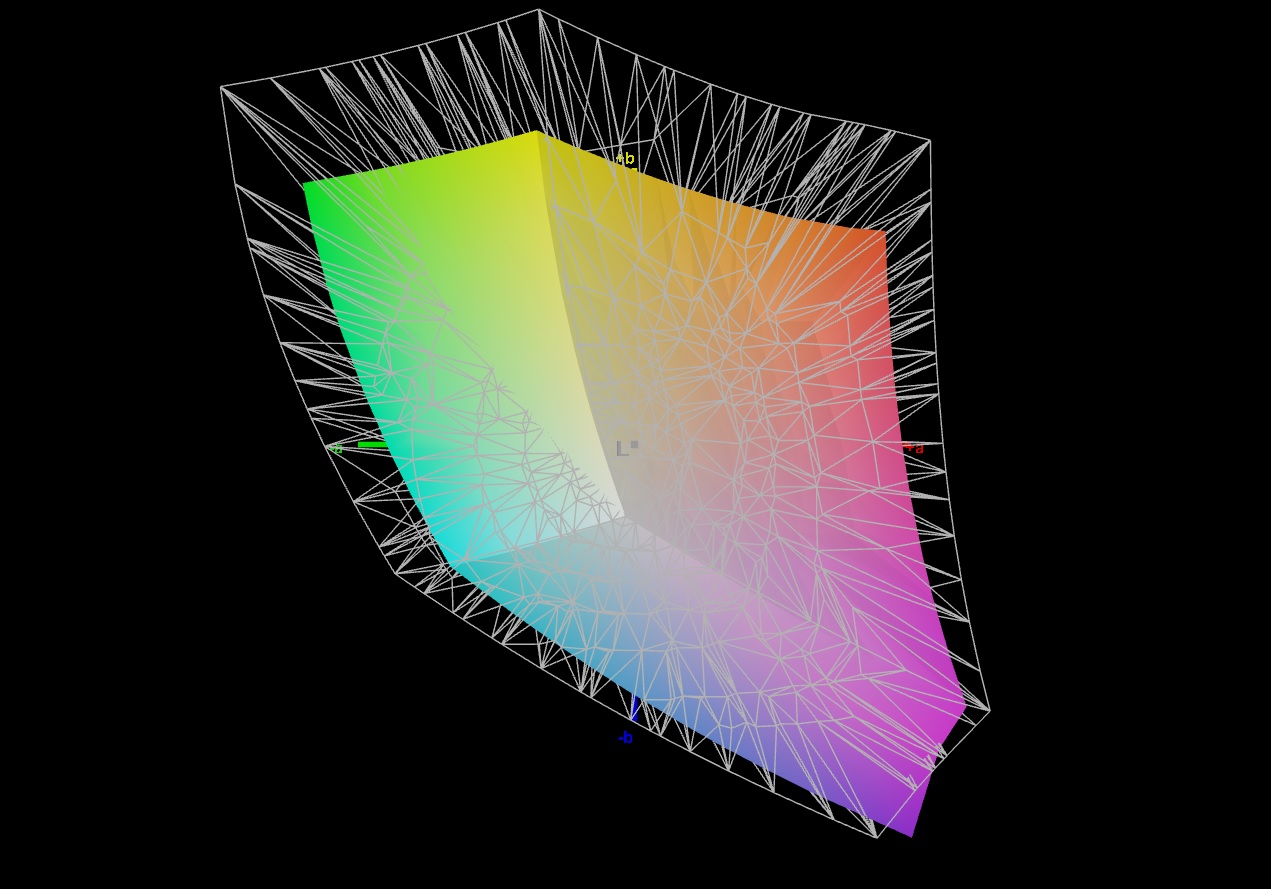
69.9% AdobeRGB 1998 (Argyll 3D)
99.2% sRGB (Argyll 3D)
69.1% Display P3 (Argyll 3D)
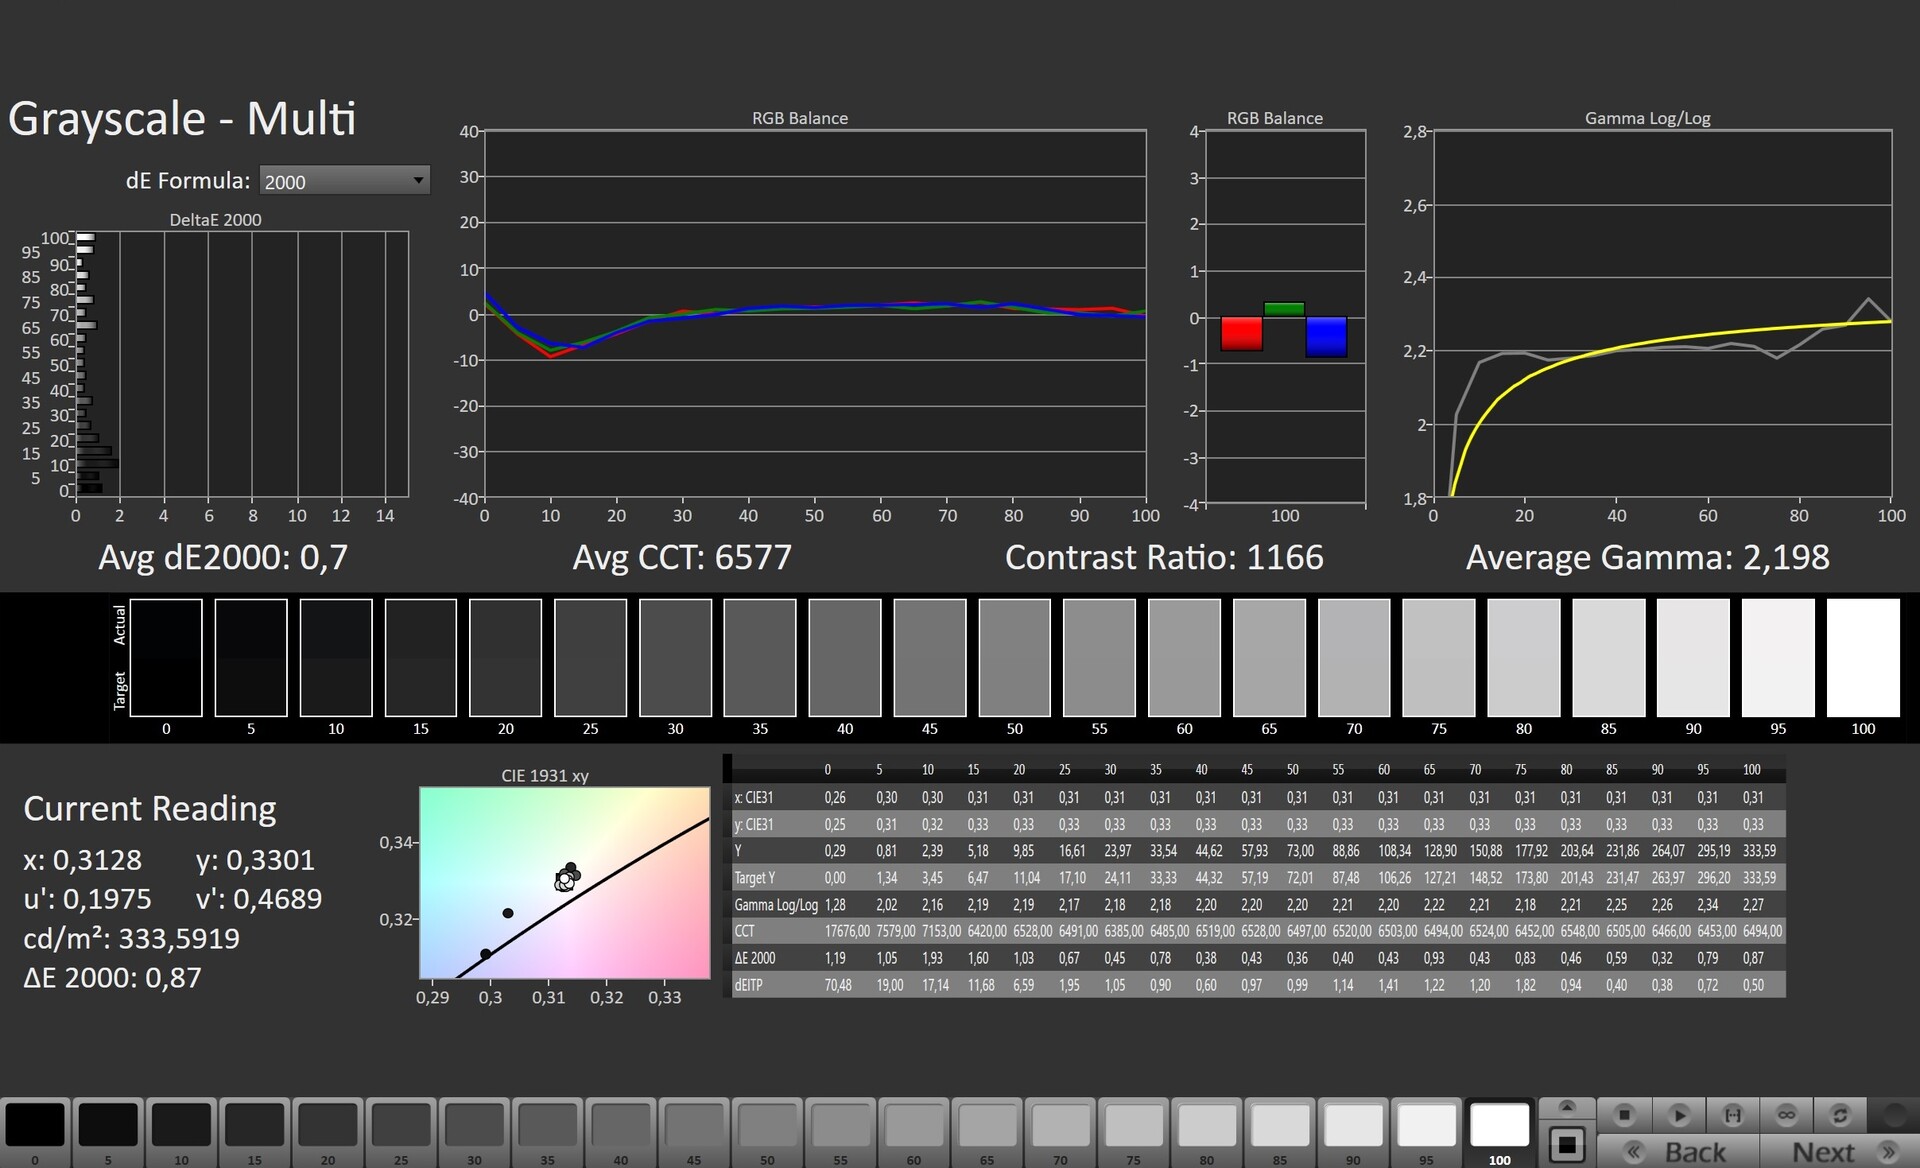
Gamma: 2.162
CCT: 7497 K
| Lenovo IdeaPad Gaming 3 15IAH7 Lenovo LEN156FHD, IPS, 1920x1080, 15.6" | Lenovo IdeaPad Gaming 3 15ARH7 LEN156FHD, IPS, 1920x1080, 15.6" | Dell G15 5515 BOE092A, IPS, 1920x1080, 15.6" | HP Victus 16-e0145ng CMN1609, IPS, 1920x1080, 16.1" | Dell Inspiron 16 Plus 7620 BOE NE16N41, IPS, 3072x1920, 16" | |
|---|---|---|---|---|---|
| Display | -42% | -43% | -39% | 2% | |
| Display P3 Coverage (%) | 69.1 | 39.4 -43% | 39.1 -43% | 41.6 -40% | 70.8 2% |
| sRGB Coverage (%) | 99.2 | 58 -42% | 56.9 -43% | 61.9 -38% | 99.5 0% |
| AdobeRGB 1998 Coverage (%) | 69.9 | 40.7 -42% | 40.4 -42% | 43 -38% | 73.2 5% |
| Response Times | -90% | -97% | -130% | -213% | |
| Response Time Grey 50% / Grey 80% * (ms) | 13 ? | 20.8 ? -60% | 25.2 ? -94% | 29.6 ? -128% | 38 ? -192% |
| Response Time Black / White * (ms) | 8.4 ? | 18.4 ? -119% | 16.8 ? -100% | 19.4 ? -131% | 28 ? -233% |
| PWM Frequency (Hz) | 200 ? | ||||
| Screen | -45% | -64% | -66% | 21% | |
| Brightness middle (cd/m²) | 338 | 287.8 -15% | 278 -18% | 257 -24% | 288.9 -15% |
| Brightness (cd/m²) | 329 | 268 -19% | 262 -20% | 239 -27% | 276 -16% |
| Brightness Distribution (%) | 92 | 86 -7% | 83 -10% | 88 -4% | 92 0% |
| Black Level * (cd/m²) | 0.27 | 0.3 -11% | 0.36 -33% | 0.25 7% | 0.26 4% |
| Contrast (:1) | 1252 | 959 -23% | 772 -38% | 1028 -18% | 1111 -11% |
| Colorchecker dE 2000 * | 2.88 | 6.3 -119% | 5.74 -99% | 6.91 -140% | 1.88 35% |
| Colorchecker dE 2000 max. * | 9.35 | 21.32 -128% | 19.63 -110% | 22.27 -138% | 4.37 53% |
| Colorchecker dE 2000 calibrated * | 1.22 | 2.53 -107% | 4.7 -285% | 3.61 -196% | 0.42 66% |
| Greyscale dE 2000 * | 5 | 4 20% | 3.1 38% | 7.5 -50% | 1.4 72% |
| Gamma | 2.162 102% | 2.21 100% | 2.011 109% | 2.125 104% | 2.3 96% |
| CCT | 7497 87% | 6762 96% | 6207 105% | 6025 108% | 6634 98% |
| Totaal Gemiddelde (Programma / Instellingen) | -59% /
-51% | -68% /
-64% | -78% /
-69% | -63% /
-16% |
* ... kleiner is beter
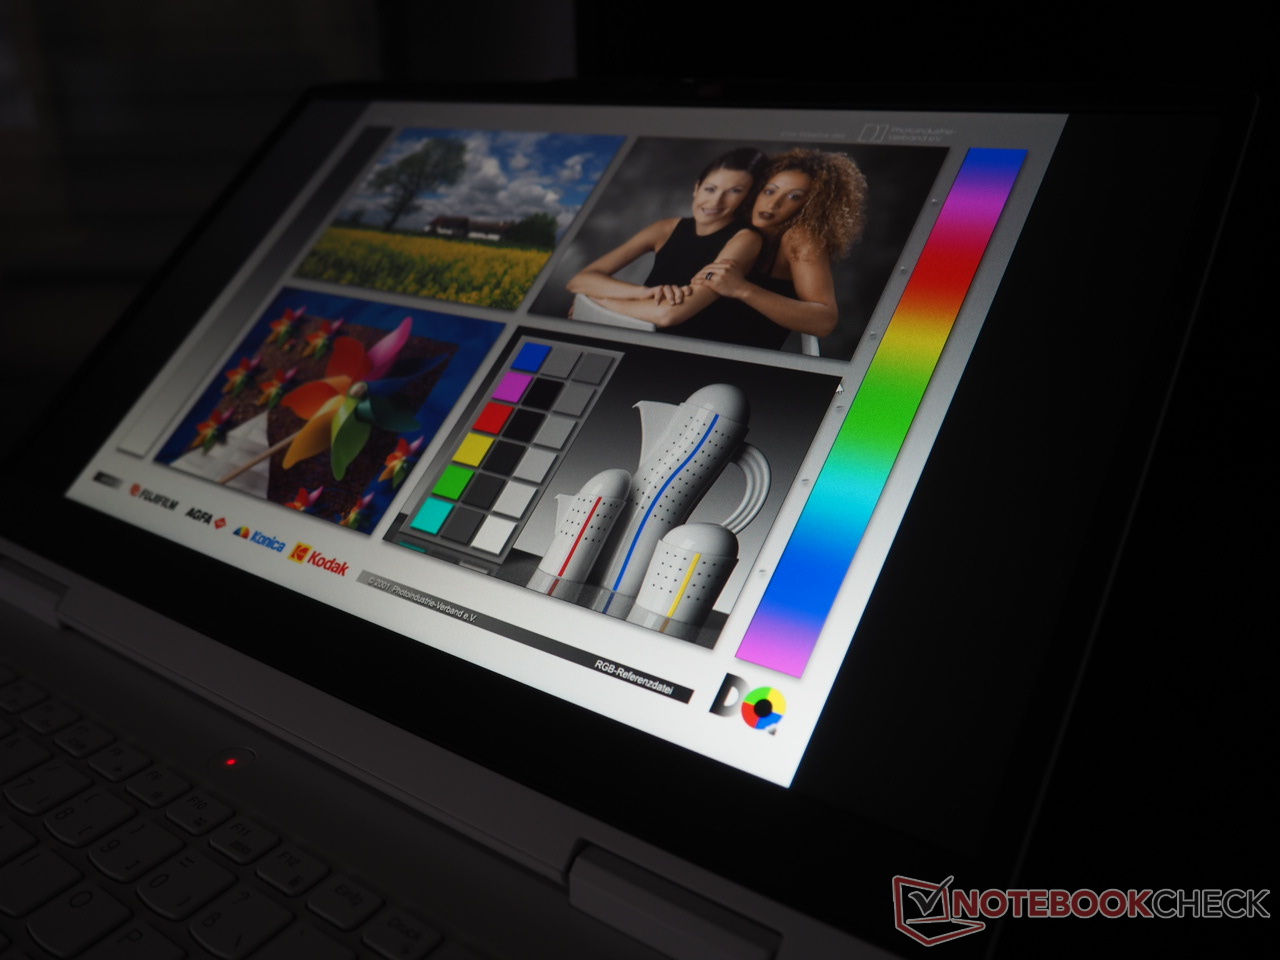
Kleine kleurruimtes en een lage helderheid zijn wijdverbreid in het segment van 1.000 euro. Maar dit is niet het geval met de IdeaPad Gaming 15 15IAH7: Ongeveer 100% sRGB dekking en een gemiddelde helderheid van 329 cd/m² doen recht aan de prijs van de laptop.
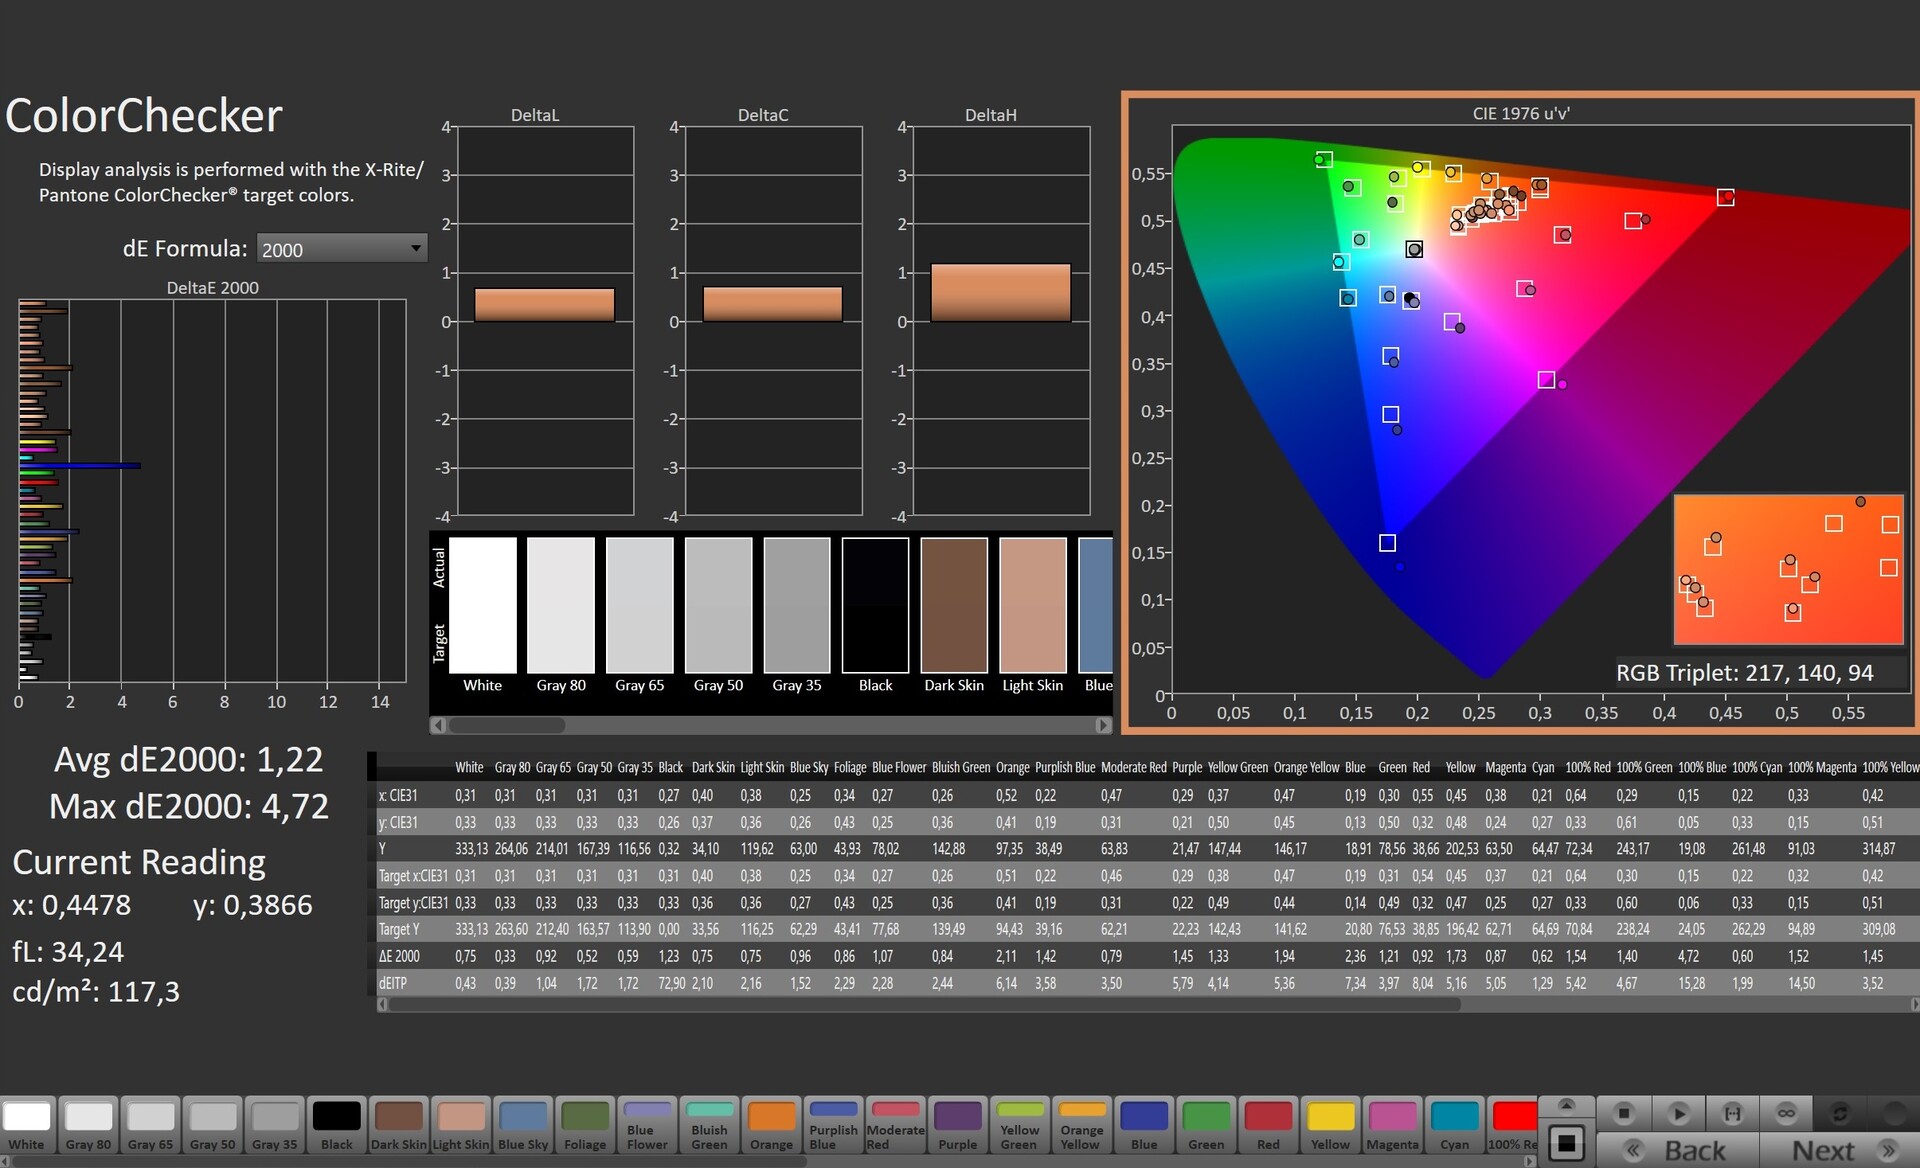
Ook in de overige disciplines slaat de 15-inch laptop een goed figuur. Een reactietijd van 8 tot 13 ms is zeker een goede waarde. Hetzelfde geldt ook voor het contrast van 1252:1, dat ook bovengemiddeld is.
Het enige waar je over zou kunnen klagen is de kleurnauwkeurigheid. Bij levering heeft het 165-Hz paneel een duidelijke blauwe tint. Dit kan echter worden gecorrigeerd met een kalibratie (ons ICC-bestand is rechtsboven gratis te downloaden, naast de grafiek van de helderheidsverdeling). Ons testtoestel vertoont geen schermbloedingen of PWM-flikkeringen.
Responstijd Scherm
| ↔ Responstijd Zwart naar Wit | ||
|---|---|---|
| 8.4 ms ... stijging ↗ en daling ↘ gecombineerd | ↗ 4.2 ms stijging | 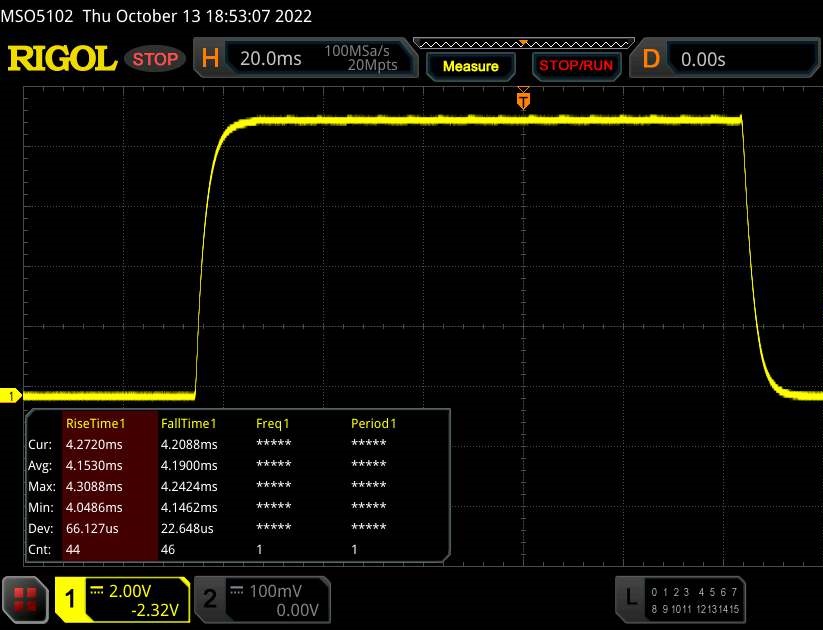 |
| ↘ 4.2 ms daling | ||
| Het scherm vertoonde snelle responstijden in onze tests en zou geschikt moeten zijn voor games. Ter vergelijking: alle testtoestellen variëren van 0.1 (minimum) tot 240 (maximum) ms. » 24 % van alle toestellen zijn beter. Dit betekent dat de gemeten responstijd beter is dan het gemiddelde (19.8 ms) van alle geteste toestellen. | ||
| ↔ Responstijd 50% Grijs naar 80% Grijs | ||
| 13 ms ... stijging ↗ en daling ↘ gecombineerd | ↗ 6.3 ms stijging | 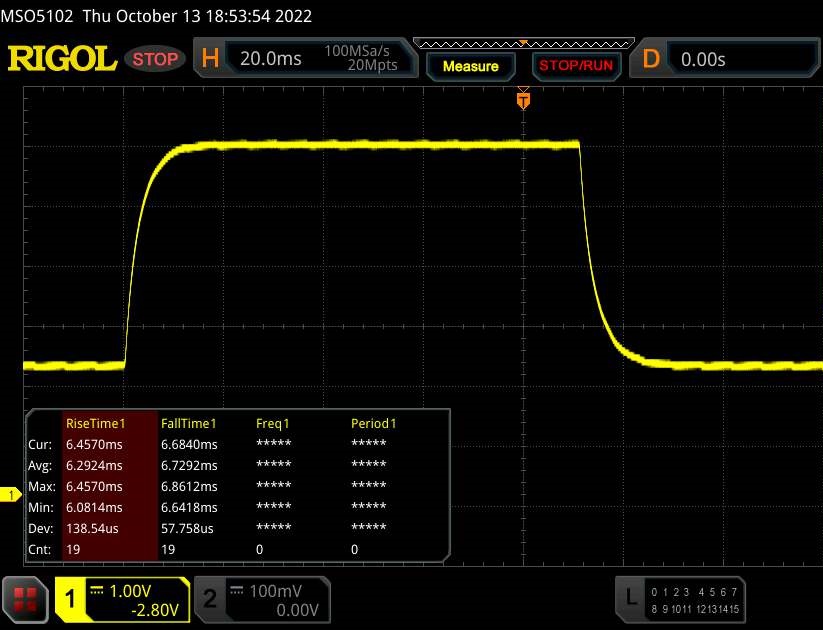 |
| ↘ 6.7 ms daling | ||
| Het scherm vertoonde prima responstijden in onze tests maar is misschien wat te traag voor competitieve games. Ter vergelijking: alle testtoestellen variëren van 0.165 (minimum) tot 636 (maximum) ms. » 27 % van alle toestellen zijn beter. Dit betekent dat de gemeten responstijd beter is dan het gemiddelde (31 ms) van alle geteste toestellen. | ||
Screen Flickering / PWM (Pulse-Width Modulation)
| Screen flickering / PWM niet waargenomen |  | ||
Ter vergelijking: 52 % van alle geteste toestellen maakten geen gebruik van PWM om de schermhelderheid te verlagen. Als het wel werd gebruikt, werd een gemiddelde van 7754 (minimum: 5 - maximum: 343500) Hz waargenomen. | |||
Prestaties
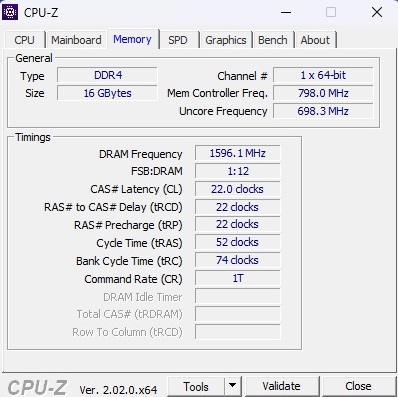
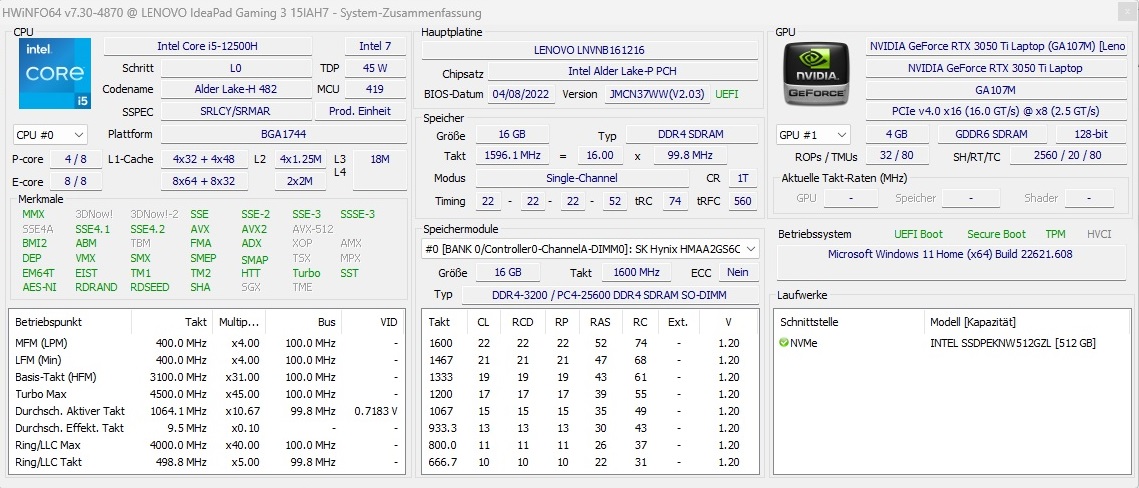
De prestaties van de IdeaPad Gaming 3 15IAH7 plaatsen hem in het middensegment. De processor met veel kernen en 16 GB werkgeheugen moeten voldoende reserves bieden voor de komende jaren, ook al had Lenovo om prestatieredenen dual-channel RAM moeten gebruiken in plaats van een enkele RAM-module. Hoewel de ingebouwde M.2 SSD alleen in het 2242 formaat wordt geleverd, biedt de behuizing nog steeds ruimte voor een klassieke 2280 SSD. De grafische kaart laat gemengde indrukken achter. Aan de ene kant biedt de RTX 3050 Ti een solide prijs-prestatieverhouding, maar aan de andere kant is 4 GB VRAM niet erg toekomstbestendig.
Testvoorwaarden
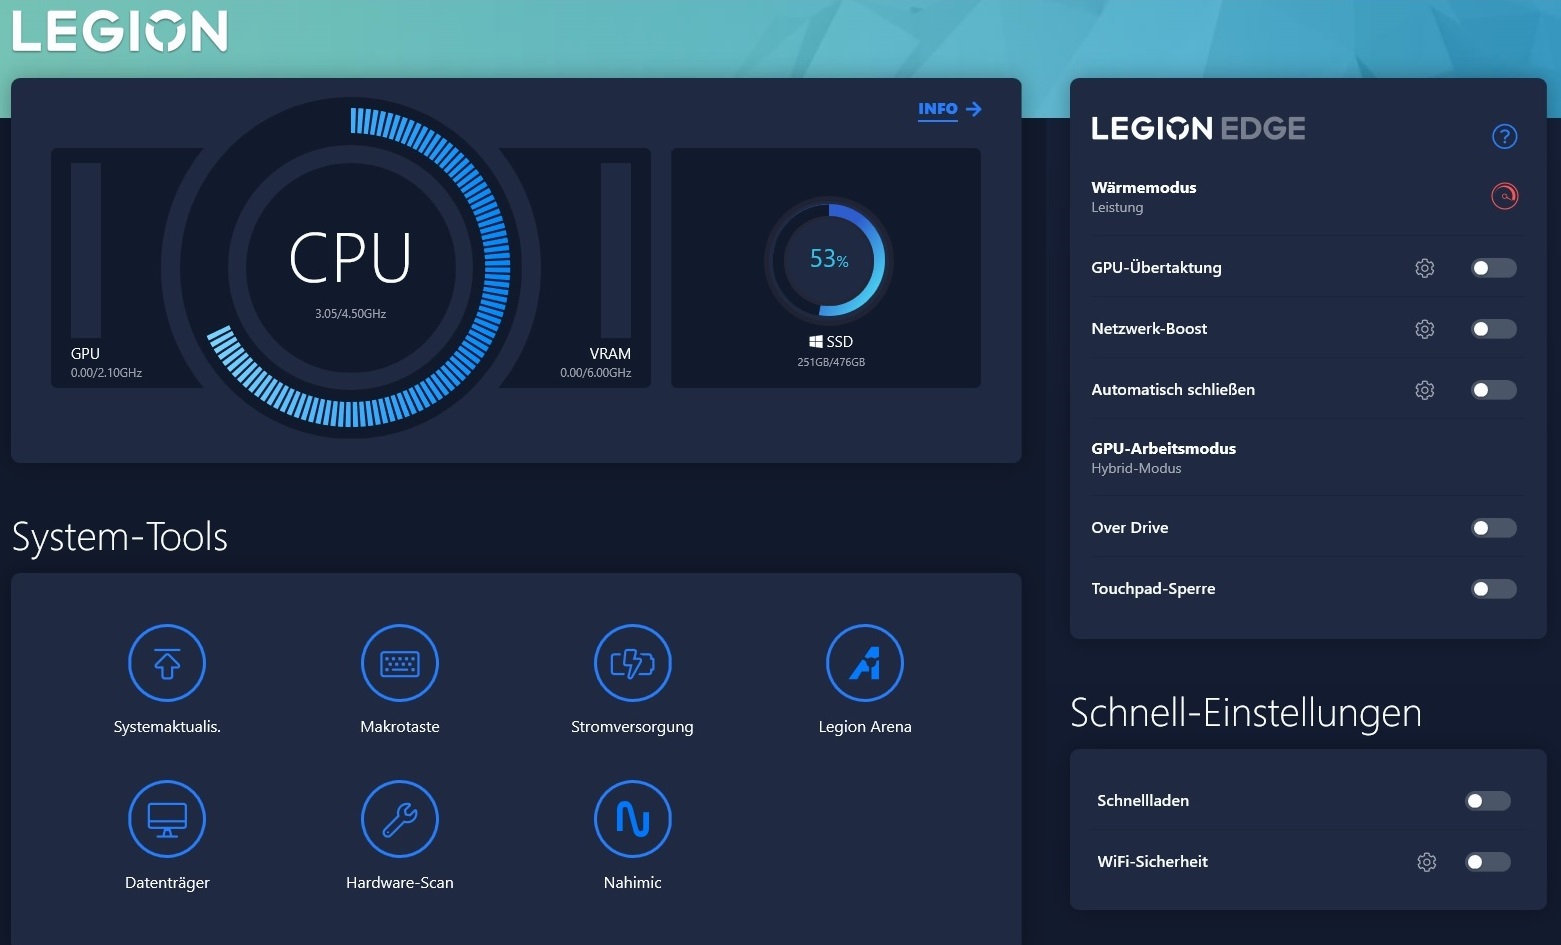
De voorgeïnstalleerde Lenovo Vantage software biedt tientallen instelmogelijkheden, waarvan vooral de energiemodus en de GPU werkmodus relevant zijn. Tenzij we anders vermelden, zijn al onze metingen uitgevoerd met de prestatiemodus en de reguliere hybride grafische schakeling geactiveerd. Gezien de geringe prestatievermindering (zie grafiek) zouden we in de praktijk echter eerder aanraden om de gebalanceerde modus (aangepast profiel) te gebruiken. In de Stille modus is de werking van het apparaat opnieuw aanzienlijk stiller. Ondanks een daling van ongeveer 30% in de framerates zijn veel games nog steeds speelbaar.


| De Witcher 3 (FHD/Ultra) | Geluidsniveau | Prestaties |
| Prestatiemodus | 46 dB(A) | basis (~60 FPS) |
| Aangepaste modus | 43 dB(A) | -7% (~56 FPS) |
| Stille modus | 34 dB(A) | -30% (~42 FPS) |
Processor
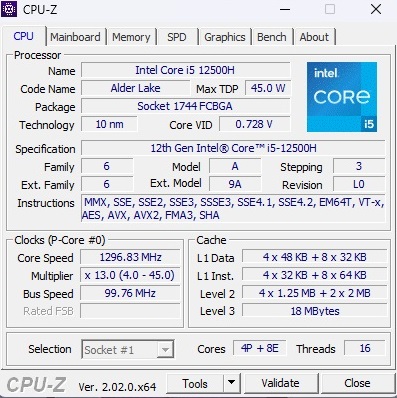
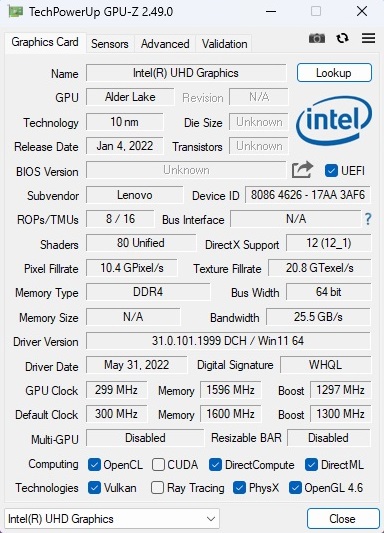
De Core i5-12500H is een 12-core model uit Intel's Alder Lake generatie dat 4 Performance cores (incl. hyperthreading) en 8 Efficiency cores (zonder hyperthreading) bevat en gespecificeerd is op een TDP van 45 Watt. In de CPU-tests levert de 10-nm chip zeer goede prestaties. Aangezien de prestaties ook constant stabiel blijven, ligt de IdeaPad Gaming 3 15IAH7 zelfs voor op de Core i7-12700Hvan de Dell Inspiron 16 Plus na een tijdje in de Cinebench loop, en bereikt de toppositie. De Ryzen CPU's van de andere concurrenten (R5 5600H, R5 6600H & R7 5800H) blijven iets achter.
Cinebench R15 Multi Constant Load Test
* ... kleiner is beter
AIDA64: FP32 Ray-Trace | FPU Julia | CPU SHA3 | CPU Queen | FPU SinJulia | FPU Mandel | CPU AES | CPU ZLib | FP64 Ray-Trace | CPU PhotoWorxx
| Performance rating | |
| Gemiddelde van klas Gaming | |
| Dell G15 5515 | |
| Dell Inspiron 16 Plus 7620 | |
| Lenovo IdeaPad Gaming 3 15IAH7 | |
| Gemiddeld Intel Core i5-12500H | |
| Lenovo IdeaPad Gaming 3 15ARH7 | |
| HP Victus 16-e0145ng | |
| AIDA64 / FP32 Ray-Trace | |
| Gemiddelde van klas Gaming (10227 - 85542, n=105, laatste 2 jaar) | |
| Dell G15 5515 | |
| Lenovo IdeaPad Gaming 3 15IAH7 | |
| Dell Inspiron 16 Plus 7620 | |
| Lenovo IdeaPad Gaming 3 15ARH7 | |
| Gemiddeld Intel Core i5-12500H (6851 - 13947, n=9) | |
| HP Victus 16-e0145ng | |
| AIDA64 / FPU Julia | |
| Gemiddelde van klas Gaming (51376 - 238426, n=105, laatste 2 jaar) | |
| Dell G15 5515 | |
| Lenovo IdeaPad Gaming 3 15ARH7 | |
| HP Victus 16-e0145ng | |
| Lenovo IdeaPad Gaming 3 15IAH7 | |
| Dell Inspiron 16 Plus 7620 | |
| Gemiddeld Intel Core i5-12500H (29874 - 68178, n=9) | |
| AIDA64 / CPU SHA3 | |
| Gemiddelde van klas Gaming (2180 - 10115, n=105, laatste 2 jaar) | |
| Lenovo IdeaPad Gaming 3 15IAH7 | |
| Dell G15 5515 | |
| Gemiddeld Intel Core i5-12500H (2287 - 3337, n=9) | |
| Dell Inspiron 16 Plus 7620 | |
| Lenovo IdeaPad Gaming 3 15ARH7 | |
| HP Victus 16-e0145ng | |
| AIDA64 / CPU Queen | |
| Gemiddelde van klas Gaming (49785 - 173351, n=90, laatste 2 jaar) | |
| Dell G15 5515 | |
| Dell Inspiron 16 Plus 7620 | |
| Lenovo IdeaPad Gaming 3 15IAH7 | |
| Gemiddeld Intel Core i5-12500H (77935 - 80703, n=9) | |
| Lenovo IdeaPad Gaming 3 15ARH7 | |
| HP Victus 16-e0145ng | |
| AIDA64 / FPU SinJulia | |
| Gemiddelde van klas Gaming (4424 - 33636, n=105, laatste 2 jaar) | |
| Dell G15 5515 | |
| Lenovo IdeaPad Gaming 3 15ARH7 | |
| HP Victus 16-e0145ng | |
| Dell Inspiron 16 Plus 7620 | |
| Lenovo IdeaPad Gaming 3 15IAH7 | |
| Gemiddeld Intel Core i5-12500H (6590 - 7431, n=9) | |
| AIDA64 / FPU Mandel | |
| Gemiddelde van klas Gaming (25115 - 128721, n=105, laatste 2 jaar) | |
| Dell G15 5515 | |
| Lenovo IdeaPad Gaming 3 15ARH7 | |
| HP Victus 16-e0145ng | |
| Lenovo IdeaPad Gaming 3 15IAH7 | |
| Dell Inspiron 16 Plus 7620 | |
| Gemiddeld Intel Core i5-12500H (18252 - 34041, n=9) | |
| AIDA64 / CPU AES | |
| Dell G15 5515 | |
| Lenovo IdeaPad Gaming 3 15IAH7 | |
| Gemiddelde van klas Gaming (39258 - 247074, n=105, laatste 2 jaar) | |
| Lenovo IdeaPad Gaming 3 15ARH7 | |
| Gemiddeld Intel Core i5-12500H (50298 - 111567, n=9) | |
| Dell Inspiron 16 Plus 7620 | |
| HP Victus 16-e0145ng | |
| AIDA64 / CPU ZLib | |
| Gemiddelde van klas Gaming (574 - 2531, n=105, laatste 2 jaar) | |
| Dell Inspiron 16 Plus 7620 | |
| Lenovo IdeaPad Gaming 3 15IAH7 | |
| Gemiddeld Intel Core i5-12500H (746 - 924, n=9) | |
| Dell G15 5515 | |
| Lenovo IdeaPad Gaming 3 15ARH7 | |
| HP Victus 16-e0145ng | |
| AIDA64 / FP64 Ray-Trace | |
| Gemiddelde van klas Gaming (5509 - 45446, n=105, laatste 2 jaar) | |
| Dell G15 5515 | |
| Lenovo IdeaPad Gaming 3 15IAH7 | |
| Dell Inspiron 16 Plus 7620 | |
| Lenovo IdeaPad Gaming 3 15ARH7 | |
| Gemiddeld Intel Core i5-12500H (3848 - 7405, n=9) | |
| HP Victus 16-e0145ng | |
| AIDA64 / CPU PhotoWorxx | |
| Gemiddelde van klas Gaming (12271 - 89891, n=105, laatste 2 jaar) | |
| Dell Inspiron 16 Plus 7620 | |
| Gemiddeld Intel Core i5-12500H (13686 - 43813, n=9) | |
| HP Victus 16-e0145ng | |
| Lenovo IdeaPad Gaming 3 15ARH7 | |
| Dell G15 5515 | |
| Lenovo IdeaPad Gaming 3 15IAH7 | |
Systeemprestaties
Volgens PCMark 10 zijn de systeemprestaties ook respectabel. Met 6.755 punten wordt hij alleen verslagen door de Dell Inspiron 16 Plus. Subjectief gezien reageert het besturingssysteem comfortabel snel.
CrossMark: Overall | Productivity | Creativity | Responsiveness
| PCMark 10 / Score | |
| Gemiddelde van klas Gaming (5828 - 12414, n=93, laatste 2 jaar) | |
| Dell Inspiron 16 Plus 7620 | |
| Lenovo IdeaPad Gaming 3 15IAH7 | |
| Lenovo IdeaPad Gaming 3 15ARH7 | |
| Dell G15 5515 | |
| HP Victus 16-e0145ng | |
| PCMark 10 / Essentials | |
| Gemiddelde van klas Gaming (8810 - 11935, n=97, laatste 2 jaar) | |
| Dell Inspiron 16 Plus 7620 | |
| Lenovo IdeaPad Gaming 3 15IAH7 | |
| HP Victus 16-e0145ng | |
| Dell G15 5515 | |
| Lenovo IdeaPad Gaming 3 15ARH7 | |
| PCMark 10 / Productivity | |
| Gemiddelde van klas Gaming (6845 - 25323, n=95, laatste 2 jaar) | |
| Lenovo IdeaPad Gaming 3 15IAH7 | |
| Dell Inspiron 16 Plus 7620 | |
| Lenovo IdeaPad Gaming 3 15ARH7 | |
| Dell G15 5515 | |
| HP Victus 16-e0145ng | |
| PCMark 10 / Digital Content Creation | |
| Gemiddelde van klas Gaming (7602 - 19954, n=95, laatste 2 jaar) | |
| Dell Inspiron 16 Plus 7620 | |
| Lenovo IdeaPad Gaming 3 15IAH7 | |
| HP Victus 16-e0145ng | |
| Dell G15 5515 | |
| Lenovo IdeaPad Gaming 3 15ARH7 | |
| CrossMark / Overall | |
| Gemiddelde van klas Gaming (1366 - 2409, n=94, laatste 2 jaar) | |
| Dell Inspiron 16 Plus 7620 | |
| Lenovo IdeaPad Gaming 3 15ARH7 | |
| CrossMark / Productivity | |
| Gemiddelde van klas Gaming (1386 - 2254, n=94, laatste 2 jaar) | |
| Dell Inspiron 16 Plus 7620 | |
| Lenovo IdeaPad Gaming 3 15ARH7 | |
| CrossMark / Creativity | |
| Gemiddelde van klas Gaming (1343 - 2786, n=94, laatste 2 jaar) | |
| Dell Inspiron 16 Plus 7620 | |
| Lenovo IdeaPad Gaming 3 15ARH7 | |
| CrossMark / Responsiveness | |
| Gemiddelde van klas Gaming (1226 - 2334, n=94, laatste 2 jaar) | |
| Dell Inspiron 16 Plus 7620 | |
| Lenovo IdeaPad Gaming 3 15ARH7 | |
| PCMark 10 Score | 6755 punten | |
Help | ||
| AIDA64 / Memory Copy | |
| Gemiddelde van klas Gaming (21750 - 129946, n=105, laatste 2 jaar) | |
| Dell Inspiron 16 Plus 7620 | |
| Gemiddeld Intel Core i5-12500H (23850 - 66598, n=9) | |
| HP Victus 16-e0145ng | |
| Dell G15 5515 | |
| Lenovo IdeaPad Gaming 3 15ARH7 | |
| Lenovo IdeaPad Gaming 3 15IAH7 | |
| AIDA64 / Memory Read | |
| Gemiddelde van klas Gaming (22956 - 118858, n=105, laatste 2 jaar) | |
| Dell Inspiron 16 Plus 7620 | |
| Gemiddeld Intel Core i5-12500H (24879 - 68013, n=9) | |
| HP Victus 16-e0145ng | |
| Dell G15 5515 | |
| Lenovo IdeaPad Gaming 3 15ARH7 | |
| Lenovo IdeaPad Gaming 3 15IAH7 | |
| AIDA64 / Memory Write | |
| Gemiddelde van klas Gaming (22297 - 135096, n=105, laatste 2 jaar) | |
| Dell Inspiron 16 Plus 7620 | |
| Gemiddeld Intel Core i5-12500H (23543 - 58797, n=9) | |
| HP Victus 16-e0145ng | |
| Dell G15 5515 | |
| Lenovo IdeaPad Gaming 3 15ARH7 | |
| Lenovo IdeaPad Gaming 3 15IAH7 | |
| AIDA64 / Memory Latency | |
| Gemiddelde van klas Gaming (75.3 - 259, n=105, laatste 2 jaar) | |
| Gemiddeld Intel Core i5-12500H (83.8 - 114.7, n=9) | |
| Dell Inspiron 16 Plus 7620 | |
| Lenovo IdeaPad Gaming 3 15IAH7 | |
| Lenovo IdeaPad Gaming 3 15ARH7 | |
| Dell G15 5515 | |
| HP Victus 16-e0145ng | |
* ... kleiner is beter
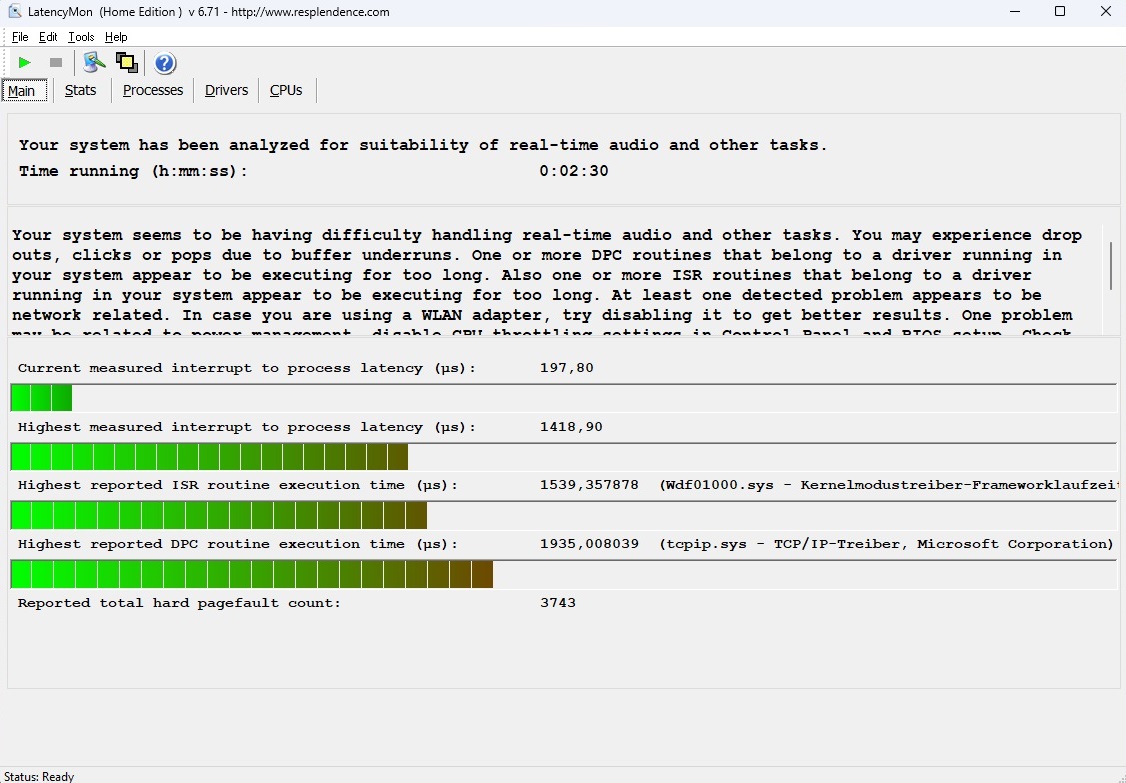
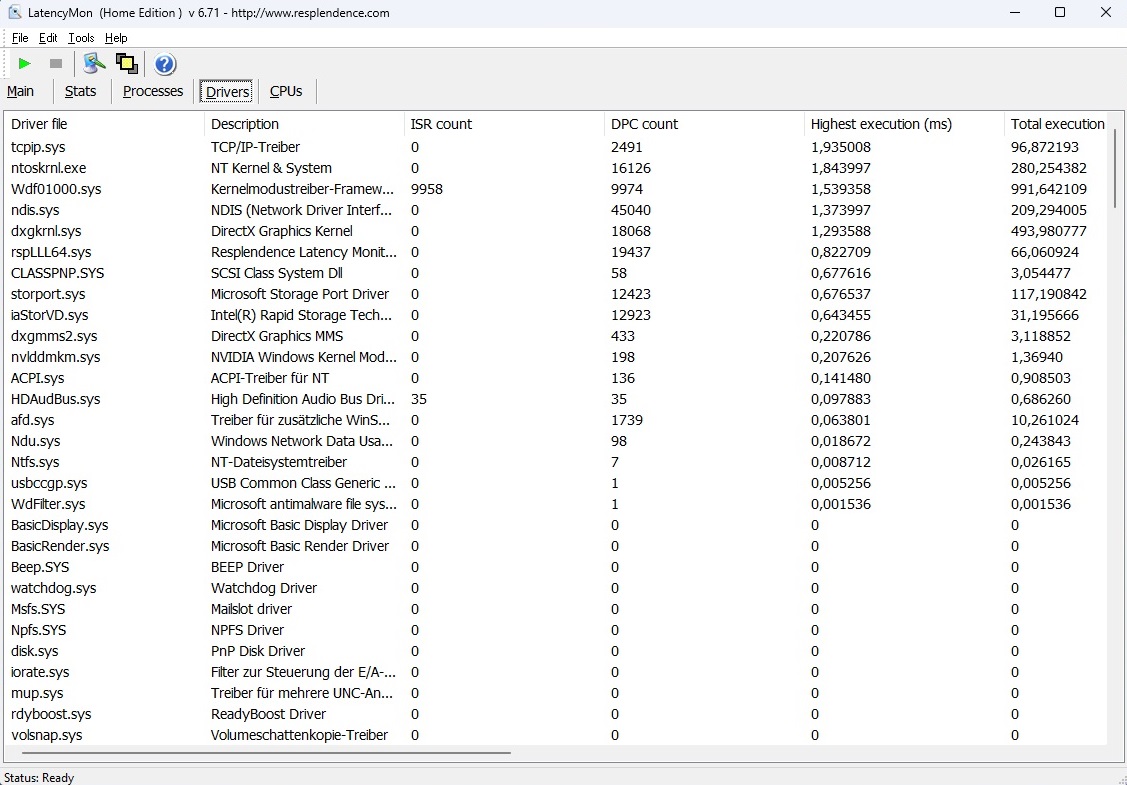
DPC wachttijden
In de latentietest doet de 15-inch laptop het niet zo goed. De LatencyMon tool vermeldt potentiële problemen met real-time audio en video verwerking. Slechts zeer weinig gebruikers zouden echter last moeten hebben van deze toepassingsscenario's.
| DPC Latencies / LatencyMon - interrupt to process latency (max), Web, Youtube, Prime95 | |
| Lenovo IdeaPad Gaming 3 15IAH7 | |
| Dell Inspiron 16 Plus 7620 | |
| HP Victus 16-e0145ng | |
| Lenovo IdeaPad Gaming 3 15ARH7 | |
| Dell G15 5515 | |
* ... kleiner is beter
Opslagoplossing
De SSD prestaties eindigen in het midden van ons vergelijkingsveld. Het 512-GB model van Intel (660p) is noch bijzonder snel, noch bijzonder traag voor een NVMe schijf. Het is mooi dat - net als de CPU-snelheid - ook de SSD-snelheid relatief constant blijft.

* ... kleiner is beter
Constant Performance Reading: DiskSpd Read Loop, Queue Depth 8
Grafische kaart
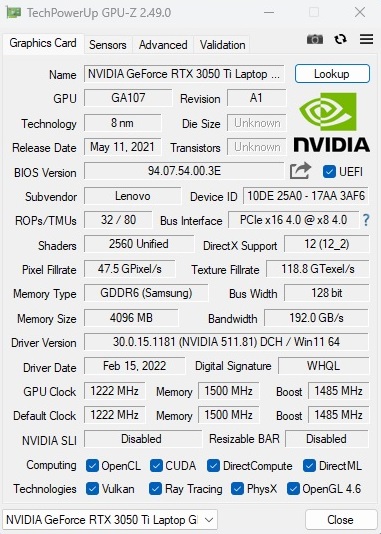
De prestaties van Nvidia's Ampere GPU's hangen in grote mate af van de aangepaste TGP. Lenovo koos voor een relatief hoge waarde in de IdeaPad Gaming 3, wat de benchmarkresultaten ten goede komt. 85 Watt is behoorlijk veel voor een RTX 3050 Ti. De 15-inch laptop doet het navenant goed in de 3DMarks benchmarks. Als je alle waarden optelt, is de RTX 3050 Ti bijna 25% sneller dan het huidige gemiddelde van deze grafische kaart. Tot op zekere hoogte maakt dit goed dat je nu al apparaten kunt krijgen met de RTX 3060, die 6 in plaats van 4 GB VRAM bevat, in het segment van 1000 euro.
| 3DMark 11 Performance | 19254 punten | |
| 3DMark Cloud Gate Standard Score | 48874 punten | |
| 3DMark Fire Strike Score | 14086 punten | |
| 3DMark Time Spy Score | 6213 punten | |
Help | ||
* ... kleiner is beter
Spelprestaties
De positieve trend uit de synthetische grafische tests zet zich voort in onze gaming testruns. Hoewel de prestaties in sommige games aanzienlijk kunnen lijden onder het enkelkanaals RAM (daarom zouden we aanraden om over te schakelen naar 2x 8 GB), draaien games die niet RAM zwaar zijn ook aanzienlijk sneller dan op een RTX 3050 Ti met een lagere TGP.
| The Witcher 3 | |
| 1920x1080 High Graphics & Postprocessing (Nvidia HairWorks Off) | |
| Gemiddelde van klas Gaming (341 - 404, n=2, laatste 2 jaar) | |
| Lenovo IdeaPad Gaming 3 15IAH7 | |
| Dell Inspiron 16 Plus 7620 | |
| Lenovo IdeaPad Gaming 3 15ARH7 | |
| HP Victus 16-e0145ng | |
| Dell G15 5515 | |
| Gemiddeld NVIDIA GeForce RTX 3050 Ti Laptop GPU (30 - 110, n=26) | |
| 1920x1080 Ultra Graphics & Postprocessing (HBAO+) | |
| Gemiddelde van klas Gaming (104.7 - 240, n=7, laatste 2 jaar) | |
| Lenovo IdeaPad Gaming 3 15IAH7 | |
| Dell Inspiron 16 Plus 7620 | |
| Dell G15 5515 | |
| Lenovo IdeaPad Gaming 3 15ARH7 | |
| HP Victus 16-e0145ng | |
| Gemiddeld NVIDIA GeForce RTX 3050 Ti Laptop GPU (19 - 58.5, n=29) | |
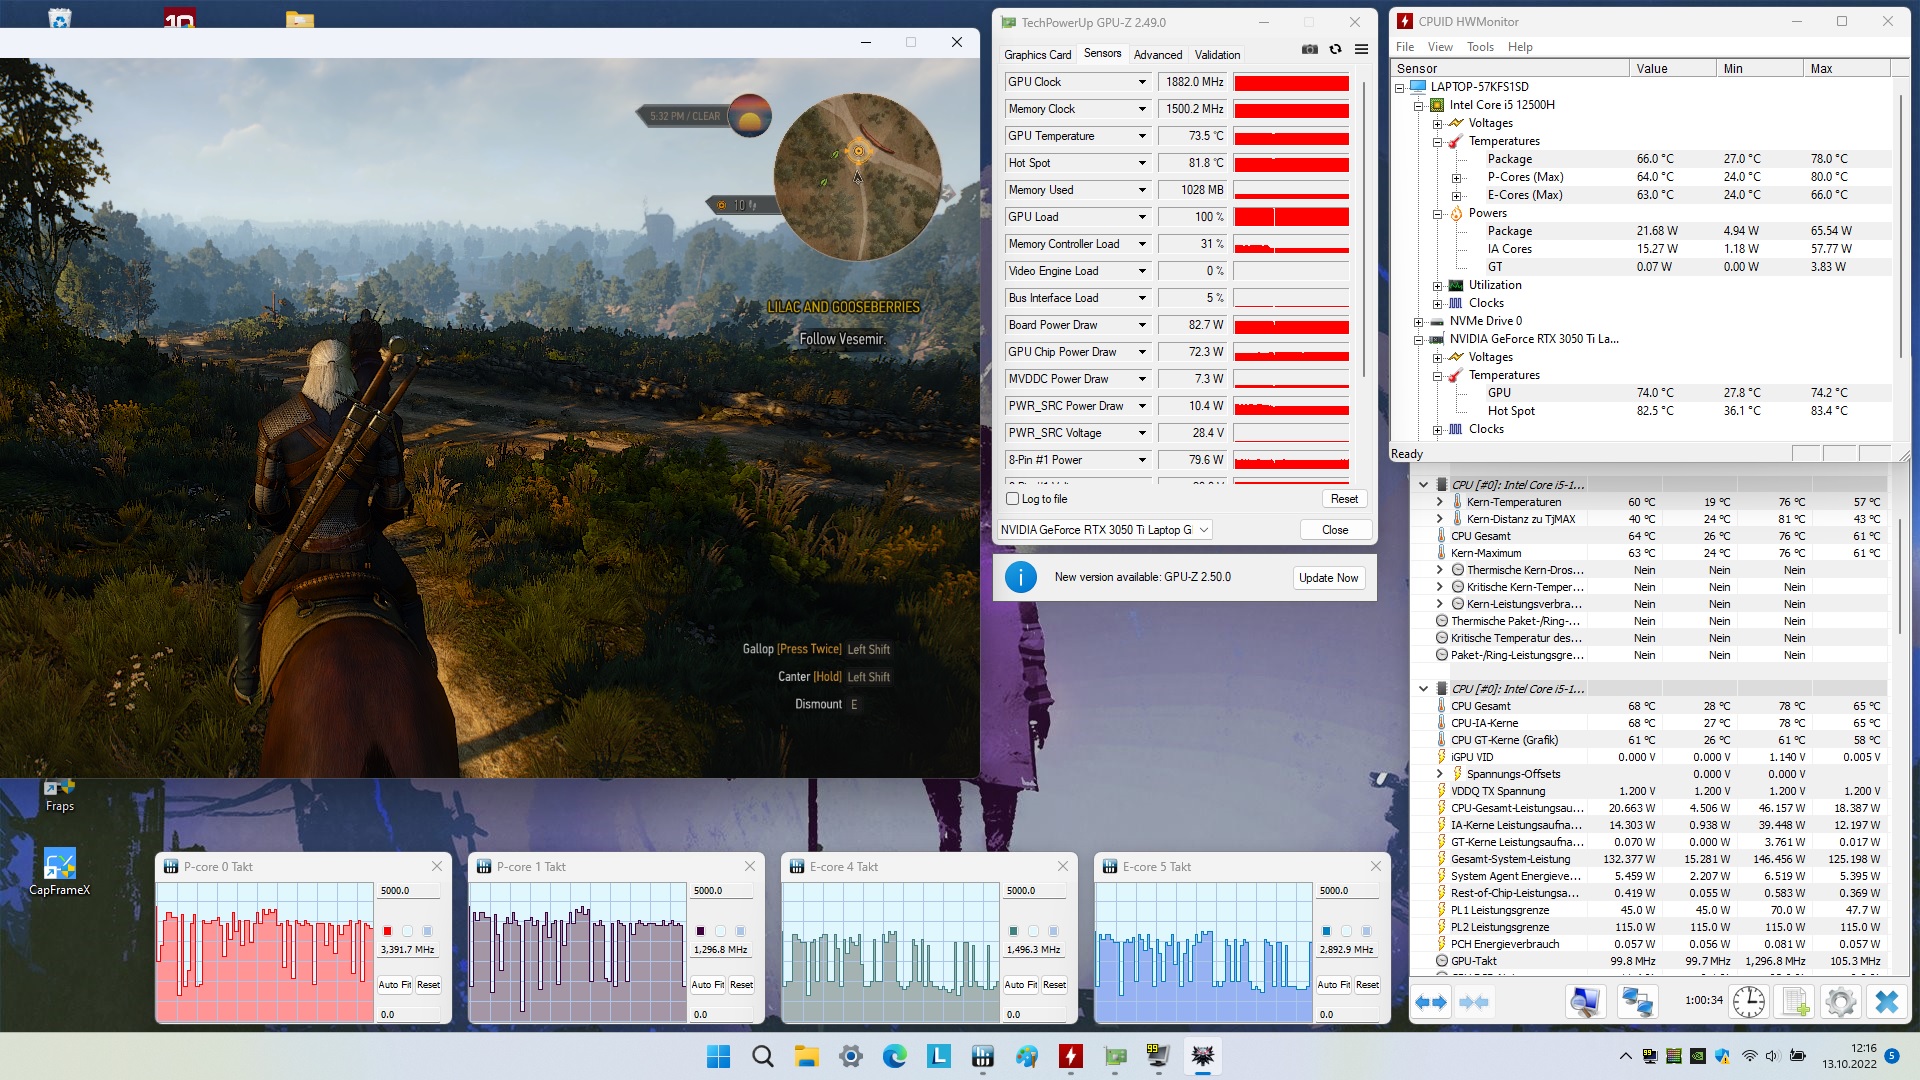
We merken geen opvallende gedragingen op die opvielen in onze 60 minuten durende constante test met De Witcher 3. In principe kan de IdeaPad Gaming 3 15IAH7 bijna alle moderne games aan met hoge tot maximale details in de native resolutie van 1920 x 1080 pixels, zolang je het doet zonder ray tracing (waar de RTX 3050 Ti enkele aanzienlijke zwakheden vertoont).
The Witcher 3 FPS Chart
| lage | gem. | hoge | ultra | |
|---|---|---|---|---|
| GTA V (2015) | 160.7 | 130.6 | 73.5 | |
| The Witcher 3 (2015) | 173 | 110 | 58.5 | |
| Dota 2 Reborn (2015) | 145.9 | 127.3 | 113.8 | 107.8 |
| Final Fantasy XV Benchmark (2018) | 81.5 | 58.8 | ||
| X-Plane 11.11 (2018) | 109.9 | 98.1 | 81.1 | |
| Strange Brigade (2018) | 145.5 | 117.3 | 101.3 | |
| Ghostwire Tokyo (2022) | 79.5 | 76.8 | 75.9 | |
| Tiny Tina's Wonderlands (2022) | 92.1 | 67.2 | 51.7 | |
| Vampire Bloodhunt (2022) | 111.8 | 110.9 | 106.1 | |
| F1 22 (2022) | 111 | 92 | 32 | |
| The Quarry (2022) | 69.7 | 58.3 | 45.8 |
Emissies
Geluidsemissies
In de prestatiemodus is de 15-inch laptop niet erg stil. Al tijdens stationair gebruik hoor je met 29 tot 32 dB(A) veel ventilatorgeluid. Onder belasting produceert het apparaat een enorme hoeveelheid geluid met 42 tot 54 dB(A), hoewel andere gaming laptops zoals de Victus 16 even luid worden. Dankzij de twee andere energiestanden kan het apparaat echter gemakkelijk en snel stiller worden gemaakt.
Geluidsniveau
| Onbelast |
| 29 / 30 / 32 dB (A) |
| Belasting |
| 42 / 54 dB (A) |
 | ||
30 dB stil 40 dB(A) hoorbaar 50 dB(A) luid |
||
min: | ||
| Lenovo IdeaPad Gaming 3 15IAH7 GeForce RTX 3050 Ti Laptop GPU, i5-12500H | Lenovo IdeaPad Gaming 3 15ARH7 GeForce RTX 3050 4GB Laptop GPU, R5 6600H | Dell G15 5515 GeForce RTX 3050 Ti Laptop GPU, R7 5800H | HP Victus 16-e0145ng GeForce RTX 3050 Ti Laptop GPU, R5 5600H | Dell Inspiron 16 Plus 7620 GeForce RTX 3050 Ti Laptop GPU, i7-12700H | |
|---|---|---|---|---|---|
| Noise | 11% | 7% | 0% | 4% | |
| uit / omgeving * (dB) | 25 | 23.3 7% | 24 4% | 26 -4% | 23.3 7% |
| Idle Minimum * (dB) | 29 | 23.8 18% | 25 14% | 26 10% | 25.7 11% |
| Idle Average * (dB) | 30 | 23.8 21% | 26 13% | 28 7% | 26.1 13% |
| Idle Maximum * (dB) | 32 | 27.2 15% | 30 6% | 34 -6% | 30.6 4% |
| Load Average * (dB) | 42 | 34.8 17% | 44 -5% | 44 -5% | 46.2 -10% |
| Witcher 3 ultra * (dB) | 46 | 49.3 -7% | 44 4% | 48 -4% | 49.2 -7% |
| Load Maximum * (dB) | 54 | 49.4 9% | 48 11% | 53 2% | 49.4 9% |
* ... kleiner is beter
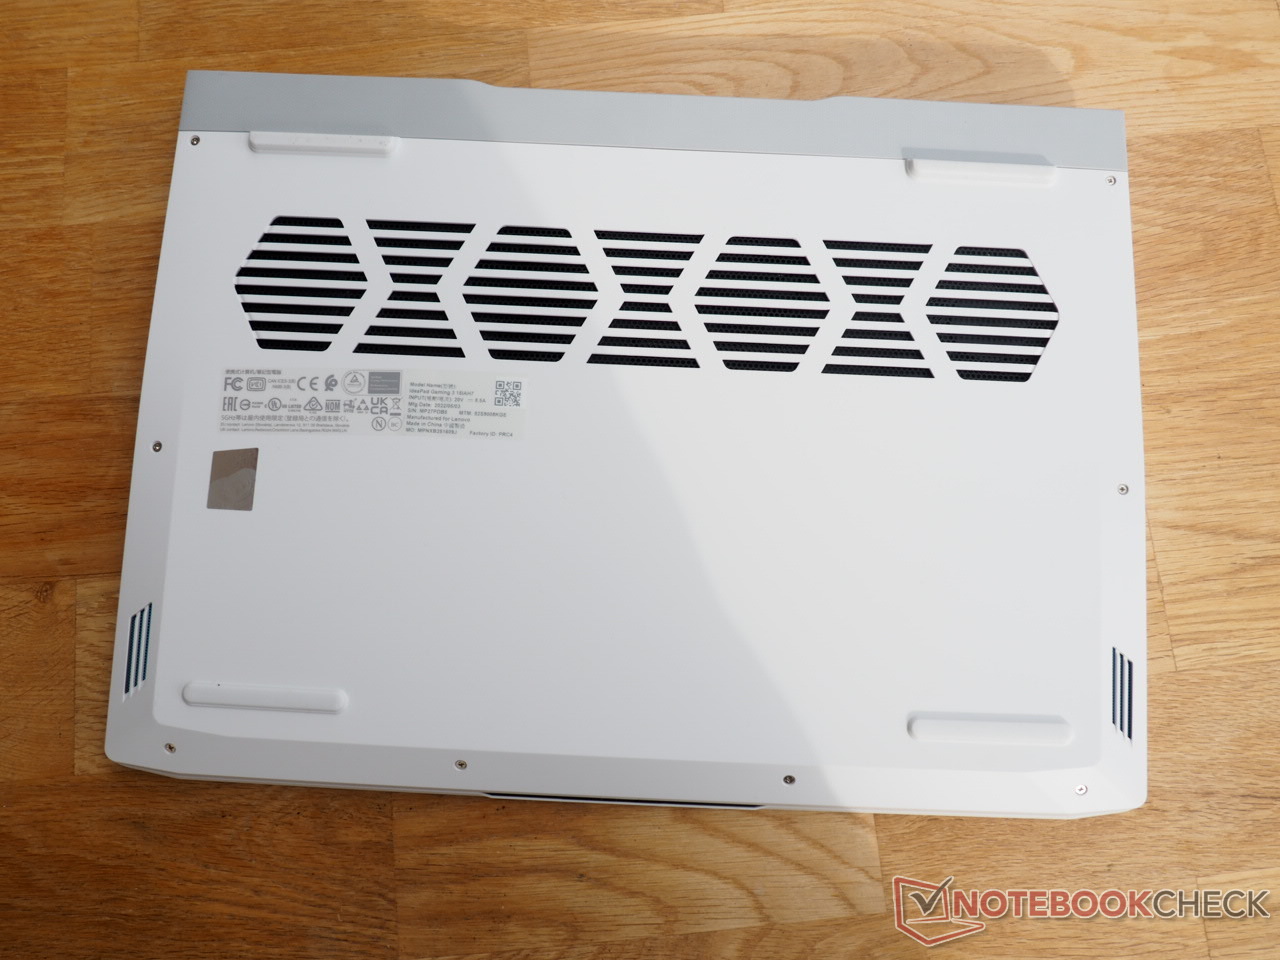
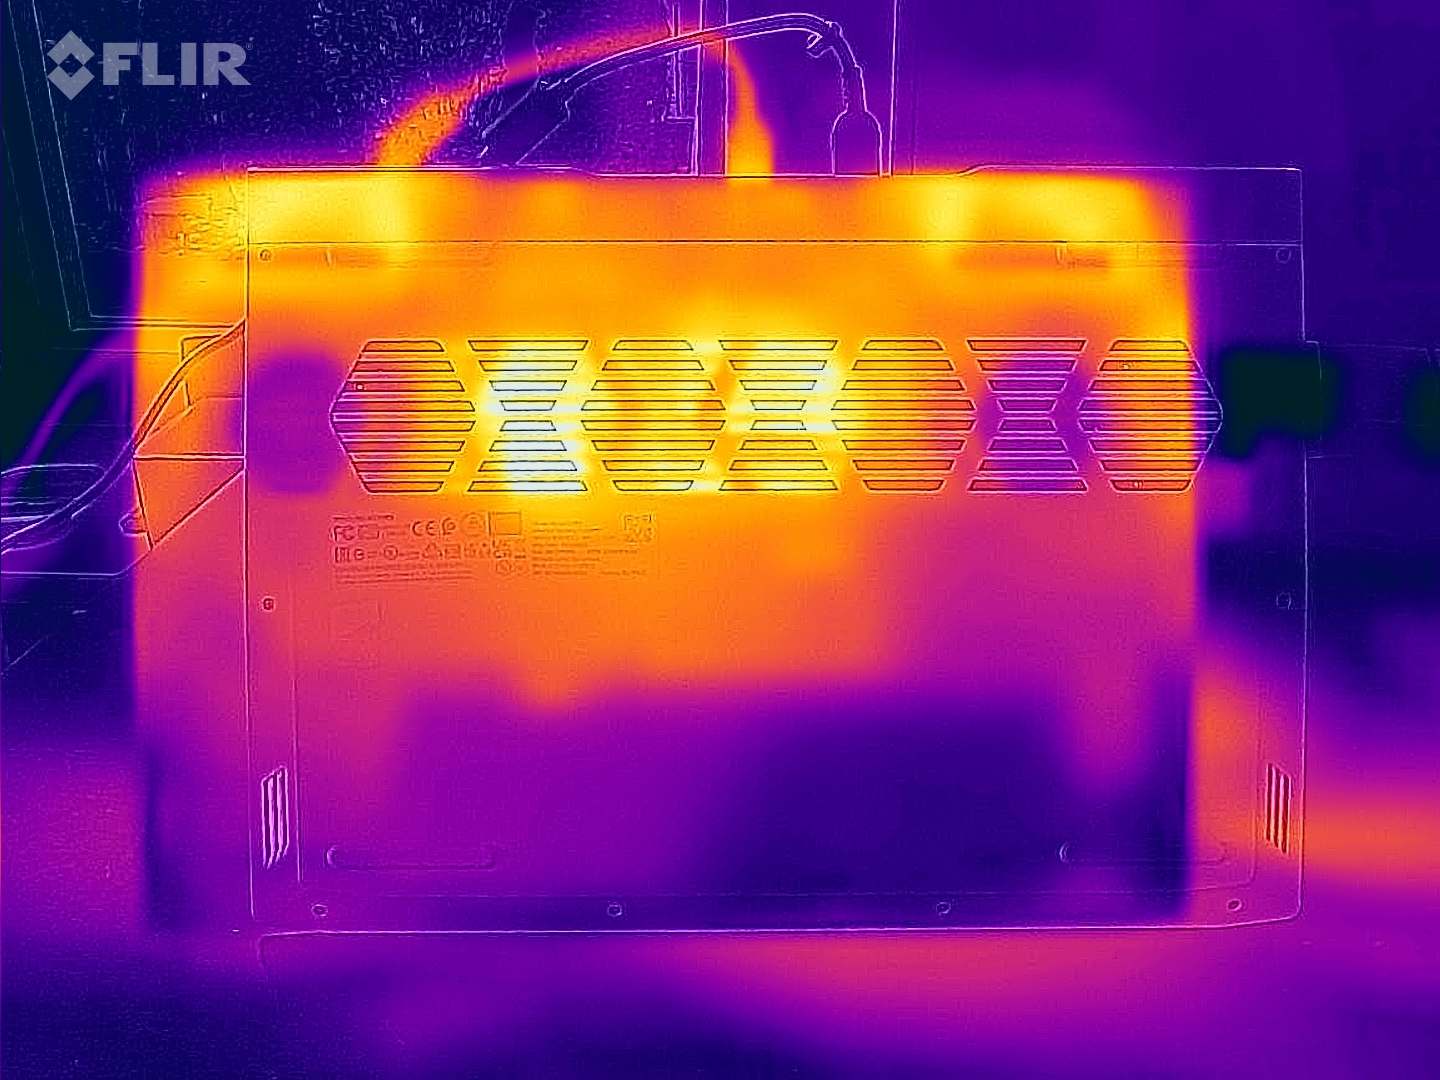
Temperaturen
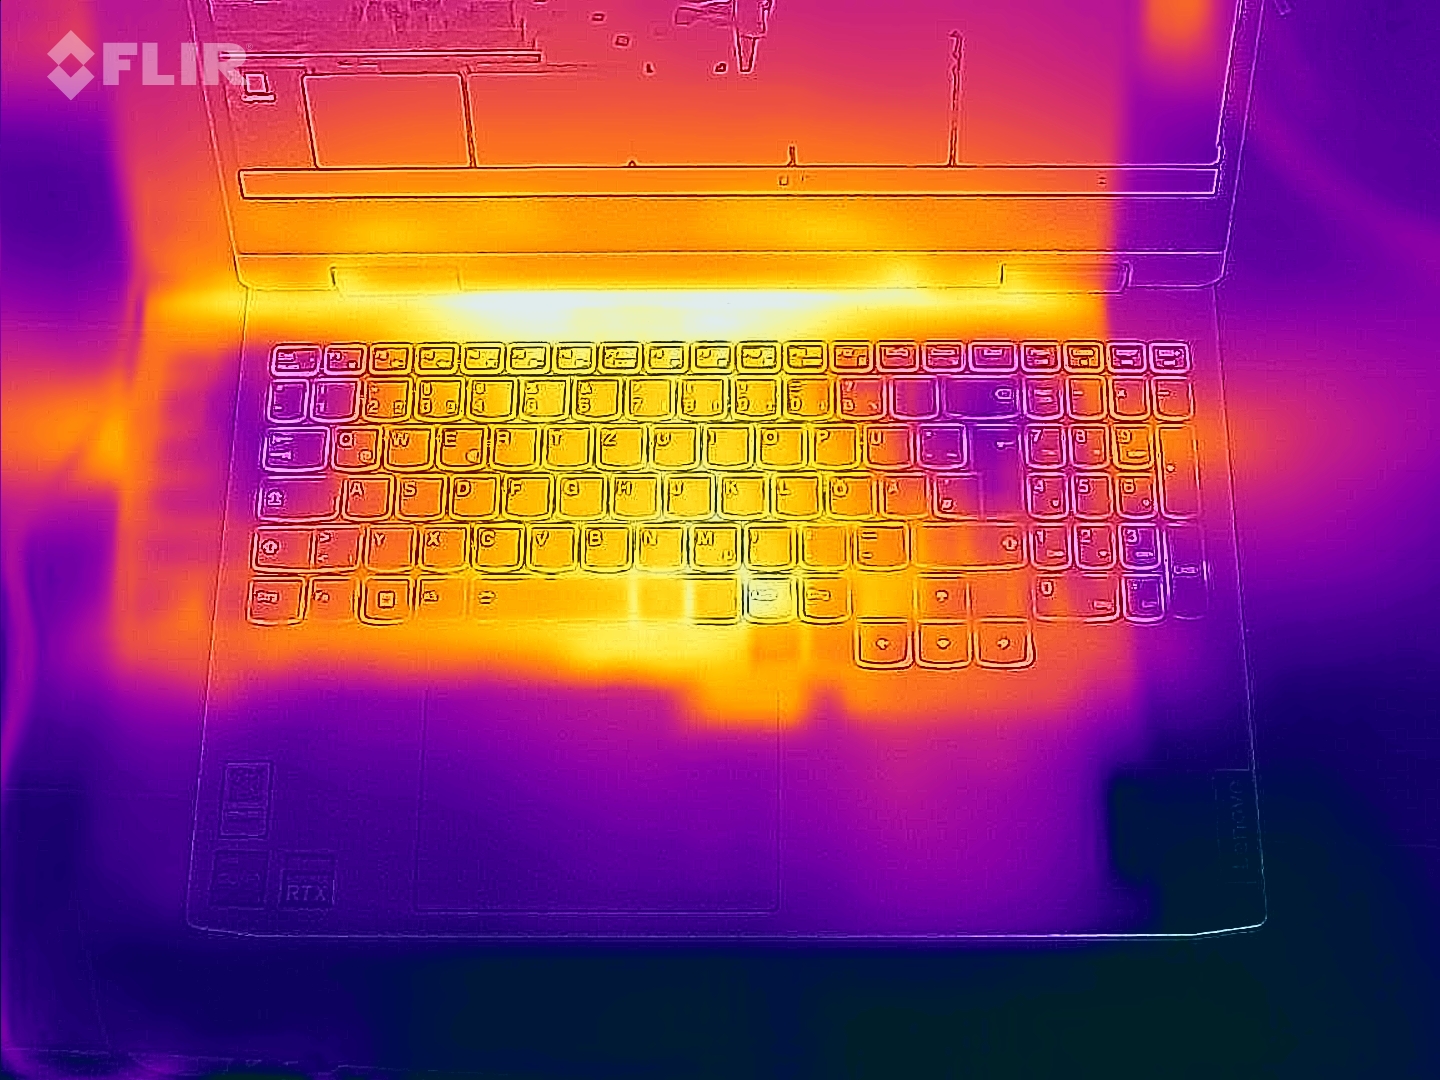
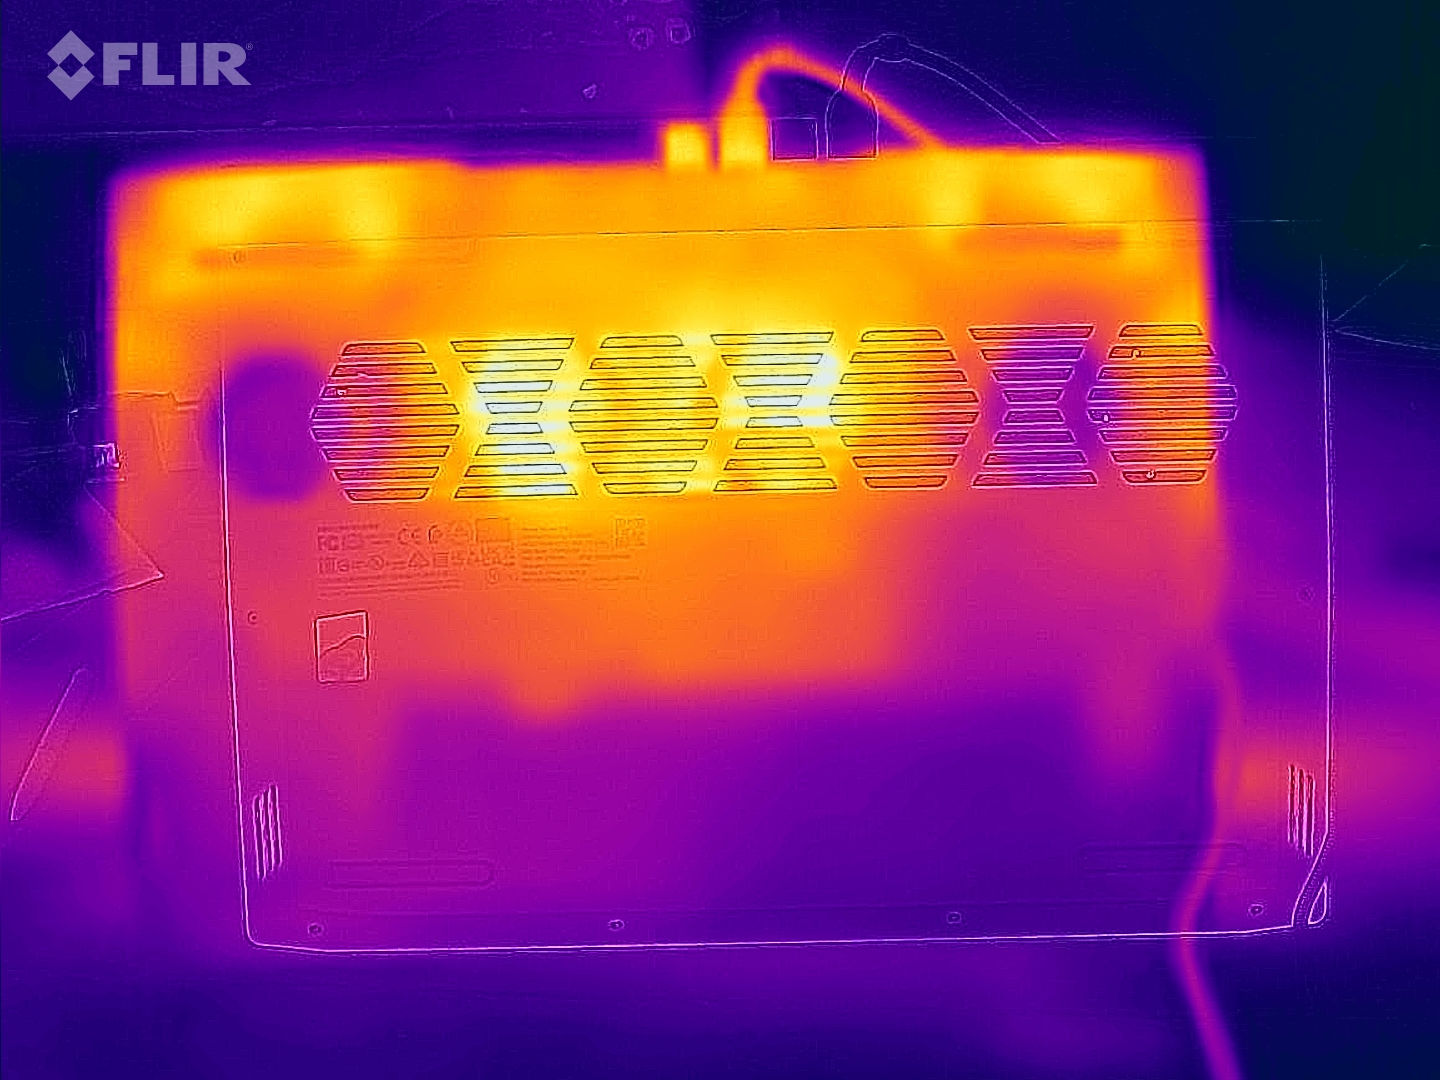
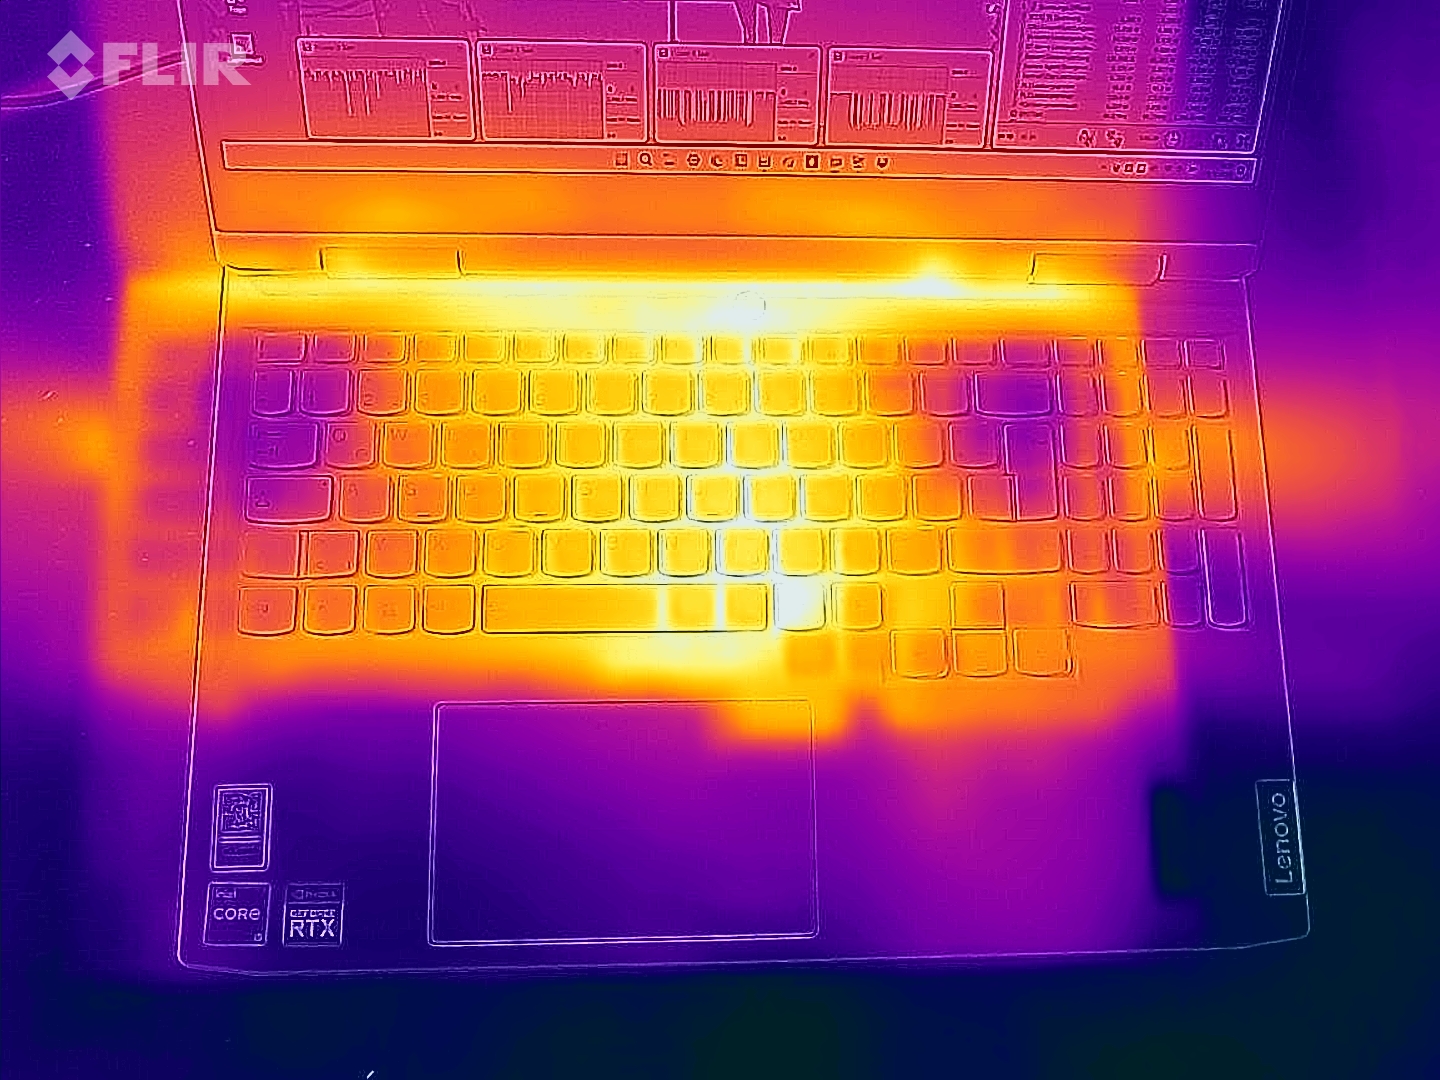
De temperatuurontwikkeling is ook typisch voor een gaming laptop. Terwijl het Lenovo-apparaat comfortabel koel blijft tijdens inactief gebruik, lopen de temperaturen op tot 47 °C (~117 °F) aan de bovenkant en 52 °C (~126 °F) aan de onderkant tijdens 3D-gebruik. Je moet dus niet proberen te gamen met de laptop op schoot.
(-) De maximumtemperatuur aan de bovenzijde bedraagt 47 °C / 117 F, vergeleken met het gemiddelde van 40.4 °C / 105 F, variërend van 21.2 tot 68.8 °C voor de klasse Gaming.
(-) De bodem warmt op tot een maximum van 52 °C / 126 F, vergeleken met een gemiddelde van 43.2 °C / 110 F
(+) Bij onbelast gebruik bedraagt de gemiddelde temperatuur voor de bovenzijde 24.2 °C / 76 F, vergeleken met het apparaatgemiddelde van 33.9 °C / 93 F.
(-) Bij het spelen van The Witcher 3 is de gemiddelde temperatuur voor de bovenzijde 39.2 °C / 103 F, vergeleken met het apparaatgemiddelde van 33.9 °C / 93 F.
(±) De palmsteunen en het touchpad kunnen zeer heet aanvoelen met een maximum van ###max## °C / 98.6 F.
(-) De gemiddelde temperatuur van de handpalmsteun van soortgelijke toestellen bedroeg 28.8 °C / 83.8 F (-8.2 °C / -14.8 F).
| Lenovo IdeaPad Gaming 3 15IAH7 GeForce RTX 3050 Ti Laptop GPU, i5-12500H | Lenovo IdeaPad Gaming 3 15ARH7 GeForce RTX 3050 4GB Laptop GPU, R5 6600H | Dell G15 5515 GeForce RTX 3050 Ti Laptop GPU, R7 5800H | HP Victus 16-e0145ng GeForce RTX 3050 Ti Laptop GPU, R5 5600H | Dell Inspiron 16 Plus 7620 GeForce RTX 3050 Ti Laptop GPU, i7-12700H | |
|---|---|---|---|---|---|
| Heat | -3% | -3% | -25% | -8% | |
| Maximum Upper Side * (°C) | 47 | 47.6 -1% | 50 -6% | 54 -15% | 46 2% |
| Maximum Bottom * (°C) | 52 | 46.6 10% | 49 6% | 47 10% | 45.8 12% |
| Idle Upper Side * (°C) | 25 | 27.2 -9% | 26 -4% | 41 -64% | 29.2 -17% |
| Idle Bottom * (°C) | 24 | 27.2 -13% | 26 -8% | 31 -29% | 31 -29% |
* ... kleiner is beter
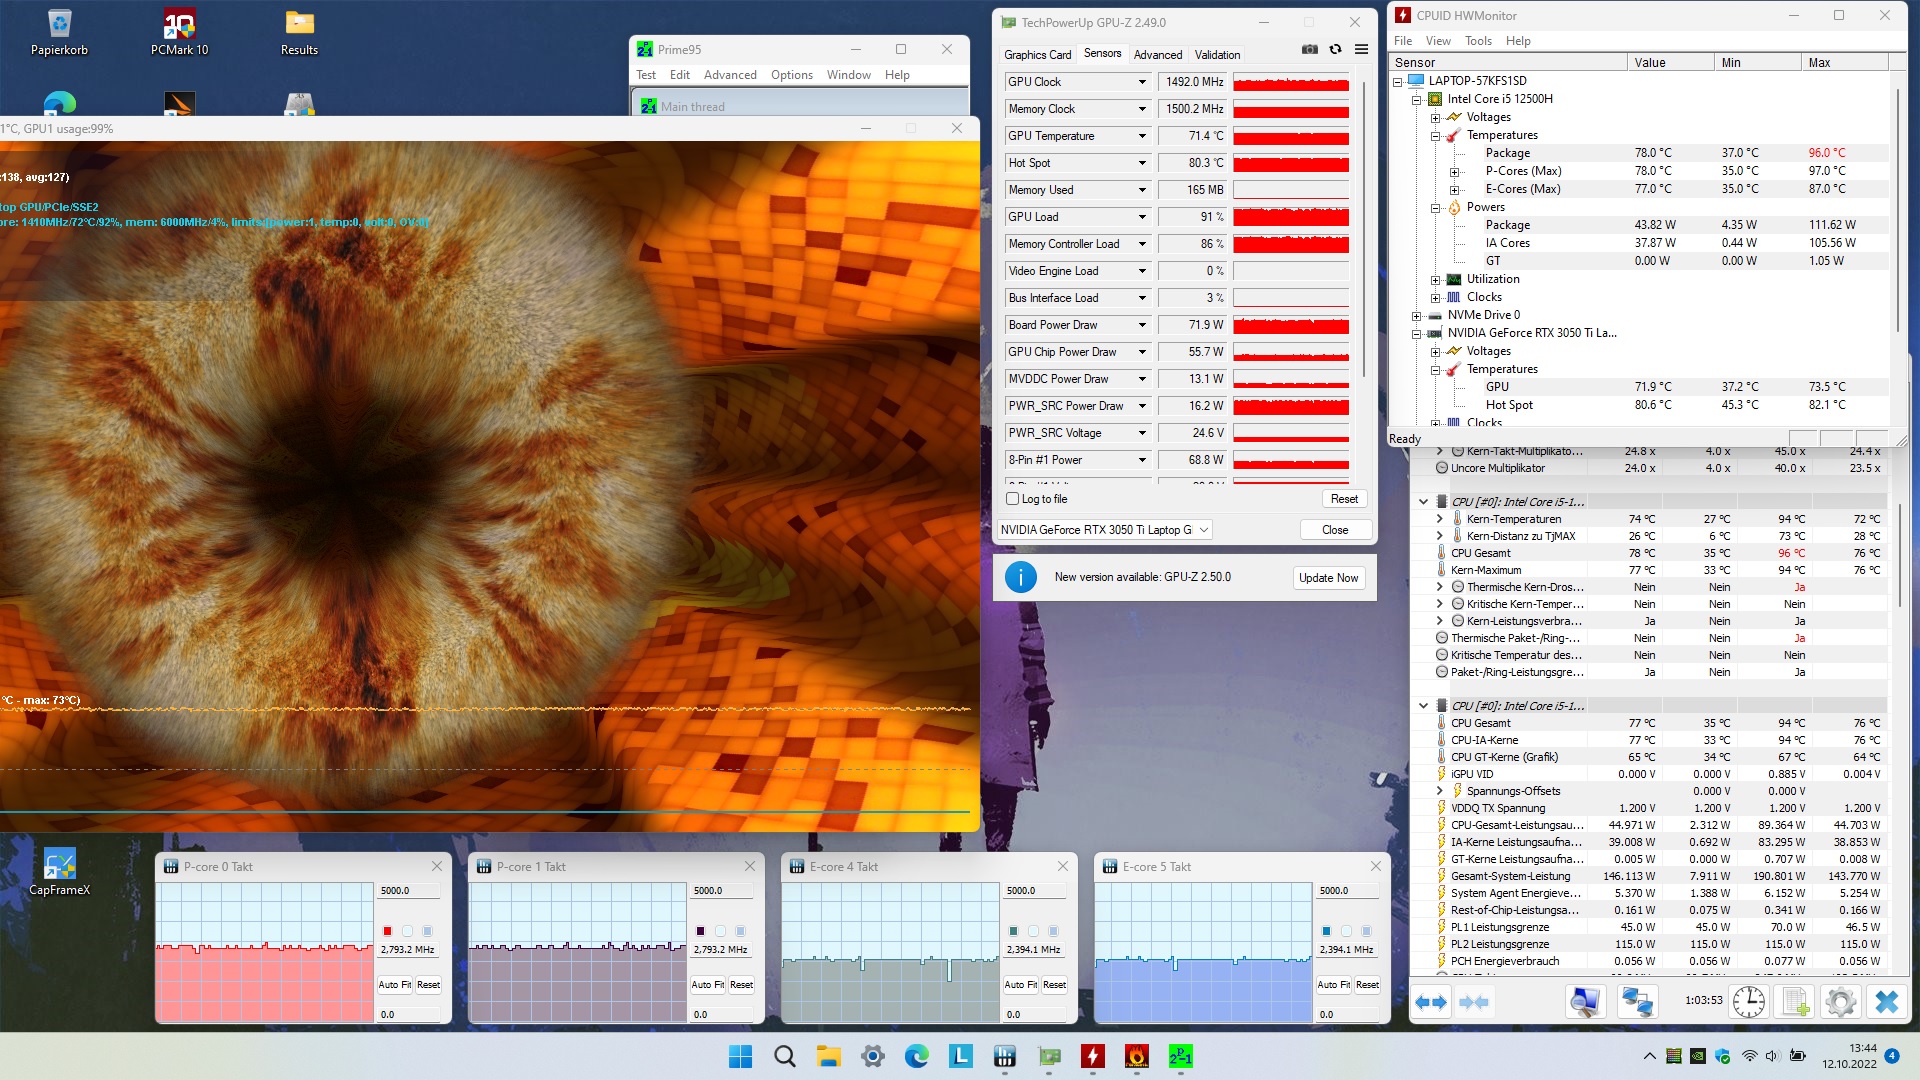
Stresstest
De stresstest met een uur FurMark & Prime95 laat niets vreemds zien. De 15-inch laptop blijft uit de buurt van throttling en kritische hardwarewaarden. Wij zouden ongeveer 71 °C (~160 °F) voor de GPU en 78 °C (~172 °F) voor de CPU onder volledige belasting als gematigde waarden beschouwen.
Luidsprekers
Lenovo IdeaPad Gaming 3 15IAH7 audioanalyse
(+) | luidsprekers kunnen relatief luid spelen (83 dB)
Bas 100 - 315 Hz
(-) | bijna geen lage tonen - gemiddeld 17.1% lager dan de mediaan
(±) | lineariteit van de lage tonen is gemiddeld (12.8% delta ten opzichte van de vorige frequentie)
Midden 400 - 2000 Hz
(±) | hogere middens - gemiddeld 5.6% hoger dan de mediaan
(+) | de middentonen zijn lineair (4.5% delta ten opzichte van de vorige frequentie)
Hoog 2 - 16 kHz
(+) | evenwichtige hoogtepunten - slechts 2% verwijderd van de mediaan
(+) | de hoge tonen zijn lineair (4.6% delta naar de vorige frequentie)
Algemeen 100 - 16.000 Hz
(+) | het totale geluid is lineair (14.4% verschil met de mediaan)
Vergeleken met dezelfde klasse
» 27% van alle geteste apparaten in deze klasse waren beter, 7% vergelijkbaar, 66% slechter
» De beste had een delta van 6%, het gemiddelde was 18%, de slechtste was 132%
Vergeleken met alle geteste toestellen
» 18% van alle geteste apparaten waren beter, 4% gelijk, 78% slechter
» De beste had een delta van 4%, het gemiddelde was 23%, de slechtste was 134%
Dell G15 5515 audioanalyse
(±) | luidspreker luidheid is gemiddeld maar goed (76 dB)
Bas 100 - 315 Hz
(-) | bijna geen lage tonen - gemiddeld 22% lager dan de mediaan
(±) | lineariteit van de lage tonen is gemiddeld (14.9% delta ten opzichte van de vorige frequentie)
Midden 400 - 2000 Hz
(+) | evenwichtige middens - slechts 2.8% verwijderd van de mediaan
(+) | de middentonen zijn lineair (3% delta ten opzichte van de vorige frequentie)
Hoog 2 - 16 kHz
(+) | evenwichtige hoogtepunten - slechts 1.4% verwijderd van de mediaan
(+) | de hoge tonen zijn lineair (3.7% delta naar de vorige frequentie)
Algemeen 100 - 16.000 Hz
(±) | lineariteit van het totale geluid is gemiddeld (16.8% verschil met de mediaan)
Vergeleken met dezelfde klasse
» 44% van alle geteste apparaten in deze klasse waren beter, 11% vergelijkbaar, 45% slechter
» De beste had een delta van 6%, het gemiddelde was 18%, de slechtste was 132%
Vergeleken met alle geteste toestellen
» 30% van alle geteste apparaten waren beter, 8% gelijk, 63% slechter
» De beste had een delta van 4%, het gemiddelde was 23%, de slechtste was 134%
Energiebeheer
Stroomverbruik
Ook het stroomverbruik valt niet op. Ook al verbruikt de Gaming 3 gemiddeld iets meer stroom dan andere RTX 3050 Ti laptops, dit komt vooral door de hogere TGP.
| Uit / Standby | |
| Inactief | |
| Belasting |
|
Key:
min: | |
| Lenovo IdeaPad Gaming 3 15IAH7 GeForce RTX 3050 Ti Laptop GPU, i5-12500H | Lenovo IdeaPad Gaming 3 15ARH7 GeForce RTX 3050 4GB Laptop GPU, R5 6600H | Dell G15 5515 GeForce RTX 3050 Ti Laptop GPU, R7 5800H | HP Victus 16-e0145ng GeForce RTX 3050 Ti Laptop GPU, R5 5600H | Dell Inspiron 16 Plus 7620 GeForce RTX 3050 Ti Laptop GPU, i7-12700H | Gemiddelde van klas Gaming | |
|---|---|---|---|---|---|---|
| Power Consumption | 8% | 7% | 5% | 6% | -55% | |
| Idle Minimum * (Watt) | 8 | 7.7 4% | 5 37% | 7 12% | 6.8 15% | 13 ? -63% |
| Idle Average * (Watt) | 10 | 9.1 9% | 9 10% | 9 10% | 9.6 4% | 19 ? -90% |
| Idle Maximum * (Watt) | 16 | 15.6 2% | 20 -25% | 15 6% | 17 -6% | 24.6 ? -54% |
| Load Average * (Watt) | 99 | 90.7 8% | 94 5% | 93 6% | 117.5 -19% | 110.7 ? -12% |
| Witcher 3 ultra * (Watt) | 144.6 | 122.9 15% | 123 15% | 134.5 7% | 113.1 22% | |
| Load Maximum * (Watt) | 168 | 155.2 8% | 172 -2% | 185 -10% | 137.4 18% | 259 ? -54% |
* ... kleiner is beter
Power Consumption The Witcher 3 / Stress Test
Power Consumption With External Monitor
Levensduur van de batterij
Afhankelijk van het model biedt de IdeaPad een 45-Wh of een 60-Wh batterij. In tegenstelling tot zijn AMD broertje, weet de geteste Intel versie gelukkig te scoren met de krachtigere batterij. Door het hogere verbruik blijven de verschillen echter binnen de perken. Met amper 6 uur blijkt de batterijduur tijdens draadloos internetten bij een tot 150 cd/m² gereduceerde schermhelderheid zelfs iets lager dan die van de AMD-versie. Ook de andere concurrenten lopen in dit opzicht voor.
| Lenovo IdeaPad Gaming 3 15IAH7 GeForce RTX 3050 Ti Laptop GPU, i5-12500H, 60 Wh | Lenovo IdeaPad Gaming 3 15ARH7 GeForce RTX 3050 4GB Laptop GPU, R5 6600H, 45 Wh | Dell G15 5515 GeForce RTX 3050 Ti Laptop GPU, R7 5800H, 56 Wh | HP Victus 16-e0145ng GeForce RTX 3050 Ti Laptop GPU, R5 5600H, 70 Wh | Dell Inspiron 16 Plus 7620 GeForce RTX 3050 Ti Laptop GPU, i7-12700H, 86 Wh | Gemiddelde van klas Gaming | |
|---|---|---|---|---|---|---|
| Batterijduur | 10% | 36% | 20% | 63% | 21% | |
| WiFi v1.3 (h) | 5.9 | 6.5 10% | 8 36% | 7.1 20% | 9.6 63% | 7.11 ? 21% |
| Reader / Idle (h) | 2.4 | 13.5 | 18.6 | 8.27 ? | ||
| Load (h) | 0.9 | 1.5 | 1.2 | 1.502 ? | ||
| H.264 (h) | 8.8 | 8.32 ? |
Pro
Contra
Verdict
Als je de matige kwaliteit van de behuizing qua materiaal en afwerking buiten beschouwing laat, heeft Lenovo met de IdeaPad Gaming 3 15IAH7 een geslaagde budget gaming laptop gemaakt.
Dankzij hoge TDP's en constante prestatieontwikkeling is deCore i5-12500Hen GeForce RTX 3050 Tihun volle kracht kunnen tonen, terwijl de (meestal tragere) concurrenten daarentegen een betere batterijduur leveren. Bijna geen van de alternatieve laptops weet echter de beeldkwaliteit van de Gaming 3 te bereiken. De meeste concurrenten blijven achter op het gebied van kleurruimte en helderheid. In ons vergelijkingsveld is alleen de Dell Inspiron 16 Plusin staat om in de buurt te komen van de Lenovo laptop.
Wie een goed beeldscherm verwacht, maar niet te veel geld wil uitgeven voor een gaming laptop, moet de IdeaPad Gaming 3 15IAH7 eens nader bekijken.
Prijs en beschikbaarheid
Op het moment van deze test is de IdeaPad Gaming 3 15IAH7 met een Core i5-12500H, GeForce RTX 3050 Ti, 8 GB RAM en 512 GB SSD beschikbaar voor $1031 van BestBuy.
Lenovo IdeaPad Gaming 3 15IAH7
- 14-10-2022 v7 (old)
Florian Glaser
Price comparison

