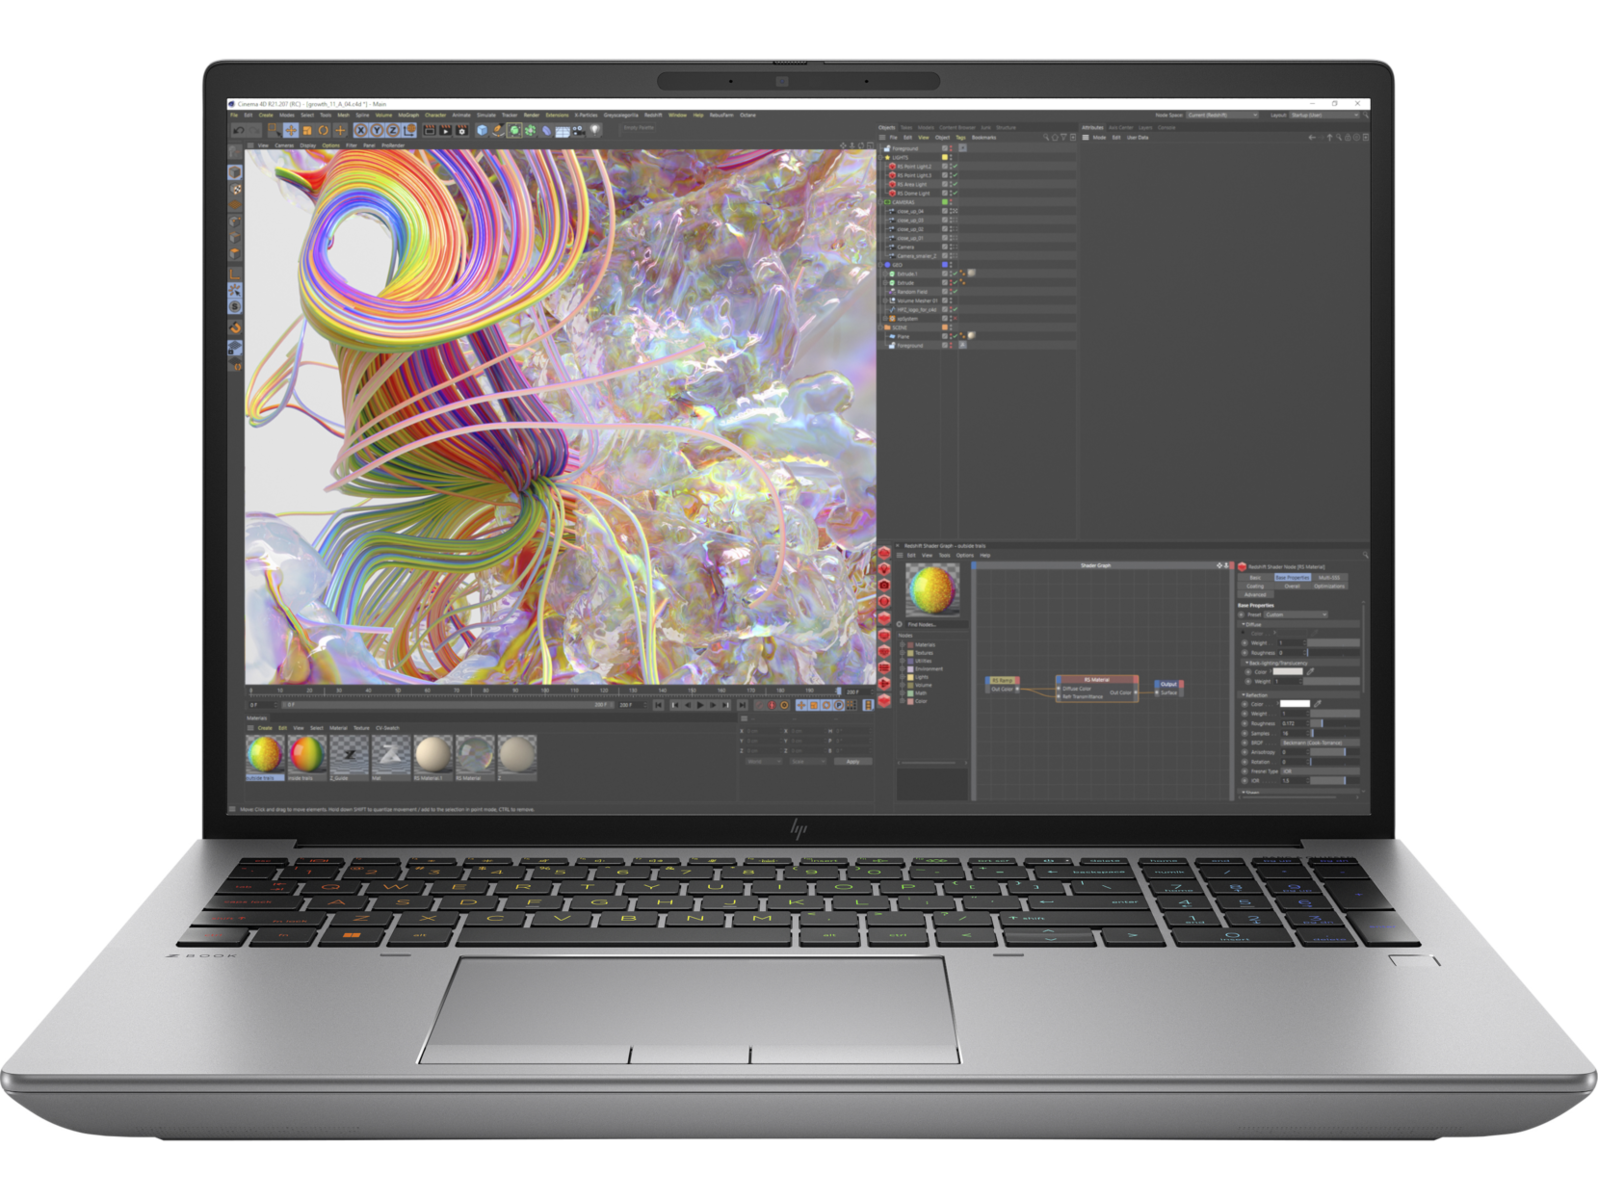
HP ZBook Fury 16 G9 workstation review: Dell Precision 7670 en ThinkPad P16 G1 alternatief

De ZBook Fury serie bevat HP's best presterende mobiele werkstations, in tegenstelling tot de mid-range ZBook Studio serie en ultradunne ZBook Firefly serie.
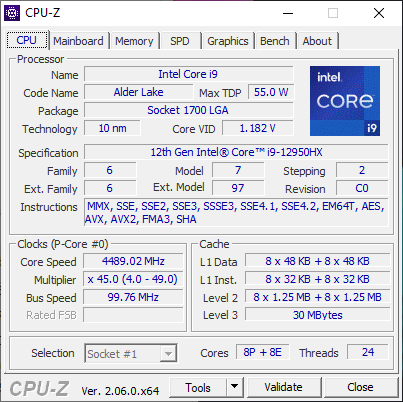
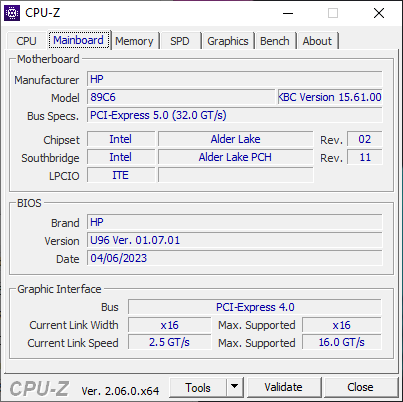
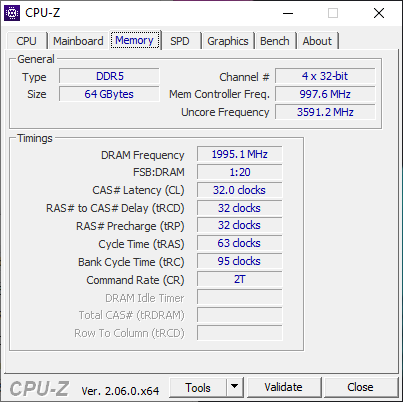
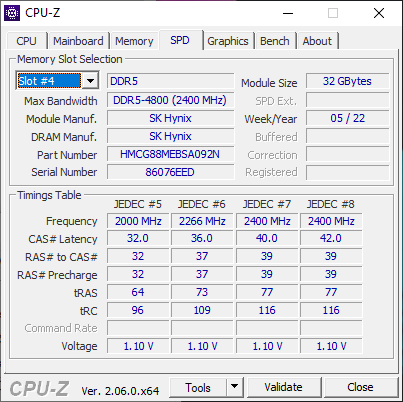
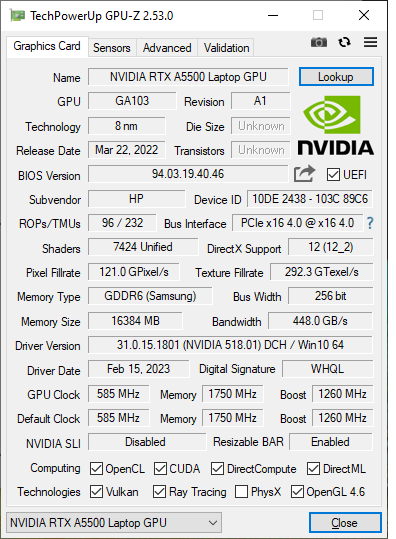
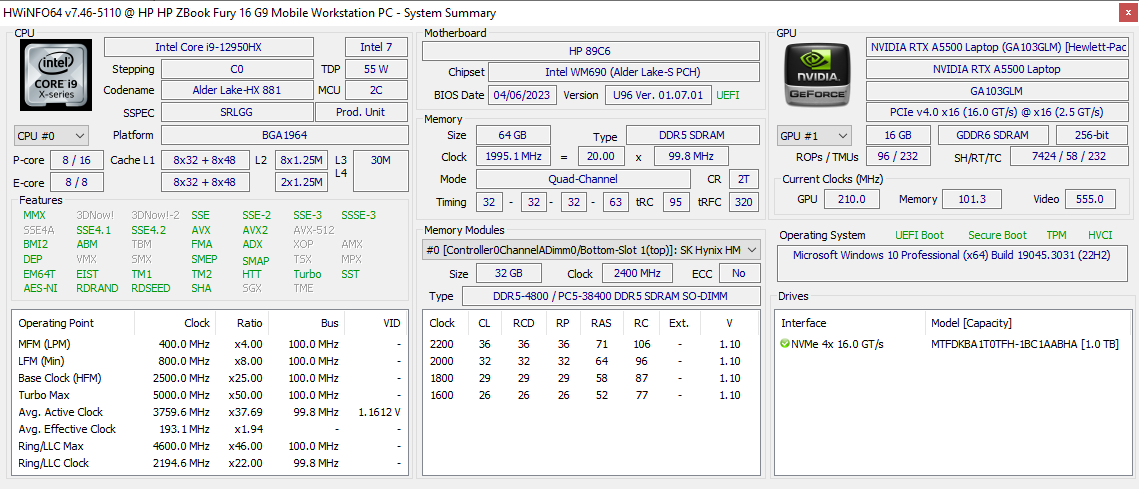
Ons apparaat is een high-end configuratie van de Fury 16 G9 met de 12e generatie Alder Lake-H Core i9-12950HX CPU, RTX A5500 Ampere GPU, 64 GB RAM en een 3840 x 2400 IPS-scherm en kost iets meer dan $4000 USD. Configureerbare opties zijn enorm met LTE, 5G en zelfs OLED-panelen zoals hier vermeldt. Merk op dat de ZBook Fury G10 met nieuwere 13e generatie Intel-opties ook beschikbaar is, maar de behuizing blijft identiek aan onze Fury G9.
Alternatieven voor de ZBook Fury 16 G9 zijn andere vlaggenschip 16-inch mobiele werkstations zoals de Dell Precision 7670, MSI CreatorPro Z16P, Asus ProArt StudioBook 16of Lenovo ThinkPad P16 G1.
Meer HP beoordelingen:
Potentiële concurrenten in vergelijking
Evaluatie | Datum | Model | Gewicht | Hoogte | Formaat | Resolutie | Beste prijs |
|---|---|---|---|---|---|---|---|
| 91 % v7 (old) | 06-2023 | HP ZBook Fury 16 G9 i9-12950HX, RTX A5500 Laptop GPU | 2.6 kg | 28.5 mm | 16.00" | 3840x2400 | |
| 90.1 % v7 (old) | 11-2022 | HP ZBook Studio 16 G9 62U04EA i7-12800H, RTX A2000 Laptop GPU | 1.8 kg | 19 mm | 16.00" | 3840x2400 | |
| 82.9 % v7 (old) | 10-2022 | HP ZBook Firefly 16 G9-6B897EA i7-1265U, T550 Laptop GPU | 2 kg | 19.2 mm | 16.00" | 1920x1200 | |
| 91 % v7 (old) | 02-2023 | Lenovo ThinkPad P16 G1 RTX A5500 i9-12950HX, RTX A5500 Laptop GPU | 3 kg | 30.23 mm | 16.00" | 3840x2400 | |
| 89.1 % v7 (old) | 12-2022 | Dell Precision 7000 7670 Performance i9-12950HX, RTX A5500 Laptop GPU | 2.8 kg | 25.95 mm | 16.00" | 3840x2400 | |
| 84.3 % v7 (old) | 11-2022 | MSI CreatorPro Z16P B12UKST i7-12700H, RTX A3000 Laptop GPU | 2.4 kg | 19 mm | 16.00" | 2560x1600 |
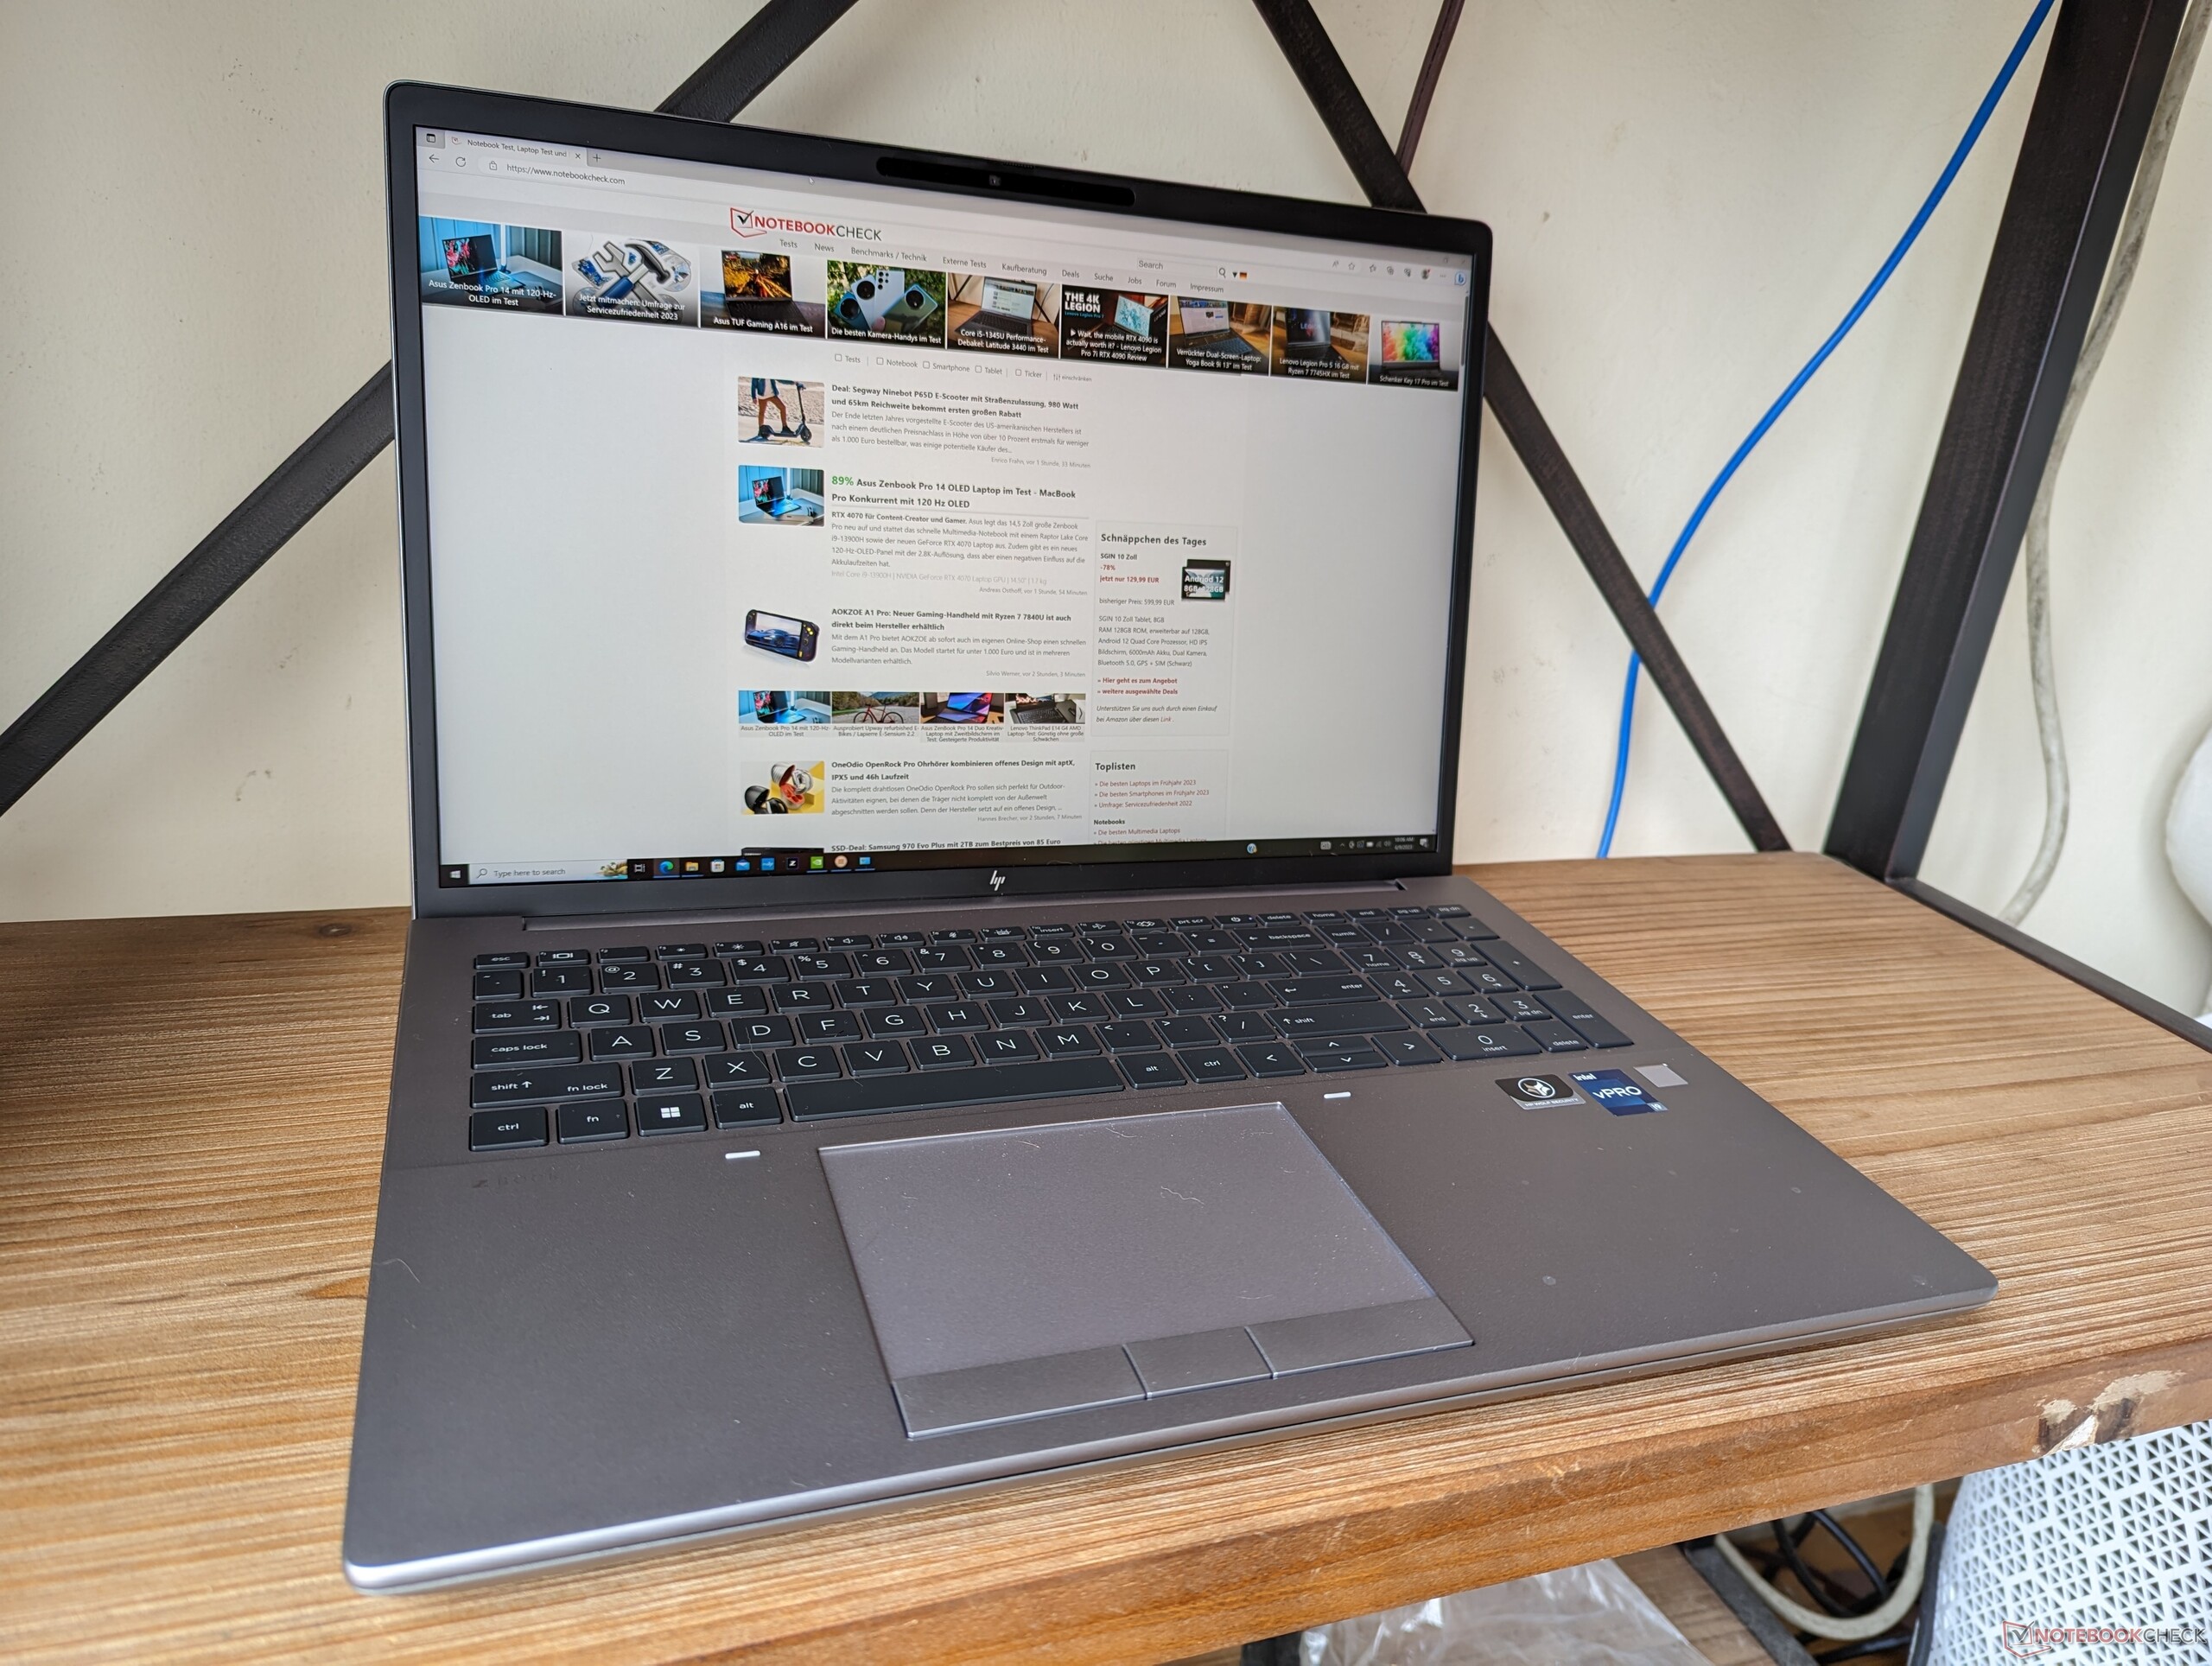
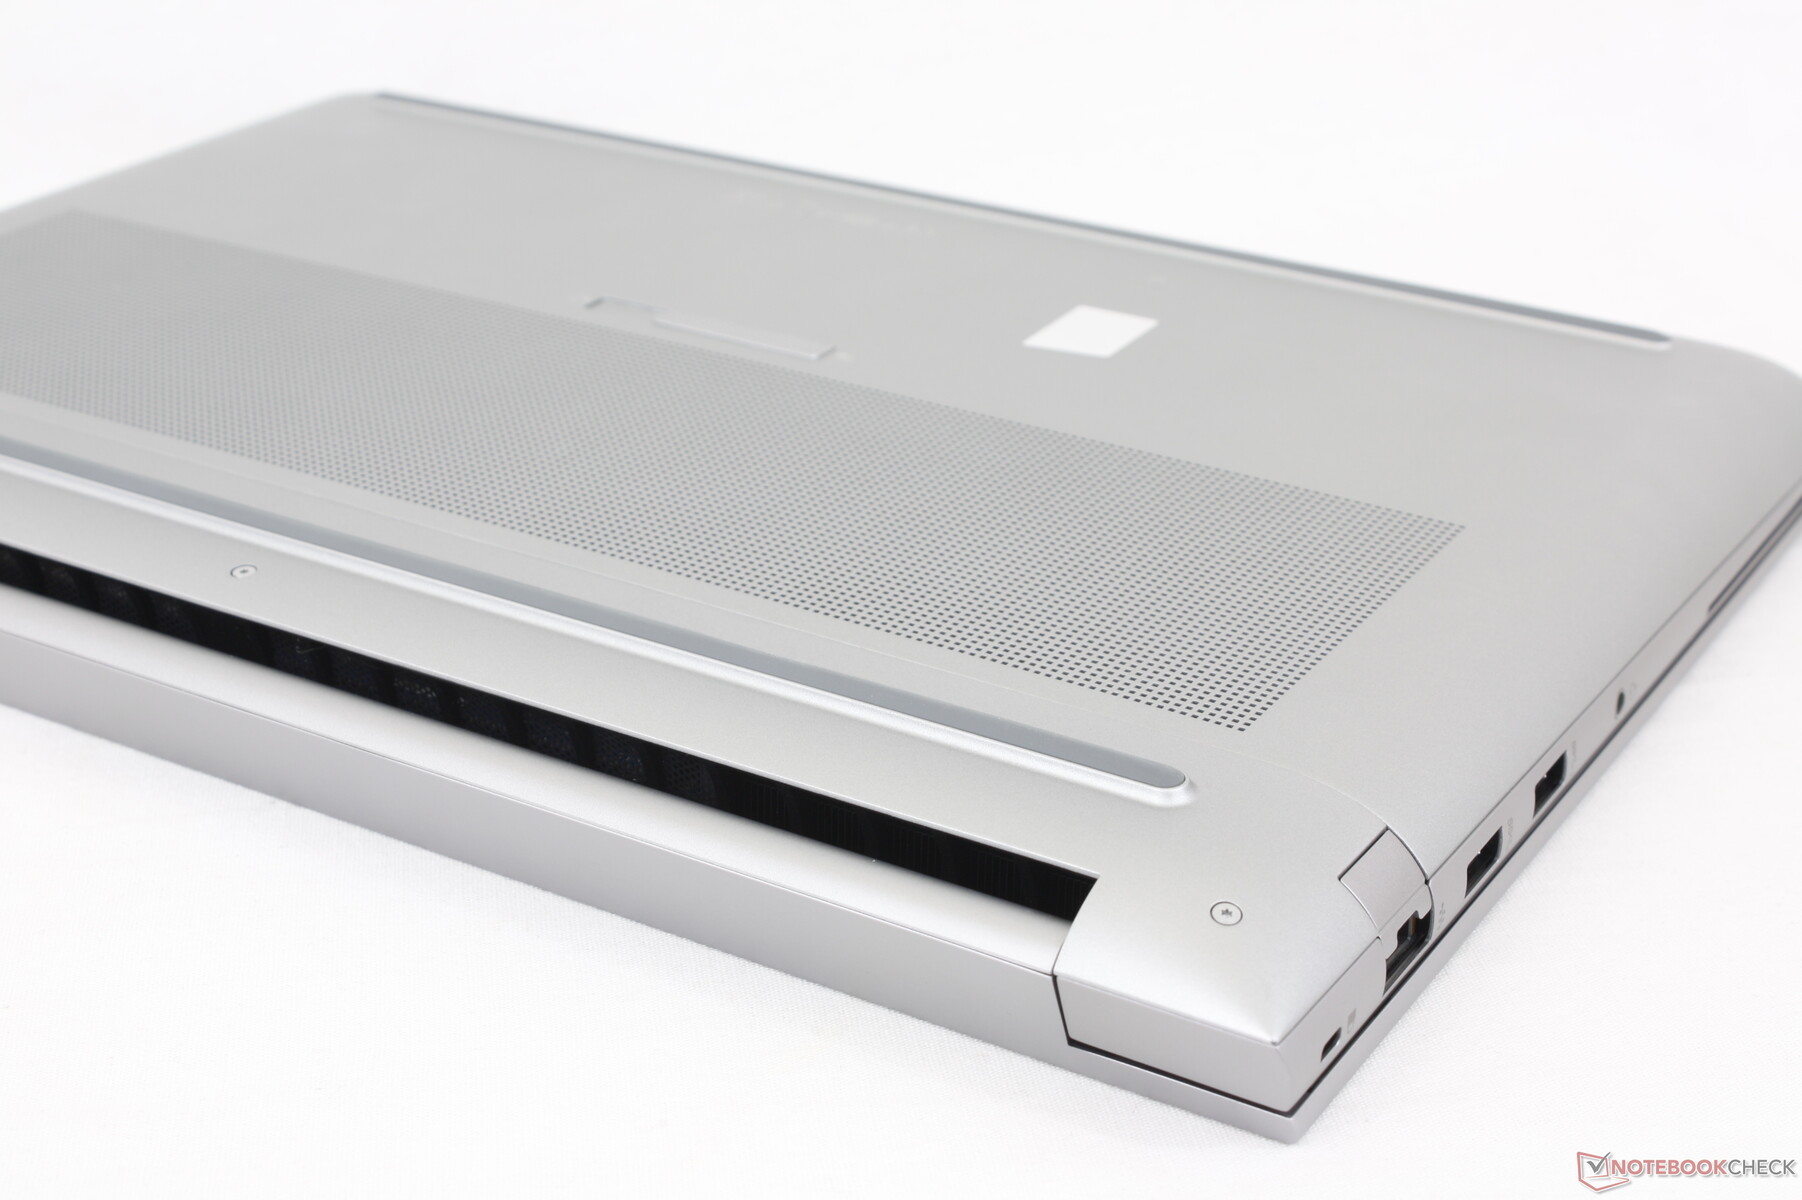
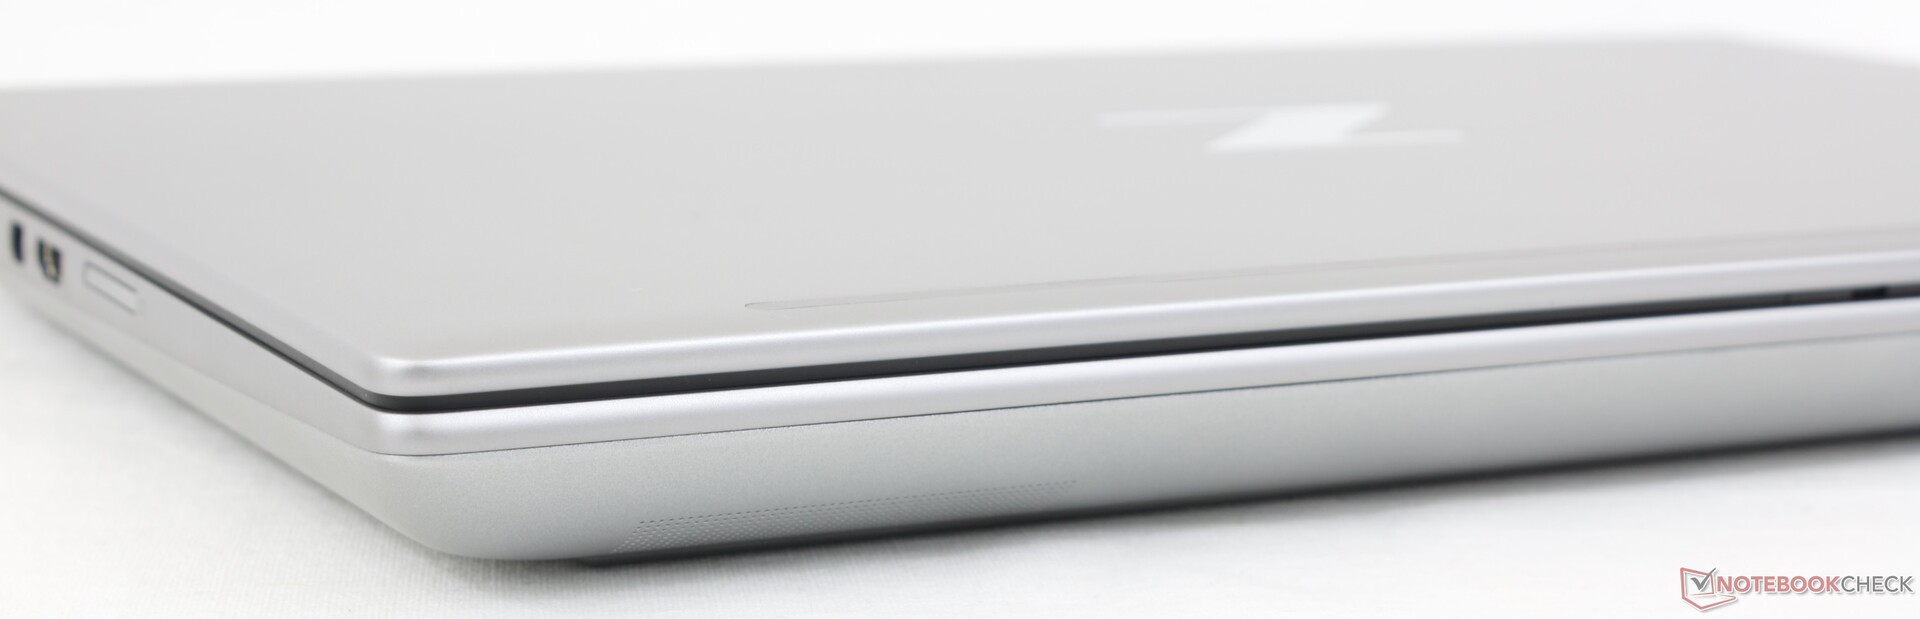
Koffer - Klassieke ZBook
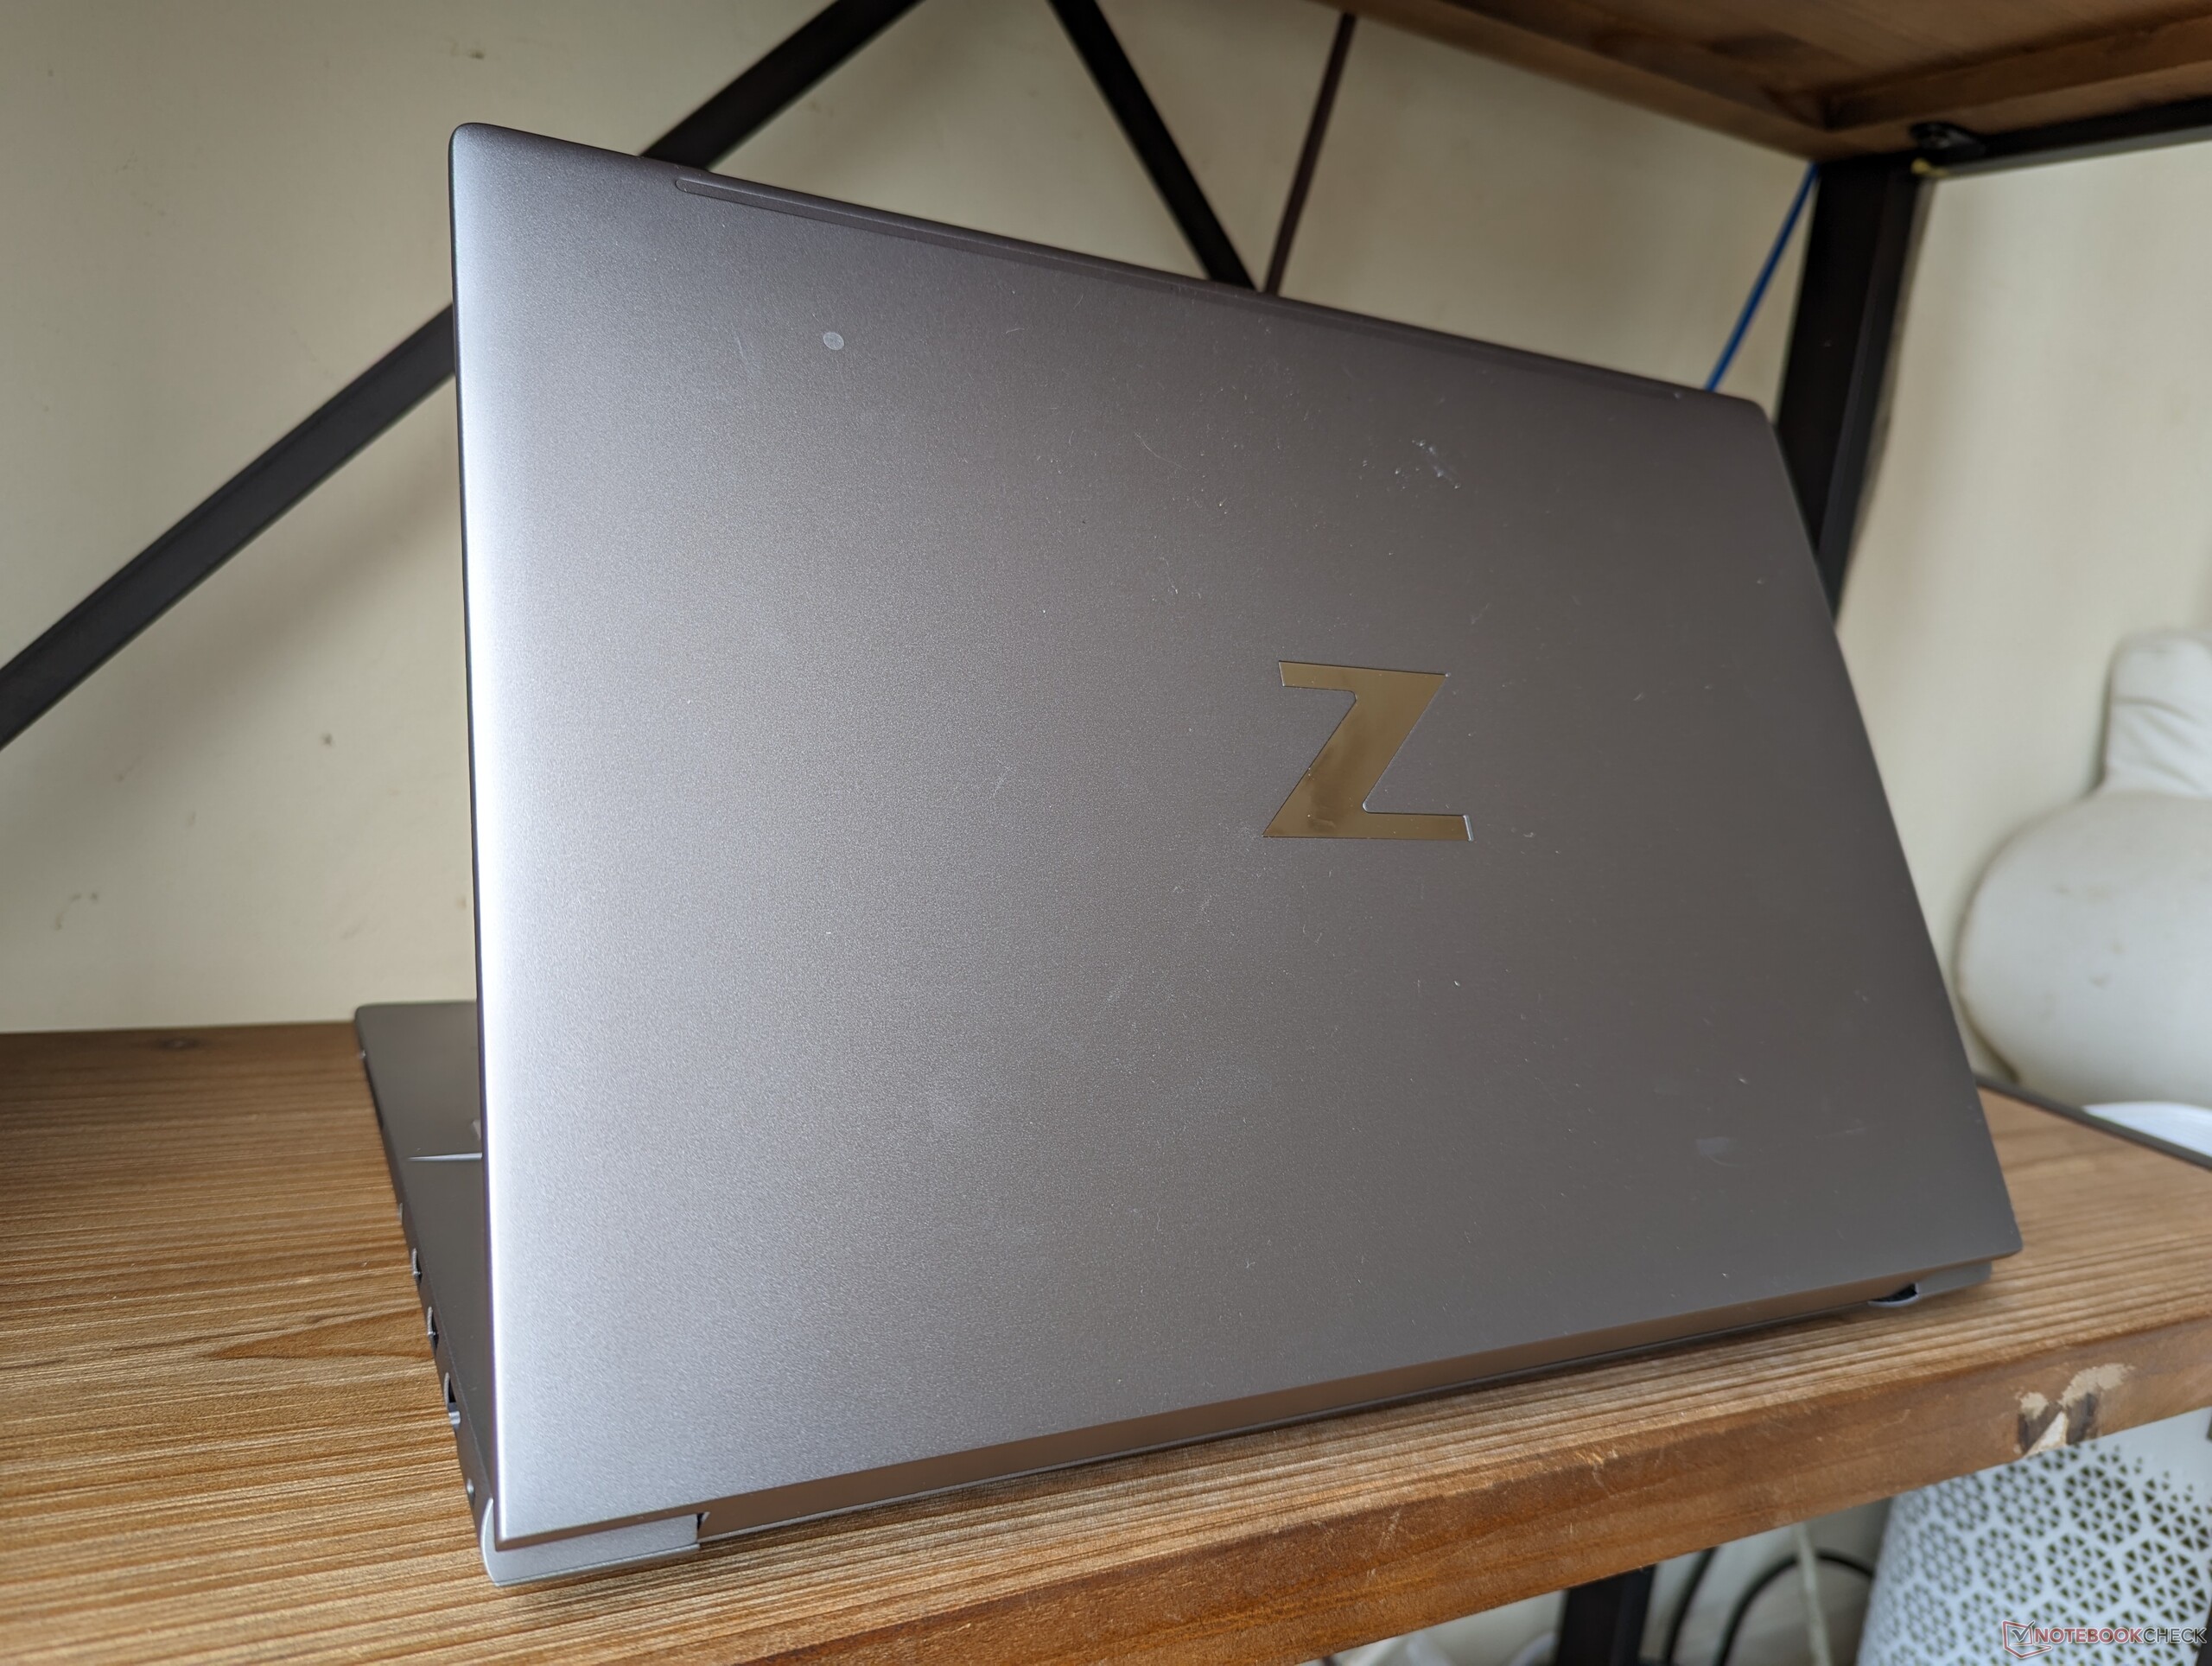
Het chassis bestaat uit dezelfde aluminiumlegering waar ZBook-eigenaars al bekend mee zijn. Draaien, kromtrekken en kraken zijn minimaal en vergelijkbaar met de Precision 7670 voor een sterke eerste indruk en geen problematische gebieden. Buiging is het meest merkbaar wanneer je druk uitoefent op het midden van de buitenklep waar het "Z" logo zich bevindt, maar dit is geen reden voor langdurige problemen.
De HP is merkbaar lichter dan zowel deThinkPad P16 G1 en Precision 7670, ook al hebben ze allemaal dezelfde CPU en GPU opties. Dit gaat echter ten koste van de prestaties, zoals onze benchmark vergelijkingen hieronder zullen laten zien. Voor iets draagbaarders kunnen gebruikers de veel dunnere ZBook Firefly 16 G9 of ZBook Studio 16 G9 overwegen.
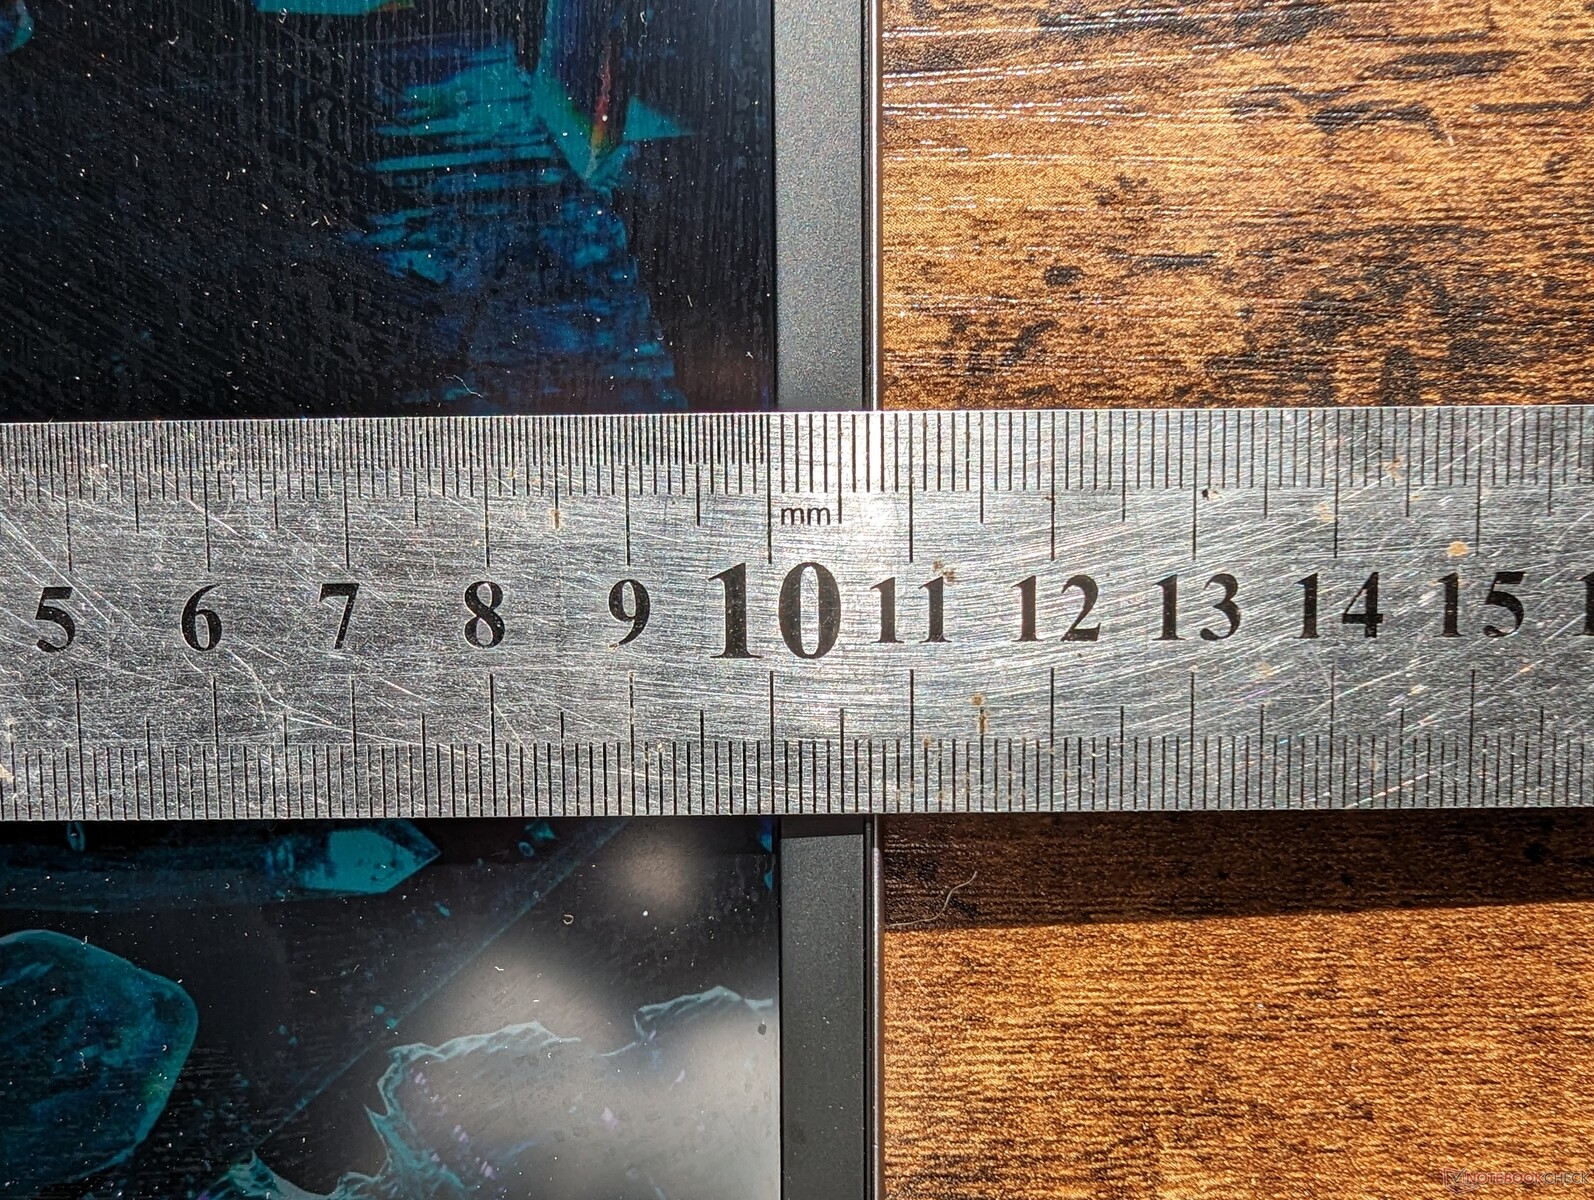
De onderste rand van de Fury G9 is verrassend smal voor een workstation, wat ertoe bijdraagt dat het model korter is dan de meeste andere 16-inch alternatieven.
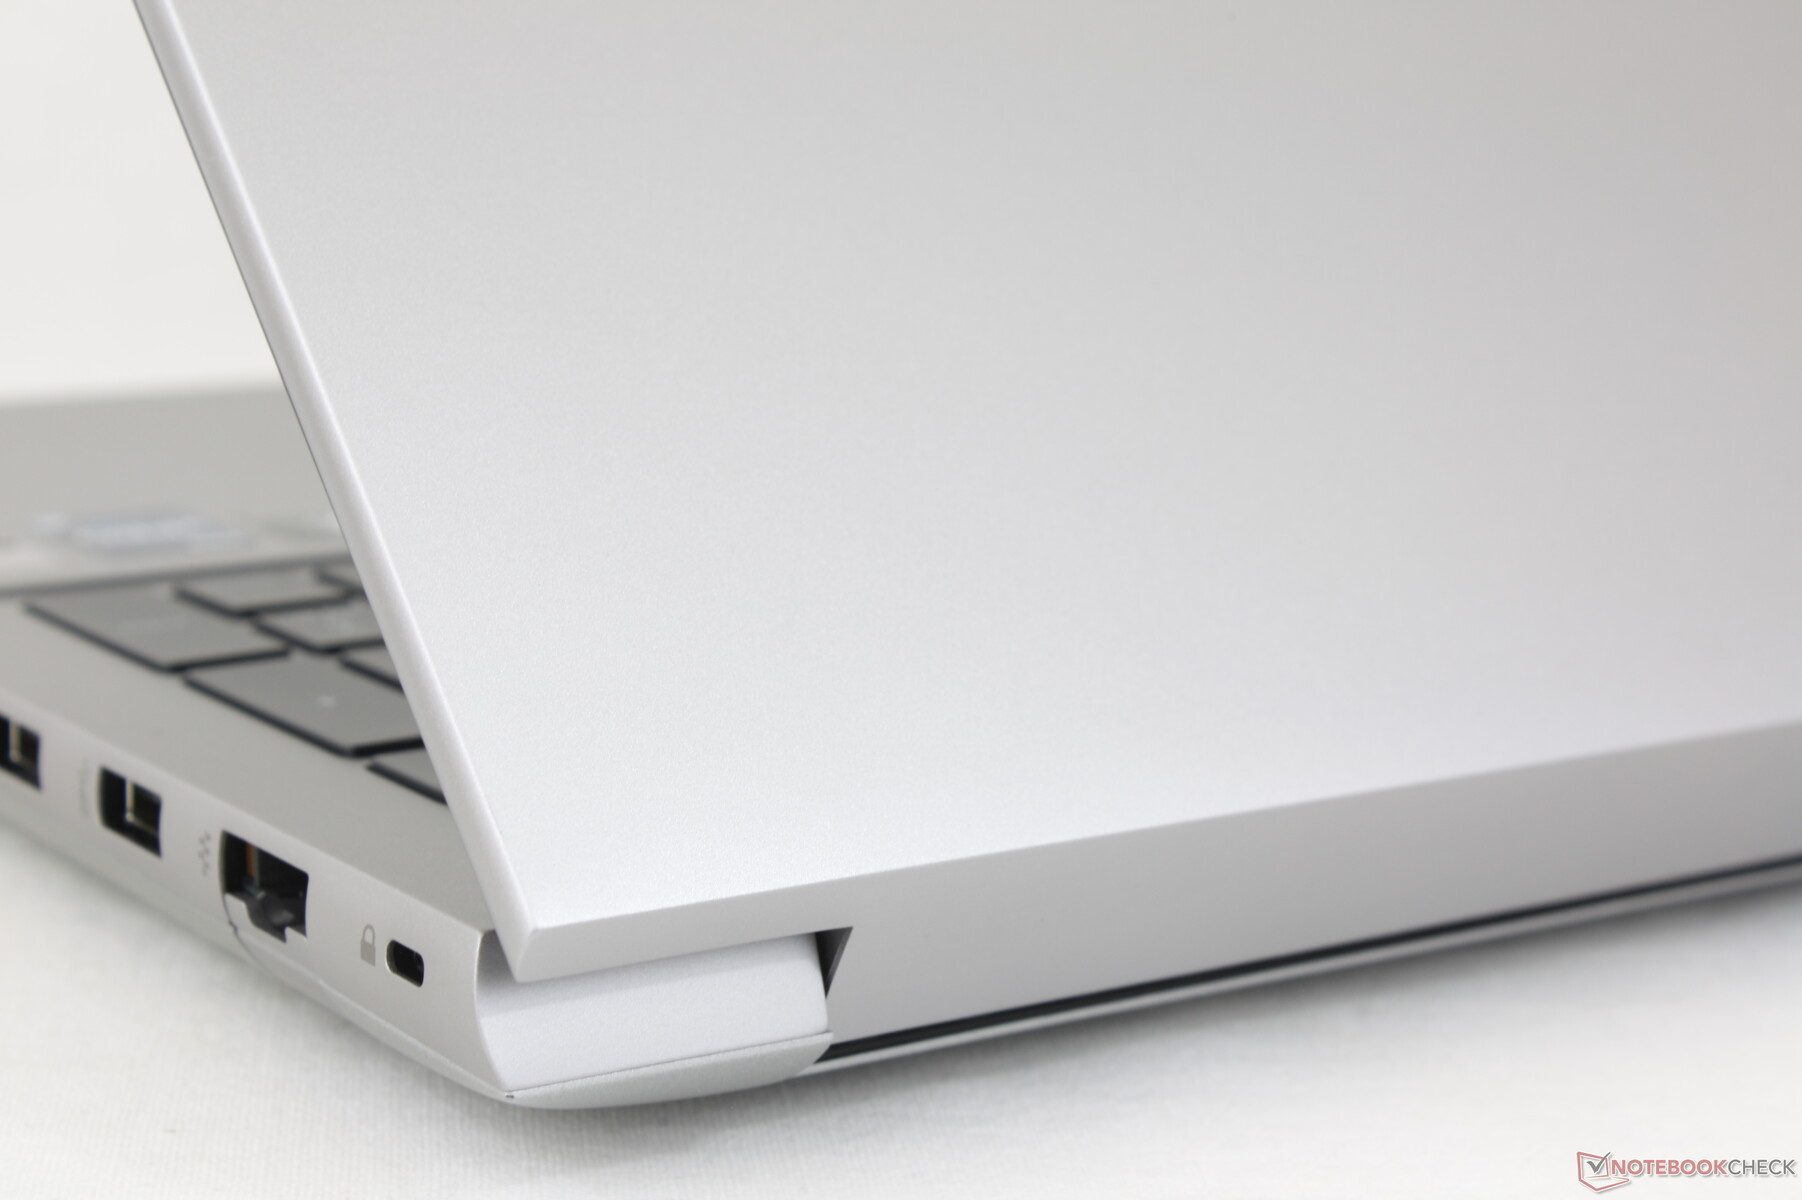
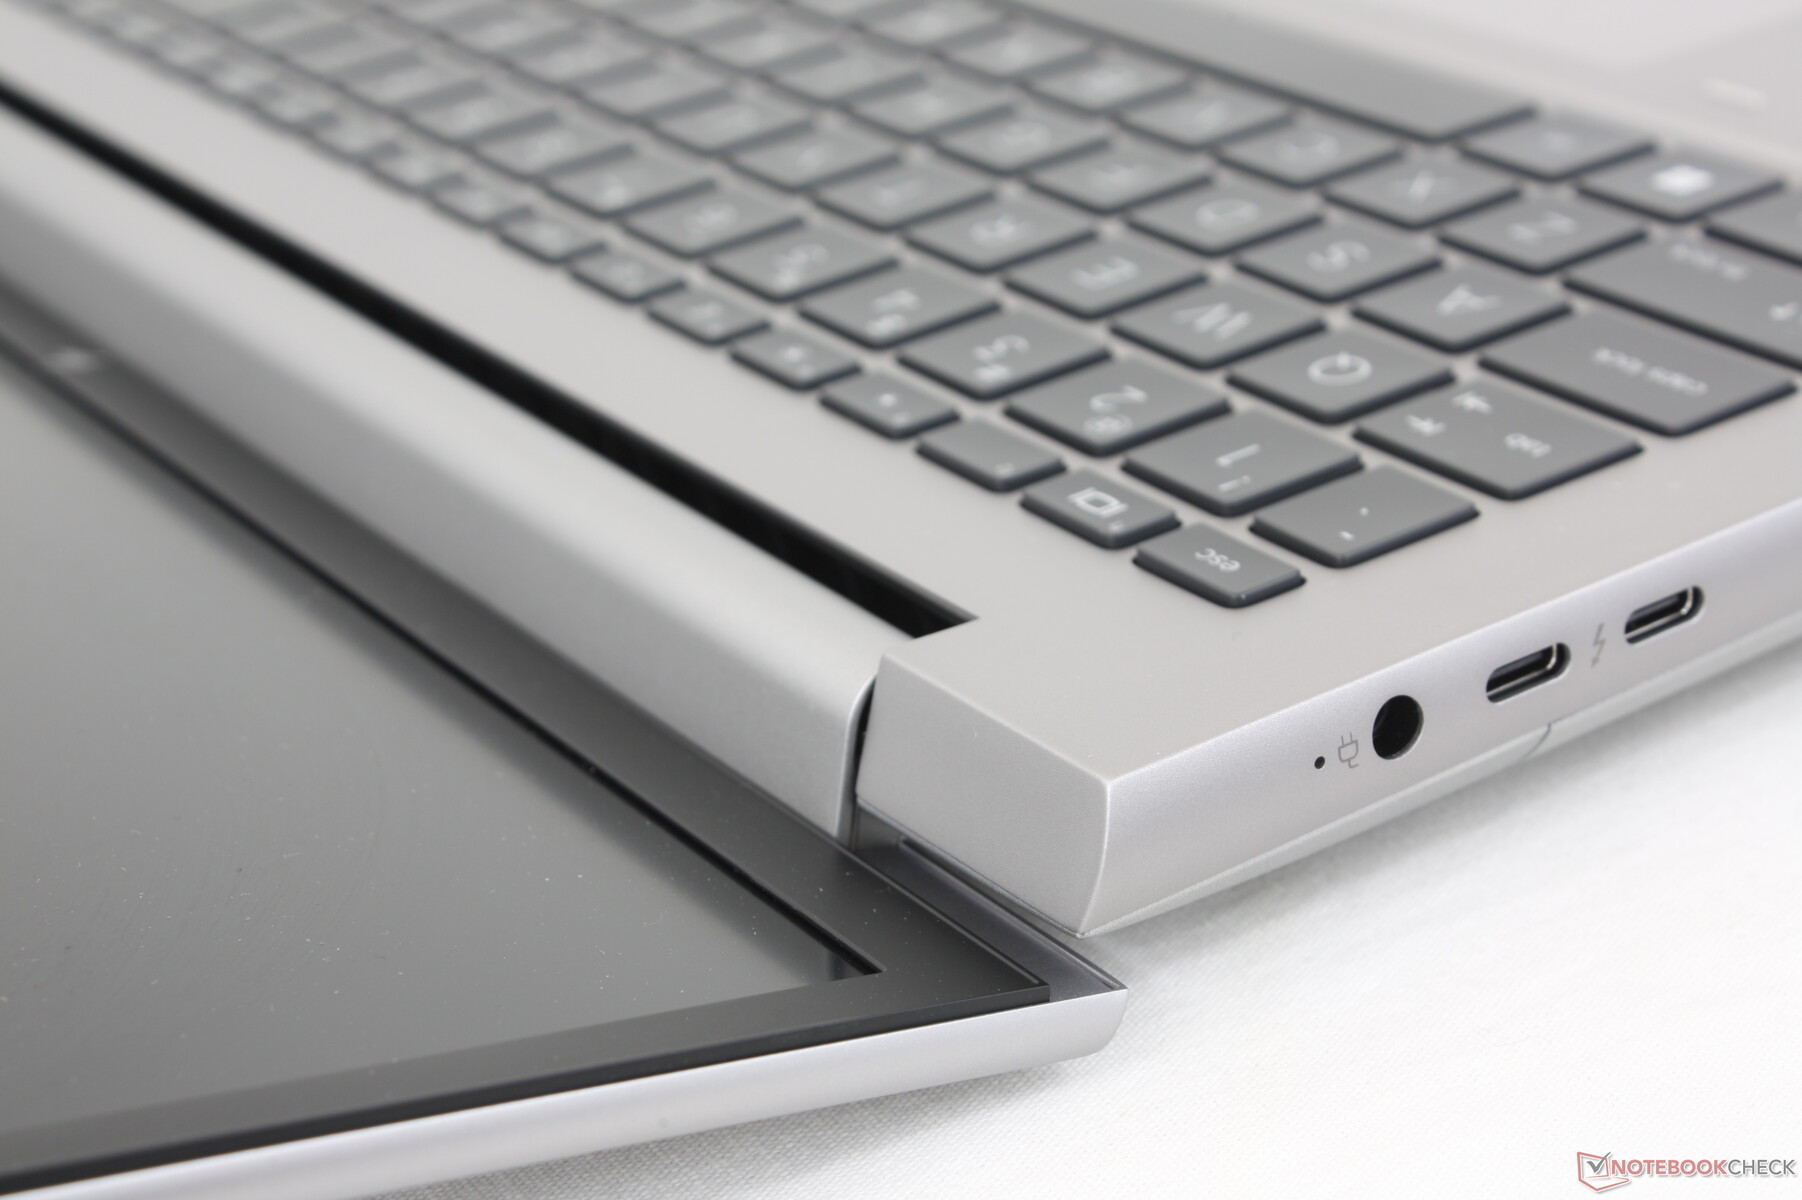
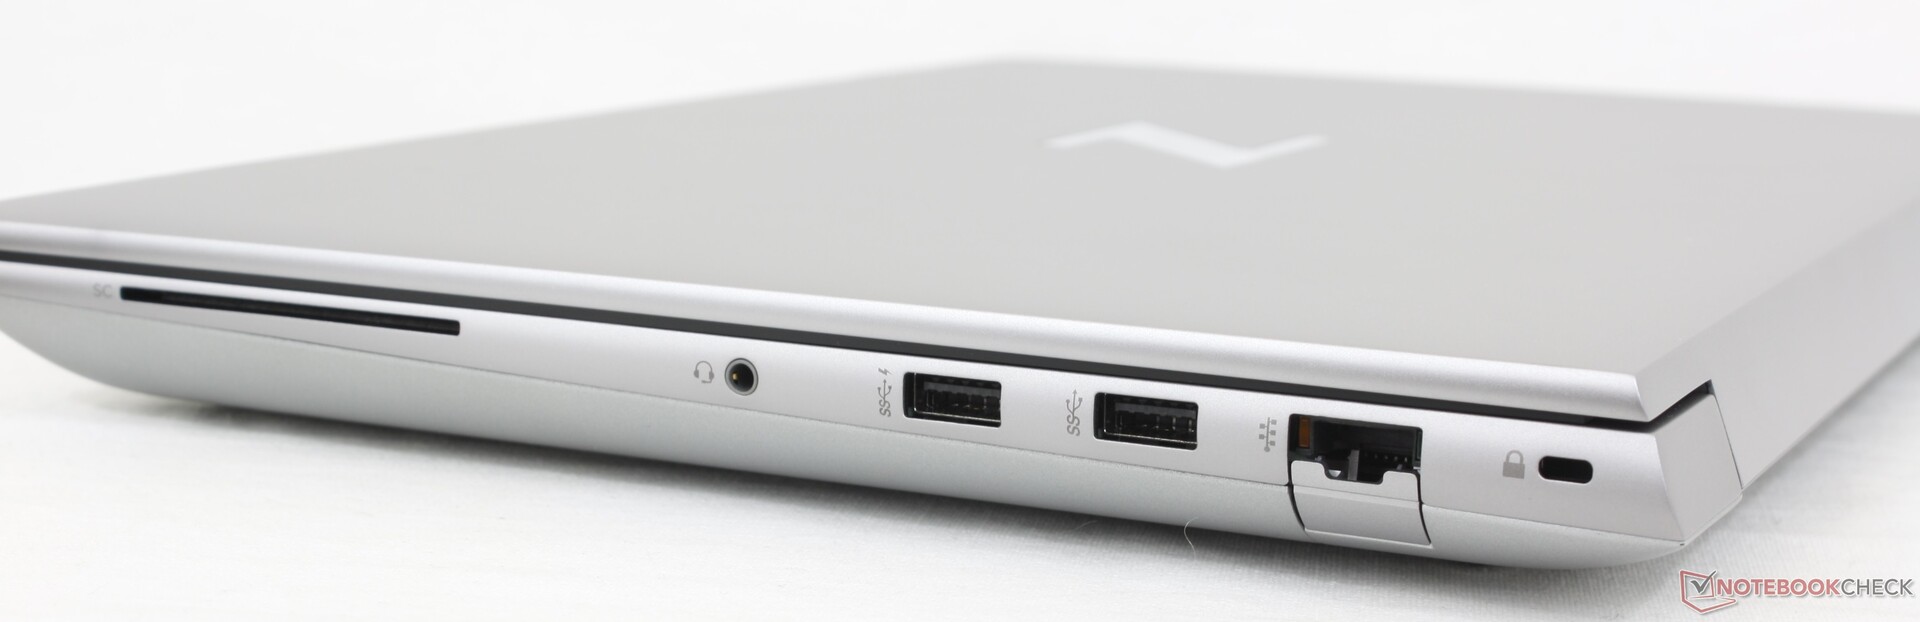
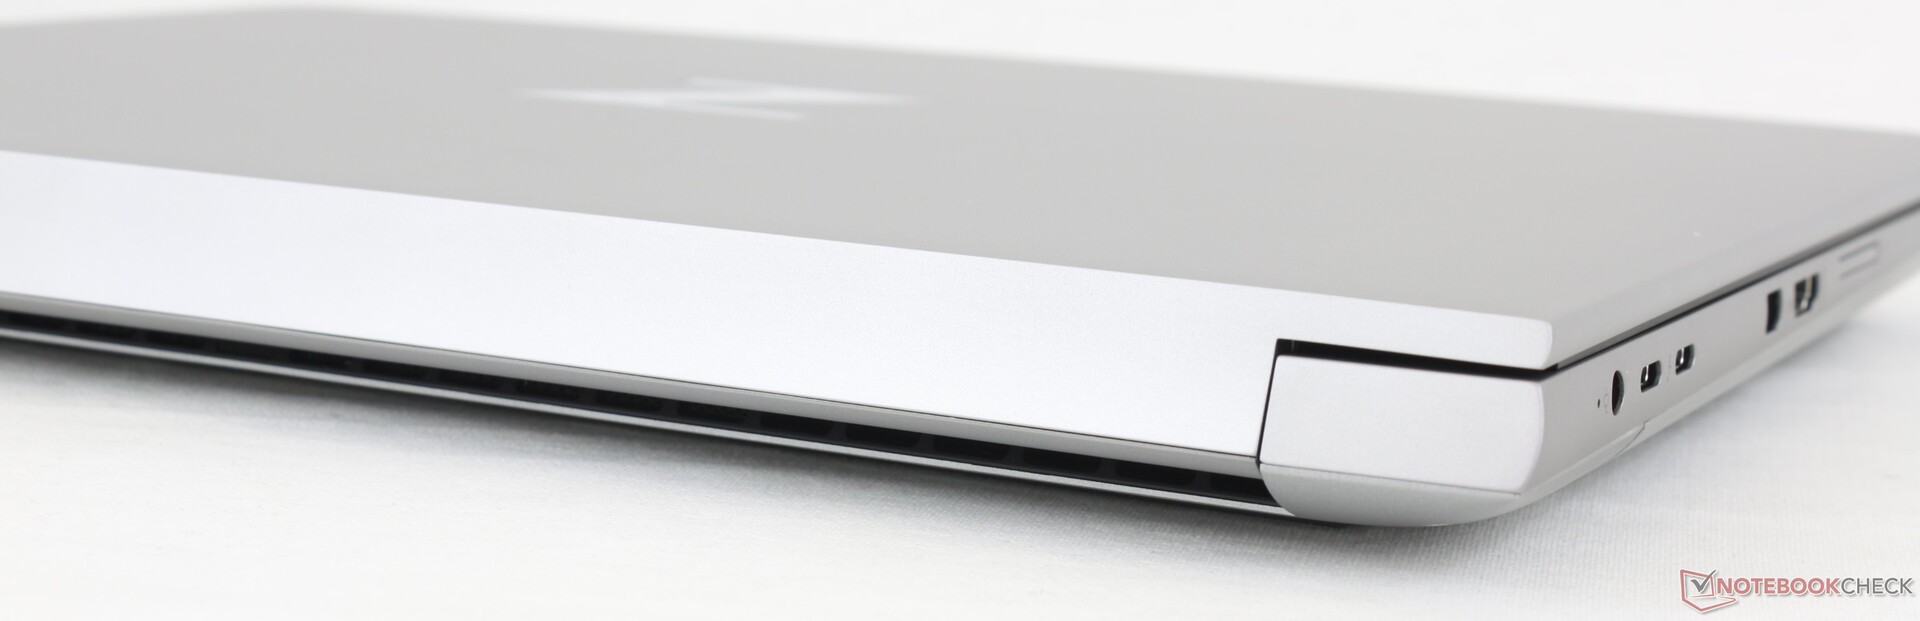
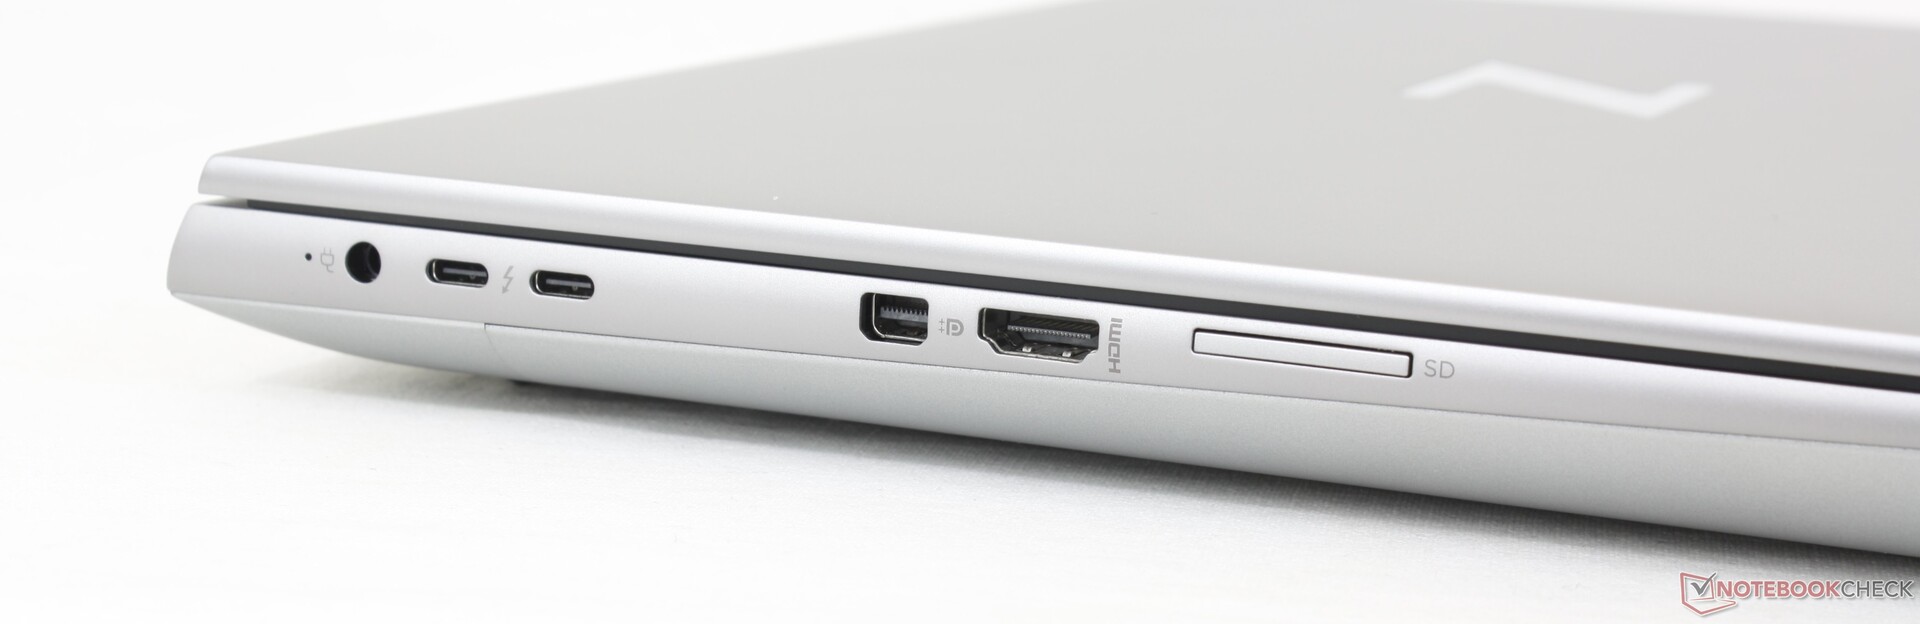
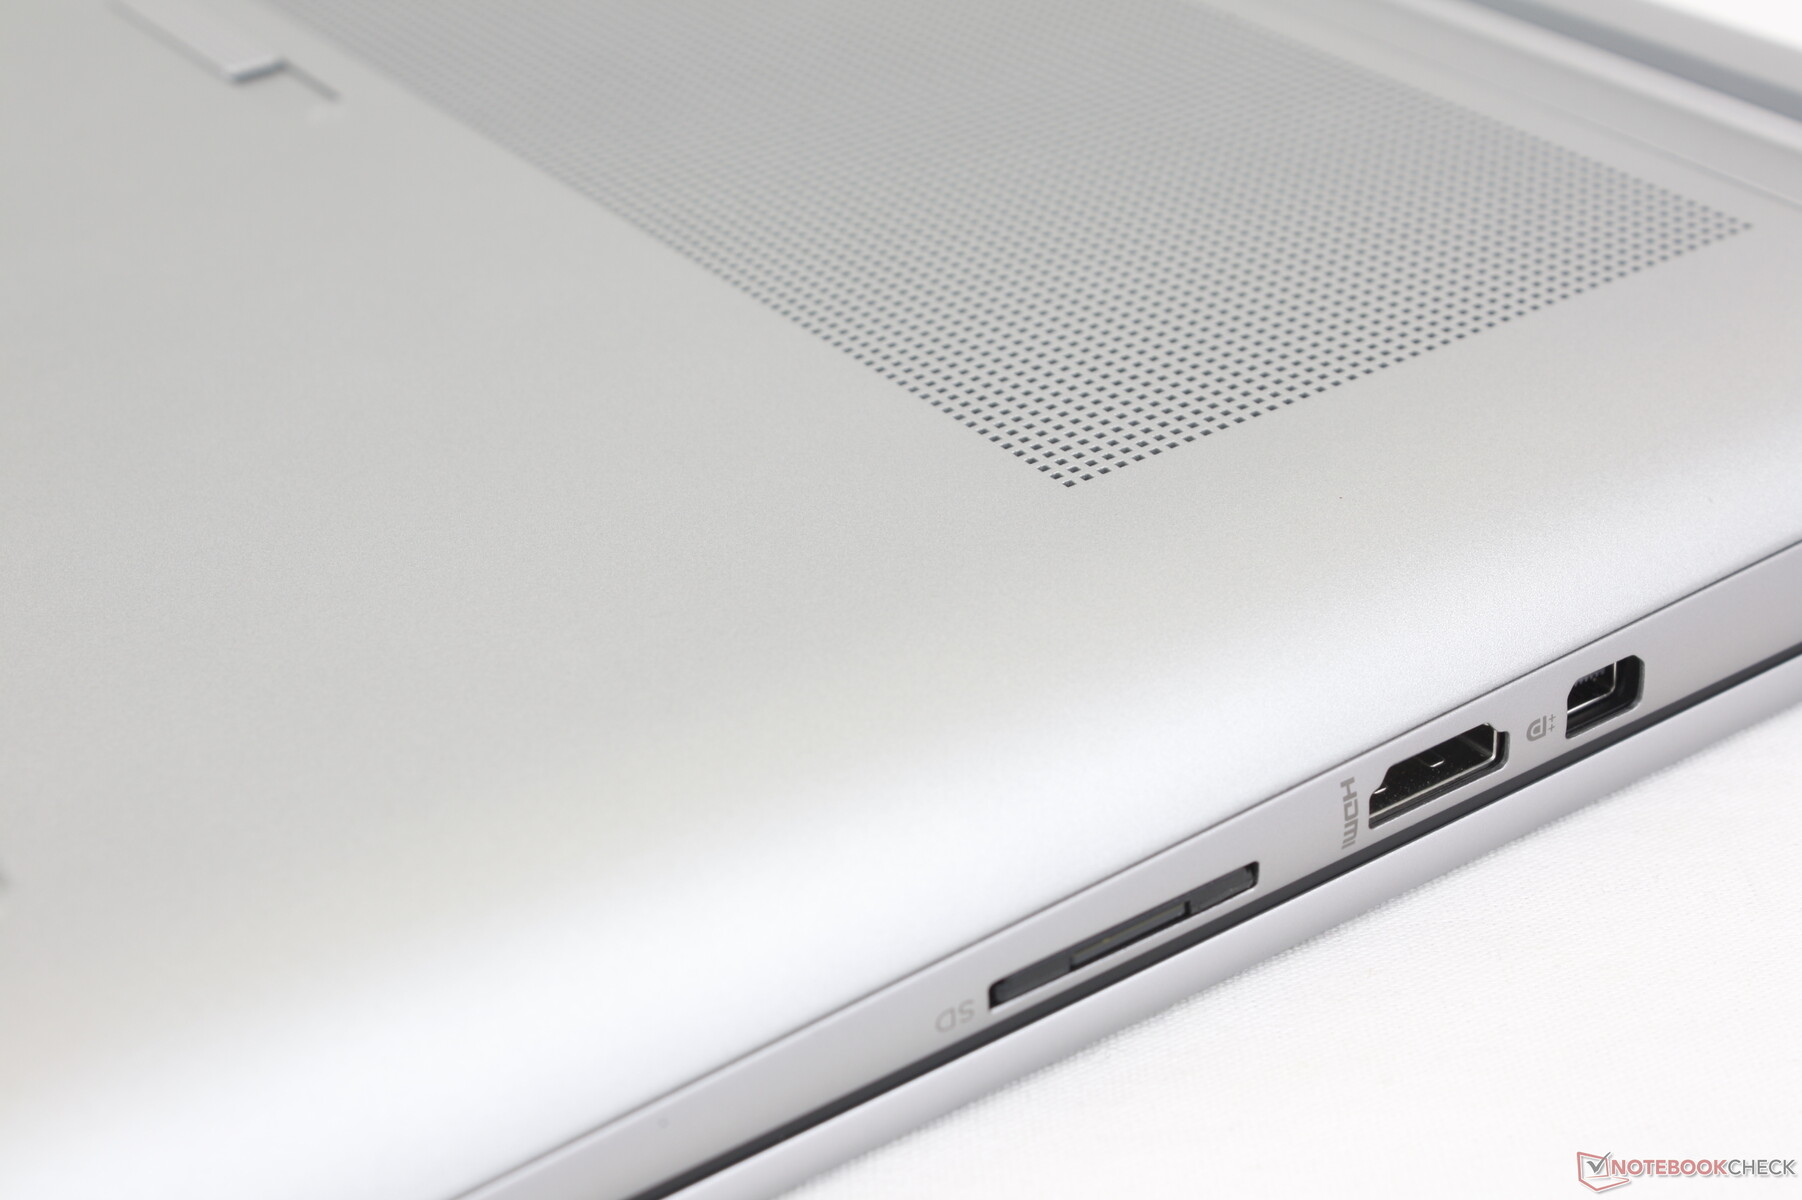
Connectiviteit
Onze HP heeft alle poorten van de Precision 7670, maar met een geïntegreerde mini-DisplayPort in plaats van een derde USB-C poort. In feite is dit een van de weinige mobiele werkstations met een mini-DisplayPort optie.
De twee USB-C poorten hadden beter gepositioneerd kunnen worden, omdat ze erg dicht op elkaar zitten naast de poort van de AC-adapter. Het aansluiten van bepaalde adapters of kabels op de ene poort kan bijvoorbeeld de toegang tot de andere twee poorten blokkeren.
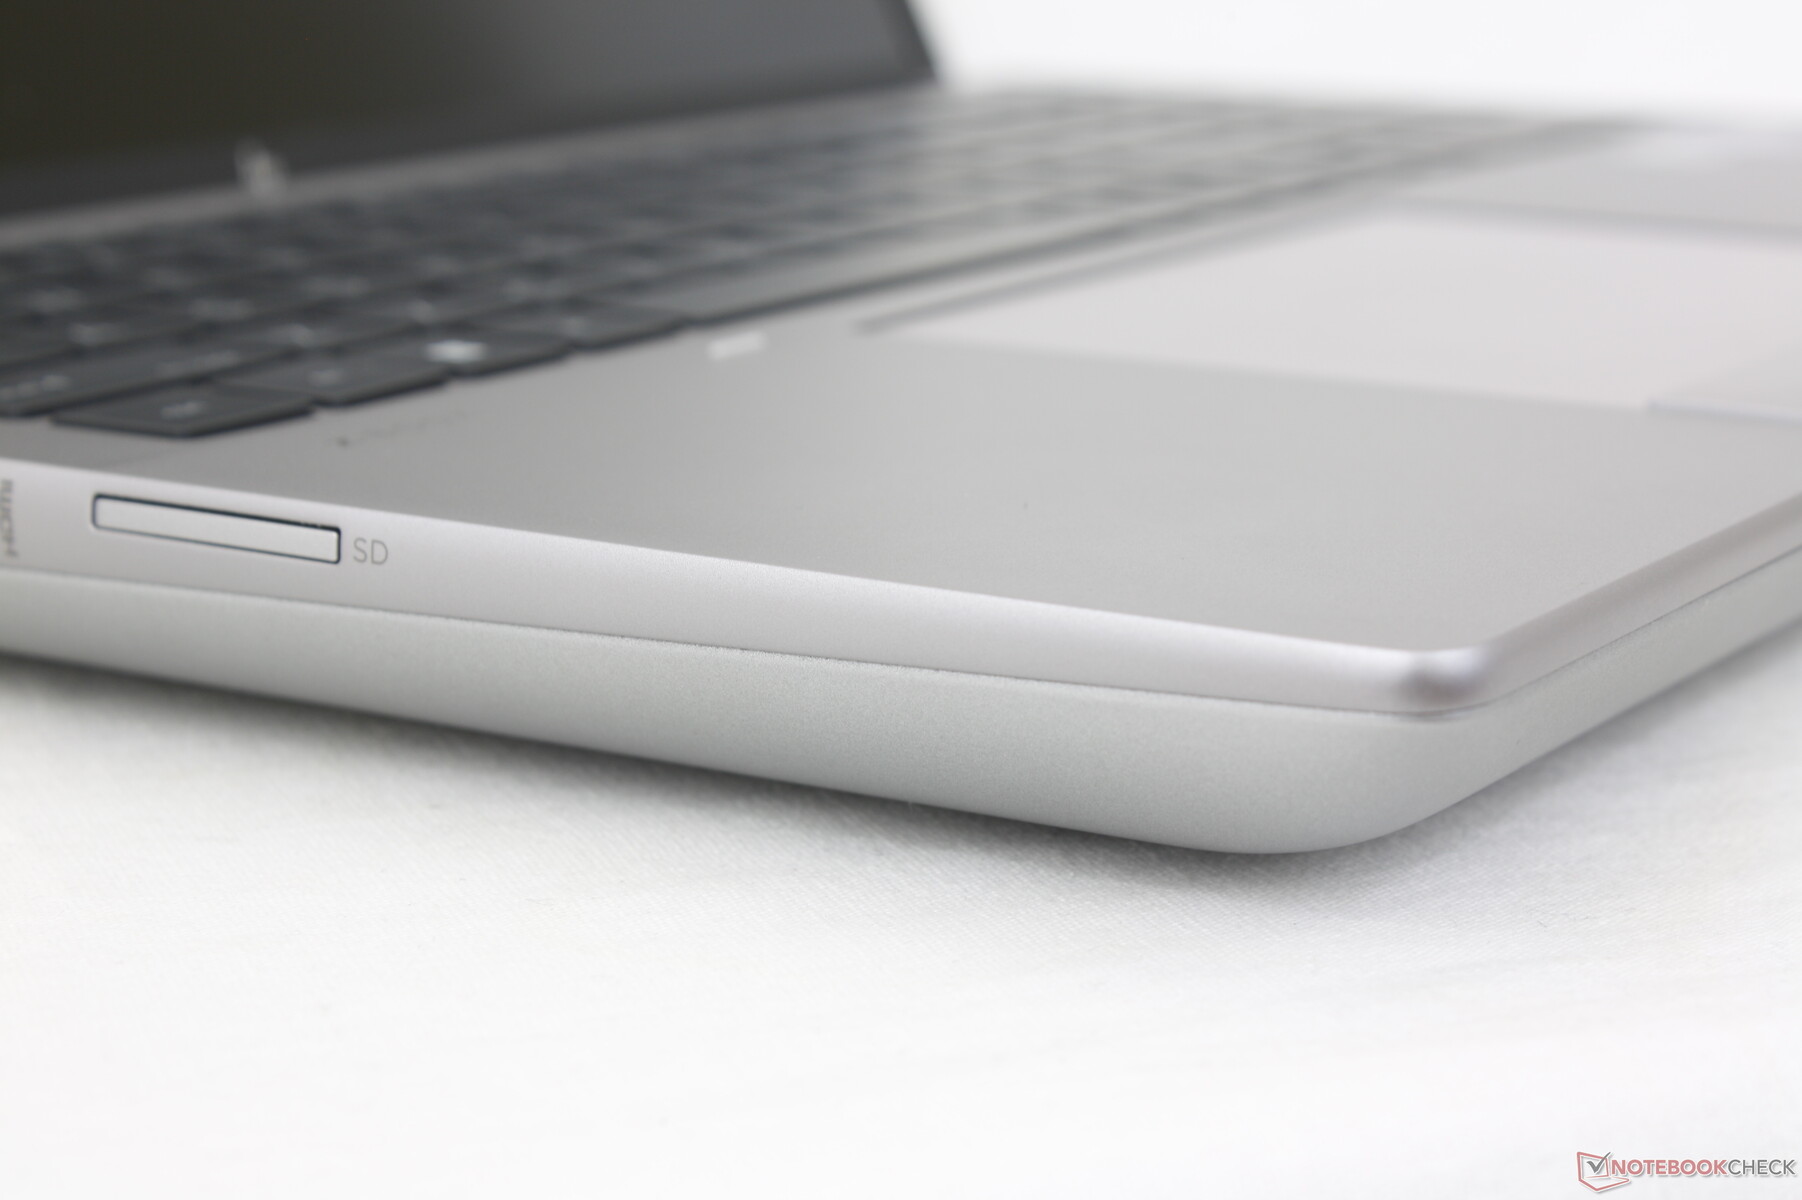
SD-kaartlezer
De overdrachtsnelheden bereiken een maximum van ongeveer 80 MB/s met onze PNY EliteX-PRO60 testkaart, hoewel de kaart overdrachtsnelheden tot 280 MB/s aankan. Ter vergelijking: de geïntegreerde SD-lezer op de Precision 7670 is meer dan 2x sneller. Gebruikers die vertrouwen op SD-kaarten voor video- en bestandsoverdracht kunnen in dit opzicht teleurgesteld worden door de Fury 16 G9.
| SD Card Reader | |
| average JPG Copy Test (av. of 3 runs) | |
| Dell Precision 7000 7670 Performance (Toshiba Exceria Pro SDXC 64 GB UHS-II) | |
| MSI CreatorPro Z16P B12UKST (AV Pro V60) | |
| HP ZBook Fury 16 G9 (PNY EliteX-PRO60) | |
| Lenovo ThinkPad P16 G1 RTX A5500 (Toshiba Exceria Pro SDXC 64 GB UHS-II) | |
| HP ZBook Studio 16 G9 62U04EA (Angelbird AV PRO V60) | |
| maximum AS SSD Seq Read Test (1GB) | |
| Dell Precision 7000 7670 Performance (Toshiba Exceria Pro SDXC 64 GB UHS-II) | |
| HP ZBook Fury 16 G9 (PNY EliteX-PRO60) | |
| MSI CreatorPro Z16P B12UKST (AV Pro V60) | |
| Lenovo ThinkPad P16 G1 RTX A5500 (Toshiba Exceria Pro SDXC 64 GB UHS-II) | |
| HP ZBook Studio 16 G9 62U04EA (Angelbird AV PRO V60) | |
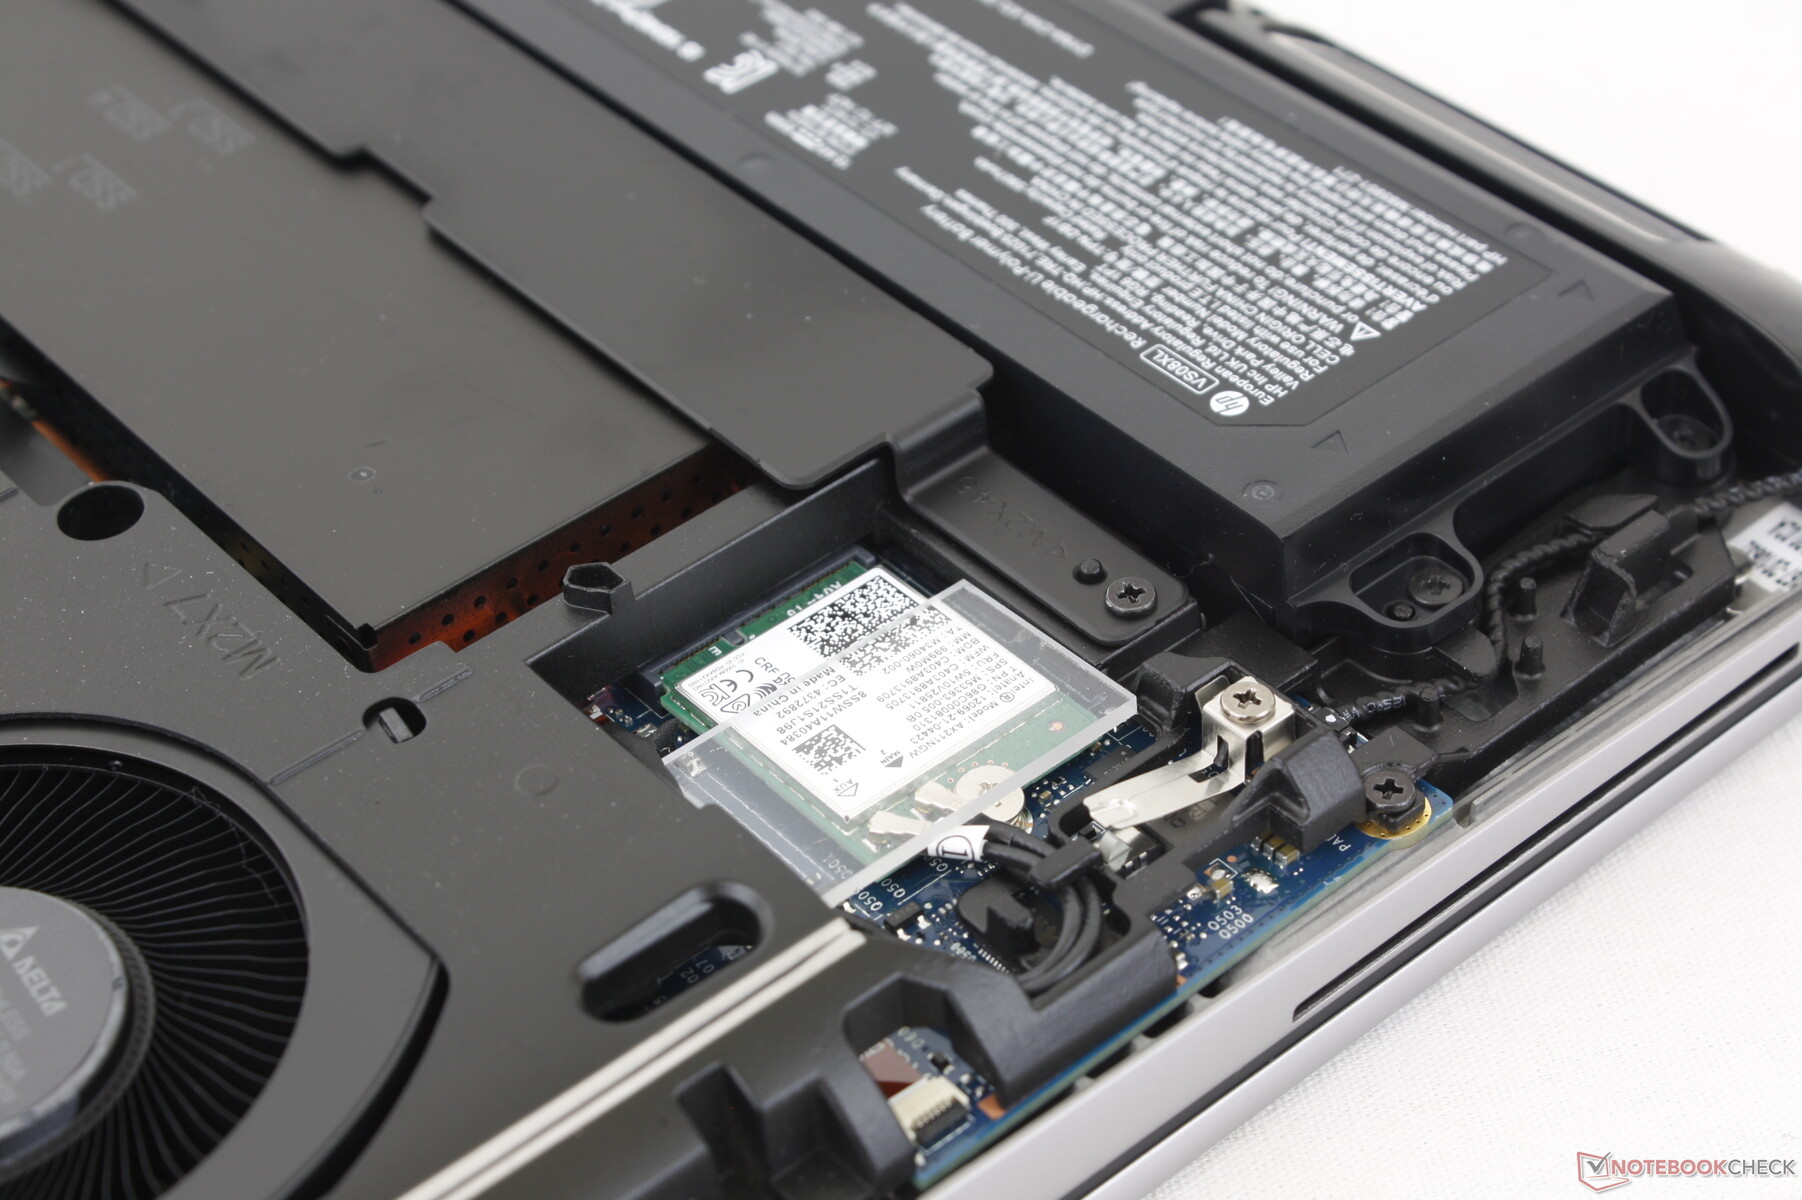
Communicatie
Ons Windows 10-toestel wordt geleverd met de Intel AX211 voor Wi-Fi 6E en Bluetooth 5.2 connectiviteit. Helaas is Wi-Fi 6E uitgeschakeld onder Windows 10 omdat Microsoft het (idioot genoeg) exclusief heeft gemaakt voor Windows 11. Je zult dus met Windows 11 moeten configureren als je wilt profiteren van de voordelen van 6 GHz Wi-Fi. Voor de rest hebben we geen prestatieproblemen ondervonden toen we gekoppeld waren aan ons normale Wi-Fi 6 netwerk.
Webcam
De ZBook Fury 16 G9 heeft de 5 MP webcam geërfd van de nieuwste Spectre en EliteBook-modellen. De beeldkwaliteit is scherper dan op de meeste andere laptops waar 1 MP en 2 MP sensoren nog steeds gebruikelijk zijn, waaronder op de concurrerende ThinkPad P16 en Precision 7670.
Een schuifsluiter en IR-sensor zijn inbegrepen voor respectievelijk privacy en Hello ondersteuning.


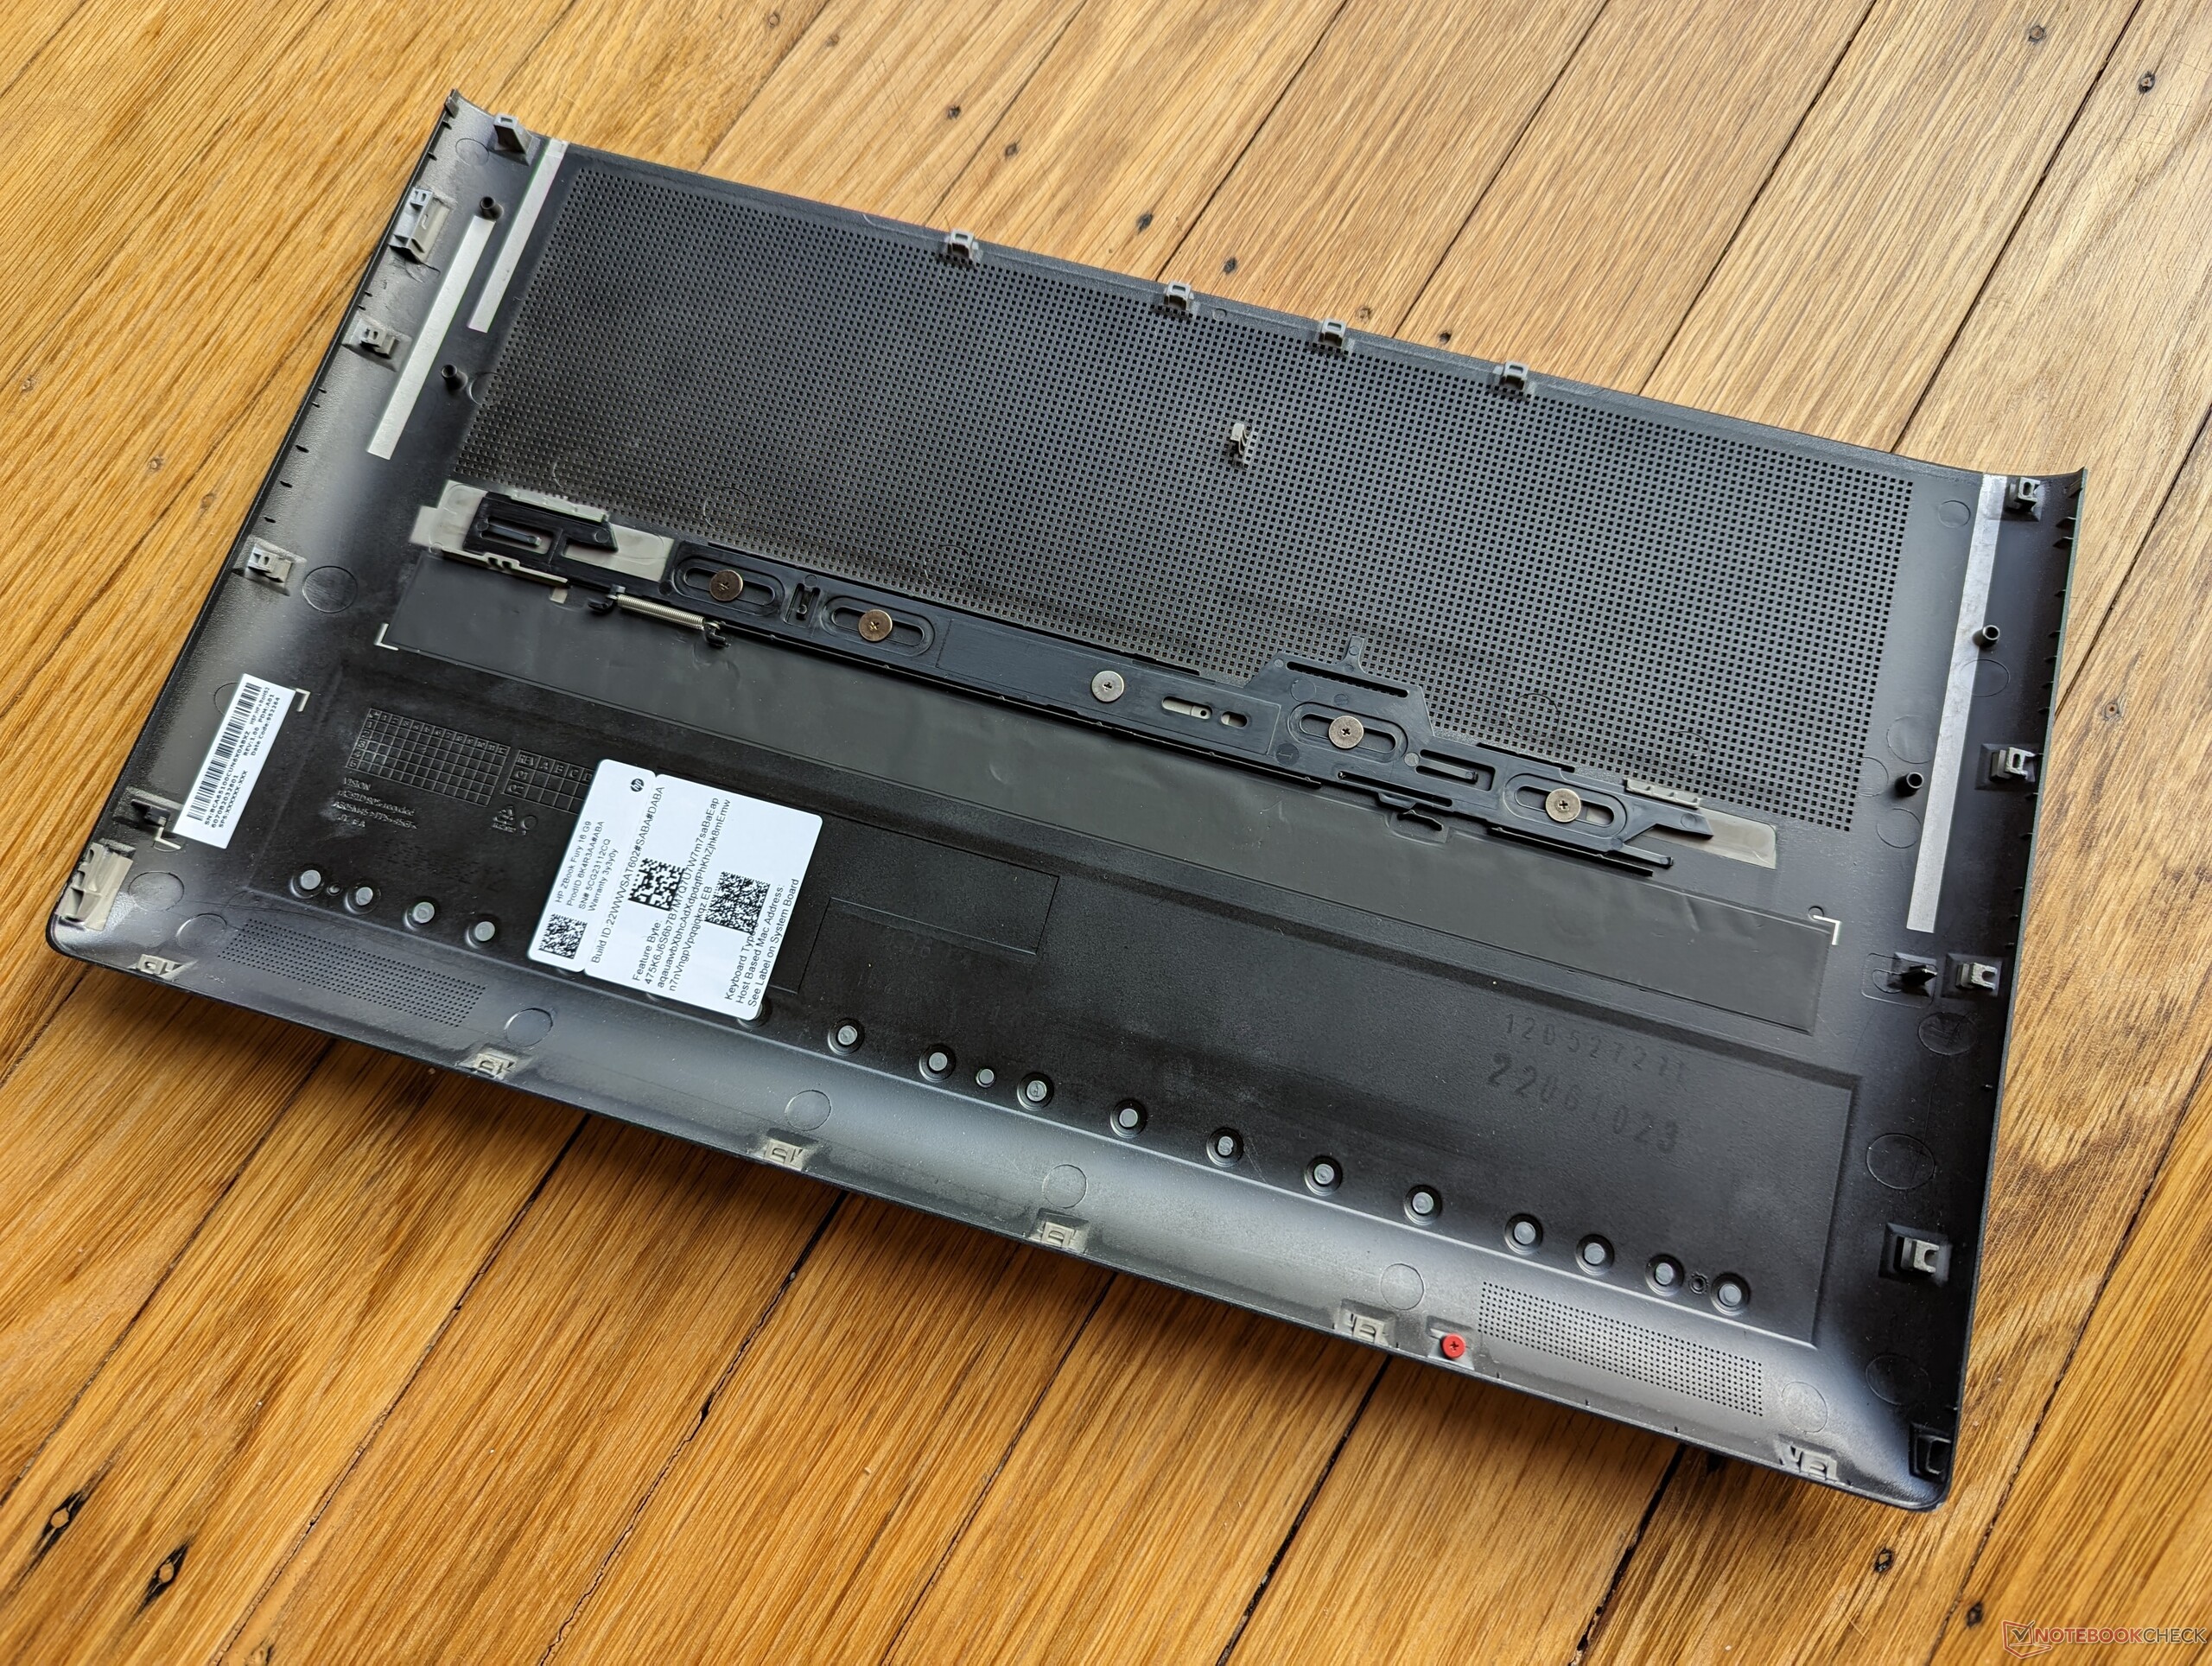
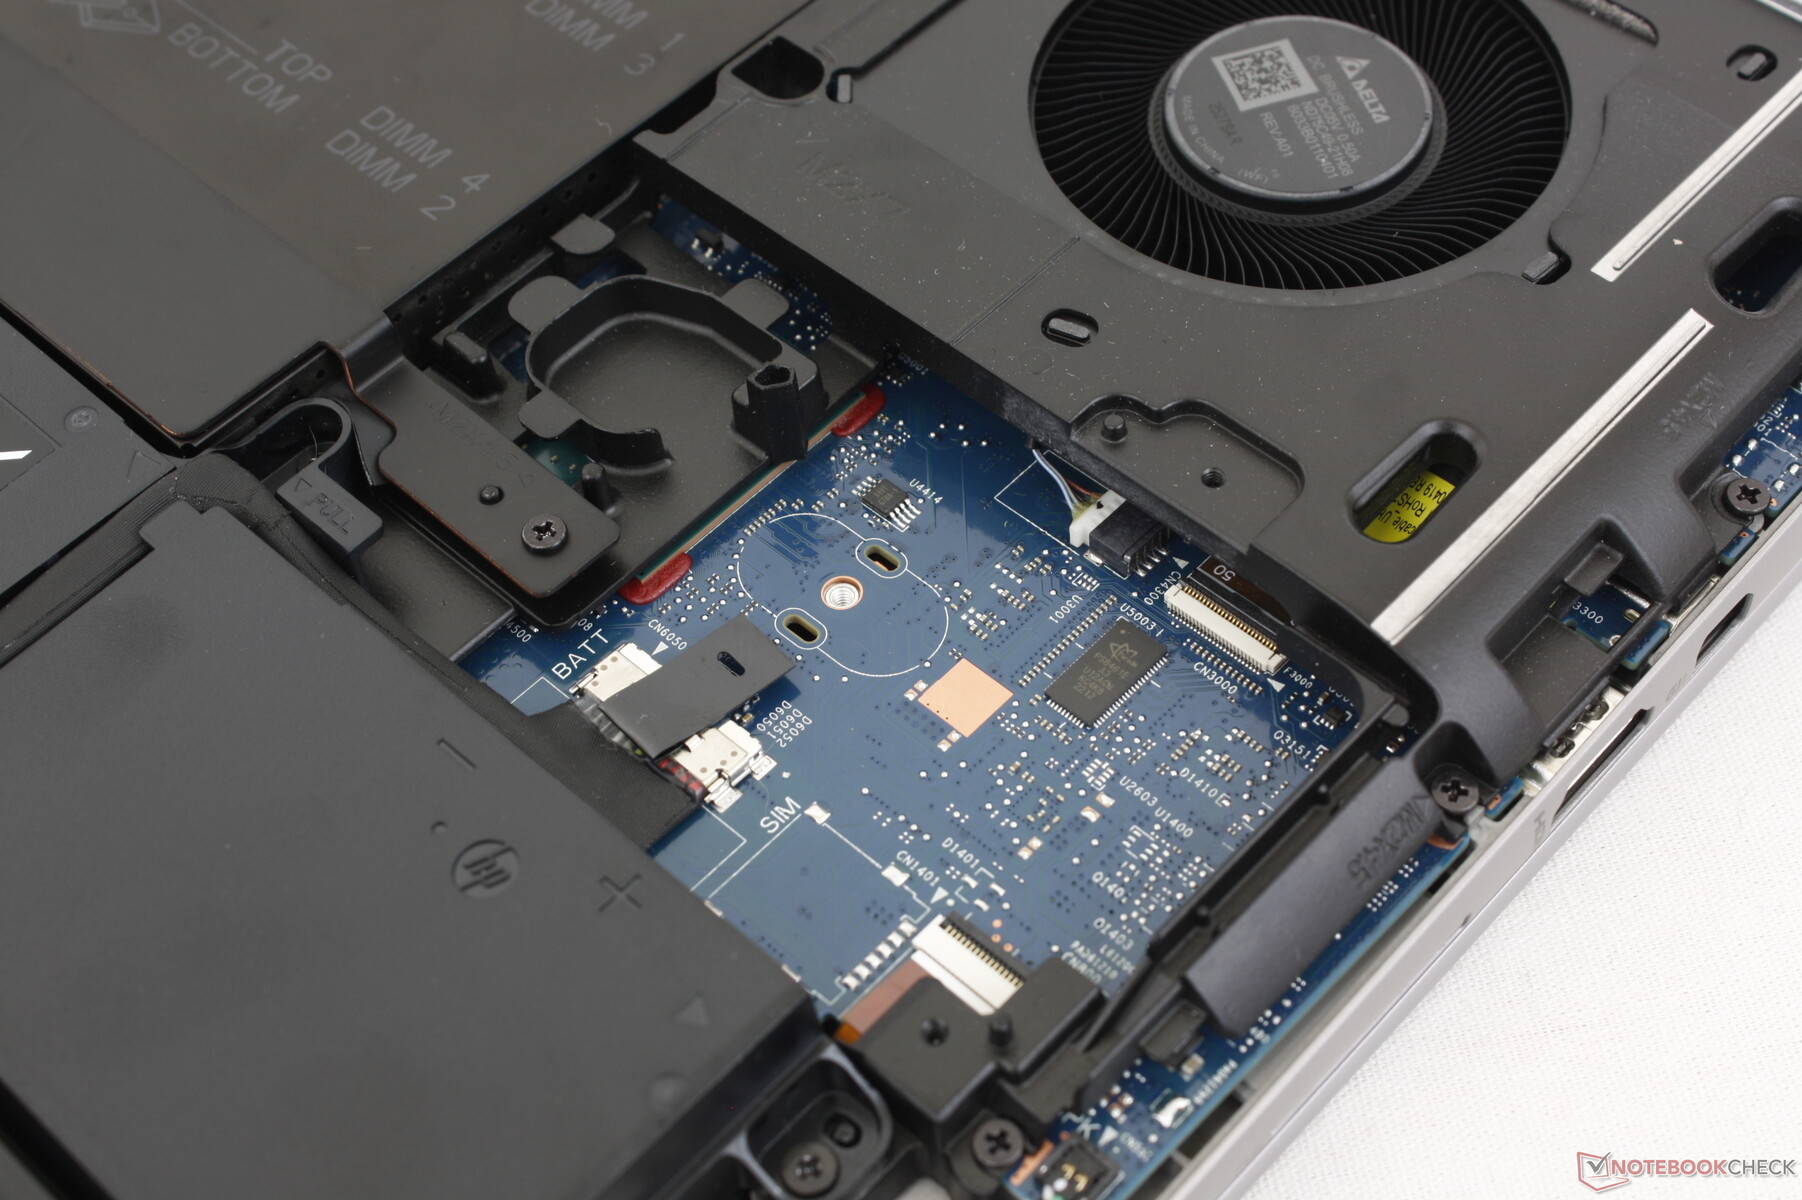
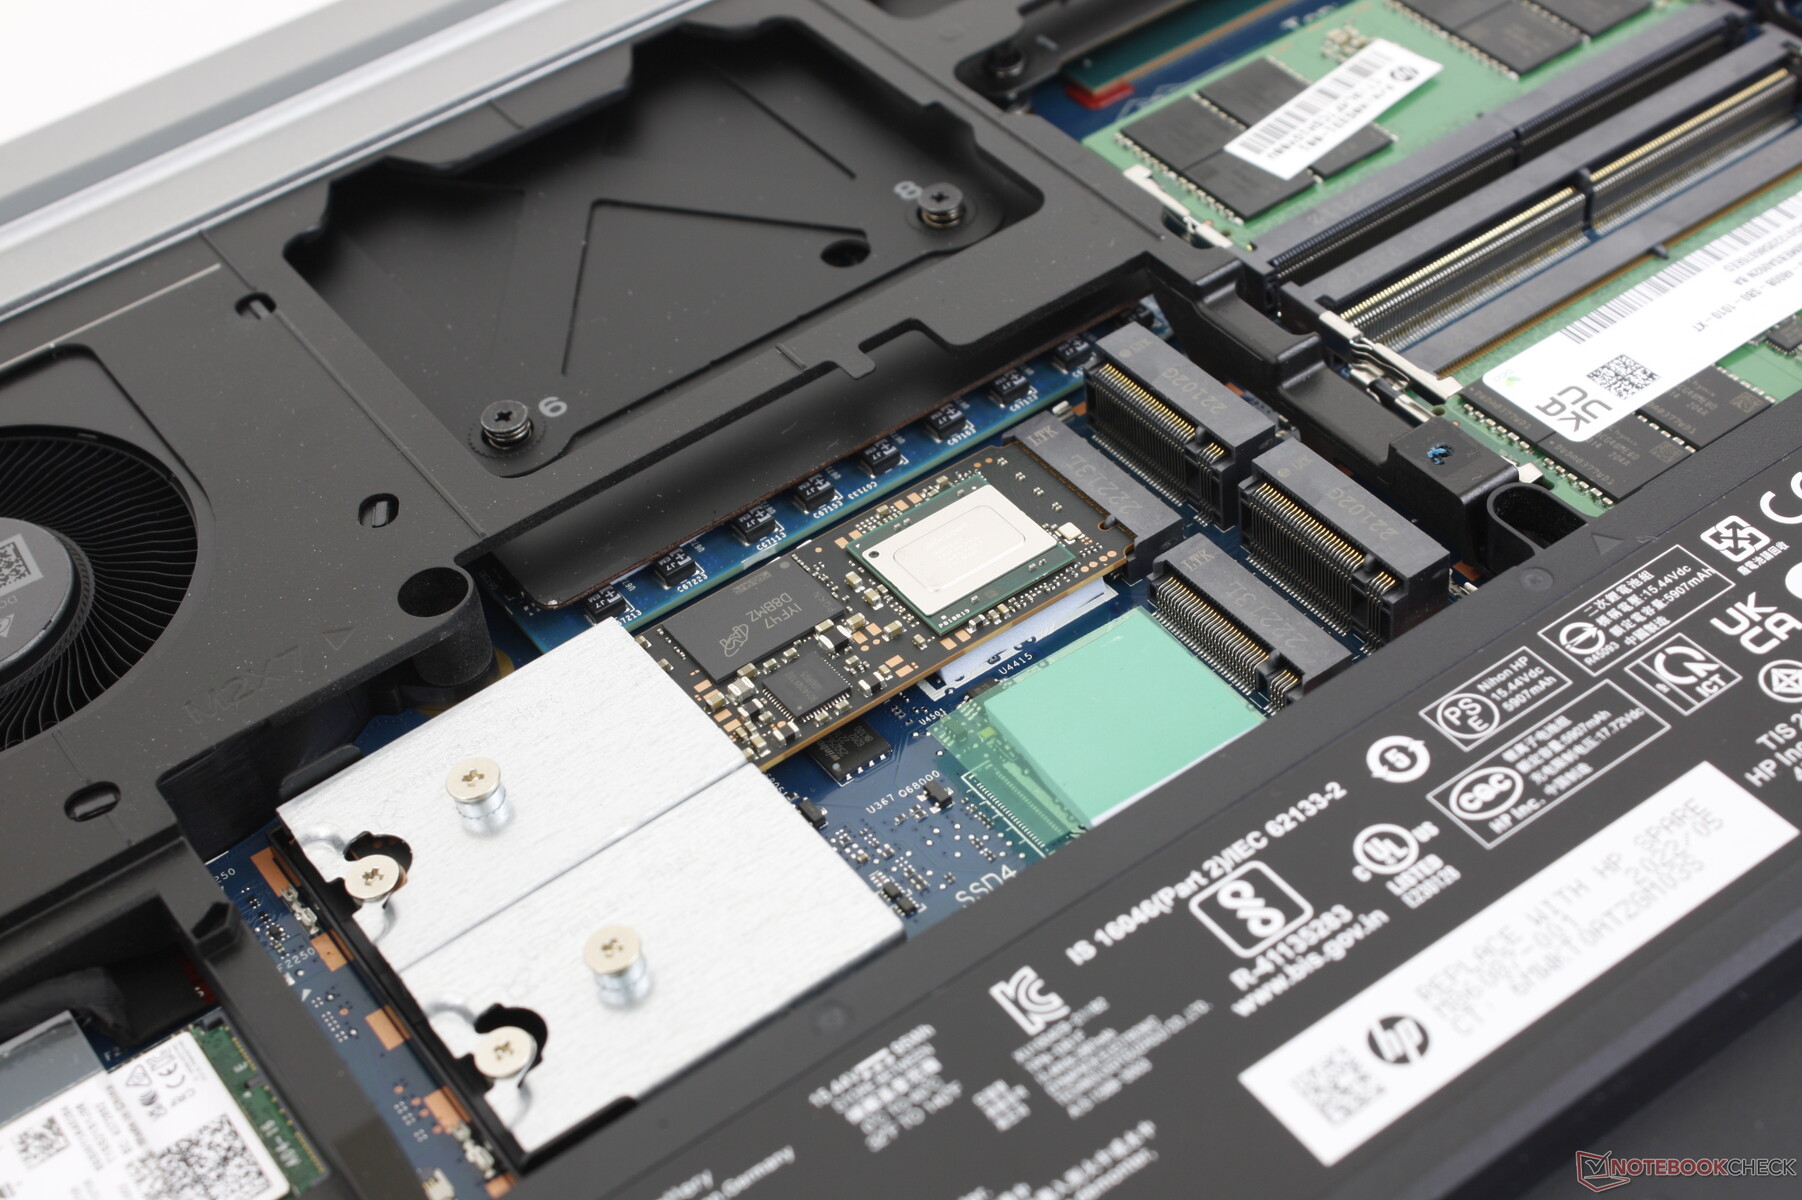
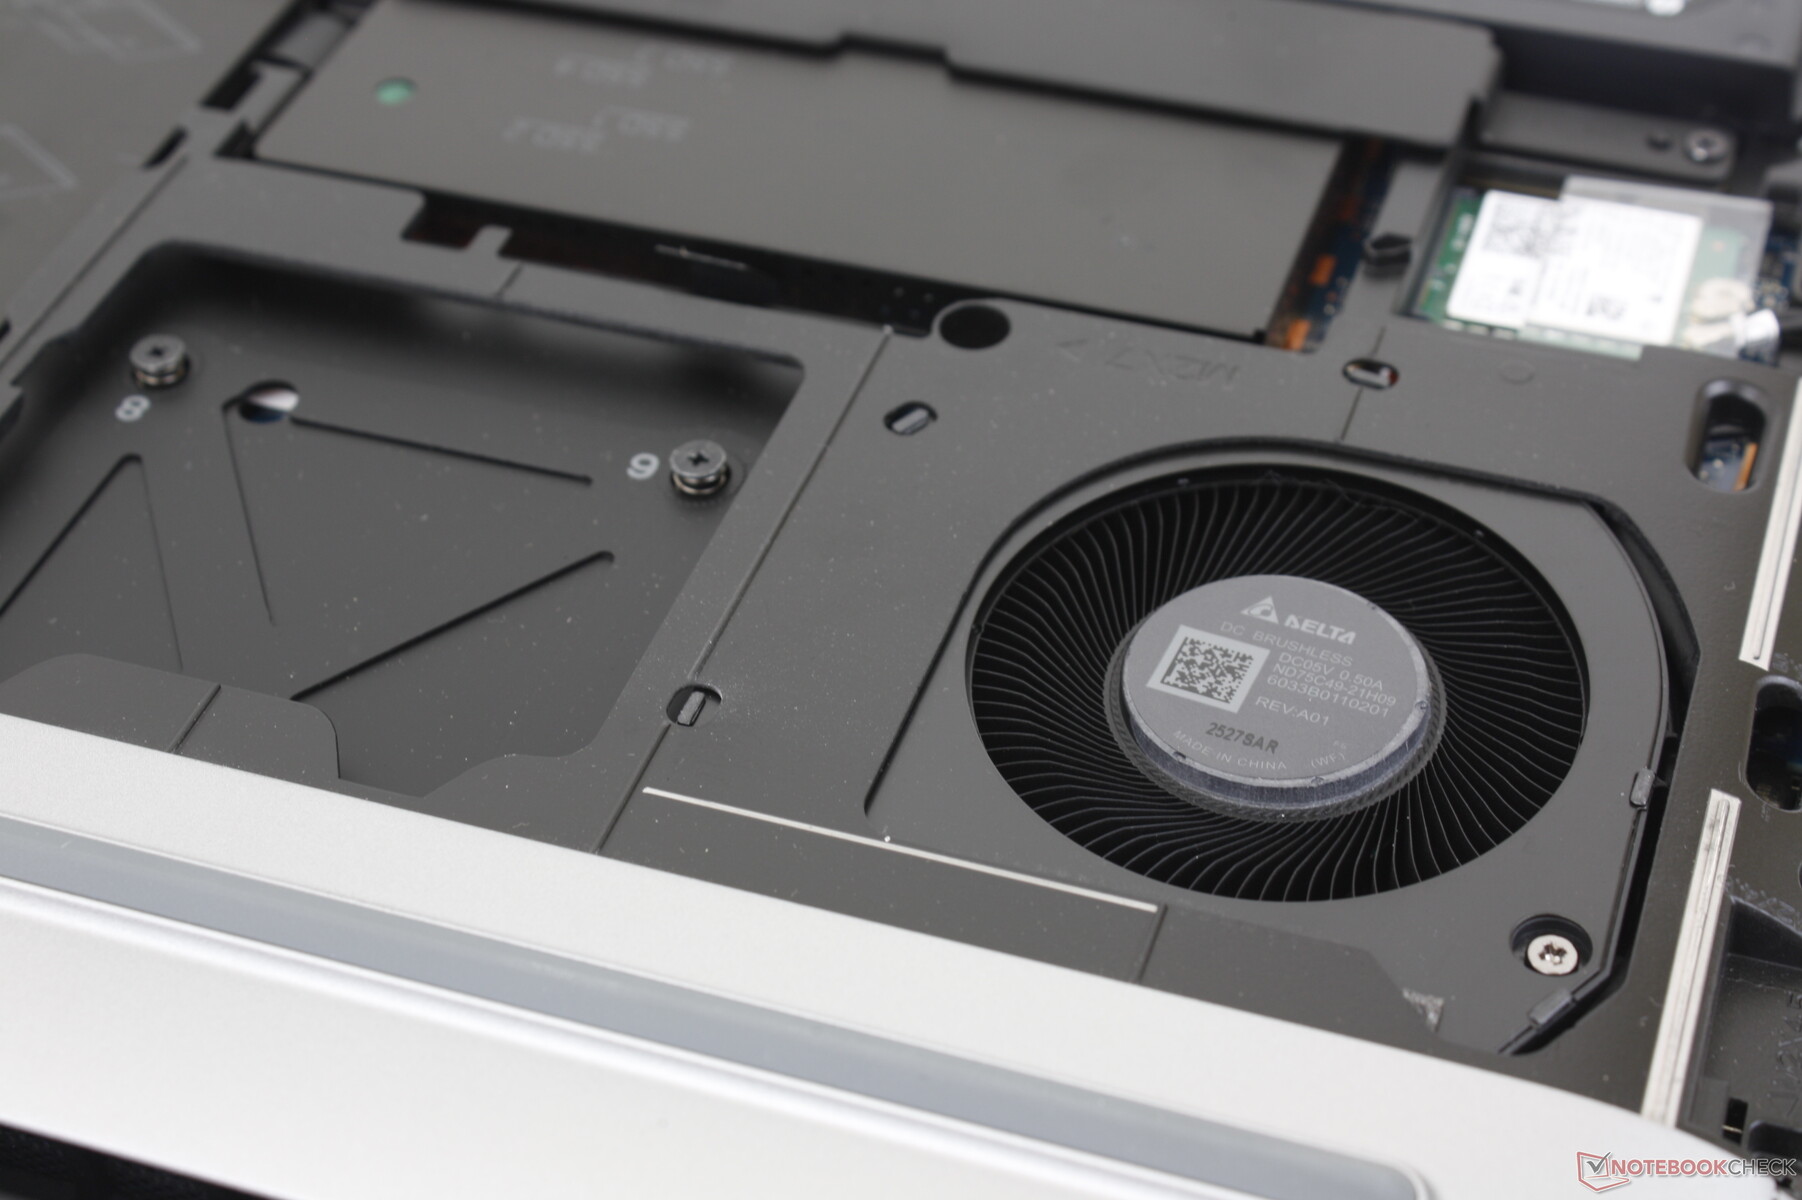
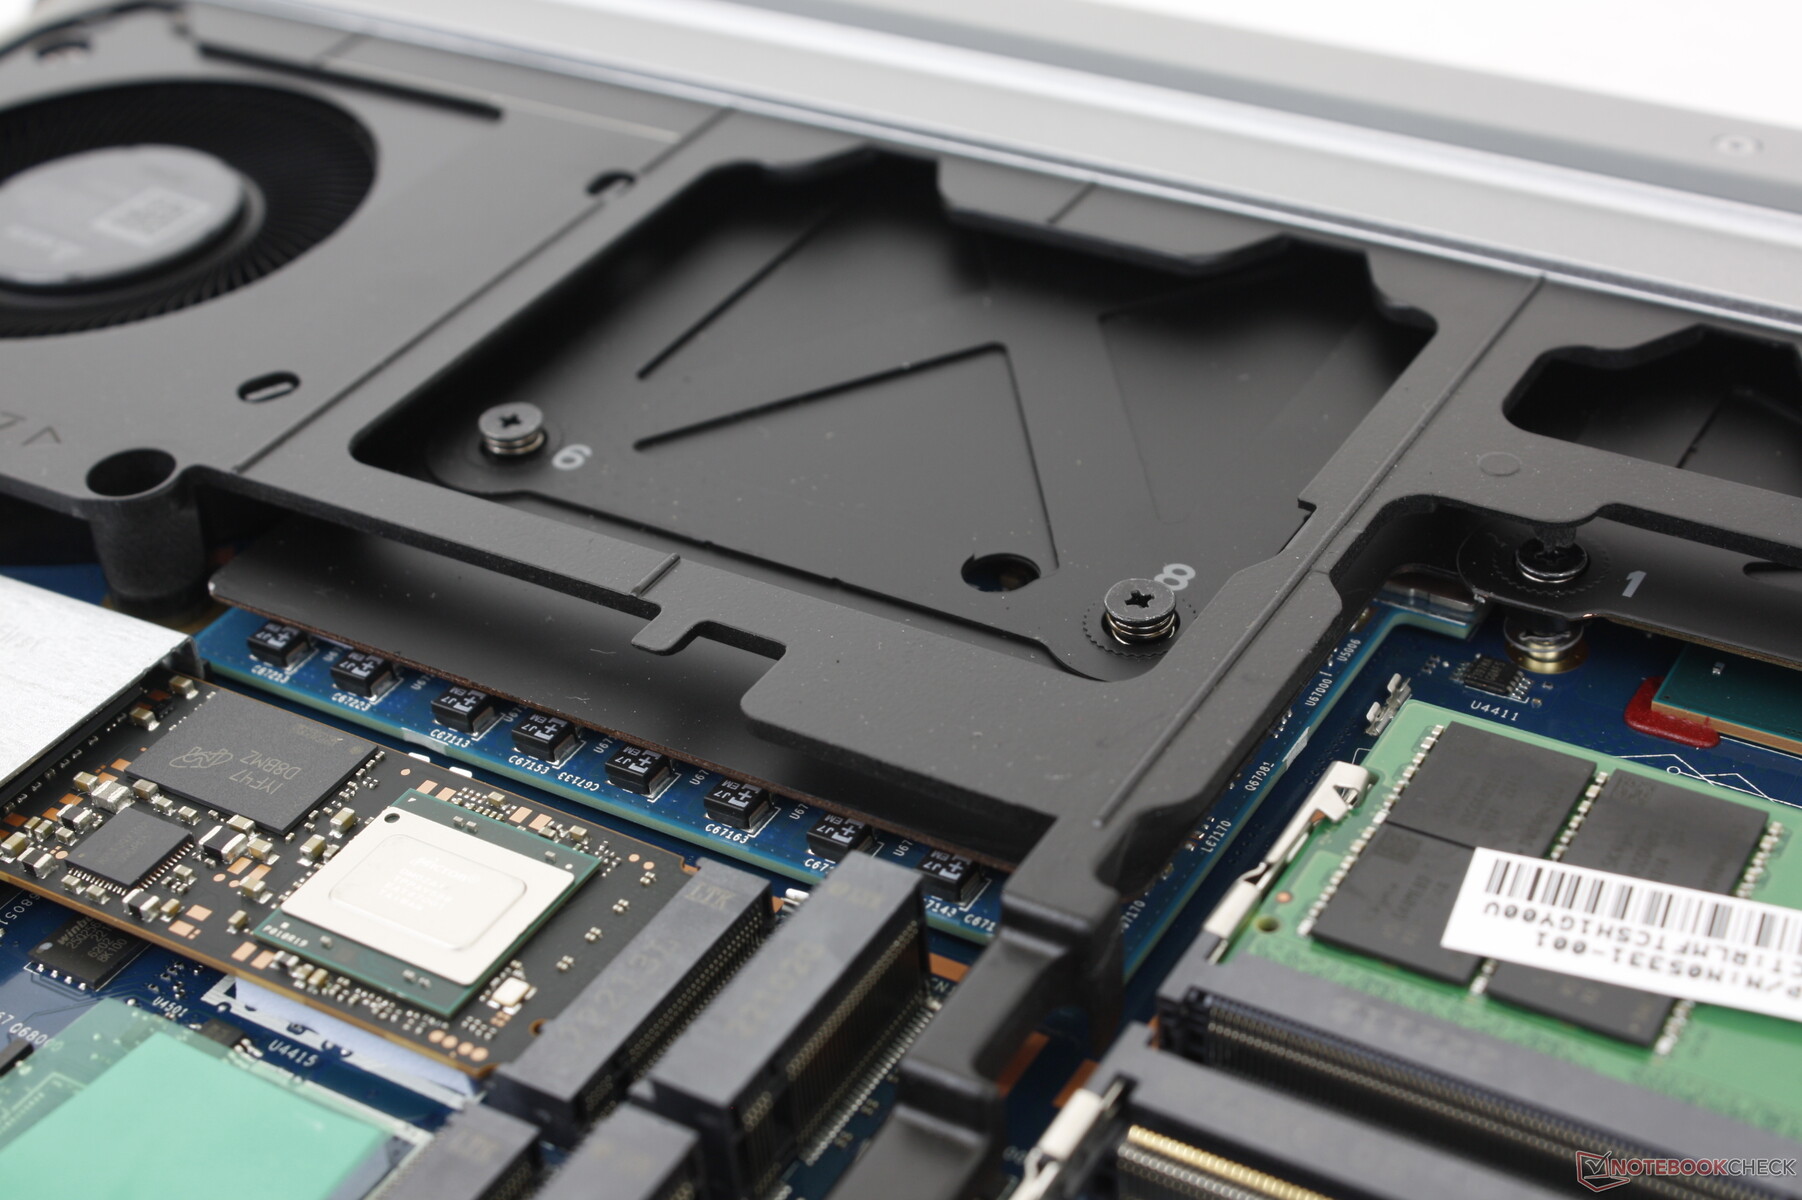
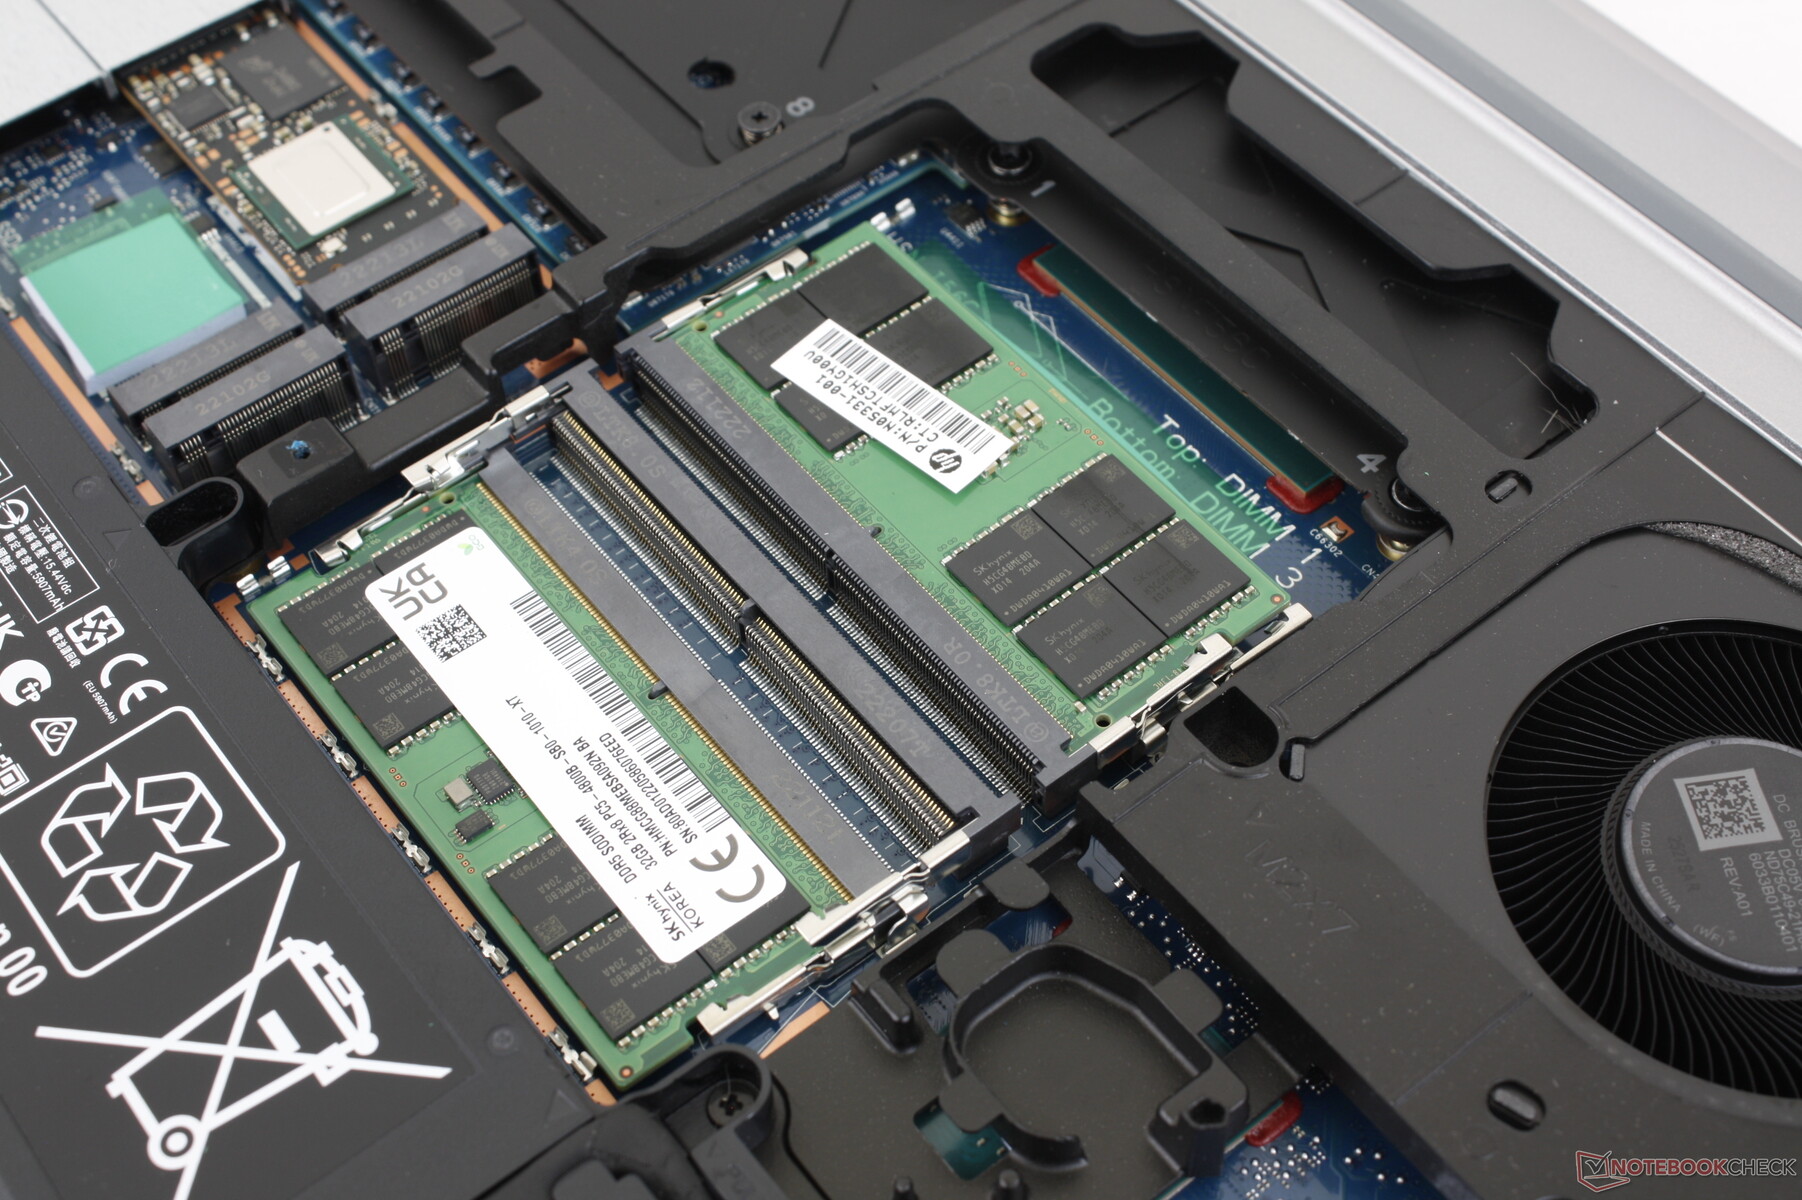
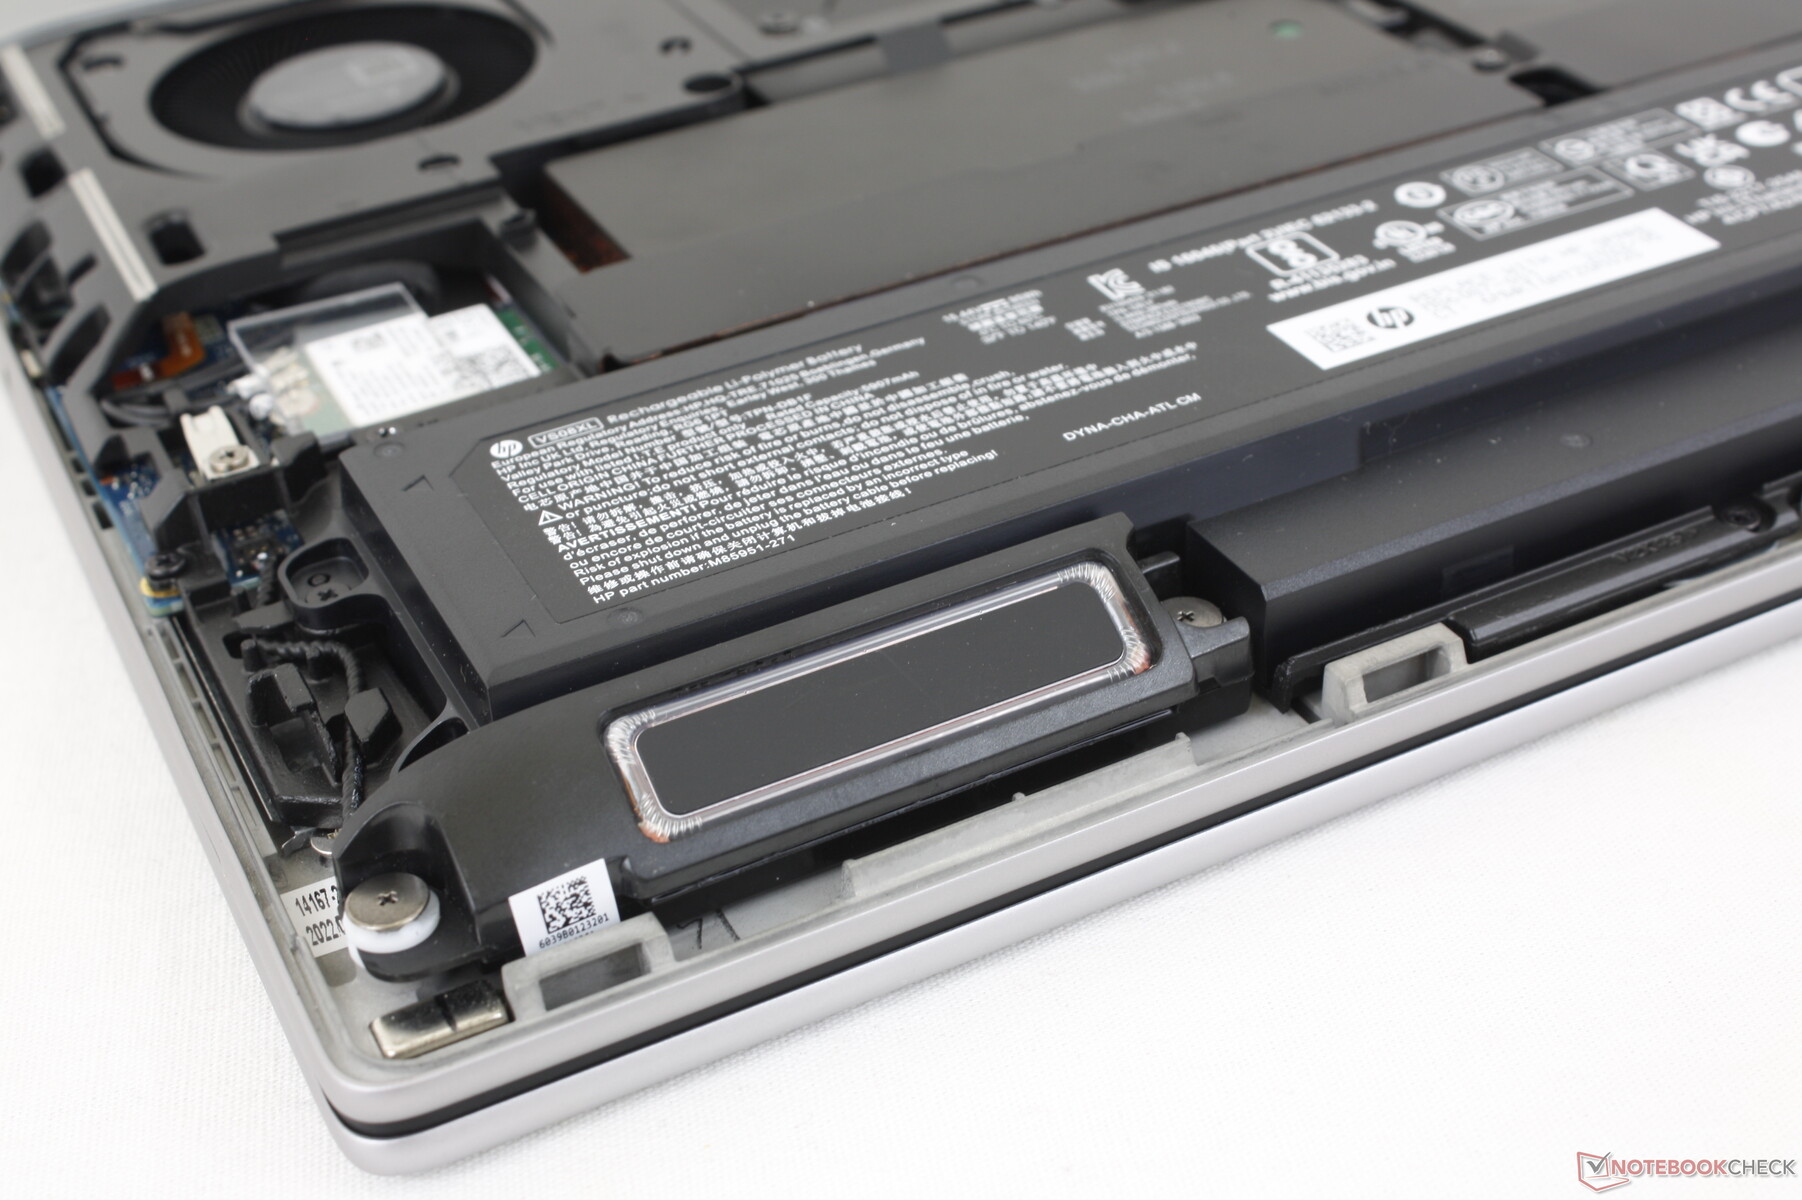
Onderhoud
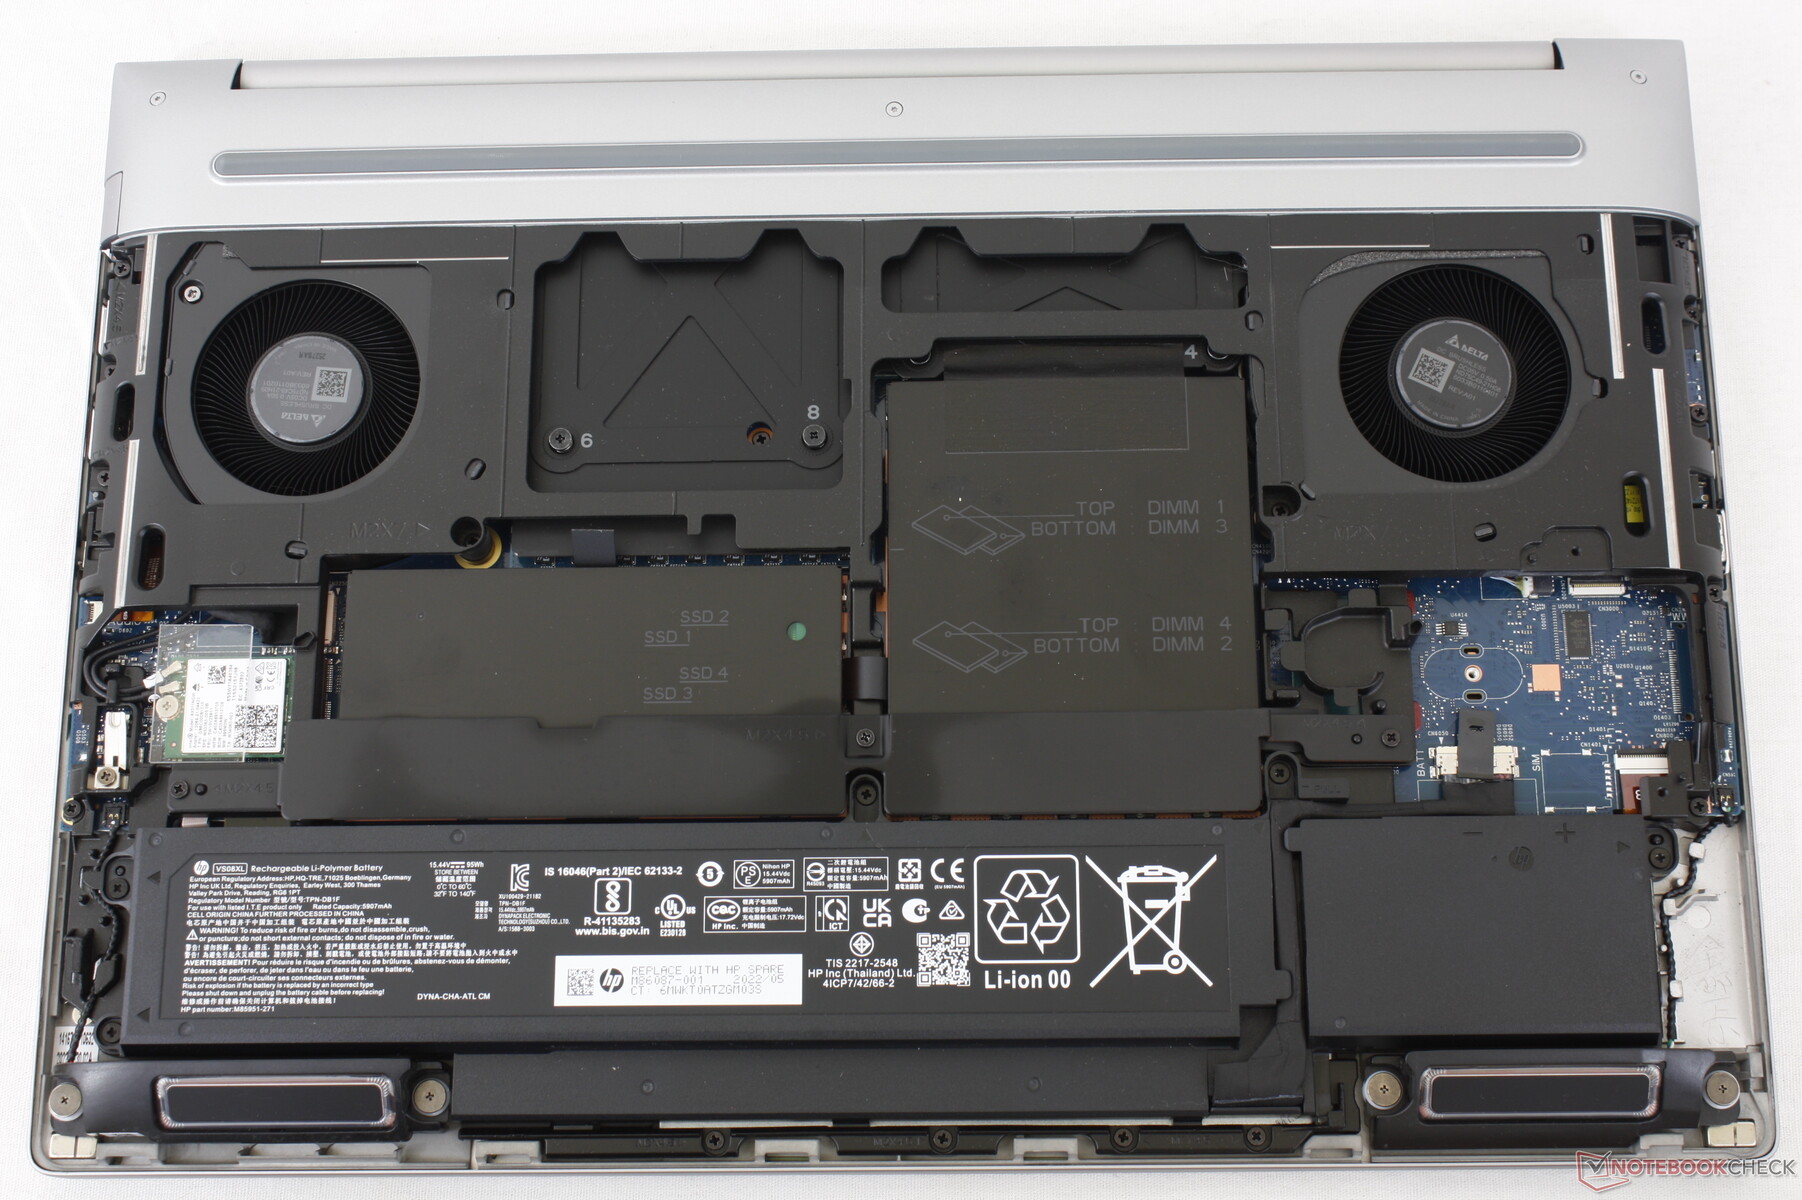
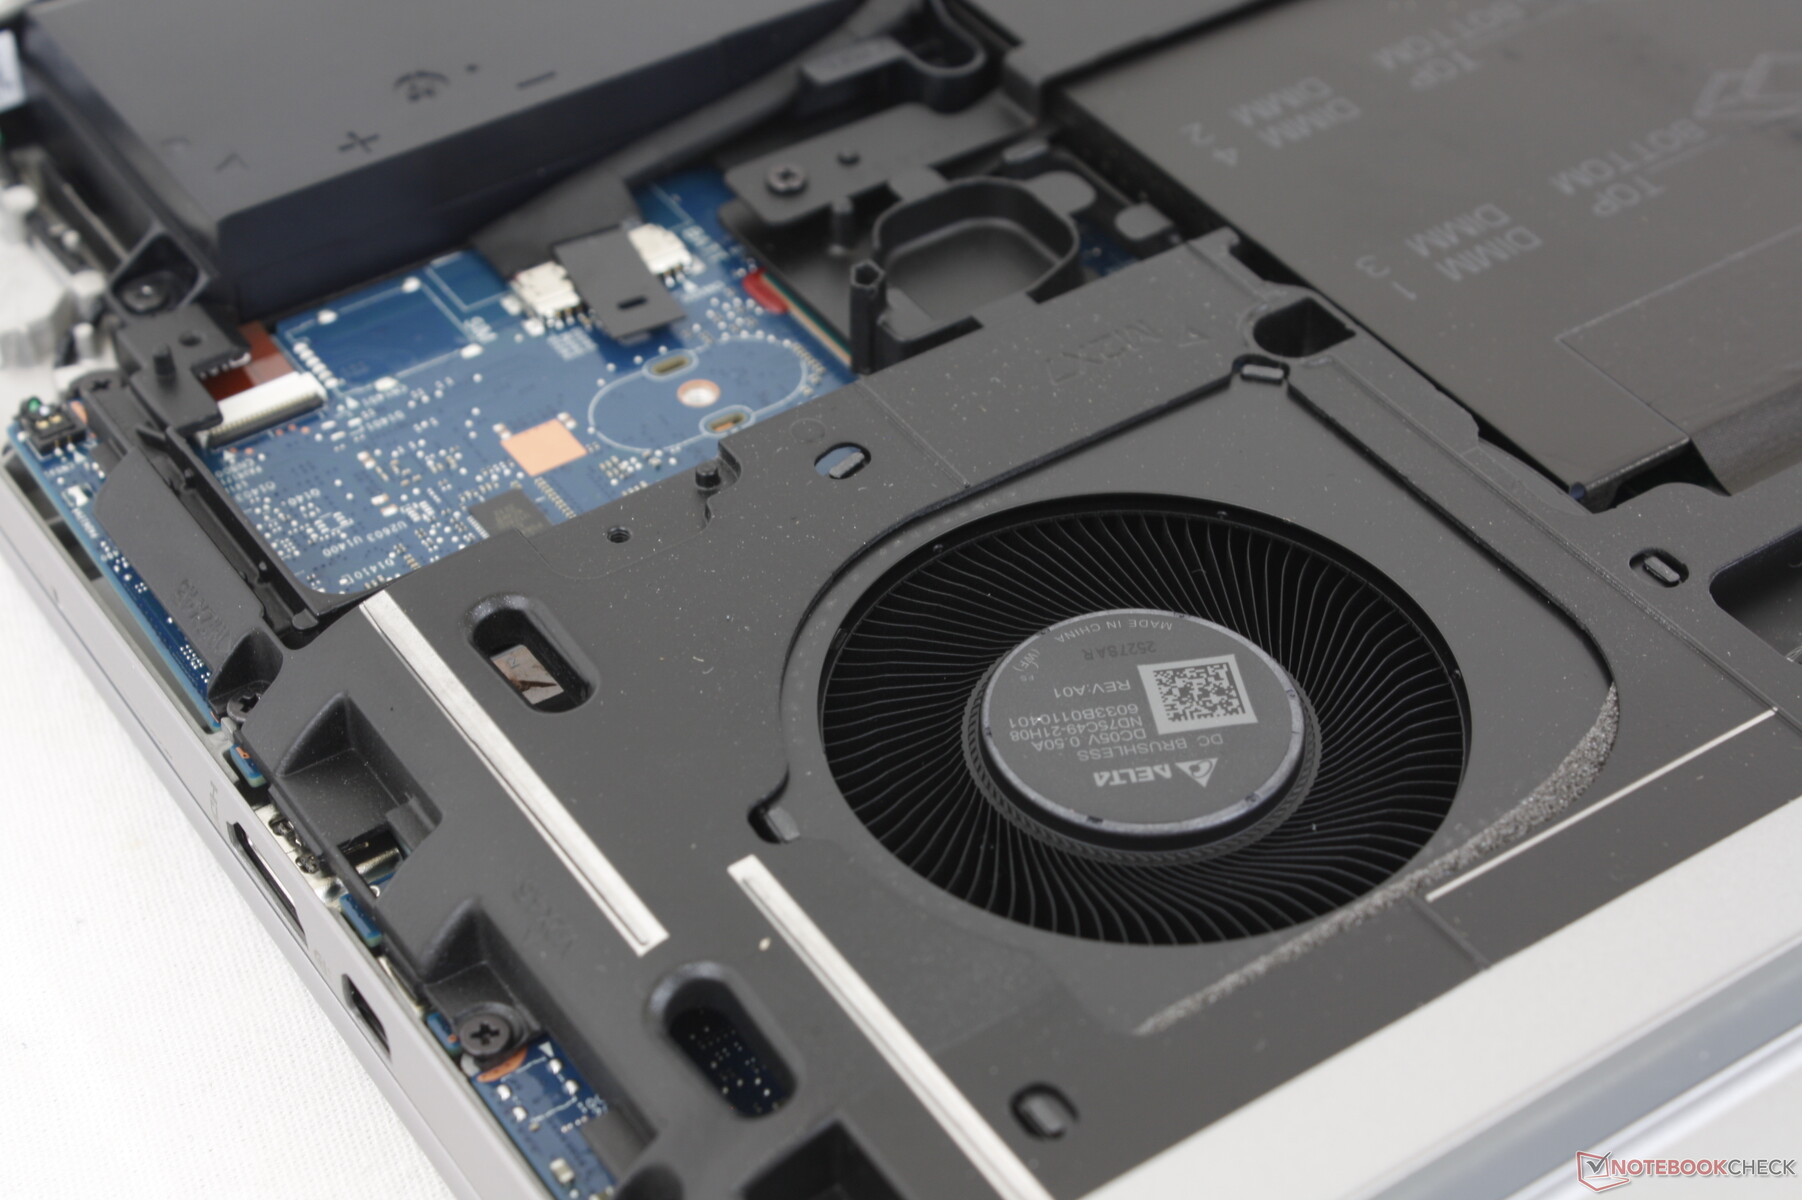
Het onderste paneel is "gereedschapsloos" in die zin dat het er gemakkelijk af te schuiven is zonder gereedschap. Helaas is er nog steeds een schroevendraaier nodig omdat de opslagbays en SODIMM-sleuven worden beschermd door aluminium platen. Het model ondersteunt tot 4x M.2 2280 SSD's en 4x DDR5 RAM modules, wat meer is dan wat de Precision 7670 en ThinkPad P16 kunnen bieden.
Accessoires en garantie
Er zitten geen extra's in de verpakking behalve de gebruikelijke AC-adapter en papierwerk. Een beperkte garantie van drie jaar is standaard bij aankoop in de VS.
Invoerapparaten - Ruim en comfortabel
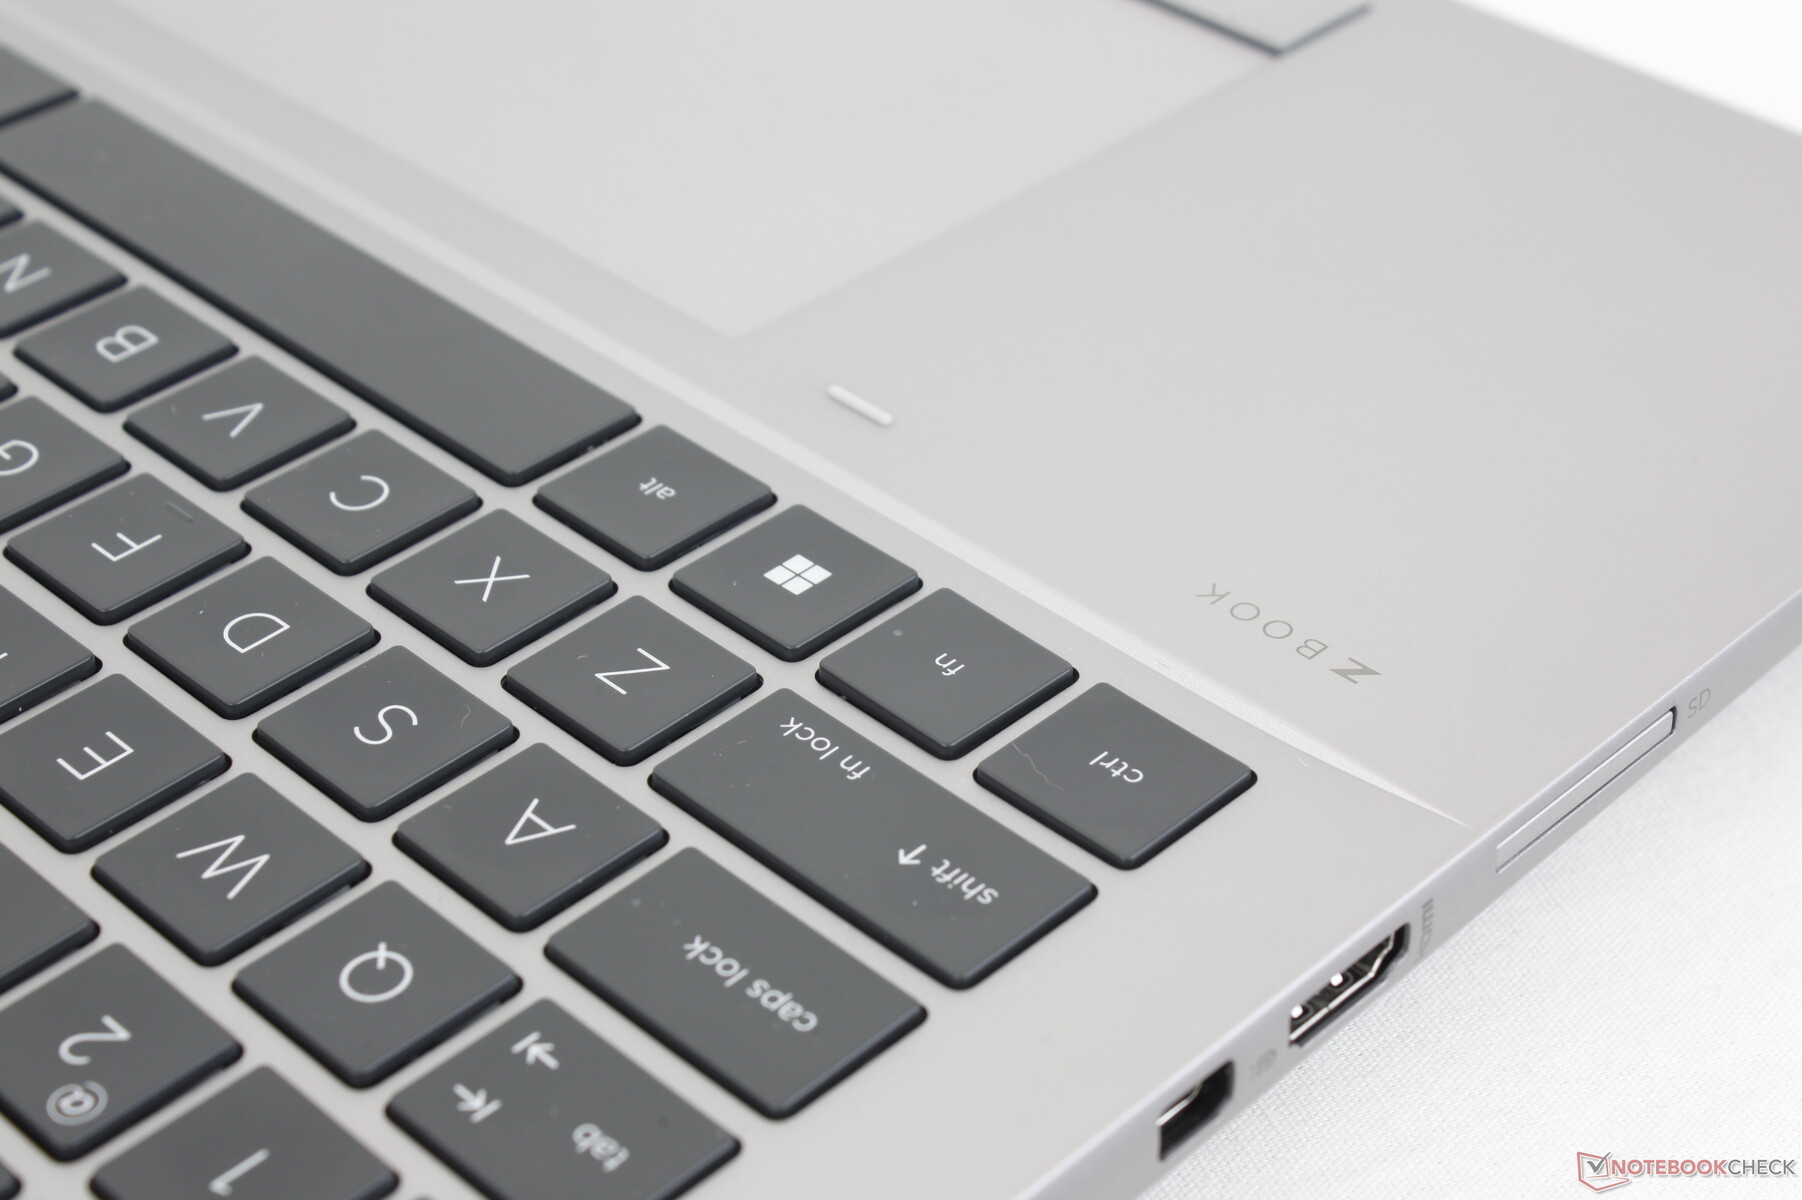
Toetsenbord
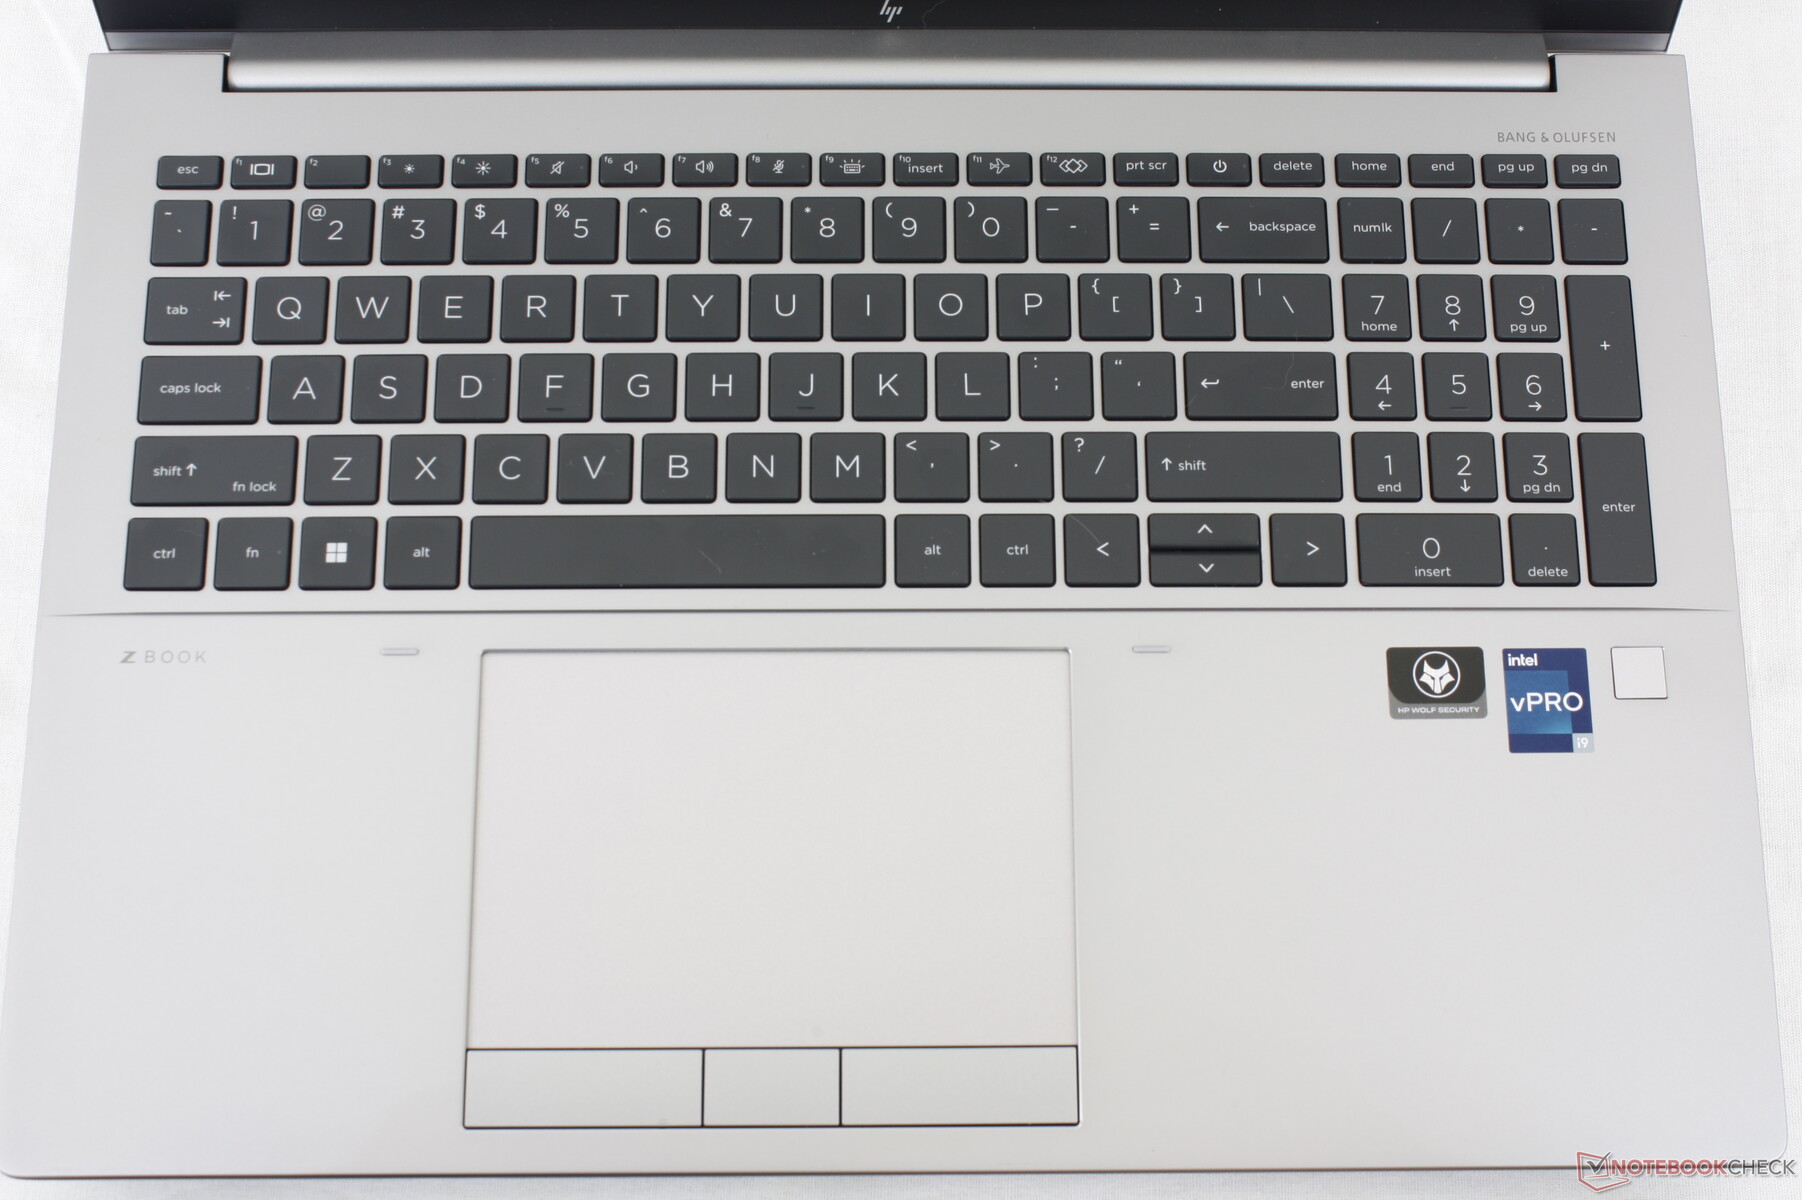
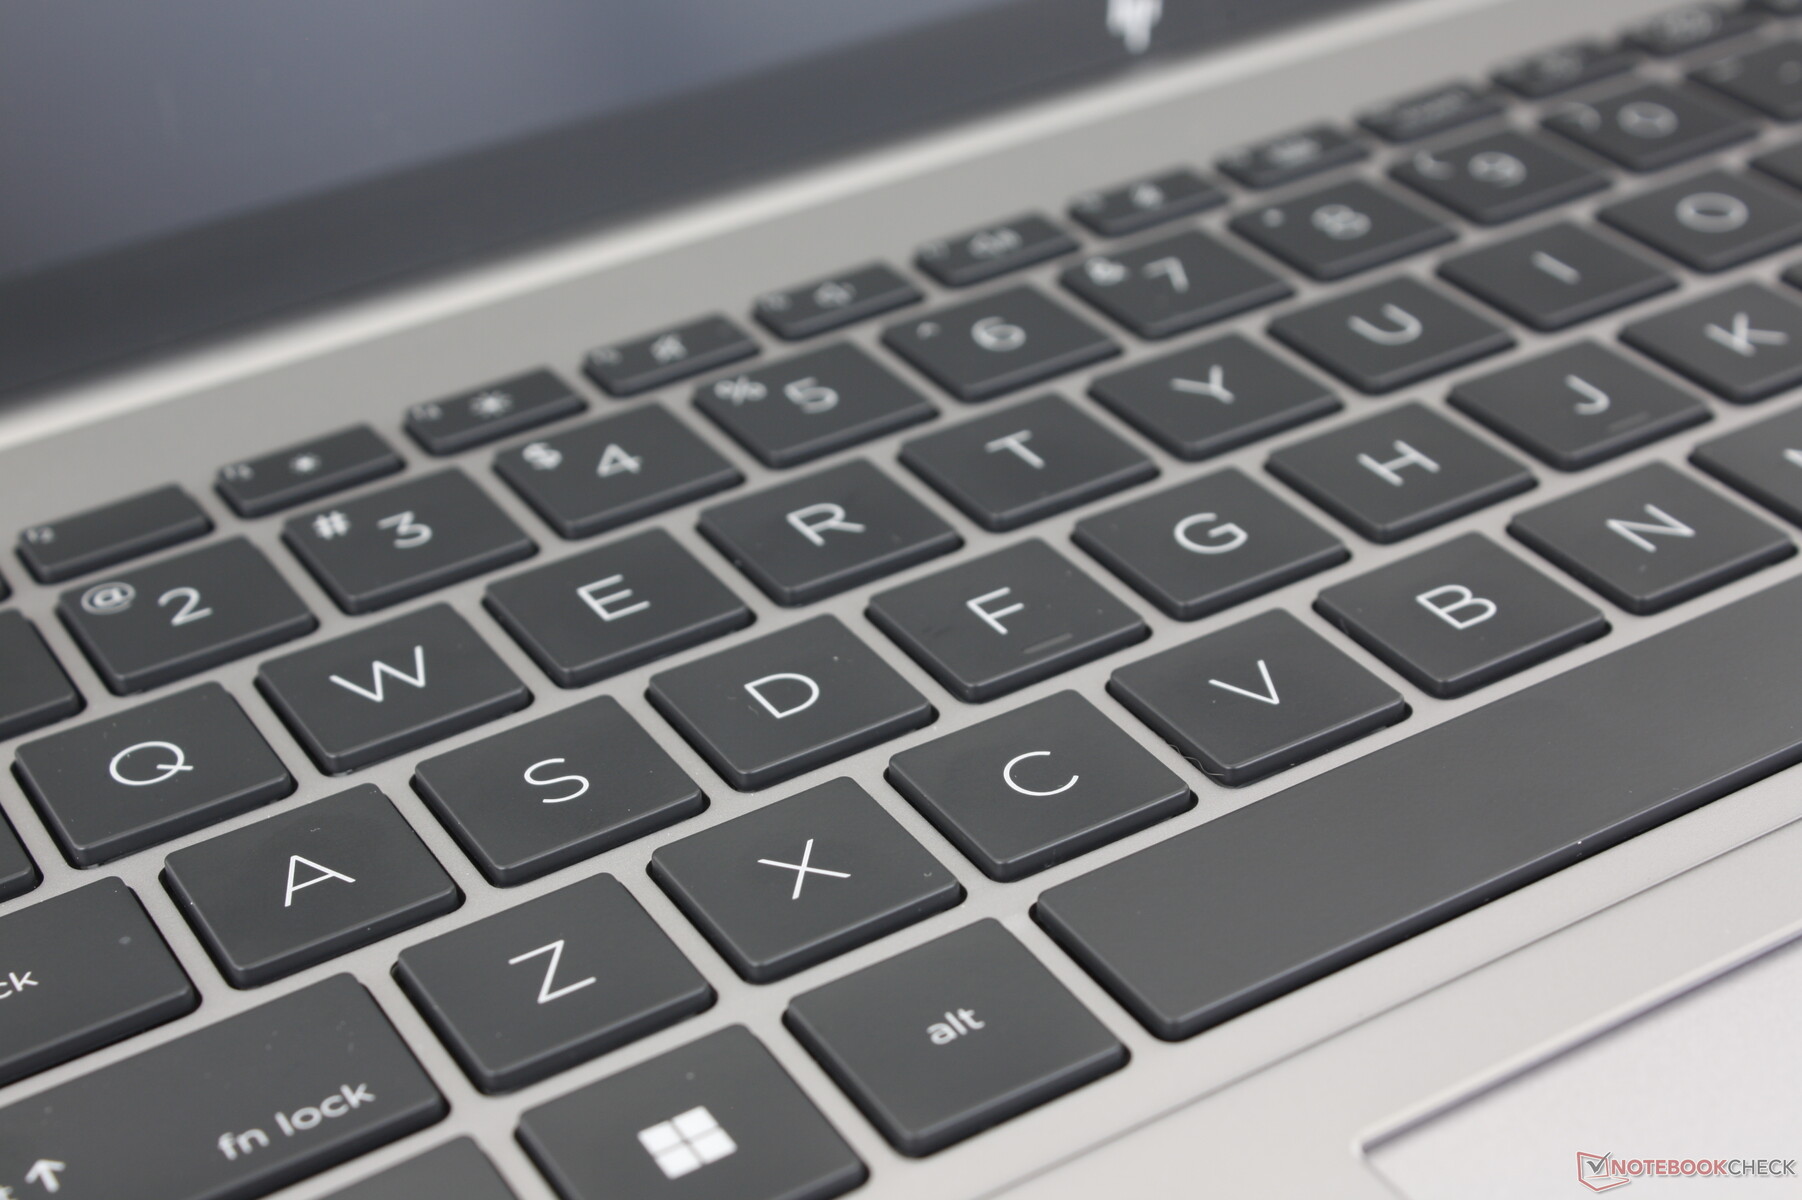
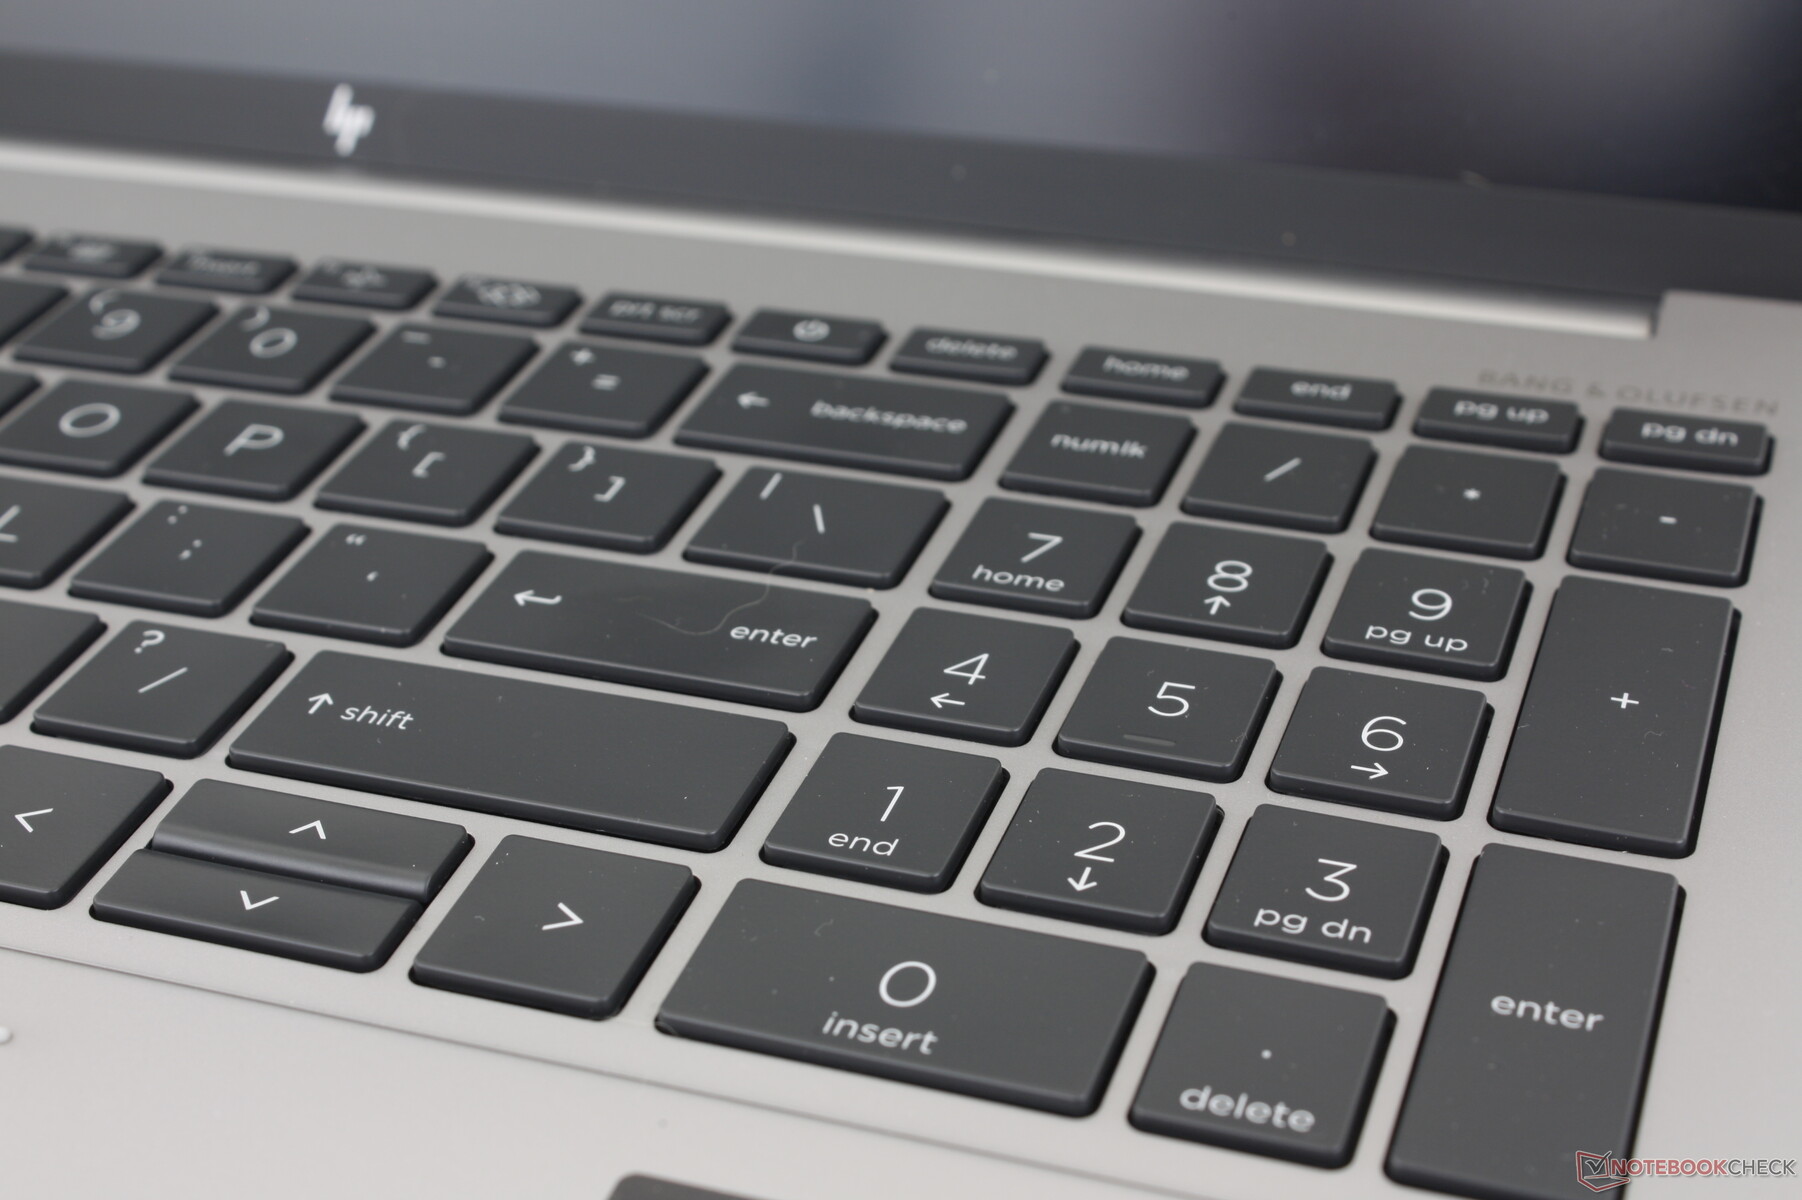
De HP Spectre, EliteBook en ZBook families hebben allemaal een aantal van de beste toetsenborden in hun respectievelijke categorieën als het gaat om feedback en aanslag. De toetsen op de Fury 16 G9 zijn stevig voor een bevredigende type-ervaring. Het geluid is echter luider dan op de ThinkPad P16 G1 of Precision 7670, vooral wanneer je op de spatiebalk of Enter toets drukt. Typisten die de voorkeur geven aan stillere toetsen kunnen het ZBook-toetsenbord eerst uitproberen voordat ze zich vastleggen.
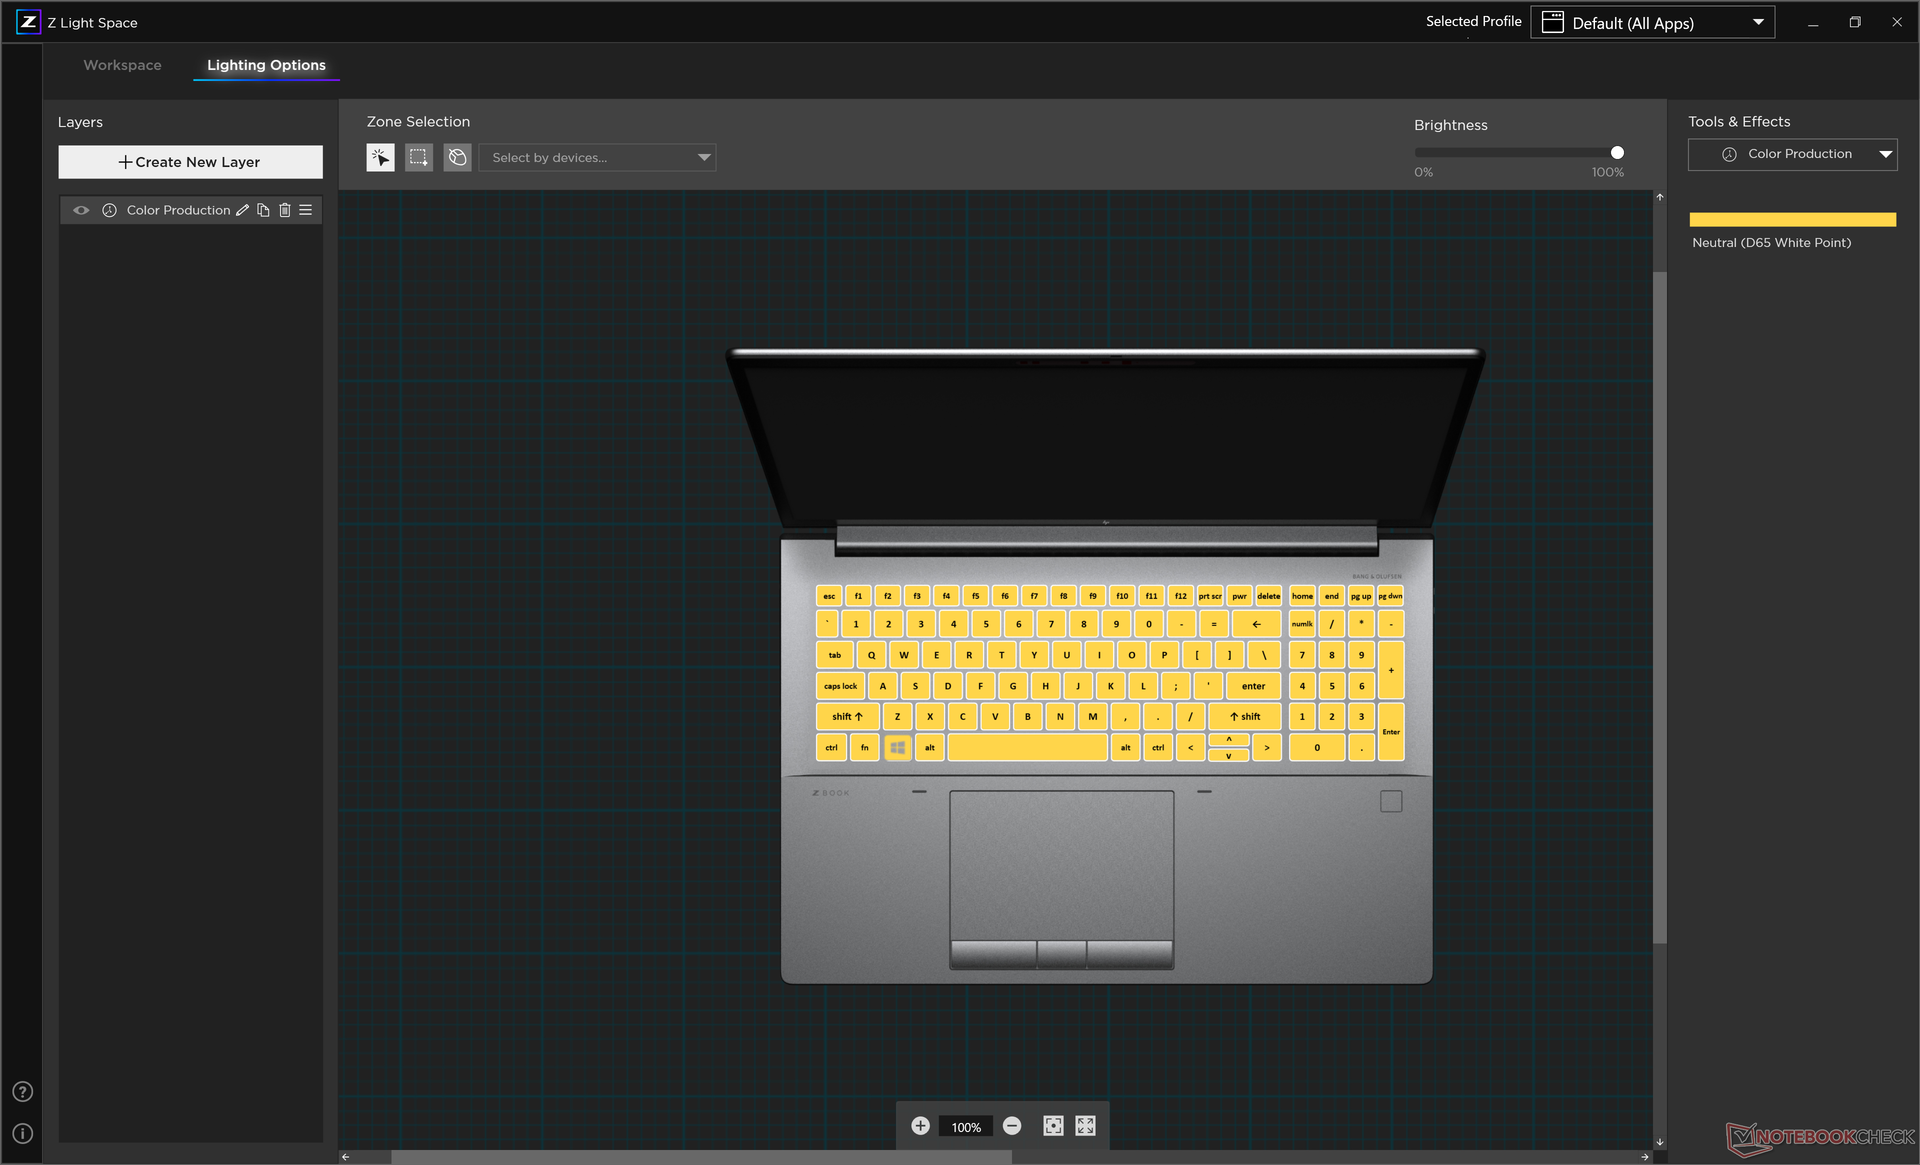
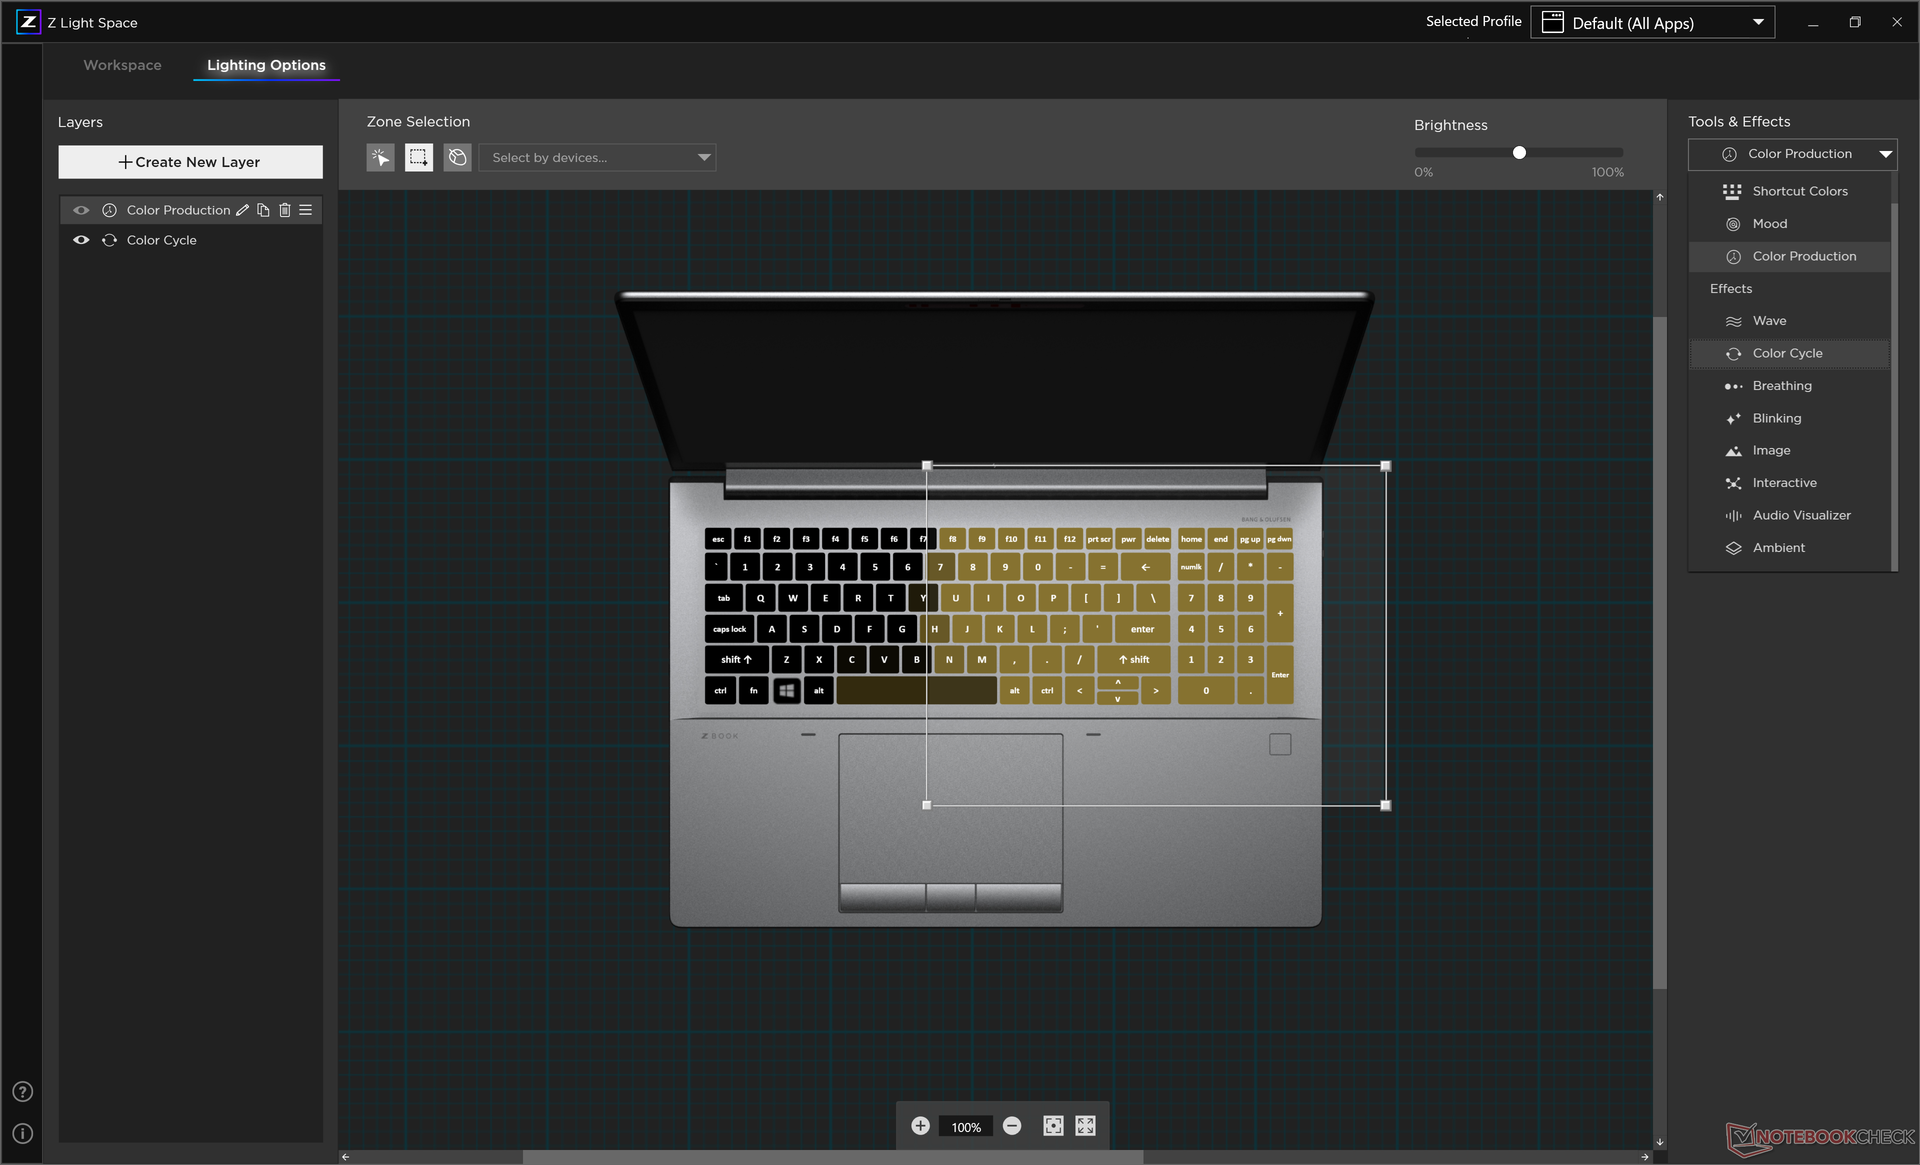
Opvallende kenmerken van het ZBook-toetsenbord zijn de RGB-achtergrondverlichting per toets en de enkele programmeerbare/aanpasbare toets. De meeste andere werkstations hebben nog geen vergelijkbare extra functies.
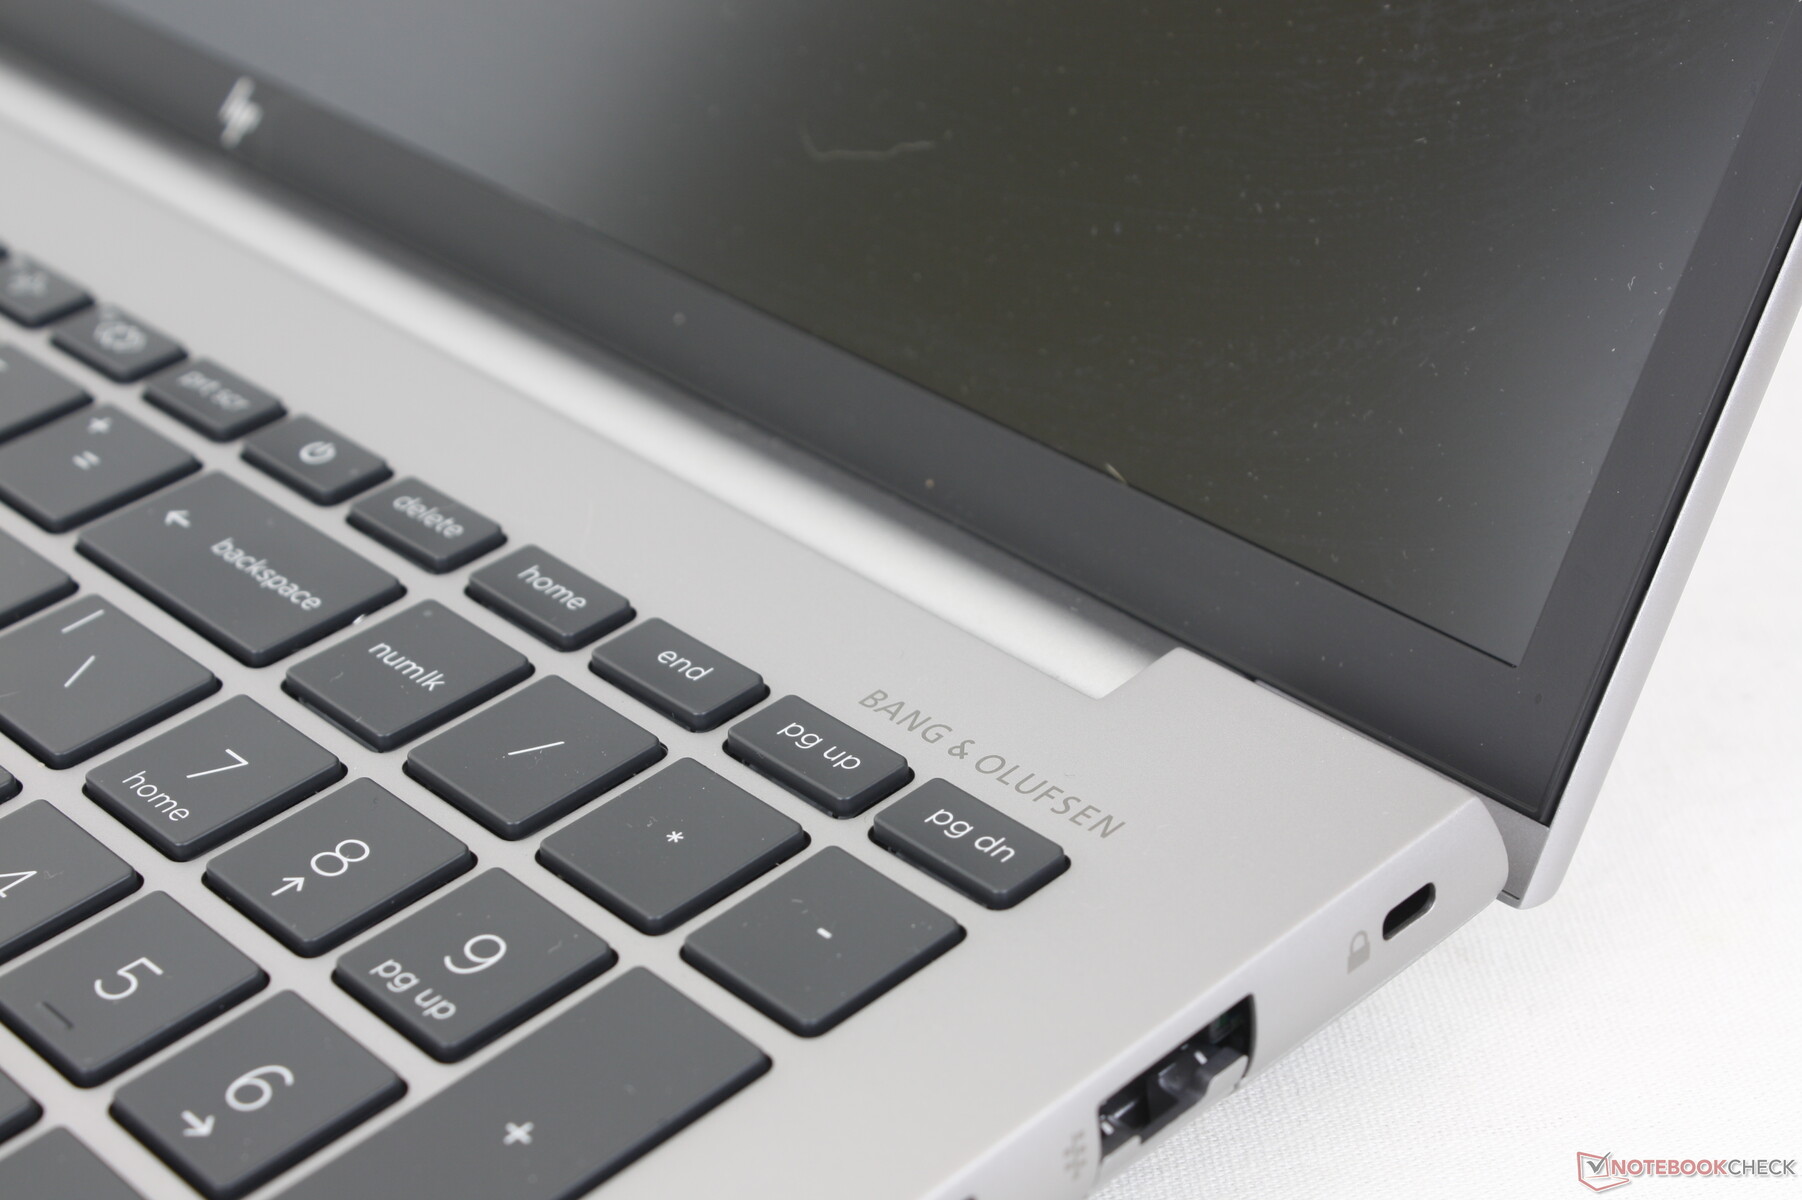
Touchpad
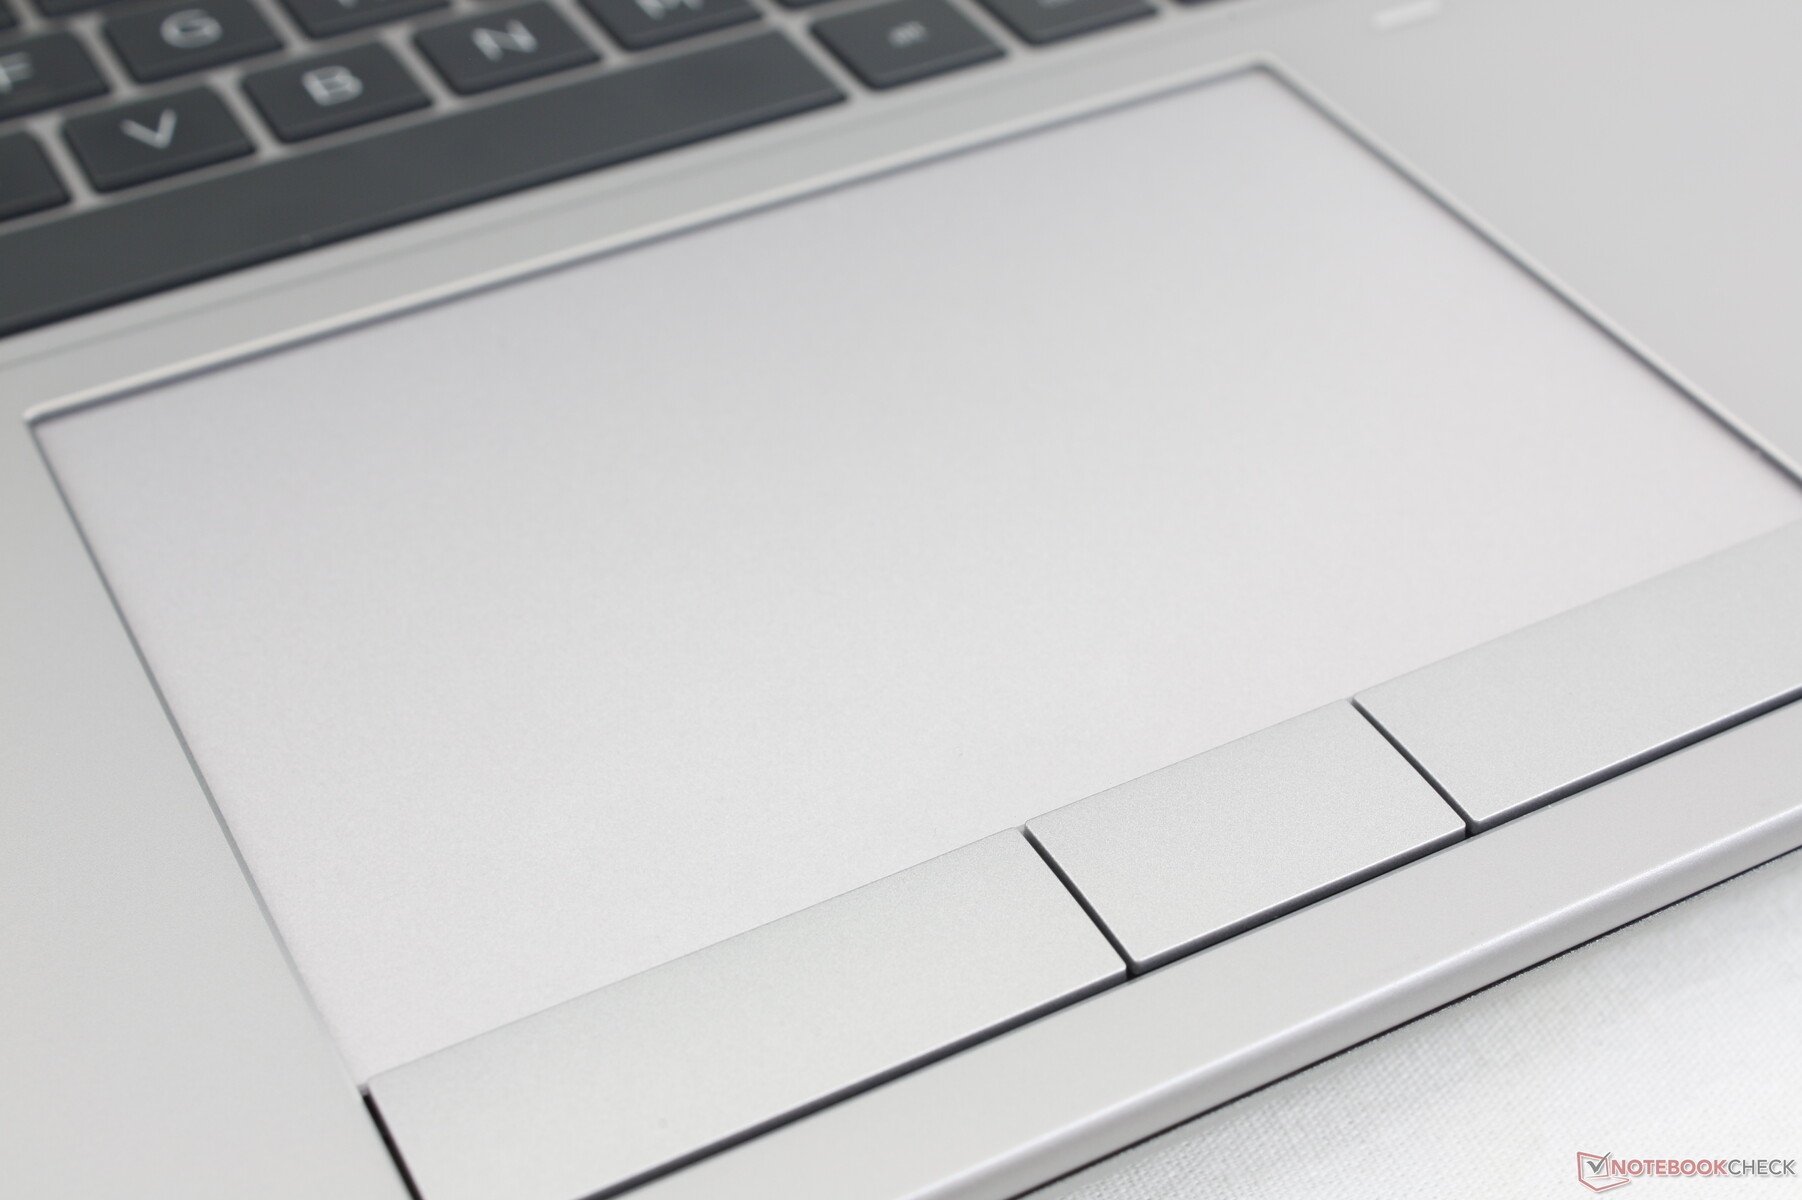
Het touchpad is een van de beste die we hebben gebruikt op een laptop, of het nu een werkstation is of niet. Niet alleen is het groter (12,4 x 8,3 cm) dan de touchpads op de ThinkPad P16 G1 (11,5 x 6,9 cm) of Precision 7670 (11,5 x 8 cm), maar de glijeigenschappen zijn soepel voor betrouwbare cursorbesturing bij elke snelheid. Ondertussen hebben de speciale muisknoppen een grotere bewegingsvrijheid dan op de meeste andere laptops, terwijl ze een bevredigende klik behouden wanneer ze worden ingedrukt. Ter vergelijking, op de Precision 7670 ontbreken speciale muisknoppen ten gunste van een clickpad-oplossing.
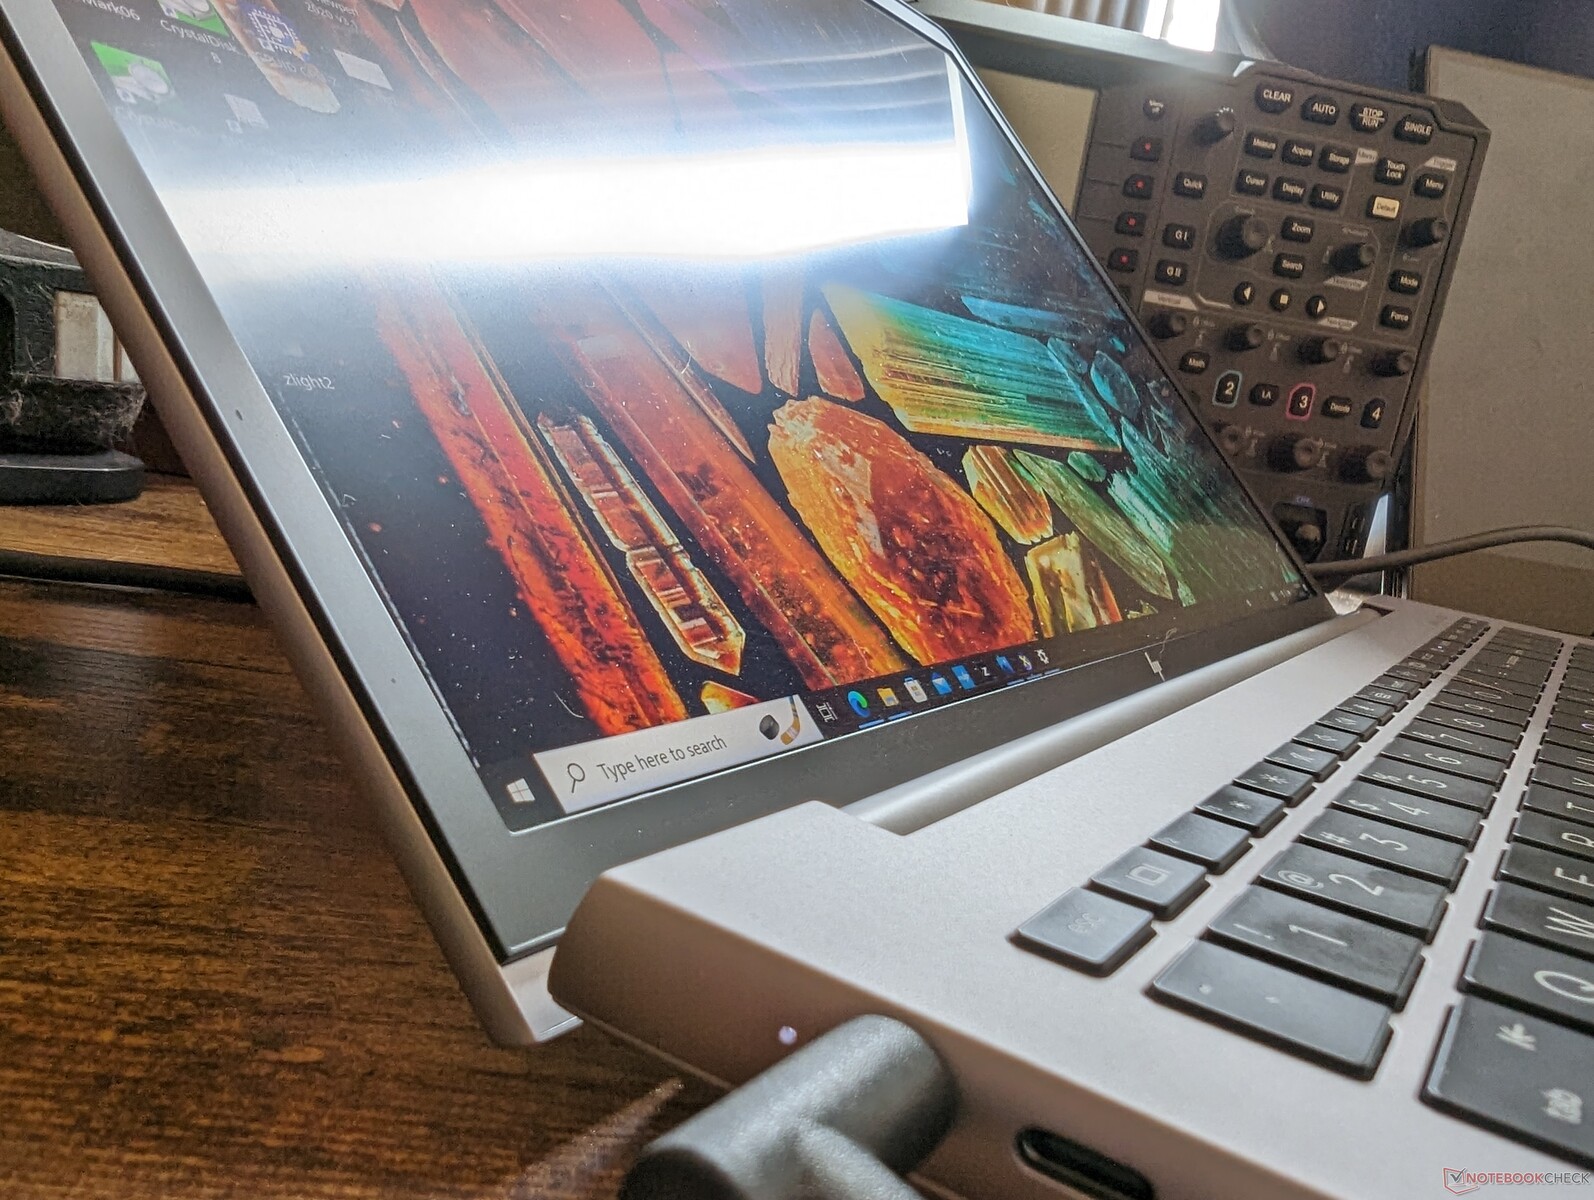
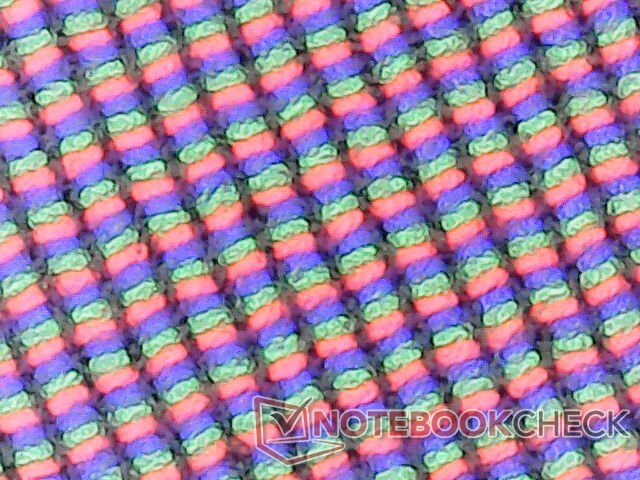
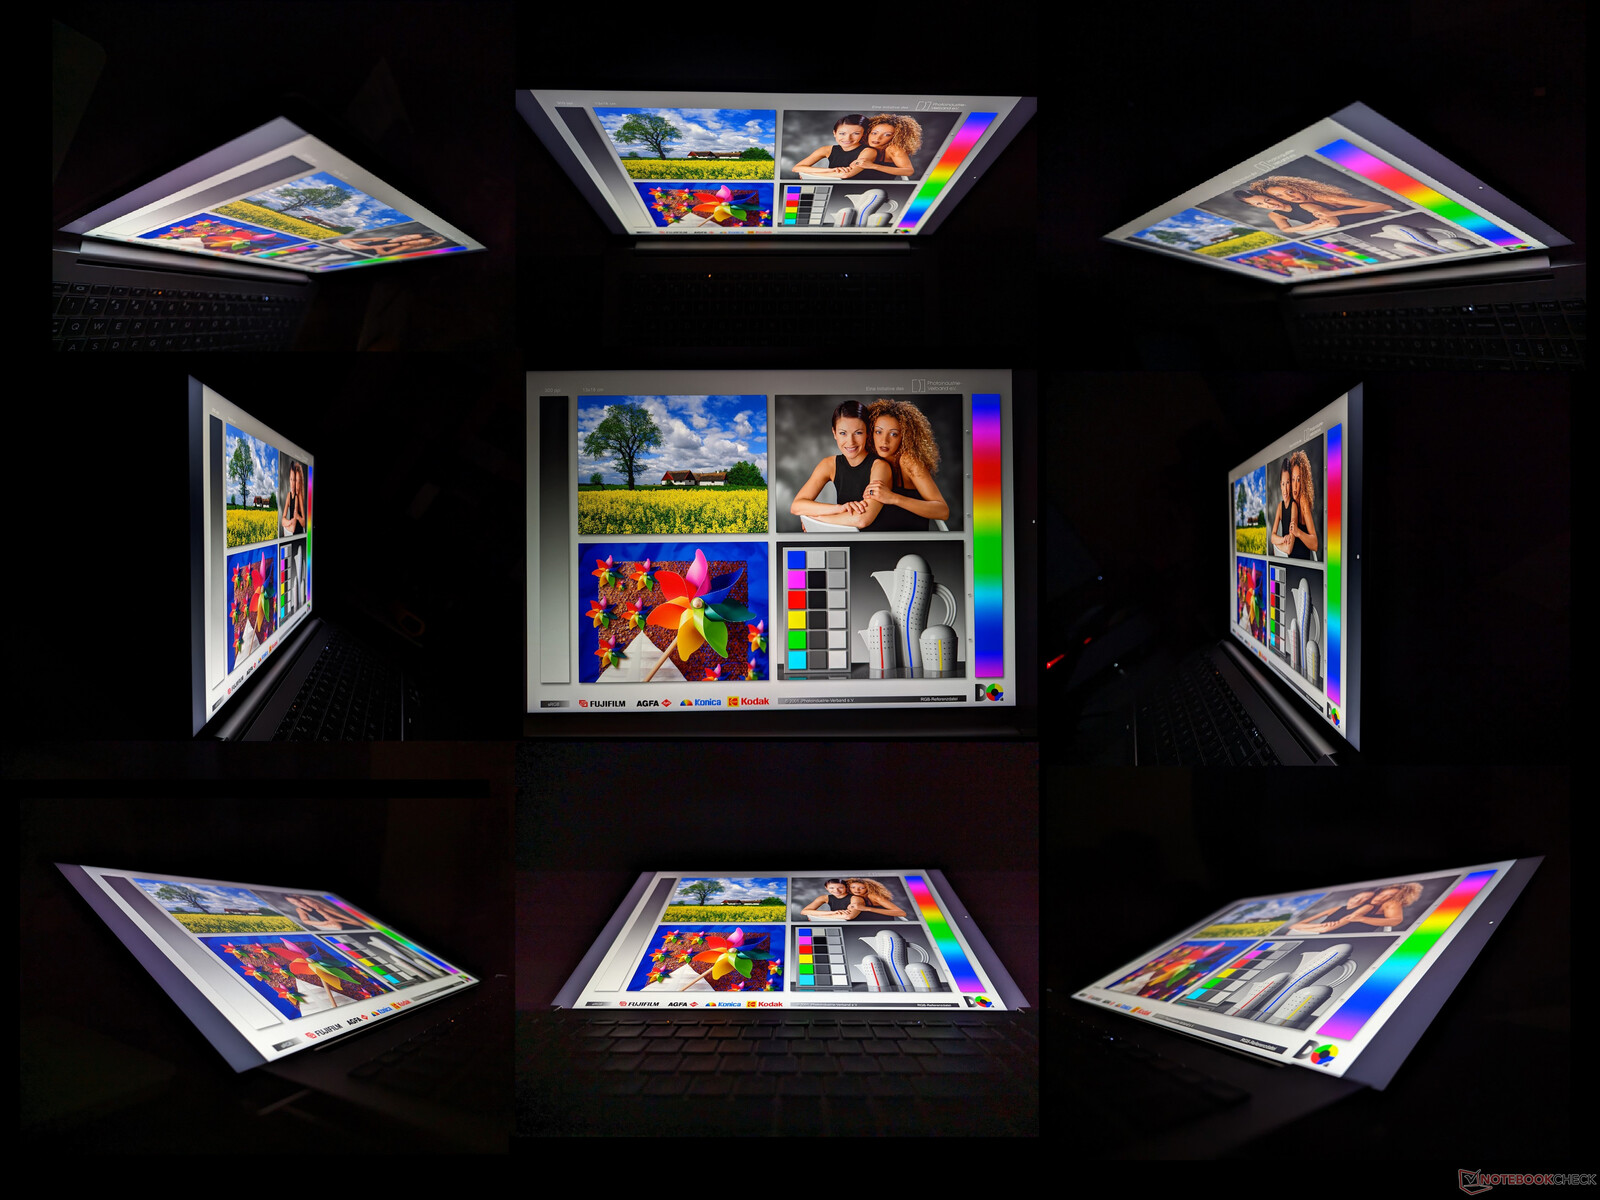
Beeldscherm - Uitstekende kleuren met goede responstijden
HP gebruikt dezelfde BOE-paneelopties voor veel van zijn 16-inch laptops. De ZBook Studio 16 G9maakt bijvoorbeeld gebruik van hetzelfde 16:10 4K-paneel als onze ZBook Fury 16 G9, zoals blijkt uit de vergelijkbare kenmerken in de tabel hieronder.
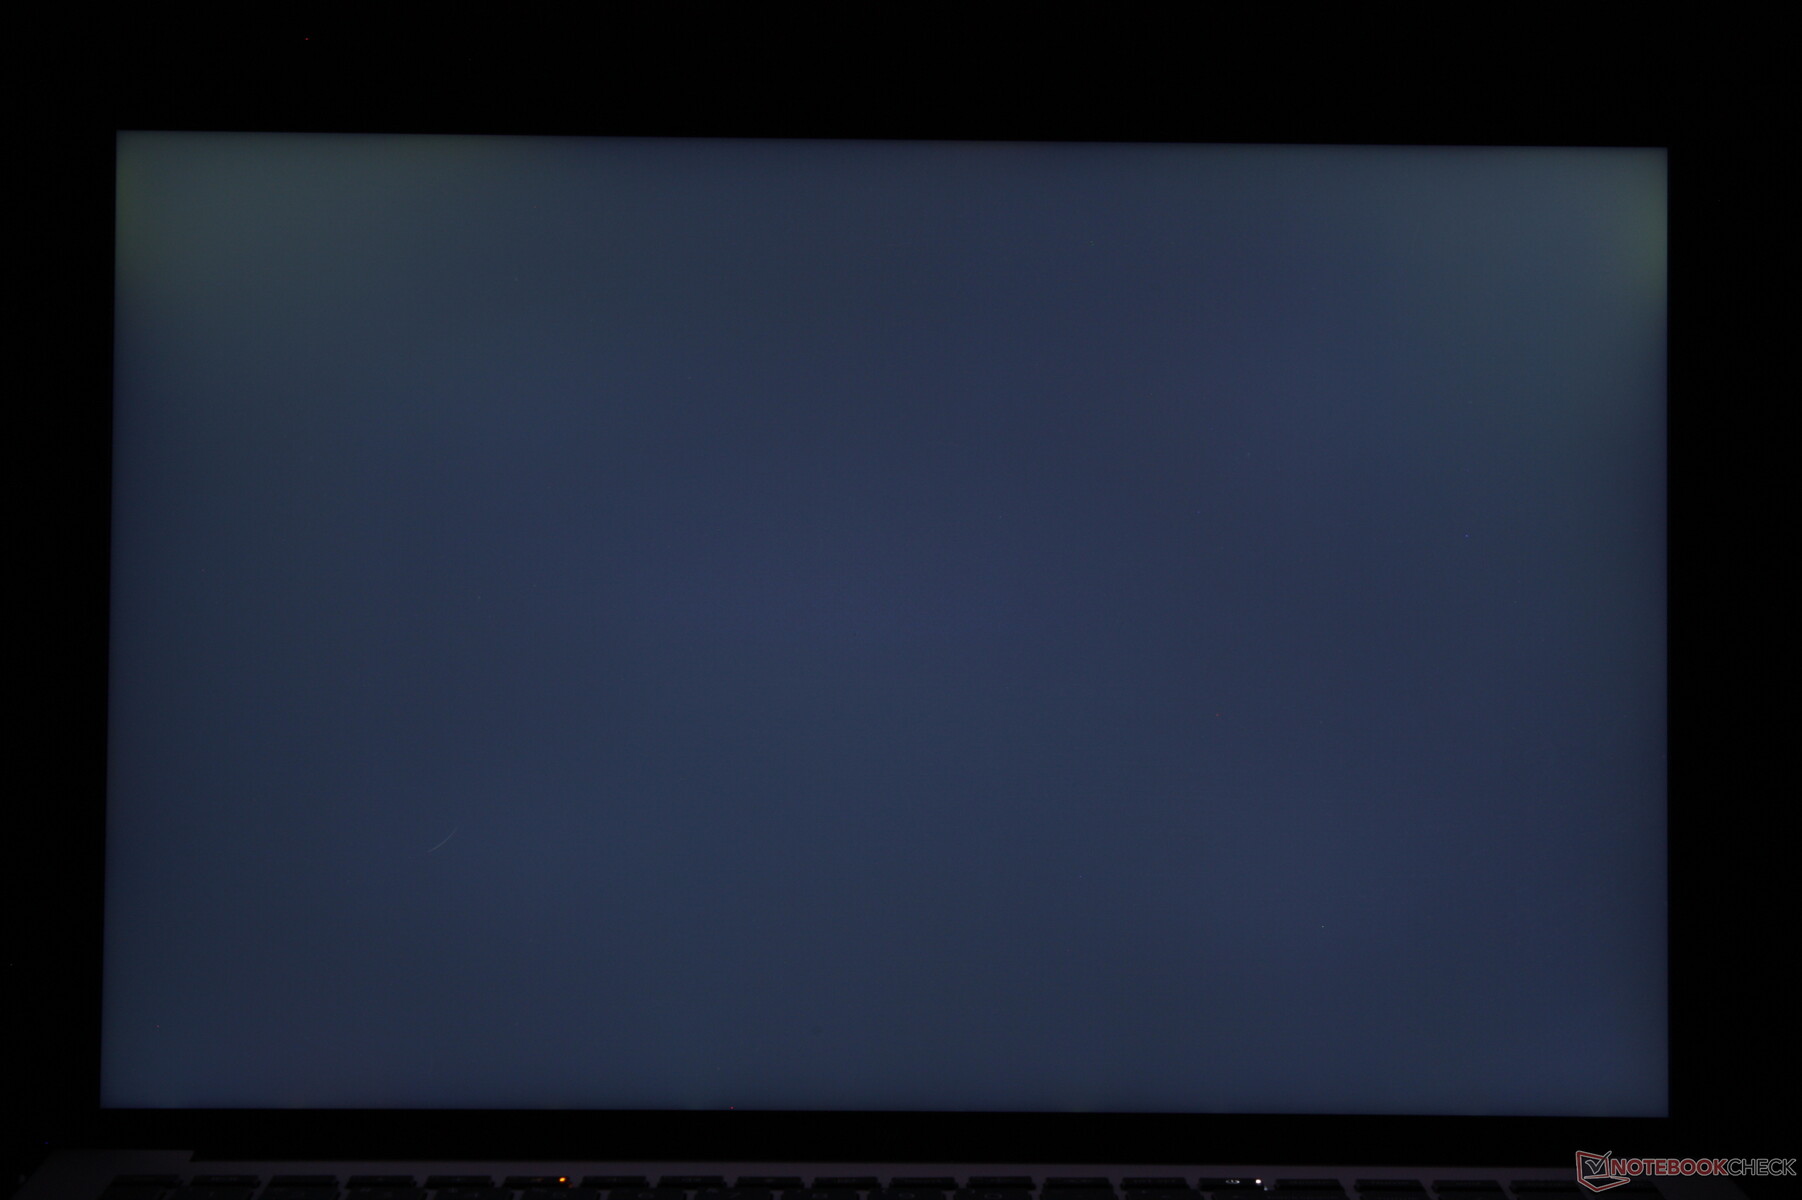
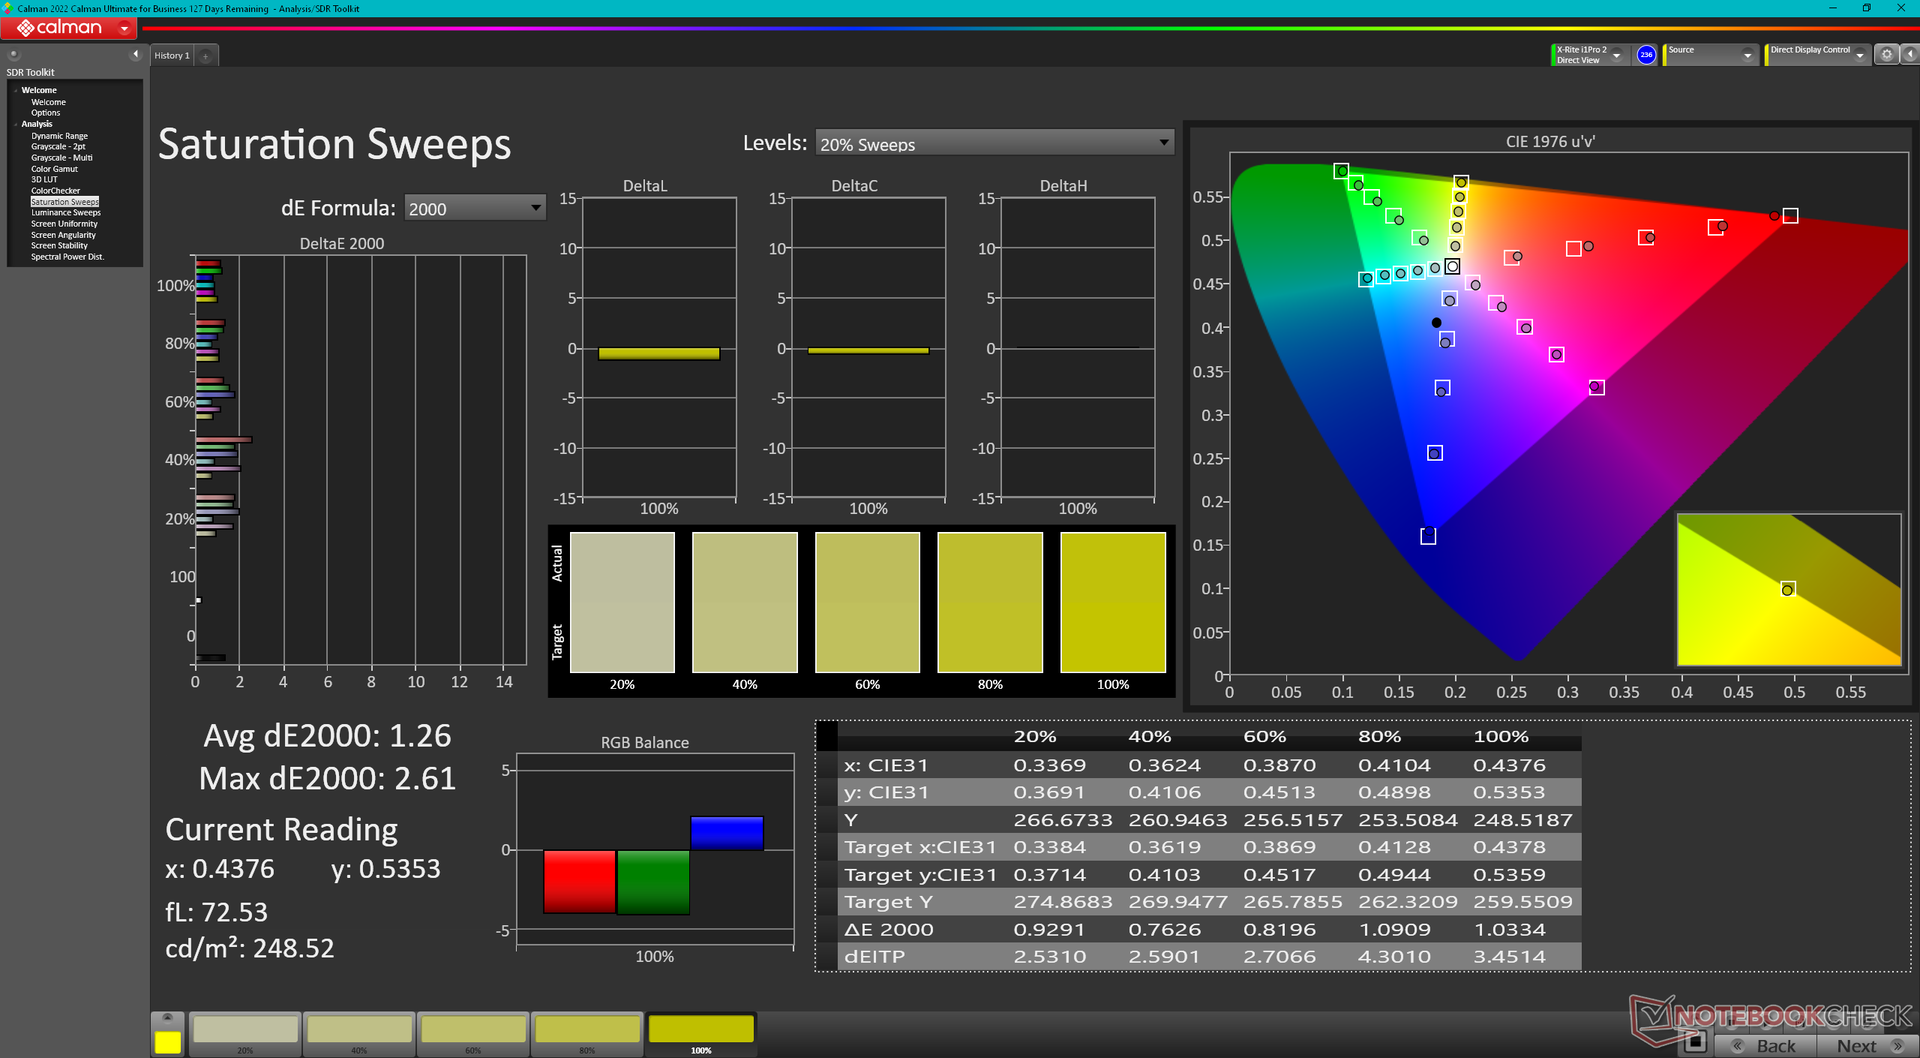
Ons specifieke 4K IPS-paneel is een high-end oplossing met brede P3-kleuren en goede zwart-wit en grijs-grijs responstijden die geschikt zijn voor zowel contentcreatie als gamingtoepassingen. De matte overlay is echter niet zo scherp als een glanzend alternatief en de contrastverhouding is beperkt tot slechts ~1000:1. Gelukkig biedt HP een OLED-optie. Gelukkig biedt HP een OLED optie om deze twee tekortkomingen direct aan te pakken.
| |||||||||||||||||||||||||
Helderheidsverdeling: 83 %
Helderheid in Batterij-modus: 451.7 cd/m²
Contrast: 931:1 (Zwart: 0.57 cd/m²)
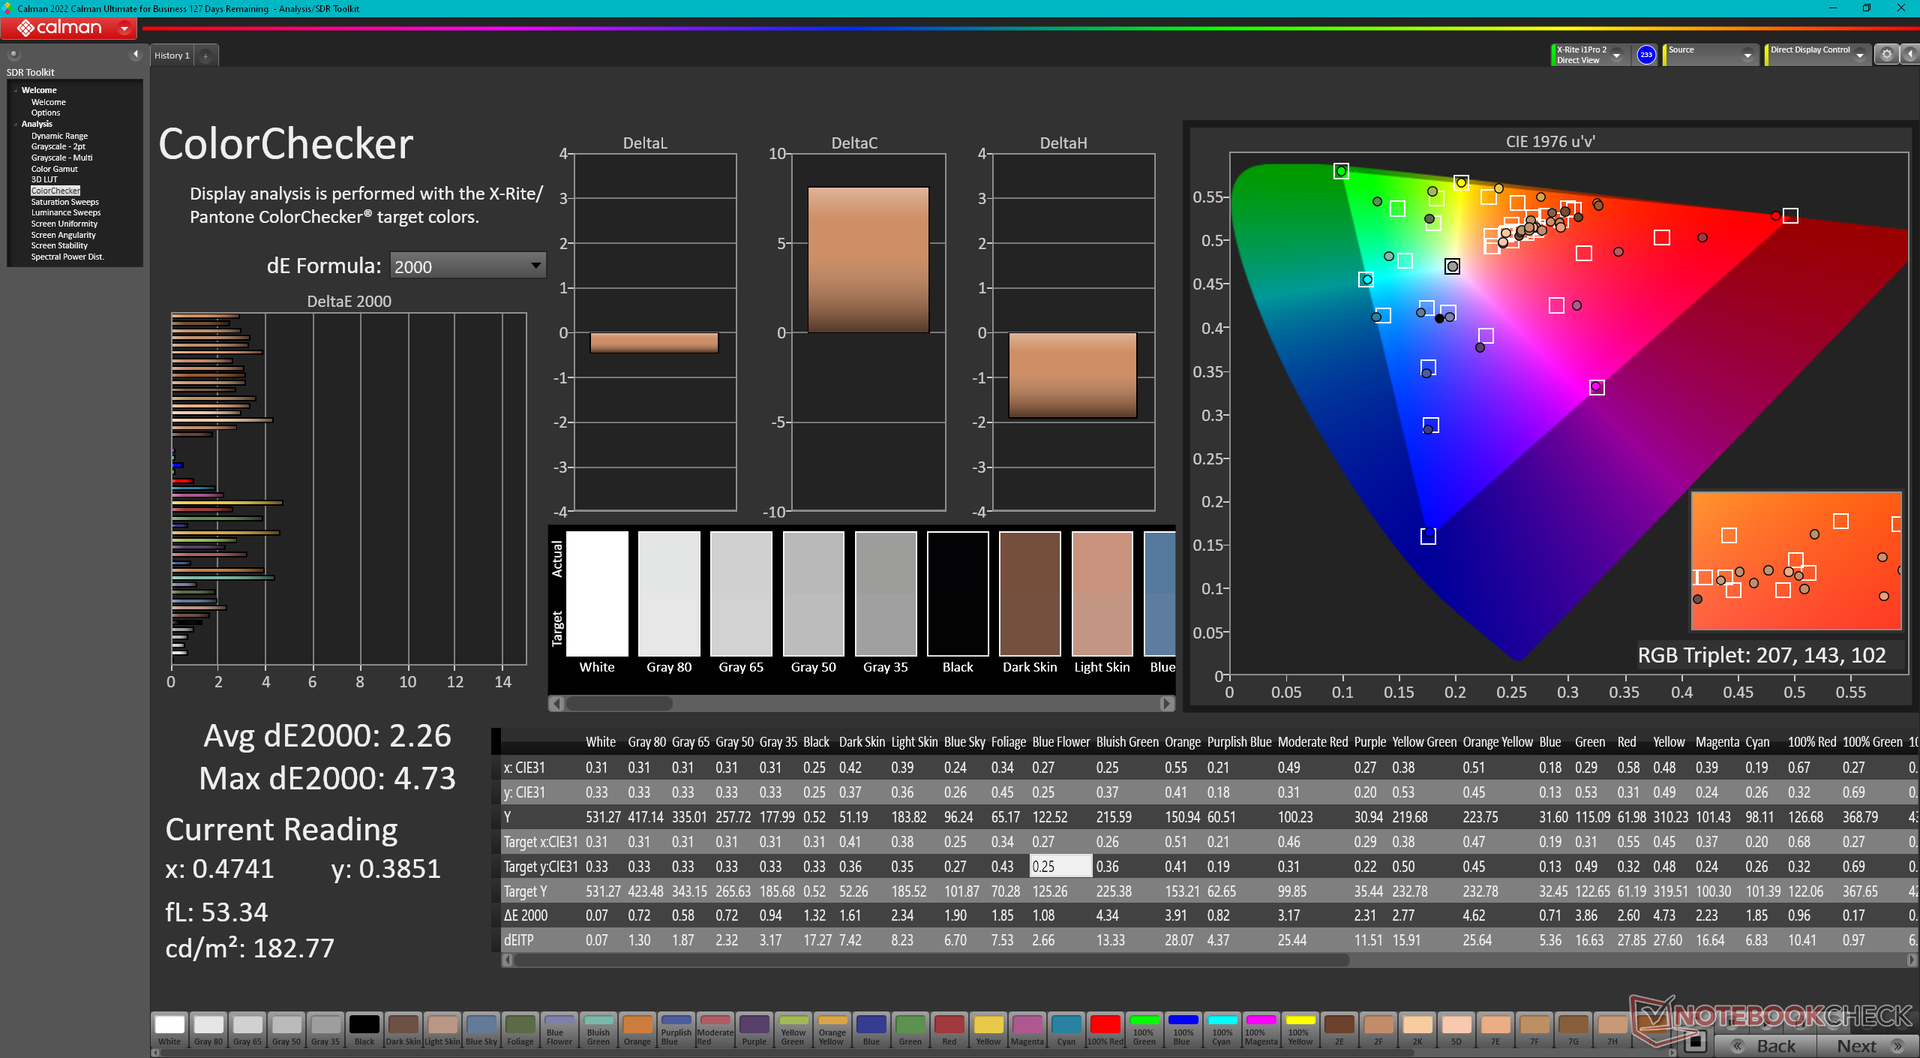
ΔE ColorChecker Calman: 2.26 | ∀{0.5-29.43 Ø4.71}
calibrated: 4.73
ΔE Greyscale Calman: 1 | ∀{0.09-98 Ø4.96}
86.3% AdobeRGB 1998 (Argyll 3D)
99.9% sRGB (Argyll 3D)
97.4% Display P3 (Argyll 3D)
Gamma: 2.28
CCT: 6543 K
| HP ZBook Fury 16 G9 BOE0A52, IPS, 3840x2400, 16" | HP ZBook Studio 16 G9 62U04EA BOE0A52, IPS, 3840x2400, 16" | HP ZBook Firefly 16 G9-6B897EA BOE0A02, IPS, 1920x1200, 16" | Lenovo ThinkPad P16 G1 RTX A5500 LP160UQ1-SPB1, IPS, 3840x2400, 16" | Dell Precision 7000 7670 Performance Samsung 160YV03, OLED, 3840x2400, 16" | MSI CreatorPro Z16P B12UKST B160QAN02.N, IPS, 2560x1600, 16" | |
|---|---|---|---|---|---|---|
| Display | 0% | -18% | -2% | 6% | 0% | |
| Display P3 Coverage (%) | 97.4 | 97.5 0% | 68.1 -30% | 82.9 -15% | 99.9 3% | 97.6 0% |
| sRGB Coverage (%) | 99.9 | 99.9 0% | 96.1 -4% | 98.9 -1% | 100 0% | 99.9 0% |
| AdobeRGB 1998 Coverage (%) | 86.3 | 86.3 0% | 70 -19% | 95.9 11% | 98.1 14% | 87.4 1% |
| Response Times | 9% | -206% | -281% | 83% | 11% | |
| Response Time Grey 50% / Grey 80% * (ms) | 13.7 ? | 15.3 ? -12% | 52.8 ? -285% | 45.6 ? -233% | 1.84 ? 87% | 12.8 ? 7% |
| Response Time Black / White * (ms) | 8.6 ? | 6.1 ? 29% | 19.5 ? -127% | 36.8 ? -328% | 1.92 ? 78% | 7.4 ? 14% |
| PWM Frequency (Hz) | 59.52 ? | |||||
| Screen | 18% | -40% | -12% | -61% | 5% | |
| Brightness middle (cd/m²) | 530.5 | 554 4% | 526 -1% | 601.9 13% | 325.2 -39% | 407 -23% |
| Brightness (cd/m²) | 476 | 516 8% | 499 5% | 569 20% | 328 -31% | 388 -18% |
| Brightness Distribution (%) | 83 | 84 1% | 93 12% | 77 -7% | 97 17% | 88 6% |
| Black Level * (cd/m²) | 0.57 | 0.47 18% | 0.31 46% | 0.47 18% | 0.36 37% | |
| Contrast (:1) | 931 | 1179 27% | 1697 82% | 1281 38% | 1131 21% | |
| Colorchecker dE 2000 * | 2.26 | 1 56% | 3.6 -59% | 2.45 -8% | 4.59 -103% | 1.3 42% |
| Colorchecker dE 2000 calibrated * | 4.73 | 0.6 87% | 2.6 45% | 0.7 85% | ||
| Greyscale dE 2000 * | 1 | 1.6 -60% | 5.5 -450% | 2.6 -160% | 2.5 -150% | 2.1 -110% |
| Gamma | 2.28 96% | 2.29 96% | 2.02 109% | 2.3 96% | 2.1 105% | 2.26 97% |
| CCT | 6543 99% | 6458 101% | 6527 100% | 6805 96% | 6541 99% | 6437 101% |
| Colorchecker dE 2000 max. * | 2.4 | 6.6 | 4.46 | 7.65 | 2.5 | |
| Totaal Gemiddelde (Programma / Instellingen) | 9% /
12% | -88% /
-60% | -98% /
-54% | 9% /
-12% | 5% /
5% |
* ... kleiner is beter
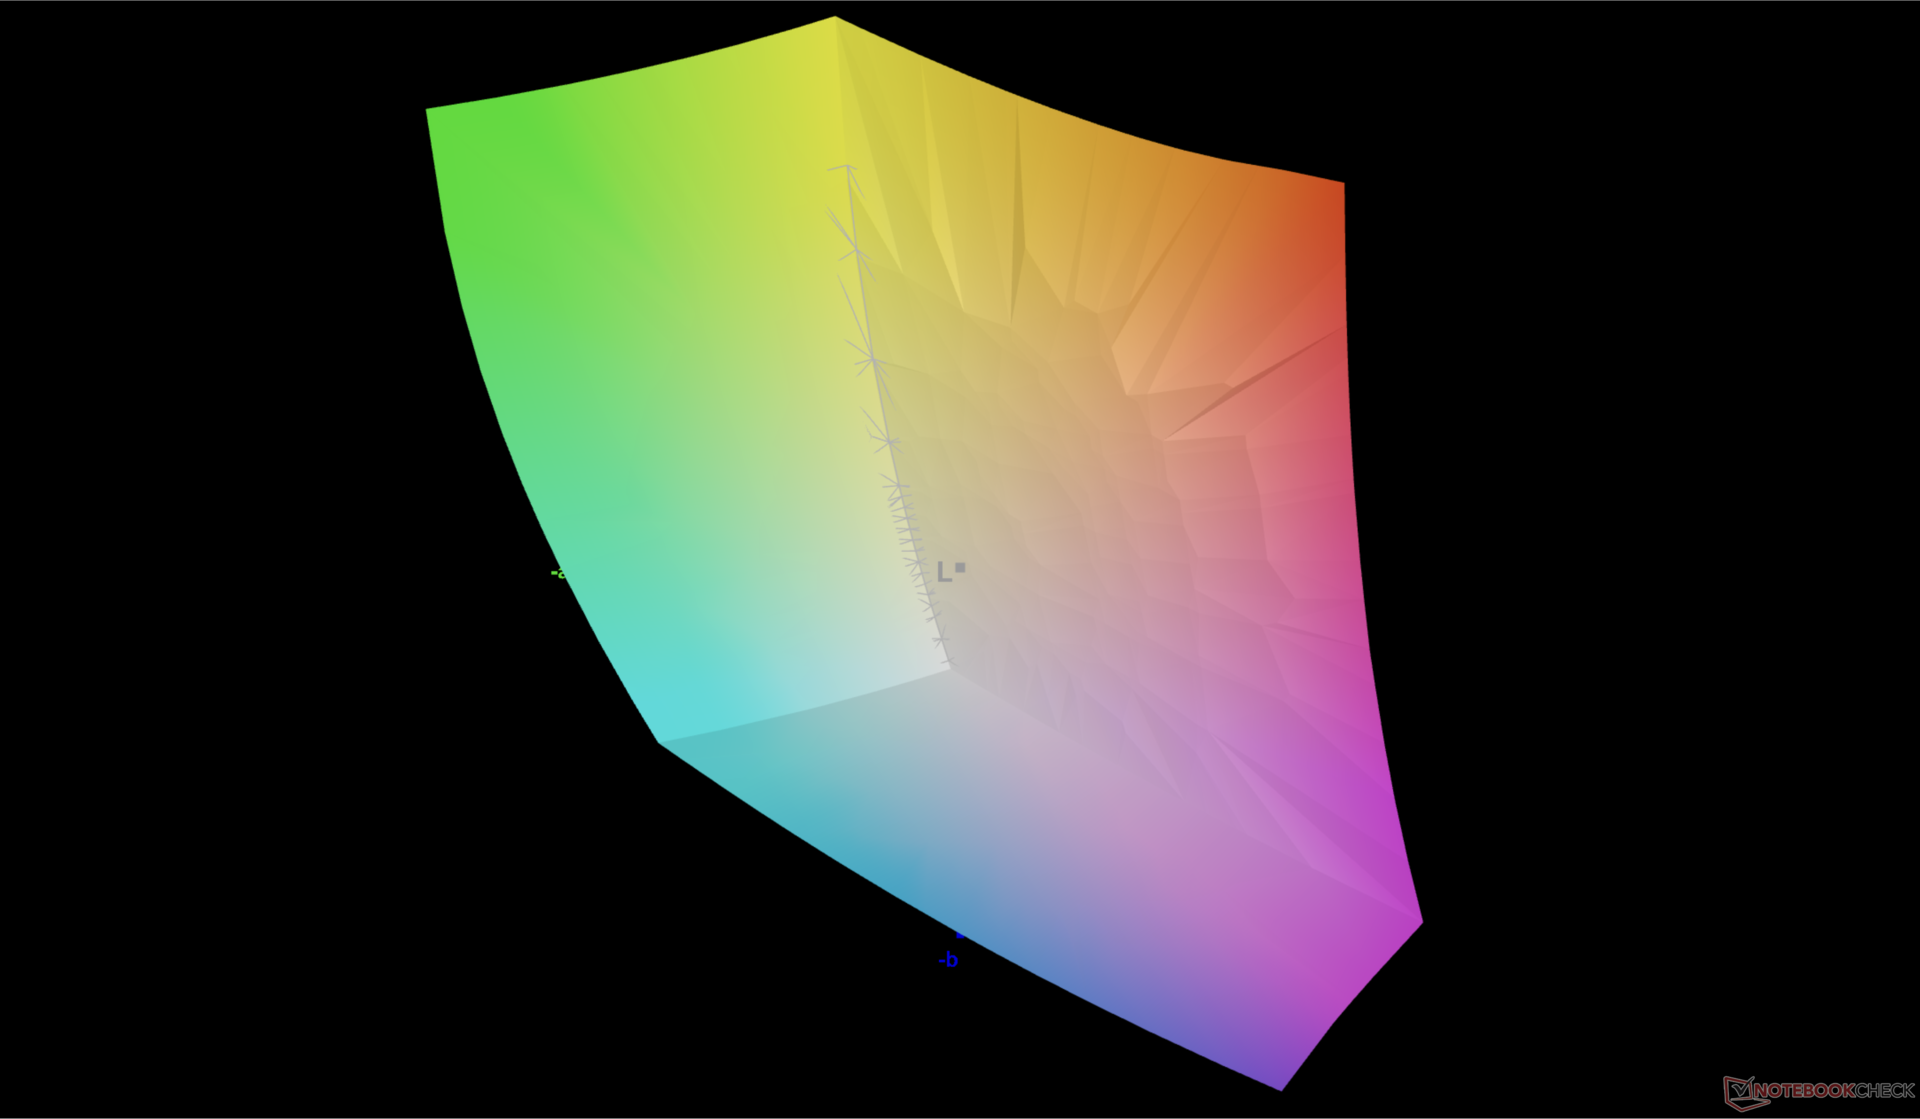
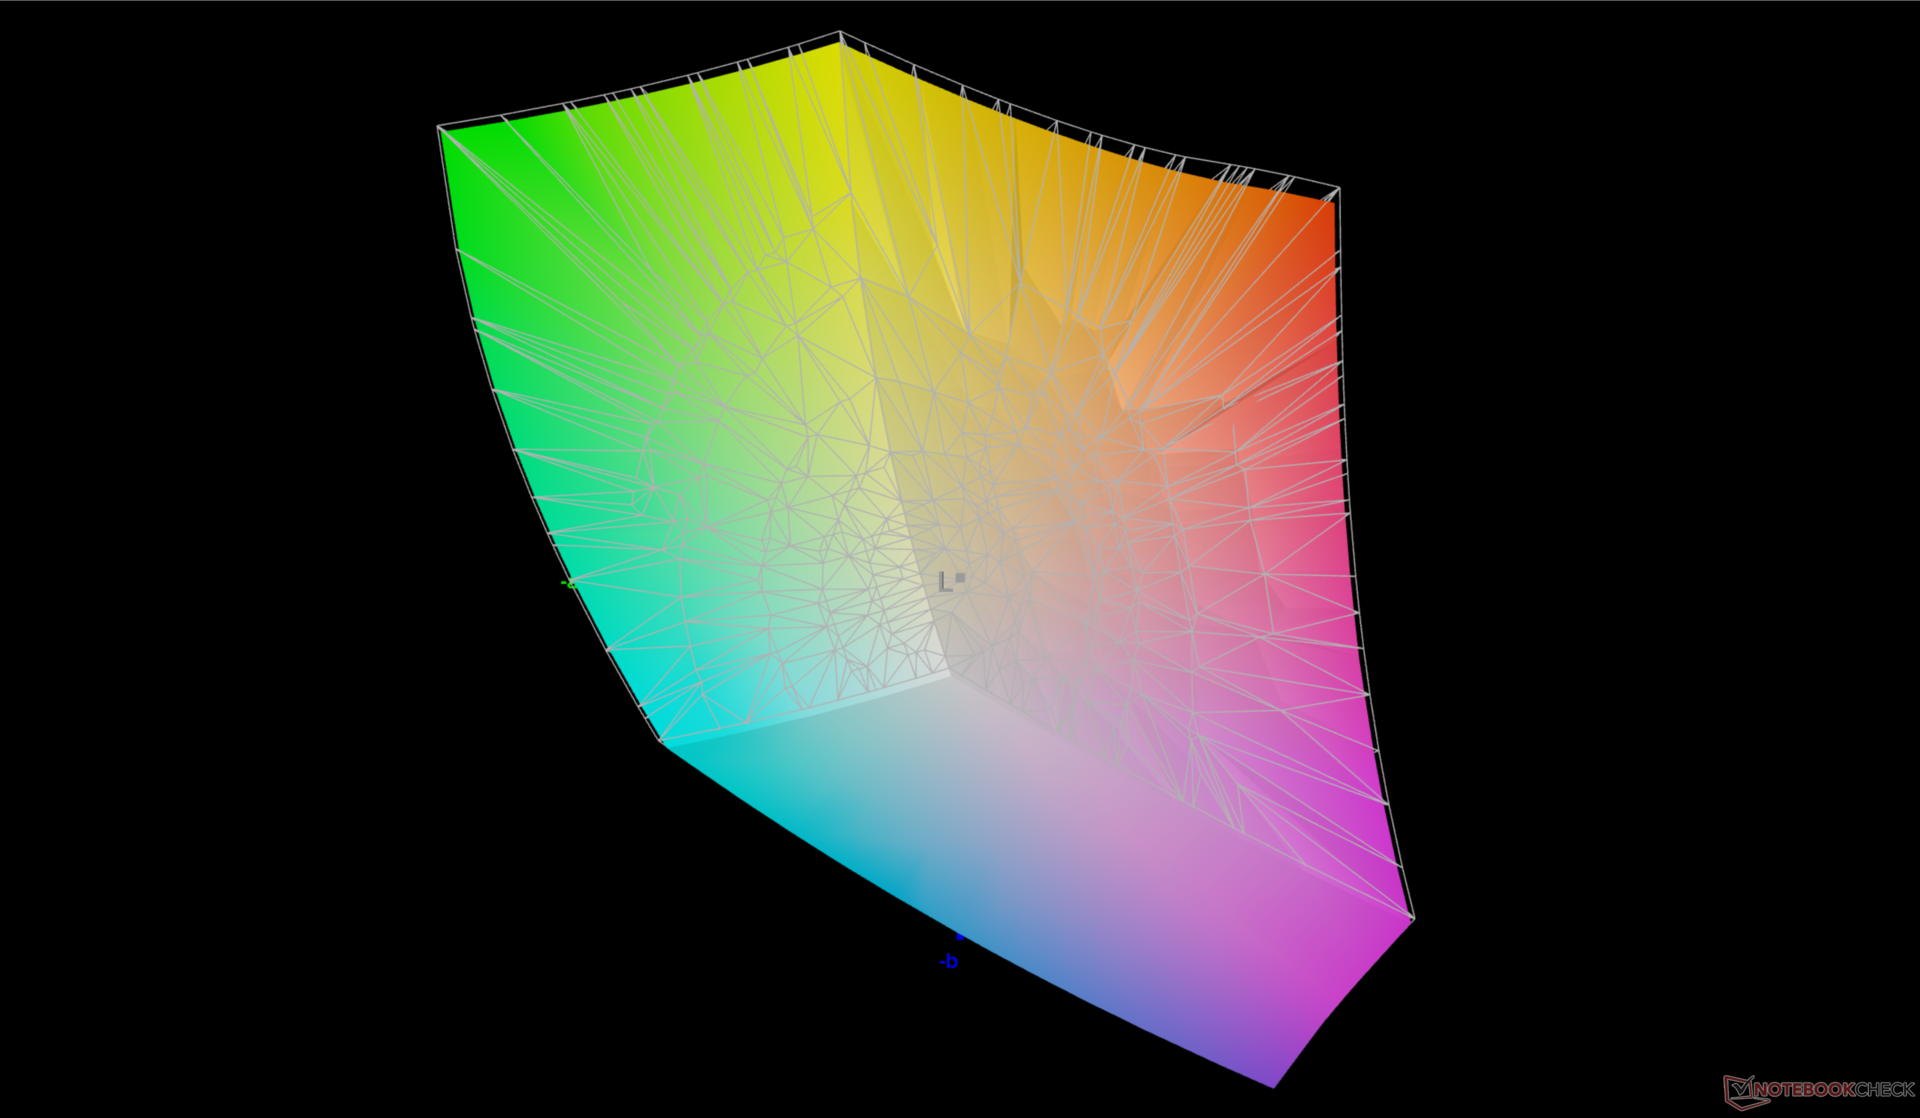
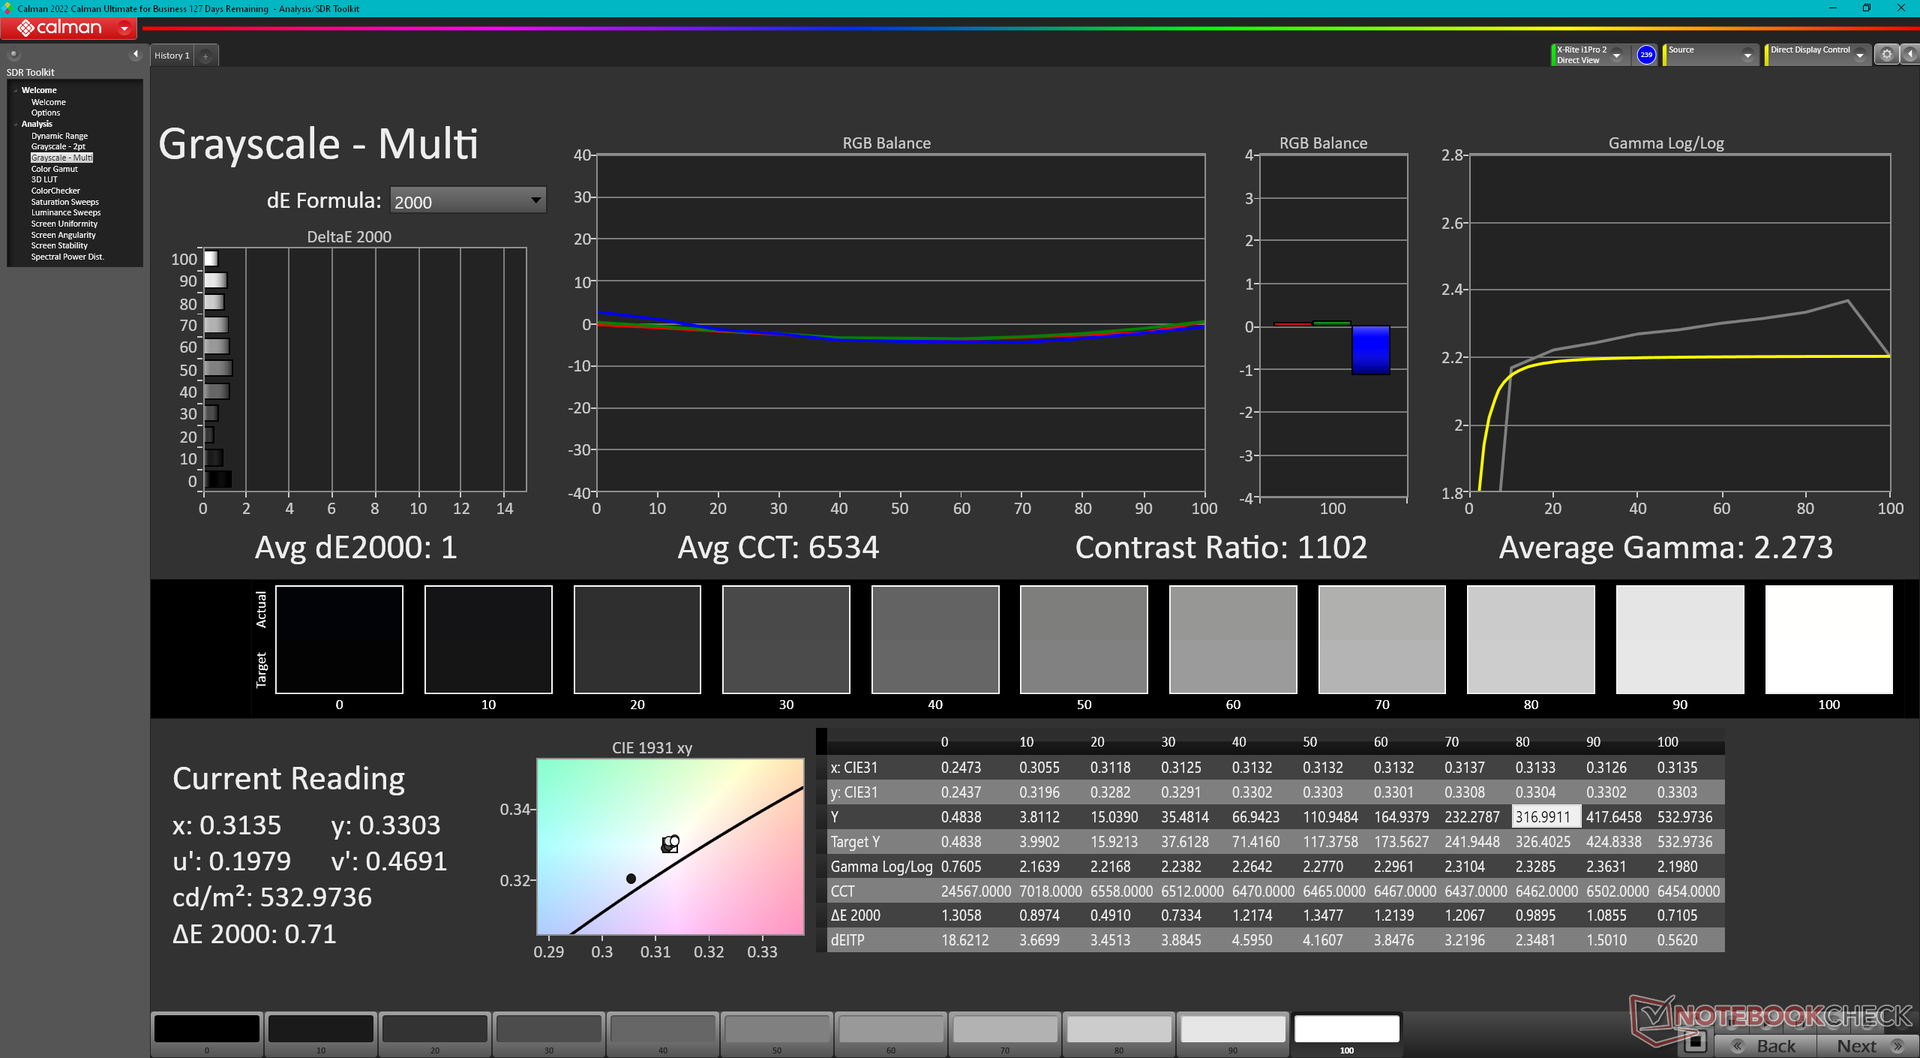
Het scherm is kant-en-klaar gekalibreerd volgens de P3-standaard met gemiddelde grijswaarden en kleuren DeltaE-waarden van respectievelijk slechts 1,0 en 2,26.
Responstijd Scherm
| ↔ Responstijd Zwart naar Wit | ||
|---|---|---|
| 8.6 ms ... stijging ↗ en daling ↘ gecombineerd | ↗ 4.7 ms stijging | 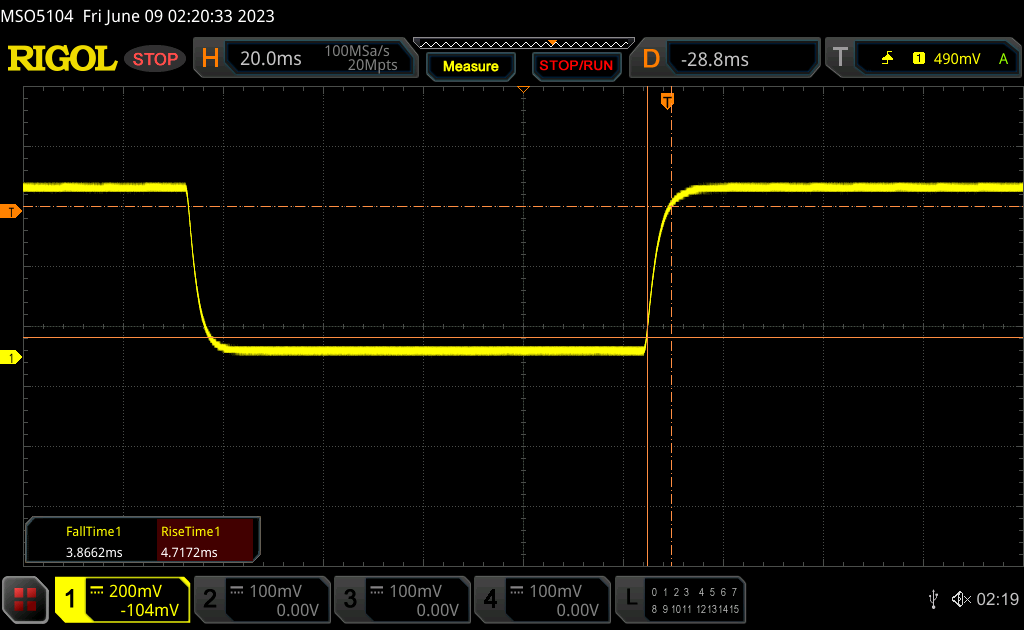 |
| ↘ 3.9 ms daling | ||
| Het scherm vertoonde snelle responstijden in onze tests en zou geschikt moeten zijn voor games. Ter vergelijking: alle testtoestellen variëren van 0.1 (minimum) tot 240 (maximum) ms. » 24 % van alle toestellen zijn beter. Dit betekent dat de gemeten responstijd beter is dan het gemiddelde (19.8 ms) van alle geteste toestellen. | ||
| ↔ Responstijd 50% Grijs naar 80% Grijs | ||
| 13.7 ms ... stijging ↗ en daling ↘ gecombineerd | ↗ 6.6 ms stijging | 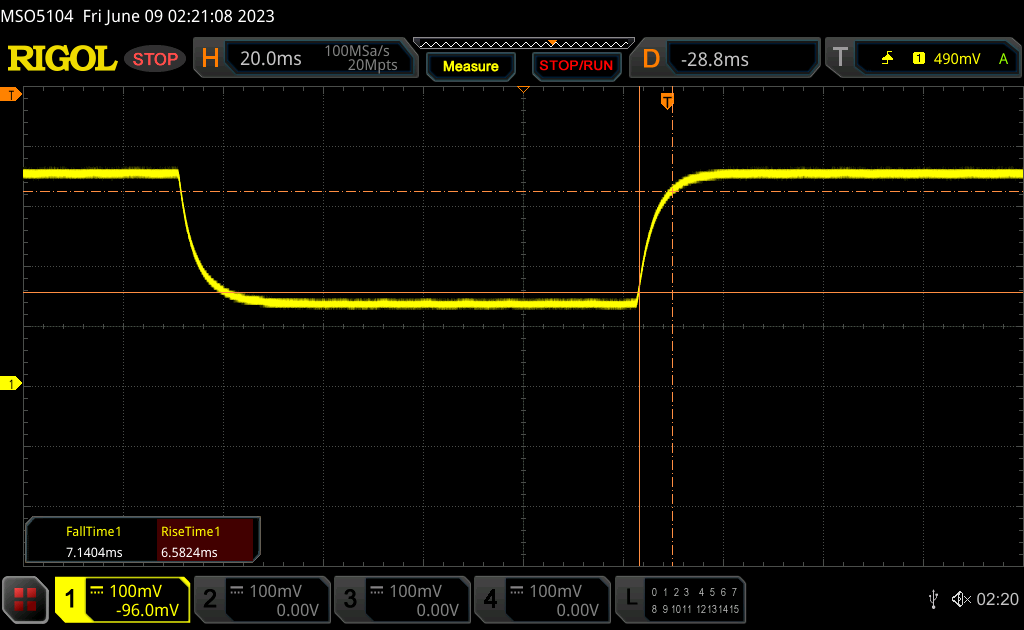 |
| ↘ 7.1 ms daling | ||
| Het scherm vertoonde prima responstijden in onze tests maar is misschien wat te traag voor competitieve games. Ter vergelijking: alle testtoestellen variëren van 0.165 (minimum) tot 636 (maximum) ms. » 28 % van alle toestellen zijn beter. Dit betekent dat de gemeten responstijd beter is dan het gemiddelde (31 ms) van alle geteste toestellen. | ||
Screen Flickering / PWM (Pulse-Width Modulation)
| Screen flickering / PWM niet waargenomen | 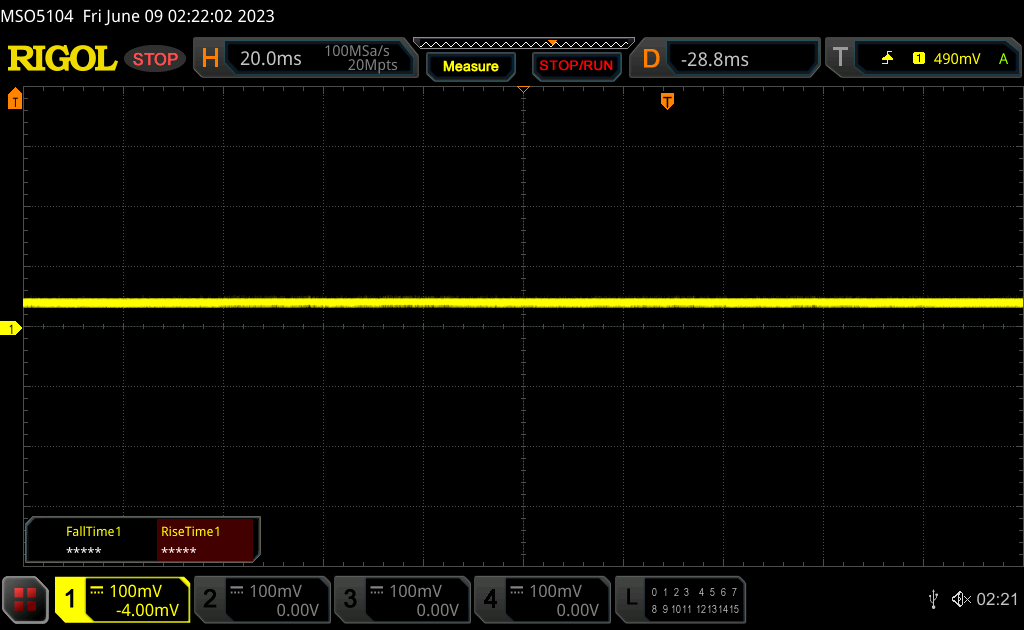 | ||
Ter vergelijking: 52 % van alle geteste toestellen maakten geen gebruik van PWM om de schermhelderheid te verlagen. Als het wel werd gebruikt, werd een gemiddelde van 7754 (minimum: 5 - maximum: 343500) Hz waargenomen. | |||
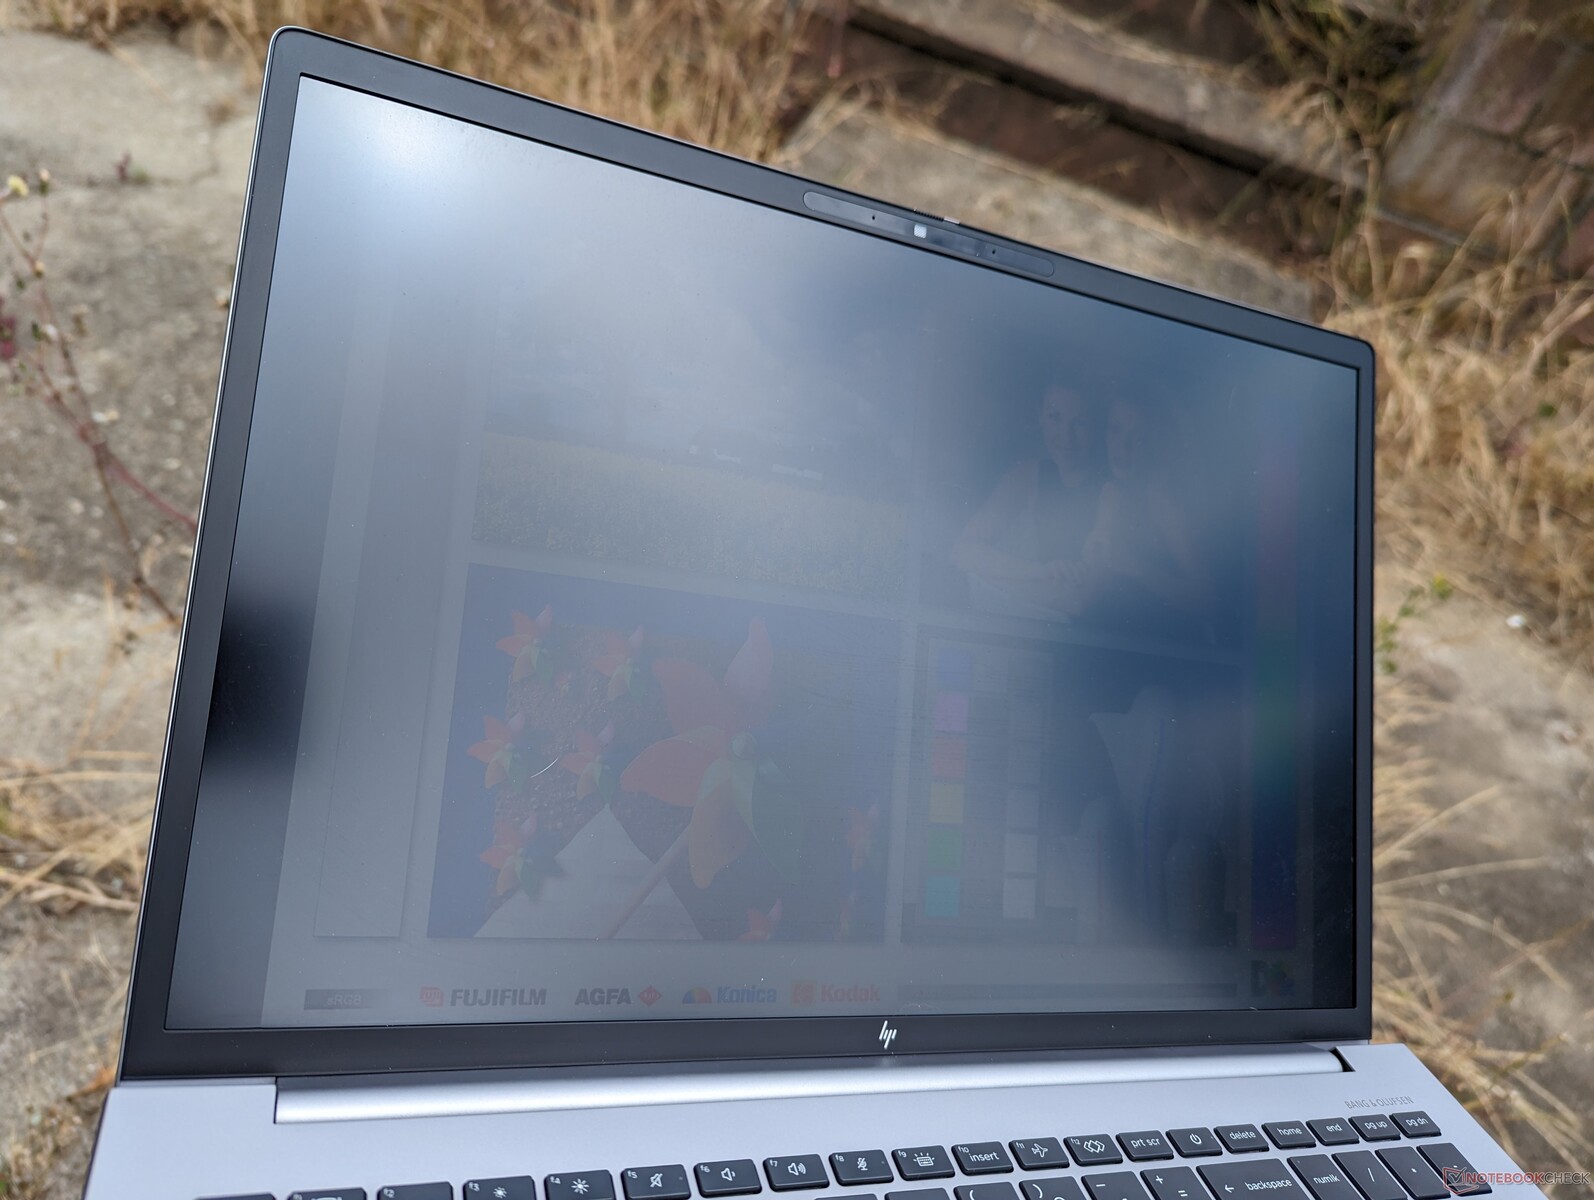
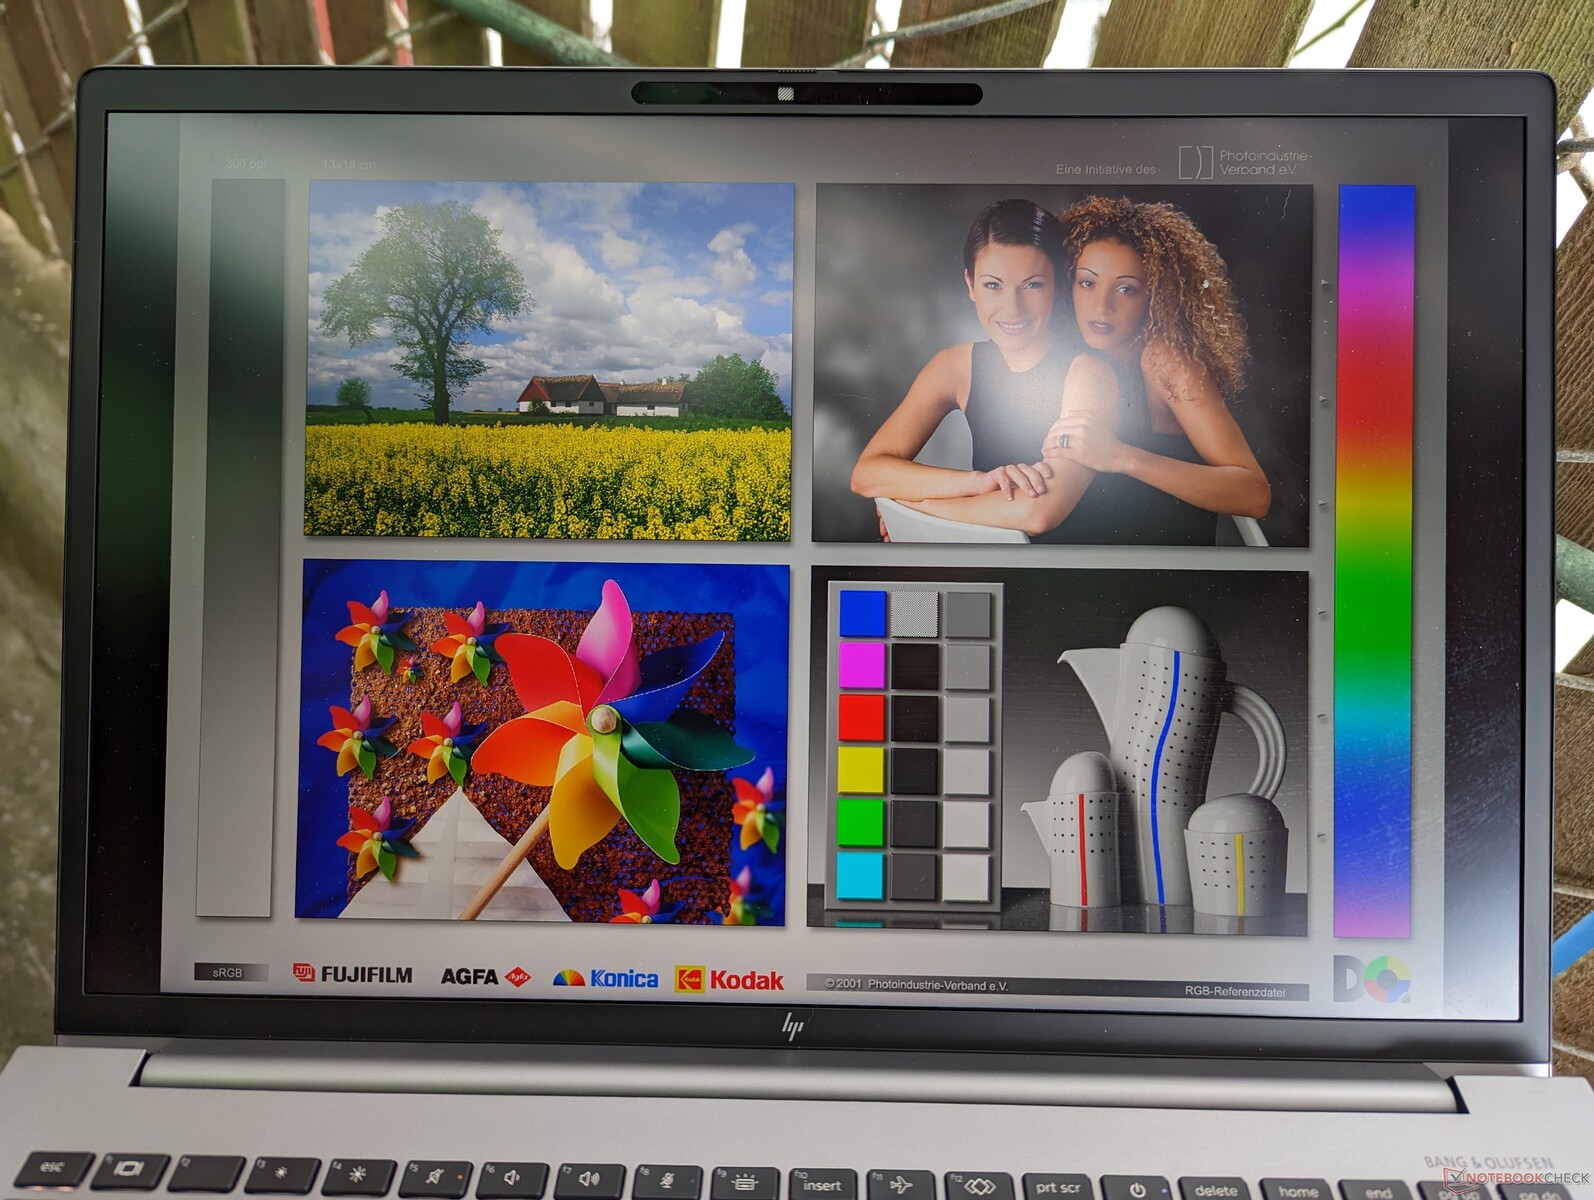
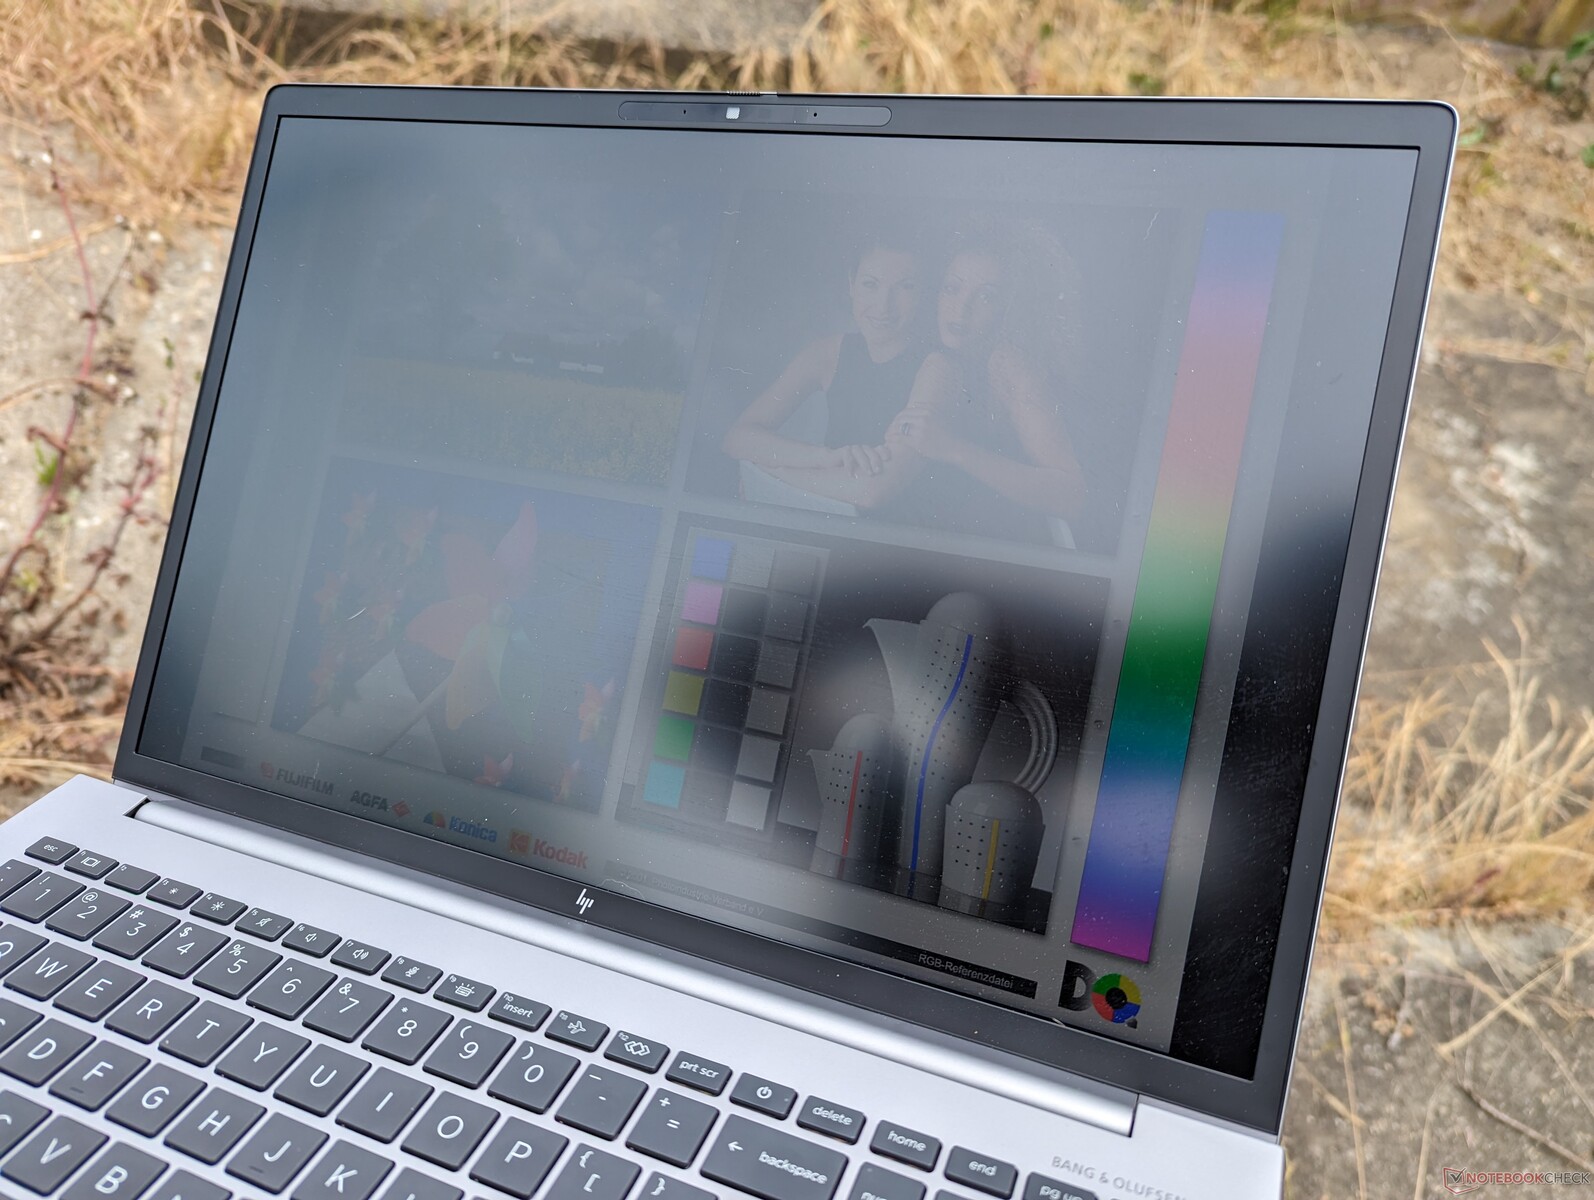
De zichtbaarheid buiten is fatsoenlijk in de schaduw en vergelijkbaar met veel Ultrabooks voor consumenten, aangezien 400 nits een veelgebruikt doel is. HP biedt een veel helderdere 1000-nits optie als zichtbaarheid buitenshuis een prioriteit is, maar de panelen zijn voorlopig beperkt tot IPS en een resolutie van slechts 1920 x 1200.
Het is de moeite waard om op te merken dat Display Power Savings standaard is ingeschakeld, wat betekent dat de maximale helderheid van het scherm met maar liefst 80 nits daalt als het op de batterij werkt. Om dit te voorkomen, start je Intel Graphics Command Center en ga je naar de submenu's System en Power om Display Power Savings uit te schakelen.
Prestaties - 12e generatie Intel Alder Lake-H met Nvidia RTX Ampere
Testomstandigheden
We hebben ons apparaat ingesteld op de modus Prestaties voordat we de onderstaande benchmarks uitvoerden. HP heeft geen extra energieprofielen naast de standaard Windows profielen en geavanceerde functies zoals Optimus 2.0 of MUX worden niet ondersteund.
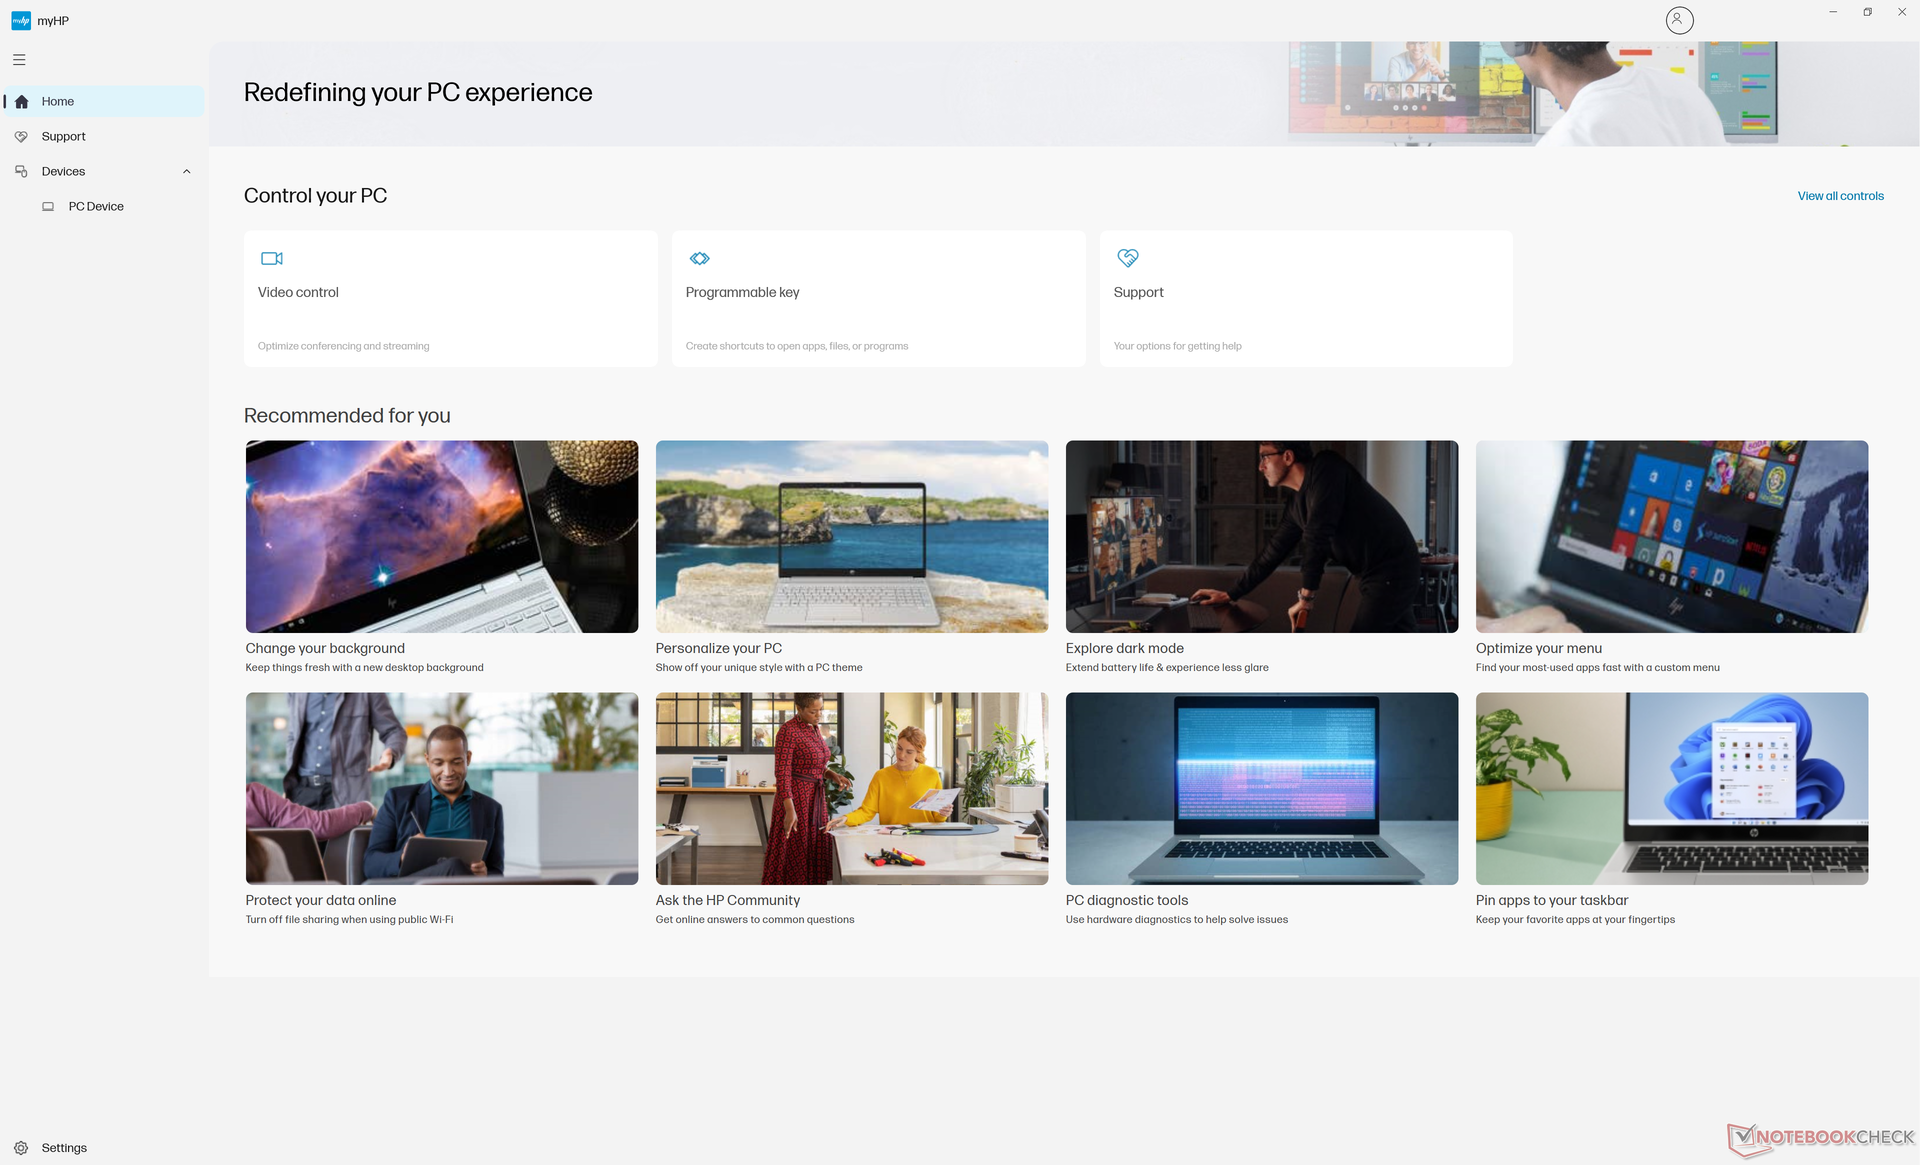
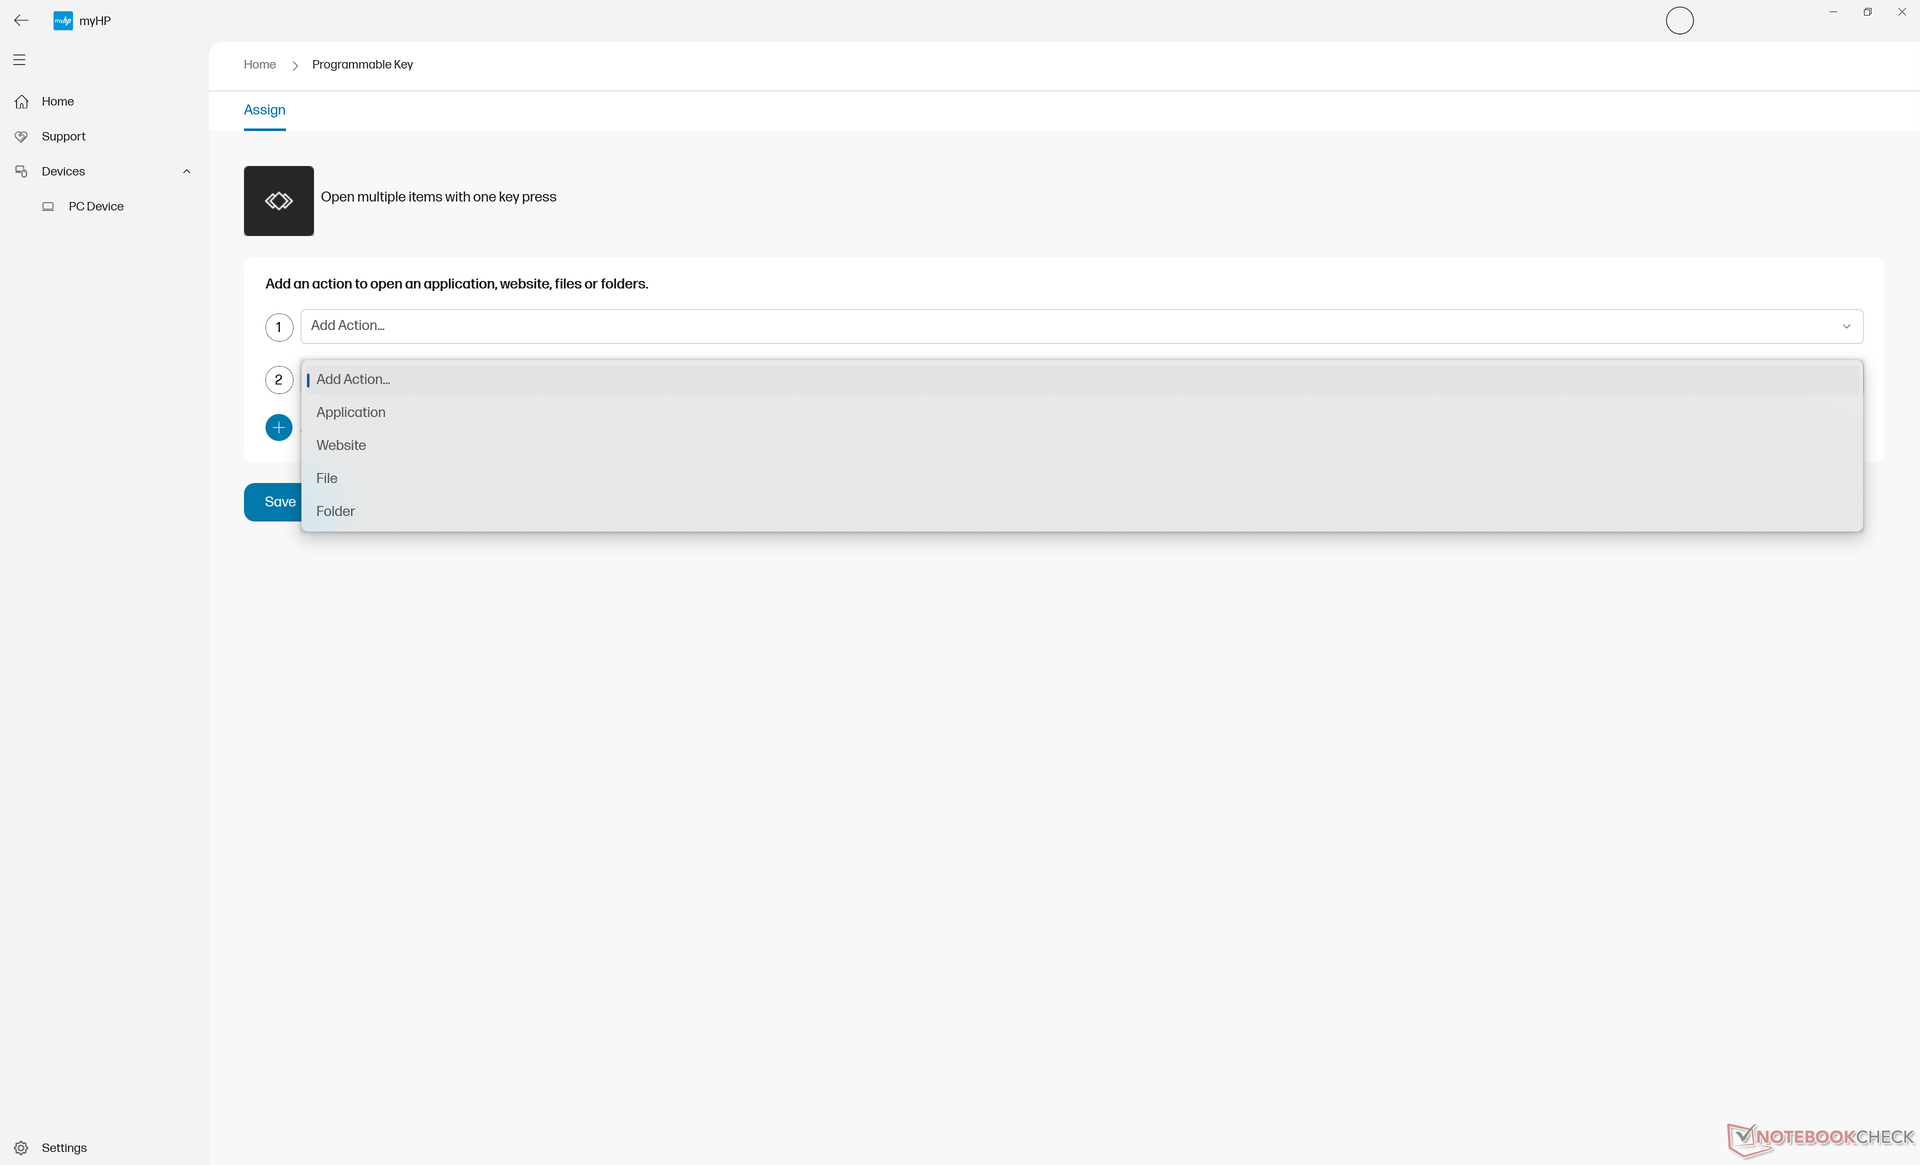
Het wordt aanbevolen dat gebruikers bekend raken met MyHP en Z Light Space voor respectievelijk HP-specifieke software-updates en RGB-toetsenbordinstellingen.
Processor
De 12e generatie Core i9-12950HX was een van de snelste mobiele CPU's met zowel vPro- als ECC-ondersteuning tot de introductie van de 13e generatie Core i9-13950HX. De Fury 16 G10 is sinds kort verkrijgbaar als 13e generatie optie.
De processor in onze HP presteert ongeveer 5 procent ondermaats in vergelijking met de gemiddelde laptop in onze database die is uitgerust met dezelfde Core i9-12950HX CPU. Wat nog erger is, is dat de CPU scherper gas geeft wanneer deze langdurig wordt belast. Bij het uitvoeren van CineBench R15 xT in een loop, bijvoorbeeld, daalden de prestaties met ongeveer 20 procent na de 7e of 8e loop. De ThinkPad P16 G1 ondervindt een lagere mate van CPU throttling, zoals blijkt uit onze onderstaande vergelijkingsgrafiek.
Downgraden naar de Core i7-12850HX configuratie vanuit onze Core i9-12950HX zal naar verwachting zowel single- als multi-thread prestaties met ongeveer 15 tot 20 procent beïnvloeden.
Cinebench R15 Multi Loop
Cinebench R23: Multi Core | Single Core
Cinebench R20: CPU (Multi Core) | CPU (Single Core)
Cinebench R15: CPU Multi 64Bit | CPU Single 64Bit
Blender: v2.79 BMW27 CPU
7-Zip 18.03: 7z b 4 | 7z b 4 -mmt1
Geekbench 5.5: Multi-Core | Single-Core
HWBOT x265 Benchmark v2.2: 4k Preset
LibreOffice : 20 Documents To PDF
R Benchmark 2.5: Overall mean
* ... kleiner is beter
AIDA64: FP32 Ray-Trace | FPU Julia | CPU SHA3 | CPU Queen | FPU SinJulia | FPU Mandel | CPU AES | CPU ZLib | FP64 Ray-Trace | CPU PhotoWorxx
| Performance rating | |
| Gemiddeld Intel Core i9-12950HX | |
| Lenovo ThinkPad P16 G1 RTX A5500 | |
| HP ZBook Fury 16 G9 | |
| MSI CreatorPro Z16P B12UKST | |
| HP ZBook Studio 16 G9 62U04EA | |
| Dell Precision 7000 7670 Performance | |
| HP ZBook Firefly 16 G9-6B897EA | |
| AIDA64 / FP32 Ray-Trace | |
| Lenovo ThinkPad P16 G1 RTX A5500 | |
| Gemiddeld Intel Core i9-12950HX (15499 - 22868, n=7) | |
| HP ZBook Fury 16 G9 | |
| Dell Precision 7000 7670 Performance | |
| HP ZBook Studio 16 G9 62U04EA | |
| MSI CreatorPro Z16P B12UKST | |
| HP ZBook Firefly 16 G9-6B897EA | |
| AIDA64 / FPU Julia | |
| HP ZBook Fury 16 G9 | |
| Lenovo ThinkPad P16 G1 RTX A5500 | |
| Gemiddeld Intel Core i9-12950HX (77846 - 115907, n=7) | |
| HP ZBook Studio 16 G9 62U04EA | |
| Dell Precision 7000 7670 Performance | |
| MSI CreatorPro Z16P B12UKST | |
| HP ZBook Firefly 16 G9-6B897EA | |
| AIDA64 / CPU SHA3 | |
| Lenovo ThinkPad P16 G1 RTX A5500 | |
| Gemiddeld Intel Core i9-12950HX (3426 - 5069, n=7) | |
| HP ZBook Fury 16 G9 | |
| HP ZBook Studio 16 G9 62U04EA | |
| MSI CreatorPro Z16P B12UKST | |
| Dell Precision 7000 7670 Performance | |
| HP ZBook Firefly 16 G9-6B897EA | |
| AIDA64 / CPU Queen | |
| HP ZBook Studio 16 G9 62U04EA | |
| Gemiddeld Intel Core i9-12950HX (102752 - 104726, n=7) | |
| Lenovo ThinkPad P16 G1 RTX A5500 | |
| Dell Precision 7000 7670 Performance | |
| HP ZBook Fury 16 G9 | |
| MSI CreatorPro Z16P B12UKST | |
| HP ZBook Firefly 16 G9-6B897EA | |
| AIDA64 / FPU SinJulia | |
| Lenovo ThinkPad P16 G1 RTX A5500 | |
| HP ZBook Fury 16 G9 | |
| Gemiddeld Intel Core i9-12950HX (10134 - 12823, n=7) | |
| Dell Precision 7000 7670 Performance | |
| HP ZBook Studio 16 G9 62U04EA | |
| MSI CreatorPro Z16P B12UKST | |
| HP ZBook Firefly 16 G9-6B897EA | |
| AIDA64 / FPU Mandel | |
| HP ZBook Fury 16 G9 | |
| Lenovo ThinkPad P16 G1 RTX A5500 | |
| Gemiddeld Intel Core i9-12950HX (37146 - 57340, n=7) | |
| HP ZBook Studio 16 G9 62U04EA | |
| Dell Precision 7000 7670 Performance | |
| MSI CreatorPro Z16P B12UKST | |
| HP ZBook Firefly 16 G9-6B897EA | |
| AIDA64 / CPU AES | |
| MSI CreatorPro Z16P B12UKST | |
| Gemiddeld Intel Core i9-12950HX (72599 - 181128, n=7) | |
| HP ZBook Fury 16 G9 | |
| Lenovo ThinkPad P16 G1 RTX A5500 | |
| HP ZBook Studio 16 G9 62U04EA | |
| Dell Precision 7000 7670 Performance | |
| HP ZBook Firefly 16 G9-6B897EA | |
| AIDA64 / CPU ZLib | |
| Lenovo ThinkPad P16 G1 RTX A5500 | |
| HP ZBook Fury 16 G9 | |
| Gemiddeld Intel Core i9-12950HX (996 - 1417, n=7) | |
| HP ZBook Studio 16 G9 62U04EA | |
| MSI CreatorPro Z16P B12UKST | |
| Dell Precision 7000 7670 Performance | |
| HP ZBook Firefly 16 G9-6B897EA | |
| AIDA64 / FP64 Ray-Trace | |
| Lenovo ThinkPad P16 G1 RTX A5500 | |
| Gemiddeld Intel Core i9-12950HX (8455 - 12432, n=7) | |
| HP ZBook Fury 16 G9 | |
| HP ZBook Studio 16 G9 62U04EA | |
| Dell Precision 7000 7670 Performance | |
| MSI CreatorPro Z16P B12UKST | |
| HP ZBook Firefly 16 G9-6B897EA | |
| AIDA64 / CPU PhotoWorxx | |
| MSI CreatorPro Z16P B12UKST | |
| Dell Precision 7000 7670 Performance | |
| Gemiddeld Intel Core i9-12950HX (35479 - 42655, n=7) | |
| Lenovo ThinkPad P16 G1 RTX A5500 | |
| HP ZBook Fury 16 G9 | |
| HP ZBook Studio 16 G9 62U04EA | |
| HP ZBook Firefly 16 G9-6B897EA | |
Systeemprestaties
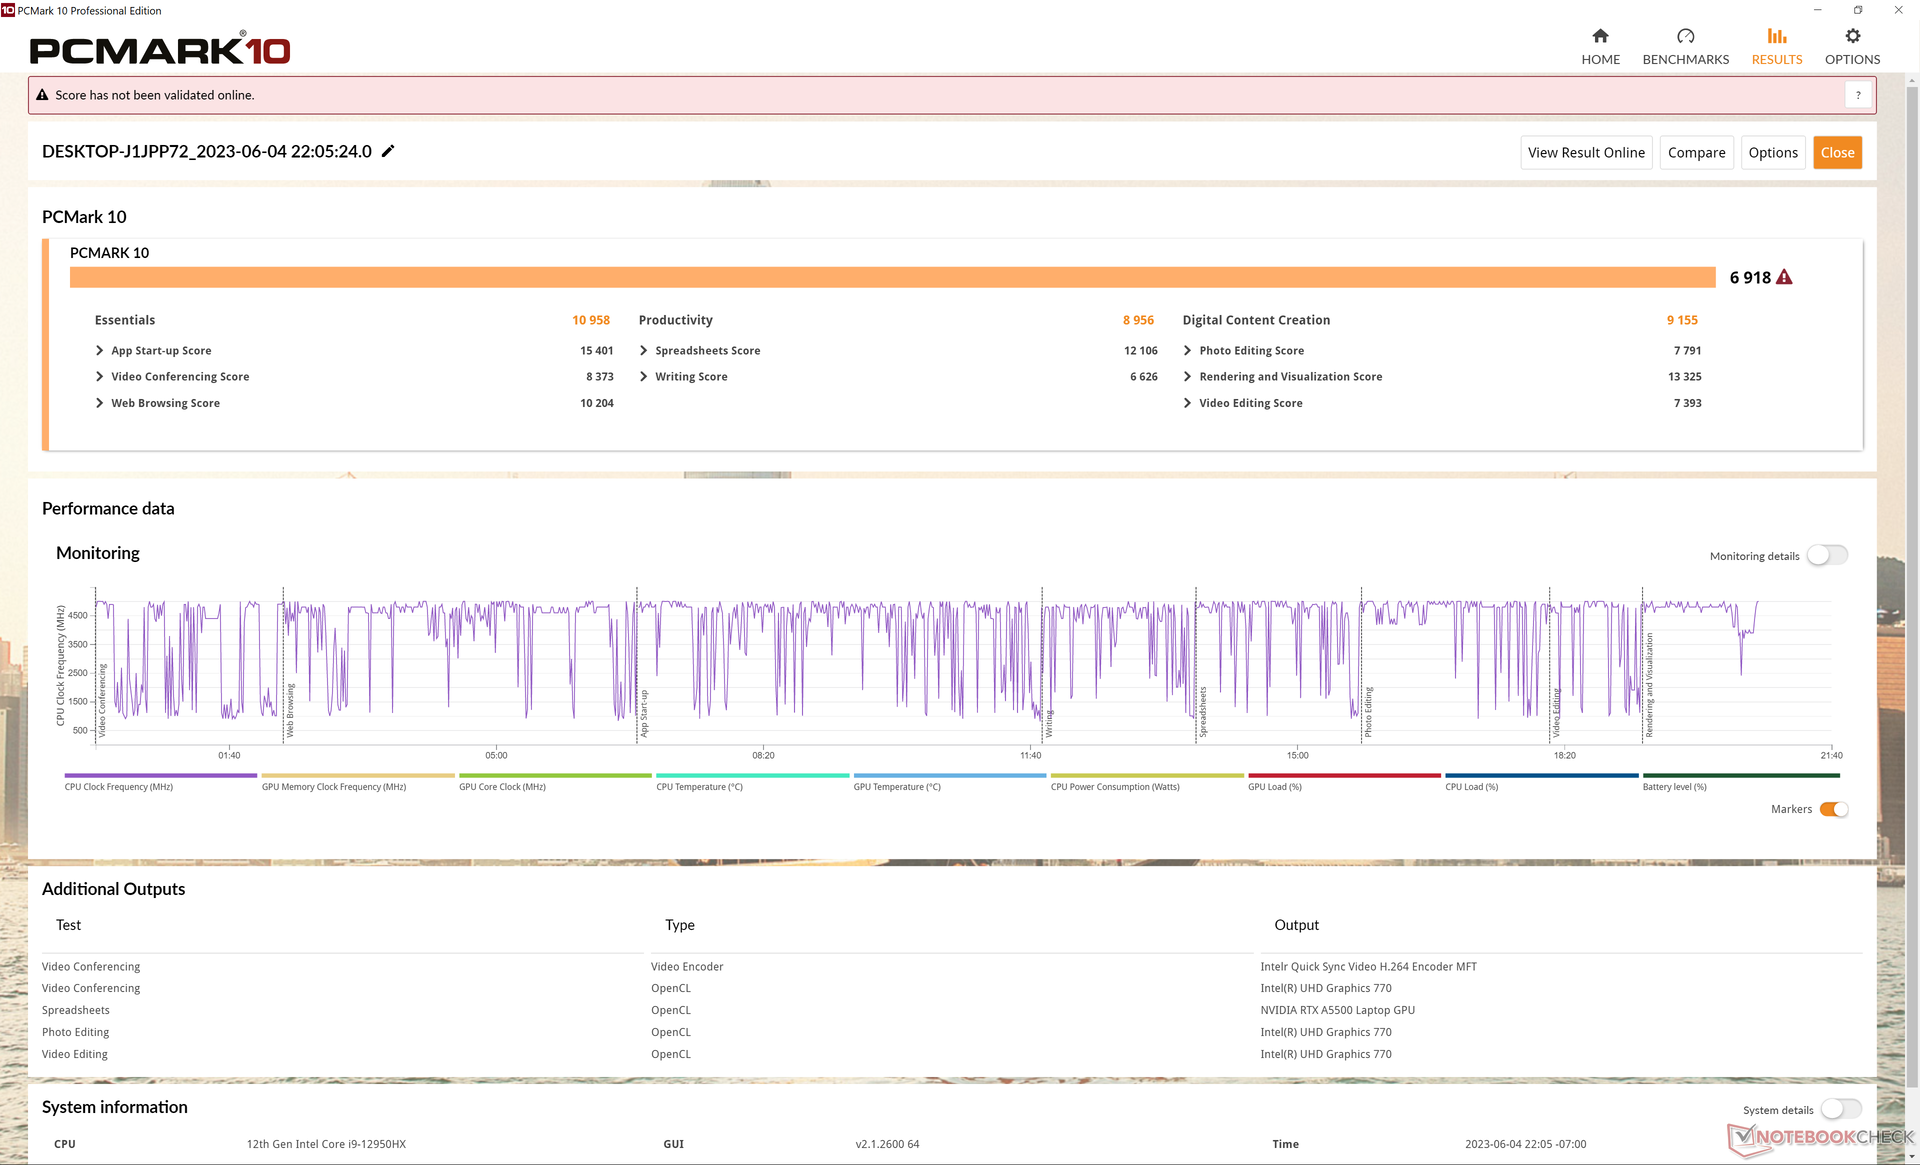
De PCMark-resultaten zijn vergelijkbaar met zowel de Dell Precision 7670 als de Lenovo ThinkPad P16 G1. Let op het aanzienlijke voordeel ten opzichte van de kleinere ZBook Firefly 16 G9 in de subtest voor het maken van digitale content dankzij de snellere RTX A5500 GPU in onze Fury 16 G9.
CrossMark: Overall | Productivity | Creativity | Responsiveness
| PCMark 10 / Score | |
| Lenovo ThinkPad P16 G1 RTX A5500 | |
| MSI CreatorPro Z16P B12UKST | |
| Gemiddeld Intel Core i9-12950HX, NVIDIA RTX A5500 Laptop GPU (6883 - 7236, n=3) | |
| HP ZBook Fury 16 G9 | |
| Dell Precision 7000 7670 Performance | |
| HP ZBook Studio 16 G9 62U04EA | |
| HP ZBook Firefly 16 G9-6B897EA | |
| PCMark 10 / Essentials | |
| Dell Precision 7000 7670 Performance | |
| Gemiddeld Intel Core i9-12950HX, NVIDIA RTX A5500 Laptop GPU (10898 - 11465, n=3) | |
| HP ZBook Fury 16 G9 | |
| Lenovo ThinkPad P16 G1 RTX A5500 | |
| MSI CreatorPro Z16P B12UKST | |
| HP ZBook Firefly 16 G9-6B897EA | |
| HP ZBook Studio 16 G9 62U04EA | |
| PCMark 10 / Productivity | |
| Lenovo ThinkPad P16 G1 RTX A5500 | |
| MSI CreatorPro Z16P B12UKST | |
| HP ZBook Fury 16 G9 | |
| Gemiddeld Intel Core i9-12950HX, NVIDIA RTX A5500 Laptop GPU (8054 - 9489, n=3) | |
| HP ZBook Firefly 16 G9-6B897EA | |
| Dell Precision 7000 7670 Performance | |
| HP ZBook Studio 16 G9 62U04EA | |
| PCMark 10 / Digital Content Creation | |
| Lenovo ThinkPad P16 G1 RTX A5500 | |
| MSI CreatorPro Z16P B12UKST | |
| Dell Precision 7000 7670 Performance | |
| Gemiddeld Intel Core i9-12950HX, NVIDIA RTX A5500 Laptop GPU (9155 - 9944, n=3) | |
| HP ZBook Studio 16 G9 62U04EA | |
| HP ZBook Fury 16 G9 | |
| HP ZBook Firefly 16 G9-6B897EA | |
| CrossMark / Overall | |
| MSI CreatorPro Z16P B12UKST | |
| HP ZBook Fury 16 G9 | |
| Lenovo ThinkPad P16 G1 RTX A5500 | |
| Gemiddeld Intel Core i9-12950HX, NVIDIA RTX A5500 Laptop GPU (1801 - 1889, n=3) | |
| HP ZBook Studio 16 G9 62U04EA | |
| Dell Precision 7000 7670 Performance | |
| HP ZBook Firefly 16 G9-6B897EA | |
| CrossMark / Productivity | |
| MSI CreatorPro Z16P B12UKST | |
| HP ZBook Fury 16 G9 | |
| Lenovo ThinkPad P16 G1 RTX A5500 | |
| Gemiddeld Intel Core i9-12950HX, NVIDIA RTX A5500 Laptop GPU (1684 - 1785, n=3) | |
| HP ZBook Studio 16 G9 62U04EA | |
| Dell Precision 7000 7670 Performance | |
| HP ZBook Firefly 16 G9-6B897EA | |
| CrossMark / Creativity | |
| Lenovo ThinkPad P16 G1 RTX A5500 | |
| HP ZBook Fury 16 G9 | |
| Gemiddeld Intel Core i9-12950HX, NVIDIA RTX A5500 Laptop GPU (2042 - 2192, n=3) | |
| HP ZBook Studio 16 G9 62U04EA | |
| MSI CreatorPro Z16P B12UKST | |
| Dell Precision 7000 7670 Performance | |
| HP ZBook Firefly 16 G9-6B897EA | |
| CrossMark / Responsiveness | |
| MSI CreatorPro Z16P B12UKST | |
| HP ZBook Fury 16 G9 | |
| HP ZBook Studio 16 G9 62U04EA | |
| Gemiddeld Intel Core i9-12950HX, NVIDIA RTX A5500 Laptop GPU (1501 - 1585, n=3) | |
| Dell Precision 7000 7670 Performance | |
| Lenovo ThinkPad P16 G1 RTX A5500 | |
| HP ZBook Firefly 16 G9-6B897EA | |
| PCMark 10 Score | 6918 punten | |
Help | ||
| AIDA64 / Memory Copy | |
| Dell Precision 7000 7670 Performance | |
| Gemiddeld Intel Core i9-12950HX (59731 - 64732, n=7) | |
| Lenovo ThinkPad P16 G1 RTX A5500 | |
| MSI CreatorPro Z16P B12UKST | |
| HP ZBook Studio 16 G9 62U04EA | |
| HP ZBook Fury 16 G9 | |
| HP ZBook Firefly 16 G9-6B897EA | |
| AIDA64 / Memory Read | |
| Dell Precision 7000 7670 Performance | |
| Gemiddeld Intel Core i9-12950HX (59744 - 70359, n=7) | |
| MSI CreatorPro Z16P B12UKST | |
| HP ZBook Studio 16 G9 62U04EA | |
| Lenovo ThinkPad P16 G1 RTX A5500 | |
| HP ZBook Fury 16 G9 | |
| HP ZBook Firefly 16 G9-6B897EA | |
| AIDA64 / Memory Write | |
| MSI CreatorPro Z16P B12UKST | |
| Dell Precision 7000 7670 Performance | |
| HP ZBook Studio 16 G9 62U04EA | |
| Gemiddeld Intel Core i9-12950HX (57750 - 67899, n=7) | |
| HP ZBook Firefly 16 G9-6B897EA | |
| Lenovo ThinkPad P16 G1 RTX A5500 | |
| HP ZBook Fury 16 G9 | |
| AIDA64 / Memory Latency | |
| MSI CreatorPro Z16P B12UKST | |
| HP ZBook Fury 16 G9 | |
| Lenovo ThinkPad P16 G1 RTX A5500 | |
| HP ZBook Firefly 16 G9-6B897EA | |
| HP ZBook Studio 16 G9 62U04EA | |
| Gemiddeld Intel Core i9-12950HX (84.5 - 92.2, n=7) | |
| Dell Precision 7000 7670 Performance | |
* ... kleiner is beter
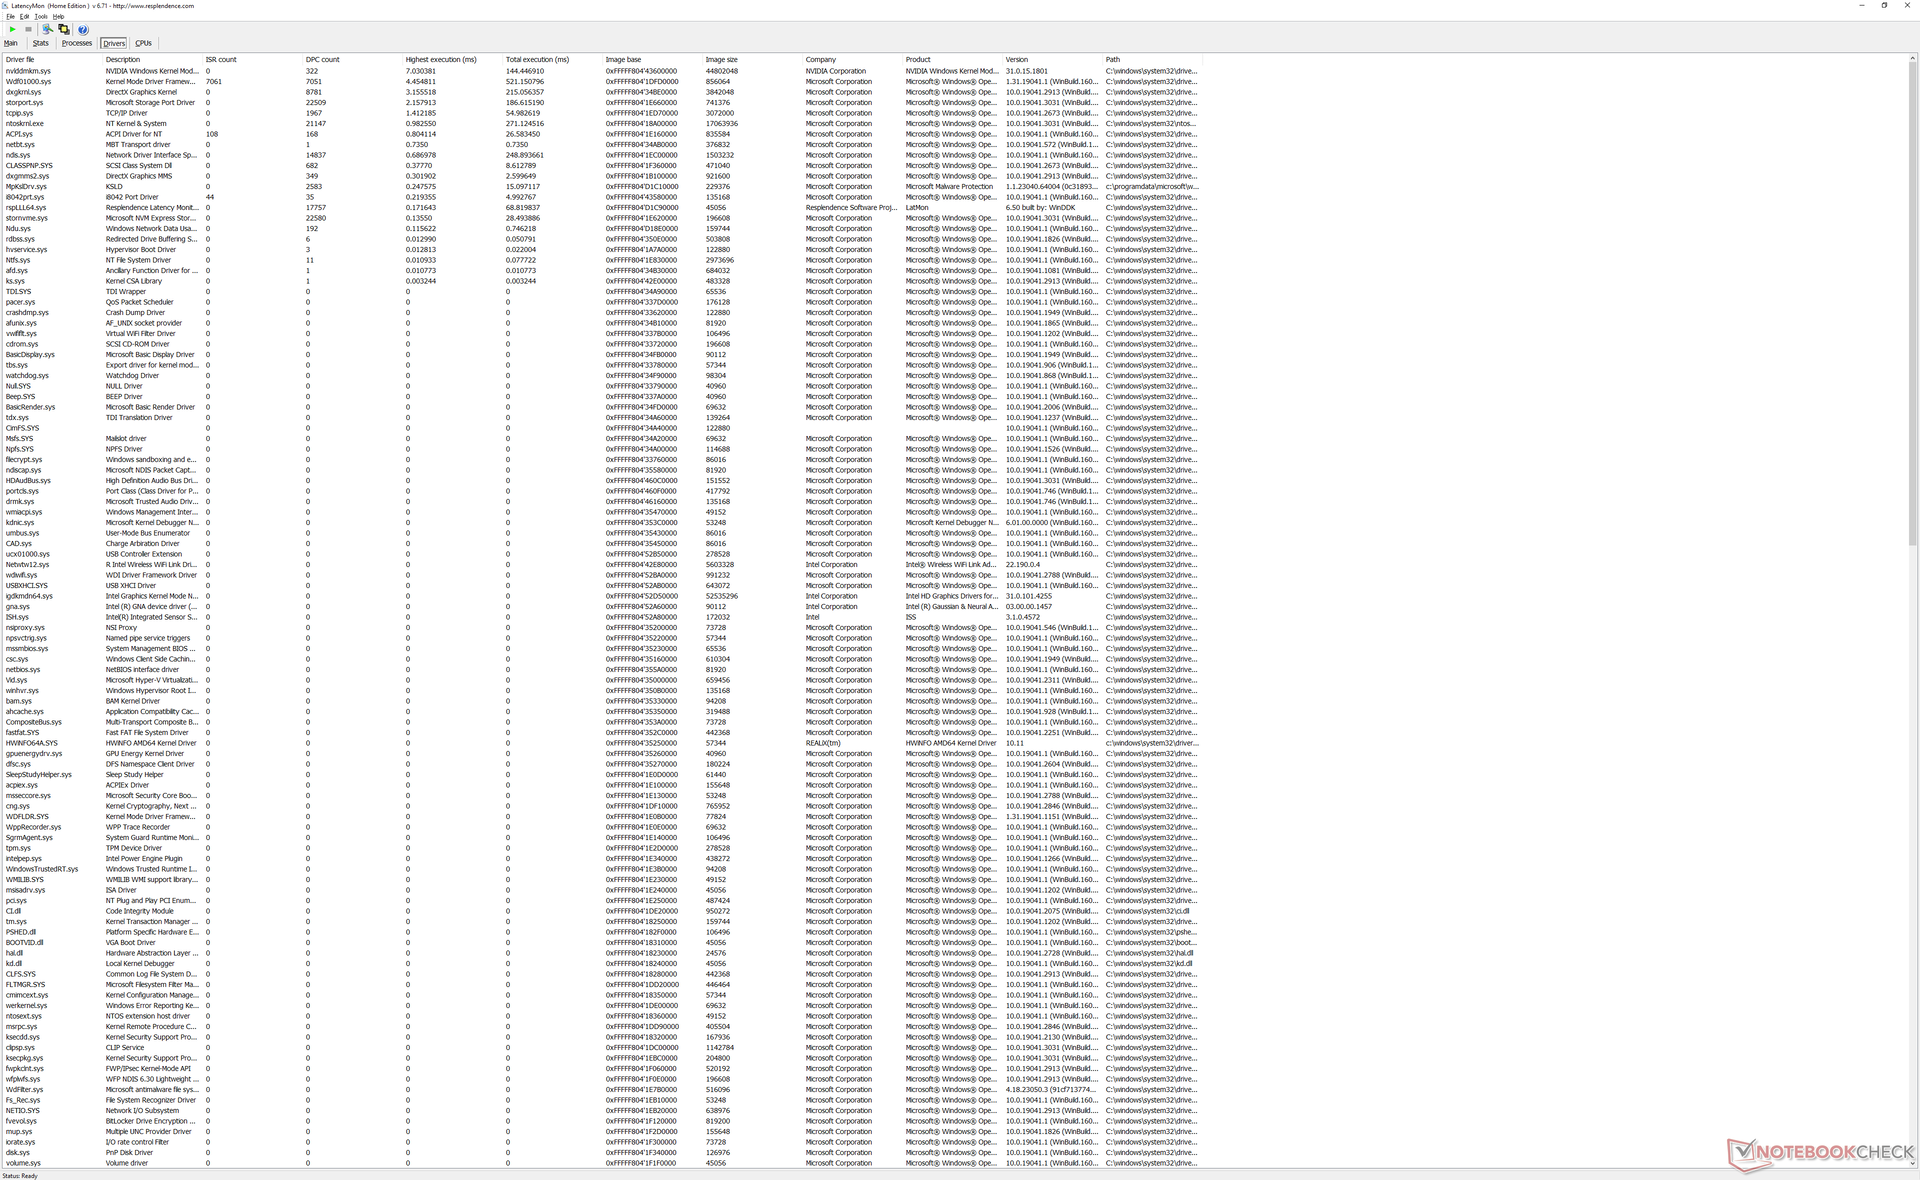
DPC latentie
LatencyMon onthult DPC-problemen bij het openen van meerdere browsertabbladen van onze startpagina. het afspelen van 4K-video's met 60 FPS is verder perfect met nul dropped frames tijdens het testen.
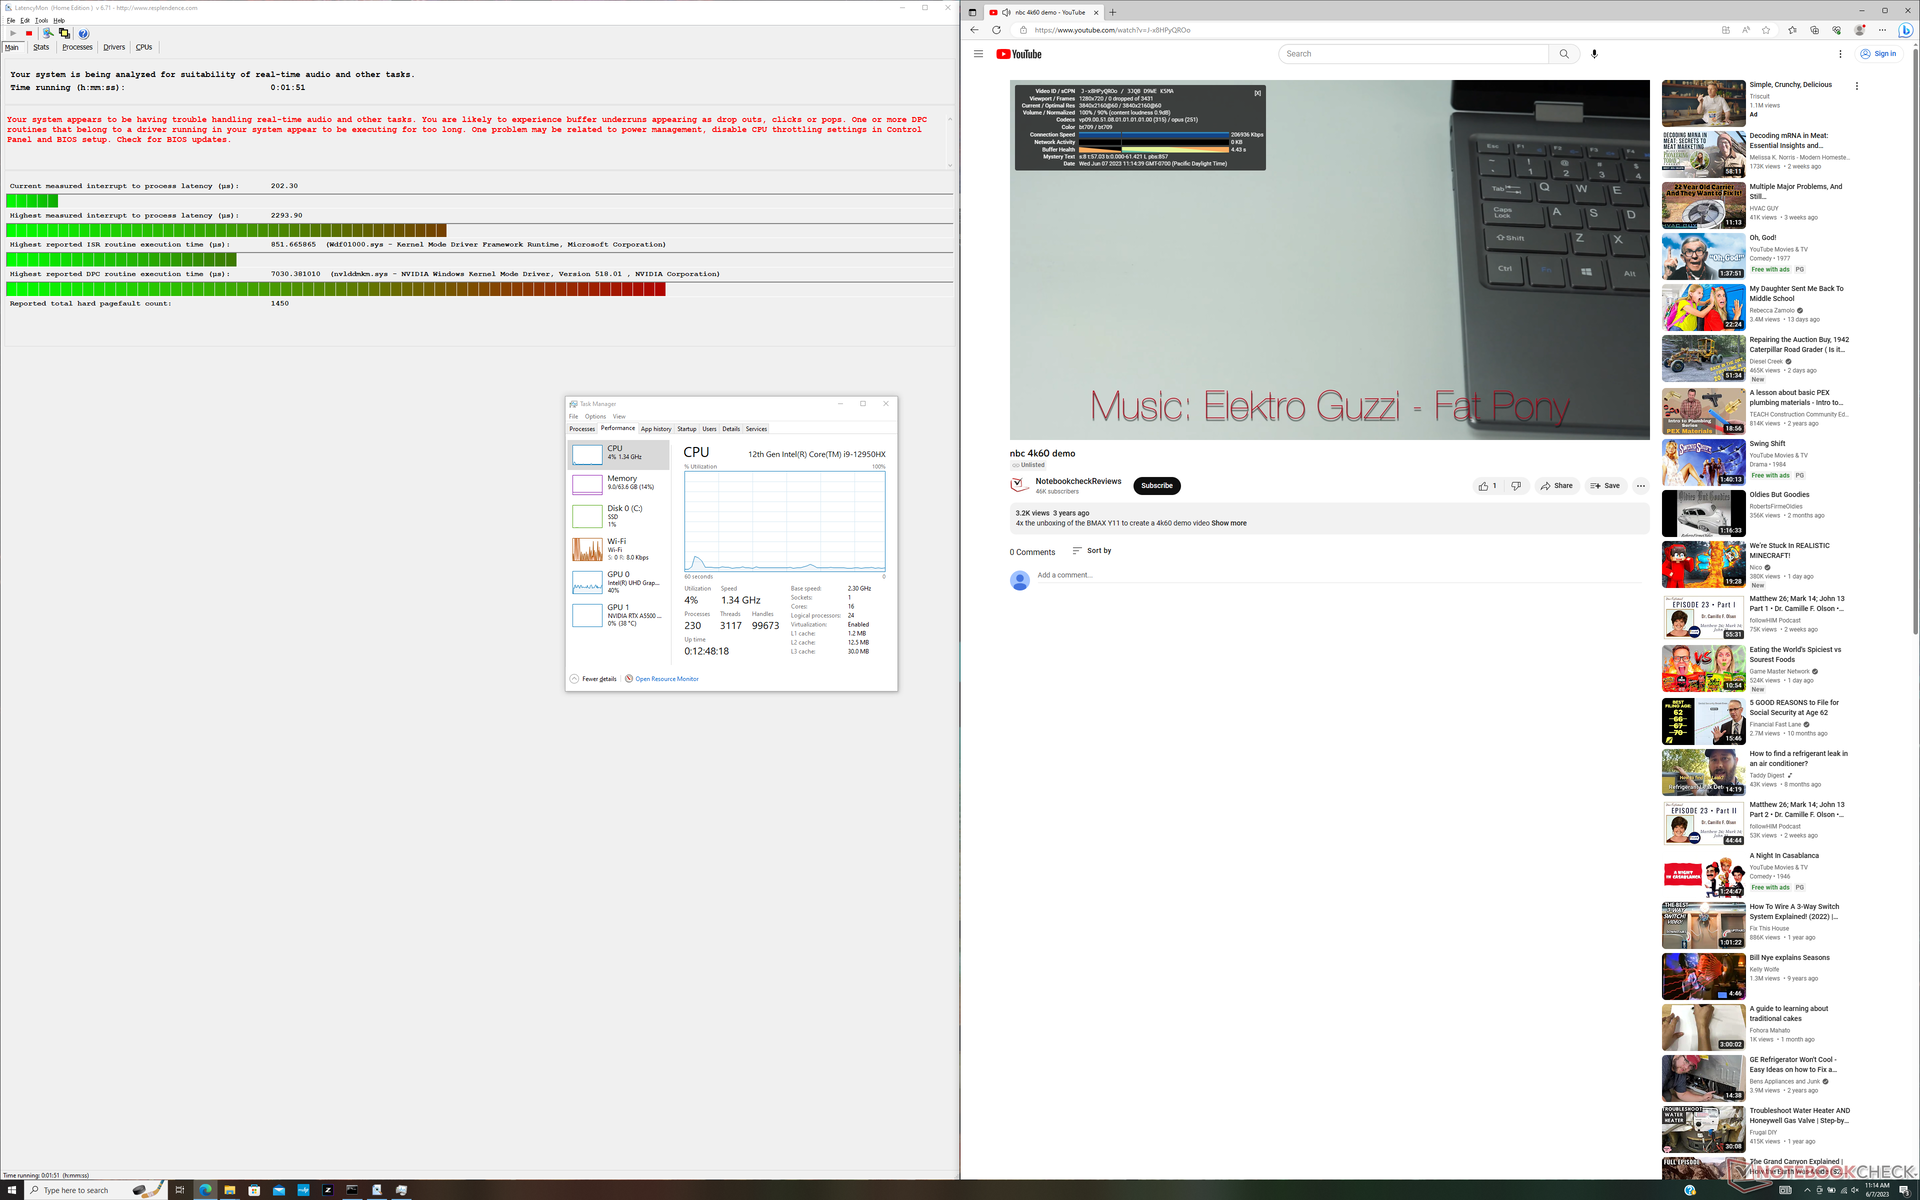
| DPC Latencies / LatencyMon - interrupt to process latency (max), Web, Youtube, Prime95 | |
| HP ZBook Fury 16 G9 | |
| Dell Precision 7000 7670 Performance | |
| Lenovo ThinkPad P16 G1 RTX A5500 | |
| HP ZBook Studio 16 G9 62U04EA | |
| HP ZBook Firefly 16 G9-6B897EA | |
| MSI CreatorPro Z16P B12UKST | |
* ... kleiner is beter
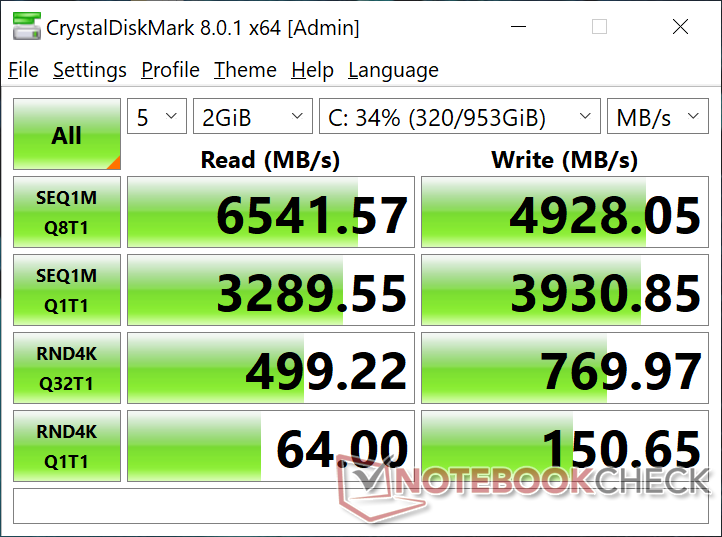
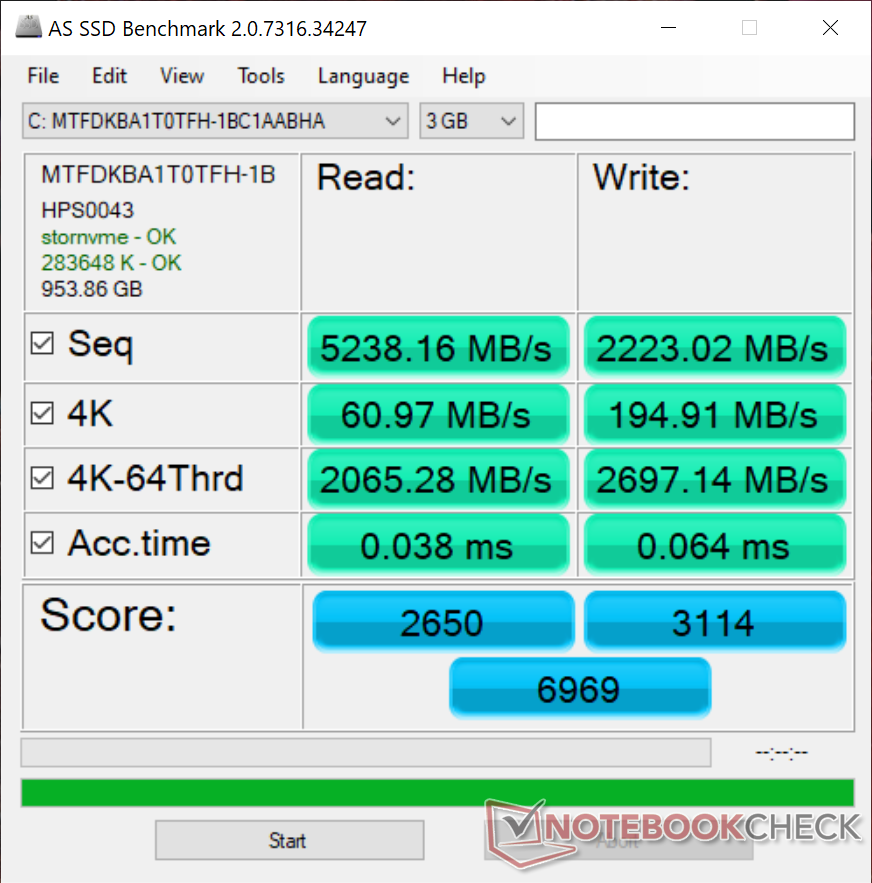
Opslagapparaten - potentiële prestatievermindering
Onze testunit wordt geleverd met dezelfde 1 TBMicron 3400 MTFDKBA1T0TFH SSD zoals gevonden op deLenovo ThinkPad X1 Extreme G5. Helaas lijkt de SSD in onze HP te lijden aan grote prestatieproblemen, zoals blijkt uit de vergelijkingsgrafiek hieronder. Wanneer DiskSpd in een lus werd uitgevoerd, daalde de overdrachtsnelheid af en toe van 6500 MB/s naar slechts 1700 MB/s, terwijl dezelfde schijf in de Lenovo onbeperkt op 6500 MB/s bleef draaien. Dit suggereert dat de Fury 16 problemen kan hebben met het koelen van de SSD's. De resultaten verbeterden niet, zelfs niet na meerdere hertests.

* ... kleiner is beter
Disk Throttling: DiskSpd Read Loop, Queue Depth 8
GPU-prestaties - 100 W TGP
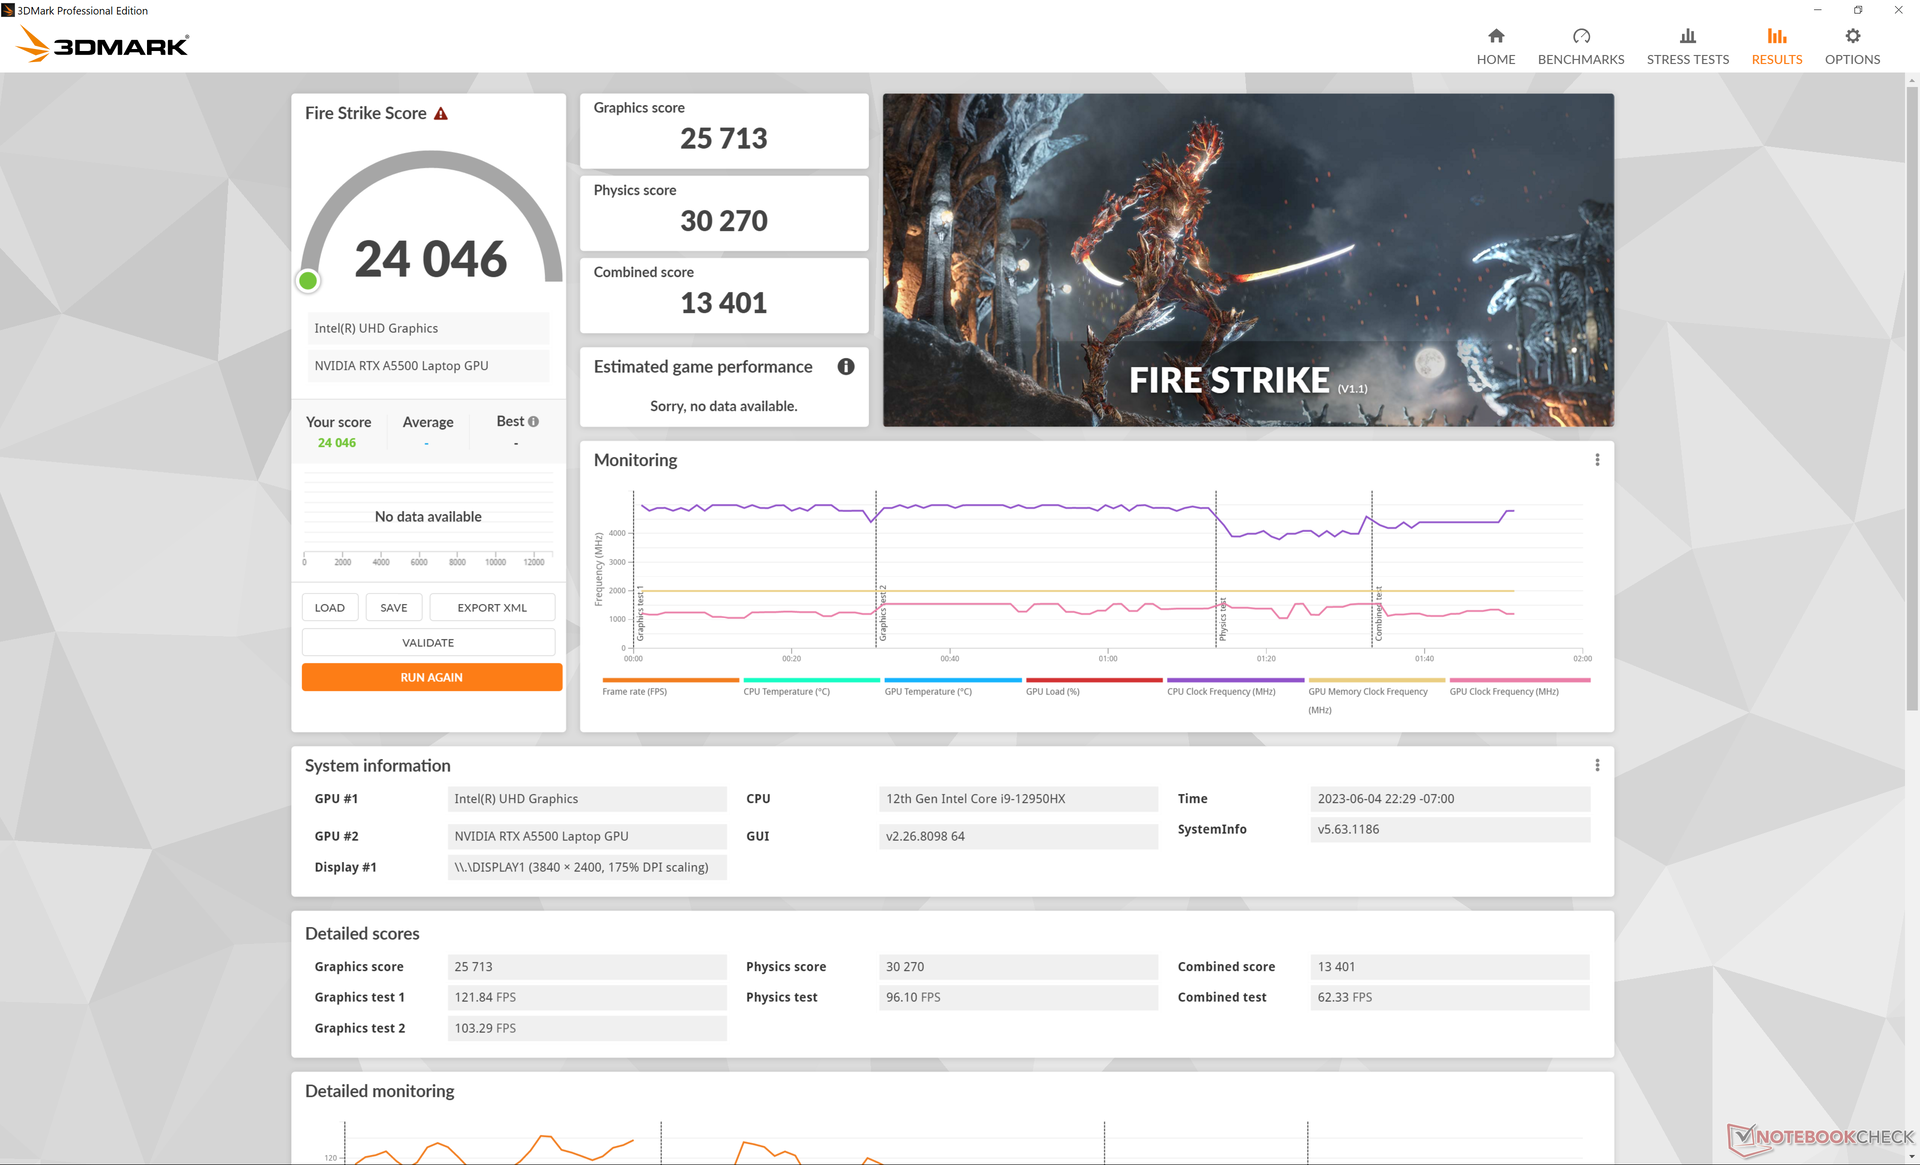
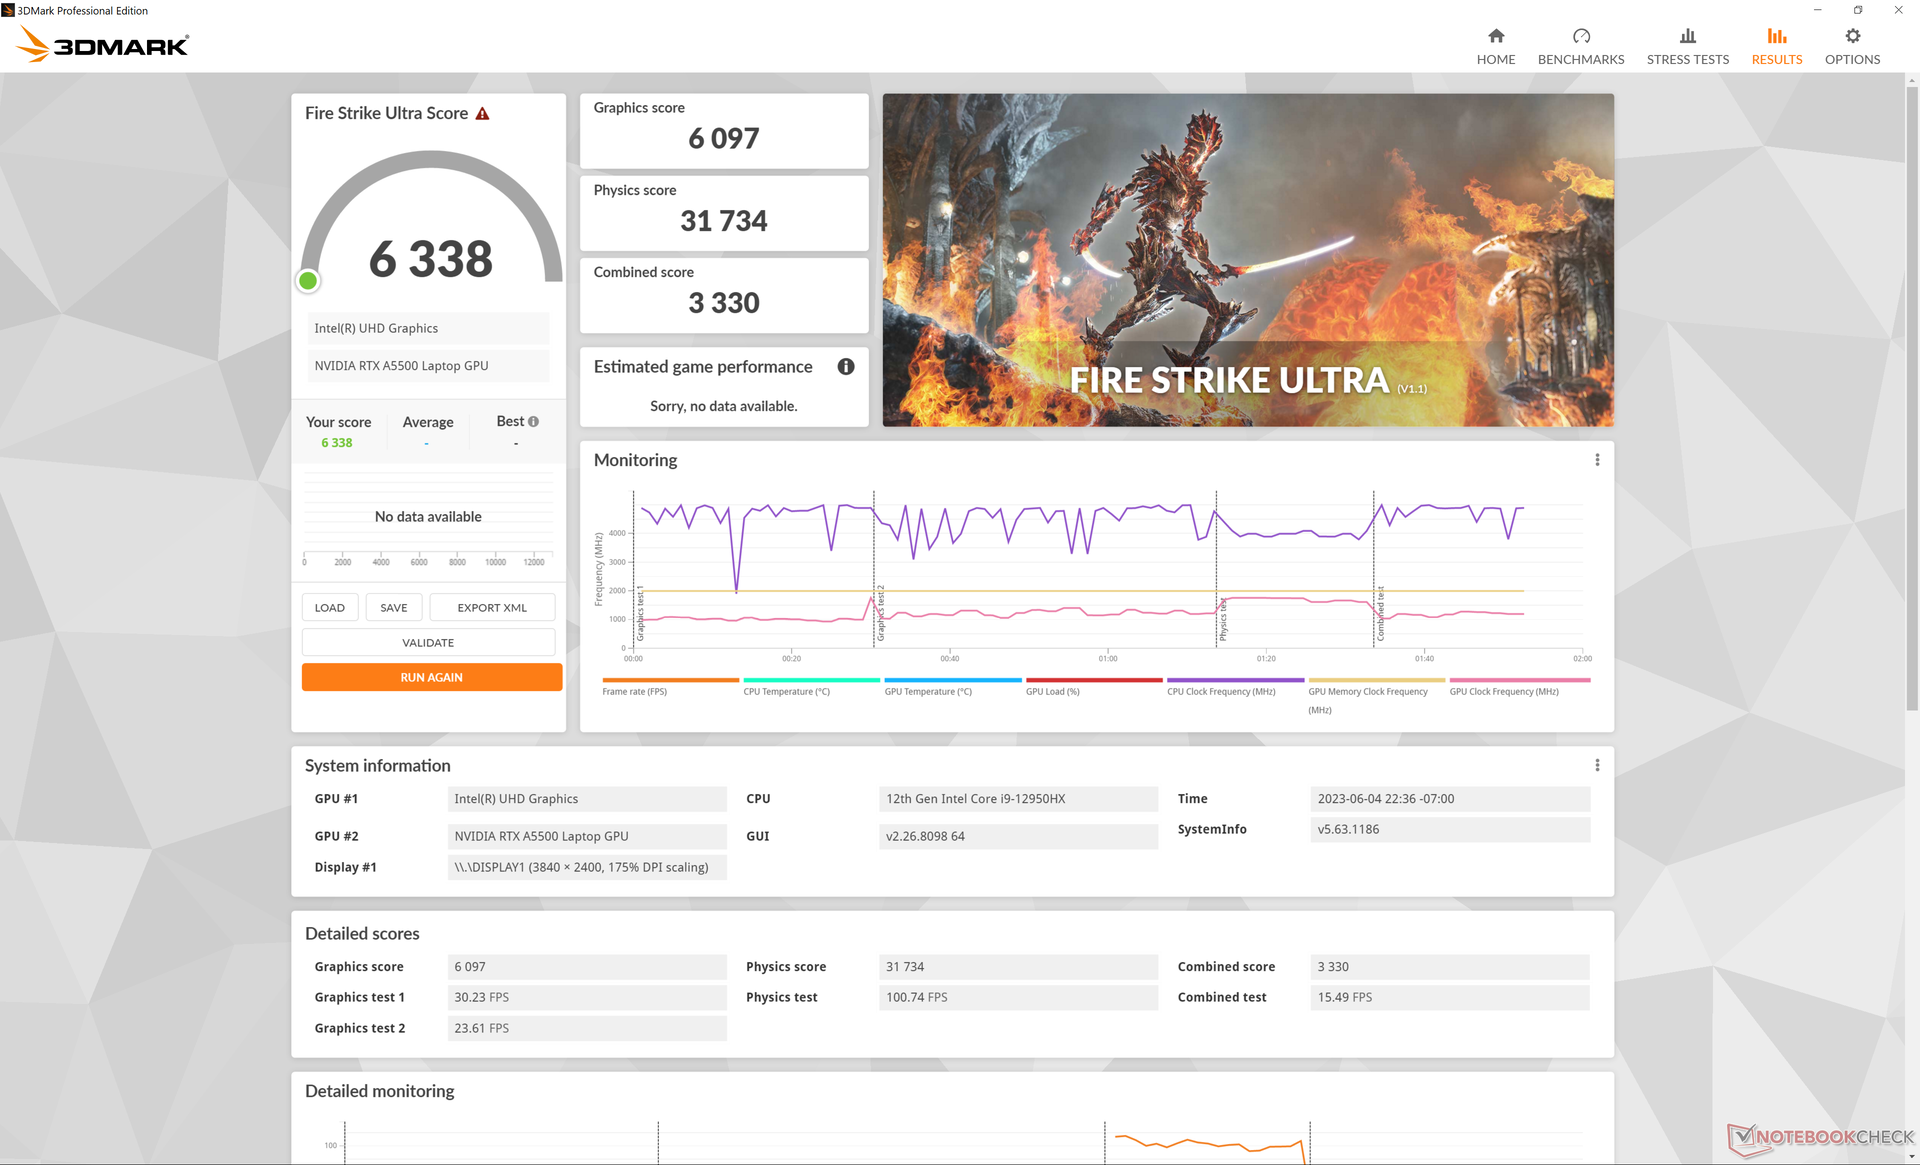
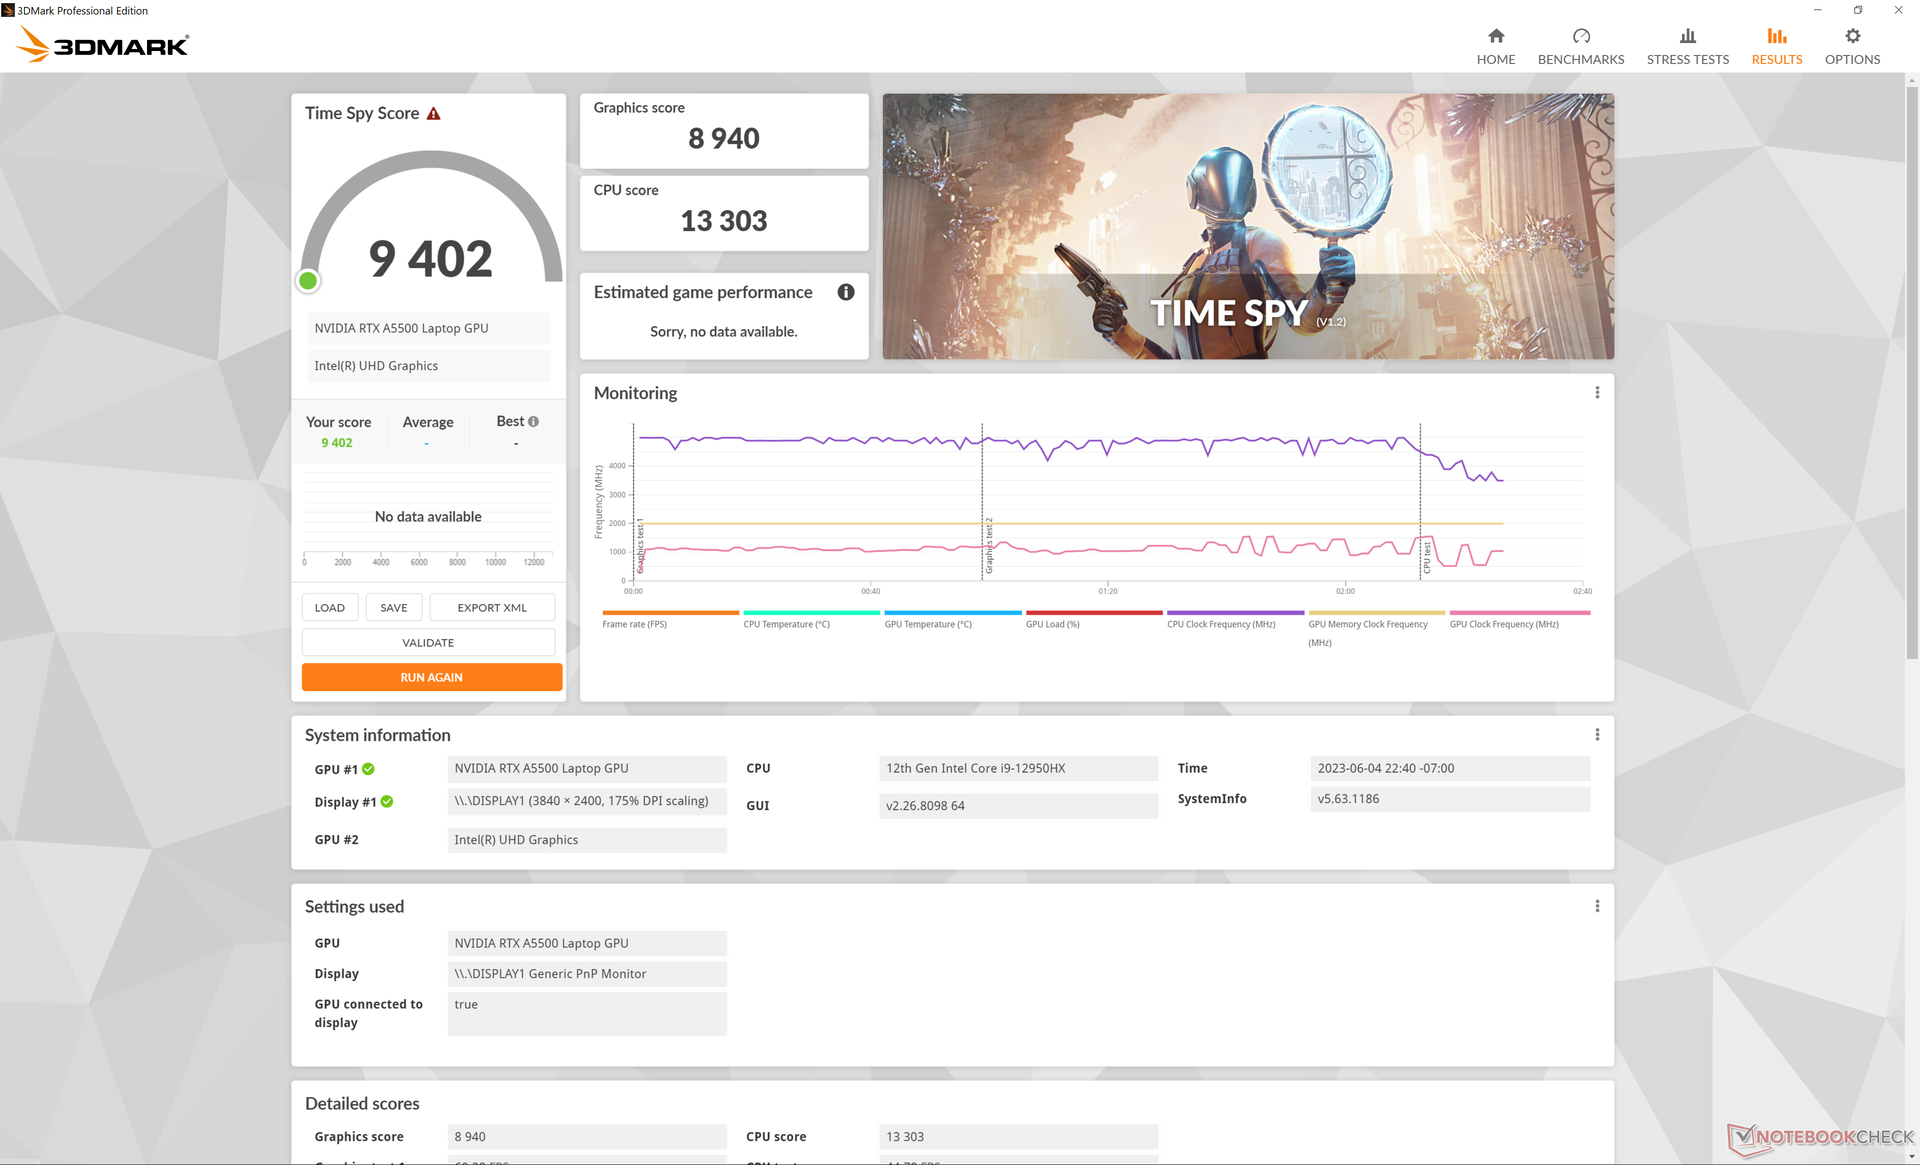
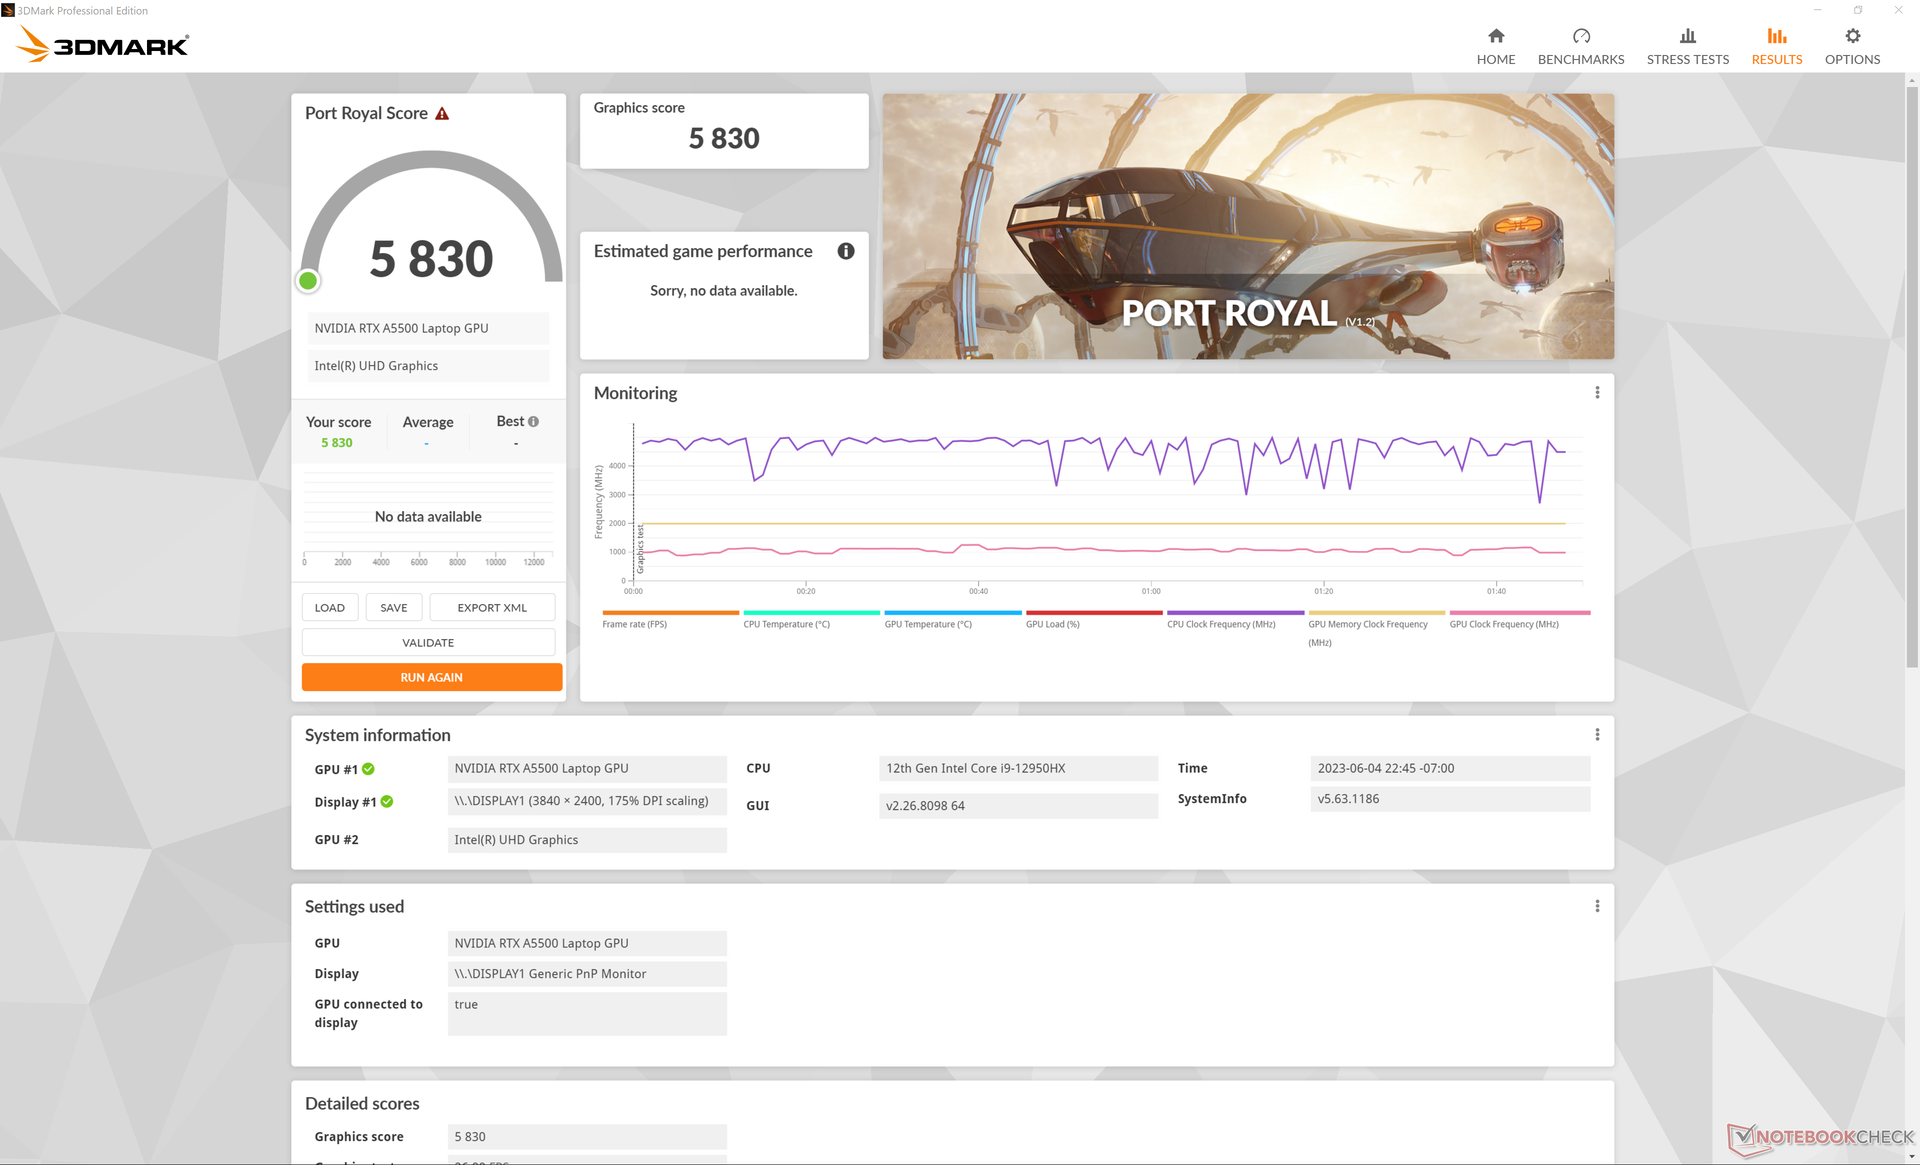
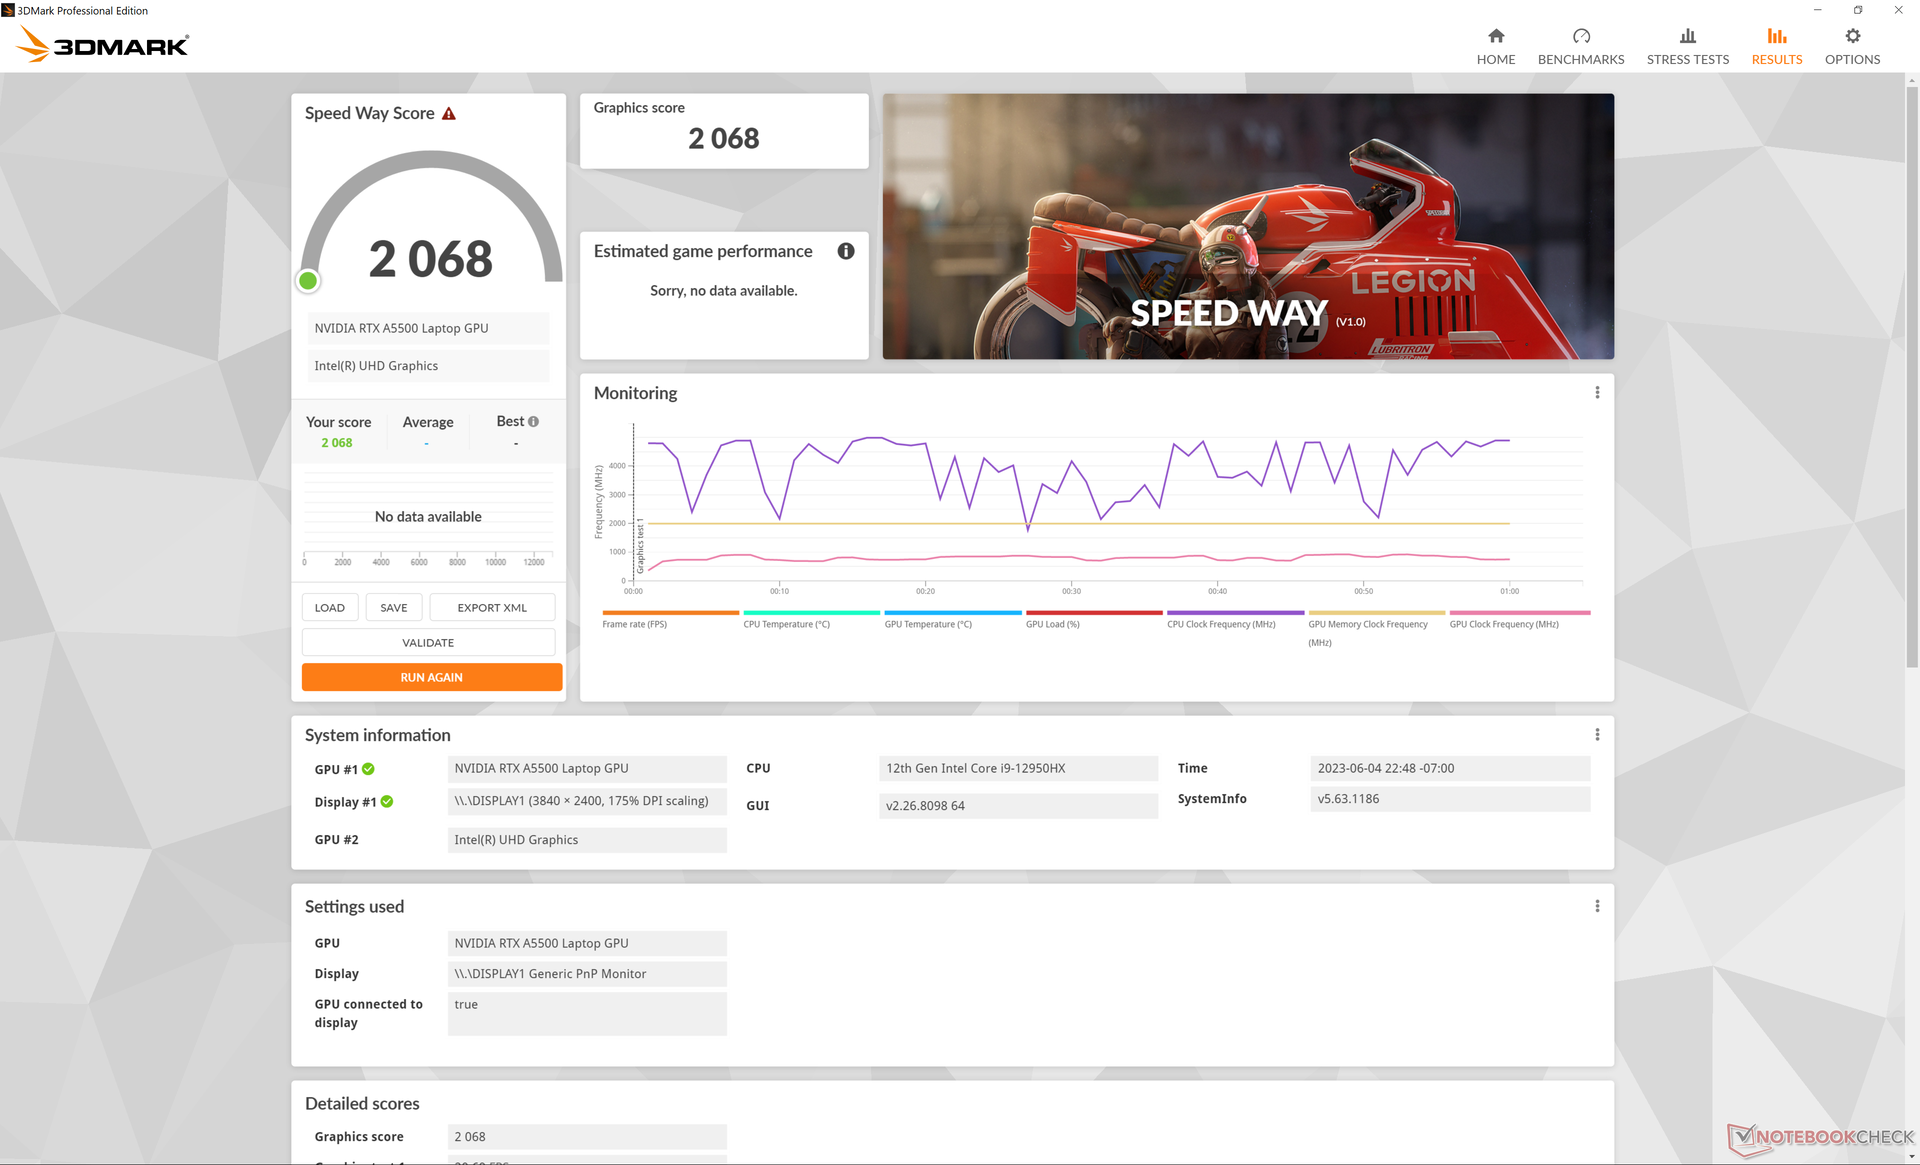
De RTX A5500 in onze HP streeft naar een TGP van 100 W vergeleken met 130 W en 135 W op de ThinkPad P16 G1 en Precision 7670respectievelijk. De grafische prestaties zouden dus iets langzamer moeten zijn op de HP, ook al gebruiken alle drie de systemen dezelfde RTX A5500 GPU. de resultaten van 3DMark en SpecViewPerf bevestigen dit, want onze HP ligt in sommige gevallen tot 15 procent achter op de modellen van Dell en Lenovo. Het is natuurlijk nog steeds een erg snel workstation, maar het is niet de snelste optie die er is.
Downgraden naar de RTX A3000 configuratie van onze topklasse RTX A5500 zal de grafische prestaties naar verwachting met 20 tot 30 procent verminderen.
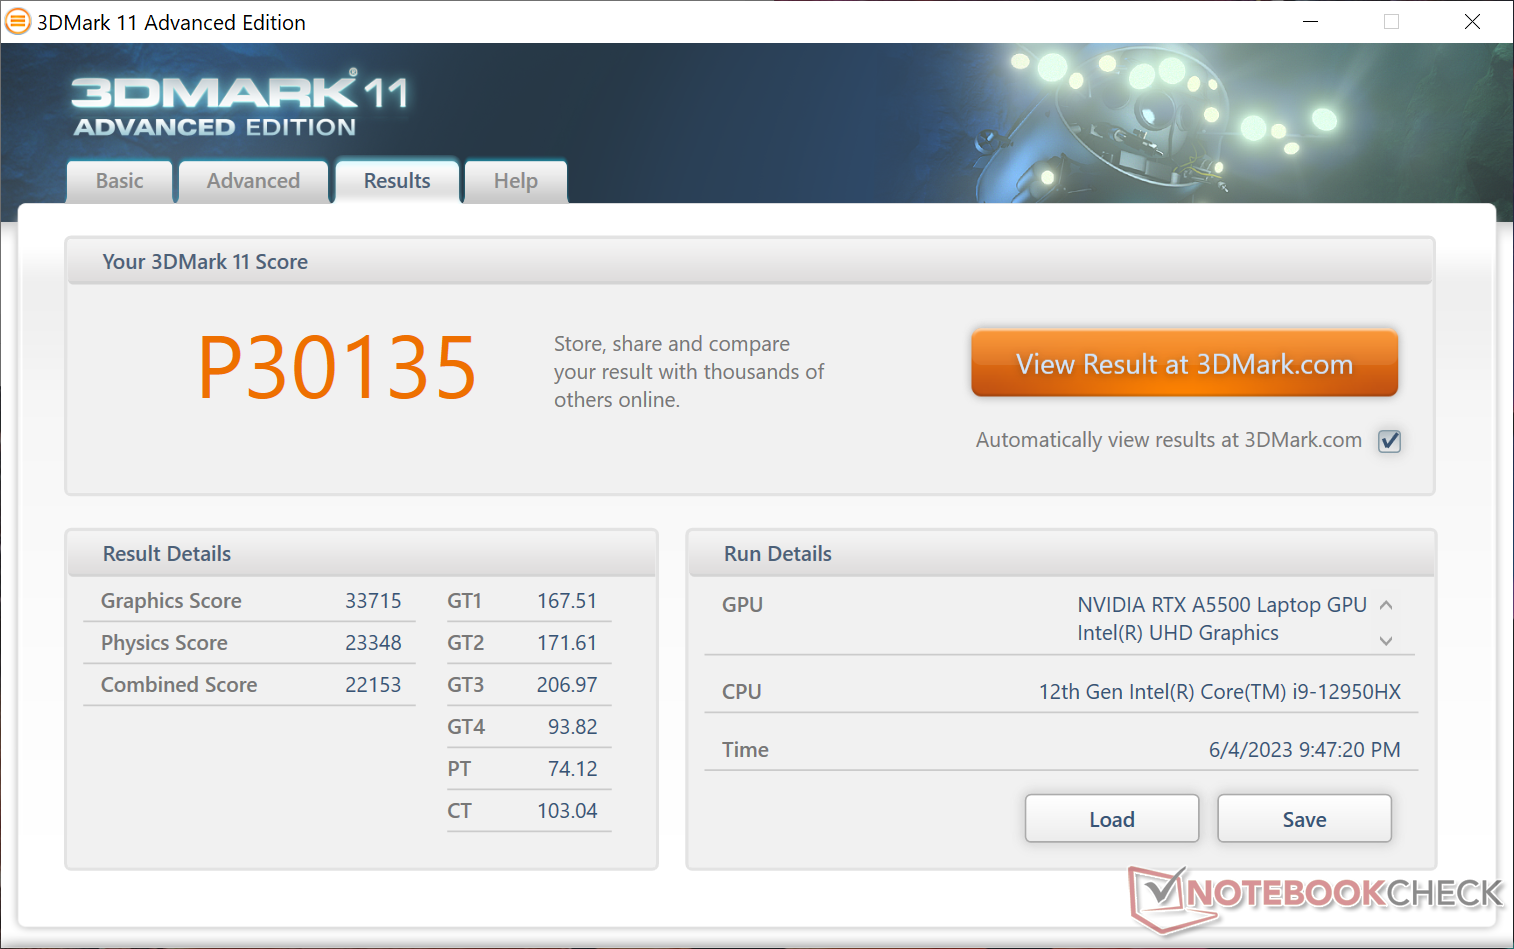
| 3DMark 11 Performance | 30135 punten | |
| 3DMark Fire Strike Score | 24046 punten | |
| 3DMark Time Spy Score | 9402 punten | |
Help | ||
* ... kleiner is beter
Spelprestaties
Hoewel het geen gaming GPU is, is de RTX A5500 meer dan geschikt om de nieuwste titels op hoge resoluties en instellingen te spelen. Gebruikers kunnen verwachten dat de gamingprestaties op hetzelfde niveau liggen als de mobiele GeForce RTX 4070.
| Tiny Tina's Wonderlands | |
| 1920x1080 Low Preset (DX12) | |
| Lenovo Legion Pro 5 16IRX8 | |
| HP ZBook Fury 16 G9 | |
| Gemiddeld NVIDIA RTX A5500 Laptop GPU (n=1) | |
| Dell XPS 17 9730 RTX 4070 | |
| 1920x1080 Medium Preset (DX12) | |
| Lenovo Legion Pro 5 16IRX8 | |
| HP ZBook Fury 16 G9 | |
| Gemiddeld NVIDIA RTX A5500 Laptop GPU (n=1) | |
| Dell XPS 17 9730 RTX 4070 | |
| 1920x1080 High Preset (DX12) | |
| Lenovo Legion Pro 5 16IRX8 | |
| HP ZBook Fury 16 G9 | |
| Gemiddeld NVIDIA RTX A5500 Laptop GPU (n=1) | |
| Dell XPS 17 9730 RTX 4070 | |
| 1920x1080 Badass Preset (DX12) | |
| Asus Zephyrus Duo 16 GX650PY-NM006W | |
| Lenovo Legion Pro 5 16IRX8 | |
| HP ZBook Fury 16 G9 | |
| Gemiddeld NVIDIA RTX A5500 Laptop GPU (n=1) | |
| Dell XPS 17 9730 RTX 4070 | |
| 2560x1440 Badass Preset (DX12) | |
| Asus Zephyrus Duo 16 GX650PY-NM006W | |
| Lenovo Legion Pro 5 16IRX8 | |
| HP ZBook Fury 16 G9 | |
| Gemiddeld NVIDIA RTX A5500 Laptop GPU (n=1) | |
| Dell XPS 17 9730 RTX 4070 | |
| 3840x2160 Badass Preset (DX12) | |
| Lenovo Legion Pro 5 16IRX8 | |
| HP ZBook Fury 16 G9 | |
| Gemiddeld NVIDIA RTX A5500 Laptop GPU (n=1) | |
| Dell XPS 17 9730 RTX 4070 | |
Witcher 3 FPS Chart
| lage | gem. | hoge | ultra | QHD | 4K | |
|---|---|---|---|---|---|---|
| GTA V (2015) | 185.4 | 182.7 | 170.7 | 118.5 | 97.5 | 97.1 |
| The Witcher 3 (2015) | 447 | 308.5 | 169.3 | 92.8 | 62.2 | |
| Dota 2 Reborn (2015) | 191.3 | 173.1 | 162.4 | 150.7 | 116.1 | |
| Final Fantasy XV Benchmark (2018) | 180.1 | 131.6 | 103.5 | 75.1 | 39.4 | |
| X-Plane 11.11 (2018) | 151.3 | 130.9 | 103.6 | 81.9 | ||
| Strange Brigade (2018) | 447 | 235 | 190.2 | 168.6 | 122 | 67.6 |
| Cyberpunk 2077 1.6 (2022) | 128.7 | 114.4 | 87.6 | 69.8 | 41.4 | 18.1 |
| Tiny Tina's Wonderlands (2022) | 193.7 | 158.6 | 109.5 | 87.5 | 57.9 | 29.6 |
| F1 22 (2022) | 224 | 209 | 170.2 | 60.9 | 37.2 | 17.6 |
| Returnal (2023) | 70 | 68 | 64 | 59 | 42 | 20 |
Uitstoot - Stil bij lage belasting
Systeemgeluid
Het geluid van de ventilator is stil als er weinig belasting is. Het schommelt tussen 29 dB(A) en 35 dB(A) tijdens lage tot gemiddelde belastingen, wat in de meeste kantooromgevingen net hoorbaar is.
Bij zwaardere belastingen, zoals games, kan het maximale ventilatorgeluid net onder de 50 dB(A) liggen, wat dicht in de buurt komt van wat we hebben gemeten op de ThinkPad P16 G1 of Precision 7670. Desalniettemin is deThinkPad P16 G1 in staat om stiller te blijven gedurende langere perioden. Bij het uitvoeren van 3DMark 06 bijvoorbeeld, bereikte het ventilatorgeluid op onze HP een piek van 36 dB(A) tegen het einde van de eerste benchmarkscène, vergeleken met slechts 29 dB(A) op de Lenovo.
Geluidsniveau
| Onbelast |
| 22.7 / 22.7 / 28.8 dB (A) |
| Belasting |
| 36.2 / 49.3 dB (A) |
 | ||
30 dB stil 40 dB(A) hoorbaar 50 dB(A) luid |
||
min: | ||
| HP ZBook Fury 16 G9 RTX A5500 Laptop GPU, i9-12950HX, Micron 3400 1TB MTFDKBA1T0TFH | HP ZBook Studio 16 G9 62U04EA RTX A2000 Laptop GPU, i7-12800H, Micron 3400 1TB MTFDKBA1T0TFH | HP ZBook Firefly 16 G9-6B897EA T550 Laptop GPU, i7-1265U, Samsung PM9A1 MZVL21T0HCLR | Lenovo ThinkPad P16 G1 RTX A5500 RTX A5500 Laptop GPU, i9-12950HX, WDC PC SN810 2TB | Dell Precision 7000 7670 Performance RTX A5500 Laptop GPU, i9-12950HX | MSI CreatorPro Z16P B12UKST RTX A3000 Laptop GPU, i7-12700H, Samsung PM9A1 MZVL21T0HCLR | |
|---|---|---|---|---|---|---|
| Noise | -4% | 4% | 4% | -9% | -6% | |
| uit / omgeving * (dB) | 22.6 | 24 -6% | 23.8 -5% | 23.1 -2% | 23.9 -6% | 24.1 -7% |
| Idle Minimum * (dB) | 22.7 | 24 -6% | 23.8 -5% | 23.1 -2% | 24 -6% | 27.1 -19% |
| Idle Average * (dB) | 22.7 | 27.7 -22% | 23.8 -5% | 23.1 -2% | 24 -6% | 27.1 -19% |
| Idle Maximum * (dB) | 28.8 | 27.7 4% | 23.8 17% | 23.1 20% | 38 -32% | 27.1 6% |
| Load Average * (dB) | 36.2 | 39.8 -10% | 39.4 -9% | 28.9 20% | 46.3 -28% | 42.9 -19% |
| Witcher 3 ultra * (dB) | 49.5 | 44.3 11% | 40.5 18% | 51.6 -4% | 41.9 15% | 44 11% |
| Load Maximum * (dB) | 49.3 | 47.7 3% | 41.4 16% | 51.4 -4% | 47.9 3% | 47 5% |
* ... kleiner is beter
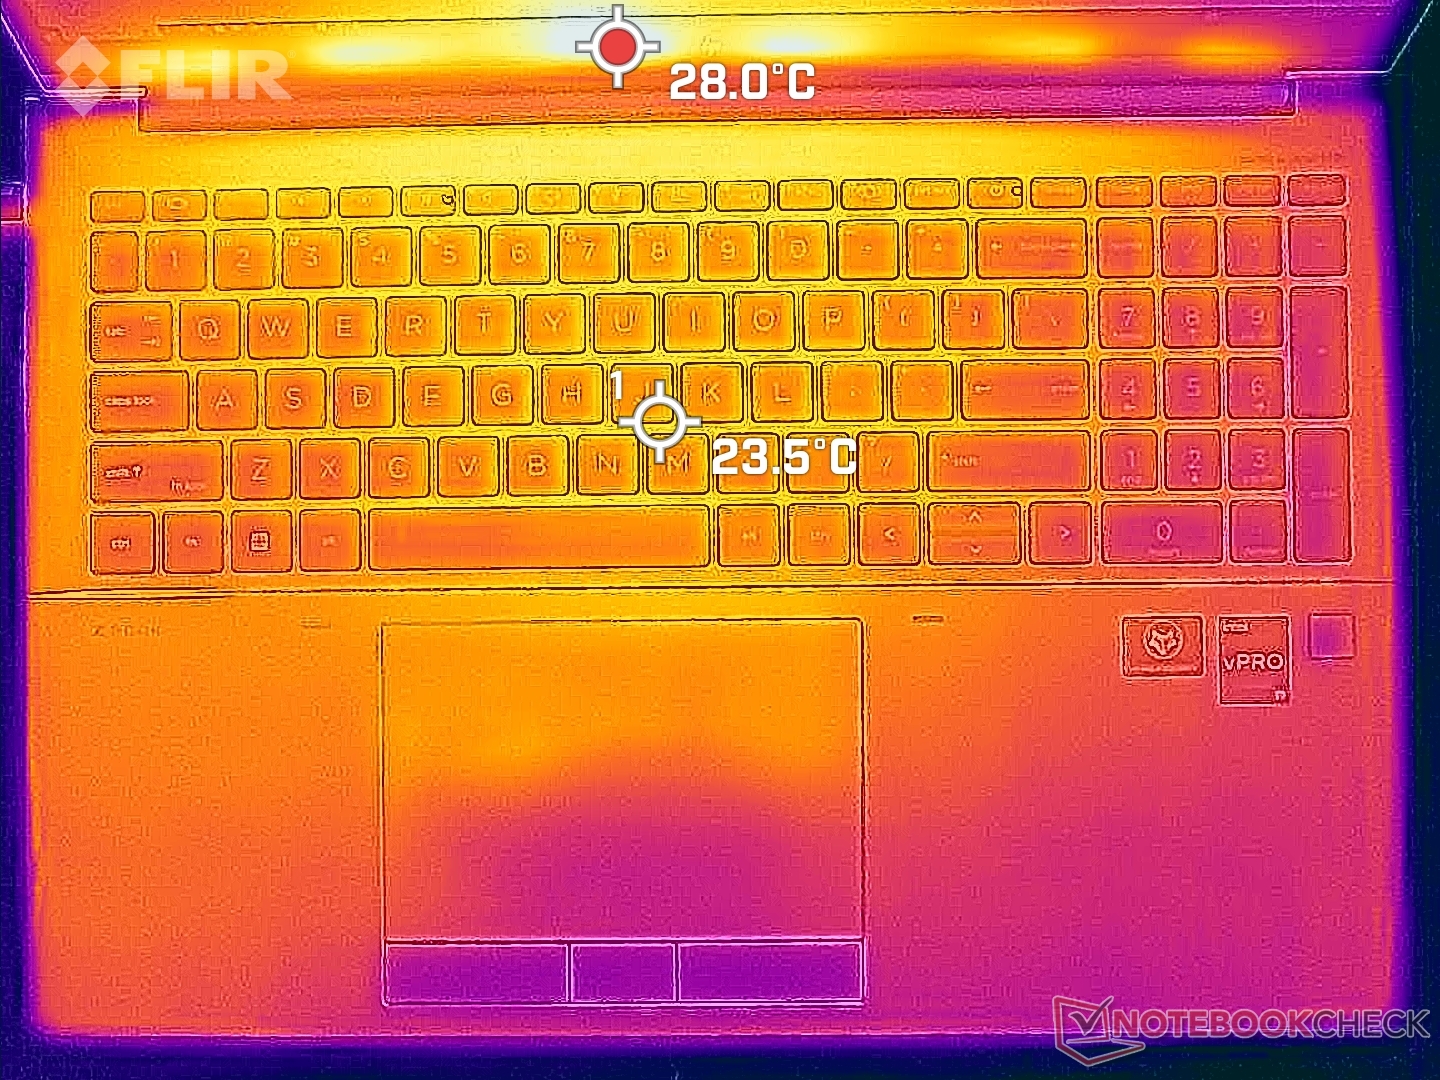
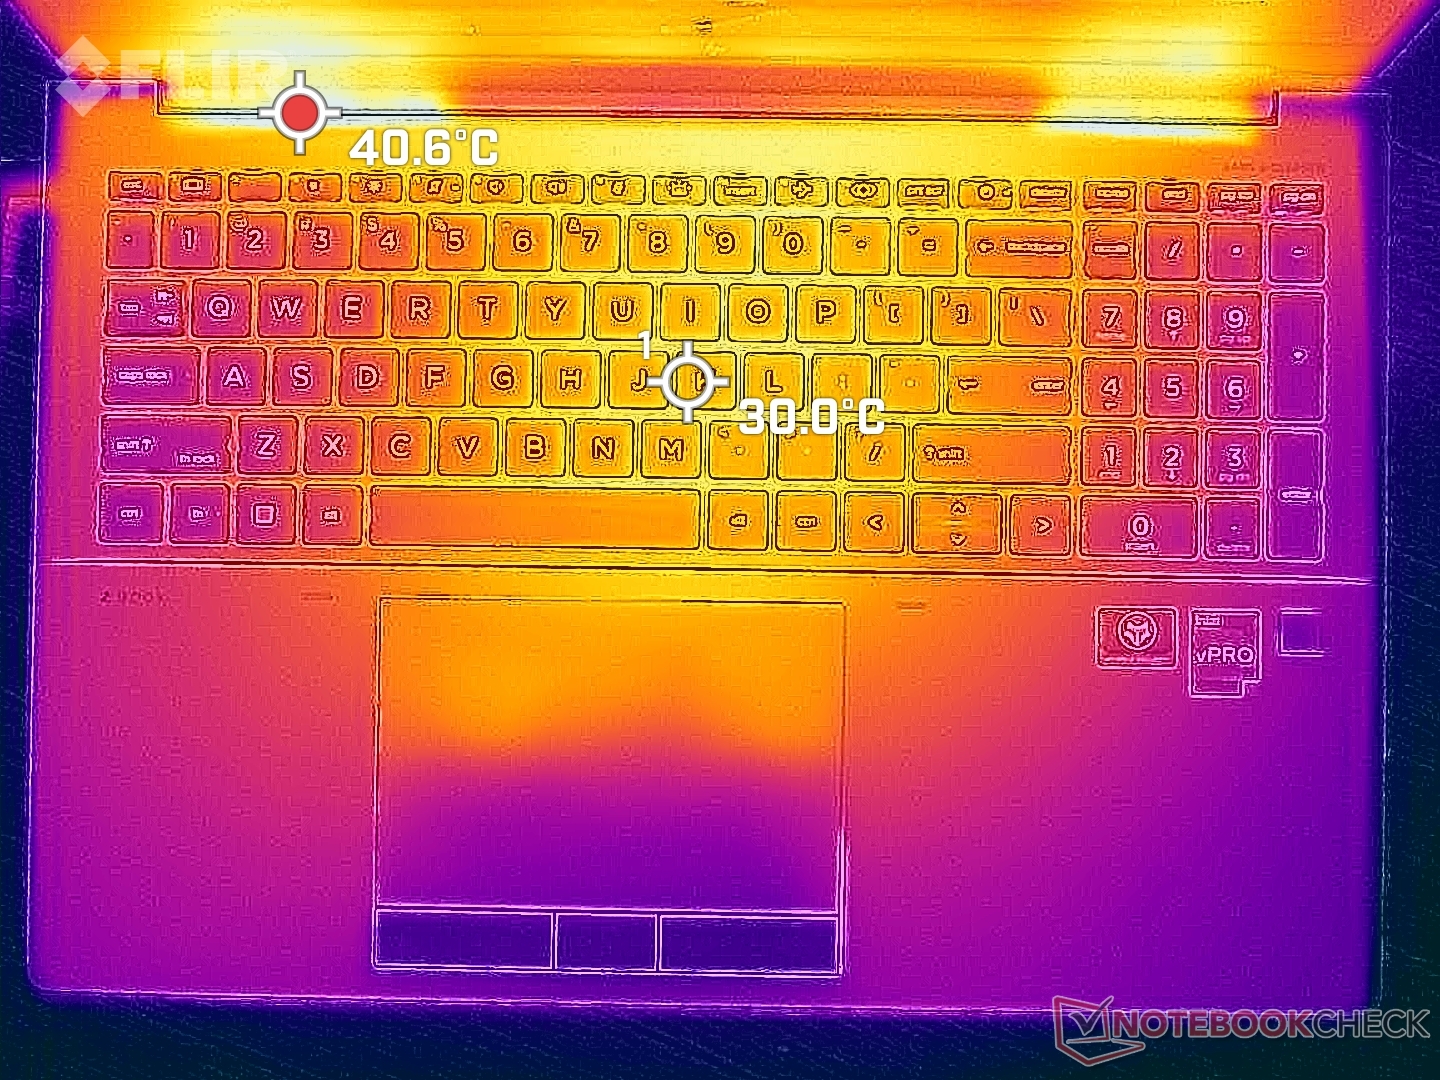
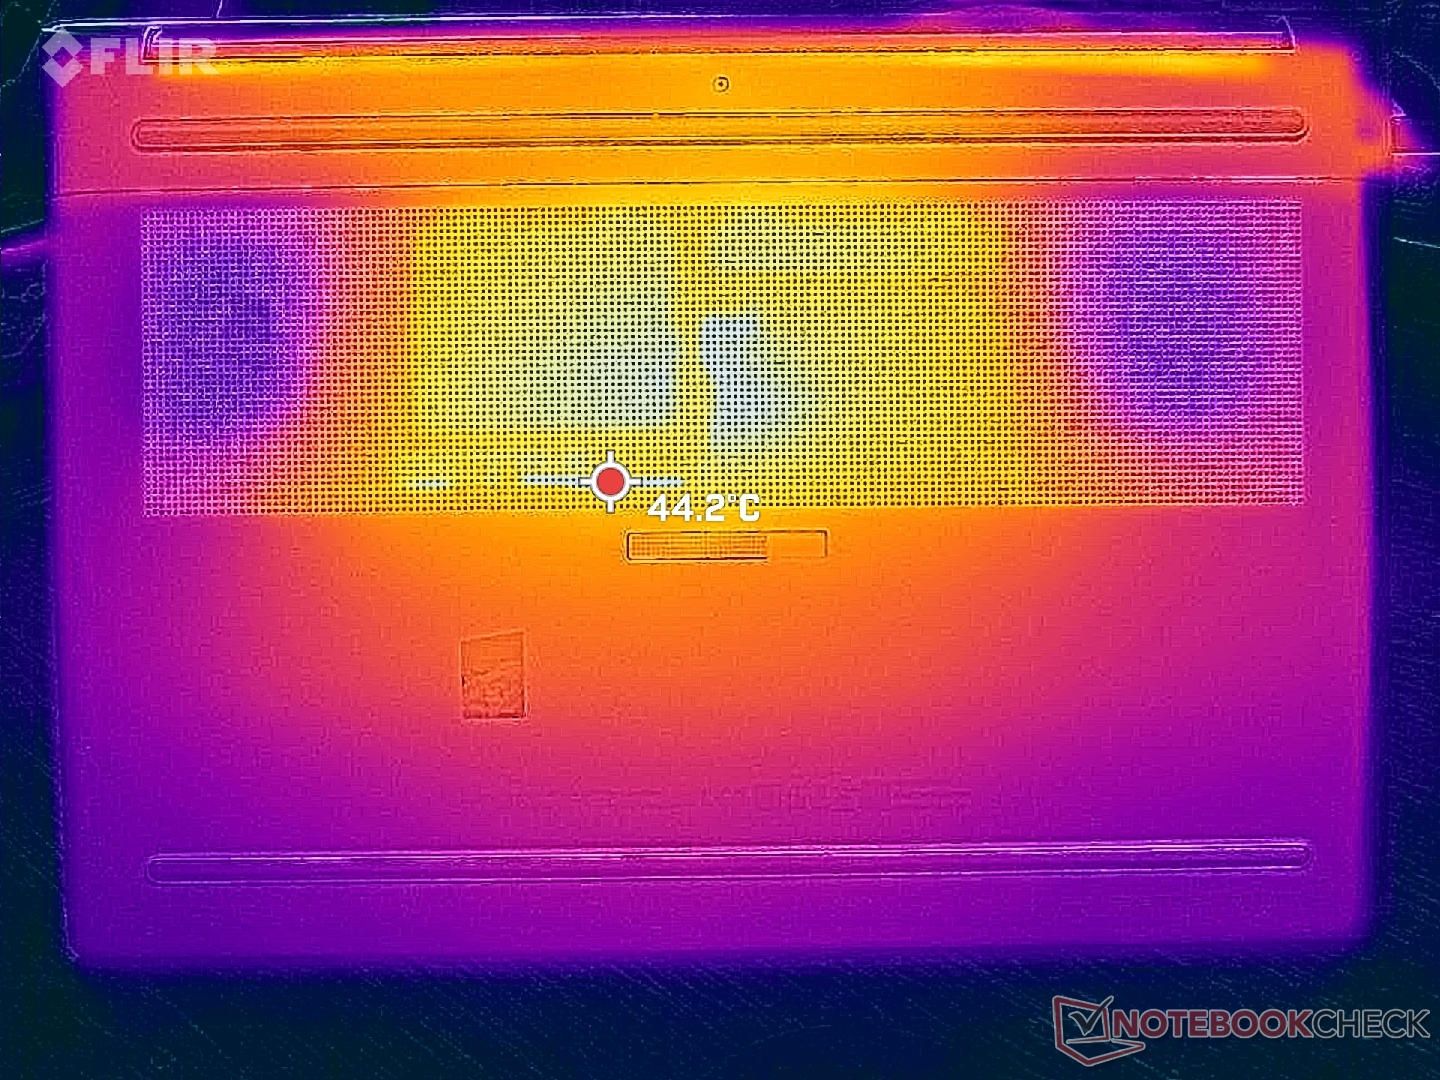
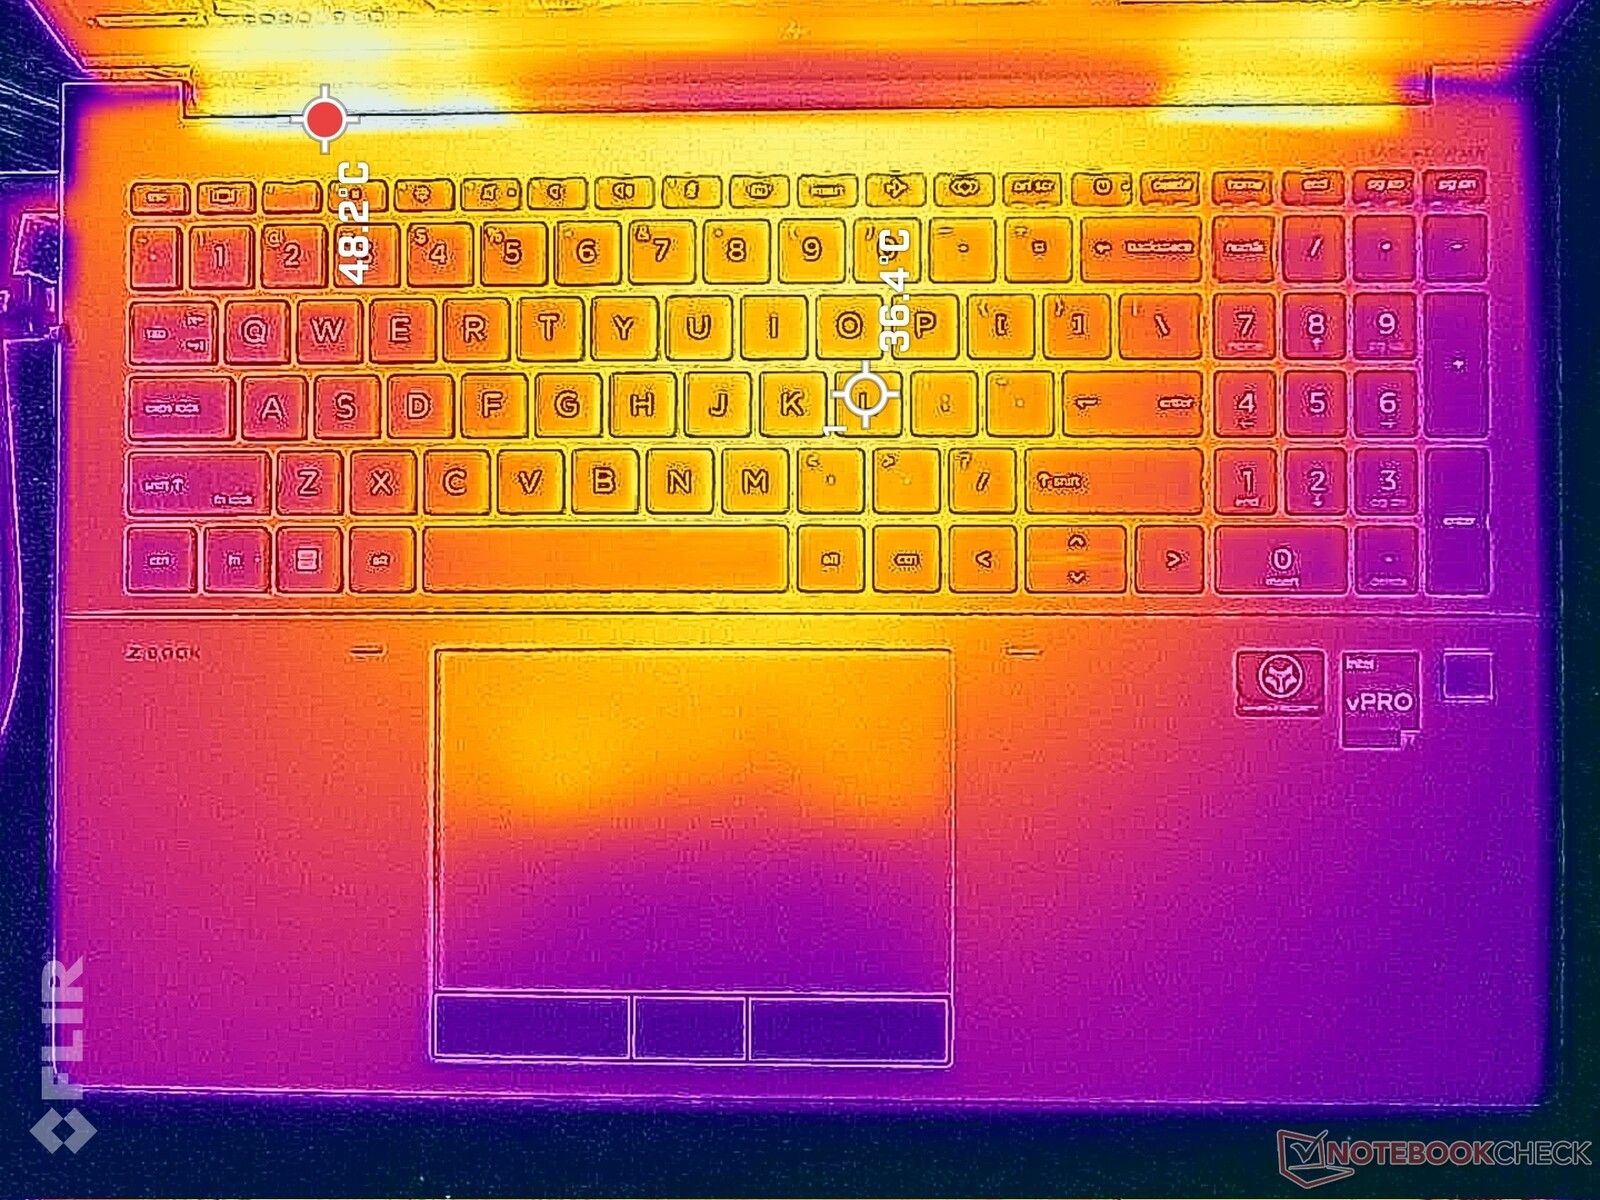
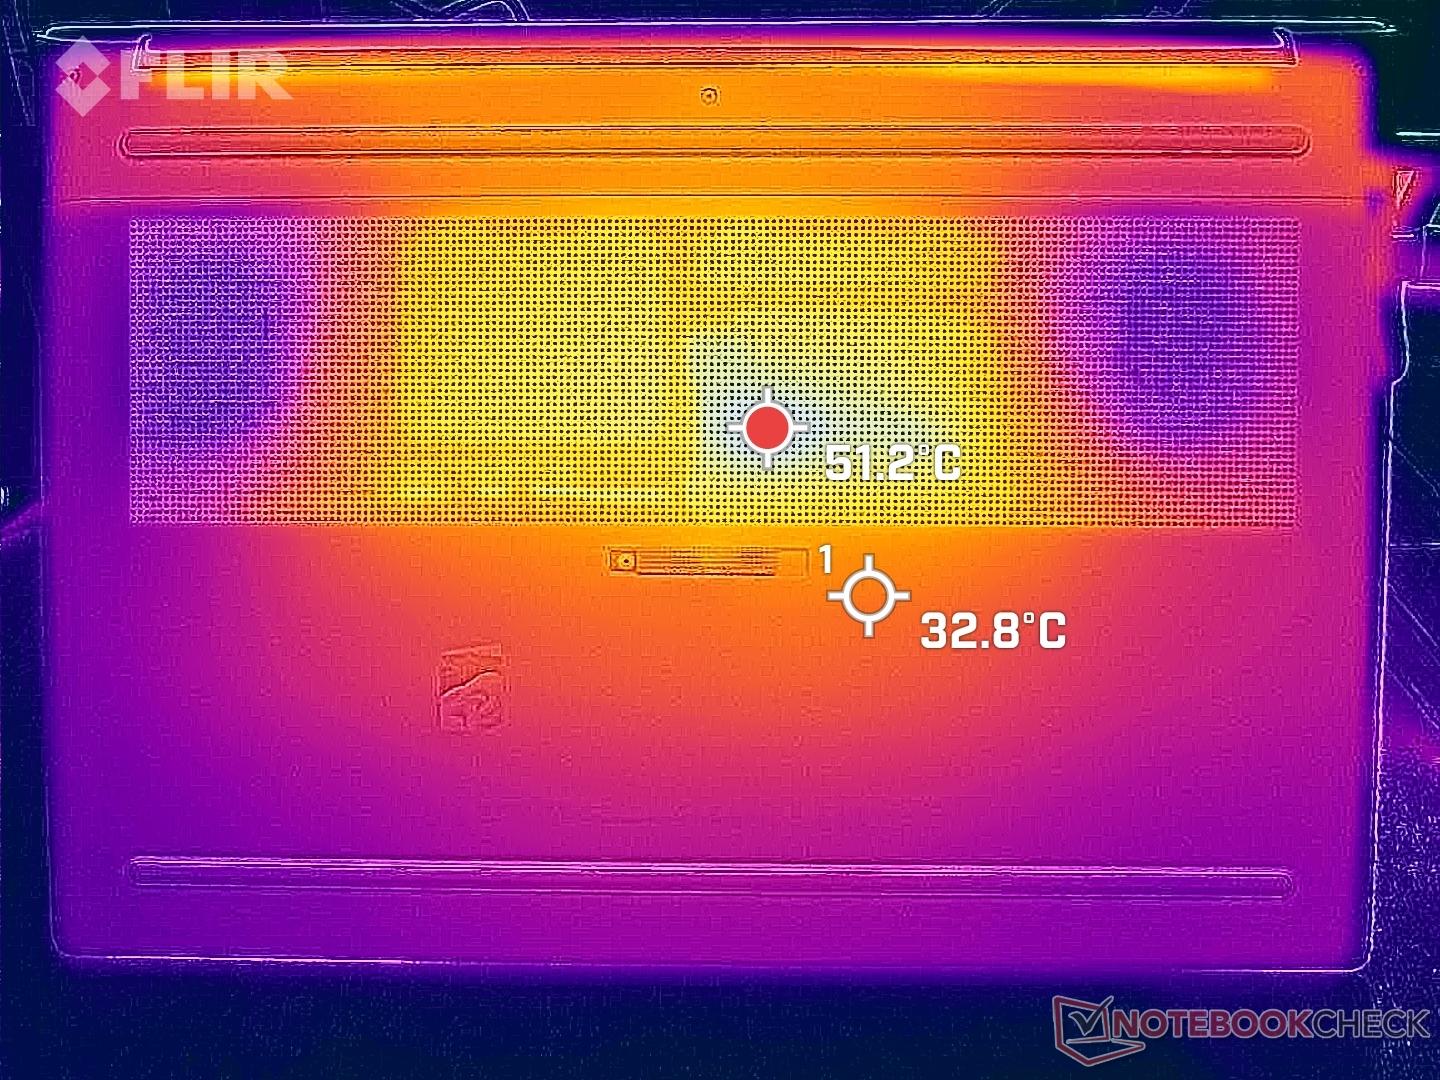
Temperatuur - Warme handpalmen onder belasting
De oppervlaktetemperaturen zijn warmer in het midden van het toetsenbord, waar ze kunnen oplopen tot meer dan 36 C bij extreme verwerkingsbelastingen. De temperatuurontwikkeling is symmetrischer dan op de Precision 7670 of ThinkPad P16, maar het touchpad en de palmsteunen kunnen warmer worden dan we zouden willen. Bij veeleisende belastingen kan het touchpad op de HP bijvoorbeeld meer dan 35 C bereiken, vergeleken met 30 C of lager op de eerder genoemde Lenovo en Dell alternatieven.
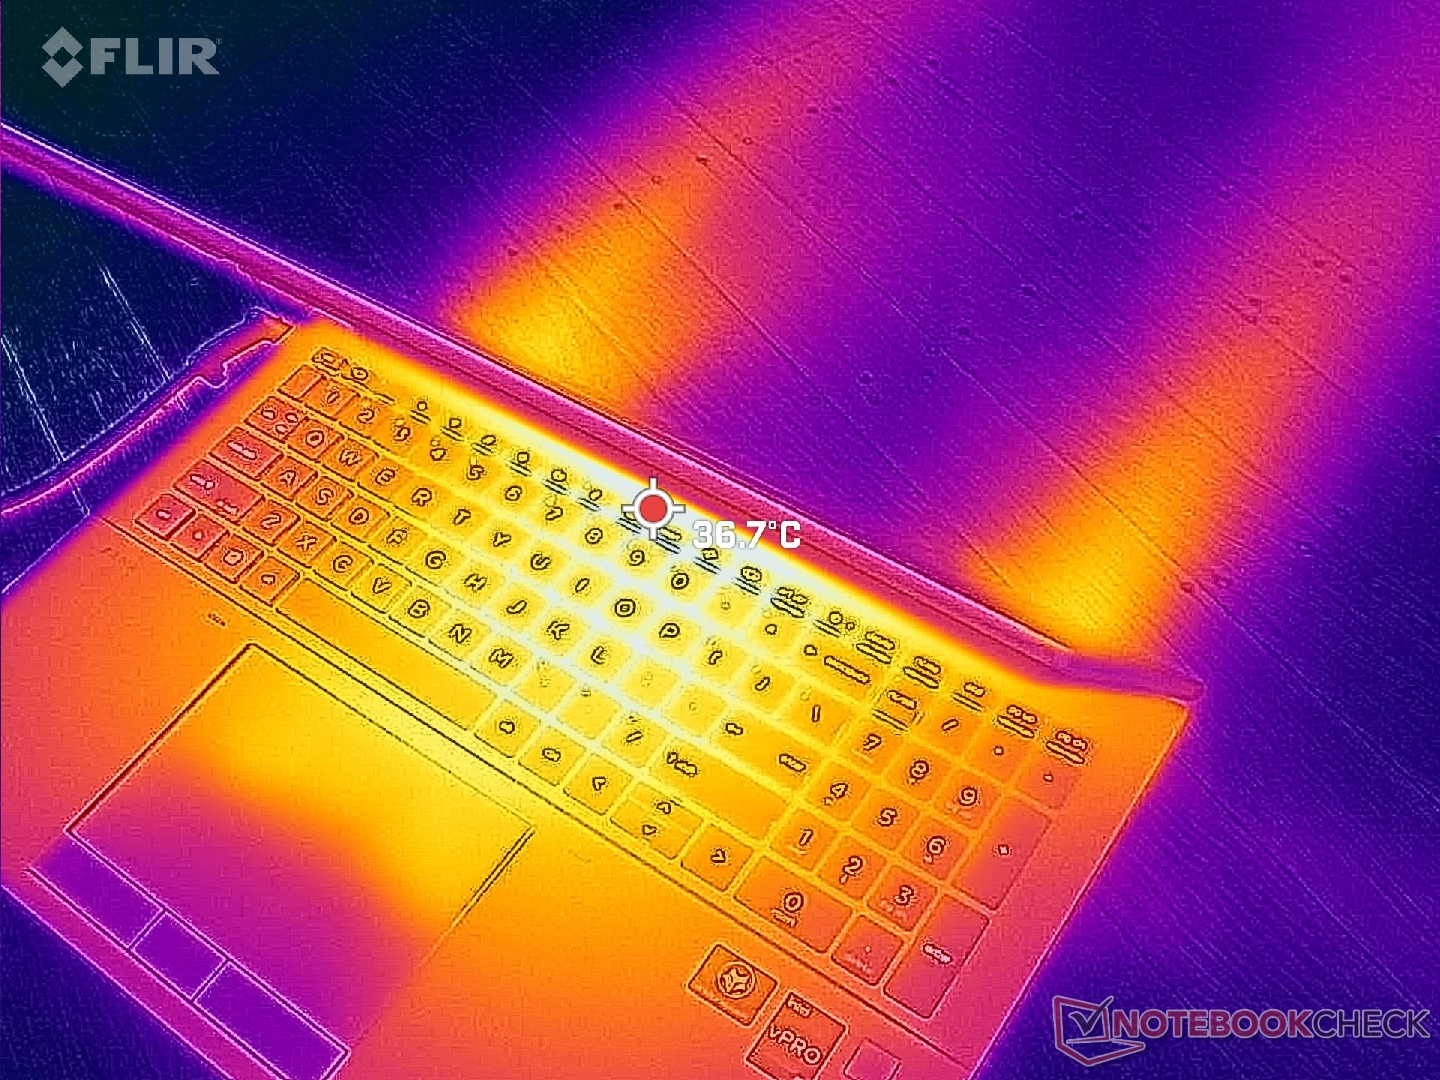
(±) De maximumtemperatuur aan de bovenzijde bedraagt 43.2 °C / 110 F, vergeleken met het gemiddelde van 38.2 °C / 101 F, variërend van 22.2 tot 69.8 °C voor de klasse Workstation.
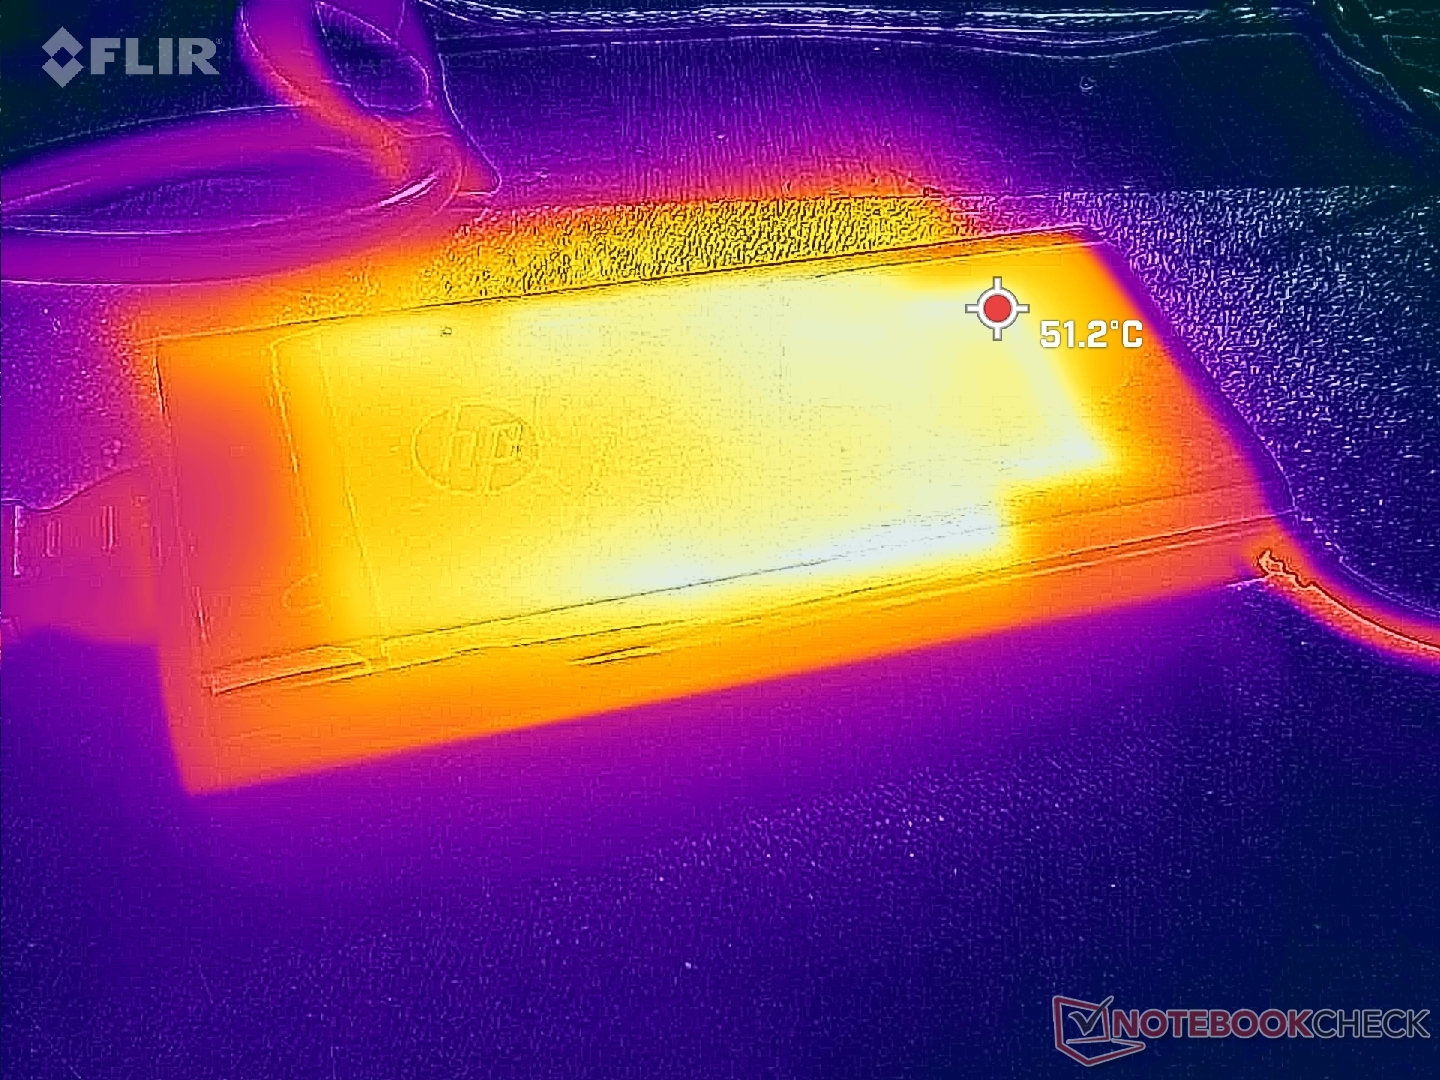
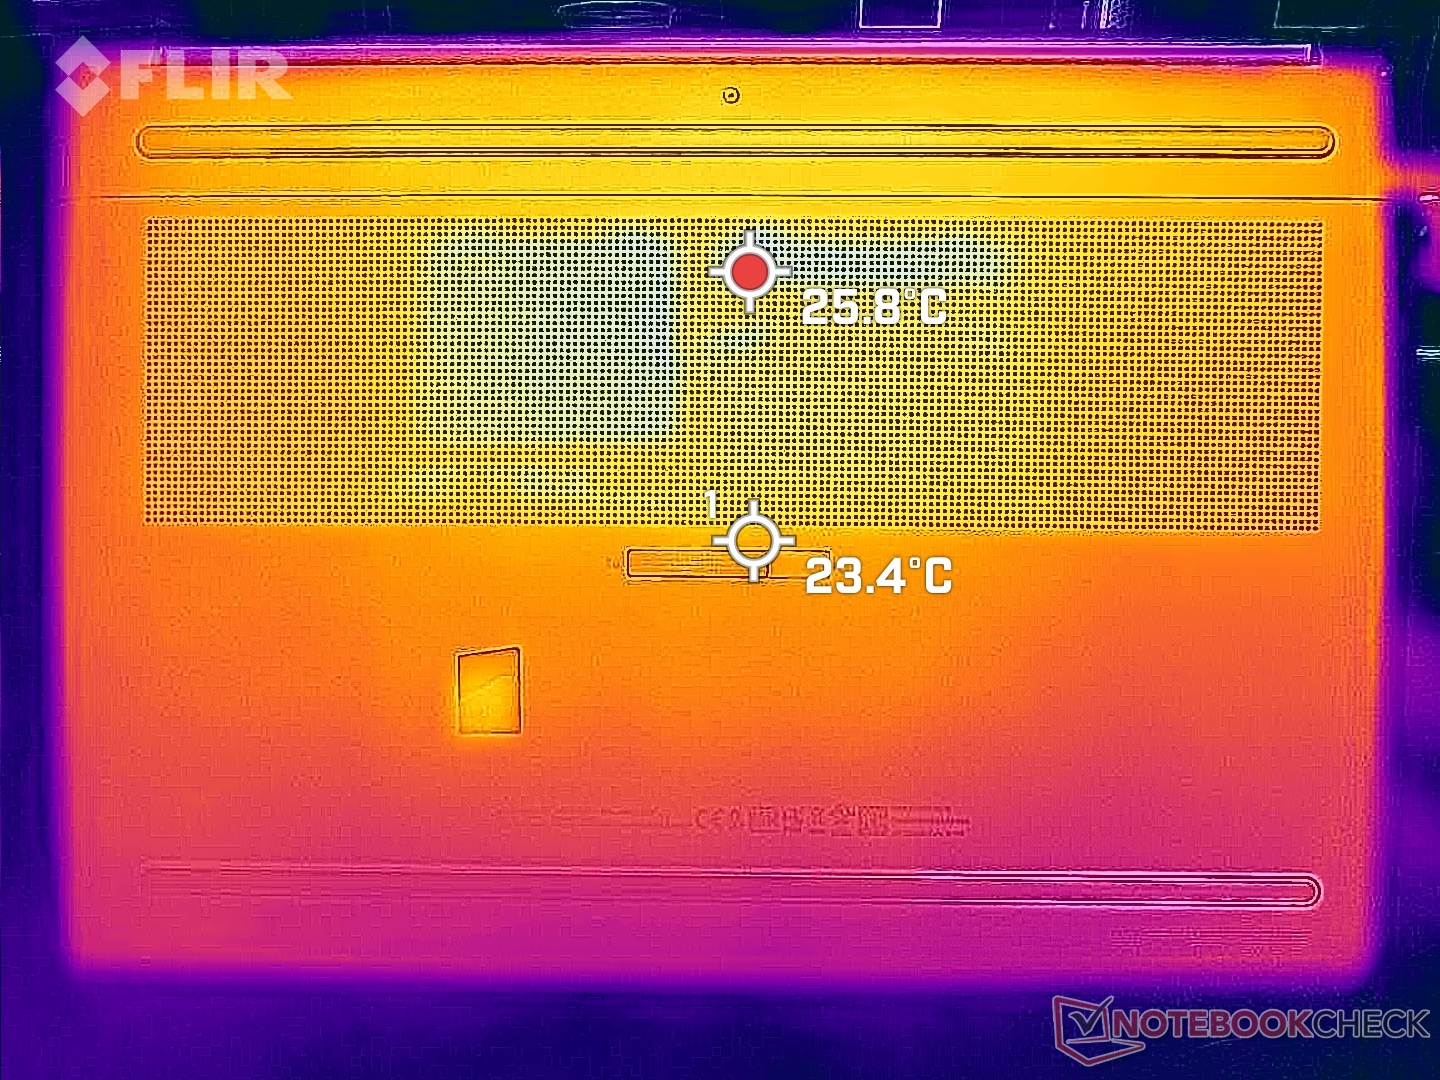
(-) De bodem warmt op tot een maximum van 50.4 °C / 123 F, vergeleken met een gemiddelde van 41.1 °C / 106 F
(+) Bij onbelast gebruik bedraagt de gemiddelde temperatuur voor de bovenzijde 27.1 °C / 81 F, vergeleken met het apparaatgemiddelde van 32 °C / 90 F.
(±) Bij het spelen van The Witcher 3 is de gemiddelde temperatuur voor de bovenzijde 34 °C / 93 F, vergeleken met het apparaatgemiddelde van 32 °C / 90 F.
(+) De handpalmsteunen en het touchpad bereiken maximaal de huidtemperatuur (35.6 °C / 96.1 F) en zijn dus niet heet.
(-) De gemiddelde temperatuur van de handpalmsteun van soortgelijke toestellen bedroeg 27.8 °C / 82 F (-7.8 °C / -14.1 F).
| HP ZBook Fury 16 G9 Intel Core i9-12950HX, NVIDIA RTX A5500 Laptop GPU | HP ZBook Studio 16 G9 62U04EA Intel Core i7-12800H, NVIDIA RTX A2000 Laptop GPU | HP ZBook Firefly 16 G9-6B897EA Intel Core i7-1265U, NVIDIA T550 Laptop GPU | Lenovo ThinkPad P16 G1 RTX A5500 Intel Core i9-12950HX, NVIDIA RTX A5500 Laptop GPU | Dell Precision 7000 7670 Performance Intel Core i9-12950HX, NVIDIA RTX A5500 Laptop GPU | MSI CreatorPro Z16P B12UKST Intel Core i7-12700H, NVIDIA RTX A3000 Laptop GPU | |
|---|---|---|---|---|---|---|
| Heat | -1% | -4% | -12% | -15% | -12% | |
| Maximum Upper Side * (°C) | 43.2 | 38.7 10% | 42.1 3% | 44.8 -4% | 53 -23% | 56.3 -30% |
| Maximum Bottom * (°C) | 50.4 | 53.4 -6% | 48 5% | 49.8 1% | 43.2 14% | 68.3 -36% |
| Idle Upper Side * (°C) | 28.6 | 27.3 5% | 29.9 -5% | 30.6 -7% | 36.8 -29% | 25.2 12% |
| Idle Bottom * (°C) | 28.2 | 31.6 -12% | 32.9 -17% | 38.6 -37% | 33.8 -20% | 25.9 8% |
* ... kleiner is beter
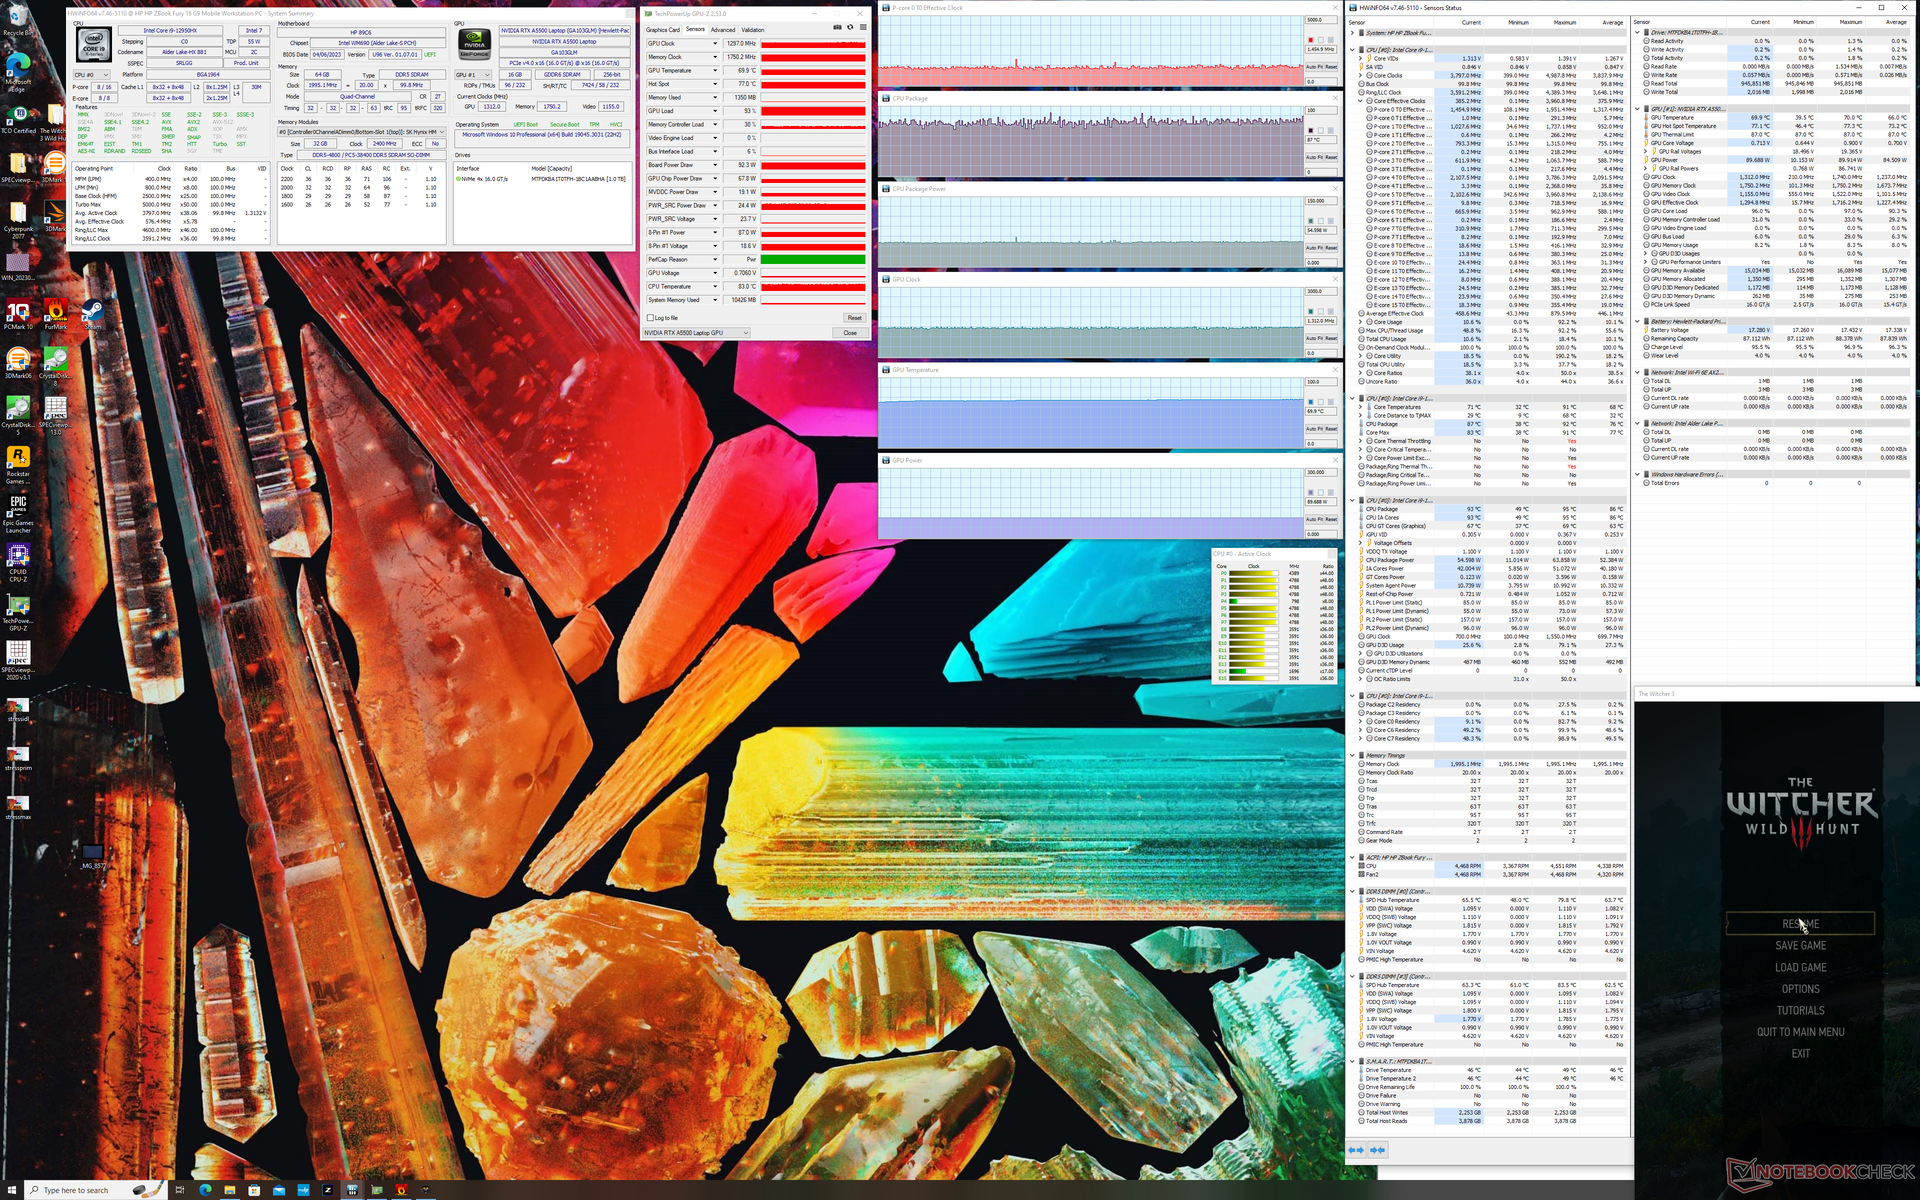
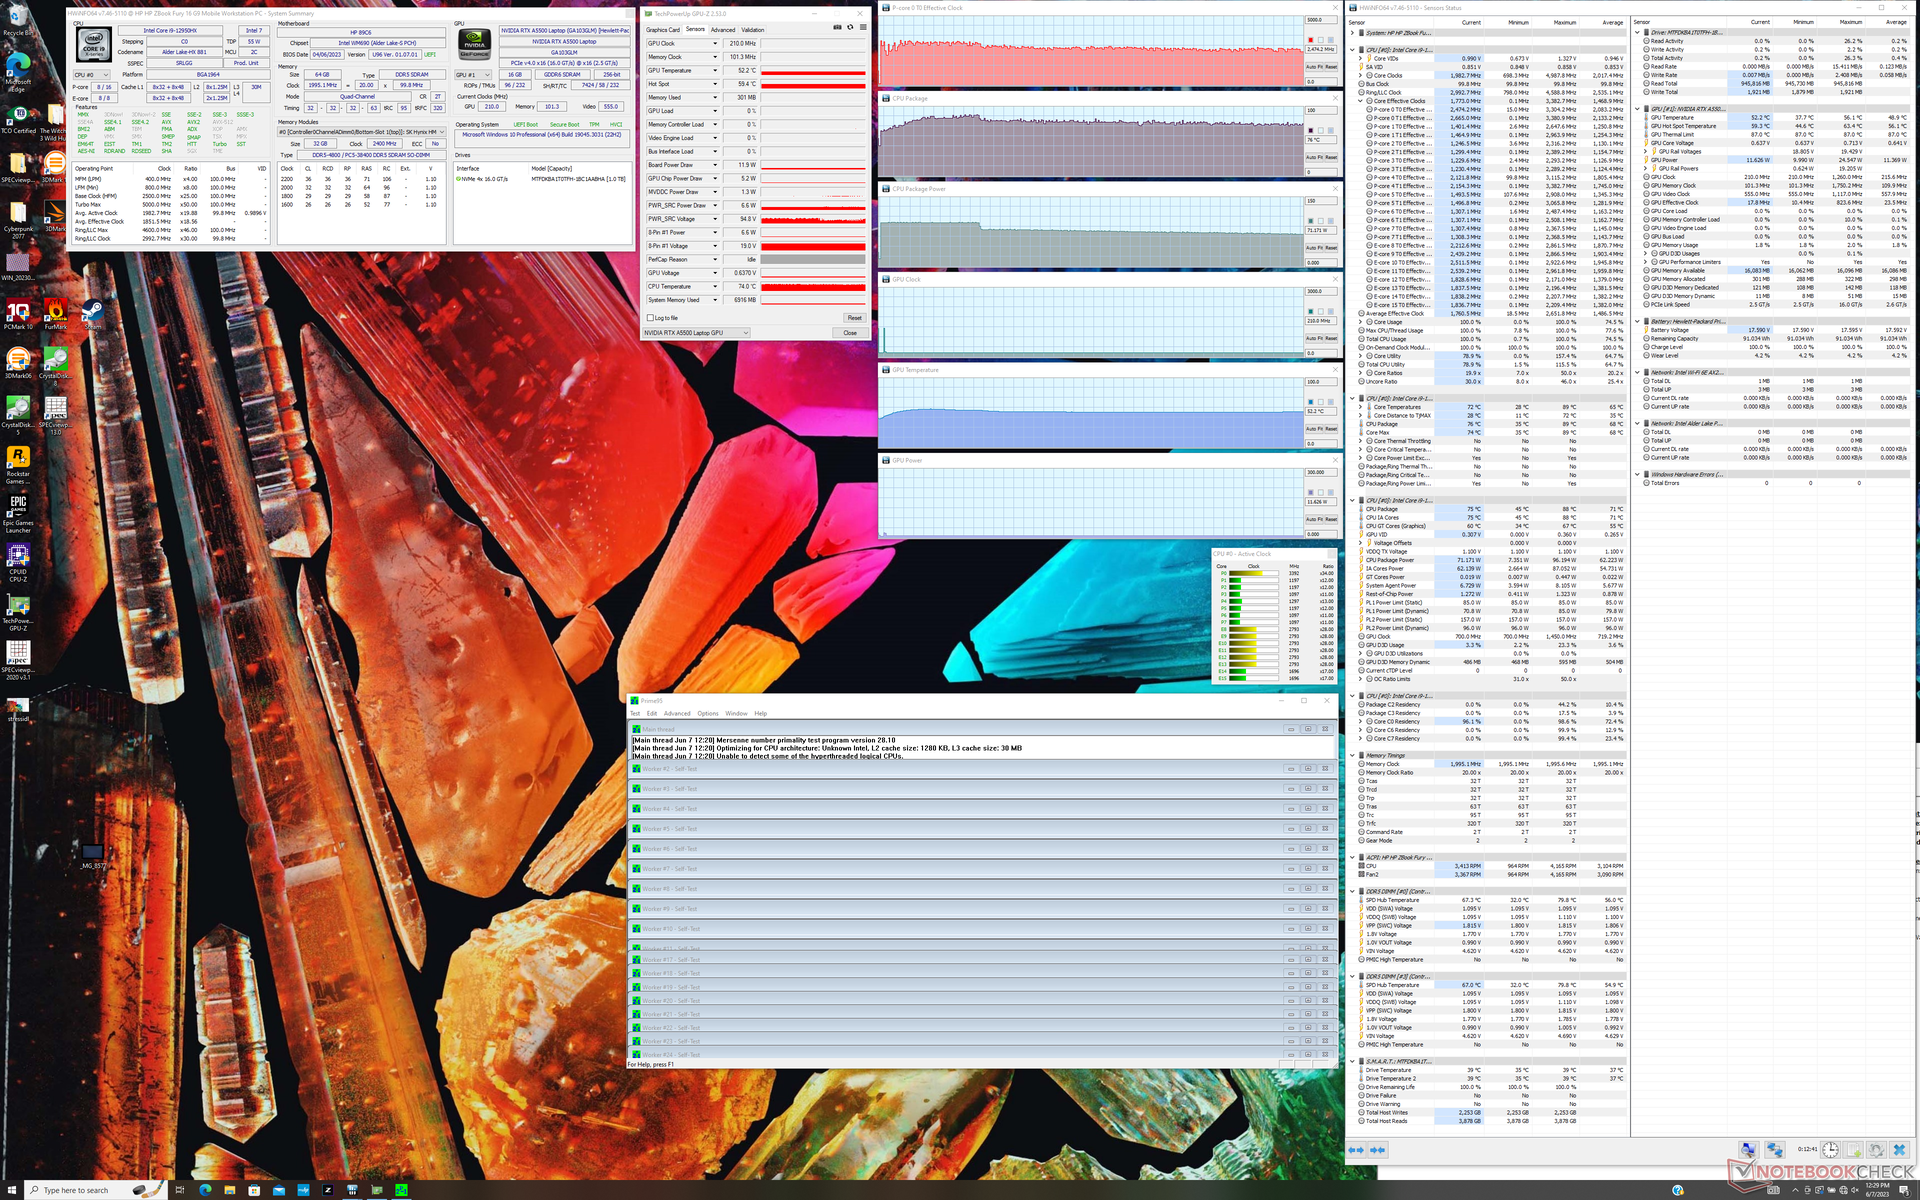
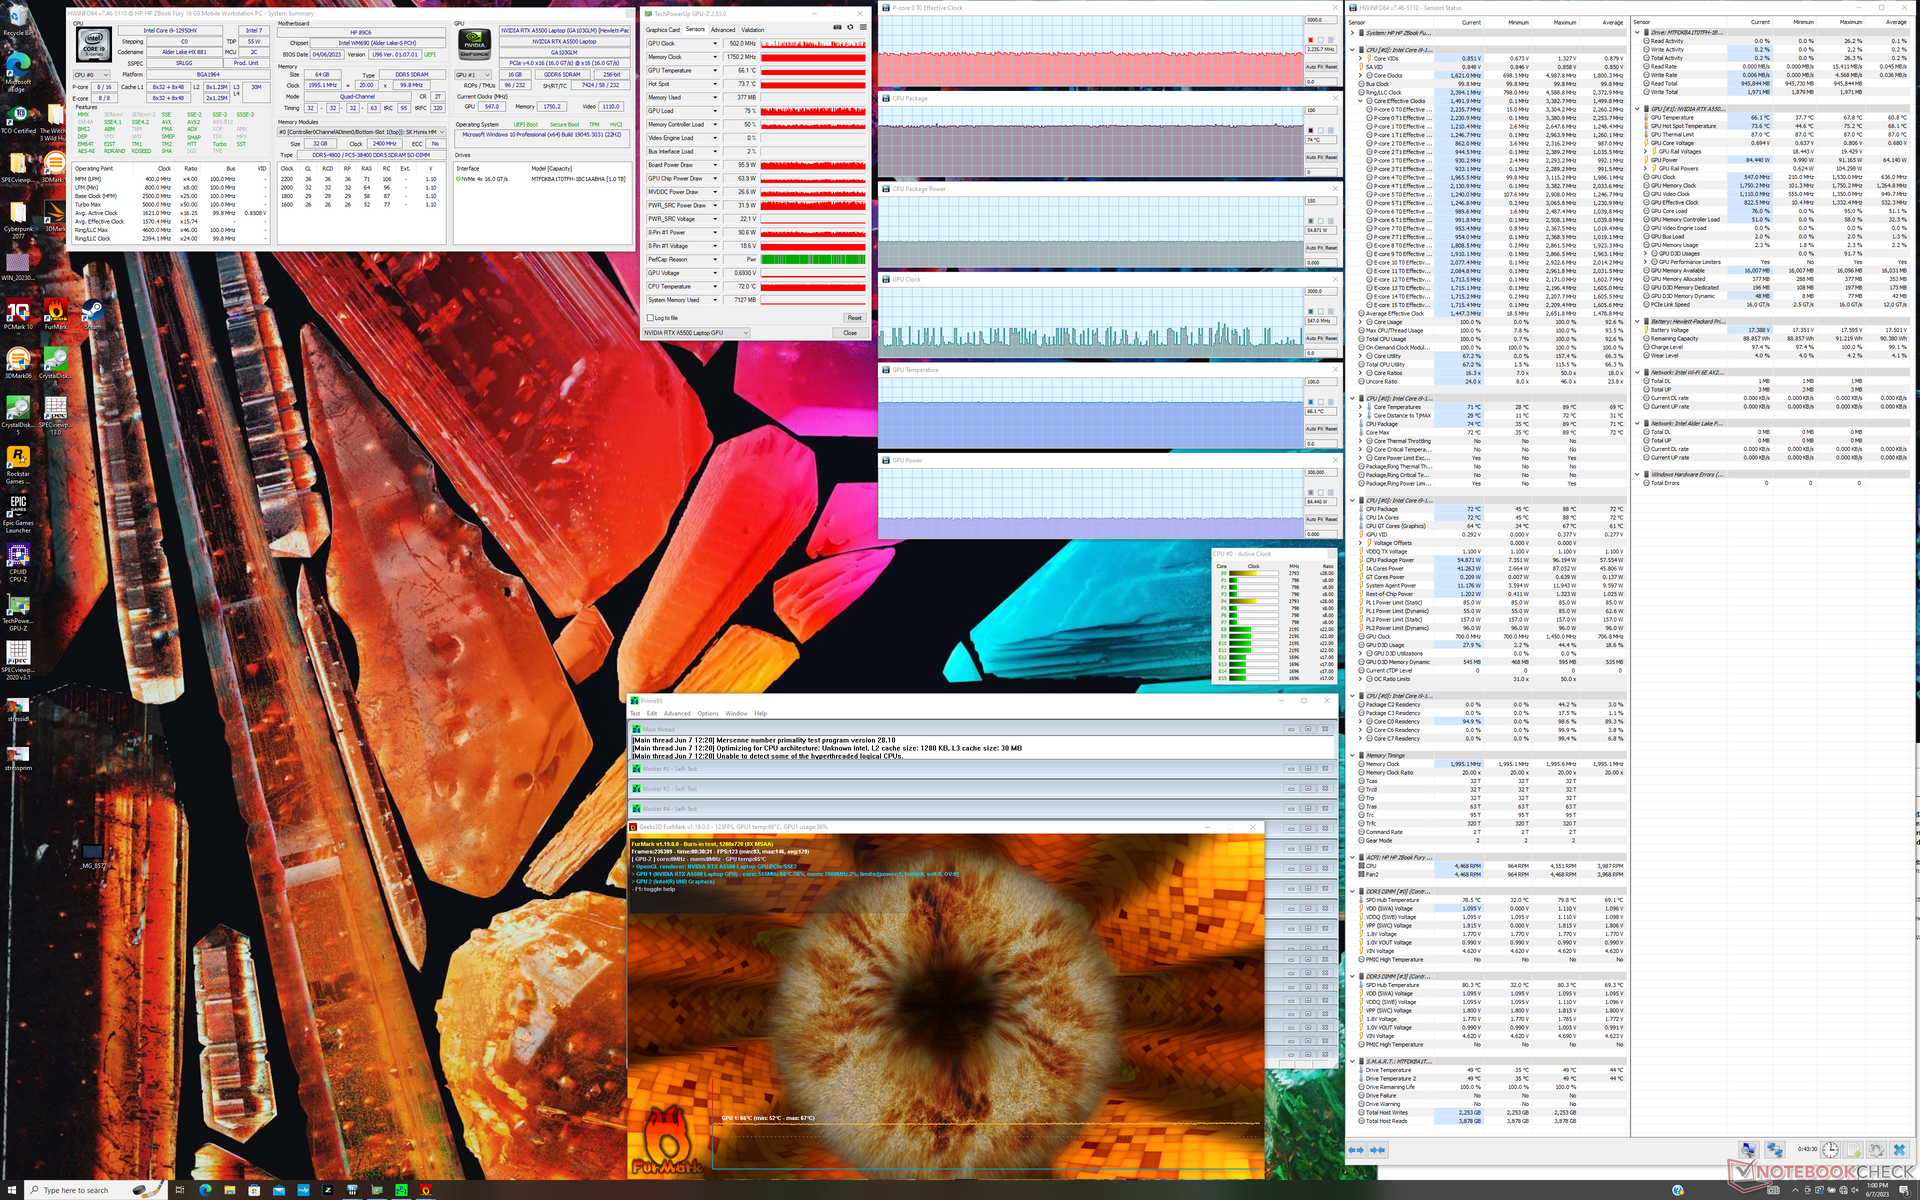
Stresstest
Bij het uitvoeren van Prime95 om de CPU te belasten, piekten de kloksnelheden en stroomopname op het bord naar respectievelijk 3,1 GHz en 96 W, wat slechts een paar minuten duurde of totdat de kerntemperatuur 89 C bereikte. Daarna daalde de CPU verder voordat hij zich stabiliseerde op 2,4 GHz, 76 C en 71 W. Deze test herhalen op de ThinkPad P16 G1 met exact dezelfde Core i9-12950HX CPU zou resulteren in een hogere stabiele kloksnelheid (3,0 GHz) en opgenomen vermogen (81 W) ten koste van een veel hogere kerntemperatuur (100 C). HP stelt zich in dit opzicht terughoudender op, wat overeenkomt met onze CineBench resultaten hierboven.
Het draaien van Witcher 3 om een hoge grafische belasting weer te geven, resulteert in een stabiele GPU kloksnelheid, temperatuur en stroomverbruik van respectievelijk 1297 MHz, 70 C en 92 W. Het herhalen van deze test op de ThinkPad P16 G1 zou resulteren in hogere stabiele waarden over de hele linie van 1477 MHz, 78 C en 129 W. De GPU-geheugenklok zou ook hoger zijn op de ThinkPad.
Werken op batterijvoeding beperkt de prestaties, zelfs in het profiel Prestaties. Een Fire Strike test op batterijen zou Physics en Graphics scores opleveren van respectievelijk 22837 en 5625 punten, vergeleken met 30270 en 25713 punten op netstroom.
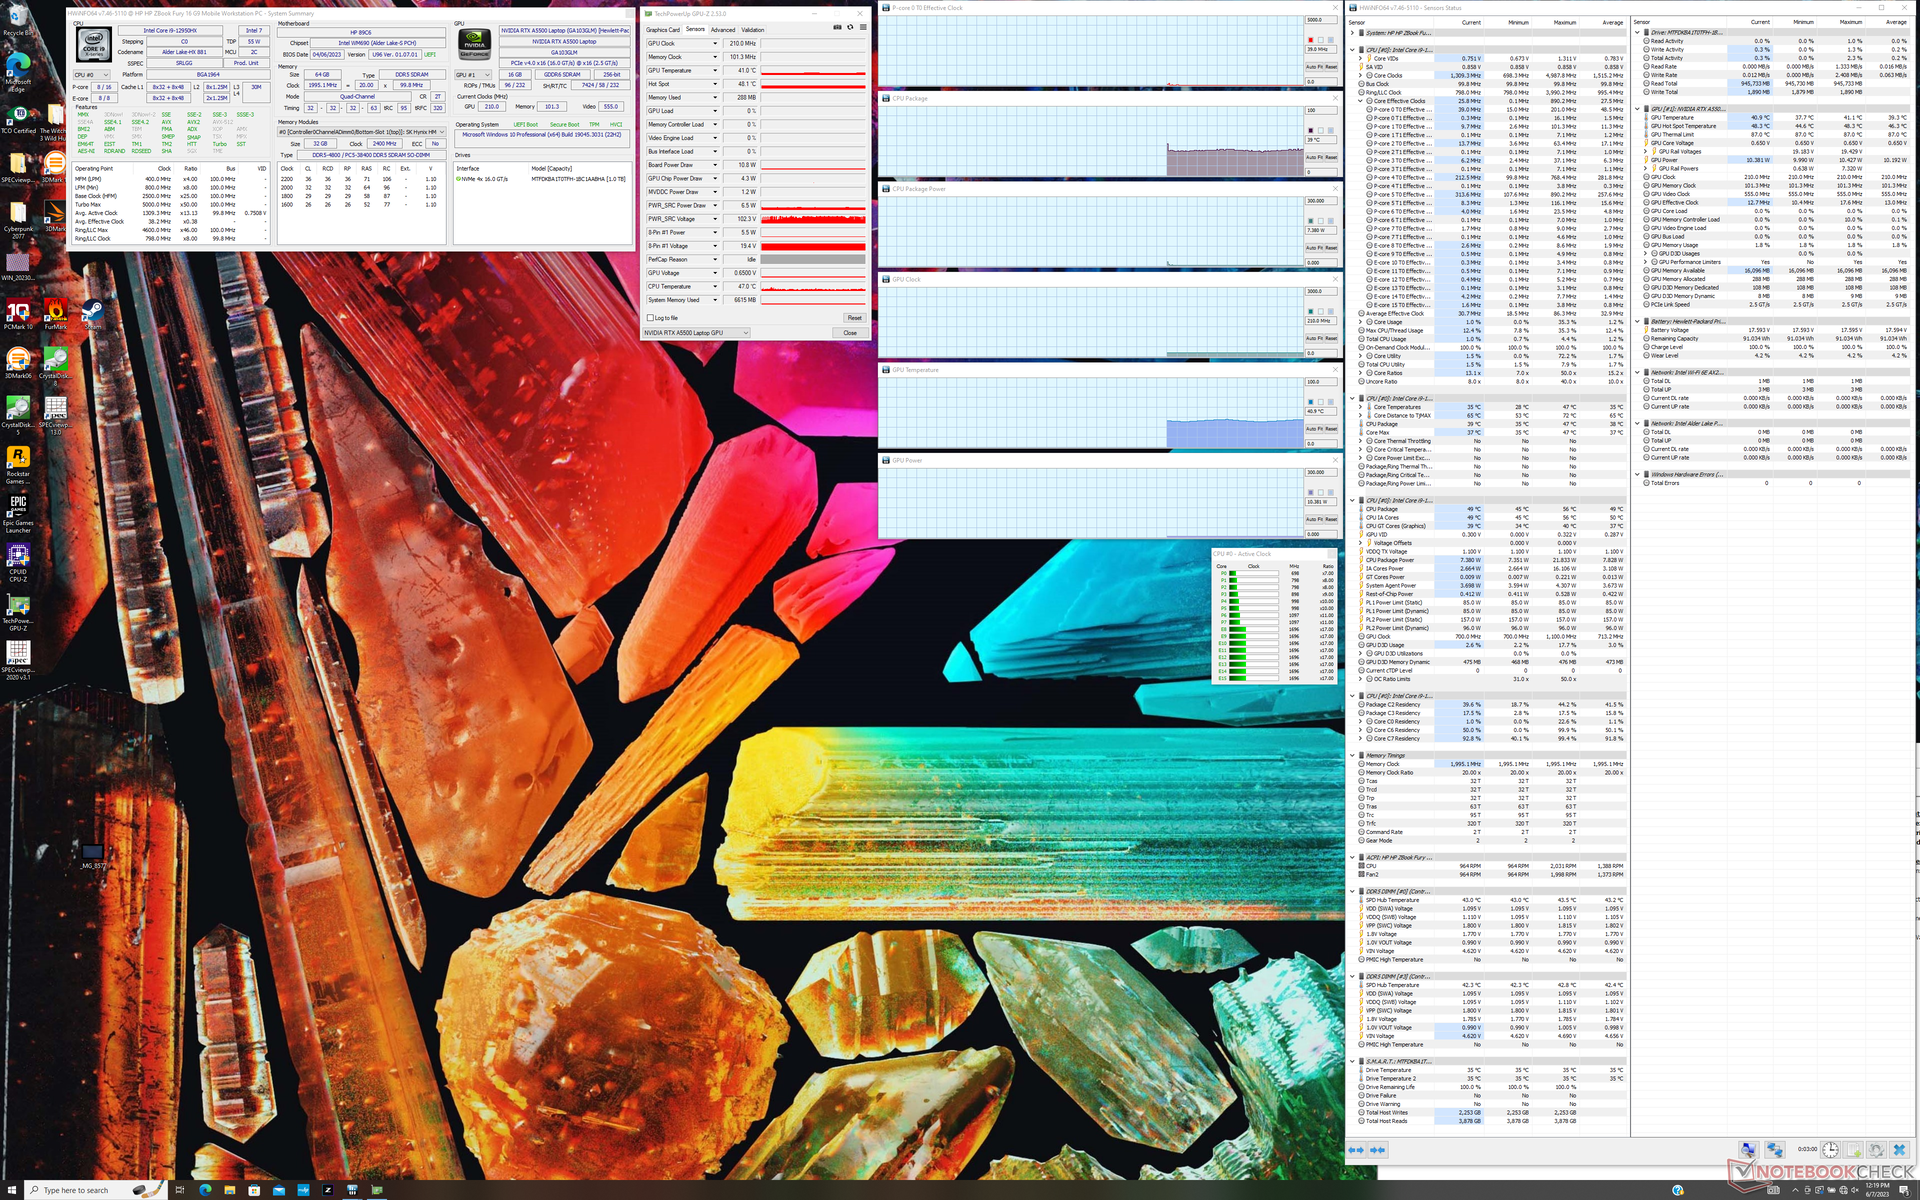
| CPU-klok (GHz) | GPU-klok (MHz) | Gemiddelde CPU-temperatuur (°C) | Gemiddelde GPU-temperatuur (°C) | |
| Systeem inactief | -- | -- | 39 | 41 |
| Prime95 Stress | 2.5 - 2.7 | -- | 76 | 52 |
| Prime95 + FurMark Stress | 2,2 - 2,3 | 547 - 1200 | 74 | 66 |
| Witcher 3 Stress | ~1.4 | 1297 | 87 | 70 |
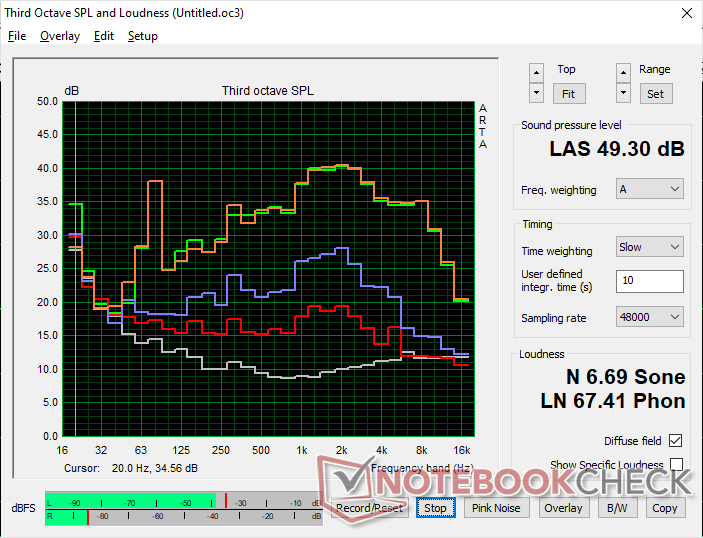
Luidsprekers
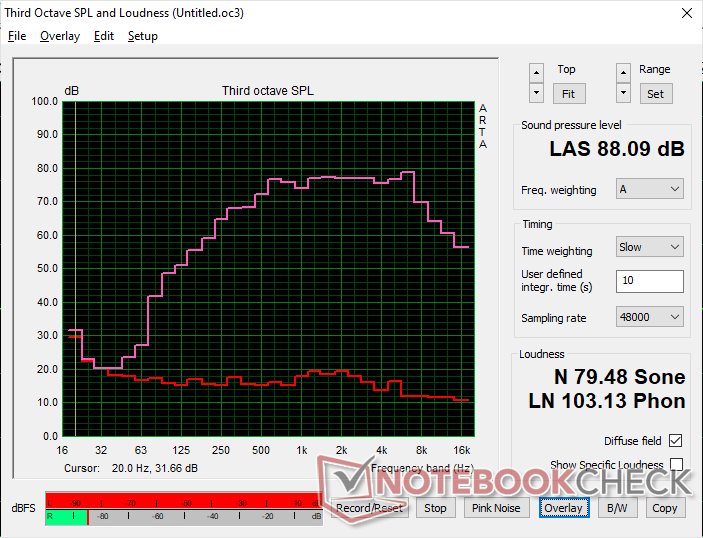
HP ZBook Fury 16 G9 audioanalyse
(+) | luidsprekers kunnen relatief luid spelen (88.1 dB)
Bas 100 - 315 Hz
(-) | bijna geen lage tonen - gemiddeld 16.1% lager dan de mediaan
(±) | lineariteit van de lage tonen is gemiddeld (7.5% delta ten opzichte van de vorige frequentie)
Midden 400 - 2000 Hz
(+) | evenwichtige middens - slechts 2.7% verwijderd van de mediaan
(+) | de middentonen zijn lineair (3.2% delta ten opzichte van de vorige frequentie)
Hoog 2 - 16 kHz
(+) | evenwichtige hoogtepunten - slechts 4.2% verwijderd van de mediaan
(+) | de hoge tonen zijn lineair (4.9% delta naar de vorige frequentie)
Algemeen 100 - 16.000 Hz
(+) | het totale geluid is lineair (13.5% verschil met de mediaan)
Vergeleken met dezelfde klasse
» 26% van alle geteste apparaten in deze klasse waren beter, 5% vergelijkbaar, 70% slechter
» De beste had een delta van 7%, het gemiddelde was 17%, de slechtste was 35%
Vergeleken met alle geteste toestellen
» 14% van alle geteste apparaten waren beter, 4% gelijk, 82% slechter
» De beste had een delta van 4%, het gemiddelde was 23%, de slechtste was 134%
Apple MacBook Pro 16 2021 M1 Pro audioanalyse
(+) | luidsprekers kunnen relatief luid spelen (84.7 dB)
Bas 100 - 315 Hz
(+) | goede baars - slechts 3.8% verwijderd van de mediaan
(+) | de lage tonen zijn lineair (5.2% delta naar de vorige frequentie)
Midden 400 - 2000 Hz
(+) | evenwichtige middens - slechts 1.3% verwijderd van de mediaan
(+) | de middentonen zijn lineair (2.1% delta ten opzichte van de vorige frequentie)
Hoog 2 - 16 kHz
(+) | evenwichtige hoogtepunten - slechts 1.9% verwijderd van de mediaan
(+) | de hoge tonen zijn lineair (2.7% delta naar de vorige frequentie)
Algemeen 100 - 16.000 Hz
(+) | het totale geluid is lineair (4.6% verschil met de mediaan)
Vergeleken met dezelfde klasse
» 0% van alle geteste apparaten in deze klasse waren beter, 0% vergelijkbaar, 100% slechter
» De beste had een delta van 5%, het gemiddelde was 17%, de slechtste was 45%
Vergeleken met alle geteste toestellen
» 0% van alle geteste apparaten waren beter, 0% gelijk, 100% slechter
» De beste had een delta van 4%, het gemiddelde was 23%, de slechtste was 134%
Energiebeheer
Stroomverbruik
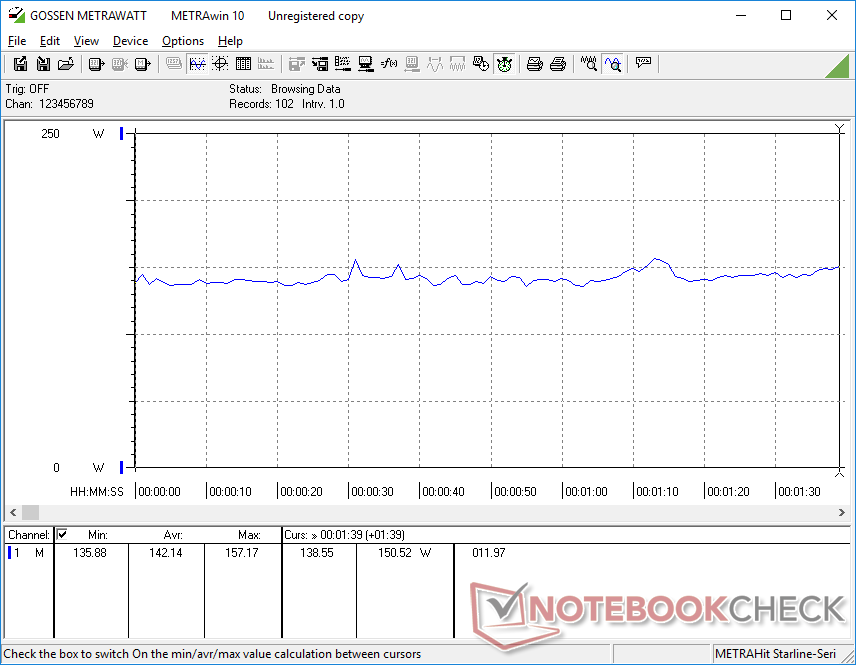
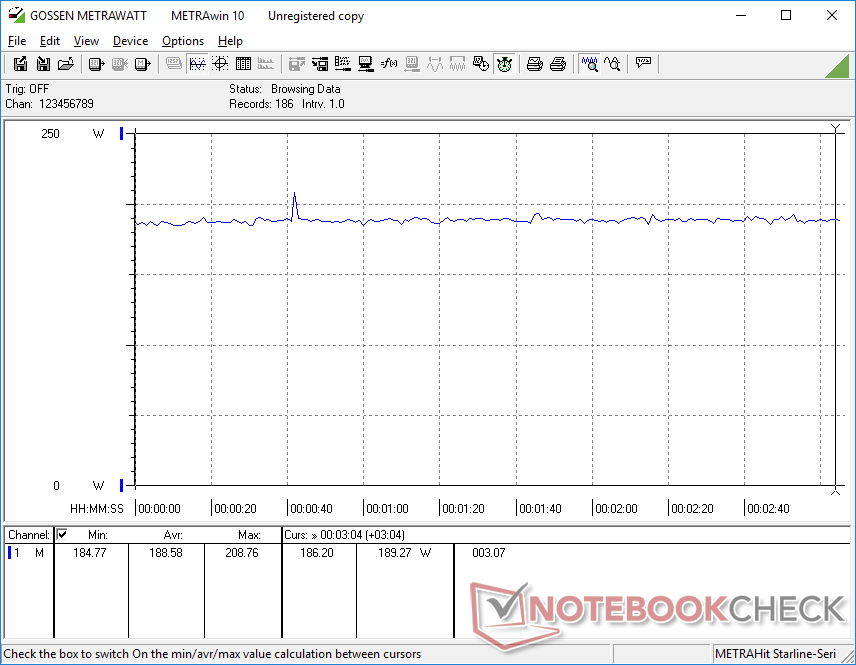
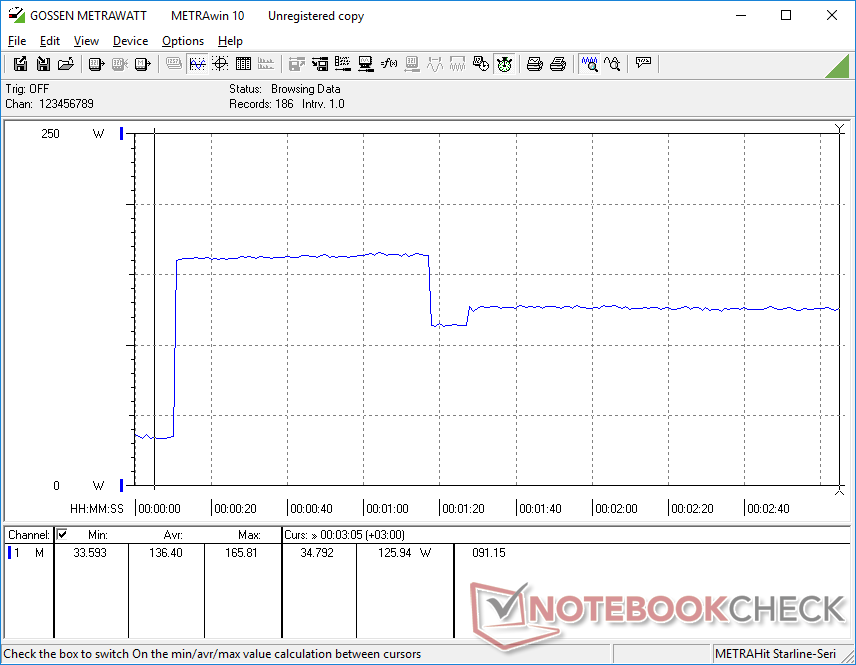
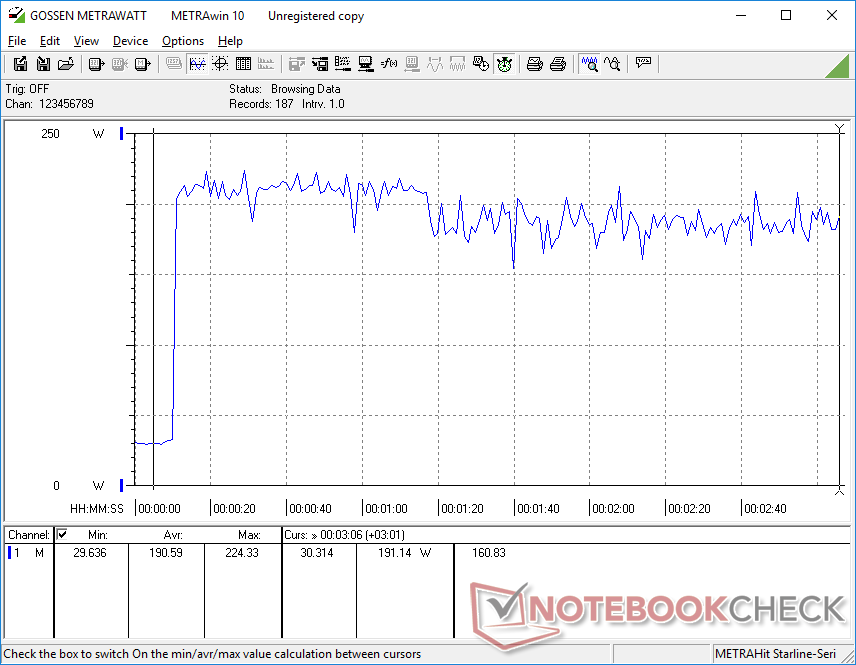
Het stroomverbruik is over de hele linie relatief hoog. Stationair draaien op de desktop bijvoorbeeld, verbruikt iets meer dan 19 W, zelfs met het Power Saver-profiel en de minimale helderheidsinstelling, vergeleken met respectievelijk 7 W of 16 W op de ThinkPad P16 G1 of Precision 7670. Het uitvoeren van meer veeleisende belastingen zoals Witcher 3 zou 189 W of bijna 30 W meer verbruiken dan op de Precision 7670, ook al biedt de Dell iets snellere grafische prestaties.
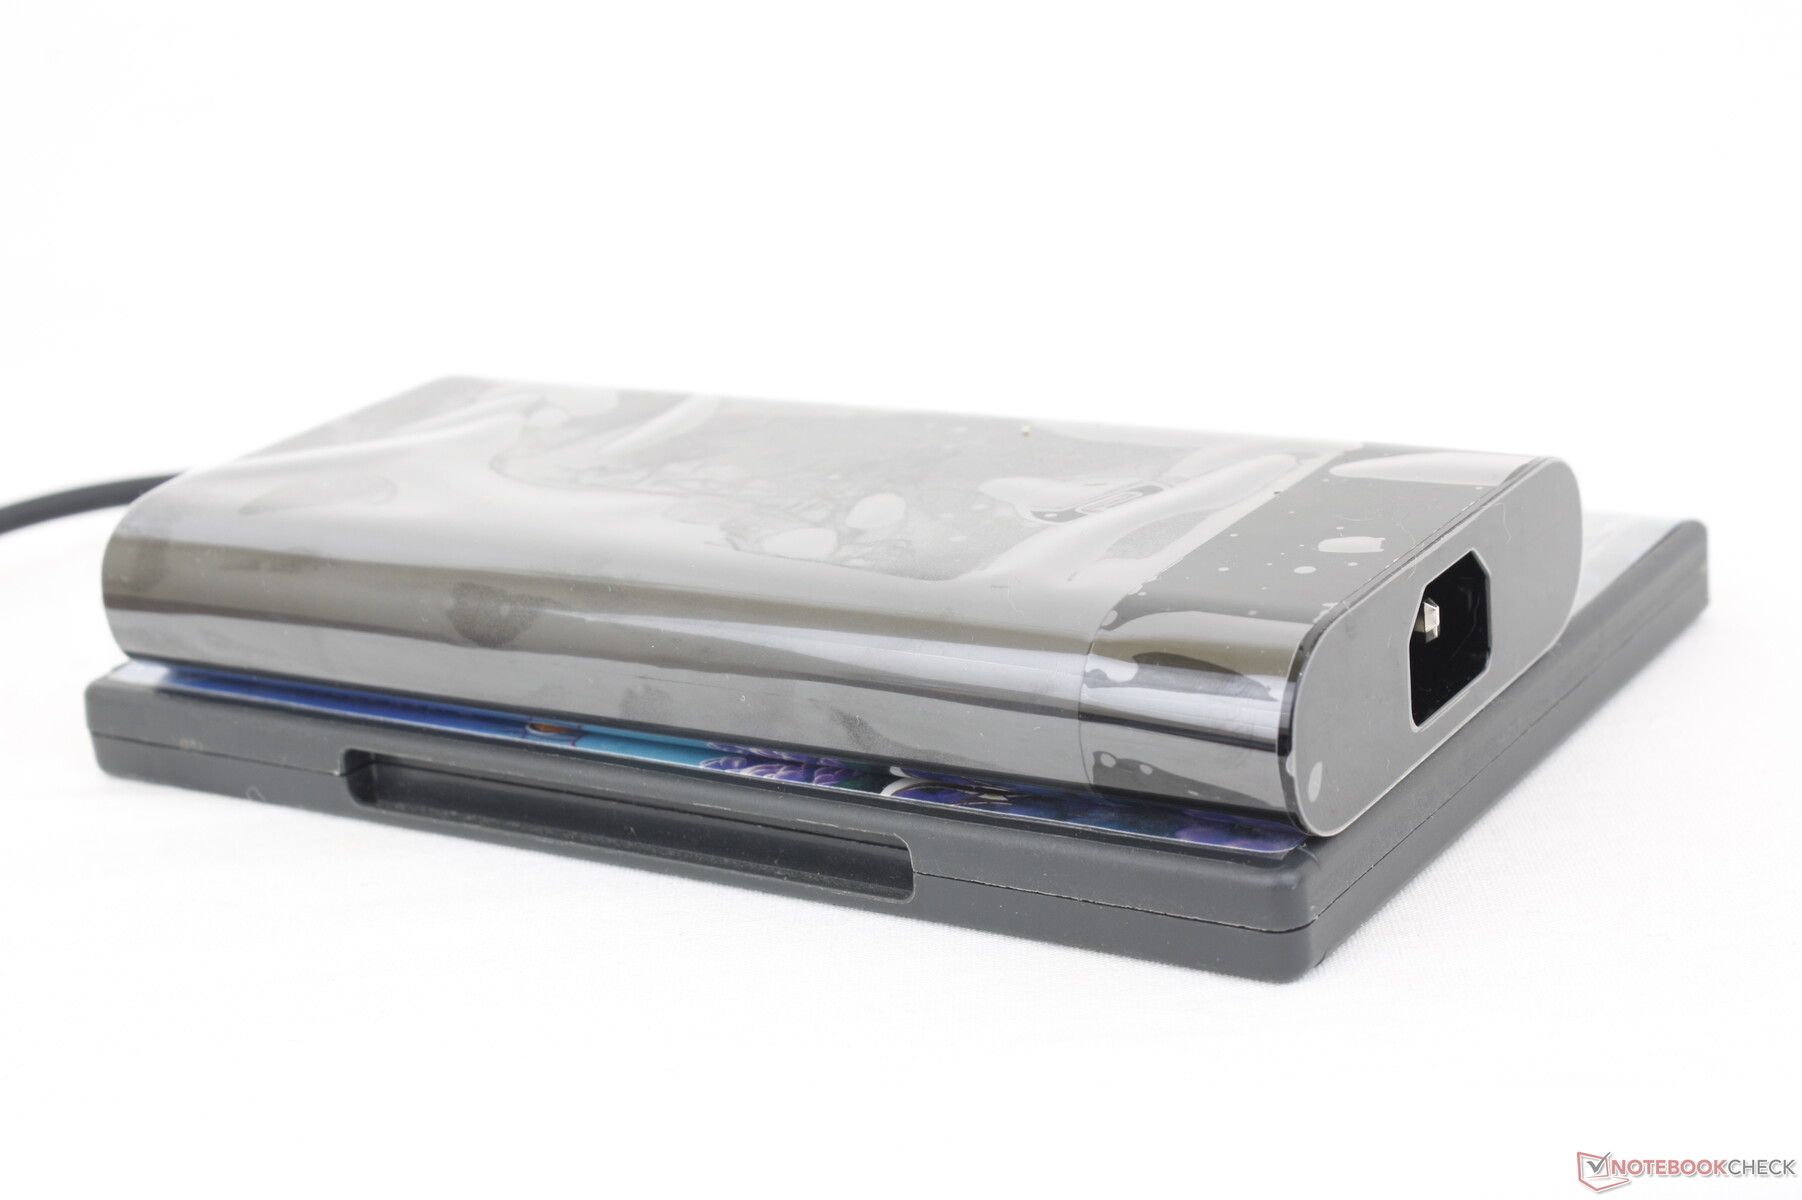
We zijn in staat om een tijdelijke maximale stroomopname van 224 W te registreren van de middelgrote (~18 x 8,9 x 2,7 cm) 230 W AC adapter wanneer de CPU en GPU elk op 100 procent gebruik zitten. Het opladen zou dus tot een kruipsnelheid vertragen als dergelijke hoge belastingen tegelijkertijd werden uitgevoerd. Het herhalen van deze test op de Precision 7670 of ThinkPad P16 G1 zou resulteren in veel hogere tijdelijke stroomverbruikniveaus van rond de 300 W elk, omdat ze beide hogere TGP/TDP doelen en dus hogere Turbo Boost plafonds hebben.
| Uit / Standby | |
| Inactief | |
| Belasting |
|
Key:
min: | |
| HP ZBook Fury 16 G9 i9-12950HX, RTX A5500 Laptop GPU, Micron 3400 1TB MTFDKBA1T0TFH, IPS, 3840x2400, 16" | HP ZBook Studio 16 G9 62U04EA i7-12800H, RTX A2000 Laptop GPU, Micron 3400 1TB MTFDKBA1T0TFH, IPS, 3840x2400, 16" | HP ZBook Firefly 16 G9-6B897EA i7-1265U, T550 Laptop GPU, Samsung PM9A1 MZVL21T0HCLR, IPS, 1920x1200, 16" | Lenovo ThinkPad P16 G1 RTX A5500 i9-12950HX, RTX A5500 Laptop GPU, WDC PC SN810 2TB, IPS, 3840x2400, 16" | Dell Precision 7000 7670 Performance i9-12950HX, RTX A5500 Laptop GPU, , OLED, 3840x2400, 16" | MSI CreatorPro Z16P B12UKST i7-12700H, RTX A3000 Laptop GPU, Samsung PM9A1 MZVL21T0HCLR, IPS, 2560x1600, 16" | |
|---|---|---|---|---|---|---|
| Power Consumption | 40% | 71% | 10% | -8% | 35% | |
| Idle Minimum * (Watt) | 19.5 | 7.2 63% | 4.5 77% | 7.5 62% | 16.4 16% | 10.8 45% |
| Idle Average * (Watt) | 29 | 18.1 38% | 8 72% | 20.1 31% | 35.9 -24% | 16.3 44% |
| Idle Maximum * (Watt) | 40.7 | 18.5 55% | 8.7 79% | 40 2% | 47 -15% | 16.9 58% |
| Load Average * (Watt) | 142.1 | 112.8 21% | 48.3 66% | 137 4% | 147.1 -4% | 111.7 21% |
| Witcher 3 ultra * (Watt) | 188.6 | 106.7 43% | 45.3 76% | 208 -10% | 158.8 16% | 152.1 19% |
| Load Maximum * (Watt) | 224.4 | 186 17% | 94.7 58% | 285.9 -27% | 311 -39% | 177.4 21% |
* ... kleiner is beter
Power Consumption Witcher 3 / Stresstest
Power Consumption external Monitor
Batterijduur - Buggy Runtimes
De WLAN-looptijd van 6 uur is vergelijkbaar met deZBook Studio 16 G9 en de ThinkPad P16 G1, maar is ruim een uur langer dan de Precision 7670. De dunnere ZBook Firefly 16 G9 gaat bijna twee keer zo lang mee omdat deze een langzamere Core U-serie CPU gebruikt.
Het opladen van de 95 Wh batterij van leeg naar vol gaat snel, in iets meer dan een uur met de meegeleverde AC-adapter. Het systeem kan ook worden opgeladen via USB-C adapters van derden, maar compatibiliteit is niet gegarandeerd voor kleinere capaciteiten. Als je bijvoorbeeld onze 65 W USB-C adapter op de Fury 16 G9 zou aansluiten, zou er een Windows pop-up verschijnen met de melding dat er onvoldoende stroom is om op te laden. Aan de andere kant zou onze 130 W USB-C AC-adapter het systeem zonder problemen opladen. De prestaties zijn minder als er via USB-C wordt opgeladen, zoals te verwachten was.
Vreemd genoeg was de batterijlevensduur bij stationair draaien op Power Saver en de laagste helderheidsinstelling korter dan onze Balanced WLAN-instellingen, zelfs na meerdere hertests. Dit is waarschijnlijk een bug in het model die wijst op slecht beheer van bronnen op de achtergrond of buggy CPU toestanden gerelateerd aan de instellingen van het Windows energieprofiel.
| HP ZBook Fury 16 G9 i9-12950HX, RTX A5500 Laptop GPU, 95 Wh | HP ZBook Studio 16 G9 62U04EA i7-12800H, RTX A2000 Laptop GPU, 86 Wh | HP ZBook Firefly 16 G9-6B897EA i7-1265U, T550 Laptop GPU, 76 Wh | Lenovo ThinkPad P16 G1 RTX A5500 i9-12950HX, RTX A5500 Laptop GPU, 94 Wh | Dell Precision 7000 7670 Performance i9-12950HX, RTX A5500 Laptop GPU, 93 Wh | MSI CreatorPro Z16P B12UKST i7-12700H, RTX A3000 Laptop GPU, 90 Wh | |
|---|---|---|---|---|---|---|
| Batterijduur | -2% | 92% | -3% | -22% | -3% | |
| Reader / Idle (h) | 5.3 | |||||
| WiFi v1.3 (h) | 6 | 6.3 5% | 13 117% | 5.8 -3% | 4.7 -22% | 5.8 -3% |
| Load (h) | 1.2 | 1.1 -8% | 2 67% | |||
| H.264 (h) | 8.5 | 18.4 |
Pro
Contra
Verdict - Goede prestaties, maar Lenovo en Dell doen het sneller
De ZBook Fury 16 G9 biedt functies die niet beschikbaar zijn op de meeste andere mobiele werkstations. Het superheldere 1000-nit paneel, optionele OLED, per-toets RGB-verlichting, speciale programmeerbare toets en ondersteuning voor maximaal 4x SSD's en 4x SODIMM-modules zijn allemaal functies die liefhebbers kunnen waarderen. Ondertussen zijn het comfortabele toetsenbord en touchpad iets waarvan we zouden willen dat andere fabrikanten het kunnen evenaren.
Het belangrijkste nadeel waardoor de ZBook Fury 16 G9 niet direct een aanrader is, is de snellere prestatie in vergelijking met de Lenovo ThinkPad P16 G1 of Dell Precision 7670. Het is waar dat de HP 4x interne schijven kan ondersteunen, maar de prestaties van deze schijven hebben de neiging om te haperen wanneer ze onder druk komen te staan. Het is ook teleurstellend dat de RTX A5500 streeft naar een TGP van slechts 100 W, terwijl de eerder genoemde Lenovo en Dell modellen elk streven naar ~130 W voor snellere prestaties. Zelfs de CPU presteert iets ondermaats in vergelijking met andere modellen met dezelfde processoroptie.
De HP ZBook Fury 16 G9 is lichter en heeft meer mogelijkheden dan veel andere 16-inch werkstations. De prestaties lijden echter lichtjes onder de lagere TGP- en TDP-doelstellingen en de ontoereikende SSD-koeling.
Als de bovenstaande extra functies je niet interesseren, dan kun je de prestaties beter maximaliseren met de ThinkPad P16 G1 of Precision 7670. Als je het echter niet erg vindt om wat prestaties in te leveren voor deze functies, dan kan de lichtere HP Fury het overwegen waard zijn.
Prijs en beschikbaarheid
HP levert zijn ZBook Fury 16 G9 nu vanaf 1490 USD voor de basisconfiguratie tot meer dan 4000 USD voor onze reviewconfiguratie. De Fury 16 G10 is ook verkrijgbaar.
HP ZBook Fury 16 G9
- 09-06-2023 v7 (old)
Allen Ngo
Transparantie
De selectie van te beoordelen apparaten wordt gemaakt door onze redactie. Het testexemplaar werd ten behoeve van deze beoordeling door de fabrikant of detailhandelaar in bruikleen aan de auteur verstrekt. De kredietverstrekker had geen invloed op deze recensie, noch ontving de fabrikant vóór publicatie een exemplaar van deze recensie. Er bestond geen verplichting om deze recensie te publiceren. Als onafhankelijk mediabedrijf is Notebookcheck niet onderworpen aan het gezag van fabrikanten, detailhandelaren of uitgevers.
[transparency_disclaimer]Dit is hoe Notebookcheck test
Elk jaar beoordeelt Notebookcheck onafhankelijk honderden laptops en smartphones met behulp van gestandaardiseerde procedures om ervoor te zorgen dat alle resultaten vergelijkbaar zijn. We hebben onze testmethoden al zo'n 20 jaar voortdurend ontwikkeld en daarbij de industriestandaard bepaald. In onze testlaboratoria wordt gebruik gemaakt van hoogwaardige meetapparatuur door ervaren technici en redacteuren. Deze tests omvatten een validatieproces in meerdere fasen. Ons complexe beoordelingssysteem is gebaseerd op honderden goed onderbouwde metingen en benchmarks, waardoor de objectiviteit behouden blijft. Meer informatie over onze testmethoden kunt u hier vinden.
Price comparison

