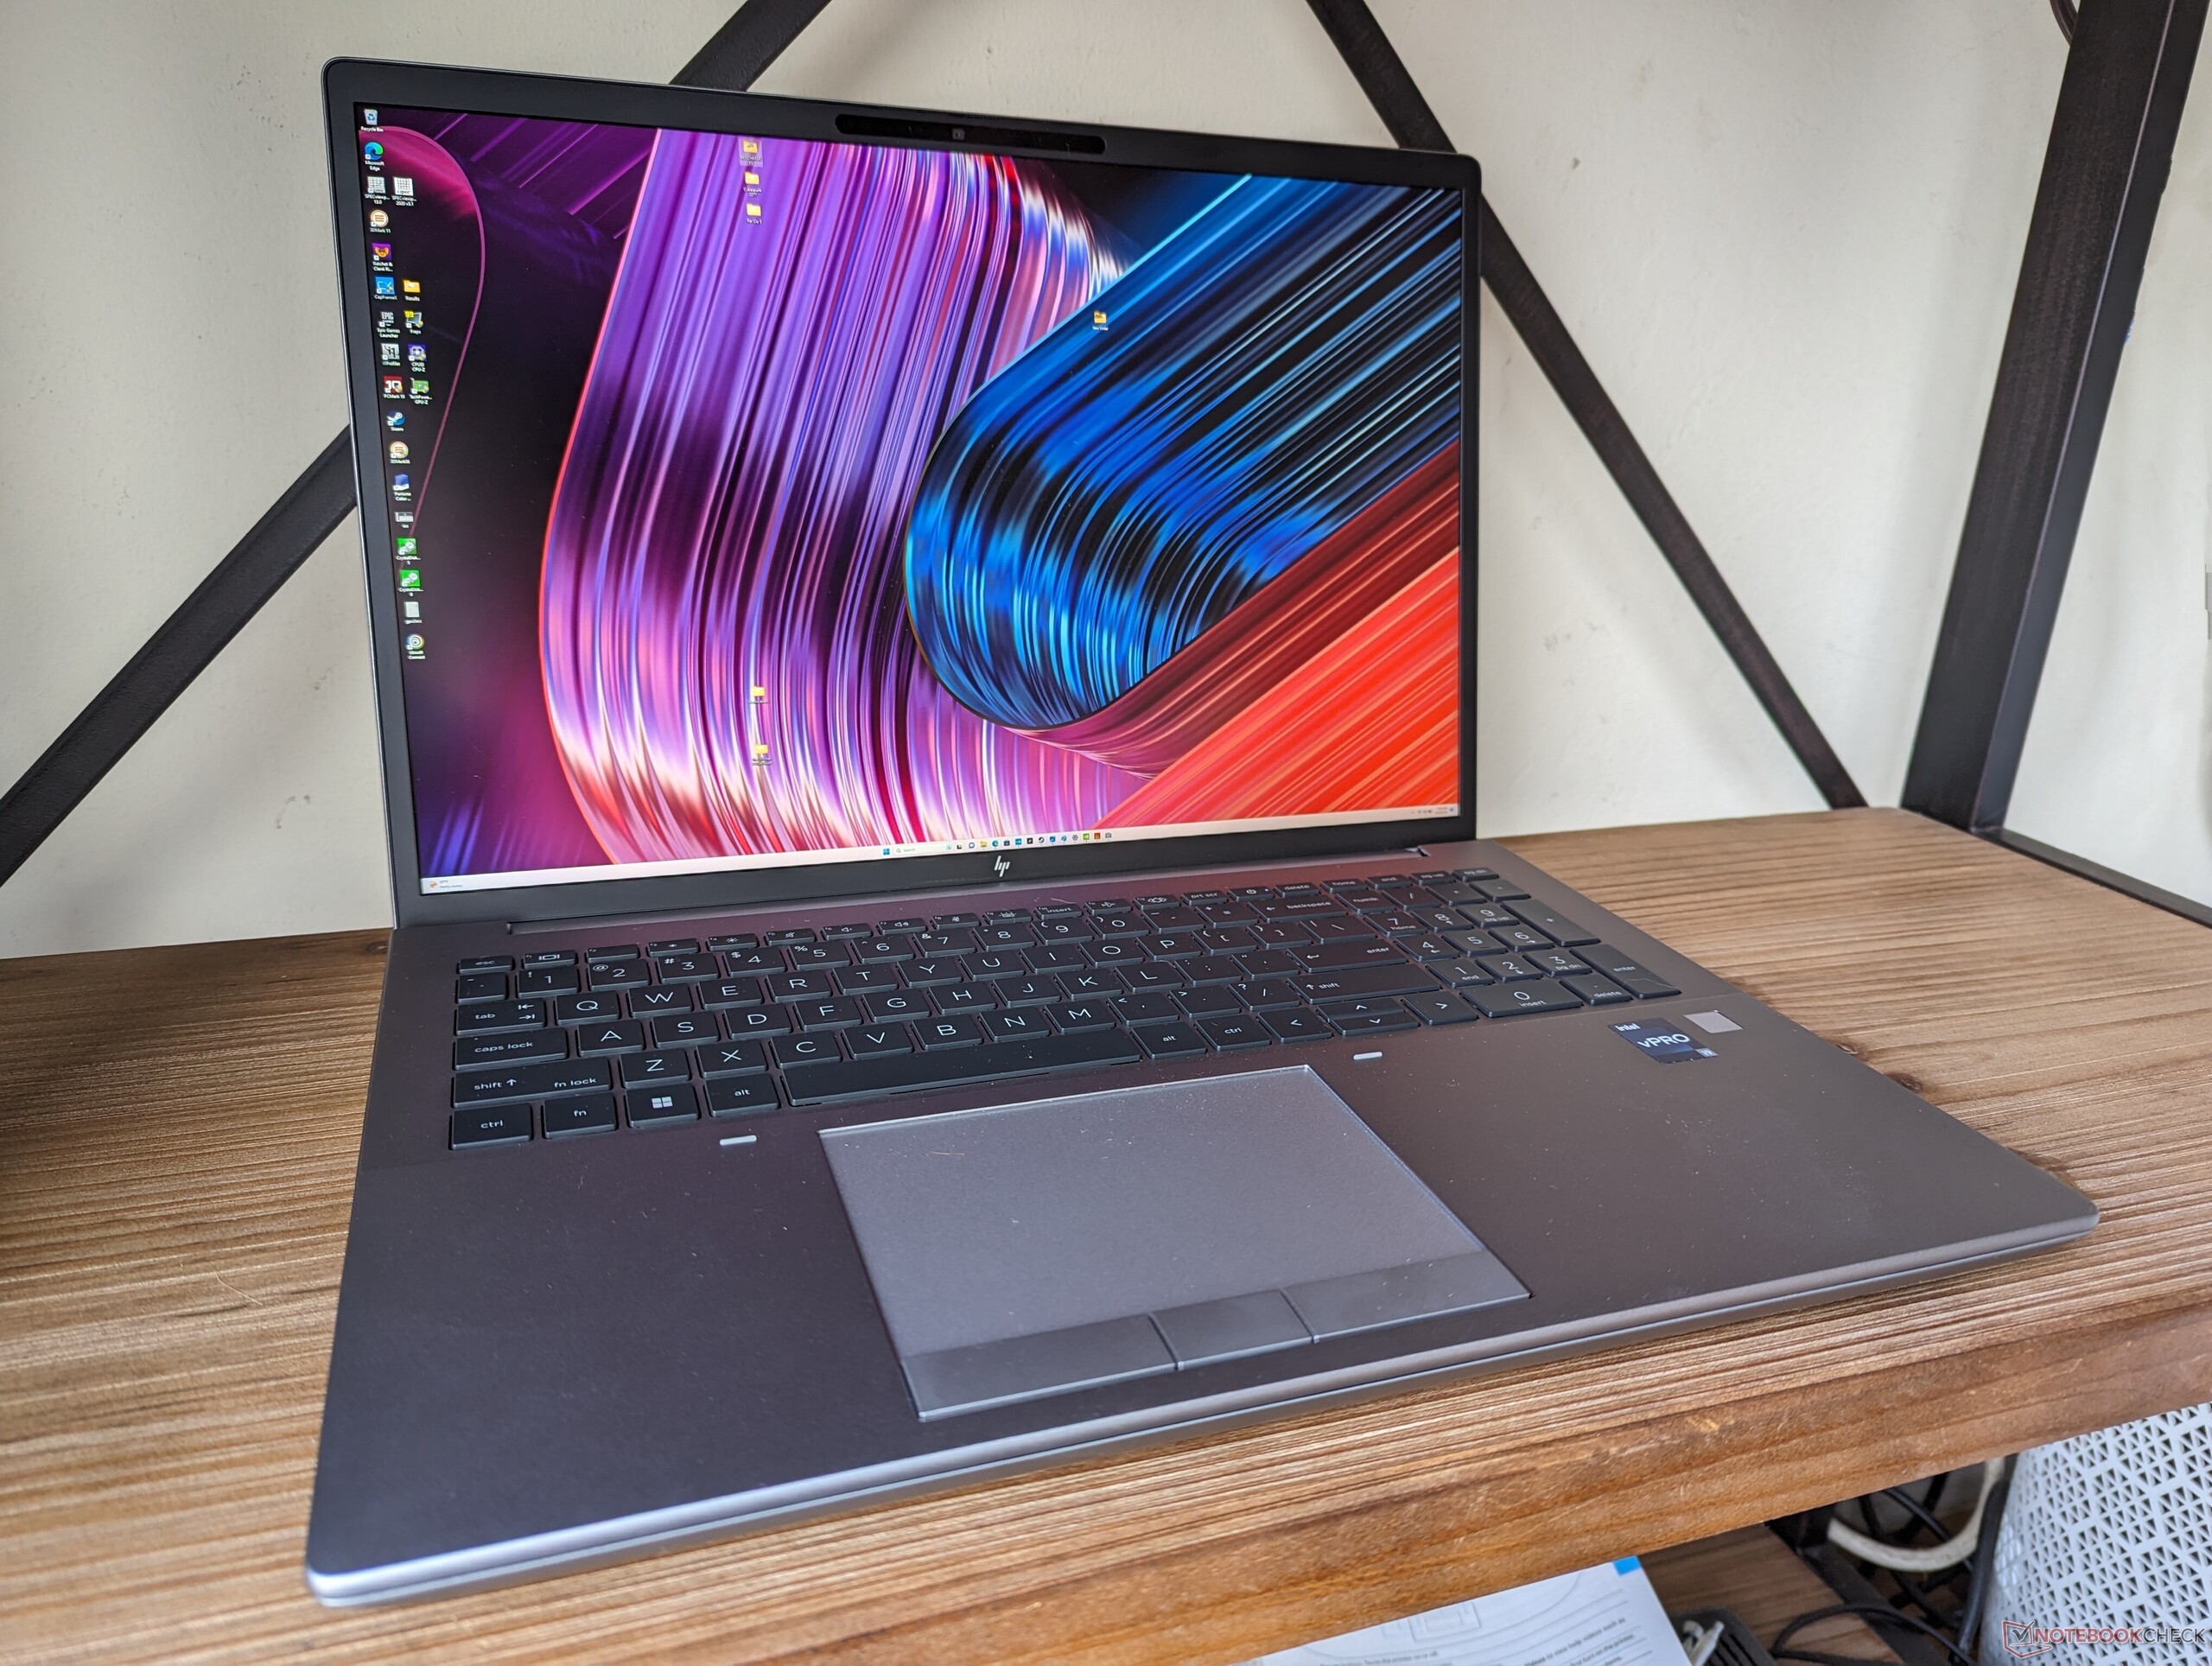
HP ZBook Fury 16 G10 mobiel werkstation review: 100 W Nvidia RTX 5000 Ada

De ZBook Fury 16 G10 is de directe opvolger van de ZBook Fury 16 G9 van vorig jaar, met nieuwe 13e gen Raptor Lake-HX CPU- en Nvidia RTX Ada GPU-opties ter vervanging van respectievelijk de oudere 12e gen Alder Lake- en RTX Ampere-processors. Het nieuwe model is verder visueel identiek aan de Fury 16 G9 en daarom raden we aan om onze review van vorig jaar te bekijken onze review van het model van vorig jaar om meer te weten te komen over de fysieke kenmerken van de Fury 16 G10.
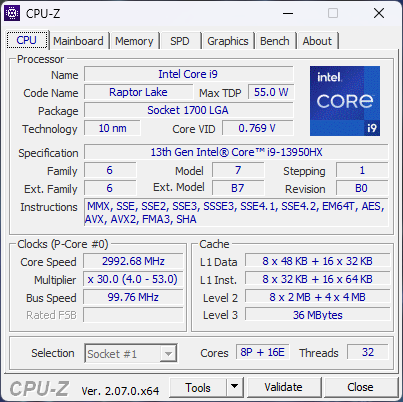
Onze specifieke revieweenheid is een configuratie in het hogere segment met de Core i9-13950HX, Nvidia RTX 5000 Ada en een 2400p IPS-beeldscherm voor een verkoopprijs van ongeveer $5300 USD. Kleinere configuraties zijn beschikbaar voor lagere startprijzen zoals beschreven in de officiële HP specificaties lijst.
Alternatieven voor de Fury 16 G10 zijn andere 16-inch mobiele werkstations zoals de Dell Precision 5680, Lenovo ThinkPad P16 G1,MSI CreatorPro Z16Pof deAsus ProArt StudioBook 16.
Meer HP beoordelingen:
Potentiële concurrenten in vergelijking
Evaluatie | Datum | Model | Gewicht | Hoogte | Formaat | Resolutie | Beste prijs |
|---|---|---|---|---|---|---|---|
| 92.3 % v7 (old) | 09-2023 | HP ZBook Fury 16 G10 i9-13950HX, RTX 5000 Ada Generation Laptop | 2.6 kg | 28.5 mm | 16.00" | 3840x2400 | |
| 91 % v7 (old) | 06-2023 | HP ZBook Fury 16 G9 i9-12950HX, RTX A5500 Laptop GPU | 2.6 kg | 28.5 mm | 16.00" | 3840x2400 | |
| 89 % v7 (old) | 08-2023 | Dell Precision 5000 5680 i9-13900H, RTX 5000 Ada Generation Laptop | 2.3 kg | 22.17 mm | 16.00" | 3840x2400 | |
| 91 % v7 (old) | 02-2023 | Lenovo ThinkPad P16 G1 RTX A5500 i9-12950HX, RTX A5500 Laptop GPU | 3 kg | 30.23 mm | 16.00" | 3840x2400 | |
| 84.3 % v7 (old) | 11-2022 | MSI CreatorPro Z16P B12UKST i7-12700H, RTX A3000 Laptop GPU | 2.4 kg | 19 mm | 16.00" | 2560x1600 | |
v (old) | 12-2021 | Asus ProArt StudioBook 16 W7600H5A-2BL2 W-11955M, RTX A5000 Laptop GPU | 2.4 kg | 21.4 mm | 16.00" | 3840x2400 |
Behuizing - Vertrouwd ZBook Fury 16 G9-ontwerp
SD-kaartlezer
| SD Card Reader | |
| average JPG Copy Test (av. of 3 runs) | |
| Dell Precision 5000 5680 (Toshiba Exceria Pro SDXC 64 GB UHS-II) | |
| MSI CreatorPro Z16P B12UKST (AV Pro V60) | |
| HP ZBook Fury 16 G10 (Toshiba Exceria Pro SDXC 64 GB UHS-II) | |
| HP ZBook Fury 16 G9 (PNY EliteX-PRO60) | |
| Lenovo ThinkPad P16 G1 RTX A5500 (Toshiba Exceria Pro SDXC 64 GB UHS-II) | |
| Asus ProArt StudioBook 16 W7600H5A-2BL2 (AV Pro SD microSD 128 GB V60) | |
| maximum AS SSD Seq Read Test (1GB) | |
| Dell Precision 5000 5680 (Toshiba Exceria Pro SDXC 64 GB UHS-II) | |
| HP ZBook Fury 16 G10 (Toshiba Exceria Pro SDXC 64 GB UHS-II) | |
| Asus ProArt StudioBook 16 W7600H5A-2BL2 (AV Pro SD microSD 128 GB V60) | |
| HP ZBook Fury 16 G9 (PNY EliteX-PRO60) | |
| MSI CreatorPro Z16P B12UKST (AV Pro V60) | |
| Lenovo ThinkPad P16 G1 RTX A5500 (Toshiba Exceria Pro SDXC 64 GB UHS-II) | |
Communicatie
| Networking | |
| iperf3 transmit AX12 | |
| Asus ProArt StudioBook 16 W7600H5A-2BL2 | |
| iperf3 receive AX12 | |
| Asus ProArt StudioBook 16 W7600H5A-2BL2 | |
| iperf3 transmit AXE11000 | |
| HP ZBook Fury 16 G10 | |
| Lenovo ThinkPad P16 G1 RTX A5500 | |
| Dell Precision 5000 5680 | |
| HP ZBook Fury 16 G9 | |
| iperf3 receive AXE11000 | |
| HP ZBook Fury 16 G9 | |
| HP ZBook Fury 16 G10 | |
| Lenovo ThinkPad P16 G1 RTX A5500 | |
| Dell Precision 5000 5680 | |
| iperf3 transmit AXE11000 6GHz | |
| MSI CreatorPro Z16P B12UKST | |
| Lenovo ThinkPad P16 G1 RTX A5500 | |
| HP ZBook Fury 16 G10 | |
| Dell Precision 5000 5680 | |
| iperf3 receive AXE11000 6GHz | |
| MSI CreatorPro Z16P B12UKST | |
| HP ZBook Fury 16 G10 | |
| Lenovo ThinkPad P16 G1 RTX A5500 | |
| Dell Precision 5000 5680 | |
Webcam
HP laptops hebben nog steeds webcams met een van de hoogste resoluties op de markt. De 5 MP sensor op de Fury 16 G10 biedt een veel schoner beeld dan de 2 MP webcam op de Precision 5680.


Onderhoud
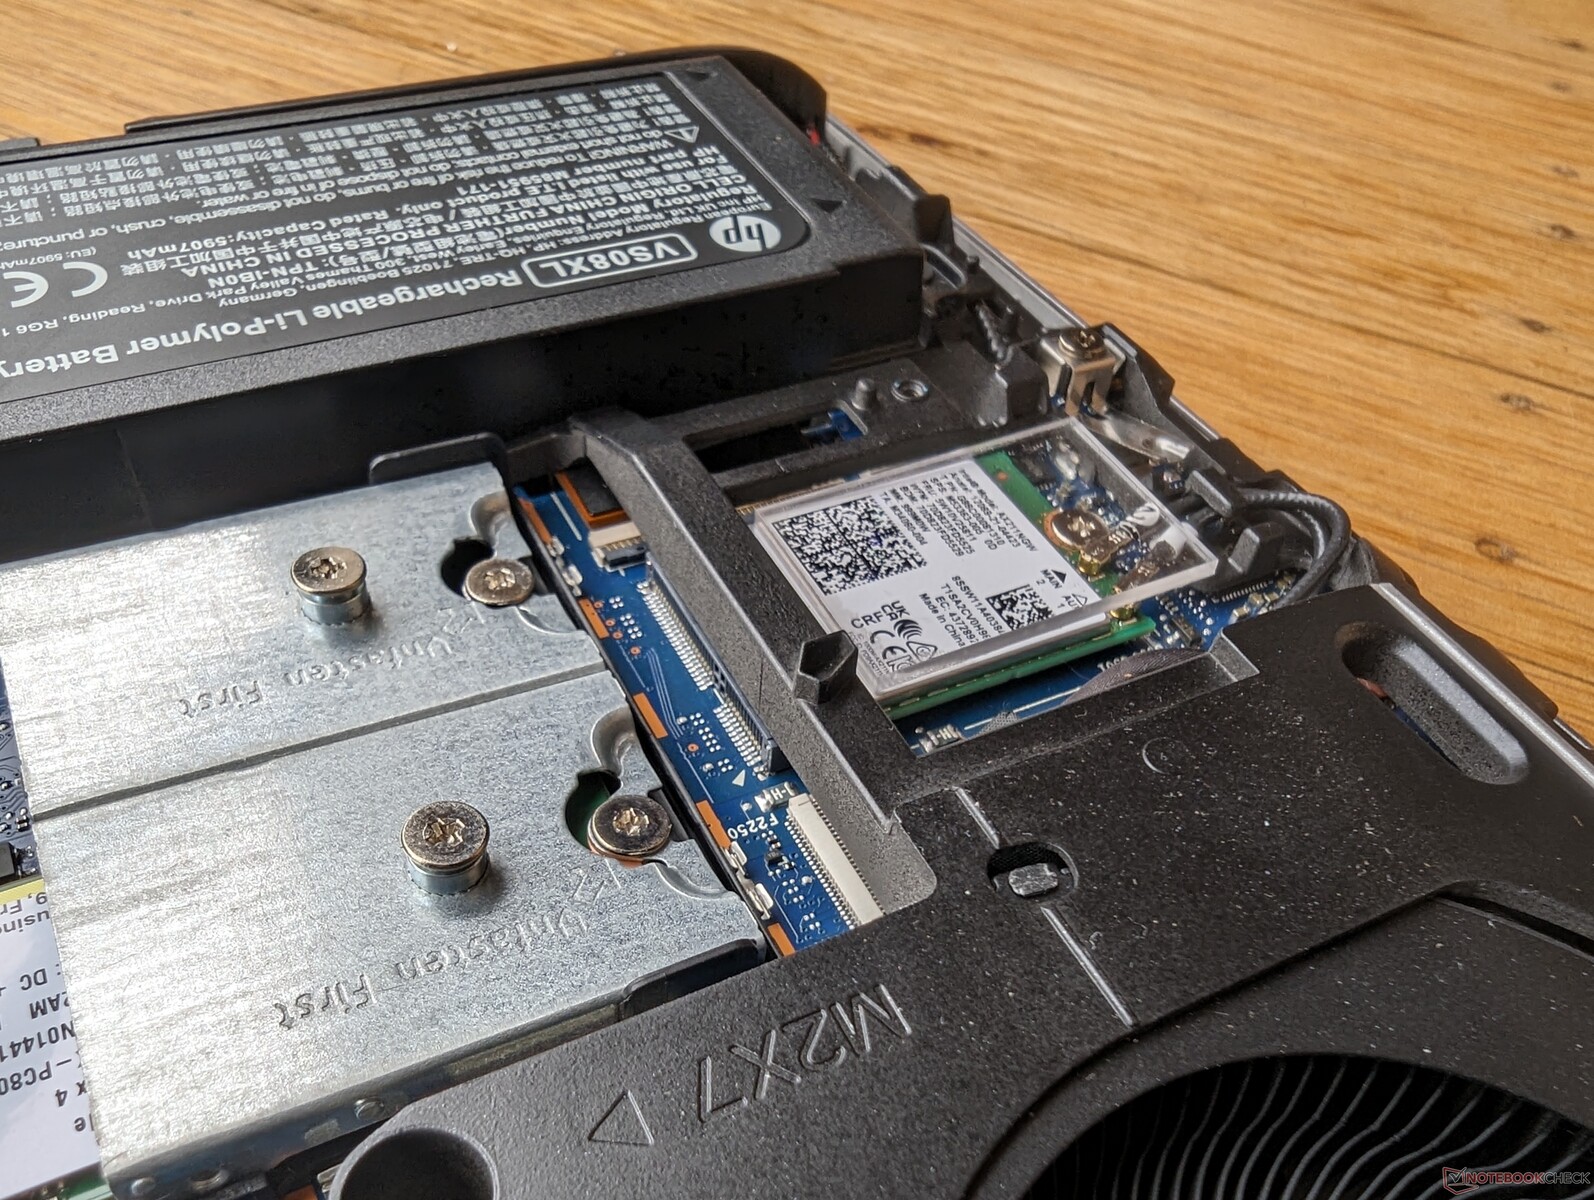
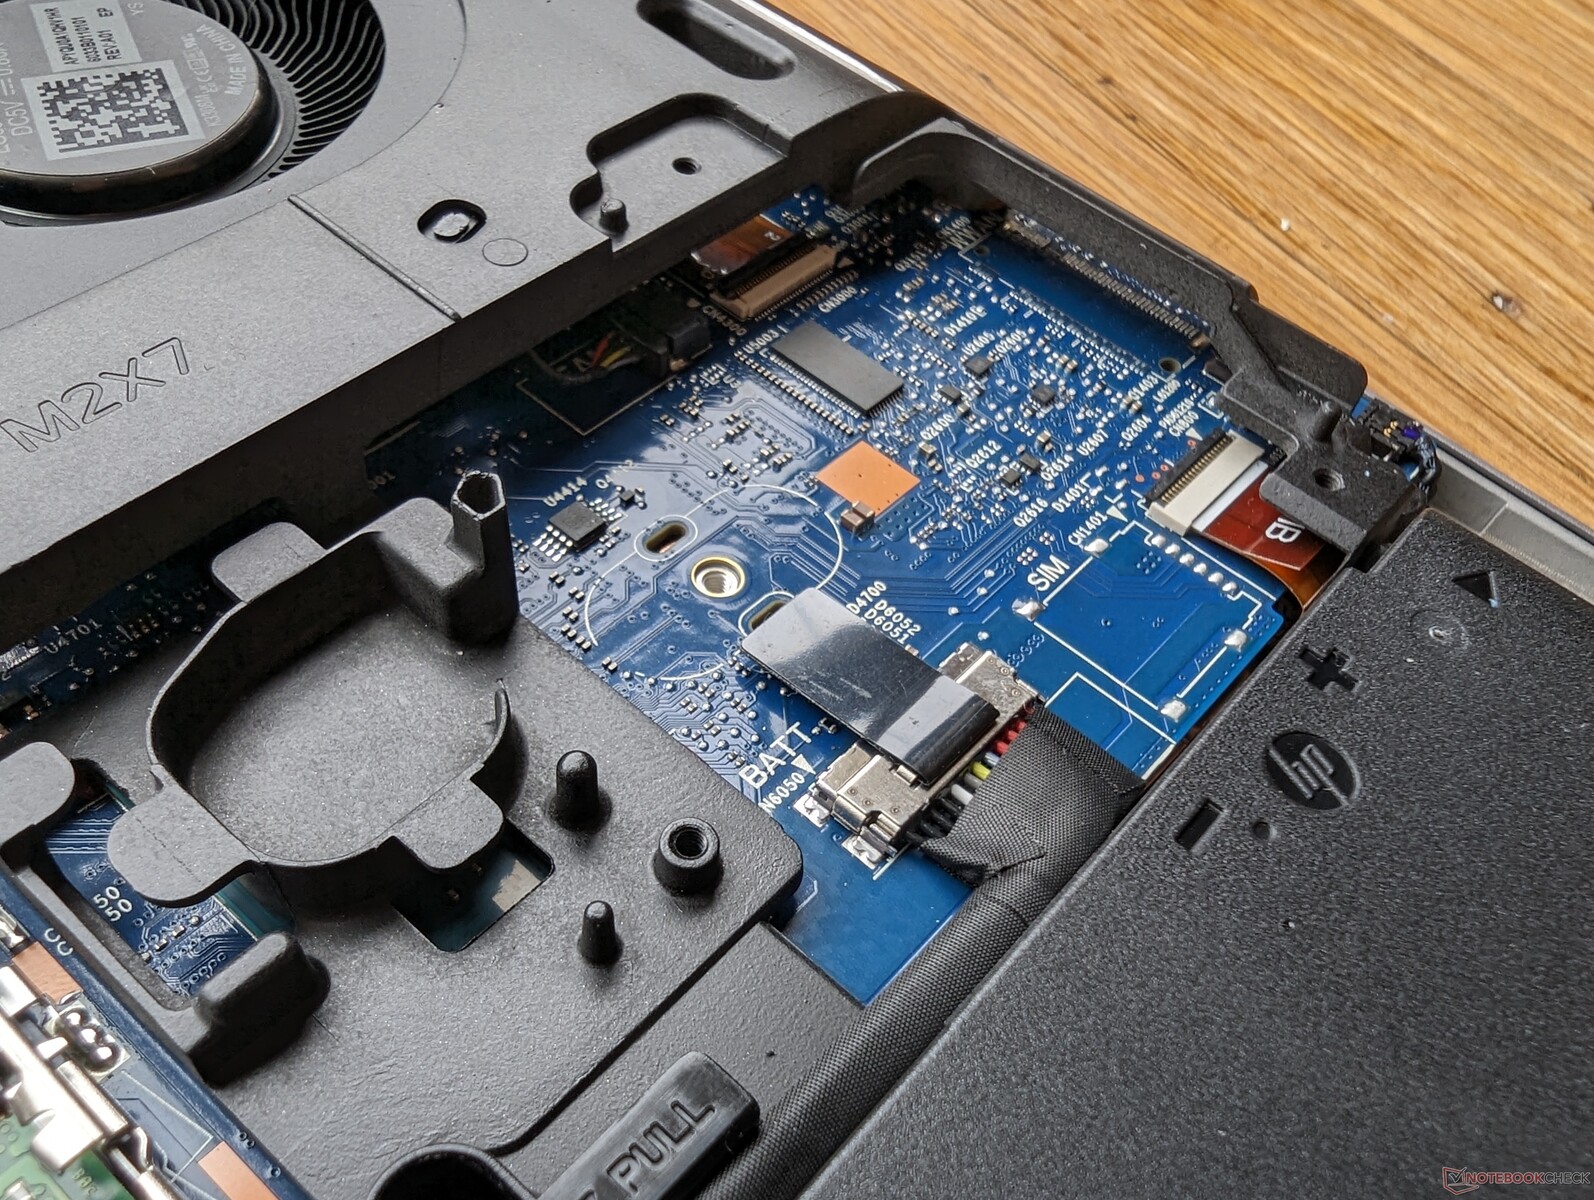
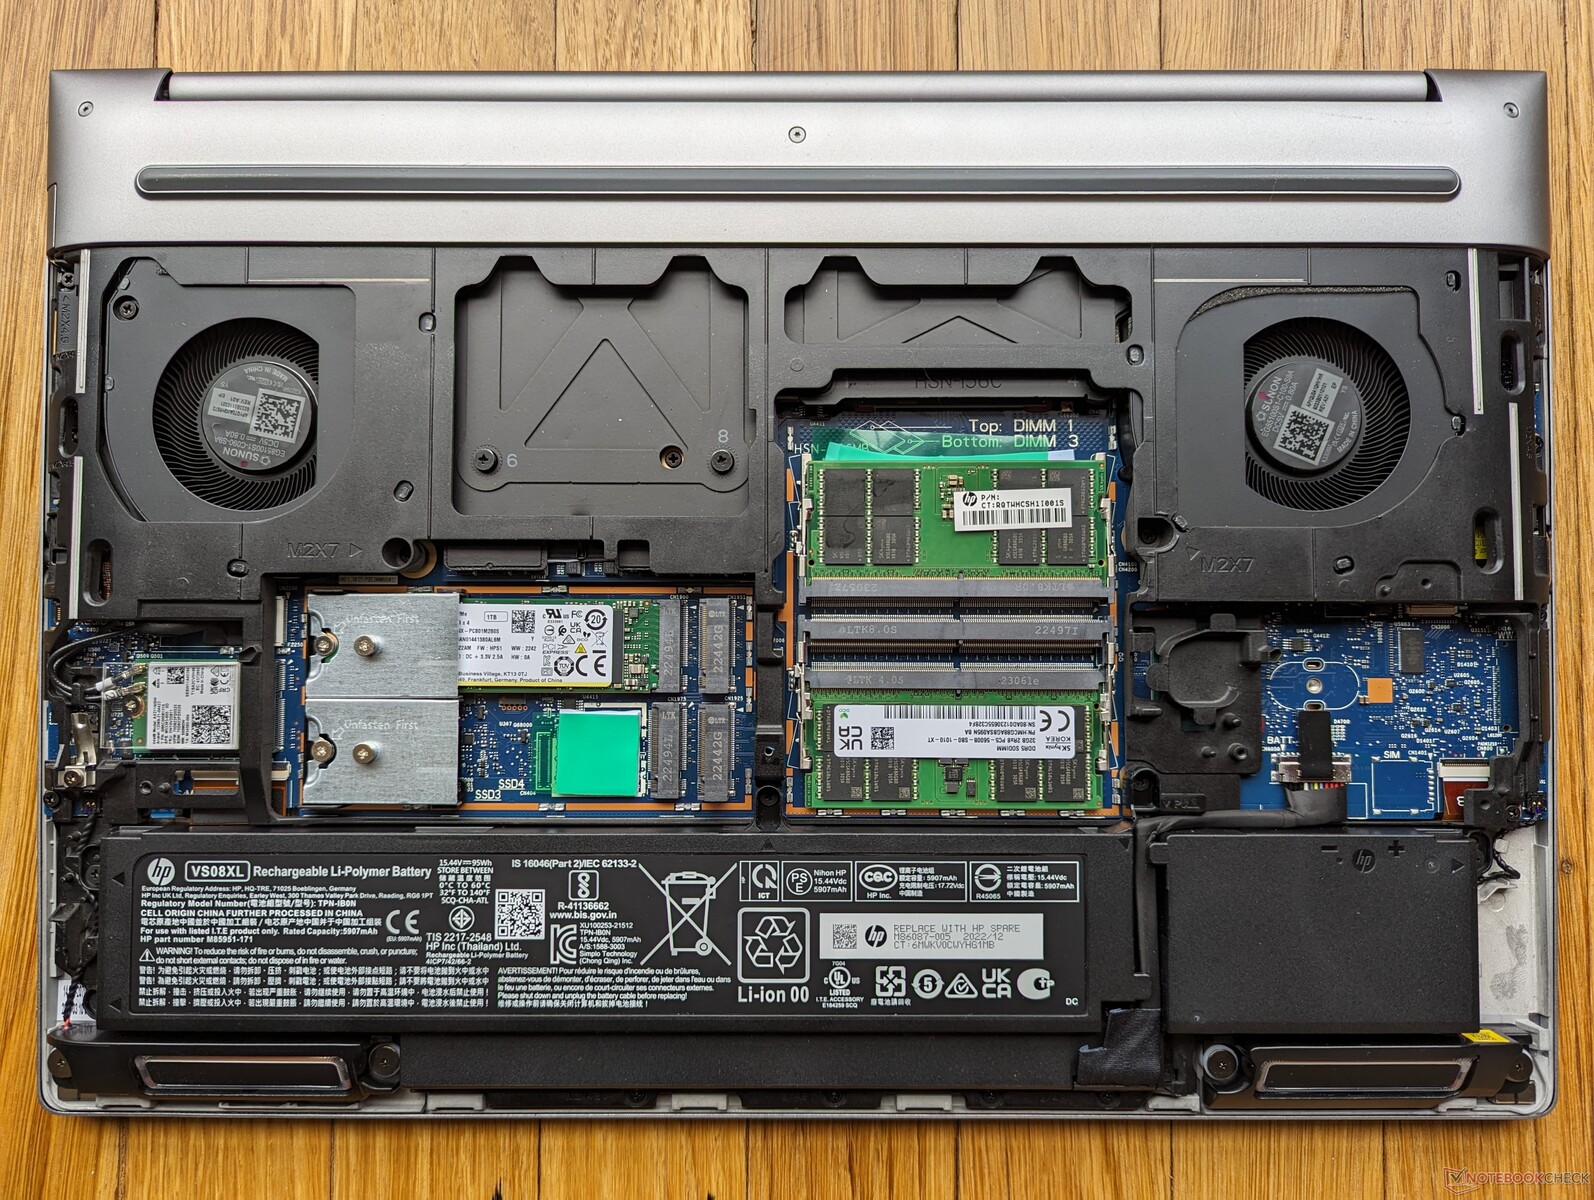
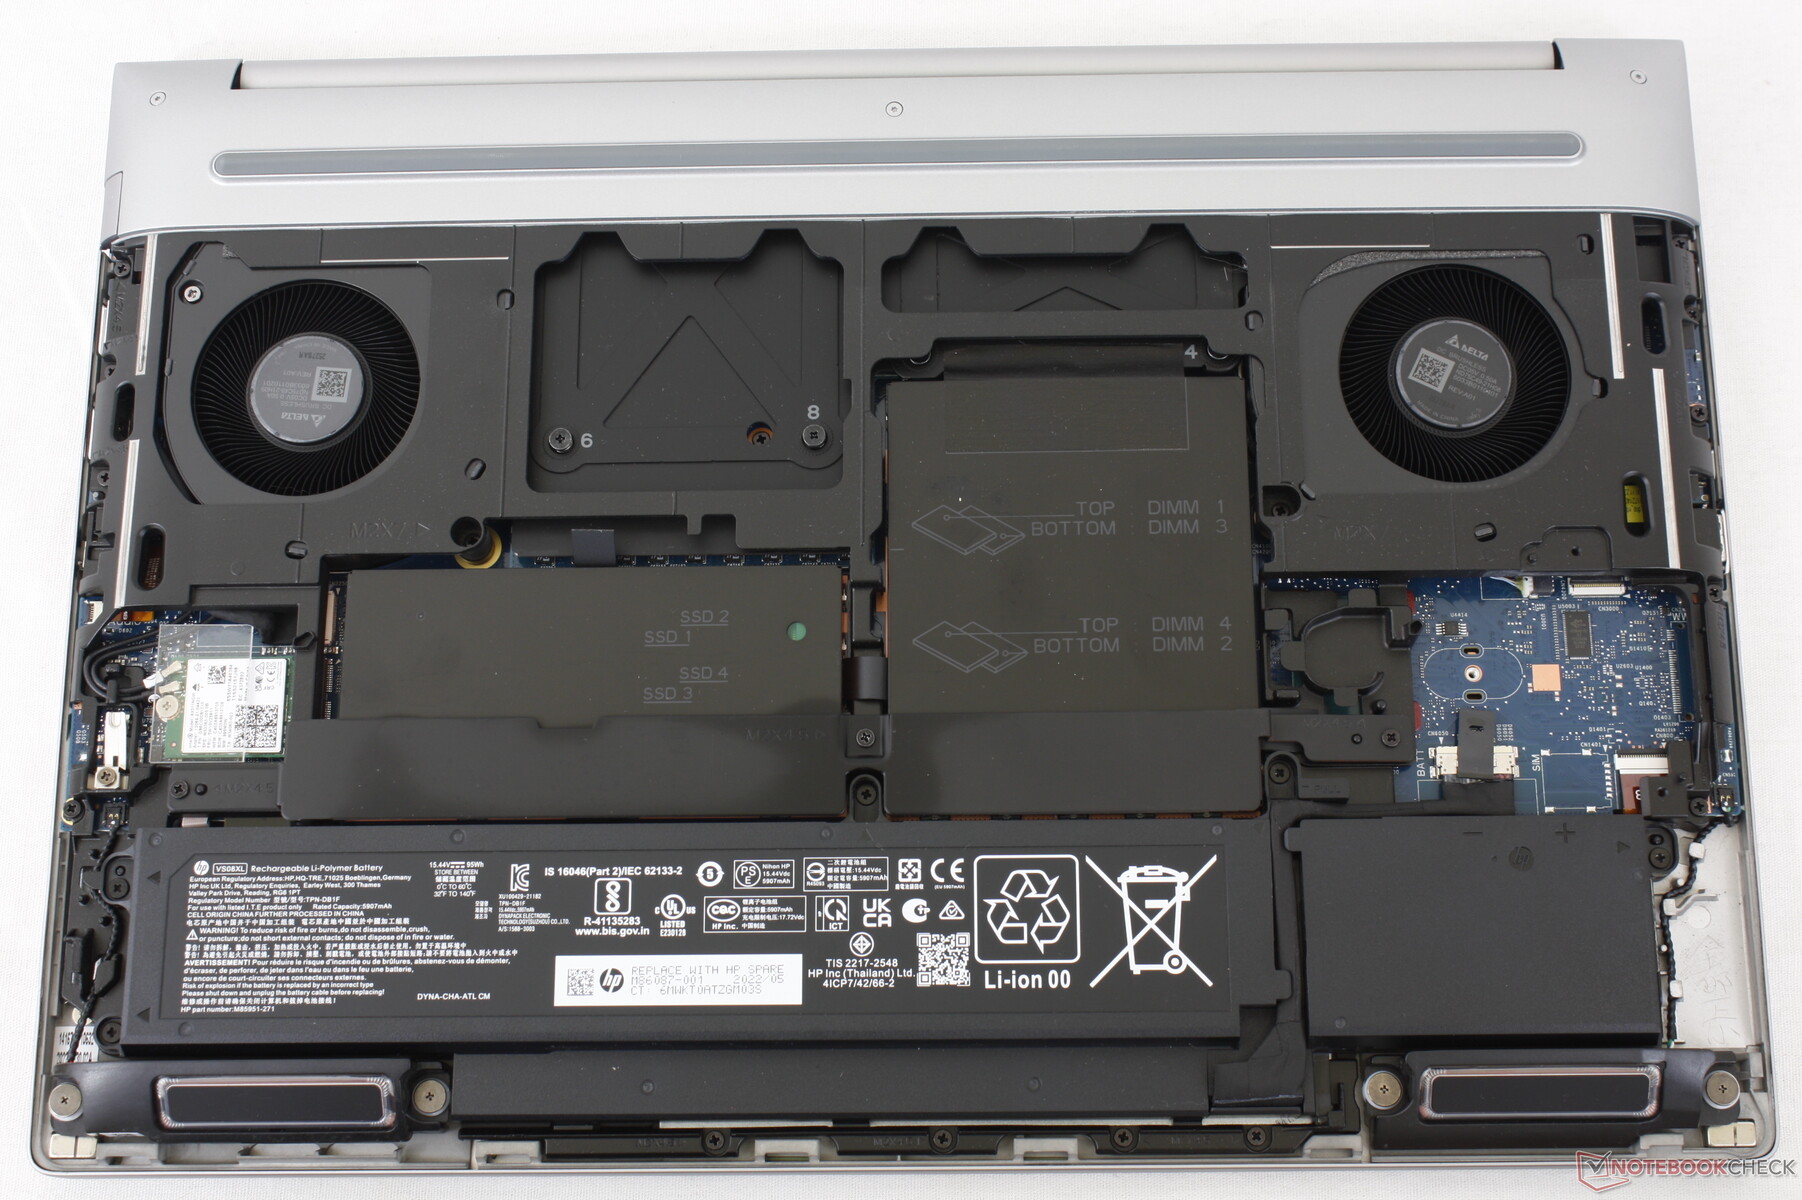
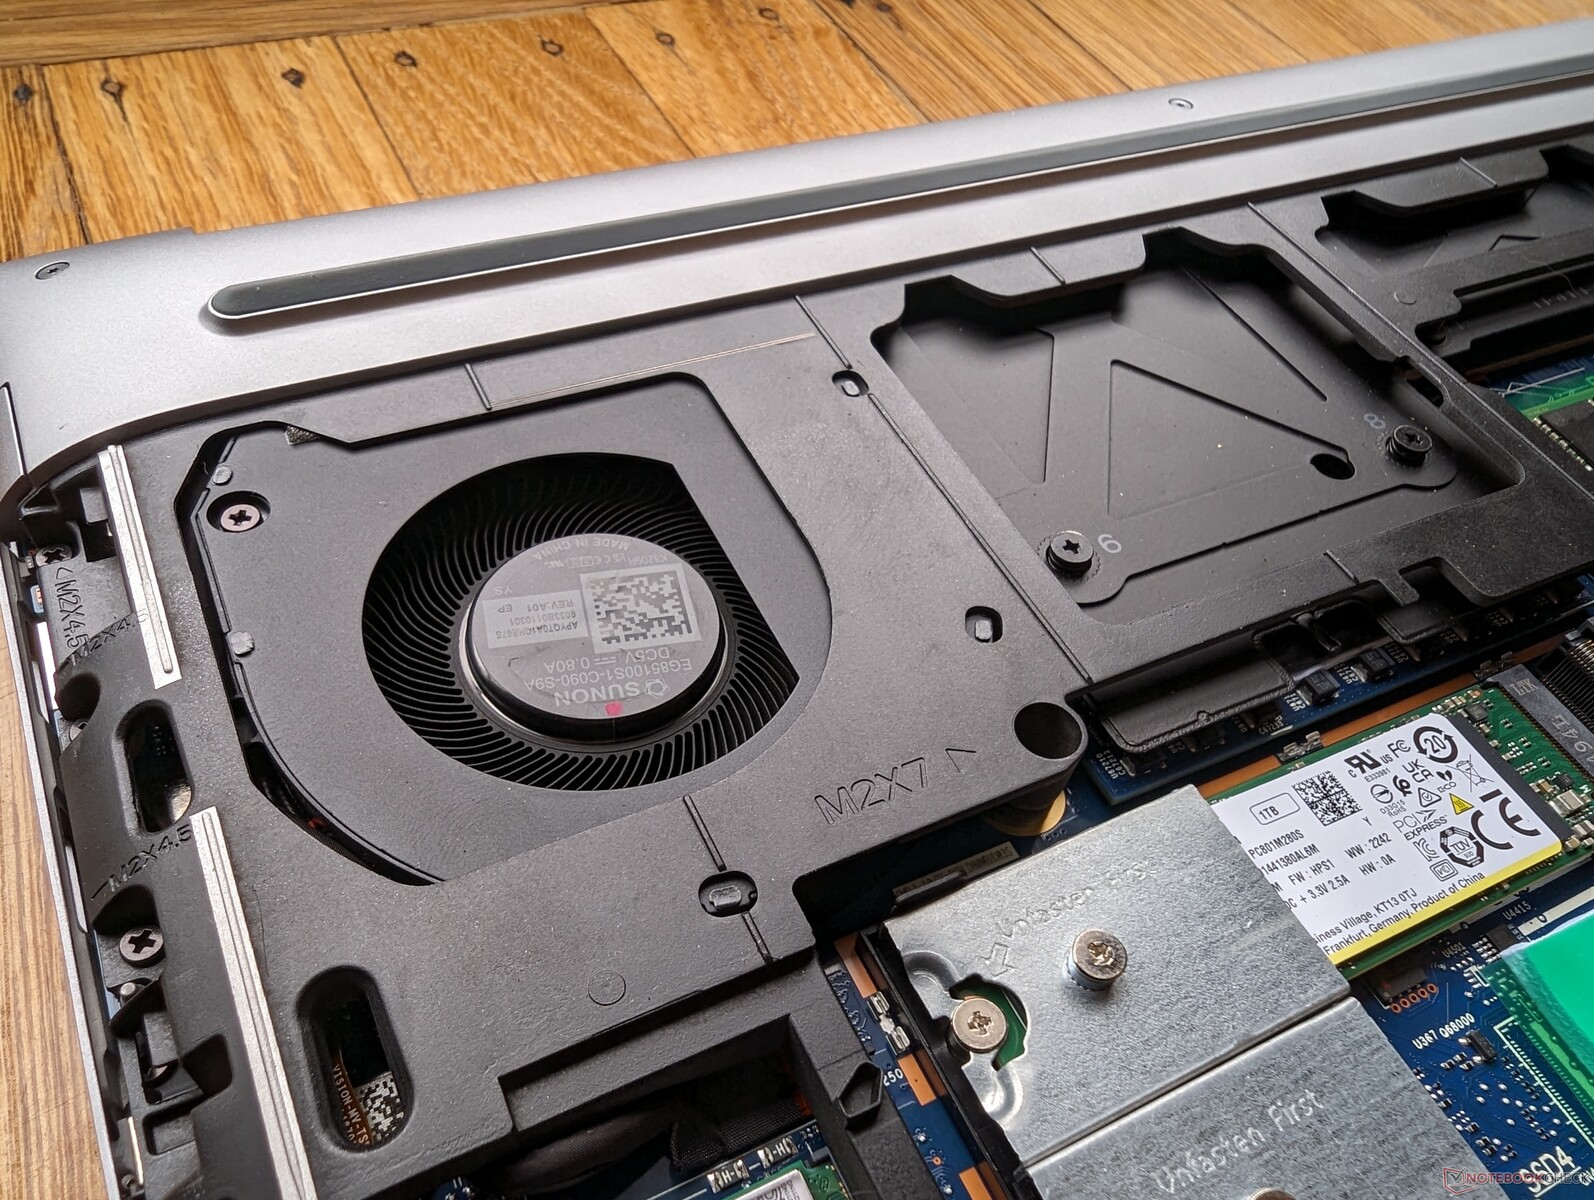
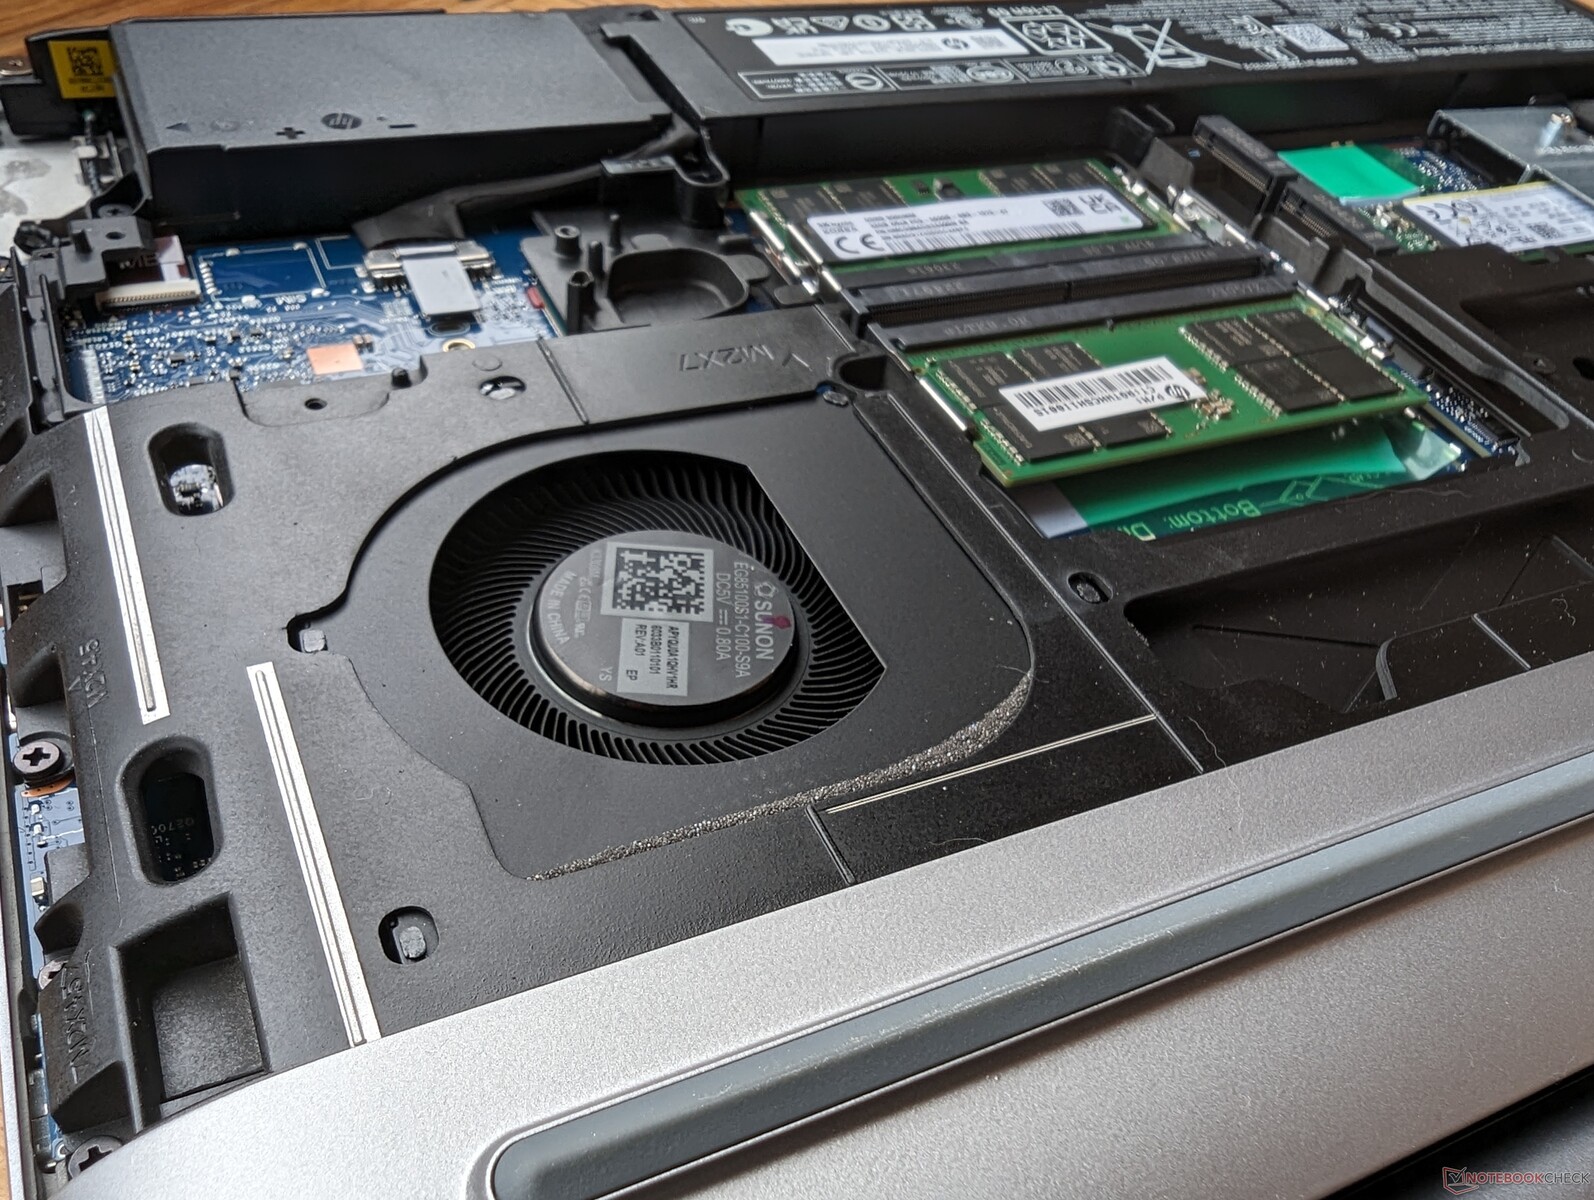
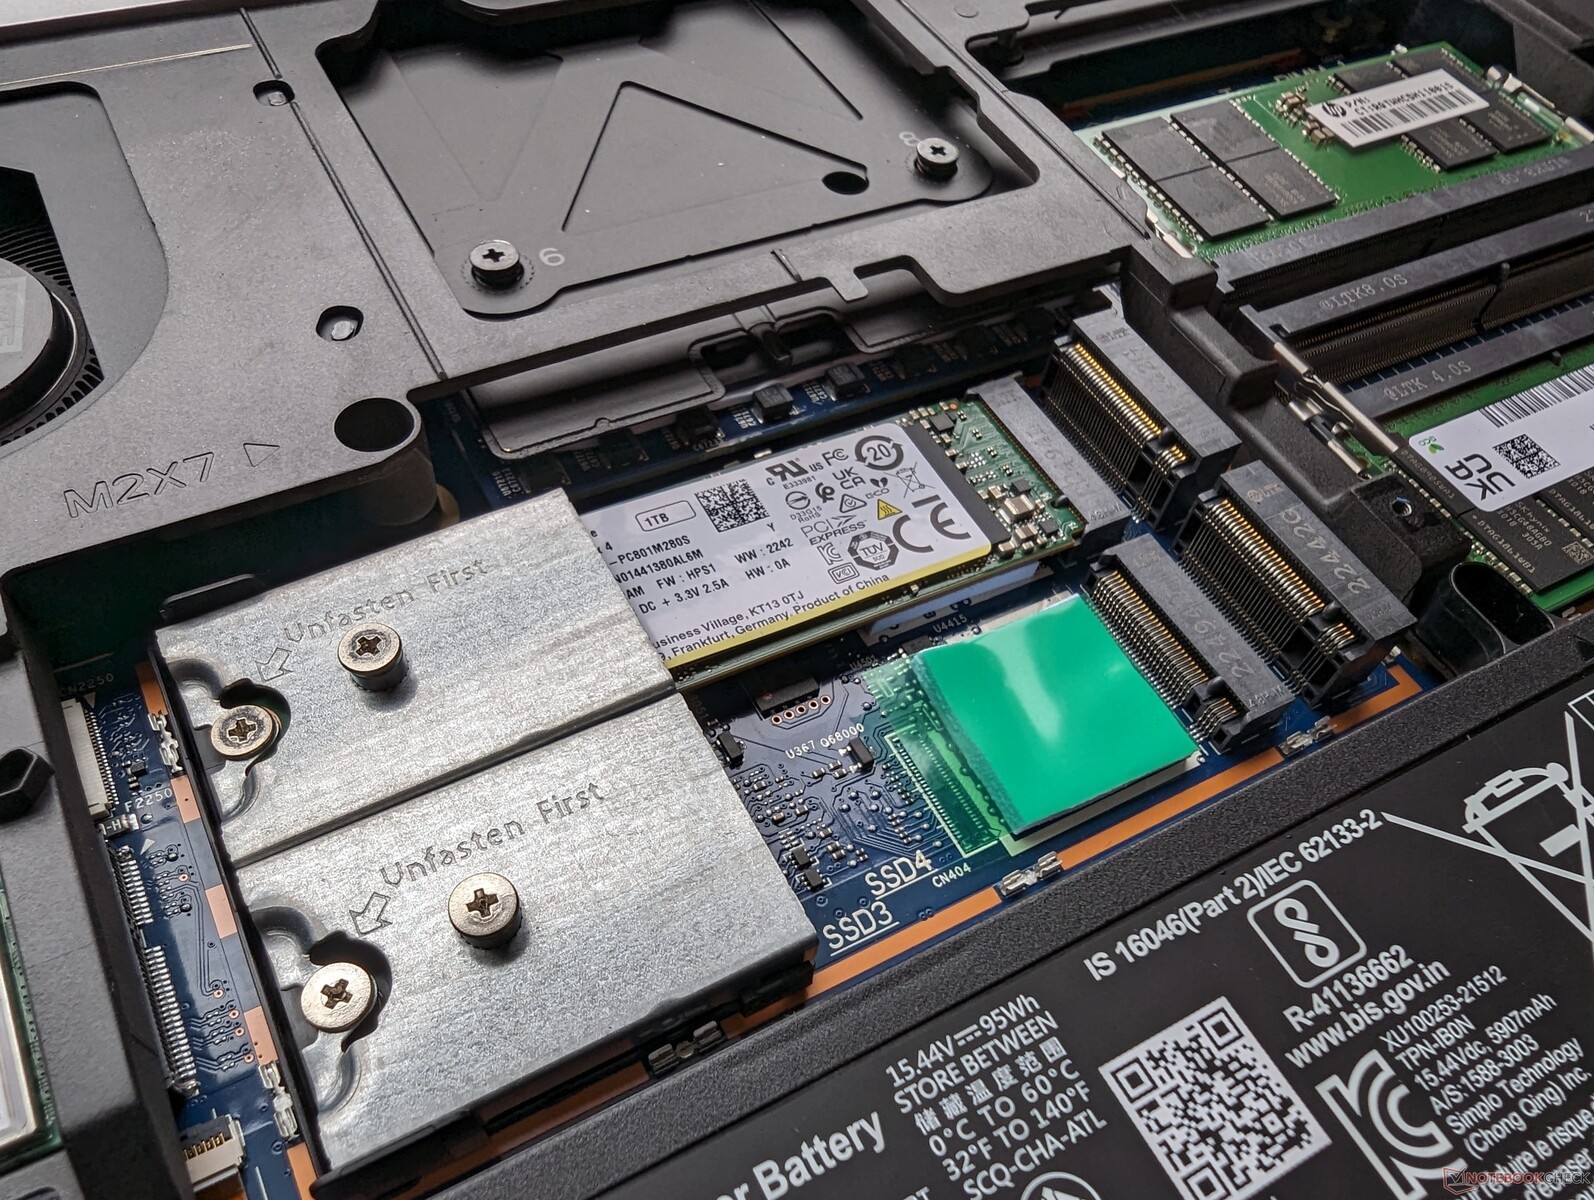
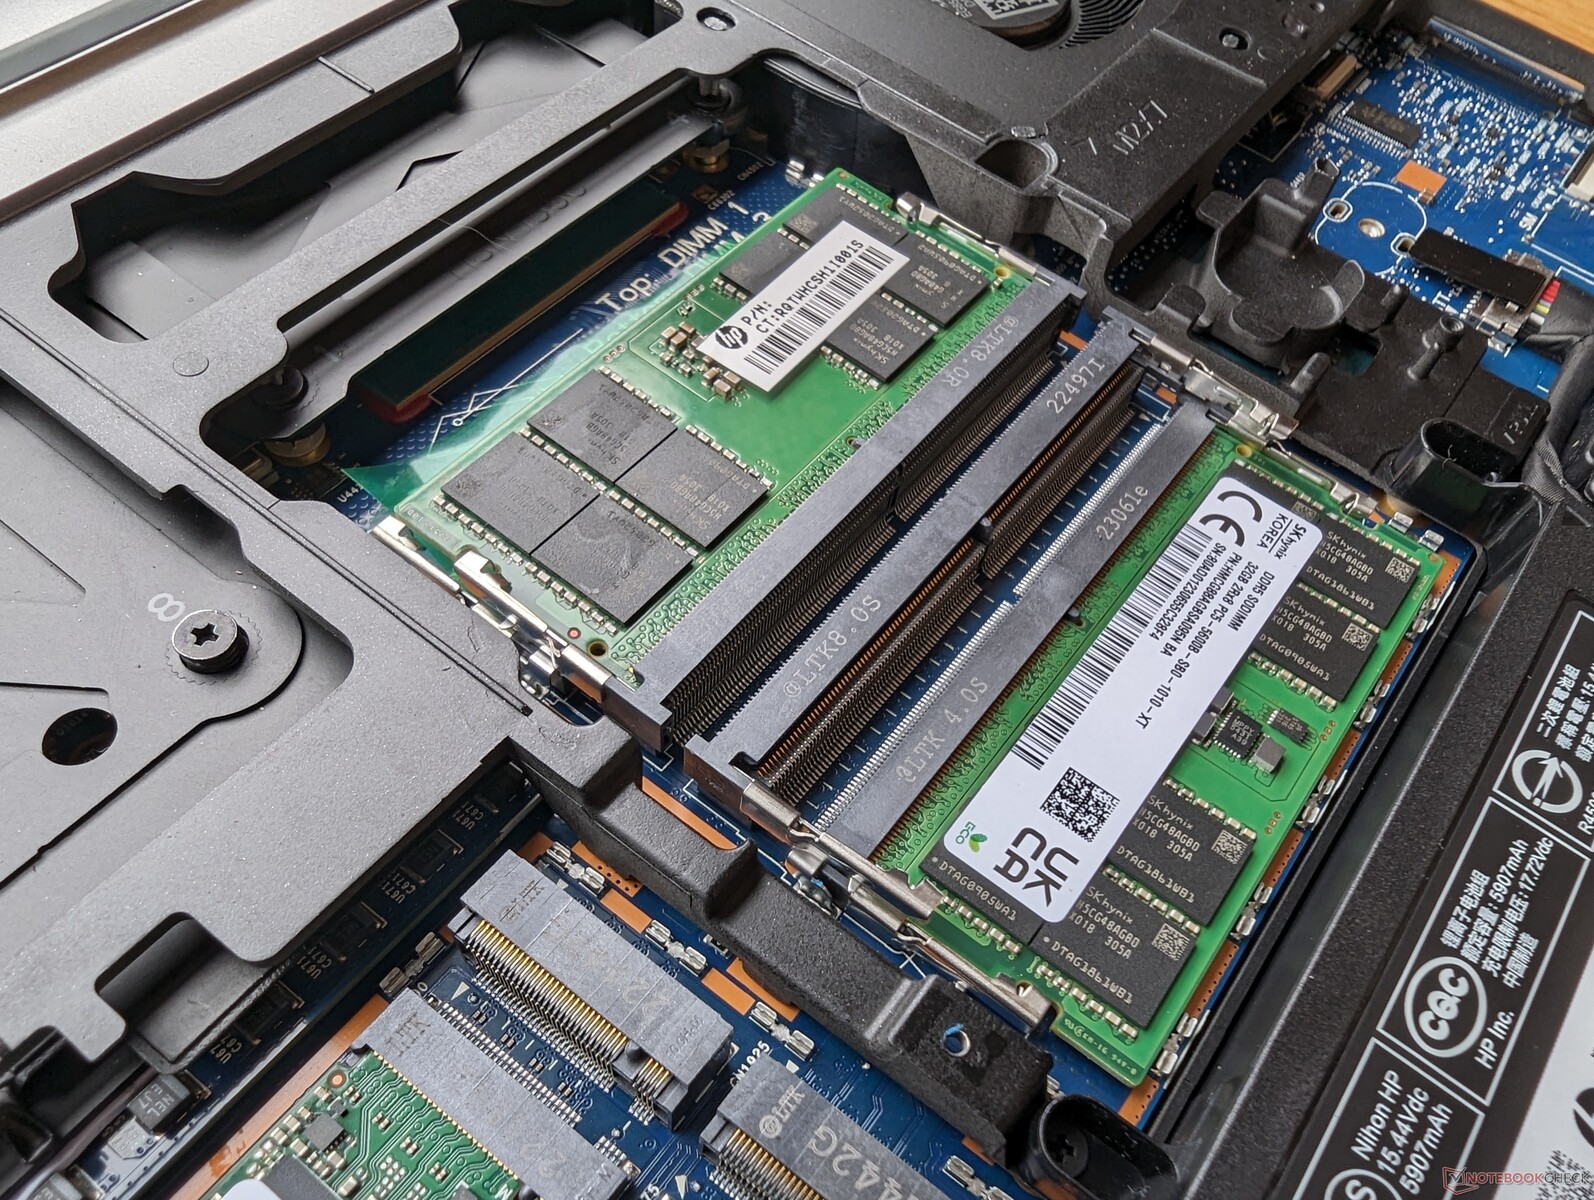
Onderhoud is "zonder gereedschap" in de zin dat het bodempaneel zonder gereedschap kan worden verwijderd. Eenmaal binnen is echter een schroevendraaier nodig om de metalen plaat te verwijderen die de vier SSD's en vier RAM-modules beschermt. Je hebt dus nog steeds een schroevendraaier nodig voor zinvolle upgrades.
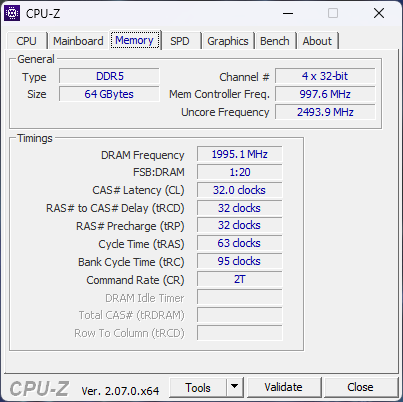
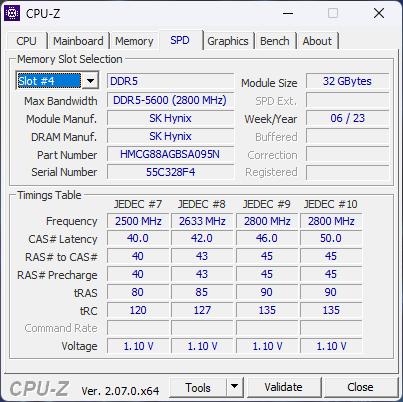
Tot 128 GB RAM wordt ondersteund, zij het slechts tot 4000 MT/s.
Accessoires en garantie
Er zitten geen extra's in de doos behalve de AC-adapter en papierwerk. HP biedt standaard drie jaar beperkte garantie.
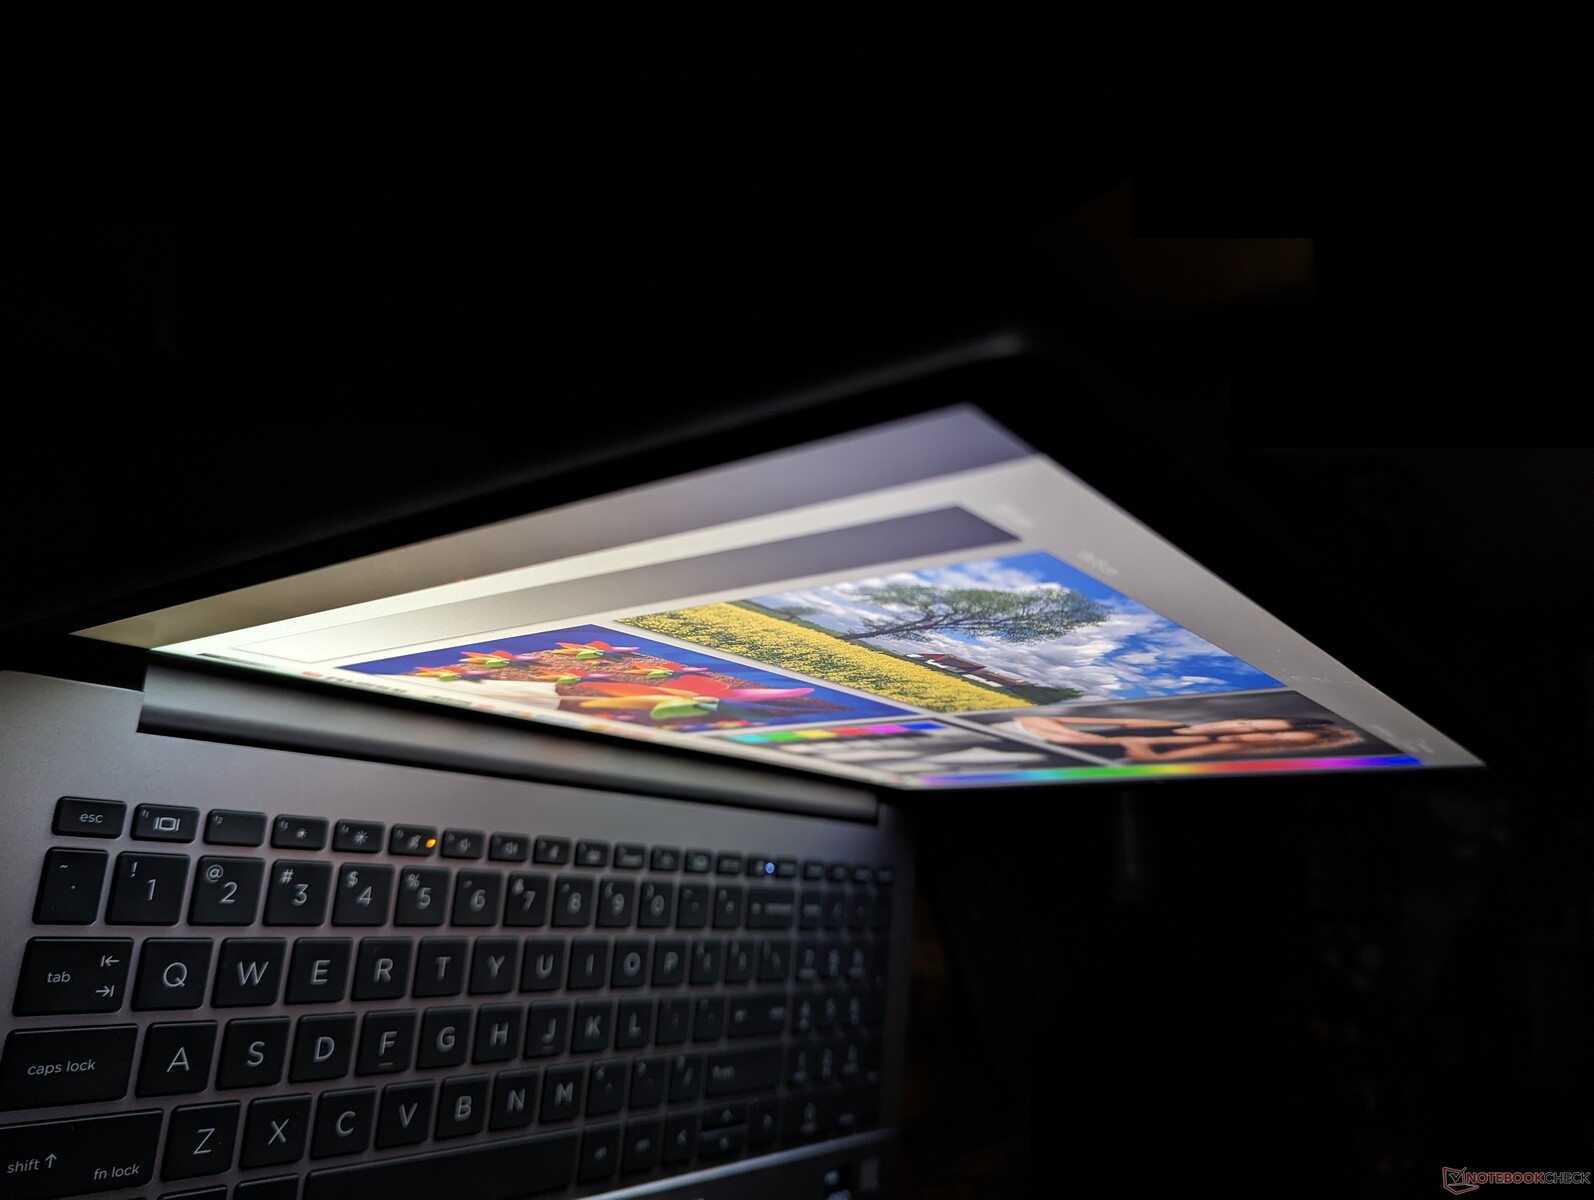
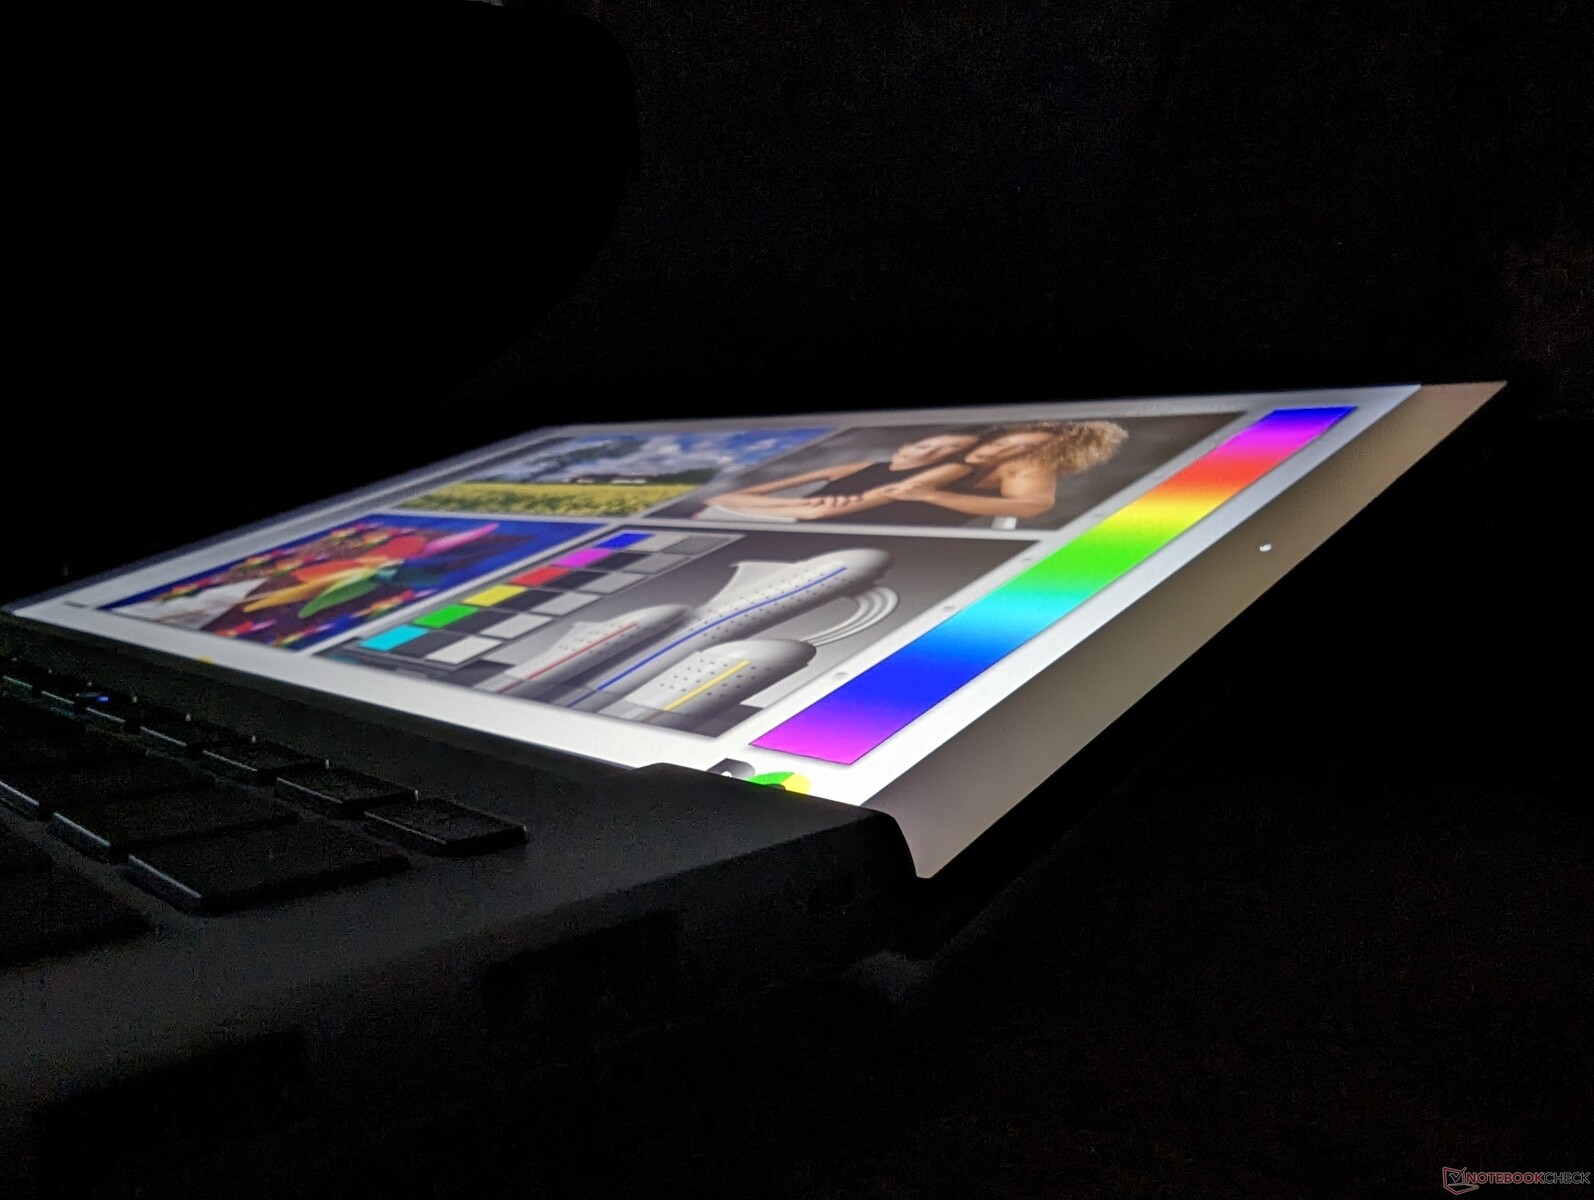
Weergave
De volgende drie eDP+PSR (Panel Self Refresh) schermopties zijn beschikbaar voor de 16-inch Fury 16 G10. Onze specifieke revieweenheid is geconfigureerd met de vetgedrukte optie:
- 3840 x 2400, 60 Hz, OLED, aanraakscherm, 400 nits, 100% DCI-P3, glanzend
- 3840 x 2400, 120 Hz, IPS, non-touch, 500 nits, 100% DCI-P3, mat
- 1920 x 1200, 60 Hz, IPS, non-touch, 1000 nits, 100% sRGB, mat
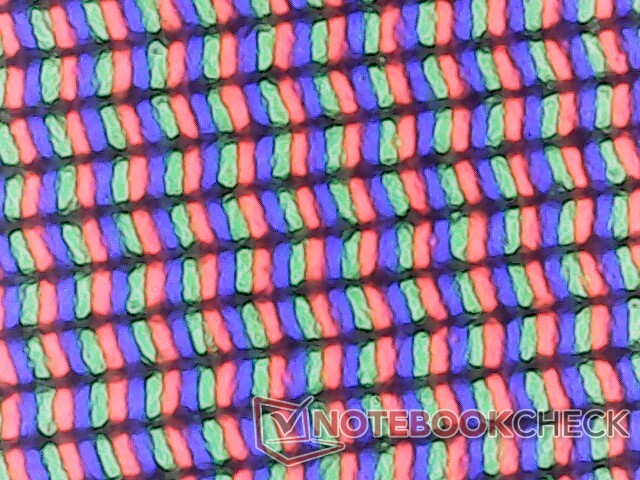
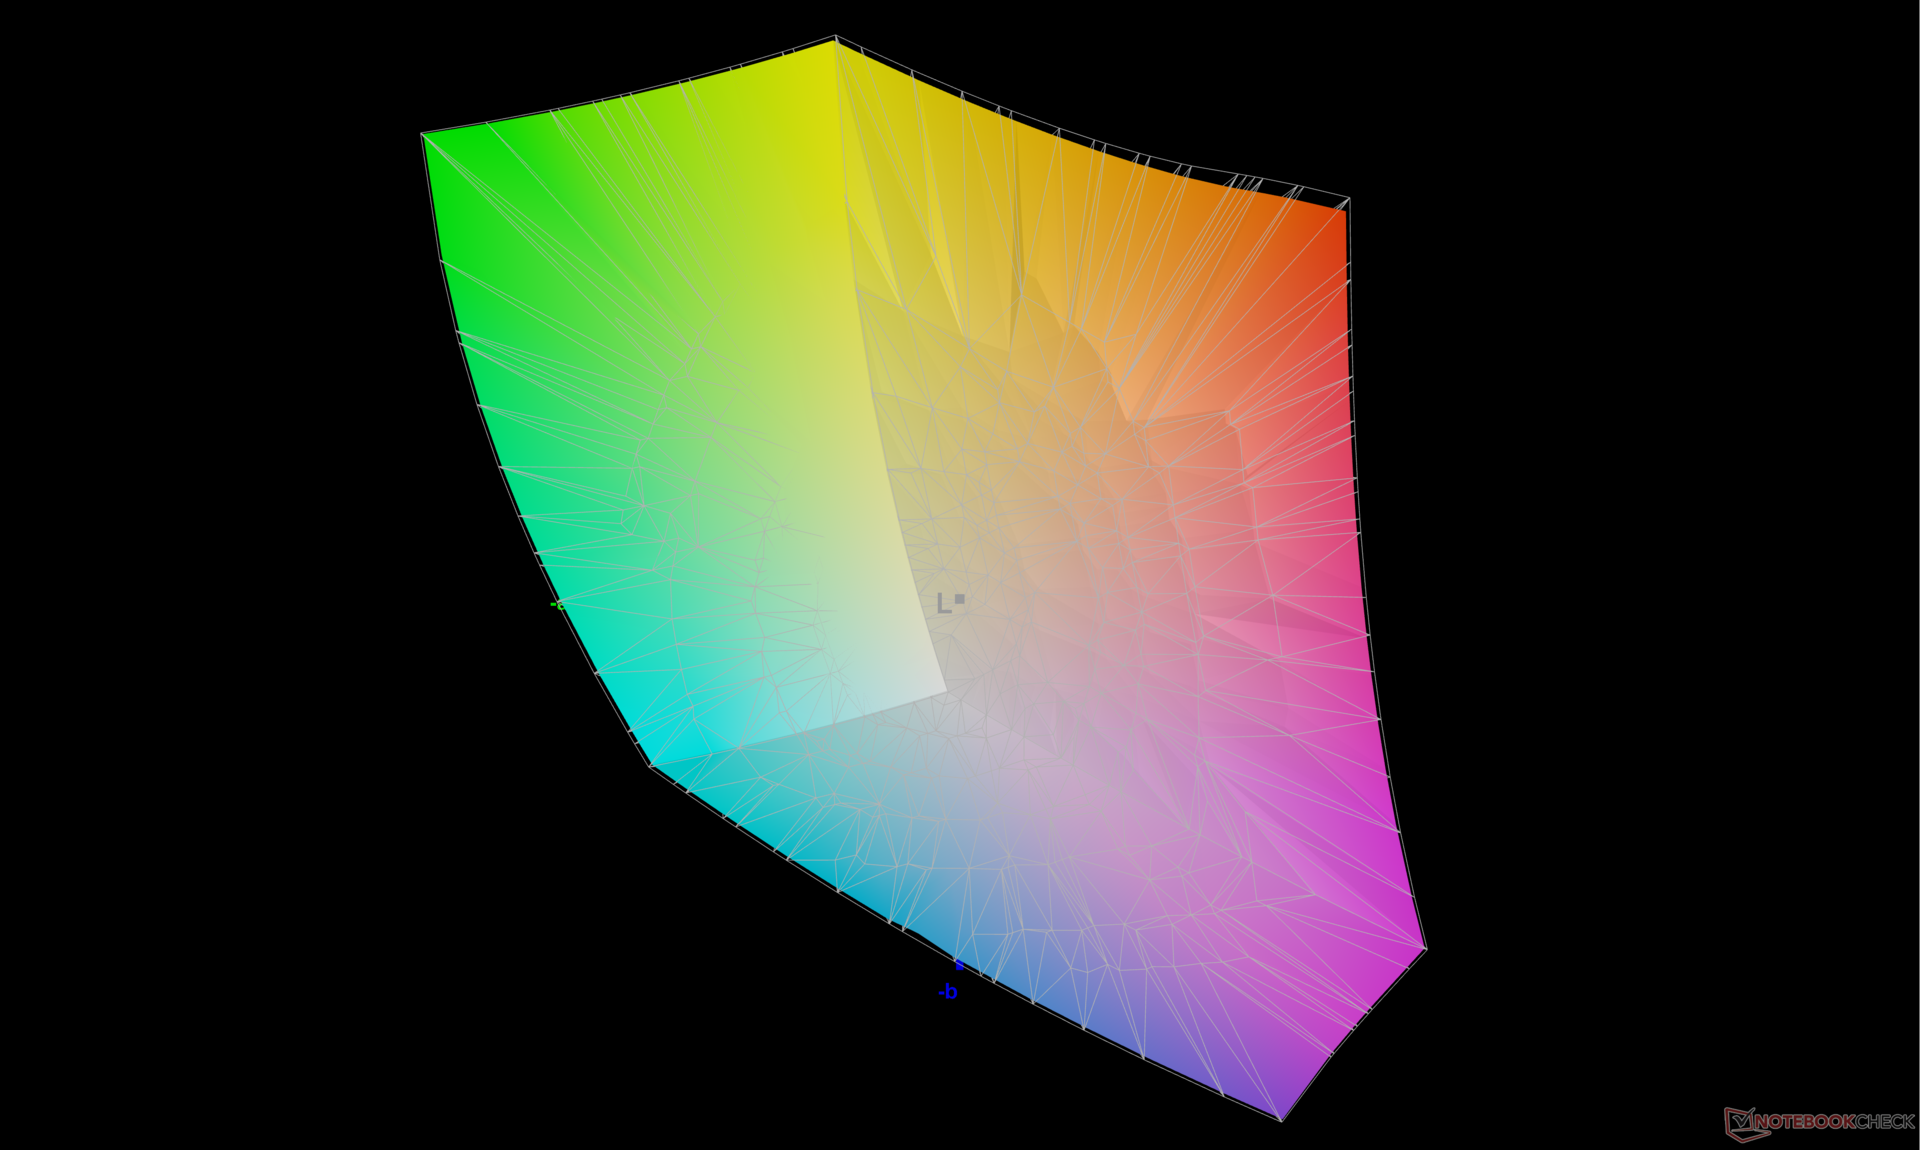
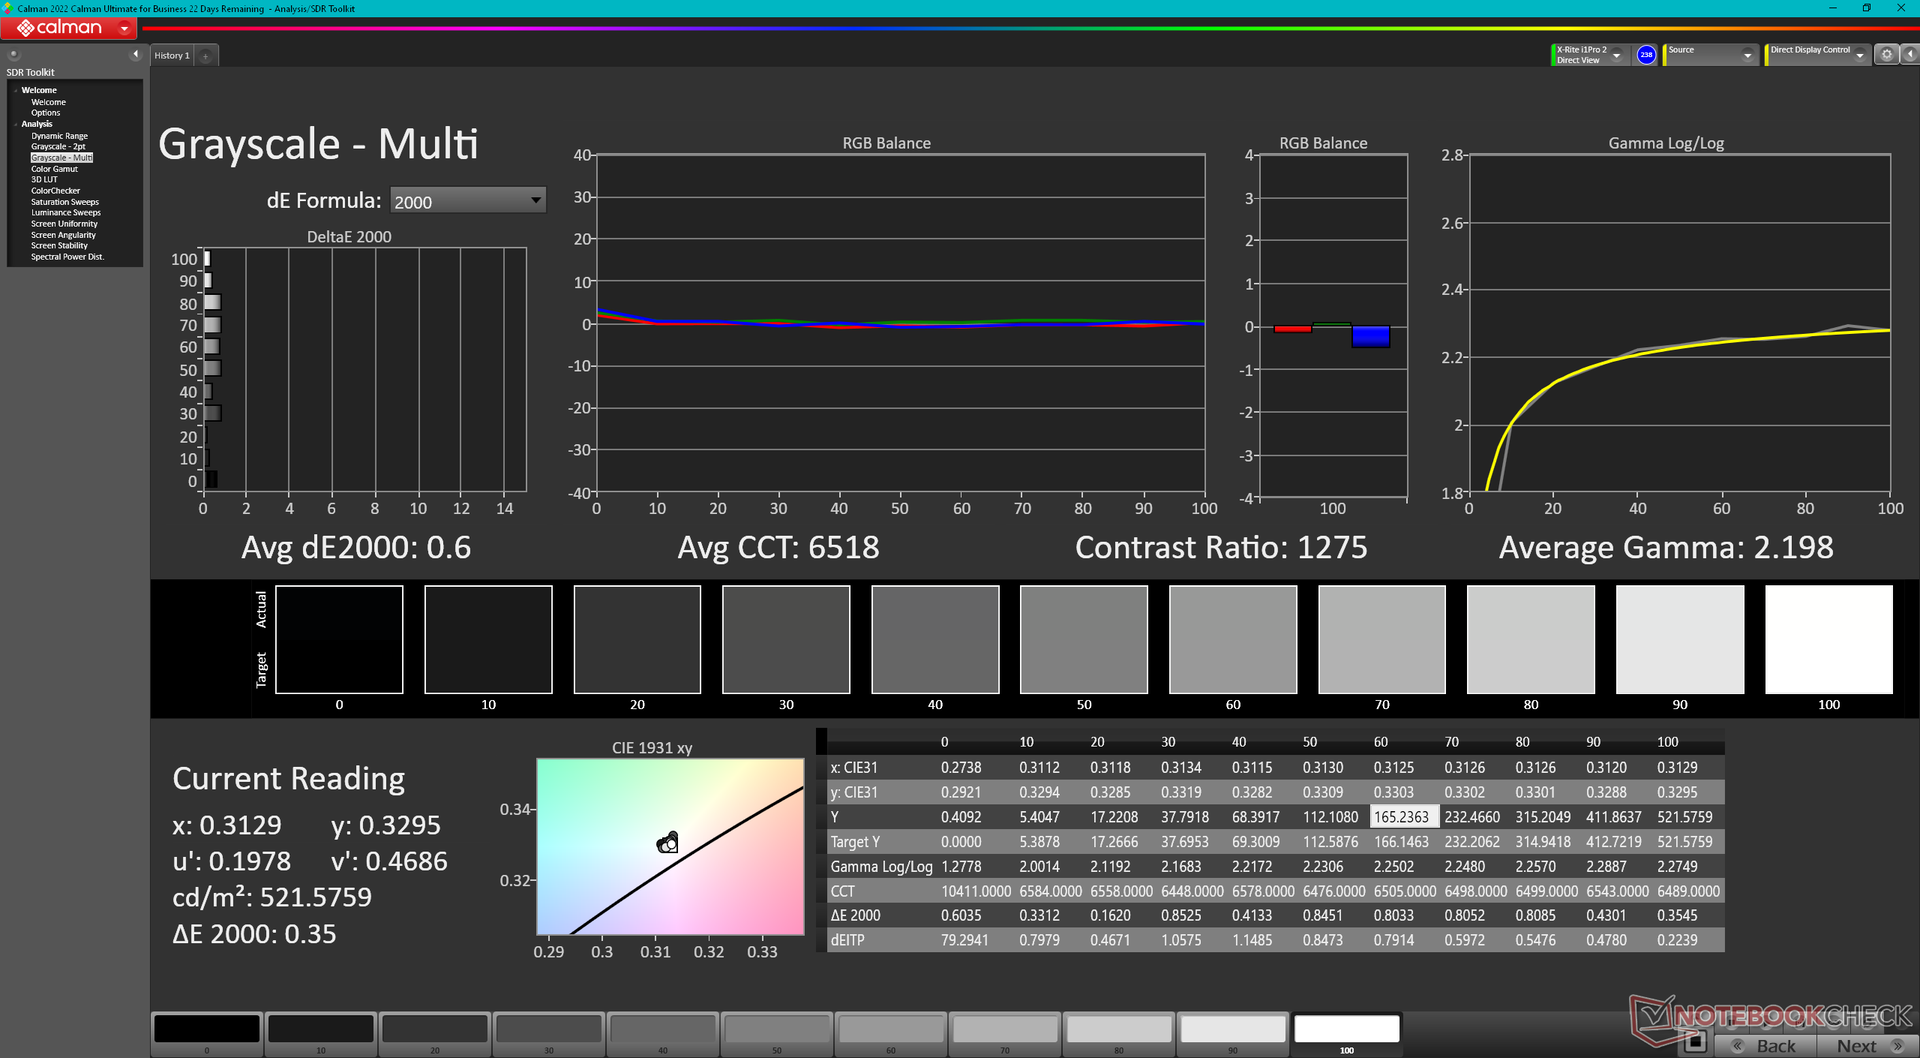
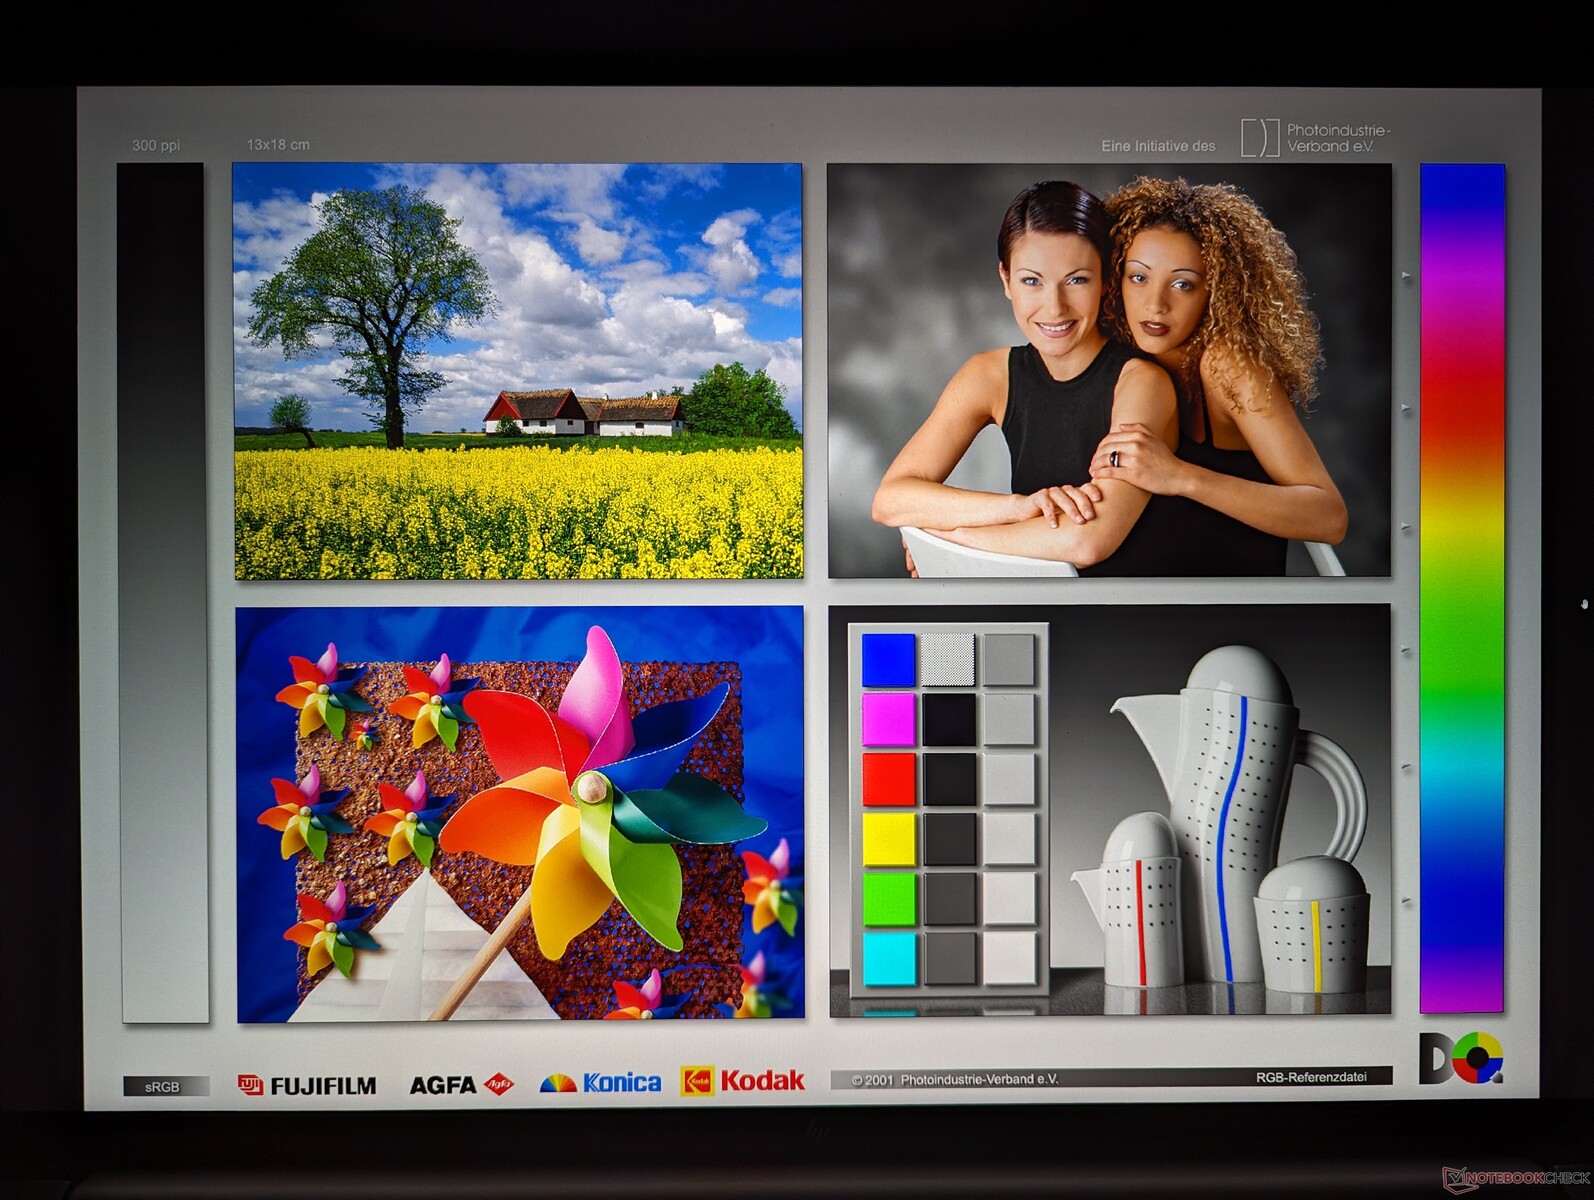
Onze onafhankelijke metingen met een X-Rite colorimeter bevestigen zowel de volledige P3-dekking als de maximale helderheid van 500 nits zoals geadverteerd. De 120 Hz verversingssnelheid is ook een merkbare verbetering ten opzichte van het 60 Hz paneel op de Fury 16 G9 van vorig jaar. Dit is een van de weinige werkstations op de markt van dit moment met een 4K IPS paneel met zowel P3 kleuren als een snelle 120 Hz verversingssnelheid.
| |||||||||||||||||||||||||
Helderheidsverdeling: 90 %
Helderheid in Batterij-modus: 514.6 cd/m²
Contrast: 1119:1 (Zwart: 0.46 cd/m²)
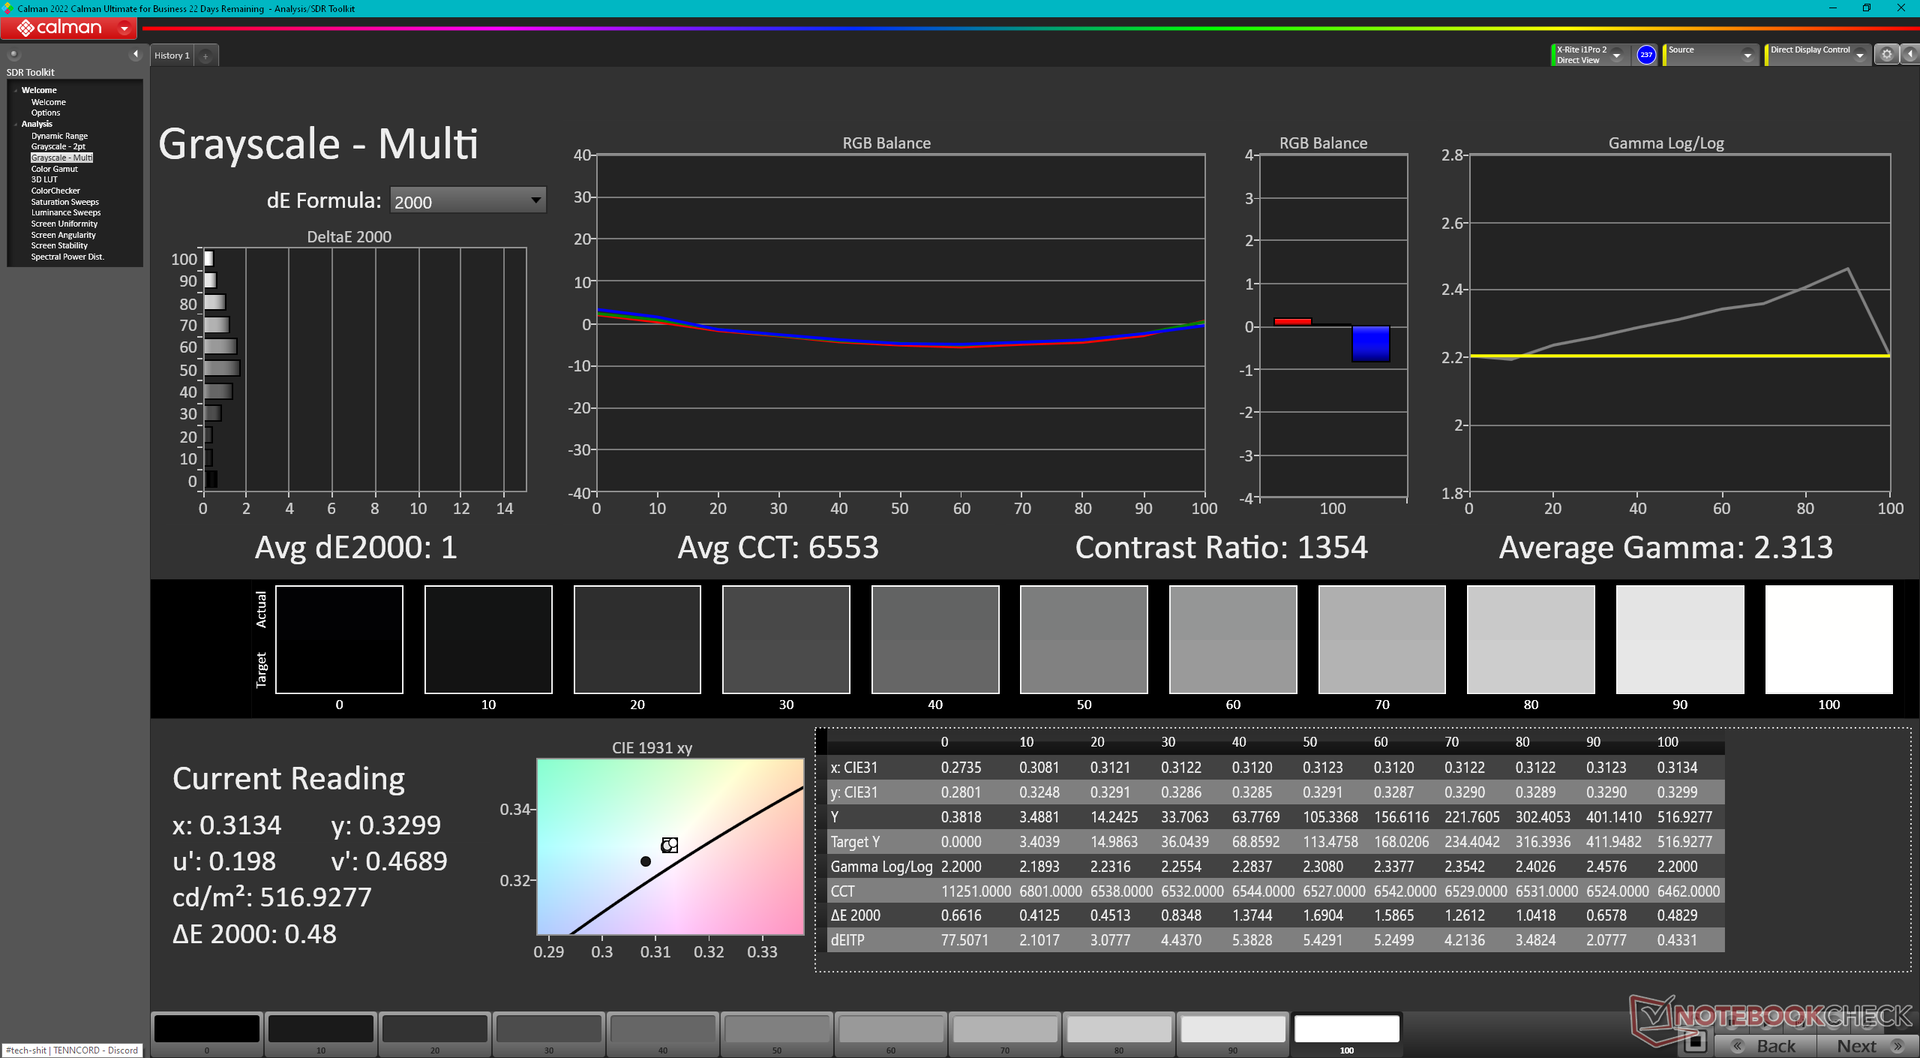
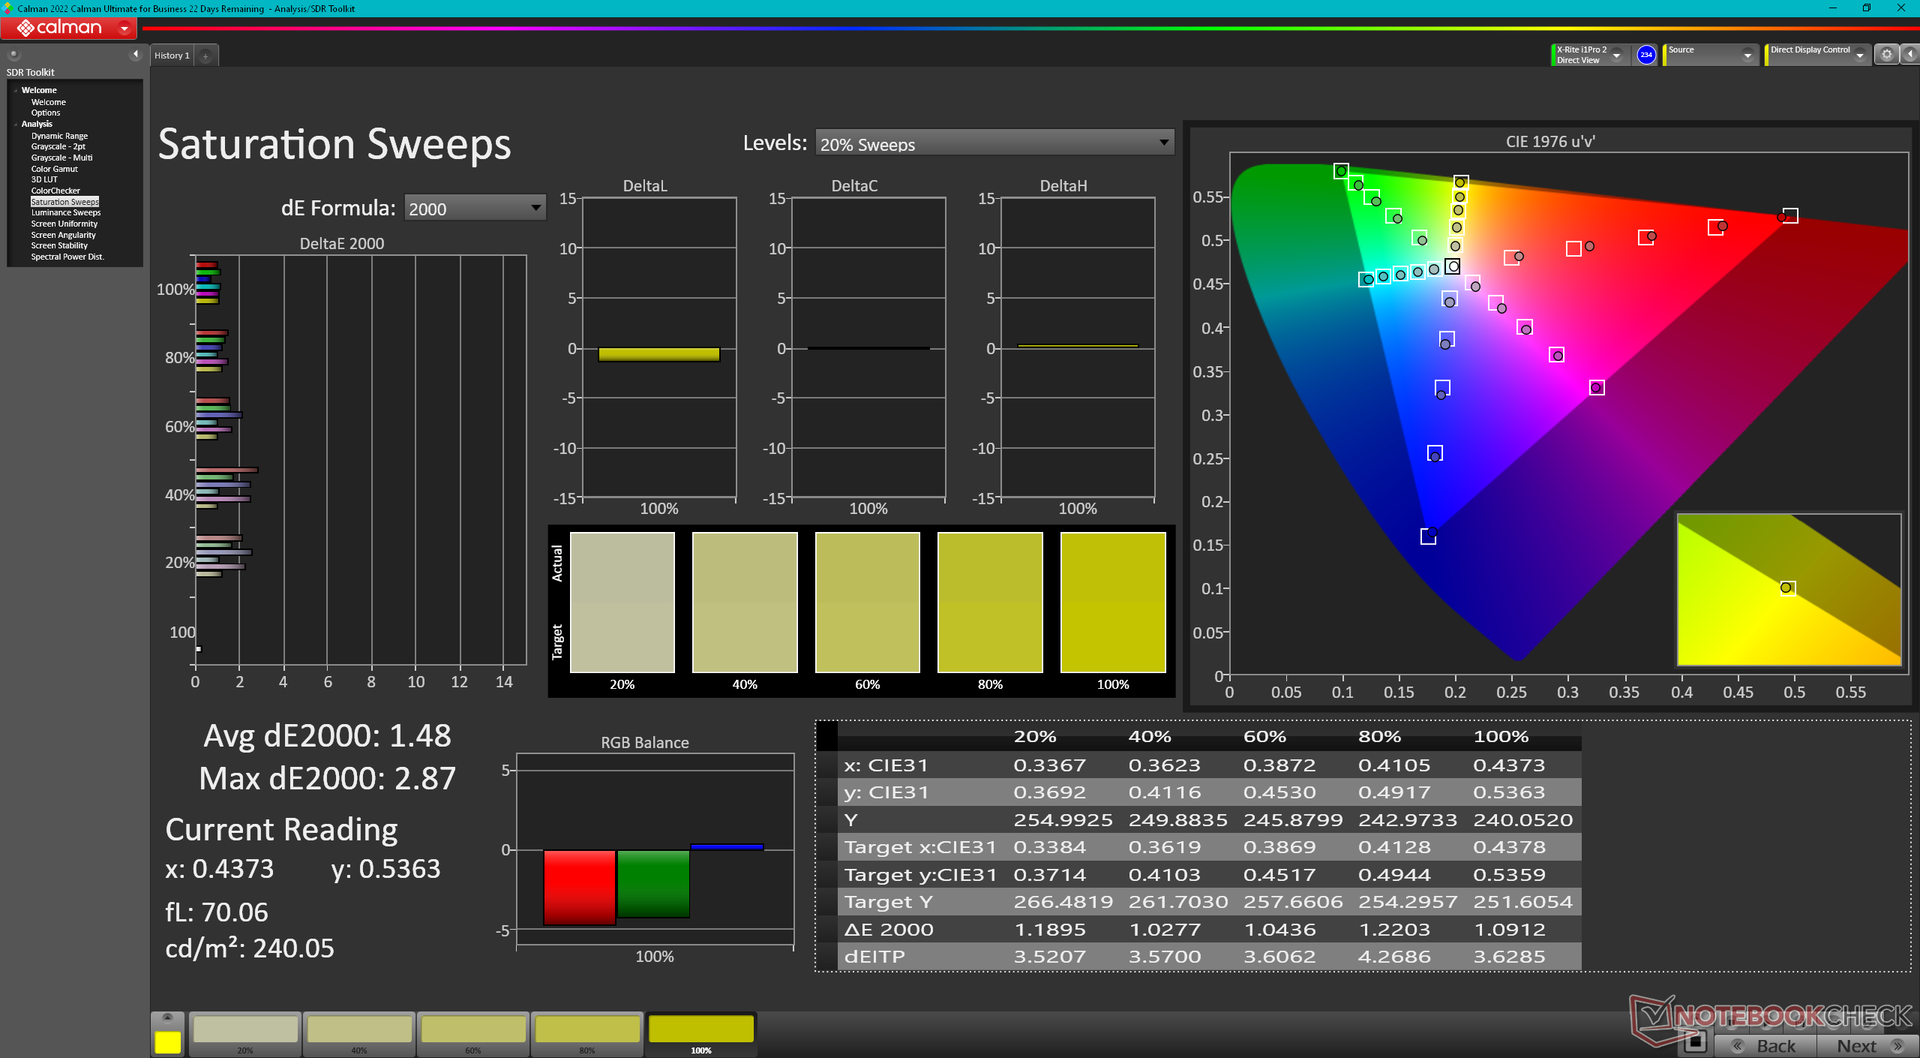
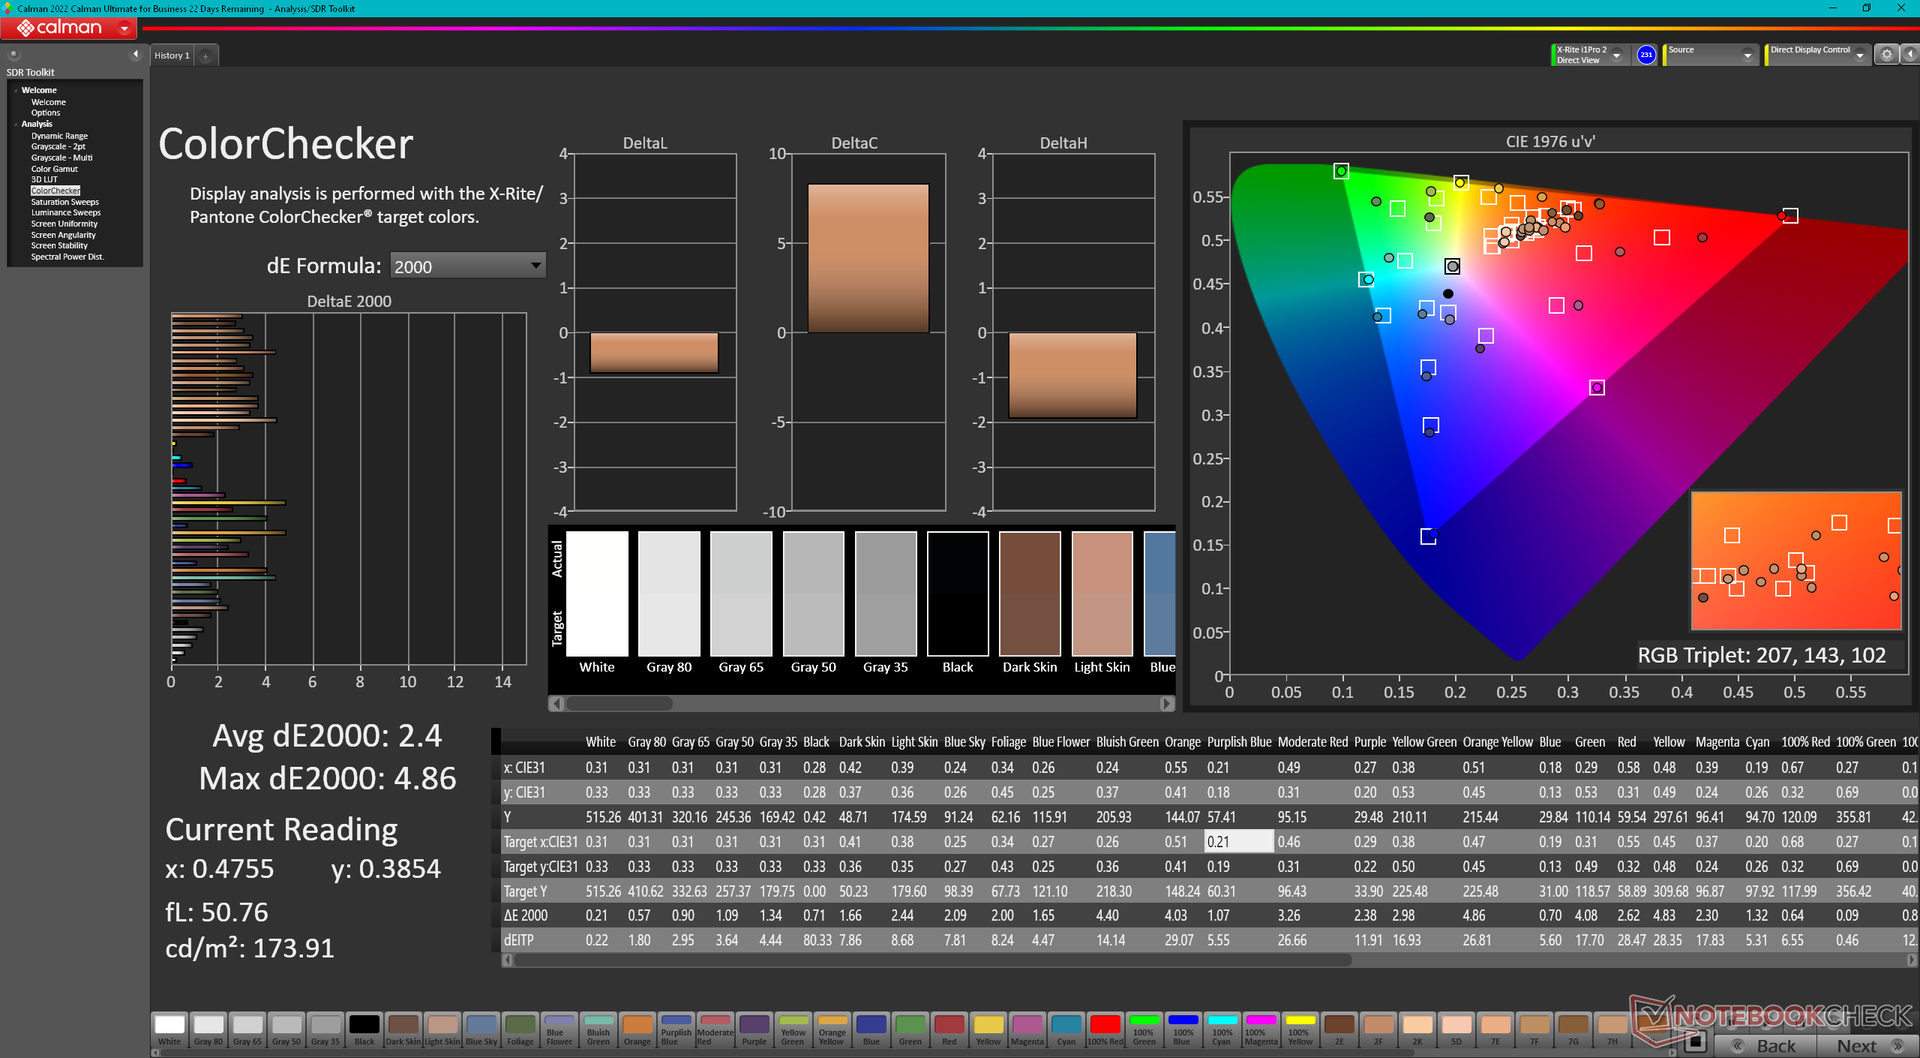
ΔE ColorChecker Calman: 2.4 | ∀{0.5-29.43 Ø4.71}
calibrated: 0.4
ΔE Greyscale Calman: 1 | ∀{0.09-98 Ø4.96}
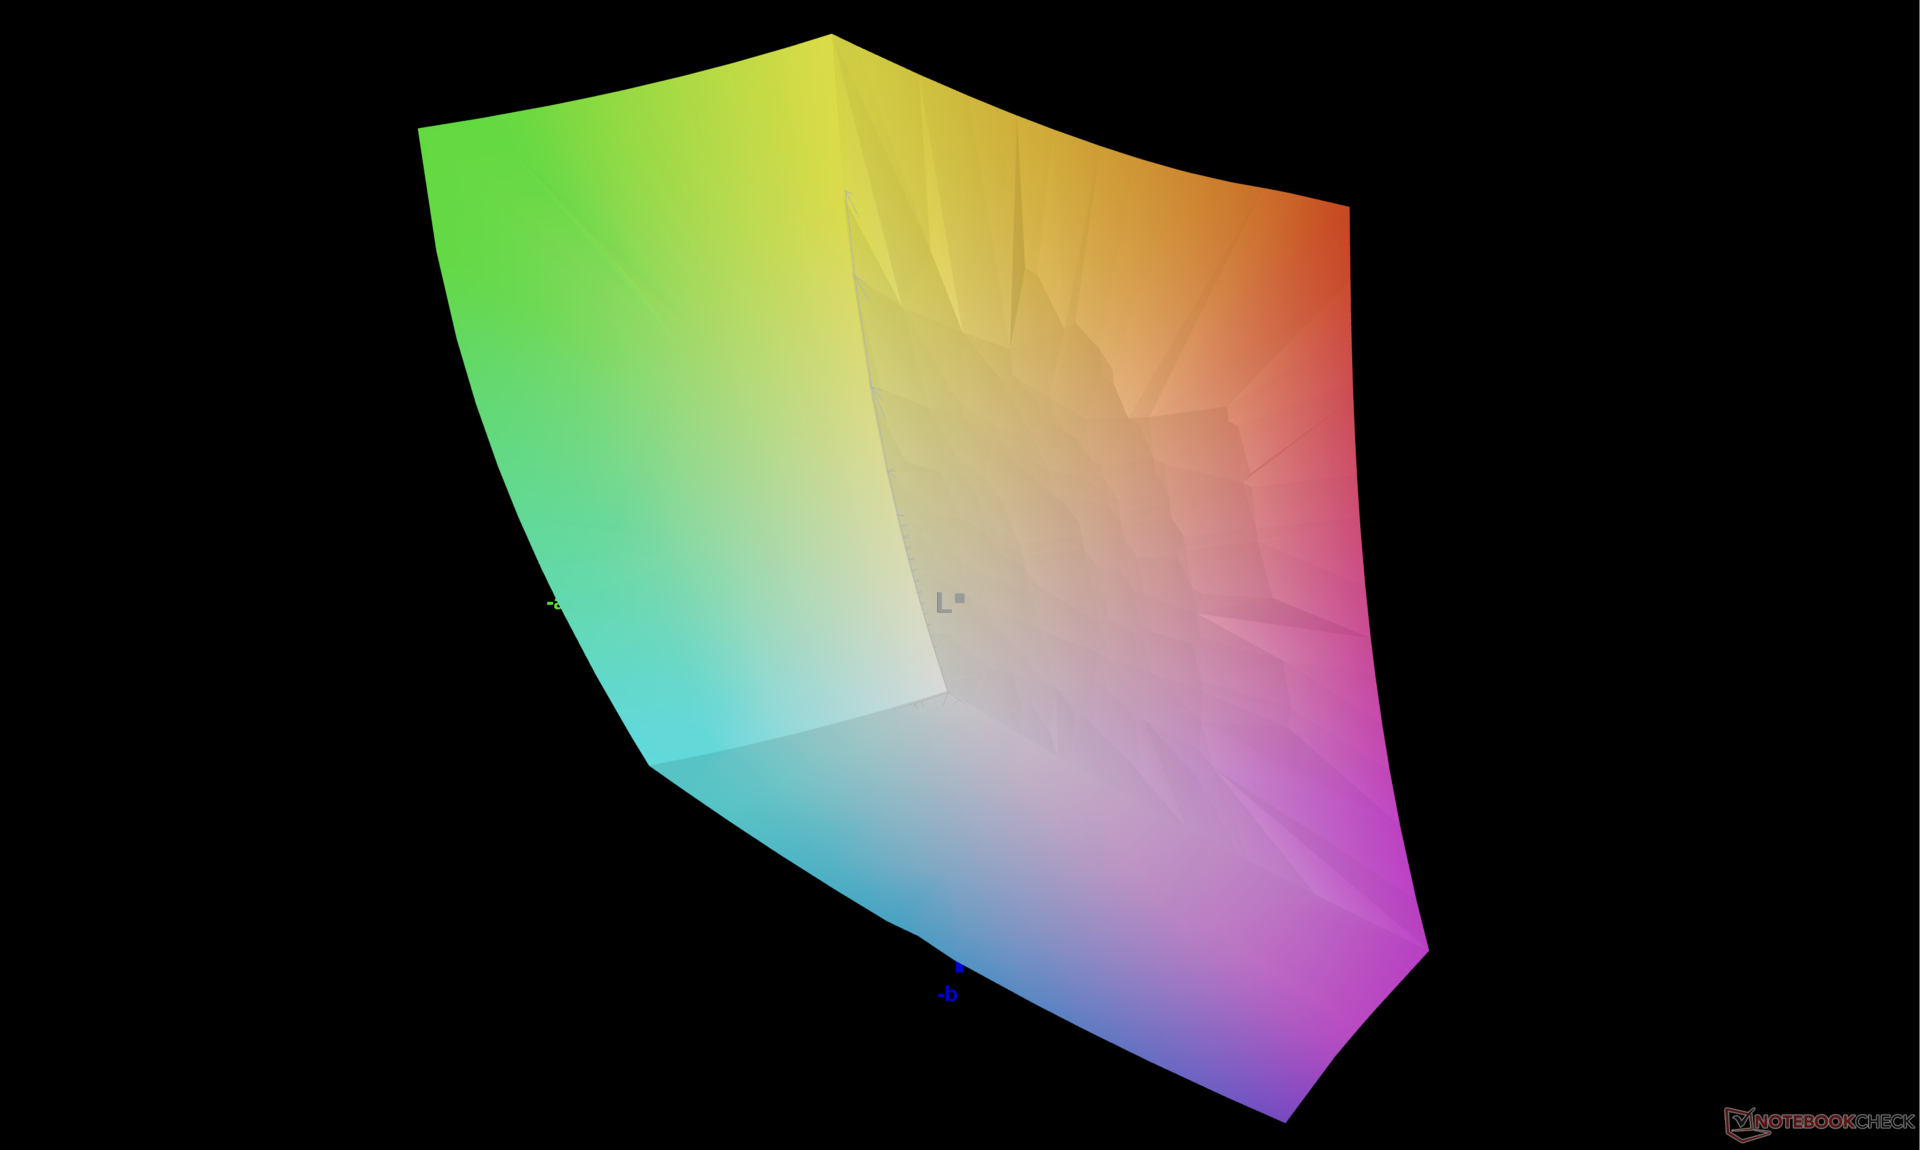
86.2% AdobeRGB 1998 (Argyll 3D)
99.9% sRGB (Argyll 3D)
98% Display P3 (Argyll 3D)
Gamma: 2.3
CCT: 6553 K
| HP ZBook Fury 16 G10 AUO87A8, IPS, 3840x2400, 16" | HP ZBook Fury 16 G9 BOE0A52, IPS, 3840x2400, 16" | Dell Precision 5000 5680 Samsung 160YV03, OLED, 3840x2400, 16" | Lenovo ThinkPad P16 G1 RTX A5500 LP160UQ1-SPB1, IPS, 3840x2400, 16" | MSI CreatorPro Z16P B12UKST B160QAN02.N, IPS, 2560x1600, 16" | Asus ProArt StudioBook 16 W7600H5A-2BL2 ATNA60YV02-0, OLED, 3840x2400, 16" | |
|---|---|---|---|---|---|---|
| Display | -0% | 5% | -2% | 0% | 5% | |
| Display P3 Coverage (%) | 98 | 97.4 -1% | 99.9 2% | 82.9 -15% | 97.6 0% | 99.9 2% |
| sRGB Coverage (%) | 99.9 | 99.9 0% | 100 0% | 98.9 -1% | 99.9 0% | 100 0% |
| AdobeRGB 1998 Coverage (%) | 86.2 | 86.3 0% | 97.5 13% | 95.9 11% | 87.4 1% | 98.6 14% |
| Response Times | -3% | 84% | -283% | 8% | 81% | |
| Response Time Grey 50% / Grey 80% * (ms) | 11.9 ? | 13.7 ? -15% | 1.68 ? 86% | 45.6 ? -283% | 12.8 ? -8% | 2 ? 83% |
| Response Time Black / White * (ms) | 9.6 ? | 8.6 ? 10% | 1.77 ? 82% | 36.8 ? -283% | 7.4 ? 23% | 2 ? 79% |
| PWM Frequency (Hz) | 60 ? | 240 ? | ||||
| Screen | -141% | -72% | -16% | -12% | -102% | |
| Brightness middle (cd/m²) | 514.6 | 530.5 3% | 345.7 -33% | 601.9 17% | 407 -21% | 353 -31% |
| Brightness (cd/m²) | 495 | 476 -4% | 349 -29% | 569 15% | 388 -22% | 360 -27% |
| Brightness Distribution (%) | 90 | 83 -8% | 98 9% | 77 -14% | 88 -2% | 96 7% |
| Black Level * (cd/m²) | 0.46 | 0.57 -24% | 0.47 -2% | 0.36 22% | ||
| Contrast (:1) | 1119 | 931 -17% | 1281 14% | 1131 1% | ||
| Colorchecker dE 2000 * | 2.4 | 2.26 6% | 3.59 -50% | 2.45 -2% | 1.3 46% | 2.45 -2% |
| Colorchecker dE 2000 max. * | 4.86 | 7.02 -44% | 4.46 8% | 2.5 49% | 3.75 23% | |
| Colorchecker dE 2000 calibrated * | 0.4 | 4.73 -1083% | 0.99 -147% | 0.7 -75% | 2.77 -593% | |
| Greyscale dE 2000 * | 1 | 1 -0% | 3.1 -210% | 2.6 -160% | 2.1 -110% | 1.88 -88% |
| Gamma | 2.3 96% | 2.28 96% | 2.13 103% | 2.3 96% | 2.26 97% | 2.31 95% |
| CCT | 6553 99% | 6543 99% | 6448 101% | 6805 96% | 6437 101% | 6441 101% |
| Totaal Gemiddelde (Programma / Instellingen) | -48% /
-87% | 6% /
-27% | -100% /
-53% | -1% /
-7% | -5% /
-44% |
* ... kleiner is beter
Het scherm wordt goed gekalibreerd uit de doos geleverd tegen de P3-standaard en daarom is kalibratie door de eindgebruiker niet zo nodig.
Responstijd Scherm
| ↔ Responstijd Zwart naar Wit | ||
|---|---|---|
| 9.6 ms ... stijging ↗ en daling ↘ gecombineerd | ↗ 5.1 ms stijging | 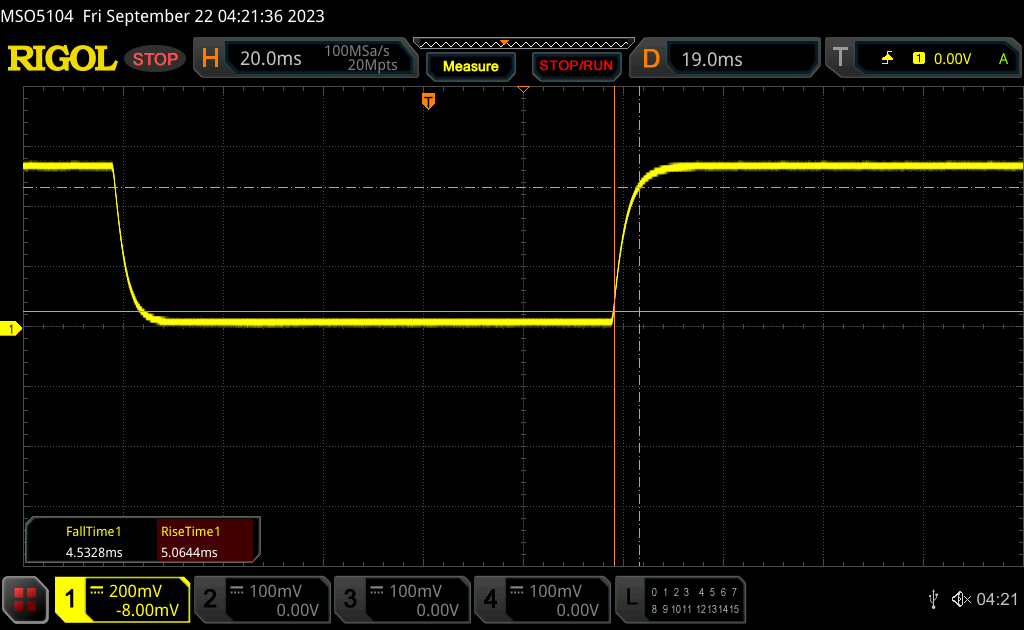 |
| ↘ 4.5 ms daling | ||
| Het scherm vertoonde snelle responstijden in onze tests en zou geschikt moeten zijn voor games. Ter vergelijking: alle testtoestellen variëren van 0.1 (minimum) tot 240 (maximum) ms. » 26 % van alle toestellen zijn beter. Dit betekent dat de gemeten responstijd beter is dan het gemiddelde (19.8 ms) van alle geteste toestellen. | ||
| ↔ Responstijd 50% Grijs naar 80% Grijs | ||
| 11.9 ms ... stijging ↗ en daling ↘ gecombineerd | ↗ 5.9 ms stijging | 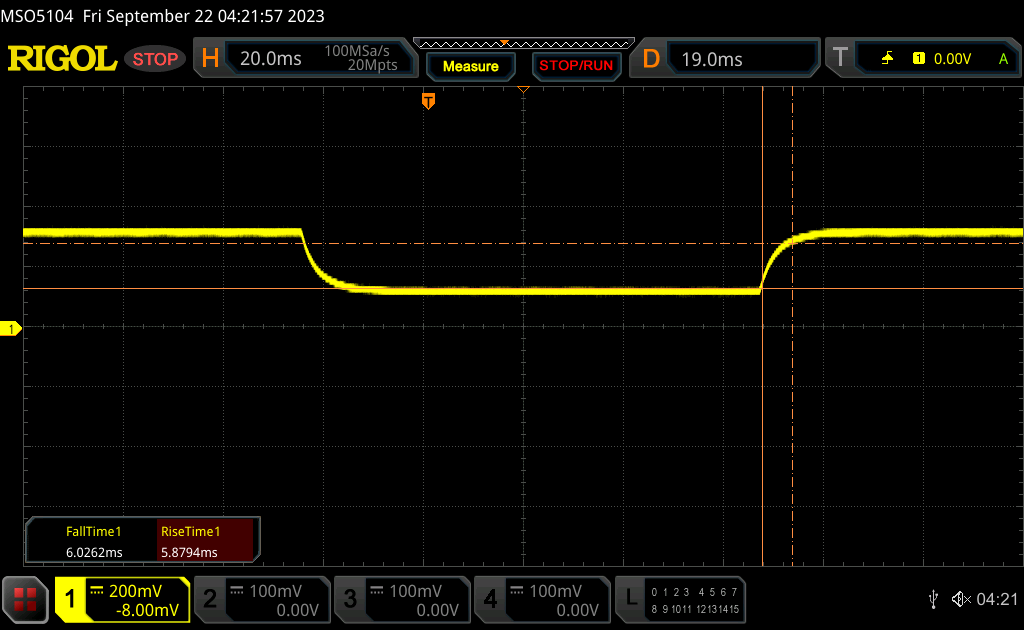 |
| ↘ 6 ms daling | ||
| Het scherm vertoonde prima responstijden in onze tests maar is misschien wat te traag voor competitieve games. Ter vergelijking: alle testtoestellen variëren van 0.165 (minimum) tot 636 (maximum) ms. » 25 % van alle toestellen zijn beter. Dit betekent dat de gemeten responstijd beter is dan het gemiddelde (31 ms) van alle geteste toestellen. | ||
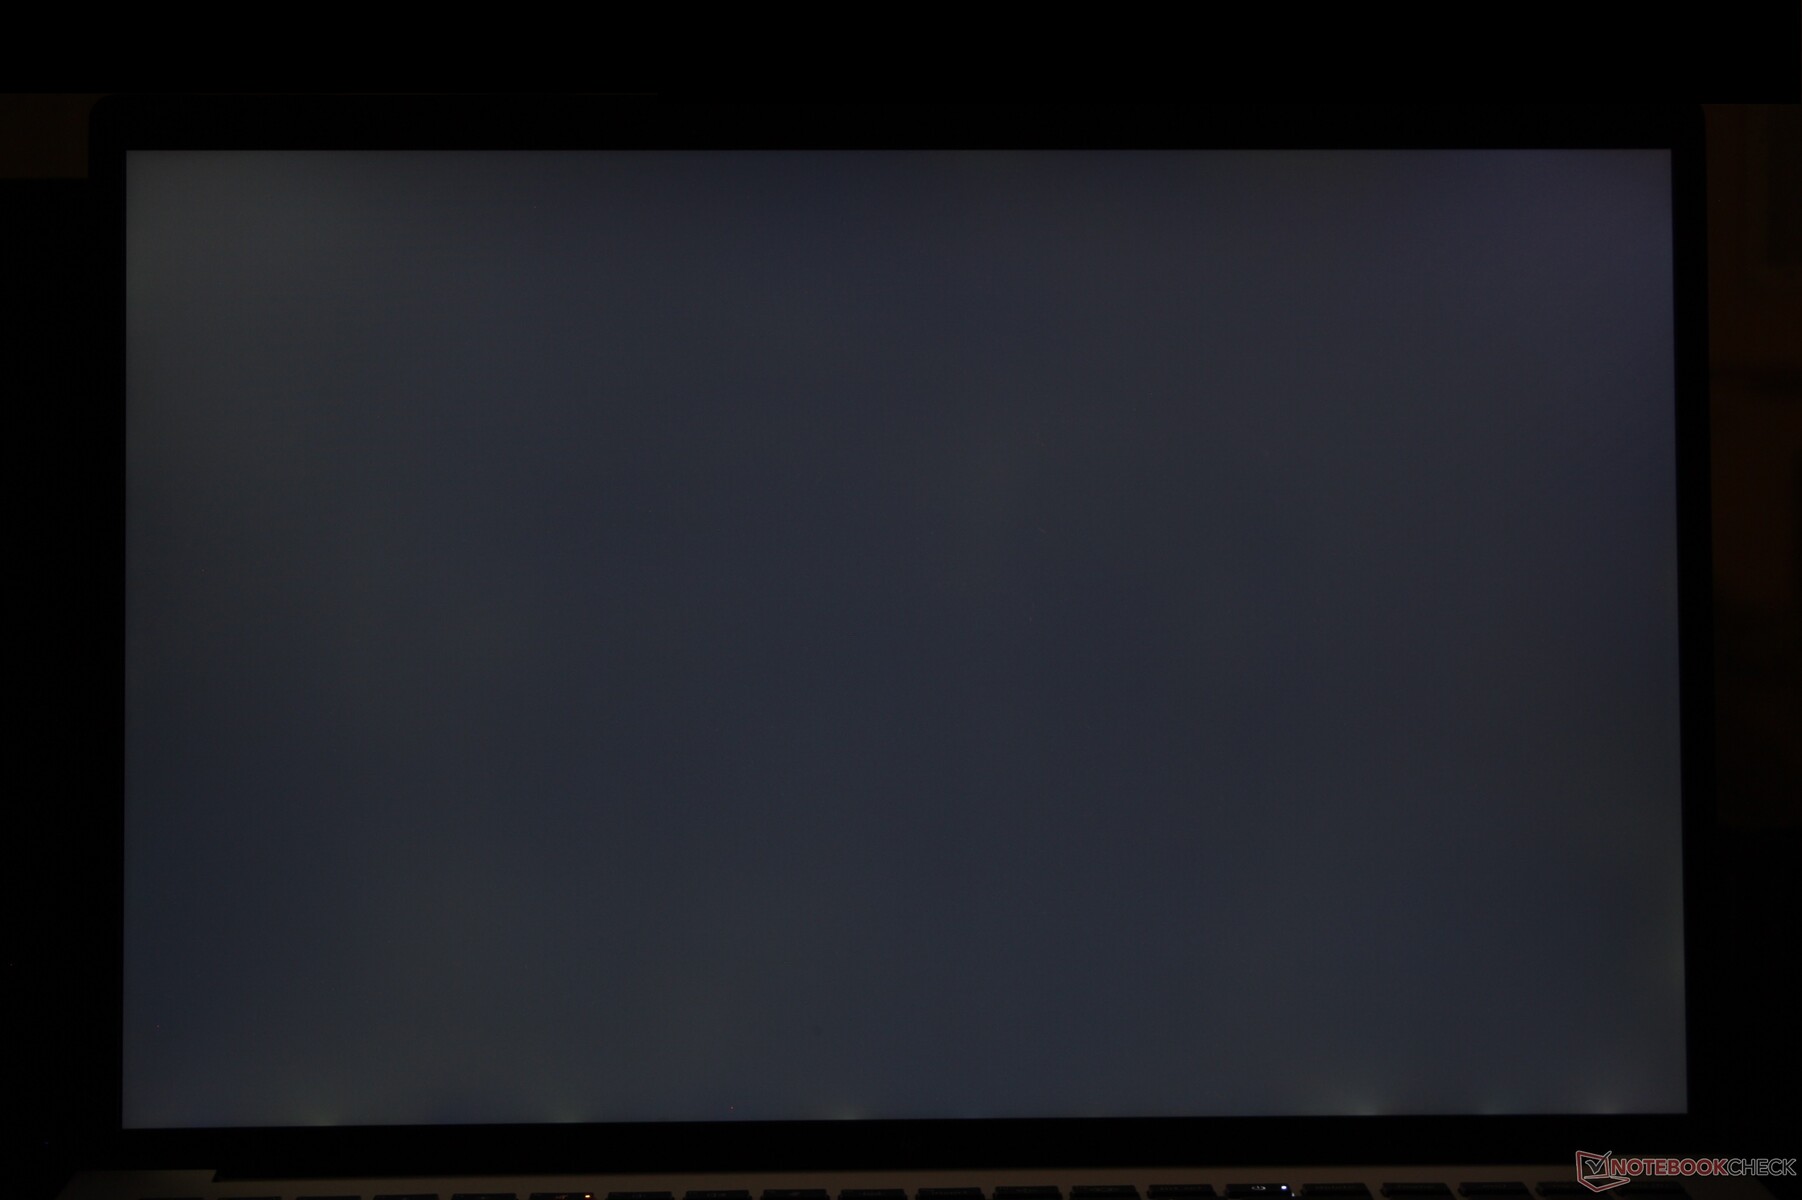
Screen Flickering / PWM (Pulse-Width Modulation)
| Screen flickering / PWM niet waargenomen | 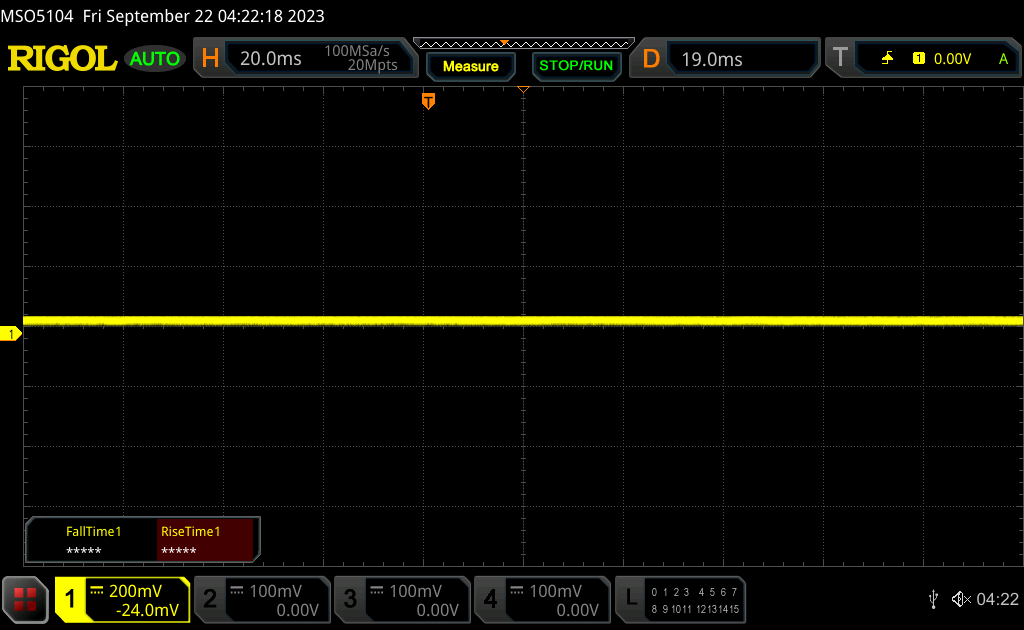 | ||
Ter vergelijking: 52 % van alle geteste toestellen maakten geen gebruik van PWM om de schermhelderheid te verlagen. Als het wel werd gebruikt, werd een gemiddelde van 7757 (minimum: 5 - maximum: 343500) Hz waargenomen. | |||

Prestaties
Testomstandigheden
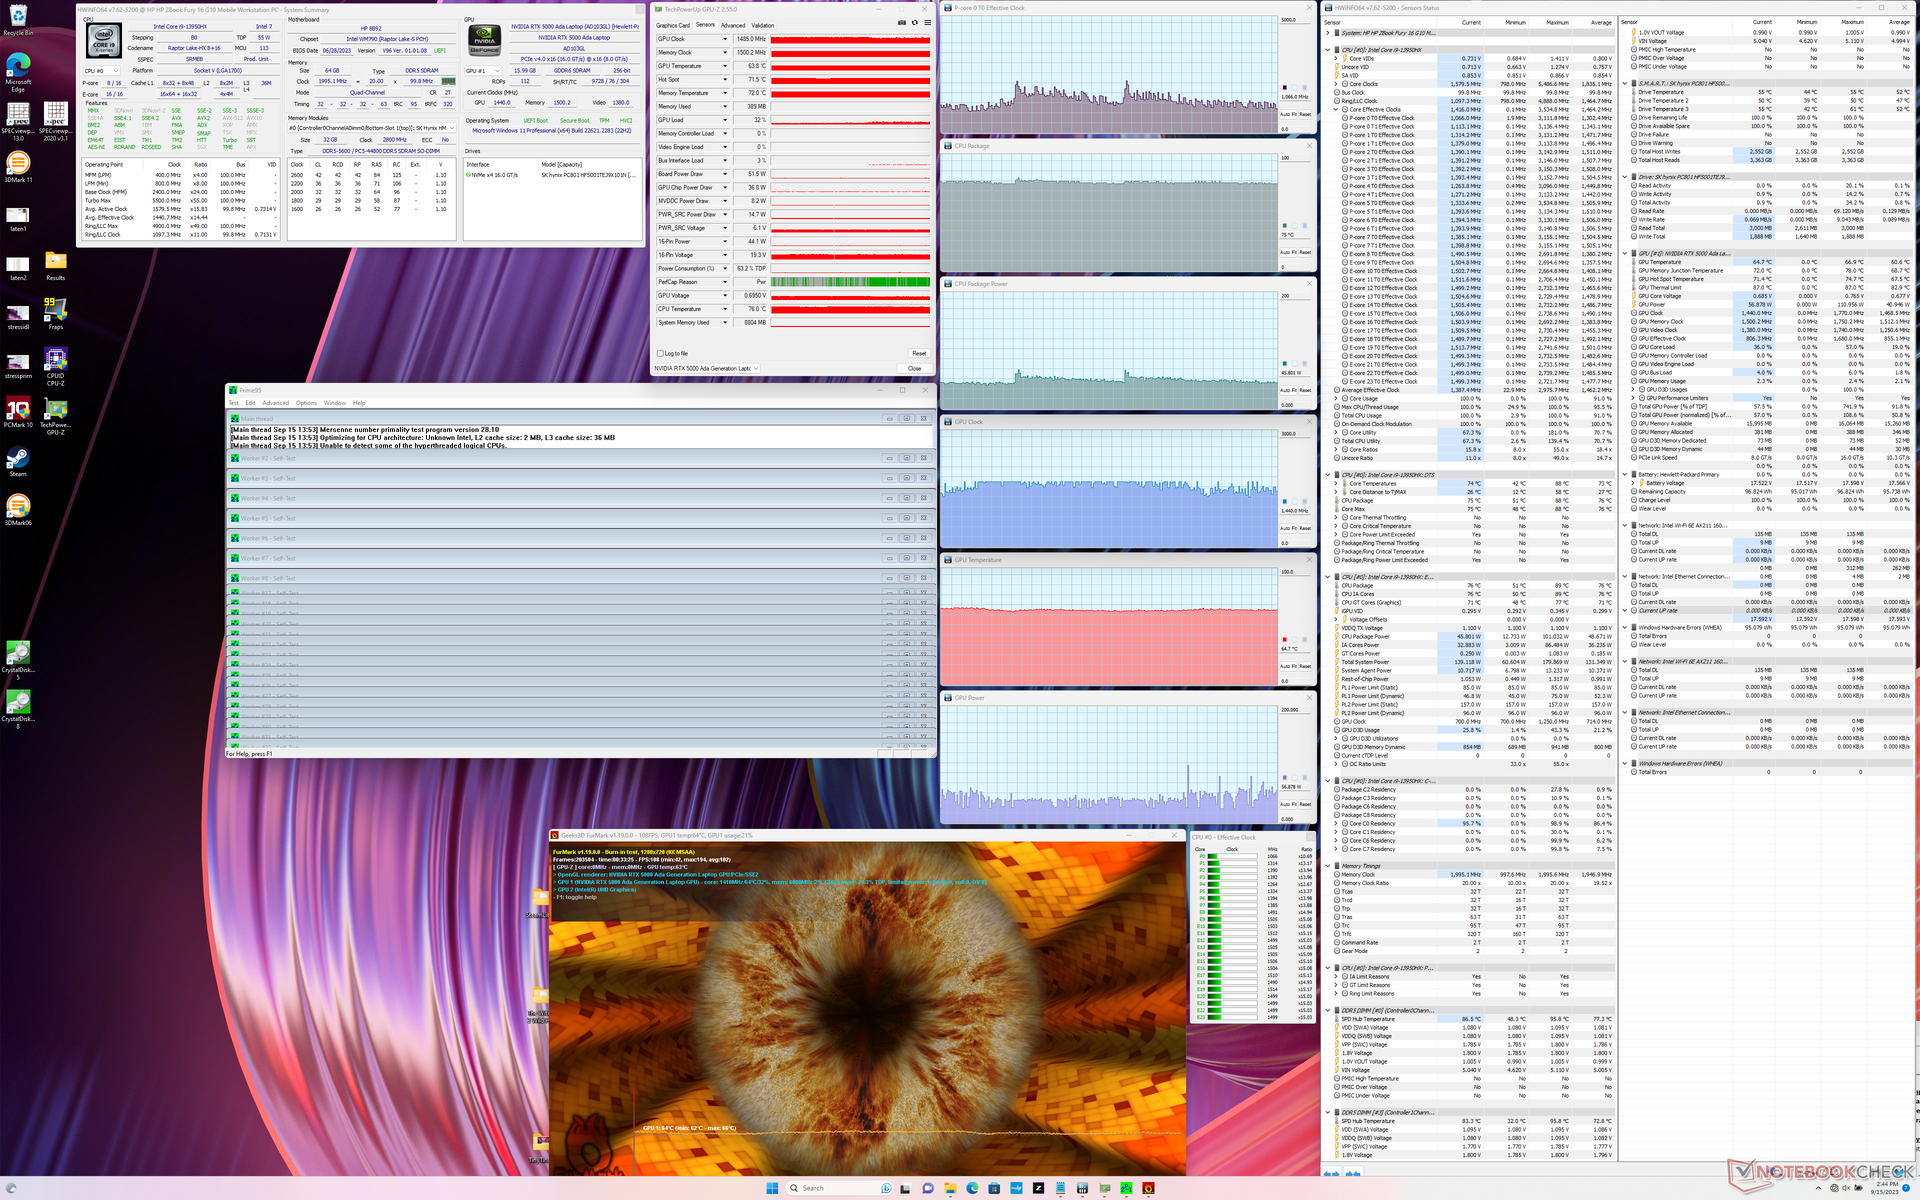
We zetten Windows in de modus Prestaties voordat we de onderstaande benchmarks uitvoeren.
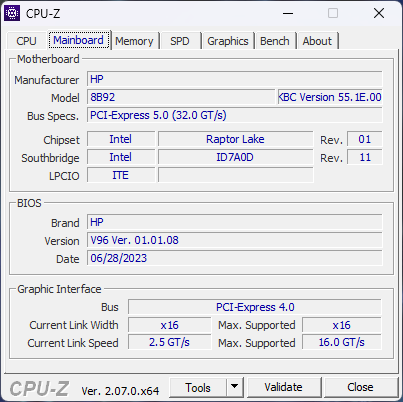
Advanced Optimus, MUX en Intel Xeon CPU's worden niet ondersteund. Het is echter vermeldenswaard dat het model officieel DDR5 ECC RAM ondersteunt, ondanks het ontbreken van Xeon opties, een functie die niet te vinden is op de meeste andere mobiele werkstations.
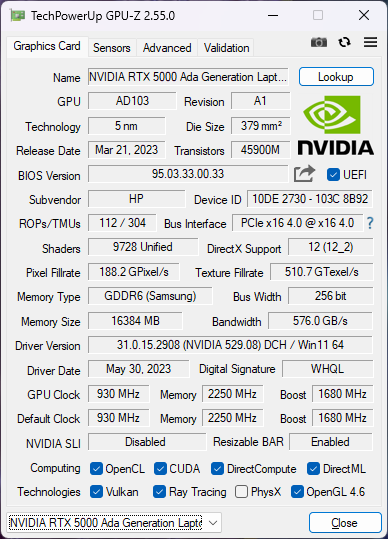
De ECC VRAM-modus kan worden in- of uitgeschakeld, net als bij andere Ada Lovelace GPU's die zijn ontworpen voor werkstations. Door deze modus in te schakelen wordt het maximaal bruikbare VRAM verlaagd van 16 GB naar 15 GB.
Processor
CPU-prestaties zijn een allegaartje. Aan de ene kant zijn de multi-thread prestaties ruwweg 25 tot 30 procent sneller dan de Core i9-12950HX in de Fury 16 G9 van vorig jaar. Aan de andere kant zijn de prestaties gemiddeld ongeveer 15 procent langzamer dan op andere laptops met dezelfdeCore i9-13950HX processor als onze HP. Dezelfde CPU in de grotereRazer Blade 18 en MSI GE78HXdraaien bijvoorbeeld consistent sneller dan onze HP. Dit wil niet zeggen dat de Fury 16 G10 traag is, maar het laat wel zien dat de CPU iets langzamer is dan verwacht.
Cinebench R15 Multi Loop
Cinebench R23: Multi Core | Single Core
Cinebench R20: CPU (Multi Core) | CPU (Single Core)
Cinebench R15: CPU Multi 64Bit | CPU Single 64Bit
Blender: v2.79 BMW27 CPU
7-Zip 18.03: 7z b 4 | 7z b 4 -mmt1
Geekbench 5.5: Multi-Core | Single-Core
HWBOT x265 Benchmark v2.2: 4k Preset
LibreOffice : 20 Documents To PDF
R Benchmark 2.5: Overall mean
| CPU Performance rating | |
| Gemiddeld Intel Core i9-13950HX | |
| HP ZBook Fury 16 G10 | |
| Lenovo ThinkPad P16 G1 RTX A5500 | |
| Dell Precision 5000 5680 | |
| HP ZBook Fury 16 G9 | |
| Lenovo ThinkPad P16 G1 21D6001DMB | |
| HP ZBook Studio 16 G9 62U04EA | |
| MSI CreatorPro Z16P B12UKST | |
| Asus ProArt StudioBook 16 W7600H5A-2BL2 | |
| Lenovo ThinkPad P1 G4-20Y4Z9DVUS | |
| Cinebench R23 / Multi Core | |
| Gemiddeld Intel Core i9-13950HX (24560 - 33277, n=7) | |
| HP ZBook Fury 16 G10 | |
| Lenovo ThinkPad P16 G1 RTX A5500 | |
| HP ZBook Fury 16 G9 | |
| Dell Precision 5000 5680 | |
| Lenovo ThinkPad P16 G1 21D6001DMB | |
| MSI CreatorPro Z16P B12UKST | |
| HP ZBook Studio 16 G9 62U04EA | |
| Lenovo ThinkPad P1 G4-20Y4Z9DVUS | |
| Asus ProArt StudioBook 16 W7600H5A-2BL2 | |
| Cinebench R23 / Single Core | |
| HP ZBook Fury 16 G10 | |
| Gemiddeld Intel Core i9-13950HX (1952 - 2113, n=7) | |
| Dell Precision 5000 5680 | |
| HP ZBook Fury 16 G9 | |
| Lenovo ThinkPad P16 G1 RTX A5500 | |
| HP ZBook Studio 16 G9 62U04EA | |
| Lenovo ThinkPad P16 G1 21D6001DMB | |
| MSI CreatorPro Z16P B12UKST | |
| Lenovo ThinkPad P1 G4-20Y4Z9DVUS | |
| Asus ProArt StudioBook 16 W7600H5A-2BL2 | |
| Cinebench R20 / CPU (Multi Core) | |
| Gemiddeld Intel Core i9-13950HX (8697 - 12648, n=7) | |
| HP ZBook Fury 16 G10 | |
| Lenovo ThinkPad P16 G1 RTX A5500 | |
| HP ZBook Fury 16 G9 | |
| Dell Precision 5000 5680 | |
| Lenovo ThinkPad P16 G1 21D6001DMB | |
| MSI CreatorPro Z16P B12UKST | |
| HP ZBook Studio 16 G9 62U04EA | |
| Lenovo ThinkPad P1 G4-20Y4Z9DVUS | |
| Asus ProArt StudioBook 16 W7600H5A-2BL2 | |
| Cinebench R20 / CPU (Single Core) | |
| HP ZBook Fury 16 G10 | |
| Gemiddeld Intel Core i9-13950HX (742 - 816, n=7) | |
| Dell Precision 5000 5680 | |
| HP ZBook Fury 16 G9 | |
| Lenovo ThinkPad P16 G1 RTX A5500 | |
| HP ZBook Studio 16 G9 62U04EA | |
| Lenovo ThinkPad P16 G1 21D6001DMB | |
| MSI CreatorPro Z16P B12UKST | |
| Lenovo ThinkPad P1 G4-20Y4Z9DVUS | |
| Asus ProArt StudioBook 16 W7600H5A-2BL2 | |
| Cinebench R15 / CPU Multi 64Bit | |
| Gemiddeld Intel Core i9-13950HX (3625 - 5227, n=7) | |
| HP ZBook Fury 16 G10 | |
| Lenovo ThinkPad P16 G1 RTX A5500 | |
| Lenovo ThinkPad P16 G1 21D6001DMB | |
| HP ZBook Studio 16 G9 62U04EA | |
| HP ZBook Fury 16 G9 | |
| Dell Precision 5000 5680 | |
| MSI CreatorPro Z16P B12UKST | |
| Lenovo ThinkPad P1 G4-20Y4Z9DVUS | |
| Asus ProArt StudioBook 16 W7600H5A-2BL2 | |
| Cinebench R15 / CPU Single 64Bit | |
| HP ZBook Fury 16 G10 | |
| Gemiddeld Intel Core i9-13950HX (274 - 303, n=7) | |
| Dell Precision 5000 5680 | |
| Lenovo ThinkPad P16 G1 RTX A5500 | |
| HP ZBook Studio 16 G9 62U04EA | |
| Lenovo ThinkPad P16 G1 21D6001DMB | |
| MSI CreatorPro Z16P B12UKST | |
| Lenovo ThinkPad P1 G4-20Y4Z9DVUS | |
| Asus ProArt StudioBook 16 W7600H5A-2BL2 | |
| HP ZBook Fury 16 G9 | |
| Blender / v2.79 BMW27 CPU | |
| Asus ProArt StudioBook 16 W7600H5A-2BL2 | |
| Lenovo ThinkPad P1 G4-20Y4Z9DVUS | |
| MSI CreatorPro Z16P B12UKST | |
| Dell Precision 5000 5680 | |
| HP ZBook Studio 16 G9 62U04EA | |
| Lenovo ThinkPad P16 G1 21D6001DMB | |
| HP ZBook Fury 16 G9 | |
| Lenovo ThinkPad P16 G1 RTX A5500 | |
| HP ZBook Fury 16 G10 | |
| Gemiddeld Intel Core i9-13950HX (100 - 137, n=7) | |
| 7-Zip 18.03 / 7z b 4 | |
| Gemiddeld Intel Core i9-13950HX (99351 - 127295, n=7) | |
| HP ZBook Fury 16 G10 | |
| Lenovo ThinkPad P16 G1 RTX A5500 | |
| HP ZBook Fury 16 G9 | |
| Dell Precision 5000 5680 | |
| Lenovo ThinkPad P16 G1 21D6001DMB | |
| HP ZBook Studio 16 G9 62U04EA | |
| MSI CreatorPro Z16P B12UKST | |
| Lenovo ThinkPad P1 G4-20Y4Z9DVUS | |
| Asus ProArt StudioBook 16 W7600H5A-2BL2 | |
| 7-Zip 18.03 / 7z b 4 -mmt1 | |
| Gemiddeld Intel Core i9-13950HX (6445 - 7064, n=7) | |
| HP ZBook Fury 16 G10 | |
| Dell Precision 5000 5680 | |
| Lenovo ThinkPad P16 G1 RTX A5500 | |
| HP ZBook Fury 16 G9 | |
| HP ZBook Studio 16 G9 62U04EA | |
| Lenovo ThinkPad P16 G1 21D6001DMB | |
| MSI CreatorPro Z16P B12UKST | |
| Lenovo ThinkPad P1 G4-20Y4Z9DVUS | |
| Asus ProArt StudioBook 16 W7600H5A-2BL2 | |
| Geekbench 5.5 / Multi-Core | |
| Gemiddeld Intel Core i9-13950HX (16776 - 21853, n=7) | |
| HP ZBook Fury 16 G10 | |
| Lenovo ThinkPad P16 G1 RTX A5500 | |
| Dell Precision 5000 5680 | |
| HP ZBook Fury 16 G9 | |
| Lenovo ThinkPad P16 G1 21D6001DMB | |
| HP ZBook Studio 16 G9 62U04EA | |
| MSI CreatorPro Z16P B12UKST | |
| Asus ProArt StudioBook 16 W7600H5A-2BL2 | |
| Lenovo ThinkPad P1 G4-20Y4Z9DVUS | |
| Geekbench 5.5 / Single-Core | |
| HP ZBook Fury 16 G10 | |
| Dell Precision 5000 5680 | |
| Gemiddeld Intel Core i9-13950HX (1805 - 2097, n=7) | |
| HP ZBook Fury 16 G9 | |
| Lenovo ThinkPad P16 G1 RTX A5500 | |
| HP ZBook Studio 16 G9 62U04EA | |
| MSI CreatorPro Z16P B12UKST | |
| Lenovo ThinkPad P16 G1 21D6001DMB | |
| Lenovo ThinkPad P1 G4-20Y4Z9DVUS | |
| Asus ProArt StudioBook 16 W7600H5A-2BL2 | |
| HWBOT x265 Benchmark v2.2 / 4k Preset | |
| Gemiddeld Intel Core i9-13950HX (26 - 34.5, n=7) | |
| HP ZBook Fury 16 G10 | |
| Lenovo ThinkPad P16 G1 RTX A5500 | |
| Dell Precision 5000 5680 | |
| HP ZBook Fury 16 G9 | |
| HP ZBook Studio 16 G9 62U04EA | |
| MSI CreatorPro Z16P B12UKST | |
| Lenovo ThinkPad P16 G1 21D6001DMB | |
| Lenovo ThinkPad P1 G4-20Y4Z9DVUS | |
| Asus ProArt StudioBook 16 W7600H5A-2BL2 | |
| LibreOffice / 20 Documents To PDF | |
| Lenovo ThinkPad P1 G4-20Y4Z9DVUS | |
| Lenovo ThinkPad P16 G1 21D6001DMB | |
| Gemiddeld Intel Core i9-13950HX (32.8 - 52.1, n=7) | |
| HP ZBook Fury 16 G10 | |
| HP ZBook Studio 16 G9 62U04EA | |
| Dell Precision 5000 5680 | |
| Lenovo ThinkPad P16 G1 RTX A5500 | |
| MSI CreatorPro Z16P B12UKST | |
| HP ZBook Fury 16 G9 | |
| Asus ProArt StudioBook 16 W7600H5A-2BL2 | |
| R Benchmark 2.5 / Overall mean | |
| Asus ProArt StudioBook 16 W7600H5A-2BL2 | |
| Lenovo ThinkPad P1 G4-20Y4Z9DVUS | |
| MSI CreatorPro Z16P B12UKST | |
| Lenovo ThinkPad P16 G1 21D6001DMB | |
| HP ZBook Studio 16 G9 62U04EA | |
| Lenovo ThinkPad P16 G1 RTX A5500 | |
| HP ZBook Fury 16 G9 | |
| Dell Precision 5000 5680 | |
| Gemiddeld Intel Core i9-13950HX (0.3823 - 0.4121, n=7) | |
| HP ZBook Fury 16 G10 | |
* ... kleiner is beter
AIDA64: FP32 Ray-Trace | FPU Julia | CPU SHA3 | CPU Queen | FPU SinJulia | FPU Mandel | CPU AES | CPU ZLib | FP64 Ray-Trace | CPU PhotoWorxx
| Performance rating | |
| Gemiddeld Intel Core i9-13950HX | |
| HP ZBook Fury 16 G10 | |
| Lenovo ThinkPad P16 G1 RTX A5500 | |
| HP ZBook Fury 16 G9 | |
| Dell Precision 5000 5680 | |
| MSI CreatorPro Z16P B12UKST | |
| AIDA64 / FP32 Ray-Trace | |
| Gemiddeld Intel Core i9-13950HX (17993 - 28957, n=9) | |
| HP ZBook Fury 16 G10 | |
| Lenovo ThinkPad P16 G1 RTX A5500 | |
| HP ZBook Fury 16 G9 | |
| Dell Precision 5000 5680 | |
| MSI CreatorPro Z16P B12UKST | |
| AIDA64 / FPU Julia | |
| Gemiddeld Intel Core i9-13950HX (89362 - 144303, n=9) | |
| HP ZBook Fury 16 G10 | |
| HP ZBook Fury 16 G9 | |
| Lenovo ThinkPad P16 G1 RTX A5500 | |
| Dell Precision 5000 5680 | |
| MSI CreatorPro Z16P B12UKST | |
| AIDA64 / CPU SHA3 | |
| Gemiddeld Intel Core i9-13950HX (4518 - 7093, n=9) | |
| HP ZBook Fury 16 G10 | |
| Lenovo ThinkPad P16 G1 RTX A5500 | |
| HP ZBook Fury 16 G9 | |
| MSI CreatorPro Z16P B12UKST | |
| Dell Precision 5000 5680 | |
| AIDA64 / CPU Queen | |
| Gemiddeld Intel Core i9-13950HX (131931 - 140103, n=8) | |
| HP ZBook Fury 16 G10 | |
| Dell Precision 5000 5680 | |
| Lenovo ThinkPad P16 G1 RTX A5500 | |
| HP ZBook Fury 16 G9 | |
| MSI CreatorPro Z16P B12UKST | |
| AIDA64 / FPU SinJulia | |
| Gemiddeld Intel Core i9-13950HX (12318 - 17057, n=9) | |
| HP ZBook Fury 16 G10 | |
| Lenovo ThinkPad P16 G1 RTX A5500 | |
| HP ZBook Fury 16 G9 | |
| Dell Precision 5000 5680 | |
| MSI CreatorPro Z16P B12UKST | |
| AIDA64 / FPU Mandel | |
| Gemiddeld Intel Core i9-13950HX (44372 - 71038, n=9) | |
| HP ZBook Fury 16 G10 | |
| HP ZBook Fury 16 G9 | |
| Lenovo ThinkPad P16 G1 RTX A5500 | |
| Dell Precision 5000 5680 | |
| MSI CreatorPro Z16P B12UKST | |
| AIDA64 / CPU AES | |
| Gemiddeld Intel Core i9-13950HX (99981 - 204491, n=9) | |
| MSI CreatorPro Z16P B12UKST | |
| HP ZBook Fury 16 G10 | |
| HP ZBook Fury 16 G9 | |
| Lenovo ThinkPad P16 G1 RTX A5500 | |
| Dell Precision 5000 5680 | |
| AIDA64 / CPU ZLib | |
| Gemiddeld Intel Core i9-13950HX (1263 - 2069, n=9) | |
| HP ZBook Fury 16 G10 | |
| Lenovo ThinkPad P16 G1 RTX A5500 | |
| HP ZBook Fury 16 G9 | |
| MSI CreatorPro Z16P B12UKST | |
| Dell Precision 5000 5680 | |
| AIDA64 / FP64 Ray-Trace | |
| Gemiddeld Intel Core i9-13950HX (9649 - 15573, n=9) | |
| HP ZBook Fury 16 G10 | |
| Lenovo ThinkPad P16 G1 RTX A5500 | |
| HP ZBook Fury 16 G9 | |
| Dell Precision 5000 5680 | |
| MSI CreatorPro Z16P B12UKST | |
| AIDA64 / CPU PhotoWorxx | |
| Dell Precision 5000 5680 | |
| Gemiddeld Intel Core i9-13950HX (40233 - 50864, n=9) | |
| MSI CreatorPro Z16P B12UKST | |
| Lenovo ThinkPad P16 G1 RTX A5500 | |
| HP ZBook Fury 16 G10 | |
| HP ZBook Fury 16 G9 | |
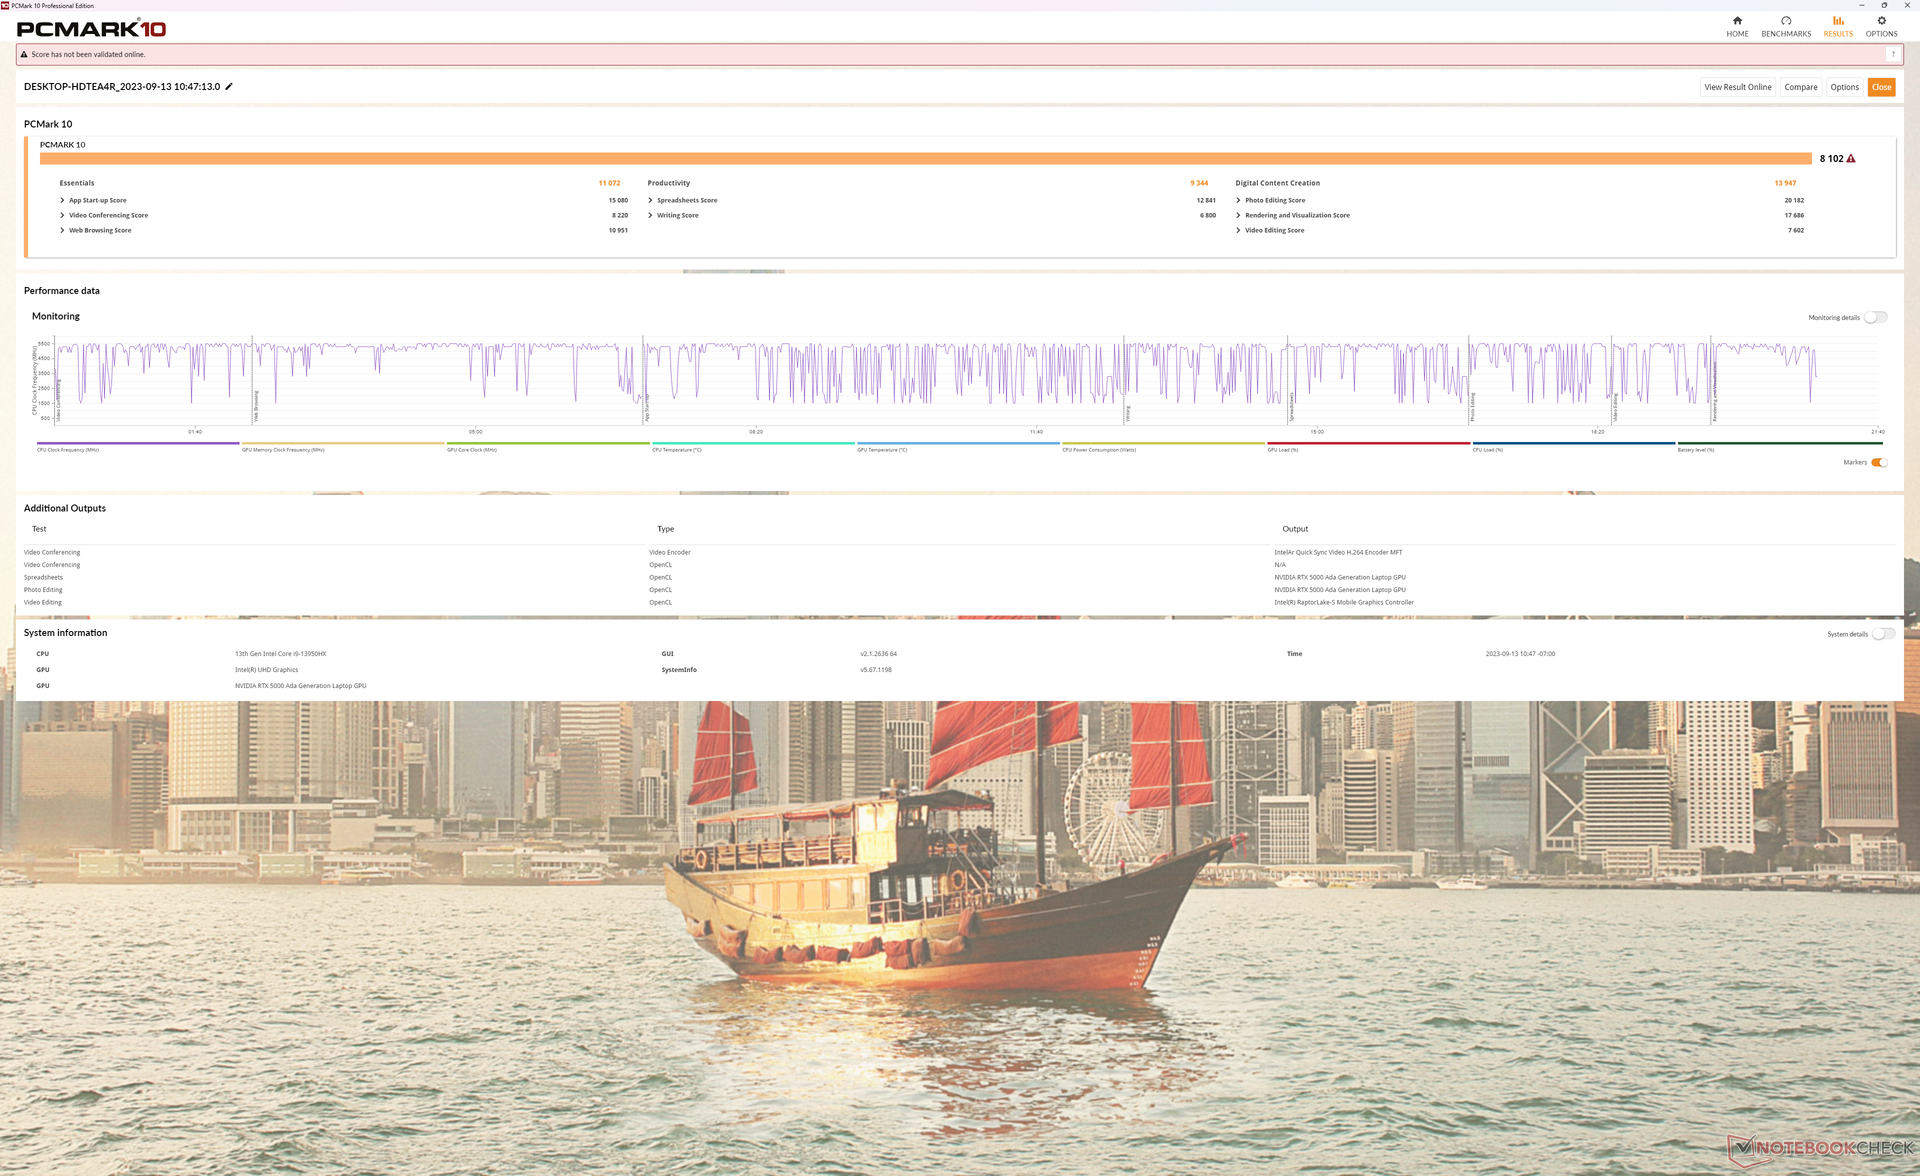
Systeemprestaties
PCMark-scores liggen hoger dan die van de Fury 16 G9 van vorig jaar, vooral in de subtest voor het maken van digitale content, dankzij de aanzienlijke sprong in GPU-prestaties. Ondertussen is de Precision 5680 hoger in Productiviteit vanwege de RAID 0 SSD's. Natuurlijk kan onze HP desgewenst ook met RAID worden geconfigureerd.
CrossMark: Overall | Productivity | Creativity | Responsiveness
| PCMark 10 / Score | |
| Dell Precision 5000 5680 | |
| HP ZBook Fury 16 G10 | |
| Gemiddeld Intel Core i9-13950HX, NVIDIA RTX 5000 Ada Generation Laptop (n=1) | |
| Lenovo ThinkPad P16 G1 RTX A5500 | |
| MSI CreatorPro Z16P B12UKST | |
| Asus ProArt StudioBook 16 W7600H5A-2BL2 | |
| HP ZBook Fury 16 G9 | |
| PCMark 10 / Essentials | |
| Dell Precision 5000 5680 | |
| HP ZBook Fury 16 G10 | |
| Gemiddeld Intel Core i9-13950HX, NVIDIA RTX 5000 Ada Generation Laptop (n=1) | |
| HP ZBook Fury 16 G9 | |
| Lenovo ThinkPad P16 G1 RTX A5500 | |
| MSI CreatorPro Z16P B12UKST | |
| Asus ProArt StudioBook 16 W7600H5A-2BL2 | |
| PCMark 10 / Productivity | |
| Dell Precision 5000 5680 | |
| Lenovo ThinkPad P16 G1 RTX A5500 | |
| MSI CreatorPro Z16P B12UKST | |
| HP ZBook Fury 16 G10 | |
| Gemiddeld Intel Core i9-13950HX, NVIDIA RTX 5000 Ada Generation Laptop (n=1) | |
| Asus ProArt StudioBook 16 W7600H5A-2BL2 | |
| HP ZBook Fury 16 G9 | |
| PCMark 10 / Digital Content Creation | |
| HP ZBook Fury 16 G10 | |
| Gemiddeld Intel Core i9-13950HX, NVIDIA RTX 5000 Ada Generation Laptop (n=1) | |
| Dell Precision 5000 5680 | |
| Asus ProArt StudioBook 16 W7600H5A-2BL2 | |
| Lenovo ThinkPad P16 G1 RTX A5500 | |
| MSI CreatorPro Z16P B12UKST | |
| HP ZBook Fury 16 G9 | |
| CrossMark / Overall | |
| MSI CreatorPro Z16P B12UKST | |
| Dell Precision 5000 5680 | |
| HP ZBook Fury 16 G10 | |
| Gemiddeld Intel Core i9-13950HX, NVIDIA RTX 5000 Ada Generation Laptop (n=1) | |
| HP ZBook Fury 16 G9 | |
| Lenovo ThinkPad P16 G1 RTX A5500 | |
| CrossMark / Productivity | |
| HP ZBook Fury 16 G10 | |
| Gemiddeld Intel Core i9-13950HX, NVIDIA RTX 5000 Ada Generation Laptop (n=1) | |
| MSI CreatorPro Z16P B12UKST | |
| Dell Precision 5000 5680 | |
| HP ZBook Fury 16 G9 | |
| Lenovo ThinkPad P16 G1 RTX A5500 | |
| CrossMark / Creativity | |
| Lenovo ThinkPad P16 G1 RTX A5500 | |
| Dell Precision 5000 5680 | |
| HP ZBook Fury 16 G9 | |
| HP ZBook Fury 16 G10 | |
| Gemiddeld Intel Core i9-13950HX, NVIDIA RTX 5000 Ada Generation Laptop (n=1) | |
| MSI CreatorPro Z16P B12UKST | |
| CrossMark / Responsiveness | |
| MSI CreatorPro Z16P B12UKST | |
| HP ZBook Fury 16 G10 | |
| Gemiddeld Intel Core i9-13950HX, NVIDIA RTX 5000 Ada Generation Laptop (n=1) | |
| HP ZBook Fury 16 G9 | |
| Dell Precision 5000 5680 | |
| Lenovo ThinkPad P16 G1 RTX A5500 | |
| PCMark 10 Score | 8102 punten | |
Help | ||
| AIDA64 / Memory Copy | |
| Dell Precision 5000 5680 | |
| Lenovo ThinkPad P16 G1 RTX A5500 | |
| MSI CreatorPro Z16P B12UKST | |
| HP ZBook Fury 16 G10 | |
| HP ZBook Fury 16 G9 | |
| AIDA64 / Memory Read | |
| Dell Precision 5000 5680 | |
| MSI CreatorPro Z16P B12UKST | |
| Lenovo ThinkPad P16 G1 RTX A5500 | |
| HP ZBook Fury 16 G10 | |
| HP ZBook Fury 16 G9 | |
| AIDA64 / Memory Write | |
| Dell Precision 5000 5680 | |
| MSI CreatorPro Z16P B12UKST | |
| Lenovo ThinkPad P16 G1 RTX A5500 | |
| HP ZBook Fury 16 G10 | |
| HP ZBook Fury 16 G9 | |
* ... kleiner is beter
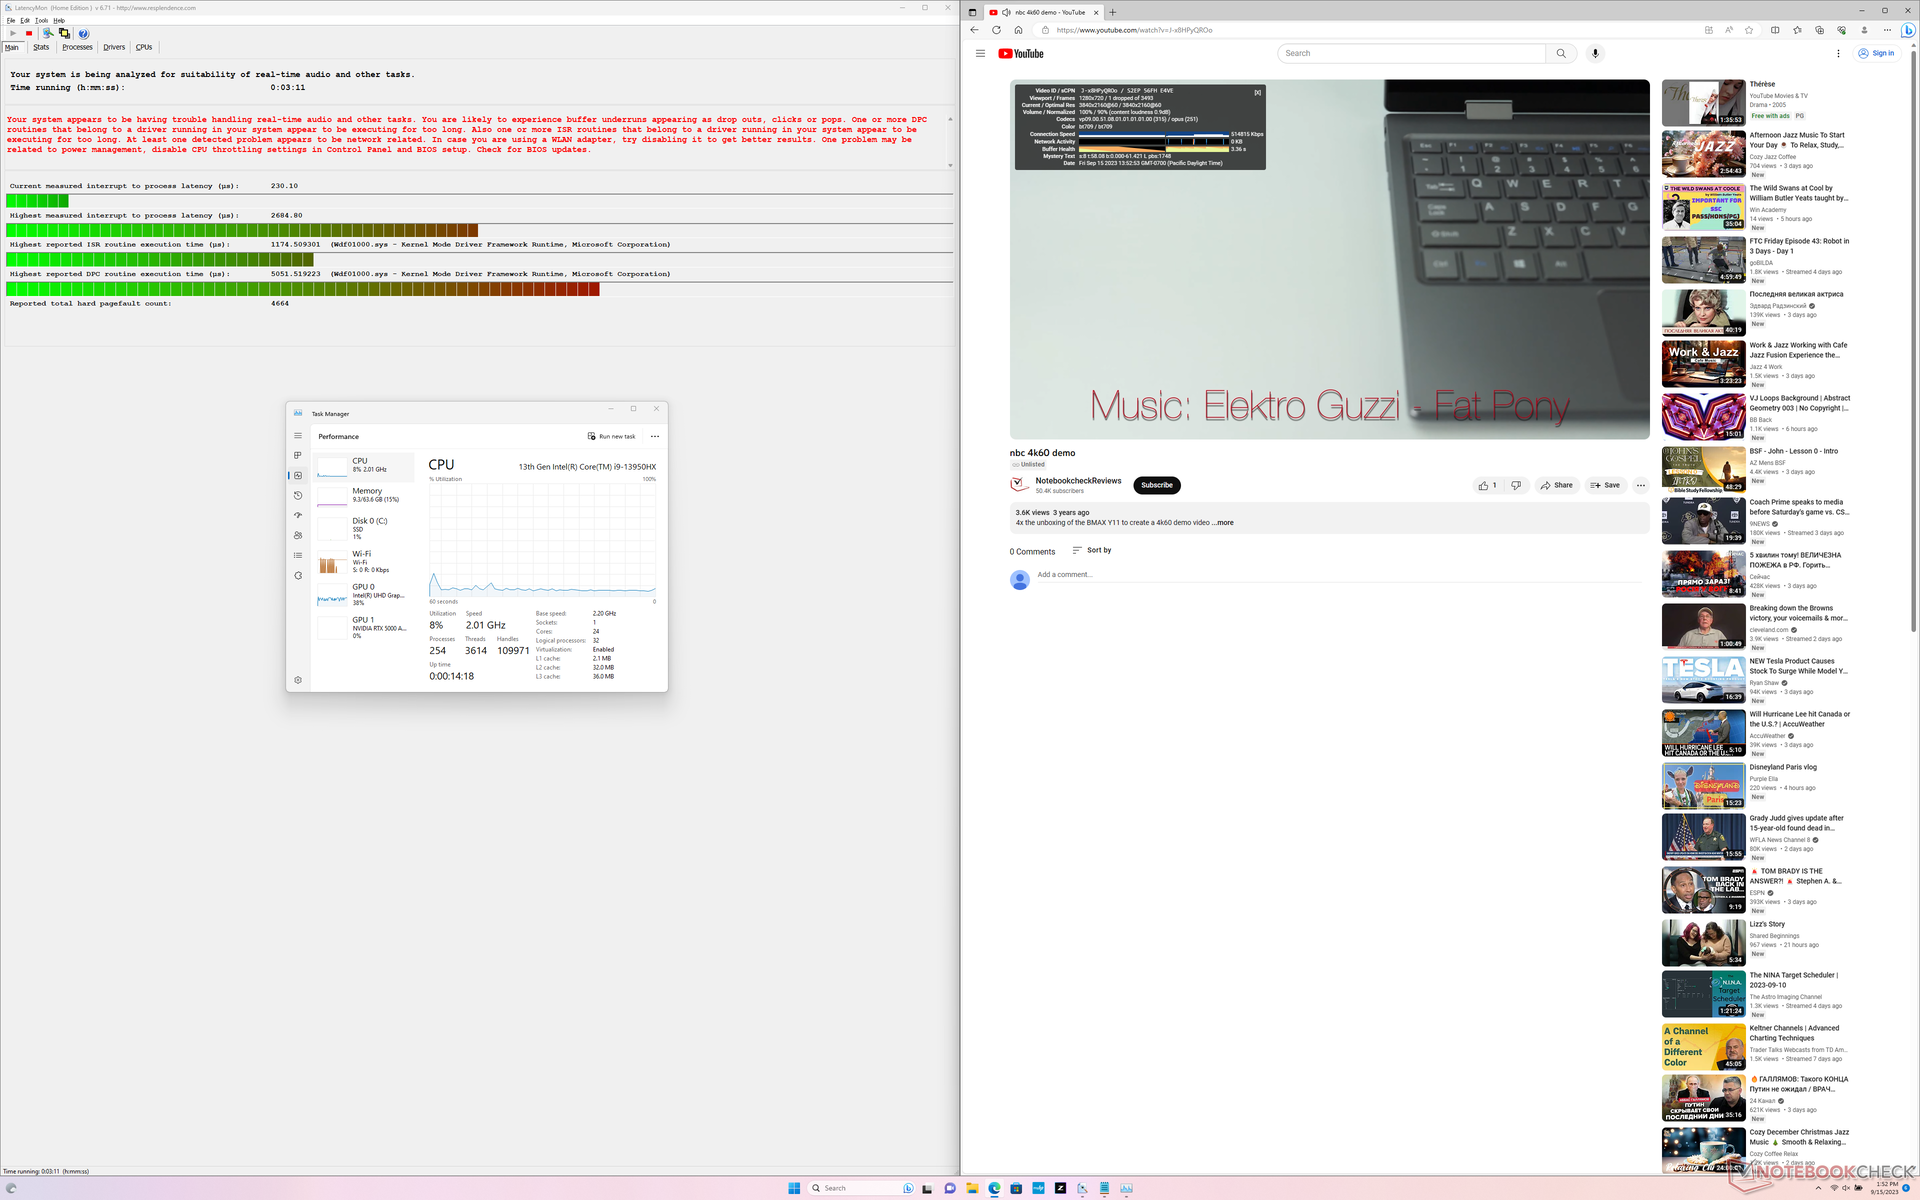
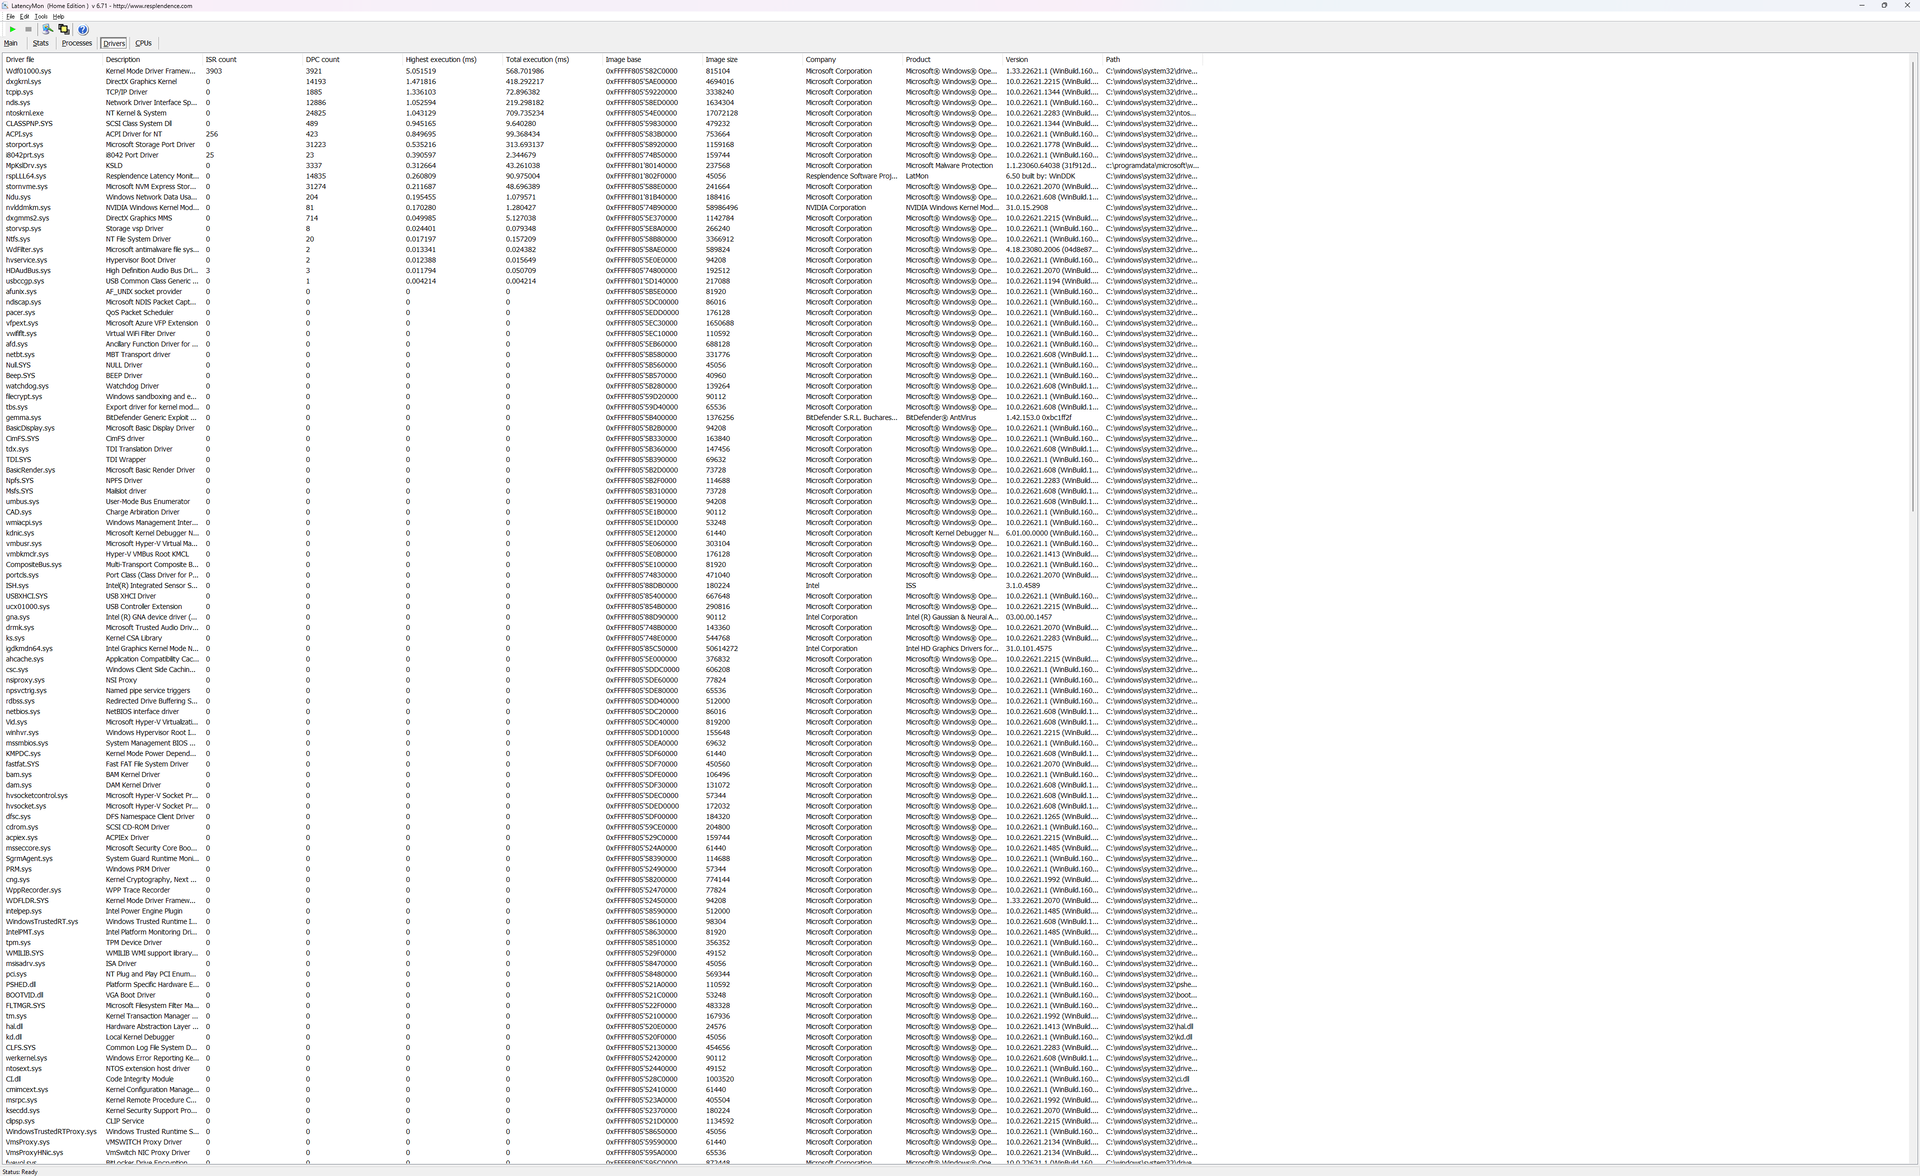
DPC latentie
LatencyMon onthult DPC-problemen bij het openen van meerdere tabbladen van onze homepage. het afspelen van 4K-video met 60 FPS is bijna perfect met slechts één dropped frame opgenomen tijdens een interval van 60 seconden.
| DPC Latencies / LatencyMon - interrupt to process latency (max), Web, Youtube, Prime95 | |
| HP ZBook Fury 16 G10 | |
| HP ZBook Fury 16 G9 | |
| Dell Precision 5000 5680 | |
| Lenovo ThinkPad P16 G1 RTX A5500 | |
| Asus ProArt StudioBook 16 W7600H5A-2BL2 | |
| MSI CreatorPro Z16P B12UKST | |
* ... kleiner is beter
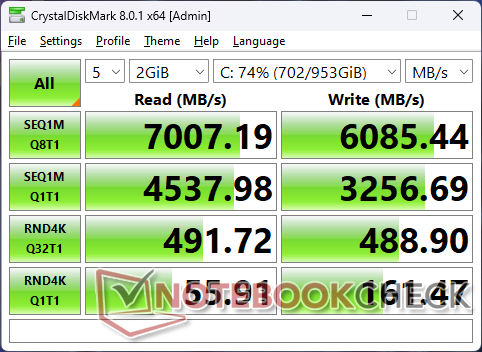
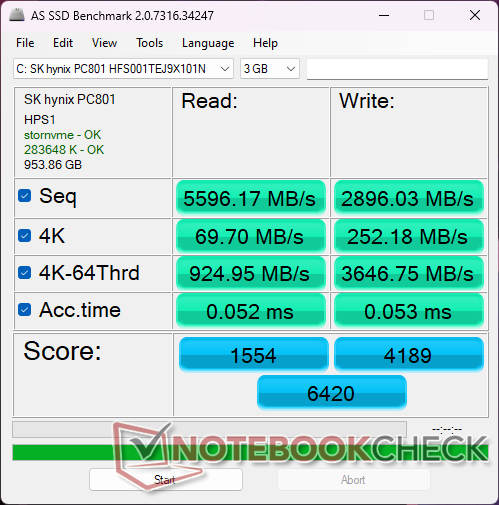
Opslagapparaten
Onze testunit wordt geleverd met een SK hynix PC801 PCIe4 x4 NVMe SSD, terwijl onze oudere Fury G16 G9 met een Micron 3400 werd geleverd. Helaas werden de prestaties na ongeveer een minuut in onze stresstest nog steeds beperkt tot 3400 MB/s, zoals te zien is in de onderstaande grafiek. Het is duidelijk dat de vier M.2 SSD slots wel wat meer koeling kunnen gebruiken om de prestatieconsistentie te verbeteren.

* ... kleiner is beter
Disk Throttling: DiskSpd Read Loop, Queue Depth 8
GPU-prestaties - Mobiel Monster
De RTX 5000 Ada in ons HP systeem is 10 tot 20 procent sneller dan dezelfde GPU in de Dell Precision 5680. De lichte maar consistente prestatievoordelen kunnen worden toegeschreven aan het hogere TGP-plafond, terwijl de GPU in de eerder genoemde Dell op een lager stroomverbruik zou draaien. Onze Stress Test sectie hieronder geeft onze observaties weer.
De algehele prestaties liggen ver voor op die van deRTX A5500 in de Fury 16 G9 van vorig jaar met wel 40 procent of zelfs 80 procent, afhankelijk van de toepassing.
| 3DMark Performance rating - Percent | |
| HP ZBook Fury 16 G10 | |
| Gemiddeld NVIDIA RTX 5000 Ada Generation Laptop | |
| Dell Precision 5000 5680 | |
| Lenovo ThinkPad P16 G1 RTX A5500 | |
| Asus ProArt StudioBook 16 W7600H5A-2BL2 -20! | |
| HP ZBook Fury 16 G9 | |
| Dell Precision 5480 -2! | |
| MSI CreatorPro Z16P B12UKST -17! | |
| HP ZBook Studio 16 G9 62U04EA -10! | |
| Lenovo ThinkPad P16 G1 21D6001DMB -18! | |
| Lenovo ThinkPad P1 G4-20Y4Z9DVUS -18! | |
| 3DMark 11 - 1280x720 Performance GPU | |
| HP ZBook Fury 16 G10 | |
| Gemiddeld NVIDIA RTX 5000 Ada Generation Laptop (49833 - 54334, n=3) | |
| Dell Precision 5000 5680 | |
| Lenovo ThinkPad P16 G1 RTX A5500 | |
| HP ZBook Fury 16 G9 | |
| Dell Precision 5480 | |
| MSI CreatorPro Z16P B12UKST | |
| HP ZBook Studio 16 G9 62U04EA | |
| Lenovo ThinkPad P16 G1 21D6001DMB | |
| Lenovo ThinkPad P1 G4-20Y4Z9DVUS | |
| 3DMark 11 Performance | 39530 punten | |
| 3DMark Fire Strike Score | 28837 punten | |
| 3DMark Time Spy Score | 15989 punten | |
Help | ||
* ... kleiner is beter
Witcher 3 FPS Chart
| lage | gem. | hoge | ultra | QHD | 4K | |
|---|---|---|---|---|---|---|
| The Witcher 3 (2015) | 510.5 | 430.3 | 298.1 | 156.5 | 105.2 | |
| Dota 2 Reborn (2015) | 211 | 191.7 | 188.2 | 166.7 | 157.3 | |
| Final Fantasy XV Benchmark (2018) | 196.9 | 179.9 | 149.1 | 120 | 68.7 | |
| X-Plane 11.11 (2018) | 175.5 | 153.9 | 122.4 | 102.6 | ||
| Far Cry 5 (2018) | 158 | 144 | 138 | 131 | 129 | |
| Strange Brigade (2018) | 411 | 337 | 306 | 283 | 216 | 105.1 |
| Cyberpunk 2077 1.6 (2022) | 110.5 | 106.8 | 104.9 | 103.8 | 74.7 | 37 |
| Tiny Tina's Wonderlands (2022) | 267.5 | 227.7 | 171.7 | 139.4 | 99.4 | 53.9 |
| F1 22 (2022) | 249 | 246 | 211 | 86.2 | 64.4 | 33.4 |
| Ratchet & Clank Rift Apart (2023) | 118 | 93.9 | 69.4 | 54.5 | 43.4 | 33.3 |
Uitstoot
Systeemgeluid
Ventilatorkarakteristieken bij normaal gebruik, geluid in verschillende belastingsscenario's volgens metingen, vervelende piepende geluiden (van bijvoorbeeld transistors) en andere onregelmatigheden (snel draaiende HDD, ODD, onregelmatige ventilator, ...)
Geluidskarakteristieken analyseren - afwijkingen? Kort overzicht:Korte analyse van geluidsemissies, vergelijking van de concurrentie.Max. 500 tekens
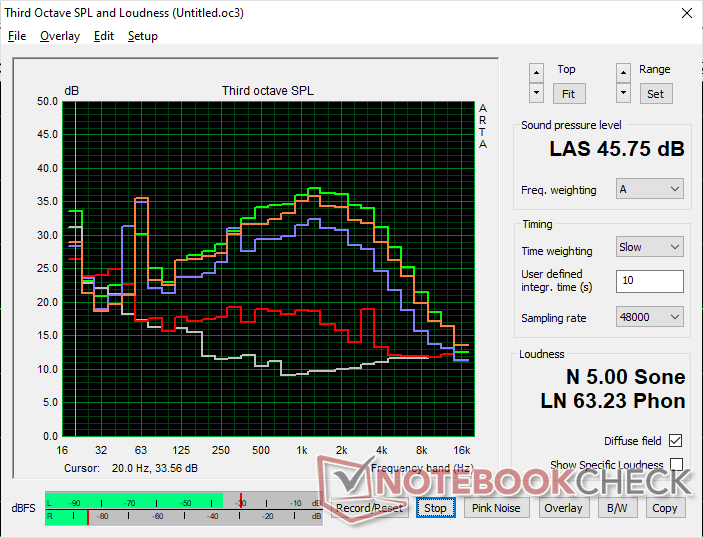
Geluidsniveau
| Onbelast |
| 22.9 / 22.9 / 28.5 dB (A) |
| Belasting |
| 40.6 / 45.8 dB (A) |
 | ||
30 dB stil 40 dB(A) hoorbaar 50 dB(A) luid |
||
min: | ||
| HP ZBook Fury 16 G10 RTX 5000 Ada Generation Laptop, i9-13950HX, SK hynix PC801 HFS001TEJ9X101N | HP ZBook Fury 16 G9 RTX A5500 Laptop GPU, i9-12950HX, Micron 3400 1TB MTFDKBA1T0TFH | Dell Precision 5000 5680 RTX 5000 Ada Generation Laptop, i9-13900H, 2x SK hynix PC801 HFS512GEJ9X101N RAID 0 | Lenovo ThinkPad P16 G1 RTX A5500 RTX A5500 Laptop GPU, i9-12950HX, WDC PC SN810 2TB | MSI CreatorPro Z16P B12UKST RTX A3000 Laptop GPU, i7-12700H, Samsung PM9A1 MZVL21T0HCLR | Asus ProArt StudioBook 16 W7600H5A-2BL2 RTX A5000 Laptop GPU, W-11955M, 2x Micron 2300 2TB MTFDHBA2T0TDV (RAID 0) | |
|---|---|---|---|---|---|---|
| Noise | -1% | 0% | 2% | -6% | -5% | |
| uit / omgeving * (dB) | 22.9 | 22.6 1% | 22.8 -0% | 23.1 -1% | 24.1 -5% | 26 -14% |
| Idle Minimum * (dB) | 22.9 | 22.7 1% | 23 -0% | 23.1 -1% | 27.1 -18% | 26 -14% |
| Idle Average * (dB) | 22.9 | 22.7 1% | 23 -0% | 23.1 -1% | 27.1 -18% | 26 -14% |
| Idle Maximum * (dB) | 28.5 | 28.8 -1% | 23 19% | 23.1 19% | 27.1 5% | 26.5 7% |
| Load Average * (dB) | 40.6 | 36.2 11% | 37.2 8% | 28.9 29% | 42.9 -6% | 42 -3% |
| Witcher 3 ultra * (dB) | 44.1 | 49.5 -12% | 51 -16% | 51.6 -17% | 44 -0% | |
| Load Maximum * (dB) | 45.8 | 49.3 -8% | 51 -11% | 51.4 -12% | 47 -3% | 43 6% |
* ... kleiner is beter
Temperatuur
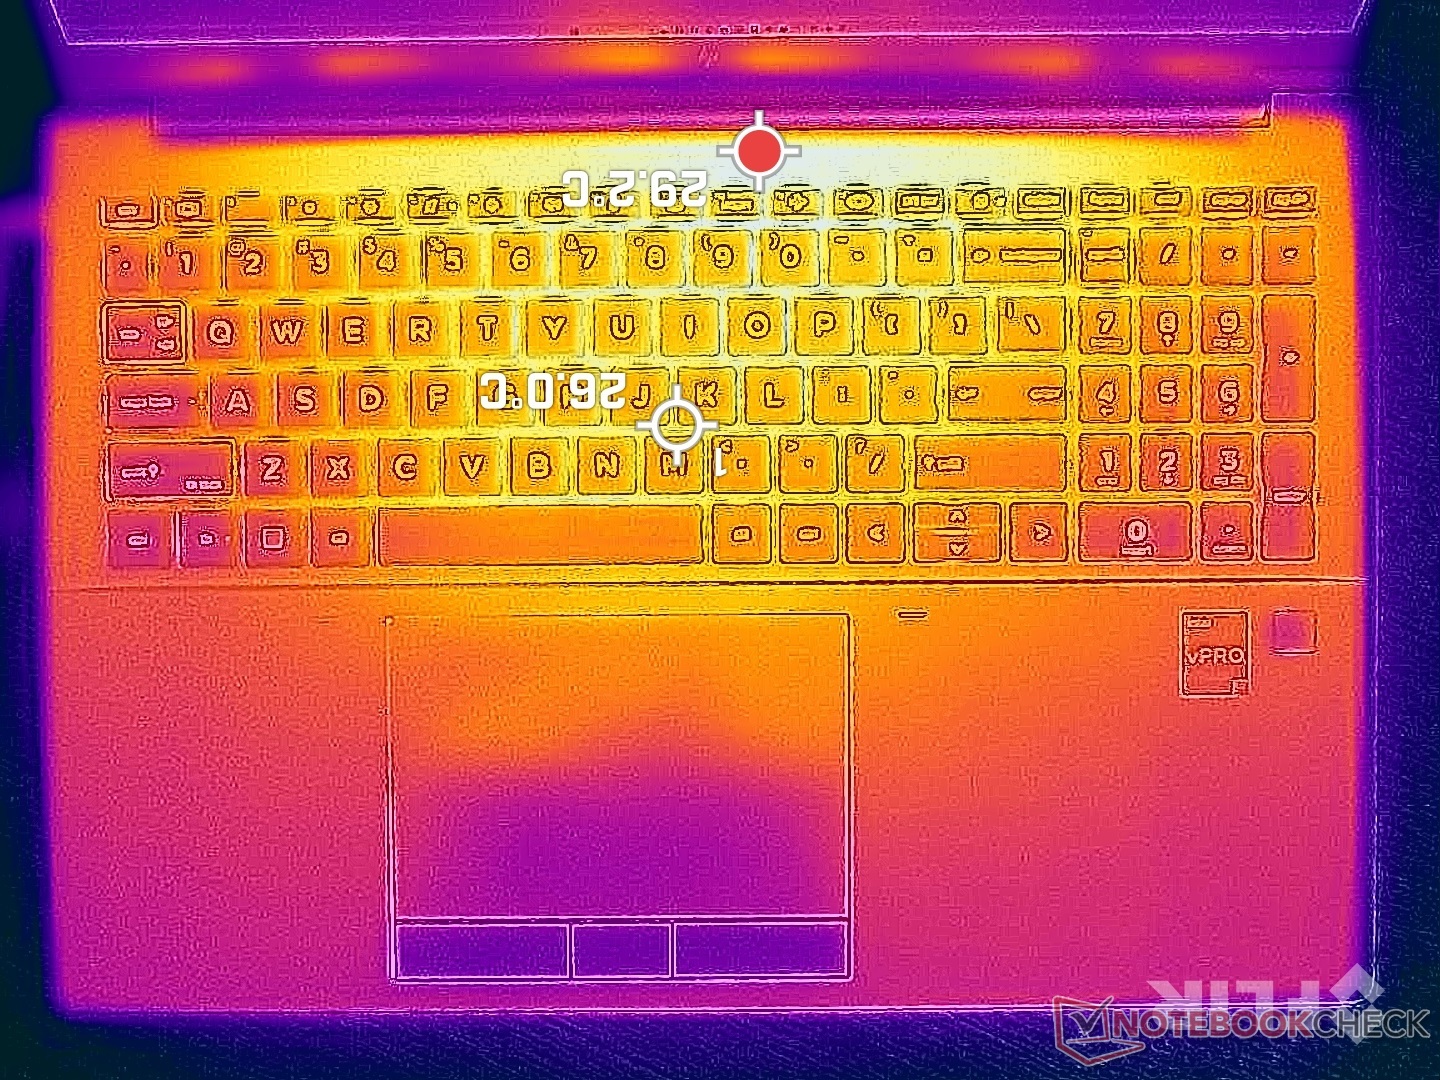
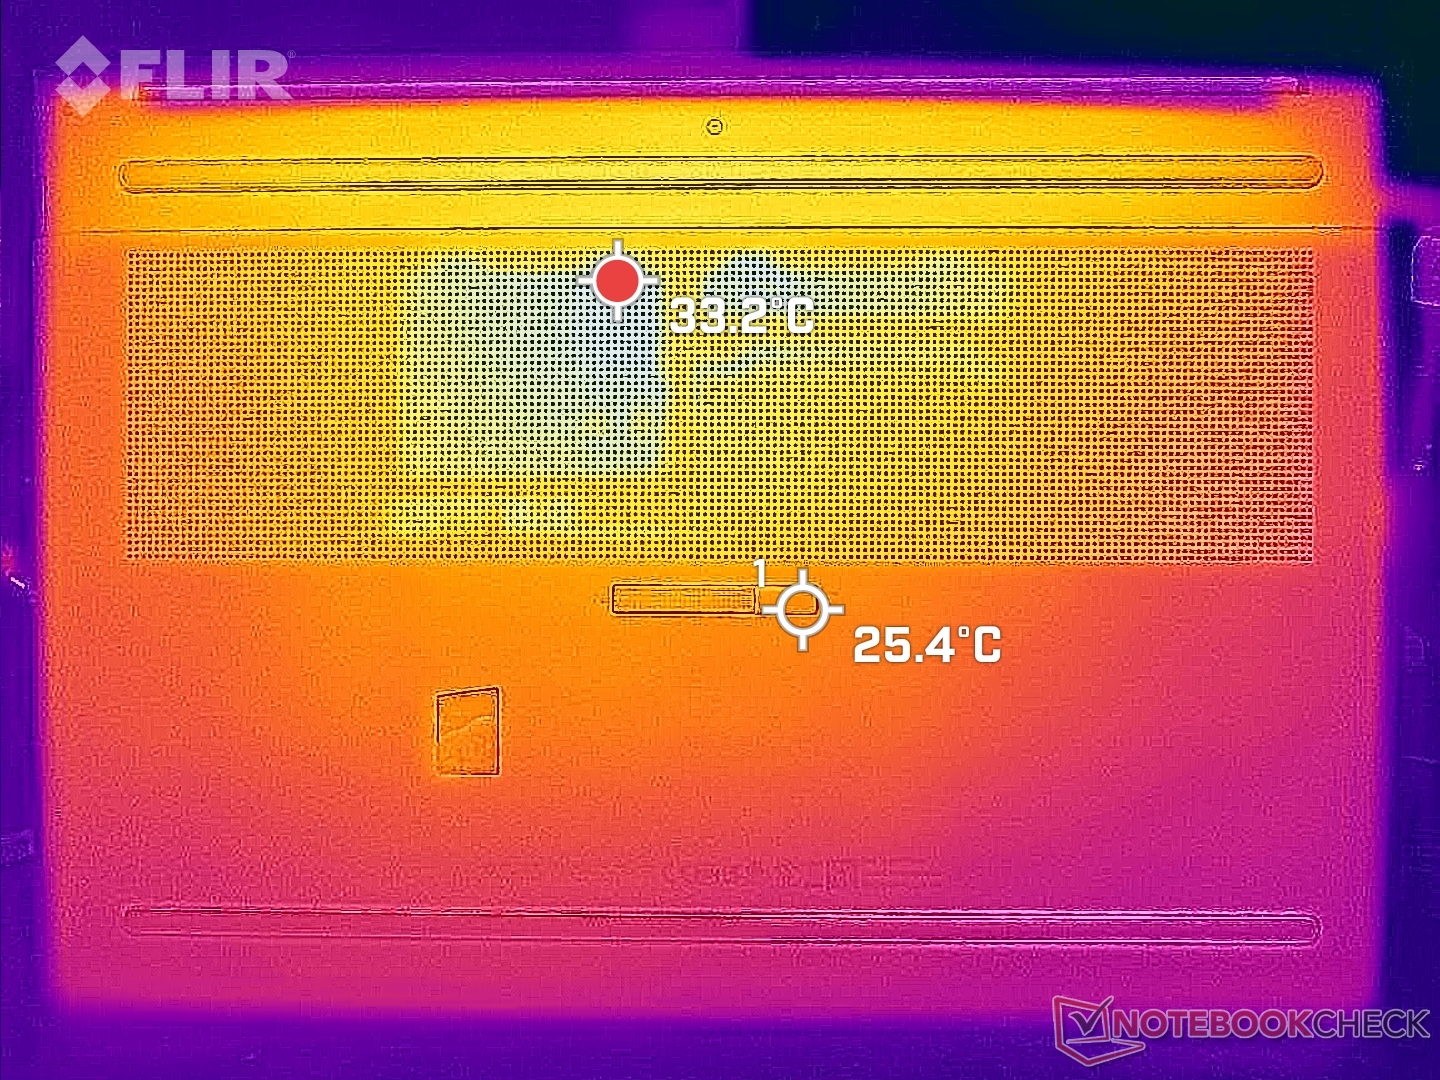
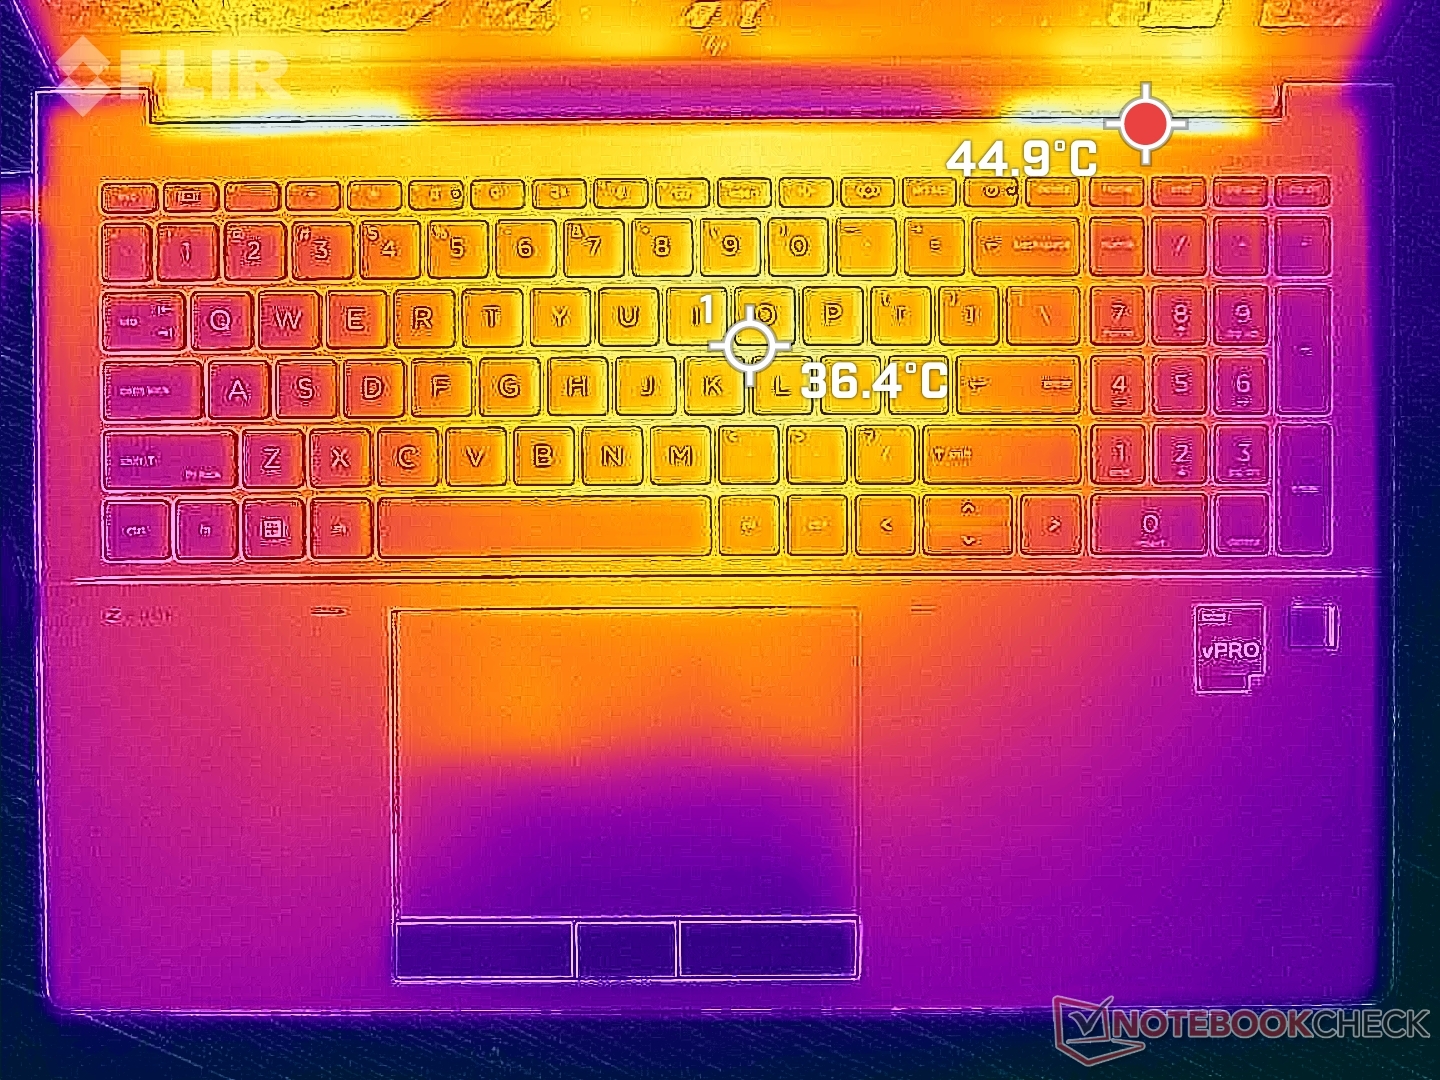
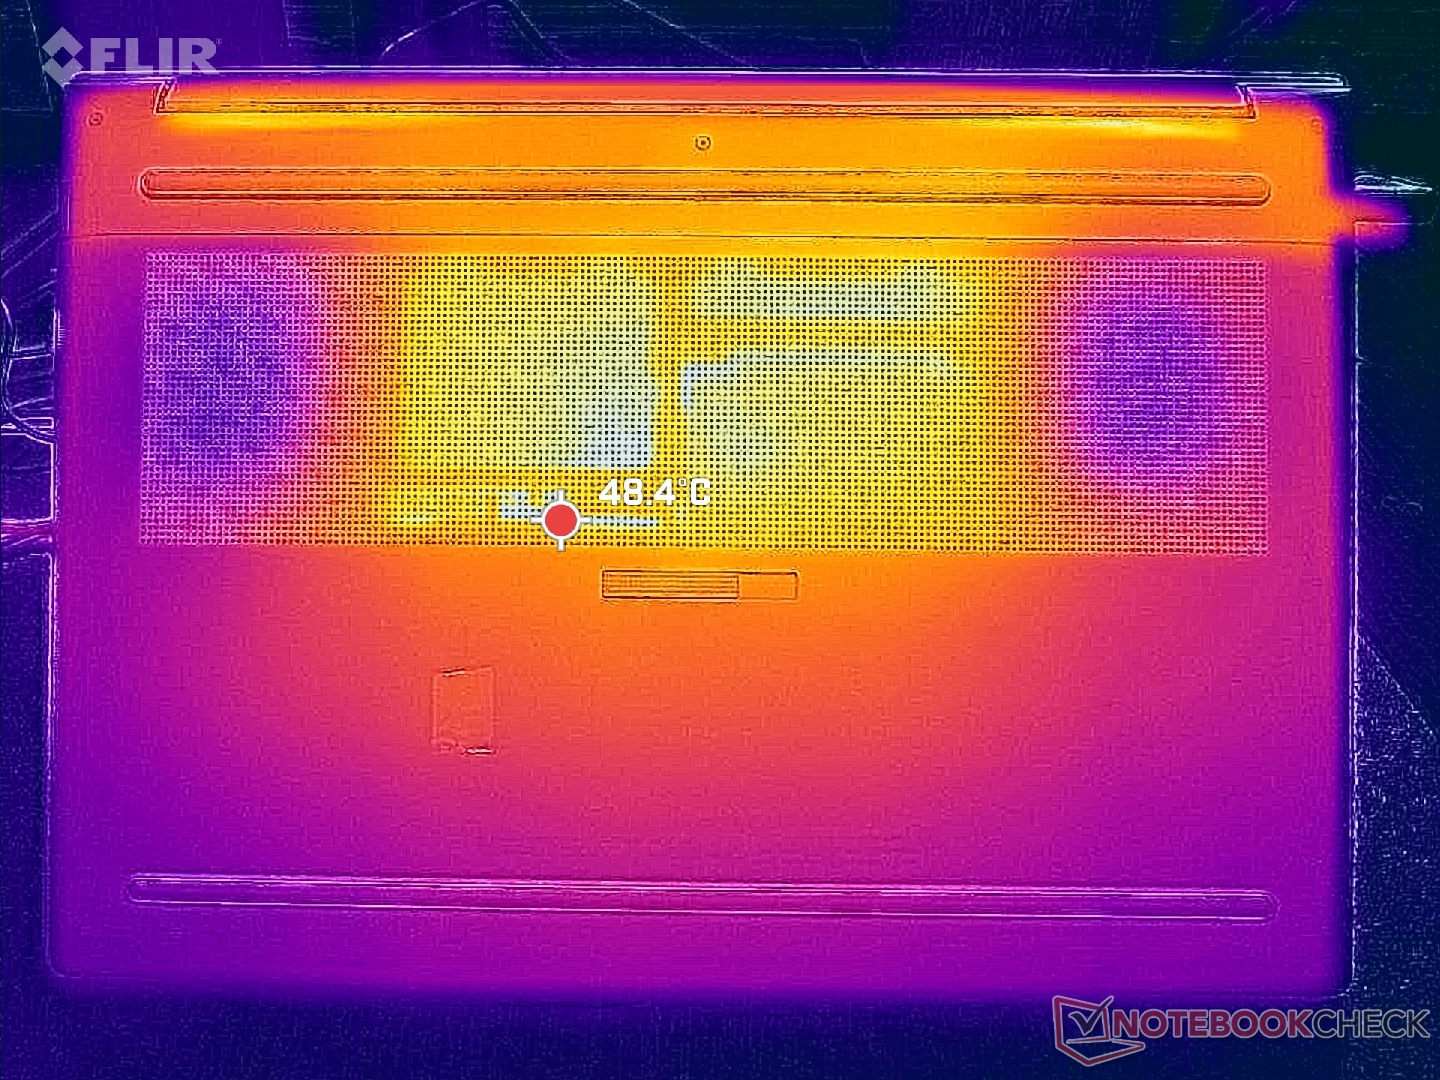
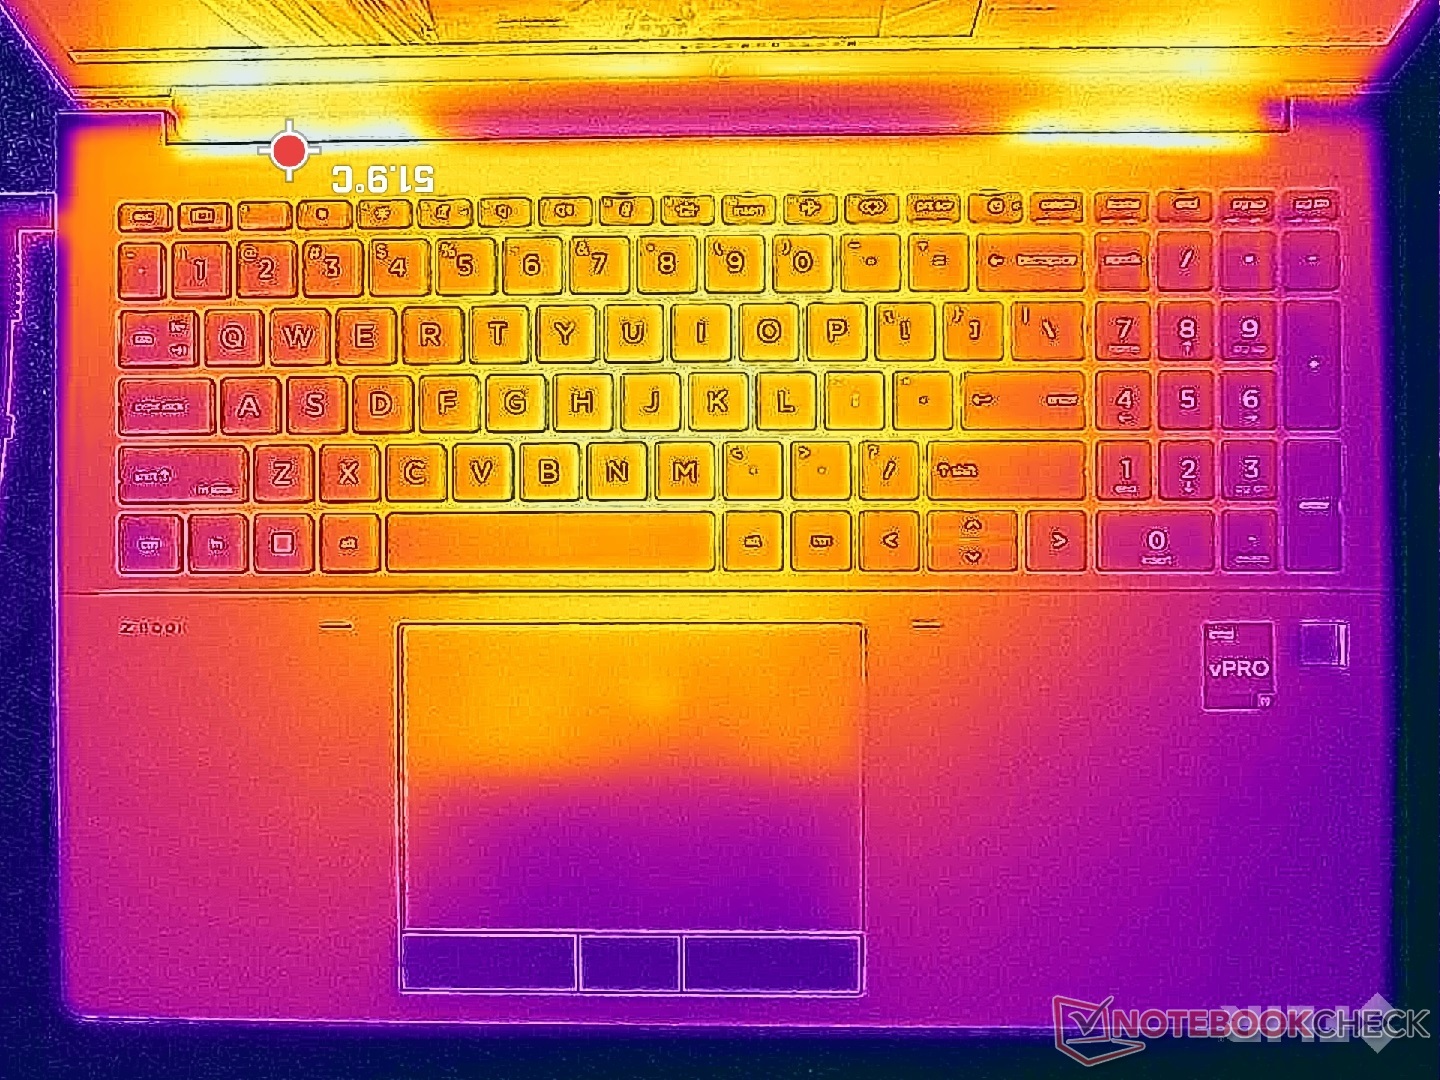
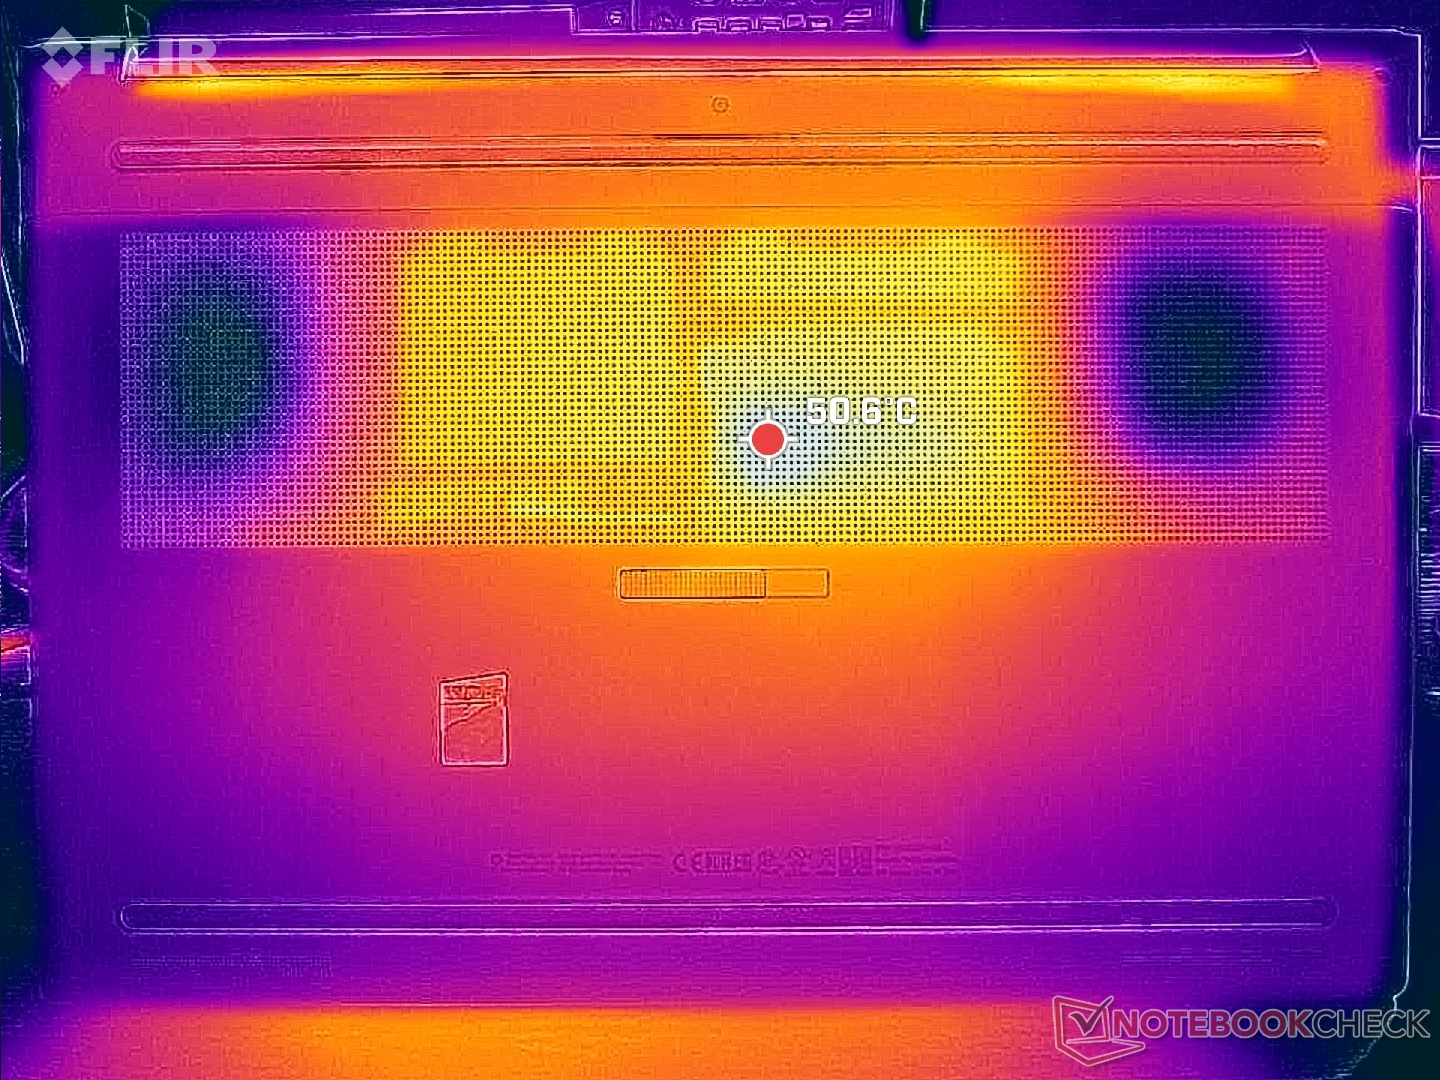
De oppervlaktetemperaturen kunnen oplopen tot meer dan 36 C in het midden van het toetsenbord of 45 C aan de achterkant bij hoge belastingen. Interessant genoeg is het systeem koeler dan de Precision 5680 op het toetsenbord, maar het tegenovergestelde geldt voor de onderoppervlakken.
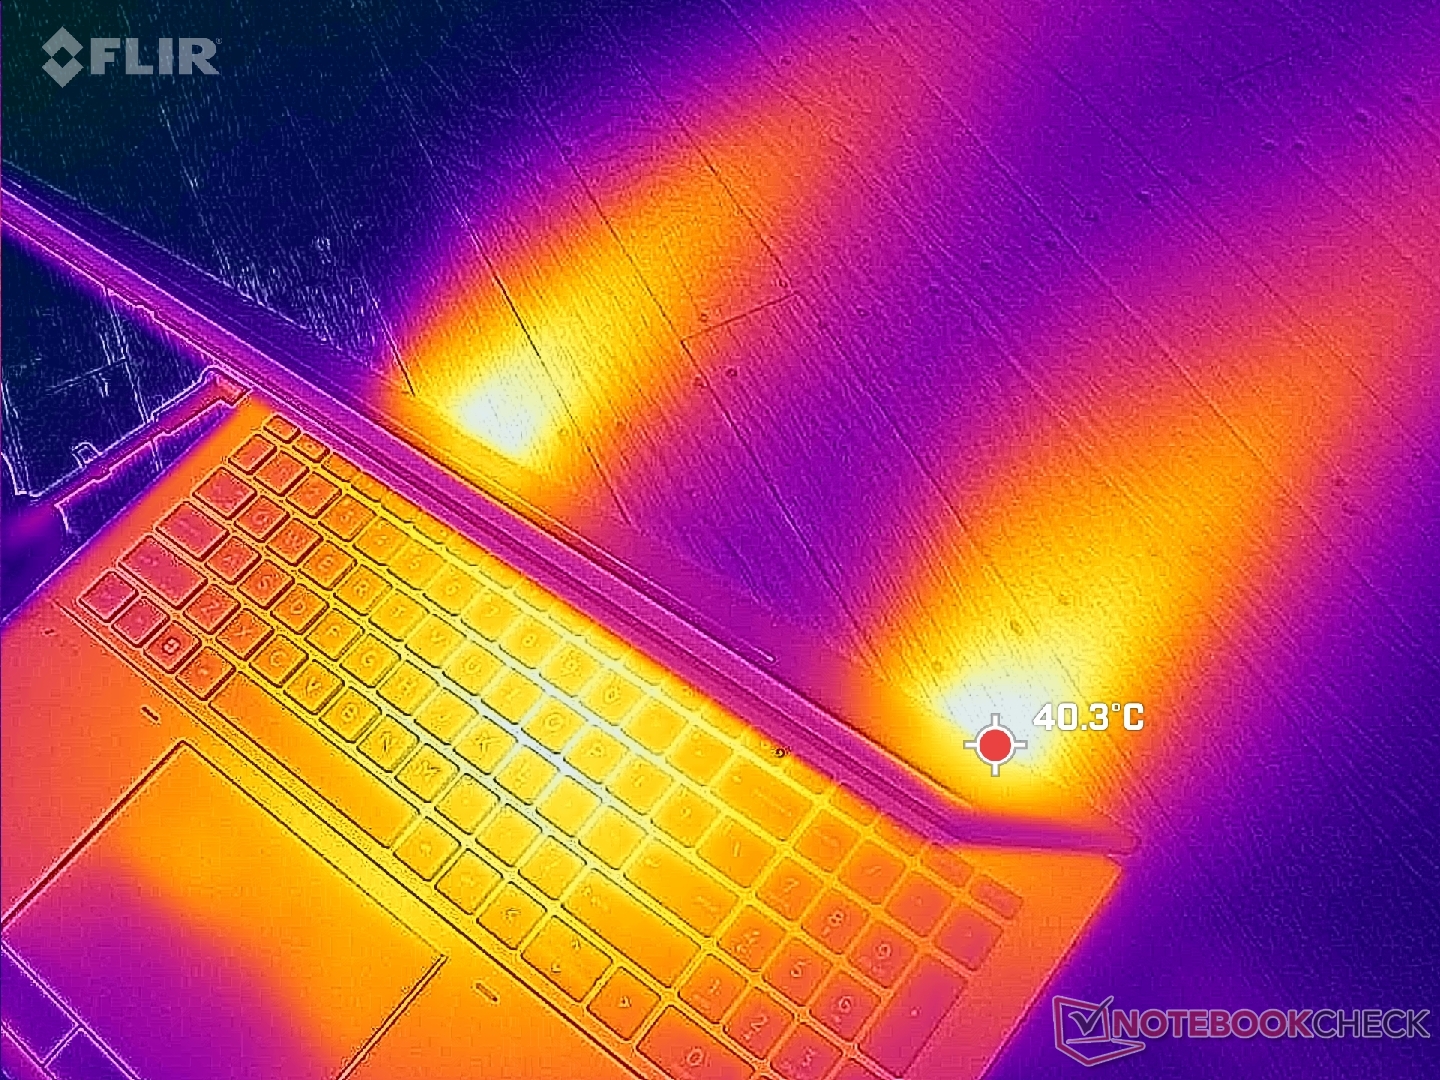
(±) De maximumtemperatuur aan de bovenzijde bedraagt 44.8 °C / 113 F, vergeleken met het gemiddelde van 38.2 °C / 101 F, variërend van 22.2 tot 69.8 °C voor de klasse Workstation.
(-) De bodem warmt op tot een maximum van 50 °C / 122 F, vergeleken met een gemiddelde van 41.1 °C / 106 F
(+) Bij onbelast gebruik bedraagt de gemiddelde temperatuur voor de bovenzijde 30.6 °C / 87 F, vergeleken met het apparaatgemiddelde van 32 °C / 90 F.
(±) Bij het spelen van The Witcher 3 is de gemiddelde temperatuur voor de bovenzijde 34.7 °C / 94 F, vergeleken met het apparaatgemiddelde van 32 °C / 90 F.
(±) De palmsteunen en het touchpad kunnen zeer heet aanvoelen met een maximum van ###max## °C / 102.6 F.
(-) De gemiddelde temperatuur van de handpalmsteun van soortgelijke toestellen bedroeg 27.8 °C / 82 F (-11.4 °C / -20.6 F).
| HP ZBook Fury 16 G10 Intel Core i9-13950HX, NVIDIA RTX 5000 Ada Generation Laptop | HP ZBook Fury 16 G9 Intel Core i9-12950HX, NVIDIA RTX A5500 Laptop GPU | Dell Precision 5000 5680 Intel Core i9-13900H, NVIDIA RTX 5000 Ada Generation Laptop | Lenovo ThinkPad P16 G1 RTX A5500 Intel Core i9-12950HX, NVIDIA RTX A5500 Laptop GPU | MSI CreatorPro Z16P B12UKST Intel Core i7-12700H, NVIDIA RTX A3000 Laptop GPU | Asus ProArt StudioBook 16 W7600H5A-2BL2 Intel Xeon W-11955M, NVIDIA RTX A5000 Laptop GPU | |
|---|---|---|---|---|---|---|
| Heat | 8% | 4% | -3% | -4% | -3% | |
| Maximum Upper Side * (°C) | 44.8 | 43.2 4% | 50.2 -12% | 44.8 -0% | 56.3 -26% | 45.7 -2% |
| Maximum Bottom * (°C) | 50 | 50.4 -1% | 32 36% | 49.8 -0% | 68.3 -37% | 48.3 3% |
| Idle Upper Side * (°C) | 34.4 | 28.6 17% | 37.4 -9% | 30.6 11% | 25.2 27% | 35.3 -3% |
| Idle Bottom * (°C) | 31.8 | 28.2 11% | 31.2 2% | 38.6 -21% | 25.9 19% | 34.4 -8% |
* ... kleiner is beter
Stresstest

Gemiddelde CPU kloksnelheden en stroomverbruik op het bord tijdens het uitvoeren van Prime95 stabiliseren op respectievelijk 1,5 GHz en 48 W, vergeleken met 2,9 GHz en 115 W op de Razer Blade 18 uitgerust met dezelfde Core i9-13950HX CPU. De kerntemperatuur zou ongeveer 8 C koeler zijn op de HP, wat suggereert dat de Fury 16 G10 voorrang geeft aan temperatuurbeheersing boven snellere prestaties.
Het draaien in de Balanced modus vermindert de grafische prestaties. Bijvoorbeeld, GPU kloksnelheden en stroomverbruik bij Witcher 3 stabiliseren op respectievelijk 1845 MHz en 102 W, vergeleken met 1770 MHz en 94 W in de gebalanceerde modus. Hoe dan ook, het HP systeem bereikt hogere werkelijke TGP-waarden dan dezelfde GPU in de Precision 5680 waar deze slechts 72 W is.
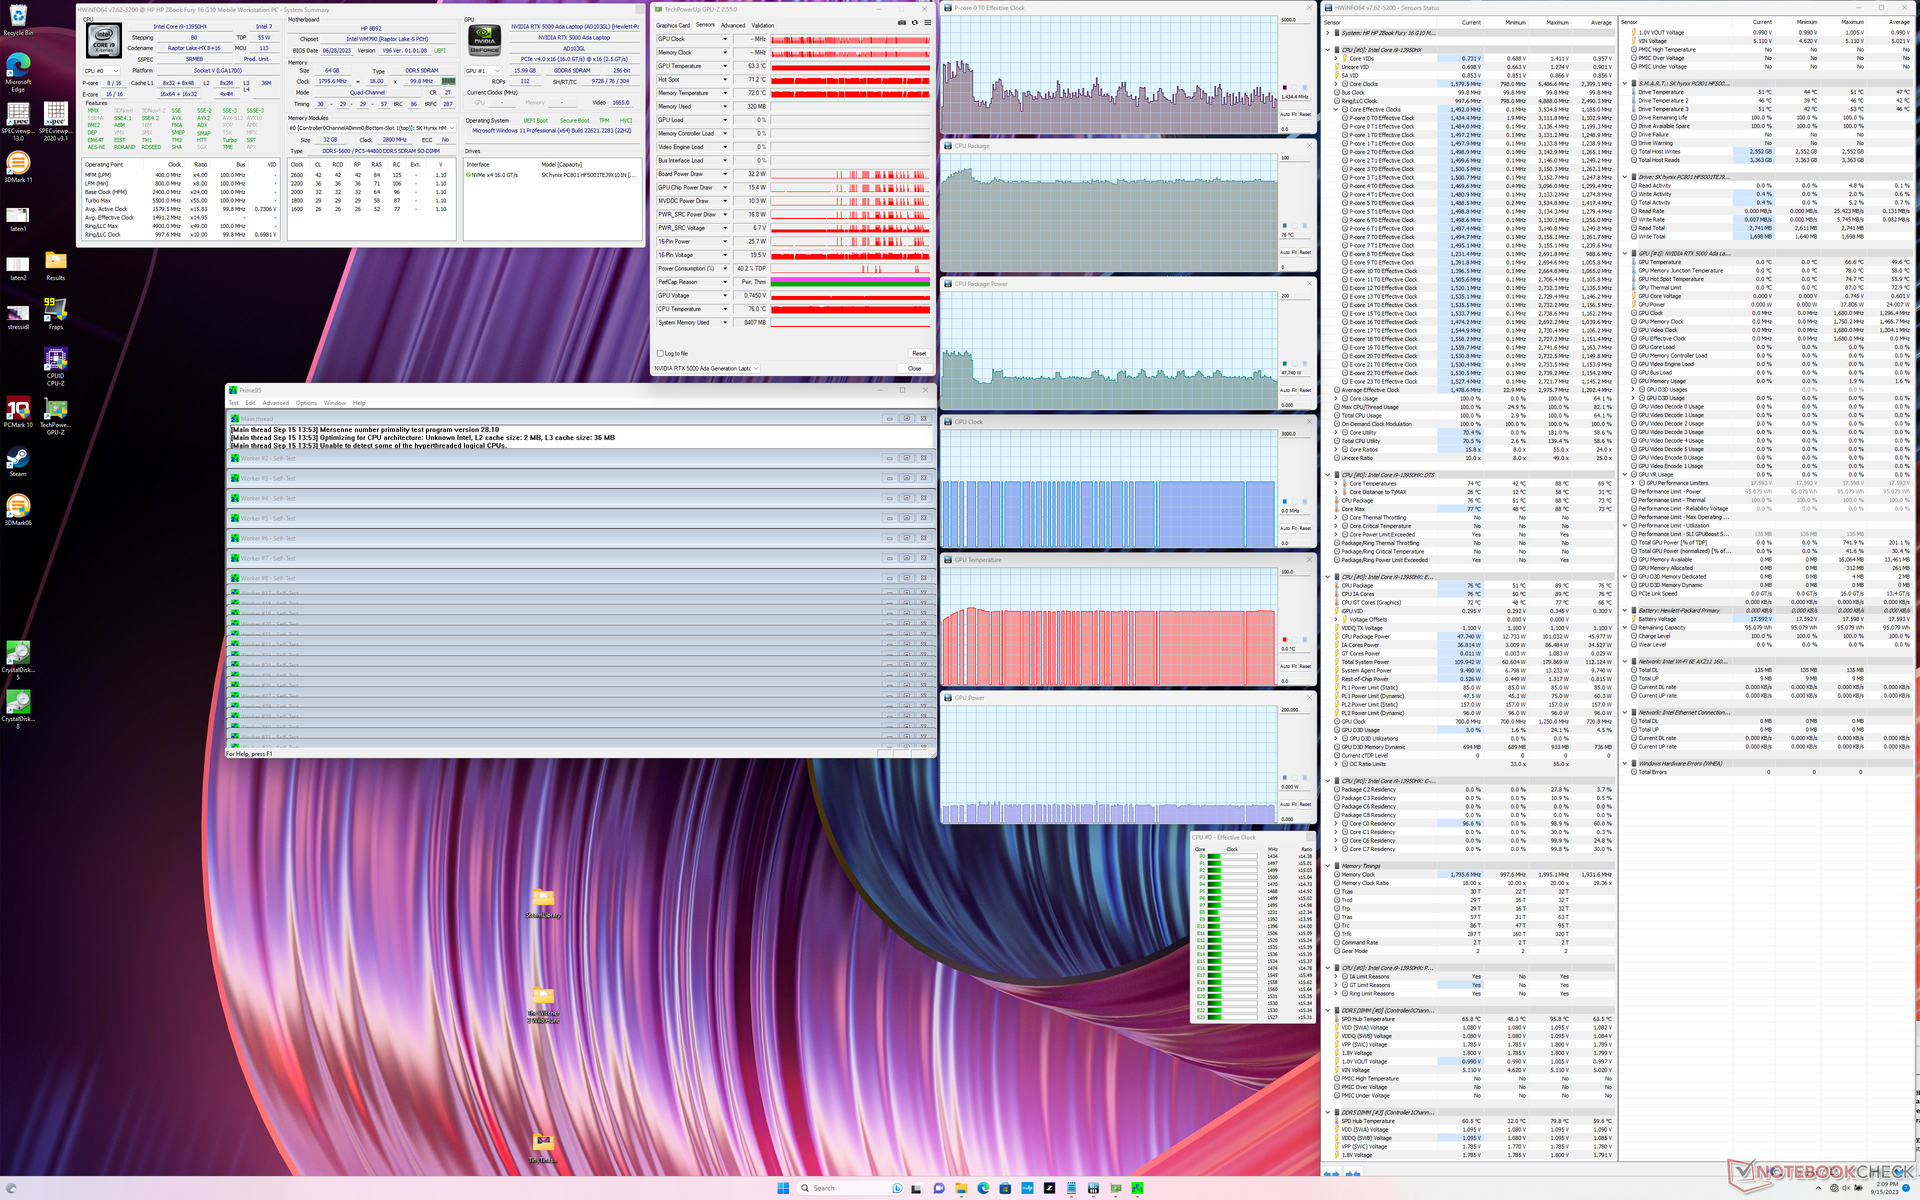

| CPU-klok (GHz) | GPU-klok (MHz) | Gemiddelde CPU-temperatuur (°C) | Gemiddelde GPU-temperatuur (°C) | |
| Systeem inactief | -- | -- | 68 | 54 |
| Prime95-stress | ~1.7 | -- | 76 | 63 |
| Prime95 + FurMark-stress | ~1.1 | 1440 | 75 | 65 |
| Witcher 3 Stress (evenwichtige modus) | ~1.1 | 1770 | 78 | 70 |
| Witcher 3 Stress (prestatiemodus) | ~1.1 | 1845 | 79 | 70 |
Luidsprekers
HP ZBook Fury 16 G10 audioanalyse
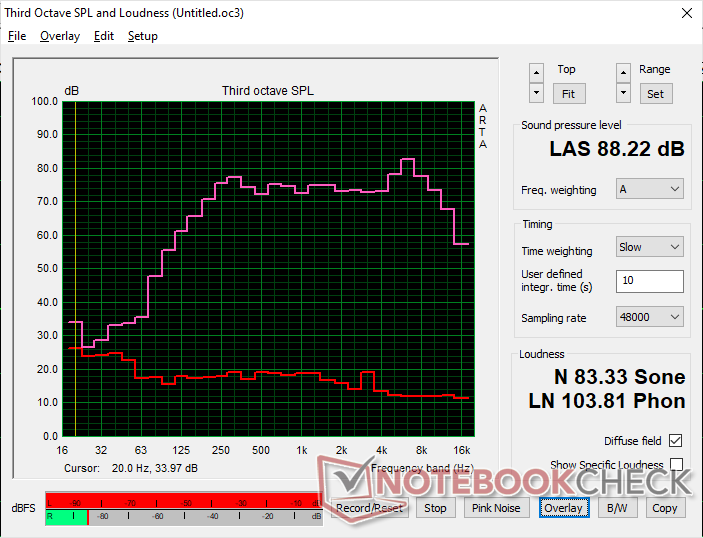
(+) | luidsprekers kunnen relatief luid spelen (88.2 dB)
Bas 100 - 315 Hz
(±) | verminderde zeebaars - gemiddeld 7.7% lager dan de mediaan
(±) | lineariteit van de lage tonen is gemiddeld (8.7% delta ten opzichte van de vorige frequentie)
Midden 400 - 2000 Hz
(+) | evenwichtige middens - slechts 1.2% verwijderd van de mediaan
(+) | de middentonen zijn lineair (3.3% delta ten opzichte van de vorige frequentie)
Hoog 2 - 16 kHz
(+) | evenwichtige hoogtepunten - slechts 2.8% verwijderd van de mediaan
(+) | de hoge tonen zijn lineair (5.2% delta naar de vorige frequentie)
Algemeen 100 - 16.000 Hz
(+) | het totale geluid is lineair (8.6% verschil met de mediaan)
Vergeleken met dezelfde klasse
» 2% van alle geteste apparaten in deze klasse waren beter, 1% vergelijkbaar, 96% slechter
» De beste had een delta van 7%, het gemiddelde was 17%, de slechtste was 35%
Vergeleken met alle geteste toestellen
» 2% van alle geteste apparaten waren beter, 1% gelijk, 97% slechter
» De beste had een delta van 4%, het gemiddelde was 23%, de slechtste was 134%
Apple MacBook Pro 16 2021 M1 Pro audioanalyse
(+) | luidsprekers kunnen relatief luid spelen (84.7 dB)
Bas 100 - 315 Hz
(+) | goede baars - slechts 3.8% verwijderd van de mediaan
(+) | de lage tonen zijn lineair (5.2% delta naar de vorige frequentie)
Midden 400 - 2000 Hz
(+) | evenwichtige middens - slechts 1.3% verwijderd van de mediaan
(+) | de middentonen zijn lineair (2.1% delta ten opzichte van de vorige frequentie)
Hoog 2 - 16 kHz
(+) | evenwichtige hoogtepunten - slechts 1.9% verwijderd van de mediaan
(+) | de hoge tonen zijn lineair (2.7% delta naar de vorige frequentie)
Algemeen 100 - 16.000 Hz
(+) | het totale geluid is lineair (4.6% verschil met de mediaan)
Vergeleken met dezelfde klasse
» 0% van alle geteste apparaten in deze klasse waren beter, 0% vergelijkbaar, 100% slechter
» De beste had een delta van 5%, het gemiddelde was 17%, de slechtste was 45%
Vergeleken met alle geteste toestellen
» 0% van alle geteste apparaten waren beter, 0% gelijk, 100% slechter
» De beste had een delta van 4%, het gemiddelde was 23%, de slechtste was 134%
Energiebeheer
Stroomverbruik
Het stroomverbruik onder belasting blijft ongeveer gelijk aan dat van het model van vorig jaar, ondanks de CPU- en GPU-verbeteringen voor veel hogere prestaties per watt. Het is over het algemeen ook hoger dan op de Precision 5680 vanwege de hogere TGP doelen van het HP model.
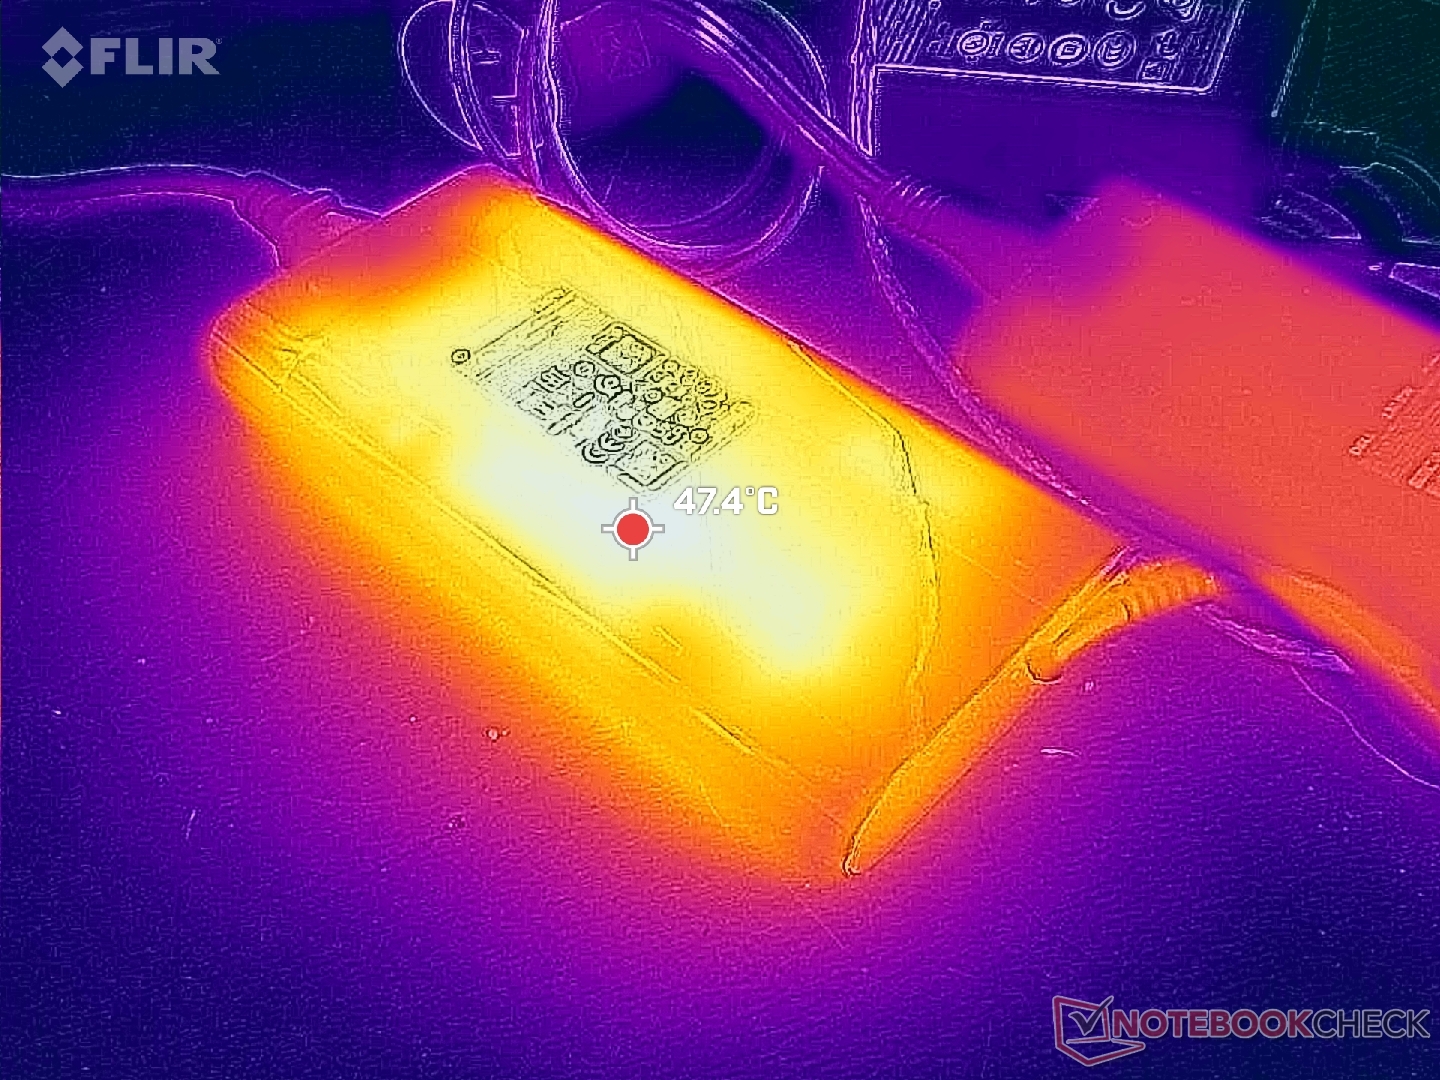
Merk op dat onze Fury 16 G10 merkbaar meer stroom zou trekken dan de vergelijkbaar geconfigureerde Precision 5680 bij het uitvoeren van hoge belastingen zoals games, voornamelijk vanwege de hogere stroomplafonddoelen voor de HP. De HP wordt geleverd met een 230 W AC adapter, terwijl de Dell wordt geleverd met een kleinere 165 W USB-C AC adapter.
| Uit / Standby | |
| Inactief | |
| Belasting |
|
Key:
min: | |
| HP ZBook Fury 16 G10 i9-13950HX, RTX 5000 Ada Generation Laptop, SK hynix PC801 HFS001TEJ9X101N, IPS, 3840x2400, 16" | HP ZBook Fury 16 G9 i9-12950HX, RTX A5500 Laptop GPU, Micron 3400 1TB MTFDKBA1T0TFH, IPS, 3840x2400, 16" | Dell Precision 5000 5680 i9-13900H, RTX 5000 Ada Generation Laptop, 2x SK hynix PC801 HFS512GEJ9X101N RAID 0, OLED, 3840x2400, 16" | Lenovo ThinkPad P16 G1 RTX A5500 i9-12950HX, RTX A5500 Laptop GPU, WDC PC SN810 2TB, IPS, 3840x2400, 16" | MSI CreatorPro Z16P B12UKST i7-12700H, RTX A3000 Laptop GPU, Samsung PM9A1 MZVL21T0HCLR, IPS, 2560x1600, 16" | Asus ProArt StudioBook 16 W7600H5A-2BL2 W-11955M, RTX A5000 Laptop GPU, 2x Micron 2300 2TB MTFDHBA2T0TDV (RAID 0), OLED, 3840x2400, 16" | |
|---|---|---|---|---|---|---|
| Power Consumption | -24% | 28% | -9% | 22% | 18% | |
| Idle Minimum * (Watt) | 15.3 | 19.5 -27% | 8 48% | 7.5 51% | 10.8 29% | 12.4 19% |
| Idle Average * (Watt) | 18.2 | 29 -59% | 10.4 43% | 20.1 -10% | 16.3 10% | 16.5 9% |
| Idle Maximum * (Watt) | 28 | 40.7 -45% | 30.5 -9% | 40 -43% | 16.9 40% | 25 11% |
| Load Average * (Watt) | 137.9 | 142.1 -3% | 75.4 45% | 137 1% | 111.7 19% | 132 4% |
| Witcher 3 ultra * (Watt) | 189.4 | 188.6 -0% | 134 29% | 208 -10% | 152.1 20% | 132 30% |
| Load Maximum * (Watt) | 202 | 224.4 -11% | 175 13% | 285.9 -42% | 177.4 12% | 134 34% |
* ... kleiner is beter
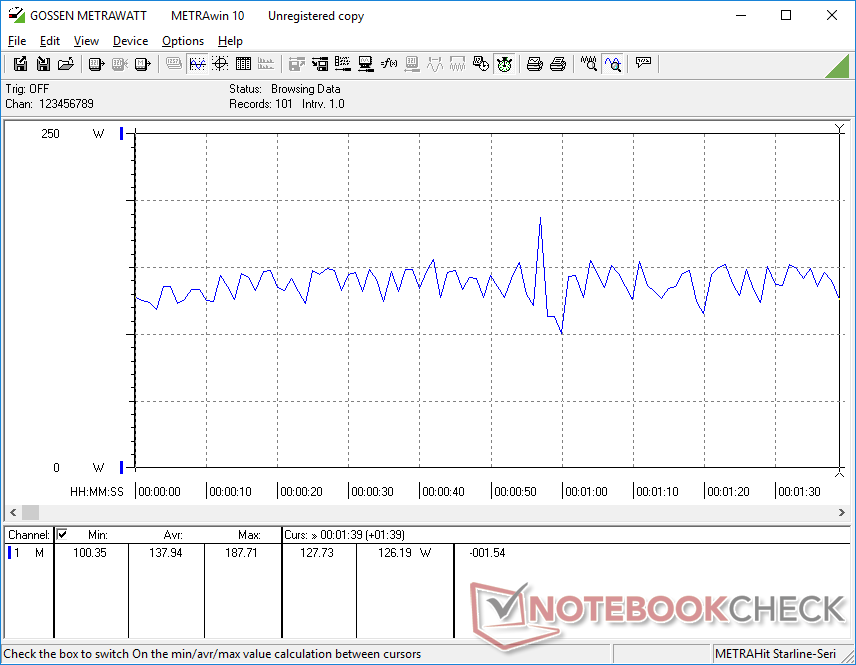
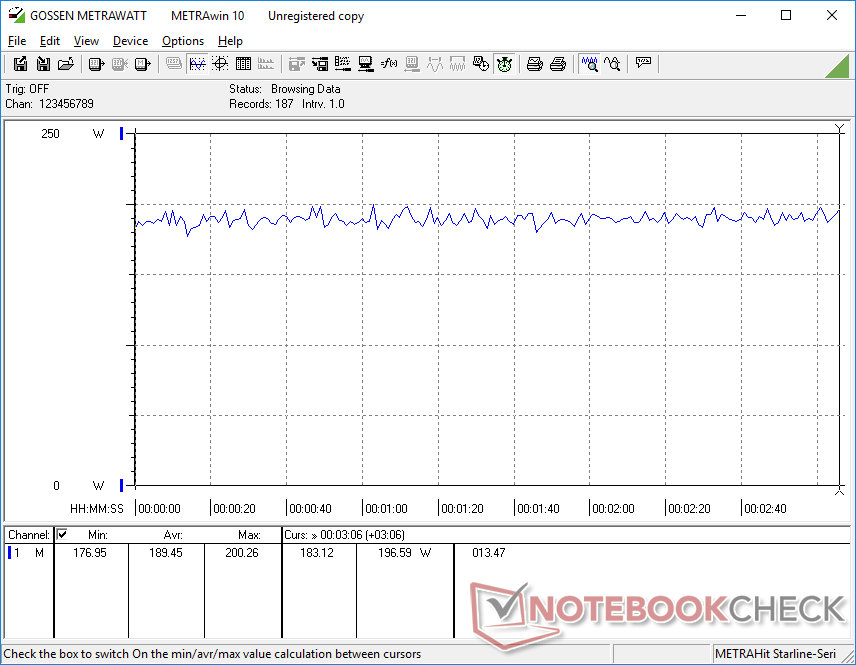
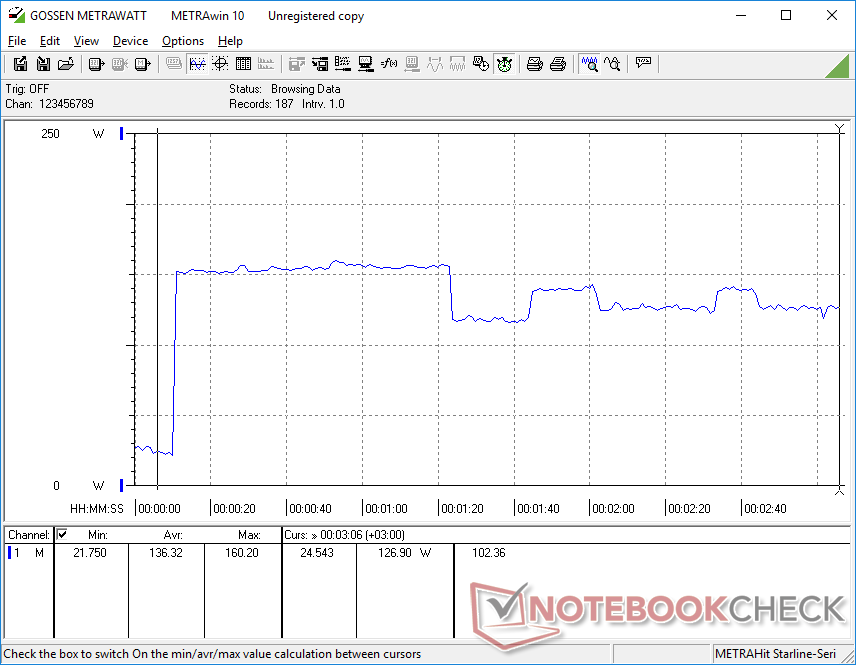
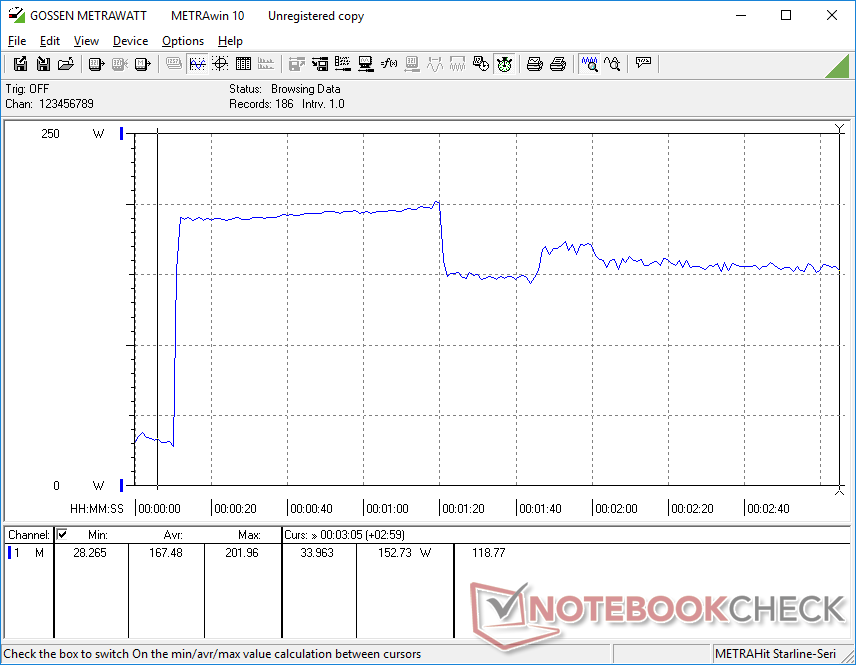
Power Consumption Witcher 3 / Stresstest
Power Consumption external Monitor
Levensduur batterij
De algemene runtimes zijn niet korter dan op het model van vorig jaar, ondanks de toename in CPU-prestaties, GPU-prestaties en beeldschermverversingsfrequentie. We zijn in staat om iets meer dan 7 uur WLAN browsen in evenwichtige modus op te nemen, of bijna een uur langer dan op de Fury 16 G9 van vorig jaar.
Opladen van leeg naar vol met de meegeleverde AC-adapter duurt iets minder dan 90 minuten. Het systeem kan ook worden opgeladen via USB-C adapters van derden, zij het langzamer.
| HP ZBook Fury 16 G10 i9-13950HX, RTX 5000 Ada Generation Laptop, 95 Wh | HP ZBook Fury 16 G9 i9-12950HX, RTX A5500 Laptop GPU, 95 Wh | Dell Precision 5000 5680 i9-13900H, RTX 5000 Ada Generation Laptop, 98 Wh | Lenovo ThinkPad P16 G1 RTX A5500 i9-12950HX, RTX A5500 Laptop GPU, 94 Wh | MSI CreatorPro Z16P B12UKST i7-12700H, RTX A3000 Laptop GPU, 90 Wh | Asus ProArt StudioBook 16 W7600H5A-2BL2 W-11955M, RTX A5000 Laptop GPU, 90 Wh | |
|---|---|---|---|---|---|---|
| Batterijduur | -18% | 36% | -21% | -21% | -32% | |
| WiFi v1.3 (h) | 7.3 | 6 -18% | 9.9 36% | 5.8 -21% | 5.8 -21% | 5 -32% |
| Reader / Idle (h) | 5.3 | 17.9 | ||||
| Load (h) | 1.2 | 1.7 | ||||
| H.264 (h) | 1.8 | |||||
| Witcher 3 ultra (h) | 1.6 |
Pro
Contra
Verdict - Het HP Workstation dat je moet hebben voor grafische jagers
Soms zijn de processorupdates van jaar tot jaar relatief klein. Andere keren kunnen ze echter behoorlijk significant zijn. De ZBook Fury 16 G10 valt in de laatste categorie, omdat de 13e generatie CPU en Nvidia RTX Ada GPU opties een aanzienlijke prestatieverbetering kunnen bieden ten opzichte van de ZBook Fury 16 G9, vooral als het aankomt op graphics. Als je waarde hecht aan ECC RAM en het maximaliseren van GPU-kracht met hogere TGP-limieten, dan is de Fury 16 G10 absoluut het overwegen waard ten opzichte van elk ander 16-inch werkstation op dit moment, inclusief de Precision 5680 die wordt geleverd met dezelfde GPU-opties, maar met lagere TGP-doelstellingen.
De ZBook Fury 16 G10 maximaliseert de GPU-kracht om een van de snelste mobiele werkstations te zijn als het aankomt op graphics. Dit lijkt echter ten koste te gaan van de SSD en CPU prestaties.
Een paar problemen weerhouden de HP ervan om "perfect" te zijn. SSD throttling komt nog steeds voor en de CPU is langzamer dan verwacht, zelfs als deze in de Performance mode staat. Dit zou makkelijker te vergeven zijn op slankere of kleinere werkstations, maar de Fury 16 G10 is allesbehalve dun en licht.
Prijs en beschikbaarheid
HP ZBook Fury 16 G10
- 23-09-2023 v7 (old)
Allen Ngo
Transparantie
De selectie van te beoordelen apparaten wordt gemaakt door onze redactie. Het testexemplaar werd ten behoeve van deze beoordeling door de fabrikant of detailhandelaar in bruikleen aan de auteur verstrekt. De kredietverstrekker had geen invloed op deze recensie, noch ontving de fabrikant vóór publicatie een exemplaar van deze recensie. Er bestond geen verplichting om deze recensie te publiceren. Als onafhankelijk mediabedrijf is Notebookcheck niet onderworpen aan het gezag van fabrikanten, detailhandelaren of uitgevers.
[transparency_disclaimer]Dit is hoe Notebookcheck test
Elk jaar beoordeelt Notebookcheck onafhankelijk honderden laptops en smartphones met behulp van gestandaardiseerde procedures om ervoor te zorgen dat alle resultaten vergelijkbaar zijn. We hebben onze testmethoden al zo'n 20 jaar voortdurend ontwikkeld en daarbij de industriestandaard bepaald. In onze testlaboratoria wordt gebruik gemaakt van hoogwaardige meetapparatuur door ervaren technici en redacteuren. Deze tests omvatten een validatieproces in meerdere fasen. Ons complexe beoordelingssysteem is gebaseerd op honderden goed onderbouwde metingen en benchmarks, waardoor de objectiviteit behouden blijft. Meer informatie over onze testmethoden kunt u hier vinden.
Price comparison

