Nvidia RTX 3000 Ada prestatiedebuut: Dell Precision 5480 werkstation review

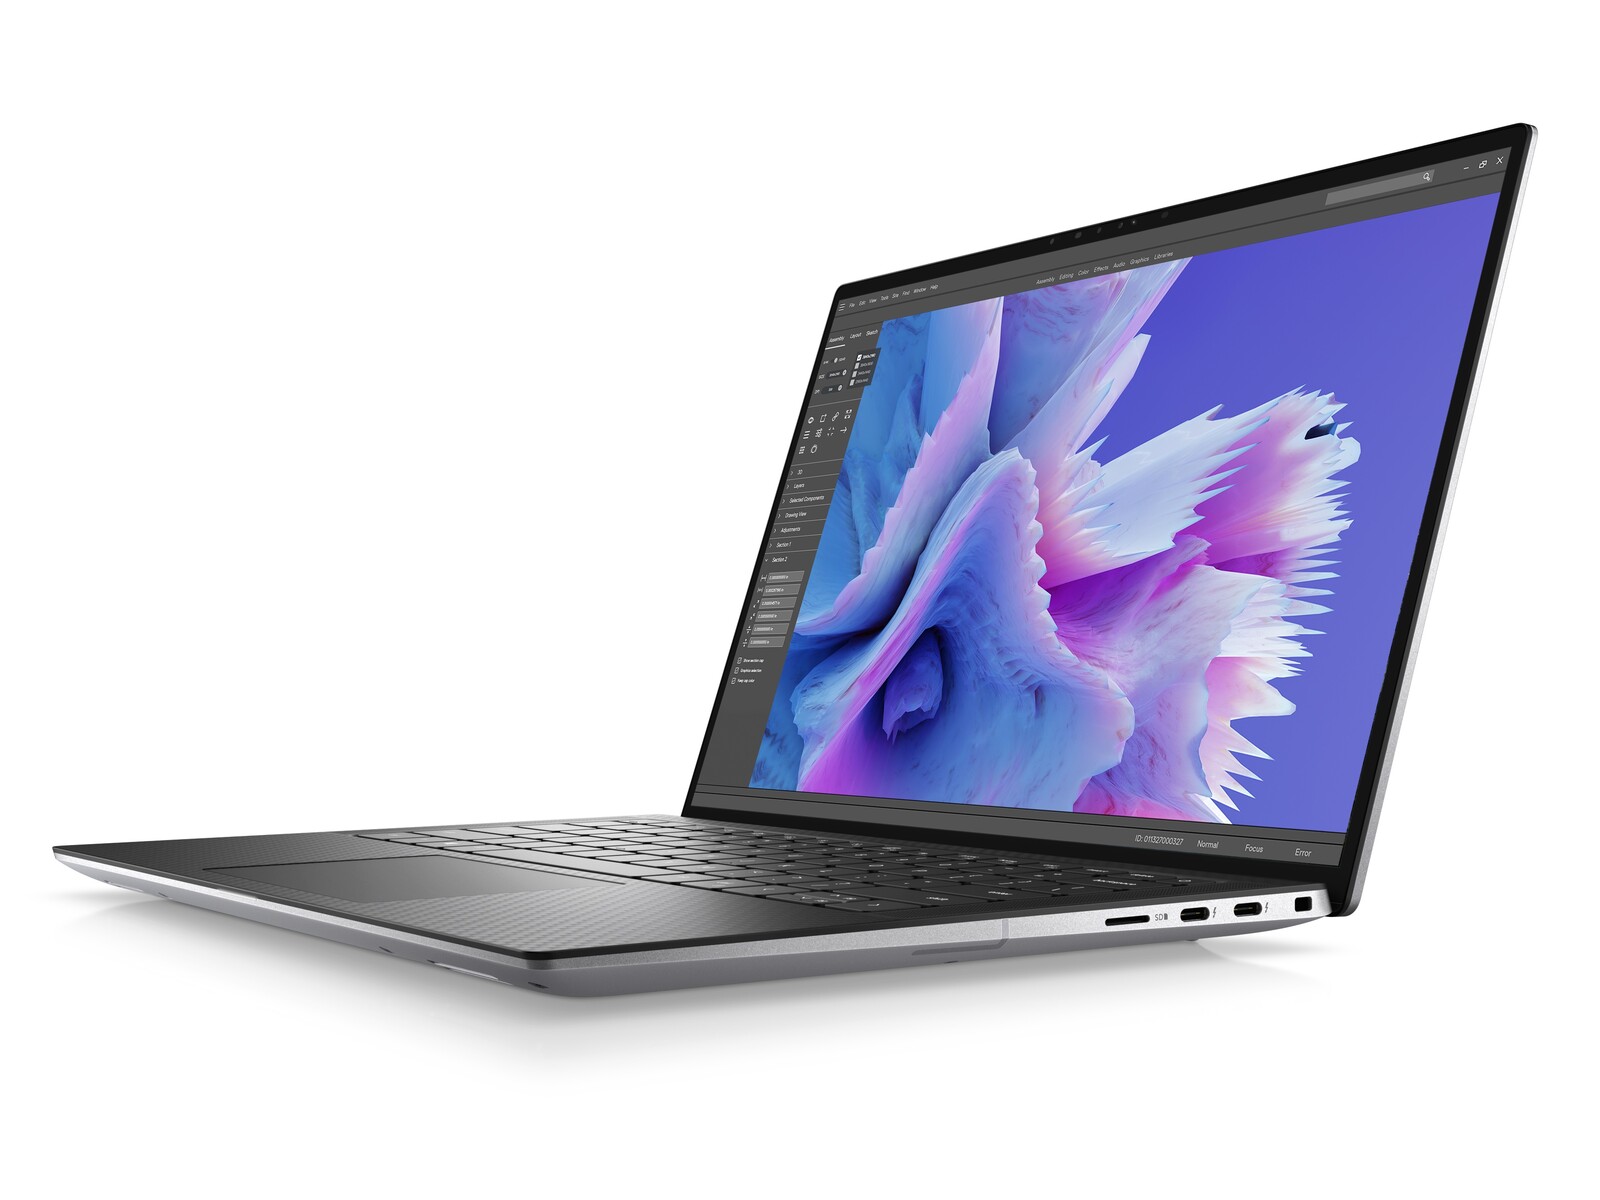
De Precision 5480 volgt direct de Precision 5470 van vorig jaar op door de 12e gen Alder Lake-H CPU en Nvidia Ampere GPU te updaten met respectievelijk 13e gen Raptor Lake-H en Ada Lovelace opties. Het is ook een van de eerste mobiele werkstations met de RTX 3000 Ada. Het chassis of skelet blijft verder hetzelfde als dat van de Precision 5470 en daarom raden we aan om eens te kijken naar onze review van het model van vorig jaar om meer te weten te komen over de fysieke kenmerken van de Precision 5480.
Onze specifieke testunit is een high-end configuratie met de Core i9-13900H CPU, RTX 3000 Ada GPU en QHD+ touchscreen voor ongeveer $4400 USD. Minder dure SKU's met de Core i5-13500H, geïntegreerde Iris Xe grafische processor en een FHD+ scherm zonder aanraakscherm zijn ook verkrijgbaar vanaf 2300 dollar.
De ruimte voor 14-inch subnotebooks is relatief klein, maar er zijn nog steeds een paar alternatieven, waaronder deLenovo ThinkPad P14s en HP ZBook Firefly 14 serie.
Meer Dell beoordelingen:
Potentiële concurrenten in vergelijking
Evaluatie | Datum | Model | Gewicht | Hoogte | Formaat | Resolutie | Beste prijs |
|---|---|---|---|---|---|---|---|
| 89.6 % v7 (old) | 09-2023 | Dell Precision 5480 i9-13900H, RTX 3000 Ada Generation Laptop | 1.6 kg | 18.95 mm | 14.00" | 2560x1600 | |
| 87.6 % v7 (old) | 09-2022 | Dell Precision 5000 5470 i9-12900H, RTX A1000 Laptop GPU | 1.6 kg | 18.95 mm | 14.00" | 2560x1600 | |
| 88.3 % v7 (old) | 10-2021 | Dell Precision 5000 5560 i7-11850H, RTX A2000 Laptop GPU | 2 kg | 18 mm | 15.60" | 3840x2400 | |
| 86.9 % v7 (old) | 04-2023 | Lenovo ThinkPad P14s G3 AMD 21J6S05000 R7 PRO 6850U, Radeon 680M | 1.5 kg | 17.9 mm | 14.00" | 1920x1200 | |
| 87.4 % v7 (old) | HP ZBook Firefly 14 G9-6B8A2EA i7-1265U, T550 Laptop GPU | 1.5 kg | 19.9 mm | 14.00" | 1920x1200 | ||
| 87.8 % v7 (old) | 04-2023 | Lenovo ThinkPad P15v G3 21EM001AGE R7 PRO 6850H, RTX A2000 Laptop GPU | 2.2 kg | 22.7 mm | 15.60" | 3840x2160 |
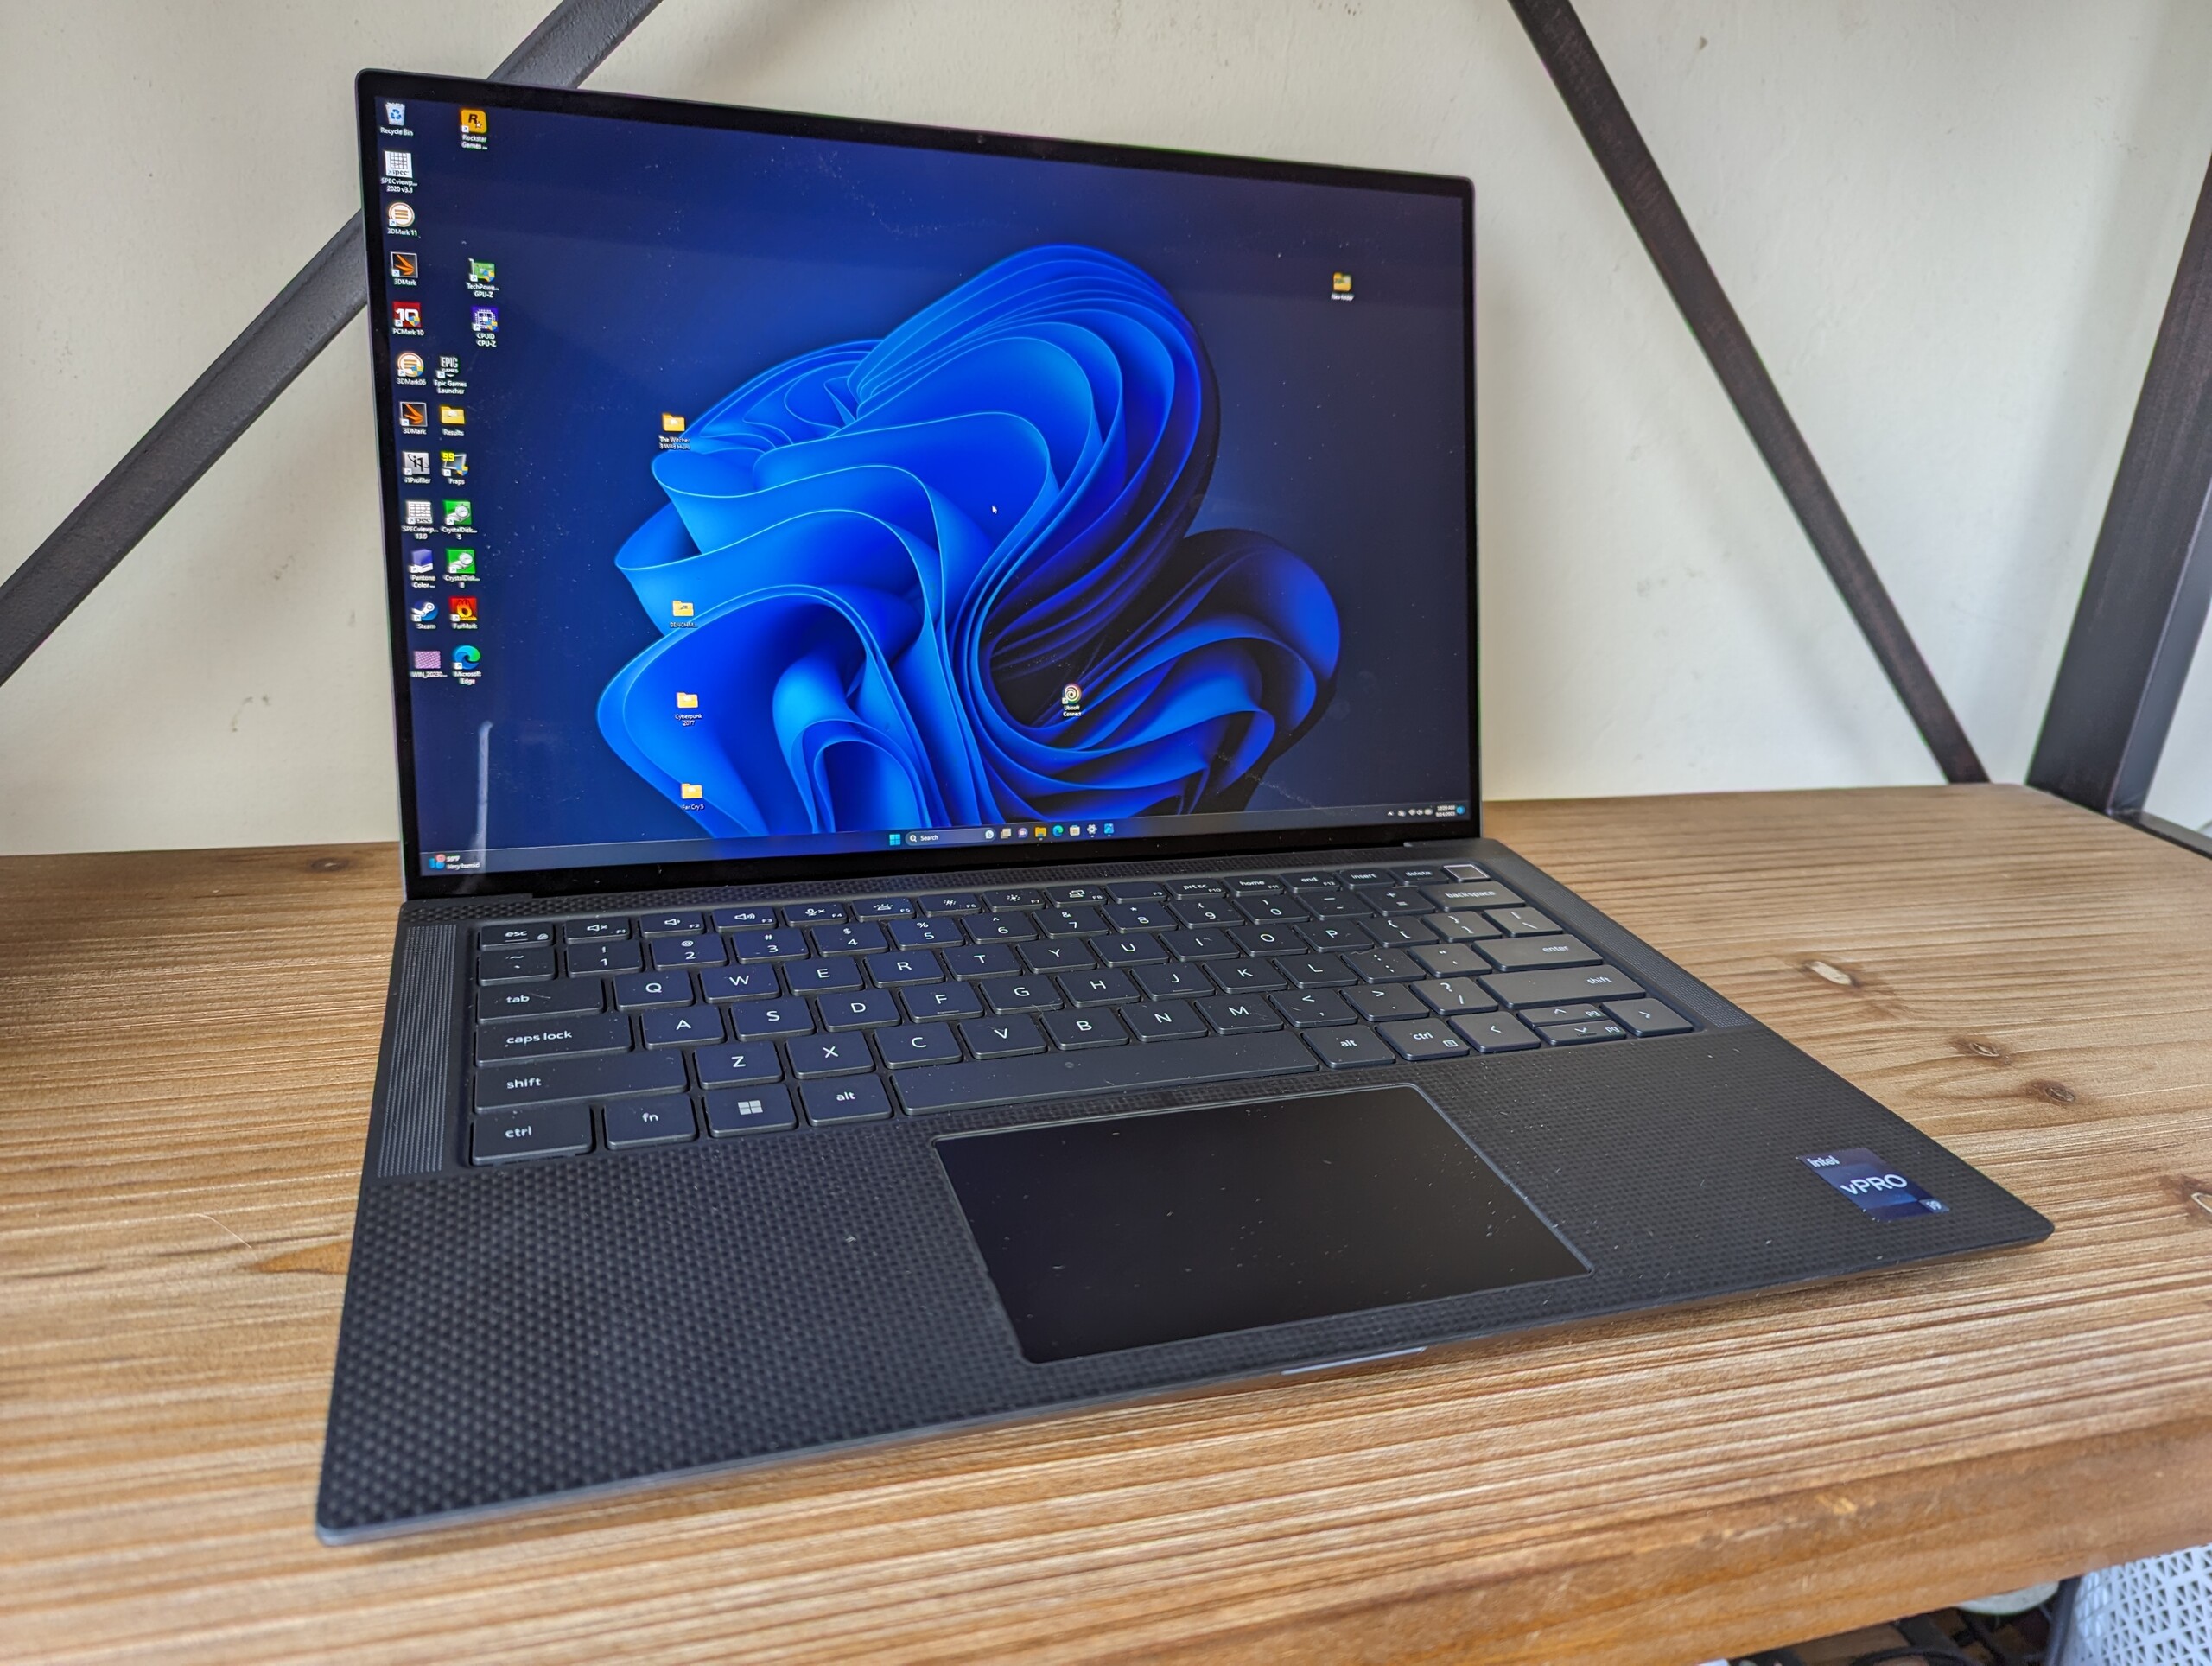
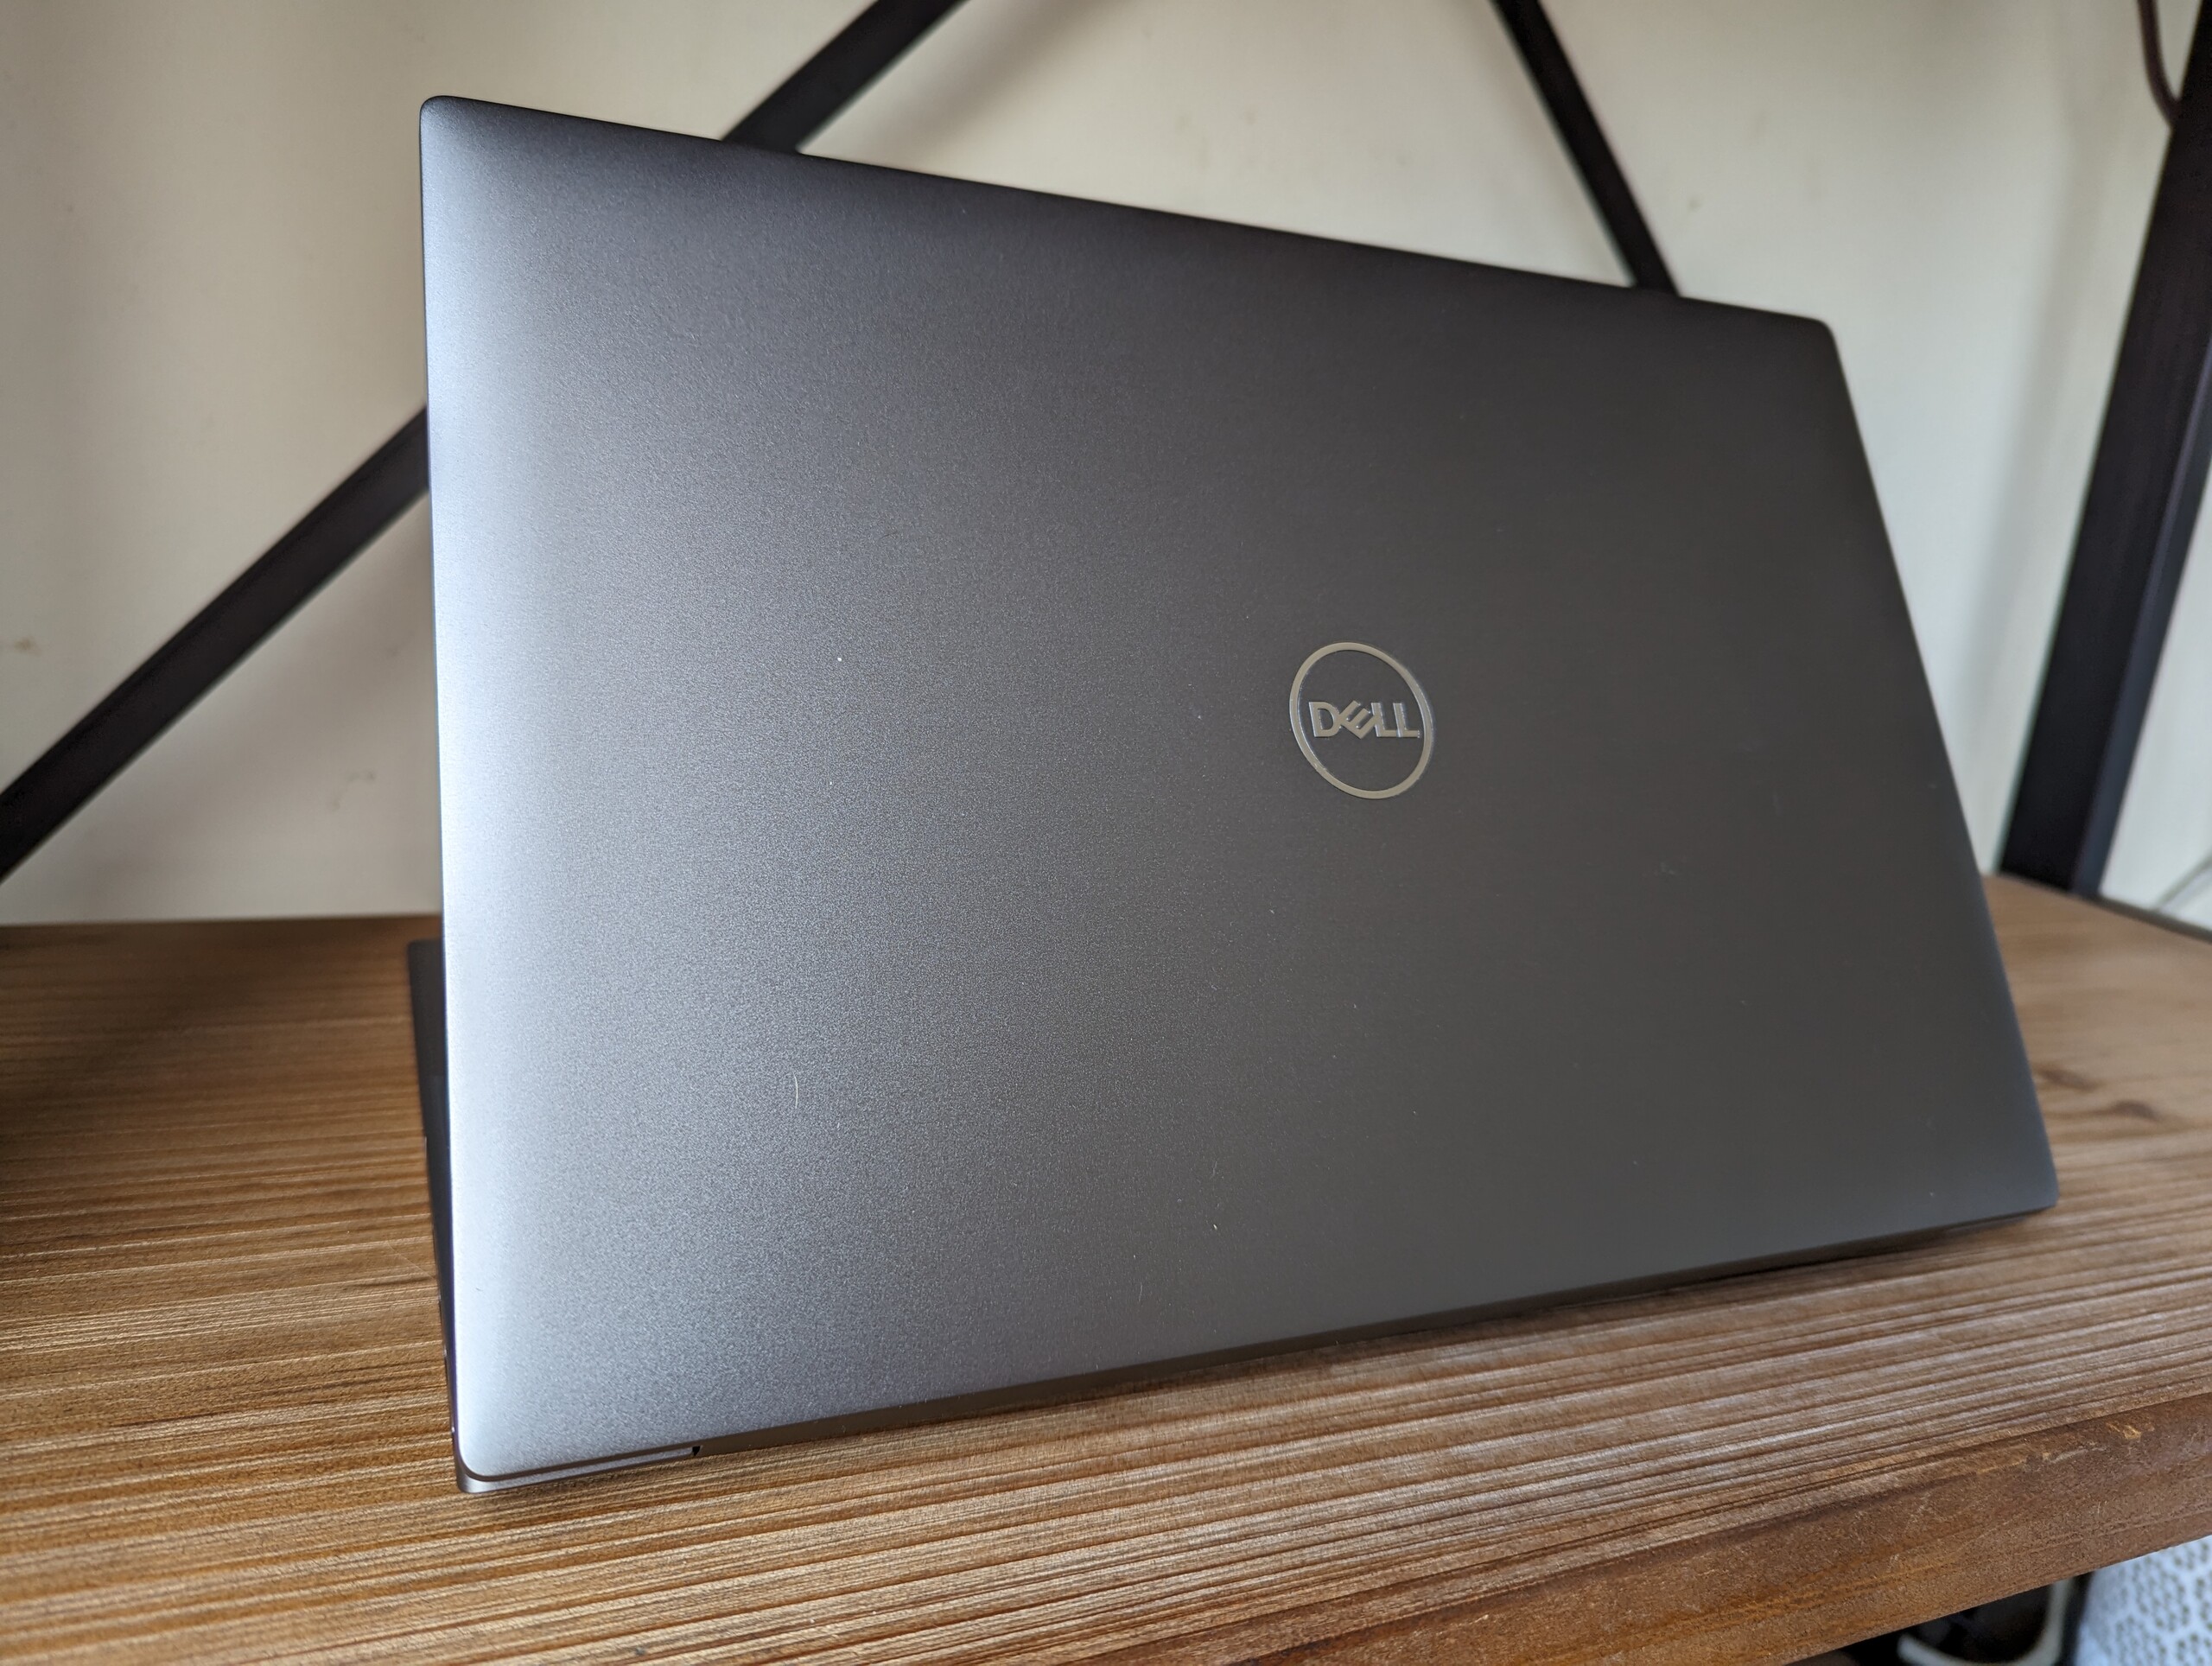
Koffer - Geïnspireerd door de XPS
SD-kaartlezer
| SD Card Reader | |
| average JPG Copy Test (av. of 3 runs) | |
| Dell Precision 5000 5560 (AV Pro V60) | |
| Lenovo ThinkPad P15v G3 21EM001AGE (AV Pro V60) | |
| Dell Precision 5000 5470 (AV Pro V60) | |
| Dell Precision 5480 (AV Pro V60) | |
| maximum AS SSD Seq Read Test (1GB) | |
| Dell Precision 5000 5470 (AV Pro V60) | |
| Lenovo ThinkPad P15v G3 21EM001AGE (AV Pro V60) | |
| Dell Precision 5000 5560 (AV Pro V60) | |
| Dell Precision 5480 (AV Pro V60) | |
Communicatie
| Networking | |
| iperf3 transmit AX12 | |
| Dell Precision 5000 5560 | |
| iperf3 receive AX12 | |
| Dell Precision 5000 5560 | |
| iperf3 transmit AXE11000 | |
| Dell Precision 5480 | |
| Lenovo ThinkPad P14s G3 AMD 21J6S05000 | |
| Lenovo ThinkPad P15v G3 21EM001AGE | |
| iperf3 receive AXE11000 | |
| Lenovo ThinkPad P14s G3 AMD 21J6S05000 | |
| Lenovo ThinkPad P15v G3 21EM001AGE | |
| Dell Precision 5480 | |
| iperf3 transmit AXE11000 6GHz | |
| Dell Precision 5480 | |
| Lenovo ThinkPad P14s G3 AMD 21J6S05000 | |
| Dell Precision 5000 5470 | |
| Lenovo ThinkPad P15v G3 21EM001AGE | |
| iperf3 receive AXE11000 6GHz | |
| Lenovo ThinkPad P14s G3 AMD 21J6S05000 | |
| Lenovo ThinkPad P15v G3 21EM001AGE | |
| Dell Precision 5480 | |
| Dell Precision 5000 5470 | |
Webcam
Dell levert nog steeds 720p webcams op veel van zijn paradepaardjes, waaronder de XPS-serie en Precision laptops gebaseerd op het XPS-ontwerp. Andere fabrikanten zijn al overgestapt op 2 MP of 5 MP sensoren en we verwachten dat Dell hetzelfde zal doen bij toekomstige redesigns.


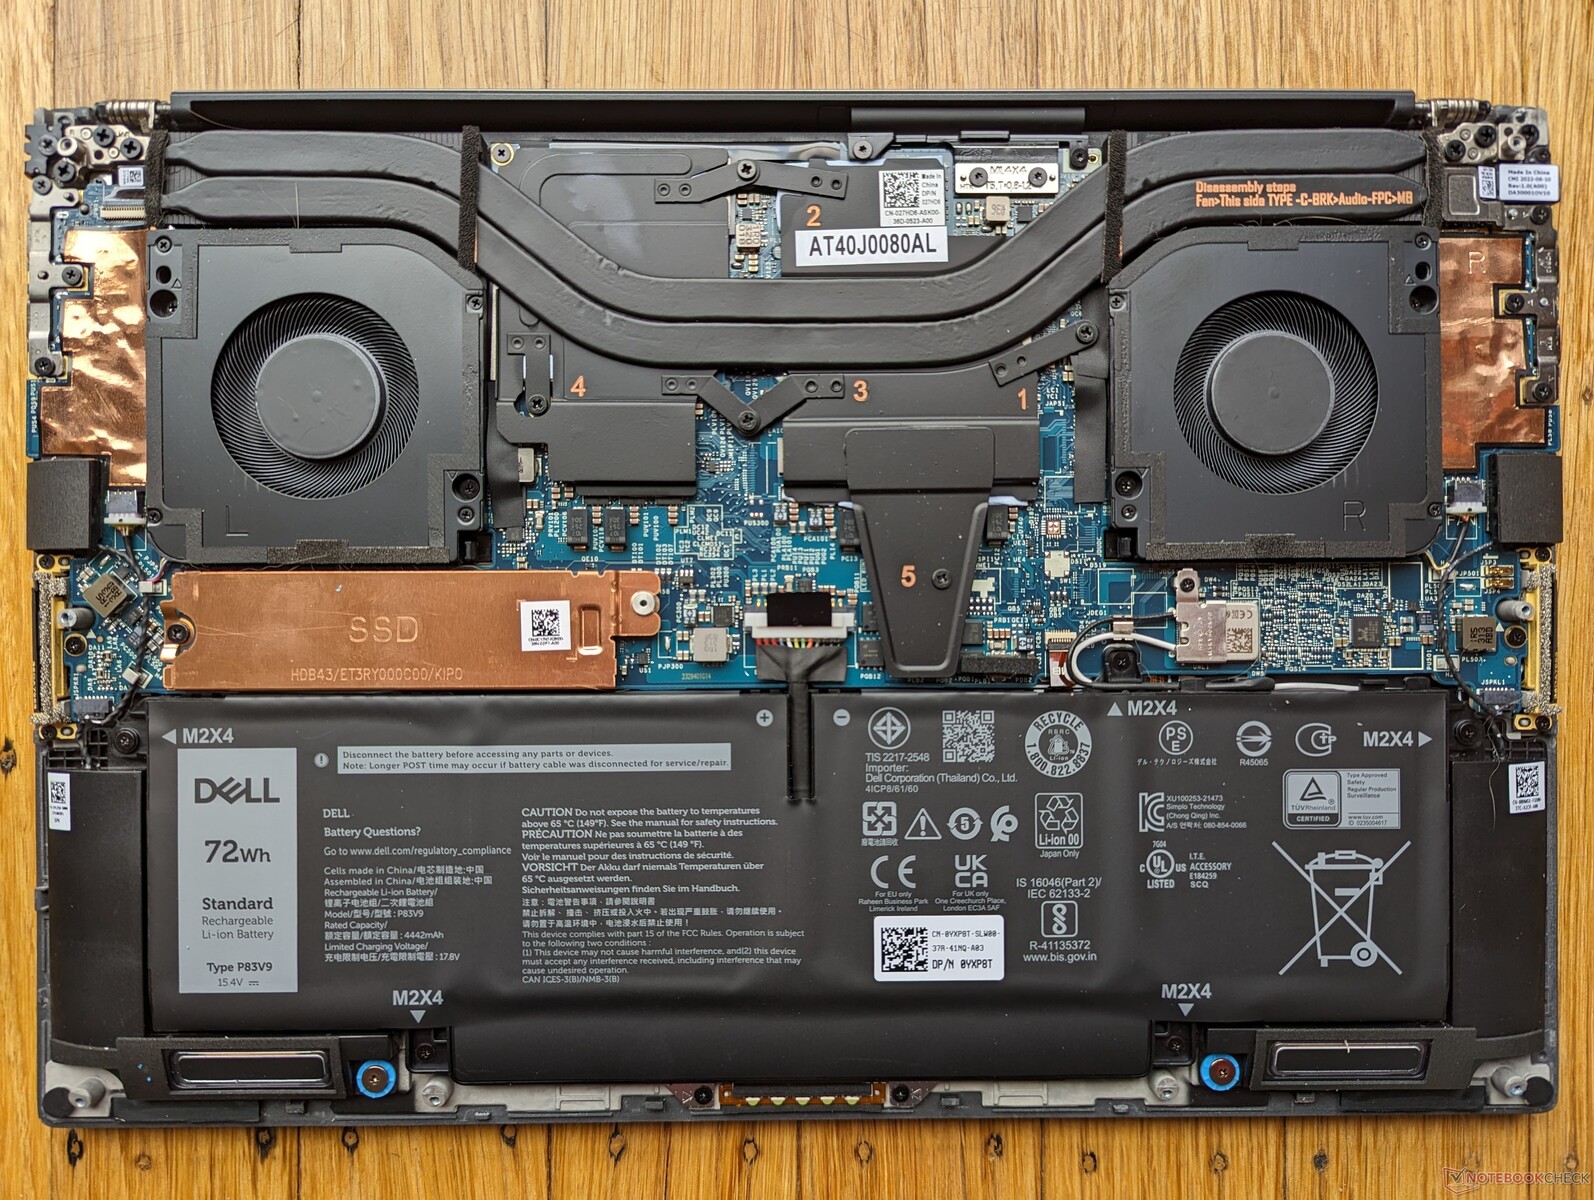
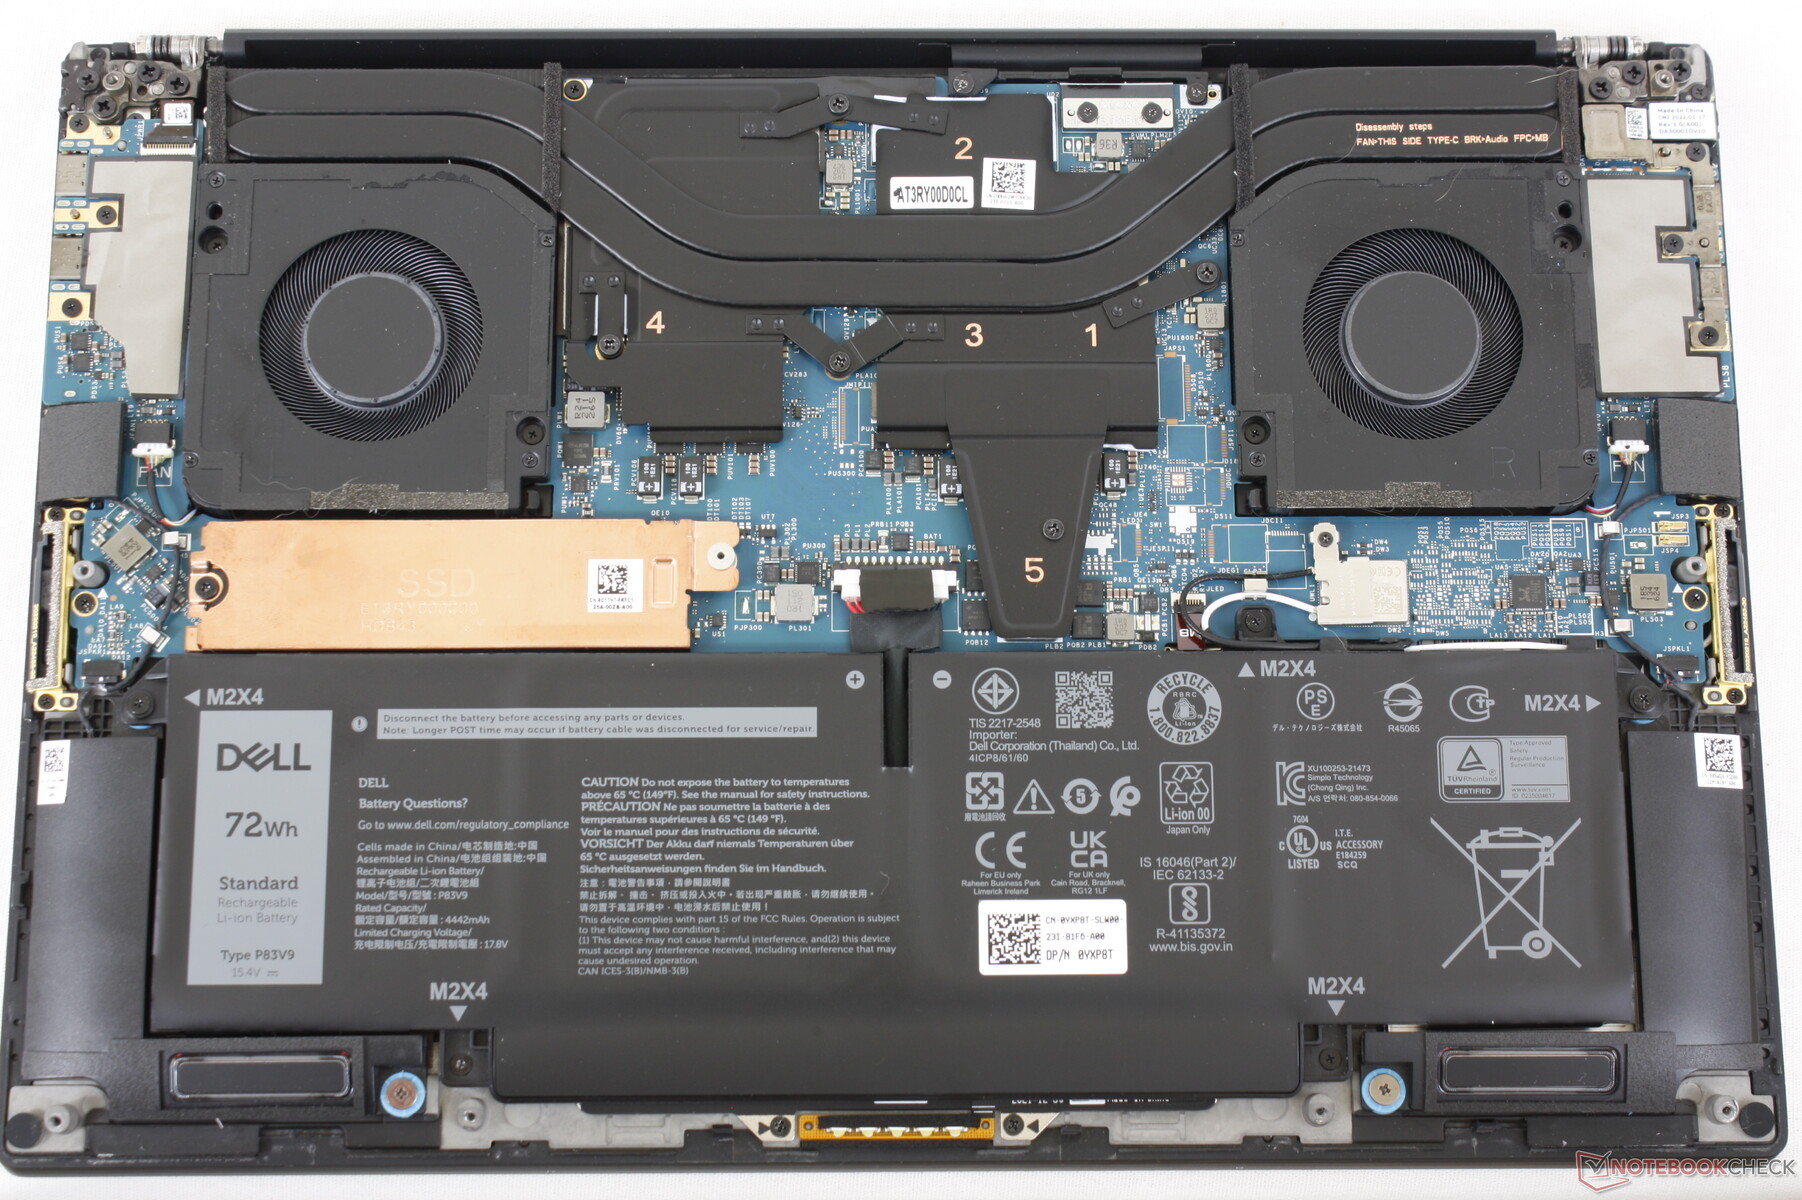
Onderhoud
Accessoires en garantie
De verkoopverpakking bevat dezelfde USB-C naar HDMI en USB-A adapter als bij het model van vorig jaar, naast het papierwerk en de 130 W USB-C AC-adapter. Dell biedt ook een kleinere 100 W USB-C AC-adapter die zou moeten volstaan voor configuraties zonder discrete Nvidia graphics.
Drie jaar garantie is standaard bij aankoop bij Dell in de VS, net als bij de Precision 7000 serie.
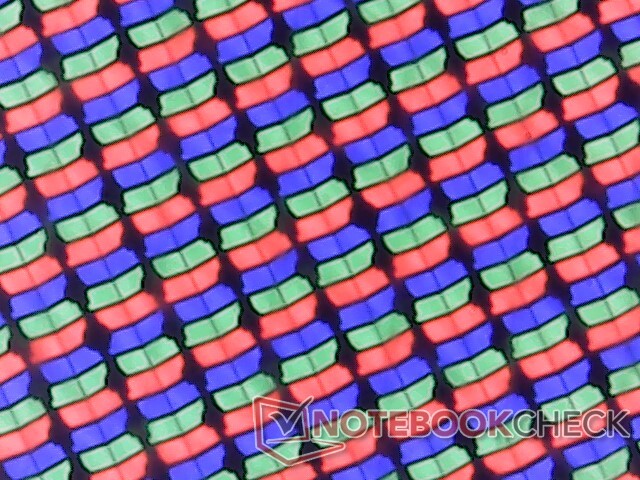
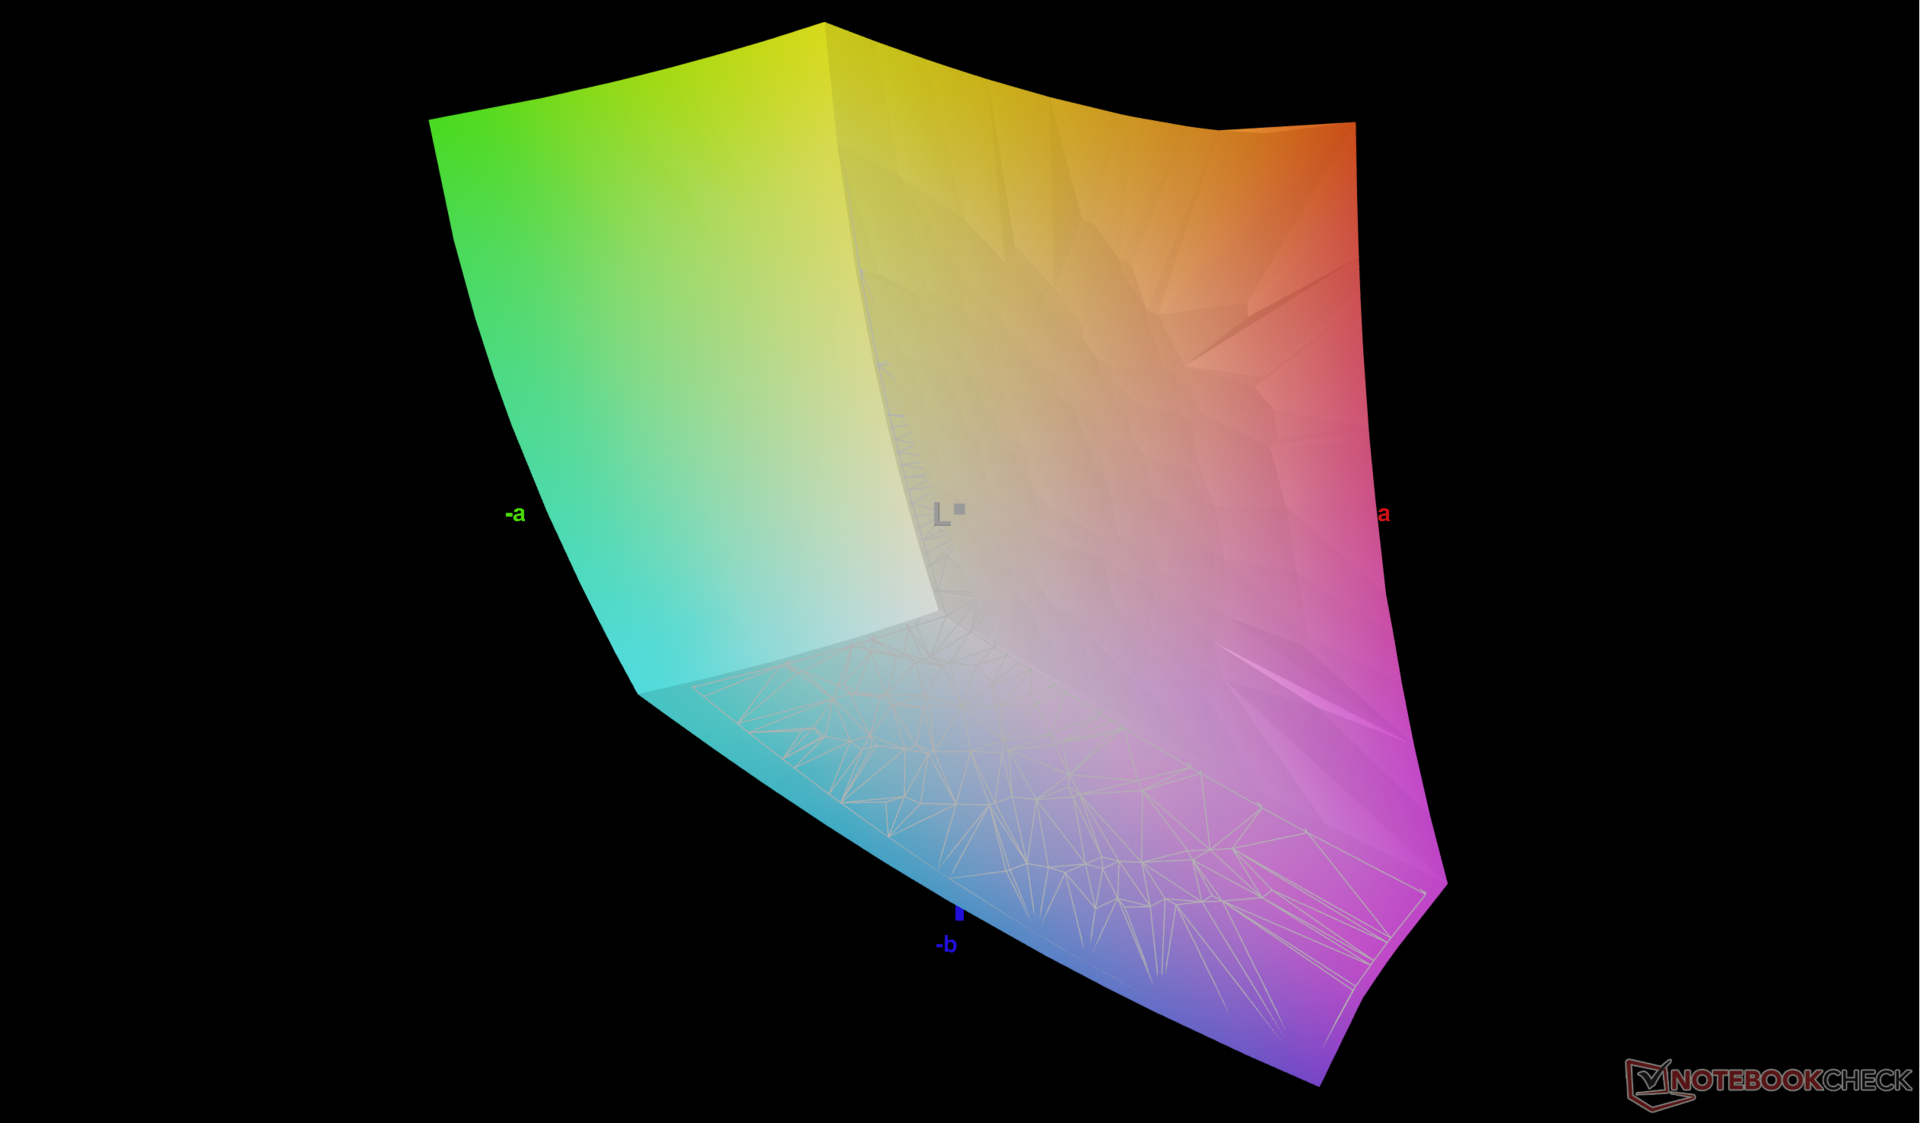
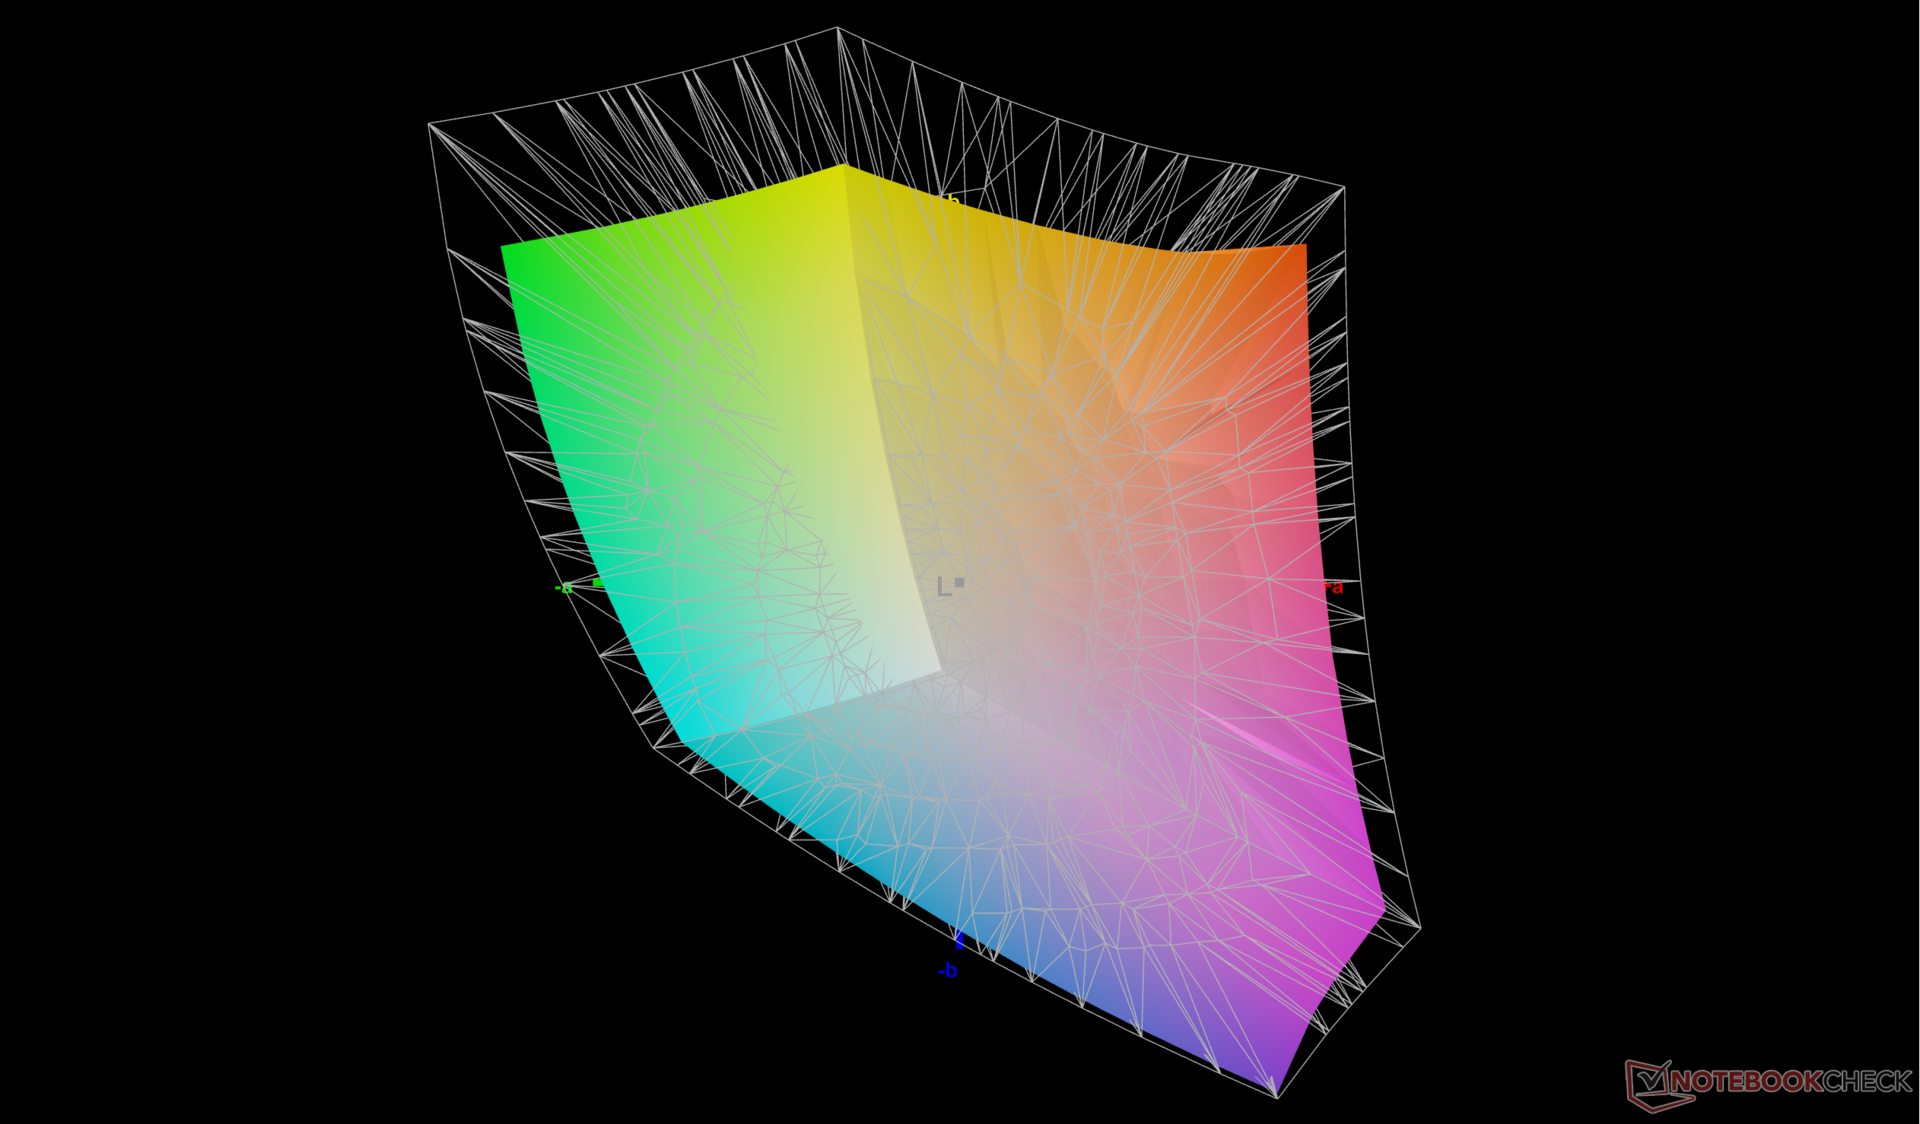
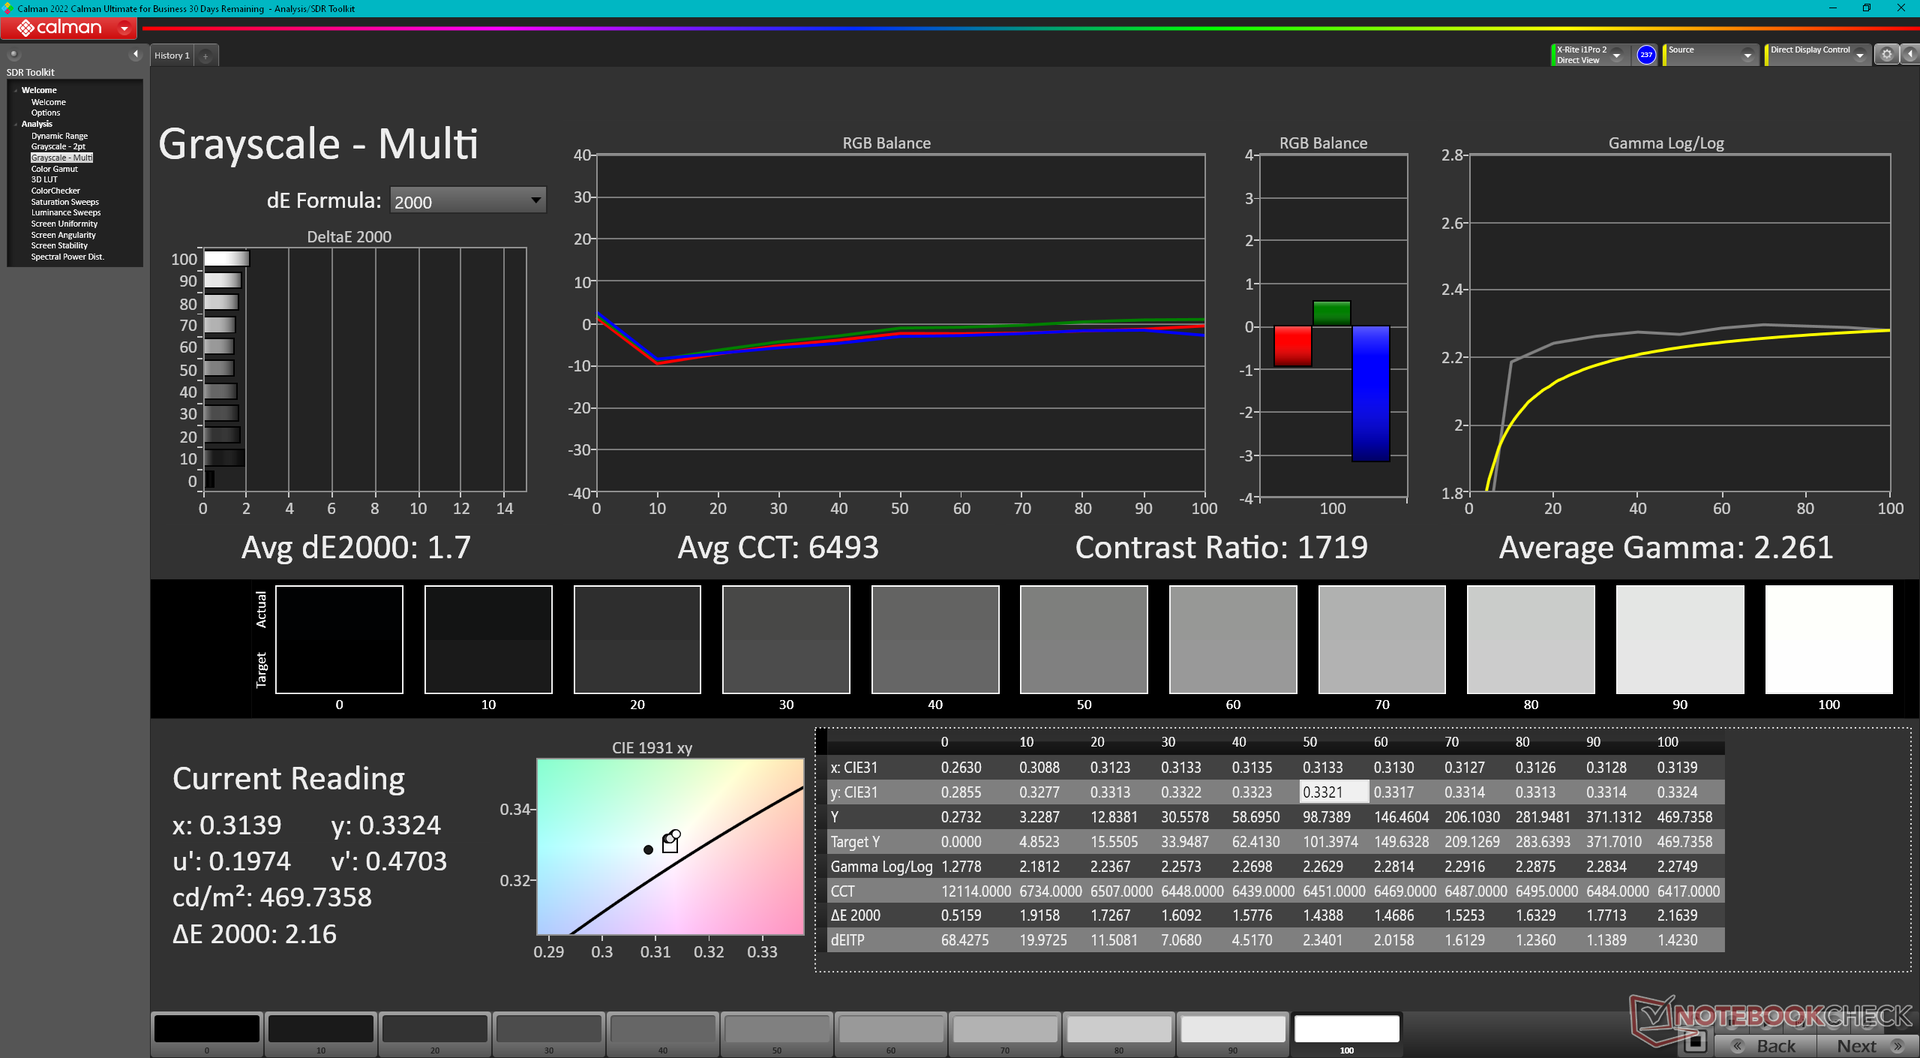
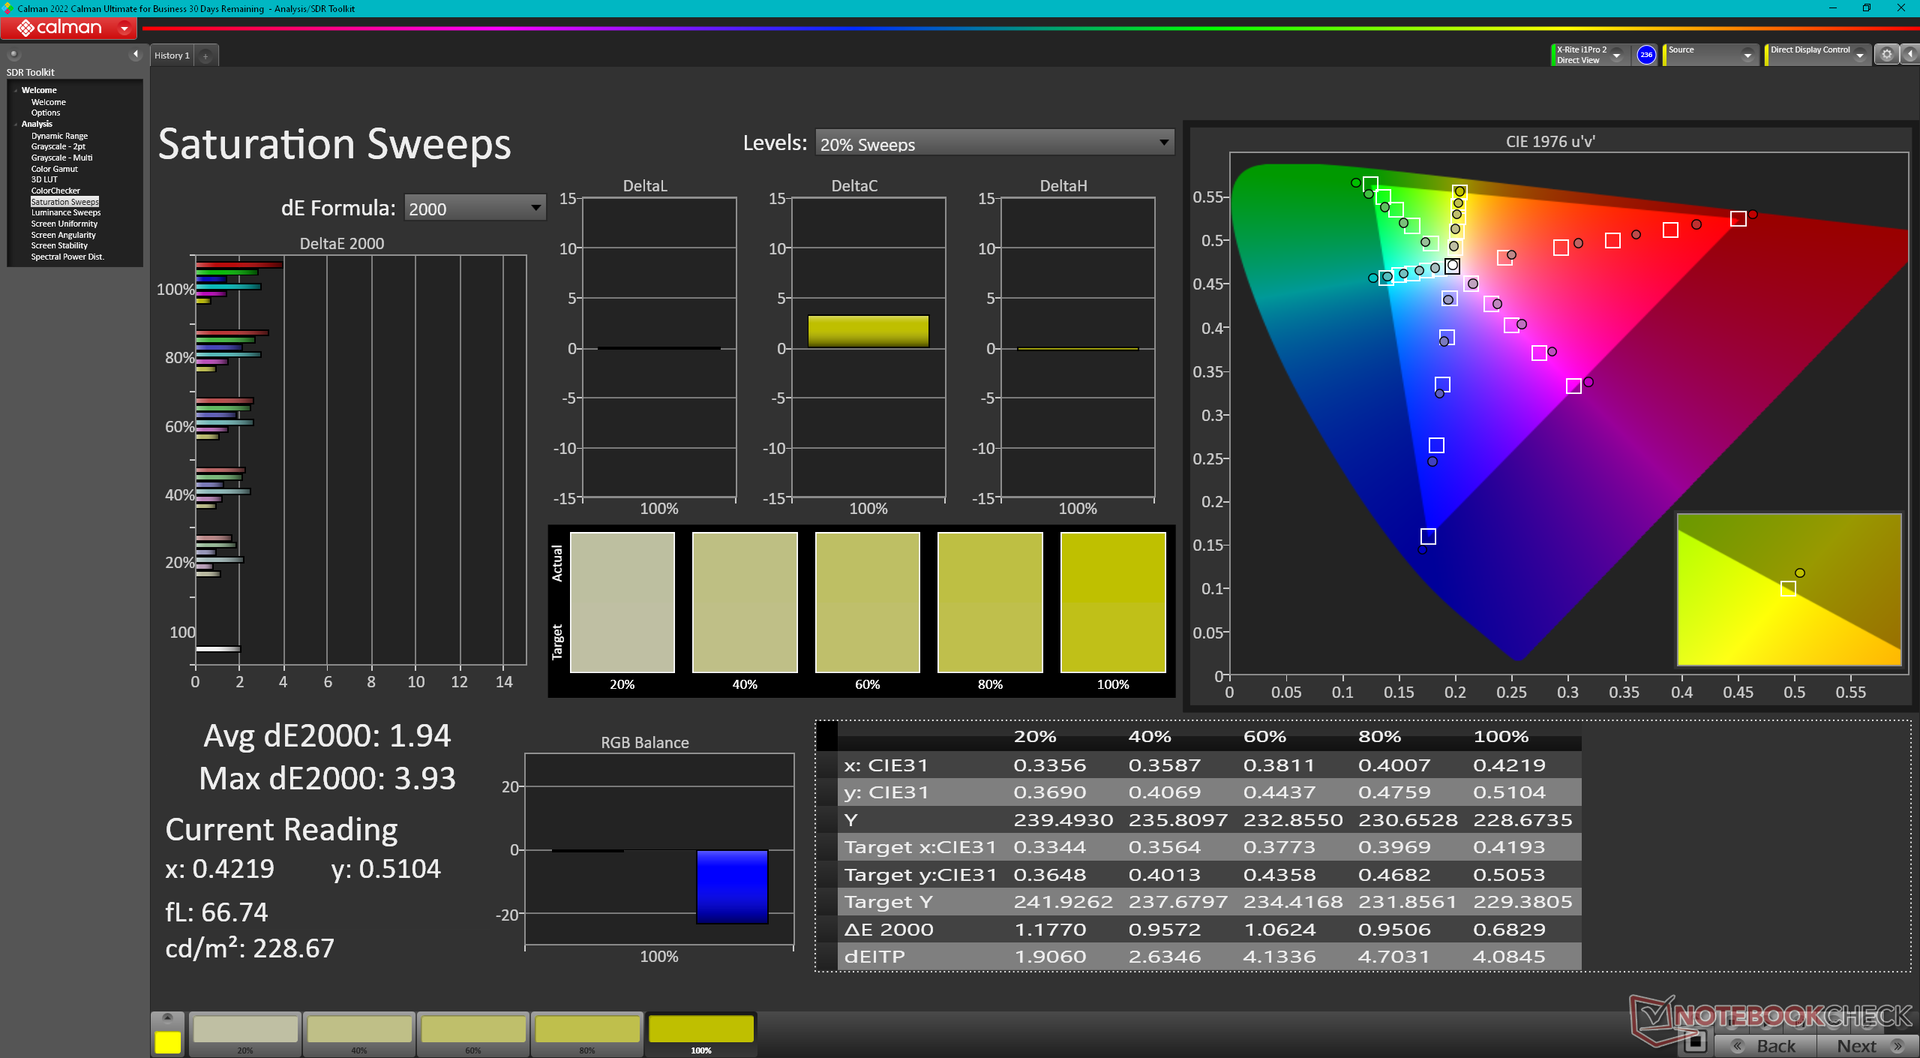
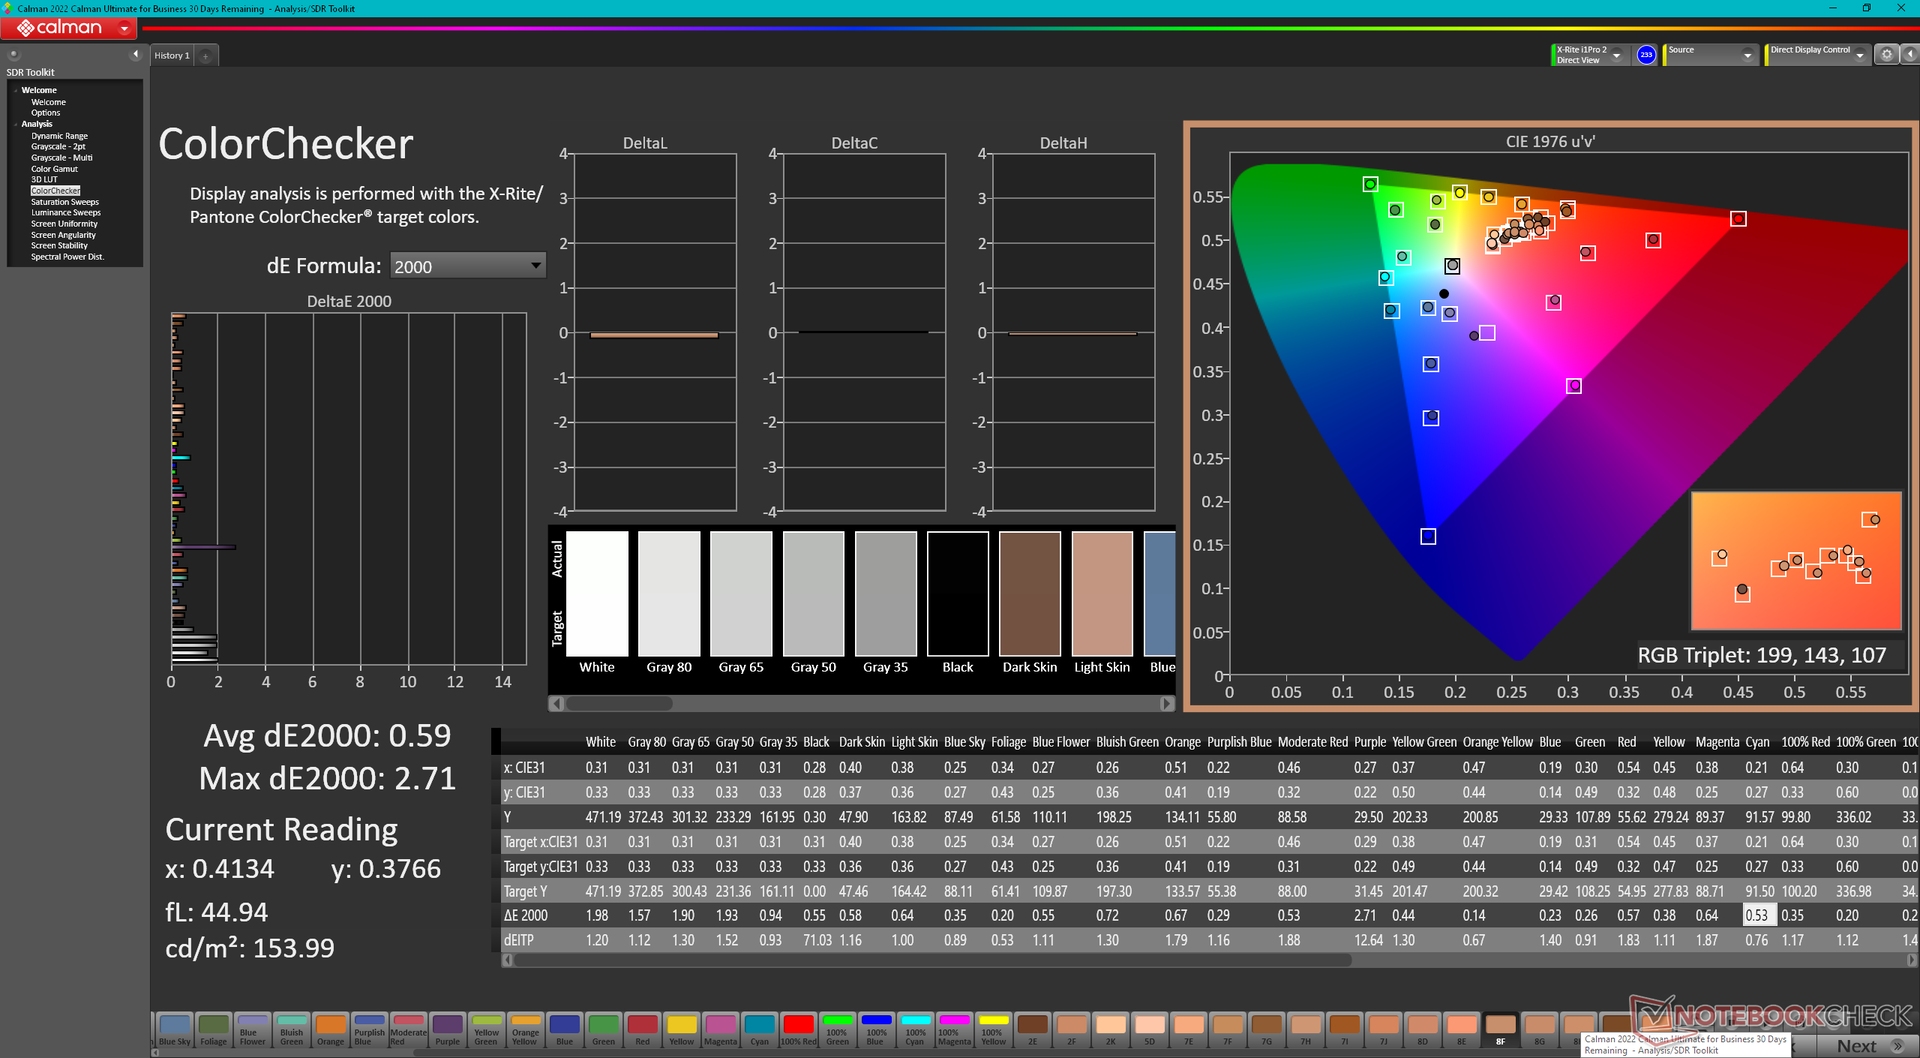
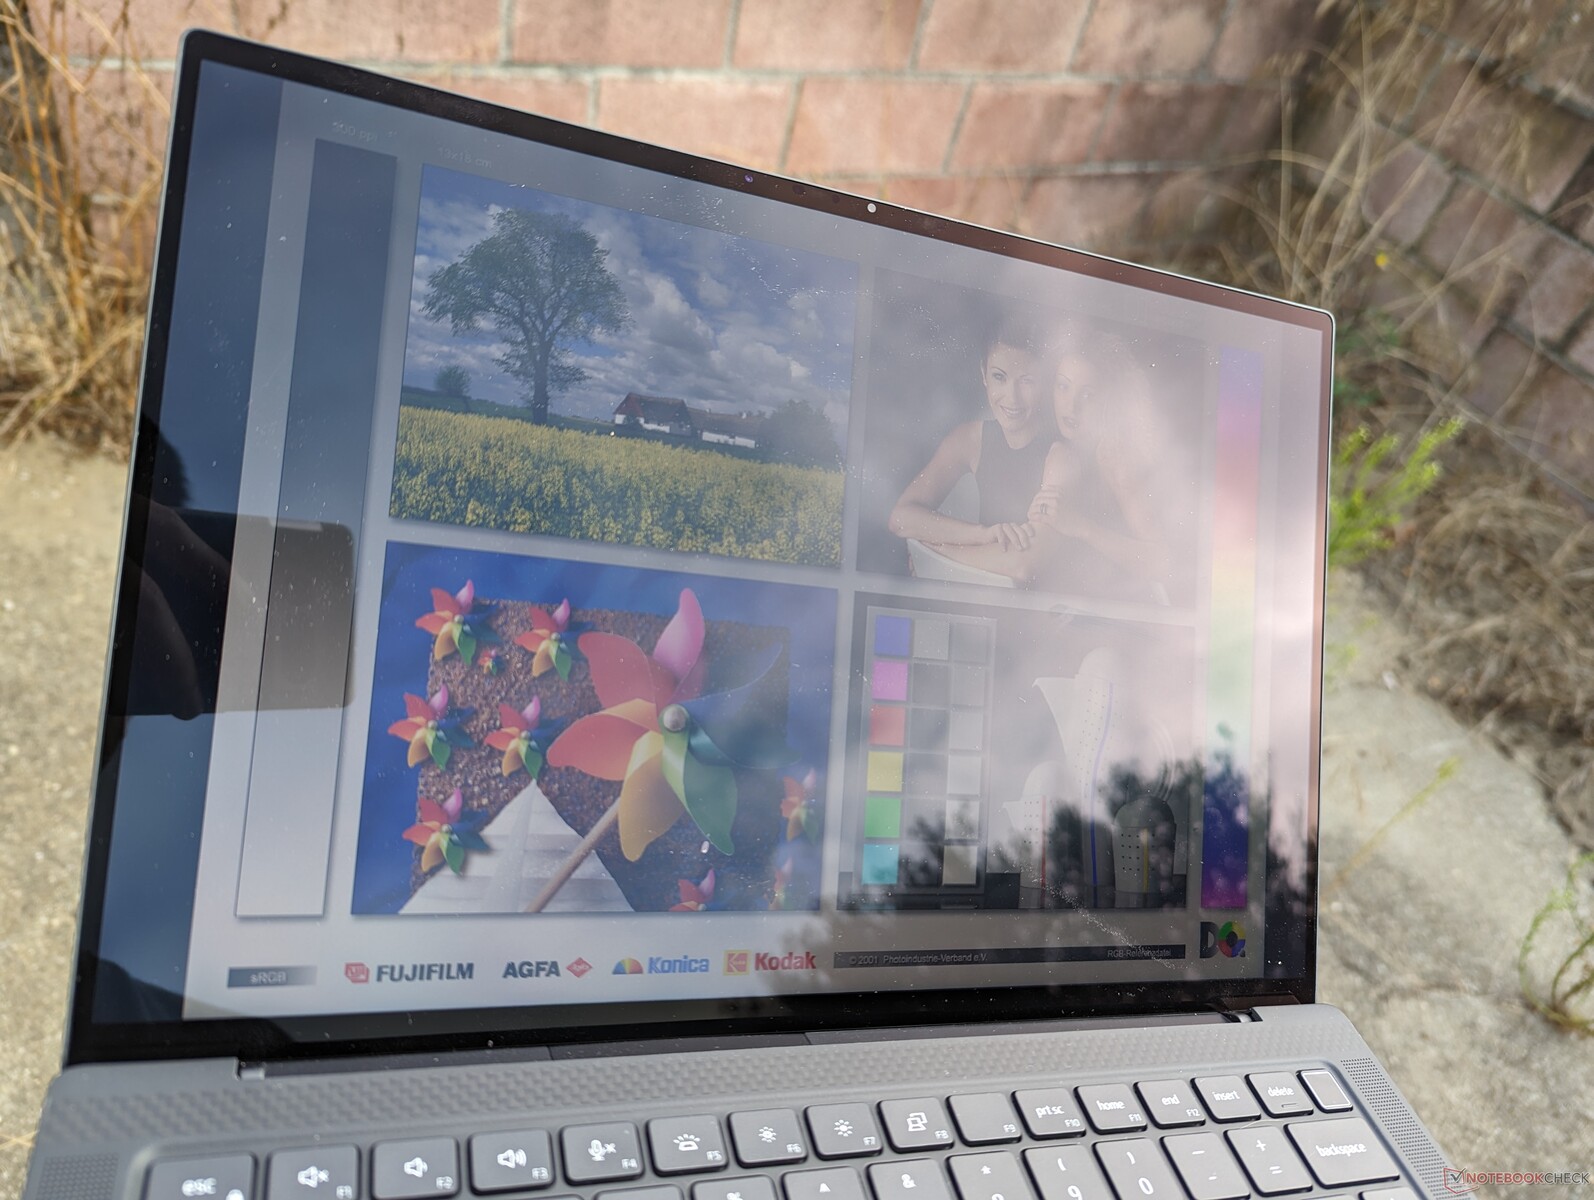
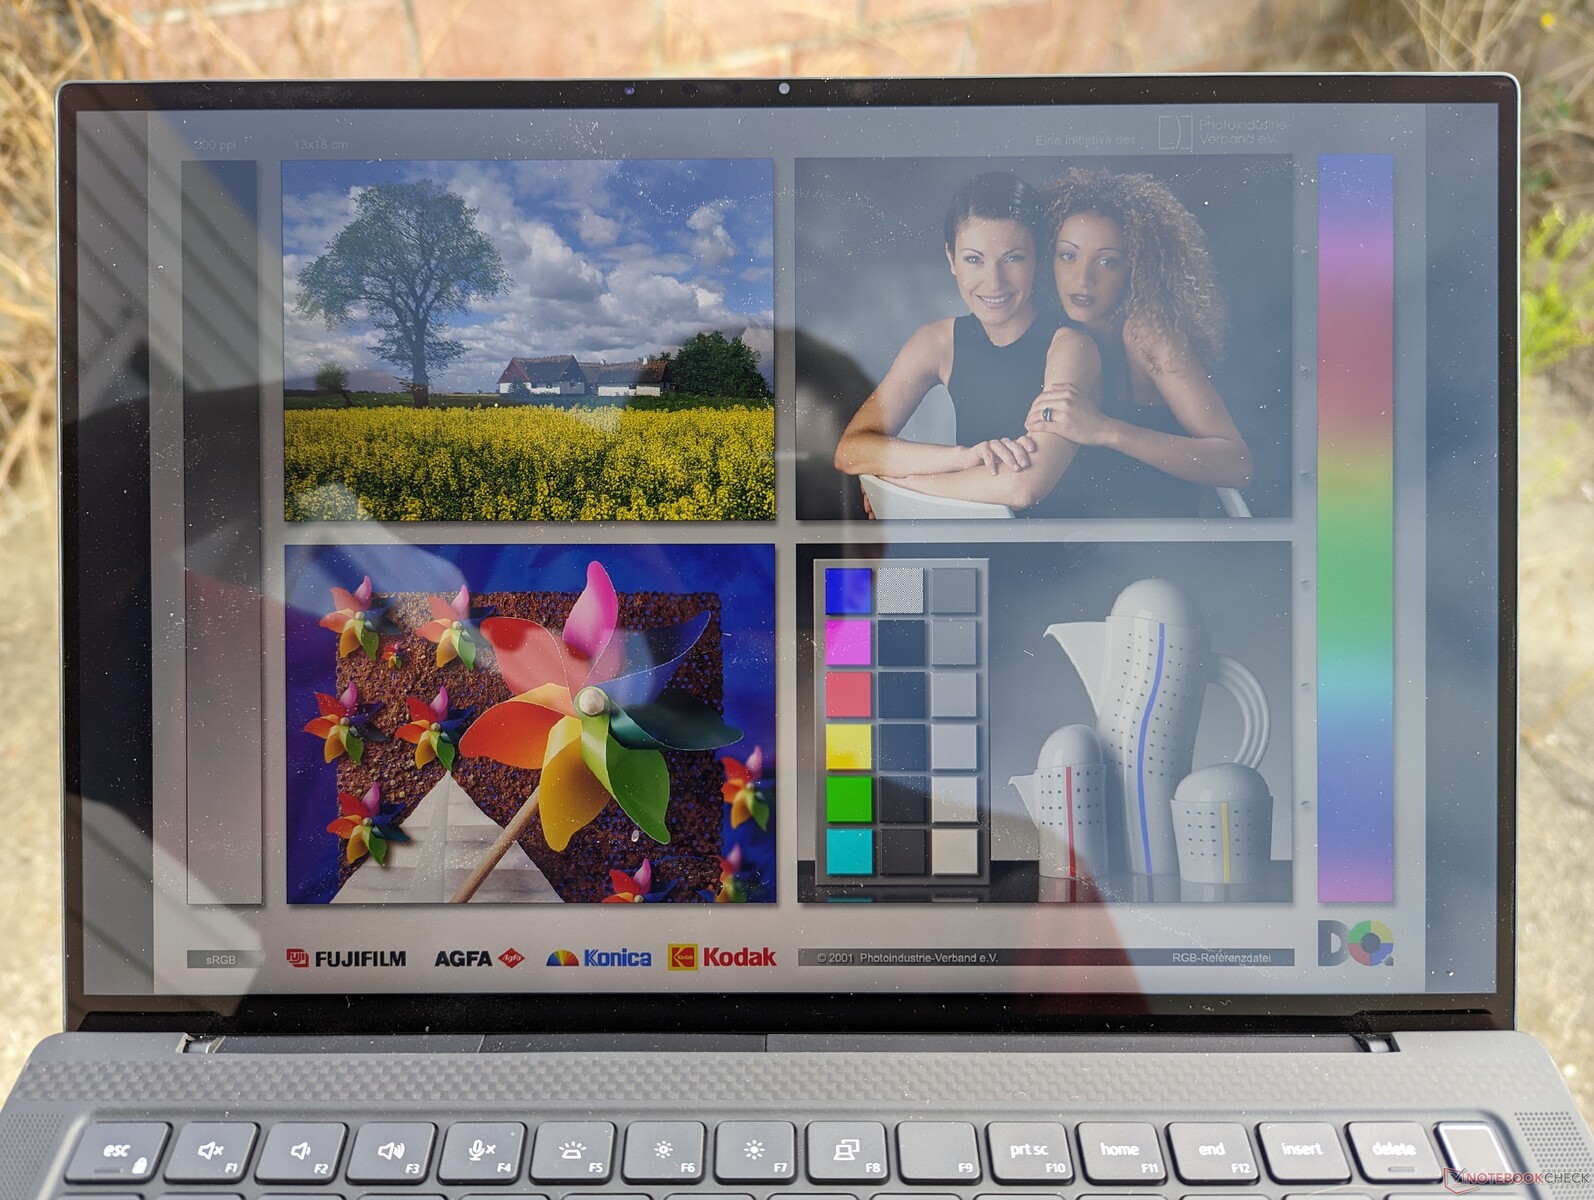
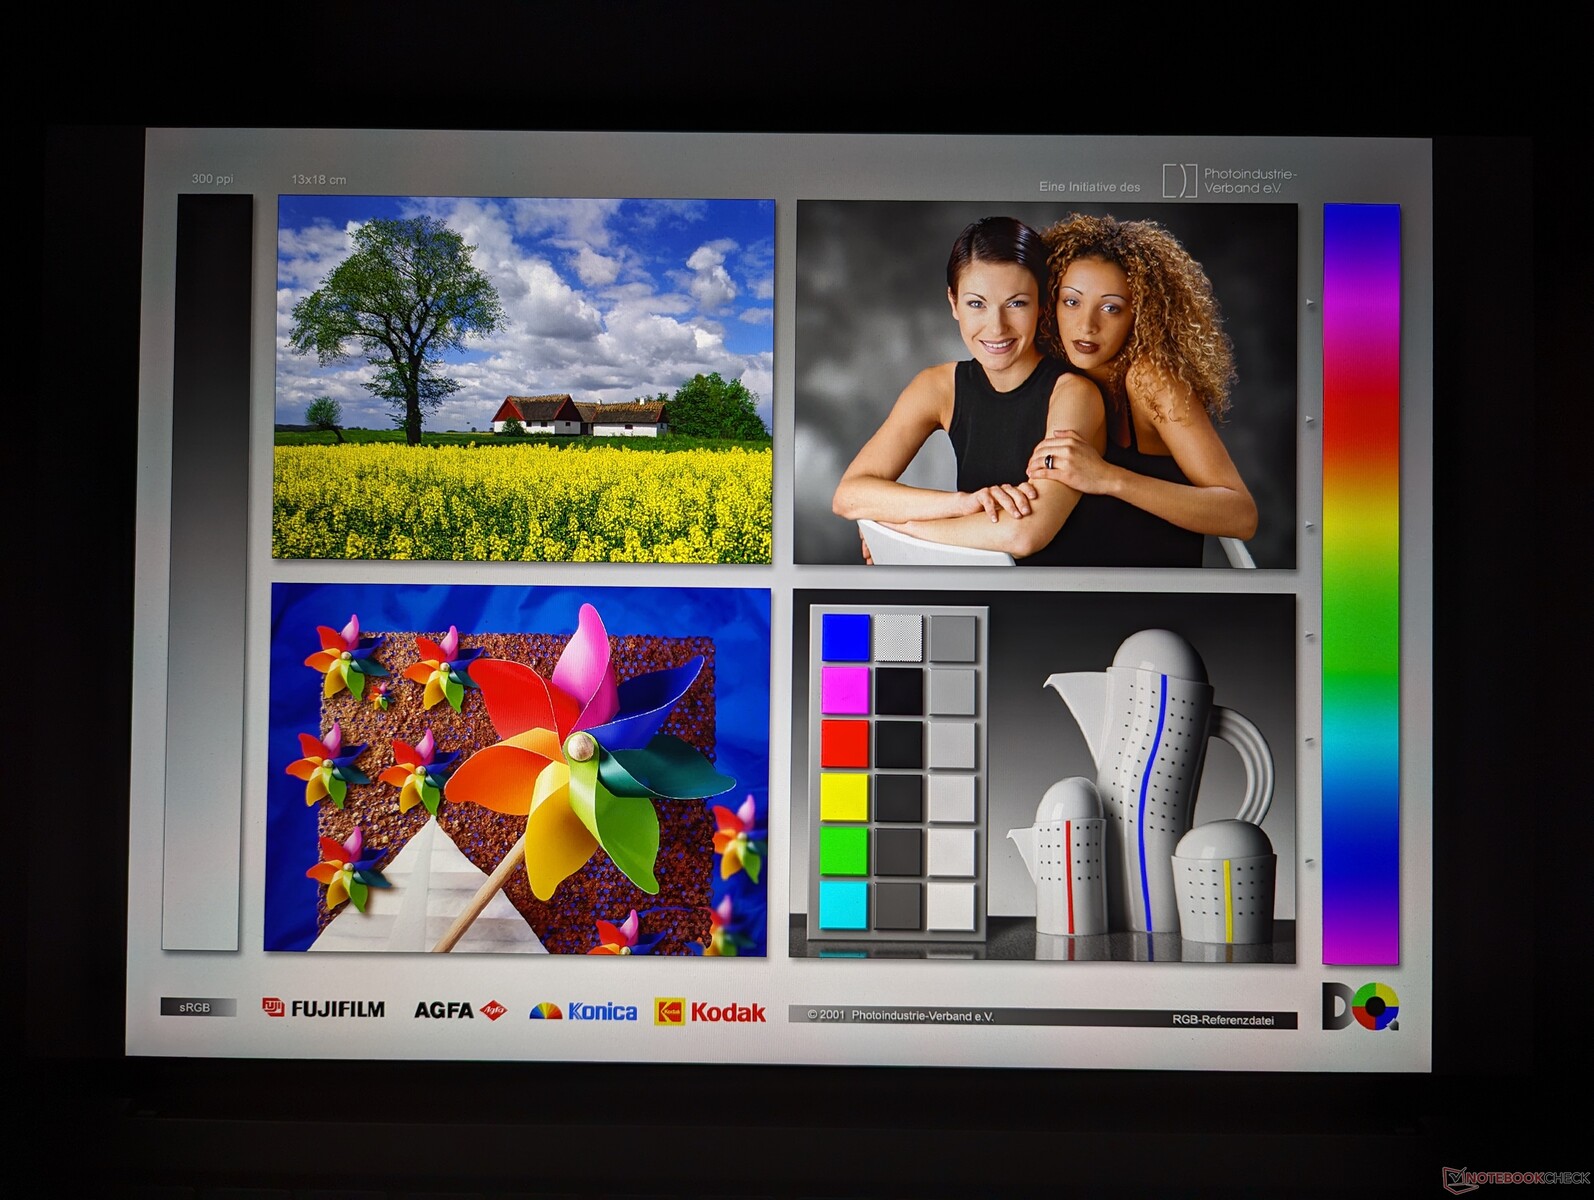
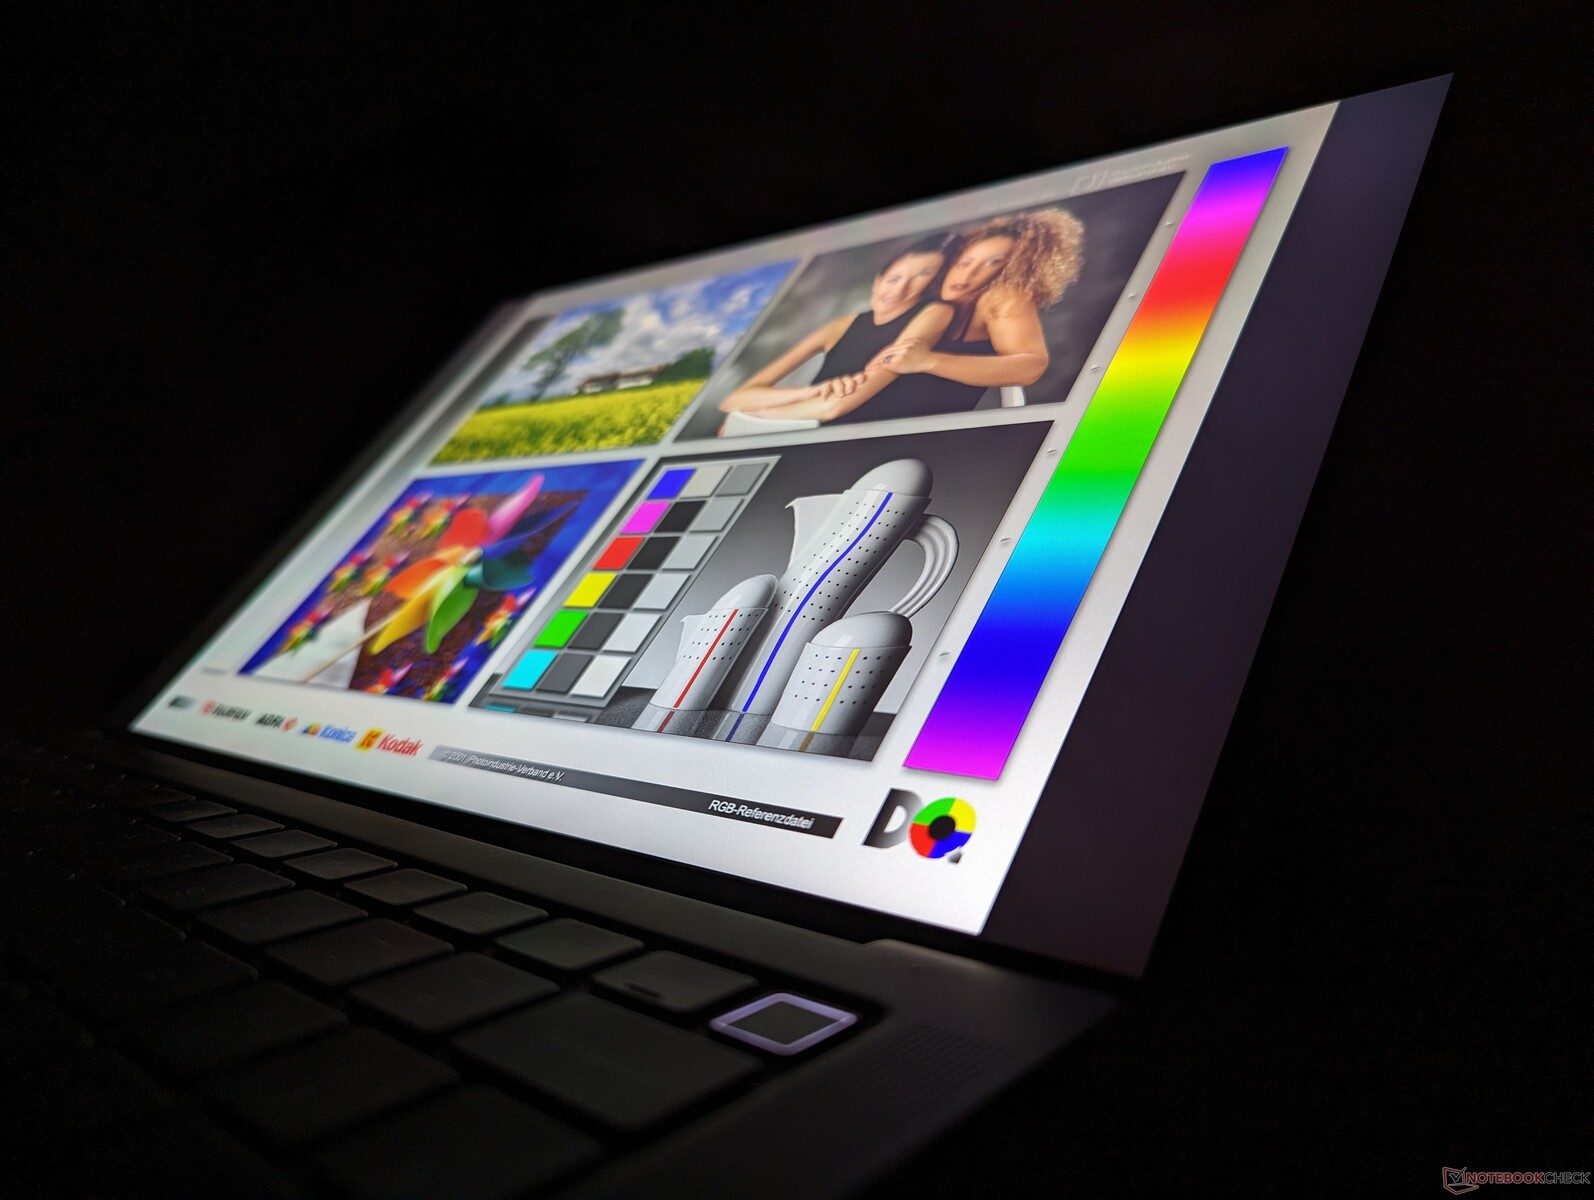
Beeldscherm - QHD+ met volledige sRGB-kleuren
Ons testapparaat wordt geleverd met hetzelfde AU Optronics B140QAN IPS-paneel als op het model van vorig jaar. Dell biedt geen nieuwe paneelopties voor de update van dit jaar, wat betekent dat volledige DCi-P3 kleuren of OLED nog steeds buiten bereik zijn.
| |||||||||||||||||||||||||
Helderheidsverdeling: 87 %
Helderheid in Batterij-modus: 472.8 cd/m²
Contrast: 1351:1 (Zwart: 0.35 cd/m²)
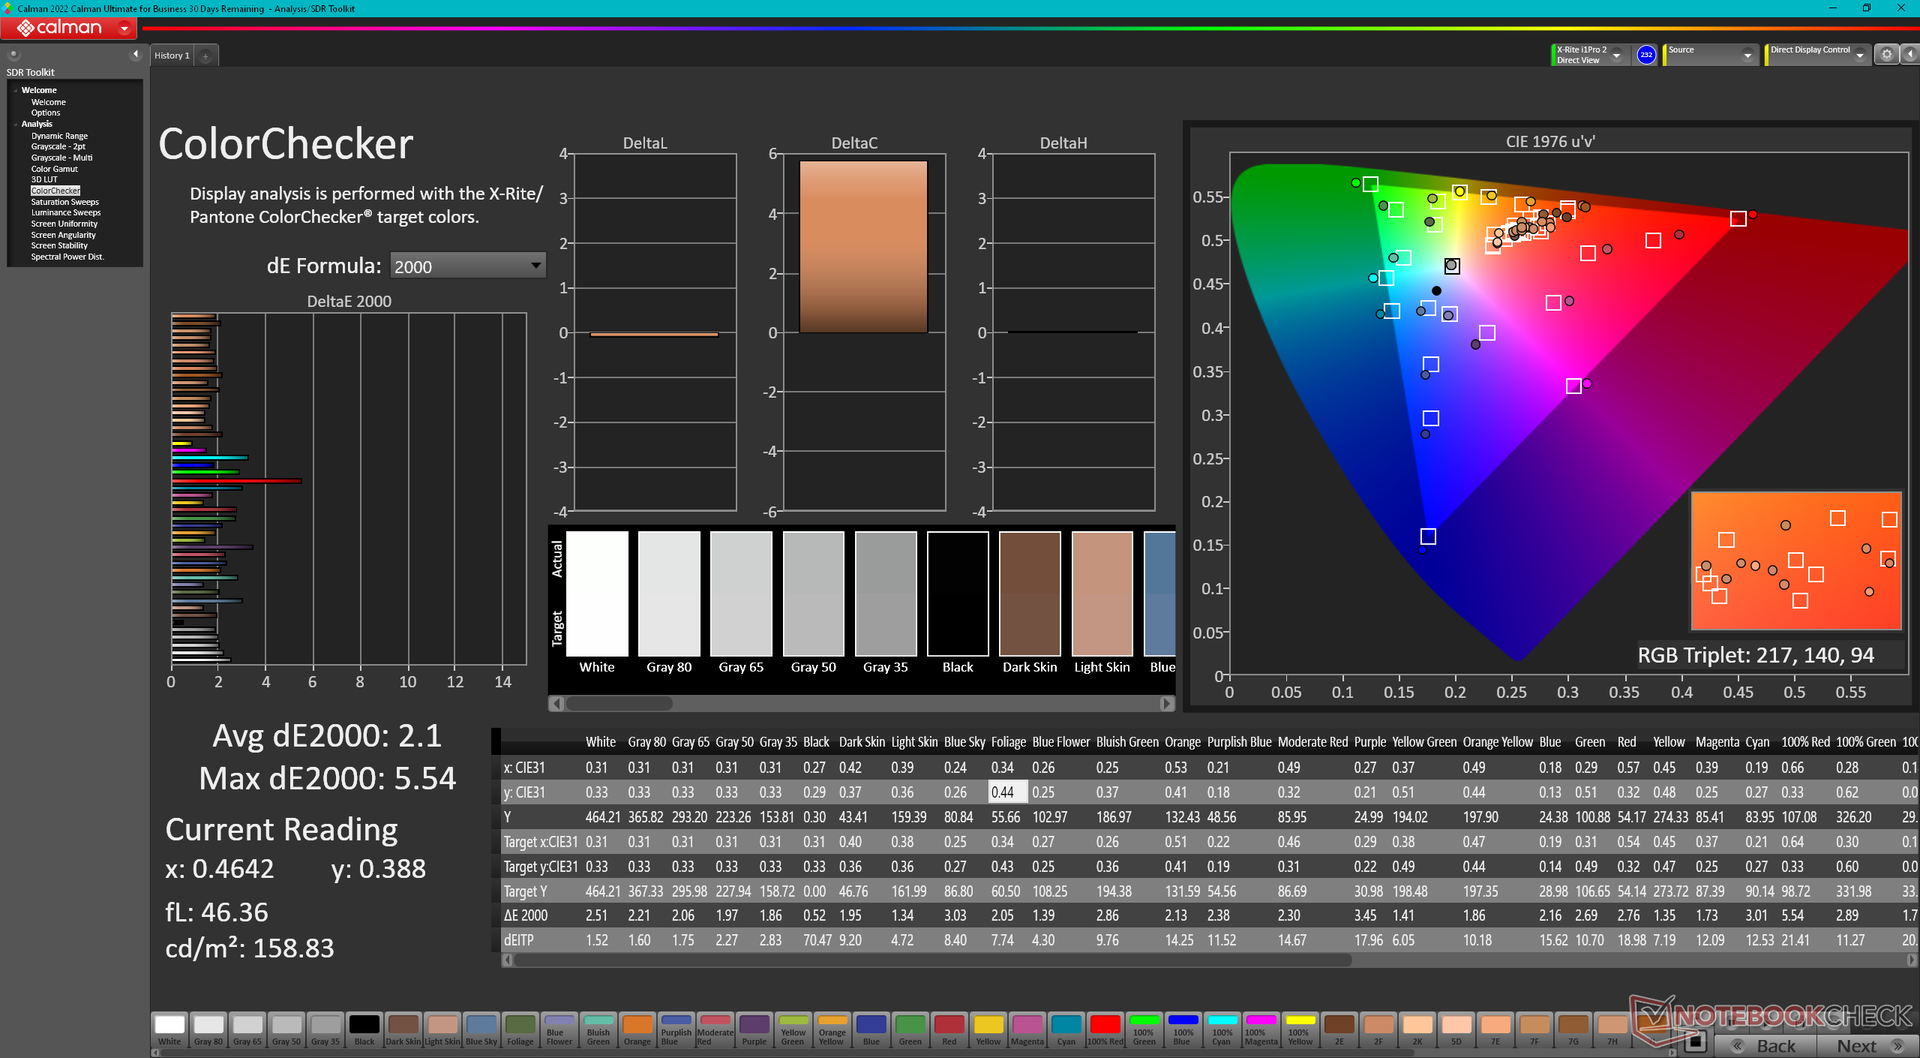
ΔE ColorChecker Calman: 2.1 | ∀{0.5-29.43 Ø4.71}
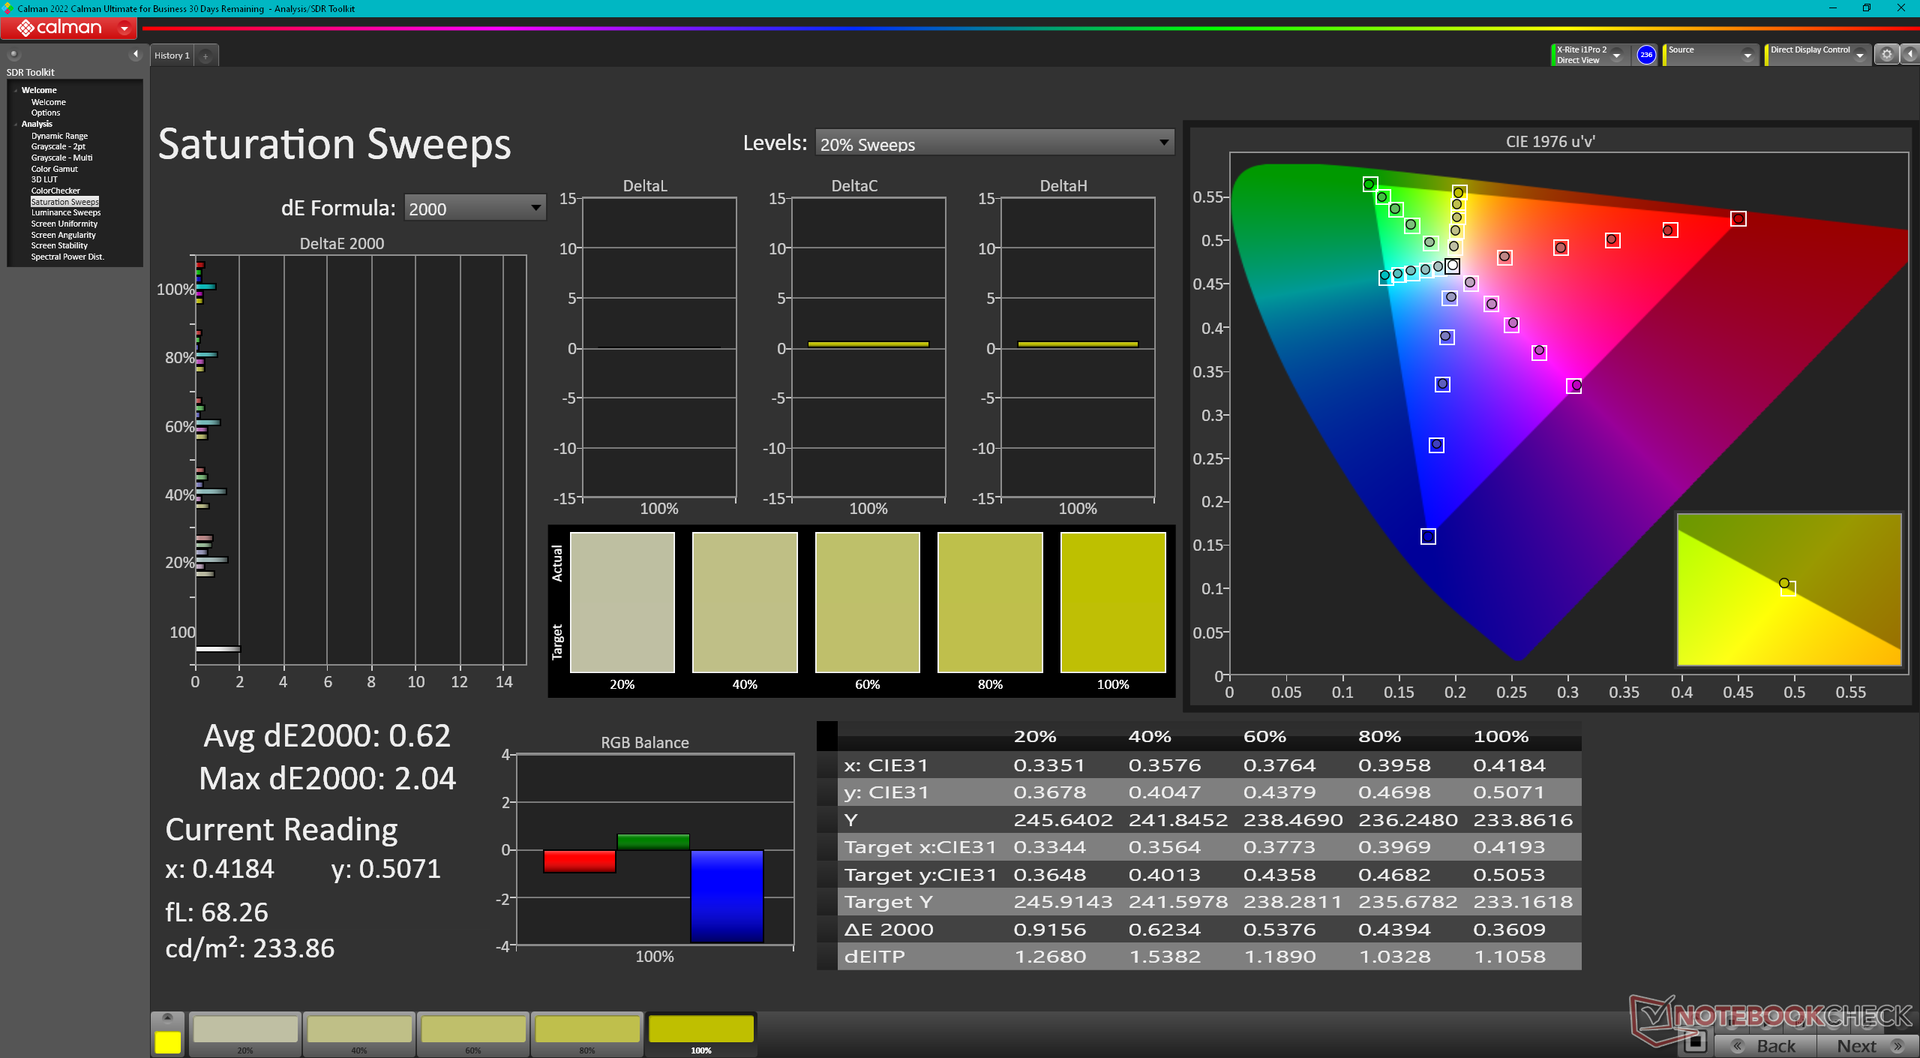
calibrated: 0.59
ΔE Greyscale Calman: 1.7 | ∀{0.09-98 Ø4.96}
78% AdobeRGB 1998 (Argyll 3D)
99.8% sRGB (Argyll 3D)
77.6% Display P3 (Argyll 3D)
Gamma: 2.26
CCT: 6493 K
| Dell Precision 5480 AU Optronics B140QAN, IPS, 2560x1600, 14" | Dell Precision 5000 5470 AU Optronics B140QAN, IPS, 2560x1600, 14" | Dell Precision 5000 5560 Sharp LQ156R1, IPS, 3840x2400, 15.6" | Lenovo ThinkPad P14s G3 AMD 21J6S05000 LP140WU1-SPB2, IPS LED, 1920x1200, 14" | Lenovo ThinkPad P15v G3 21EM001AGE NE156QUM-N6C, IPS LED, 3840x2160, 15.6" | HP ZBook Firefly 14 G9-6B8A2EA CMN1435, IPS, 1920x1200, 14" | |
|---|---|---|---|---|---|---|
| Display | 1% | 17% | -11% | 15% | -6% | |
| Display P3 Coverage (%) | 77.6 | 79.3 2% | 94.9 22% | 65.9 -15% | 89.9 16% | 69.6 -10% |
| sRGB Coverage (%) | 99.8 | 100 0% | 100 0% | 94.3 -6% | 100 0% | 99.9 0% |
| AdobeRGB 1998 Coverage (%) | 78 | 78.7 1% | 100 28% | 68.2 -13% | 99.9 28% | 71.1 -9% |
| Response Times | -24% | -14% | 13% | -7% | -16% | |
| Response Time Grey 50% / Grey 80% * (ms) | 43.9 ? | 52.4 ? -19% | 47.2 ? -8% | 33.5 ? 24% | 46.7 ? -6% | 56.3 ? -28% |
| Response Time Black / White * (ms) | 25.3 ? | 32.4 ? -28% | 30.4 ? -20% | 24.9 ? 2% | 27.3 ? -8% | 26.2 ? -4% |
| PWM Frequency (Hz) | ||||||
| Screen | -8% | -35% | -13% | -55% | -26% | |
| Brightness middle (cd/m²) | 472.8 | 537 14% | 501.5 6% | 448 -5% | 588 24% | 432 -9% |
| Brightness (cd/m²) | 469 | 518 10% | 467 0% | 422 -10% | 536 14% | 407 -13% |
| Brightness Distribution (%) | 87 | 94 8% | 83 -5% | 85 -2% | 83 -5% | 91 5% |
| Black Level * (cd/m²) | 0.35 | 0.33 6% | 0.44 -26% | 0.23 34% | 0.38 -9% | 0.28 20% |
| Contrast (:1) | 1351 | 1627 20% | 1140 -16% | 1948 44% | 1547 15% | 1543 14% |
| Colorchecker dE 2000 * | 2.1 | 2.97 -41% | 4.73 -125% | 2.5 -19% | 3.9 -86% | 3.1 -48% |
| Colorchecker dE 2000 max. * | 5.54 | 5.33 4% | 8.45 -53% | 3.7 33% | 8.8 -59% | 5.6 -1% |
| Colorchecker dE 2000 calibrated * | 0.59 | 0.88 -49% | 0.51 14% | 1.3 -120% | 1 -69% | 0.8 -36% |
| Greyscale dE 2000 * | 1.7 | 2.4 -41% | 3.6 -112% | 2.9 -71% | 7.1 -318% | 4.5 -165% |
| Gamma | 2.26 97% | 2.06 107% | 2.08 106% | 2.03 108% | 2.12 104% | 2 110% |
| CCT | 6493 100% | 6668 97% | 6447 101% | 6840 95% | 7268 89% | 6528 100% |
| Totaal Gemiddelde (Programma / Instellingen) | -10% /
-8% | -11% /
-21% | -4% /
-9% | -16% /
-33% | -16% /
-20% |
* ... kleiner is beter
Het scherm komt nog steeds goed gekalibreerd uit de doos met gemiddelde grijswaarden en kleur deltaE waarden van slechts 1,7 en 2,1, respectievelijk. Kalibratie door de eindgebruiker is mogelijk, maar niet vereist.

Responstijd Scherm
| ↔ Responstijd Zwart naar Wit | ||
|---|---|---|
| 25.3 ms ... stijging ↗ en daling ↘ gecombineerd | ↗ 12.6 ms stijging | 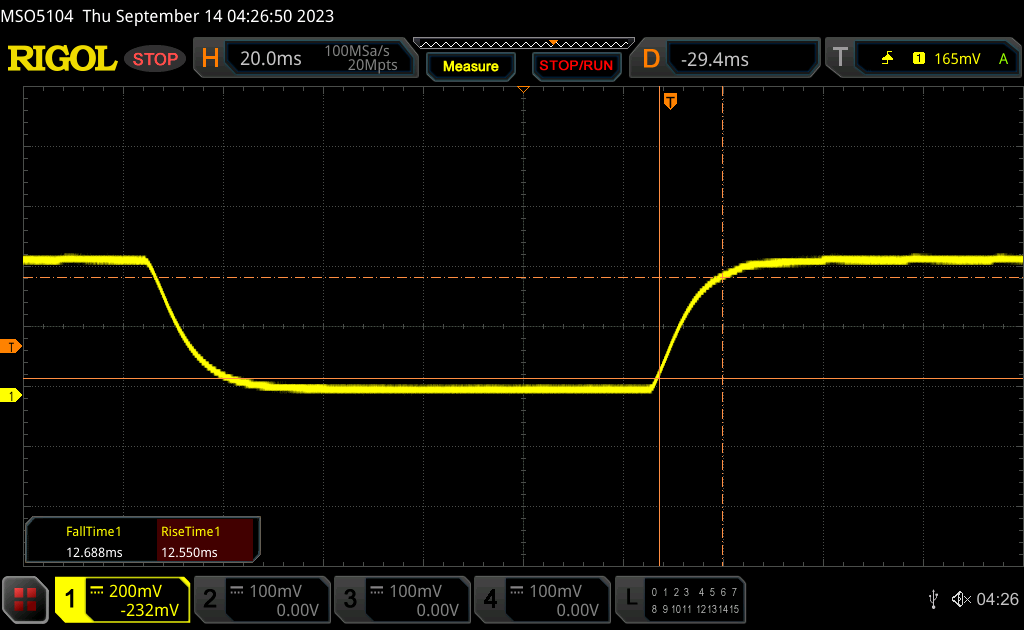 |
| ↘ 12.7 ms daling | ||
| Het scherm vertoonde relatief trage responstijden in onze tests en is misschien te traag voor games. Ter vergelijking: alle testtoestellen variëren van 0.1 (minimum) tot 240 (maximum) ms. » 61 % van alle toestellen zijn beter. Dit betekent dat de gemeten responstijd slechter is dan het gemiddelde (19.8 ms) van alle geteste toestellen. | ||
| ↔ Responstijd 50% Grijs naar 80% Grijs | ||
| 43.9 ms ... stijging ↗ en daling ↘ gecombineerd | ↗ 19.2 ms stijging | 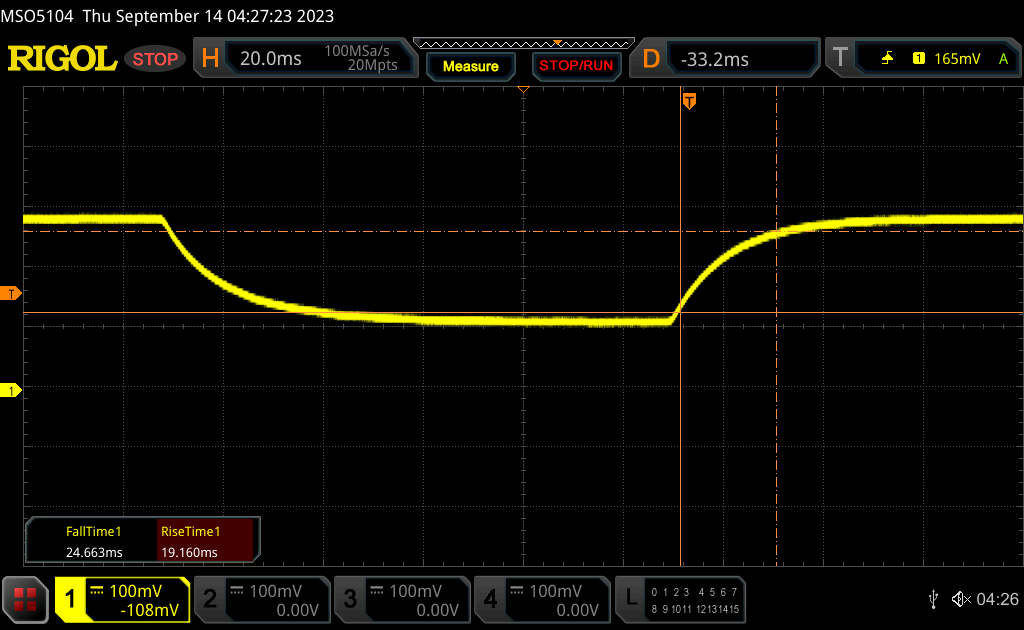 |
| ↘ 24.7 ms daling | ||
| Het scherm vertoonde trage responstijden in onze tests en is misschien te traag voor games. Ter vergelijking: alle testtoestellen variëren van 0.165 (minimum) tot 636 (maximum) ms. » 73 % van alle toestellen zijn beter. Dit betekent dat de gemeten responstijd slechter is dan het gemiddelde (30.9 ms) van alle geteste toestellen. | ||
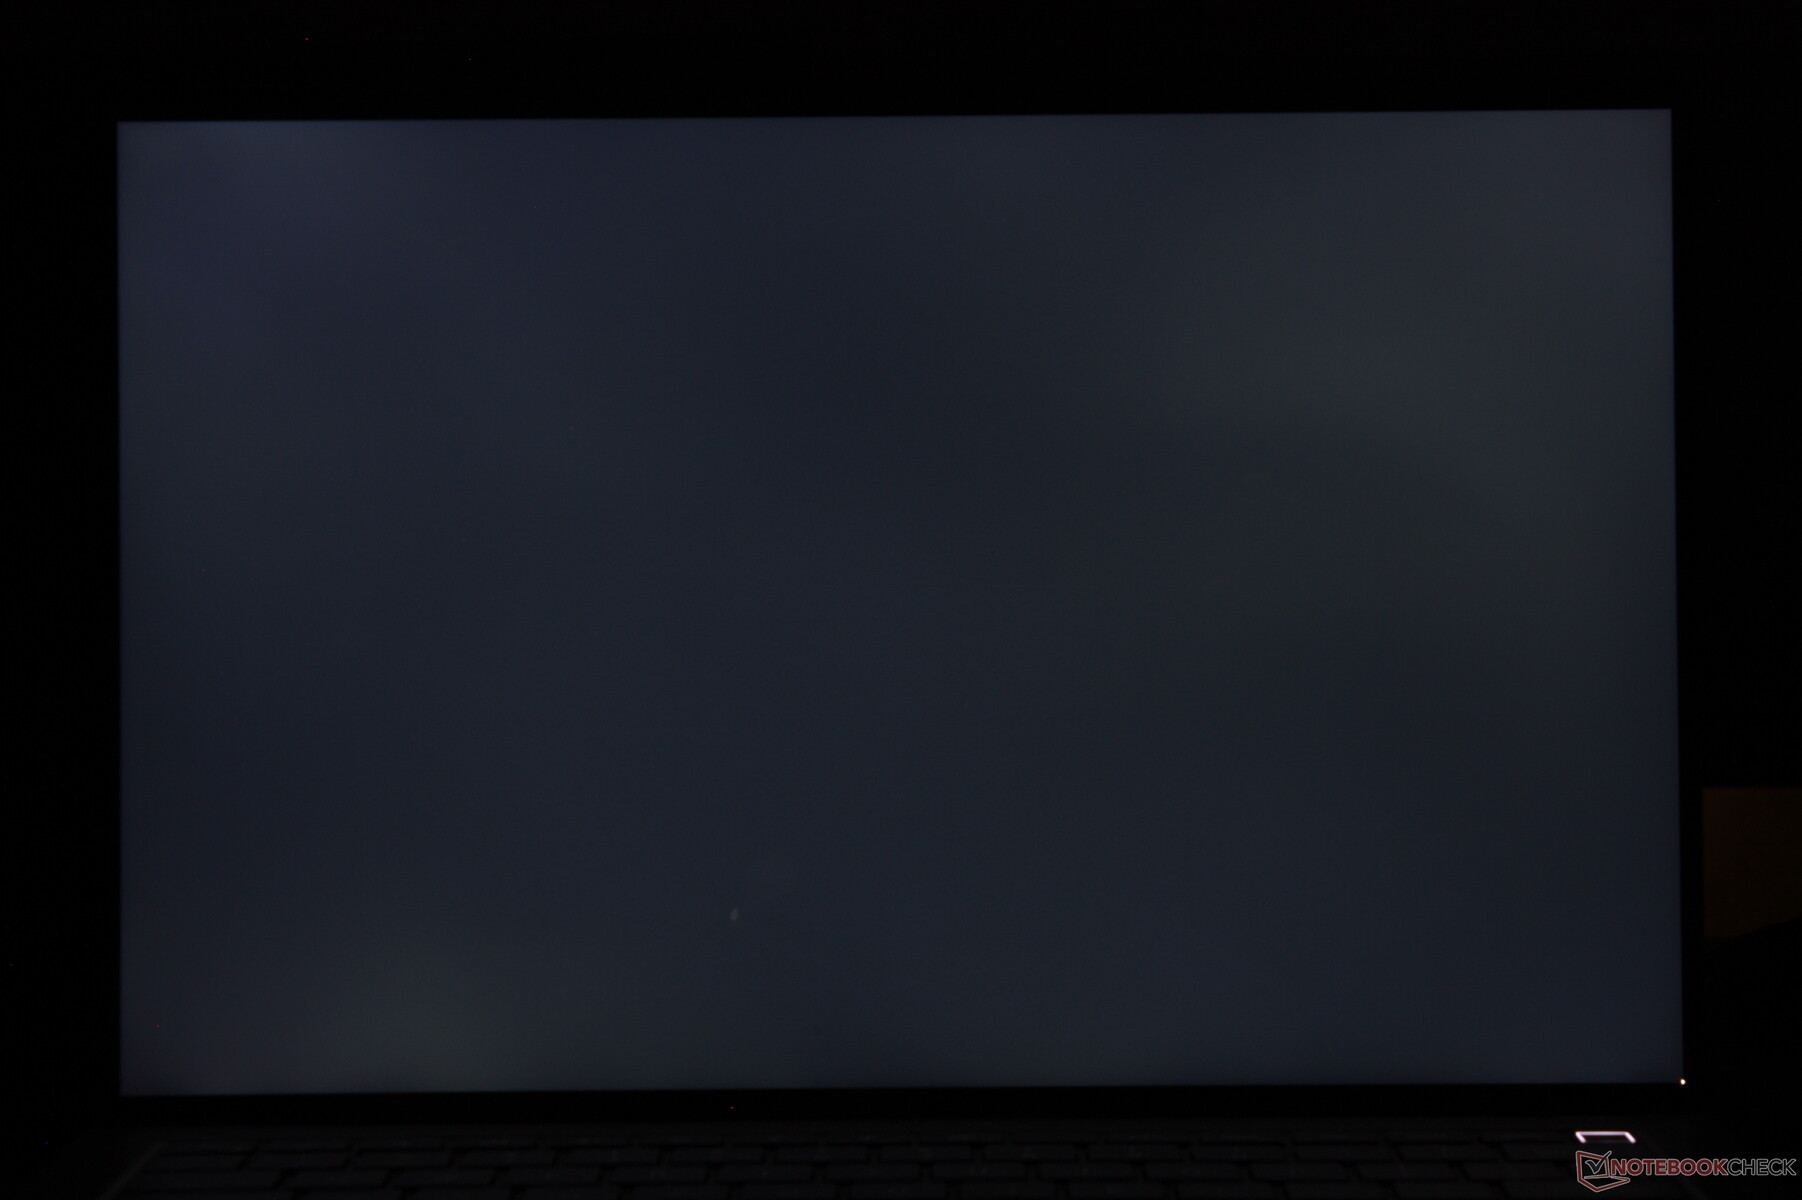
Screen Flickering / PWM (Pulse-Width Modulation)
| Screen flickering / PWM niet waargenomen | 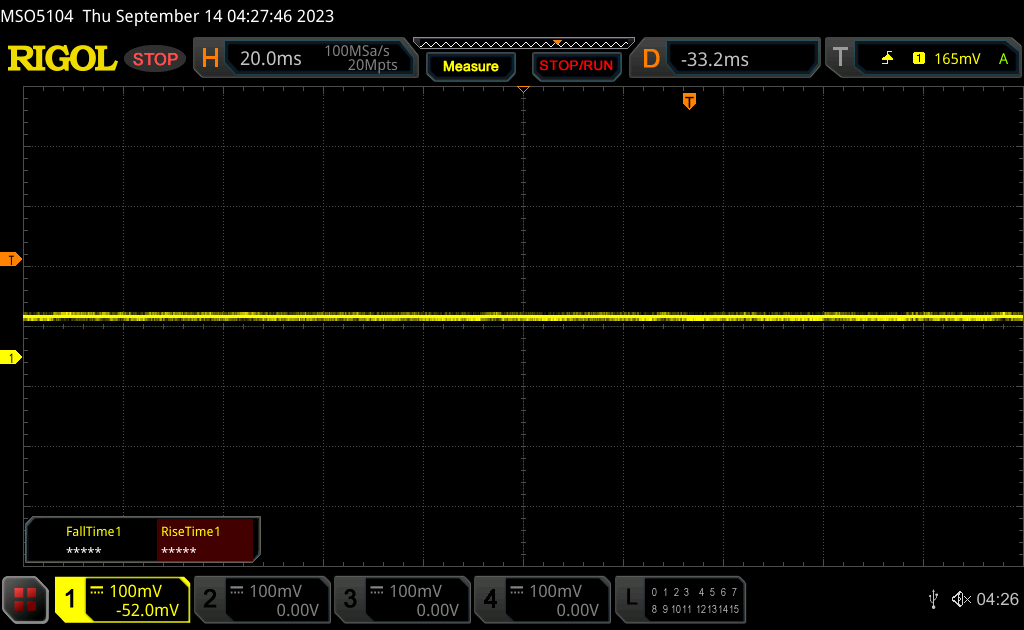 | ||
Ter vergelijking: 52 % van alle geteste toestellen maakten geen gebruik van PWM om de schermhelderheid te verlagen. Als het wel werd gebruikt, werd een gemiddelde van 7744 (minimum: 5 - maximum: 343500) Hz waargenomen. | |||
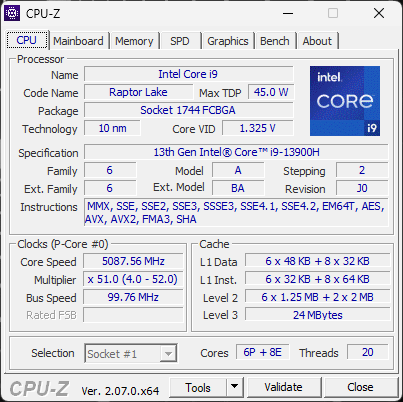
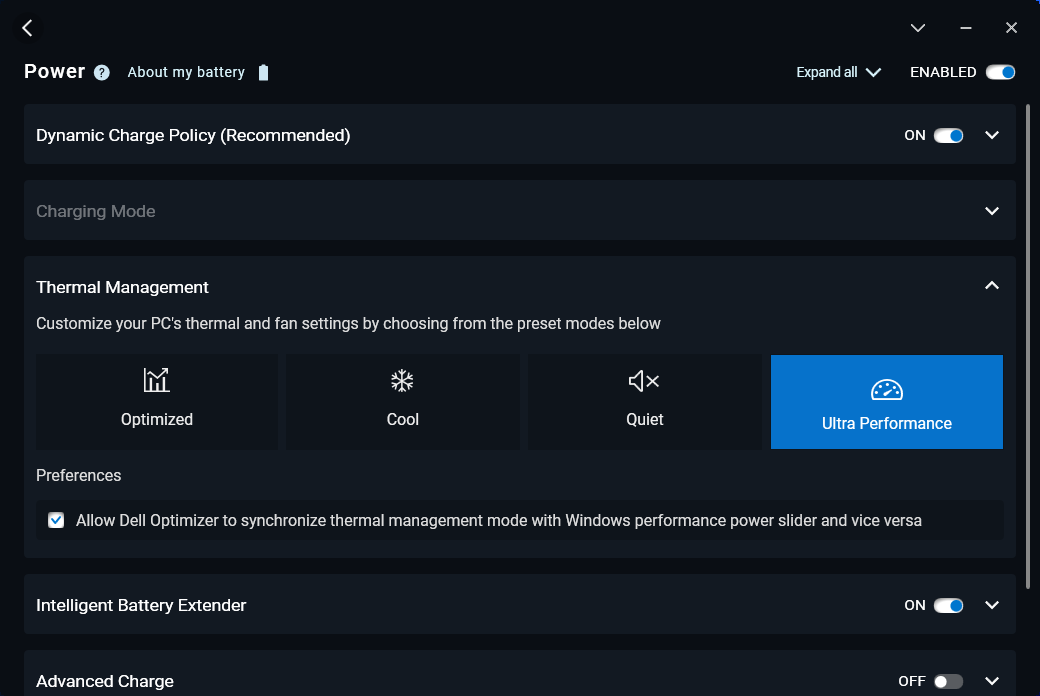
Prestaties - 13e generatie Raptor Lake-H
Testomstandigheden
We hebben ons apparaat via Dell Optimizer ingesteld op de Ultra Performance-modus voordat we de onderstaande benchmarks uitvoerden. De Optimizer energieprofielen kunnen worden gesynchroniseerd met de Windows energieprofielen, in tegenstelling tot de meeste andere laptops.
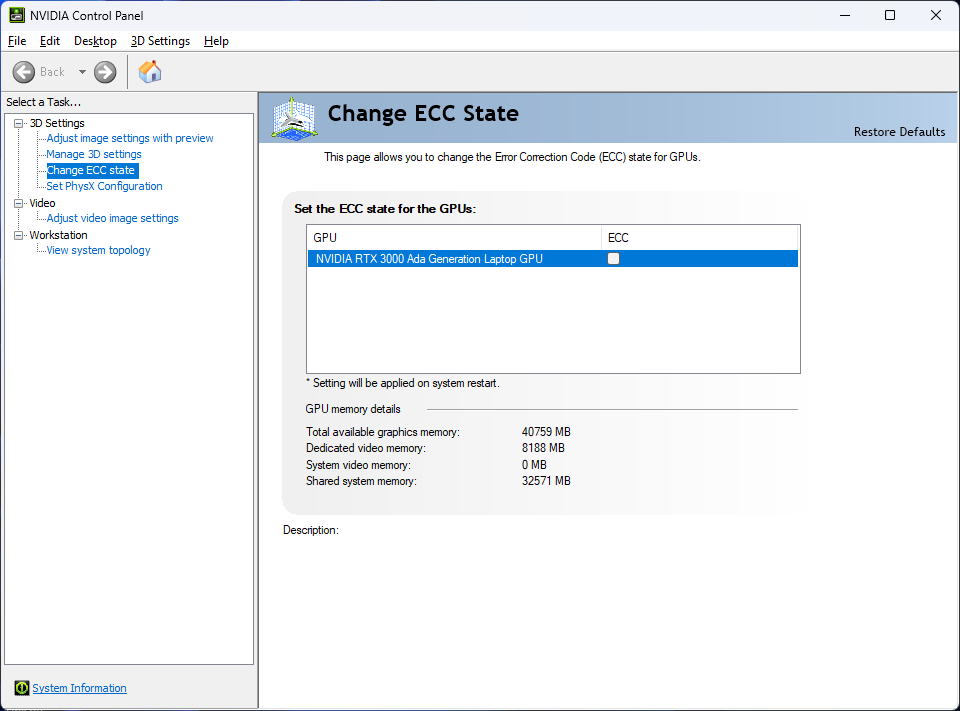
Advanced Optimus, MUX en G-Sync worden niet ondersteund op het interne beeldscherm. VRAM ECC-modus kan worden in- of uitgeschakeld via het Nvidia Configuratiescherm, net als op andere RTX GPU's uit de werkstationklasse van de Ada Lovelace-generatie.
Processor
Onze Core i9-13900H biedt tot 25 tot 35 procent snellere multi-thread prestaties ten opzichte van de Core i9-12900H in de Precision 5470 van vorig jaar. De opmerkelijke verbetering kan worden toegeschreven aan de stabielere Turbo Boost prestaties van de Precision 5480 in vergelijking met de Precision 5470, zoals blijkt uit onze CineBench R15 xT loop testresultaten hieronder.
De gemiddelde prestaties zijn nog steeds langzamer dan verwacht voor een laptop die wordt aangedreven door de Core i9-13900H, waarschijnlijk vanwege het kleine formaat van de Precision 5480. De grotere Precision 5680heeft bijvoorbeeld dezelfde CPU en presteert toch ongeveer 15 procent sneller.
Cinebench R15 Multi Loop
Cinebench R23: Multi Core | Single Core
Cinebench R20: CPU (Multi Core) | CPU (Single Core)
Cinebench R15: CPU Multi 64Bit | CPU Single 64Bit
Blender: v2.79 BMW27 CPU
7-Zip 18.03: 7z b 4 | 7z b 4 -mmt1
Geekbench 5.5: Multi-Core | Single-Core
HWBOT x265 Benchmark v2.2: 4k Preset
LibreOffice : 20 Documents To PDF
R Benchmark 2.5: Overall mean
| CPU Performance rating | |
| Asus ExpertBook B6 Flip B6602FC2 | |
| Dell Precision 5000 5680 | |
| HP ZBook Fury 16 G9 | |
| Dell Precision 5480 | |
| Gemiddeld Intel Core i9-13900H | |
| Dell Precision 5000 5470 | |
| Lenovo ThinkPad P1 G4-20Y4Z9DVUS | |
| Lenovo ThinkPad P14s G3 AMD 21J6S05000 | |
| HP ZBook Firefly 14 G9-6B8A2EA | |
| Dell Precision 5000 5560 -2! | |
| Lenovo ThinkPad P15v G3 21EM001AGE | |
| Lenovo ThinkPad P15v G2 21A9000XGE -1! | |
| Cinebench R23 / Multi Core | |
| Asus ExpertBook B6 Flip B6602FC2 | |
| HP ZBook Fury 16 G9 | |
| Dell Precision 5000 5680 | |
| Gemiddeld Intel Core i9-13900H (11997 - 20385, n=28) | |
| Dell Precision 5480 | |
| Dell Precision 5000 5470 | |
| Lenovo ThinkPad P15v G3 21EM001AGE | |
| Lenovo ThinkPad P1 G4-20Y4Z9DVUS | |
| Lenovo ThinkPad P14s G3 AMD 21J6S05000 | |
| Lenovo ThinkPad P15v G2 21A9000XGE | |
| Dell Precision 5000 5560 | |
| HP ZBook Firefly 14 G9-6B8A2EA | |
| Cinebench R23 / Single Core | |
| Dell Precision 5000 5680 | |
| Dell Precision 5480 | |
| HP ZBook Fury 16 G9 | |
| Gemiddeld Intel Core i9-13900H (1297 - 2054, n=26) | |
| Asus ExpertBook B6 Flip B6602FC2 | |
| Dell Precision 5000 5470 | |
| HP ZBook Firefly 14 G9-6B8A2EA | |
| Lenovo ThinkPad P14s G3 AMD 21J6S05000 | |
| Dell Precision 5000 5560 | |
| Lenovo ThinkPad P1 G4-20Y4Z9DVUS | |
| Lenovo ThinkPad P15v G3 21EM001AGE | |
| Cinebench R20 / CPU (Multi Core) | |
| Asus ExpertBook B6 Flip B6602FC2 | |
| HP ZBook Fury 16 G9 | |
| Dell Precision 5000 5680 | |
| Gemiddeld Intel Core i9-13900H (4935 - 7716, n=25) | |
| Dell Precision 5480 | |
| Lenovo ThinkPad P15v G3 21EM001AGE | |
| Lenovo ThinkPad P15v G3 21EM001AGE | |
| Lenovo ThinkPad P1 G4-20Y4Z9DVUS | |
| Dell Precision 5000 5470 | |
| Lenovo ThinkPad P14s G3 AMD 21J6S05000 | |
| Dell Precision 5000 5560 | |
| Lenovo ThinkPad P15v G2 21A9000XGE | |
| HP ZBook Firefly 14 G9-6B8A2EA | |
| Cinebench R20 / CPU (Single Core) | |
| Dell Precision 5000 5680 | |
| Dell Precision 5480 | |
| HP ZBook Fury 16 G9 | |
| Asus ExpertBook B6 Flip B6602FC2 | |
| Gemiddeld Intel Core i9-13900H (428 - 792, n=25) | |
| Dell Precision 5000 5470 | |
| HP ZBook Firefly 14 G9-6B8A2EA | |
| Lenovo ThinkPad P14s G3 AMD 21J6S05000 | |
| Lenovo ThinkPad P1 G4-20Y4Z9DVUS | |
| Dell Precision 5000 5560 | |
| Lenovo ThinkPad P15v G3 21EM001AGE | |
| Lenovo ThinkPad P15v G3 21EM001AGE | |
| Lenovo ThinkPad P15v G2 21A9000XGE | |
| Cinebench R15 / CPU Multi 64Bit | |
| Asus ExpertBook B6 Flip B6602FC2 | |
| Gemiddeld Intel Core i9-13900H (2061 - 3100, n=26) | |
| HP ZBook Fury 16 G9 | |
| Dell Precision 5480 | |
| Dell Precision 5000 5680 | |
| Dell Precision 5000 5470 | |
| Lenovo ThinkPad P1 G4-20Y4Z9DVUS | |
| Lenovo ThinkPad P15v G3 21EM001AGE | |
| Lenovo ThinkPad P14s G3 AMD 21J6S05000 | |
| Lenovo ThinkPad P15v G2 21A9000XGE | |
| Dell Precision 5000 5560 | |
| HP ZBook Firefly 14 G9-6B8A2EA | |
| Cinebench R15 / CPU Single 64Bit | |
| Dell Precision 5000 5680 | |
| Dell Precision 5480 | |
| Asus ExpertBook B6 Flip B6602FC2 | |
| Gemiddeld Intel Core i9-13900H (211 - 297, n=26) | |
| HP ZBook Firefly 14 G9-6B8A2EA | |
| Dell Precision 5000 5470 | |
| Lenovo ThinkPad P14s G3 AMD 21J6S05000 | |
| Dell Precision 5000 5560 | |
| Lenovo ThinkPad P1 G4-20Y4Z9DVUS | |
| Lenovo ThinkPad P15v G2 21A9000XGE | |
| HP ZBook Fury 16 G9 | |
| Lenovo ThinkPad P15v G3 21EM001AGE | |
| Blender / v2.79 BMW27 CPU | |
| HP ZBook Firefly 14 G9-6B8A2EA | |
| Lenovo ThinkPad P15v G2 21A9000XGE | |
| Dell Precision 5000 5560 | |
| Lenovo ThinkPad P14s G3 AMD 21J6S05000 | |
| Lenovo ThinkPad P1 G4-20Y4Z9DVUS | |
| Dell Precision 5000 5470 | |
| Lenovo ThinkPad P15v G3 21EM001AGE | |
| Dell Precision 5480 | |
| Gemiddeld Intel Core i9-13900H (166 - 268, n=24) | |
| Dell Precision 5000 5680 | |
| Asus ExpertBook B6 Flip B6602FC2 | |
| HP ZBook Fury 16 G9 | |
| 7-Zip 18.03 / 7z b 4 | |
| HP ZBook Fury 16 G9 | |
| Asus ExpertBook B6 Flip B6602FC2 | |
| Dell Precision 5000 5680 | |
| Gemiddeld Intel Core i9-13900H (45045 - 79032, n=25) | |
| Dell Precision 5480 | |
| Lenovo ThinkPad P15v G3 21EM001AGE | |
| Dell Precision 5000 5470 | |
| Lenovo ThinkPad P1 G4-20Y4Z9DVUS | |
| Lenovo ThinkPad P14s G3 AMD 21J6S05000 | |
| Dell Precision 5000 5560 | |
| Lenovo ThinkPad P15v G2 21A9000XGE | |
| HP ZBook Firefly 14 G9-6B8A2EA | |
| 7-Zip 18.03 / 7z b 4 -mmt1 | |
| Asus ExpertBook B6 Flip B6602FC2 | |
| Dell Precision 5000 5680 | |
| Dell Precision 5480 | |
| Gemiddeld Intel Core i9-13900H (3665 - 6600, n=25) | |
| HP ZBook Fury 16 G9 | |
| Dell Precision 5000 5560 | |
| HP ZBook Firefly 14 G9-6B8A2EA | |
| Lenovo ThinkPad P1 G4-20Y4Z9DVUS | |
| Dell Precision 5000 5470 | |
| Lenovo ThinkPad P15v G3 21EM001AGE | |
| Lenovo ThinkPad P15v G2 21A9000XGE | |
| Lenovo ThinkPad P14s G3 AMD 21J6S05000 | |
| Geekbench 5.5 / Multi-Core | |
| Asus ExpertBook B6 Flip B6602FC2 | |
| Dell Precision 5000 5680 | |
| HP ZBook Fury 16 G9 | |
| Dell Precision 5480 | |
| Gemiddeld Intel Core i9-13900H (9094 - 15410, n=26) | |
| Dell Precision 5000 5470 | |
| HP ZBook Firefly 14 G9-6B8A2EA | |
| Lenovo ThinkPad P1 G4-20Y4Z9DVUS | |
| Lenovo ThinkPad P15v G3 21EM001AGE | |
| Lenovo ThinkPad P14s G3 AMD 21J6S05000 | |
| Lenovo ThinkPad P15v G2 21A9000XGE | |
| Geekbench 5.5 / Single-Core | |
| Dell Precision 5000 5680 | |
| HP ZBook Fury 16 G9 | |
| Dell Precision 5480 | |
| Gemiddeld Intel Core i9-13900H (1140 - 2043, n=26) | |
| Asus ExpertBook B6 Flip B6602FC2 | |
| Dell Precision 5000 5470 | |
| HP ZBook Firefly 14 G9-6B8A2EA | |
| Lenovo ThinkPad P1 G4-20Y4Z9DVUS | |
| Lenovo ThinkPad P14s G3 AMD 21J6S05000 | |
| Lenovo ThinkPad P15v G2 21A9000XGE | |
| Lenovo ThinkPad P15v G3 21EM001AGE | |
| HWBOT x265 Benchmark v2.2 / 4k Preset | |
| Asus ExpertBook B6 Flip B6602FC2 | |
| Dell Precision 5000 5680 | |
| HP ZBook Fury 16 G9 | |
| Gemiddeld Intel Core i9-13900H (14.1 - 22.3, n=25) | |
| Dell Precision 5480 | |
| Lenovo ThinkPad P1 G4-20Y4Z9DVUS | |
| Dell Precision 5000 5470 | |
| Lenovo ThinkPad P14s G3 AMD 21J6S05000 | |
| Lenovo ThinkPad P15v G3 21EM001AGE | |
| Dell Precision 5000 5560 | |
| Lenovo ThinkPad P15v G2 21A9000XGE | |
| HP ZBook Firefly 14 G9-6B8A2EA | |
| LibreOffice / 20 Documents To PDF | |
| Lenovo ThinkPad P15v G3 21EM001AGE | |
| Lenovo ThinkPad P14s G3 AMD 21J6S05000 | |
| Lenovo ThinkPad P15v G2 21A9000XGE | |
| Lenovo ThinkPad P1 G4-20Y4Z9DVUS | |
| Dell Precision 5000 5560 | |
| Gemiddeld Intel Core i9-13900H (34.4 - 82.8, n=25) | |
| Dell Precision 5000 5470 | |
| Dell Precision 5480 | |
| HP ZBook Firefly 14 G9-6B8A2EA | |
| Asus ExpertBook B6 Flip B6602FC2 | |
| Dell Precision 5000 5680 | |
| HP ZBook Fury 16 G9 | |
| R Benchmark 2.5 / Overall mean | |
| Lenovo ThinkPad P15v G2 21A9000XGE | |
| Lenovo ThinkPad P1 G4-20Y4Z9DVUS | |
| Dell Precision 5000 5560 | |
| Lenovo ThinkPad P14s G3 AMD 21J6S05000 | |
| Lenovo ThinkPad P15v G3 21EM001AGE | |
| HP ZBook Firefly 14 G9-6B8A2EA | |
| Dell Precision 5000 5470 | |
| Dell Precision 5480 | |
| Asus ExpertBook B6 Flip B6602FC2 | |
| Gemiddeld Intel Core i9-13900H (0.4052 - 0.723, n=25) | |
| HP ZBook Fury 16 G9 | |
| Dell Precision 5000 5680 | |
* ... kleiner is beter
AIDA64: FP32 Ray-Trace | FPU Julia | CPU SHA3 | CPU Queen | FPU SinJulia | FPU Mandel | CPU AES | CPU ZLib | FP64 Ray-Trace | CPU PhotoWorxx
| Performance rating | |
| Lenovo ThinkPad P15v G3 21EM001AGE | |
| Dell Precision 5480 | |
| Gemiddeld Intel Core i9-13900H | |
| Lenovo ThinkPad P14s G3 AMD 21J6S05000 | |
| Dell Precision 5000 5470 | |
| HP ZBook Firefly 14 G9-6B8A2EA | |
| AIDA64 / FP32 Ray-Trace | |
| Dell Precision 5480 | |
| Gemiddeld Intel Core i9-13900H (6788 - 19557, n=25) | |
| Lenovo ThinkPad P15v G3 21EM001AGE | |
| Dell Precision 5000 5470 | |
| Lenovo ThinkPad P14s G3 AMD 21J6S05000 | |
| HP ZBook Firefly 14 G9-6B8A2EA | |
| AIDA64 / FPU Julia | |
| Lenovo ThinkPad P15v G3 21EM001AGE | |
| Lenovo ThinkPad P14s G3 AMD 21J6S05000 | |
| Dell Precision 5480 | |
| Gemiddeld Intel Core i9-13900H (22551 - 95579, n=25) | |
| Dell Precision 5000 5470 | |
| HP ZBook Firefly 14 G9-6B8A2EA | |
| AIDA64 / CPU SHA3 | |
| Gemiddeld Intel Core i9-13900H (2491 - 4270, n=25) | |
| Dell Precision 5480 | |
| Lenovo ThinkPad P15v G3 21EM001AGE | |
| Dell Precision 5000 5470 | |
| Lenovo ThinkPad P14s G3 AMD 21J6S05000 | |
| HP ZBook Firefly 14 G9-6B8A2EA | |
| AIDA64 / CPU Queen | |
| Dell Precision 5480 | |
| Dell Precision 5000 5470 | |
| Gemiddeld Intel Core i9-13900H (65121 - 120936, n=25) | |
| Lenovo ThinkPad P15v G3 21EM001AGE | |
| Lenovo ThinkPad P14s G3 AMD 21J6S05000 | |
| HP ZBook Firefly 14 G9-6B8A2EA | |
| AIDA64 / FPU SinJulia | |
| Lenovo ThinkPad P15v G3 21EM001AGE | |
| Lenovo ThinkPad P14s G3 AMD 21J6S05000 | |
| Dell Precision 5480 | |
| Gemiddeld Intel Core i9-13900H (6108 - 11631, n=25) | |
| Dell Precision 5000 5470 | |
| HP ZBook Firefly 14 G9-6B8A2EA | |
| AIDA64 / FPU Mandel | |
| Lenovo ThinkPad P15v G3 21EM001AGE | |
| Lenovo ThinkPad P14s G3 AMD 21J6S05000 | |
| Dell Precision 5480 | |
| Gemiddeld Intel Core i9-13900H (11283 - 48474, n=25) | |
| Dell Precision 5000 5470 | |
| HP ZBook Firefly 14 G9-6B8A2EA | |
| AIDA64 / CPU AES | |
| Lenovo ThinkPad P15v G3 21EM001AGE | |
| Gemiddeld Intel Core i9-13900H (3691 - 149377, n=25) | |
| Dell Precision 5480 | |
| Lenovo ThinkPad P14s G3 AMD 21J6S05000 | |
| HP ZBook Firefly 14 G9-6B8A2EA | |
| Dell Precision 5000 5470 | |
| AIDA64 / CPU ZLib | |
| Gemiddeld Intel Core i9-13900H (789 - 1254, n=25) | |
| Dell Precision 5480 | |
| Lenovo ThinkPad P15v G3 21EM001AGE | |
| Lenovo ThinkPad P14s G3 AMD 21J6S05000 | |
| HP ZBook Firefly 14 G9-6B8A2EA | |
| Dell Precision 5000 5470 | |
| AIDA64 / FP64 Ray-Trace | |
| Gemiddeld Intel Core i9-13900H (3655 - 10716, n=25) | |
| Dell Precision 5480 | |
| Lenovo ThinkPad P15v G3 21EM001AGE | |
| Dell Precision 5000 5470 | |
| Lenovo ThinkPad P14s G3 AMD 21J6S05000 | |
| HP ZBook Firefly 14 G9-6B8A2EA | |
| AIDA64 / CPU PhotoWorxx | |
| Dell Precision 5480 | |
| Dell Precision 5000 5470 | |
| HP ZBook Firefly 14 G9-6B8A2EA | |
| Gemiddeld Intel Core i9-13900H (10871 - 50488, n=25) | |
| Lenovo ThinkPad P14s G3 AMD 21J6S05000 | |
| Lenovo ThinkPad P15v G3 21EM001AGE | |
Systeemprestaties
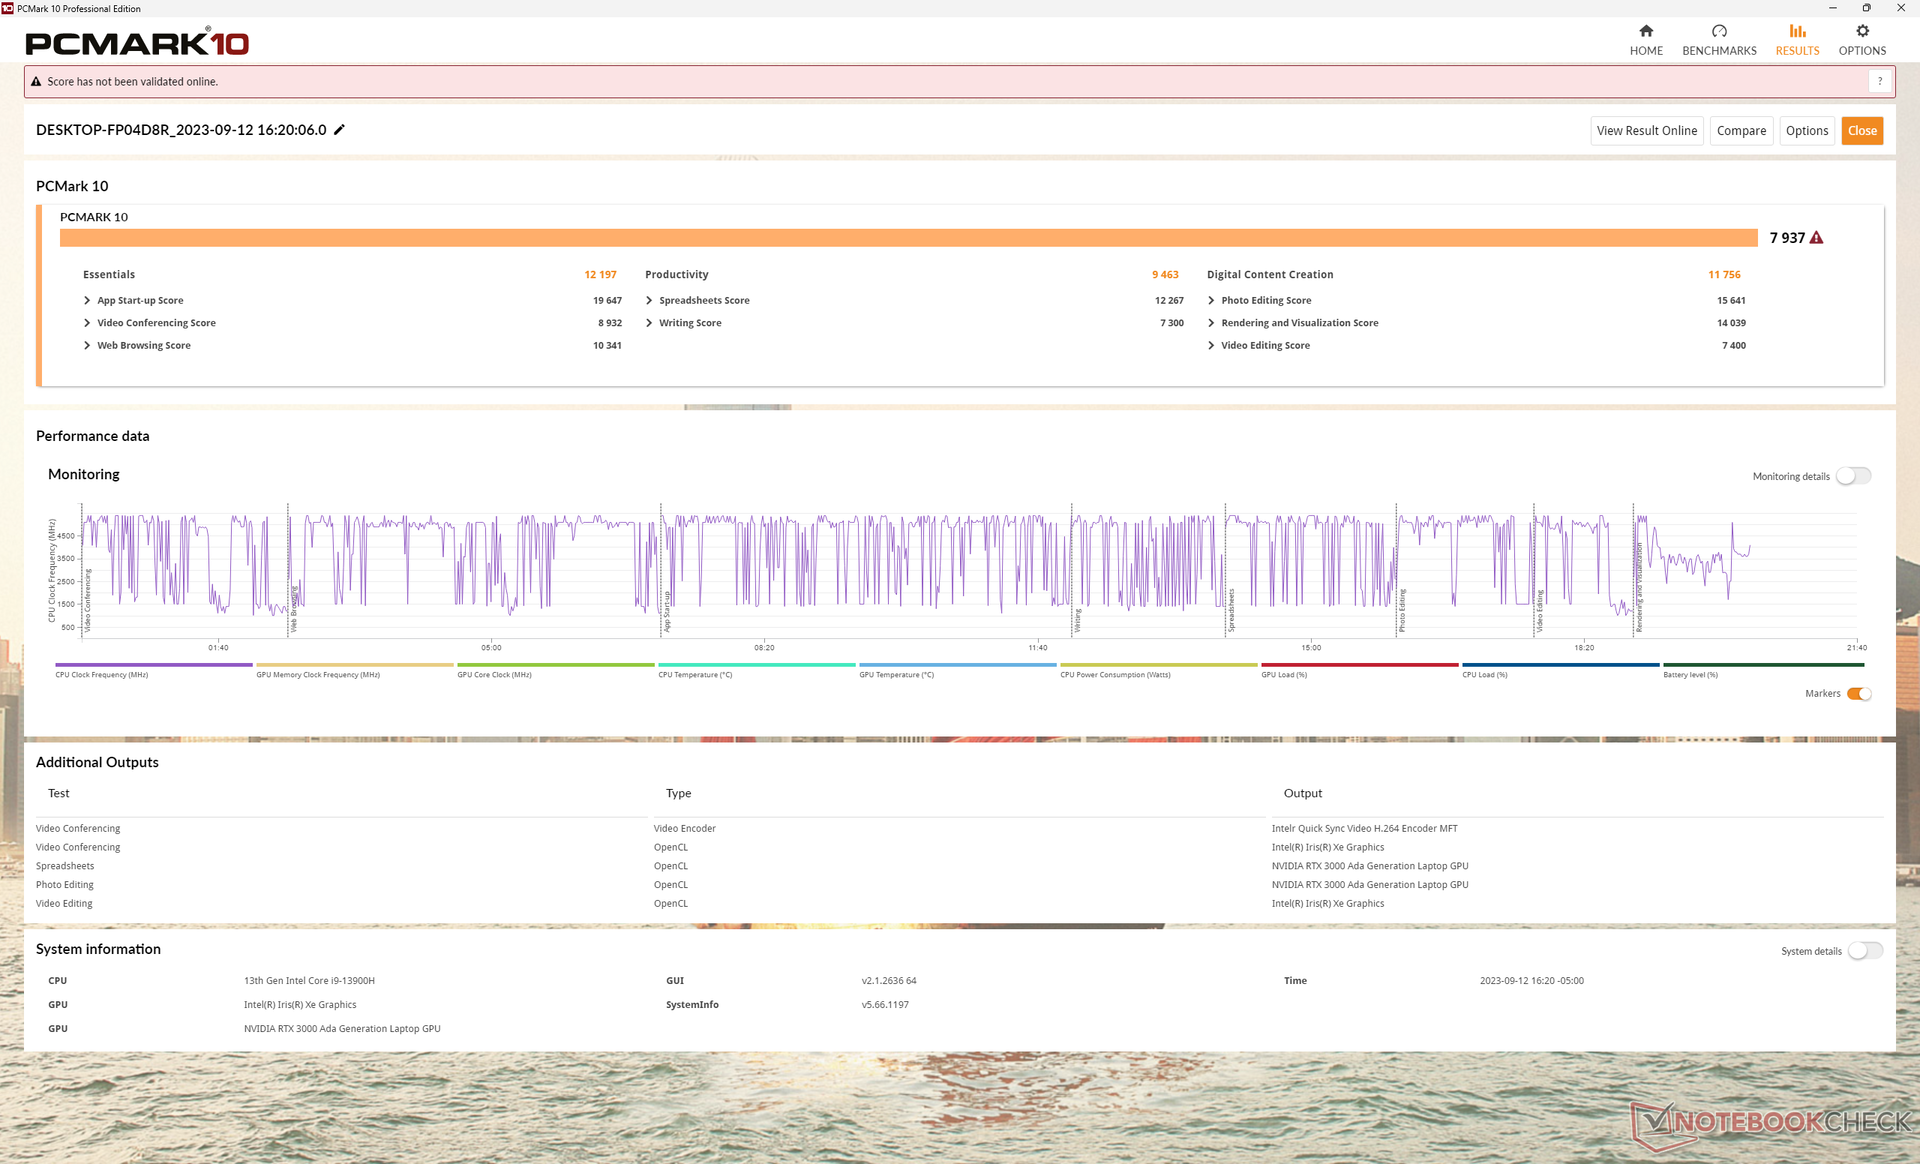
PCMark scores zijn hoger dan andere 14-inch workstations die we tot nu toe hebben getest. Veel van de winst kan worden toegeschreven aan de nieuwe RTX 3000 Ada GPU die aanzienlijke prestatievoordelen biedt ten opzichte van de Ampere-opties van vorig jaar, zoals ons GPU-prestatiegedeelte hieronder zal laten zien.
CrossMark: Overall | Productivity | Creativity | Responsiveness
| PCMark 10 / Score | |
| Dell Precision 5480 | |
| Dell Precision 5000 5470 | |
| Dell Precision 5000 5560 | |
| Lenovo ThinkPad P15 G2-20YQ001JGE | |
| Lenovo ThinkPad P15v G3 21EM001AGE | |
| HP ZBook Firefly 14 G9-6B8A2EA | |
| Lenovo ThinkPad P14s G3 AMD 21J6S05000 | |
| PCMark 10 / Essentials | |
| Dell Precision 5480 | |
| Dell Precision 5000 5470 | |
| Dell Precision 5000 5560 | |
| Lenovo ThinkPad P15 G2-20YQ001JGE | |
| HP ZBook Firefly 14 G9-6B8A2EA | |
| Lenovo ThinkPad P15v G3 21EM001AGE | |
| Lenovo ThinkPad P14s G3 AMD 21J6S05000 | |
| PCMark 10 / Productivity | |
| HP ZBook Firefly 14 G9-6B8A2EA | |
| Dell Precision 5480 | |
| Dell Precision 5000 5560 | |
| Lenovo ThinkPad P15v G3 21EM001AGE | |
| Dell Precision 5000 5470 | |
| Lenovo ThinkPad P14s G3 AMD 21J6S05000 | |
| Lenovo ThinkPad P15 G2-20YQ001JGE | |
| PCMark 10 / Digital Content Creation | |
| Dell Precision 5480 | |
| Dell Precision 5000 5470 | |
| Lenovo ThinkPad P15 G2-20YQ001JGE | |
| Lenovo ThinkPad P15v G3 21EM001AGE | |
| Dell Precision 5000 5560 | |
| Lenovo ThinkPad P14s G3 AMD 21J6S05000 | |
| HP ZBook Firefly 14 G9-6B8A2EA | |
| CrossMark / Overall | |
| Dell Precision 5480 | |
| Dell Precision 5000 5470 | |
| HP ZBook Firefly 14 G9-6B8A2EA | |
| Lenovo ThinkPad P15v G3 21EM001AGE | |
| Lenovo ThinkPad P14s G3 AMD 21J6S05000 | |
| CrossMark / Productivity | |
| Dell Precision 5480 | |
| Dell Precision 5000 5470 | |
| HP ZBook Firefly 14 G9-6B8A2EA | |
| Lenovo ThinkPad P15v G3 21EM001AGE | |
| Lenovo ThinkPad P14s G3 AMD 21J6S05000 | |
| CrossMark / Creativity | |
| Dell Precision 5480 | |
| Dell Precision 5000 5470 | |
| HP ZBook Firefly 14 G9-6B8A2EA | |
| Lenovo ThinkPad P15v G3 21EM001AGE | |
| Lenovo ThinkPad P14s G3 AMD 21J6S05000 | |
| CrossMark / Responsiveness | |
| Dell Precision 5480 | |
| Dell Precision 5000 5470 | |
| HP ZBook Firefly 14 G9-6B8A2EA | |
| Lenovo ThinkPad P15v G3 21EM001AGE | |
| Lenovo ThinkPad P14s G3 AMD 21J6S05000 | |
| PCMark 10 Score | 7937 punten | |
Help | ||
| AIDA64 / Memory Copy | |
| Dell Precision 5480 | |
| Dell Precision 5000 5470 | |
| Gemiddeld Intel Core i9-13900H (37448 - 74486, n=25) | |
| HP ZBook Firefly 14 G9-6B8A2EA | |
| Lenovo ThinkPad P14s G3 AMD 21J6S05000 | |
| Lenovo ThinkPad P15v G3 21EM001AGE | |
| AIDA64 / Memory Read | |
| Dell Precision 5000 5470 | |
| Dell Precision 5480 | |
| HP ZBook Firefly 14 G9-6B8A2EA | |
| Gemiddeld Intel Core i9-13900H (41599 - 75433, n=25) | |
| Lenovo ThinkPad P14s G3 AMD 21J6S05000 | |
| Lenovo ThinkPad P15v G3 21EM001AGE | |
| AIDA64 / Memory Write | |
| Dell Precision 5480 | |
| Gemiddeld Intel Core i9-13900H (36152 - 88505, n=25) | |
| HP ZBook Firefly 14 G9-6B8A2EA | |
| Dell Precision 5000 5470 | |
| Lenovo ThinkPad P14s G3 AMD 21J6S05000 | |
| Lenovo ThinkPad P15v G3 21EM001AGE | |
| AIDA64 / Memory Latency | |
| Lenovo ThinkPad P14s G3 AMD 21J6S05000 | |
| Dell Precision 5000 5470 | |
| Lenovo ThinkPad P15v G3 21EM001AGE | |
| Dell Precision 5480 | |
| Gemiddeld Intel Core i9-13900H (75.8 - 102.3, n=25) | |
| HP ZBook Firefly 14 G9-6B8A2EA | |
* ... kleiner is beter
DPC latentie
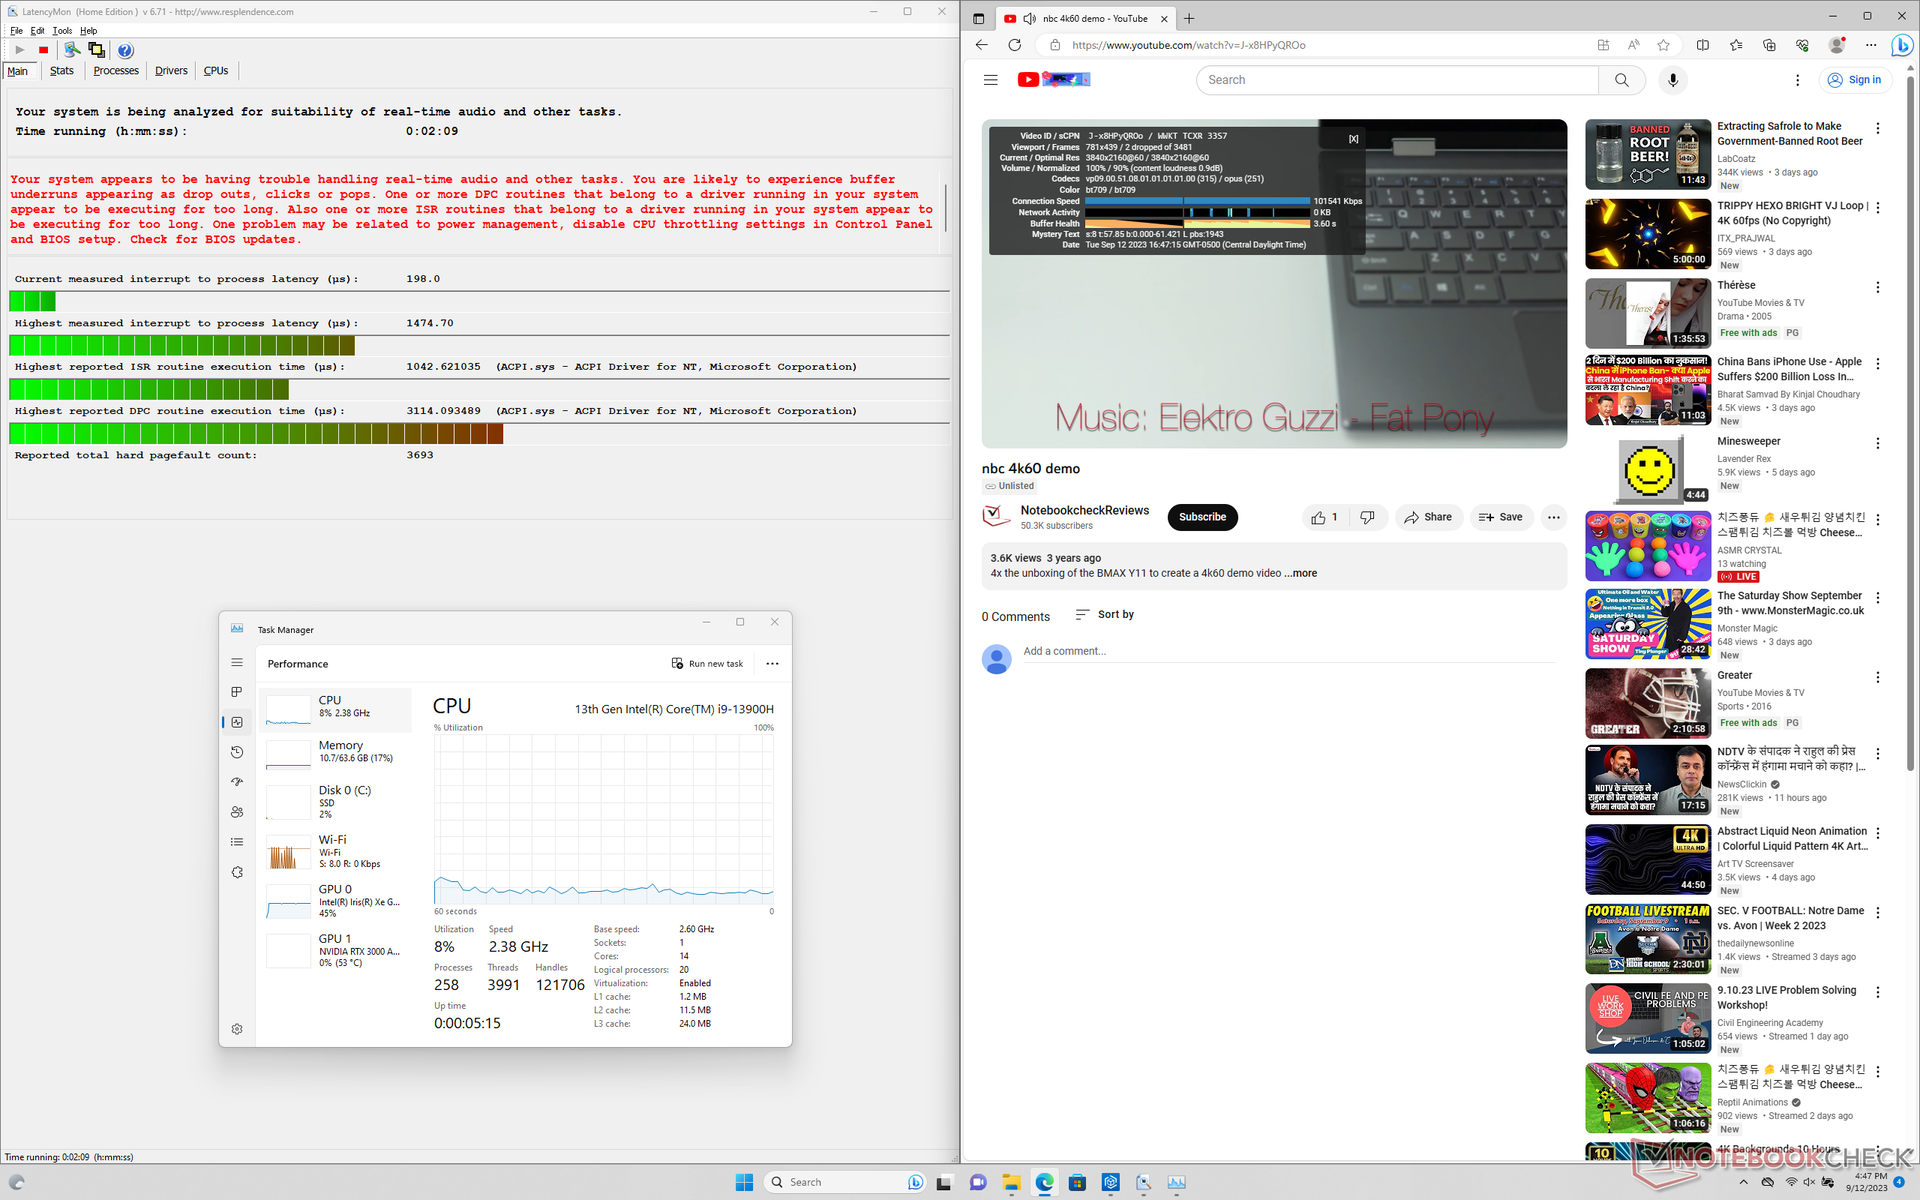
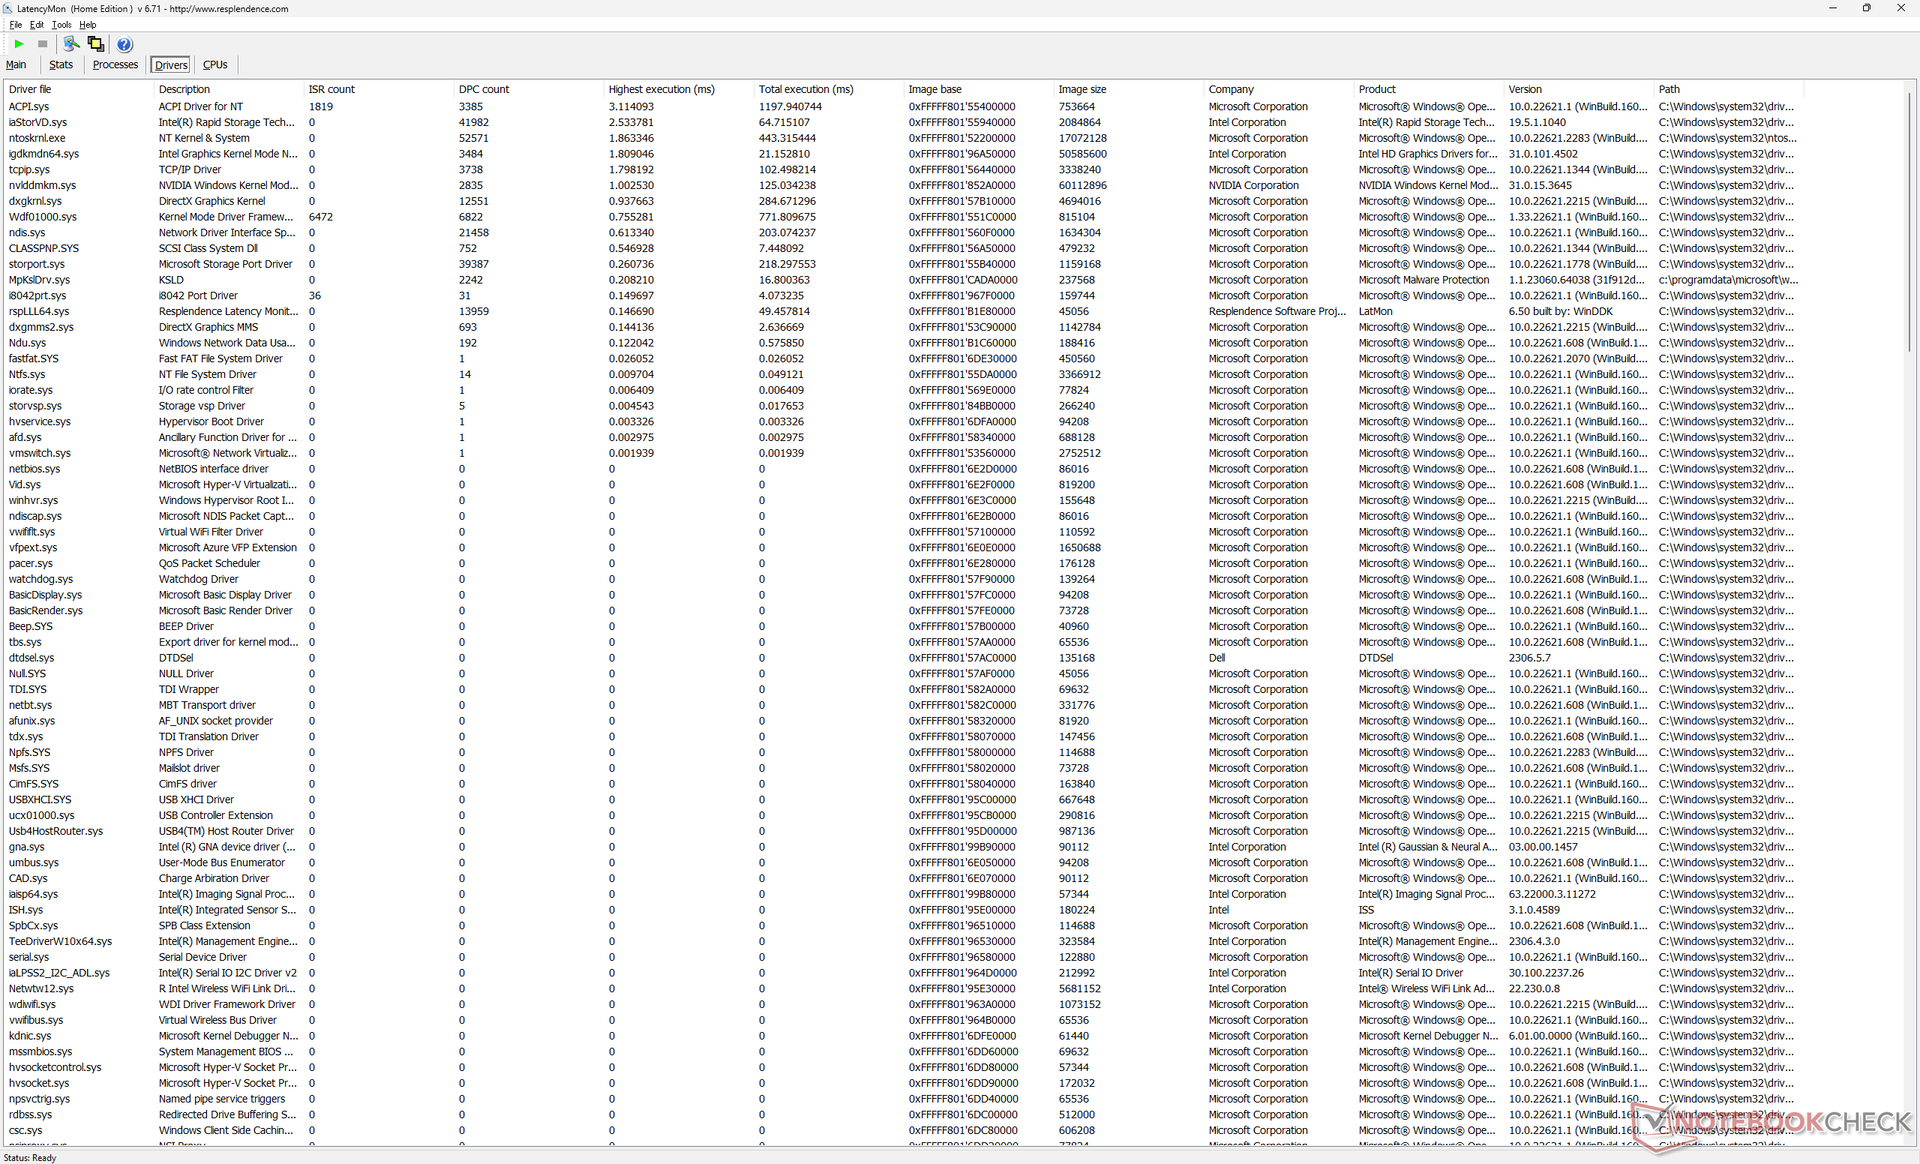
LatencyMon onthult DPC-problemen bij het openen van meerdere browsertabbladen van onze startpagina. We zijn ook in staat om 2 dropped frames op te nemen tijdens een minuut durende 4K60 video, wat jammer is om te zien op een mobiel werkstation.
| DPC Latencies / LatencyMon - interrupt to process latency (max), Web, Youtube, Prime95 | |
| Dell Precision 5480 | |
| Dell Precision 5000 5470 | |
| Lenovo ThinkPad P14s G3 AMD 21J6S05000 | |
| Dell Precision 5000 5560 | |
| Lenovo ThinkPad P15v G3 21EM001AGE | |
* ... kleiner is beter
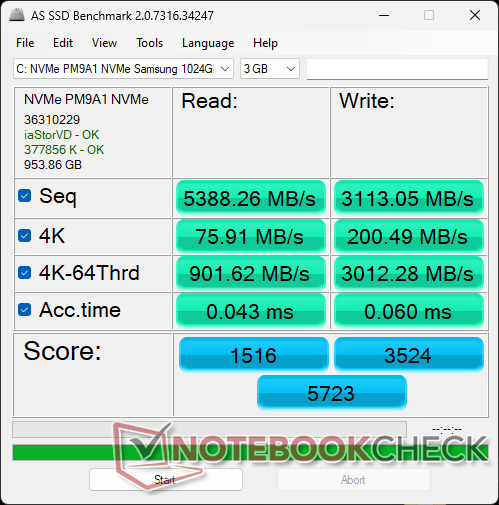
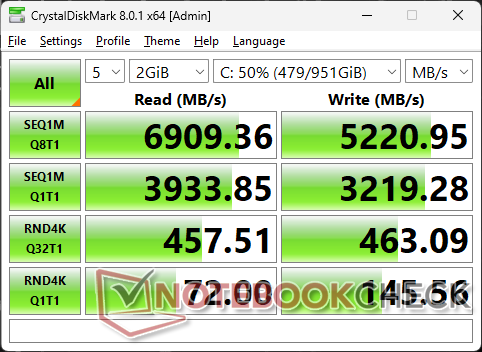
Opslagapparaten
Dell lijkt gebruik te maken van Samsung PM9A1 SSD's voor de meeste van haar Precision modellen, waaronder de Precision 5470 en 5560. De maximale overdrachtsnelheden liggen stabiel op ongeveer 6900 MB/s zonder problemen.
Zelfversleutelende drives zijn optioneel bij Dell, maar het model kan slechts één interne SSD ondersteunen.

| Drive Performance rating - Percent | |
| Lenovo ThinkPad P14s G3 AMD 21J6S05000 | |
| Gemiddeld Samsung PM9A1 MZVL21T0HCLR | |
| Dell Precision 5000 5560 | |
| Dell Precision 5480 | |
| Lenovo ThinkPad P15v G3 21EM001AGE | |
| Dell Precision 5000 5470 | |
| HP ZBook Firefly 14 G9-6B8A2EA -11! | |
* ... kleiner is beter
Disk Throttling: DiskSpd Read Loop, Queue Depth 8
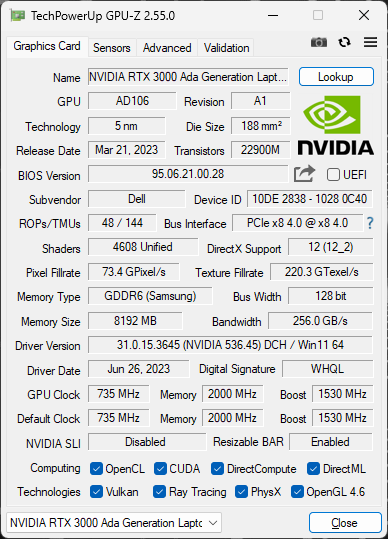
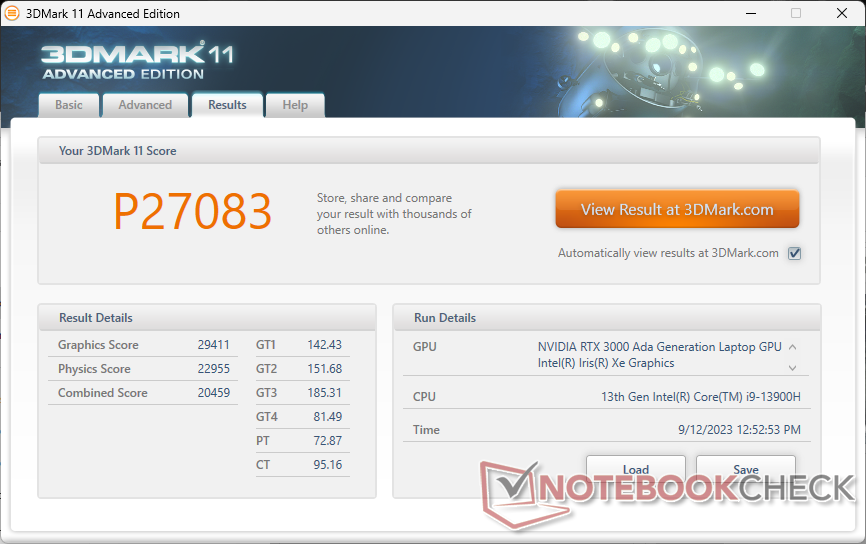
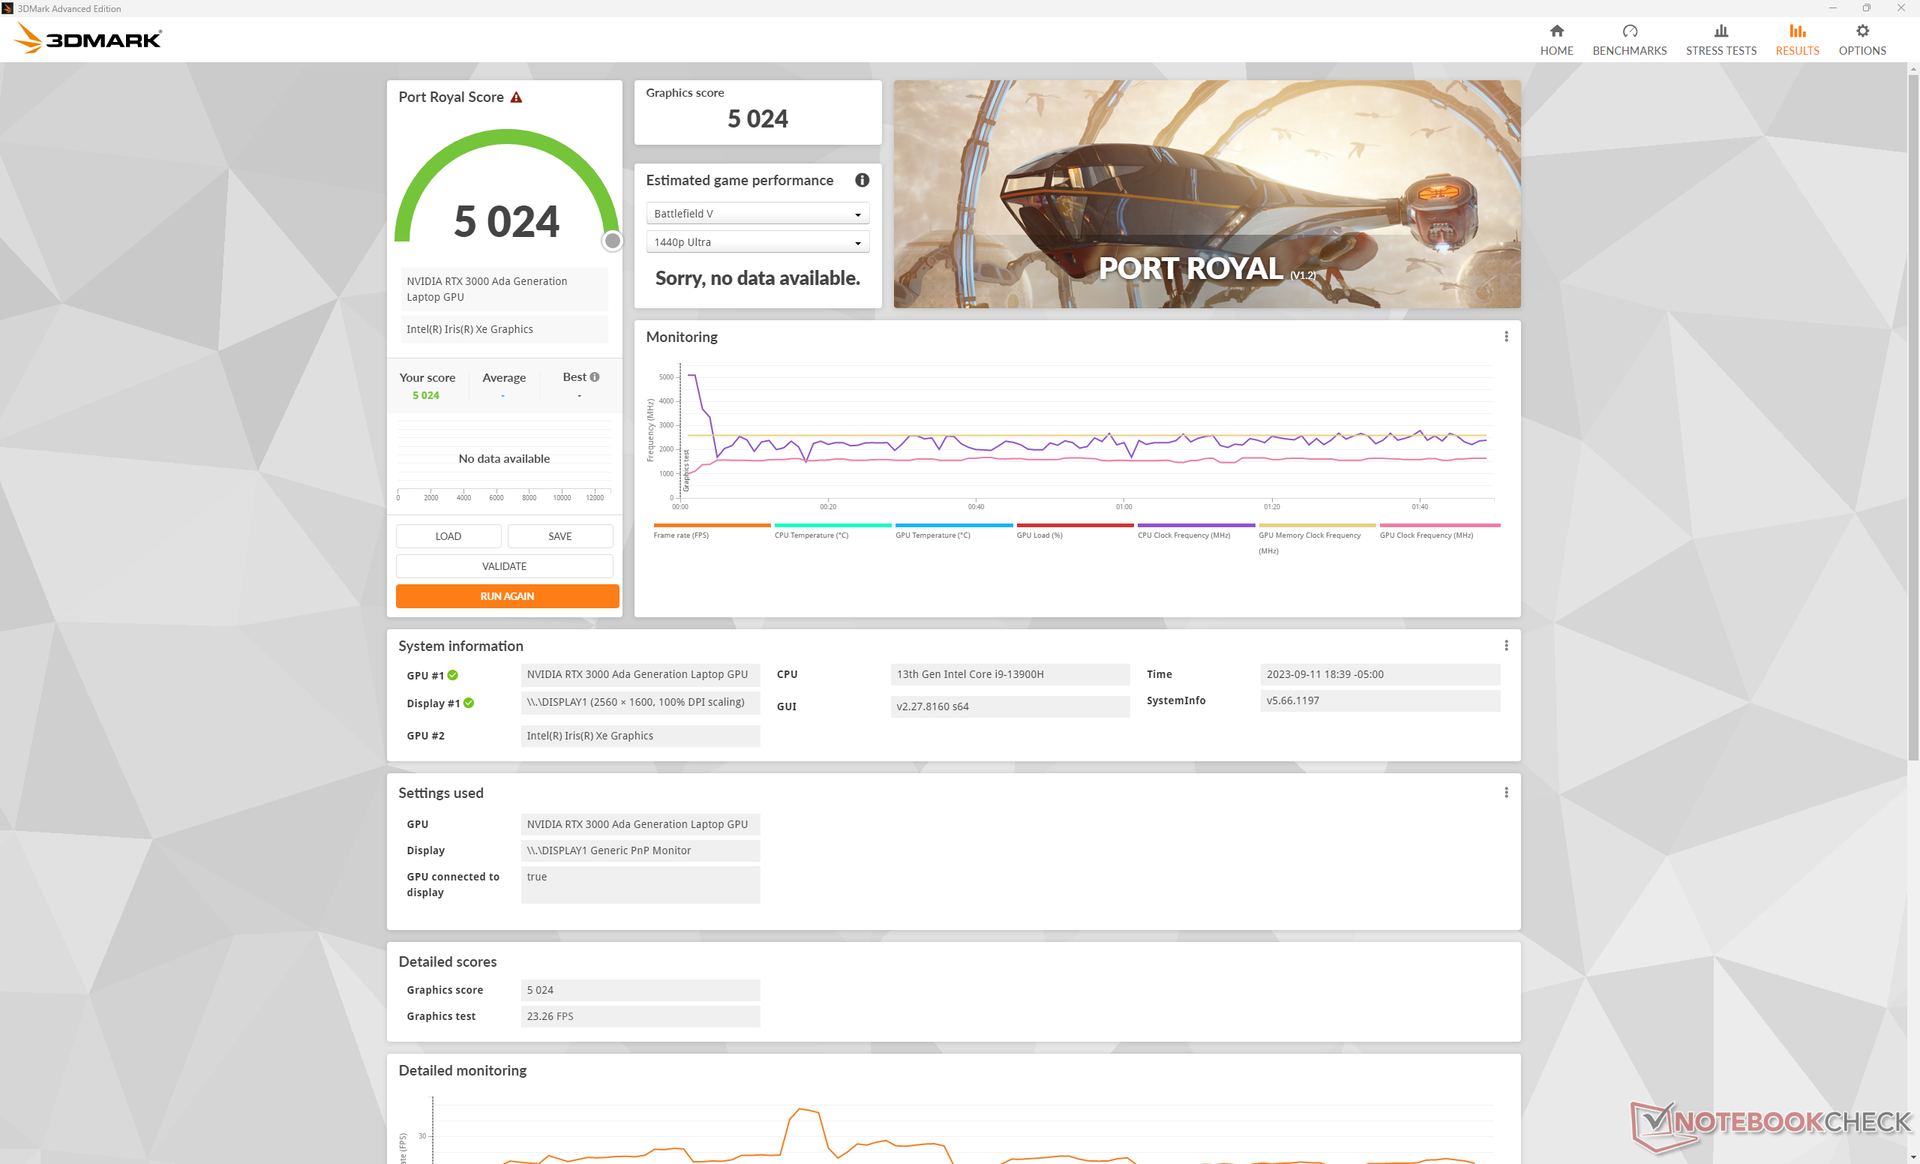
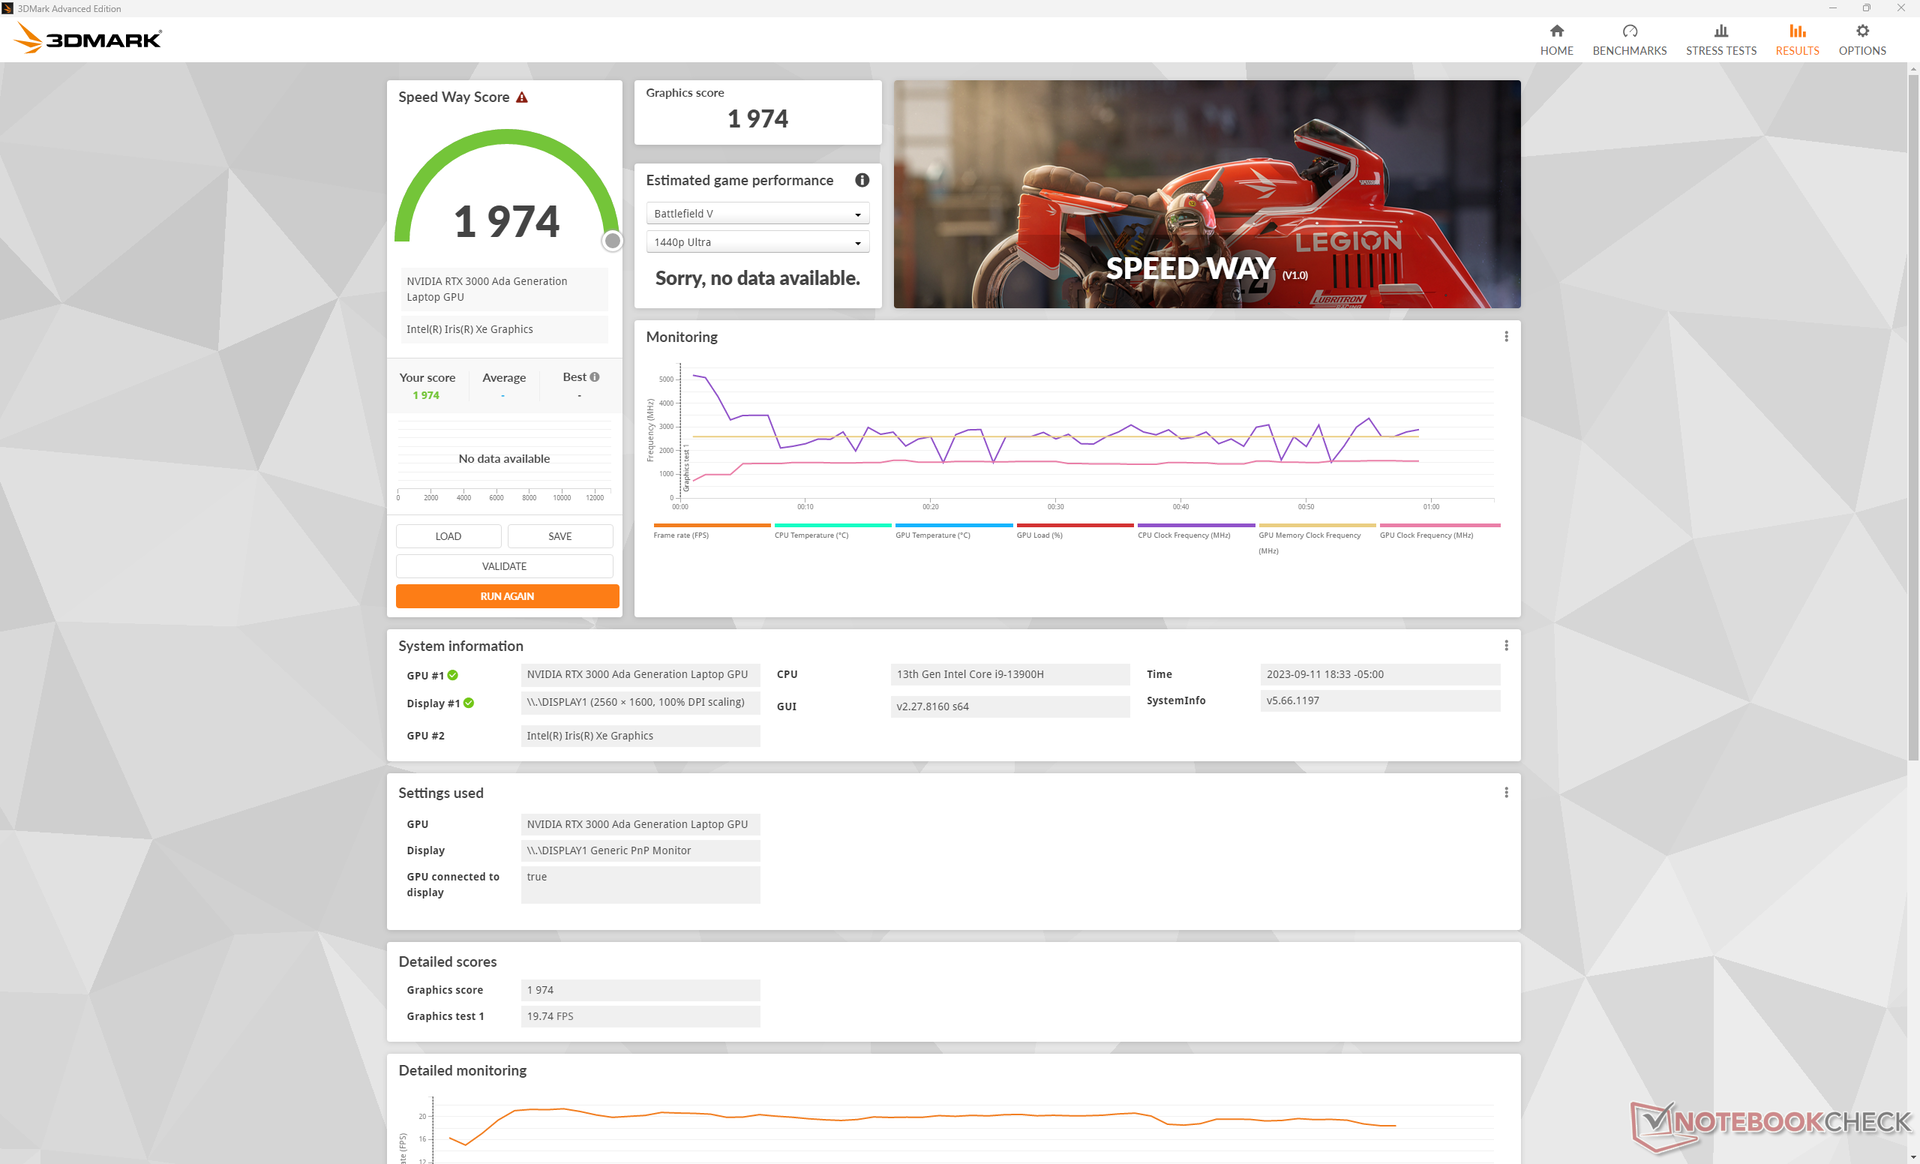
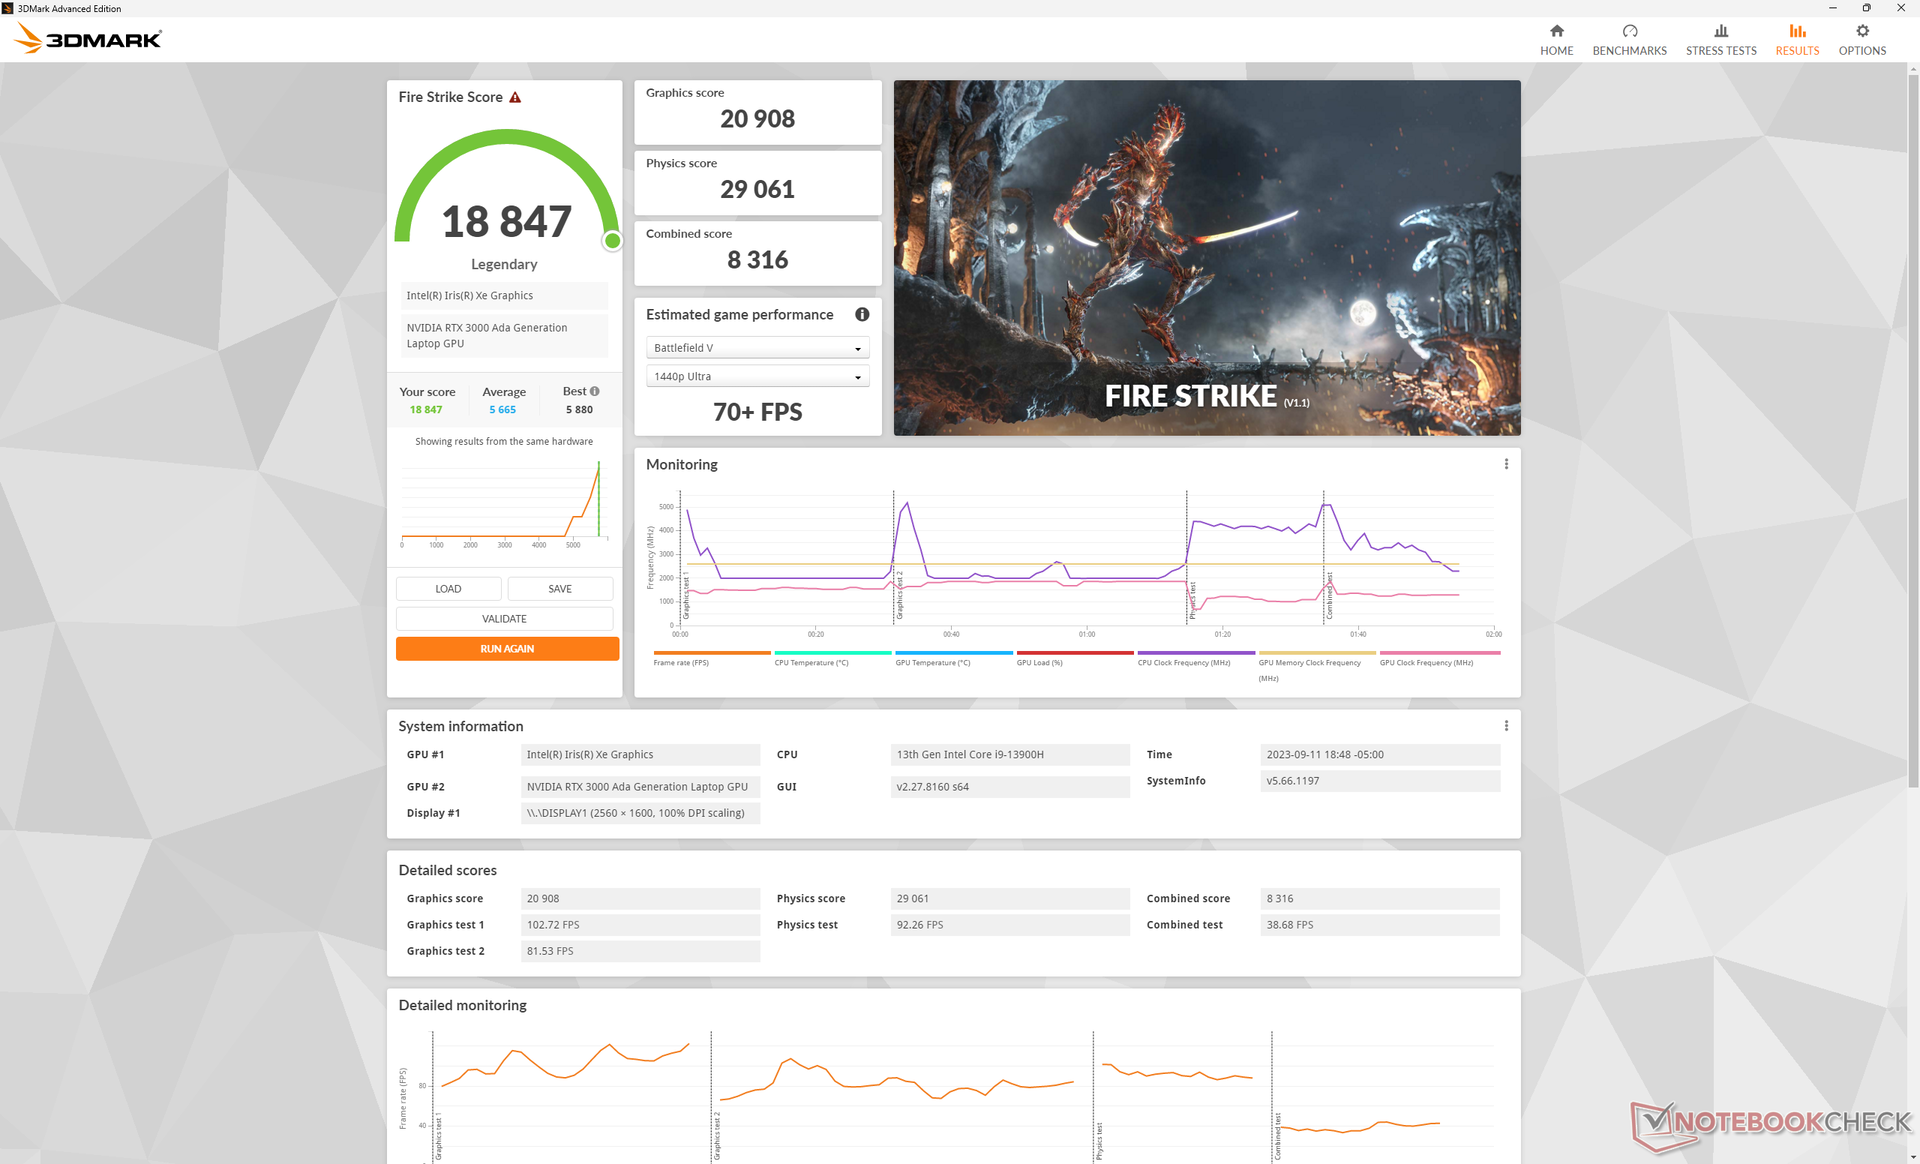
GPU-prestaties
De RTX 3000 Ada is ongeveer 60 tot 80 procent sneller dan de RTX A1000 op de Precision 5470 van vorig jaar of ongeveer 10 tot 15 procent sneller dan de RTX A3000 die hij direct vervangt. De nieuwere GPU mikt op een iets hogere TGP van 50 W, terwijl de GPU in de Precision 5470 beperkt was tot 40 W.
De RTX A1000 van de vorige generatie is nog steeds configureerbaar op de Precision 5480, maar de RTX 3000 Ada wordt sterk aanbevolen vanwege de aanzienlijke prestatieverbeteringen. De nieuwere Ada GPU loopt slechts een beetje achter op de oudere ampère RTX A5500 zoals die te vinden is op veel grotere werkstations zoals deHP ZBook Fury 16 G9.
Het draaien in de Balanced-modus heeft meer invloed op de CPU-prestaties dan op de GPU-prestaties, zoals blijkt uit onze Fire Strike resultaten in de tabel hieronder. De tekorten zijn relatief klein en liggen in de single-digit procentpunten, zelfs als de batterijmodus is ingeschakeld.
Interessant is dat twee SpecViewPerf 12 subtests (energie en medisch) altijd crashten op ons apparaat en daarom zijn deze scores weggelaten uit de onderstaande grafieken.
| Vermogen Profiel | Natuurkunde Score | Grafische Score | Gecombineerde score |
| Prestatiemodus | 29061 | 20908 | 8316 |
| Evenwichtige modus | 26880 (-8%) | 20411 (-2%) | 7633 (-8%) |
| Batterij-modus | 27852 (-4%) | 19755 (-6%) | 7569 (-9%) |
| 3DMark 11 - 1280x720 Performance GPU | |
| Dell Precision 5000 5680 | |
| HP ZBook Fury 16 G9 | |
| Gemiddeld NVIDIA RTX 3000 Ada Generation Laptop (28283 - 33802, n=3) | |
| Dell Precision 5480 | |
| Lenovo ThinkPad P15 G2-20YQ001JGE | |
| Asus ExpertBook B6 Flip B6602FC2 | |
| Dell Precision 5000 5560 | |
| Lenovo ThinkPad P15v G3 21EM001AGE | |
| Dell Precision 5000 5470 | |
| Lenovo ThinkPad P1 G4-20Y4Z9DVUS | |
| Lenovo ThinkPad P15v G2 21A9000XGE | |
| Lenovo ThinkPad P14s G3 AMD 21J6S05000 | |
| HP ZBook Firefly 14 G9-6B8A2EA | |
| 3DMark 11 Performance | 27083 punten | |
| 3DMark Fire Strike Score | 18847 punten | |
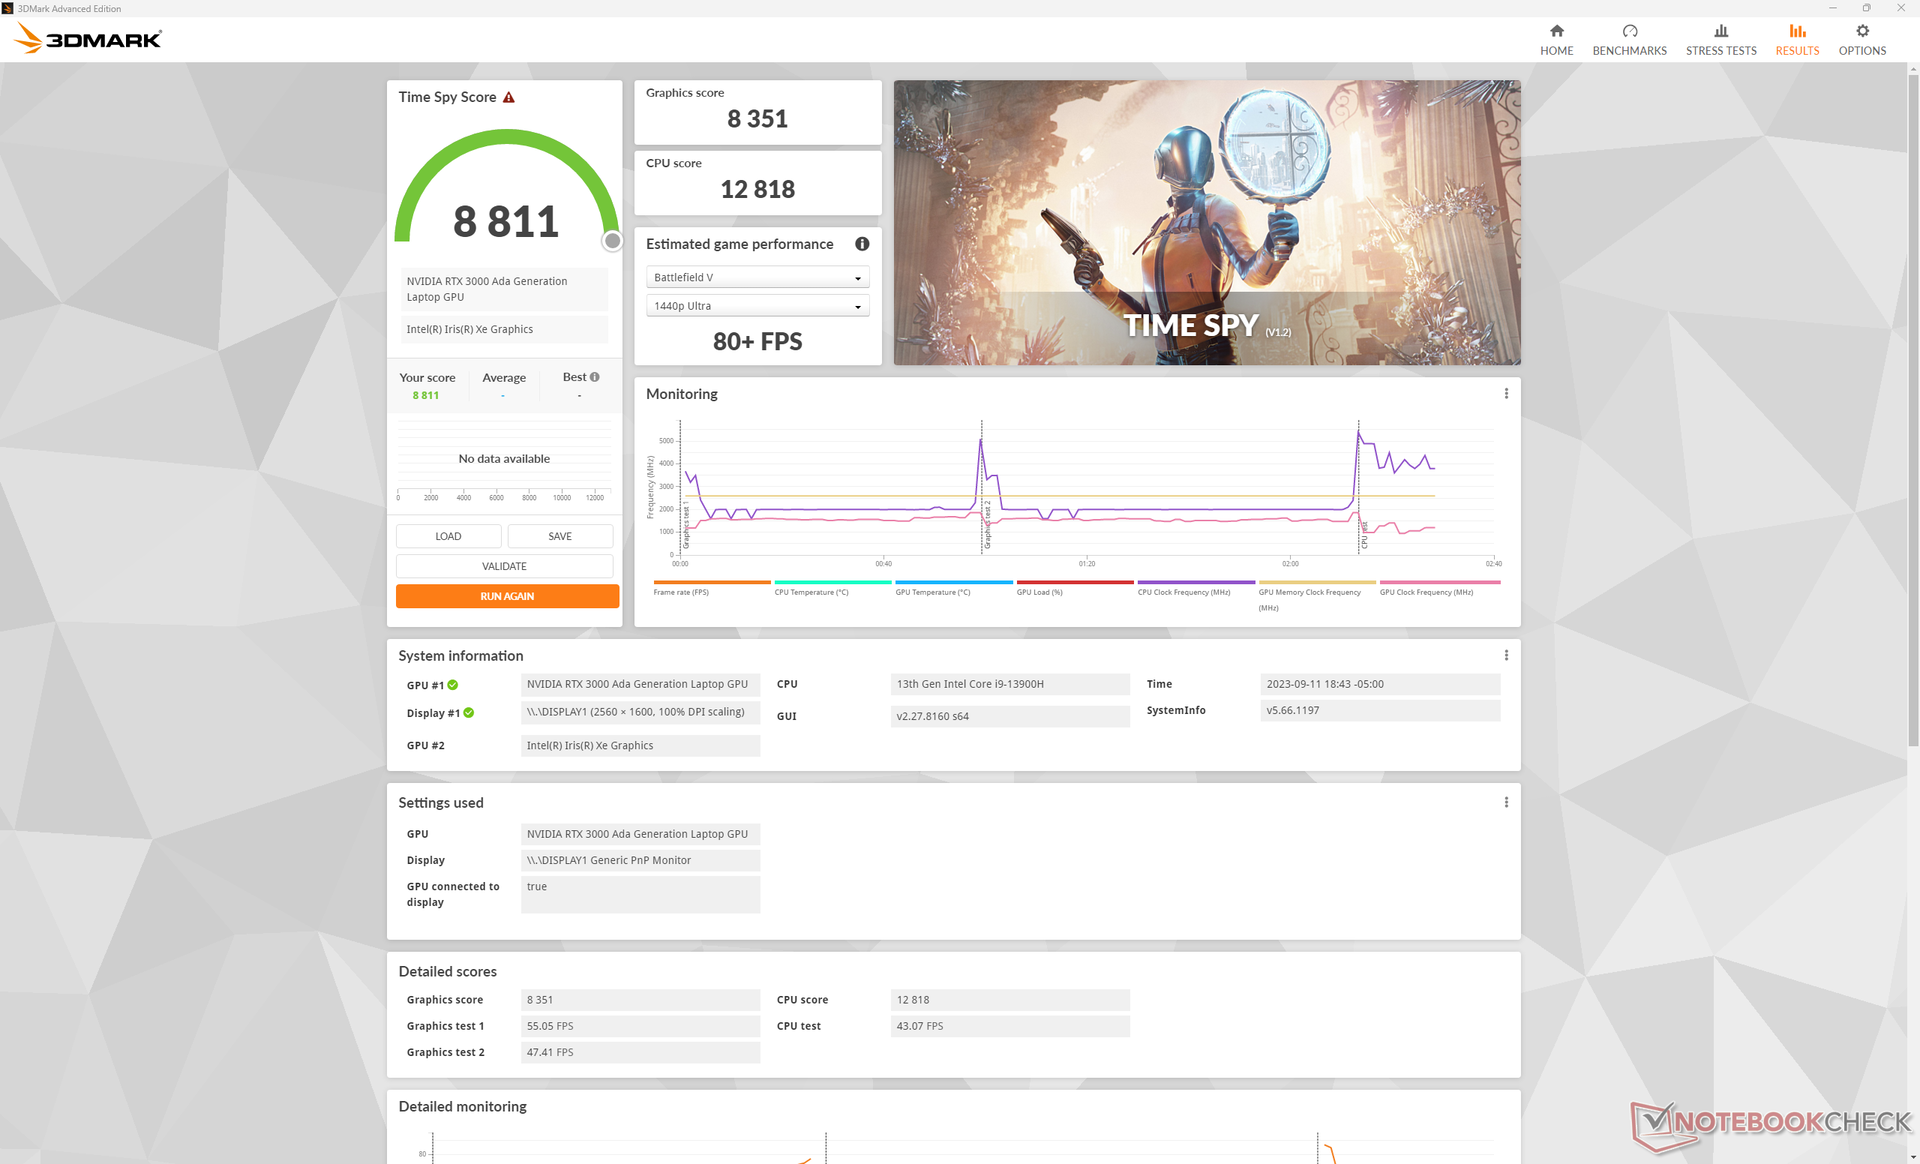
| 3DMark Time Spy Score | 8811 punten | |
Help | ||
* ... kleiner is beter
Spelprestaties
Gamingprestaties komen het meest overeen met laptops die draaien op de GeForce RTX 4060, zoals de recente Inspiron 16 Plus 7630. Ons werkstation kan veeleisende titels zoals Cyberpunk 2077 prima draaien op 1080p, terwijl native QHD+ lagere instellingen of DLSS nodig heeft om de framerates op peil te houden.
Witcher 3 FPS Chart
| lage | gem. | hoge | ultra | |
|---|---|---|---|---|
| GTA V (2015) | 183.2 | 177 | 164.1 | 88.2 |
| The Witcher 3 (2015) | 364.1 | 242.5 | 150.1 | 78.7 |
| Dota 2 Reborn (2015) | 175.7 | 160.8 | 151.5 | 142.9 |
| Final Fantasy XV Benchmark (2018) | 155.1 | 108 | 78.9 | |
| X-Plane 11.11 (2018) | 152 | 126.8 | 102 | |
| Far Cry 5 (2018) | 155 | 116 | 106 | 101 |
| Strange Brigade (2018) | 400 | 191.3 | 160.1 | 140.7 |
| Cyberpunk 2077 1.6 (2022) | 92.3 | 72.4 | 61.2 | 56.2 |
| Tiny Tina's Wonderlands (2022) | 156 | 131.4 | 88 | 69 |
| F1 22 (2022) | 162.7 | 159.6 | 133.4 | 51.1 |
Uitstoot
Systeemgeluid
Het geluid en gedrag van de ventilator is niet echt veranderd ten opzichte van het model van vorig jaar. Hogere belastingen, vergelijkbaar met games, zorgen voor een ventilatorgeluid van iets meer dan 50 dB(A), waarmee dit een van de luidste 14-inch werkstations op de markt is. Interessant is dat dit maximum hetzelfde blijft tussen de Balanced en Performance modi en dat er dus weinig tot geen voordeel is van het draaien in de Balanced modus op het gebied van geluid.
Geluidsniveau
| Onbelast |
| 23.5 / 23.5 / 23.5 dB (A) |
| Belasting |
| 39.9 / 51 dB (A) |
 | ||
30 dB stil 40 dB(A) hoorbaar 50 dB(A) luid |
||
min: | ||
| Dell Precision 5480 RTX 3000 Ada Generation Laptop, i9-13900H, Samsung PM9A1 MZVL21T0HCLR | Dell Precision 5000 5470 RTX A1000 Laptop GPU, i9-12900H, Samsung PM9A1 MZVL21T0HCLR | Dell Precision 5000 5560 RTX A2000 Laptop GPU, i7-11850H, Samsung PM9A1 MZVL22T0HBLB | Lenovo ThinkPad P14s G3 AMD 21J6S05000 Radeon 680M, R7 PRO 6850U, Samsung PM9A1 MZVL21T0HCLR | HP ZBook Firefly 14 G9-6B8A2EA T550 Laptop GPU, i7-1265U, Micron 3400 1TB MTFDKBA1T0TFH | Lenovo ThinkPad P15v G3 21EM001AGE RTX A2000 Laptop GPU, R7 PRO 6850H, SK Hynix PC711 1TB HFS001TDE9X081N | |
|---|---|---|---|---|---|---|
| Noise | -2% | 11% | 11% | 4% | 9% | |
| uit / omgeving * (dB) | 23.5 | 23 2% | 23.4 -0% | 22.9 3% | 23.6 -0% | 23.2 1% |
| Idle Minimum * (dB) | 23.5 | 23.3 1% | 23.6 -0% | 22.9 3% | 23.6 -0% | 23.2 1% |
| Idle Average * (dB) | 23.5 | 23.3 1% | 23.6 -0% | 22.9 3% | 23.6 -0% | 23.2 1% |
| Idle Maximum * (dB) | 23.5 | 23.3 1% | 23.6 -0% | 22.9 3% | 23.6 -0% | 23.2 1% |
| Load Average * (dB) | 39.9 | 48.5 -22% | 25.8 35% | 30.8 23% | 42.5 -7% | 35 12% |
| Witcher 3 ultra * (dB) | 50.1 | 48.6 3% | 40.1 20% | 39.4 21% | 42.5 15% | 37.9 24% |
| Load Maximum * (dB) | 51 | 50.4 1% | 41.4 19% | 39.5 23% | 42.5 17% | 37.5 26% |
* ... kleiner is beter
Temperatuur
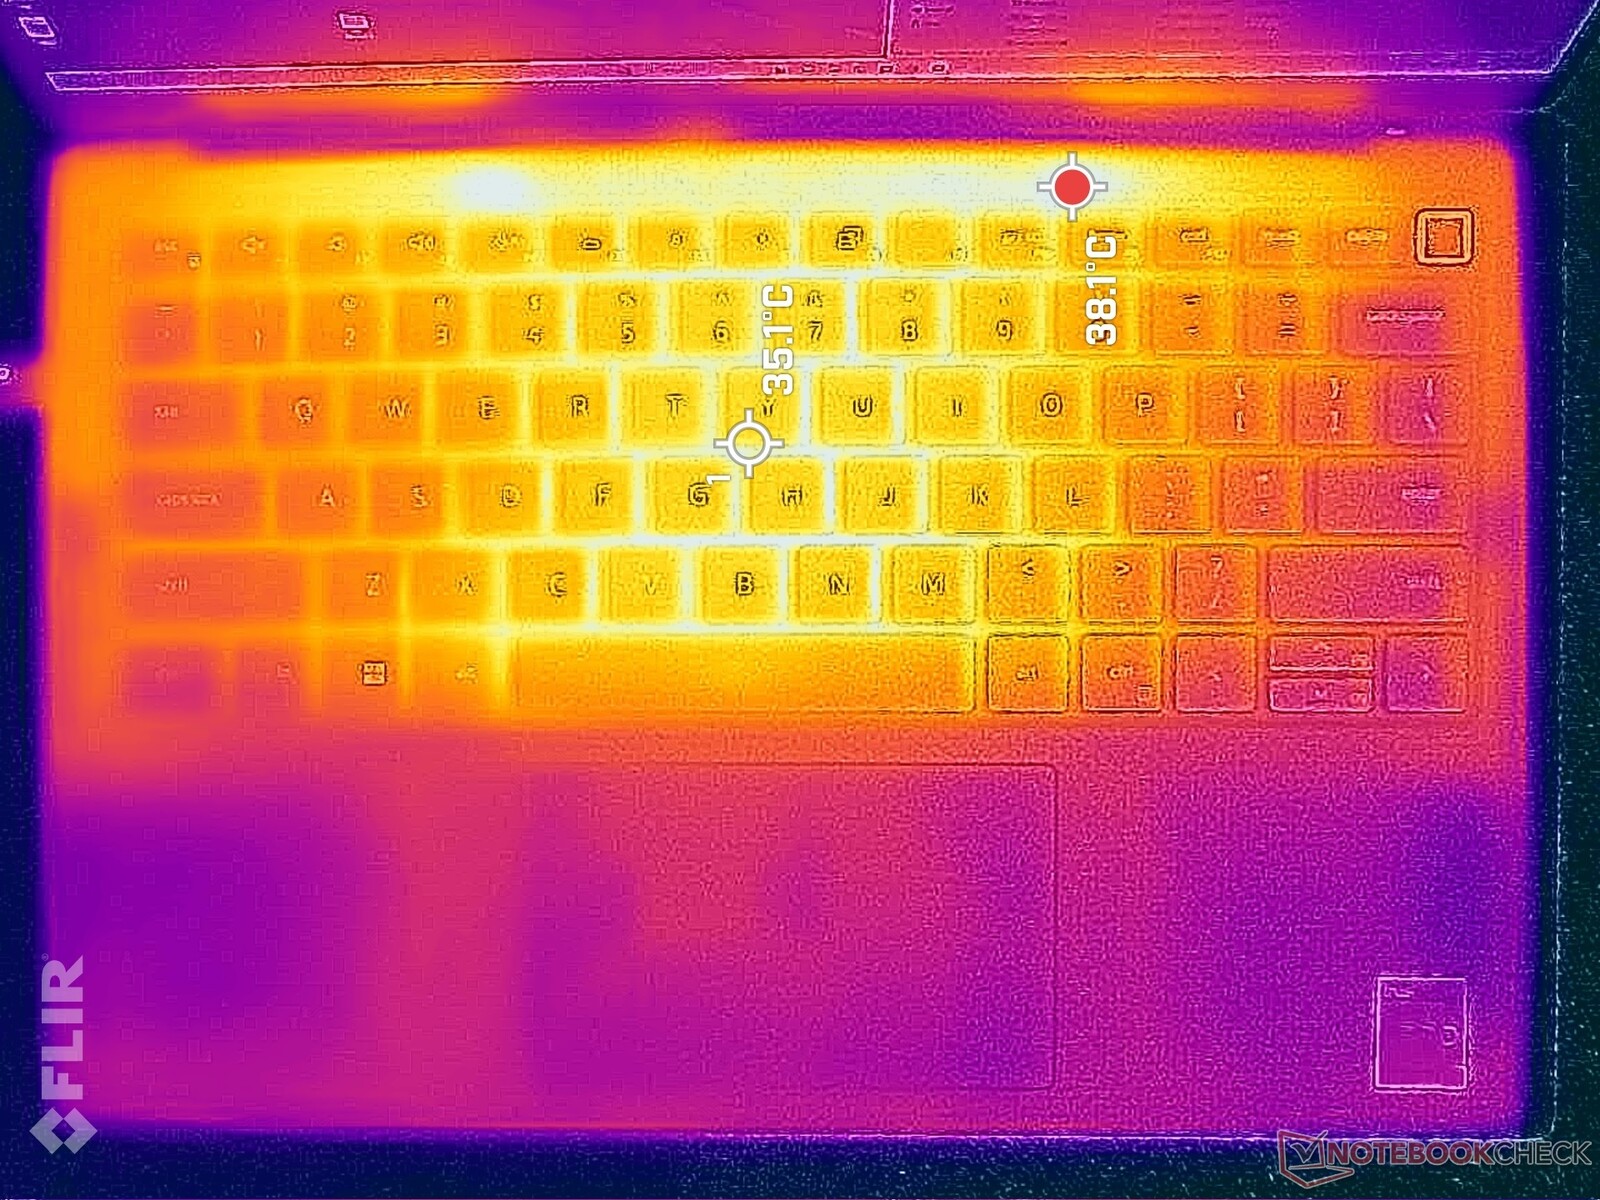
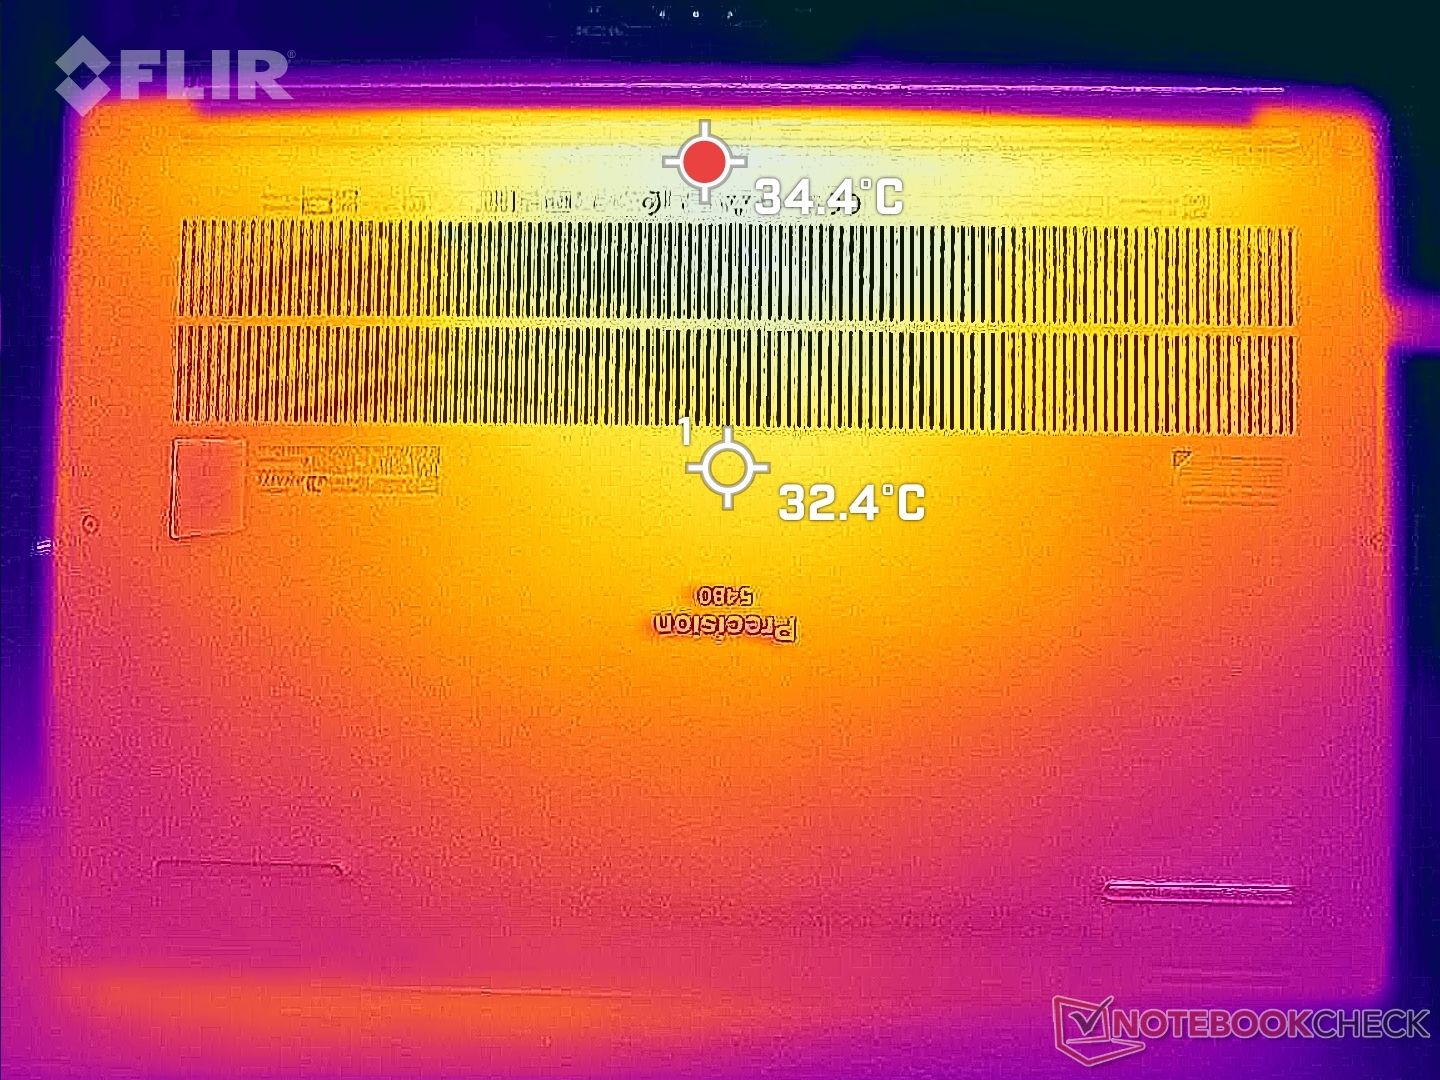
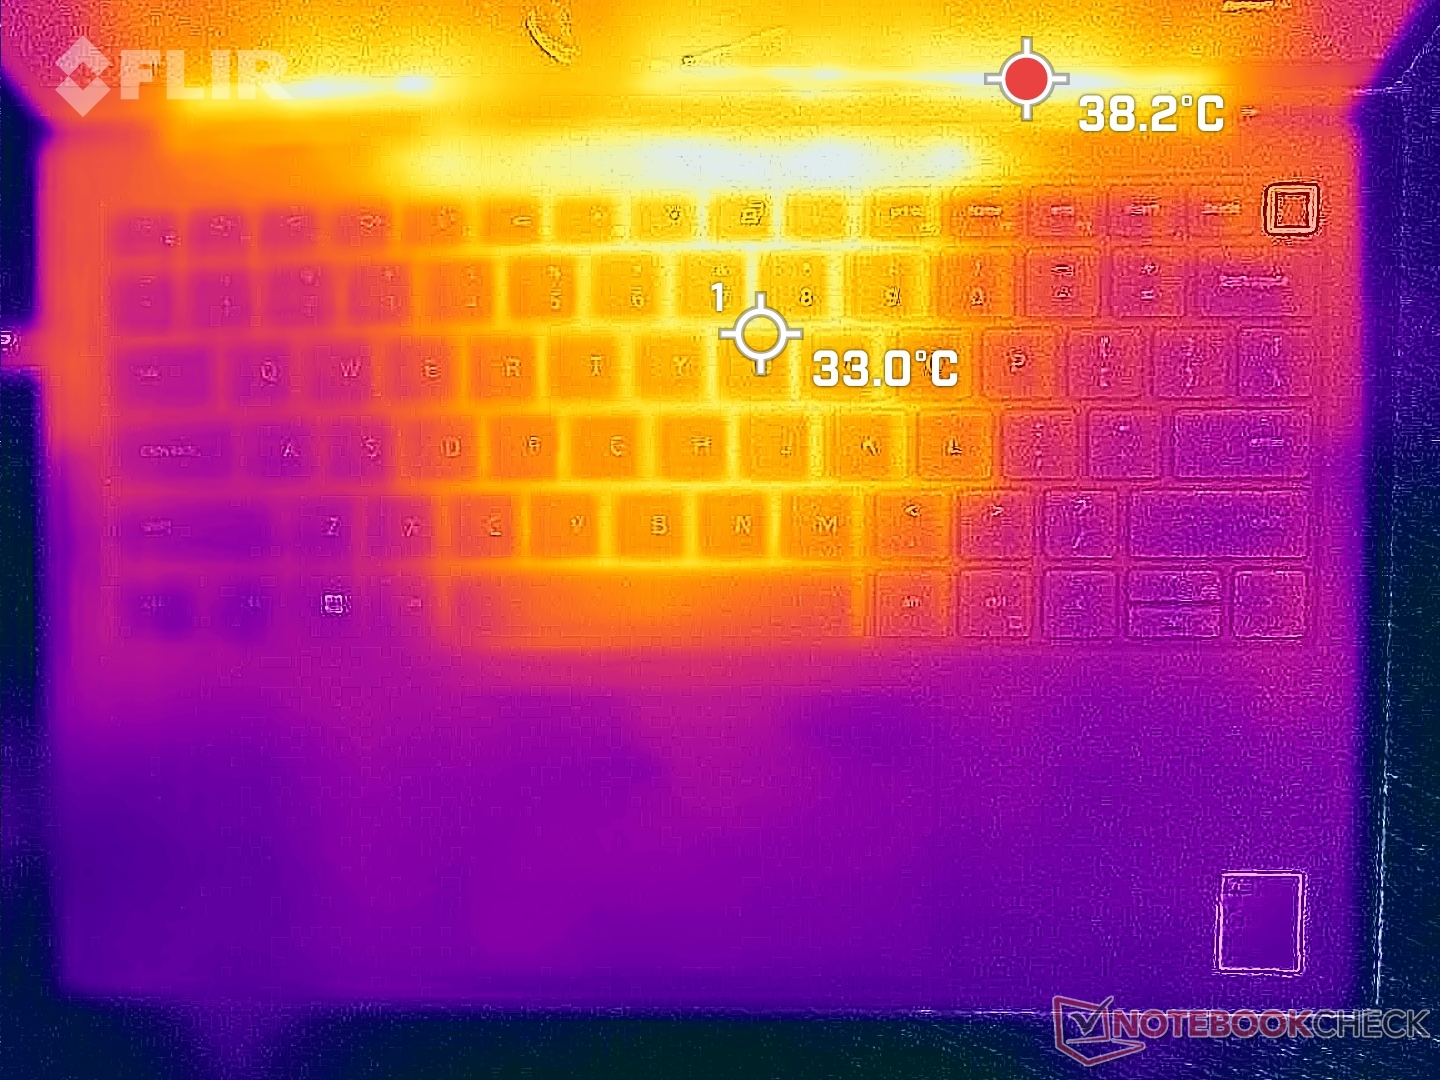
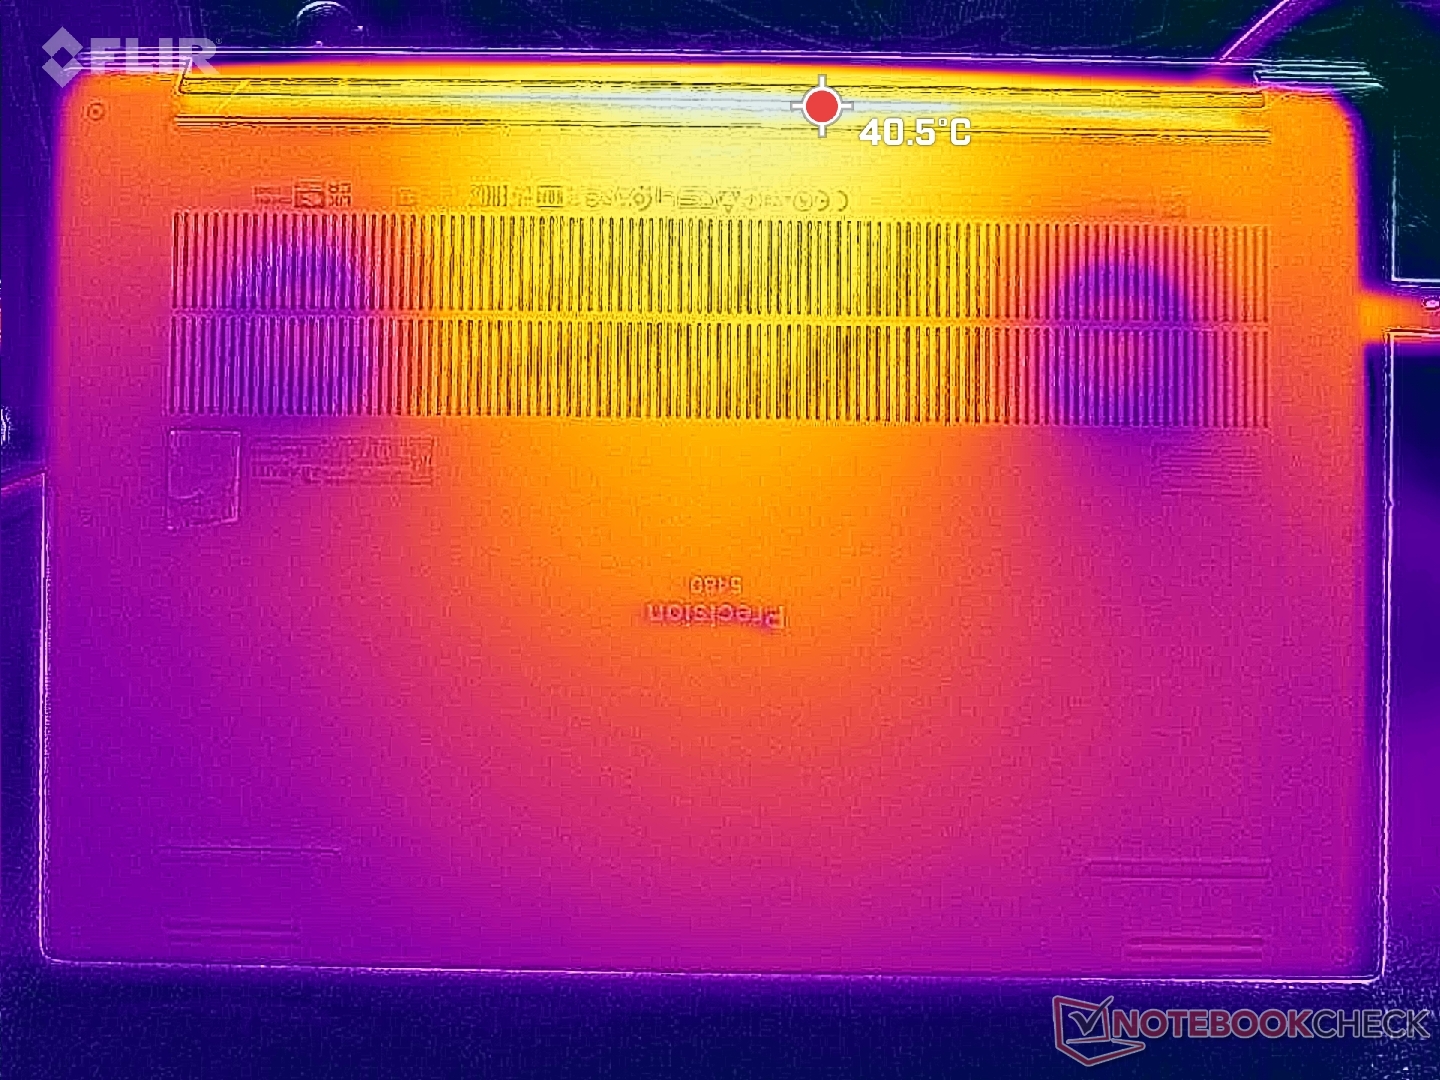
De oppervlaktetemperaturen zijn warmer dan normaal in het midden van het apparaat wanneer het stationair draait op de desktop vanwege de inerte ventilatoren. De prijs voor stilte bij het uitvoeren van niet-veeleisende belastingen is dus een warme oppervlaktetemperatuur die sommige gebruikers wel of niet stoort.
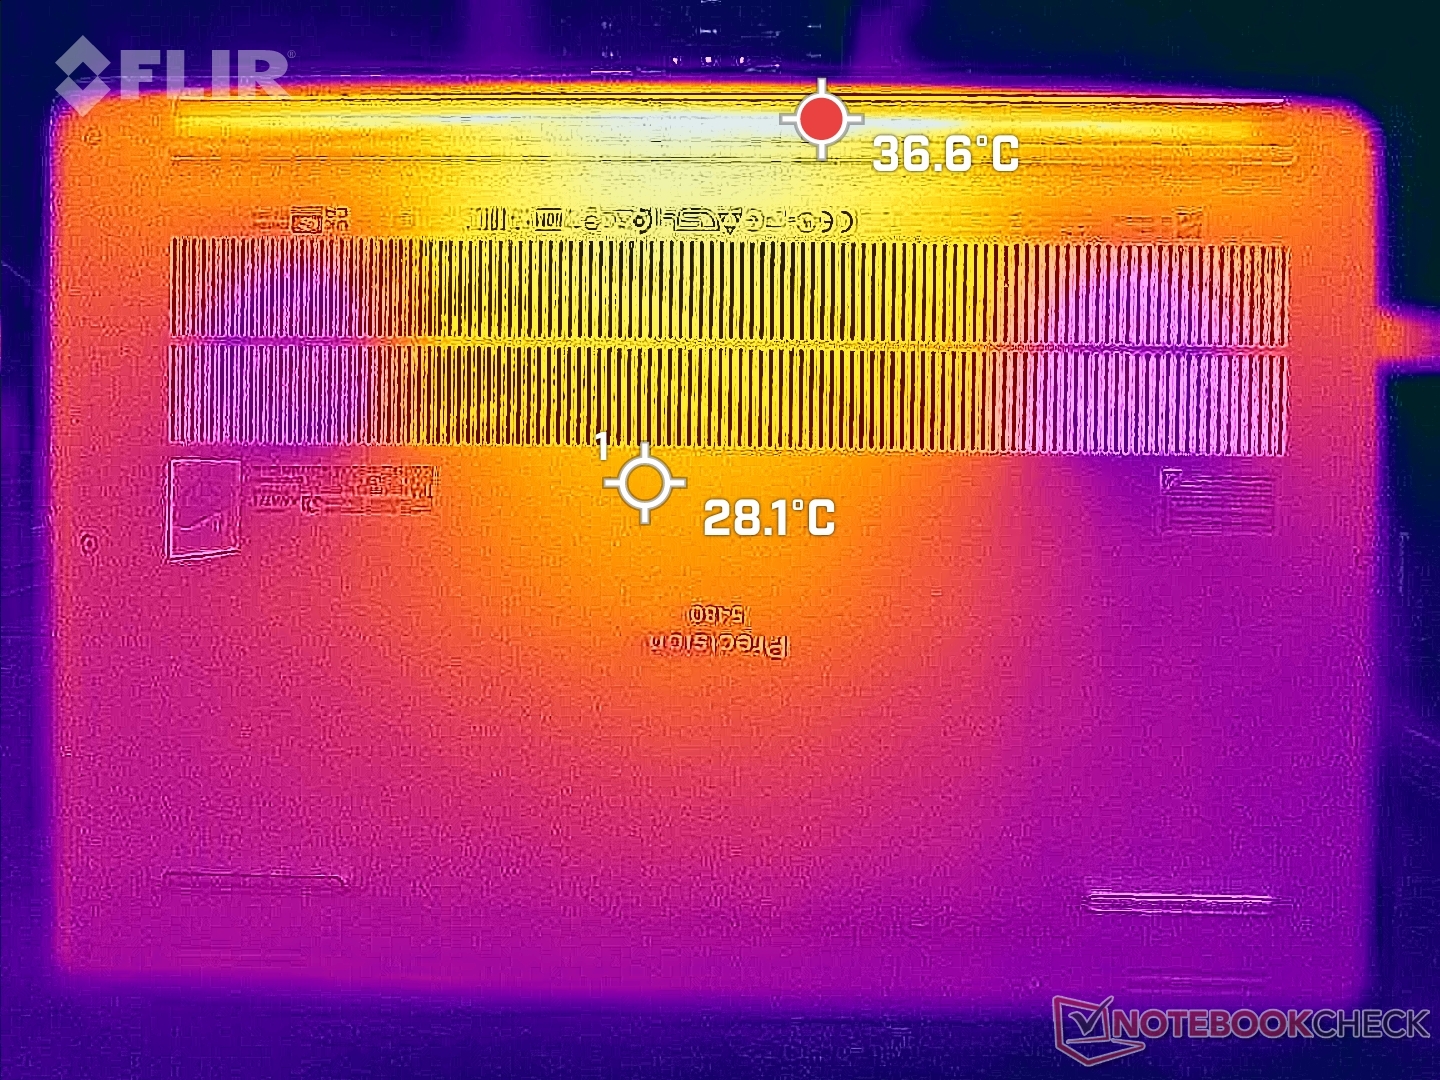
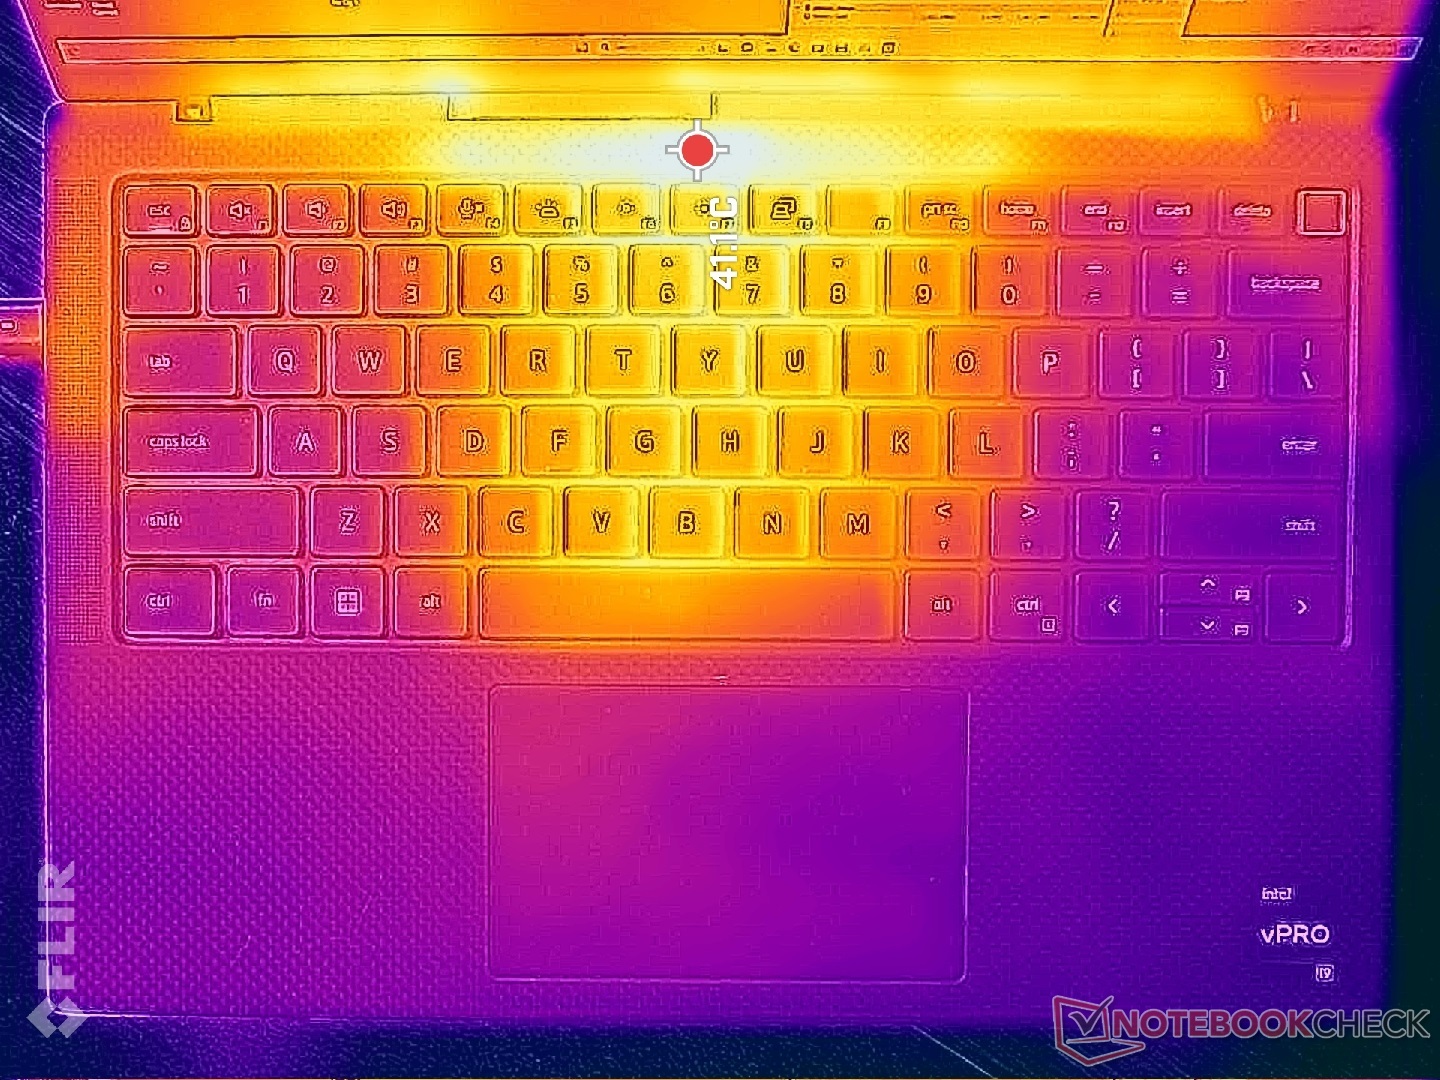
Hete plekken kunnen oplopen tot meer dan 40 C aan de boven- en onderkant van de behuizing wanneer Prime95 en FurMark tegelijkertijd worden uitgevoerd. Ze zijn geconcentreerd aan de achterkant van het apparaat, zodat de koolstofvezel palmsteunen nog steeds comfortabel aanvoelen, maar het grootste deel van de metalen onderkant zal erg warm zijn.
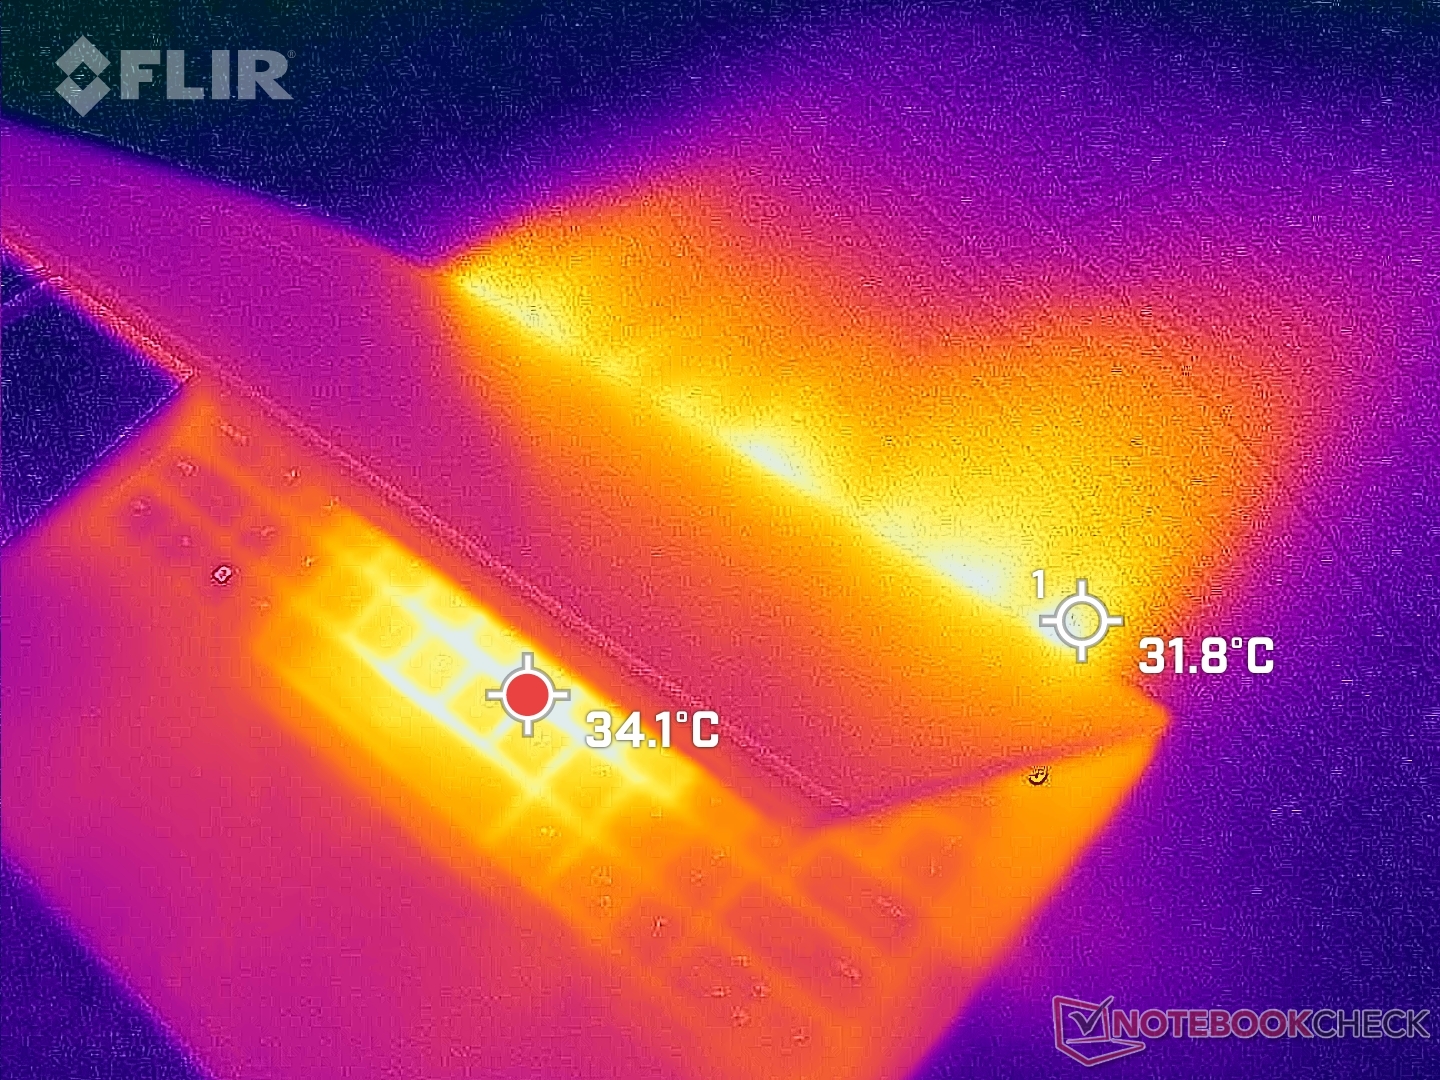
(±) De maximumtemperatuur aan de bovenzijde bedraagt 44 °C / 111 F, vergeleken met het gemiddelde van 38.2 °C / 101 F, variërend van 22.2 tot 69.8 °C voor de klasse Workstation.
(+) De bodem warmt op tot een maximum van 38.2 °C / 101 F, vergeleken met een gemiddelde van 41.1 °C / 106 F
(±) Bij onbelast gebruik bedraagt de gemiddelde temperatuur voor de bovenzijde 34.2 °C / 94 F, vergeleken met het apparaatgemiddelde van 32 °C / 90 F.
(±) Bij het spelen van The Witcher 3 is de gemiddelde temperatuur voor de bovenzijde 32 °C / 90 F, vergeleken met het apparaatgemiddelde van 32 °C / 90 F.
(+) De palmsteunen en het touchpad zijn met een maximum van ###max## °C / 85.3 F koeler dan de huidtemperatuur en voelen daarom koel aan.
(±) De gemiddelde temperatuur van de handpalmsteun van soortgelijke toestellen bedroeg 27.8 °C / 82 F (-1.8 °C / -3.3 F).
| Dell Precision 5480 Intel Core i9-13900H, NVIDIA RTX 3000 Ada Generation Laptop | Dell Precision 5000 5470 Intel Core i9-12900H, NVIDIA RTX A1000 Laptop GPU | Dell Precision 5000 5560 Intel Core i7-11850H, NVIDIA RTX A2000 Laptop GPU | Lenovo ThinkPad P14s G3 AMD 21J6S05000 AMD Ryzen 7 PRO 6850U, AMD Radeon 680M | Lenovo ThinkPad P15v G3 21EM001AGE AMD Ryzen 7 PRO 6850H, NVIDIA RTX A2000 Laptop GPU | HP ZBook Firefly 14 G9-6B8A2EA Intel Core i7-1265U, NVIDIA T550 Laptop GPU | |
|---|---|---|---|---|---|---|
| Heat | 9% | -1% | 14% | 7% | 11% | |
| Maximum Upper Side * (°C) | 44 | 41.8 5% | 48.2 -10% | 42.7 3% | 48.7 -11% | 41.2 6% |
| Maximum Bottom * (°C) | 38.2 | 36 6% | 42.6 -12% | 43.1 -13% | 50.5 -32% | 47.9 -25% |
| Idle Upper Side * (°C) | 38.8 | 34.6 11% | 34.8 10% | 25.7 34% | 25 36% | 26.5 32% |
| Idle Bottom * (°C) | 38.6 | 33.6 13% | 35.2 9% | 26.4 32% | 25.4 34% | 27 30% |
* ... kleiner is beter
Stresstest
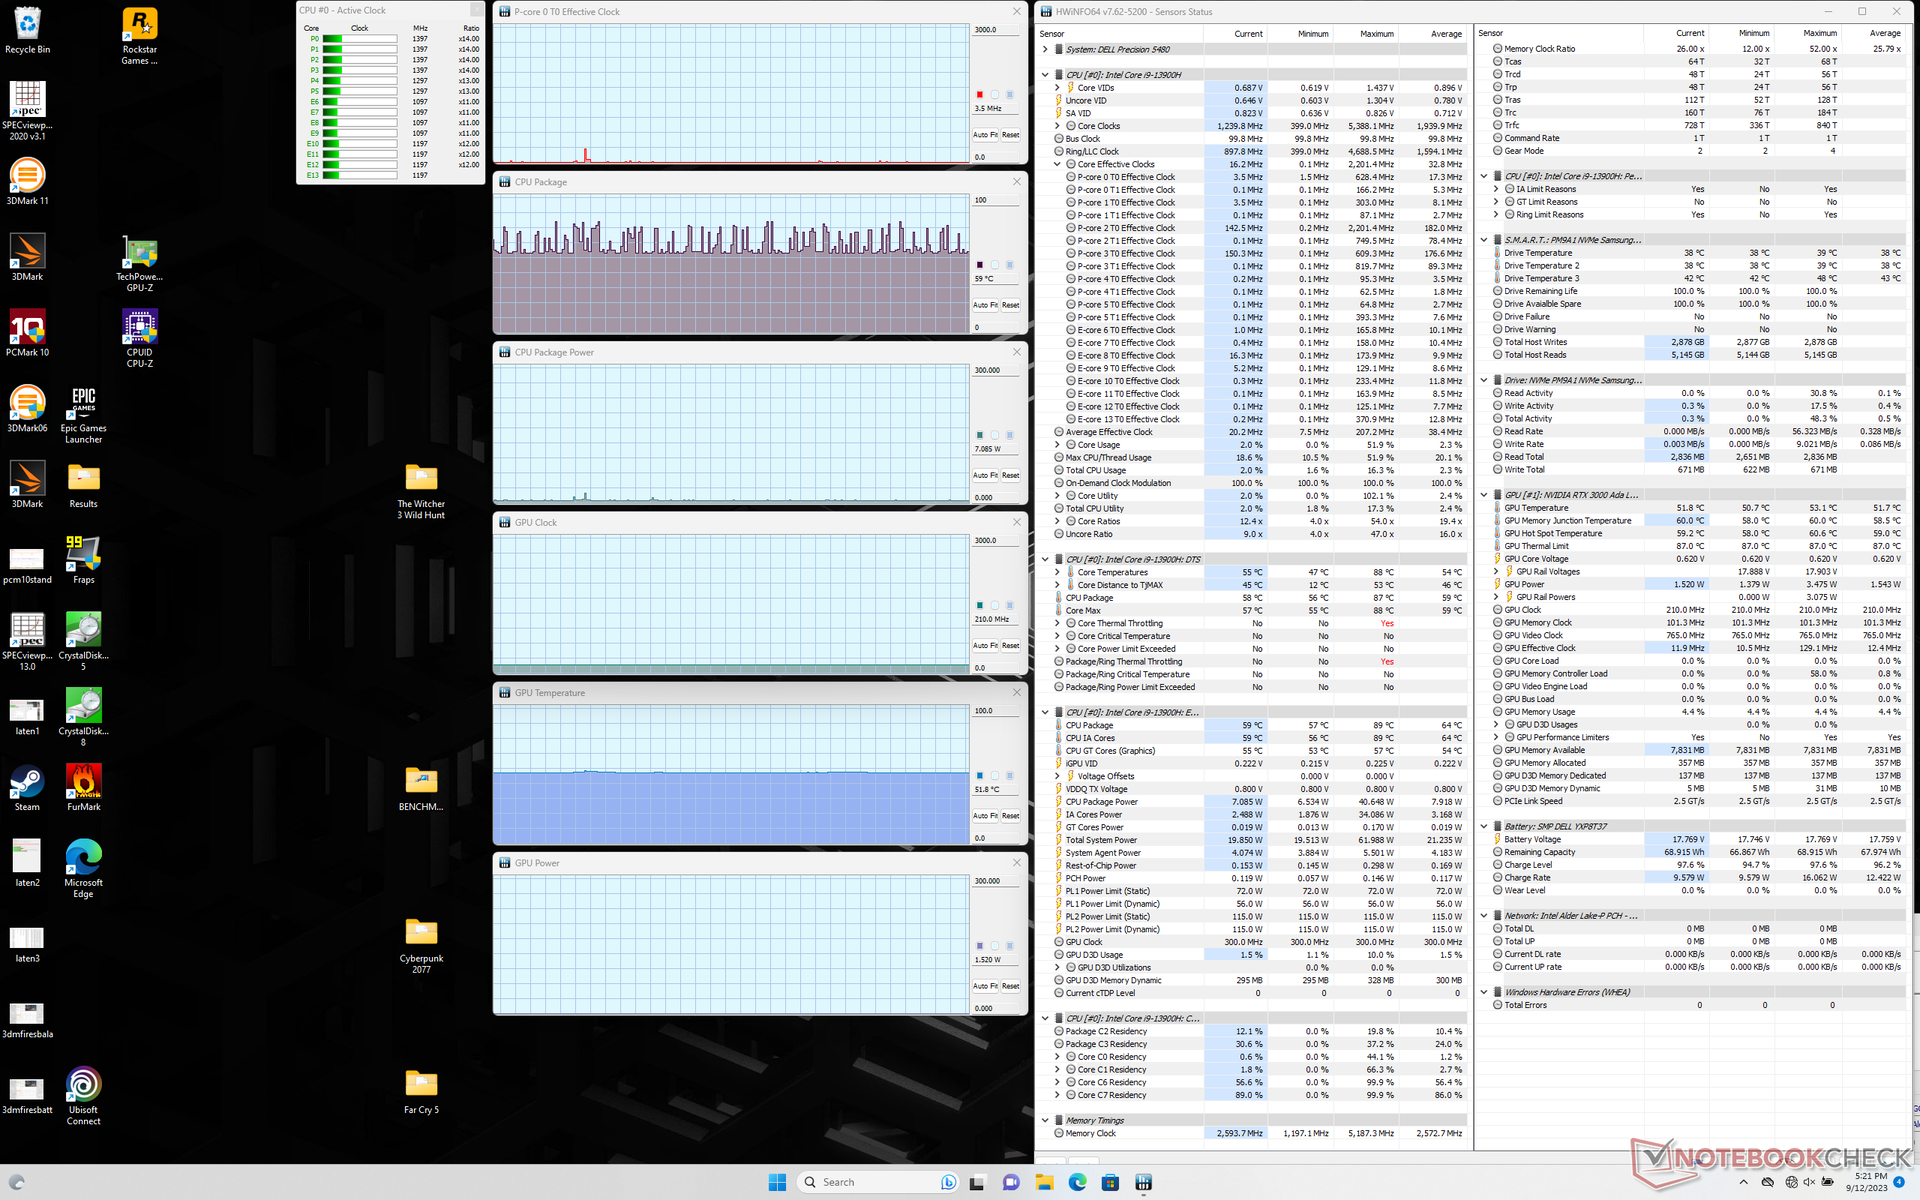
Tijdens het uitvoeren van Prime95 stress piekte de CPU naar 3,4 GHz, 88 W en 100 C gedurende slechts een paar minuten. Uiteindelijk stabiliseerde hij rond 2,4 GHz en 51 W om een iets koelere maar beter beheersbare kerntemperatuur van 93 C te handhaven. De maximale Turbo Boost is dus niet onbeperkt, maar nog steeds behoorlijk goed gezien de kleine vormfactor van 14 inch.
De CPU en GPU stabiliseren zich rond 64 C wanneer ze draaien op Witcher 3 om hoge belastingen weer te geven. Interessant genoeg veranderde dit niet bij het schakelen tussen de Balanced en Performance modi, wat suggereert dat de Balanced modus voldoende zou moeten zijn voor de meeste soorten werkbelasting. Merk op dat het stroomverbruik van de GPU-kaart hoger is met ongeveer 45 W tot 50 W, vergeleken met slechts 36 W op de 5470 van vorig jaar Precision 5470. De kerntemperaturen zouden desondanks koeler zijn dan bij het model van vorig jaar bij een vergelijkbare belasting door gaming.
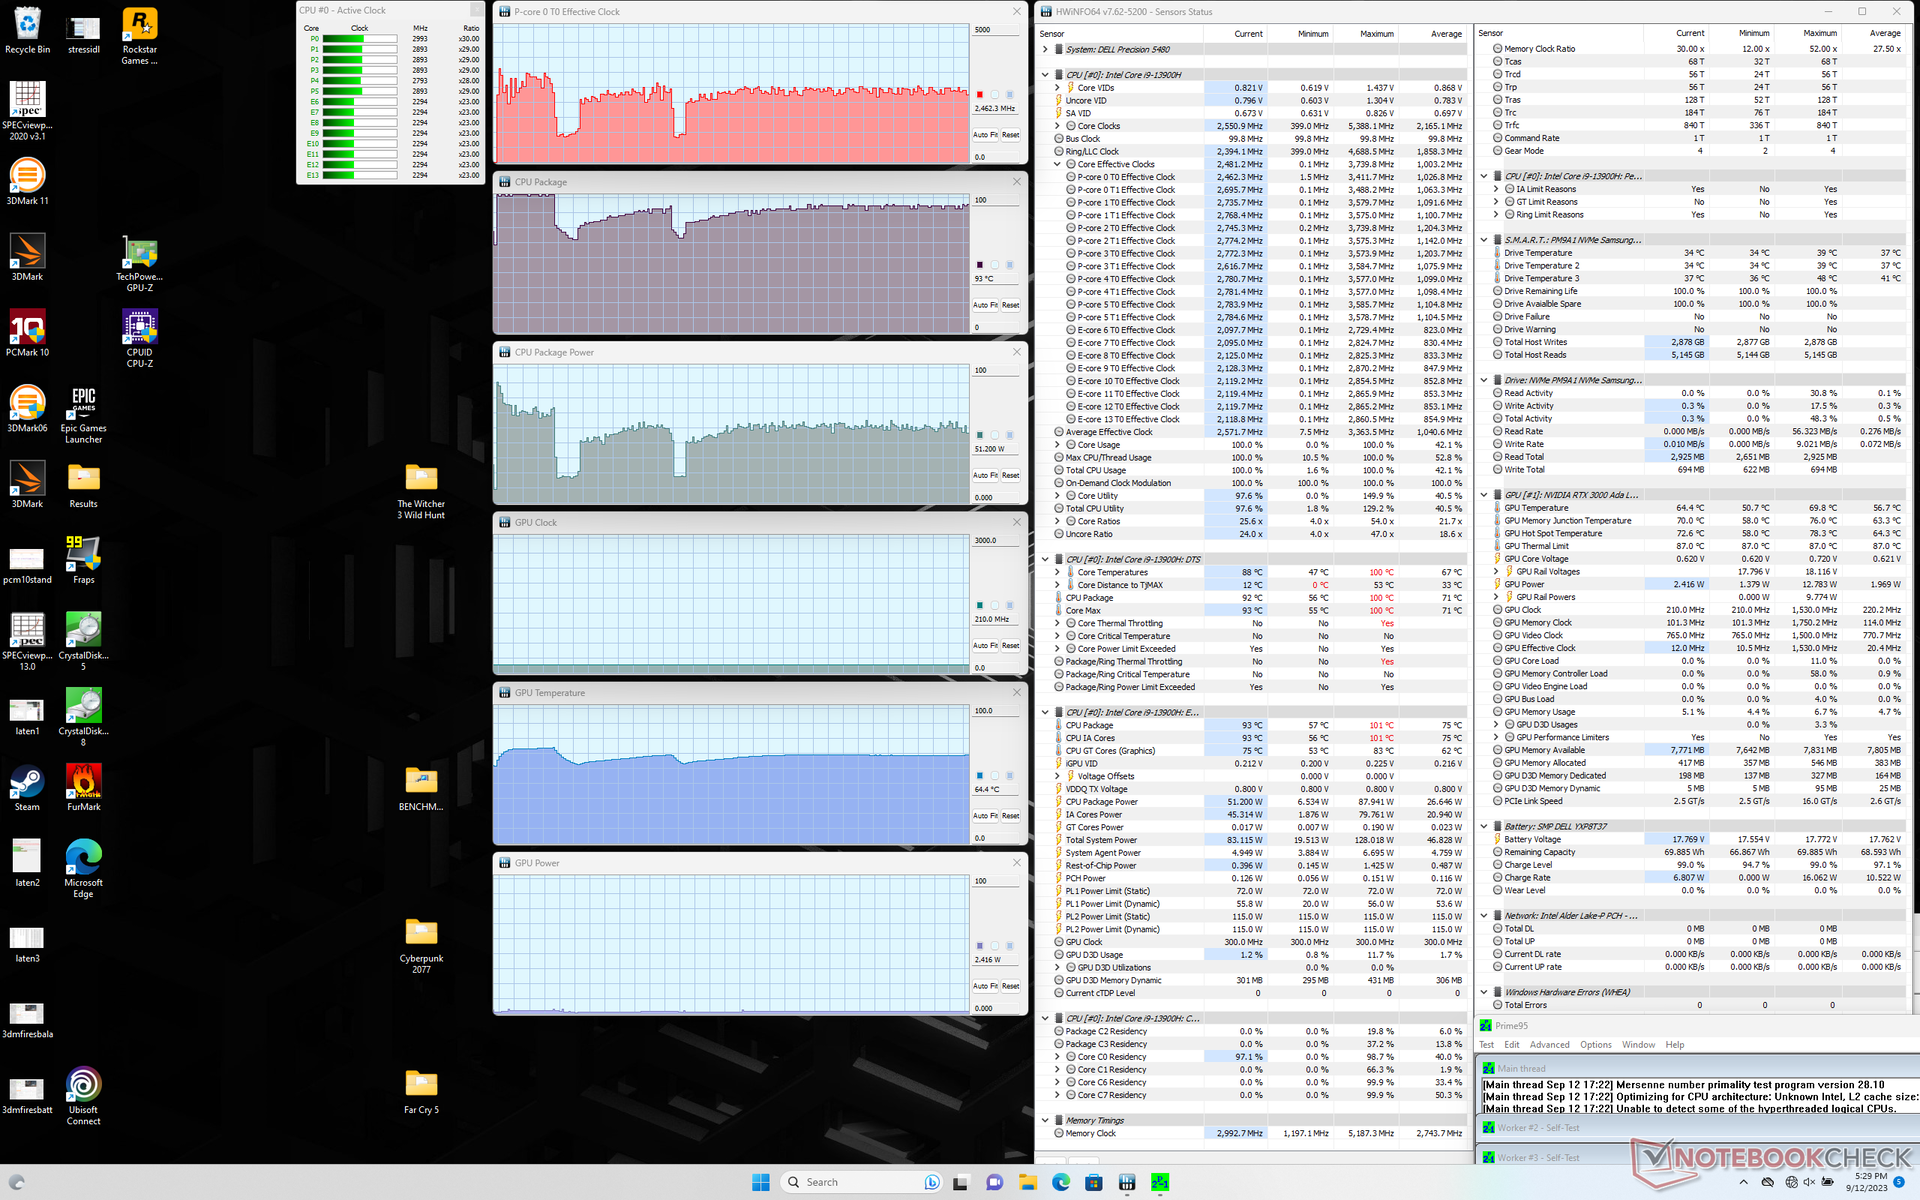
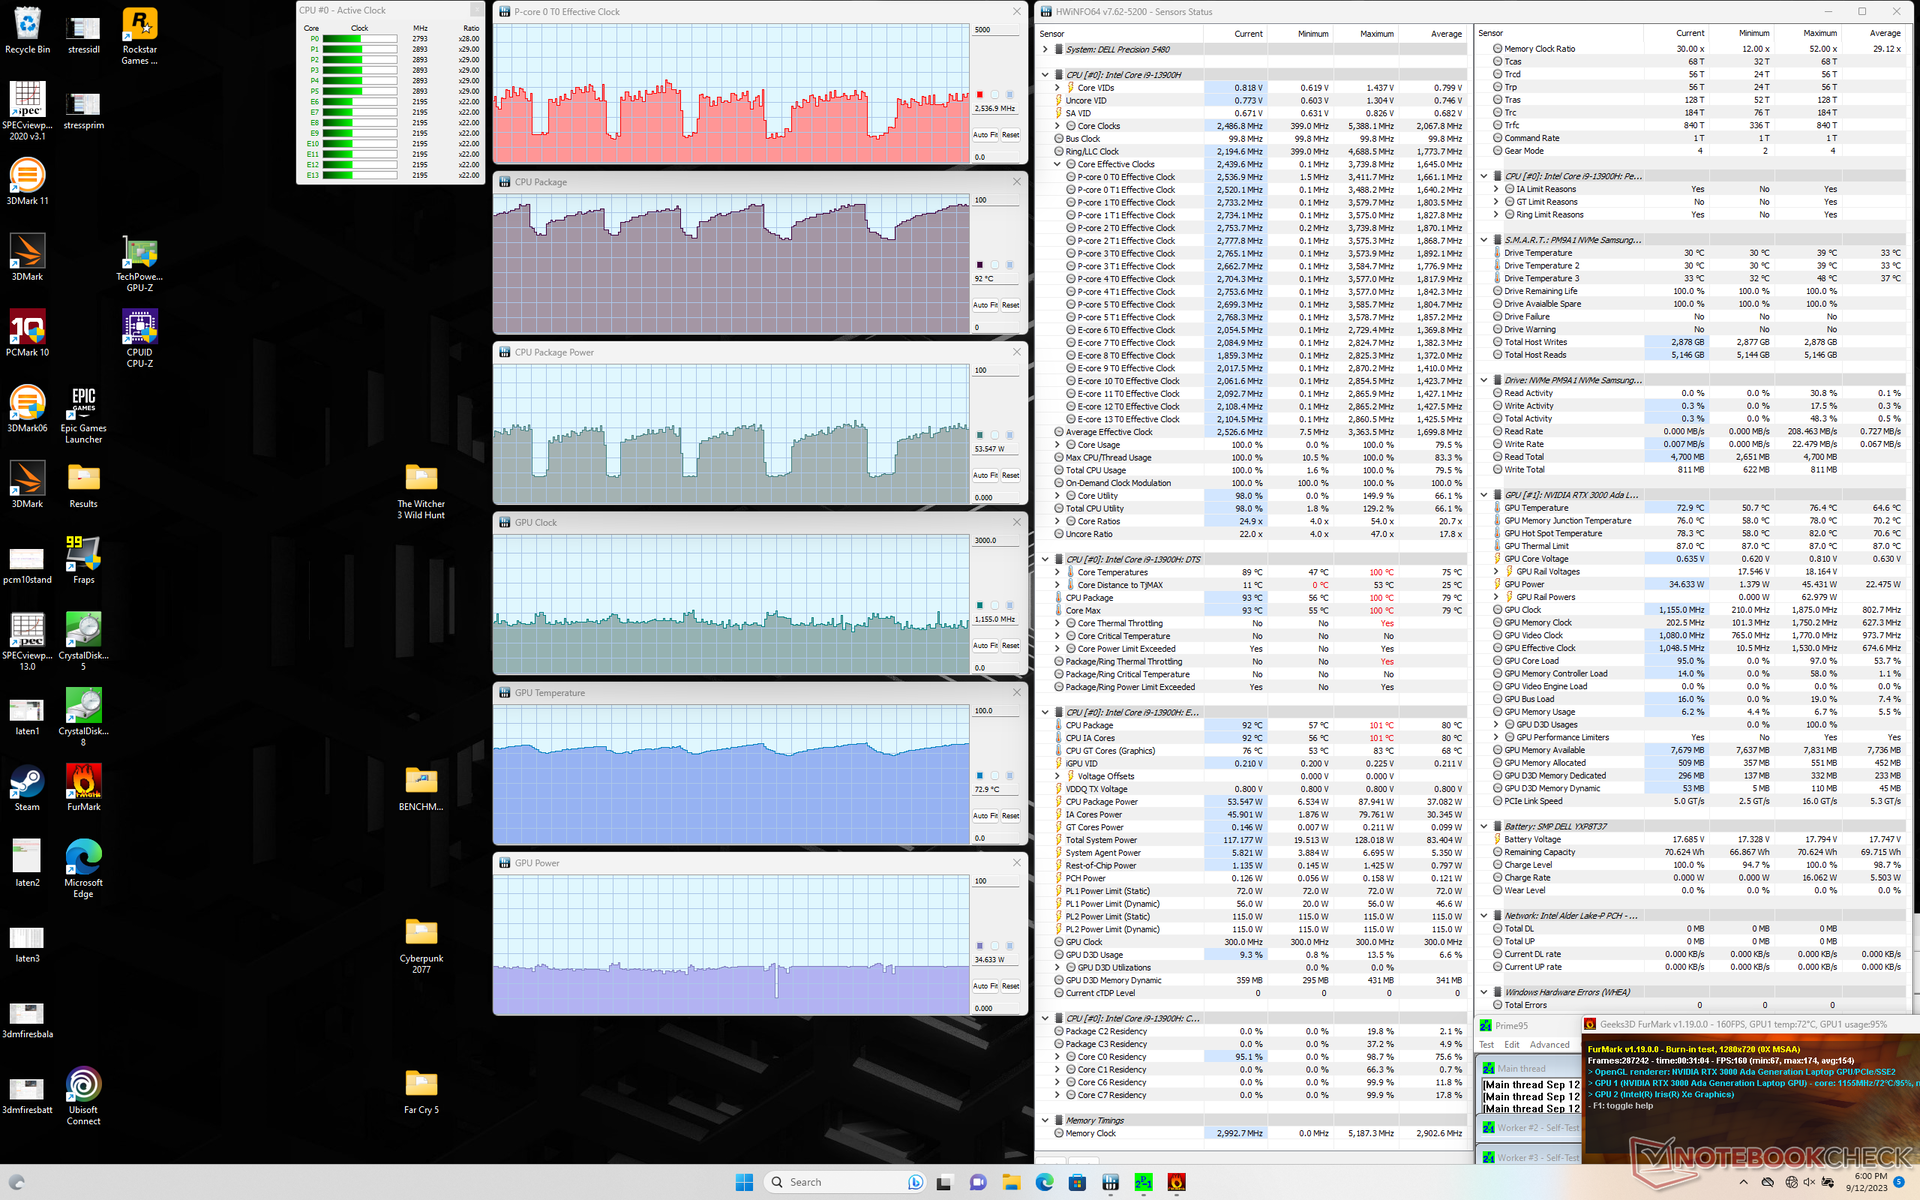
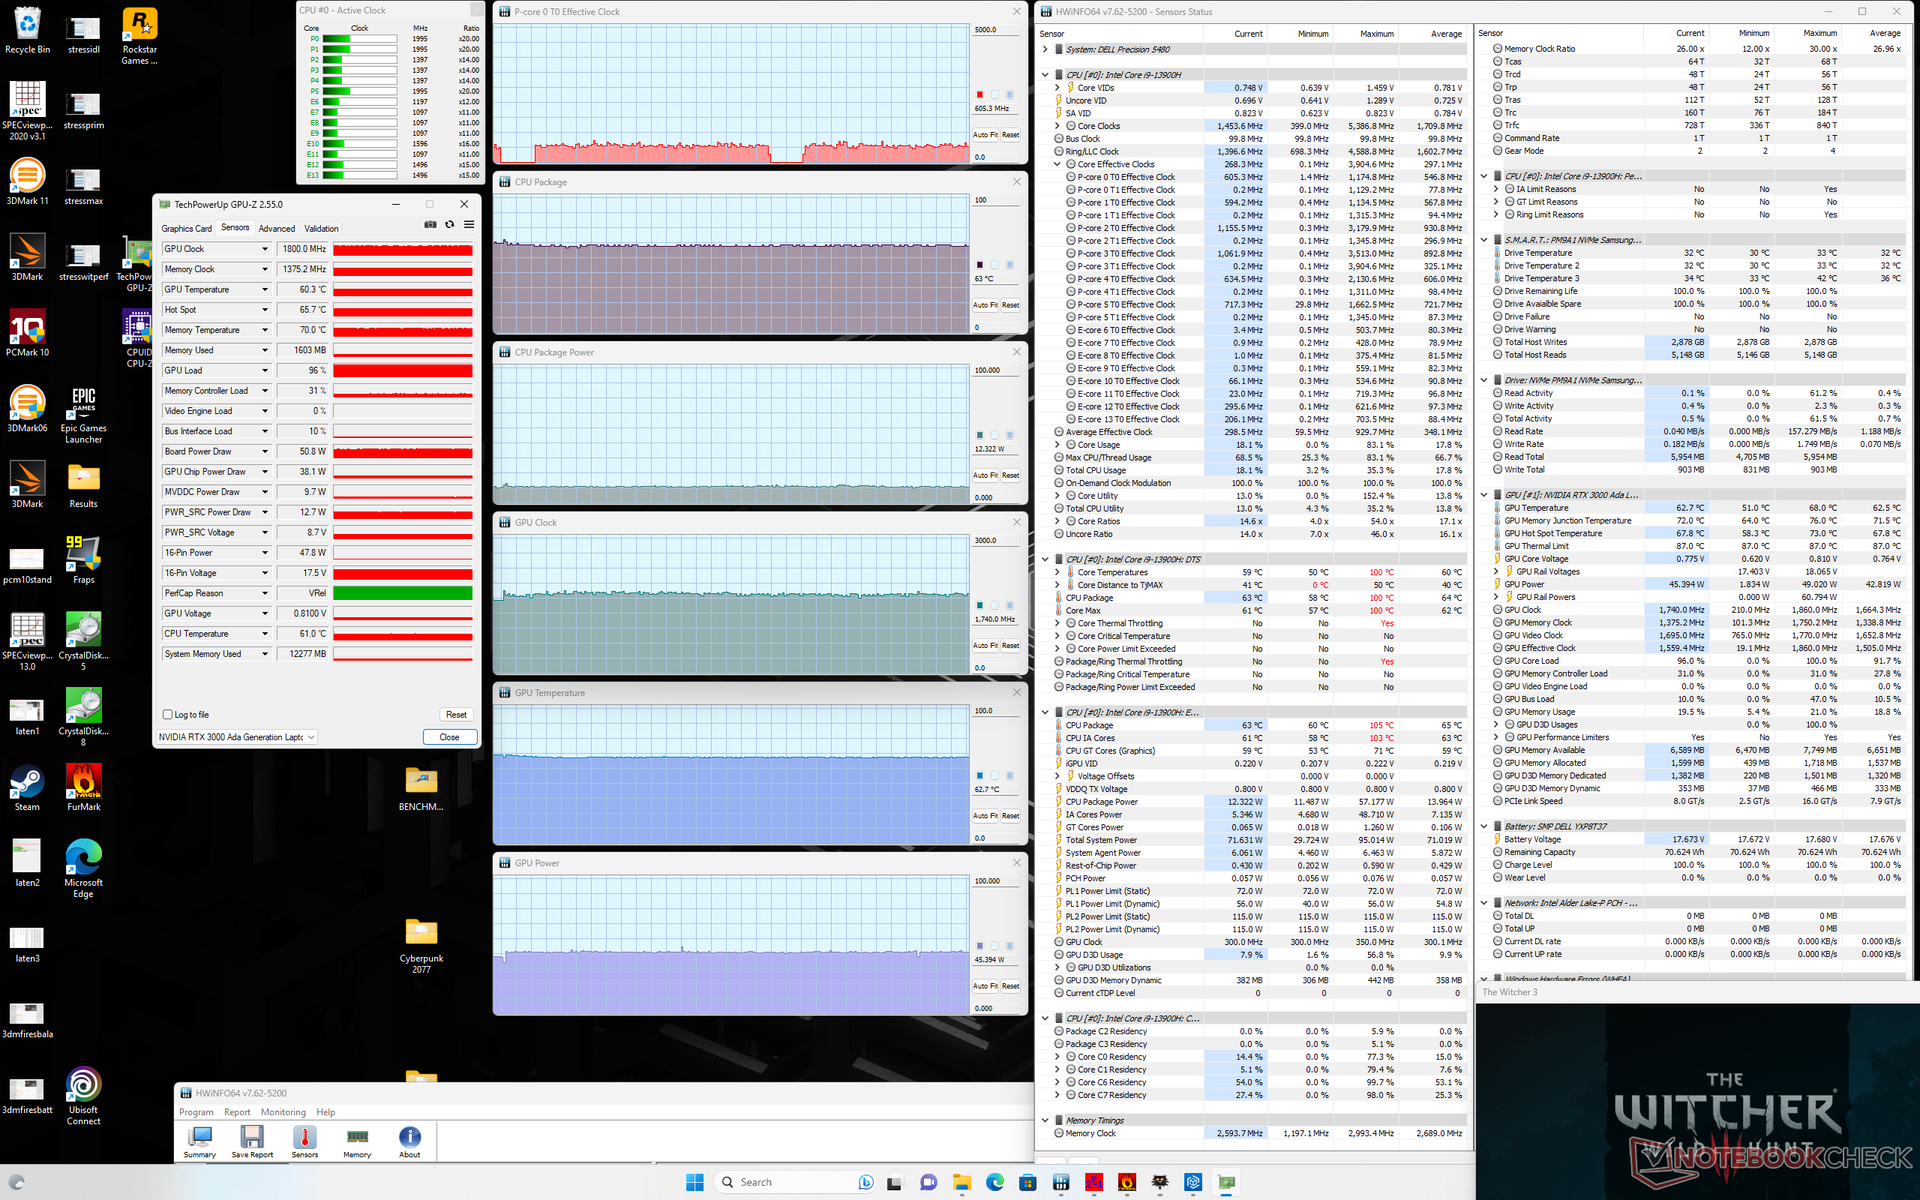
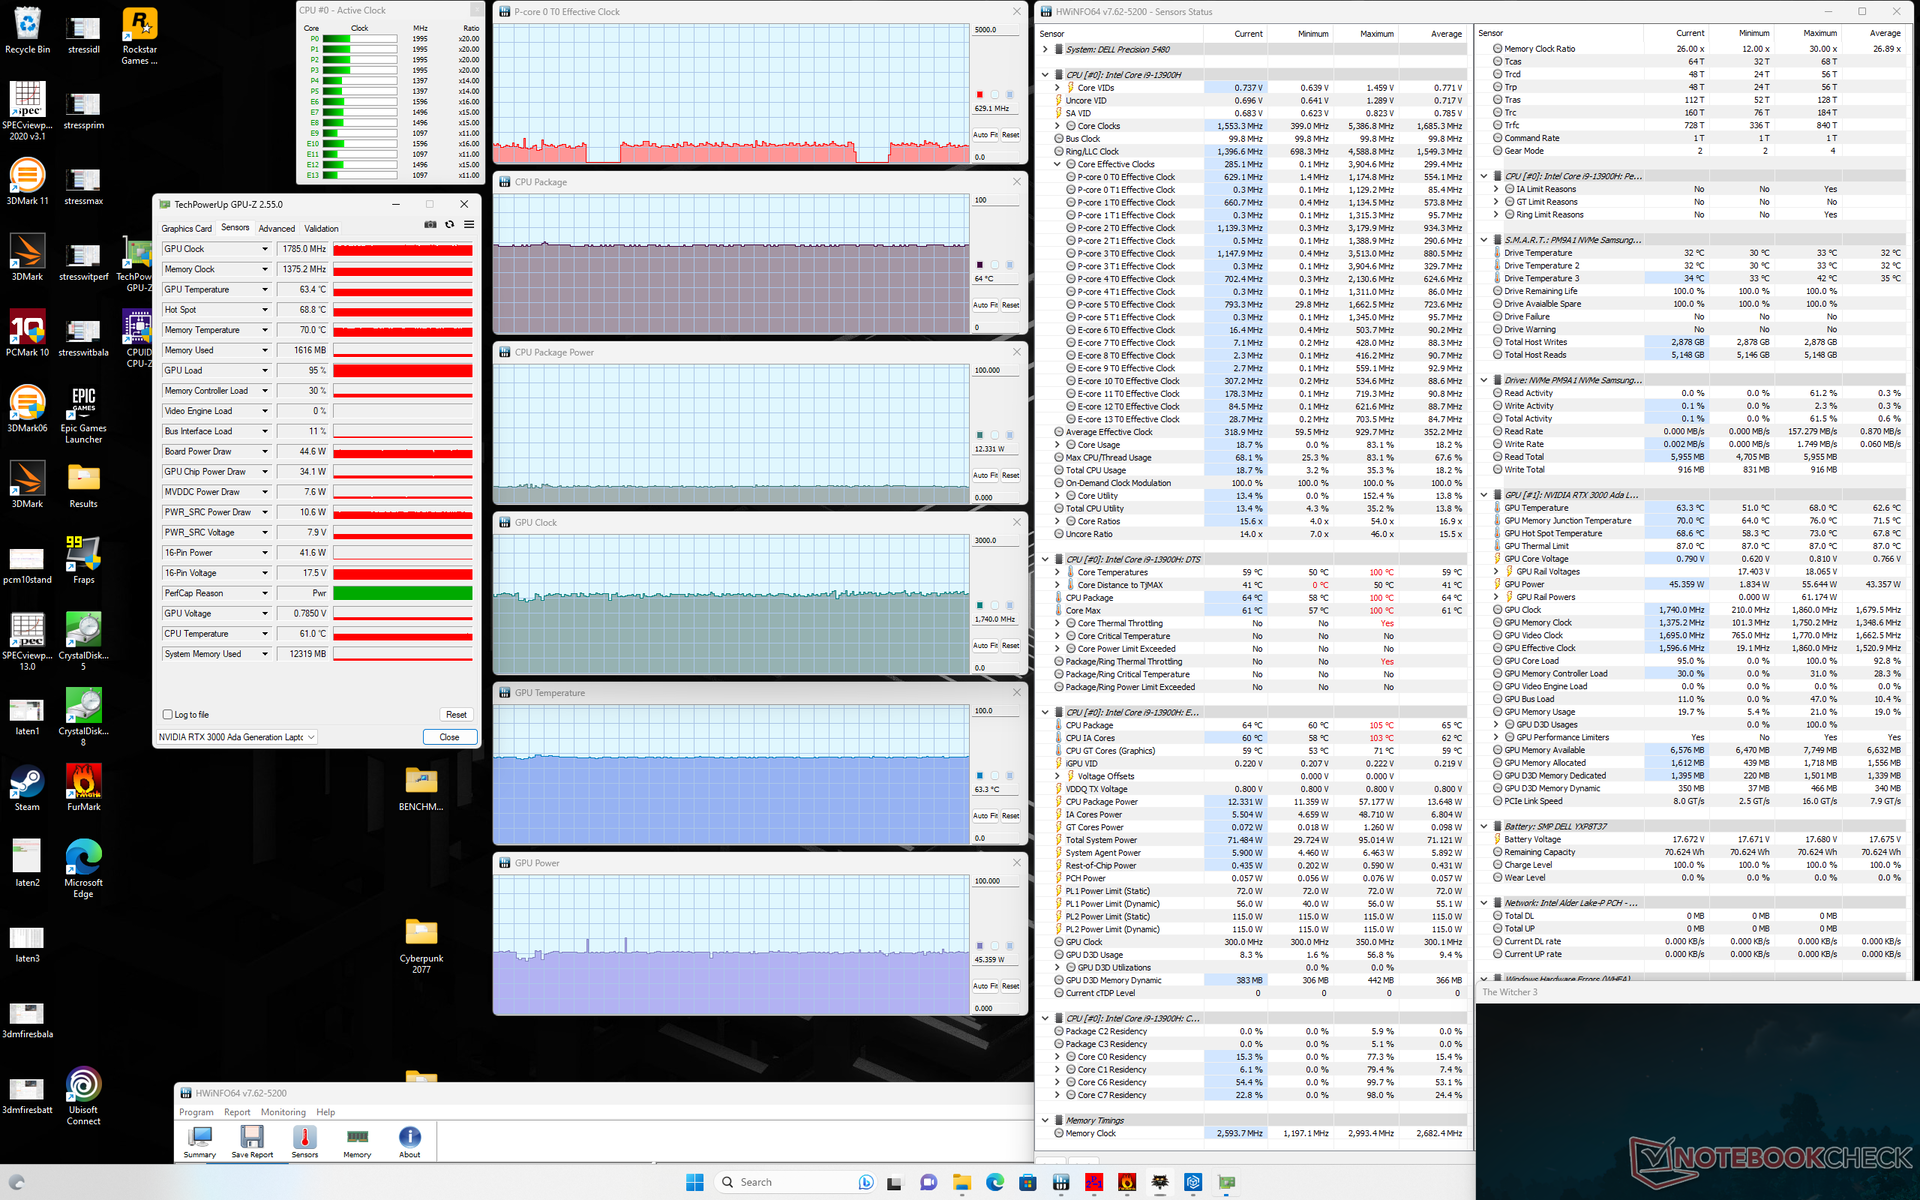
| CPU-klok (GHz) | GPU-klok (MHz) | Gemiddelde CPU-temperatuur (°C) | Gemiddelde GPU-temperatuur (°C) | |
| Systeem inactief | -- | -- | 59 | 52 |
| Prime95-stress | 2.5 | -- | 93 | 65 |
| Prime95 + FurMark Stress | 1.0 - 2.6 | 1155 | 69 - 92 | 66 - 73 |
| Witcher 3 Belasting (evenwichtige modus) | 0,6 | 1740 | 63 | 63 |
| Witcher 3 Belasting (prestatiemodus) | 0,6 | 1740 | 64 | 63 |
Luidsprekers
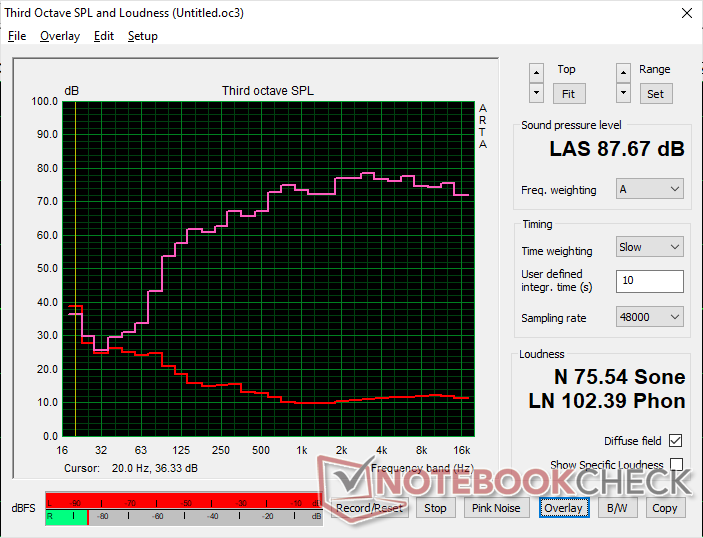
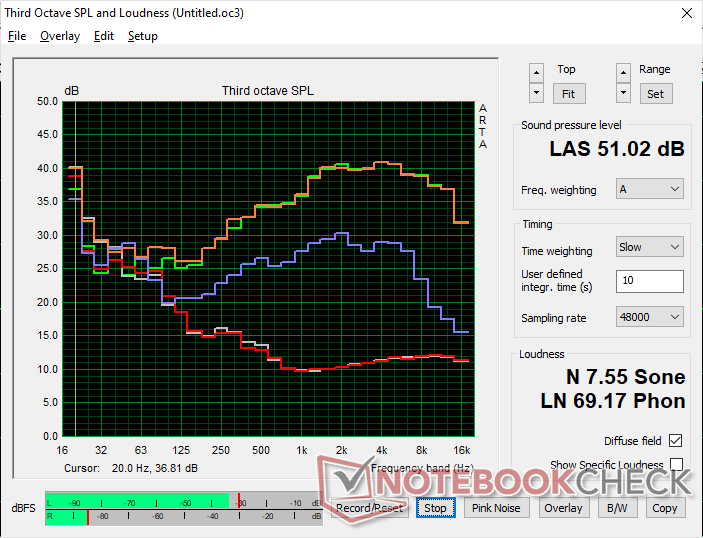
Dell Precision 5480 audioanalyse
(+) | luidsprekers kunnen relatief luid spelen (87.7 dB)
Bas 100 - 315 Hz
(±) | verminderde zeebaars - gemiddeld 12.9% lager dan de mediaan
(±) | lineariteit van de lage tonen is gemiddeld (7% delta ten opzichte van de vorige frequentie)
Midden 400 - 2000 Hz
(+) | evenwichtige middens - slechts 2.8% verwijderd van de mediaan
(+) | de middentonen zijn lineair (3.6% delta ten opzichte van de vorige frequentie)
Hoog 2 - 16 kHz
(+) | evenwichtige hoogtepunten - slechts 2.9% verwijderd van de mediaan
(+) | de hoge tonen zijn lineair (2% delta naar de vorige frequentie)
Algemeen 100 - 16.000 Hz
(+) | het totale geluid is lineair (9% verschil met de mediaan)
Vergeleken met dezelfde klasse
» 4% van alle geteste apparaten in deze klasse waren beter, 2% vergelijkbaar, 94% slechter
» De beste had een delta van 7%, het gemiddelde was 17%, de slechtste was 35%
Vergeleken met alle geteste toestellen
» 3% van alle geteste apparaten waren beter, 1% gelijk, 96% slechter
» De beste had een delta van 4%, het gemiddelde was 23%, de slechtste was 134%
Apple MacBook Pro 16 2021 M1 Pro audioanalyse
(+) | luidsprekers kunnen relatief luid spelen (84.7 dB)
Bas 100 - 315 Hz
(+) | goede baars - slechts 3.8% verwijderd van de mediaan
(+) | de lage tonen zijn lineair (5.2% delta naar de vorige frequentie)
Midden 400 - 2000 Hz
(+) | evenwichtige middens - slechts 1.3% verwijderd van de mediaan
(+) | de middentonen zijn lineair (2.1% delta ten opzichte van de vorige frequentie)
Hoog 2 - 16 kHz
(+) | evenwichtige hoogtepunten - slechts 1.9% verwijderd van de mediaan
(+) | de hoge tonen zijn lineair (2.7% delta naar de vorige frequentie)
Algemeen 100 - 16.000 Hz
(+) | het totale geluid is lineair (4.6% verschil met de mediaan)
Vergeleken met dezelfde klasse
» 0% van alle geteste apparaten in deze klasse waren beter, 0% vergelijkbaar, 100% slechter
» De beste had een delta van 5%, het gemiddelde was 17%, de slechtste was 45%
Vergeleken met alle geteste toestellen
» 0% van alle geteste apparaten waren beter, 0% gelijk, 100% slechter
» De beste had een delta van 4%, het gemiddelde was 23%, de slechtste was 134%
Energiebeheer
Stroomverbruik
De Precision 5480 is veeleisender dan de uitgaande Precision 5470 bij zware belastingen. Witcher 3 de 5480 zou bijvoorbeeld ongeveer 90 W verbruiken vergeleken met 83 W op het model van vorig jaar, maar de lichte toename in verbruik wordt in de schaduw gesteld door de aanzienlijke sprong in prestaties zoals hierboven vermeld.
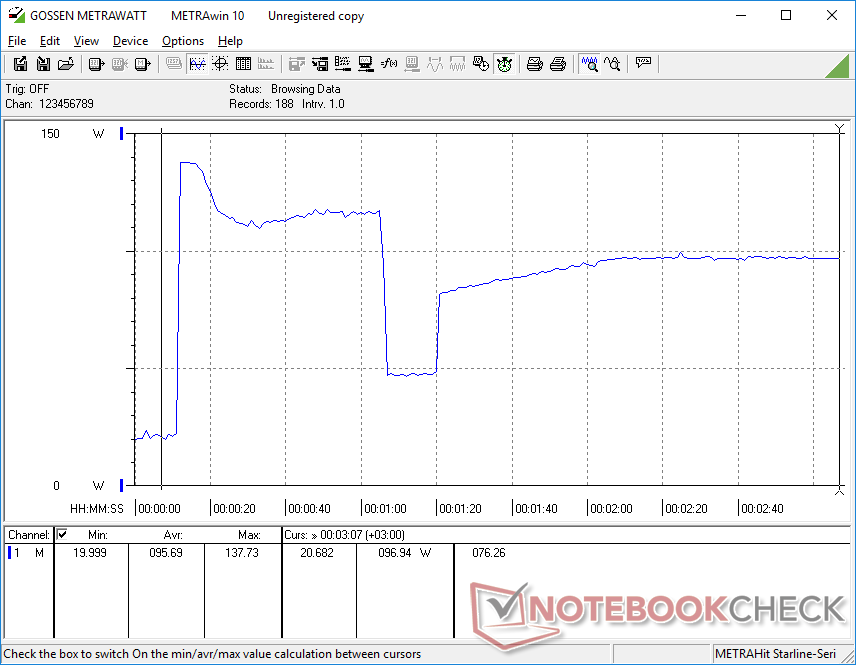
Interessant genoeg zou het stroomverbruik tijdens het draaien van Prime95 meer dan 2x zo hoog zijn als bij het model van vorig jaar (98 W vs. 42 W), nadat rekening is gehouden met het afknijpen van de prestaties, zoals de grafieken hieronder laten zien. De jaar-op-jaar toename in processorprestaties heeft dus een veel hogere prijs in vergelijking met de toename in grafische prestaties.
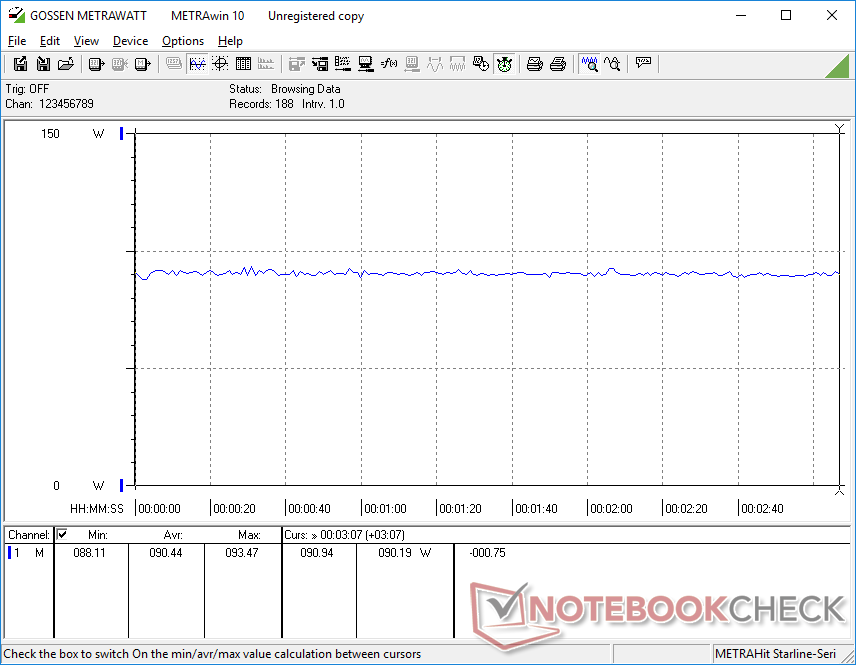
Het is ook de moeite waard om te vermelden dat ons apparaat meer stroom trok dan verwacht wanneer het gewoon stationair draaide op het bureaublad zonder toepassingen, wat gedeeltelijk verantwoordelijk kan zijn voor de over het algemeen warmere oppervlaktetemperaturen zoals eerder vermeld.
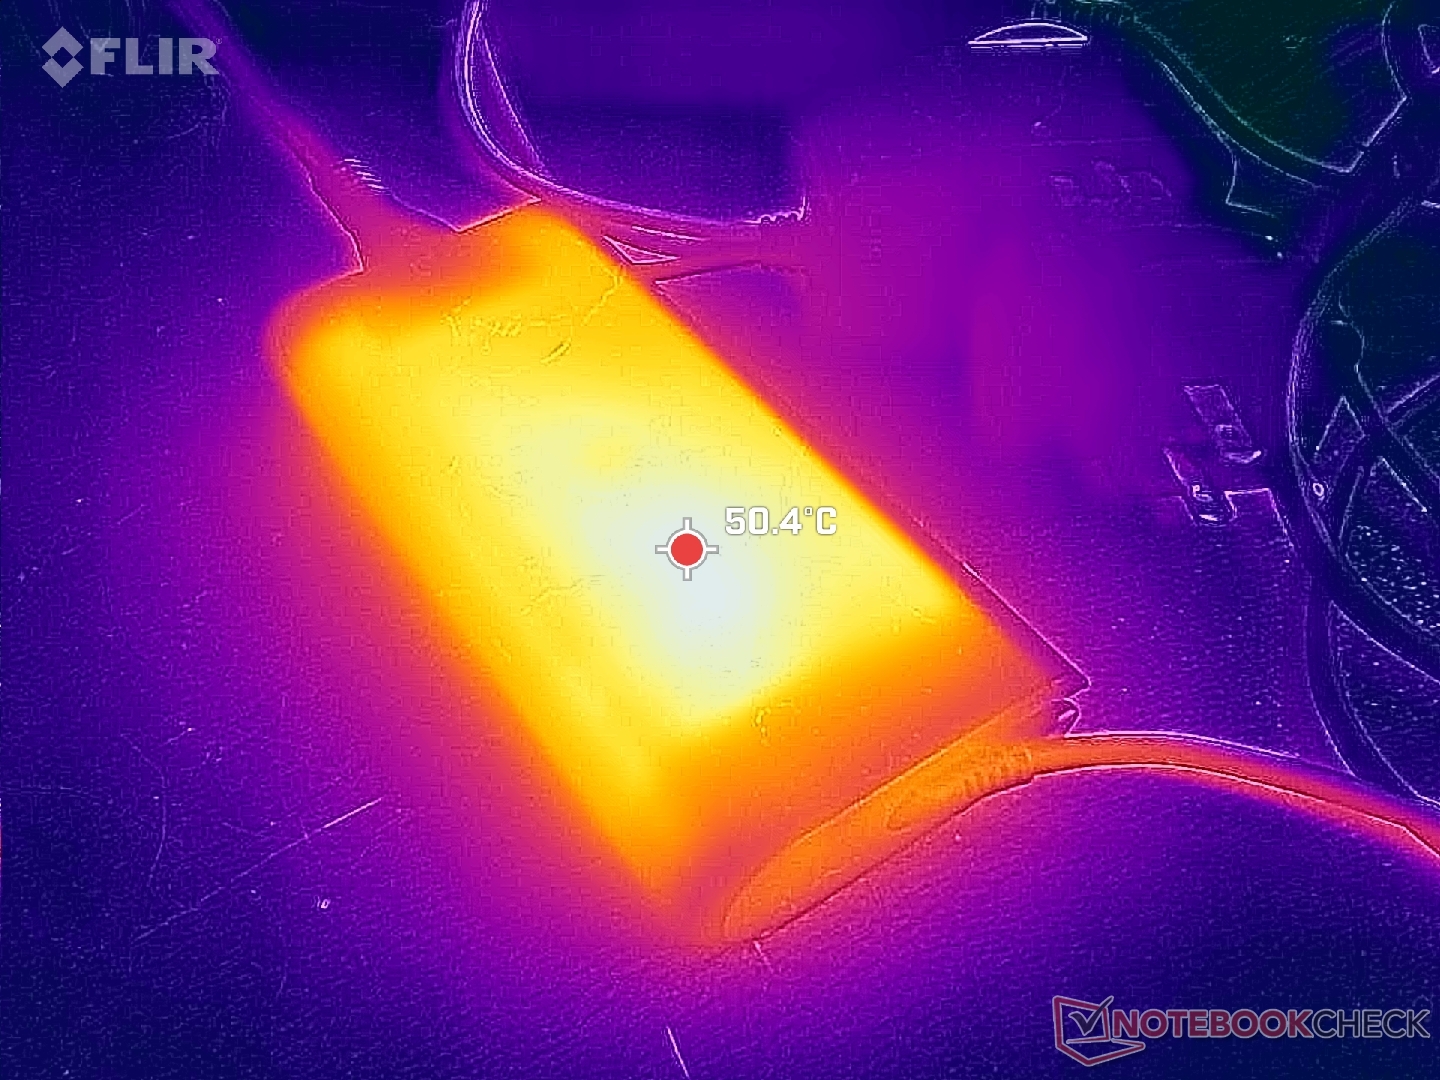
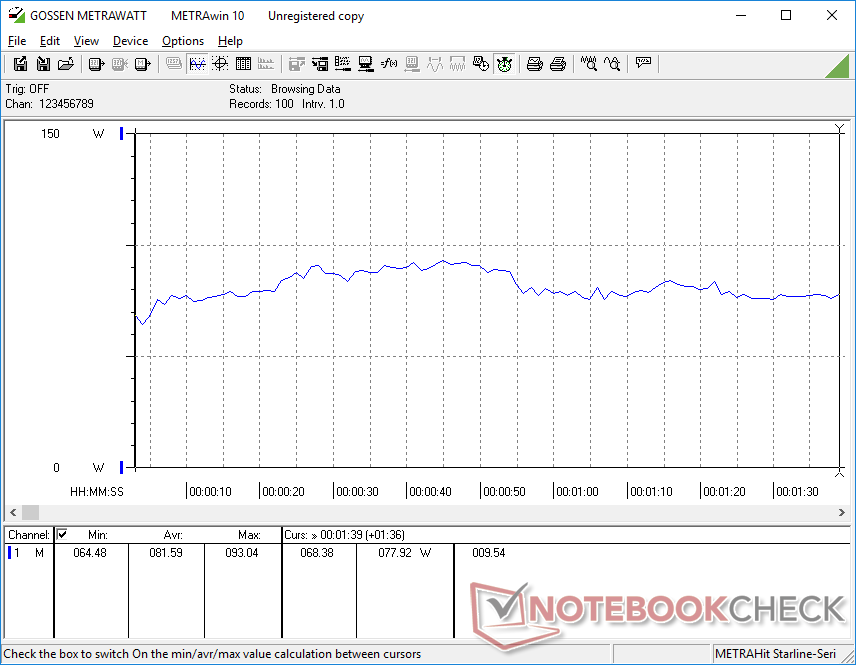
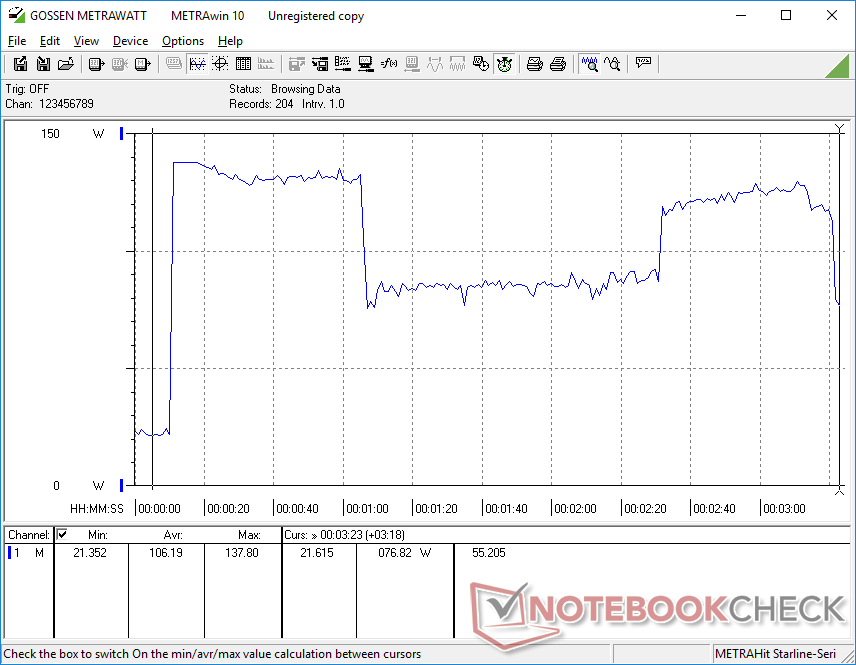
We hebben een tijdelijk maximaal verbruik gemeten van 138 W van de kleine-medium (~14,3 x 6,5 x 2,1 cm) 130 W USB-C AC-adapter wanneer de CPU en GPU volledig worden belast. Dit hoge verbruik is niet consistent, want het schommelt elke minuut tussen 76 W en 138 W, zoals te zien is in de onderstaande grafiek die correleert met de cyclische kloksnelheden.
| Uit / Standby | |
| Inactief | |
| Belasting |
|
Key:
min: | |
| Dell Precision 5480 i9-13900H, RTX 3000 Ada Generation Laptop, Samsung PM9A1 MZVL21T0HCLR, IPS, 2560x1600, 14" | Dell Precision 5000 5470 i9-12900H, RTX A1000 Laptop GPU, Samsung PM9A1 MZVL21T0HCLR, IPS, 2560x1600, 14" | Dell Precision 5000 5560 i7-11850H, RTX A2000 Laptop GPU, Samsung PM9A1 MZVL22T0HBLB, IPS, 3840x2400, 15.6" | Lenovo ThinkPad P14s G3 AMD 21J6S05000 R7 PRO 6850U, Radeon 680M, Samsung PM9A1 MZVL21T0HCLR, IPS LED, 1920x1200, 14" | Lenovo ThinkPad P15v G3 21EM001AGE R7 PRO 6850H, RTX A2000 Laptop GPU, SK Hynix PC711 1TB HFS001TDE9X081N, IPS LED, 3840x2160, 15.6" | HP ZBook Firefly 14 G9-6B8A2EA i7-1265U, T550 Laptop GPU, Micron 3400 1TB MTFDKBA1T0TFH, IPS, 1920x1200, 14" | |
|---|---|---|---|---|---|---|
| Power Consumption | 25% | 15% | 63% | 24% | 60% | |
| Idle Minimum * (Watt) | 14.9 | 4.3 71% | 6.2 58% | 2.6 83% | 6.3 58% | 4.2 72% |
| Idle Average * (Watt) | 19.5 | 8.9 54% | 13.9 29% | 5 74% | 13.9 29% | 6.5 67% |
| Idle Maximum * (Watt) | 27.2 | 18.9 31% | 23.8 12% | 5.6 79% | 14.5 47% | 7.2 74% |
| Load Average * (Watt) | 81.6 | 94 -15% | 95.7 -17% | 49.7 39% | 82.8 -1% | 47.7 42% |
| Witcher 3 ultra * (Watt) | 90.4 | 83.2 8% | 87 4% | 50.6 44% | 88.8 2% | 42.9 53% |
| Load Maximum * (Watt) | 137.8 | 137.5 -0% | 132.6 4% | 61.1 56% | 124.8 9% | 68.2 51% |
* ... kleiner is beter
Power Consumption Witcher 3 / Stresstest
Power Consumption external Monitor
Levensduur batterij
De WLAN-gebruiksduur is ongeveer 1 tot 2 uur langer dan bij het model van vorig jaar, wat behoorlijk goed is gezien de prestatievoordelen ten opzichte van vorig jaar. Ondertussen duurt het opladen van leeg naar vol iets meer dan 2 uur.
| Dell Precision 5480 i9-13900H, RTX 3000 Ada Generation Laptop, 72 Wh | Dell Precision 5000 5470 i9-12900H, RTX A1000 Laptop GPU, 72 Wh | Dell Precision 5000 5560 i7-11850H, RTX A2000 Laptop GPU, 86 Wh | Lenovo ThinkPad P14s G3 AMD 21J6S05000 R7 PRO 6850U, Radeon 680M, 52.5 Wh | Lenovo ThinkPad P15v G3 21EM001AGE R7 PRO 6850H, RTX A2000 Laptop GPU, 68 Wh | HP ZBook Firefly 14 G9-6B8A2EA i7-1265U, T550 Laptop GPU, 51 Wh | |
|---|---|---|---|---|---|---|
| Batterijduur | 5% | 29% | 17% | 32% | -19% | |
| WiFi v1.3 (h) | 10.9 | 9.6 -12% | 6.3 -42% | 12.2 12% | 6.9 -37% | 8.8 -19% |
| Load (h) | 0.9 | 1.1 22% | 1.8 100% | 1.1 22% | 1.8 100% | |
| Reader / Idle (h) | 14.7 | 12 | ||||
| H.264 (h) | 12 | 10.7 |
Pro
Contra
Verdict - RTX 3000 Ada maakt indruk
De Precision 5480 is een interne verfijning van de Precision 5470 van vorig jaar. De CPU-prestaties zijn sneller en stabieler dan voorheen, terwijl de Ada GPU de echte ster van de show is en de grootste reden om de Precision 5480 te kopen in plaats van de oudere Precision 5470. Het stroomverbruik kan iets hoger zijn, maar de batterijduur is niet significant veranderd en de prestatieverhoging zal de moeite waard zijn voor veeleisende gebruikers.
Misschien wel het grootste nadeel van het systeem is hoe luid het kan zijn als het gaspedaal wordt ingetrapt. Hoewel de prestaties per volume erg hoog zijn, gaat al dat vermogen in zo'n klein en draagbaar pakket ten koste van het geluid van de ventilator. Andere 14-inch werkstations zoals de
Lenovo ThinkPad P14s ofHP ZBook Firefly 14 G9 werken veel stiller, maar daar moet je wel een groot deel van de grafische prestaties voor inleveren.De 14-inch Precision 5480 is voor mobiele power users die weten dat ze de snelle RTX 3000 Ada GPU volledig kunnen benutten. Anders zijn er alternatieven van Lenovo en HP die veel stiller en discreter werken.
Prijs en beschikbaarheid
Dell levert nu zijn Precision 5480 workstation vanaf 2070 USD voor de basis Core i5 configuratie zonder discrete graphics tot meer dan 4400 USD voor onze Core i7 RTX 3000 Ada configuratie.
Dell Precision 5480
- 15-09-2023 v7 (old)
Allen Ngo
Transparantie
De selectie van te beoordelen apparaten wordt gemaakt door onze redactie. Het testexemplaar werd ten behoeve van deze beoordeling door de fabrikant of detailhandelaar in bruikleen aan de auteur verstrekt. De kredietverstrekker had geen invloed op deze recensie, noch ontving de fabrikant vóór publicatie een exemplaar van deze recensie. Er bestond geen verplichting om deze recensie te publiceren. Als onafhankelijk mediabedrijf is Notebookcheck niet onderworpen aan het gezag van fabrikanten, detailhandelaren of uitgevers.
[transparency_disclaimer]Dit is hoe Notebookcheck test
Elk jaar beoordeelt Notebookcheck onafhankelijk honderden laptops en smartphones met behulp van gestandaardiseerde procedures om ervoor te zorgen dat alle resultaten vergelijkbaar zijn. We hebben onze testmethoden al zo'n 20 jaar voortdurend ontwikkeld en daarbij de industriestandaard bepaald. In onze testlaboratoria wordt gebruik gemaakt van hoogwaardige meetapparatuur door ervaren technici en redacteuren. Deze tests omvatten een validatieproces in meerdere fasen. Ons complexe beoordelingssysteem is gebaseerd op honderden goed onderbouwde metingen en benchmarks, waardoor de objectiviteit behouden blijft. Meer informatie over onze testmethoden kunt u hier vinden.
Price comparison

