Lenovo ThinkPad P15v G2 laptop review: Betaalbaar zakelijk werkstation
De Lenovo ThinkPad P15v Gen2 is een 15-inch werkstation dat tussen de ThinkPad P15's en P15 groep laptops in termen van functies en prijs. Net als de laatste groep, maakt het gebruik van een Intel Core i7-11800H, maar komt met de optie van een Nvidia GeForce RTX A2000 als de krachtigste GPU die beschikbaar is voor deze variant. De ThinkPad T15p Gen2 gebruikt de langzamere Nvidia GeForce GTX 1650, die is geconfigureerd als een professionele variant (Nvidia T1200) in onze P15v G2.
Beide apparaten kunnen worden uitgerust met een 4K-beeldscherm (600 nits), net als de T15p Gen1. De omvangrijkere ThinkPad T15g is daarentegen een werkstationvariant van de ThinkPad P15 die in de richting van gaming is opgeschoven. De P15v-serie biedt dus krachtige componenten tegen een niet al te hoog gewicht en een niet al te hoge prijs (rond de 1.800 euro). Lenovo adverteert zijn workstation voor creatieve individuen: of deze claim terecht is, met name wat betreft het beeldscherm, zal blijken in de volgende review.
Opmerking voor internationale lezers:
De Lenovo ThinkPad P15v Gen2 is ook in andere landen verkrijgbaar in verschillende configuraties tegen verschillende prijzen (zie "Prijs en beschikbaarheid" aan het einde van deze review voor voorbeelden)| Model | Toepassingsgebied |
|---|---|
| ThinkPad P15 | Klassiek werkstation |
| ThinkPad T15g | Gaming-werkstation |
| ThinkPad P15s | Ultrabook-werkstation |
| ThinkPad T15 | Zakelijk |
| ThinkPad P15v | Instap-werkstation |
| ThinkPad T15p | Zakelijke prestaties |
Potentiële concurrenten in vergelijking
Evaluatie | Datum | Model | Gewicht | Hoogte | Formaat | Resolutie | Beste prijs |
|---|---|---|---|---|---|---|---|
| 86.2 % v7 (old) | 06-2022 | Lenovo ThinkPad P15v G2 21A9000XGE i7-11800H, T1200 Laptop GPU | 2.3 kg | 22.7 mm | 15.60" | 1920x1080 | |
| 87.2 % v7 (old) | 10-2021 | Lenovo ThinkPad P15 G2-20YQ001JGE i7-11800H, RTX A3000 Laptop GPU | 2.9 kg | 31.5 mm | 15.60" | 1920x1080 | |
| 86.3 % v7 (old) | 03-2021 | Lenovo ThinkPad T15g-20UR000GGE i7-10750H, GeForce RTX 2070 Super Max-Q | 2.8 kg | 31.45 mm | 15.60" | 1920x1080 | |
| 86.6 % v7 (old) | 02-2021 | Lenovo ThinkPad T15p-20TN0006GE i7-10750H, GeForce GTX 1050 Mobile | 2.2 kg | 22.7 mm | 15.60" | 3840x2160 | |
| 85.3 % v7 (old) | 06-2021 | Lenovo ThinkPad P15s Gen2-20W6000GGE i7-1165G7, T500 Laptop GPU | 1.9 kg | 19.1 mm | 15.60" | 3840x2160 | |
| 87.7 % v7 (old) | 07-2022 | HP ZBook Power 15 G8 313S5EA i7-11800H, T600 Laptop GPU | 2 kg | 22.8 mm | 15.60" | 1920x1080 | |
| 88.3 % v7 (old) | 10-2021 | Dell Precision 5000 5560 i7-11850H, RTX A2000 Laptop GPU | 2 kg | 18 mm | 15.60" | 3840x2400 |
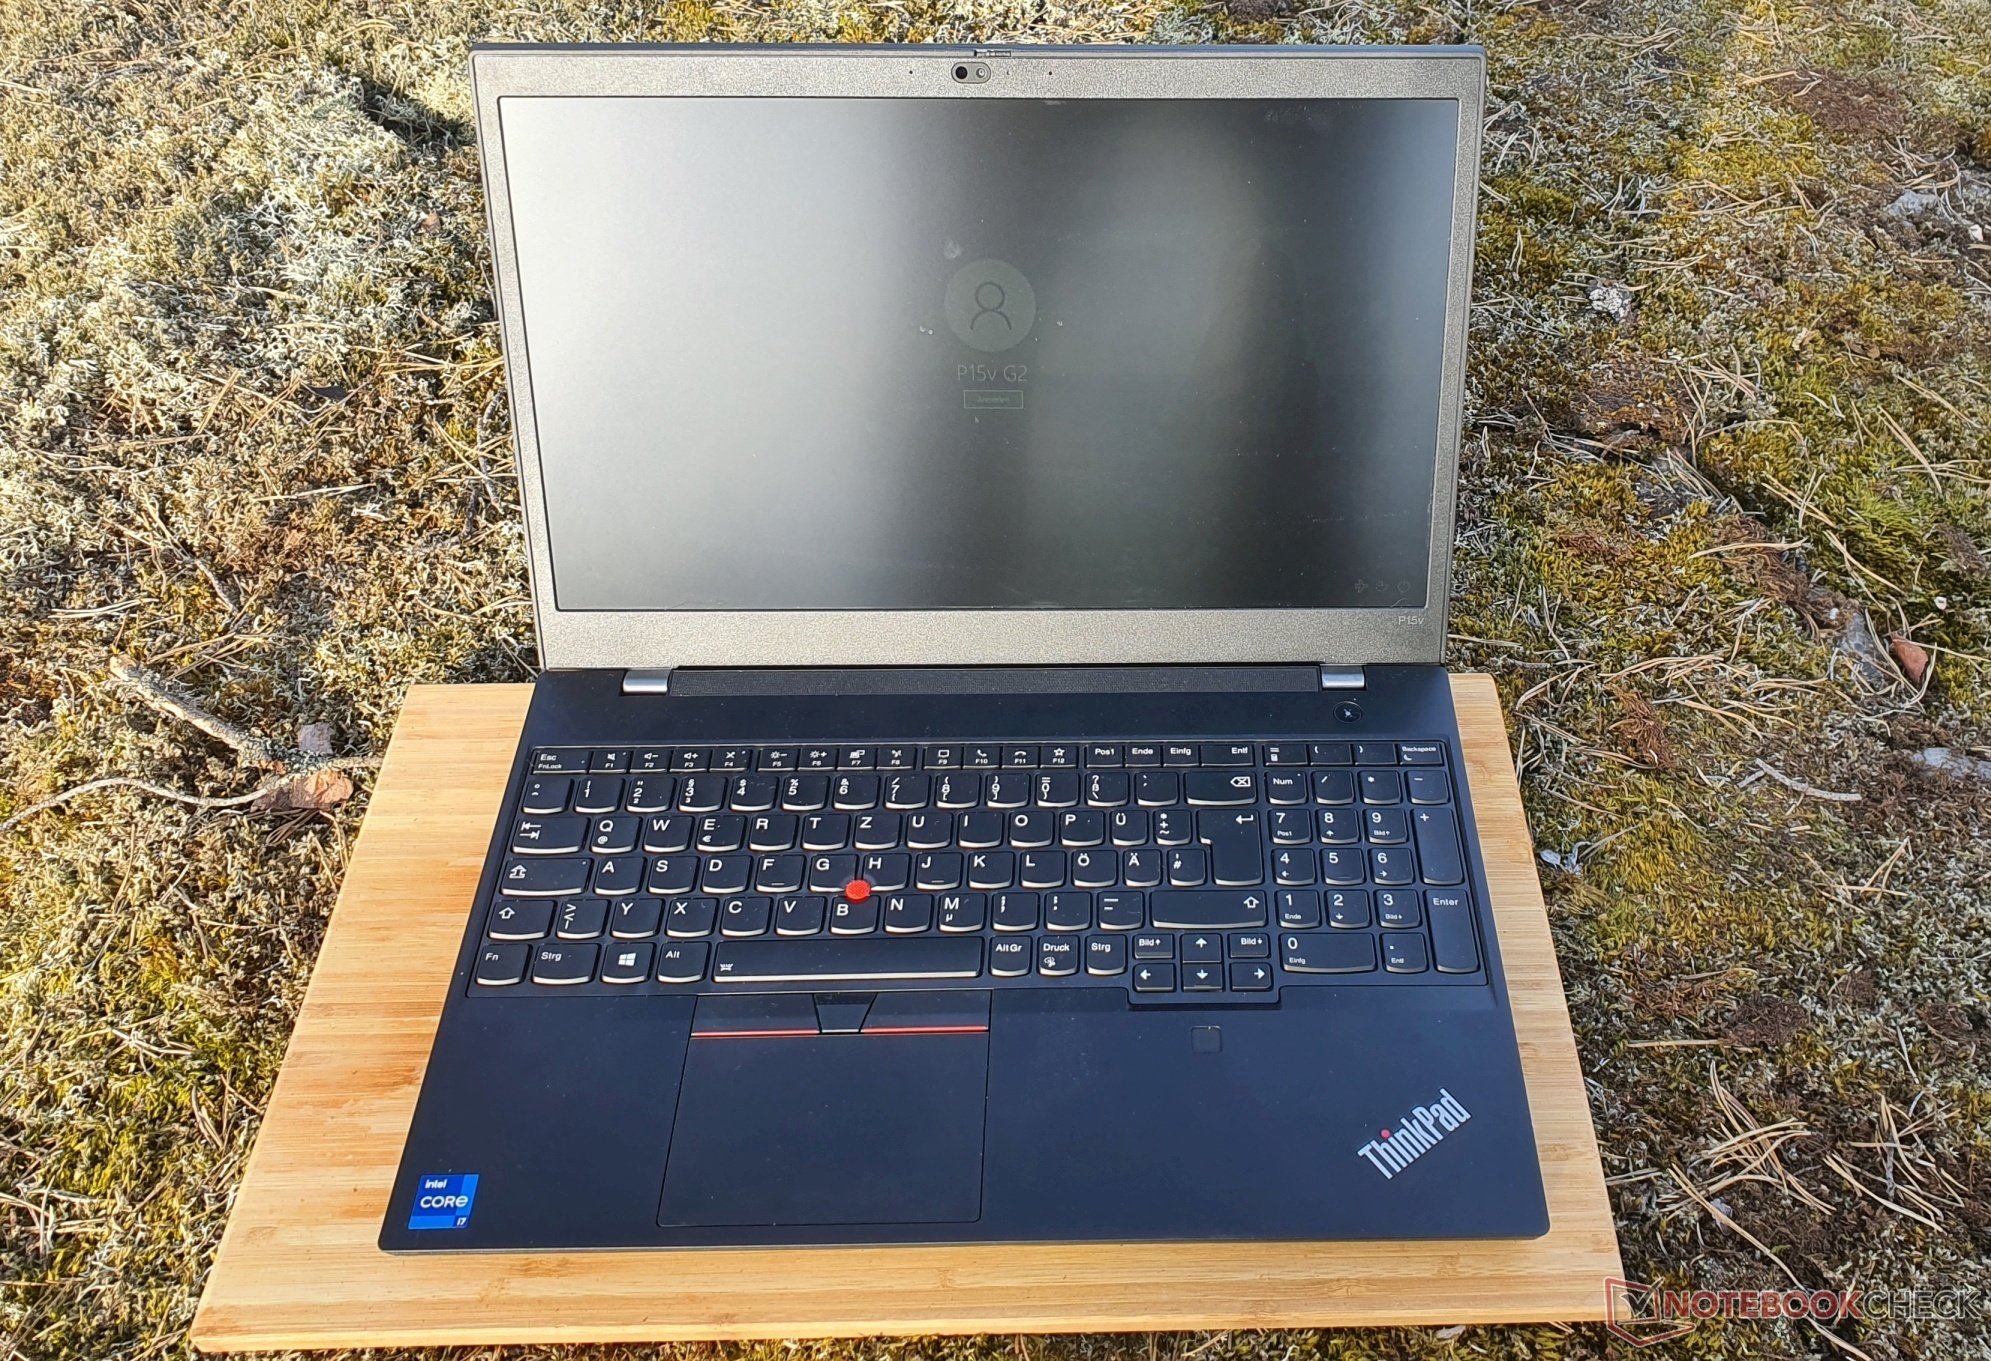
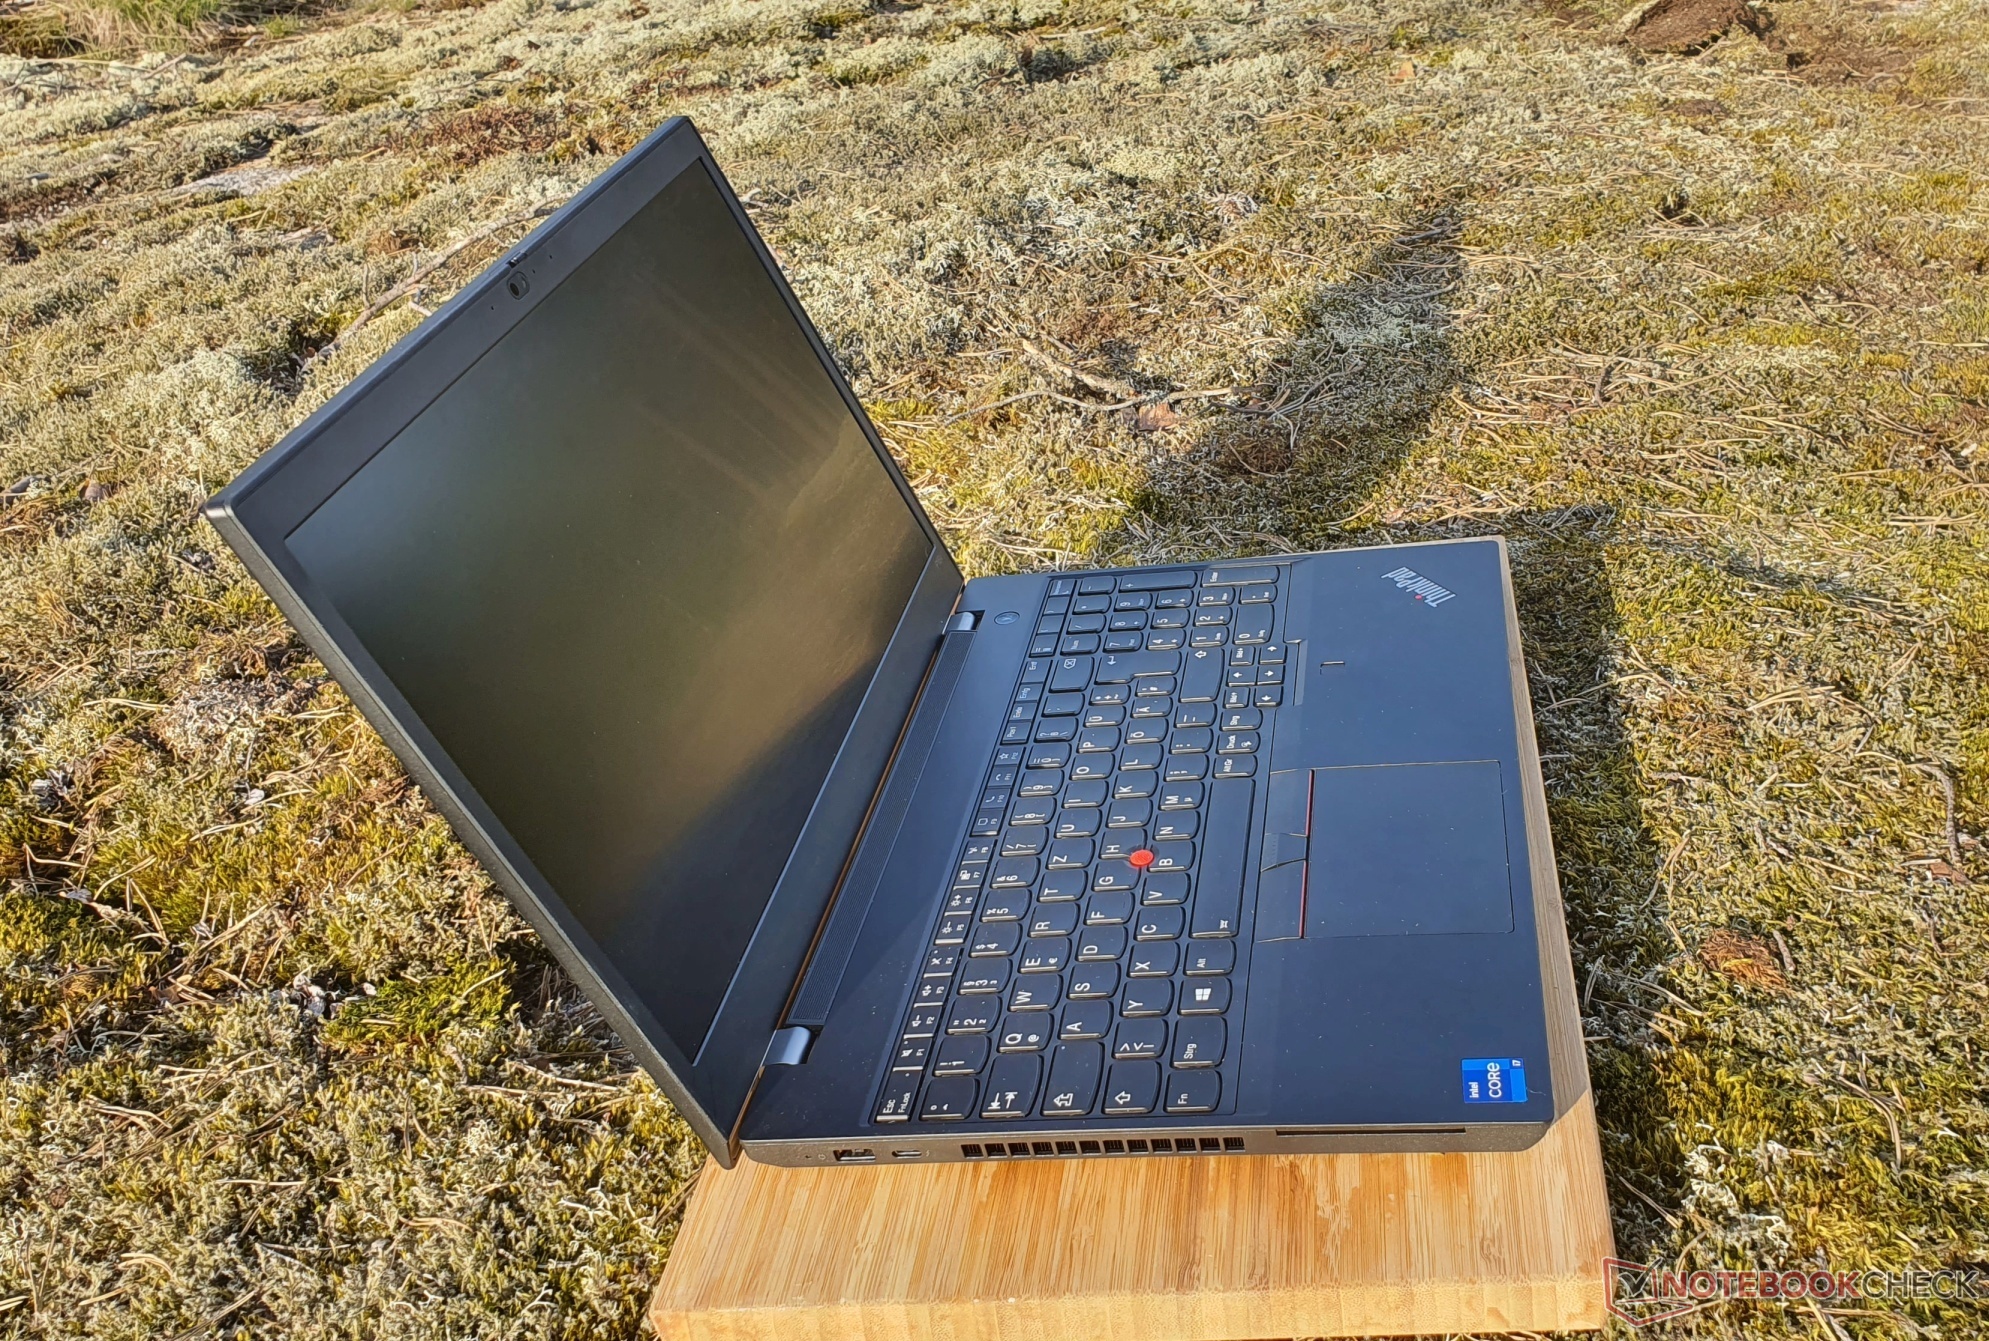
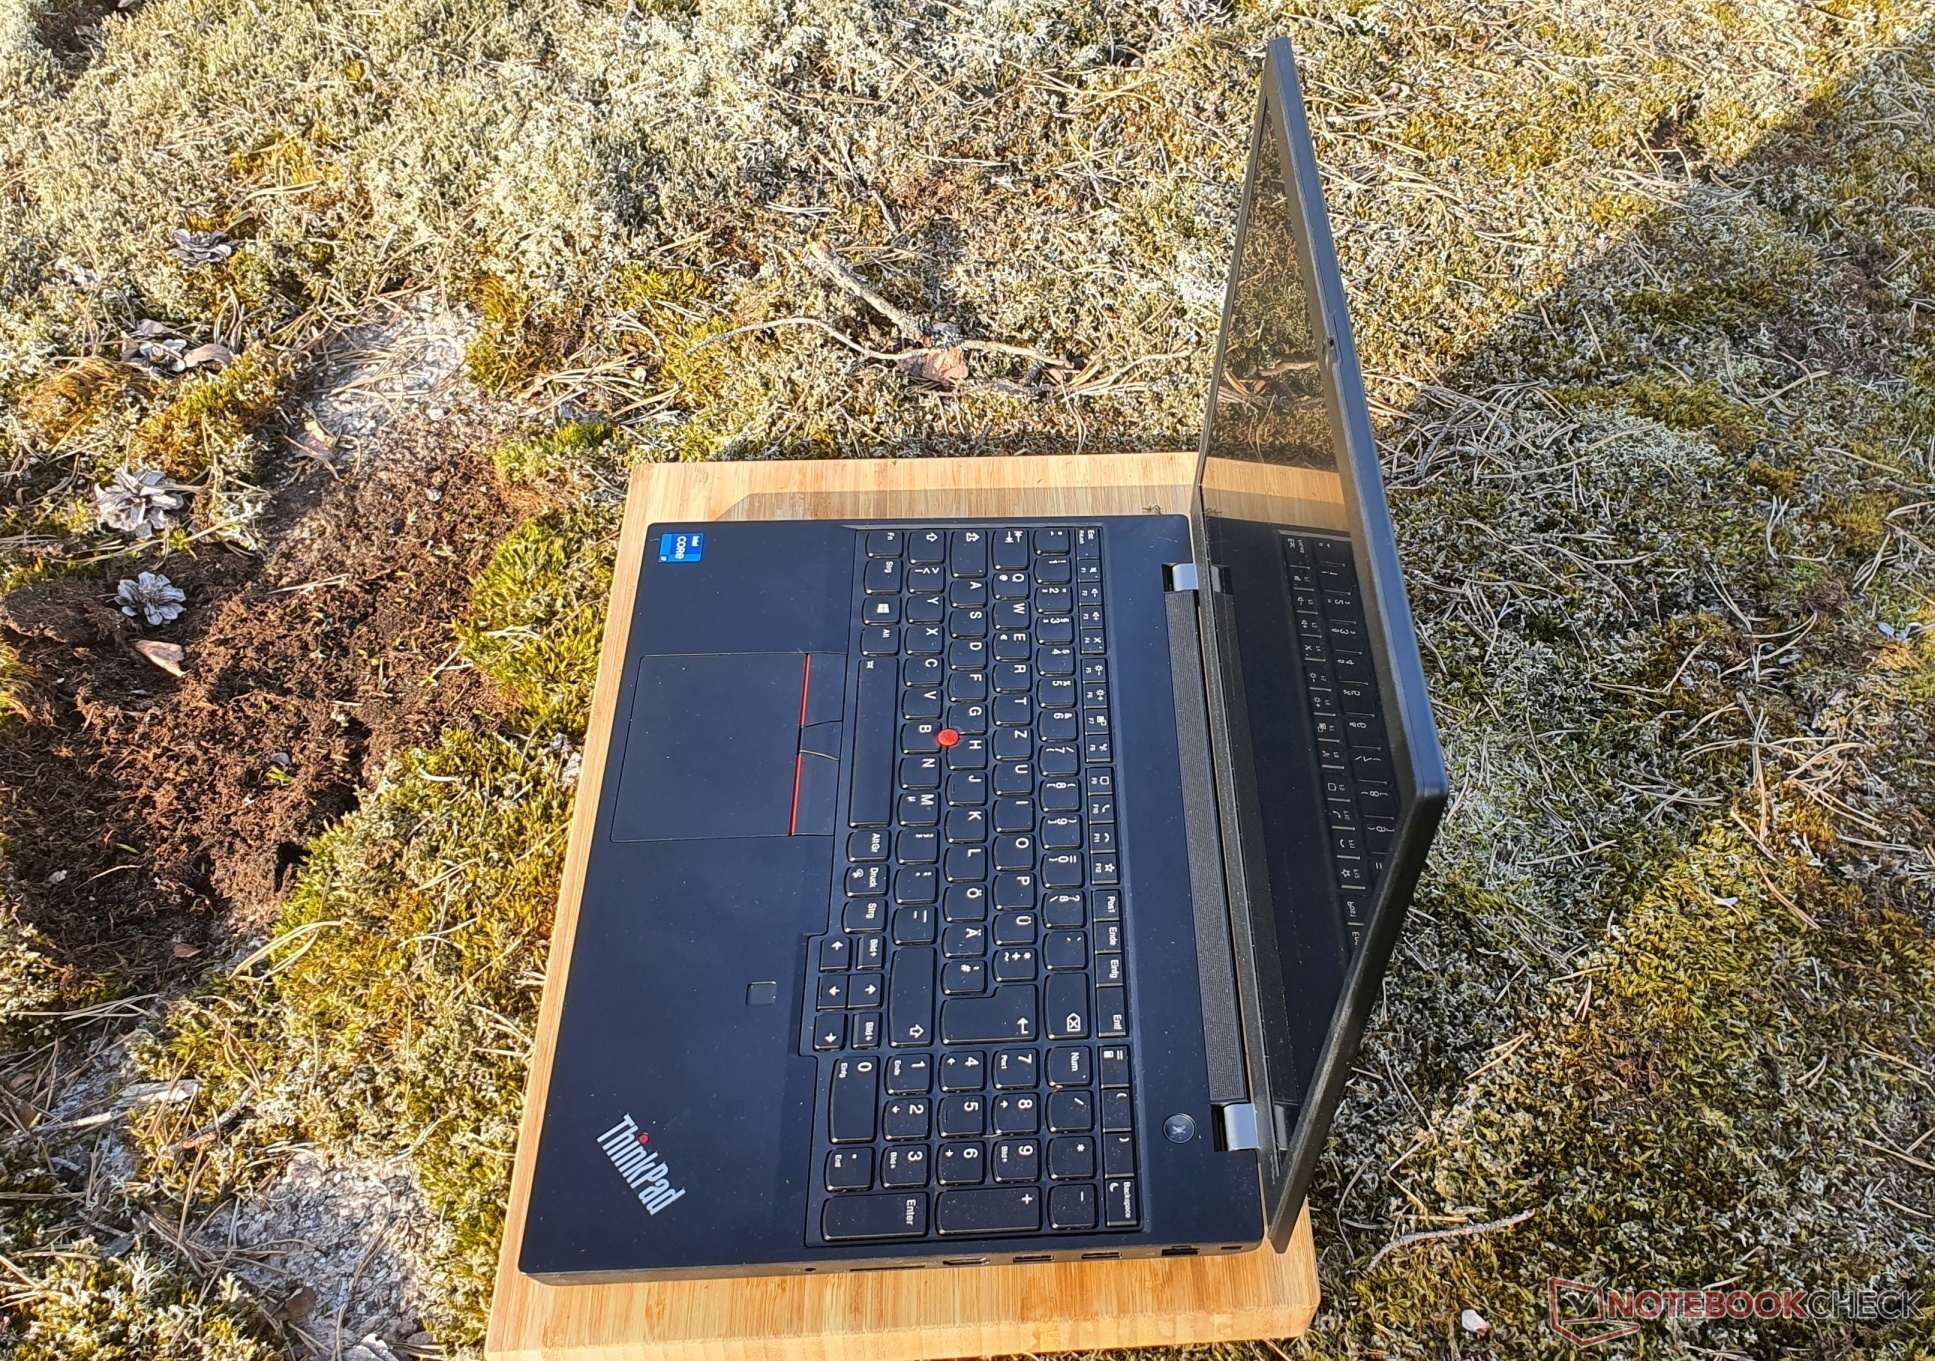
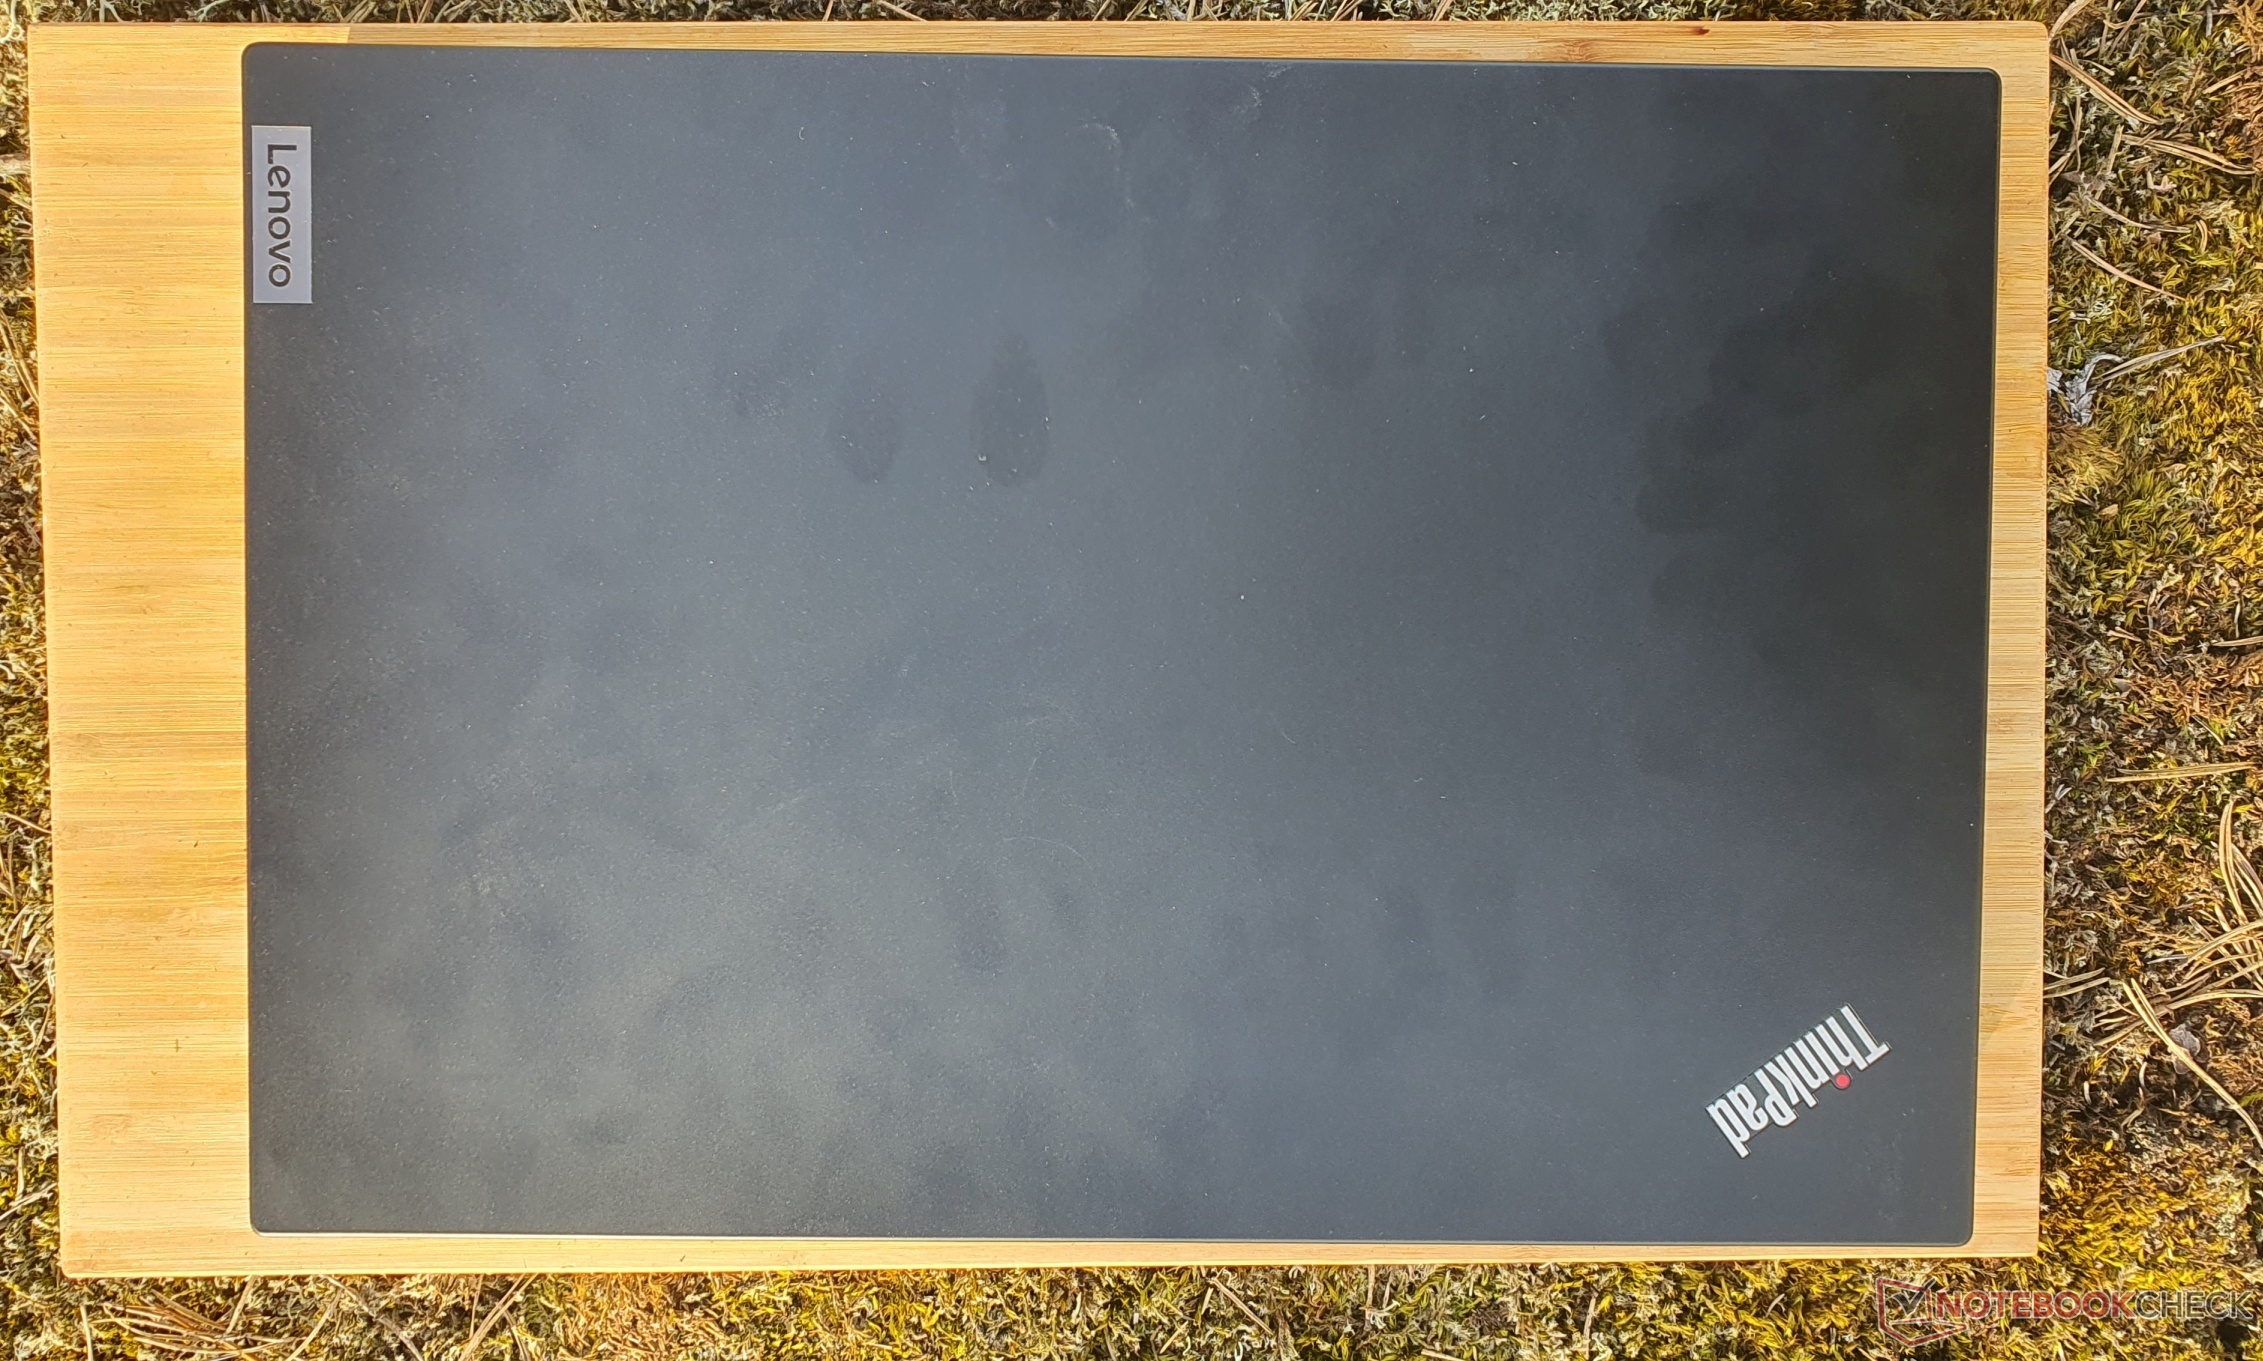
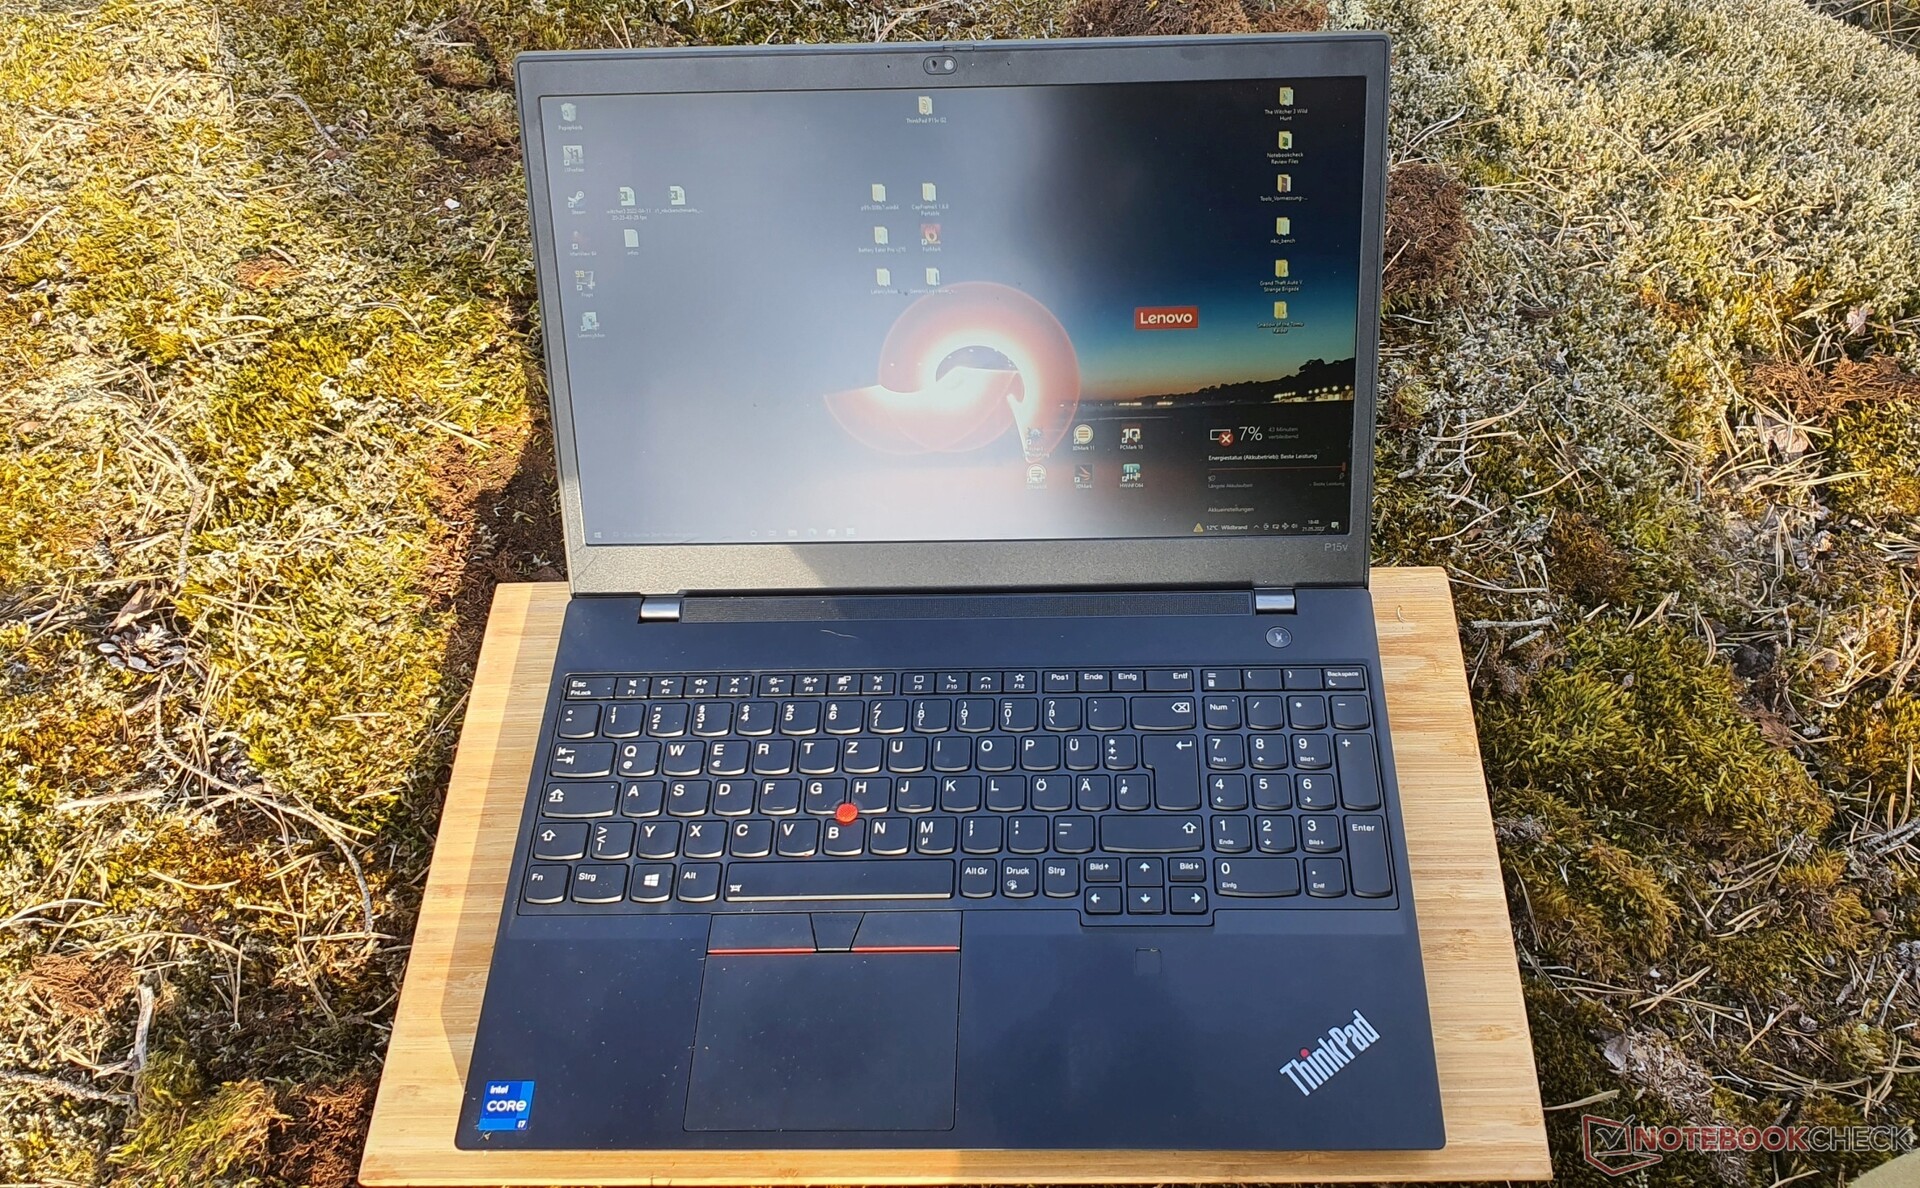
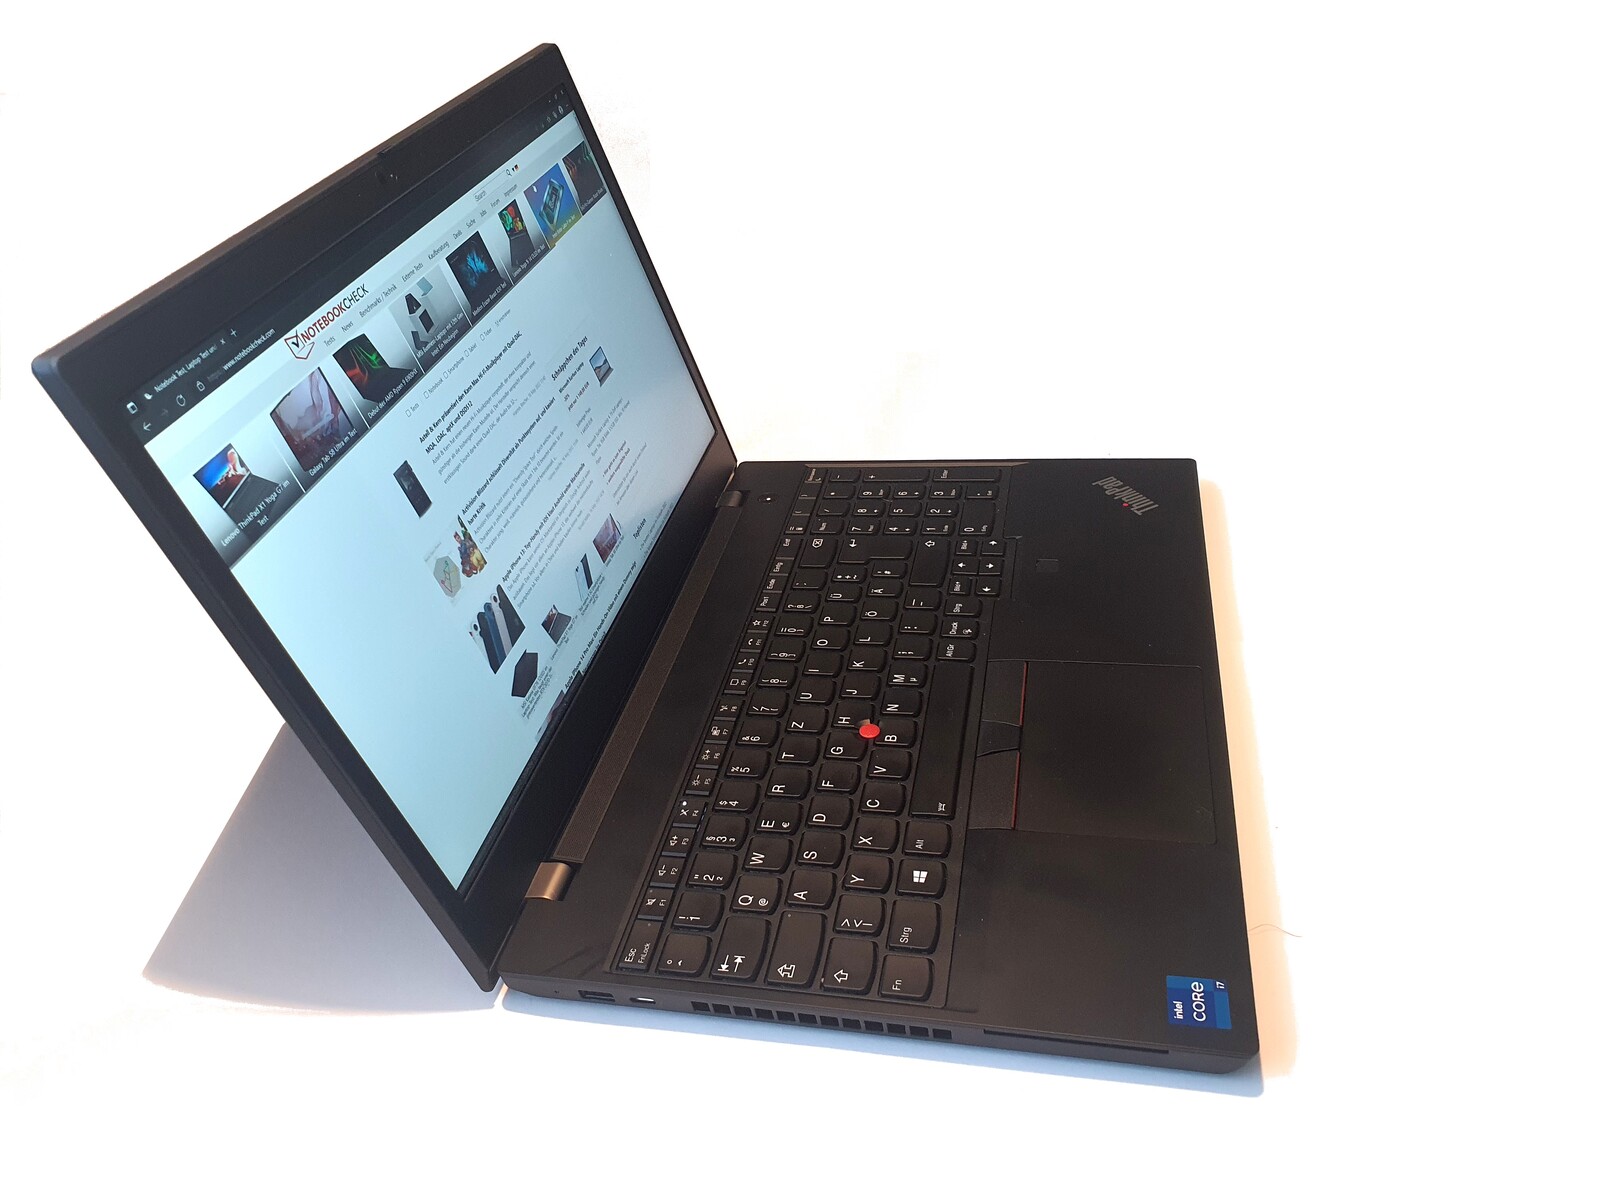
Behuizing: Stabiel plastic voor de matte ThinkPad

De behuizing van de ThinkPad P15v lijkt op die van deThinkPad P15smaar is hoger (ongeveer 3,6 mm) en zwaarder (360 gram). Het deksel is ook aanzienlijk dikker en biedt meer weerstand tegen torsie, maar het kan nog steeds merkbaar worden verdraaid.
Dezelfde behuizing als de ThinkPad T15p wordt hier gebruikt, wat rondom stabiel, mat-ruw ABS plastic betekent, maar zonder de glasvezelversterking van de P15's. Ook ontbreken de haptisch aangename rubberen coatings, wat zorgt voor een zeer ruwe onderzijde zoals bekend van budget ThinkPads zoals deL15of de ThinkPad R500 uit een ver verleden.
Er zijn geen fouten in de afwerking, en de stabiliteit is op een hoog niveau. De met magnesium versterkte basiseenheid kan op geen enkele manier worden verdraaid, en de toetsenbordeenheid geeft alleen in het midden een beetje mee wanneer er gerichte druk wordt uitgeoefend. De scharnieren zijn zeer strak, maar maken het toch mogelijk om met één hand tot een hoek van 180° te openen. Helaas is de ThinkPad een magneet voor vingerafdrukken.
Dankzij hun krachtigere grafische kaarten en in het algemeen sterkere koelsystemen, zijn de ThinkPad P15 en T15g laptops aanzienlijk dikkere workstationlaptops van ongeveer 31,5 mm in vergelijking met de 22,7 mm "dunne" en dus lichtere P15v, wat resulteert in een gewichtsverschil van 600 gram
Volgens de s-suffix (slank) is de ThinkPad P15s nog dunner en lichter.Dell's Precision 5560blijft onverslaanbaar met zijn 14-inch laptopformaat, terwijl HP's ZBook Power 15 vergelijkbare afmetingen heeft als de ThinkPad P15v, maar bijna 300 gram lichter is met 1,97 kg.
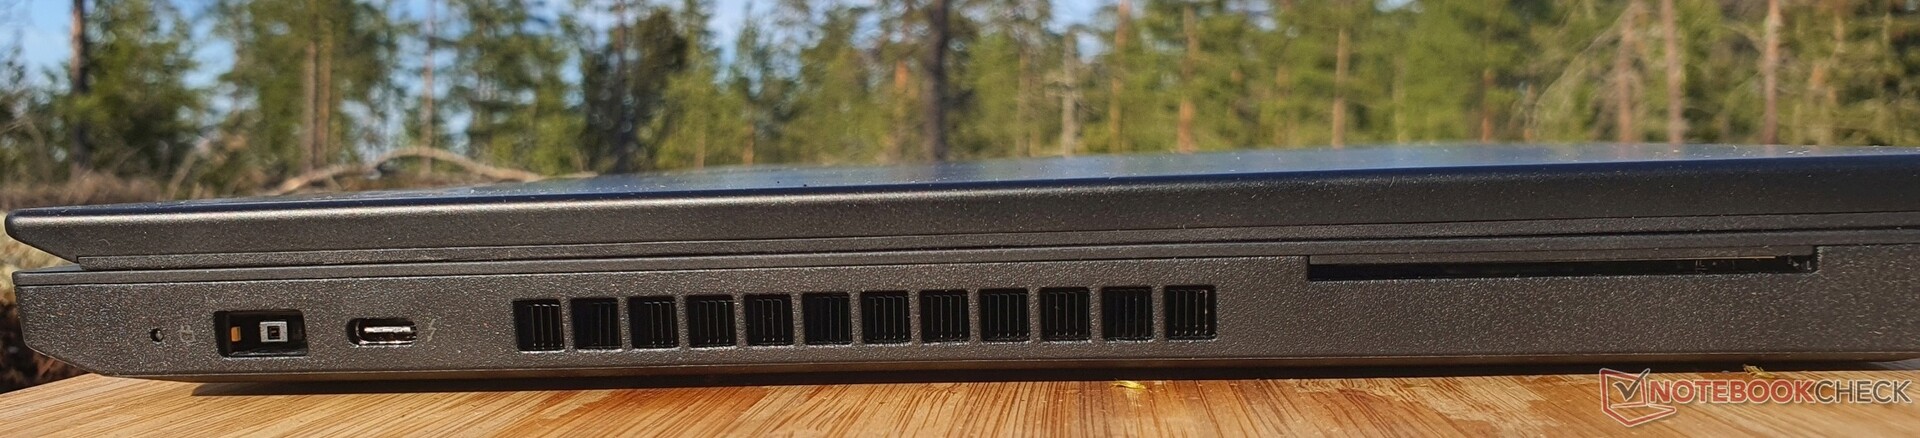
Connectiviteit: Lenovo met vaste Wi-Fi 6 en SD-kaartlezer
De ThinkPad P15v G2 biedt veel poorten: aan de linkerkant bevindt zich de eigen slim-tip oplaadpoort en een Thunderbolt 4-poort, die helaas geen opladen ondersteunt. Daarnaast is er een smartcardlezer en ventilatiesleuven, zodat afvalwarmte geen probleem vormt bij het gebruik van een muis aan de rechterkant
Kenmerken aan de rechterkant zijn twee USB-A 3.2 Gen1 (Always On) poorten, HDMI 2.0, GBit Ethernet en een full-sized SD-kaartlezer, die niet langer worden aangeboden in puur zakelijke ThinkPads zoals de P15's. Modellen met WWAN hebben een SIM-kaartsleuf aan de achterkant van het apparaat die fungeert als een µSD-kaartsleuf als er geen WWAN is geconfigureerd.

SD-kaartlezer
Wat betreft de leessnelheden van bestanden van 1 GB komt de ThinkPad P15v G2 als beste uit de bus in zijn klasse. In de kopieertest blijft hij echter ver achter bij de 200 MB/s van de ThinkPad P15 en Dell Precision 5560 werkstations met ongeveer 96 MB/s.
| SD Card Reader | |
| average JPG Copy Test (av. of 3 runs) | |
| Lenovo ThinkPad P15 G2-20YQ001JGE (AV Pro V60) | |
| Dell Precision 5000 5560 (AV Pro V60) | |
| Lenovo ThinkPad T15g-20UR000GGE (Toshiba Exceria Pro SDXC 64 GB UHS-II) | |
| Gemiddelde van klas Workstation (49.6 - 681, n=14, laatste 2 jaar) | |
| Lenovo ThinkPad P15v G2 21A9000XGE | |
| Lenovo ThinkPad T15p-20TN0006GE (Toshiba Exceria Pro SDXC 64 GB UHS-II) | |
| Lenovo ThinkPad P15s Gen2-20W6000GGE (AV Pro V60) | |
| maximum AS SSD Seq Read Test (1GB) | |
| Lenovo ThinkPad P15v G2 21A9000XGE | |
| Gemiddelde van klas Workstation (87.6 - 1455, n=14, laatste 2 jaar) | |
| Lenovo ThinkPad P15 G2-20YQ001JGE (AV Pro V60) | |
| Lenovo ThinkPad T15g-20UR000GGE (Toshiba Exceria Pro SDXC 64 GB UHS-II) | |
| Dell Precision 5000 5560 (AV Pro V60) | |
| Lenovo ThinkPad T15p-20TN0006GE (Toshiba Exceria Pro SDXC 64 GB UHS-II) | |
| Lenovo ThinkPad P15s Gen2-20W6000GGE (AV Pro V60) | |
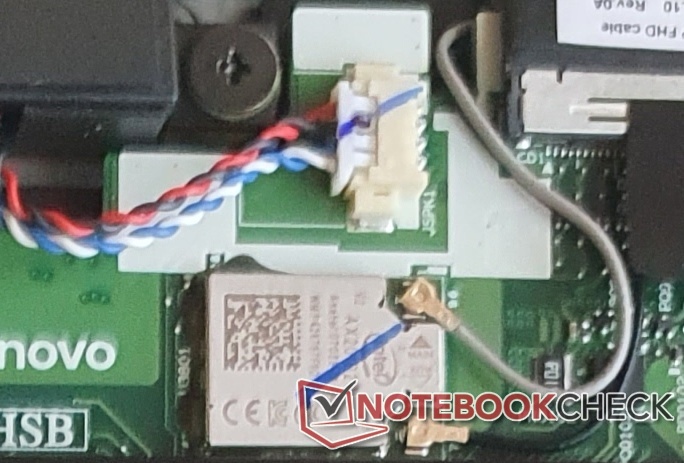
Communicatie
RJ45 Ethernet (1 GBit/s) is aanwezig. Ook is er Intel's Wi-Fi 6 AX201 (permanent geïnstalleerd), waarmee de ThinkPad P15v G2 netwerkgegevens tien keer sneller kan overdragen dan via de kabel, wat op het hoge niveau van de concurrentie ligt. Een bestaande M.2-Slot (en de bijbehorende antennekabels) maakt de installatie van een WWAN-kaart mogelijk, maar deze kan ook voorgeïnstalleerd worden besteld
Webcam

Hoewel de camera slechts een belabberde 720p biedt, zijn de modelkwaliteiten van de gebruiker wel te zien.


Veiligheid
Zuiver zakelijke laptops zoals de ThinkPad P15v bieden tal van beveiligingsfuncties, zoals een smartcardlezer, een vingerafdruklezer in de palmsteun, een Kensington-beveiligingsslot, TPM 2.0, en een infraroodcamera voor Windows Hello met een geïntegreerde ThinkShutter (sluiter voor de webcam).
Accessoires
Buiten de vrij compacte 135 watt slanke stroomadapter worden er geen accessoires meegeleverd bij aankoop. Een expliciete dockingpoort is ook achterwege gelaten en Thunderbolt oplossingen ontbreken door de onmogelijkheid om via USB-C op te laden. Alleen een speciale docking variant die de eigen laadpoort combineert met Thunderbolt kan worden gebruikt: deThinkPad Thunderbolt 3 Workstation Dock Gen 2.
De verpakking van Lenovo kan niet echt als milieuvriendelijk worden omschreven, ook al zijn de verpakking en de doos zeer eenvoudig gehouden.
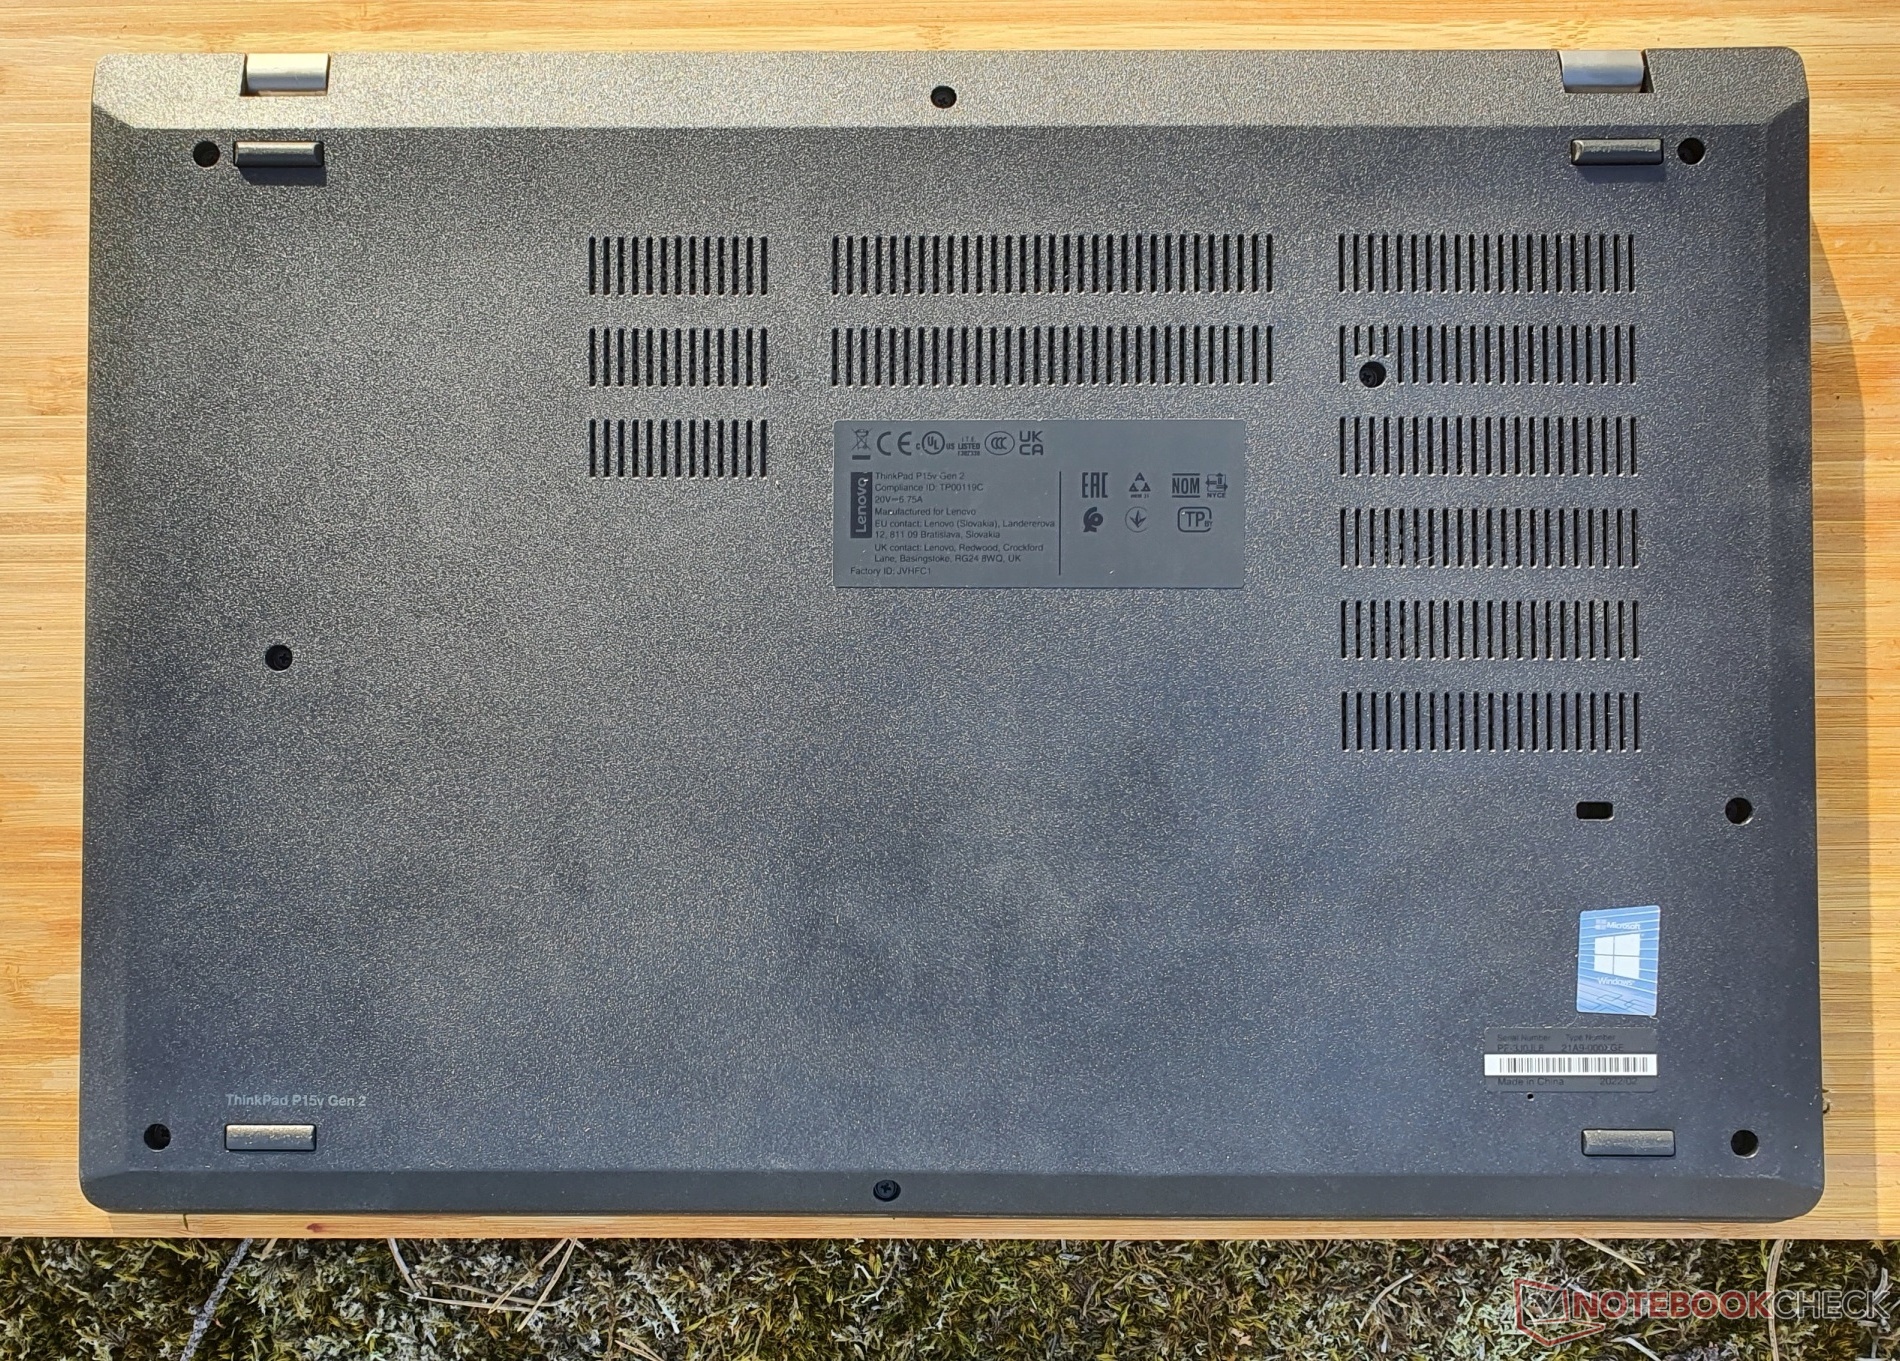
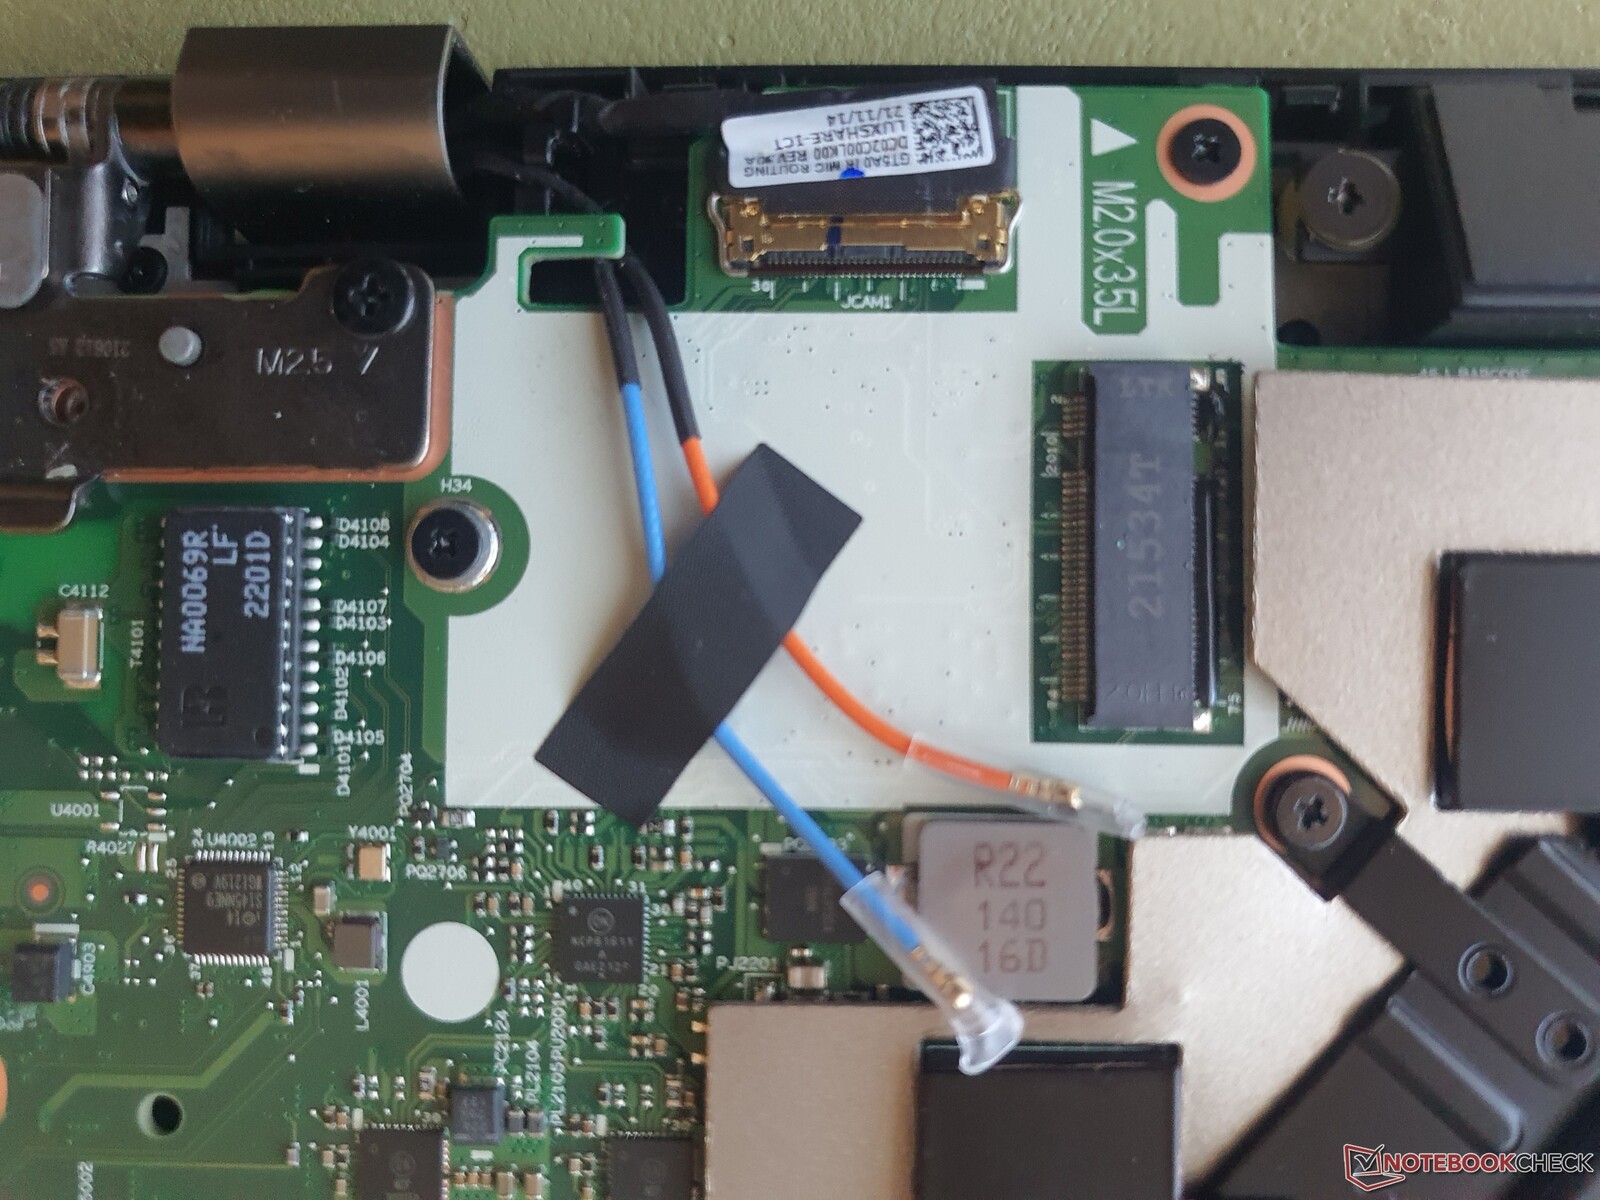
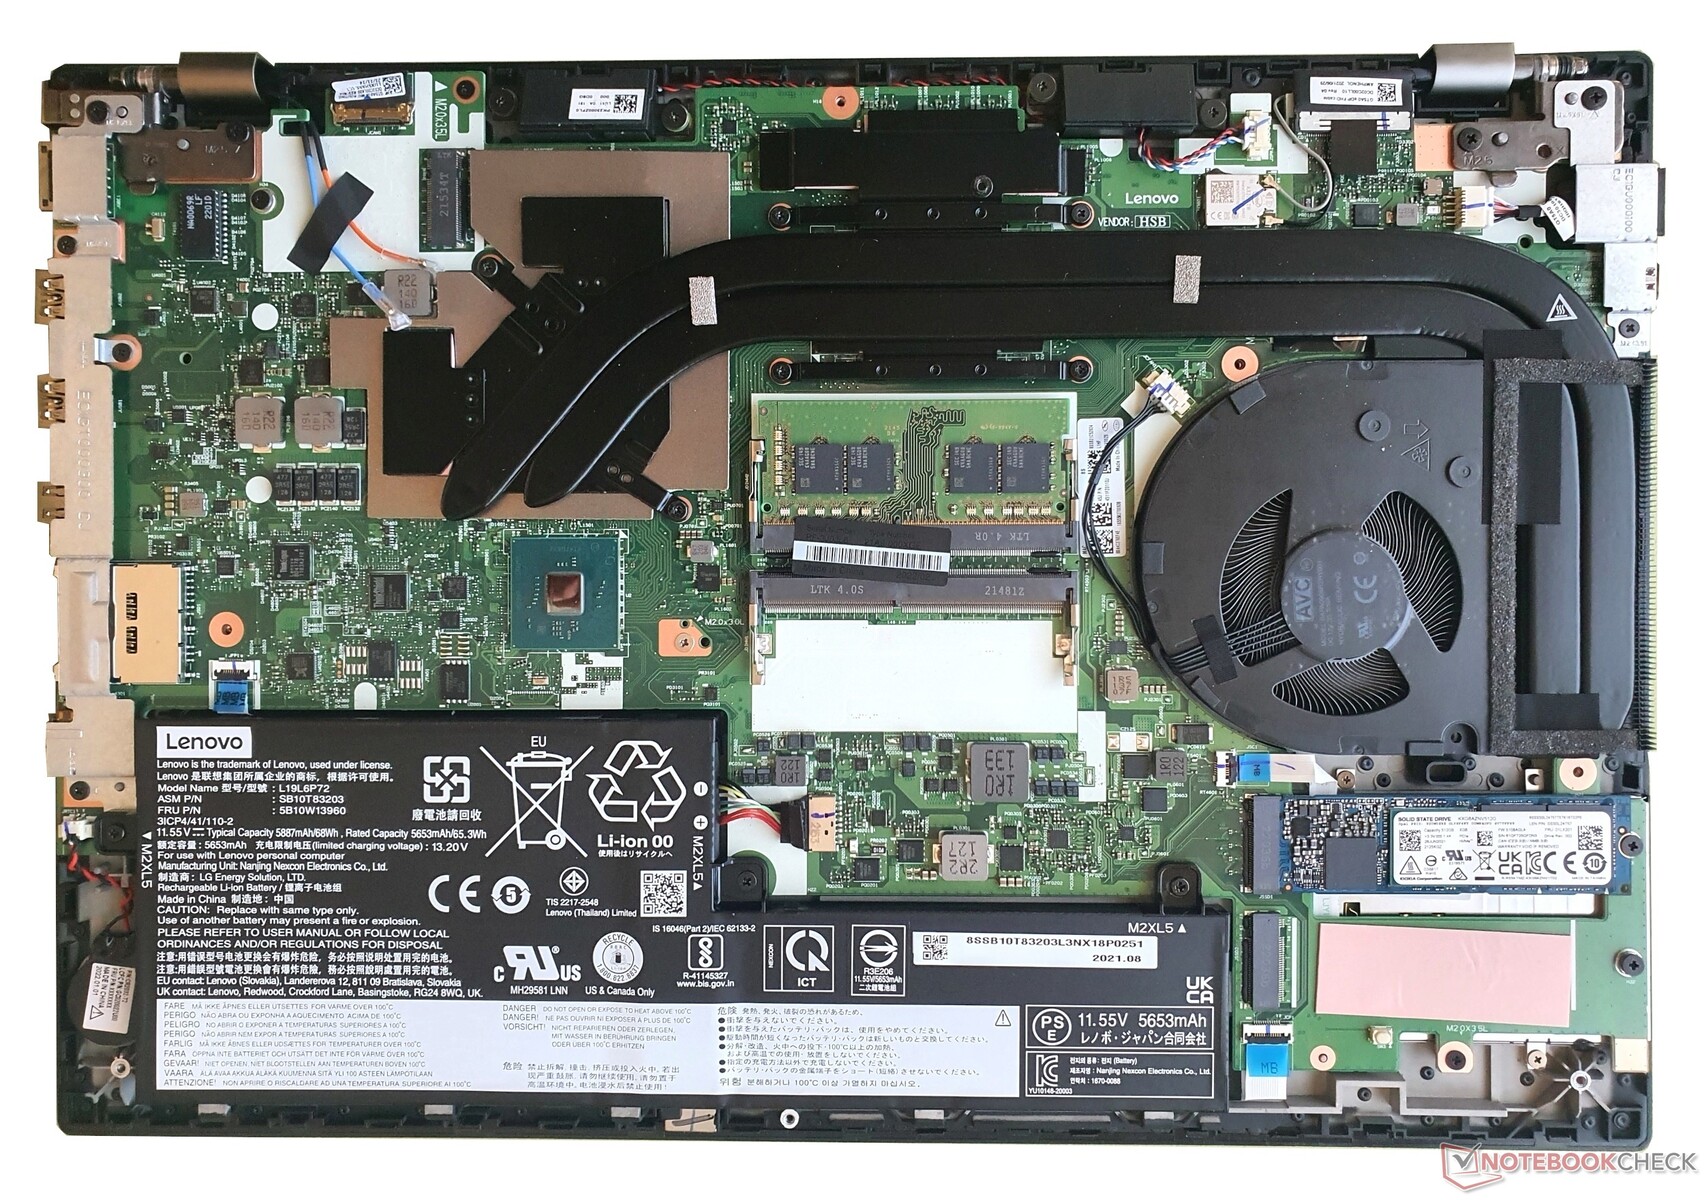
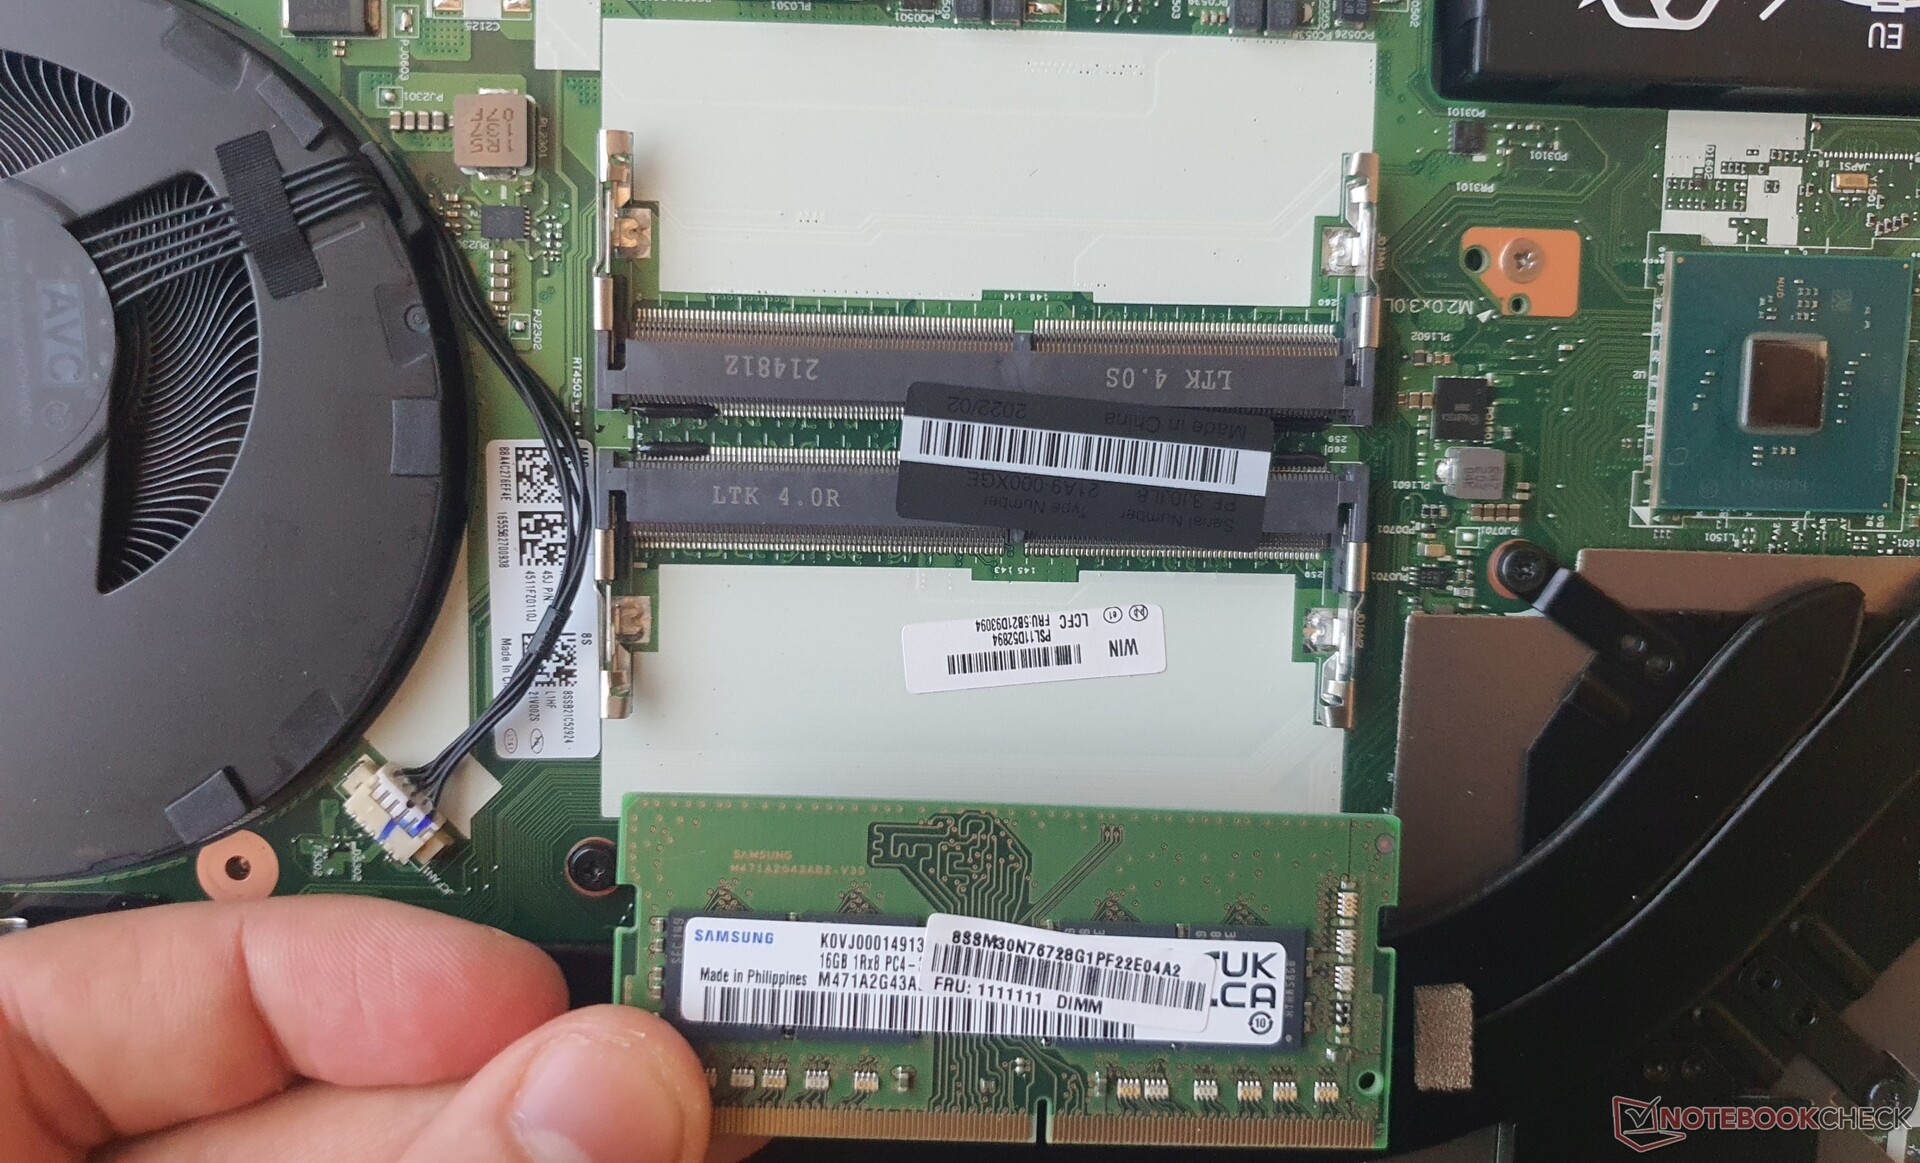
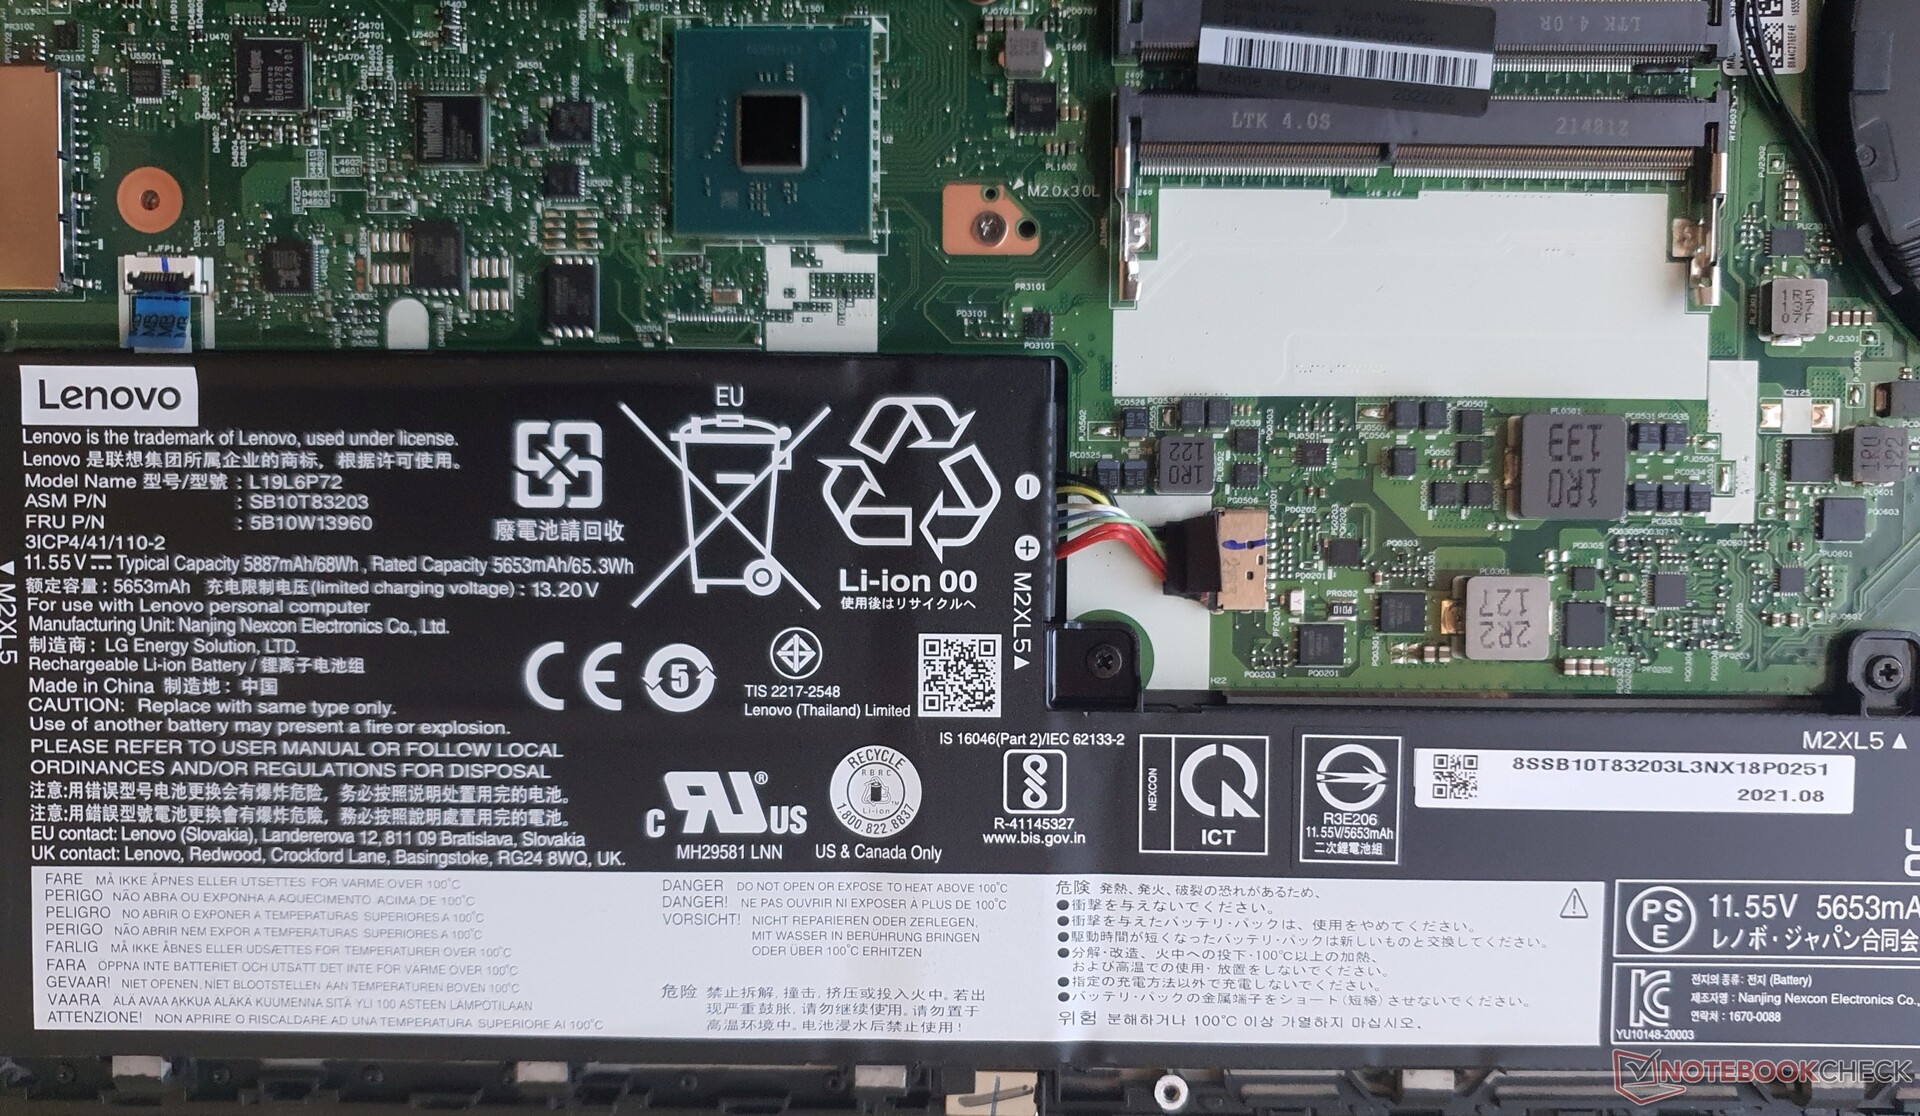
Onderhoud
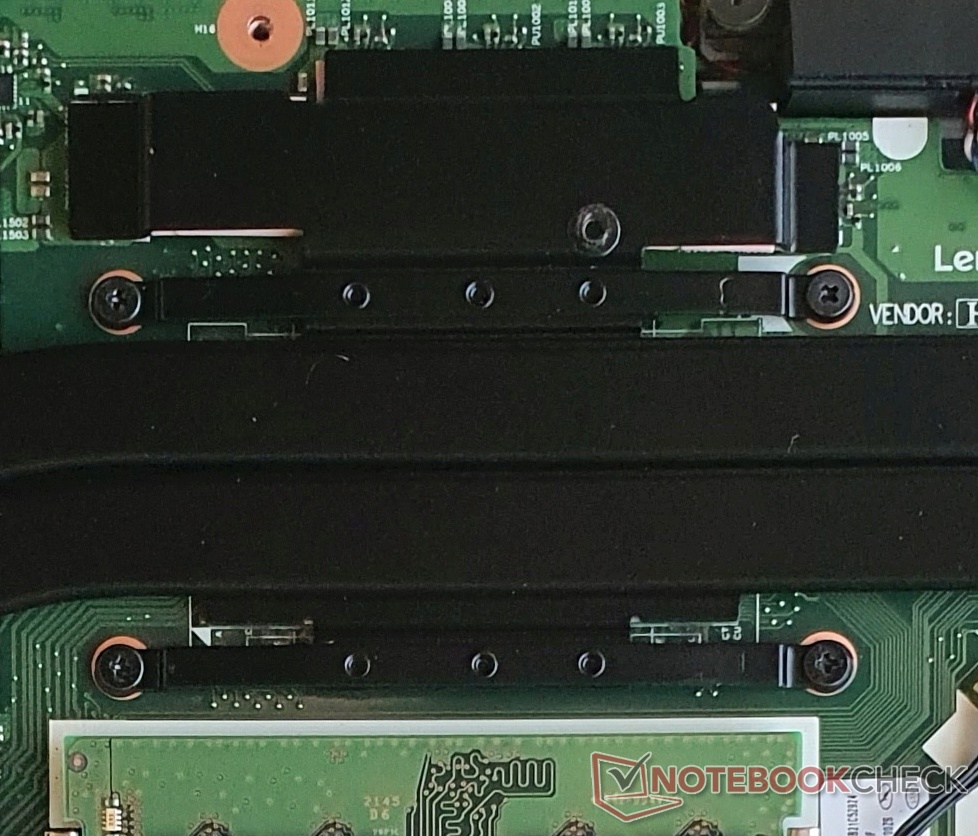
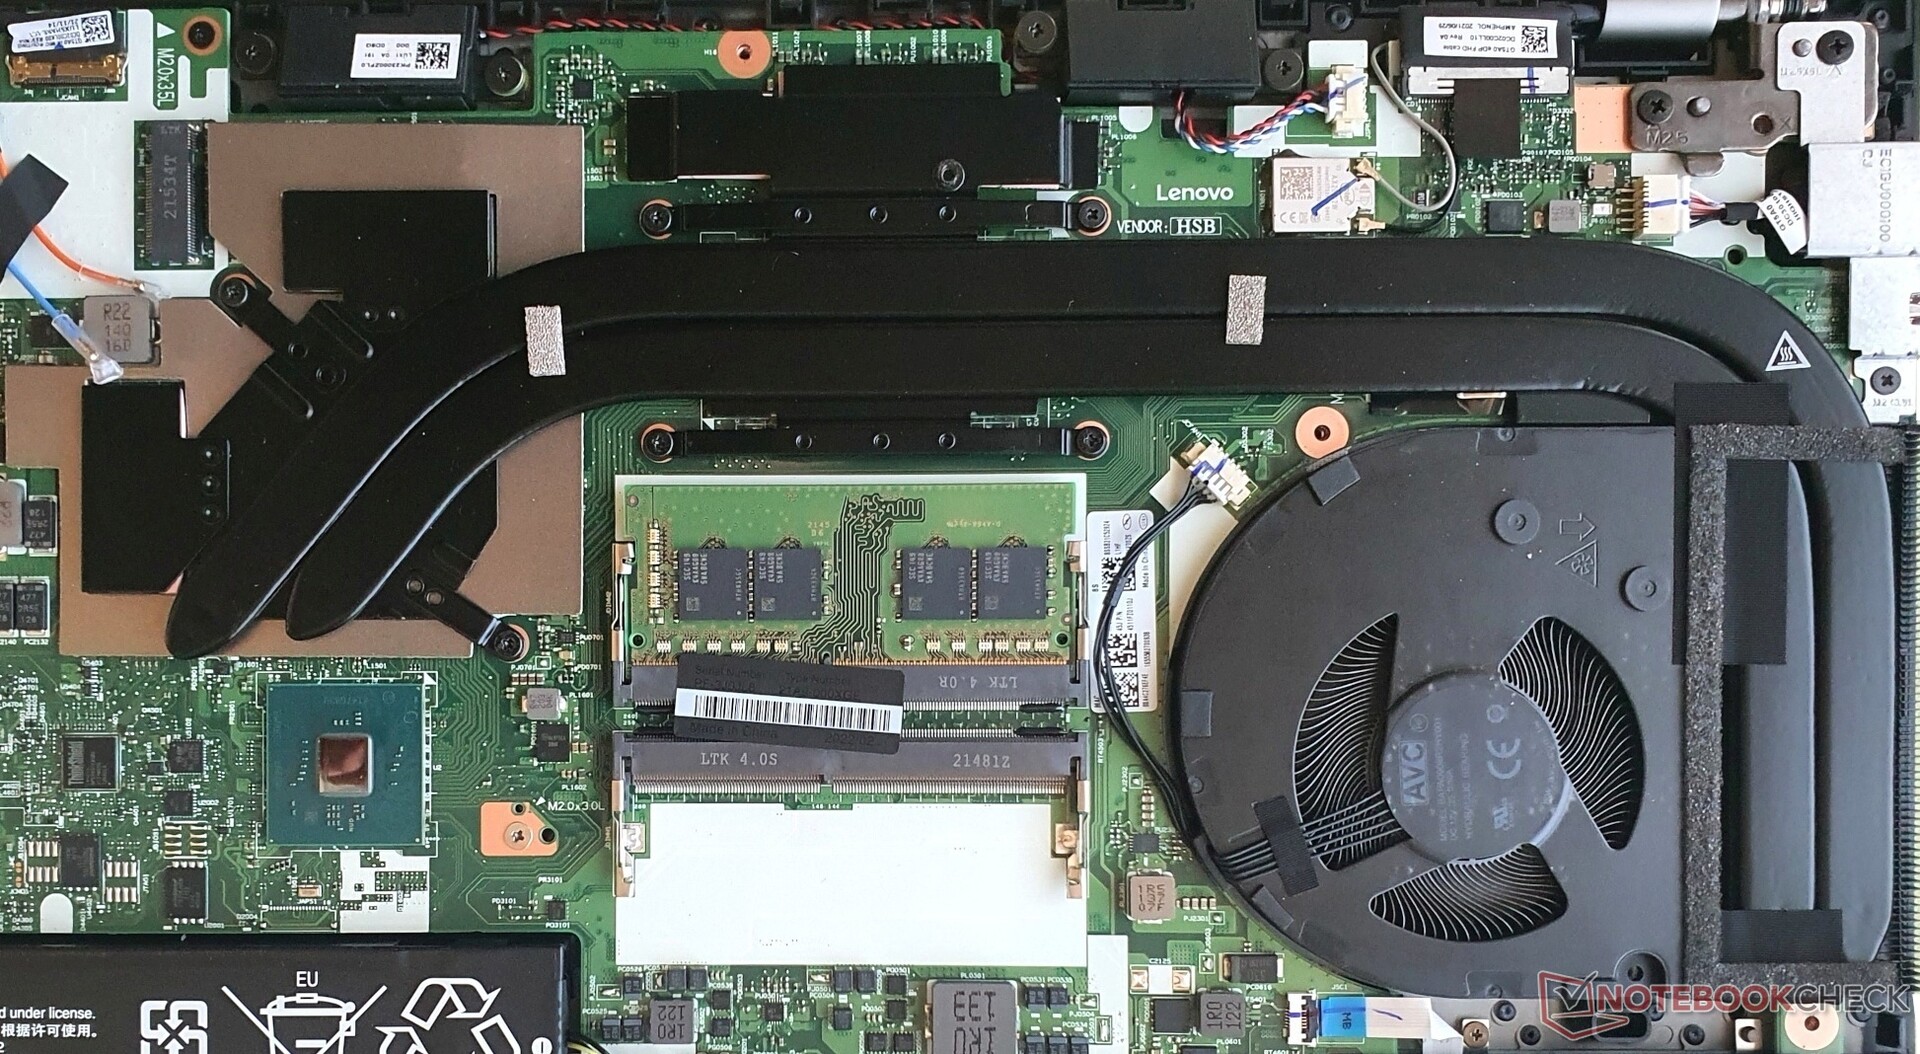
Ondanks verschillende plastic clips is de bodemplaat vrij gemakkelijk te verwijderen. De negen schroeven zijn snel los, terwijl er een aantal vast blijven zitten in de behuizing. Bij het openen heb je toegang tot het RAM (1 vrij slot), de M.2-2280-SSD (1 vrij slot), de ventilator, die vervangbaar is (inclusief de heat pipe), en de 68 Wh batterij, die ook vervangbaar is. De WLAN module is permanent geïnstalleerd
Een ander nuttig aspect is dat het toetsenbord gemakkelijk kan worden vervangen als het na jaren typen versleten of defect is geraakt.
Garantie
Net als alle ThinkPads uit het hogere segment (T/X/P-serie) biedt Lenovo Duitsland een garantie van drie jaar voor de P15v G2-laptop, inclusief ophalen en retourneren. Reparaties ter plaatse zijn ook mogelijk tegen een meerprijs, net als Bescherming tegen onopzettelijke schade, Premier Support of verlenging van de garantie tot 5 jaar.
Opmerking voor internationale lezers: Het garantiebeleid van Lenovo kan per regio verschillen, dus controleer zeker de website van Lenovo (indien van toepassing) voor het land van aankoop
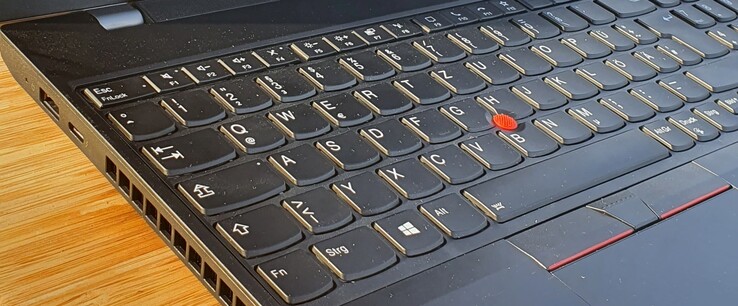
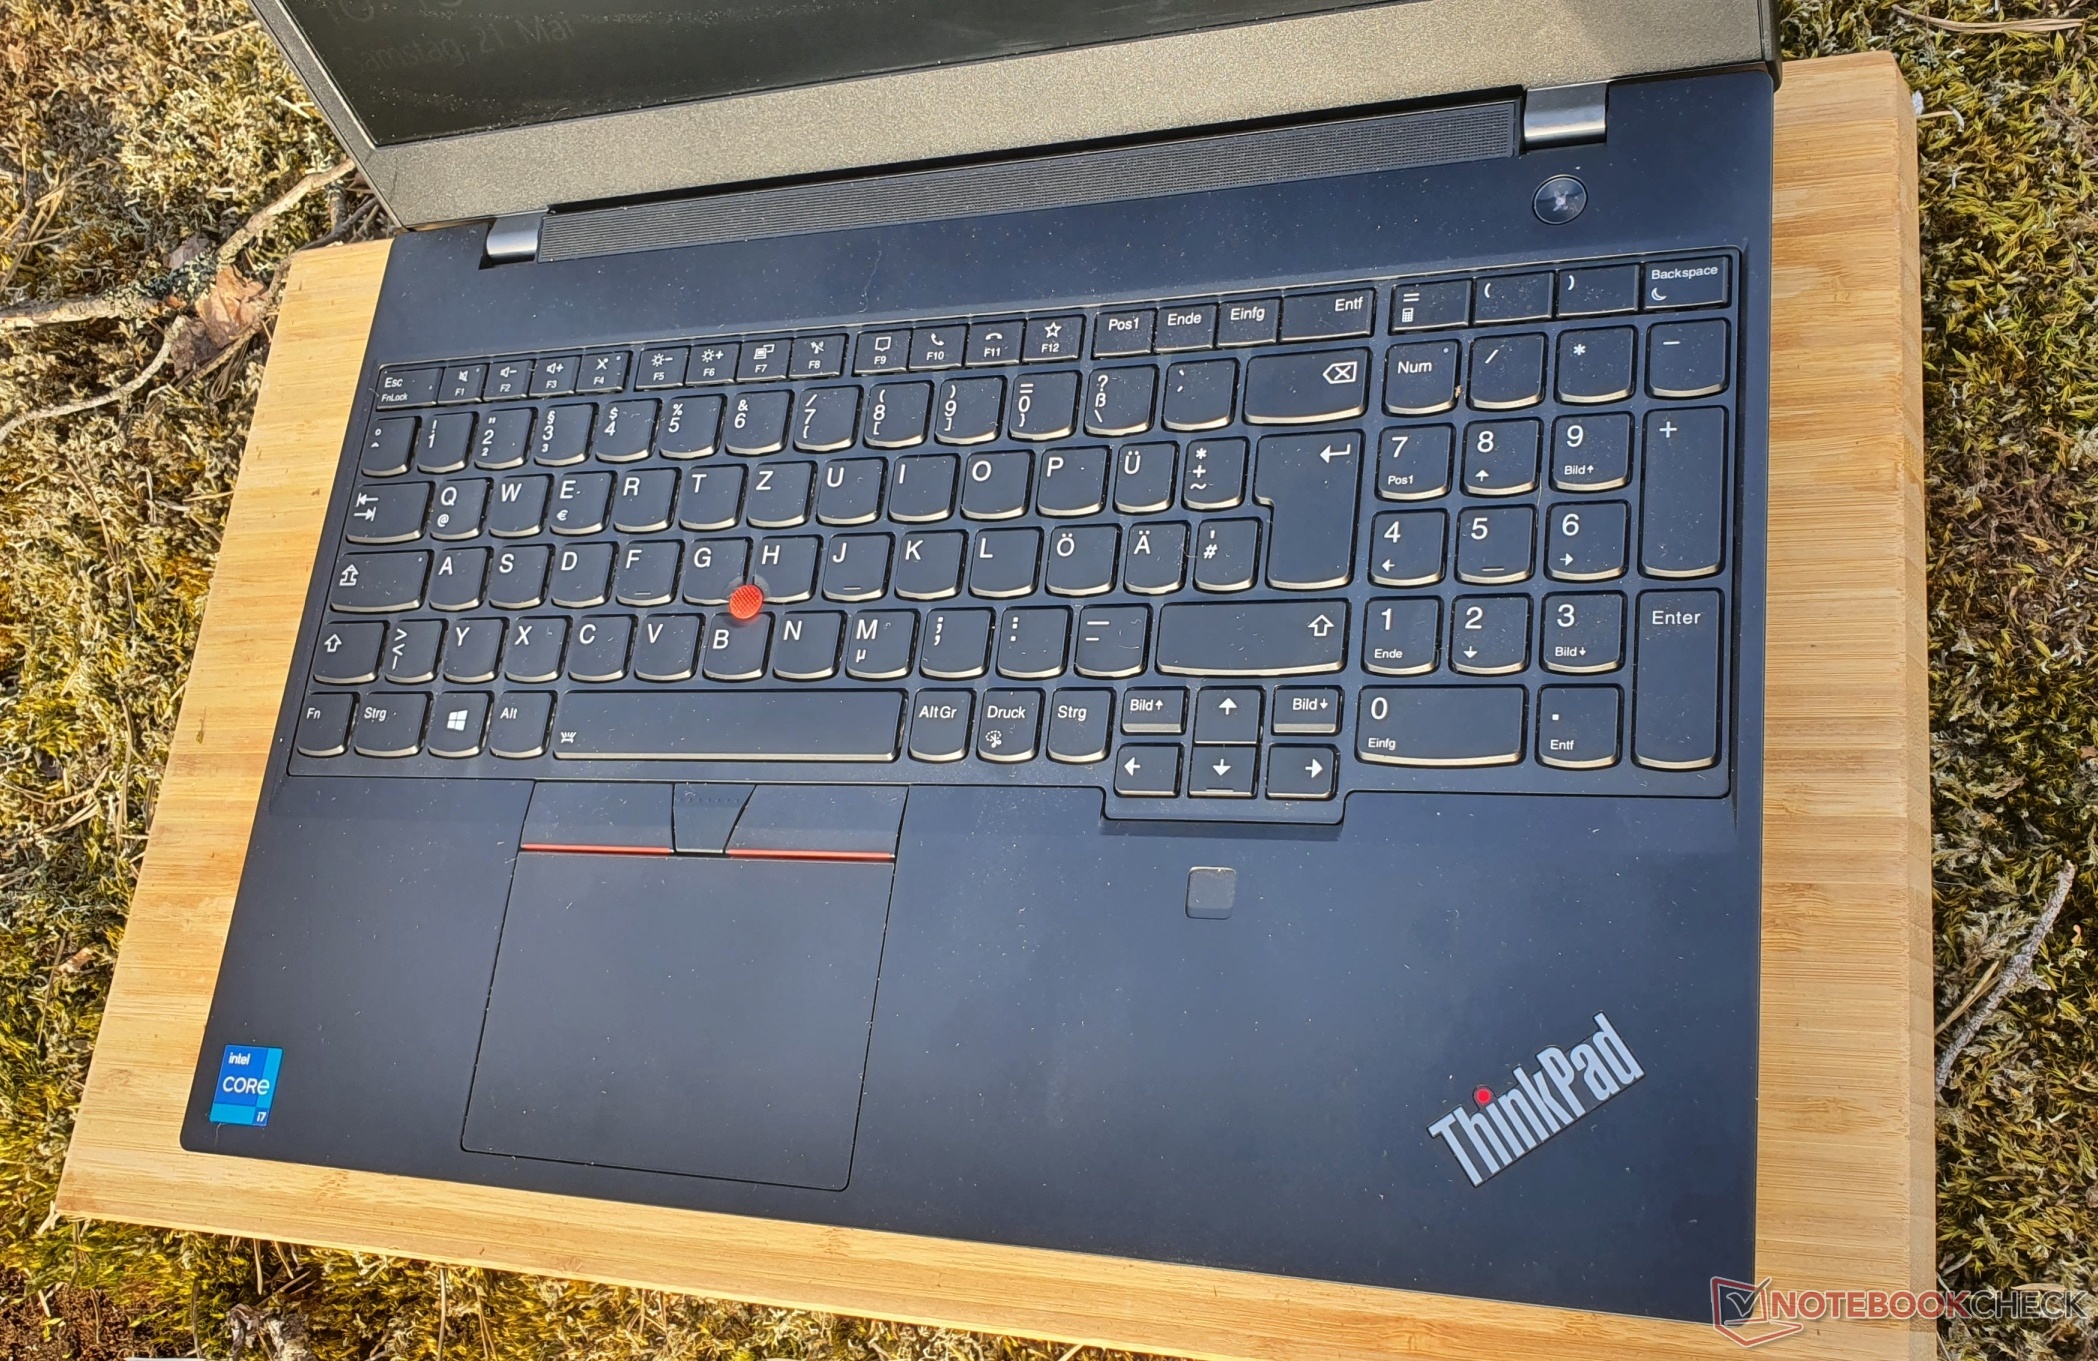
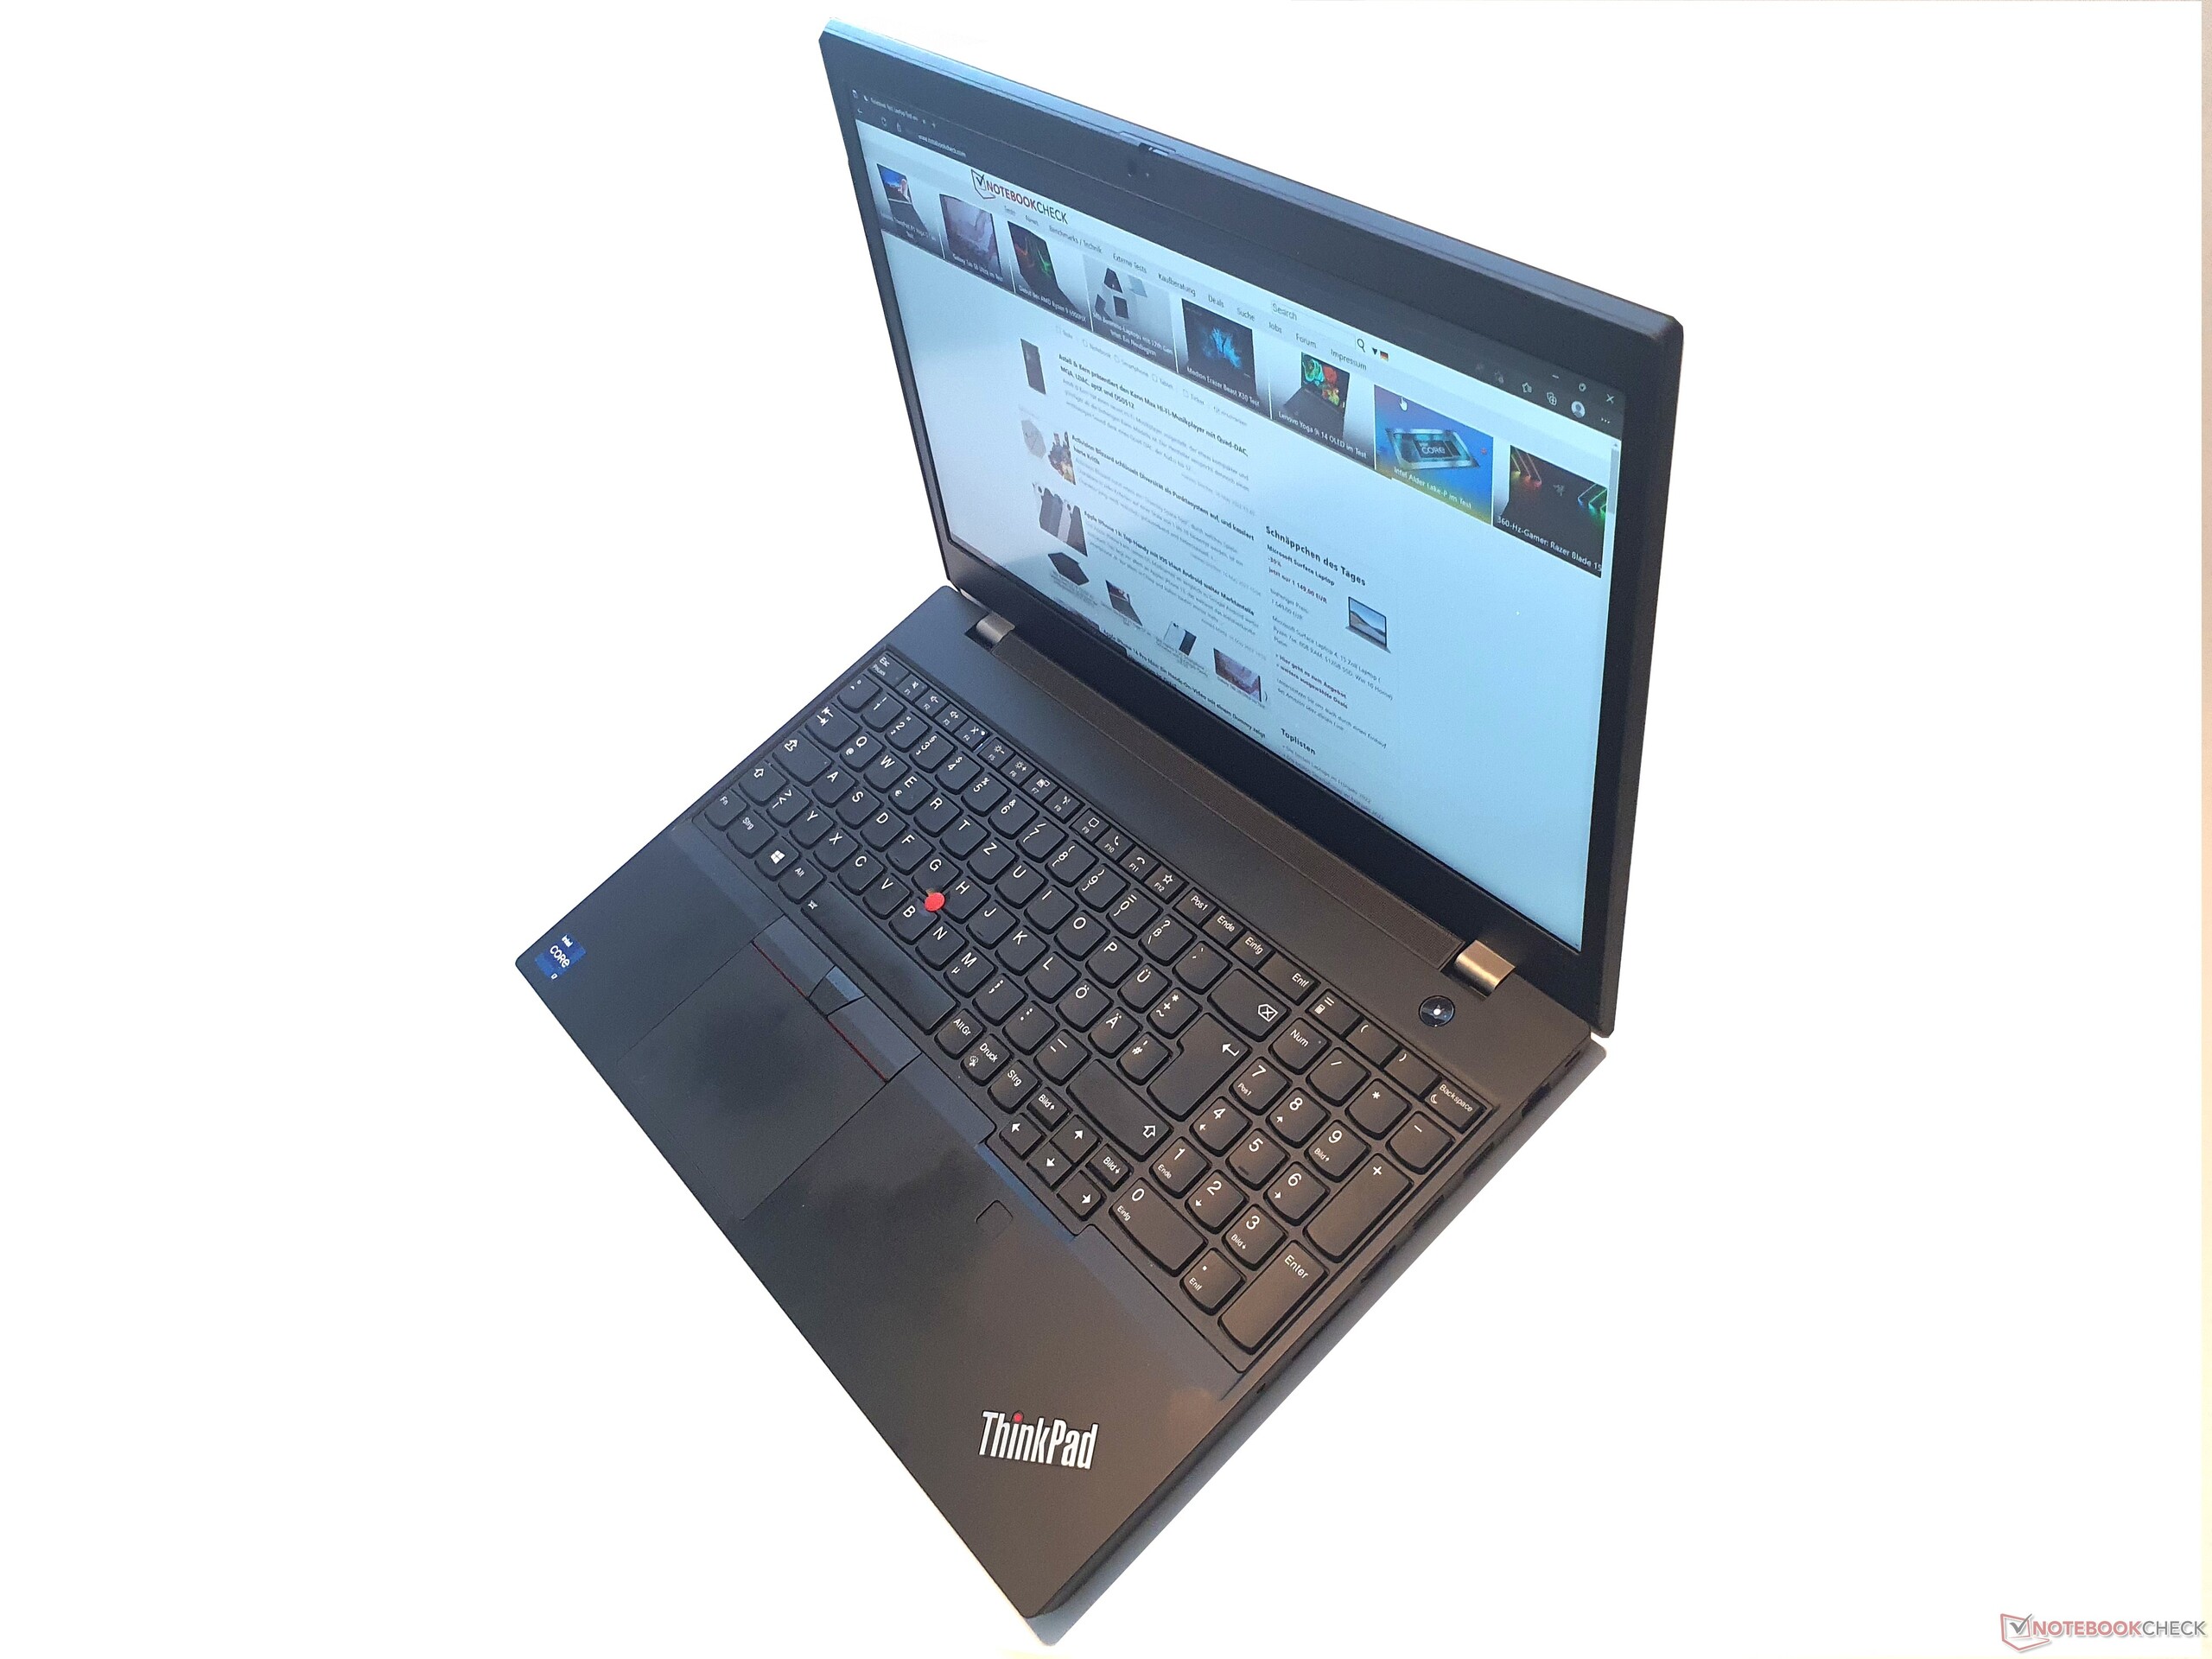
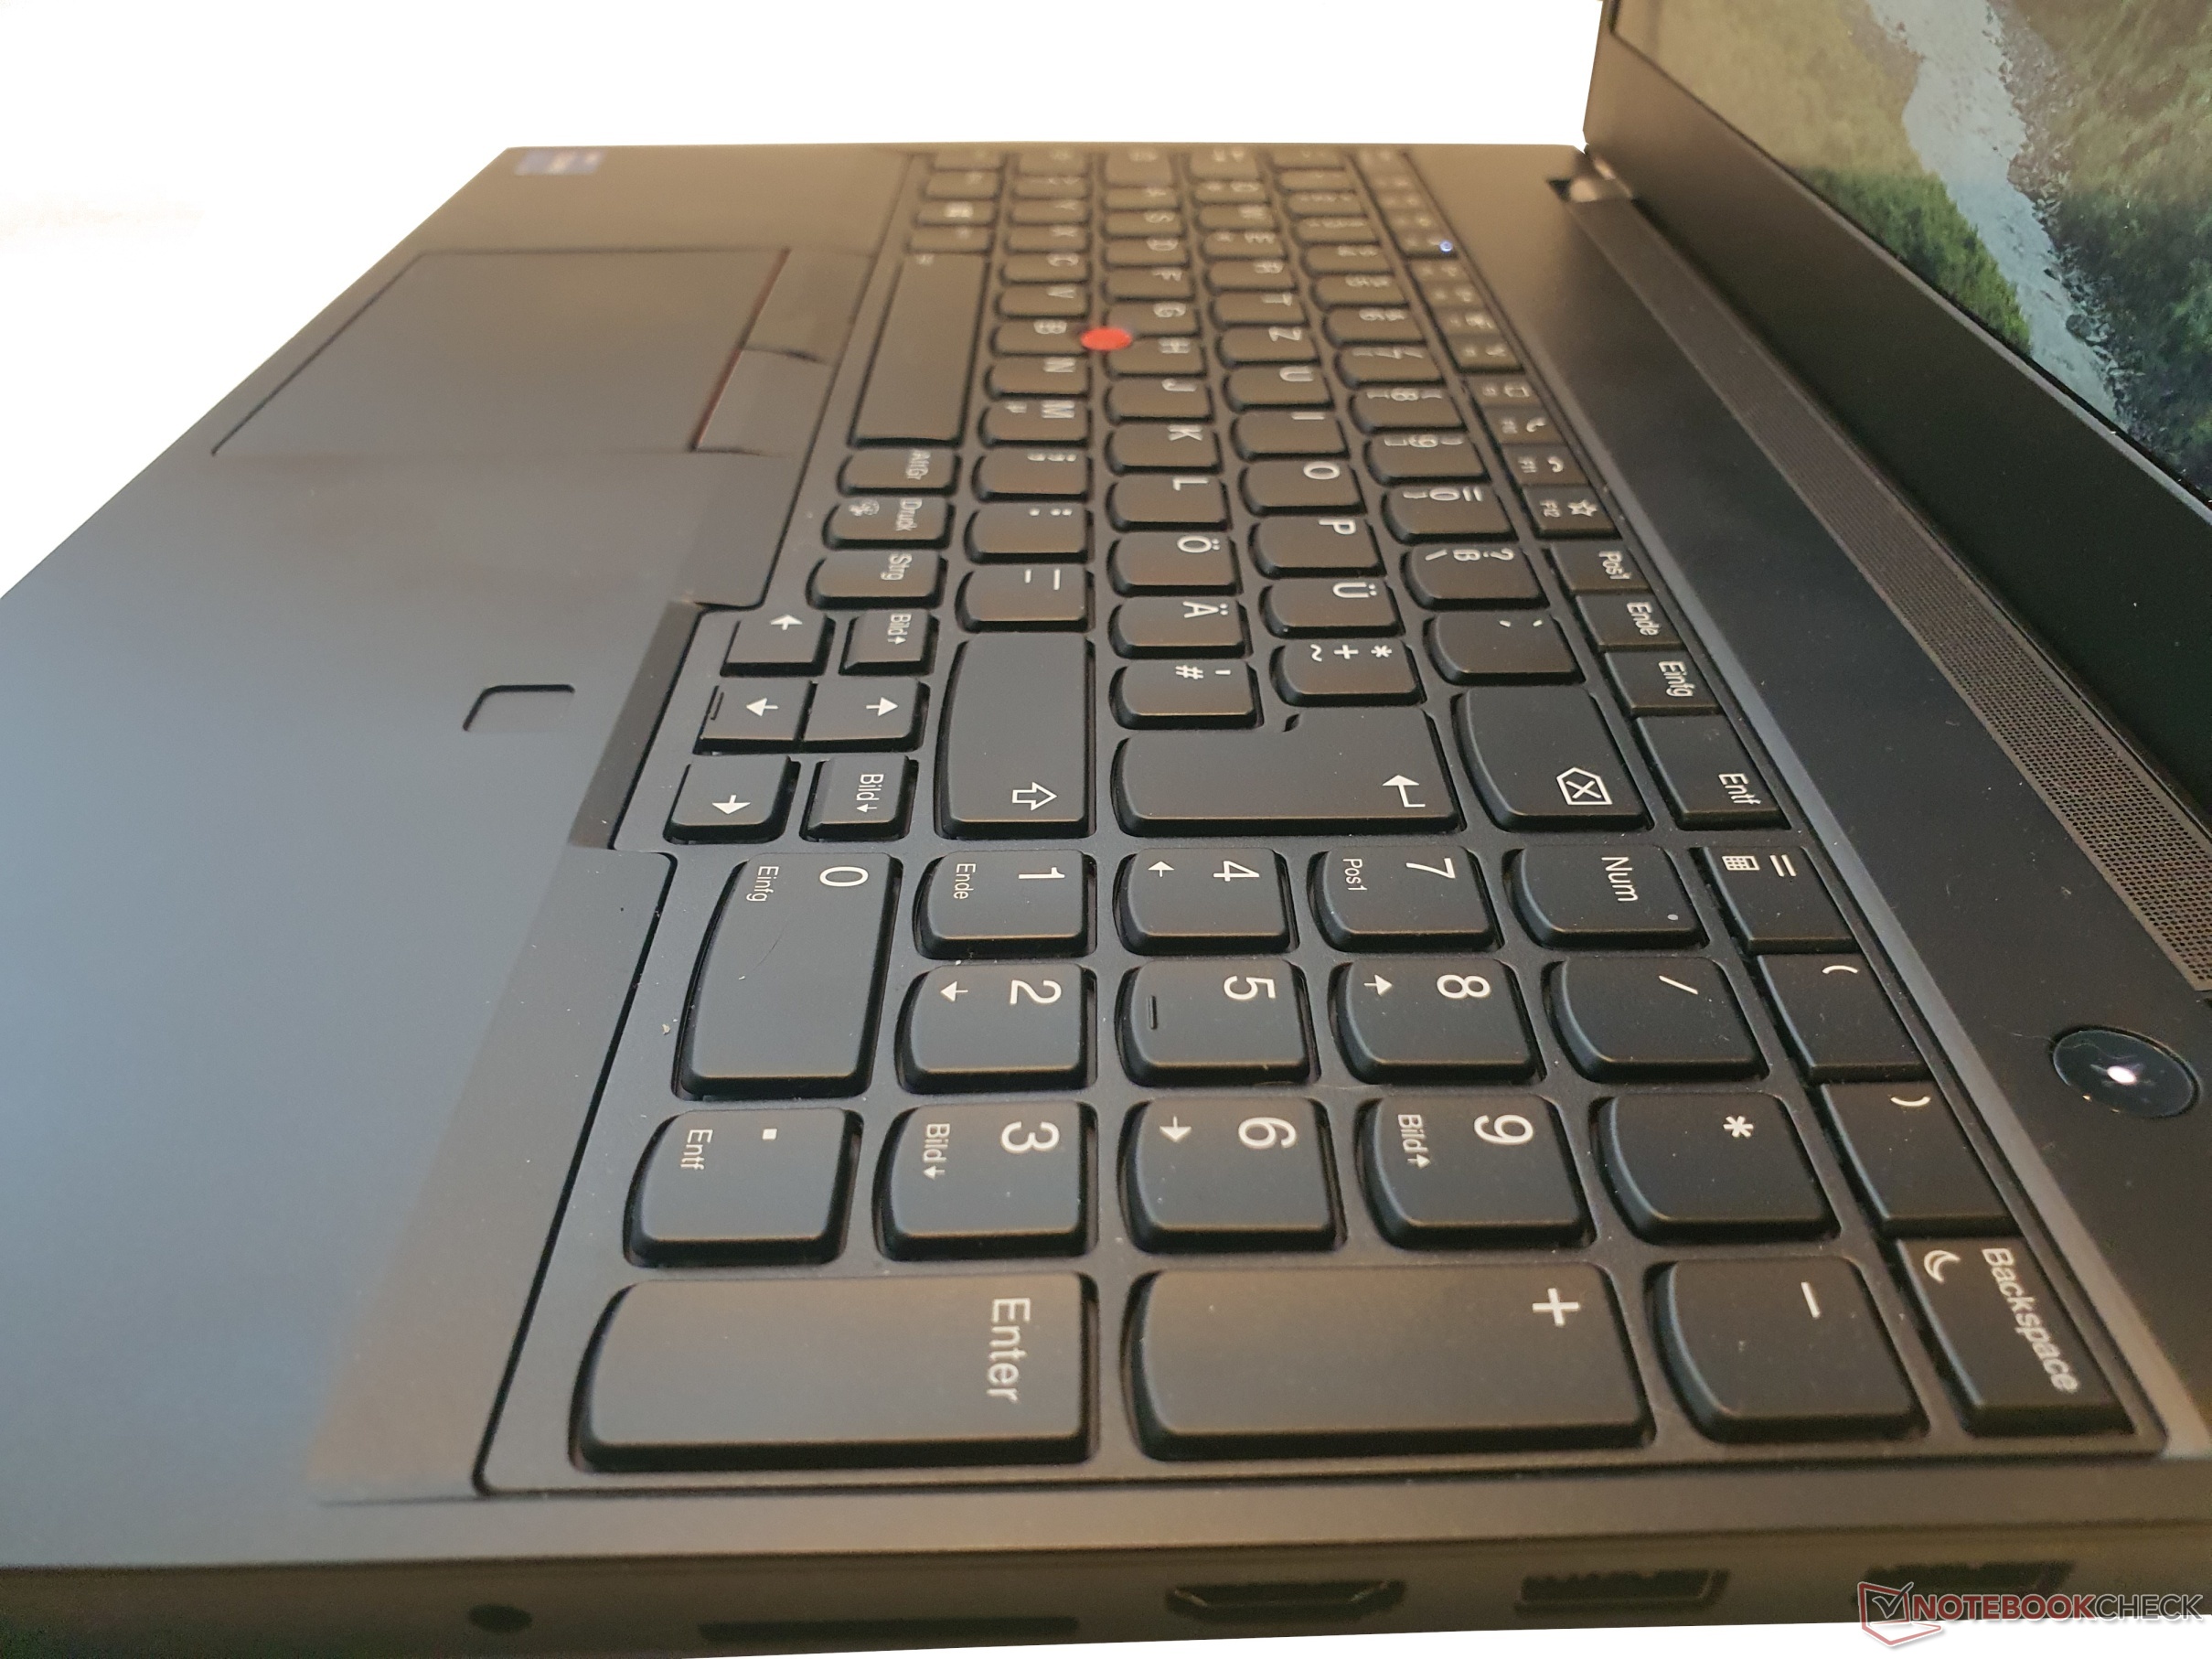
ThinkPad invoerapparaten: Lenovo met fatsoenlijke 1,8 mm travel
Toetsenbord
Het spatwaterdichte toetsenbord van Lenovo is zeer comfortabel in gebruik met zijn toetsen van 15 x 15 mm en een travel van 1,8 mm. Dit is bij veel ThinkPads al teruggebracht tot 1,5 mm. Het drukpunt van de gladde, licht holle toetsen is duidelijk merkbaar en de aanslag zeer bevredigend. Aan de andere kant heeft het toetsenbord van de HP ZBook Power 15 een nog scherper drukpunt (naar de mening van de tester), maar een kortere travel. Bij twijfel, test de toetsenborden alvorens te kopen.
Over het algemeen is de lay-out erg goed, mede dankzij de speciale navigatie en de vrij grote pijltjestoetsen. Alleen de vier toetsen links van de Enter en die in de bovenste rij zijn wat kleiner. Er is ook een numeriek toetsenblok, wat de invoer van werkstation-gerelateerde gegevens kan vereenvoudigen. Zelfs onder gerichte druk geeft het toetsenbord niet mee. De achtergrondverlichting heeft twee instelniveaus.
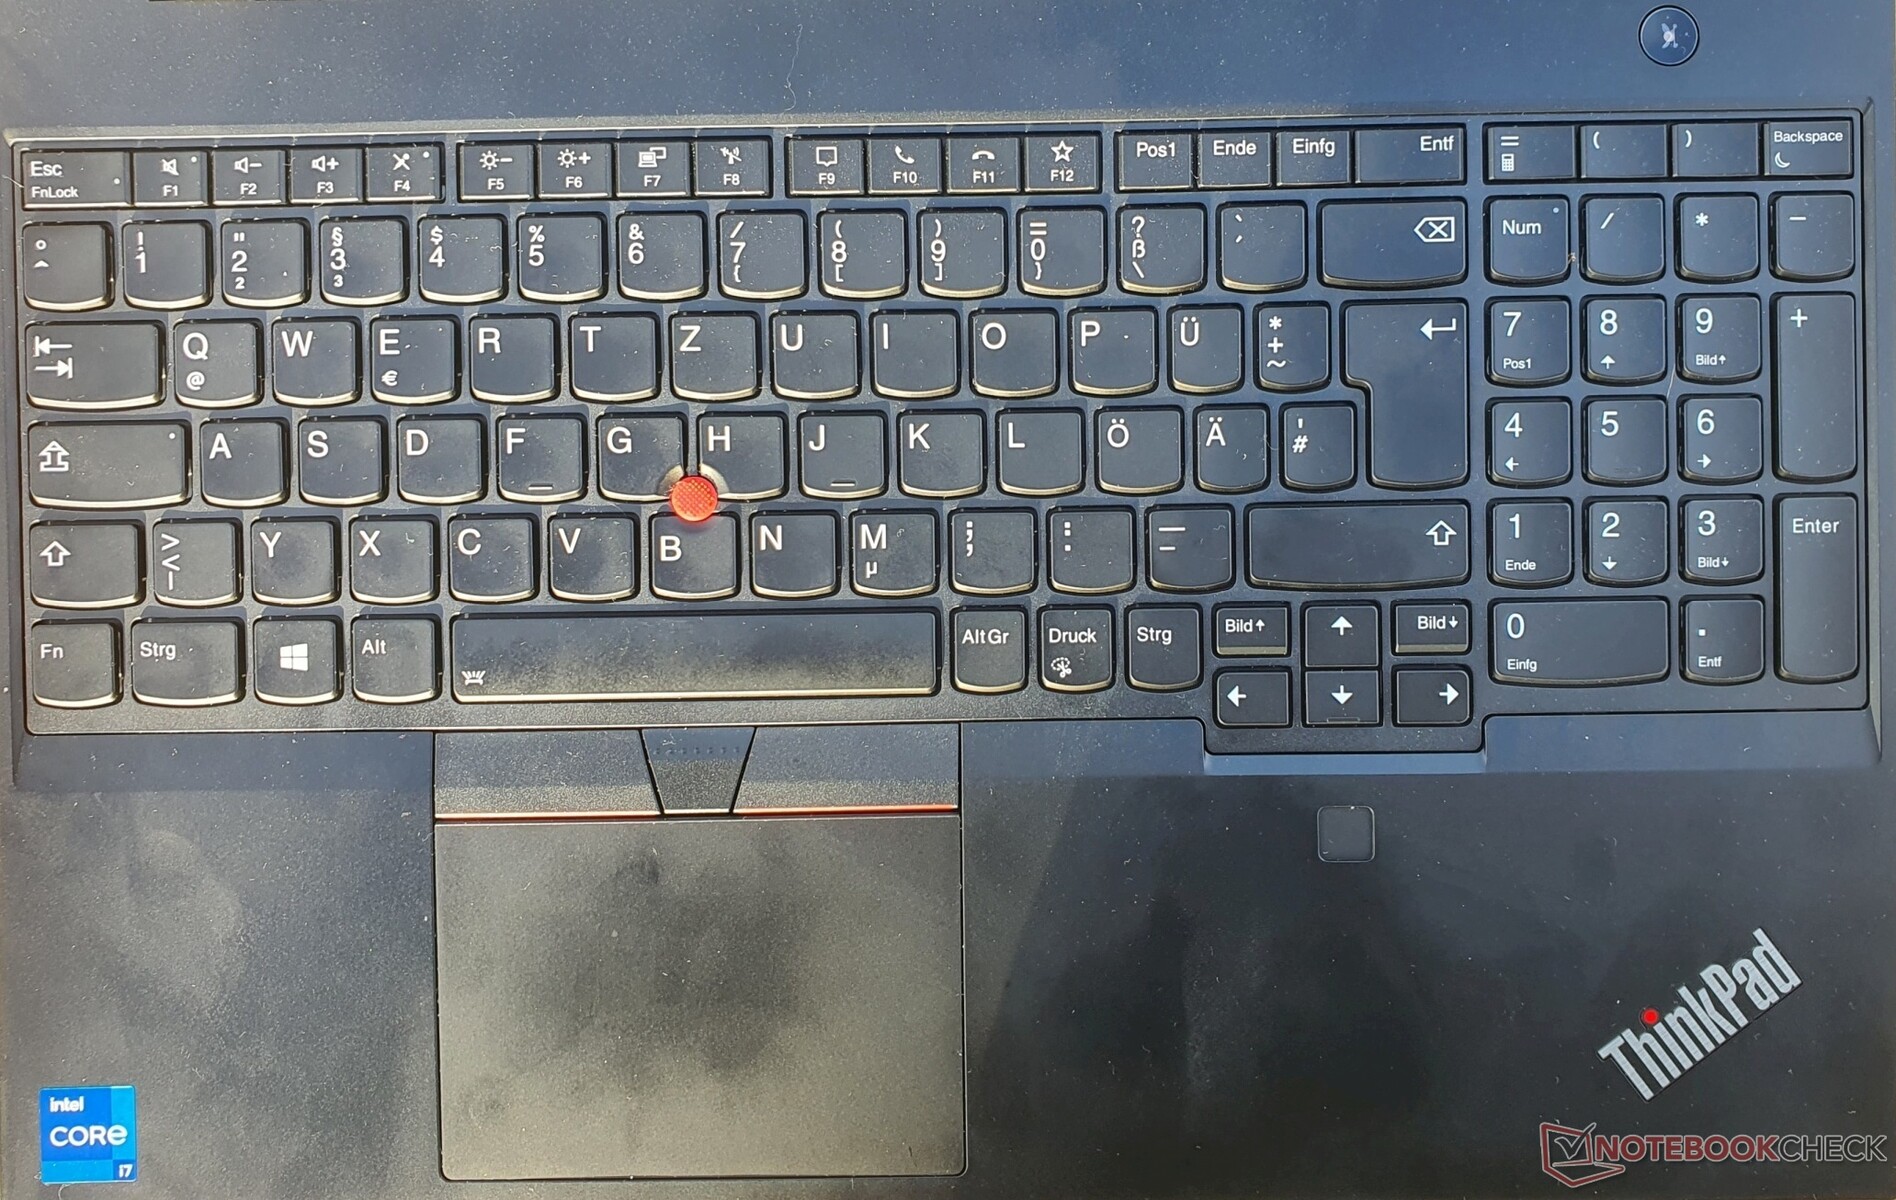
Touchpad & TrackPoint
Het middelgrote touchpad meet 10 x 7 cm en heeft een glad Mylar oppervlak met behoorlijke glijeigenschappen. De geïntegreerde klikknoppen hebben een volledige val en een goed gedoseerd drukpunt.
Met een beetje oefening kan met het TrackPoint en de drie knoppen de muiscursor zeer nauwkeurig worden bestuurd, wat als voordeel heeft dat je je hand niet van het toetsenbord hoeft te halen. Scrollen in combinatie met de middelste knop is ook handig.
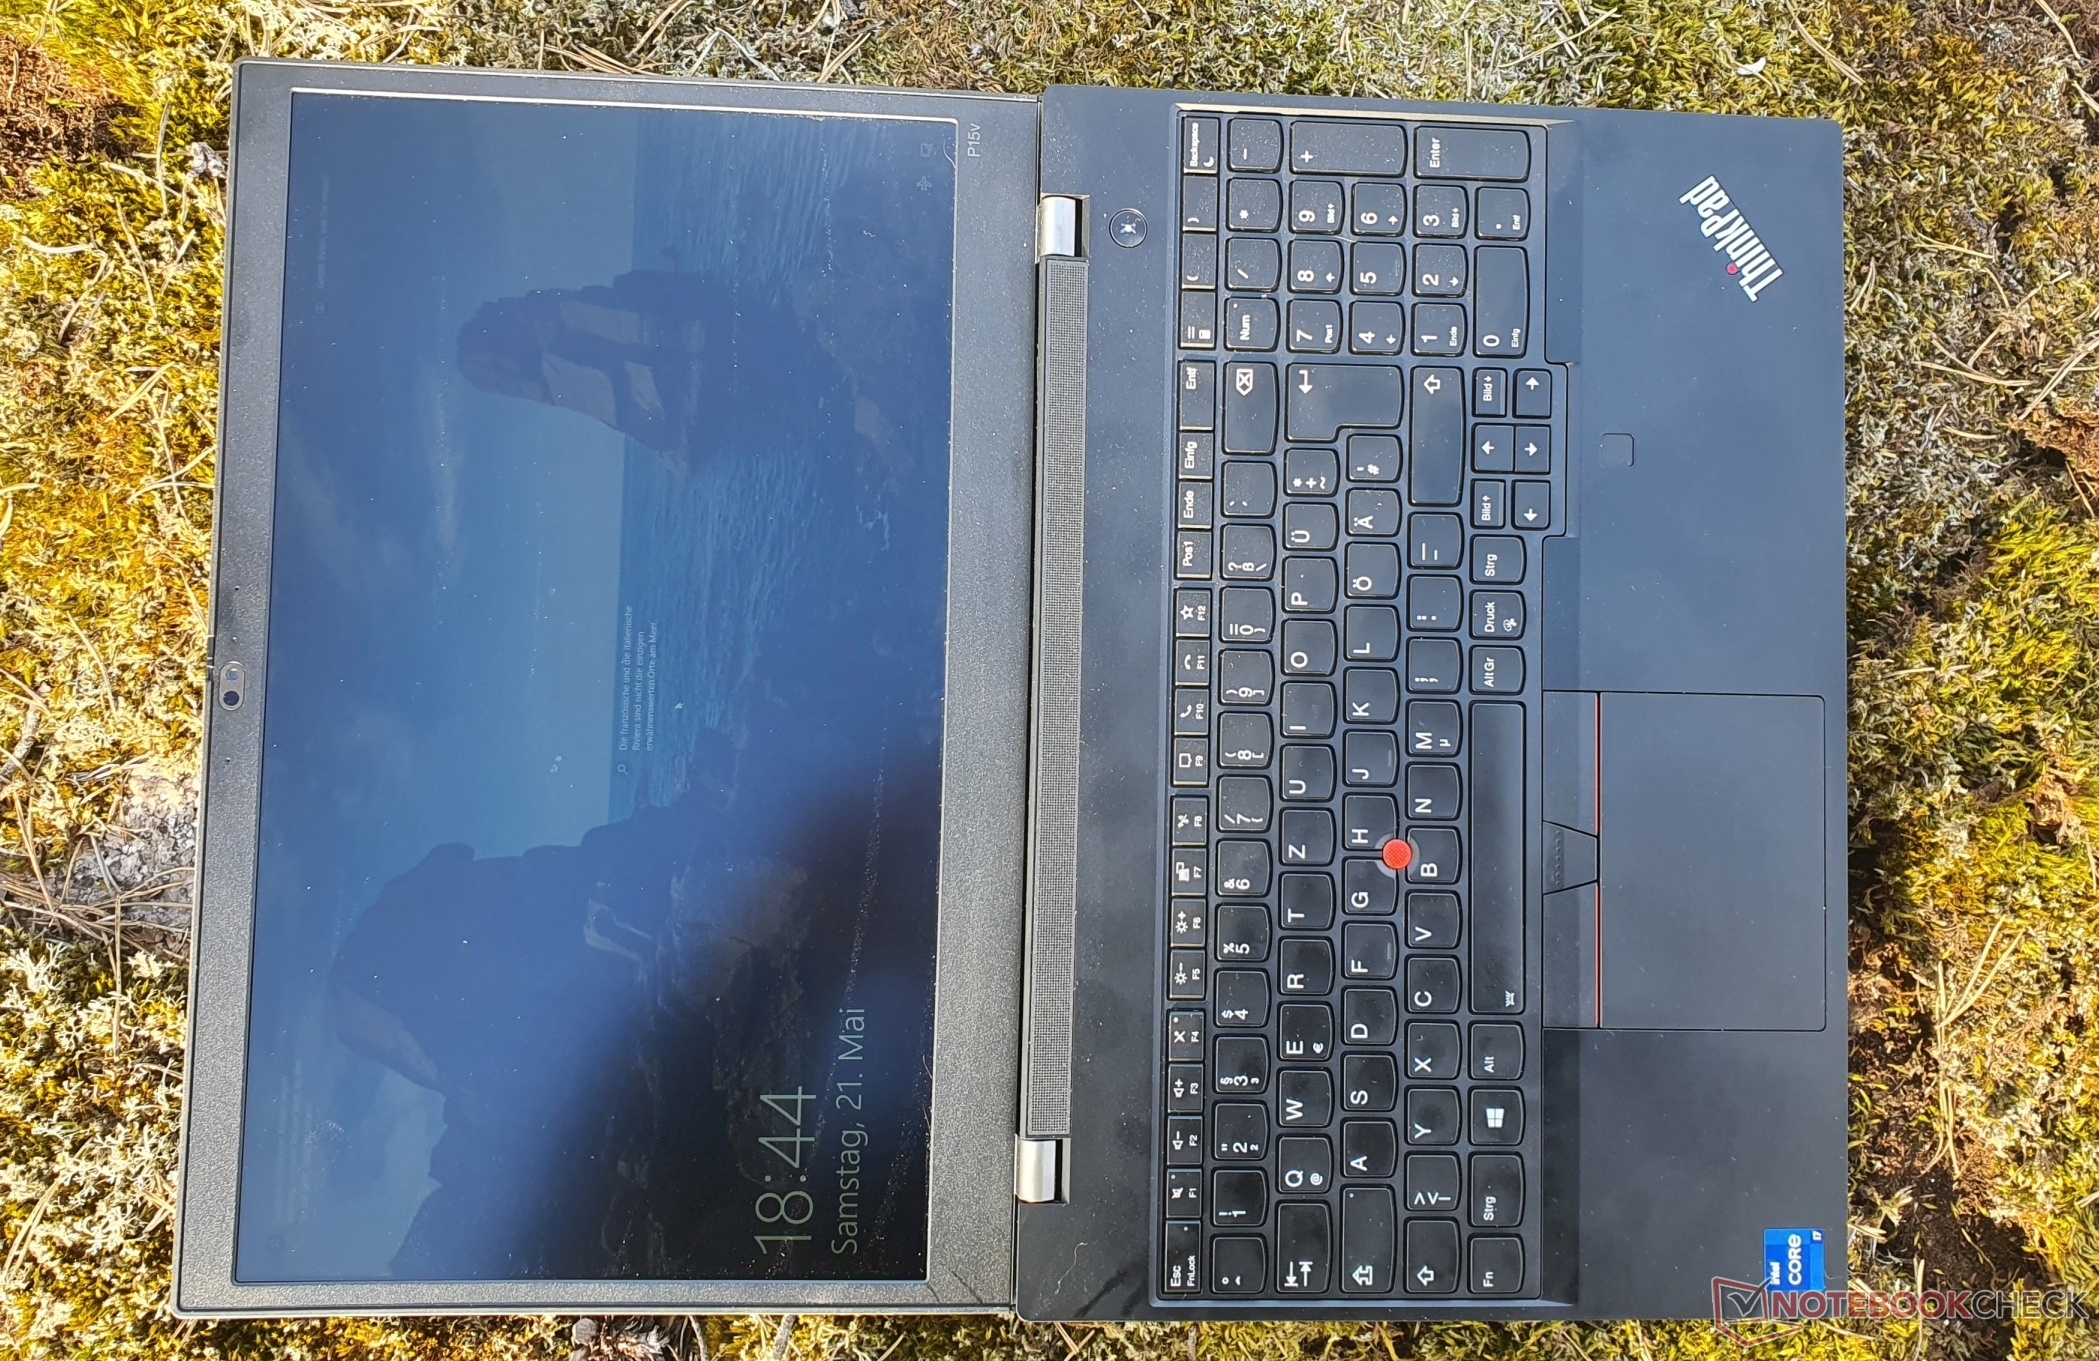
Optioneel 4K-scherm op de ThinkPad P15v G2
Lenovo biedt in totaal vier matte 15,6-inch beeldschermopties in 16:9-formaat voor de ThinkPad P15v G2:
FHD (1920x1080) IPS, 300 nits, 45% NTSC.
FHD (1920x1080) IPS touch, 300 nits, 45% sRGB
FHD (1920x1080) IPS, 300 nits, 100% sRGB
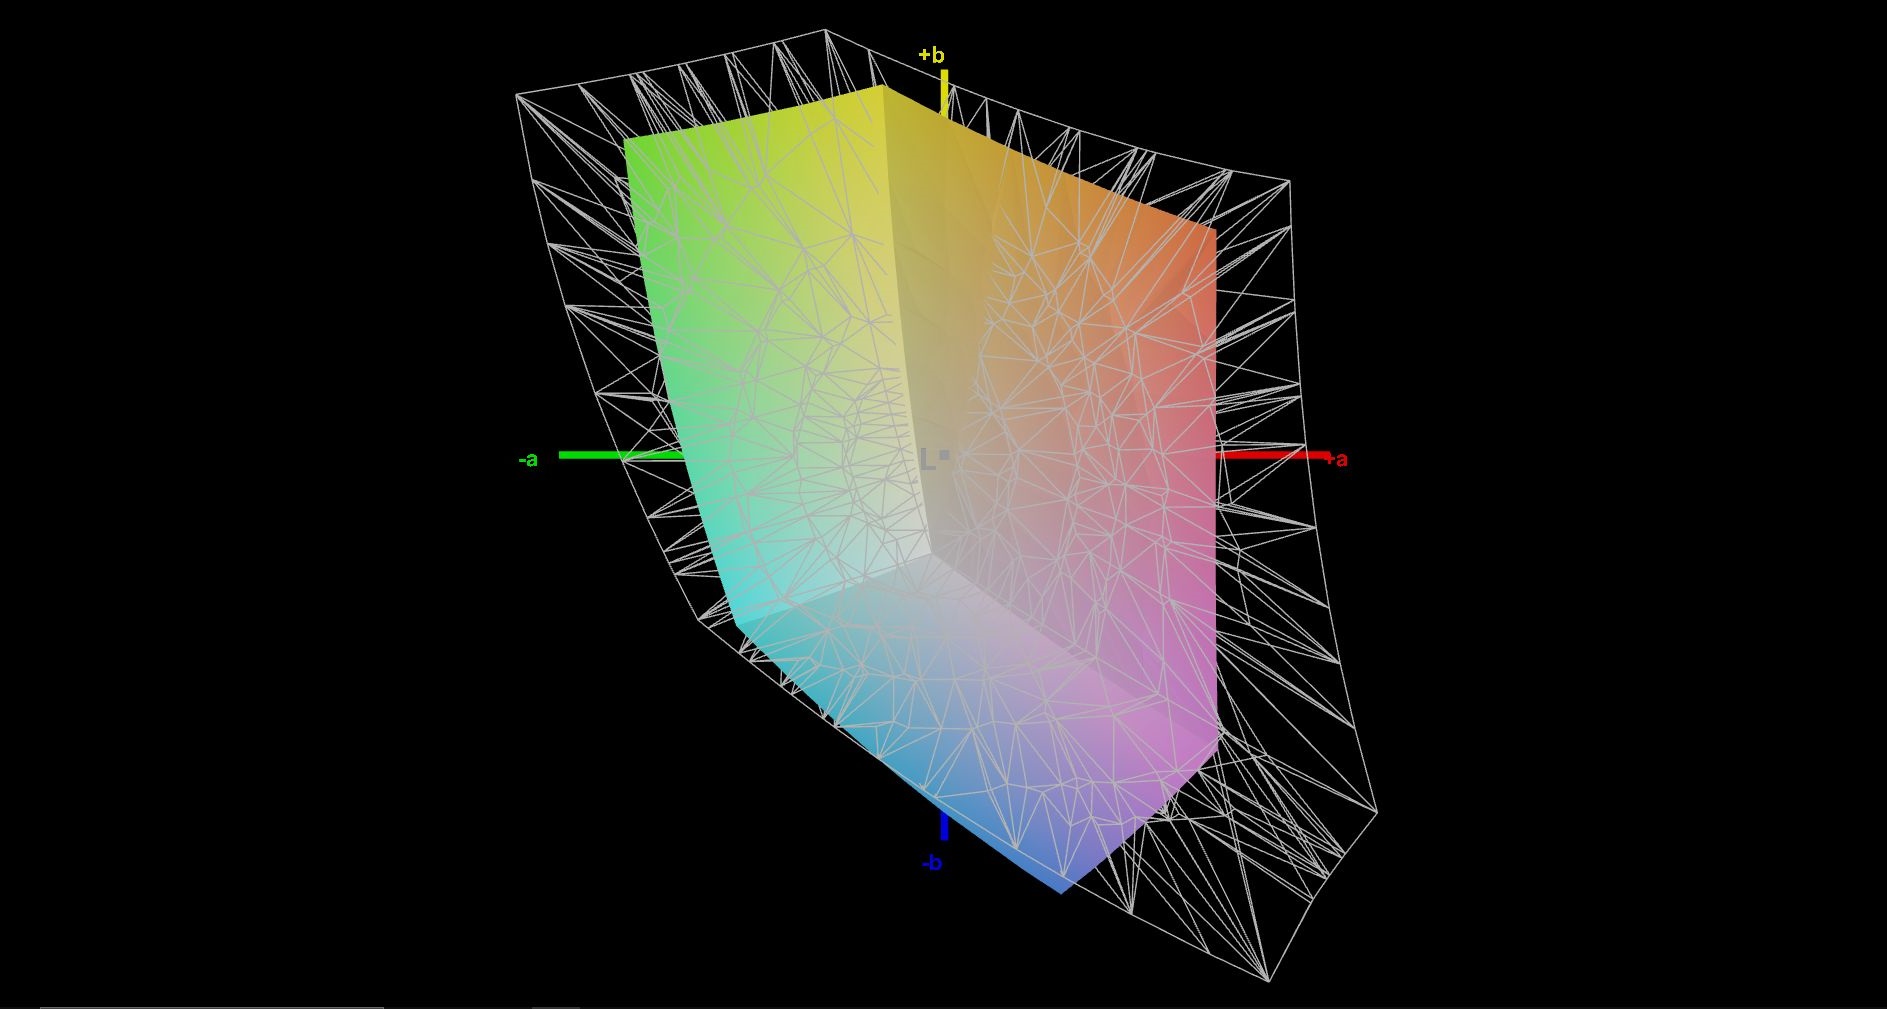
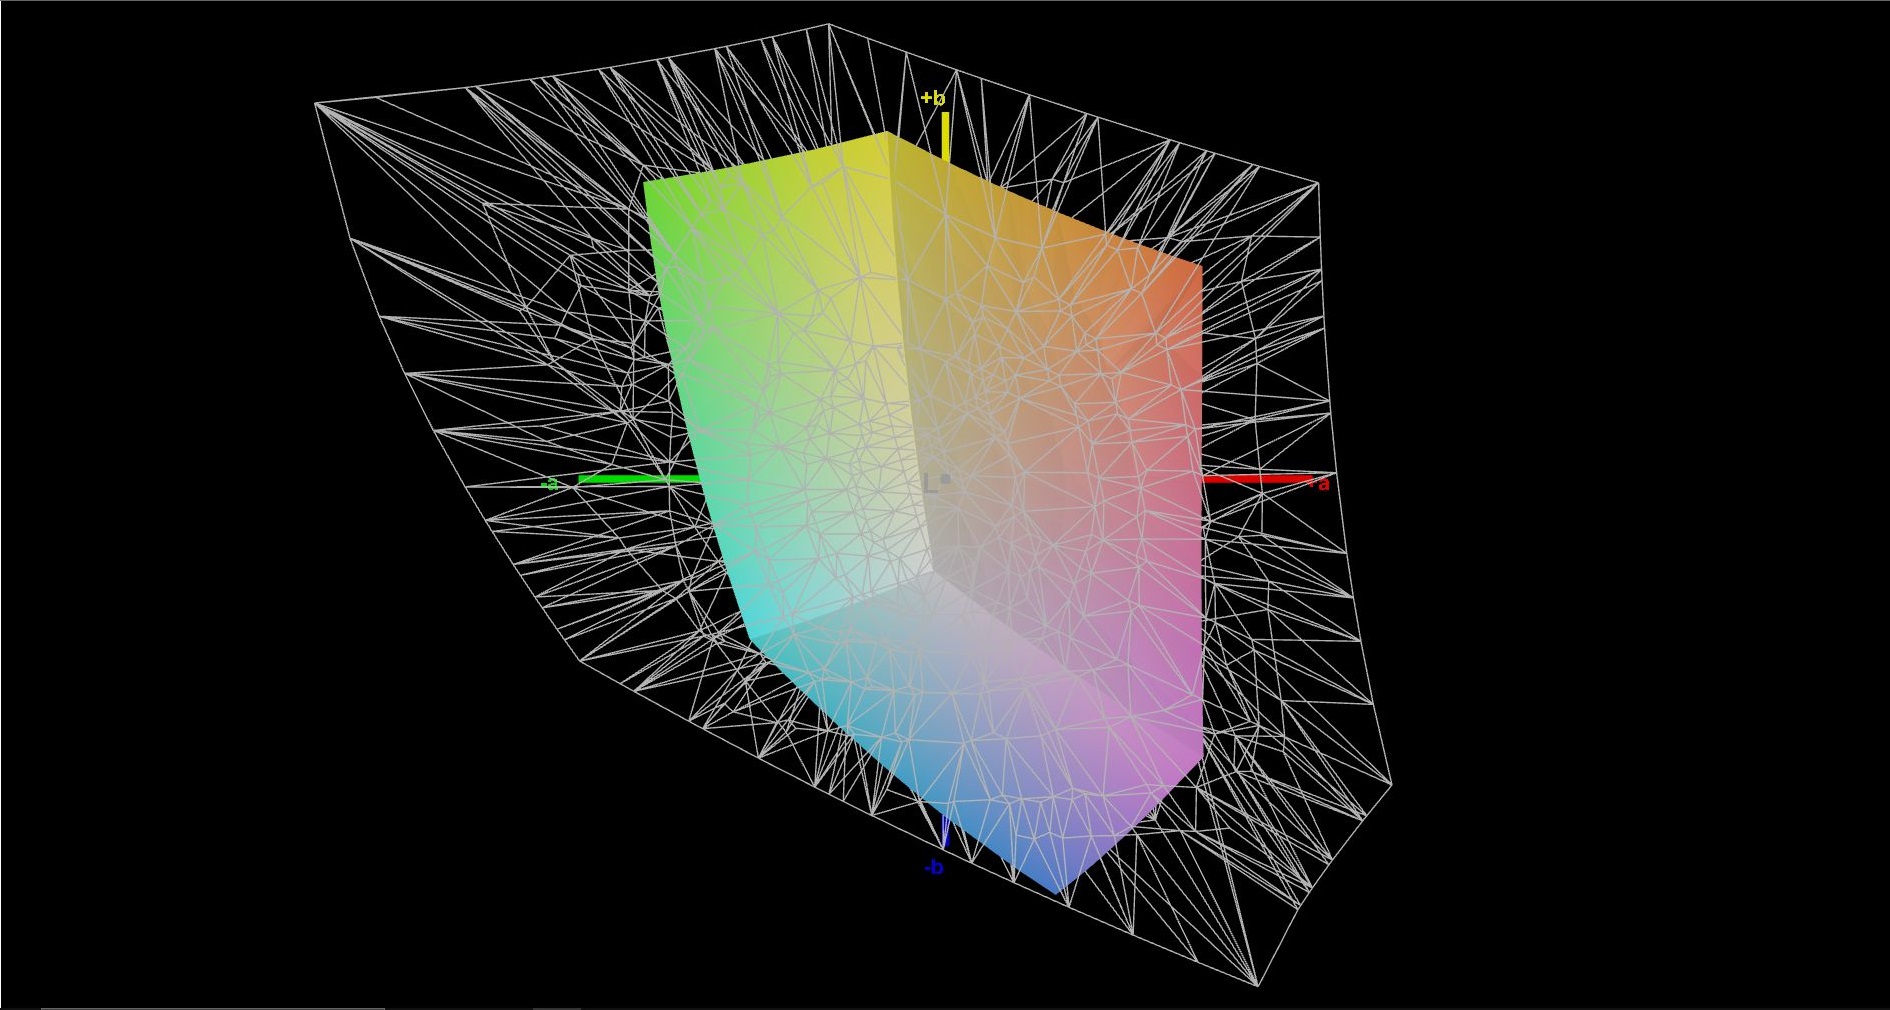
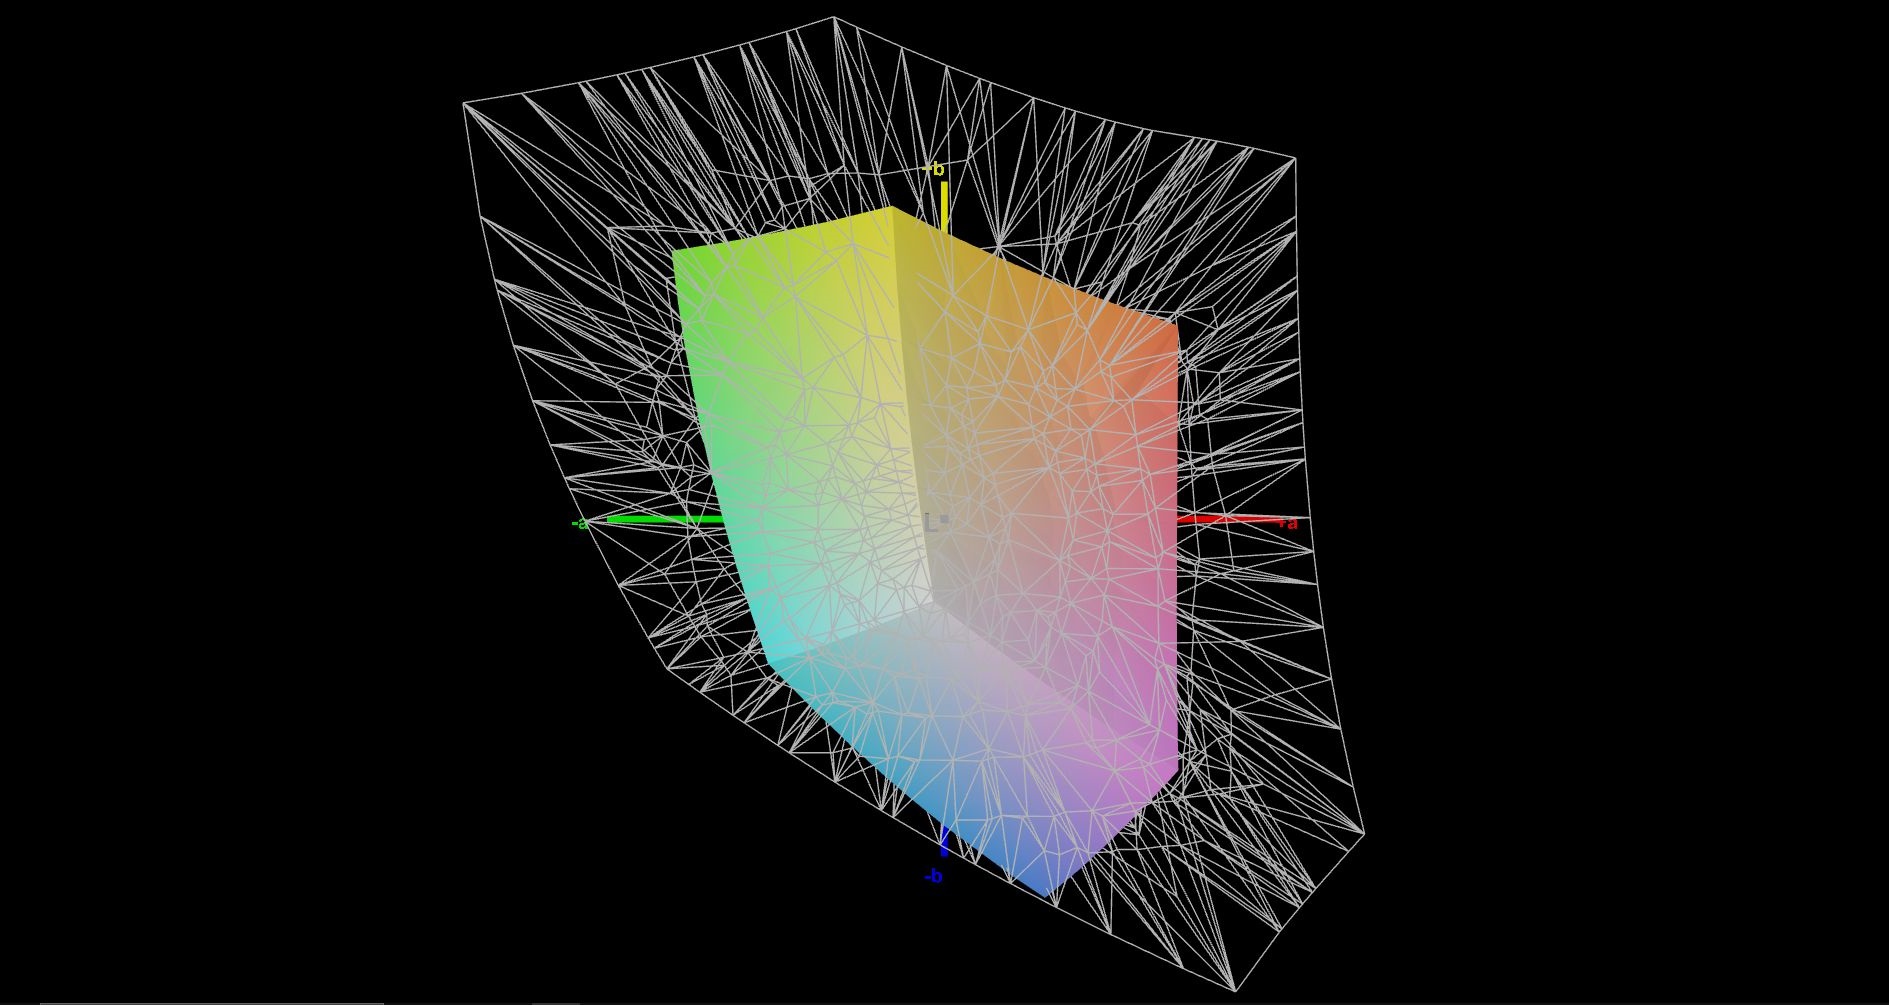
UHD (3840x2160) IPS, 600 nits, 100% AdobeRGB, HDR400, X-Rite
Ons paneel vertegenwoordigt de instapvariant en heeft een resolutie van 1920x1080, waardoor content voldoende scherp wordt weergegeven. Ook de schaalbaarheid, die op 100% kan worden ingesteld, is een voordeel, want zo wordt content nog scherper weergegeven en worden schaalproblemen voorkomen.
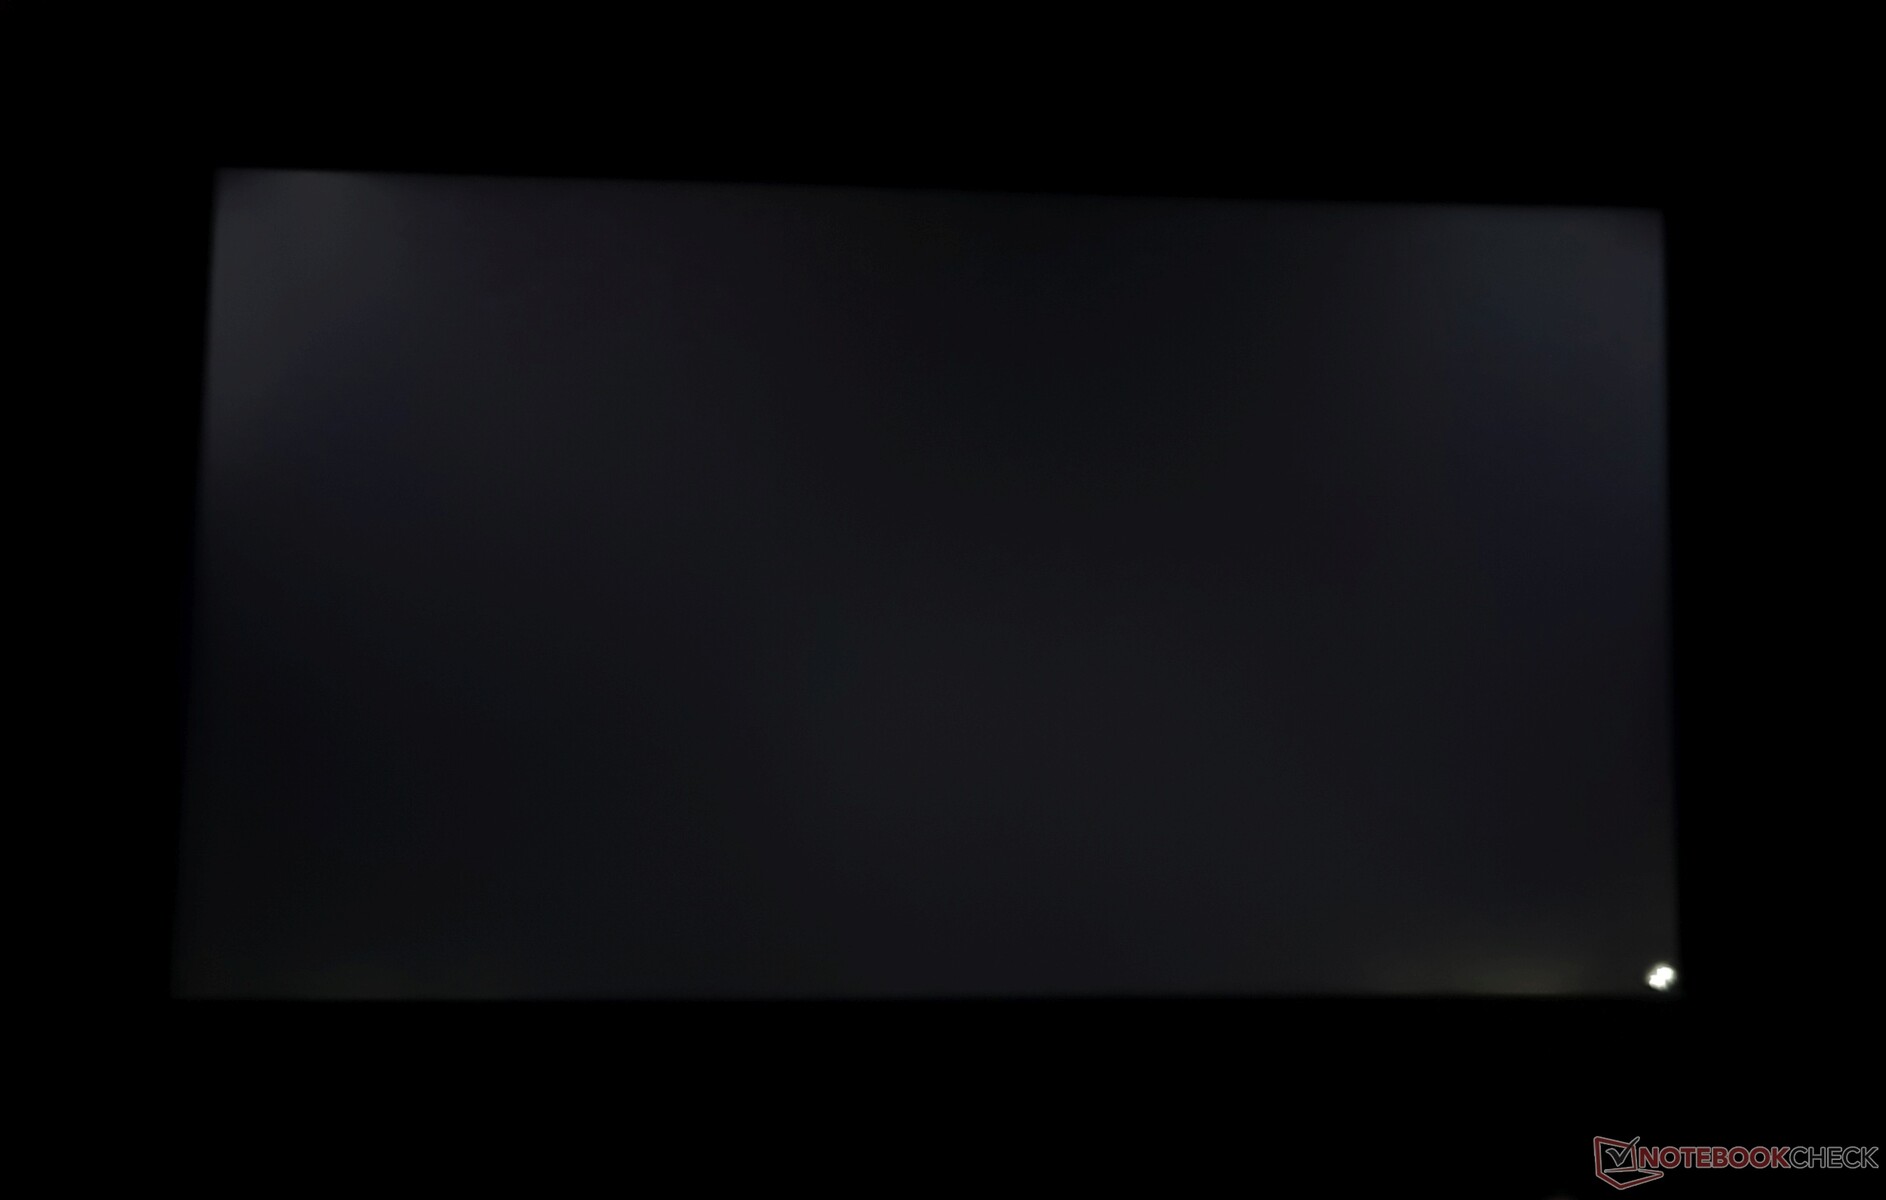
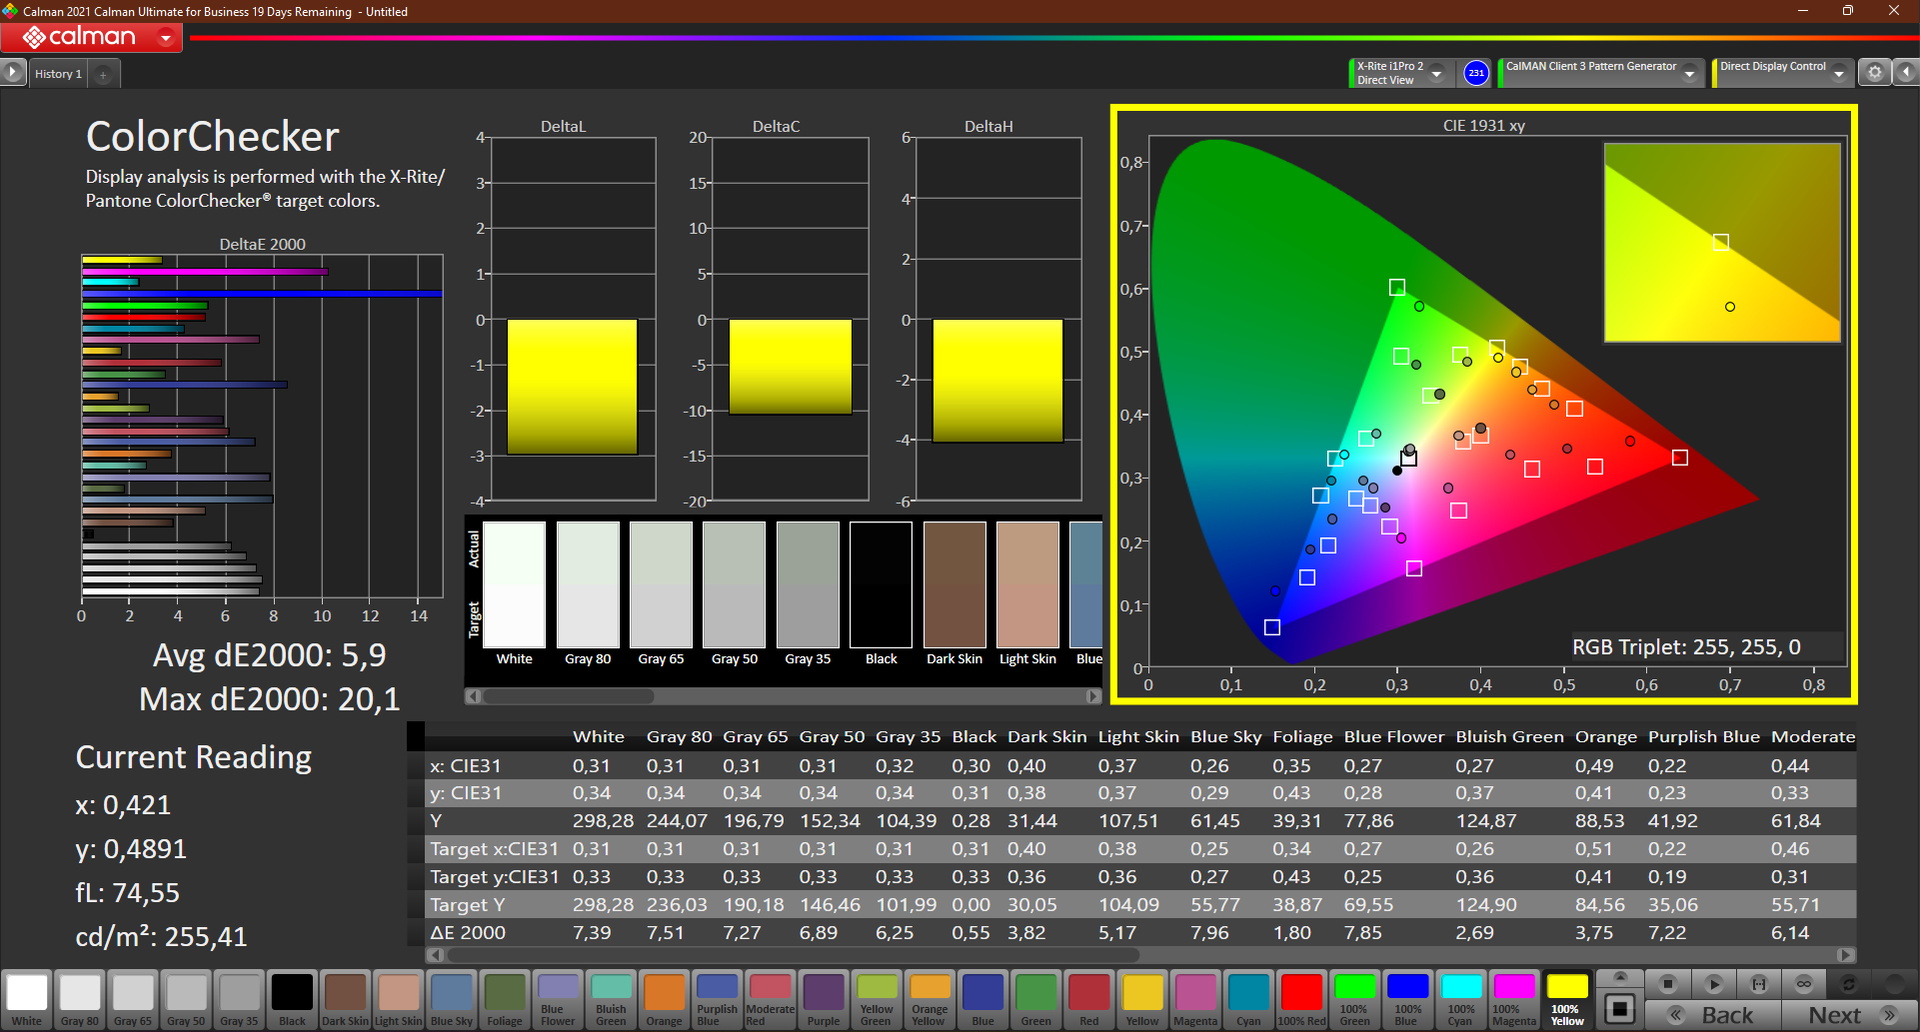
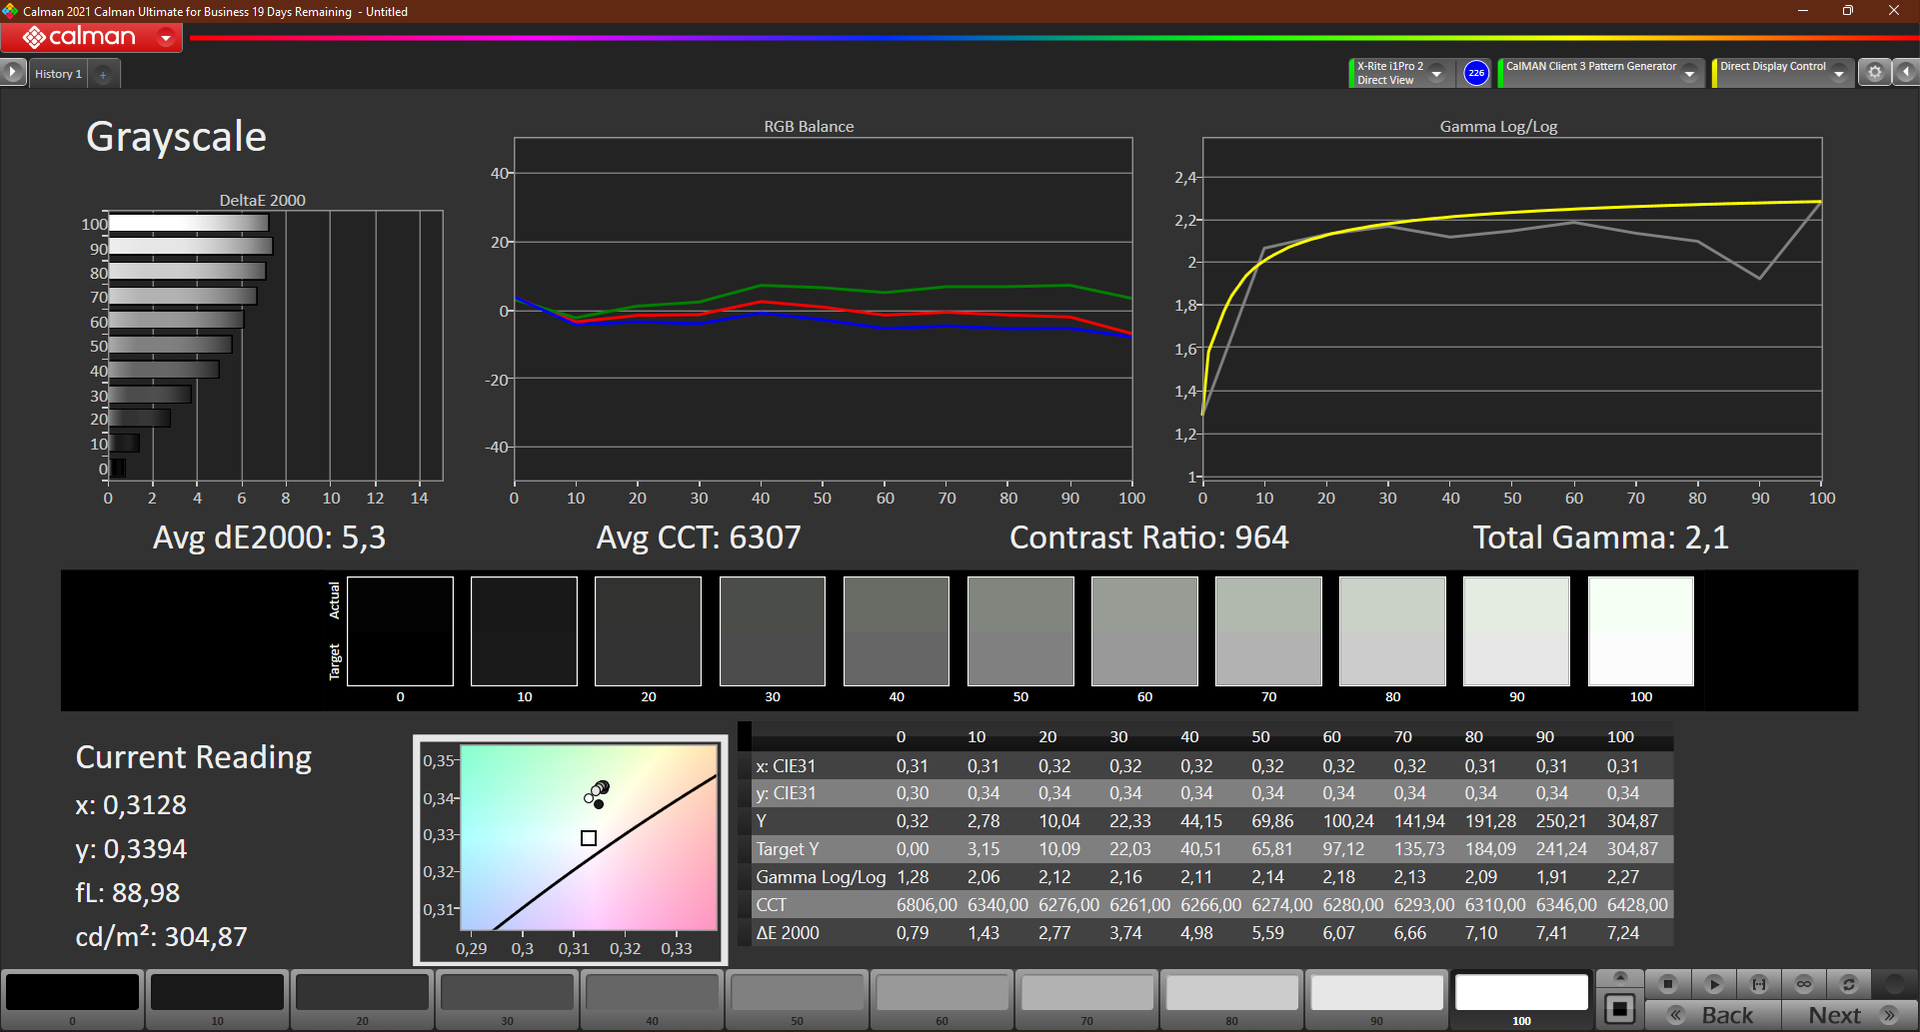
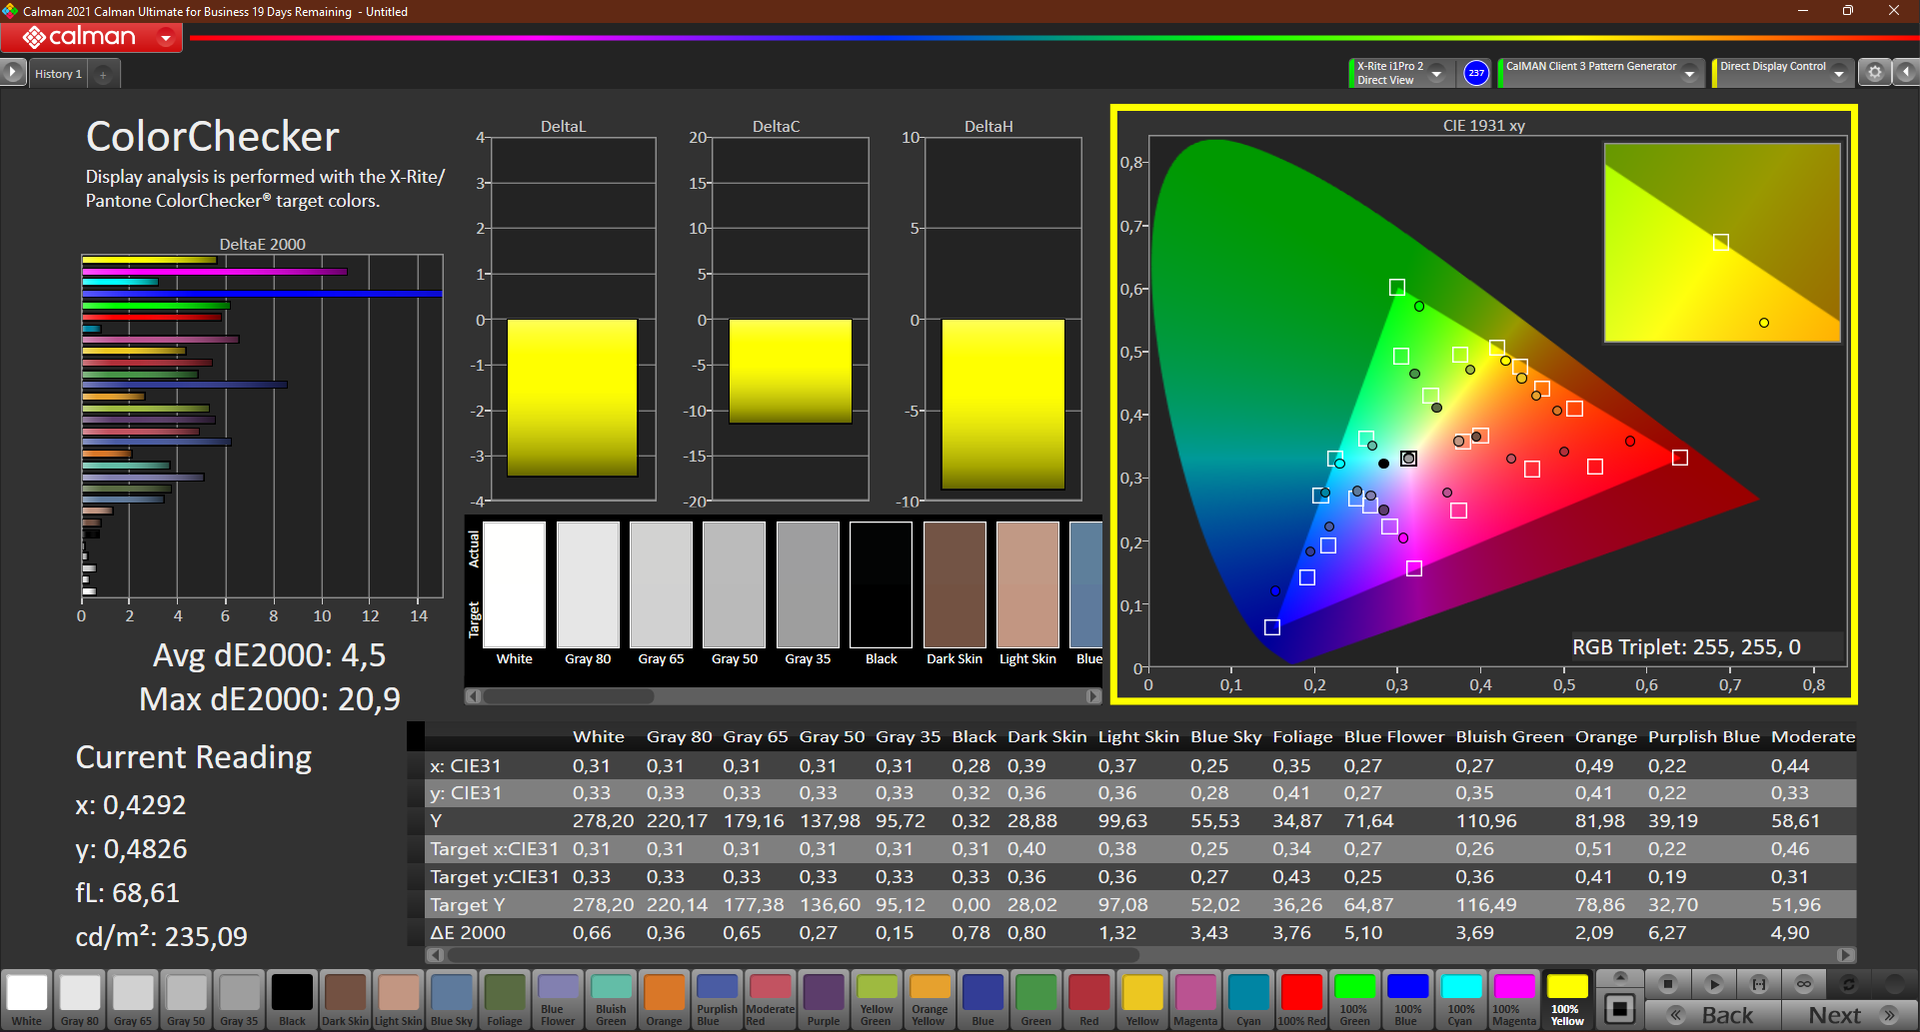
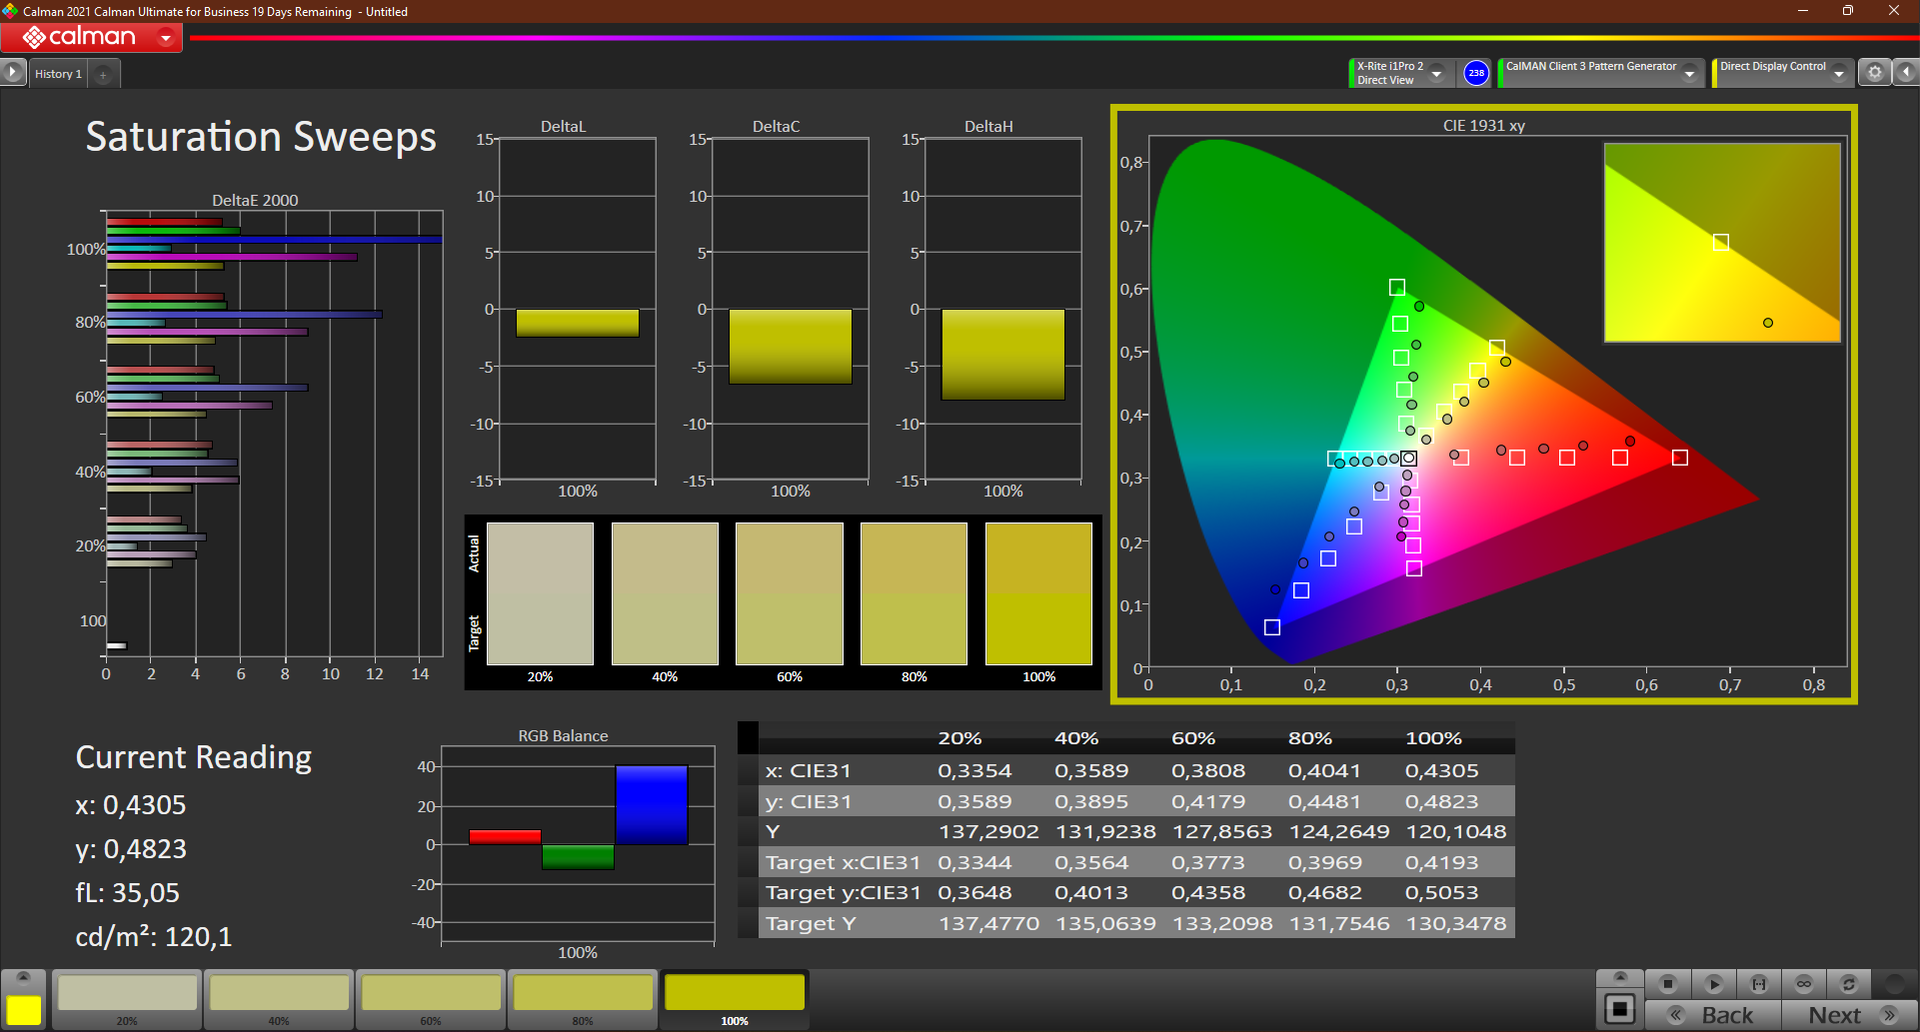
De helderheid van ongeveer 280 nits is niet optimaal, maar is binnenshuis nog steeds acceptabel. De contrastverhouding van 953:1 is OK, net als de zwartwaarde van 0,32. Kalibratie resulteert in een rijker zwart, en we waren ook in staat om de bijbehorende DeltaE grijswaarde te verlagen van 5,3 naar een goede 0,9. De Delta E kleurwaarde blijft echter hoog met 4,5
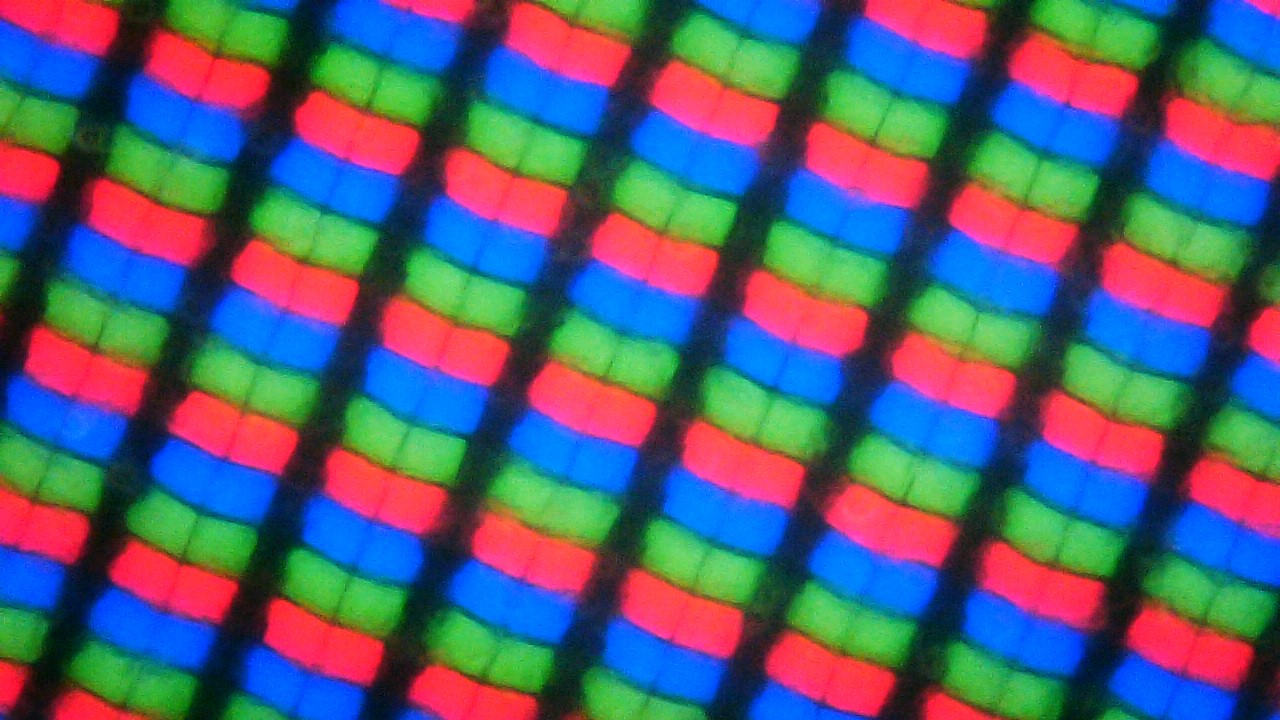
Subjectief gezien is de beeldkwaliteit goed, niet in de laatste plaats vanwege de relatief heldere subpixels en het rijke zwart. Maar de HP ZBook Power 15 en alle andere vergelijkingsapparaten bieden op papier veel betere cijfers. De responstijden van het paneel zijn middelmatig tot traag en dus niet optimaal voor gaming. Er werd geen PWM flikkering waargenomen.
| |||||||||||||||||||||||||
Helderheidsverdeling: 88 %
Helderheid in Batterij-modus: 305 cd/m²
Contrast: 953:1 (Zwart: 0.32 cd/m²)
ΔE ColorChecker Calman: 5.9 | ∀{0.5-29.43 Ø4.71}
calibrated: 4.5
ΔE Greyscale Calman: 5.3 | ∀{0.09-98 Ø4.96}
45.3% AdobeRGB 1998 (Argyll 3D)
65.1% sRGB (Argyll 3D)
43.7% Display P3 (Argyll 3D)
Gamma: 2.1
CCT: 6307 K
| Lenovo ThinkPad P15v G2 21A9000XGE N156HCA-EAC, IPS LED, 1920x1080, 15.6" | Lenovo ThinkPad P15 G2-20YQ001JGE N156HCE_GN1, IPS, 1920x1080, 15.6" | Lenovo ThinkPad T15g-20UR000GGE N156HCE-GN1, IPS, 1920x1080, 15.6" | Lenovo ThinkPad T15p-20TN0006GE MNF601EA1-1, IPS LED, 3840x2160, 15.6" | Lenovo ThinkPad P15s Gen2-20W6000GGE MNF601EA1-1, IPS LED, 3840x2160, 15.6" | HP ZBook Power 15 G8 313S5EA AUOA08B, IPS LED, 1920x1080, 15.6" | Dell Precision 5000 5560 Sharp LQ156R1, IPS, 3840x2400, 15.6" | |
|---|---|---|---|---|---|---|---|
| Display | 55% | 39% | 90% | 87% | 57% | 97% | |
| Display P3 Coverage (%) | 43.7 | 68.6 57% | 61.3 40% | 86.8 99% | 84.5 93% | 70.5 61% | 94.9 117% |
| sRGB Coverage (%) | 65.1 | 99.8 53% | 90.5 39% | 99.3 53% | 98.7 52% | 99 52% | 100 54% |
| AdobeRGB 1998 Coverage (%) | 45.3 | 70.6 56% | 62.3 38% | 98.5 117% | 97.8 116% | 71.3 57% | 100 121% |
| Response Times | 33% | 31% | 19% | 17% | -32% | -4% | |
| Response Time Grey 50% / Grey 80% * (ms) | 48 ? | 37.6 ? 22% | 38 ? 21% | 41.6 ? 13% | 40 ? 17% | 61 -27% | 47.2 ? 2% |
| Response Time Black / White * (ms) | 28 ? | 16 ? 43% | 16.8 ? 40% | 21.2 ? 24% | 23.2 ? 17% | 38 ? -36% | 30.4 ? -9% |
| PWM Frequency (Hz) | 26040 ? | 26040 ? | |||||
| Screen | 46% | 44% | 70% | 70% | 49% | 34% | |
| Brightness middle (cd/m²) | 305 | 498 63% | 504 65% | 595 95% | 604 98% | 393 29% | 501.5 64% |
| Brightness (cd/m²) | 281 | 490 74% | 476 69% | 594 111% | 609 117% | 385 37% | 467 66% |
| Brightness Distribution (%) | 88 | 95 8% | 90 2% | 94 7% | 91 3% | 78 -11% | 83 -6% |
| Black Level * (cd/m²) | 0.32 | 0.39 -22% | 0.34 -6% | 0.32 -0% | 0.34 -6% | 0.25 22% | 0.44 -38% |
| Contrast (:1) | 953 | 1277 34% | 1482 56% | 1859 95% | 1776 86% | 1572 65% | 1140 20% |
| Colorchecker dE 2000 * | 5.9 | 2.1 64% | 2.9 51% | 1.2 80% | 0.9 85% | 1.5 75% | 4.73 20% |
| Colorchecker dE 2000 max. * | 20.1 | 5.6 72% | 7.1 65% | 2.5 88% | 2.6 87% | 4.3 79% | 8.45 58% |
| Colorchecker dE 2000 calibrated * | 4.5 | 0.8 82% | 1.3 71% | 1 78% | 0.8 82% | 1.4 69% | 0.51 89% |
| Greyscale dE 2000 * | 5.3 | 3.4 36% | 4.3 19% | 1.4 74% | 1.1 79% | 1.3 75% | 3.6 32% |
| Gamma | 2.1 105% | 2.32 95% | 2.25 98% | 2.1 105% | 2.15 102% | 2.26 97% | 2.08 106% |
| CCT | 6307 103% | 7162 91% | 7265 89% | 6492 100% | 6656 98% | 6435 101% | 6447 101% |
| Color Space (Percent of AdobeRGB 1998) (%) | 57.7 | 85.3 | 84.5 | ||||
| Color Space (Percent of sRGB) (%) | 90.8 | 99.2 | 98.6 | ||||
| Totaal Gemiddelde (Programma / Instellingen) | 45% /
46% | 38% /
41% | 60% /
67% | 58% /
66% | 25% /
39% | 42% /
42% |
* ... kleiner is beter
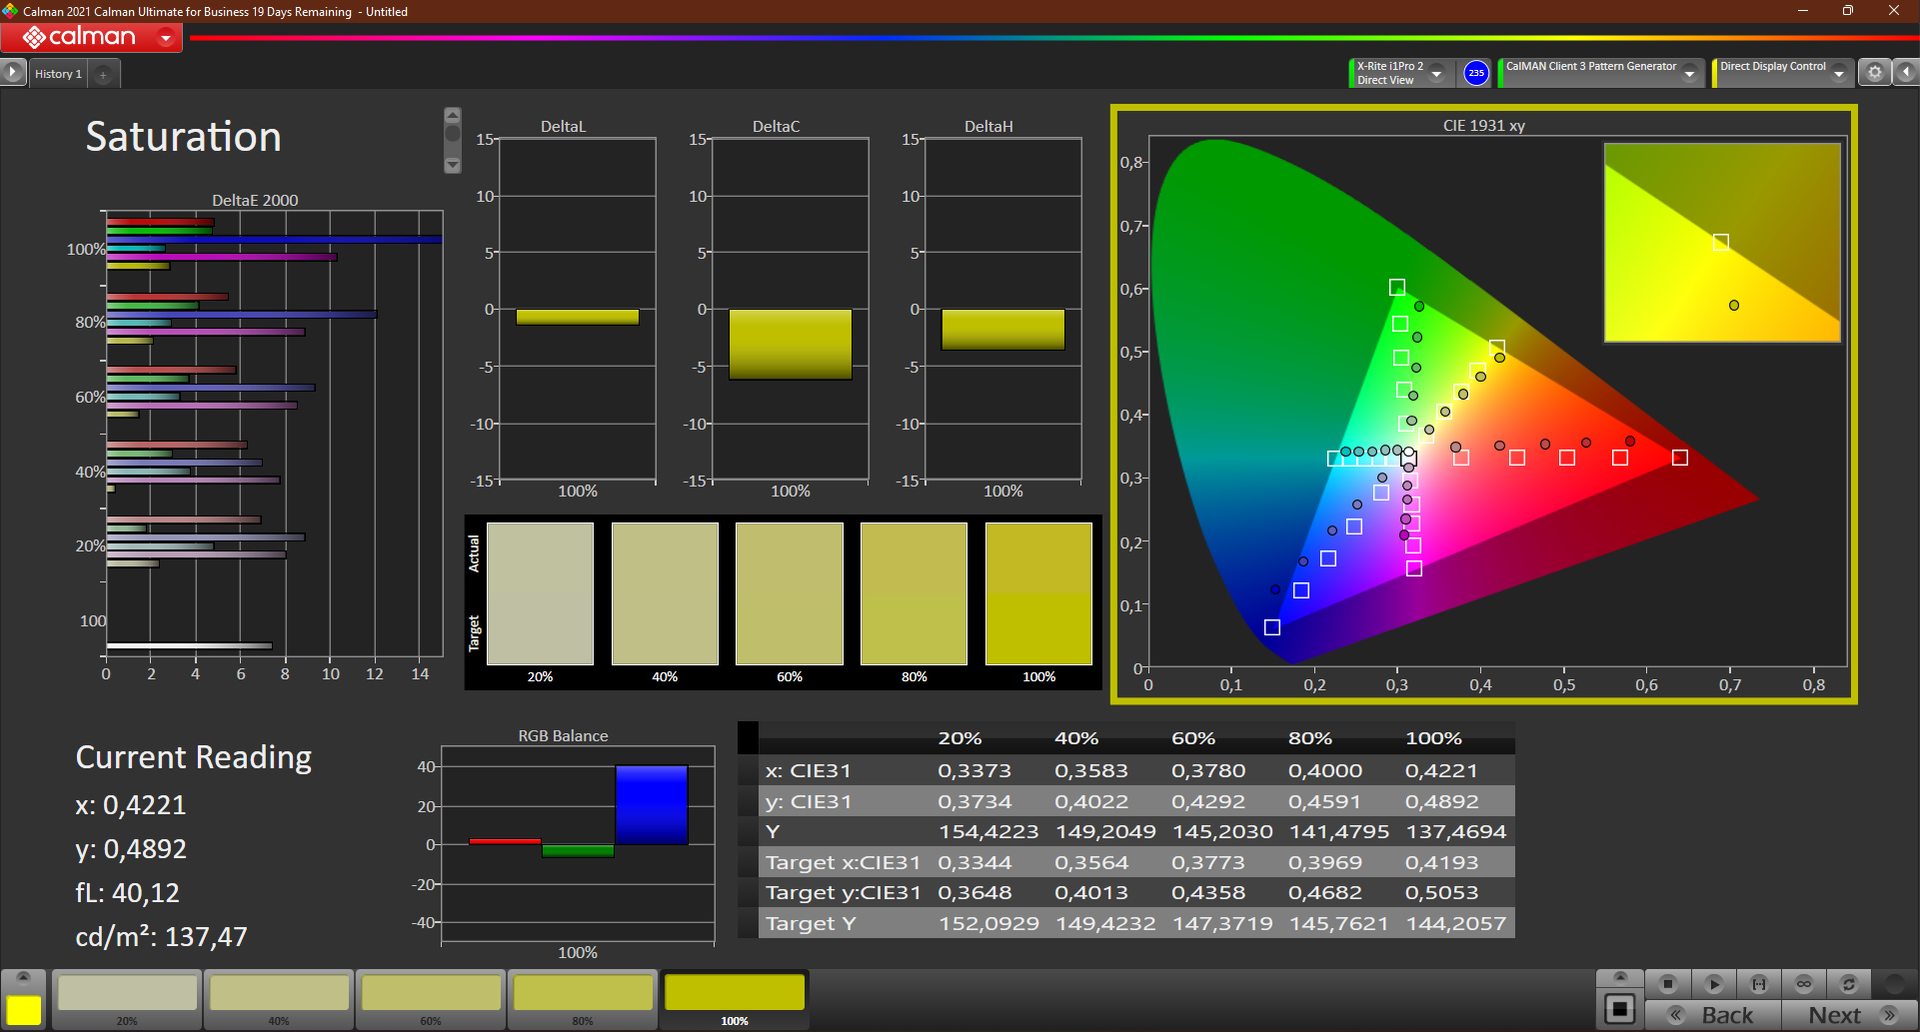
De kleinste kleurruimte die we hebben gemeten (sRGB) wordt met slechts 65% gedekt. Als u grotere kleurruimten nodig hebt, moet u andere beeldschermopties gebruiken, aangezien ons geteste model ongeschikt blijkt voor ambitieuze beeldbewerking.
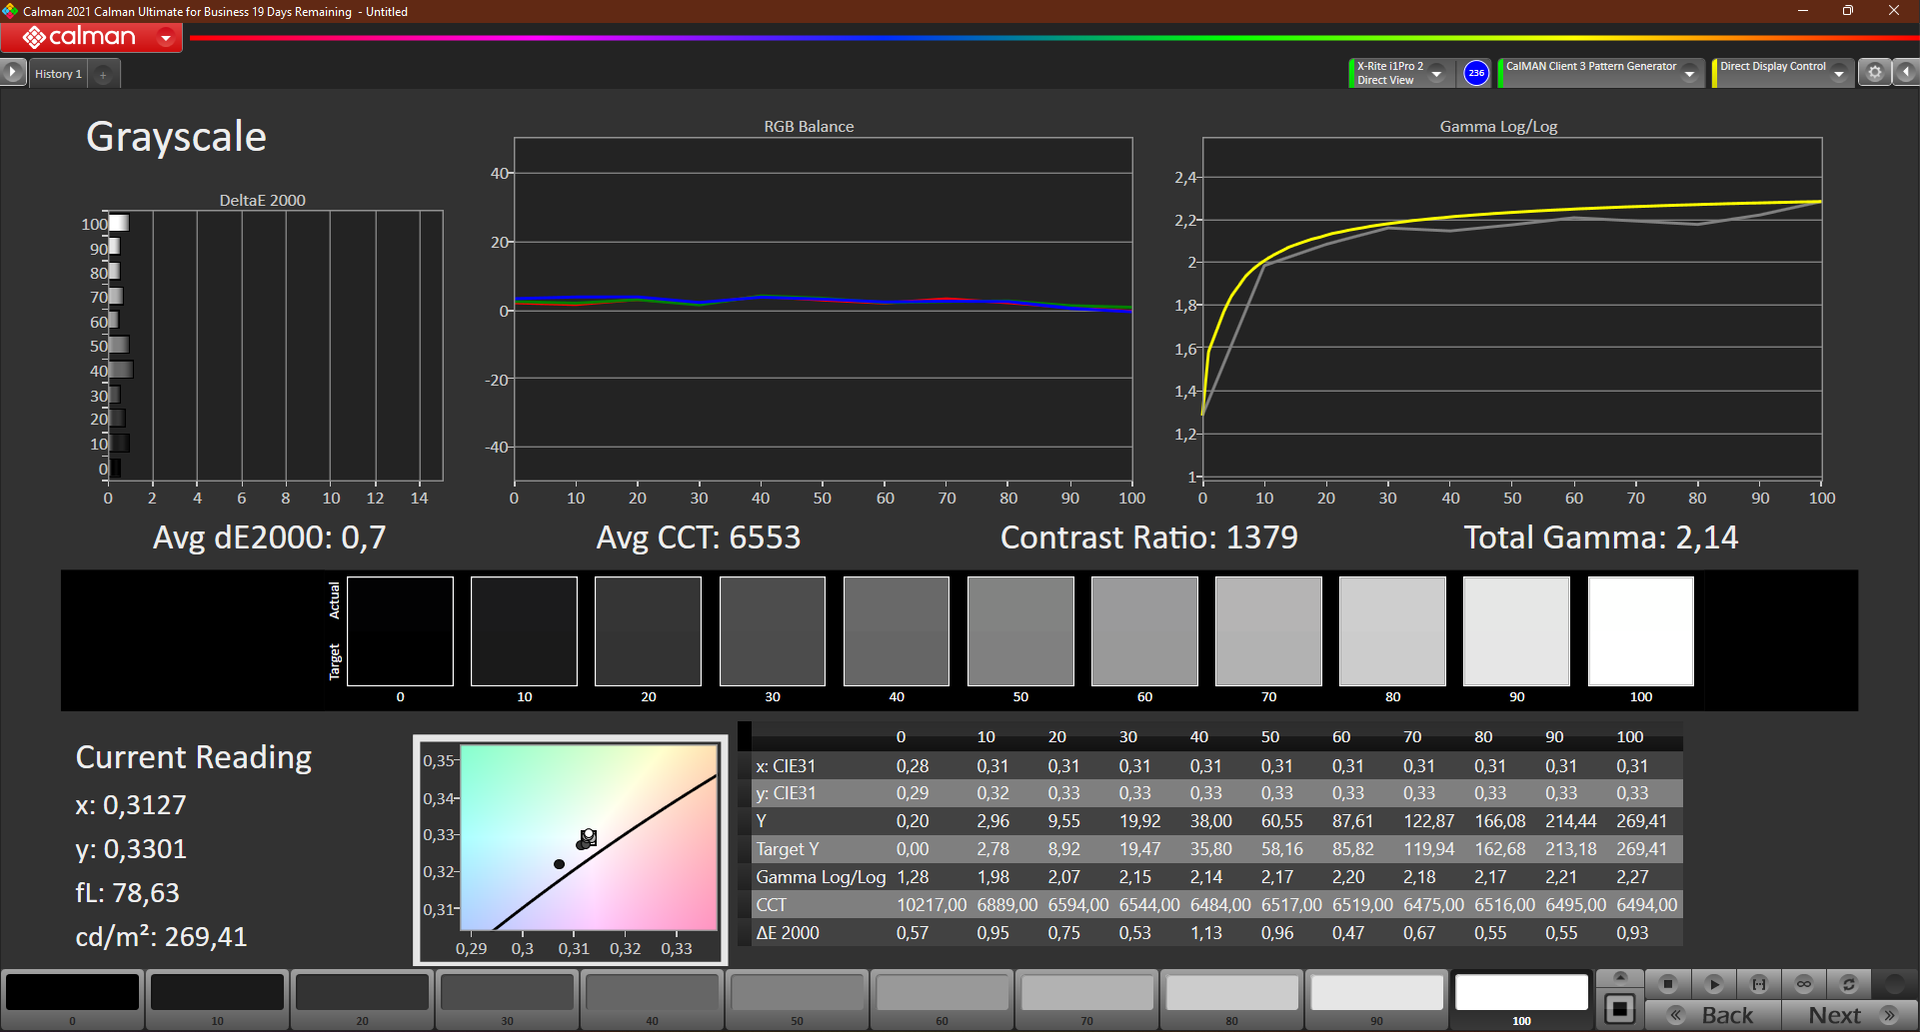
De RGB-balans is enigszins verbeterd na kalibratie met CalMan en de X-Rite i1 Pro 2 colorimeter. Met name blauw wijkt sterk af met een DeltaE-waarde van ~15. De contrastverhouding steeg ook met 45% tot 1.379:1. De helderheid daalde echter met ongeveer 20 nits als gevolg van het proces. Zoals altijd is ons ICC kleurprofiel beschikbaar om te downloaden naast de belichtingsgrafiek.
Responstijd Scherm
| ↔ Responstijd Zwart naar Wit | ||
|---|---|---|
| 28 ms ... stijging ↗ en daling ↘ gecombineerd | ↗ 17 ms stijging | 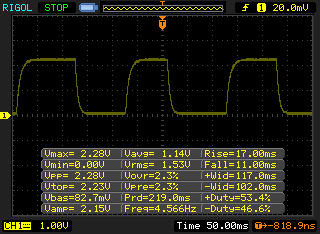 |
| ↘ 11 ms daling | ||
| Het scherm vertoonde relatief trage responstijden in onze tests en is misschien te traag voor games. Ter vergelijking: alle testtoestellen variëren van 0.1 (minimum) tot 240 (maximum) ms. » 71 % van alle toestellen zijn beter. Dit betekent dat de gemeten responstijd slechter is dan het gemiddelde (19.8 ms) van alle geteste toestellen. | ||
| ↔ Responstijd 50% Grijs naar 80% Grijs | ||
| 48 ms ... stijging ↗ en daling ↘ gecombineerd | ↗ 26 ms stijging | 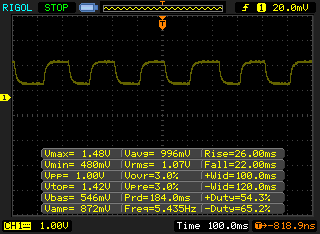 |
| ↘ 22 ms daling | ||
| Het scherm vertoonde trage responstijden in onze tests en is misschien te traag voor games. Ter vergelijking: alle testtoestellen variëren van 0.165 (minimum) tot 636 (maximum) ms. » 82 % van alle toestellen zijn beter. Dit betekent dat de gemeten responstijd slechter is dan het gemiddelde (31 ms) van alle geteste toestellen. | ||
Screen Flickering / PWM (Pulse-Width Modulation)
| Screen flickering / PWM niet waargenomen | 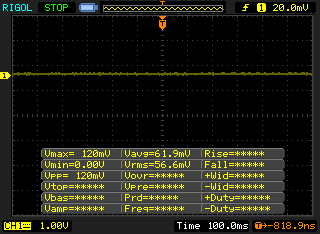 | ||
Ter vergelijking: 52 % van alle geteste toestellen maakten geen gebruik van PWM om de schermhelderheid te verlagen. Als het wel werd gebruikt, werd een gemiddelde van 7754 (minimum: 5 - maximum: 343500) Hz waargenomen. | |||
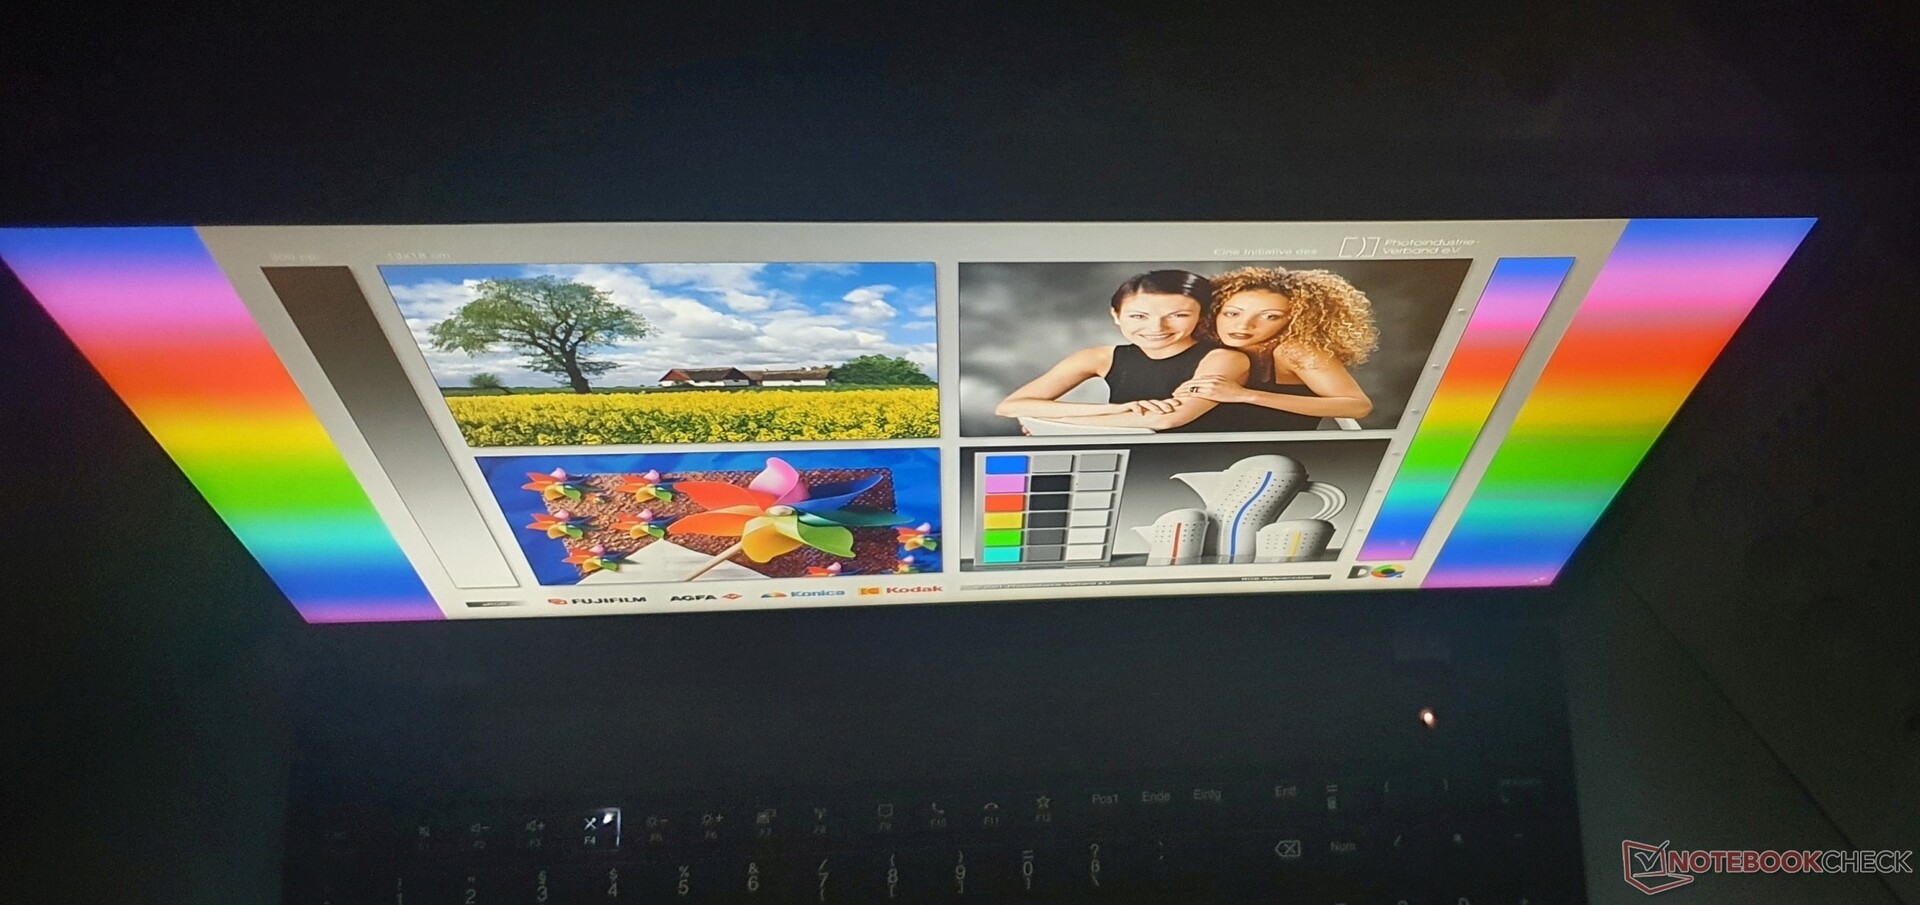
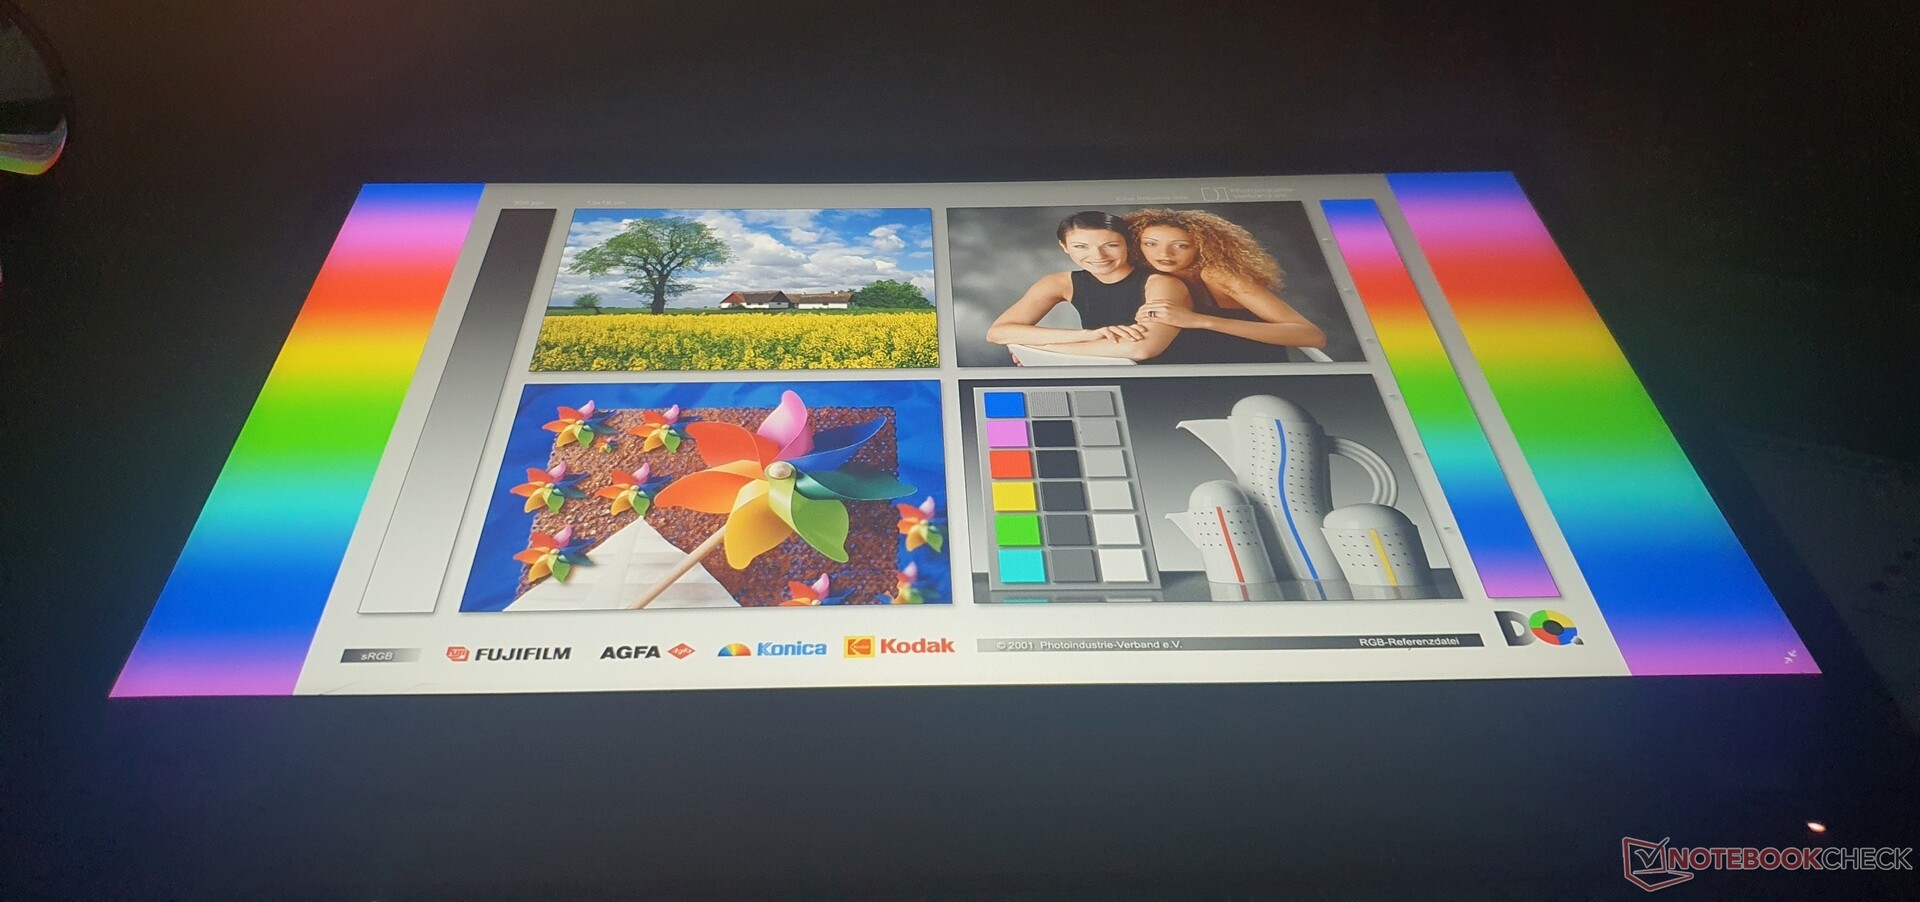
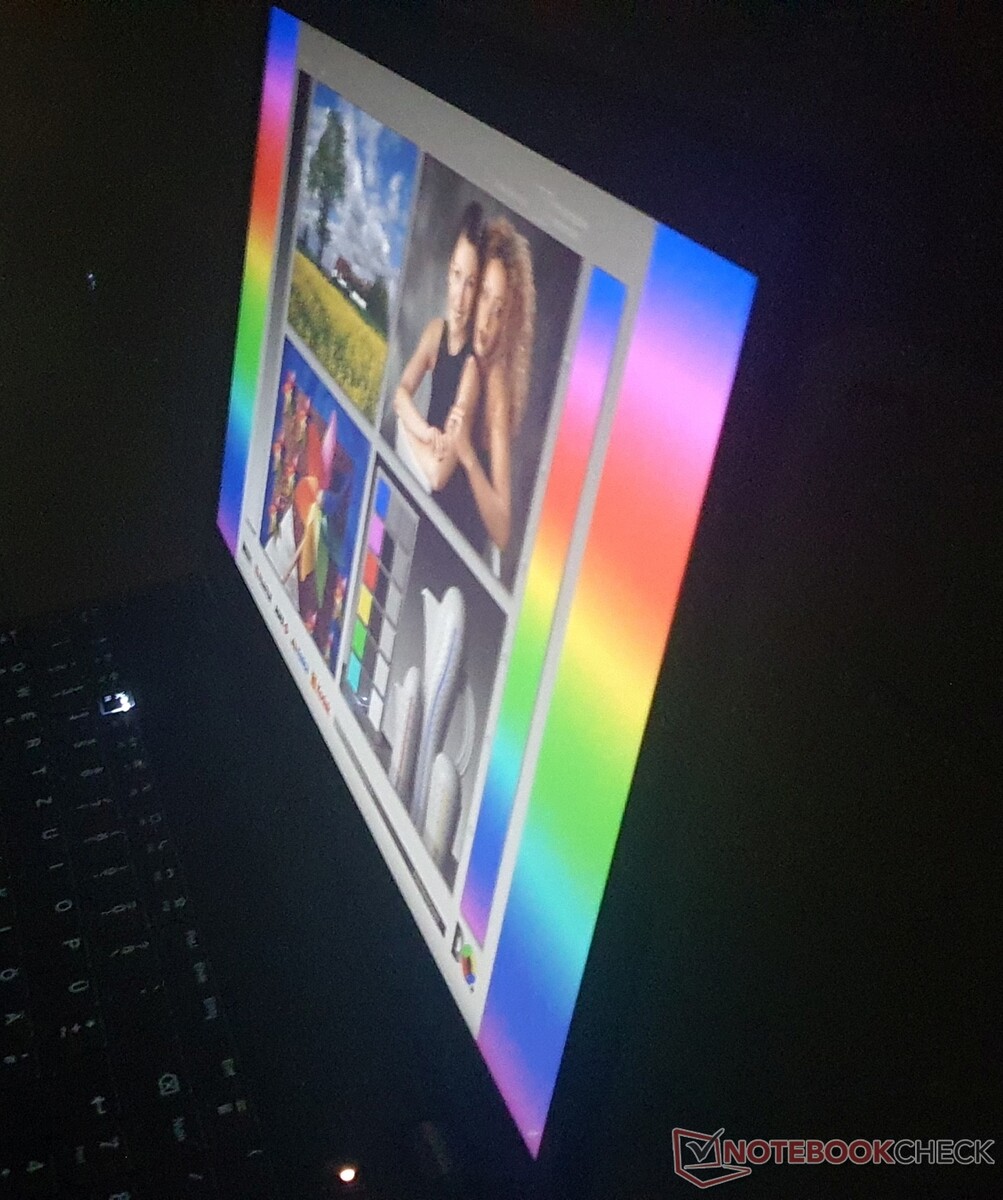
Buiten in de zon is het scherm met zijn 280 nits niet helder genoeg, ondanks het matte oppervlak. Maar de P15v kan wel in de schaduw worden gebruikt
De leesbaarheid van het scherm is zeer goed tot een kijkhoek van ongeveer 170°, wat typisch is voor IPS. OLED's presteren zelfs nog beter.
Prestaties: ThinkPad P15v G2 beter met Intel Core i9
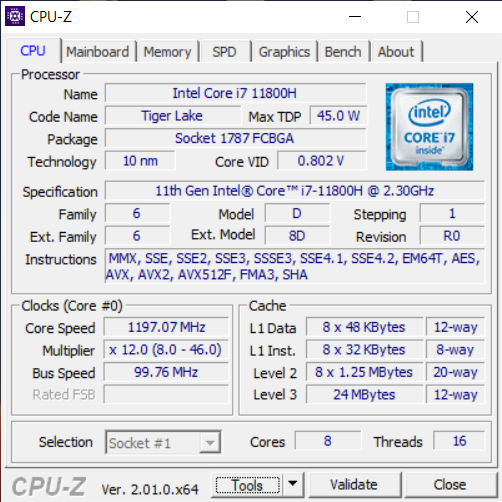
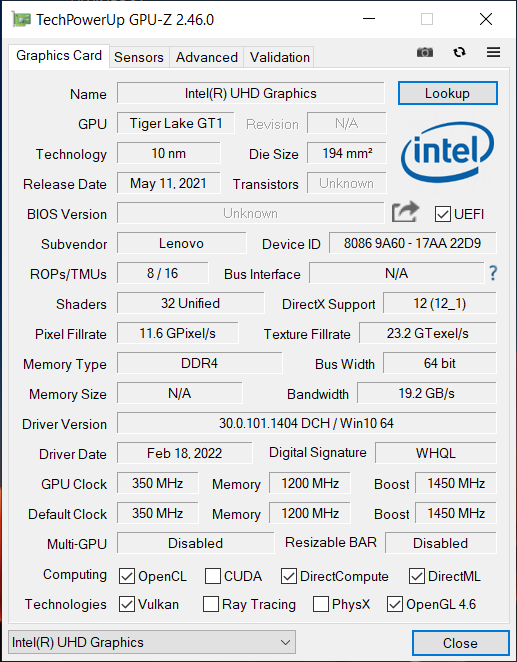
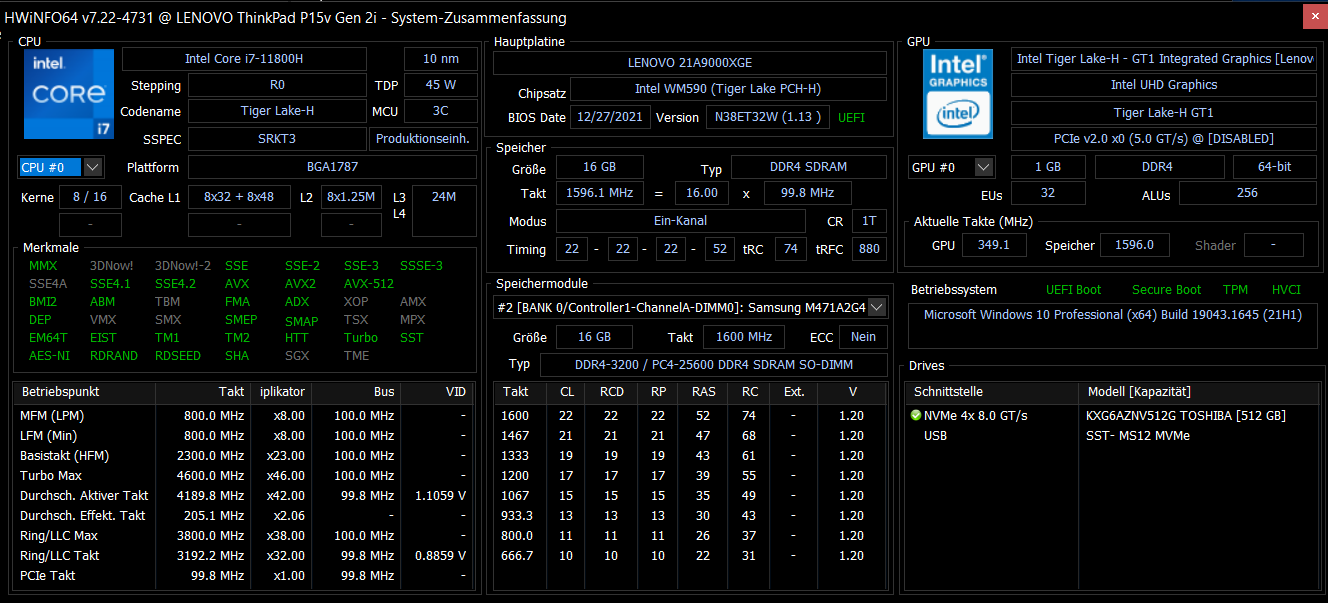
Ons review model wordt geleverd met een Intel Tiger-LakeCore i7-11800H octa-core CPU. Als alternatief kunt u kiezen voor een Core Core i9-11950Haan de grafische kant, naast de geïntegreerde Intel Xe-iGPU (32/16 EUs), kunt u kiezen uit een Nvidia T600, T1200 (ons model) of een RTX A2000elk met ISV certificaties. Xeon CPU's en ECC RAM zijn niet bedoeld voor wat verondersteld wordt een goedkoop werkstation te zijn.
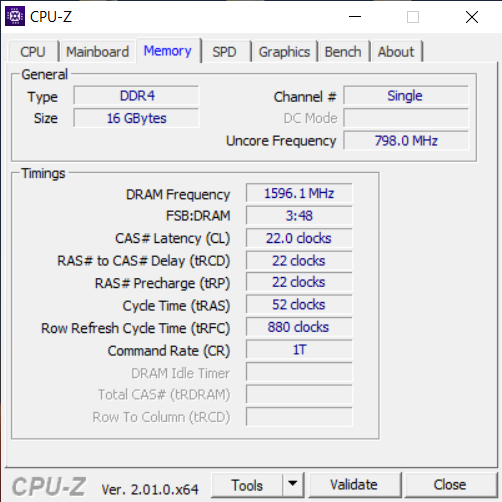
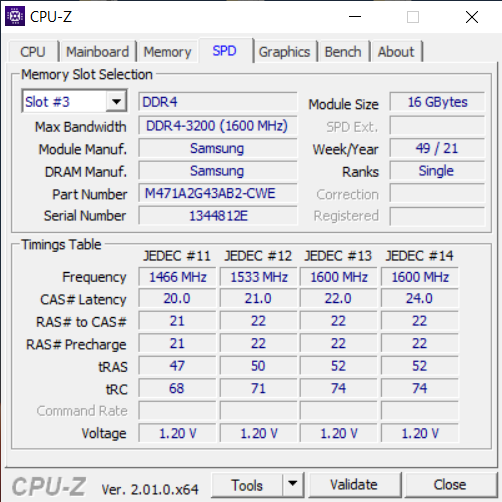
Twee SODIMM's bieden plaats aan maximaal 64 GB DDR4-3200 RAM, terwijl ons model is uitgerust met een 16 GB module in single-channel modus. Er zijn ook twee PCIe 4.0 slots die elk maximaal 2 TB NVMe SSD's in M.2 2280 formaat mogelijk maken
Processor
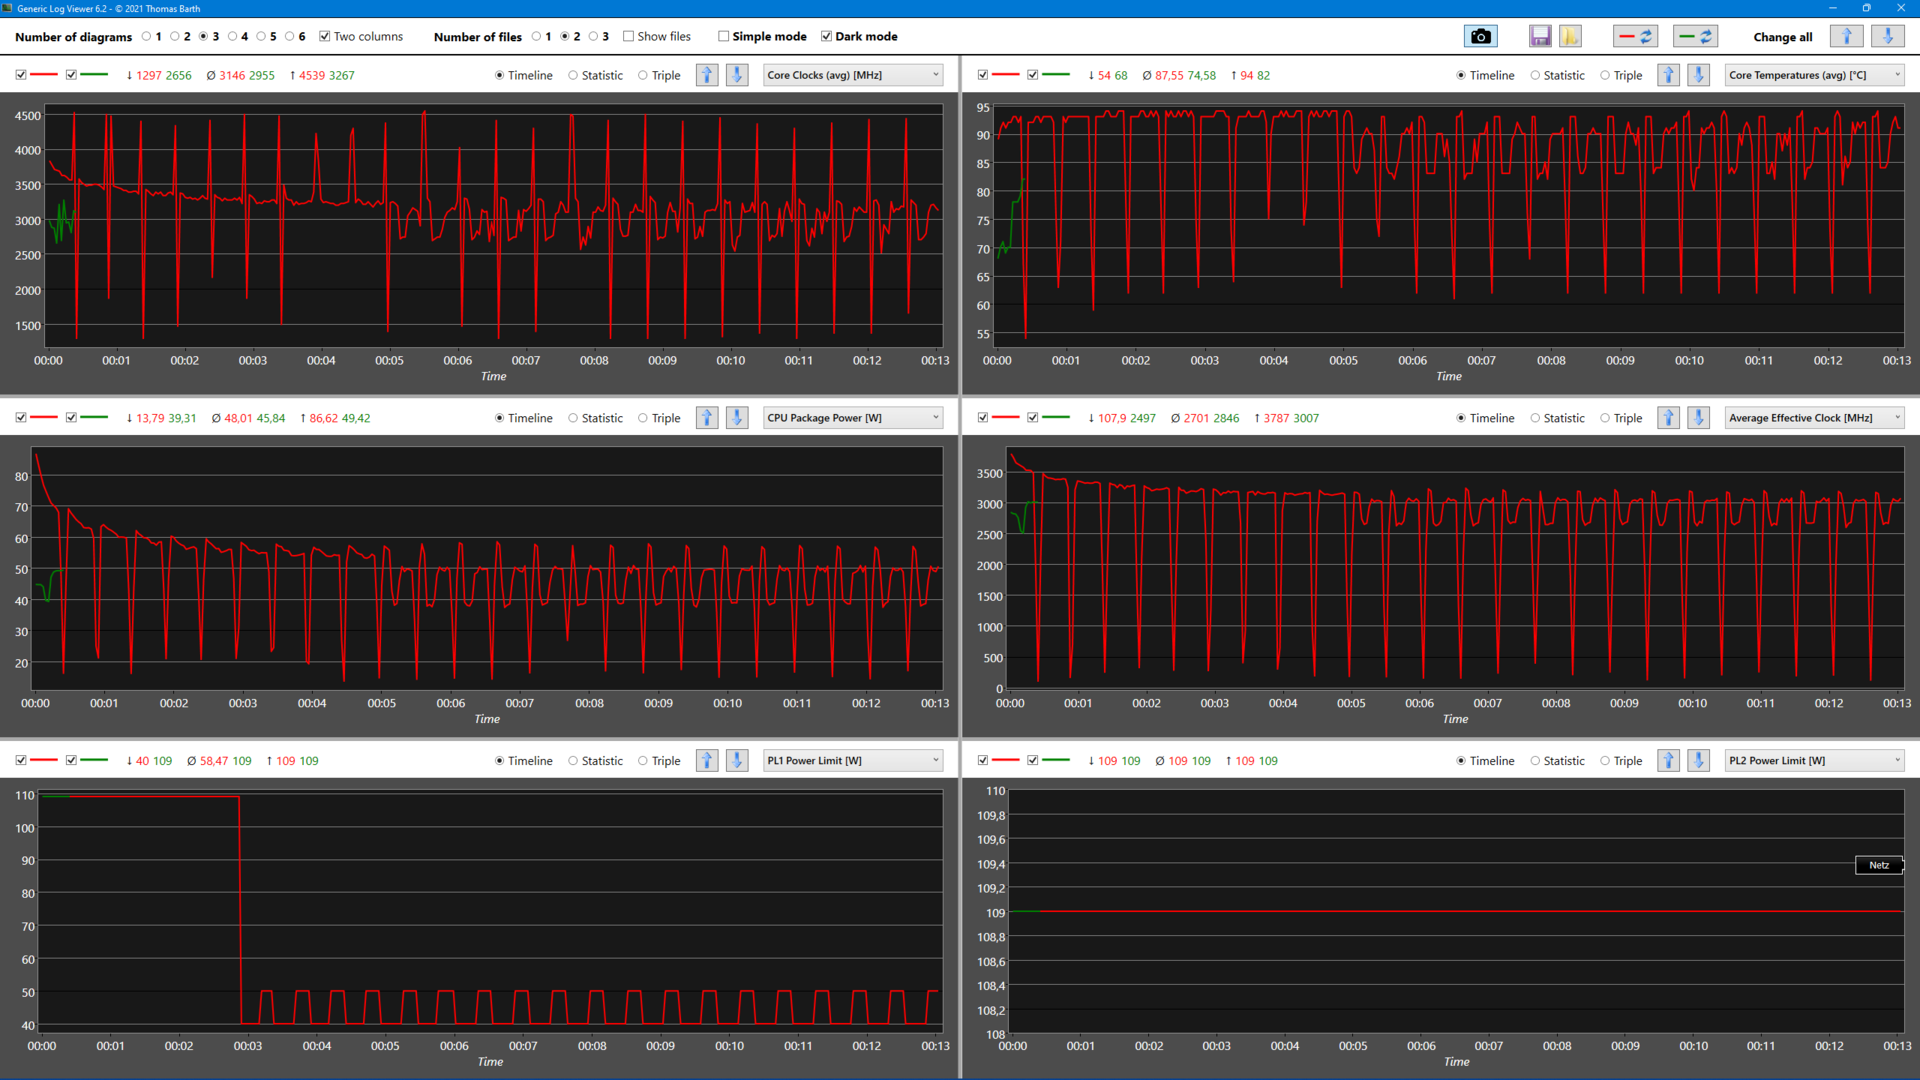
Intel's Core i7-11800Hbelooft veel vermogen met zijn acht kernen, maar de CPU is in de praktijk niet optimaal geconfigureerd in de ThinkPad P15v G2. In de loop van de CB15 loop wordt herhaaldelijk 4,6 GHz bereikt, terwijl het gemiddelde 3,15 GHz is. Na 10 runs worden slechts 1.400 punten consistent gehaald. De dikke ThinkPad P15 G2behaalt 1.768 punten met dezelfde CPU.
Zelfs de veel dunnere ThinkPad P1 G3 van de tester behaalt met de Core i9 van de voorgeneratie een volgehouden ~1.700 punten. Onder PL2 (initieel) wordt 87 van 109 watt gebruikt, maar het probleem ontstaat door de 60 watt (@4,6 GHz) die voorbij PL1 (50 watt) wordt geduwd. Als gevolg daarvan komt de CPU regelmatig boven de 94 °C uit en is hij onderhevig aan gefaseerde thermische throttling.
Ongeveer 25% van de prestaties wordt verspild in sommige toepassingen. Een handmatige TDP beperking tot 50 of zelfs 45 Watt via de "ThrottleStop" tool leidt ook tot fluctuerend gedrag. Interessant genoeg was er geen throttling onder een constant verbruik van 50 watt tijdens de stress test met Prime95. Een BIOS update hielp niet. Het blijft de vraag of deze prestatiedaling verholpen kan worden met een flexibelere Core i9, en deze optie is duur. Op zijn minst wordt de voorganger hier duidelijk overtroffen, maar HP's ZBook Power 15 is ~30% sneller met dezelfde Core i7.
De werkstation-gerelateerde OpenCL score is slechts half zo goed als die van de ThinkPad P15, voornamelijk door de zwakkere GPU. Deze discrepantie is nog extremer in V-Ray 5 CUDA. In batterijmodus dalen de prestaties met ongeveer 20% (@45 watt).
Cinebench R15 Multi Sustained Load
Cinebench R23: Multi Core | Single Core
Cinebench R20: CPU (Multi Core) | CPU (Single Core)
Cinebench R15: CPU Multi 64Bit | CPU Single 64Bit
Blender: v2.79 BMW27 CPU
7-Zip 18.03: 7z b 4 | 7z b 4 -mmt1
Geekbench 5.5: Multi-Core | Single-Core
HWBOT x265 Benchmark v2.2: 4k Preset
LibreOffice : 20 Documents To PDF
R Benchmark 2.5: Overall mean
V-Ray 5 Benchmark: GPU CUDA
Geekbench 5.5: OpenCL Score
SPECviewperf 13: Solidworks (sw-04) | Siemens NX (snx-03) | Showcase (showcase-02) | Medical (medical-02) | Maya (maya-05) | Energy (energy-02) | Creo (creo-02) | Catia (catia-05) | 3ds Max (3dsmax-06)
SPECviewperf 2020: 1920x1080 Solidworks (solidworks-05) | 1920x1080 Siemens NX (snx-04) | 1920x1080 Medical (medical-03) | 1920x1080 Maya (maya-06) | 1920x1080 Energy (energy-03) | 1920x1080 Creo (creo-03) | 1920x1080 CATIA (catia-06) | 1920x1080 3ds Max (3dsmax-07)
| CPU Performance rating | |
| Gemiddelde van klas Workstation | |
| Lenovo ThinkPad P15 G2-20YQ001JGE -1! | |
| Gemiddeld Intel Core i7-11800H | |
| Dell Precision 5000 5560 -4! | |
| Lenovo ThinkPad T15g-20UR000GGE -1! | |
| HP ZBook Power 15 G8 313S5EA | |
| Lenovo ThinkPad T15p-20TN0006GE -18! | |
| Lenovo ThinkPad P15v G2 21A9000XGE -1! | |
| Lenovo ThinkPad P15s Gen2-20W6000GGE -1! | |
| Cinebench R23 / Multi Core | |
| Gemiddelde van klas Workstation (14621 - 38520, n=23, laatste 2 jaar) | |
| HP ZBook Power 15 G8 313S5EA | |
| Gemiddeld Intel Core i7-11800H (6508 - 14088, n=48) | |
| Lenovo ThinkPad P15 G2-20YQ001JGE | |
| Lenovo ThinkPad P15v G2 21A9000XGE | |
| Dell Precision 5000 5560 | |
| Lenovo ThinkPad T15g-20UR000GGE | |
| Lenovo ThinkPad T15p-20TN0006GE | |
| Lenovo ThinkPad P15s Gen2-20W6000GGE | |
| Cinebench R23 / Single Core | |
| Gemiddelde van klas Workstation (1712 - 2228, n=23, laatste 2 jaar) | |
| HP ZBook Power 15 G8 313S5EA | |
| Dell Precision 5000 5560 | |
| Lenovo ThinkPad P15 G2-20YQ001JGE | |
| Gemiddeld Intel Core i7-11800H (1386 - 1522, n=45) | |
| Lenovo ThinkPad P15s Gen2-20W6000GGE | |
| Lenovo ThinkPad T15g-20UR000GGE | |
| Lenovo ThinkPad T15p-20TN0006GE | |
| Cinebench R20 / CPU (Multi Core) | |
| Gemiddelde van klas Workstation (5760 - 15043, n=23, laatste 2 jaar) | |
| Gemiddeld Intel Core i7-11800H (2498 - 5408, n=50) | |
| Lenovo ThinkPad P15 G2-20YQ001JGE | |
| HP ZBook Power 15 G8 313S5EA | |
| Dell Precision 5000 5560 | |
| Lenovo ThinkPad P15v G2 21A9000XGE | |
| Lenovo ThinkPad T15p-20TN0006GE | |
| Lenovo ThinkPad T15g-20UR000GGE | |
| Lenovo ThinkPad P15s Gen2-20W6000GGE | |
| Cinebench R20 / CPU (Single Core) | |
| Gemiddelde van klas Workstation (671 - 857, n=23, laatste 2 jaar) | |
| HP ZBook Power 15 G8 313S5EA | |
| Dell Precision 5000 5560 | |
| Lenovo ThinkPad P15 G2-20YQ001JGE | |
| Gemiddeld Intel Core i7-11800H (520 - 586, n=47) | |
| Lenovo ThinkPad P15v G2 21A9000XGE | |
| Lenovo ThinkPad P15s Gen2-20W6000GGE | |
| Lenovo ThinkPad T15g-20UR000GGE | |
| Lenovo ThinkPad T15p-20TN0006GE | |
| Cinebench R15 / CPU Multi 64Bit | |
| Gemiddelde van klas Workstation (2489 - 5810, n=23, laatste 2 jaar) | |
| HP ZBook Power 15 G8 313S5EA | |
| HP ZBook Power 15 G8 313S5EA | |
| Gemiddeld Intel Core i7-11800H (1342 - 2173, n=50) | |
| Lenovo ThinkPad P15 G2-20YQ001JGE | |
| Lenovo ThinkPad P15v G2 21A9000XGE | |
| Dell Precision 5000 5560 | |
| Lenovo ThinkPad T15g-20UR000GGE | |
| Lenovo ThinkPad T15p-20TN0006GE | |
| Lenovo ThinkPad P15s Gen2-20W6000GGE | |
| Cinebench R15 / CPU Single 64Bit | |
| Gemiddelde van klas Workstation (191.4 - 328, n=23, laatste 2 jaar) | |
| Dell Precision 5000 5560 | |
| HP ZBook Power 15 G8 313S5EA | |
| Lenovo ThinkPad P15 G2-20YQ001JGE | |
| Gemiddeld Intel Core i7-11800H (201 - 231, n=46) | |
| Lenovo ThinkPad P15v G2 21A9000XGE | |
| Lenovo ThinkPad P15s Gen2-20W6000GGE | |
| Lenovo ThinkPad T15g-20UR000GGE | |
| Lenovo ThinkPad T15p-20TN0006GE | |
| Blender / v2.79 BMW27 CPU | |
| Lenovo ThinkPad P15s Gen2-20W6000GGE | |
| Lenovo ThinkPad T15p-20TN0006GE | |
| Lenovo ThinkPad T15g-20UR000GGE | |
| Lenovo ThinkPad P15v G2 21A9000XGE | |
| Dell Precision 5000 5560 | |
| Gemiddeld Intel Core i7-11800H (217 - 454, n=46) | |
| Lenovo ThinkPad P15 G2-20YQ001JGE | |
| HP ZBook Power 15 G8 313S5EA | |
| Gemiddelde van klas Workstation (91 - 222, n=23, laatste 2 jaar) | |
| 7-Zip 18.03 / 7z b 4 | |
| Gemiddelde van klas Workstation (60489 - 116969, n=23, laatste 2 jaar) | |
| Lenovo ThinkPad P15 G2-20YQ001JGE | |
| HP ZBook Power 15 G8 313S5EA | |
| Gemiddeld Intel Core i7-11800H (33718 - 56758, n=46) | |
| Dell Precision 5000 5560 | |
| Lenovo ThinkPad P15v G2 21A9000XGE | |
| Lenovo ThinkPad T15g-20UR000GGE | |
| Lenovo ThinkPad T15p-20TN0006GE | |
| Lenovo ThinkPad P15s Gen2-20W6000GGE | |
| 7-Zip 18.03 / 7z b 4 -mmt1 | |
| Gemiddelde van klas Workstation (5126 - 6960, n=23, laatste 2 jaar) | |
| Dell Precision 5000 5560 | |
| HP ZBook Power 15 G8 313S5EA | |
| Gemiddeld Intel Core i7-11800H (5138 - 5732, n=46) | |
| Lenovo ThinkPad P15 G2-20YQ001JGE | |
| Lenovo ThinkPad P15s Gen2-20W6000GGE | |
| Lenovo ThinkPad T15g-20UR000GGE | |
| Lenovo ThinkPad P15v G2 21A9000XGE | |
| Lenovo ThinkPad T15p-20TN0006GE | |
| Geekbench 5.5 / Multi-Core | |
| Gemiddelde van klas Workstation (11542 - 25554, n=23, laatste 2 jaar) | |
| Lenovo ThinkPad P15 G2-20YQ001JGE | |
| Gemiddeld Intel Core i7-11800H (4655 - 9851, n=40) | |
| HP ZBook Power 15 G8 313S5EA | |
| Lenovo ThinkPad T15g-20UR000GGE | |
| Lenovo ThinkPad P15v G2 21A9000XGE | |
| Lenovo ThinkPad T15p-20TN0006GE | |
| Lenovo ThinkPad P15s Gen2-20W6000GGE | |
| Geekbench 5.5 / Single-Core | |
| Gemiddelde van klas Workstation (1783 - 2183, n=23, laatste 2 jaar) | |
| Lenovo ThinkPad P15 G2-20YQ001JGE | |
| Gemiddeld Intel Core i7-11800H (1429 - 1625, n=40) | |
| Lenovo ThinkPad P15s Gen2-20W6000GGE | |
| HP ZBook Power 15 G8 313S5EA | |
| Lenovo ThinkPad P15v G2 21A9000XGE | |
| Lenovo ThinkPad T15g-20UR000GGE | |
| Lenovo ThinkPad T15p-20TN0006GE | |
| HWBOT x265 Benchmark v2.2 / 4k Preset | |
| Gemiddelde van klas Workstation (17.8 - 40.5, n=23, laatste 2 jaar) | |
| Lenovo ThinkPad P15 G2-20YQ001JGE | |
| HP ZBook Power 15 G8 313S5EA | |
| Gemiddeld Intel Core i7-11800H (7.38 - 17.4, n=46) | |
| Dell Precision 5000 5560 | |
| Lenovo ThinkPad P15v G2 21A9000XGE | |
| Lenovo ThinkPad T15g-20UR000GGE | |
| Lenovo ThinkPad T15p-20TN0006GE | |
| Lenovo ThinkPad P15s Gen2-20W6000GGE | |
| LibreOffice / 20 Documents To PDF | |
| Lenovo ThinkPad P15v G2 21A9000XGE | |
| Lenovo ThinkPad P15 G2-20YQ001JGE | |
| Lenovo ThinkPad T15g-20UR000GGE | |
| Dell Precision 5000 5560 | |
| Gemiddelde van klas Workstation (37.1 - 74.7, n=23, laatste 2 jaar) | |
| Gemiddeld Intel Core i7-11800H (38.6 - 59.9, n=45) | |
| Lenovo ThinkPad P15s Gen2-20W6000GGE | |
| Lenovo ThinkPad T15p-20TN0006GE | |
| HP ZBook Power 15 G8 313S5EA | |
| R Benchmark 2.5 / Overall mean | |
| Lenovo ThinkPad T15p-20TN0006GE | |
| HP ZBook Power 15 G8 313S5EA | |
| Lenovo ThinkPad P15v G2 21A9000XGE | |
| Lenovo ThinkPad T15g-20UR000GGE | |
| Lenovo ThinkPad P15 G2-20YQ001JGE | |
| Gemiddeld Intel Core i7-11800H (0.548 - 0.615, n=46) | |
| Lenovo ThinkPad P15s Gen2-20W6000GGE | |
| Dell Precision 5000 5560 | |
| Gemiddelde van klas Workstation (0.3825 - 0.603, n=23, laatste 2 jaar) | |
| V-Ray 5 Benchmark / GPU CUDA | |
| Gemiddelde van klas Workstation (989 - 3239, n=9, laatste 2 jaar) | |
| Gemiddeld Intel Core i7-11800H (164 - 1238, n=16) | |
| Lenovo ThinkPad P15v G2 21A9000XGE | |
| HP ZBook Power 15 G8 313S5EA | |
| Geekbench 5.5 / OpenCL Score | |
| Gemiddelde van klas Workstation (33651 - 272866, n=23, laatste 2 jaar) | |
| Lenovo ThinkPad P15 G2-20YQ001JGE | |
| Lenovo ThinkPad T15g-20UR000GGE | |
| Gemiddeld Intel Core i7-11800H (8476 - 129333, n=46) | |
| Lenovo ThinkPad P15v G2 21A9000XGE | |
| HP ZBook Power 15 G8 313S5EA | |
| Lenovo ThinkPad P15s Gen2-20W6000GGE | |
| Lenovo ThinkPad T15p-20TN0006GE | |
| SPECviewperf 13 / Solidworks (sw-04) | |
| Gemiddelde van klas Workstation (147.5 - 230, n=10, laatste 2 jaar) | |
| Lenovo ThinkPad P15 G2-20YQ001JGE | |
| Dell Precision 5000 5560 | |
| Lenovo ThinkPad P15v G2 21A9000XGE | |
| Gemiddeld Intel Core i7-11800H (45.5 - 156.7, n=10) | |
| HP ZBook Power 15 G8 313S5EA | |
| Lenovo ThinkPad P15s Gen2-20W6000GGE | |
| Lenovo ThinkPad T15g-20UR000GGE | |
| SPECviewperf 13 / Siemens NX (snx-03) | |
| Gemiddelde van klas Workstation (331 - 879, n=10, laatste 2 jaar) | |
| Lenovo ThinkPad P15 G2-20YQ001JGE | |
| Dell Precision 5000 5560 | |
| Lenovo ThinkPad P15v G2 21A9000XGE | |
| HP ZBook Power 15 G8 313S5EA | |
| Gemiddeld Intel Core i7-11800H (5.45 - 250, n=10) | |
| Lenovo ThinkPad P15s Gen2-20W6000GGE | |
| Lenovo ThinkPad T15g-20UR000GGE | |
| SPECviewperf 13 / Showcase (showcase-02) | |
| Gemiddelde van klas Workstation (85.3 - 319, n=10, laatste 2 jaar) | |
| Lenovo ThinkPad T15g-20UR000GGE | |
| Lenovo ThinkPad P15 G2-20YQ001JGE | |
| Gemiddeld Intel Core i7-11800H (11.3 - 138, n=10) | |
| Dell Precision 5000 5560 | |
| Lenovo ThinkPad P15v G2 21A9000XGE | |
| HP ZBook Power 15 G8 313S5EA | |
| Lenovo ThinkPad P15s Gen2-20W6000GGE | |
| SPECviewperf 13 / Medical (medical-02) | |
| Gemiddelde van klas Workstation (169.9 - 363, n=10, laatste 2 jaar) | |
| Lenovo ThinkPad P15 G2-20YQ001JGE | |
| Dell Precision 5000 5560 | |
| Gemiddeld Intel Core i7-11800H (4.96 - 89.2, n=10) | |
| Lenovo ThinkPad P15v G2 21A9000XGE | |
| Lenovo ThinkPad T15g-20UR000GGE | |
| HP ZBook Power 15 G8 313S5EA | |
| Lenovo ThinkPad P15s Gen2-20W6000GGE | |
| SPECviewperf 13 / Maya (maya-05) | |
| Gemiddelde van klas Workstation (287 - 448, n=5, laatste 2 jaar) | |
| Lenovo ThinkPad P15 G2-20YQ001JGE | |
| Lenovo ThinkPad T15g-20UR000GGE | |
| Gemiddeld Intel Core i7-11800H (32 - 337, n=10) | |
| Dell Precision 5000 5560 | |
| Lenovo ThinkPad P15v G2 21A9000XGE | |
| HP ZBook Power 15 G8 313S5EA | |
| Lenovo ThinkPad P15s Gen2-20W6000GGE | |
| SPECviewperf 13 / Energy (energy-02) | |
| Gemiddelde van klas Workstation (49.5 - 174.7, n=10, laatste 2 jaar) | |
| Lenovo ThinkPad P15 G2-20YQ001JGE | |
| Dell Precision 5000 5560 | |
| Gemiddeld Intel Core i7-11800H (1.15 - 41.2, n=10) | |
| Lenovo ThinkPad T15g-20UR000GGE | |
| Lenovo ThinkPad P15v G2 21A9000XGE | |
| HP ZBook Power 15 G8 313S5EA | |
| Lenovo ThinkPad P15s Gen2-20W6000GGE | |
| SPECviewperf 13 / Creo (creo-02) | |
| Gemiddelde van klas Workstation (262 - 589, n=10, laatste 2 jaar) | |
| Lenovo ThinkPad P15 G2-20YQ001JGE | |
| Dell Precision 5000 5560 | |
| Lenovo ThinkPad T15g-20UR000GGE | |
| Gemiddeld Intel Core i7-11800H (22.5 - 225, n=10) | |
| Lenovo ThinkPad P15v G2 21A9000XGE | |
| HP ZBook Power 15 G8 313S5EA | |
| Lenovo ThinkPad P15s Gen2-20W6000GGE | |
| SPECviewperf 13 / Catia (catia-05) | |
| Gemiddelde van klas Workstation (301 - 552, n=10, laatste 2 jaar) | |
| Lenovo ThinkPad P15 G2-20YQ001JGE | |
| Dell Precision 5000 5560 | |
| Gemiddeld Intel Core i7-11800H (31.9 - 257, n=10) | |
| Lenovo ThinkPad P15v G2 21A9000XGE | |
| HP ZBook Power 15 G8 313S5EA | |
| Lenovo ThinkPad T15g-20UR000GGE | |
| Lenovo ThinkPad P15s Gen2-20W6000GGE | |
| SPECviewperf 13 / 3ds Max (3dsmax-06) | |
| Gemiddelde van klas Workstation (202 - 422, n=10, laatste 2 jaar) | |
| Lenovo ThinkPad P15 G2-20YQ001JGE | |
| Lenovo ThinkPad T15g-20UR000GGE | |
| Gemiddeld Intel Core i7-11800H (27.2 - 235, n=10) | |
| Dell Precision 5000 5560 | |
| Lenovo ThinkPad P15v G2 21A9000XGE | |
| HP ZBook Power 15 G8 313S5EA | |
| Lenovo ThinkPad P15s Gen2-20W6000GGE | |
| SPECviewperf 2020 / Solidworks (solidworks-05) | |
| Gemiddelde van klas Workstation (50.6 - 542, n=9, laatste 2 jaar) | |
| Lenovo ThinkPad T15g-20UR000GGE | |
| Lenovo ThinkPad P15 G2-20YQ001JGE | |
| Dell Precision 5000 5560 | |
| Gemiddeld Intel Core i7-11800H (73.4 - 147.9, n=6) | |
| Lenovo ThinkPad P15v G2 21A9000XGE | |
| HP ZBook Power 15 G8 313S5EA | |
| Lenovo ThinkPad P15s Gen2-20W6000GGE | |
| SPECviewperf 2020 / Siemens NX (snx-04) | |
| Gemiddelde van klas Workstation (22.3 - 903, n=23, laatste 2 jaar) | |
| Lenovo ThinkPad P15 G2-20YQ001JGE | |
| Dell Precision 5000 5560 | |
| Lenovo ThinkPad P15v G2 21A9000XGE | |
| Gemiddeld Intel Core i7-11800H (18.7 - 250, n=8) | |
| HP ZBook Power 15 G8 313S5EA | |
| Lenovo ThinkPad P15s Gen2-20W6000GGE | |
| Lenovo ThinkPad T15g-20UR000GGE | |
| SPECviewperf 2020 / Medical (medical-03) | |
| Gemiddelde van klas Workstation (28.8 - 227, n=23, laatste 2 jaar) | |
| Lenovo ThinkPad P15 G2-20YQ001JGE | |
| Dell Precision 5000 5560 | |
| Gemiddeld Intel Core i7-11800H (18.7 - 42.7, n=8) | |
| Lenovo ThinkPad T15g-20UR000GGE | |
| Lenovo ThinkPad P15v G2 21A9000XGE | |
| HP ZBook Power 15 G8 313S5EA | |
| Lenovo ThinkPad P15s Gen2-20W6000GGE | |
| SPECviewperf 2020 / Maya (maya-06) | |
| Gemiddelde van klas Workstation (117.8 - 724, n=22, laatste 2 jaar) | |
| Lenovo ThinkPad P15 G2-20YQ001JGE | |
| Lenovo ThinkPad T15g-20UR000GGE | |
| Dell Precision 5000 5560 | |
| Gemiddeld Intel Core i7-11800H (125 - 294, n=8) | |
| Lenovo ThinkPad P15v G2 21A9000XGE | |
| HP ZBook Power 15 G8 313S5EA | |
| Lenovo ThinkPad P15s Gen2-20W6000GGE | |
| SPECviewperf 2020 / Energy (energy-03) | |
| Gemiddelde van klas Workstation (17.3 - 176.7, n=23, laatste 2 jaar) | |
| Lenovo ThinkPad P15 G2-20YQ001JGE | |
| Dell Precision 5000 5560 | |
| Gemiddeld Intel Core i7-11800H (16 - 43.1, n=8) | |
| Lenovo ThinkPad T15g-20UR000GGE | |
| Lenovo ThinkPad P15v G2 21A9000XGE | |
| HP ZBook Power 15 G8 313S5EA | |
| Lenovo ThinkPad P15s Gen2-20W6000GGE | |
| SPECviewperf 2020 / Creo (creo-03) | |
| Gemiddelde van klas Workstation (49.2 - 261, n=23, laatste 2 jaar) | |
| Lenovo ThinkPad P15 G2-20YQ001JGE | |
| Dell Precision 5000 5560 | |
| Gemiddeld Intel Core i7-11800H (67.3 - 124.5, n=8) | |
| Lenovo ThinkPad T15g-20UR000GGE | |
| Lenovo ThinkPad P15v G2 21A9000XGE | |
| HP ZBook Power 15 G8 313S5EA | |
| Lenovo ThinkPad P15s Gen2-20W6000GGE | |
| SPECviewperf 2020 / CATIA (catia-06) | |
| Gemiddelde van klas Workstation (27.1 - 182.2, n=23, laatste 2 jaar) | |
| Lenovo ThinkPad P15 G2-20YQ001JGE | |
| Dell Precision 5000 5560 | |
| Gemiddeld Intel Core i7-11800H (33.1 - 80.5, n=8) | |
| Lenovo ThinkPad T15g-20UR000GGE | |
| Lenovo ThinkPad P15v G2 21A9000XGE | |
| HP ZBook Power 15 G8 313S5EA | |
| Lenovo ThinkPad P15s Gen2-20W6000GGE | |
| SPECviewperf 2020 / 3ds Max (3dsmax-07) | |
| Gemiddelde van klas Workstation (24.7 - 251, n=23, laatste 2 jaar) | |
| Lenovo ThinkPad T15g-20UR000GGE | |
| Lenovo ThinkPad P15 G2-20YQ001JGE | |
| Gemiddeld Intel Core i7-11800H (40.9 - 109.4, n=8) | |
| Dell Precision 5000 5560 | |
| Lenovo ThinkPad P15v G2 21A9000XGE | |
| HP ZBook Power 15 G8 313S5EA | |
| Lenovo ThinkPad P15s Gen2-20W6000GGE | |
* ... kleiner is beter
AIDA64: FP32 Ray-Trace | FPU Julia | CPU SHA3 | CPU Queen | FPU SinJulia | FPU Mandel | CPU AES | CPU ZLib | FP64 Ray-Trace | CPU PhotoWorxx
| Performance rating | |
| Gemiddelde van klas Workstation | |
| HP ZBook Power 15 G8 313S5EA | |
| Gemiddeld Intel Core i7-11800H | |
| Lenovo ThinkPad P15v G2 21A9000XGE | |
| Lenovo ThinkPad T15g-20UR000GGE | |
| Lenovo ThinkPad T15p-20TN0006GE | |
| Lenovo ThinkPad P15s Gen2-20W6000GGE | |
| AIDA64 / FP32 Ray-Trace | |
| Gemiddelde van klas Workstation (16730 - 61611, n=23, laatste 2 jaar) | |
| HP ZBook Power 15 G8 313S5EA | |
| Gemiddeld Intel Core i7-11800H (8772 - 15961, n=20) | |
| Lenovo ThinkPad P15v G2 21A9000XGE | |
| Lenovo ThinkPad T15g-20UR000GGE | |
| Lenovo ThinkPad T15p-20TN0006GE | |
| Lenovo ThinkPad P15s Gen2-20W6000GGE | |
| AIDA64 / FPU Julia | |
| Gemiddelde van klas Workstation (89597 - 186971, n=23, laatste 2 jaar) | |
| HP ZBook Power 15 G8 313S5EA | |
| Gemiddeld Intel Core i7-11800H (39404 - 65636, n=20) | |
| Lenovo ThinkPad P15v G2 21A9000XGE | |
| Lenovo ThinkPad T15g-20UR000GGE | |
| Lenovo ThinkPad T15p-20TN0006GE | |
| Lenovo ThinkPad P15s Gen2-20W6000GGE | |
| AIDA64 / CPU SHA3 | |
| Gemiddelde van klas Workstation (4178 - 8975, n=23, laatste 2 jaar) | |
| HP ZBook Power 15 G8 313S5EA | |
| Gemiddeld Intel Core i7-11800H (2599 - 4439, n=20) | |
| Lenovo ThinkPad P15v G2 21A9000XGE | |
| Lenovo ThinkPad T15g-20UR000GGE | |
| Lenovo ThinkPad T15p-20TN0006GE | |
| Lenovo ThinkPad P15s Gen2-20W6000GGE | |
| AIDA64 / CPU Queen | |
| Gemiddelde van klas Workstation (60778 - 144411, n=23, laatste 2 jaar) | |
| HP ZBook Power 15 G8 313S5EA | |
| Gemiddeld Intel Core i7-11800H (85233 - 91941, n=20) | |
| Lenovo ThinkPad P15v G2 21A9000XGE | |
| Lenovo ThinkPad T15p-20TN0006GE | |
| Lenovo ThinkPad T15g-20UR000GGE | |
| Lenovo ThinkPad P15s Gen2-20W6000GGE | |
| AIDA64 / FPU SinJulia | |
| Gemiddelde van klas Workstation (8165 - 29343, n=23, laatste 2 jaar) | |
| HP ZBook Power 15 G8 313S5EA | |
| Gemiddeld Intel Core i7-11800H (6420 - 9792, n=20) | |
| Lenovo ThinkPad P15v G2 21A9000XGE | |
| Lenovo ThinkPad T15p-20TN0006GE | |
| Lenovo ThinkPad T15g-20UR000GGE | |
| Lenovo ThinkPad P15s Gen2-20W6000GGE | |
| AIDA64 / FPU Mandel | |
| Gemiddelde van klas Workstation (44497 - 98153, n=23, laatste 2 jaar) | |
| HP ZBook Power 15 G8 313S5EA | |
| Gemiddeld Intel Core i7-11800H (23365 - 39464, n=20) | |
| Lenovo ThinkPad P15v G2 21A9000XGE | |
| Lenovo ThinkPad T15g-20UR000GGE | |
| Lenovo ThinkPad T15p-20TN0006GE | |
| Lenovo ThinkPad P15s Gen2-20W6000GGE | |
| AIDA64 / CPU AES | |
| Gemiddeld Intel Core i7-11800H (74617 - 149388, n=20) | |
| Gemiddelde van klas Workstation (73133 - 187841, n=23, laatste 2 jaar) | |
| HP ZBook Power 15 G8 313S5EA | |
| Lenovo ThinkPad P15v G2 21A9000XGE | |
| Lenovo ThinkPad P15s Gen2-20W6000GGE | |
| Lenovo ThinkPad T15p-20TN0006GE | |
| Lenovo ThinkPad T15g-20UR000GGE | |
| AIDA64 / CPU ZLib | |
| Gemiddelde van klas Workstation (929 - 2148, n=23, laatste 2 jaar) | |
| HP ZBook Power 15 G8 313S5EA | |
| Lenovo ThinkPad P15v G2 21A9000XGE | |
| Lenovo ThinkPad T15g-20UR000GGE | |
| Lenovo ThinkPad T15p-20TN0006GE | |
| Lenovo ThinkPad P15s Gen2-20W6000GGE | |
| Gemiddeld Intel Core i7-11800H (461 - 830, n=43) | |
| AIDA64 / FP64 Ray-Trace | |
| Gemiddelde van klas Workstation (8545 - 32891, n=23, laatste 2 jaar) | |
| HP ZBook Power 15 G8 313S5EA | |
| Gemiddeld Intel Core i7-11800H (4545 - 8717, n=21) | |
| Lenovo ThinkPad P15v G2 21A9000XGE | |
| Lenovo ThinkPad T15g-20UR000GGE | |
| Lenovo ThinkPad T15p-20TN0006GE | |
| Lenovo ThinkPad P15s Gen2-20W6000GGE | |
| AIDA64 / CPU PhotoWorxx | |
| Gemiddelde van klas Workstation (37151 - 93684, n=23, laatste 2 jaar) | |
| Lenovo ThinkPad P15s Gen2-20W6000GGE | |
| Lenovo ThinkPad T15g-20UR000GGE | |
| Gemiddeld Intel Core i7-11800H (11898 - 26757, n=21) | |
| HP ZBook Power 15 G8 313S5EA | |
| Lenovo ThinkPad T15p-20TN0006GE | |
| Lenovo ThinkPad P15v G2 21A9000XGE | |
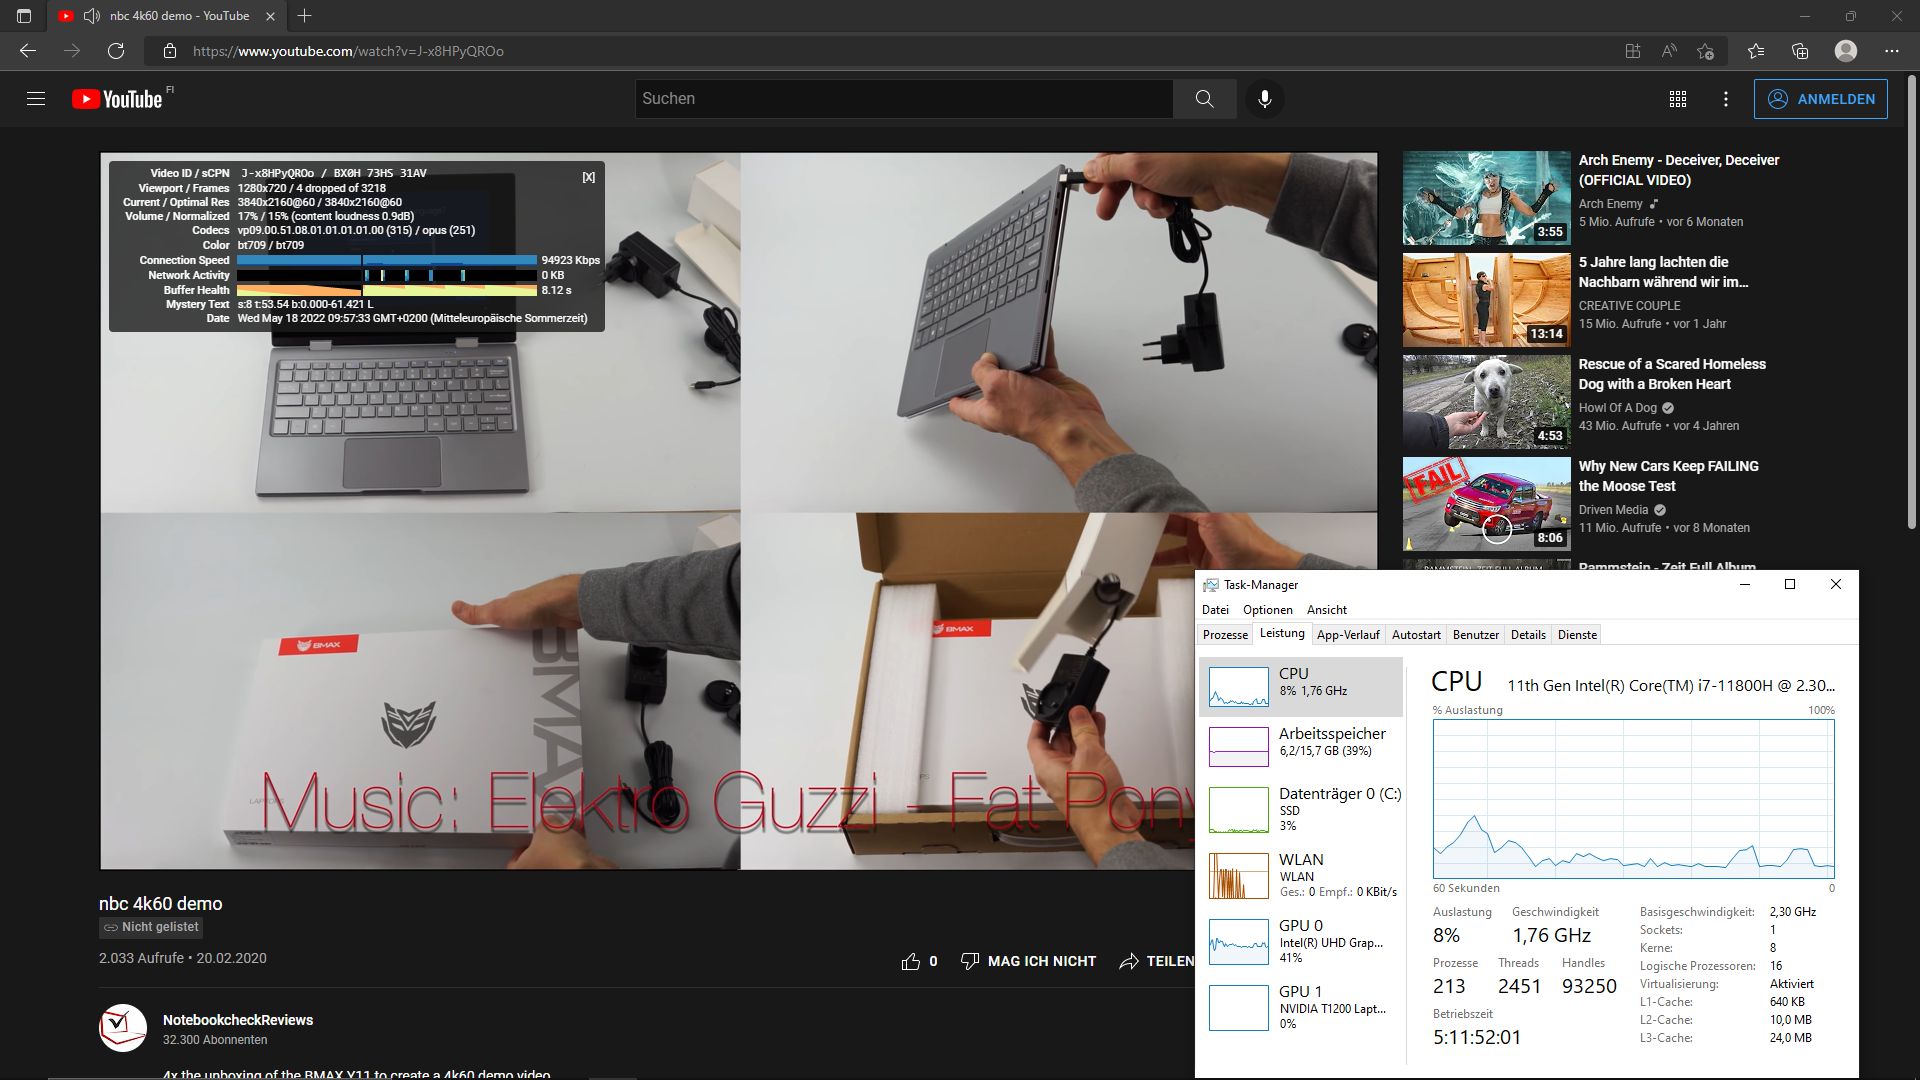
Systeemprestaties
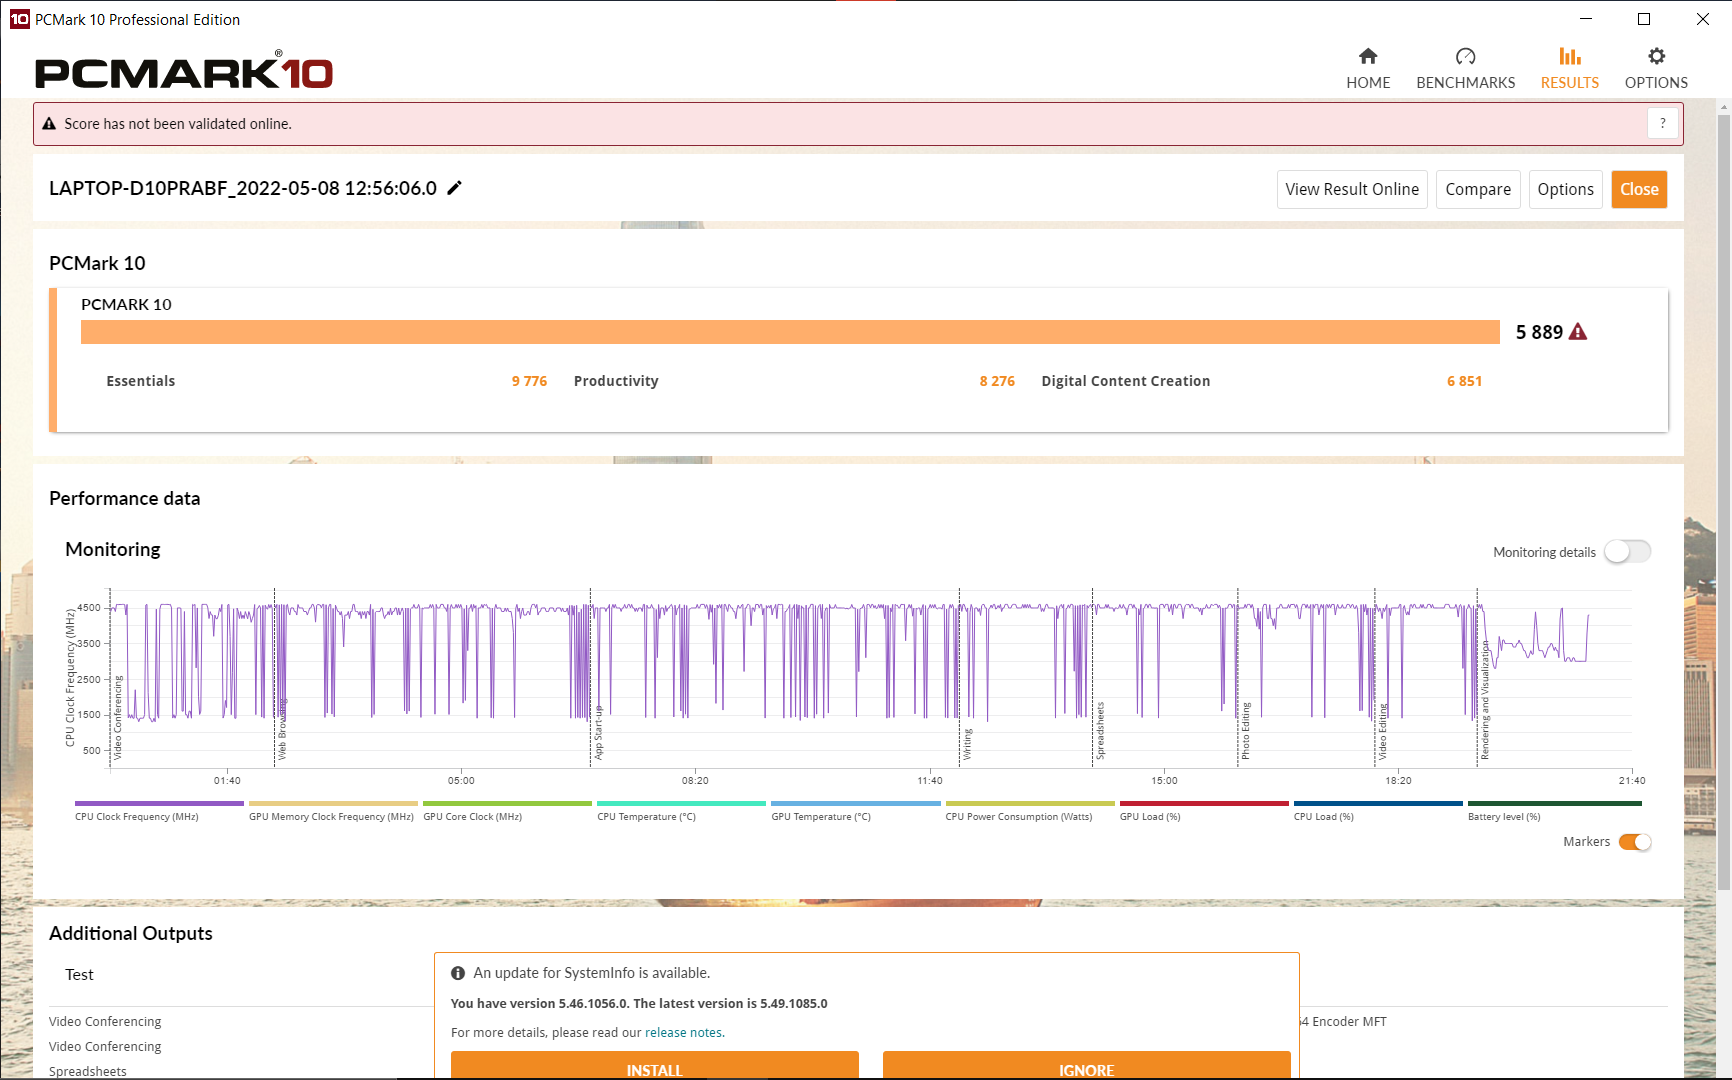
Browsen met meerdere tabbladen terwijl je een 4k YouTube video afspeelt verloopt vloeiend.
De benchmarkresultaten zijn van een goed niveau, wat nog kan worden verbeterd met een tweede RAM-module (dual-channel modus).
CrossMark: Overall | Productivity | Creativity | Responsiveness
| PCMark 10 / Score | |
| Gemiddelde van klas Workstation (6563 - 10409, n=19, laatste 2 jaar) | |
| Dell Precision 5000 5560 | |
| Lenovo ThinkPad P15 G2-20YQ001JGE | |
| Lenovo ThinkPad T15g-20UR000GGE | |
| Gemiddeld Intel Core i7-11800H, NVIDIA T1200 Laptop GPU (5889 - 6147, n=3) | |
| Lenovo ThinkPad P15v G2 21A9000XGE | |
| Lenovo ThinkPad P15s Gen2-20W6000GGE | |
| Lenovo ThinkPad T15p-20TN0006GE | |
| HP ZBook Power 15 G8 313S5EA | |
| PCMark 10 / Essentials | |
| Dell Precision 5000 5560 | |
| Gemiddelde van klas Workstation (9622 - 11157, n=19, laatste 2 jaar) | |
| Lenovo ThinkPad P15 G2-20YQ001JGE | |
| Gemiddeld Intel Core i7-11800H, NVIDIA T1200 Laptop GPU (9776 - 9956, n=3) | |
| Lenovo ThinkPad P15v G2 21A9000XGE | |
| Lenovo ThinkPad P15s Gen2-20W6000GGE | |
| Lenovo ThinkPad T15g-20UR000GGE | |
| Lenovo ThinkPad T15p-20TN0006GE | |
| HP ZBook Power 15 G8 313S5EA | |
| PCMark 10 / Productivity | |
| Gemiddelde van klas Workstation (8789 - 20616, n=19, laatste 2 jaar) | |
| Lenovo ThinkPad P15s Gen2-20W6000GGE | |
| Dell Precision 5000 5560 | |
| Lenovo ThinkPad P15 G2-20YQ001JGE | |
| Gemiddeld Intel Core i7-11800H, NVIDIA T1200 Laptop GPU (8276 - 8445, n=3) | |
| Lenovo ThinkPad P15v G2 21A9000XGE | |
| Lenovo ThinkPad T15g-20UR000GGE | |
| HP ZBook Power 15 G8 313S5EA | |
| Lenovo ThinkPad T15p-20TN0006GE | |
| PCMark 10 / Digital Content Creation | |
| Gemiddelde van klas Workstation (8108 - 15631, n=19, laatste 2 jaar) | |
| Lenovo ThinkPad P15 G2-20YQ001JGE | |
| Dell Precision 5000 5560 | |
| Lenovo ThinkPad T15g-20UR000GGE | |
| Gemiddeld Intel Core i7-11800H, NVIDIA T1200 Laptop GPU (6851 - 7581, n=3) | |
| Lenovo ThinkPad P15v G2 21A9000XGE | |
| Lenovo ThinkPad T15p-20TN0006GE | |
| HP ZBook Power 15 G8 313S5EA | |
| Lenovo ThinkPad P15s Gen2-20W6000GGE | |
| CrossMark / Overall | |
| Gemiddelde van klas Workstation (1307 - 2267, n=22, laatste 2 jaar) | |
| HP ZBook Power 15 G8 313S5EA | |
| Gemiddeld Intel Core i7-11800H, NVIDIA T1200 Laptop GPU (1367 - 1526, n=2) | |
| Lenovo ThinkPad P15v G2 21A9000XGE | |
| CrossMark / Productivity | |
| Gemiddelde van klas Workstation (1130 - 2122, n=22, laatste 2 jaar) | |
| HP ZBook Power 15 G8 313S5EA | |
| Gemiddeld Intel Core i7-11800H, NVIDIA T1200 Laptop GPU (1389 - 1521, n=2) | |
| Lenovo ThinkPad P15v G2 21A9000XGE | |
| CrossMark / Creativity | |
| Gemiddelde van klas Workstation (1657 - 2725, n=22, laatste 2 jaar) | |
| HP ZBook Power 15 G8 313S5EA | |
| Gemiddeld Intel Core i7-11800H, NVIDIA T1200 Laptop GPU (1430 - 1606, n=2) | |
| Lenovo ThinkPad P15v G2 21A9000XGE | |
| CrossMark / Responsiveness | |
| Gemiddelde van klas Workstation (993 - 2096, n=22, laatste 2 jaar) | |
| Gemiddeld Intel Core i7-11800H, NVIDIA T1200 Laptop GPU (1137 - 1323, n=2) | |
| HP ZBook Power 15 G8 313S5EA | |
| Lenovo ThinkPad P15v G2 21A9000XGE | |
| PCMark 10 Score | 5889 punten | |
Help | ||
| AIDA64 / Memory Copy | |
| Gemiddelde van klas Workstation (56003 - 164795, n=23, laatste 2 jaar) | |
| Lenovo ThinkPad P15s Gen2-20W6000GGE | |
| Gemiddeld Intel Core i7-11800H (24508 - 48144, n=21) | |
| Lenovo ThinkPad T15g-20UR000GGE | |
| HP ZBook Power 15 G8 313S5EA | |
| Lenovo ThinkPad P15v G2 21A9000XGE | |
| Lenovo ThinkPad T15p-20TN0006GE | |
| AIDA64 / Memory Read | |
| Gemiddelde van klas Workstation (55795 - 121563, n=23, laatste 2 jaar) | |
| Lenovo ThinkPad P15s Gen2-20W6000GGE | |
| Gemiddeld Intel Core i7-11800H (25882 - 50365, n=20) | |
| Lenovo ThinkPad T15g-20UR000GGE | |
| HP ZBook Power 15 G8 313S5EA | |
| Lenovo ThinkPad P15v G2 21A9000XGE | |
| Lenovo ThinkPad T15p-20TN0006GE | |
| AIDA64 / Memory Write | |
| Gemiddelde van klas Workstation (55663 - 214520, n=23, laatste 2 jaar) | |
| Lenovo ThinkPad P15s Gen2-20W6000GGE | |
| Lenovo ThinkPad T15g-20UR000GGE | |
| Gemiddeld Intel Core i7-11800H (22240 - 46214, n=20) | |
| HP ZBook Power 15 G8 313S5EA | |
| Lenovo ThinkPad P15v G2 21A9000XGE | |
| Lenovo ThinkPad T15p-20TN0006GE | |
| AIDA64 / Memory Latency | |
| Gemiddelde van klas Workstation (84.5 - 165.2, n=23, laatste 2 jaar) | |
| Lenovo ThinkPad P15v G2 21A9000XGE | |
| Lenovo ThinkPad P15s Gen2-20W6000GGE | |
| Lenovo ThinkPad T15p-20TN0006GE | |
| HP ZBook Power 15 G8 313S5EA | |
| Lenovo ThinkPad T15g-20UR000GGE | |
| Gemiddeld Intel Core i7-11800H (71.9 - 104.1, n=44) | |
* ... kleiner is beter
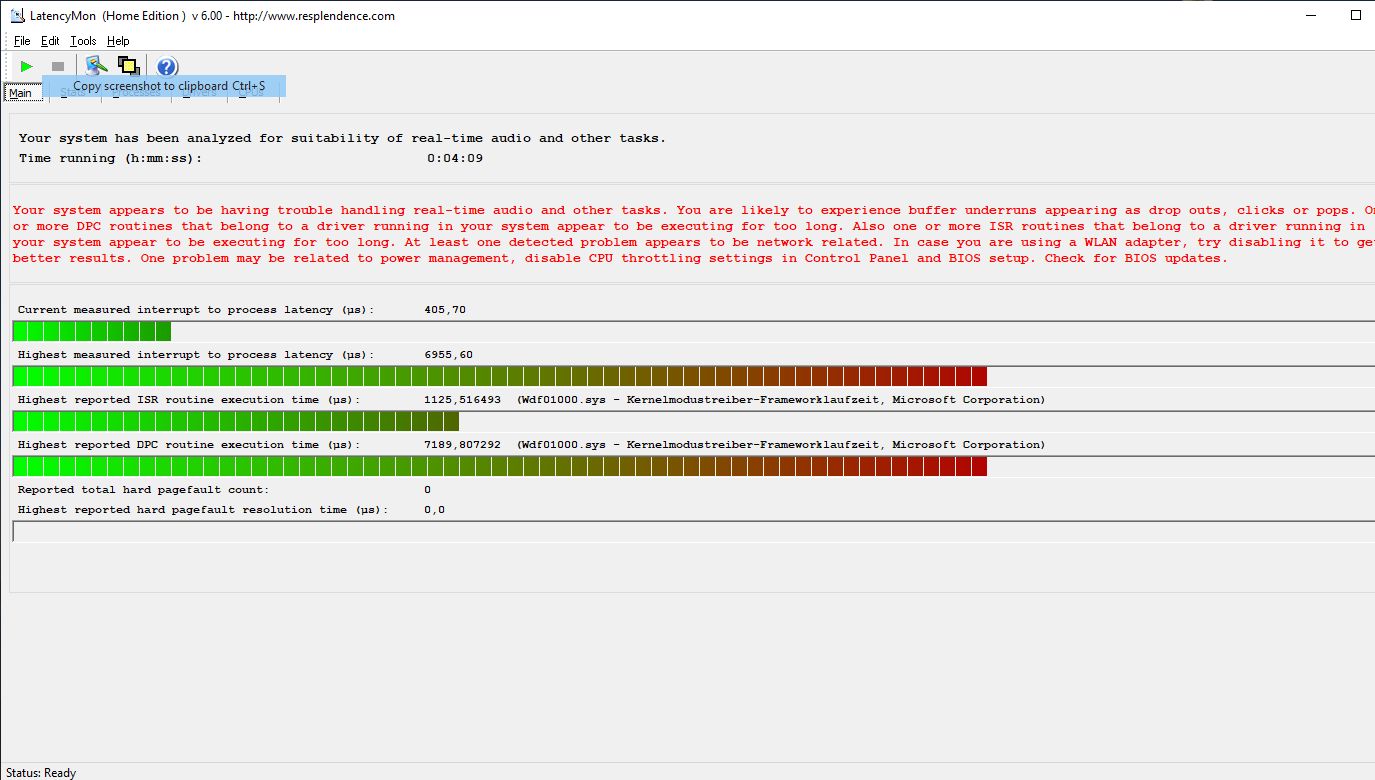
DPC latenties
Net als de dikkere ThinkPad P15 G2, bleken de DPC latenties belabberd te zijn met de nieuwste stuurprogramma's en BIOS op het moment van testen. Zoals zo vaak zijn de kernel module en netwerk drivers hiervoor verantwoordelijk. De P15v G2 is daarom ongeschikt voor real-time video- en audioverwerking Dell's Precision 5560 doet het hier veel beter.
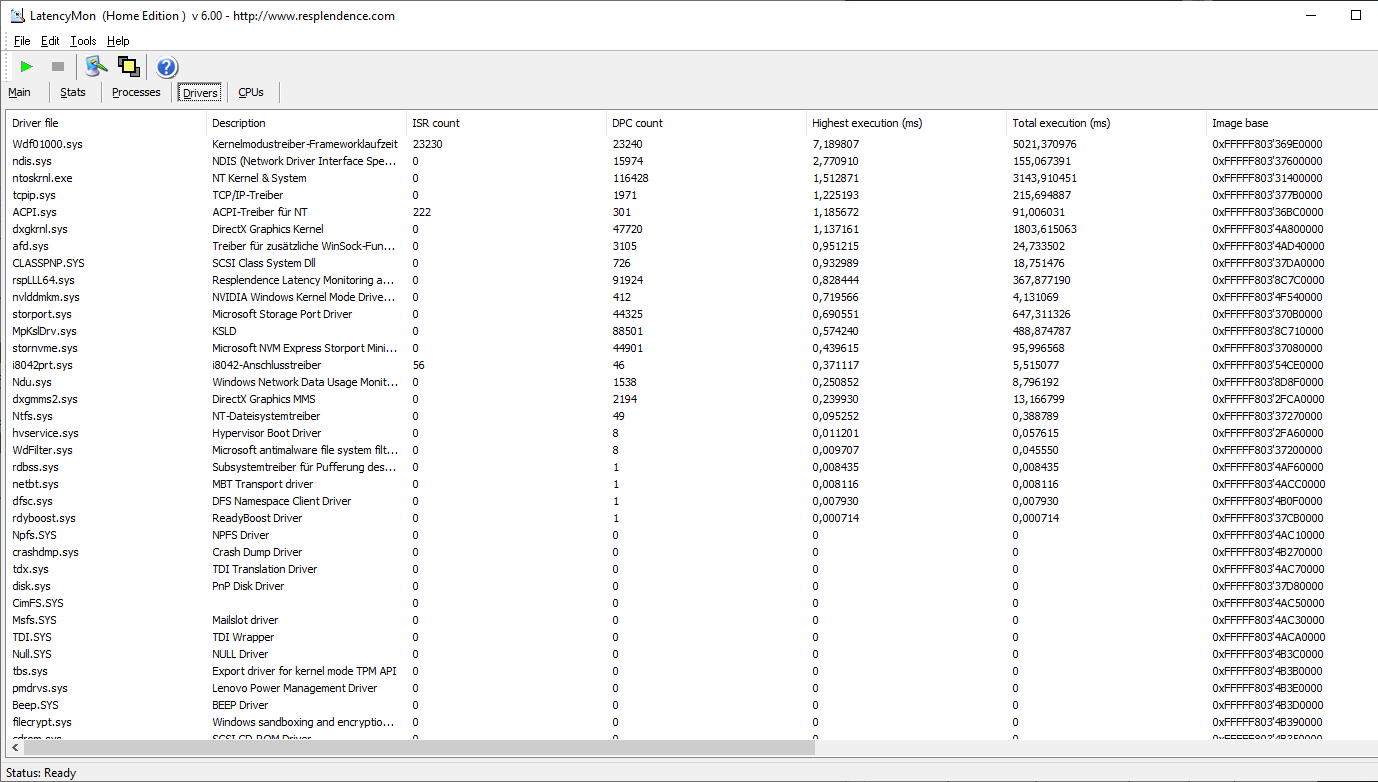
| DPC Latencies / LatencyMon - interrupt to process latency (max), Web, Youtube, Prime95 | |
| Lenovo ThinkPad P15v G2 21A9000XGE | |
| Lenovo ThinkPad P15 G2-20YQ001JGE | |
| Lenovo ThinkPad P15s Gen2-20W6000GGE | |
| Lenovo ThinkPad T15g-20UR000GGE | |
| Lenovo ThinkPad T15p-20TN0006GE | |
| Dell Precision 5000 5560 | |
| HP ZBook Power 15 G8 313S5EA | |
* ... kleiner is beter
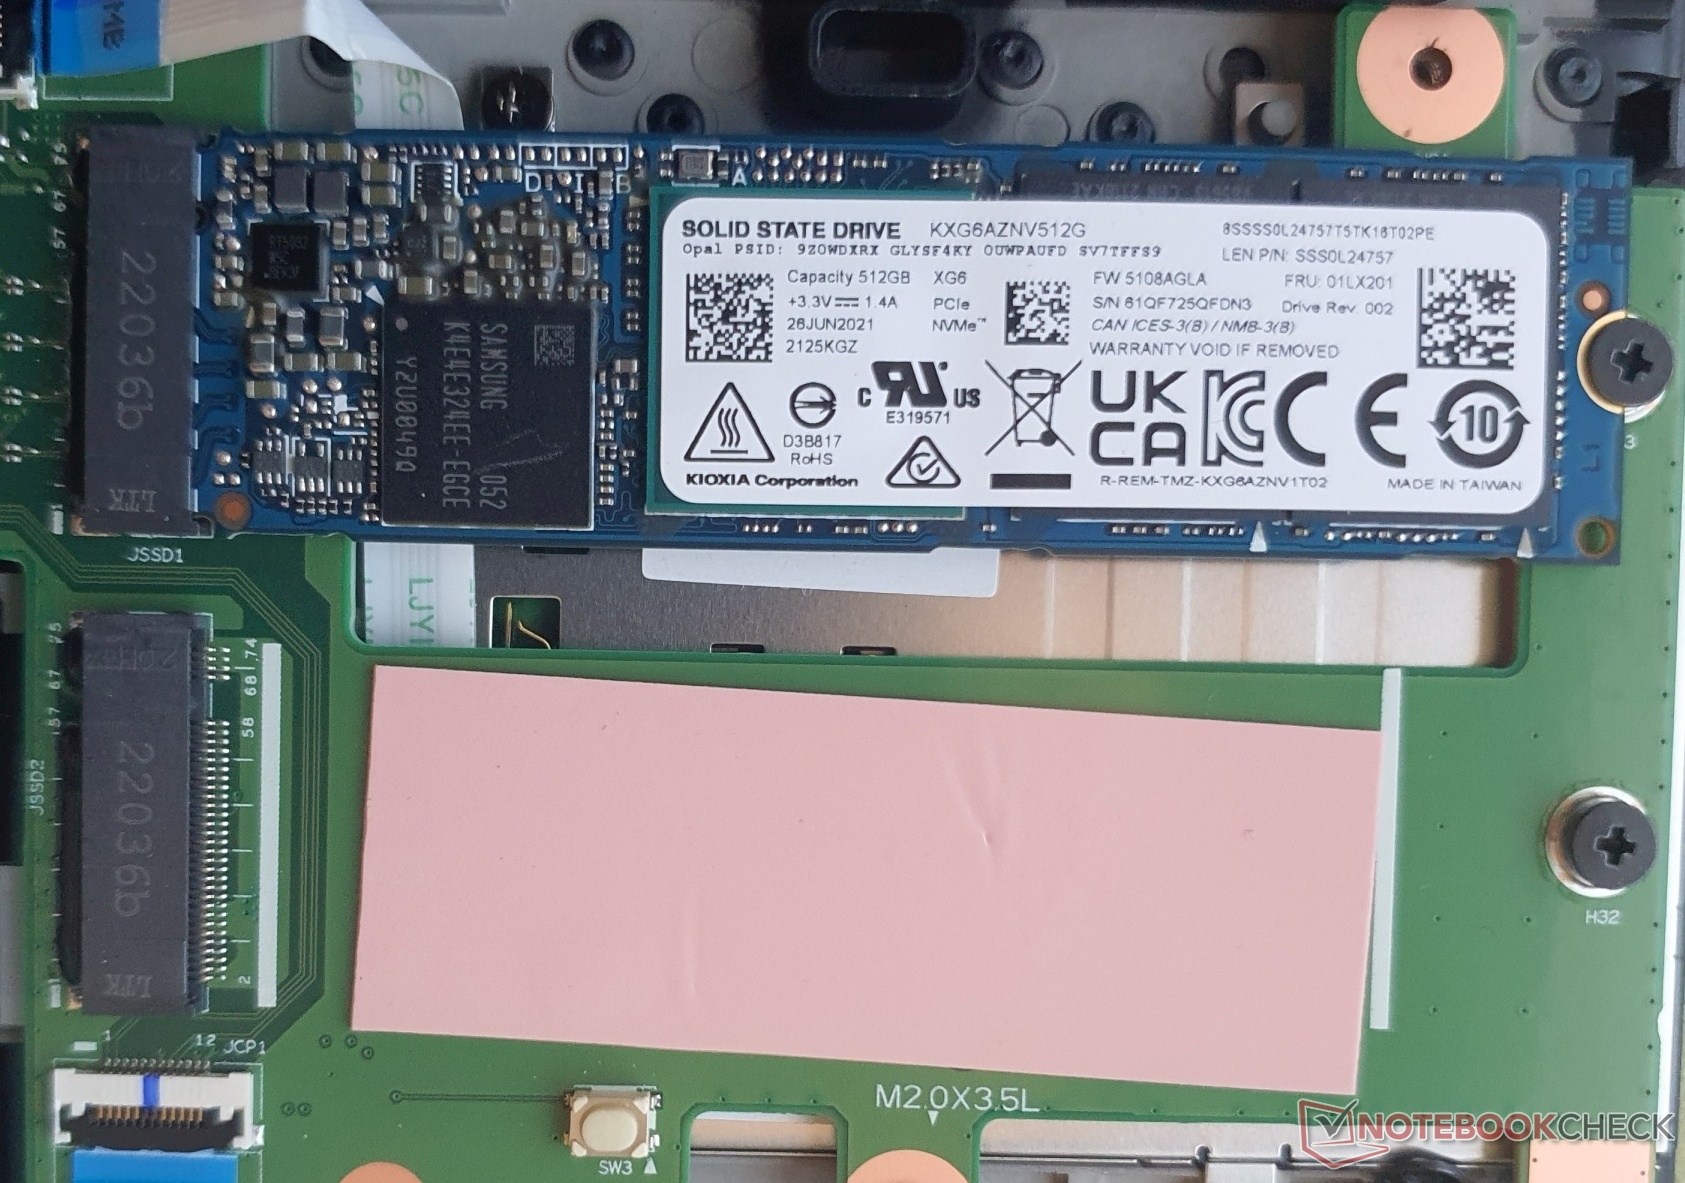
Opslagapparaten
De NVMe SSD van Toshiba heeft een capaciteit van 512 GB. De snelheid is zoals verwacht voor PCIe 3.0, maar niet altijd per se voldoende voor een werkstation.
Daar staat tegenover dat je tot twee snellere PCIe 4.0 SSD's kunt upgraden en deze ook in een RAID (0.1) configuratie kunt gebruiken. HP's ZBook Power 15 G8, Dell's Precision 5560en de ThinkPad P15 halen ongeveer de dubbele snelheid.
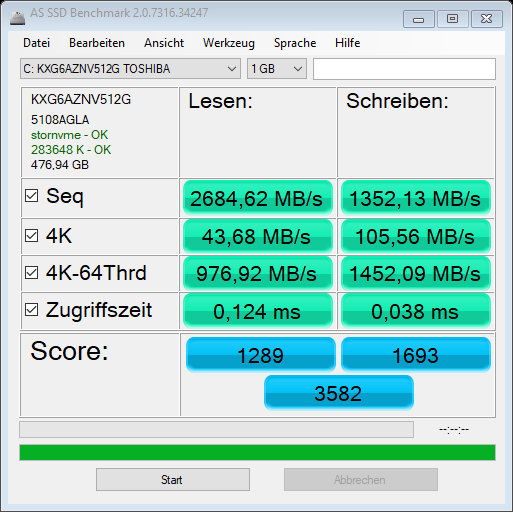
| Lenovo ThinkPad P15v G2 21A9000XGE T1200 Laptop GPU, i7-11800H, Toshiba XG6 KXG6AZNV512G | Lenovo ThinkPad P15 G2-20YQ001JGE RTX A3000 Laptop GPU, i7-11800H, Kioxia XG7 KXG7AZNV512G | Lenovo ThinkPad T15g-20UR000GGE GeForce RTX 2070 Super Max-Q, i7-10750H, SK Hynix PC401 512GB M.2 (HFS512GD9TNG) | Lenovo ThinkPad T15p-20TN0006GE GeForce GTX 1050 Mobile, i7-10750H, WDC PC SN730 SDBQNTY-512GB | Lenovo ThinkPad P15s Gen2-20W6000GGE T500 Laptop GPU, i7-1165G7, WDC PC SN720 SDAQNTW-1T00 | Dell Precision 5000 5560 RTX A2000 Laptop GPU, i7-11850H, Samsung PM9A1 MZVL22T0HBLB | |
|---|---|---|---|---|---|---|
| AS SSD | 53% | 49% | 16% | 32% | 57% | |
| Seq Read (MB/s) | 2684 | 5105 90% | 2889 8% | 2505 -7% | 2796 4% | 5169 93% |
| Seq Write (MB/s) | 1352 | 1815 34% | 2424 79% | 1230 -9% | 2525 87% | 1986 47% |
| 4K Read (MB/s) | 43.68 | 47.46 9% | 55.6 27% | 42.4 -3% | 50.9 17% | 78 79% |
| 4K Write (MB/s) | 105.56 | 137.3 30% | 144.6 37% | 116.5 10% | 211.9 101% | 214.6 103% |
| 4K-64 Read (MB/s) | 976.92 | 2112 116% | 1569 61% | 1416 45% | 1505 54% | 1232 26% |
| 4K-64 Write (MB/s) | 1452.09 | 1702 17% | 1922 32% | 1809 25% | 949 -35% | 2719 87% |
| Access Time Read * (ms) | 0.124 | 0.065 48% | 0.07 44% | 0.109 12% | 0.081 35% | 0.024 81% |
| Access Time Write * (ms) | 0.038 | 0.03 21% | 0.026 32% | 0.032 16% | 0.019 50% | 0.059 -55% |
| Score Read (Points) | 1289 | 2670 107% | 1914 48% | 1708 33% | 1835 42% | 1827 42% |
| Score Write (Points) | 1693 | 2021 19% | 2309 36% | 2048 21% | 1413 -17% | 3133 85% |
| Score Total (Points) | 3582 | 5885 64% | 5185 45% | 4568 28% | 4177 17% | 5753 61% |
| Copy ISO MB/s (MB/s) | 1760.5 | 2054 17% | 2489 41% | 3201 82% | ||
| Copy Program MB/s (MB/s) | 355 | 714 101% | 728 105% | 415.8 17% | ||
| Copy Game MB/s (MB/s) | 849 | 1431 69% | 1670 97% | 1212 43% |
* ... kleiner is beter

* ... kleiner is beter
Sustained Read Performance: DiskSpd Read Loop, Queue Depth 8
Grafische kaart

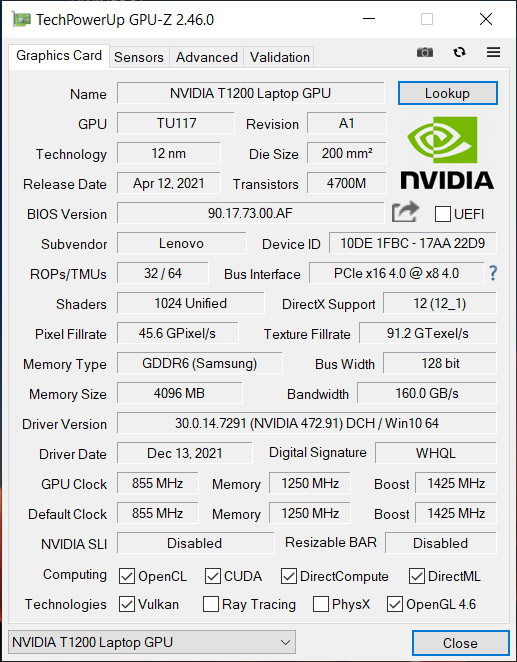
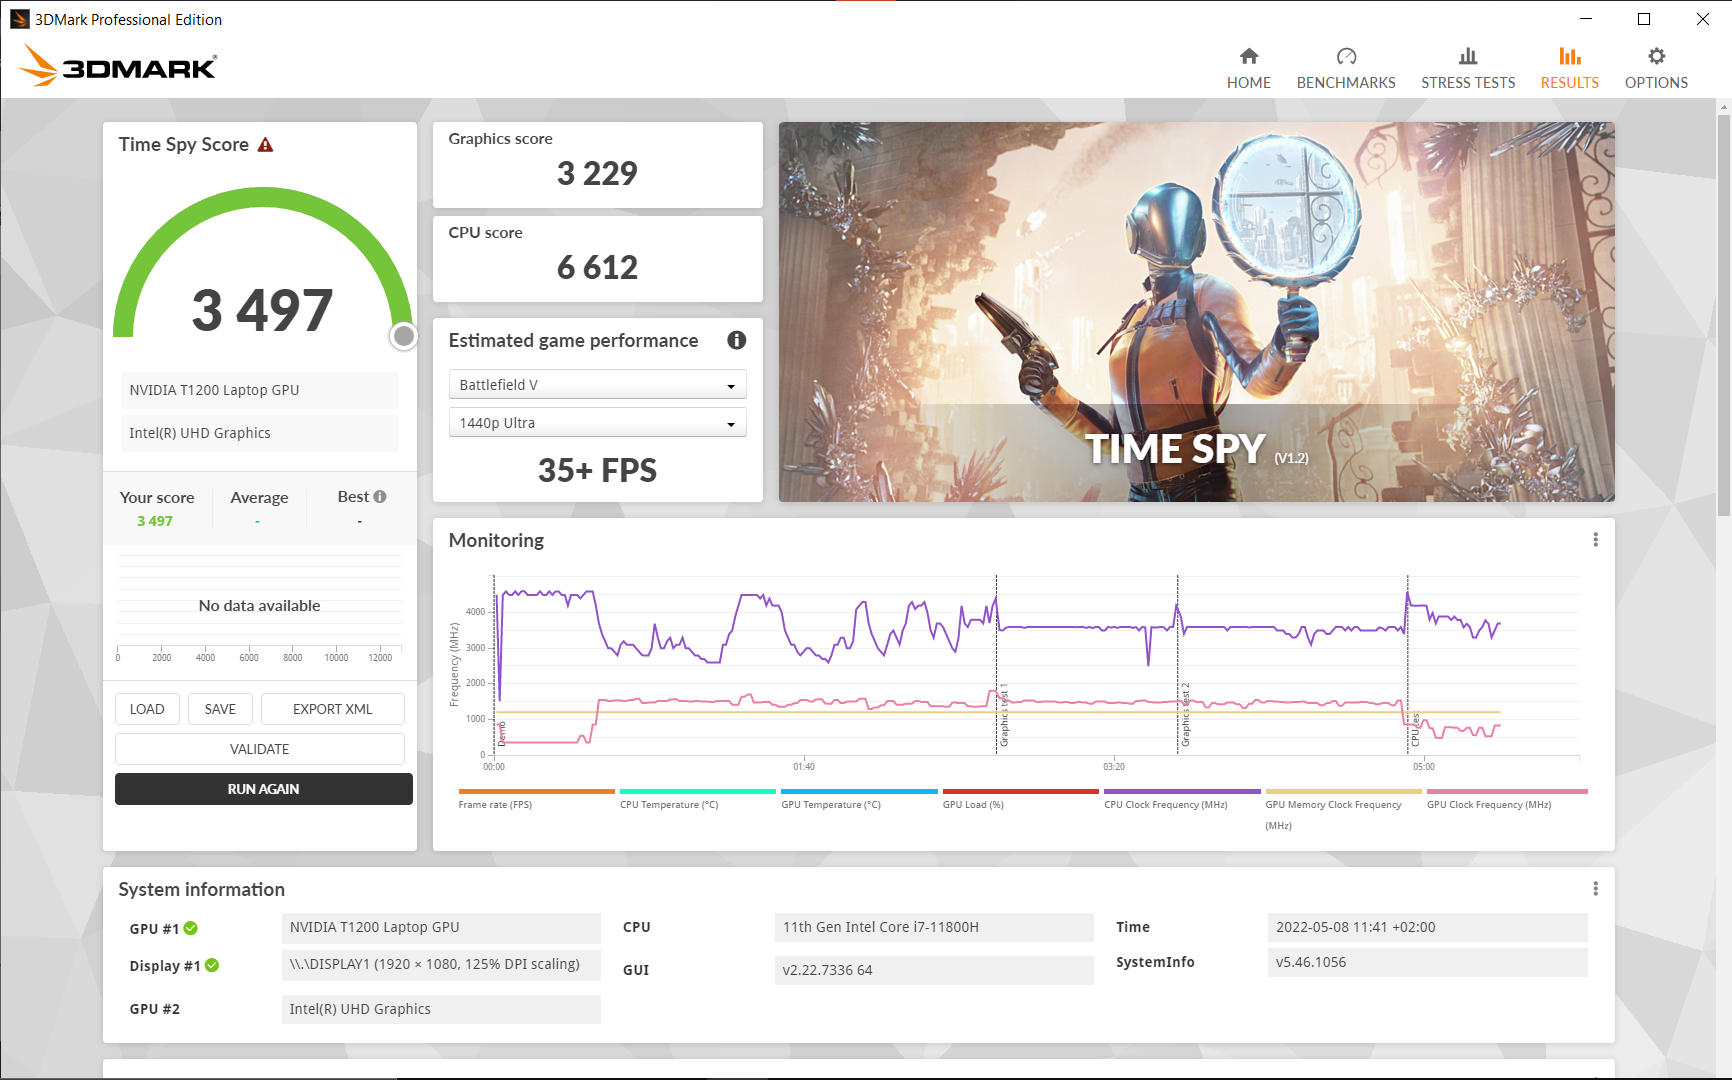
De Nvidia T1200is de professionele variant van de GeForce GTX 1650 Ti, heeft 4 GB GDDR6 VRAM en is opgevoerd tot 1.425 MHz. Hij is meer dan twee keer zo snel als de GeForce GTX 1050 van de voorganger en zijn zustermodel in veel benchmarks. Een nog groter verschil komt voort uit de optionele RTX A2000.
In batterijmodus wordt de TGP van 40 W teruggebracht tot 30 W en daalt de kloksnelheid met 250 MHz. De prestaties dalen daardoor met 15%. In dit scenario trakteert de CPU zichzelf op nog eens 7 watt meer van het gedeelde TDP.
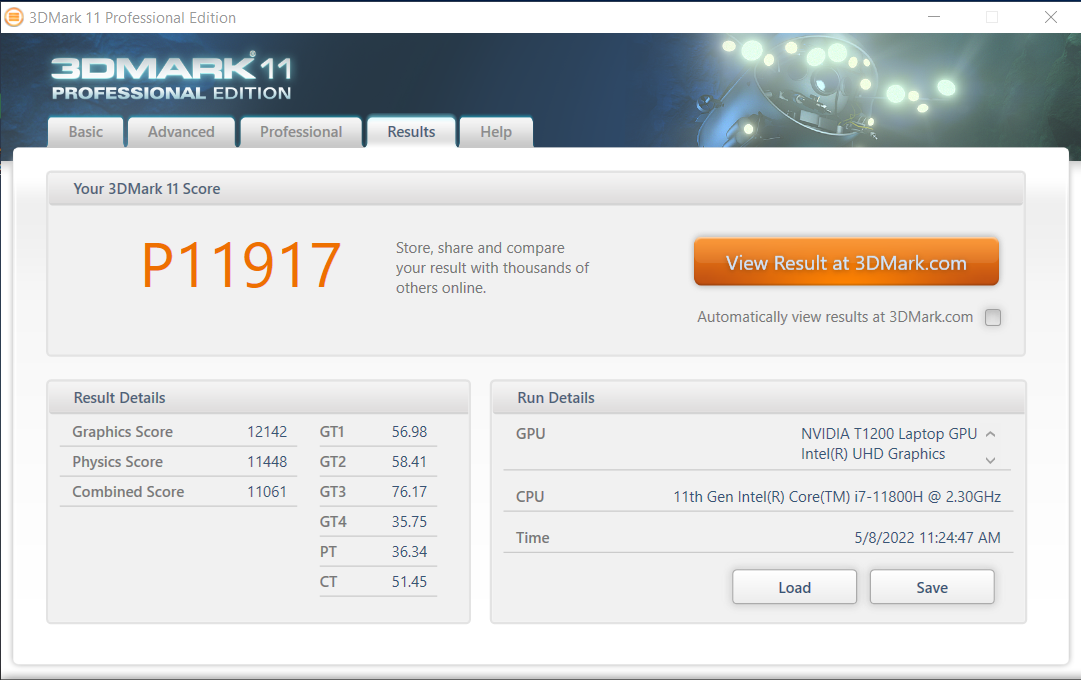
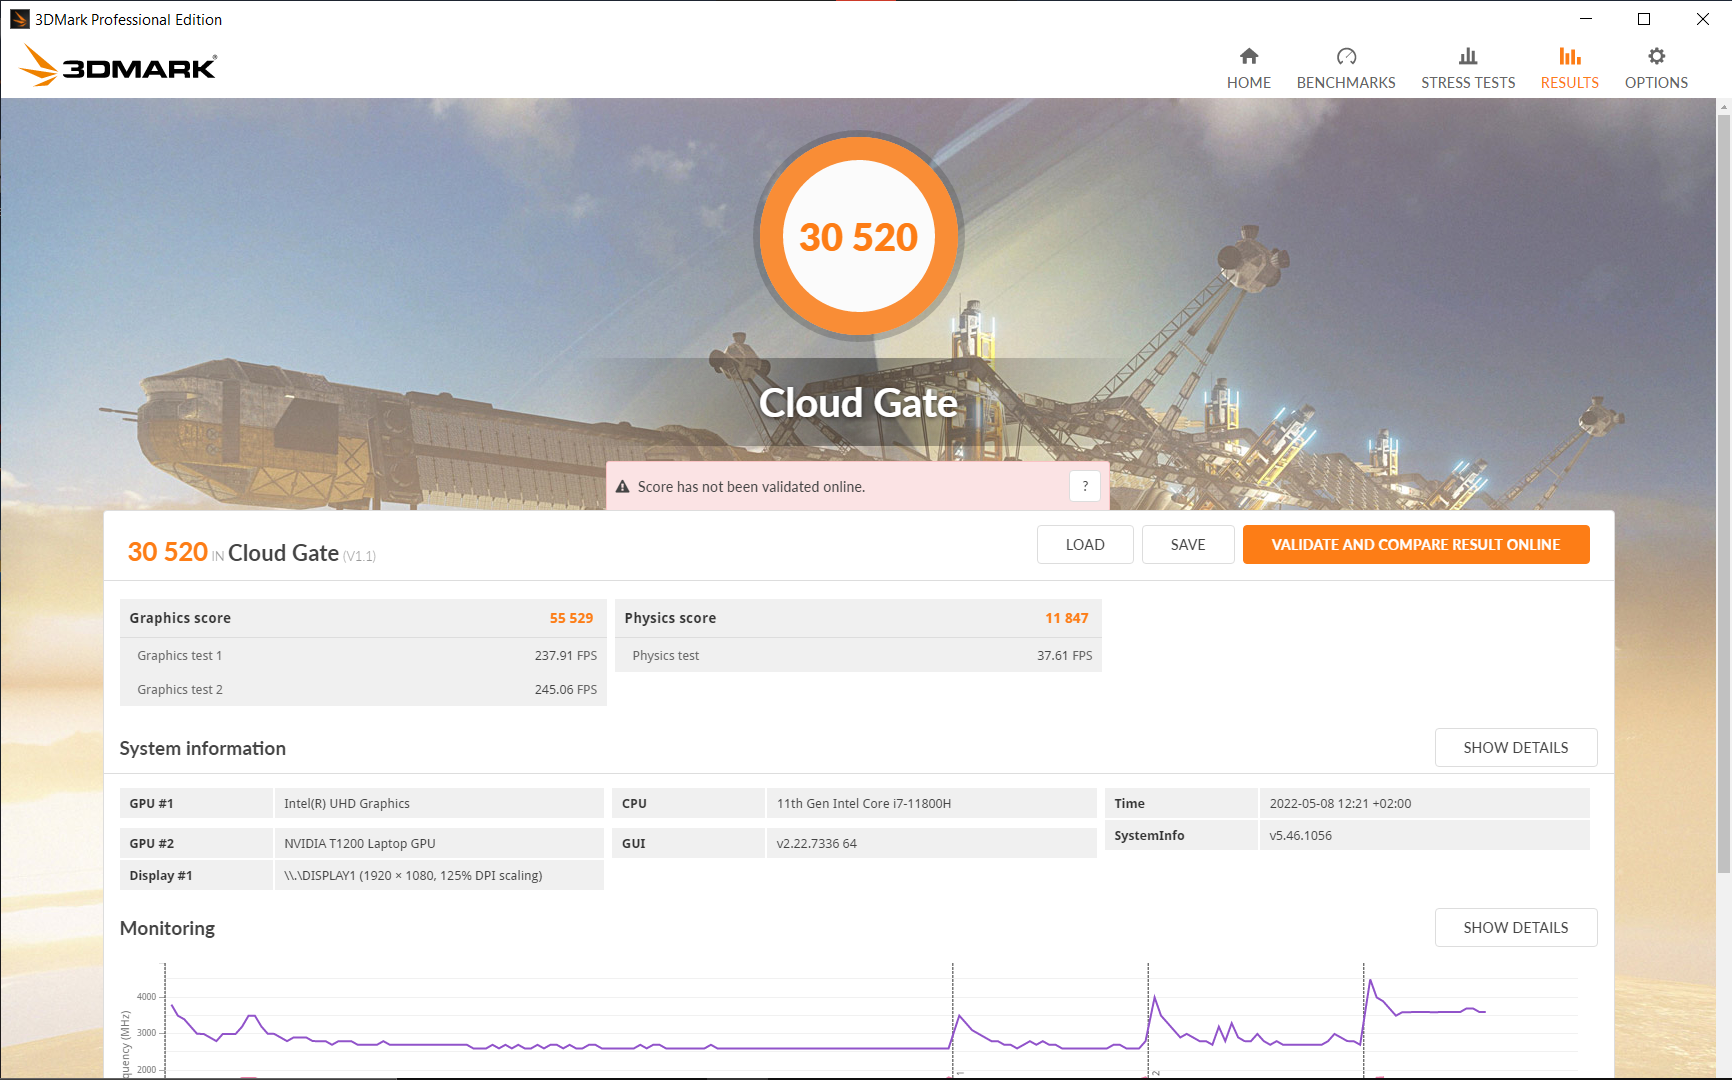
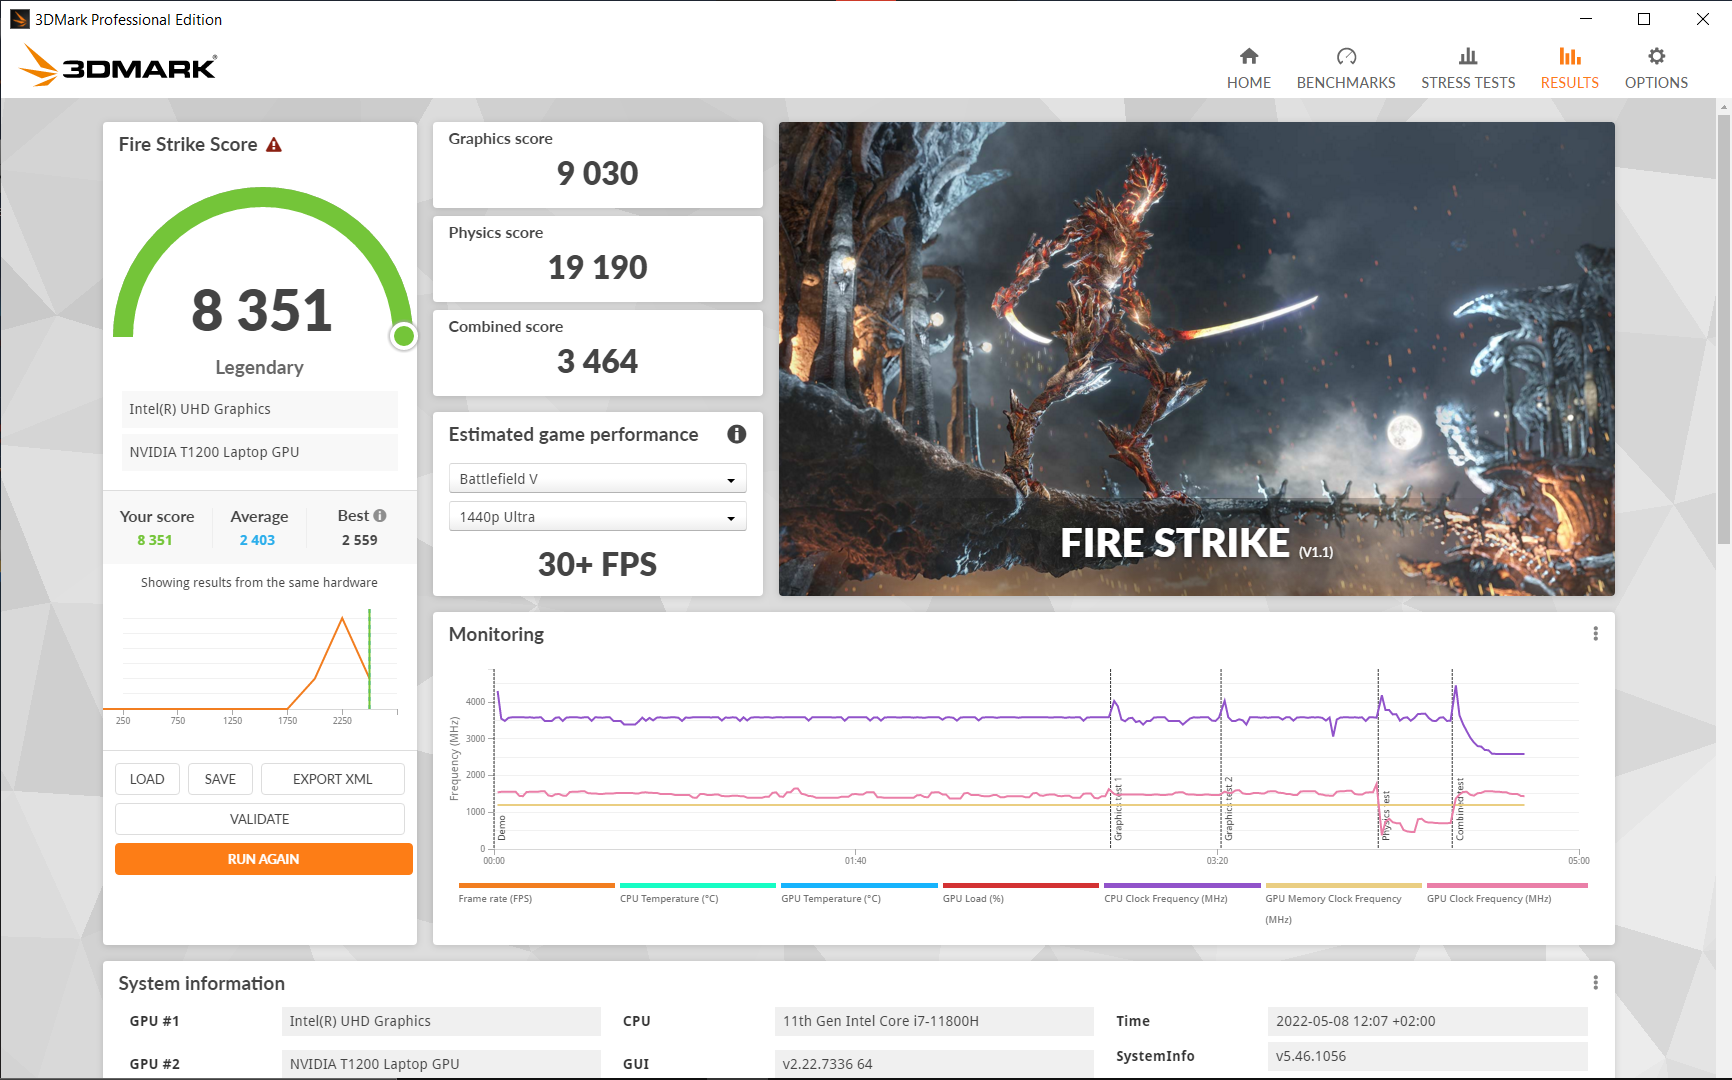
| 3DMark 06 Standard Score | 38139 punten | |
| 3DMark 11 Performance | 11917 punten | |
| 3DMark Cloud Gate Standard Score | 30520 punten | |
| 3DMark Fire Strike Score | 8351 punten | |
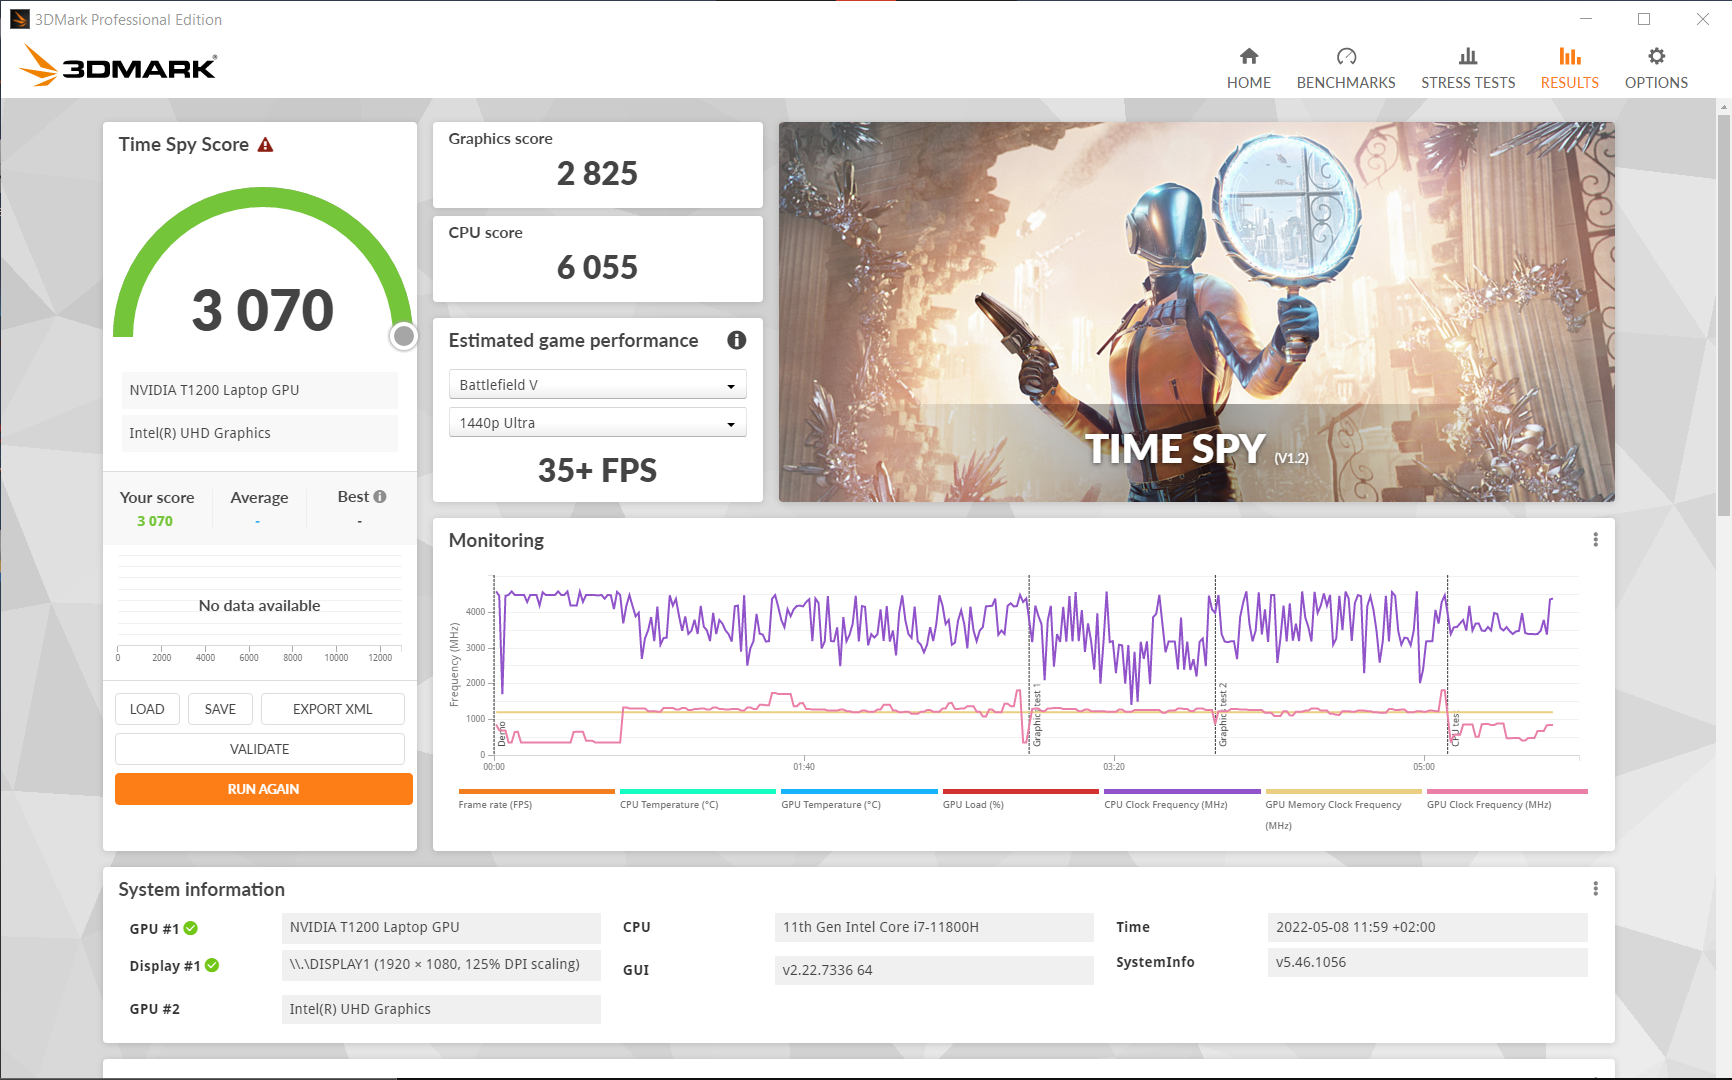
| 3DMark Time Spy Score | 3497 punten | |
Help | ||
Spelprestaties
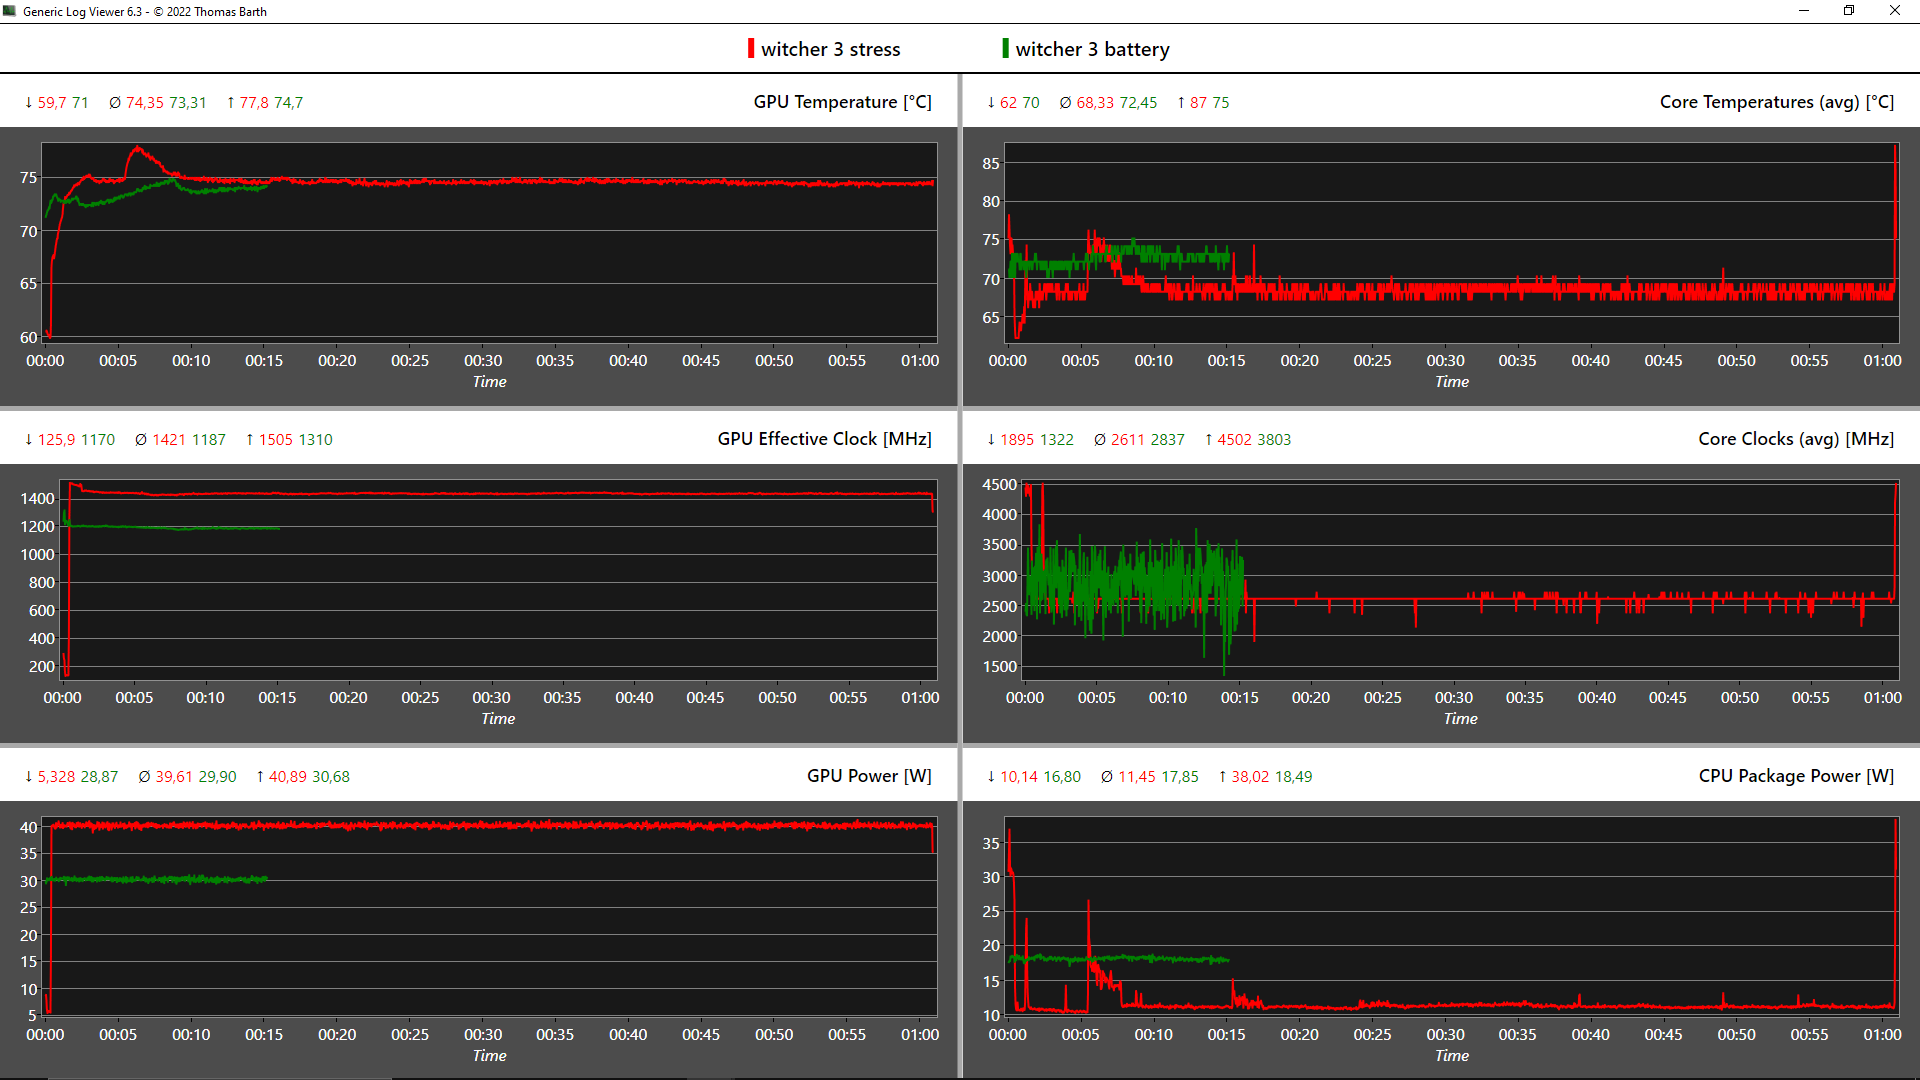
De Nvidia T1200 kan oudere games probleemloos in hoge details draaien. Nieuwe games zijn speelbaar in medium details. Er werden geen prestatiedalingen waargenomen tijdens de één uur durende Witcher 3 test.
Witcher 3 FPS Chart
| lage | gem. | hoge | ultra | |
|---|---|---|---|---|
| BioShock Infinite (2013) | 352.2 | 235.8 | 207.9 | 88.1 |
| GTA V (2015) | 169.9 | 158.5 | 89.7 | 48.5 |
| The Witcher 3 (2015) | 59 | 33.2 | ||
| Dota 2 Reborn (2015) | 133.3 | 116.5 | 107.8 | 100.4 |
| Final Fantasy XV Benchmark (2018) | 88 | 49.5 | 35 | |
| X-Plane 11.11 (2018) | 96.2 | 77.5 | 64.8 | |
| Far Cry 5 (2018) | 107 | 60 | 53 | 51 |
| Strange Brigade (2018) | 208 | 84 | 68.5 | 59.3 |
| Shadow of the Tomb Raider (2018) | 96 | 59 | 48 | 39 |
| Mafia Definitive Edition (2020) | 84 | 43.4 | 39.2 | |
| Resident Evil Village (2021) | 114.3 | 64.3 | 57.9 | 49.8 |
| Riders Republic (2021) | 93 | 50 | 41 | 40 |
| Farming Simulator 22 (2021) | 171.9 | 96.6 | 70.1 | 61.2 |
| Dying Light 2 (2022) | 36.1 | 25.7 | 21.2 | |
| GRID Legends (2022) | 103 | 73 | 61.7 | 45.7 |
| Elden Ring (2022) | 52.9 | 47 | 39.5 | 36.8 |
| Elex 2 (2022) | 43.1 | 39.3 | 34.2 | 29.6 |
| Ghostwire Tokyo (2022) | 50.7 | 47.3 | 44.6 | 41.2 |
| Vampire Bloodhunt (2022) | 121.8 | 72.9 | 69.9 | 69.5 |
Emissies: Stille Lenovo laptop met hotspots
Geluid
De ventilator blijft stil tijdens stationair draaien en ook tijdens het surfen. Alleen onder belasting is de ThinkPad duidelijk hoorbaar met 39 dB. Bij de absolute stresstest hebben we 43,5 dB gemeten. De ventilator wordt ook hoorbaar tijdens intensief surfen op het web, maar is allesbehalve luid. Er werd geen gejank van de spoel waargenomen.
Alle apparaten in ons vergelijkingsveld zijn over het algemeen luider, zoals de HP ZBook Power 15, die ongeveer 10% meer geluid registreert in belastingscenario's.
Geluidsniveau
| Onbelast |
| 25.21 / 25.21 / 25.21 dB (A) |
| Belasting |
| 39.09 / 43.53 dB (A) |
 | ||
30 dB stil 40 dB(A) hoorbaar 50 dB(A) luid |
||
min: | ||
| Lenovo ThinkPad P15v G2 21A9000XGE T1200 Laptop GPU, i7-11800H, Toshiba XG6 KXG6AZNV512G | Lenovo ThinkPad P15 G2-20YQ001JGE RTX A3000 Laptop GPU, i7-11800H, Kioxia XG7 KXG7AZNV512G | Lenovo ThinkPad T15g-20UR000GGE GeForce RTX 2070 Super Max-Q, i7-10750H, SK Hynix PC401 512GB M.2 (HFS512GD9TNG) | Lenovo ThinkPad T15p-20TN0006GE GeForce GTX 1050 Mobile, i7-10750H, WDC PC SN730 SDBQNTY-512GB | Lenovo ThinkPad P15s Gen2-20W6000GGE T500 Laptop GPU, i7-1165G7, WDC PC SN720 SDAQNTW-1T00 | HP ZBook Power 15 G8 313S5EA T600 Laptop GPU, i7-11800H, Samsung PM9A1 MZVL2512HCJQ | Dell Precision 5000 5560 RTX A2000 Laptop GPU, i7-11850H, Samsung PM9A1 MZVL22T0HBLB | |
|---|---|---|---|---|---|---|---|
| Noise | -8% | -1% | -13% | 5% | -10% | 8% | |
| uit / omgeving * (dB) | 25.21 | 24.3 4% | 24 5% | 29.3 -16% | 24.3 4% | 25.54 -1% | 23.4 7% |
| Idle Minimum * (dB) | 25.21 | 24.3 4% | 24 5% | 29.3 -16% | 25.5 -1% | 25.54 -1% | 23.6 6% |
| Idle Average * (dB) | 25.21 | 24.3 4% | 24 5% | 29.3 -16% | 25.5 -1% | 25.54 -1% | 23.6 6% |
| Idle Maximum * (dB) | 25.21 | 28.6 -13% | 24 5% | 30.6 -21% | 25.5 -1% | 25.54 -1% | 23.6 6% |
| Load Average * (dB) | 39.09 | 47.5 -22% | 36.1 8% | 42.7 -9% | 35.65 9% | 48.85 -25% | 25.8 34% |
| Witcher 3 ultra * (dB) | 36.6 | 46 -26% | 42.7 -17% | 46.58 -27% | 40.1 -10% | ||
| Load Maximum * (dB) | 43.53 | 54.9 -26% | 46 -6% | 42.7 2% | 35.65 18% | 50.98 -17% | 41.4 5% |
* ... kleiner is beter
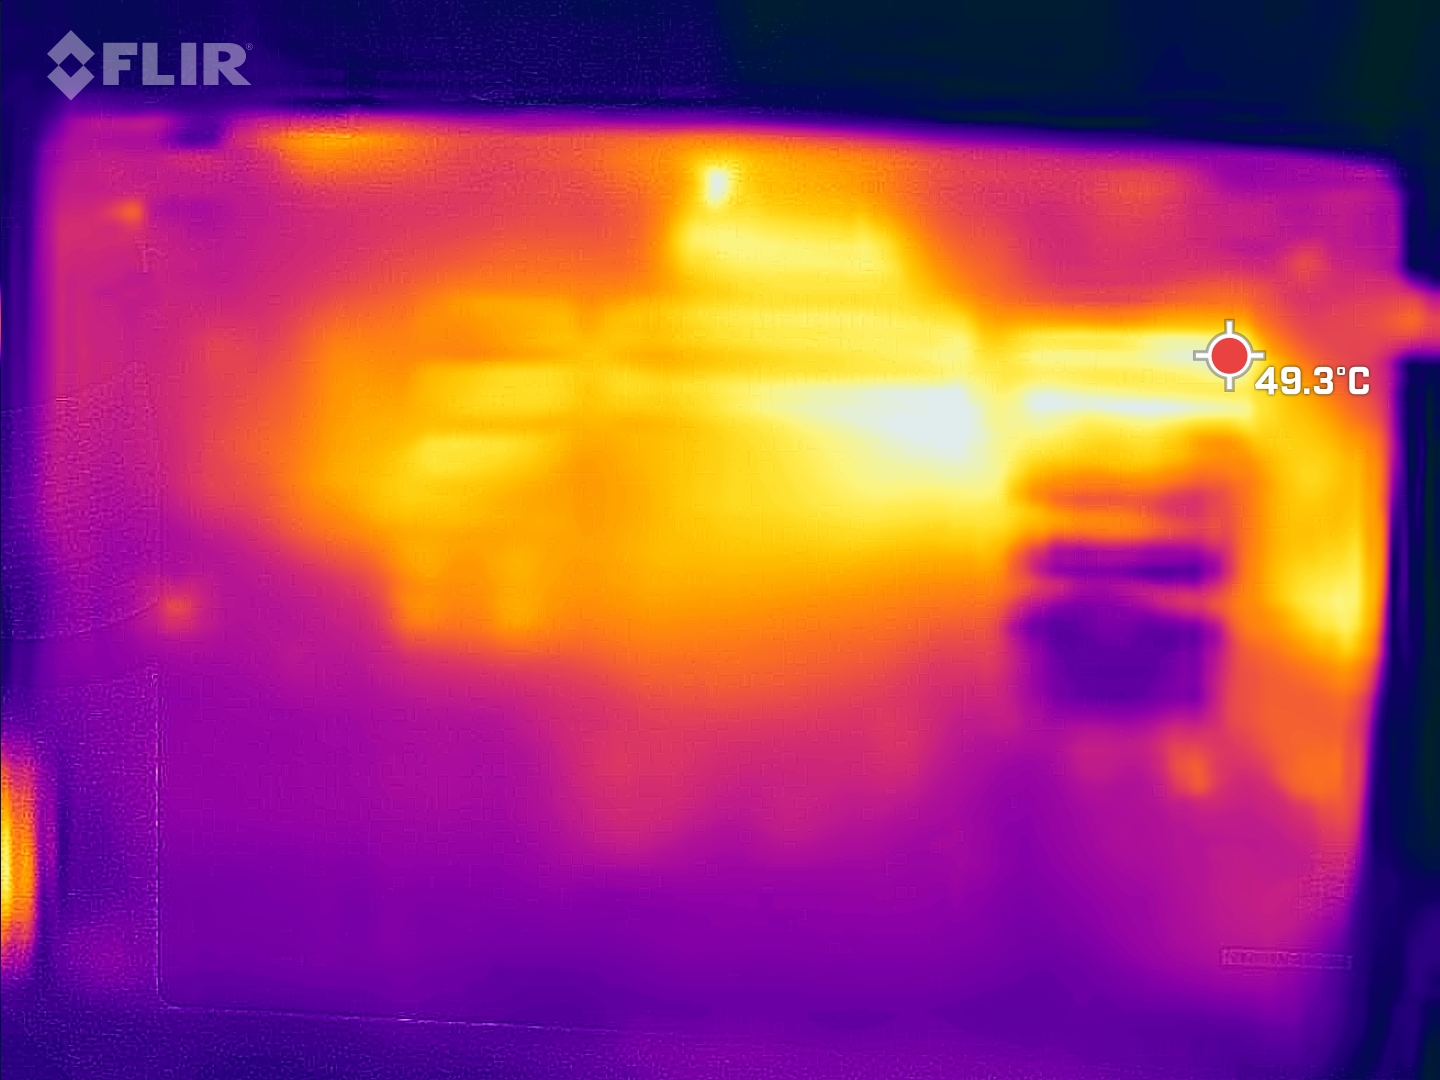
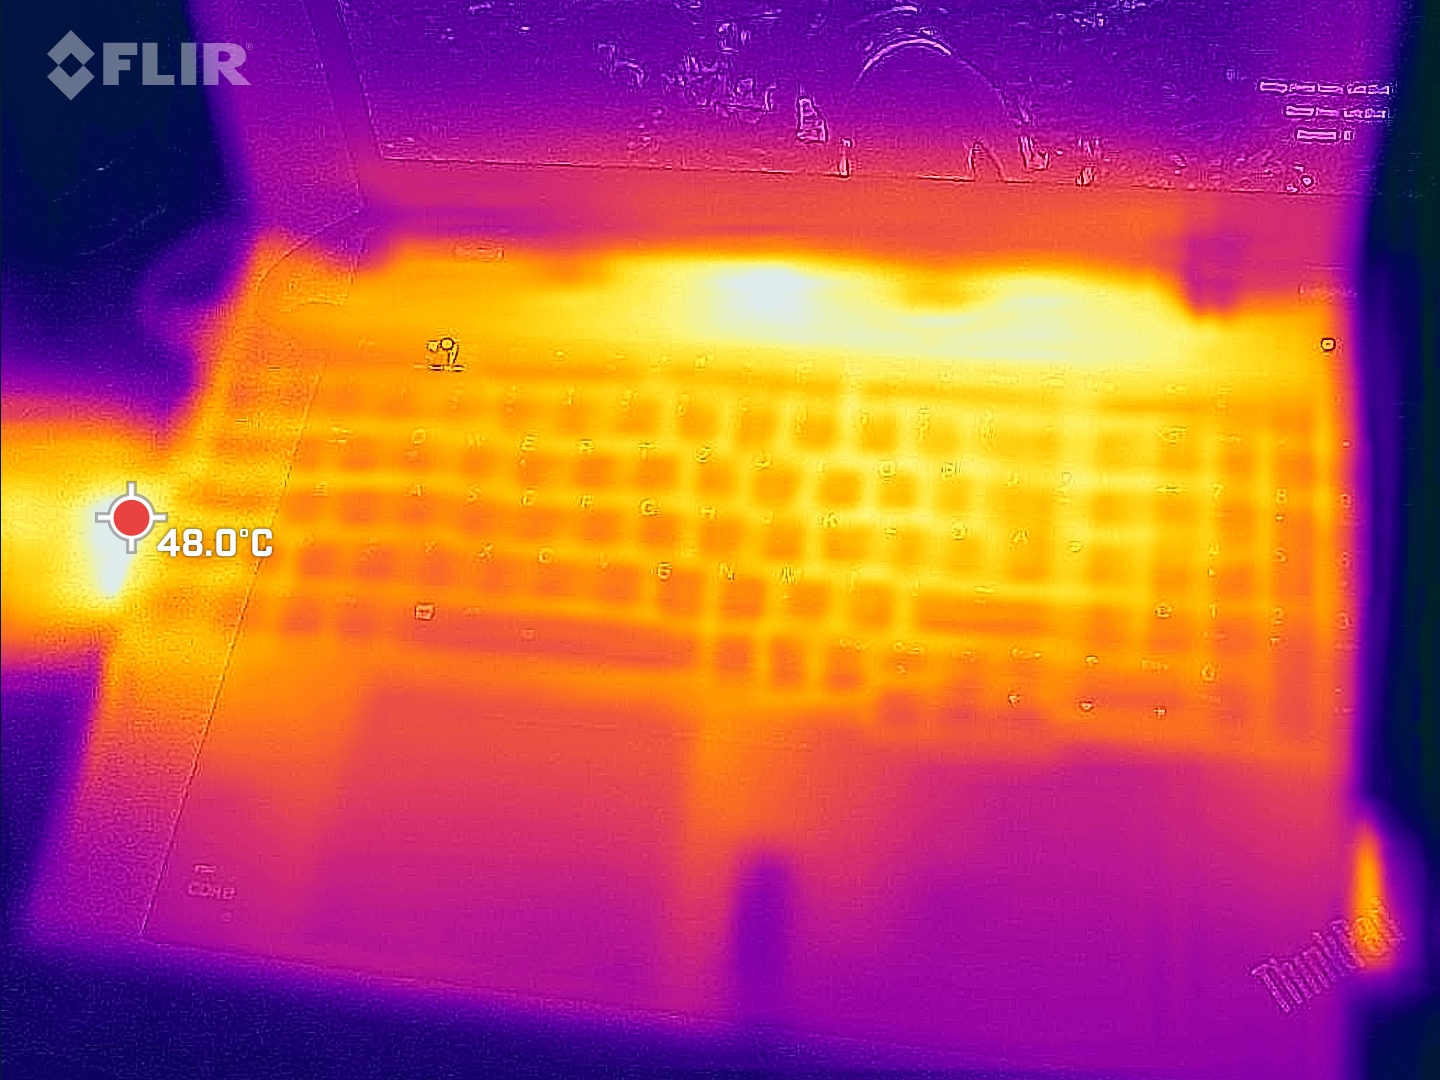
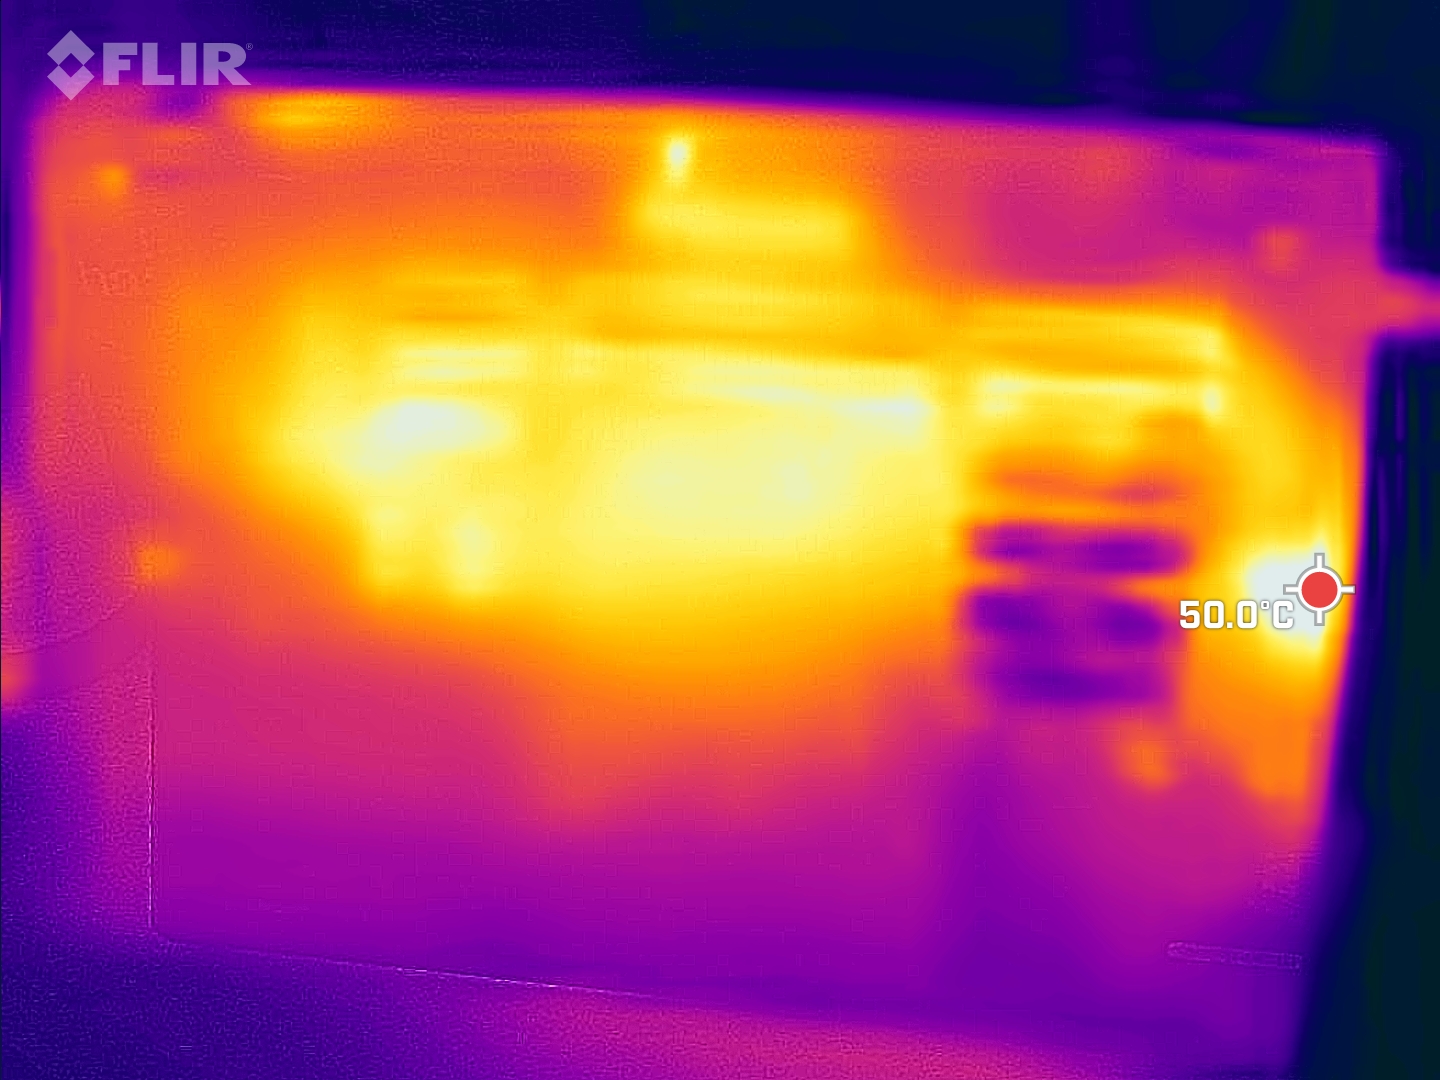
Temperatuur
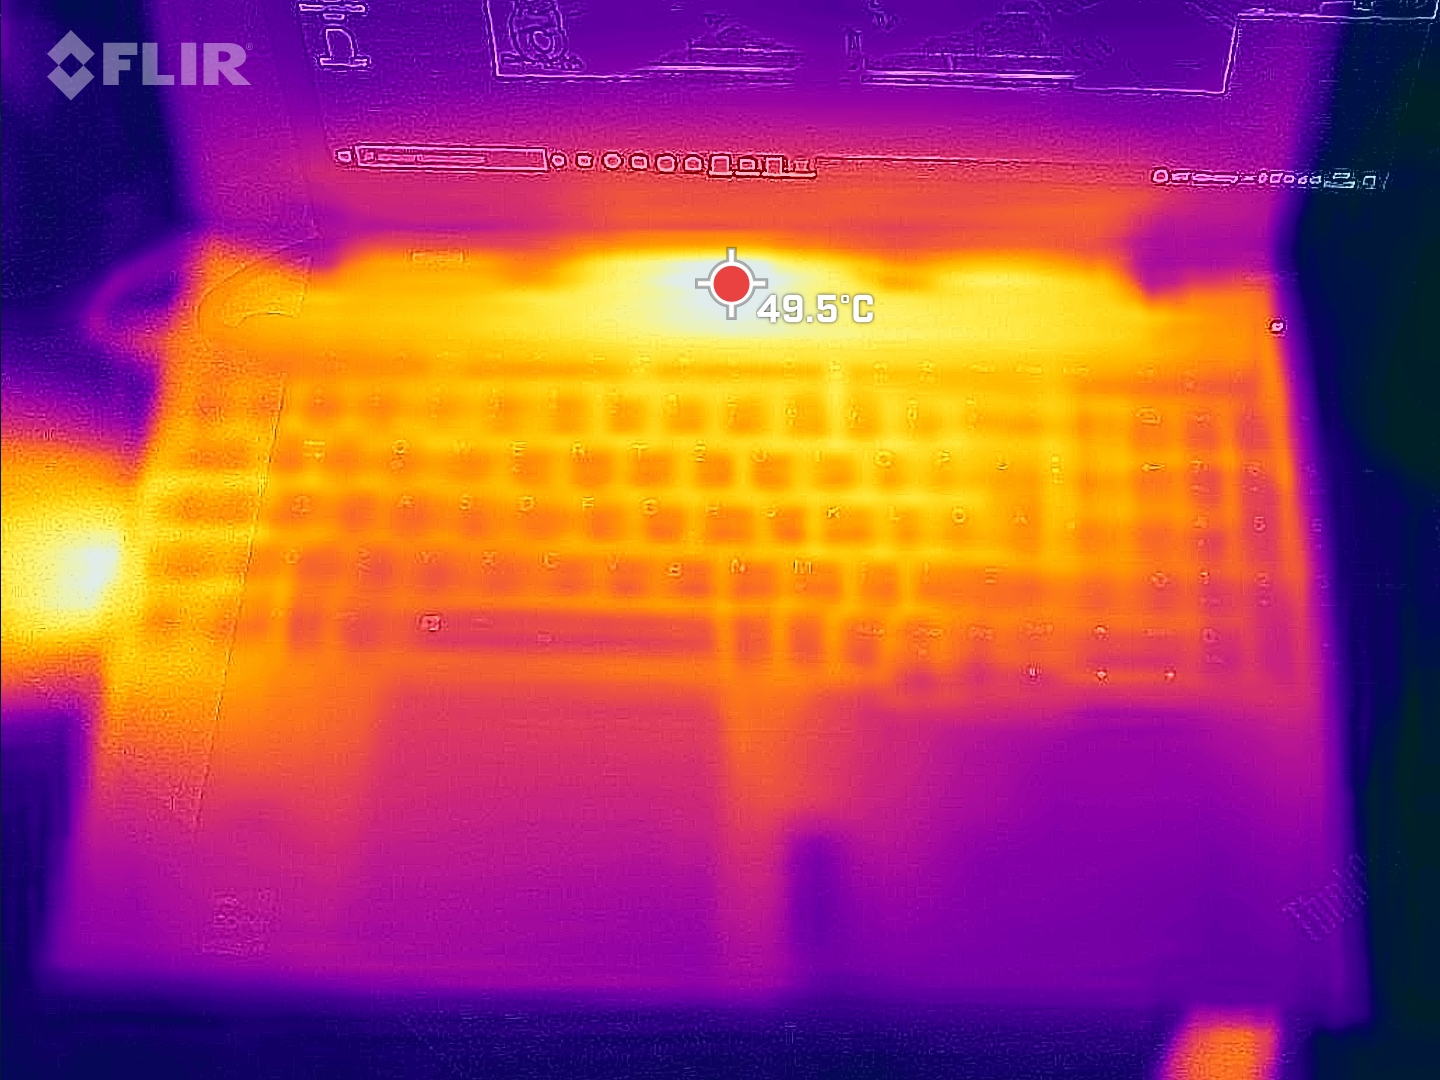
Onder belasting en ook tijdens gamen wordt de ThinkPad P15v erg heet met 53,8 °C in het midden boven het toetsenbord. De ZBook Power 15 is aanzienlijk koeler met 41,5 °C, maar dit gaat ten koste van aanzienlijk hogere geluidsniveaus.
(-) De maximumtemperatuur aan de bovenzijde bedraagt 53.8 °C / 129 F, vergeleken met het gemiddelde van 38.2 °C / 101 F, variërend van 22.2 tot 69.8 °C voor de klasse Workstation.
(-) De bodem warmt op tot een maximum van 52.1 °C / 126 F, vergeleken met een gemiddelde van 41.1 °C / 106 F
(+) Bij onbelast gebruik bedraagt de gemiddelde temperatuur voor de bovenzijde 25.6 °C / 78 F, vergeleken met het apparaatgemiddelde van 32 °C / 90 F.
(-) Bij het spelen van The Witcher 3 is de gemiddelde temperatuur voor de bovenzijde 41.4 °C / 107 F, vergeleken met het apparaatgemiddelde van 32 °C / 90 F.
(+) De handpalmsteunen en het touchpad bereiken maximaal de huidtemperatuur (35.6 °C / 96.1 F) en zijn dus niet heet.
(-) De gemiddelde temperatuur van de handpalmsteun van soortgelijke toestellen bedroeg 27.8 °C / 82 F (-7.8 °C / -14.1 F).
| Lenovo ThinkPad P15v G2 21A9000XGE Intel Core i7-11800H, NVIDIA T1200 Laptop GPU | Lenovo ThinkPad P15 G2-20YQ001JGE Intel Core i7-11800H, NVIDIA RTX A3000 Laptop GPU | Lenovo ThinkPad T15g-20UR000GGE Intel Core i7-10750H, NVIDIA GeForce RTX 2070 Super Max-Q | Lenovo ThinkPad T15p-20TN0006GE Intel Core i7-10750H, NVIDIA GeForce GTX 1050 Mobile | Lenovo ThinkPad P15s Gen2-20W6000GGE Intel Core i7-1165G7, NVIDIA T500 Laptop GPU | HP ZBook Power 15 G8 313S5EA Intel Core i7-11800H, NVIDIA T600 Laptop GPU | Dell Precision 5000 5560 Intel Core i7-11850H, NVIDIA RTX A2000 Laptop GPU | |
|---|---|---|---|---|---|---|---|
| Heat | -5% | -15% | 4% | 2% | 17% | -6% | |
| Maximum Upper Side * (°C) | 53.8 | 49.7 8% | 47.7 11% | 53.8 -0% | 42.8 20% | 41.4 23% | 48.2 10% |
| Maximum Bottom * (°C) | 52.1 | 63.2 -21% | 62.1 -19% | 56.6 -9% | 59.1 -13% | 41.5 20% | 42.6 18% |
| Idle Upper Side * (°C) | 27.6 | 27.1 2% | 31.3 -13% | 24.7 11% | 26.4 4% | 23.8 14% | 34.8 -26% |
| Idle Bottom * (°C) | 27.7 | 29.8 -8% | 38.8 -40% | 24.2 13% | 28.9 -4% | 25 10% | 35.2 -27% |
* ... kleiner is beter
Stresstest
Na een uur gecombineerde stresstesten (FurMark + Prime95) schommelt de CPU rond 2,15 GHz, wat slechts iets onder de basisklok van 2,3 GHz is. De temperatuur bereikt bijna 94 °C en het verbruik is 40 watt, terwijl de Nvidia GPU zijn gespecificeerde 35 watt onttrekt, maar zijn klokpotentieel op 986 MHz niet volledig benut.
Onder pure GPU-stress onttrekt de grafische kaart 40 watt en bereikt daarmee de volledige 1.445 MHz bij niet-kritische temperaturen. Onder alleen CPU stress, haalt de Core i7-11800H geklokt op een stabiele 2,55 GHz, verbruikt een constante 50 watt en warmt op tot 91,6 °C.
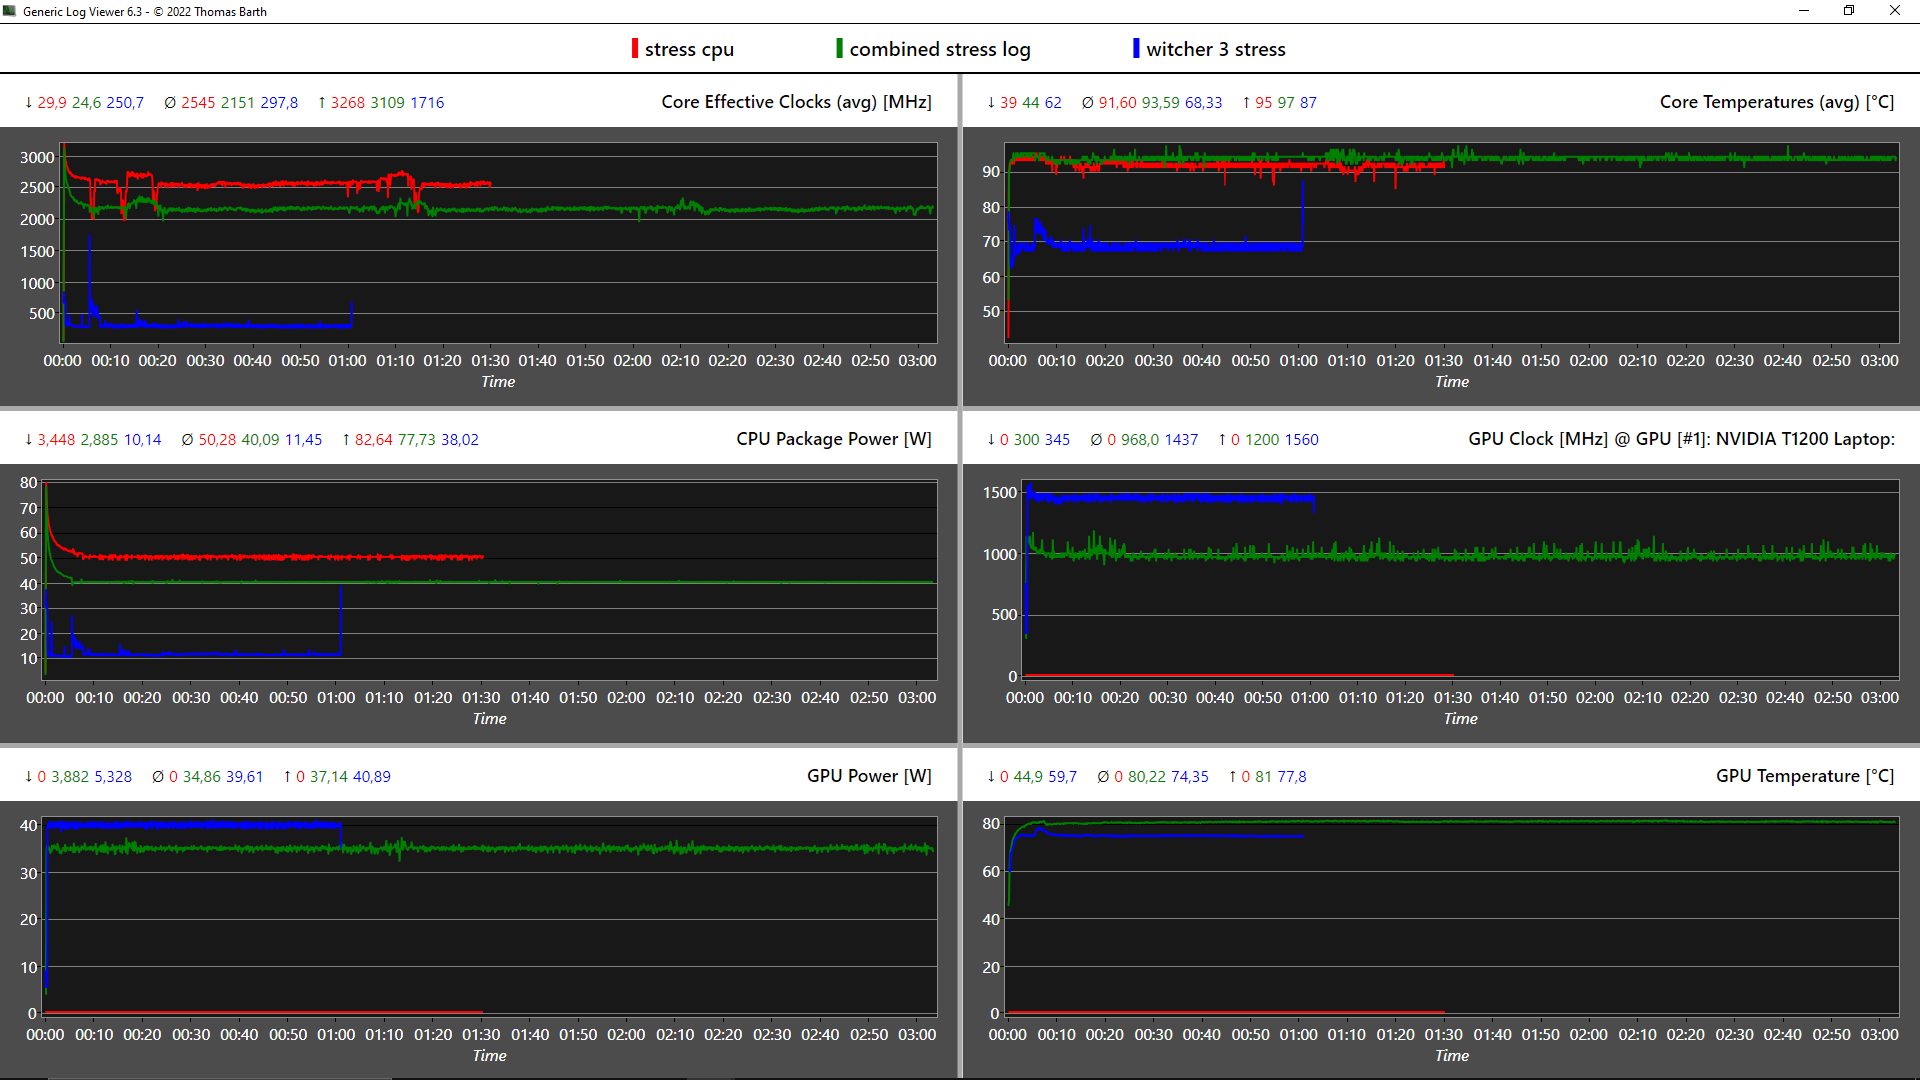
| CPU Klok (GHz) | GPU Klok (MHz) | Gemiddelde CPU Temperatuur (°C) | Gemiddelde GPU Temperatuur (°C) | |
| Systeem in ruststand | 1,2 | 300 | 42 | 44,8 |
| Prime95 Stress | 2,5 | 300 | 91,6 | 46,4 |
| Prime95 + FurMark Stress | 2,2 | 970 | 93,6 | 80,2 |
| Witcher 3 Stress | 0,3 | 1.445 | 68,3 | 74,4 |
Sprekers
De naar boven gerichte 2x 2-watt luidsprekers zijn niet bijzonder luid, maar het geluid is helder en de lage tonen zijn tot op zekere hoogte aanwezig. Over het algemeen dienen ze hun doel en presteren ze beter dan de luidsprekers van veel andere kantoornotebooks
Lenovo ThinkPad P15v G2 21A9000XGE audioanalyse
(-) | niet erg luide luidsprekers (70.7 dB)
Bas 100 - 315 Hz
(±) | verminderde zeebaars - gemiddeld 13.4% lager dan de mediaan
(±) | lineariteit van de lage tonen is gemiddeld (13.6% delta ten opzichte van de vorige frequentie)
Midden 400 - 2000 Hz
(+) | evenwichtige middens - slechts 4.7% verwijderd van de mediaan
(+) | de middentonen zijn lineair (6.2% delta ten opzichte van de vorige frequentie)
Hoog 2 - 16 kHz
(+) | evenwichtige hoogtepunten - slechts 3.2% verwijderd van de mediaan
(+) | de hoge tonen zijn lineair (5.7% delta naar de vorige frequentie)
Algemeen 100 - 16.000 Hz
(±) | lineariteit van het totale geluid is gemiddeld (21.2% verschil met de mediaan)
Vergeleken met dezelfde klasse
» 76% van alle geteste apparaten in deze klasse waren beter, 6% vergelijkbaar, 18% slechter
» De beste had een delta van 7%, het gemiddelde was 17%, de slechtste was 35%
Vergeleken met alle geteste toestellen
» 59% van alle geteste apparaten waren beter, 7% gelijk, 34% slechter
» De beste had een delta van 4%, het gemiddelde was 23%, de slechtste was 134%
HP ZBook Power 15 G8 313S5EA audioanalyse
(±) | luidspreker luidheid is gemiddeld maar goed (72.3 dB)
Bas 100 - 315 Hz
(-) | bijna geen lage tonen - gemiddeld 23.3% lager dan de mediaan
(±) | lineariteit van de lage tonen is gemiddeld (11.8% delta ten opzichte van de vorige frequentie)
Midden 400 - 2000 Hz
(+) | evenwichtige middens - slechts 2.5% verwijderd van de mediaan
(+) | de middentonen zijn lineair (5.1% delta ten opzichte van de vorige frequentie)
Hoog 2 - 16 kHz
(+) | evenwichtige hoogtepunten - slechts 4.1% verwijderd van de mediaan
(+) | de hoge tonen zijn lineair (3.1% delta naar de vorige frequentie)
Algemeen 100 - 16.000 Hz
(±) | lineariteit van het totale geluid is gemiddeld (21.4% verschil met de mediaan)
Vergeleken met dezelfde klasse
» 77% van alle geteste apparaten in deze klasse waren beter, 6% vergelijkbaar, 18% slechter
» De beste had een delta van 7%, het gemiddelde was 17%, de slechtste was 35%
Vergeleken met alle geteste toestellen
» 60% van alle geteste apparaten waren beter, 7% gelijk, 33% slechter
» De beste had een delta van 4%, het gemiddelde was 23%, de slechtste was 134%
Energiebeheer: Gemiddeld voor de ThinkPad P15v
Stroomverbruik
Het verbruik van 1,6 watt in stand-by suggereert dat een runtime van 2 dagen niet mogelijk is. Aan de andere kant zijn de idle rates erg goed voor een workstation en kunnen ze alleen overtroffen worden door de ZBook Power 15.
Aan het begin van de stresstest wordt 127 watt verbruikt en 108 watt continu. De 135 W voeding is dus voldoende groot en in staat om eventuele belastingspieken op te vangen. Een volledige oplading van de ThinkPad duurt ongeveer 90 minuten.
| Uit / Standby | |
| Inactief | |
| Belasting |
|
Key:
min: | |
| Lenovo ThinkPad P15v G2 21A9000XGE i7-11800H, T1200 Laptop GPU, Toshiba XG6 KXG6AZNV512G, IPS LED, 1920x1080, 15.6" | Lenovo ThinkPad P15 G2-20YQ001JGE i7-11800H, RTX A3000 Laptop GPU, Kioxia XG7 KXG7AZNV512G, IPS, 1920x1080, 15.6" | Lenovo ThinkPad T15g-20UR000GGE i7-10750H, GeForce RTX 2070 Super Max-Q, SK Hynix PC401 512GB M.2 (HFS512GD9TNG), IPS, 1920x1080, 15.6" | Lenovo ThinkPad T15p-20TN0006GE i7-10750H, GeForce GTX 1050 Mobile, WDC PC SN730 SDBQNTY-512GB, IPS LED, 3840x2160, 15.6" | Lenovo ThinkPad P15s Gen2-20W6000GGE i7-1165G7, T500 Laptop GPU, WDC PC SN720 SDAQNTW-1T00, IPS LED, 3840x2160, 15.6" | HP ZBook Power 15 G8 313S5EA i7-11800H, T600 Laptop GPU, Samsung PM9A1 MZVL2512HCJQ, IPS LED, 1920x1080, 15.6" | Dell Precision 5000 5560 i7-11850H, RTX A2000 Laptop GPU, Samsung PM9A1 MZVL22T0HBLB, IPS, 3840x2400, 15.6" | Gemiddeld NVIDIA T1200 Laptop GPU | Gemiddelde van klas Workstation | |
|---|---|---|---|---|---|---|---|---|---|
| Power Consumption | -31% | -36% | -20% | 6% | 23% | -38% | -23% | -53% | |
| Idle Minimum * (Watt) | 5.96 | 6.3 -6% | 5.8 3% | 6 -1% | 5.8 3% | 4.17 30% | 6.2 -4% | 7.85 ? -32% | 9.11 ? -53% |
| Idle Average * (Watt) | 8.37 | 10.7 -28% | 11.4 -36% | 12.8 -53% | 13.3 -59% | 6.32 24% | 13.9 -66% | 11.4 ? -36% | 13.8 ? -65% |
| Idle Maximum * (Watt) | 9.05 | 11.6 -28% | 13.9 -54% | 16.1 -78% | 15.6 -72% | 7.1 22% | 23.8 -163% | 12 ? -33% | 17.9 ? -98% |
| Load Average * (Watt) | 91.82 | 99.3 -8% | 93.2 -2% | 95.6 -4% | 43.2 53% | 80.41 12% | 95.7 -4% | 93.8 ? -2% | 96 ? -5% |
| Witcher 3 ultra * (Watt) | 102 | 154 -51% | 145 -42% | 84 18% | 37.1 64% | 62.3 39% | 87 15% | ||
| Load Maximum * (Watt) | 126.38 | 210 -66% | 234 -85% | 131.1 -4% | 67.3 47% | 110.18 13% | 132.6 -5% | 143.7 ? -14% | 180.3 ? -43% |
* ... kleiner is beter
Power Consumption Witcher 3 / Stresstest
Power Consumption Witcher 3 / Stress test (external monitor)
Levensduur batterij
De 68 Wh batterij slaagt erin onze Wi-Fi-test 7,5 uur van stroom te voorzien, wat overeenkomt met wat Lenovo zelf beweert. Andere werkstations bereiken aanzienlijk langere runtijden met grotere batterijen.
HP's ZBook Power 15 gaat met bijna 12,5 uur ook aanzienlijk langer mee met surfen op het web Dell's Precision 5560, met zijn 4K beeldscherm, registreert een magere 6,5 uur.
| Lenovo ThinkPad P15v G2 21A9000XGE i7-11800H, T1200 Laptop GPU, 68 Wh | Lenovo ThinkPad P15 G2-20YQ001JGE i7-11800H, RTX A3000 Laptop GPU, 94 Wh | Lenovo ThinkPad T15g-20UR000GGE i7-10750H, GeForce RTX 2070 Super Max-Q, 94 Wh | Lenovo ThinkPad T15p-20TN0006GE i7-10750H, GeForce GTX 1050 Mobile, 68 Wh | Lenovo ThinkPad P15s Gen2-20W6000GGE i7-1165G7, T500 Laptop GPU, 57 Wh | HP ZBook Power 15 G8 313S5EA i7-11800H, T600 Laptop GPU, 83 Wh | Dell Precision 5000 5560 i7-11850H, RTX A2000 Laptop GPU, 86 Wh | Gemiddelde van klas Workstation | |
|---|---|---|---|---|---|---|---|---|
| Batterijduur | 34% | 47% | 5% | 46% | 53% | 18% | 38% | |
| Reader / Idle (h) | 17.2 | 14.9 -13% | 12 -30% | 26.1 ? 52% | ||||
| H.264 (h) | 8 | 10 25% | 12.7 59% | 7.7 -4% | 9.9 24% | 10.1 26% | 10.1 ? 26% | |
| WiFi v1.3 (h) | 7.5 | 9.9 32% | 11.2 49% | 7.3 -3% | 7.7 3% | 12.3 64% | 6.3 -16% | 8.55 ? 14% |
| Load (h) | 0.9 | 1.3 44% | 1.2 33% | 1.1 22% | 1.9 111% | 2.1 133% | 1.8 100% | 1.441 ? 60% |
Pro
Contra
Verdict: ThinkPad P15v G2 voor prijsbewuste creatieven?

De ThinkPad P15v G2 weet het evenwicht tussen zakelijke laptop en werkstation vrij goed te bewaren, gezien het feit dat hij gericht is op een doelgroep die het zonder bepaalde high-end features kan stellen, zoals Xeon CPU's, ECC RAM, de snelste hardware en nog een paar andere zaken. Dat gezegd hebbende, de prestaties zijn over het algemeen goed, hoewel er in sommige scenario's een daling van 25% te zien is
De beeldschermoptie zal alleen voldoen voor creatievelingen en op CAD gebied als er voornamelijk een externe monitor wordt gebruikt en voor degenen die vooral complexere berekeningen moeten doen tegen een redelijke prijs. De grafische prestaties zijn voldoende gezien de prijs van minder dan 2.000 Euro, en de invoerapparaten staan op een hoog niveau. Er zijn wat nadelen met betrekking tot het wat donkere beeldscherm met een lage dekking van de kleurruimte. Gelukkig is er een 4K optie
De connectiviteit is breed en de ThinkPad is gemakkelijk uit te breiden. Over het geheel genomen scoort hij erg goed ten opzichte van de dunnere ThinkPad P15s. De behuizing is ook robuust, ook al hebben andere ThinkPads een verstevigd displaydeksel. De hoeveelheid plastic kan voor sommigen onaangenaam zijn in termen van gevoel en uiterlijk. De batterijruntijden zijn niet de beste, maar de emissies zijn zakelijk en zeer goed, op wat kleine hotspots uit de buurt van het toetsenbord en de palmsteun na. Het koelsysteem is over het algemeen vrij eenvoudig gehouden ten gunste van de prijs. Opladen via USB-C is ook niet beschikbaar, en de Wi-Fi module is gesoldeerd. Maar WWAN kan achteraf worden ingebouwd
De ThinkPad P15v G2 heeft niet per se een Core i9 en 4K beeldscherm nodig om een solide werkpaard te zijn. Hoewel hij vooral schittert door zijn redelijke instapprijs, blijft het een nicheproduct met beperkingen, vooral op het gebied van het beeldscherm en de CPU.
Het zustermodel (T15p G2) buiten beschouwing gelaten, zijn er twee directe alternatieven in hetzelfde prijssegment: HP's ZBook Power 15, die consequent op hoog niveau presteert, een veel helderder en beter beeldscherm heeft, een goed ontworpen toetsenbord en een veel betere batterijduur, maar hij is ook hinderlijk luid. Dell's Precision 3651 weegt slechts 1,79 kg, biedt een 4K-paneel en USB-C opladen.
Prijs en beschikbaarheid
De officiële website van Lenovo biedt de Lenovo ThinkPad P15v G2 aan in verschillende configuraties tegen verschillende prijzen, afhankelijk van het land van aankoop. Bijvoorbeeld:
VS, vanaf US$ 1,391.42
UK, vanaf GBP£ 1,758.63
Canada, vanaf CAD$ 1,780.02
Australië, vanaf AUD$ 2,119.47
Nieuw-Zeeland, vanaf NZ$ 4,699.00
Lenovo ThinkPad P15v G2 21A9000XGE
- 30-05-2022 v7 (old)
Marvin Gollor
Price comparison

