Kort testrapport Dell Precision 7550 Mobiel Werkstation: De Antithese Van De Precision 5550
Evaluatie | Datum | Model | Gewicht | Hoogte | Formaat | Resolutie | Beste prijs |
|---|---|---|---|---|---|---|---|
| 87.8 % v7 (old) | 08-2020 | Dell Precision 7550 W-10885M, Quadro RTX 5000 Max-Q | 2.8 kg | 27.36 mm | 15.60" | 3840x2160 | |
v (old) | Dell Precision 7540 i9-9980HK, Quadro RTX 3000 (Laptop) | 2.8 kg | 25 mm | 15.60" | 3840x2160 | ||
| 86.3 % v7 (old) | 08-2020 | Dell Precision 5550 P91F i7-10875H, Quadro T2000 Max-Q | 2 kg | 18 mm | 15.60" | 3840x2400 | |
| 82.1 % v7 (old) | 03-2020 | Acer ConceptD 3 Pro CN315-71P-73W1 i7-9750H, Quadro T1000 (Laptop) | 2.4 kg | 23.4 mm | 15.60" | 1920x1080 | |
| 89.8 % v7 (old) | 11-2019 | Lenovo ThinkPad P53-20QN000YGE i7-9850H, Quadro RTX 5000 Max-Q | 2.7 kg | 29.4 mm | 15.60" | 1920x1080 | |
| 84.4 % v7 (old) | 11-2018 | HP ZBook Studio G5-4QH10EA i7-8750H, Quadro P1000 | 2.1 kg | 18.9 mm | 15.60" | 3840x2160 |

| SD Card Reader | |
| average JPG Copy Test (av. of 3 runs) | |
| Dell Precision 5550 P91F (Toshiba Exceria Pro SDXC 64 GB UHS-II) | |
| Dell Precision 7540 (Toshiba Exceria Pro SDXC 64 GB UHS-II) | |
| Dell Precision 7550 (Toshiba Exceria Pro SDXC 64 GB UHS-II) | |
| Lenovo ThinkPad P53-20QN000YGE (Toshiba Exceria Pro SDXC 64 GB UHS-II) | |
| HP ZBook Studio G5-4QH10EA (Toshiba Exceria Pro SDXC 64 GB UHS-II) | |
| maximum AS SSD Seq Read Test (1GB) | |
| HP ZBook Studio G5-4QH10EA (Toshiba Exceria Pro SDXC 64 GB UHS-II) | |
| Lenovo ThinkPad P53-20QN000YGE (Toshiba Exceria Pro SDXC 64 GB UHS-II) | |
| Dell Precision 5550 P91F (Toshiba Exceria Pro SDXC 64 GB UHS-II) | |
| Dell Precision 7550 (Toshiba Exceria Pro SDXC 64 GB UHS-II) | |
| Dell Precision 7540 (Toshiba Exceria Pro SDXC 64 GB UHS-II) | |
| Networking | |
| iperf3 transmit AX12 | |
| Dell Precision 7540 | |
| Dell Precision 5550 P91F | |
| Dell Precision 7550 | |
| Acer ConceptD 9 Pro | |
| Acer ConceptD 3 Pro CN315-71P-73W1 | |
| iperf3 receive AX12 | |
| Dell Precision 7540 | |
| Dell Precision 5550 P91F | |
| Dell Precision 7550 | |
| Acer ConceptD 9 Pro | |
| Acer ConceptD 3 Pro CN315-71P-73W1 | |


| |||||||||||||||||||||||||
Helderheidsverdeling: 90 %
Helderheid in Batterij-modus: 473.5 cd/m²
Contrast: 861:1 (Zwart: 0.55 cd/m²)
ΔE ColorChecker Calman: 4.8 | ∀{0.5-29.43 Ø4.73}
calibrated: 3.08
ΔE Greyscale Calman: 5.6 | ∀{0.09-98 Ø4.97}
99.7% sRGB (Argyll 1.6.3 3D)
86.4% AdobeRGB 1998 (Argyll 1.6.3 3D)
96.8% AdobeRGB 1998 (Argyll 3D)
99.6% sRGB (Argyll 3D)
82.1% Display P3 (Argyll 3D)
Gamma: 2.34
CCT: 7549 K
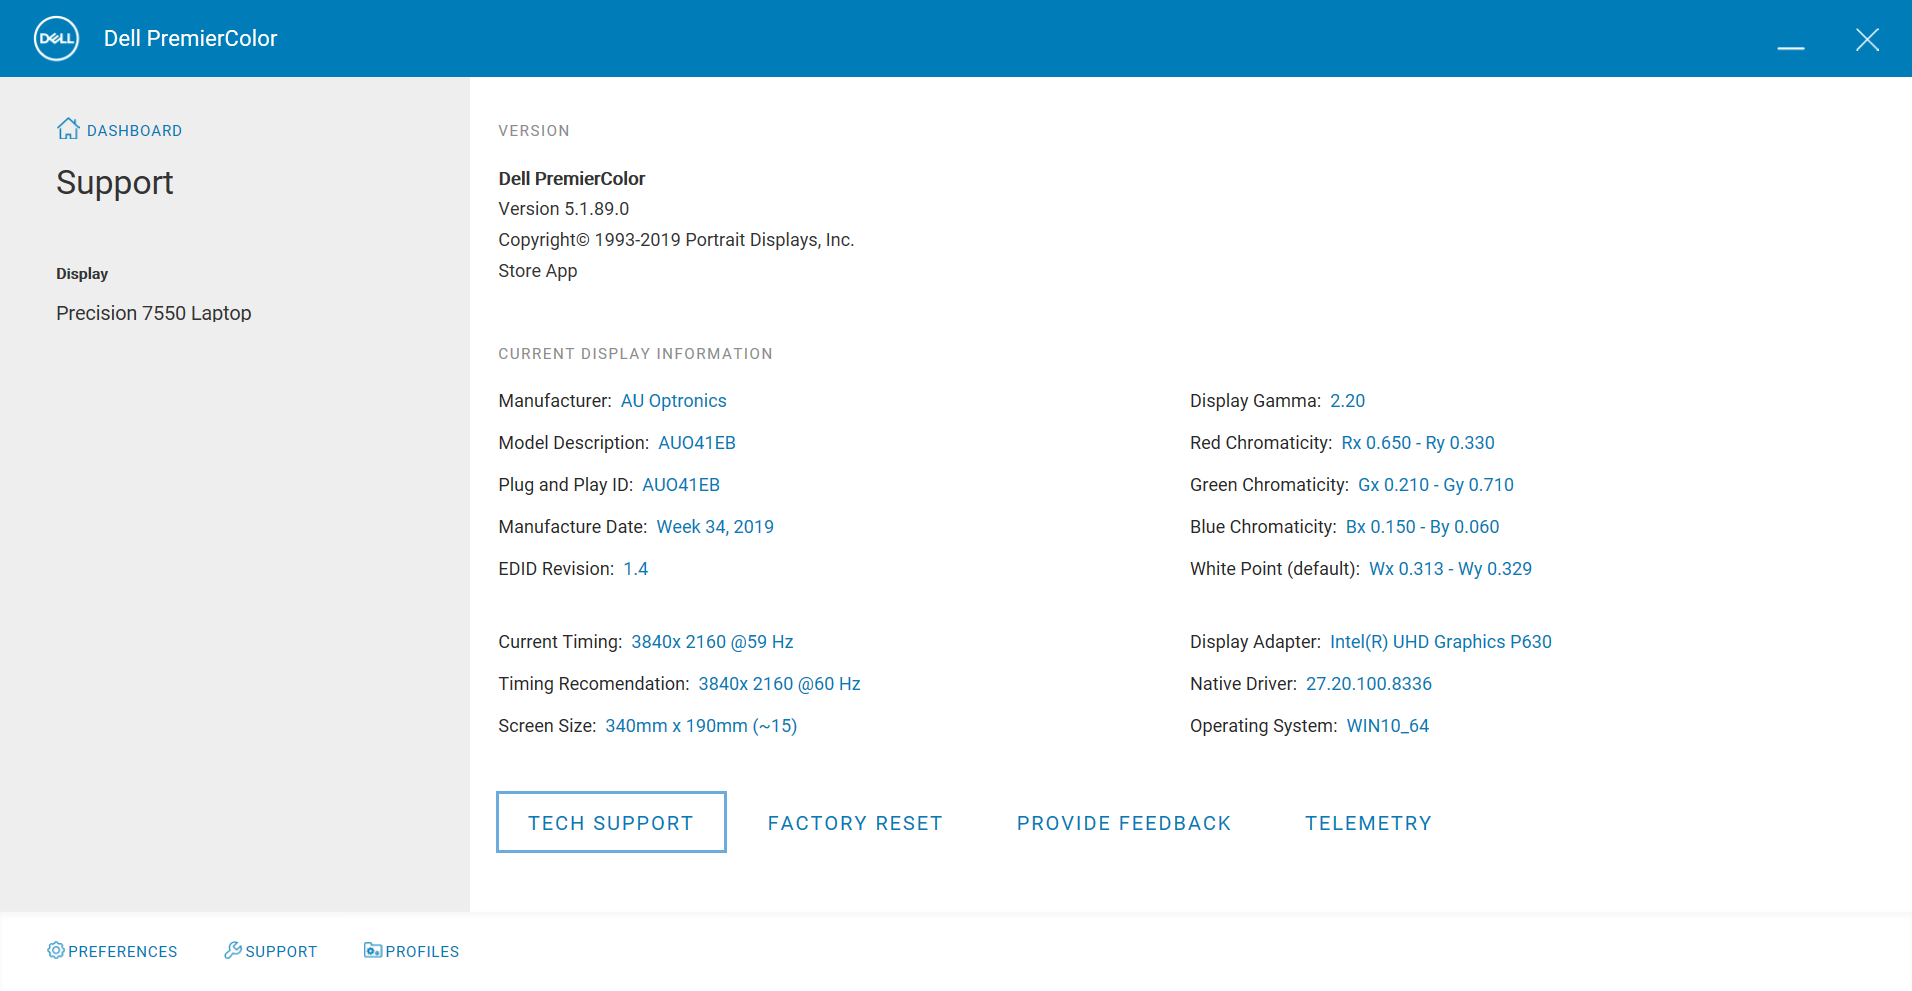
| Dell Precision 7550 AU Optronics B156ZAN, IPS, 15.6", 3840x2160 | Dell Precision 7540 AUO41EB, , 15.6", 3840x2160 | Dell Precision 5550 P91F Sharp LQ156R1, IPS, 15.6", 3840x2400 | Acer ConceptD 3 Pro CN315-71P-73W1 Chi Mei N156HCE-EN2, IPS, 15.6", 1920x1080 | Lenovo ThinkPad P53-20QN000YGE N156HCE-GN1, IPS, 15.6", 1920x1080 | HP ZBook Studio G5-4QH10EA AUO30EB, IPS LED, 15.6", 3840x2160 | |
|---|---|---|---|---|---|---|
| Display | 3% | 4% | 3% | -21% | -16% | |
| Display P3 Coverage (%) | 82.1 | 87.1 6% | 89.9 10% | 97.9 19% | 63.2 -23% | 68.2 -17% |
| sRGB Coverage (%) | 99.6 | 100 0% | 100 0% | 99.9 0% | 92.9 -7% | 96.2 -3% |
| AdobeRGB 1998 Coverage (%) | 96.8 | 99.8 3% | 99.9 3% | 87.2 -10% | 64.3 -34% | 68.8 -29% |
| Response Times | -7% | 5% | 36% | 26% | -8% | |
| Response Time Grey 50% / Grey 80% * (ms) | 51.2 ? | 61.6 ? -20% | 46 ? 10% | 33 ? 36% | 38.4 ? 25% | 60.8 ? -19% |
| Response Time Black / White * (ms) | 34 ? | 32 ? 6% | 34 ? -0% | 22 ? 35% | 25.2 ? 26% | 32.8 ? 4% |
| PWM Frequency (Hz) | 26040 ? | |||||
| Screen | 23% | 1% | 17% | 24% | 12% | |
| Brightness middle (cd/m²) | 473.5 | 491 4% | 469.8 -1% | 343 -28% | 510 8% | 417 -12% |
| Brightness (cd/m²) | 461 | 477 3% | 464 1% | 309 -33% | 468 2% | 412 -11% |
| Brightness Distribution (%) | 90 | 92 2% | 85 -6% | 85 -6% | 89 -1% | 85 -6% |
| Black Level * (cd/m²) | 0.55 | 0.37 33% | 0.42 24% | 0.22 60% | 0.36 35% | 0.29 47% |
| Contrast (:1) | 861 | 1327 54% | 1119 30% | 1559 81% | 1417 65% | 1438 67% |
| Colorchecker dE 2000 * | 4.8 | 2.9 40% | 5.16 -8% | 3.73 22% | 2.3 52% | 4.4 8% |
| Colorchecker dE 2000 max. * | 8.73 | 5.8 34% | 9.33 -7% | 6.51 25% | 5.5 37% | 6.7 23% |
| Colorchecker dE 2000 calibrated * | 3.08 | 1.2 61% | 3.75 -22% | 1.43 54% | 1.2 61% | 1.9 38% |
| Greyscale dE 2000 * | 5.6 | 4.4 21% | 5.5 2% | 4.24 24% | 3.2 43% | 5 11% |
| Gamma | 2.34 94% | 2.03 108% | 2 110% | 2.2 100% | 2.34 94% | 2.28 96% |
| CCT | 7549 86% | 6655 98% | 6198 105% | 6329 103% | 7036 92% | 7575 86% |
| Color Space (Percent of AdobeRGB 1998) (%) | 86.4 | 88.2 2% | 89.2 3% | 78 -10% | 59.4 -31% | 62.3 -28% |
| Color Space (Percent of sRGB) (%) | 99.7 | 99.9 0% | 100 0% | 100 0% | 93.1 -7% | 96 -4% |
| Totaal Gemiddelde (Programma / Instellingen) | 6% /
16% | 3% /
2% | 19% /
17% | 10% /
16% | -4% /
4% |
* ... kleiner is beter
Responstijd Scherm
| ↔ Responstijd Zwart naar Wit | ||
|---|---|---|
| 34 ms ... stijging ↗ en daling ↘ gecombineerd | ↗ 20 ms stijging | 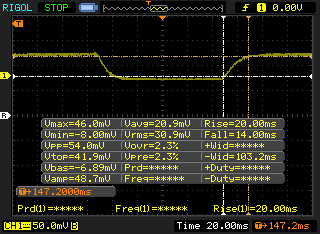 |
| ↘ 14 ms daling | ||
| Het scherm vertoonde trage responstijden in onze tests en is misschien te traag voor games. Ter vergelijking: alle testtoestellen variëren van 0.1 (minimum) tot 240 (maximum) ms. » 91 % van alle toestellen zijn beter. Dit betekent dat de gemeten responstijd slechter is dan het gemiddelde (19.9 ms) van alle geteste toestellen. | ||
| ↔ Responstijd 50% Grijs naar 80% Grijs | ||
| 51.2 ms ... stijging ↗ en daling ↘ gecombineerd | ↗ 24.4 ms stijging | 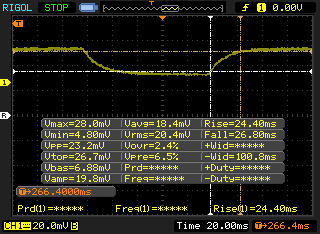 |
| ↘ 26.8 ms daling | ||
| Het scherm vertoonde trage responstijden in onze tests en is misschien te traag voor games. Ter vergelijking: alle testtoestellen variëren van 0.165 (minimum) tot 636 (maximum) ms. » 88 % van alle toestellen zijn beter. Dit betekent dat de gemeten responstijd slechter is dan het gemiddelde (31.1 ms) van alle geteste toestellen. | ||
Screen Flickering / PWM (Pulse-Width Modulation)
| Screen flickering / PWM niet waargenomen |  | ||
Ter vergelijking: 52 % van alle geteste toestellen maakten geen gebruik van PWM om de schermhelderheid te verlagen. Als het wel werd gebruikt, werd een gemiddelde van 7798 (minimum: 5 - maximum: 343500) Hz waargenomen. | |||

Cinebench R15: CPU Multi 64Bit | CPU Single 64Bit
Blender: v2.79 BMW27 CPU
7-Zip 18.03: 7z b 4 -mmt1 | 7z b 4
Geekbench 5.5: Single-Core | Multi-Core
HWBOT x265 Benchmark v2.2: 4k Preset
LibreOffice : 20 Documents To PDF
R Benchmark 2.5: Overall mean
| Cinebench R20 / CPU (Multi Core) | |
| AMD Radeon RX Vega 64 | |
| Intel Core i9-10900K | |
| Alienware m17 R2 P41E | |
| Dell Precision 7550 | |
| Asus ROG Strix Scar 15 G532LWS | |
| MSI GE65 Raider 9SF-049US | |
| Dell Precision 5550 P91F | |
| Alienware m15 R3 P87F | |
| Acer ConceptD 3 Pro CN315-71P-73W1 | |
| Cinebench R20 / CPU (Single Core) | |
| Intel Core i9-10900K | |
| AMD Radeon RX Vega 64 | |
| Dell Precision 5550 P91F | |
| Asus ROG Strix Scar 15 G532LWS | |
| Dell Precision 7550 | |
| Alienware m15 R3 P87F | |
| Alienware m17 R2 P41E | |
| MSI GE65 Raider 9SF-049US | |
| Acer ConceptD 3 Pro CN315-71P-73W1 | |
| Cinebench R15 / CPU Multi 64Bit | |
| AMD Radeon RX Vega 64 | |
| Intel Core i9-10900K | |
| Alienware m17 R2 P41E | |
| Asus ROG Strix Scar 15 G532LWS | |
| Dell Precision 7550 | |
| MSI GE65 Raider 9SF-049US | |
| Dell Precision 5550 P91F | |
| Alienware m15 R3 P87F | |
| Acer ConceptD 3 Pro CN315-71P-73W1 | |
| Cinebench R15 / CPU Single 64Bit | |
| Intel Core i9-10900K | |
| Asus ROG Strix Scar 15 G532LWS | |
| AMD Radeon RX Vega 64 | |
| Dell Precision 7550 | |
| Dell Precision 5550 P91F | |
| Alienware m15 R3 P87F | |
| MSI GE65 Raider 9SF-049US | |
| Alienware m17 R2 P41E | |
| Acer ConceptD 3 Pro CN315-71P-73W1 | |
| Blender / v2.79 BMW27 CPU | |
| Acer ConceptD 3 Pro CN315-71P-73W1 | |
| Dell Precision 5550 P91F | |
| Alienware m15 R3 P87F | |
| Dell Precision 7550 | |
| Asus ROG Strix Scar 15 G532LWS | |
| Intel Core i9-10900K | |
| AMD Radeon RX Vega 64 | |
| 7-Zip 18.03 / 7z b 4 -mmt1 | |
| Intel Core i9-10900K | |
| AMD Radeon RX Vega 64 | |
| Asus ROG Strix Scar 15 G532LWS | |
| Dell Precision 7550 | |
| Dell Precision 5550 P91F | |
| Acer ConceptD 3 Pro CN315-71P-73W1 | |
| Alienware m15 R3 P87F | |
| 7-Zip 18.03 / 7z b 4 | |
| AMD Radeon RX Vega 64 | |
| Intel Core i9-10900K | |
| Dell Precision 7550 | |
| Asus ROG Strix Scar 15 G532LWS | |
| Dell Precision 5550 P91F | |
| Alienware m15 R3 P87F | |
| Acer ConceptD 3 Pro CN315-71P-73W1 | |
| Geekbench 5.5 / Single-Core | |
| Intel Core i9-10900K | |
| Asus ROG Strix Scar 15 G532LWS | |
| Dell Precision 7550 | |
| Dell Precision 5550 P91F | |
| Alienware m15 R3 P87F | |
| AMD Radeon RX Vega 64 | |
| Acer ConceptD 3 Pro CN315-71P-73W1 | |
| Geekbench 5.5 / Multi-Core | |
| Intel Core i9-10900K | |
| AMD Radeon RX Vega 64 | |
| Asus ROG Strix Scar 15 G532LWS | |
| Dell Precision 5550 P91F | |
| Dell Precision 7550 | |
| Alienware m15 R3 P87F | |
| Acer ConceptD 3 Pro CN315-71P-73W1 | |
| HWBOT x265 Benchmark v2.2 / 4k Preset | |
| Intel Core i9-10900K | |
| AMD Radeon RX Vega 64 | |
| Dell Precision 7550 | |
| Asus ROG Strix Scar 15 G532LWS | |
| Alienware m15 R3 P87F | |
| Dell Precision 5550 P91F | |
| Acer ConceptD 3 Pro CN315-71P-73W1 | |
| LibreOffice / 20 Documents To PDF | |
| Intel Core i9-10900K | |
| Alienware m15 R3 P87F | |
| AMD Radeon RX Vega 64 | |
| Acer ConceptD 3 Pro CN315-71P-73W1 | |
| Asus ROG Strix Scar 15 G532LWS | |
| Dell Precision 7550 | |
| Dell Precision 5550 P91F | |
| R Benchmark 2.5 / Overall mean | |
| Alienware m15 R3 P87F | |
| Acer ConceptD 3 Pro CN315-71P-73W1 | |
| Dell Precision 5550 P91F | |
| Dell Precision 7550 | |
| Asus ROG Strix Scar 15 G532LWS | |
| AMD Radeon RX Vega 64 | |
| Intel Core i9-10900K | |
* ... kleiner is beter
| PCMark 10 | |
| Score | |
| Dell Precision 7540 | |
| Dell Precision 7550 | |
| Lenovo ThinkPad P53-20QN000YGE | |
| Dell Precision 5550 P91F | |
| Acer ConceptD 3 Pro CN315-71P-73W1 | |
| HP ZBook Studio G5-4QH10EA | |
| Essentials | |
| Dell Precision 5550 P91F | |
| Dell Precision 7550 | |
| Lenovo ThinkPad P53-20QN000YGE | |
| Dell Precision 7540 | |
| Acer ConceptD 3 Pro CN315-71P-73W1 | |
| HP ZBook Studio G5-4QH10EA | |
| Productivity | |
| Dell Precision 7540 | |
| Dell Precision 7550 | |
| Dell Precision 5550 P91F | |
| Lenovo ThinkPad P53-20QN000YGE | |
| Acer ConceptD 3 Pro CN315-71P-73W1 | |
| HP ZBook Studio G5-4QH10EA | |
| Digital Content Creation | |
| Dell Precision 7540 | |
| Dell Precision 7550 | |
| Lenovo ThinkPad P53-20QN000YGE | |
| Dell Precision 5550 P91F | |
| HP ZBook Studio G5-4QH10EA | |
| Acer ConceptD 3 Pro CN315-71P-73W1 | |
| PCMark 8 | |
| Home Score Accelerated v2 | |
| Dell Precision 7540 | |
| Acer ConceptD 3 Pro CN315-71P-73W1 | |
| Dell Precision 7550 | |
| Dell Precision 5550 P91F | |
| HP ZBook Studio G5-4QH10EA | |
| Work Score Accelerated v2 | |
| Acer ConceptD 3 Pro CN315-71P-73W1 | |
| Dell Precision 7550 | |
| Dell Precision 7540 | |
| Dell Precision 5550 P91F | |
| HP ZBook Studio G5-4QH10EA | |
| PCMark 8 Home Score Accelerated v2 | 3781 punten | |
| PCMark 8 Work Score Accelerated v2 | 4726 punten | |
| PCMark 10 Score | 5904 punten | |
Help | ||
| DPC Latencies / LatencyMon - interrupt to process latency (max), Web, Youtube, Prime95 | |
| Dell Precision 7550 | |
| Asus ROG Strix Scar 15 G532LWS | |
| Alienware m15 R3 P87F | |
| MSI GE66 Raider 10SFS | |
| Acer ConceptD 3 Pro CN315-71P-73W1 | |
| Acer ConceptD 9 Pro | |
| Razer Blade 15 Studio Edition 2020 | |
| Dell Precision 5550 P91F | |
* ... kleiner is beter
| Dell Precision 7550 SK Hynix PC601A NVMe 1TB | Dell Precision 5550 P91F SK Hynix PC601A NVMe 1TB | Acer ConceptD 3 Pro CN315-71P-73W1 WDC PC SN720 SDAPNTW-512G | Lenovo ThinkPad P53-20QN000YGE Samsung PM981a MZVLB1T0HBLR | HP ZBook Studio G5-4QH10EA Samsung SSD PM981 MZVLB512HAJQ | |
|---|---|---|---|---|---|
| AS SSD | -52% | 8% | 51% | 13% | |
| Seq Read (MB/s) | 2028 | 2039 1% | 2973 47% | 2655 31% | 2379 17% |
| Seq Write (MB/s) | 1193 | 1376 15% | 2429 104% | 2454 106% | 1780 49% |
| 4K Read (MB/s) | 42.31 | 44.11 4% | 24.7 -42% | 59.1 40% | 51 21% |
| 4K Write (MB/s) | 105.5 | 113.3 7% | 115.3 9% | 138.1 31% | 109.5 4% |
| 4K-64 Read (MB/s) | 1128 | 1094 -3% | 1243 10% | 2009 78% | 1184 5% |
| 4K-64 Write (MB/s) | 1537 | 1630 6% | 835 -46% | 1907 24% | 1725 12% |
| Access Time Read * (ms) | 0.069 | 0.059 14% | 0.054 22% | 0.057 17% | |
| Access Time Write * (ms) | 0.106 | 0.99 -834% | 0.034 68% | 0.028 74% | 0.034 68% |
| Score Read (Points) | 1373 | 1342 -2% | 1565 14% | 2333 70% | 1472 7% |
| Score Write (Points) | 1762 | 1881 7% | 1193 -32% | 2291 30% | 2013 14% |
| Score Total (Points) | 3801 | 3883 2% | 3525 -7% | 5810 53% | 4217 11% |
| Copy ISO MB/s (MB/s) | 1768 | 2489 41% | 2136 21% | 1989 13% | |
| Copy Program MB/s (MB/s) | 627 | 682 9% | 489.6 -22% | 457 -27% | |
| Copy Game MB/s (MB/s) | 1477 | 1515 3% | 1163 -21% | 1121 -24% | |
| CrystalDiskMark 5.2 / 6 | -1% | -4% | 9% | -20% | |
| Write 4K (MB/s) | 121 | 122.6 1% | 113.2 -6% | 147 21% | 102.7 -15% |
| Read 4K (MB/s) | 42.16 | 42.4 1% | 31.1 -26% | 48.3 15% | 38.32 -9% |
| Write Seq (MB/s) | 2150 | 2167 1% | 2540 18% | 1402 -35% | 1417 -34% |
| Read Seq (MB/s) | 1755 | 1747 0% | 2005 14% | 1503 -14% | 1289 -27% |
| Write 4K Q32T1 (MB/s) | 395.3 | 388.8 -2% | 331.4 -16% | 475.2 20% | 278.9 -29% |
| Read 4K Q32T1 (MB/s) | 381.8 | 367.3 -4% | 368.3 -4% | 581 52% | 348.8 -9% |
| Write Seq Q32T1 (MB/s) | 2730 | 2629 -4% | 2535 -7% | 2936 8% | 1895 -31% |
| Read Seq Q32T1 (MB/s) | 3468 | 3460 0% | 3427 -1% | 3539 2% | 3352 -3% |
| Write 4K Q8T8 (MB/s) | 1575 | ||||
| Read 4K Q8T8 (MB/s) | 1607 | ||||
| Totaal Gemiddelde (Programma / Instellingen) | -27% /
-34% | 2% /
4% | 30% /
33% | -4% /
1% |
* ... kleiner is beter

Disk Throttling: DiskSpd Read Loop, Queue Depth 8
| 3DMark 06 Standard Score | 42280 punten | |
| 3DMark 11 Performance | 21922 punten | |
| 3DMark Cloud Gate Standard Score | 34476 punten | |
| 3DMark Fire Strike Score | 16641 punten | |
| 3DMark Time Spy Score | 7579 punten | |
Help | ||
| lage | gem. | hoge | ultra | QHD | 4K | |
|---|---|---|---|---|---|---|
| The Witcher 3 (2015) | 299 | 249.4 | 139.1 | 77.3 | 52.5 | |
| Dota 2 Reborn (2015) | 156 | 142 | 117 | 111 | 98.7 | |
| Final Fantasy XV Benchmark (2018) | 154 | 99.7 | 77.3 | 56 | 32.8 | |
| X-Plane 11.11 (2018) | 118 | 102 | 85.7 | 48.8 |
| Dell Precision 7550 Quadro RTX 5000 Max-Q, W-10885M, SK Hynix PC601A NVMe 1TB | Dell Precision 7540 Quadro RTX 3000 (Laptop), i9-9980HK, SK hynix PC400 512 GB | Dell Precision 5550 P91F Quadro T2000 Max-Q, i7-10875H, SK Hynix PC601A NVMe 1TB | Acer ConceptD 3 Pro CN315-71P-73W1 Quadro T1000 (Laptop), i7-9750H, WDC PC SN720 SDAPNTW-512G | Lenovo ThinkPad P53-20QN000YGE Quadro RTX 5000 Max-Q, i7-9850H, Samsung PM981a MZVLB1T0HBLR | HP ZBook Studio G5-4QH10EA Quadro P1000, i7-8750H, Samsung SSD PM981 MZVLB512HAJQ | |
|---|---|---|---|---|---|---|
| Noise | 3% | 6% | -1% | 8% | 4% | |
| uit / omgeving * (dB) | 25.8 | 28.7 -11% | 26.2 -2% | 31.2 -21% | 28.3 -10% | 28.6 -11% |
| Idle Minimum * (dB) | 25.8 | 28.8 -12% | 26.2 -2% | 31.2 -21% | 28.3 -10% | 28.6 -11% |
| Idle Average * (dB) | 25.8 | 28.7 -11% | 26.2 -2% | 31.2 -21% | 28.3 -10% | 28.6 -11% |
| Idle Maximum * (dB) | 25.9 | 29.1 -12% | 26.2 -1% | 31.5 -22% | 28.3 -9% | 30 -16% |
| Load Average * (dB) | 51.2 | 37.1 28% | 39.2 23% | 38.4 25% | 29.8 42% | 38.1 26% |
| Witcher 3 ultra * (dB) | 51.9 | 41.2 21% | 39 25% | 36.9 29% | 38.3 26% | 35 33% |
| Load Maximum * (dB) | 51.9 | 41.2 21% | 50.6 3% | 41.2 21% | 38.3 26% | 42.5 18% |
* ... kleiner is beter
Geluidsniveau
| Onbelast |
| 25.8 / 25.8 / 25.9 dB (A) |
| Belasting |
| 51.2 / 51.9 dB (A) |
 | ||
30 dB stil 40 dB(A) hoorbaar 50 dB(A) luid |
||
min: | ||
(-) De maximumtemperatuur aan de bovenzijde bedraagt 49 °C / 120 F, vergeleken met het gemiddelde van 38.2 °C / 101 F, variërend van 22.2 tot 69.8 °C voor de klasse Workstation.
(-) De bodem warmt op tot een maximum van 51 °C / 124 F, vergeleken met een gemiddelde van 41.1 °C / 106 F
(+) Bij onbelast gebruik bedraagt de gemiddelde temperatuur voor de bovenzijde 26.7 °C / 80 F, vergeleken met het apparaatgemiddelde van 32 °C / 90 F.
(±) Bij het spelen van The Witcher 3 is de gemiddelde temperatuur voor de bovenzijde 37.8 °C / 100 F, vergeleken met het apparaatgemiddelde van 32 °C / 90 F.
(+) De palmsteunen en het touchpad zijn met een maximum van ###max## °C / 87.8 F koeler dan de huidtemperatuur en voelen daarom koel aan.
(-) De gemiddelde temperatuur van de handpalmsteun van soortgelijke toestellen bedroeg 27.8 °C / 82 F (-3.2 °C / -5.8 F).
Dell Precision 7550 audioanalyse
(+) | luidsprekers kunnen relatief luid spelen (83.6 dB)
Bas 100 - 315 Hz
(±) | verminderde zeebaars - gemiddeld 11.5% lager dan de mediaan
(±) | lineariteit van de lage tonen is gemiddeld (11.6% delta ten opzichte van de vorige frequentie)
Midden 400 - 2000 Hz
(±) | hogere middens - gemiddeld 5.7% hoger dan de mediaan
(+) | de middentonen zijn lineair (4.5% delta ten opzichte van de vorige frequentie)
Hoog 2 - 16 kHz
(+) | evenwichtige hoogtepunten - slechts 3.2% verwijderd van de mediaan
(+) | de hoge tonen zijn lineair (5.4% delta naar de vorige frequentie)
Algemeen 100 - 16.000 Hz
(+) | het totale geluid is lineair (12.6% verschil met de mediaan)
Vergeleken met dezelfde klasse
» 21% van alle geteste apparaten in deze klasse waren beter, 4% vergelijkbaar, 75% slechter
» De beste had een delta van 7%, het gemiddelde was 17%, de slechtste was 35%
Vergeleken met alle geteste toestellen
» 11% van alle geteste apparaten waren beter, 2% gelijk, 86% slechter
» De beste had een delta van 4%, het gemiddelde was 24%, de slechtste was 134%
Apple MacBook 12 (Early 2016) 1.1 GHz audioanalyse
(+) | luidsprekers kunnen relatief luid spelen (83.6 dB)
Bas 100 - 315 Hz
(±) | verminderde zeebaars - gemiddeld 11.3% lager dan de mediaan
(±) | lineariteit van de lage tonen is gemiddeld (14.2% delta ten opzichte van de vorige frequentie)
Midden 400 - 2000 Hz
(+) | evenwichtige middens - slechts 2.4% verwijderd van de mediaan
(+) | de middentonen zijn lineair (5.5% delta ten opzichte van de vorige frequentie)
Hoog 2 - 16 kHz
(+) | evenwichtige hoogtepunten - slechts 2% verwijderd van de mediaan
(+) | de hoge tonen zijn lineair (4.5% delta naar de vorige frequentie)
Algemeen 100 - 16.000 Hz
(+) | het totale geluid is lineair (10.2% verschil met de mediaan)
Vergeleken met dezelfde klasse
» 7% van alle geteste apparaten in deze klasse waren beter, 2% vergelijkbaar, 91% slechter
» De beste had een delta van 5%, het gemiddelde was 18%, de slechtste was 53%
Vergeleken met alle geteste toestellen
» 5% van alle geteste apparaten waren beter, 1% gelijk, 94% slechter
» De beste had een delta van 4%, het gemiddelde was 24%, de slechtste was 134%
| Uit / Standby | |
| Inactief | |
| Belasting |
|
Key:
min: | |
| Dell Precision 7550 W-10885M, Quadro RTX 5000 Max-Q, SK Hynix PC601A NVMe 1TB, IPS, 3840x2160, 15.6" | Dell Precision 7540 i9-9980HK, Quadro RTX 3000 (Laptop), SK hynix PC400 512 GB, , 3840x2160, 15.6" | Dell Precision 5550 P91F i7-10875H, Quadro T2000 Max-Q, SK Hynix PC601A NVMe 1TB, IPS, 3840x2400, 15.6" | Acer ConceptD 3 Pro CN315-71P-73W1 i7-9750H, Quadro T1000 (Laptop), WDC PC SN720 SDAPNTW-512G, IPS, 1920x1080, 15.6" | Lenovo ThinkPad P53-20QN000YGE i7-9850H, Quadro RTX 5000 Max-Q, Samsung PM981a MZVLB1T0HBLR, IPS, 1920x1080, 15.6" | HP ZBook Studio G5-4QH10EA i7-8750H, Quadro P1000, Samsung SSD PM981 MZVLB512HAJQ, IPS LED, 3840x2160, 15.6" | Acer ConceptD 9 Pro i9-9980HK, Quadro RTX 5000 (Laptop), WDC PC SN720 SDAQNTW-1T00, IPS, 3840x2160, 17.3" | |
|---|---|---|---|---|---|---|---|
| Power Consumption | 11% | 31% | 53% | 17% | 38% | -42% | |
| Idle Minimum * (Watt) | 8.2 | 8.4 -2% | 5.6 32% | 2.9 65% | 7.9 4% | 6.8 17% | 18.8 -129% |
| Idle Average * (Watt) | 16.8 | 15.4 8% | 11.2 33% | 5.5 67% | 11.8 30% | 11.3 33% | 25 -49% |
| Idle Maximum * (Watt) | 24.4 | 17.4 29% | 18.4 25% | 10.6 57% | 14.9 39% | 14.3 41% | 30 -23% |
| Load Average * (Watt) | 131 | 126 4% | 114 13% | 86 34% | 96 27% | 78 40% | 116 11% |
| Witcher 3 ultra * (Watt) | 156.6 | 143 9% | 76.7 51% | 83 47% | 149 5% | 64 59% | 221 -41% |
| Load Maximum * (Watt) | 201.8 | 170 16% | 134.2 33% | 100.7 50% | 207.8 -3% | 126 38% | 241 -19% |
* ... kleiner is beter
| Dell Precision 7550 W-10885M, Quadro RTX 5000 Max-Q, 95 Wh | Dell Precision 7540 i9-9980HK, Quadro RTX 3000 (Laptop), Wh | Dell Precision 5550 P91F i7-10875H, Quadro T2000 Max-Q, 86 Wh | Acer ConceptD 3 Pro CN315-71P-73W1 i7-9750H, Quadro T1000 (Laptop), 58.7 Wh | Lenovo ThinkPad P53-20QN000YGE i7-9850H, Quadro RTX 5000 Max-Q, 90 Wh | HP ZBook Studio G5-4QH10EA i7-8750H, Quadro P1000, 97 Wh | |
|---|---|---|---|---|---|---|
| Batterijduur | -19% | 48% | -9% | 63% | 62% | |
| Reader / Idle (h) | 11.1 | 22.6 104% | 17.3 56% | |||
| WiFi v1.3 (h) | 8.9 | 7.2 -19% | 9 1% | 8.1 -9% | 11.1 25% | 9.7 9% |
| Load (h) | 1 | 1.4 40% | 2 100% | 2.2 120% |
Pro
Contra
Voor het volledige, Engelse testrapport, klik hier.
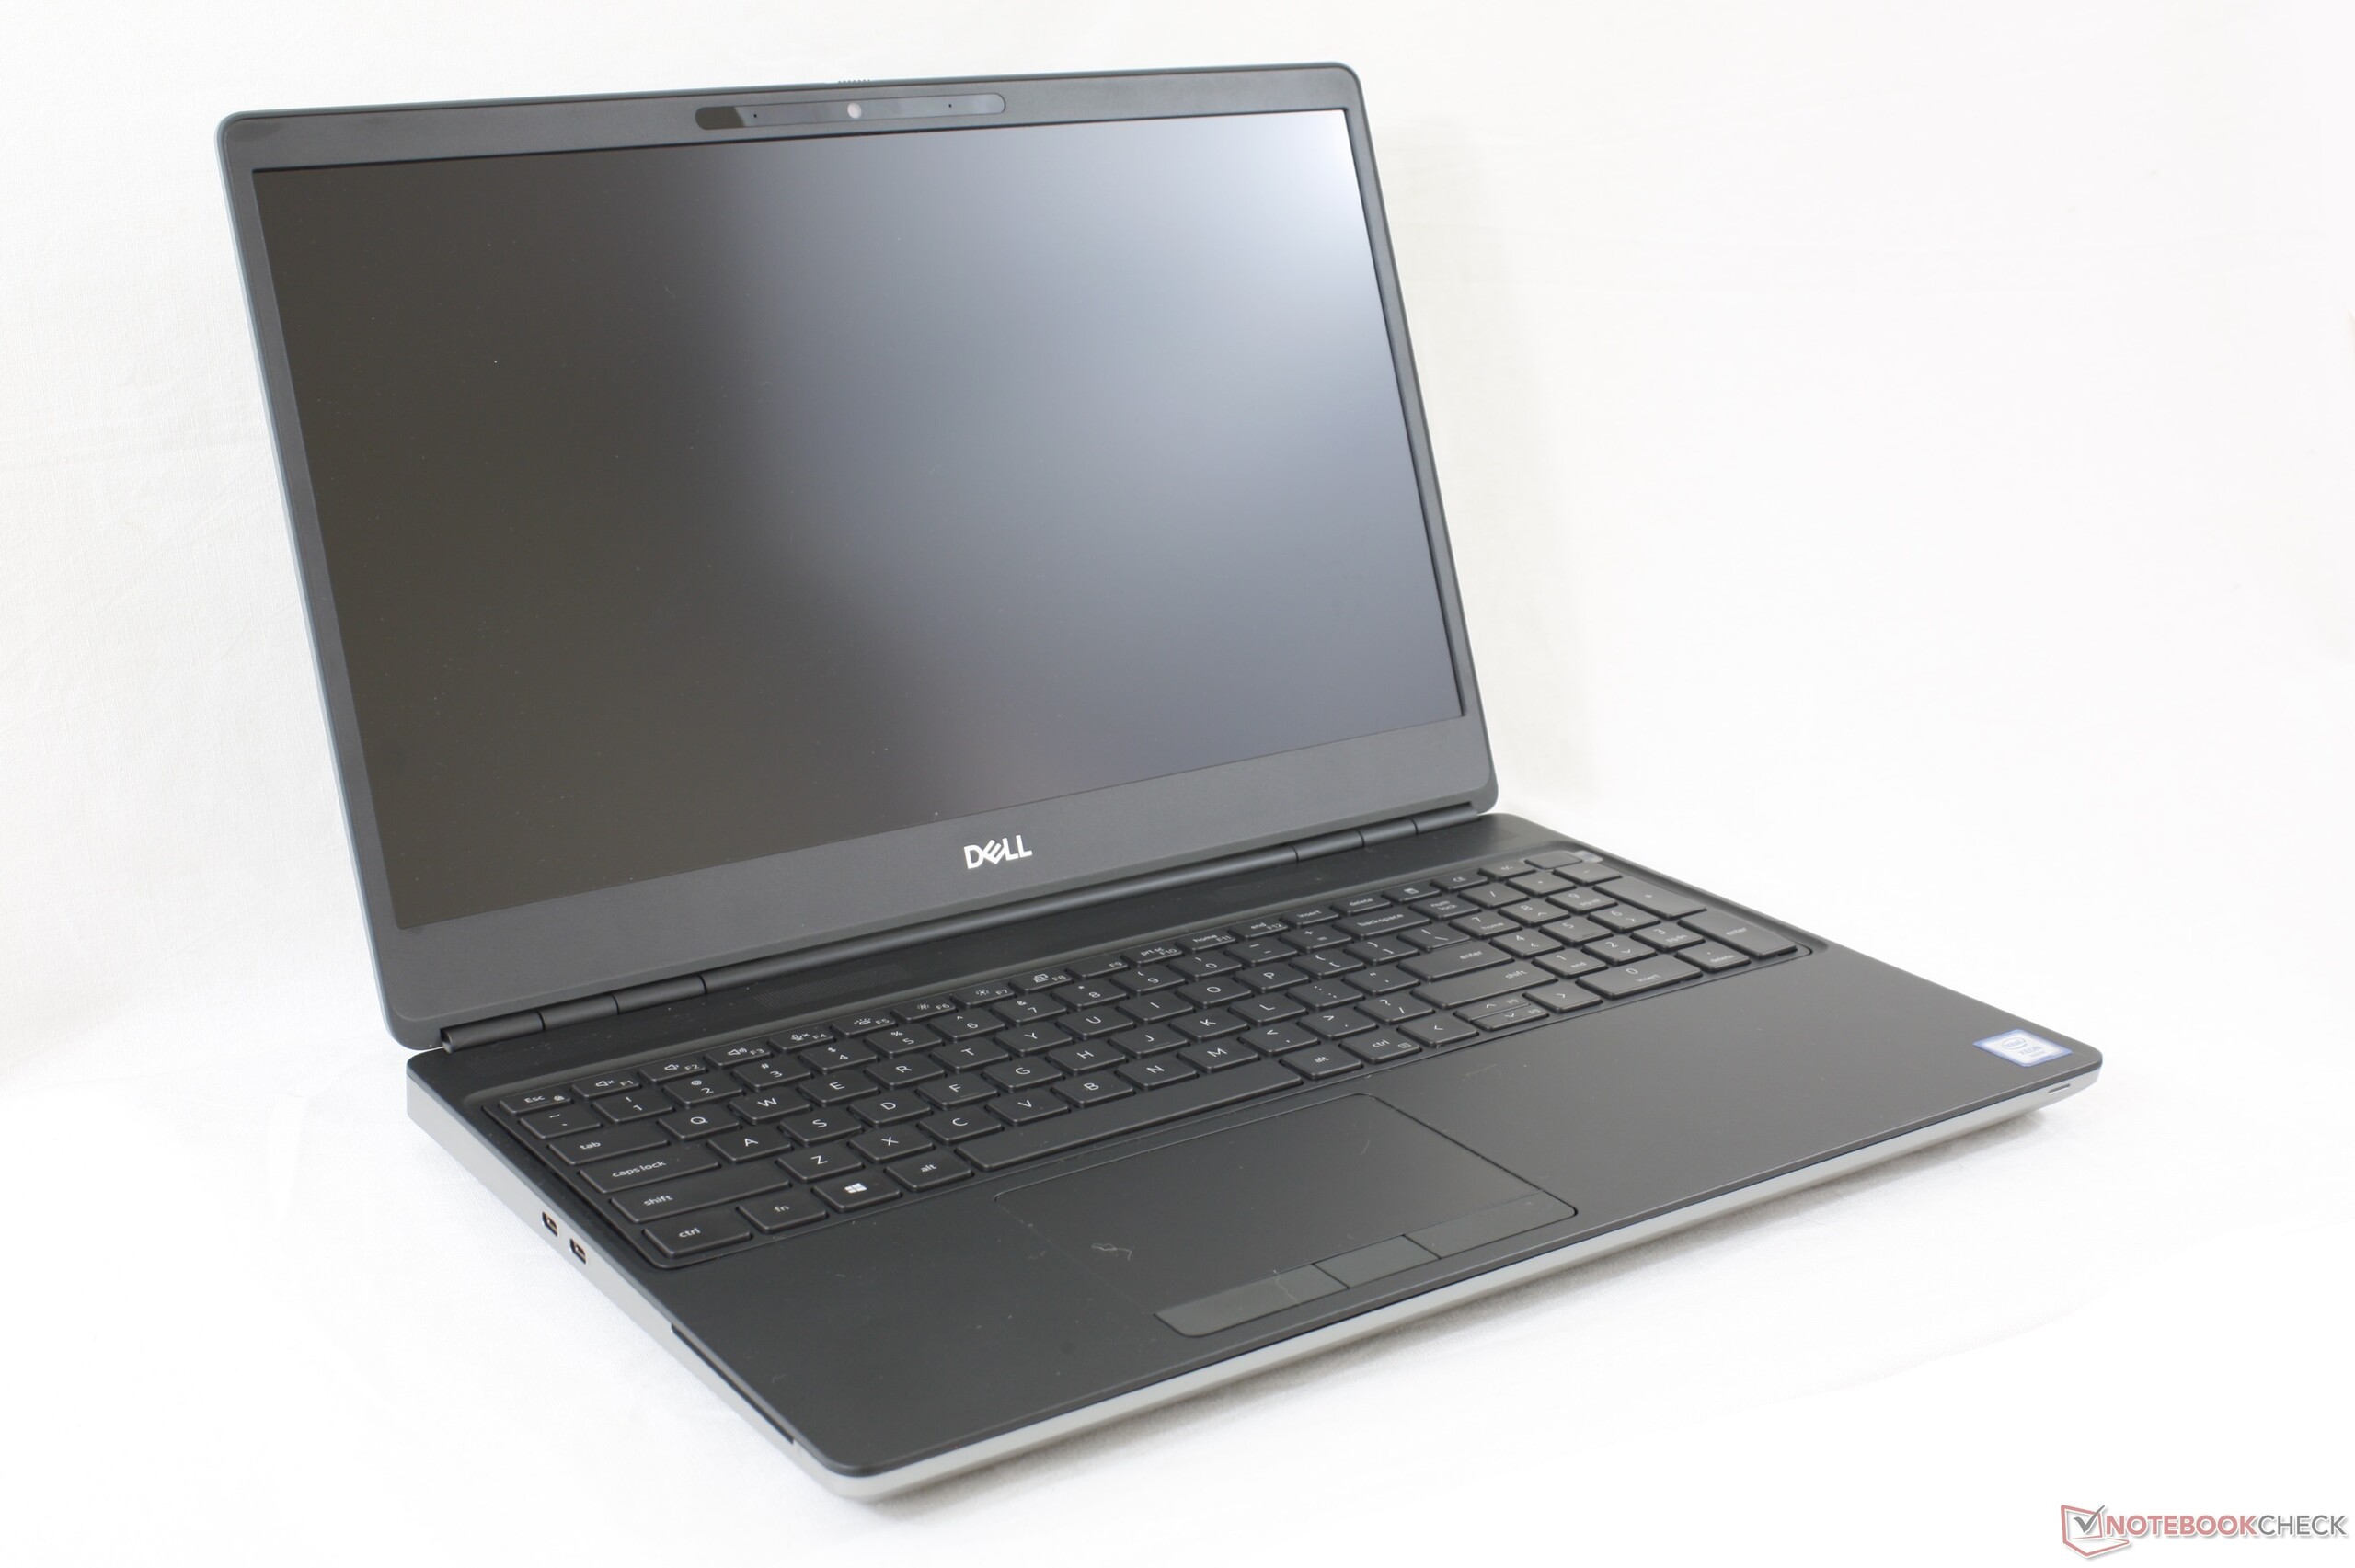
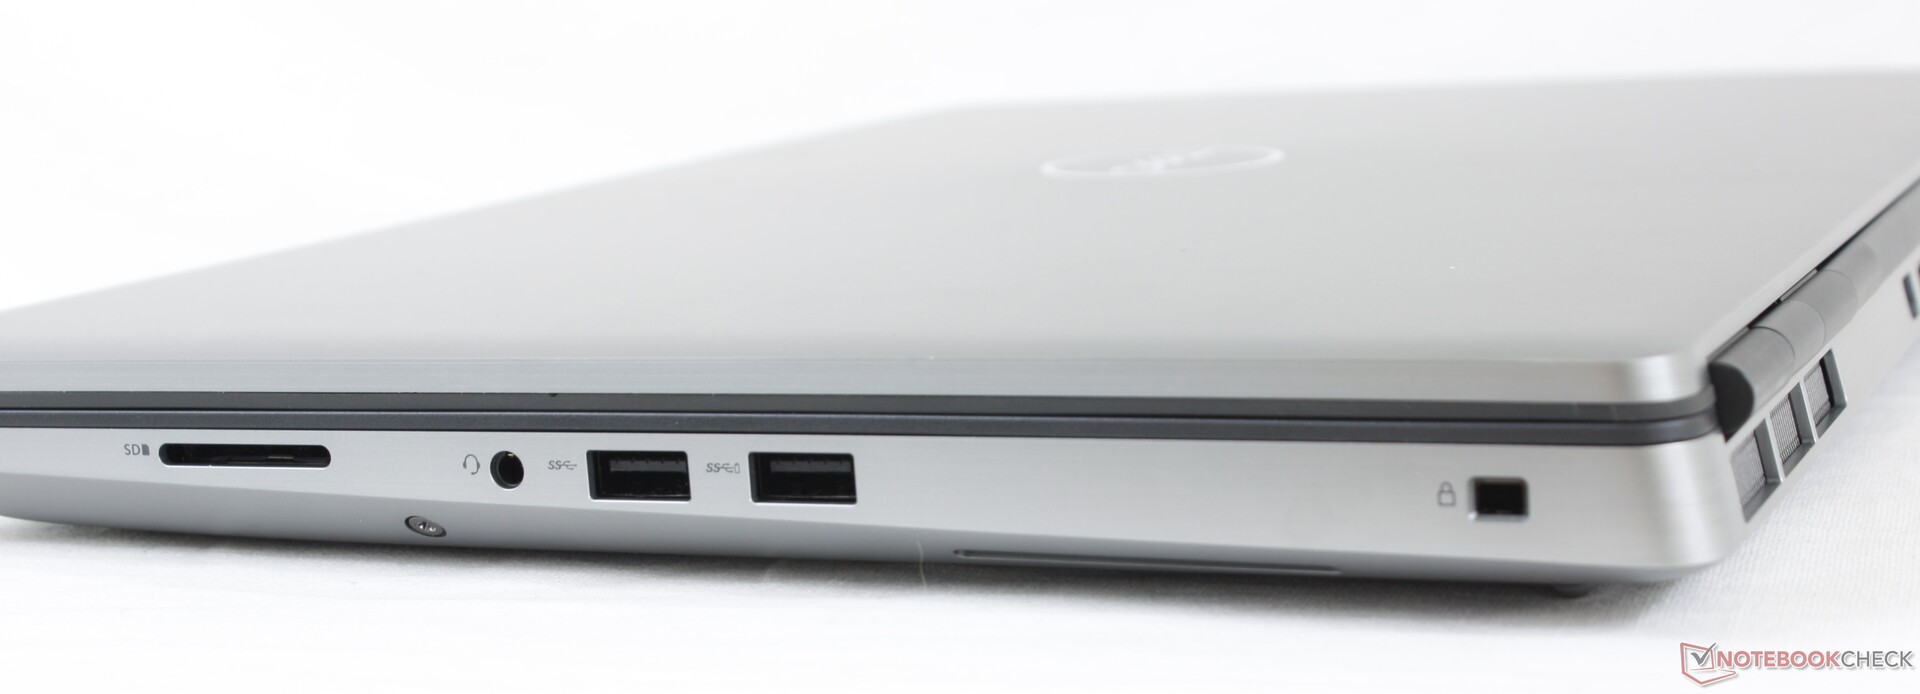
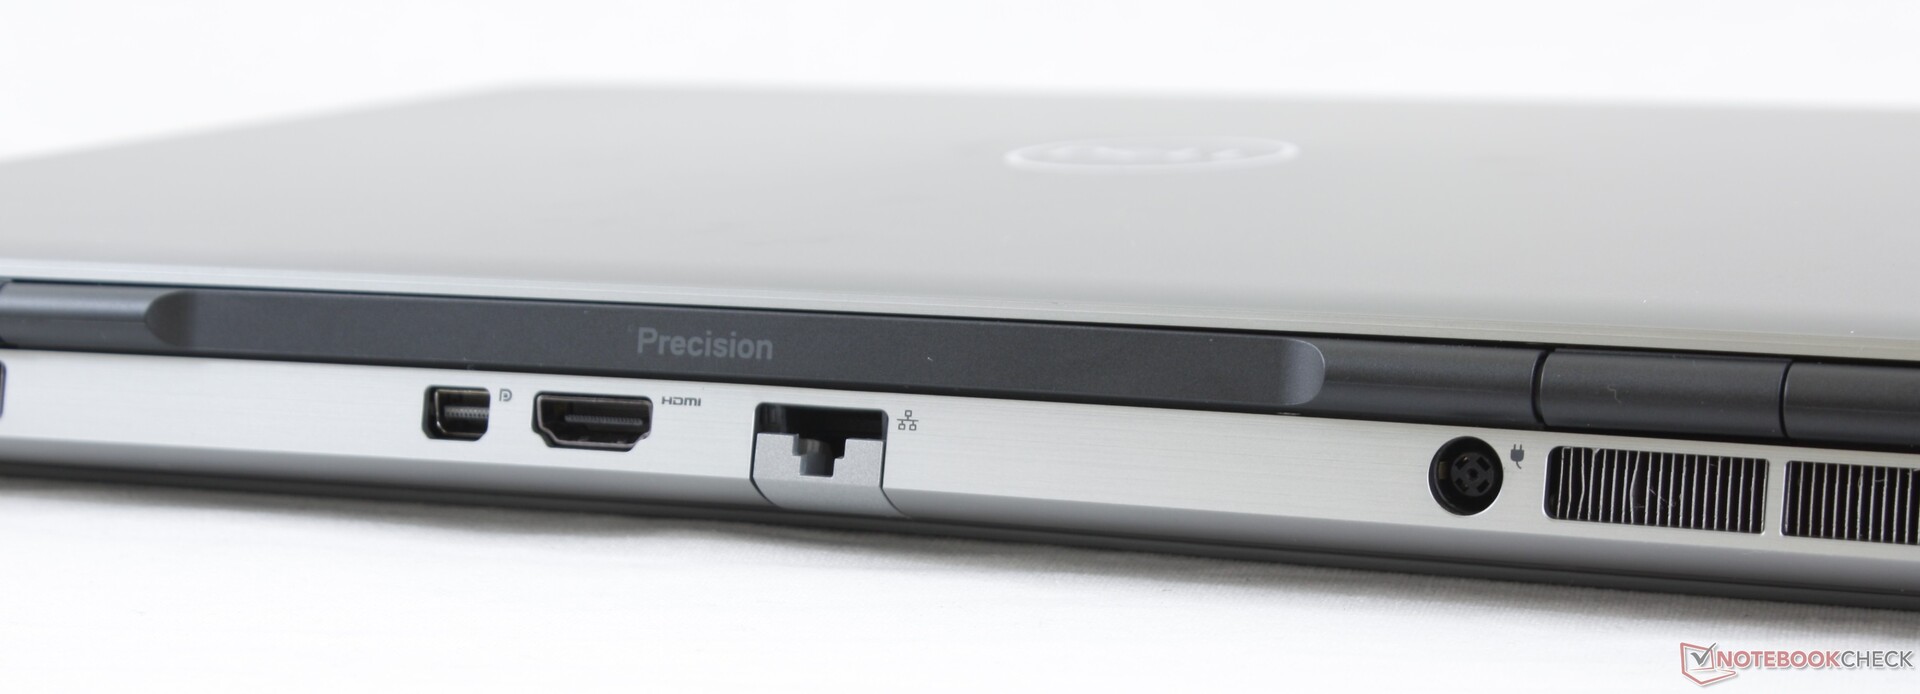
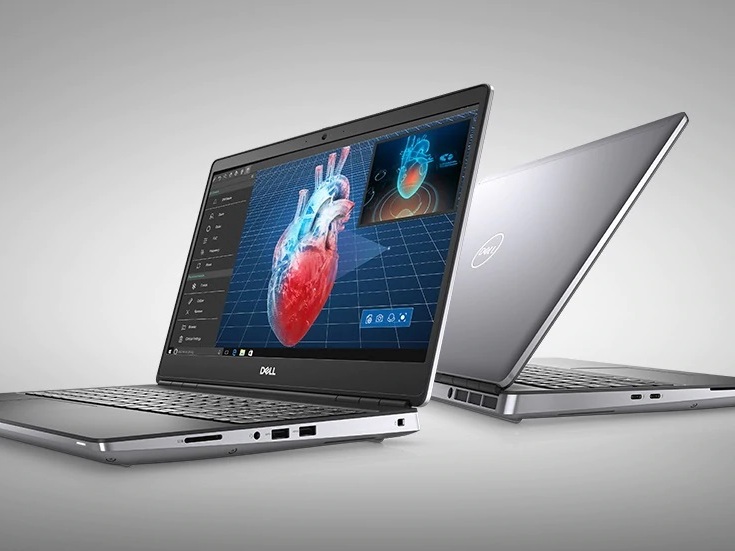
In tegenstelling tot veel nieuwere werkstations tegenwoordig, is de Precision 7550 niet bang om groot en omvangrijk te zijn om meer functies en hardware te kunnen dragen die veeleisende werkstationgebruikers verwachten. Op ultradunne werkstations zoals de Precision 5550, MSI WS66, Razer Blade 15 Studio, of de Asus StudioBook Pro 15, zal je geen handige extra opties vinden, zoals WAN, smartcardlezer, 4x SODIMM-sleuven, aparte muisknoppen, numerieke toetsen op volledige grootte of drievoudige M.2-opslagbays. Voor sommige gebruikers kunnen deze extra’s de grotere afmetingen zeker waard zijn.
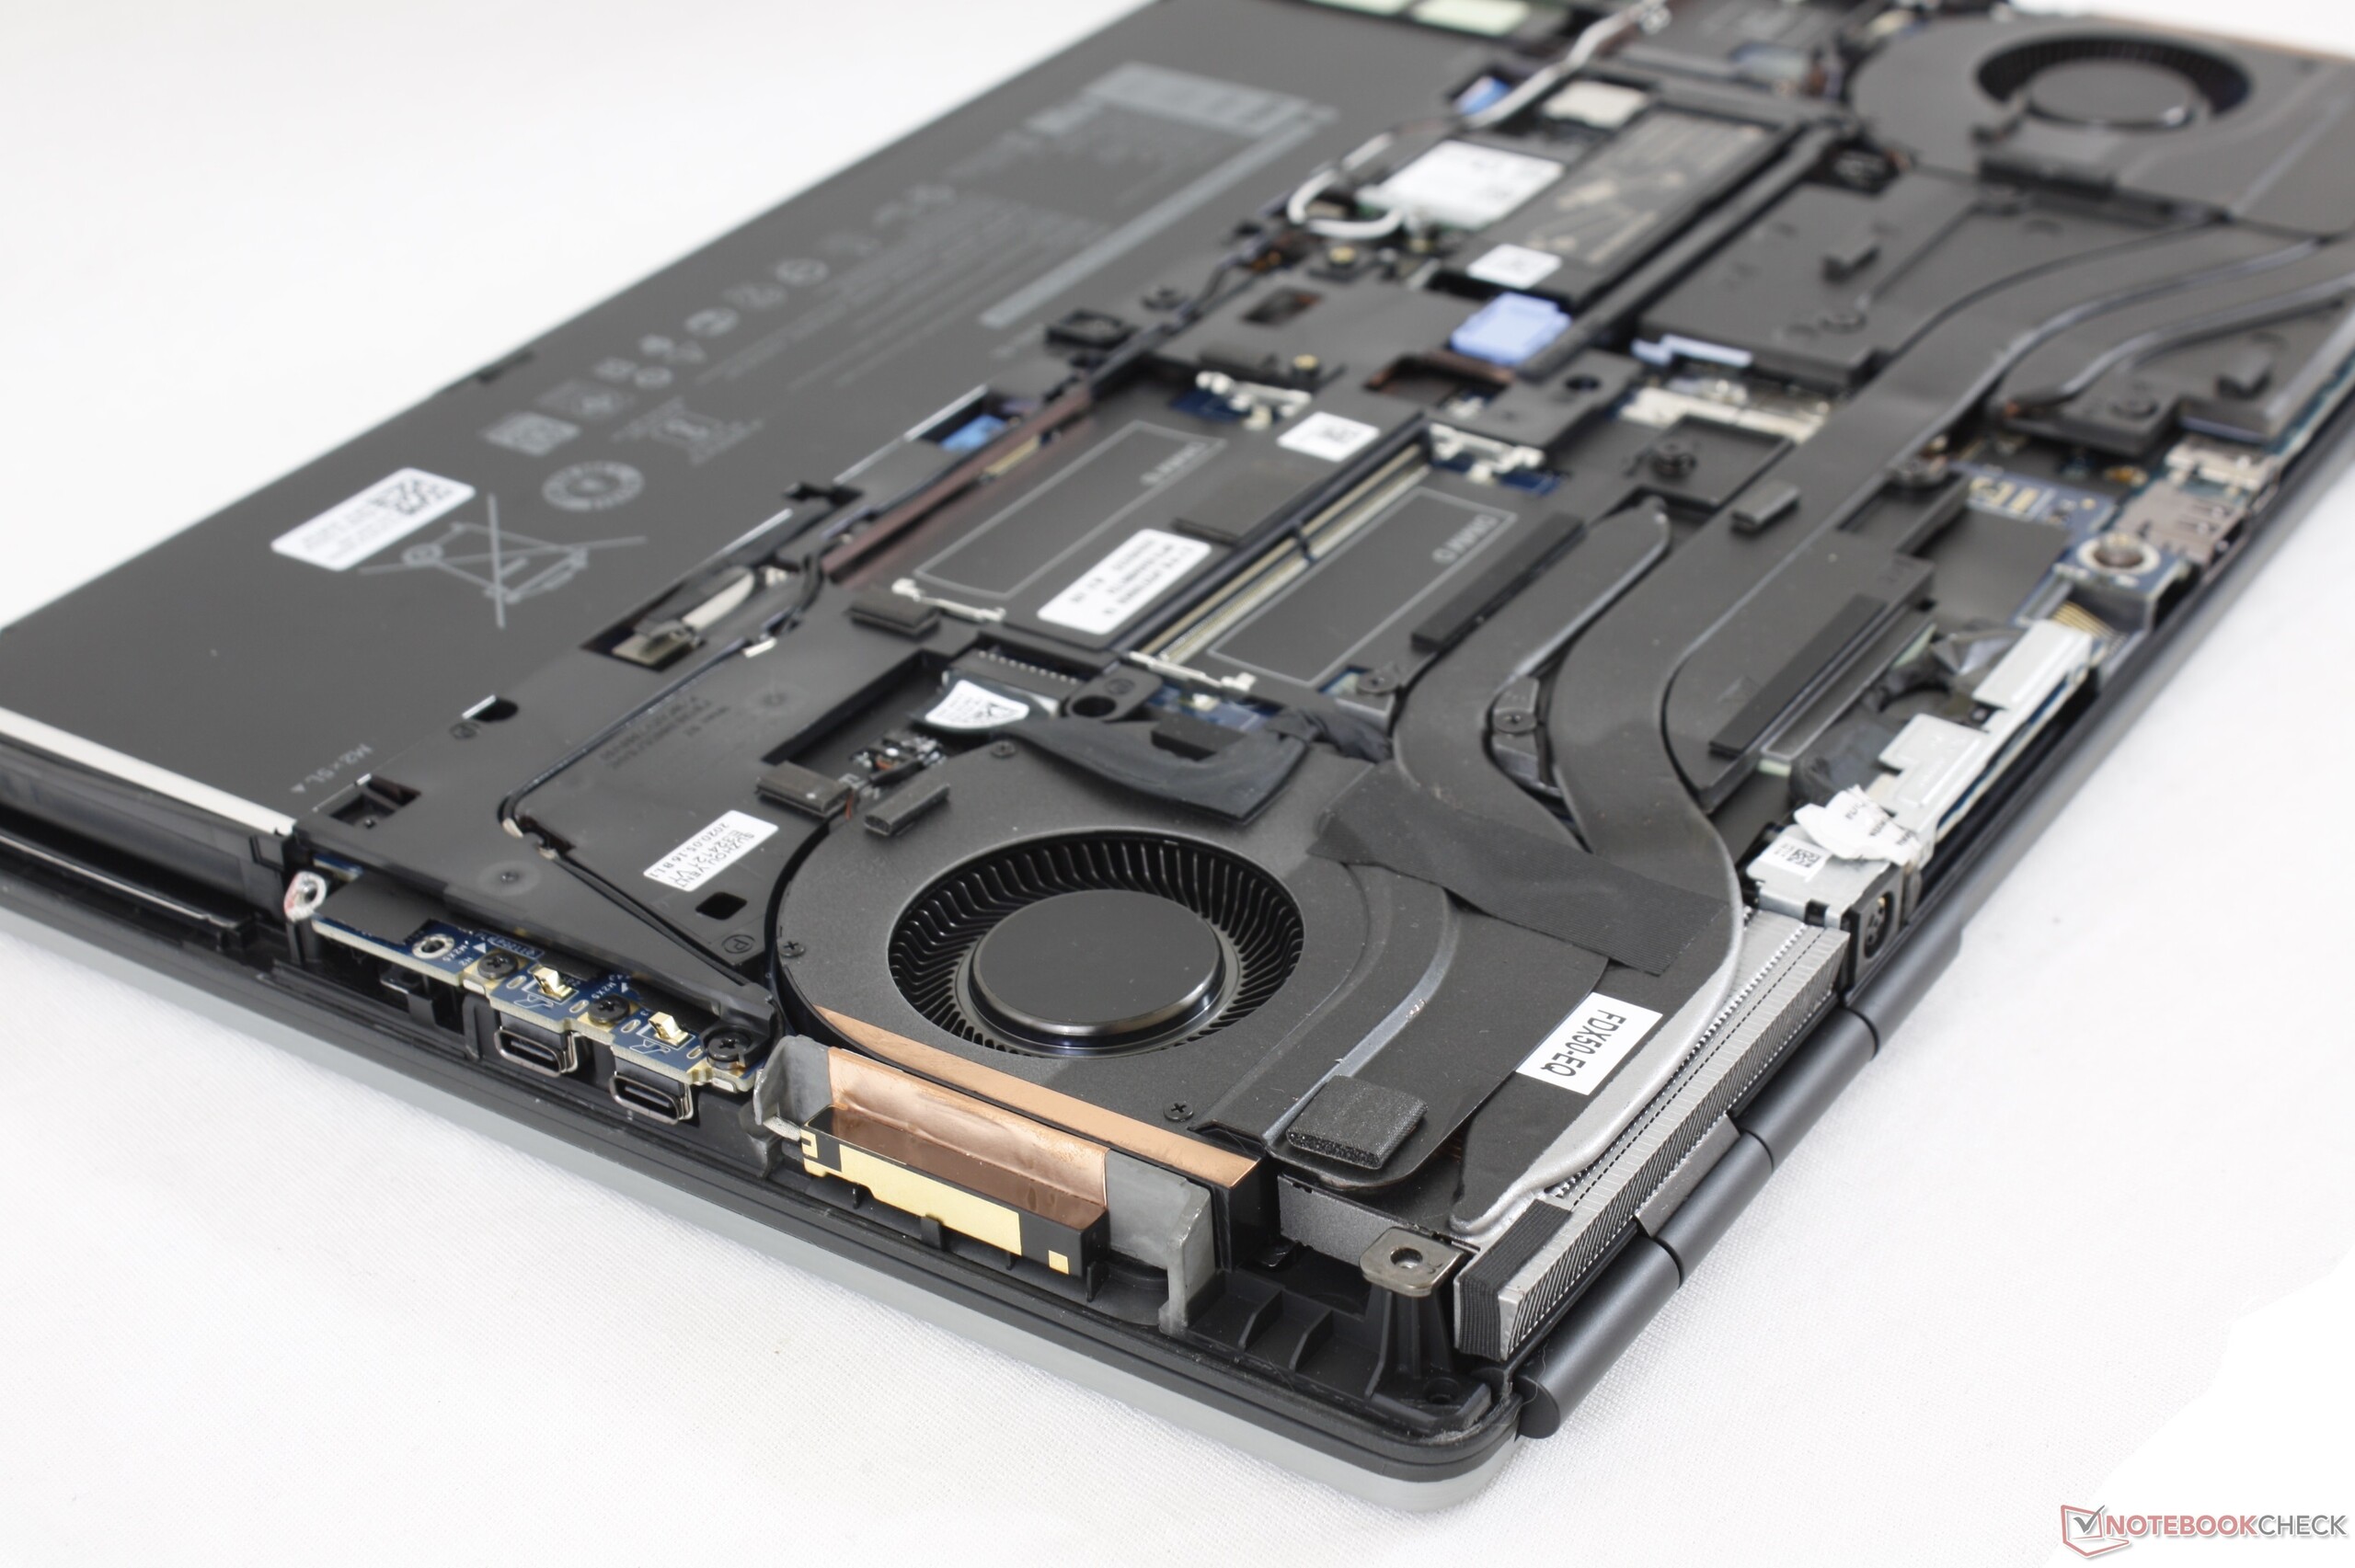
Het belangrijkste nadeel van het systeem is dat het Quadro Max-Q GPU's gebruikt in plaats van de full-power niet-Max-Q-varianten, ondanks het dikke chassisprofiel en het zware gewicht. Concurrerende systemen zoals de Acer ConceptD 9 Pro bewijzen dat de full-power RTX Quadro 5000 minstens 30 procent snellere prestaties kan bieden dan de Quadro RTX 5000 Max-Q in onze Dell. We vermoeden dat er hier geen full-power Quadro RTX 5000-optie is, omdat de 180 Watt stroomadapter een beperkende factor zou zijn. De grafische prestaties zijn dus ongeveer hetzelfde als de eerder genoemde MSI WS66, Razer Blade 15 Studio of Asus, die allemaal aanzienlijk compacter zijn dan de Precision 7550.
De grote Precision 7550 is een aantrekkelijk werkstation als je waarde hecht aan de optionele hardwarefuncties en uitbreidbaarheid. Als dit niet het geval is, kan je in wezen dezelfde onbewerkte prestaties krijgen van nieuwere Nvidia Studio-werkstations die een fractie van de grootte en het gewicht zijn.
Dell Precision 7550
- 28-08-2020 v7 (old)
Allen Ngo
Price comparison
