Kort testrapport Asus ProArt StudioBook Pro 17 W700G3T: gehinderd door kleine dingen
Evaluatie | Datum | Model | Gewicht | Hoogte | Formaat | Resolutie | Beste prijs |
|---|---|---|---|---|---|---|---|
| 86.4 % v7 (old) | 05-2020 | Asus ProArt StudioBook Pro 17 W700G3T i7-9750H, Quadro RTX 3000 Max-Q | 2.5 kg | 18.4 mm | 17.00" | 1920x1200 | |
| 83.8 % v7 (old) | 06-2019 | MSI WS75 9TL-636 i7-9750H, Quadro RTX 4000 (Laptop) | 2.3 kg | 18.95 mm | 17.30" | 1920x1080 | |
| 89.7 % v7 (old) | 12-2019 | Apple MacBook Pro 16 2019 i9 5500M i9-9880H, Radeon Pro 5500M | 2 kg | 16.2 mm | 16.00" | 3072x1920 | |
| 84.7 % v7 (old) | Acer ConceptD 5 CN517-71-74YA i7-9750H, GeForce RTX 2060 Mobile | 2.8 kg | 24 mm | 17.30" | 3840x2160 | ||
| 87 % v7 (old) | 04-2020 | Gigabyte Aero 17 HDR XB i7-10875H, GeForce RTX 2070 Super Max-Q | 2.7 kg | 21 mm | 17.30" | 3840x2160 |
| SD Card Reader | |
| average JPG Copy Test (av. of 3 runs) | |
| Gigabyte Aero 17 HDR XB (Toshiba Exceria Pro SDXC 64 GB UHS-II) | |
| Asus ProArt StudioBook Pro 17 W700G3T (Toshiba Exceria Pro SDXC 64 GB UHS-II) | |
| MSI WS75 9TL-636 (Toshiba Exceria Pro M501 64 GB UHS-II) | |
| Gemiddelde van klas Workstation (49.6 - 681, n=14, laatste 2 jaar) | |
| maximum AS SSD Seq Read Test (1GB) | |
| Gigabyte Aero 17 HDR XB (Toshiba Exceria Pro SDXC 64 GB UHS-II) | |
| Asus ProArt StudioBook Pro 17 W700G3T (Toshiba Exceria Pro SDXC 64 GB UHS-II) | |
| Gemiddelde van klas Workstation (87.6 - 1455, n=14, laatste 2 jaar) | |
| MSI WS75 9TL-636 (Toshiba Exceria Pro M501 64 GB UHS-II) | |
| Networking | |
| iperf3 transmit AX12 | |
| Asus ProArt StudioBook Pro 17 W700G3T | |
| Gigabyte Aero 17 HDR XB | |
| Acer ConceptD 5 CN517-71-74YA | |
| Apple MacBook Pro 16 2019 i9 5500M | |
| MSI WS75 9TL-636 | |
| iperf3 receive AX12 | |
| Asus ProArt StudioBook Pro 17 W700G3T | |
| Gigabyte Aero 17 HDR XB | |
| Acer ConceptD 5 CN517-71-74YA | |
| Apple MacBook Pro 16 2019 i9 5500M | |
| MSI WS75 9TL-636 | |


| |||||||||||||||||||||||||
Helderheidsverdeling: 88 %
Helderheid in Batterij-modus: 320 cd/m²
Contrast: 897:1 (Zwart: 0.36 cd/m²)
ΔE ColorChecker Calman: 1.1 | ∀{0.5-29.43 Ø4.72}
calibrated: 0.8
ΔE Greyscale Calman: 0.8 | ∀{0.09-98 Ø4.97}
99.8% sRGB (Argyll 1.6.3 3D)
75.7% AdobeRGB 1998 (Argyll 1.6.3 3D)
84.7% AdobeRGB 1998 (Argyll 3D)
99.8% sRGB (Argyll 3D)
96.2% Display P3 (Argyll 3D)
Gamma: 2.23
CCT: 6479 K
| Asus ProArt StudioBook Pro 17 W700G3T 170PUW1-A00, IPS, 1920x1200, 17" | MSI WS75 9TL-636 B173HAN04.2, IPS, 1920x1080, 17.3" | Apple MacBook Pro 16 2019 i9 5500M APPA044, IPS, 3072x1920, 16" | Acer ConceptD 5 CN517-71-74YA AUO B173ZAN03, IPS, 3840x2160, 17.3" | Gigabyte Aero 17 HDR XB AUO B173ZAN03.2 (AUO329B), IPS, 3840x2160, 17.3" | |
|---|---|---|---|---|---|
| Display | -21% | 2% | 3% | ||
| Display P3 Coverage (%) | 96.2 | 64.5 -33% | 86.2 -10% | 86.5 -10% | |
| sRGB Coverage (%) | 99.8 | 91.1 -9% | 100 0% | 100 0% | |
| AdobeRGB 1998 Coverage (%) | 84.7 | 65.8 -22% | 99.1 17% | 100 18% | |
| Response Times | 5% | -23% | -31% | -11% | |
| Response Time Grey 50% / Grey 80% * (ms) | 41.2 ? | 39.2 ? 5% | 52.4 ? -27% | 55 ? -33% | 55.2 ? -34% |
| Response Time Black / White * (ms) | 29.6 ? | 28.4 ? 4% | 34.9 ? -18% | 38 ? -28% | 26 ? 12% |
| PWM Frequency (Hz) | 131700 | ||||
| Screen | -86% | -7% | -40% | 13% | |
| Brightness middle (cd/m²) | 323 | 300 -7% | 519 61% | 410 27% | 487 51% |
| Brightness (cd/m²) | 308 | 288 -6% | 477 55% | 383 24% | 475 54% |
| Brightness Distribution (%) | 88 | 86 -2% | 86 -2% | 88 0% | 95 8% |
| Black Level * (cd/m²) | 0.36 | 0.25 31% | 0.39 -8% | 0.58 -61% | 0.38 -6% |
| Contrast (:1) | 897 | 1200 34% | 1331 48% | 707 -21% | 1282 43% |
| Colorchecker dE 2000 * | 1.1 | 3.9 -255% | 2.28 -107% | 1.91 -74% | 1.19 -8% |
| Colorchecker dE 2000 max. * | 3.3 | 6 -82% | 6.54 -98% | 4.67 -42% | 2.43 26% |
| Colorchecker dE 2000 calibrated * | 0.8 | 2.3 -187% | 0.86 -8% | 1.09 -36% | 0.5 37% |
| Greyscale dE 2000 * | 0.8 | 4.3 -437% | 0.9 -13% | 3 -275% | 1.45 -81% |
| Gamma | 2.23 99% | 2.2 100% | 2145 0% | 2.18 101% | 2.21 100% |
| CCT | 6479 100% | 7391 88% | 6572 99% | 6338 103% | 6557 99% |
| Color Space (Percent of AdobeRGB 1998) (%) | 75.7 | 59.2 -22% | 78 3% | 87 15% | 88 16% |
| Color Space (Percent of sRGB) (%) | 99.8 | 91 -9% | 100 0% | 100 0% | |
| Totaal Gemiddelde (Programma / Instellingen) | -34% /
-62% | -15% /
-10% | -23% /
-31% | 2% /
8% |
* ... kleiner is beter
Responstijd Scherm
| ↔ Responstijd Zwart naar Wit | ||
|---|---|---|
| 29.6 ms ... stijging ↗ en daling ↘ gecombineerd | ↗ 16.4 ms stijging | 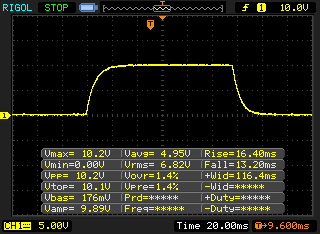 |
| ↘ 13.2 ms daling | ||
| Het scherm vertoonde relatief trage responstijden in onze tests en is misschien te traag voor games. Ter vergelijking: alle testtoestellen variëren van 0.1 (minimum) tot 240 (maximum) ms. » 79 % van alle toestellen zijn beter. Dit betekent dat de gemeten responstijd slechter is dan het gemiddelde (19.8 ms) van alle geteste toestellen. | ||
| ↔ Responstijd 50% Grijs naar 80% Grijs | ||
| 41.2 ms ... stijging ↗ en daling ↘ gecombineerd | ↗ 22 ms stijging | 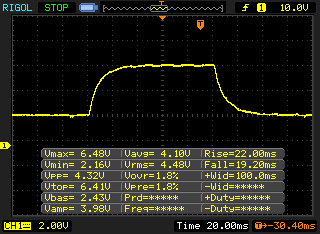 |
| ↘ 19.2 ms daling | ||
| Het scherm vertoonde trage responstijden in onze tests en is misschien te traag voor games. Ter vergelijking: alle testtoestellen variëren van 0.165 (minimum) tot 636 (maximum) ms. » 66 % van alle toestellen zijn beter. Dit betekent dat de gemeten responstijd slechter is dan het gemiddelde (31 ms) van alle geteste toestellen. | ||
Screen Flickering / PWM (Pulse-Width Modulation)
| Screen flickering / PWM niet waargenomen | 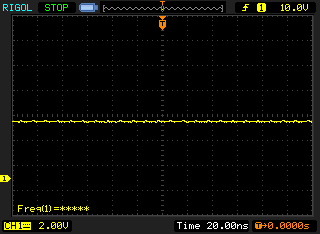 | ||
Ter vergelijking: 52 % van alle geteste toestellen maakten geen gebruik van PWM om de schermhelderheid te verlagen. Als het wel werd gebruikt, werd een gemiddelde van 7769 (minimum: 5 - maximum: 343500) Hz waargenomen. | |||
| Cinebench R15 | |
| CPU Single 64Bit | |
| Gemiddelde van klas Workstation (191.4 - 328, n=24, laatste 2 jaar) | |
| Lenovo ThinkPad P73-20QR002DGE | |
| Asus ProArt StudioBook Pro 17 W700G3T | |
| MSI WS75 9TL-636 | |
| Acer ConceptD 5 CN517-71-74YA | |
| Apple MacBook Pro 16 2019 i9 5500M (macOS 10.15.1) | |
| Apple MacBook Pro 16 2019 i9 5500M | |
| Gemiddeld Intel Core i7-9750H (170 - 194, n=82) | |
| CPU Multi 64Bit | |
| Gemiddelde van klas Workstation (2489 - 5810, n=24, laatste 2 jaar) | |
| Apple MacBook Pro 16 2019 i9 5500M (macOS 10.15.1) | |
| Apple MacBook Pro 16 2019 i9 5500M (Win 10) | |
| Lenovo ThinkPad P73-20QR002DGE | |
| Asus ProArt StudioBook Pro 17 W700G3T (Auto) | |
| Asus ProArt StudioBook Pro 17 W700G3T (Turbo) | |
| MSI WS75 9TL-636 | |
| Gemiddeld Intel Core i7-9750H (952 - 1306, n=85) | |
| Acer ConceptD 5 CN517-71-74YA | |
| PCMark 8 Home Score Accelerated v2 | 4322 punten | |
| PCMark 8 Creative Score Accelerated v2 | 6968 punten | |
| PCMark 8 Work Score Accelerated v2 | 5241 punten | |
| PCMark 10 Score | 4918 punten | |
Help | ||

| Unigine Heaven 4.0 | |
| Extreme Preset OpenGL | |
| Gemiddelde van klas Workstation (72.4 - 185.3, n=4, laatste 2 jaar) | |
| MSI WS75 9TL-636 | |
| Asus ProArt StudioBook Pro 17 W700G3T | |
| Gemiddeld NVIDIA Quadro RTX 3000 Max-Q (n=1) | |
| Lenovo ThinkPad P73-20QR002DGE | |
| Extreme Preset DX11 | |
| Gemiddelde van klas Workstation (77.7 - 222, n=4, laatste 2 jaar) | |
| Gigabyte Aero 17 HDR XB | |
| MSI WS75 9TL-636 | |
| Asus Zephyrus G14 GA401IV | |
| Asus ProArt StudioBook Pro 17 W700G3T | |
| Gemiddeld NVIDIA Quadro RTX 3000 Max-Q (n=1) | |
| Lenovo ThinkPad P73-20QR002DGE | |
| Unigine Valley 1.0 | |
| 1920x1080 Extreme HD DirectX AA:x8 | |
| MSI WS75 9TL-636 | |
| Asus ProArt StudioBook Pro 17 W700G3T | |
| Gemiddeld NVIDIA Quadro RTX 3000 Max-Q (n=1) | |
| Gemiddelde van klas Workstation (n=1laatste 2 jaar) | |
| Lenovo ThinkPad P73-20QR002DGE | |
| 1920x1080 Extreme HD Preset OpenGL AA:x8 | |
| MSI WS75 9TL-636 | |
| Asus ProArt StudioBook Pro 17 W700G3T | |
| Gemiddeld NVIDIA Quadro RTX 3000 Max-Q (n=1) | |
| Lenovo ThinkPad P73-20QR002DGE | |
| Gemiddelde van klas Workstation (n=1laatste 2 jaar) | |
| Apple MacBook Pro 16 2019 i9 5500M | |
| 3DMark 11 Performance | 14763 punten | |
| 3DMark Ice Storm Standard Score | 79168 punten | |
| 3DMark Cloud Gate Standard Score | 32299 punten | |
| 3DMark Fire Strike Score | 12130 punten | |
| 3DMark Fire Strike Extreme Score | 6117 punten | |
| 3DMark Time Spy Score | 5070 punten | |
Help | ||
| lage | gem. | hoge | ultra | QHD | 4K | |
|---|---|---|---|---|---|---|
| GTA V (2015) | 155 | 150 | 111.8 | 58.5 | 49.4 | 65 |
| The Witcher 3 (2015) | 236 | 166 | 95.9 | 48.5 | 33.8 | |
| Dota 2 Reborn (2015) | 131 | 120 | 115 | 109 | 75.6 | |
| Rise of the Tomb Raider (2016) | 195 | 139 | 96.7 | 80.8 | 34 | |
| X-Plane 11.11 (2018) | 106 | 92 | 78.6 | 64.4 | ||
| Shadow of the Tomb Raider (2018) | 86 | 76 | 71 | 65 | 43 | 21 |
| Hitman 2 (2018) | 66.3 | 63.2 | 57.5 | 55.9 | 44.8 | 24.3 |
| Dirt Rally 2.0 (2019) | 203 | 128 | 101 | 64 | 47.2 | |
| The Division 2 (2019) | 114 | 86 | 68 | 50 | 34 | 17 |
| Ghost Recon Breakpoint (2019) | 75 | 65 | 59 | 45 | 32 | 16 |
| GRID 2019 (2019) | 93 | 72.4 | 66.3 | 51.4 | 46.6 | 21.2 |
| Call of Duty Modern Warfare 2019 (2019) | 142.5 | 93.8 | 81 | 54.3 | 34 | 17.5 |
| Need for Speed Heat (2019) | 82 | 74.7 | 66.7 | 61.9 | 47.5 | 25.9 |
| Star Wars Jedi Fallen Order (2019) | 76.8 | 71.8 | 66.3 | 46.8 | 24.1 | |
| Doom Eternal (2020) | 178.3 | 119.2 | 104.4 | 102.6 | 67.5 | 31.6 |
Geluidsniveau
| Onbelast |
| 29.4 / 29.9 / 29.9 dB (A) |
| Belasting |
| 31.6 / 31.6 dB (A) |
 | ||
30 dB stil 40 dB(A) hoorbaar 50 dB(A) luid |
||
min: | ||
| Asus ProArt StudioBook Pro 17 W700G3T Quadro RTX 3000 Max-Q, i7-9750H, Samsung SSD PM981 MZVLB1T0HALR | MSI WS75 9TL-636 Quadro RTX 4000 (Laptop), i7-9750H, Samsung SSD PM981 MZVLB1T0HALR | Apple MacBook Pro 16 2019 i9 5500M Radeon Pro 5500M, i9-9880H, Apple SSD AP1024 7171 | Acer ConceptD 5 CN517-71-74YA GeForce RTX 2060 Mobile, i7-9750H, WDC PC SN720 SDAQNTW-1T00 | Gigabyte Aero 17 HDR XB GeForce RTX 2070 Super Max-Q, i7-10875H, Samsung SSD PM981a MZVLB512HBJQ | |
|---|---|---|---|---|---|
| Noise | -14% | -18% | -12% | -35% | |
| uit / omgeving * (dB) | 29.4 | 29.4 -0% | 29.8 -1% | 29.8 -1% | 30 -2% |
| Idle Minimum * (dB) | 29.4 | 29.4 -0% | 29.9 -2% | 29.7 -1% | 35 -19% |
| Idle Average * (dB) | 29.9 | 30.1 -1% | 29.9 -0% | 29.7 1% | 36 -20% |
| Idle Maximum * (dB) | 29.9 | 30.9 -3% | 29.9 -0% | 29.7 1% | 38 -27% |
| Load Average * (dB) | 31.6 | 40.7 -29% | 43 -36% | 39.9 -26% | 47 -49% |
| Witcher 3 ultra * (dB) | 31.6 | 41.9 -33% | 45.4 -44% | 39.5 -25% | 49 -55% |
| Load Maximum * (dB) | 31.6 | 42.7 -35% | 46.1 -46% | 41 -30% | 54 -71% |
* ... kleiner is beter
(-) De maximumtemperatuur aan de bovenzijde bedraagt 45.4 °C / 114 F, vergeleken met het gemiddelde van 38.2 °C / 101 F, variërend van 22.2 tot 69.8 °C voor de klasse Workstation.
(-) De bodem warmt op tot een maximum van 53.7 °C / 129 F, vergeleken met een gemiddelde van 41.1 °C / 106 F
(+) Bij onbelast gebruik bedraagt de gemiddelde temperatuur voor de bovenzijde 21.3 °C / 70 F, vergeleken met het apparaatgemiddelde van 32 °C / 90 F.
(±) Bij het spelen van The Witcher 3 is de gemiddelde temperatuur voor de bovenzijde 36.5 °C / 98 F, vergeleken met het apparaatgemiddelde van 32 °C / 90 F.
(+) De palmsteunen en het touchpad zijn met een maximum van ###max## °C / 88.7 F koeler dan de huidtemperatuur en voelen daarom koel aan.
(-) De gemiddelde temperatuur van de handpalmsteun van soortgelijke toestellen bedroeg 27.8 °C / 82 F (-3.7 °C / -6.7 F).
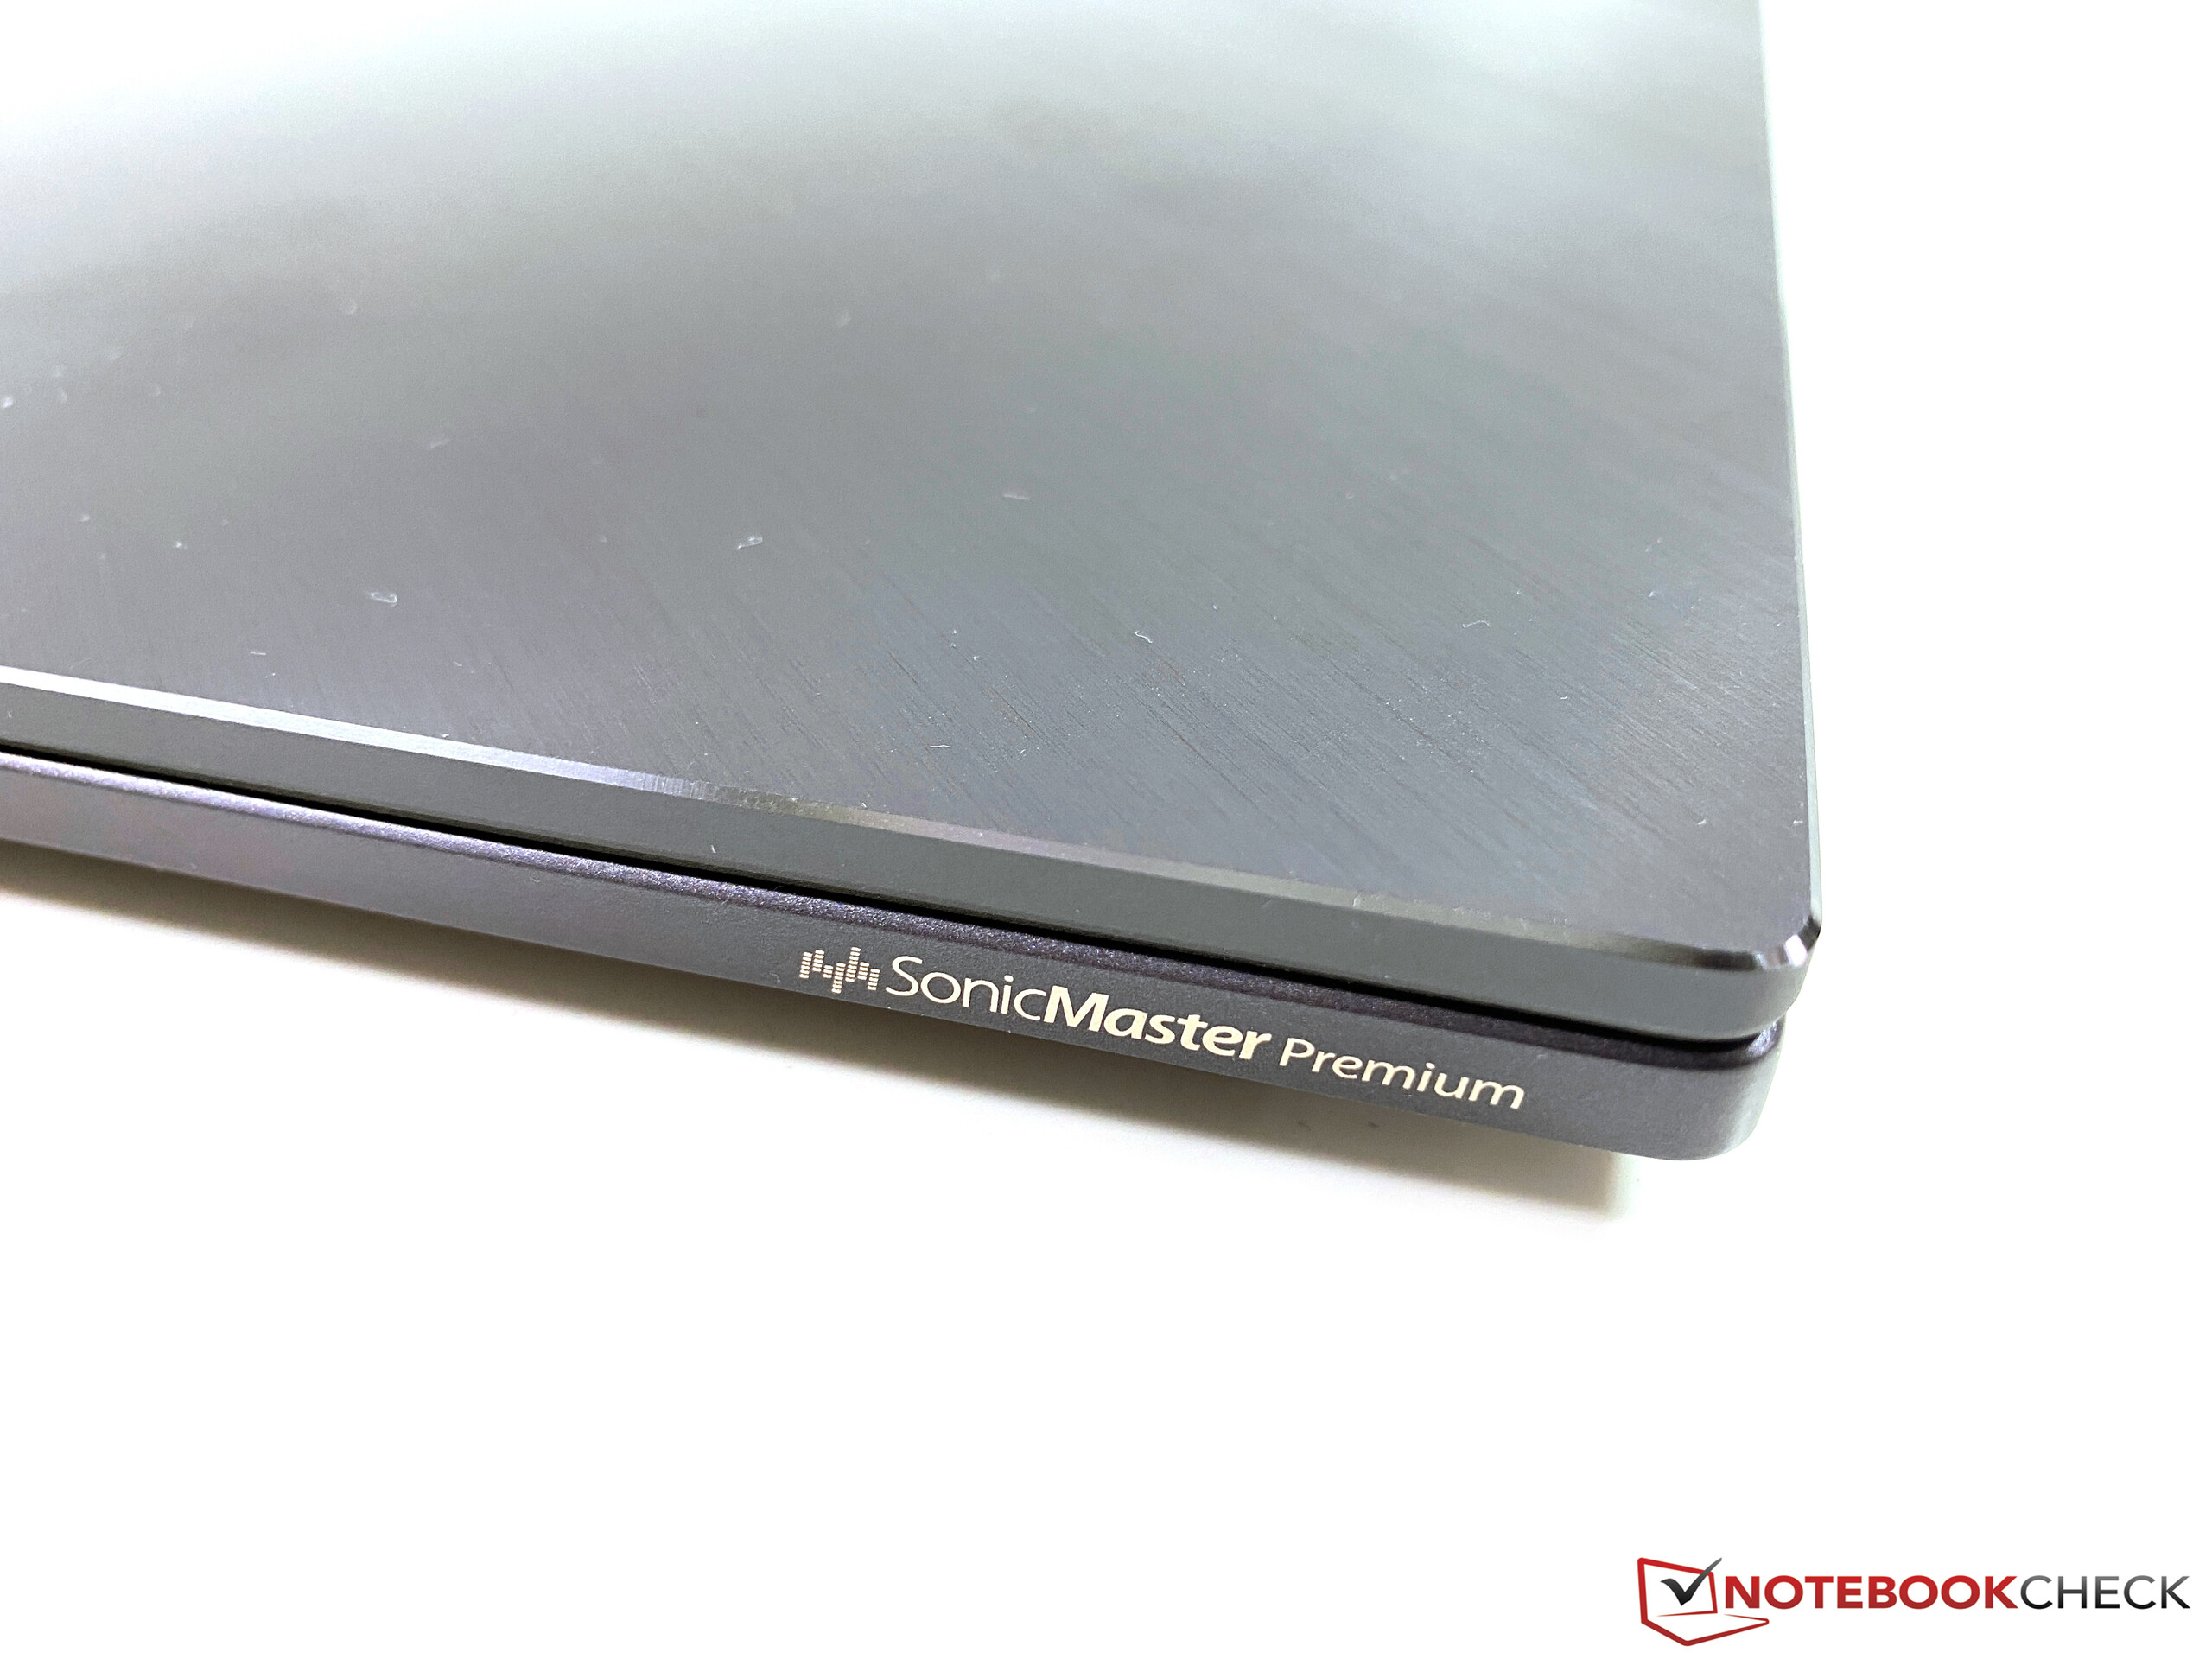
Asus ProArt StudioBook Pro 17 W700G3T audioanalyse
(±) | luidspreker luidheid is gemiddeld maar goed (79 dB)
Bas 100 - 315 Hz
(-) | bijna geen lage tonen - gemiddeld 15% lager dan de mediaan
(±) | lineariteit van de lage tonen is gemiddeld (11% delta ten opzichte van de vorige frequentie)
Midden 400 - 2000 Hz
(+) | evenwichtige middens - slechts 3.4% verwijderd van de mediaan
(+) | de middentonen zijn lineair (4.4% delta ten opzichte van de vorige frequentie)
Hoog 2 - 16 kHz
(+) | evenwichtige hoogtepunten - slechts 4.5% verwijderd van de mediaan
(+) | de hoge tonen zijn lineair (6.9% delta naar de vorige frequentie)
Algemeen 100 - 16.000 Hz
(±) | lineariteit van het totale geluid is gemiddeld (17.1% verschil met de mediaan)
Vergeleken met dezelfde klasse
» 50% van alle geteste apparaten in deze klasse waren beter, 9% vergelijkbaar, 41% slechter
» De beste had een delta van 7%, het gemiddelde was 17%, de slechtste was 35%
Vergeleken met alle geteste toestellen
» 31% van alle geteste apparaten waren beter, 8% gelijk, 61% slechter
» De beste had een delta van 4%, het gemiddelde was 24%, de slechtste was 134%
MSI WS75 9TL-636 audioanalyse
(±) | luidspreker luidheid is gemiddeld maar goed (75.4 dB)
Bas 100 - 315 Hz
(-) | bijna geen lage tonen - gemiddeld 25.9% lager dan de mediaan
(±) | lineariteit van de lage tonen is gemiddeld (7.8% delta ten opzichte van de vorige frequentie)
Midden 400 - 2000 Hz
(±) | hogere middens - gemiddeld 5.2% hoger dan de mediaan
(±) | lineariteit van de middentonen is gemiddeld (8.1% delta ten opzichte van de vorige frequentie)
Hoog 2 - 16 kHz
(+) | evenwichtige hoogtepunten - slechts 3.3% verwijderd van de mediaan
(±) | lineariteit van de hoogtepunten is gemiddeld (9.3% delta ten opzichte van de vorige frequentie)
Algemeen 100 - 16.000 Hz
(±) | lineariteit van het totale geluid is gemiddeld (27.5% verschil met de mediaan)
Vergeleken met dezelfde klasse
» 94% van alle geteste apparaten in deze klasse waren beter, 2% vergelijkbaar, 4% slechter
» De beste had een delta van 7%, het gemiddelde was 17%, de slechtste was 35%
Vergeleken met alle geteste toestellen
» 84% van alle geteste apparaten waren beter, 3% gelijk, 13% slechter
» De beste had een delta van 4%, het gemiddelde was 24%, de slechtste was 134%
| Uit / Standby | |
| Inactief | |
| Belasting |
|
Key:
min: | |
| Asus ProArt StudioBook Pro 17 W700G3T i7-9750H, Quadro RTX 3000 Max-Q, Samsung SSD PM981 MZVLB1T0HALR, IPS, 1920x1200, 17" | MSI WS75 9TL-636 i7-9750H, Quadro RTX 4000 (Laptop), Samsung SSD PM981 MZVLB1T0HALR, IPS, 1920x1080, 17.3" | Apple MacBook Pro 16 2019 i9 5500M i9-9880H, Radeon Pro 5500M, Apple SSD AP1024 7171, IPS, 3072x1920, 16" | Acer ConceptD 5 CN517-71-74YA i7-9750H, GeForce RTX 2060 Mobile, WDC PC SN720 SDAQNTW-1T00, IPS, 3840x2160, 17.3" | Gigabyte Aero 17 HDR XB i7-10875H, GeForce RTX 2070 Super Max-Q, Samsung SSD PM981a MZVLB512HBJQ, IPS, 3840x2160, 17.3" | Gemiddeld NVIDIA Quadro RTX 3000 Max-Q | Gemiddelde van klas Workstation | |
|---|---|---|---|---|---|---|---|
| Power Consumption | -24% | 23% | 7% | -41% | 6% | 6% | |
| Idle Minimum * (Watt) | 11.3 | 16.4 -45% | 3.7 67% | 6.2 45% | 16 -42% | 7.7 ? 32% | 9.04 ? 20% |
| Idle Average * (Watt) | 16 | 21.6 -35% | 12.1 24% | 15.2 5% | 19 -19% | 14.6 ? 9% | 13.8 ? 14% |
| Idle Maximum * (Watt) | 16.8 | 22.9 -36% | 17 -1% | 17.4 -4% | 30 -79% | 16.9 ? -1% | 17.7 ? -5% |
| Load Average * (Watt) | 93.6 | 88 6% | 91.5 2% | 95 -1% | 109 -16% | 111.1 ? -19% | 96.2 ? -3% |
| Witcher 3 ultra * (Watt) | 106 | 137 -29% | 103 3% | 136 -28% | 167 -58% | ||
| Load Maximum * (Watt) | 186.6 | 193 -3% | 102.3 45% | 145 22% | 246 -32% | 173.5 ? 7% | 178.5 ? 4% |
* ... kleiner is beter
| Asus ProArt StudioBook Pro 17 W700G3T i7-9750H, Quadro RTX 3000 Max-Q, 57 Wh | MSI WS75 9TL-636 i7-9750H, Quadro RTX 4000 (Laptop), 82 Wh | Apple MacBook Pro 16 2019 i9 5500M i9-9880H, Radeon Pro 5500M, 99.8 Wh | Acer ConceptD 5 CN517-71-74YA i7-9750H, GeForce RTX 2060 Mobile, 55 Wh | Gigabyte Aero 17 HDR XB i7-10875H, GeForce RTX 2070 Super Max-Q, 94 Wh | Gemiddelde van klas Workstation | |
|---|---|---|---|---|---|---|
| Batterijduur | 1% | 34% | -5% | 20% | 22% | |
| H.264 (h) | 6.9 | 8.2 19% | 9.7 41% | 9.51 ? 38% | ||
| WiFi v1.3 (h) | 5.9 | 6.6 12% | 12 103% | 5.6 -5% | 6.2 5% | 8.52 ? 44% |
| Load (h) | 1.7 | 1.2 -29% | 1 -41% | 2.3 35% | 1.429 ? -16% | |
| Reader / Idle (h) | 12.6 | 9.9 | 26.1 ? | |||
| Witcher 3 ultra (h) | 0.9 |
Pro
Contra
Verdict – StudioBook Pro is held back by small things
Dit is de verkorte versie van het originele artikel. Het volledige, Engelse testrapport vind je hier.
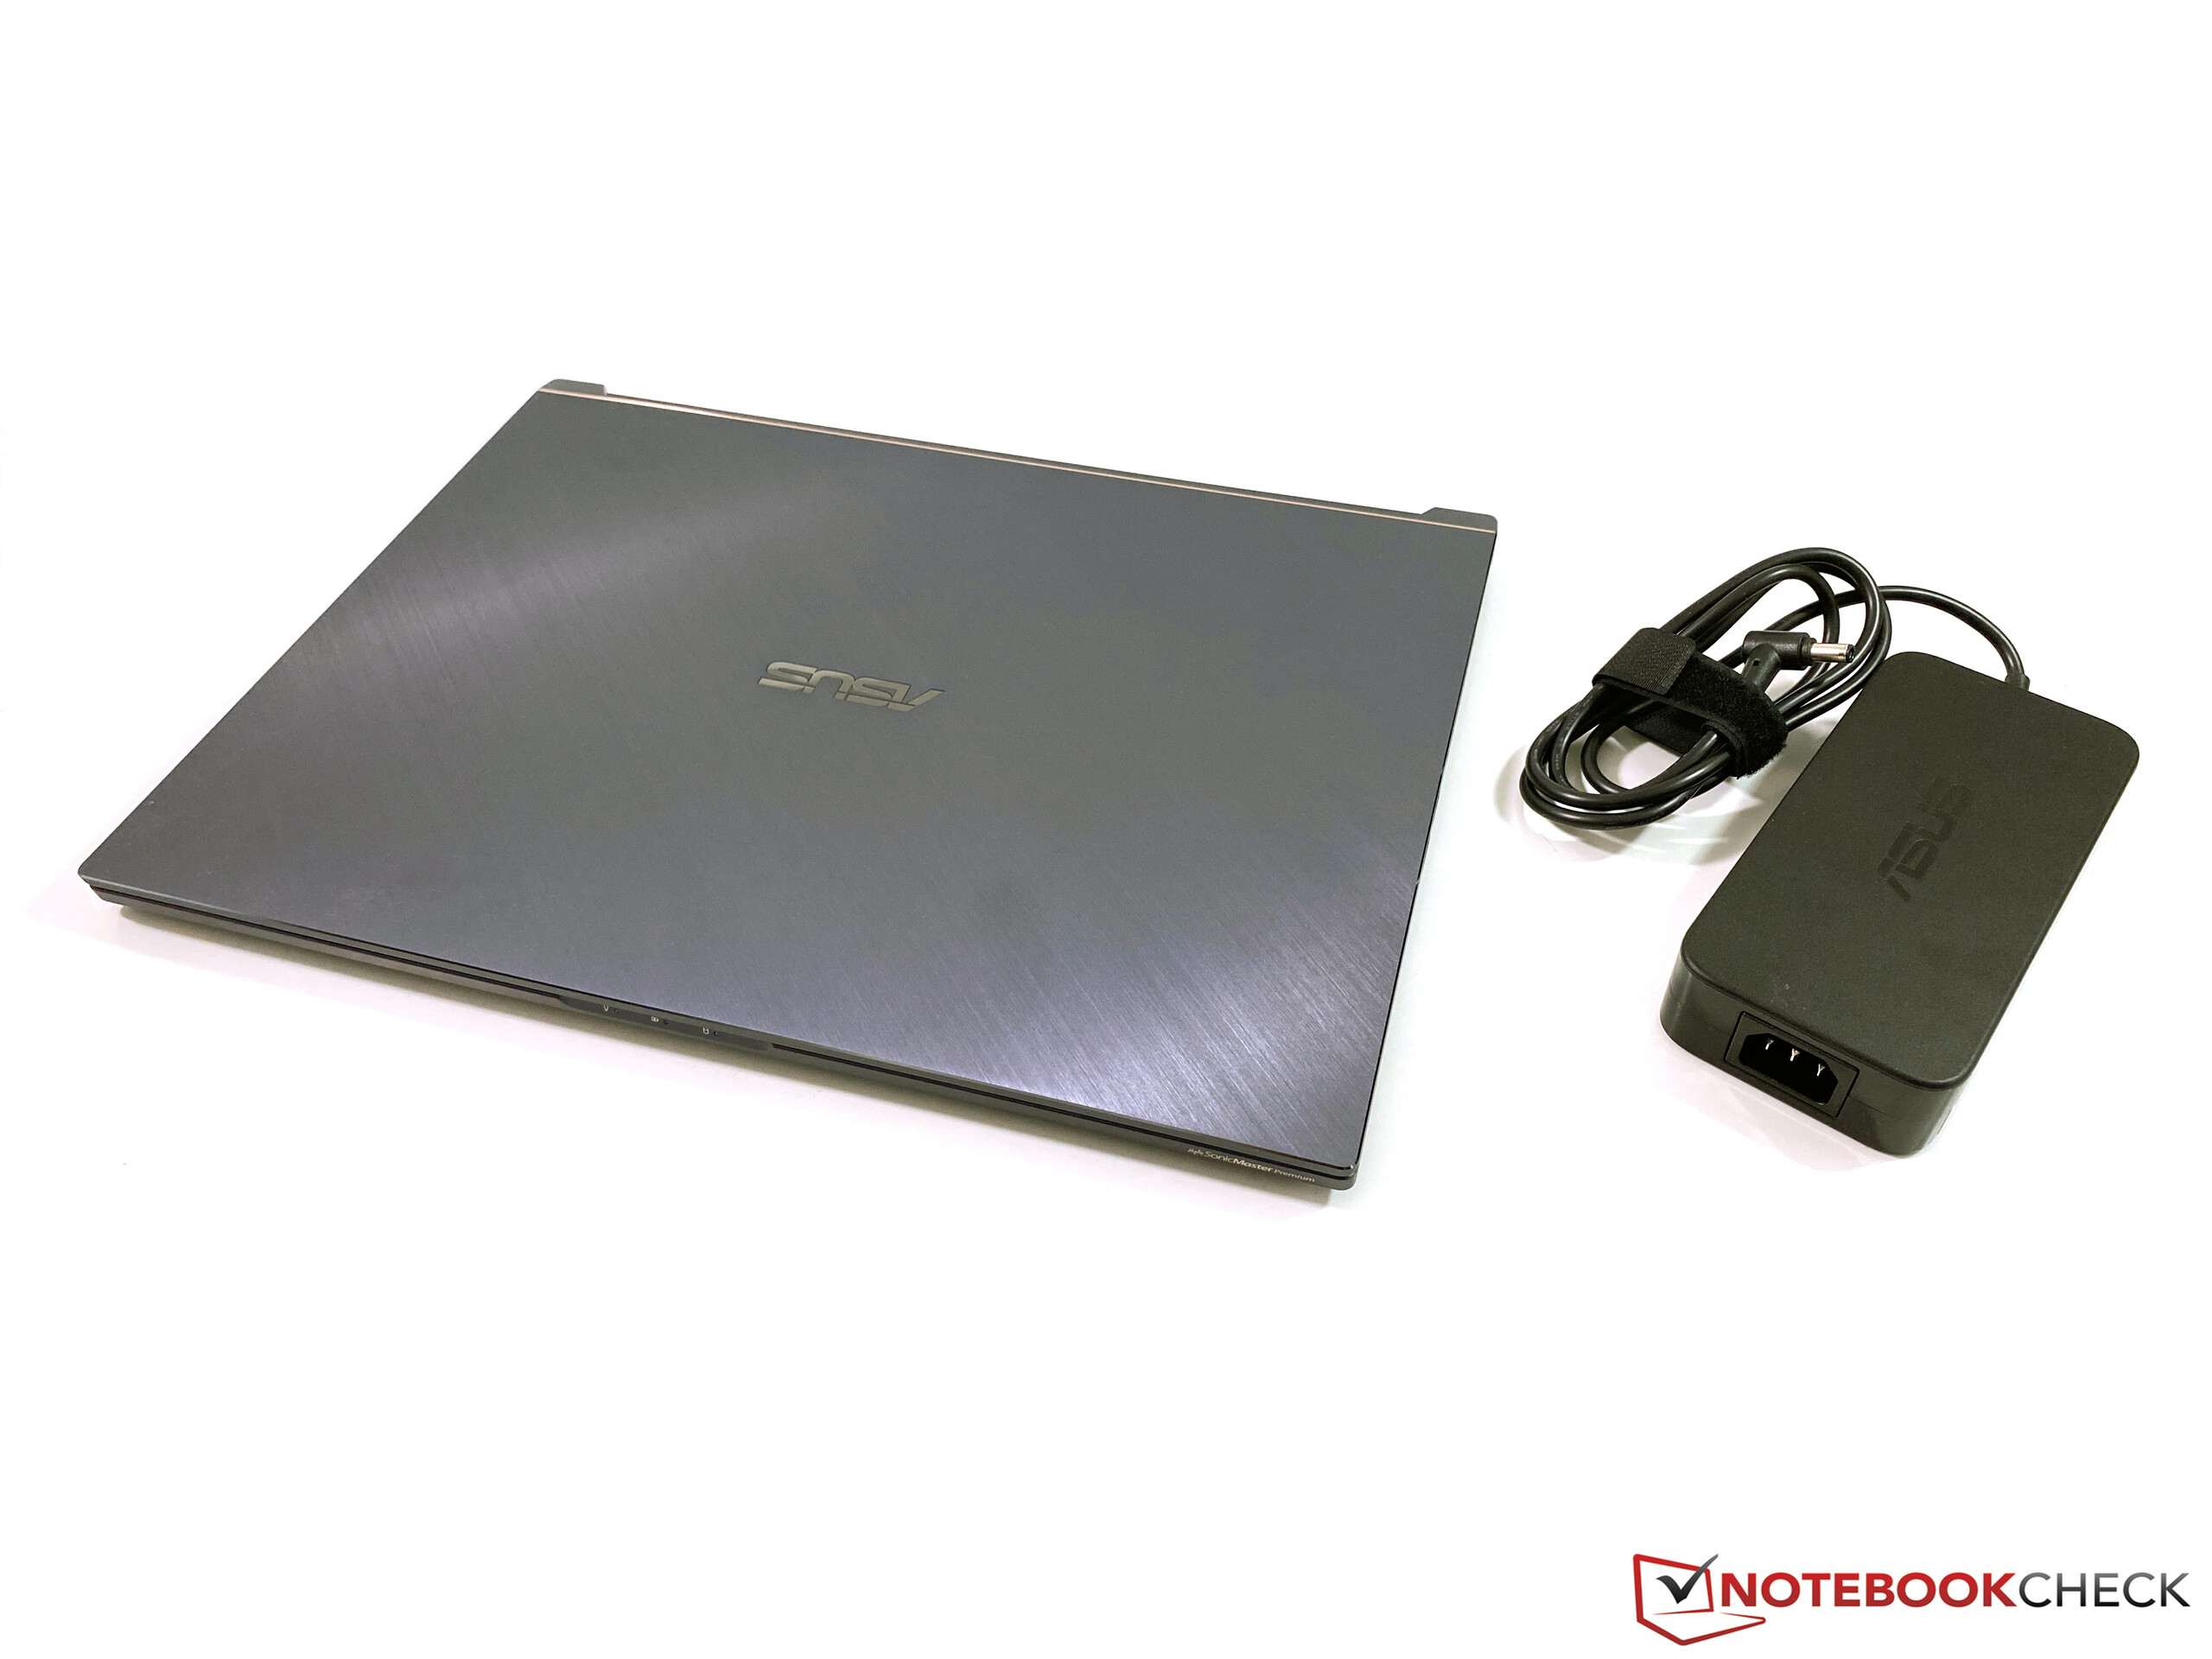
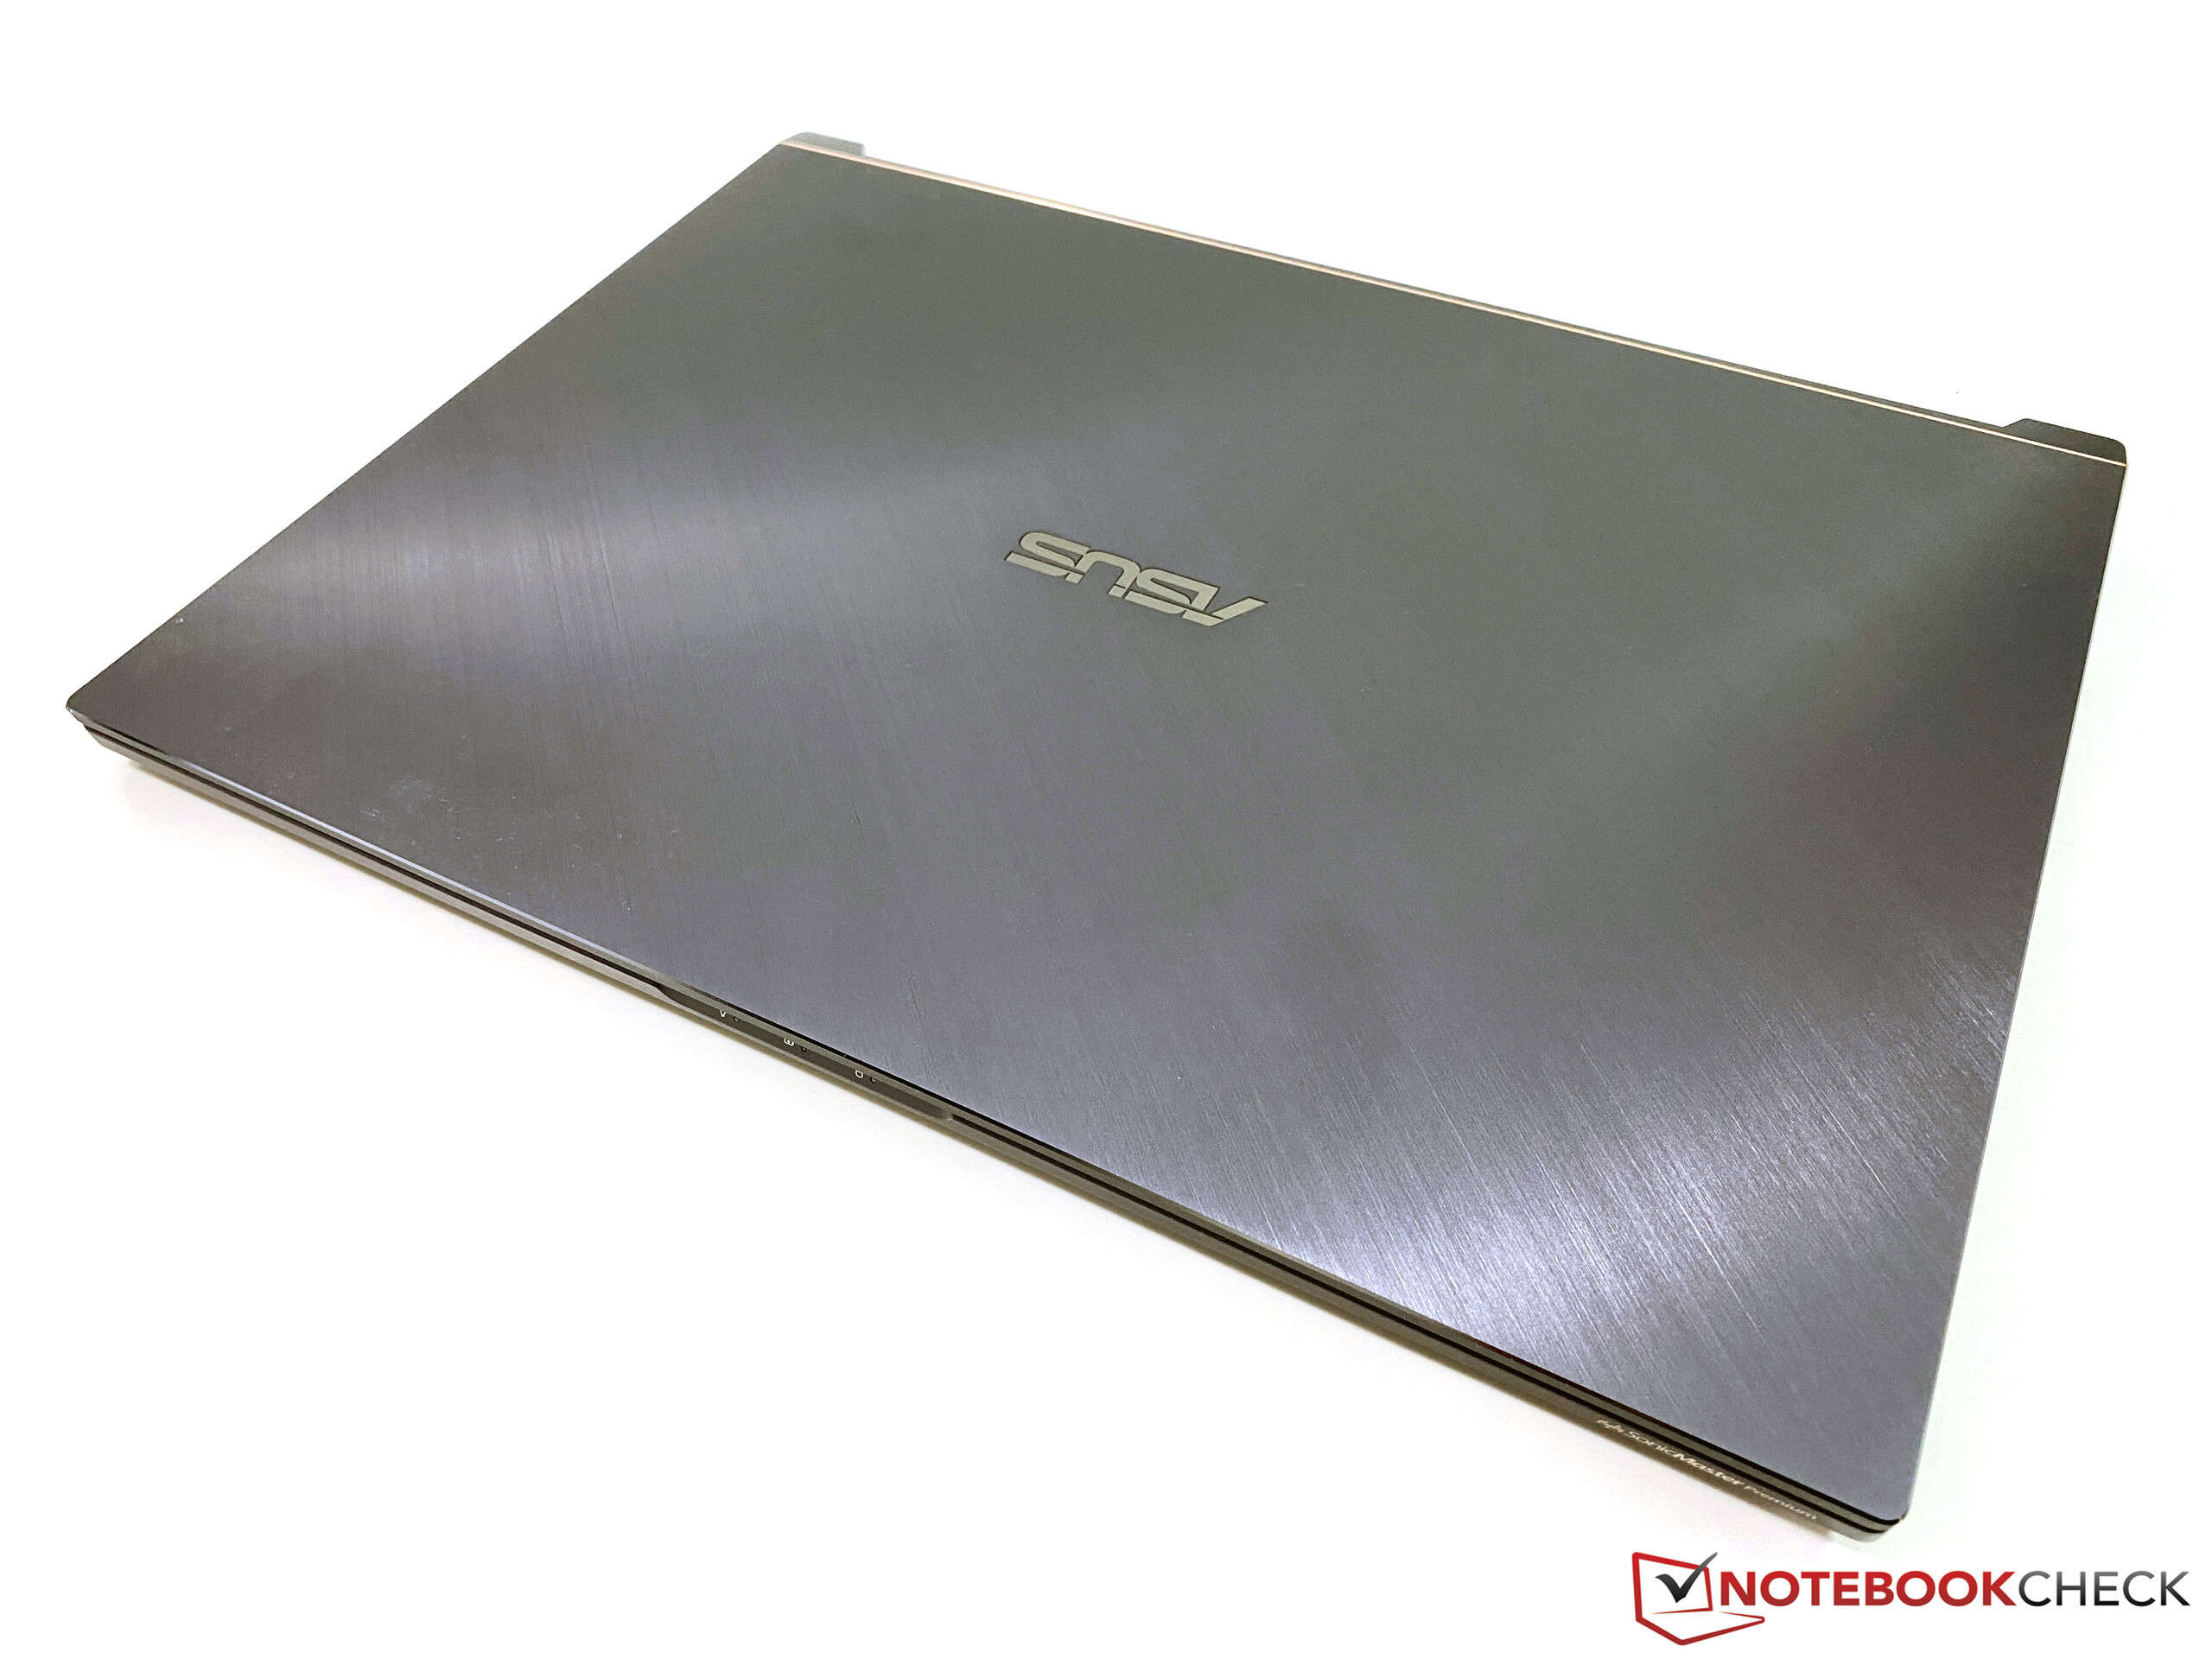
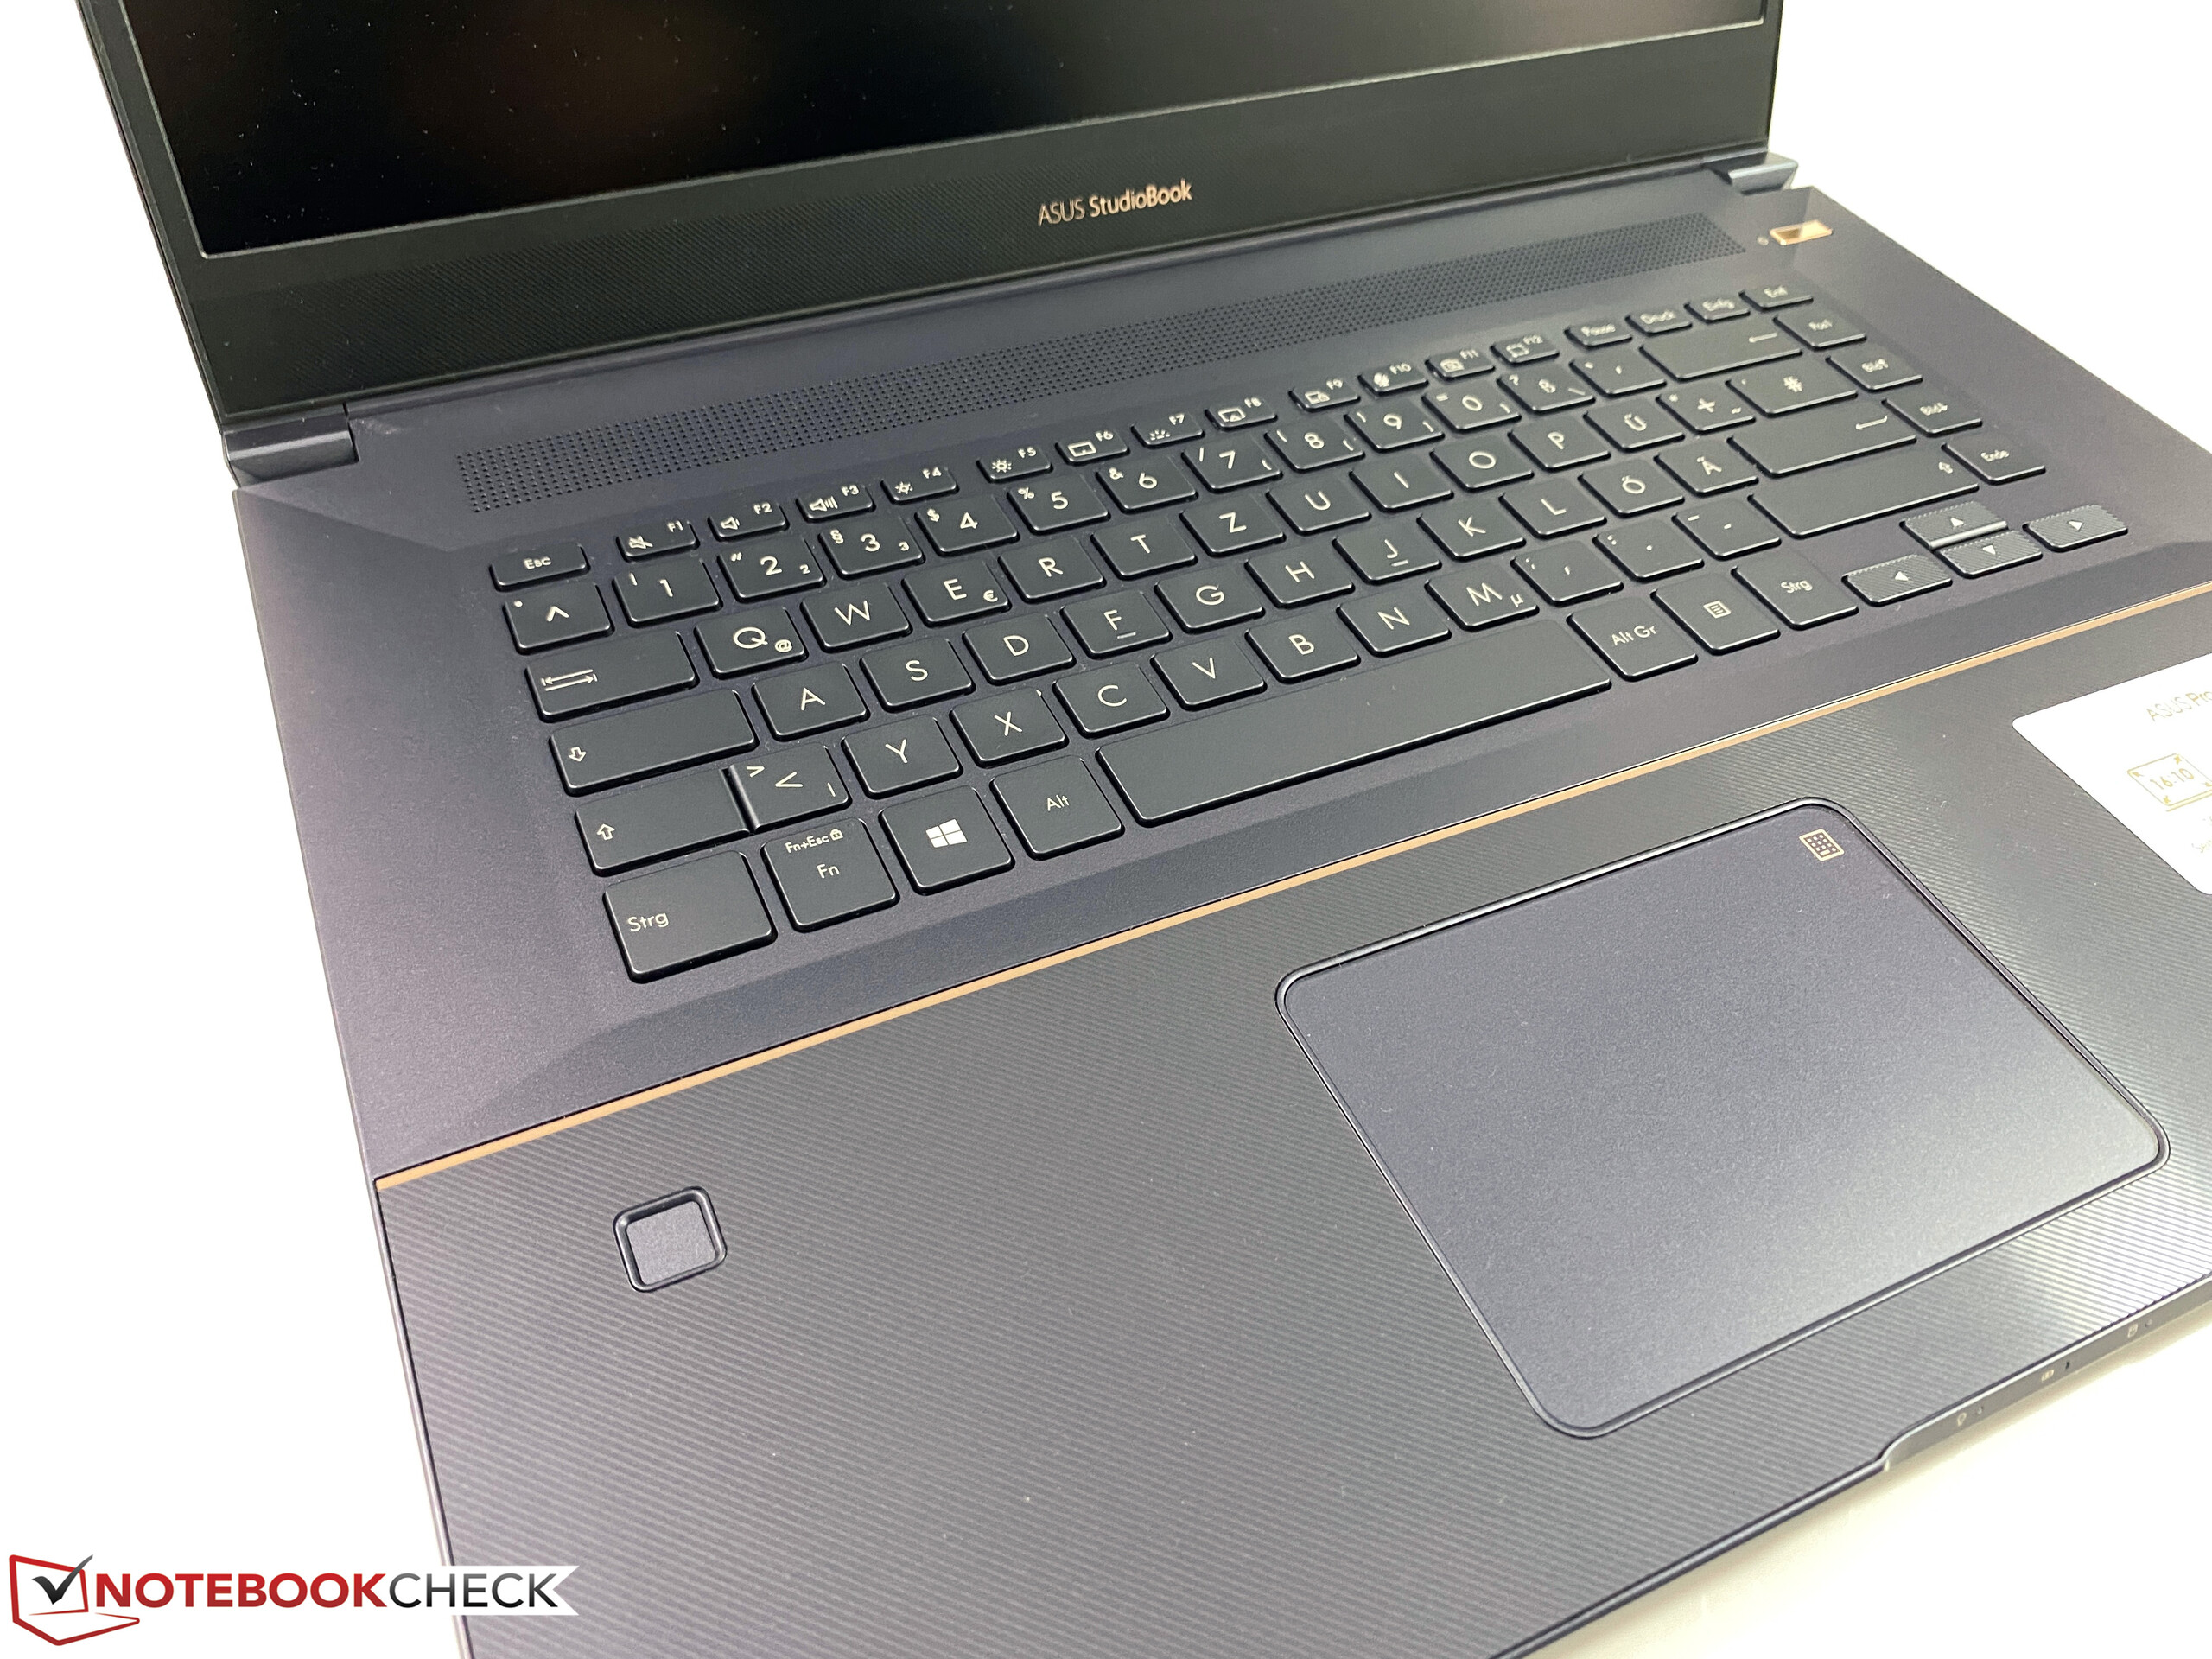
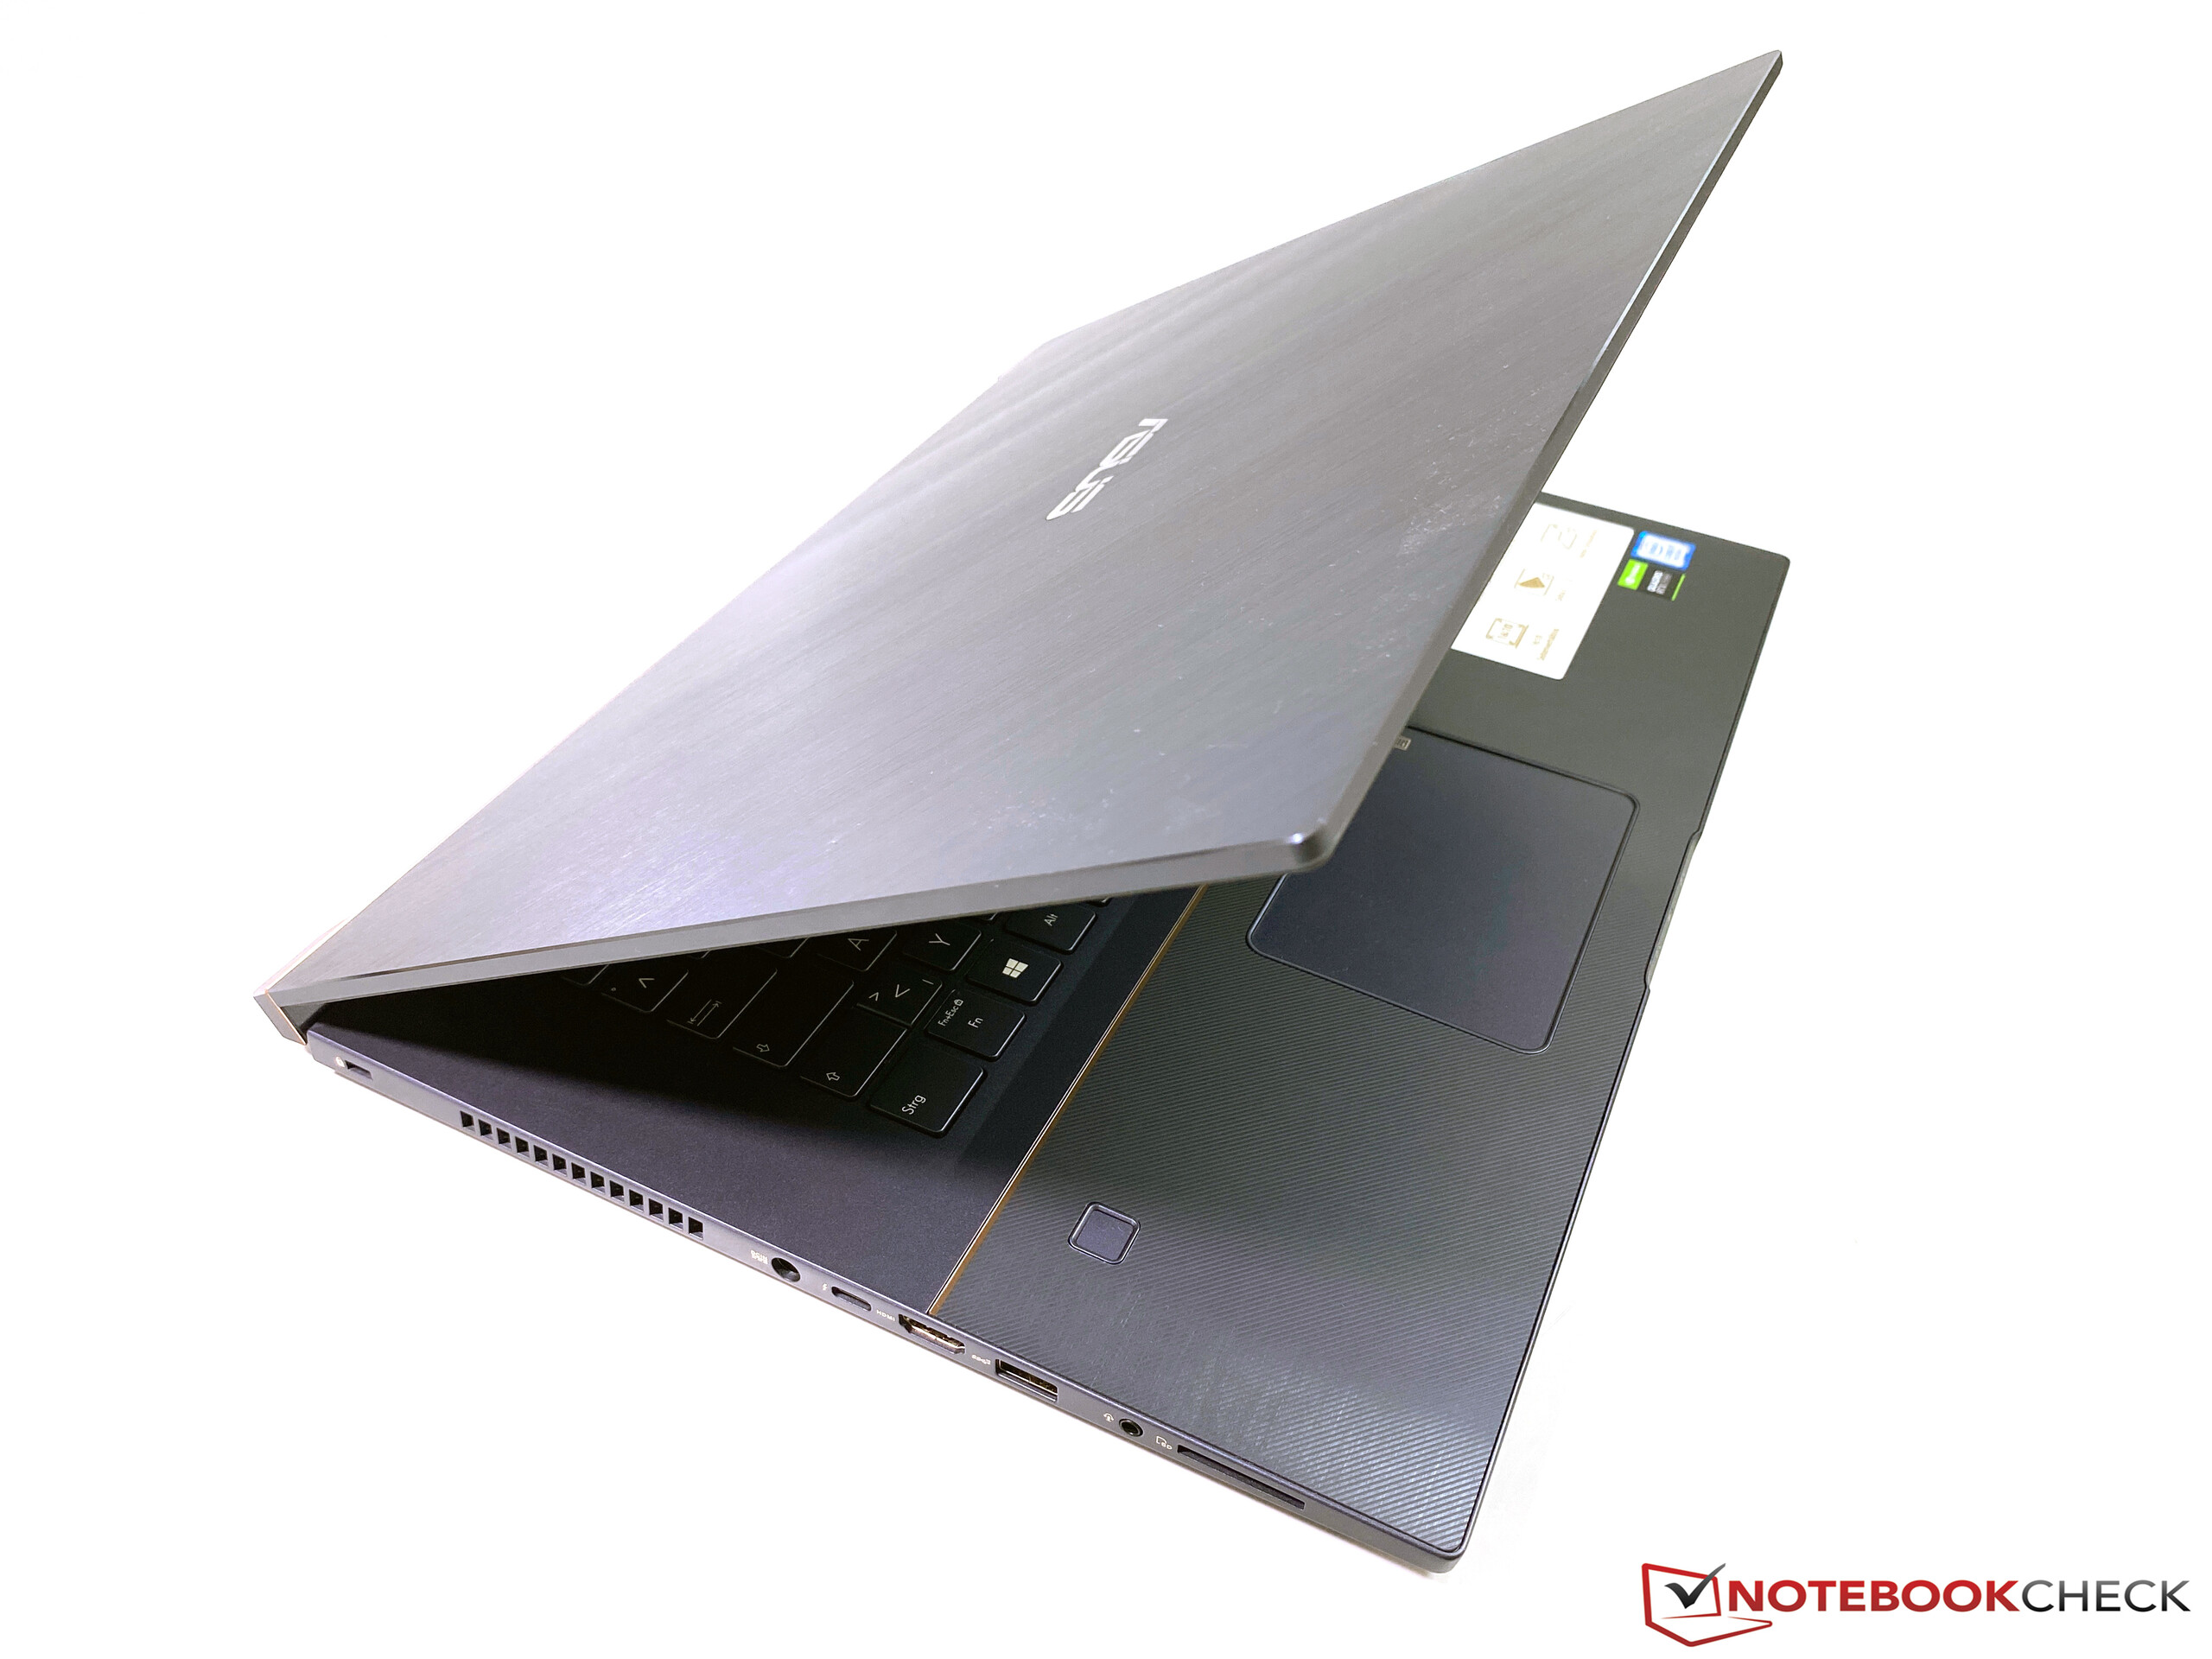
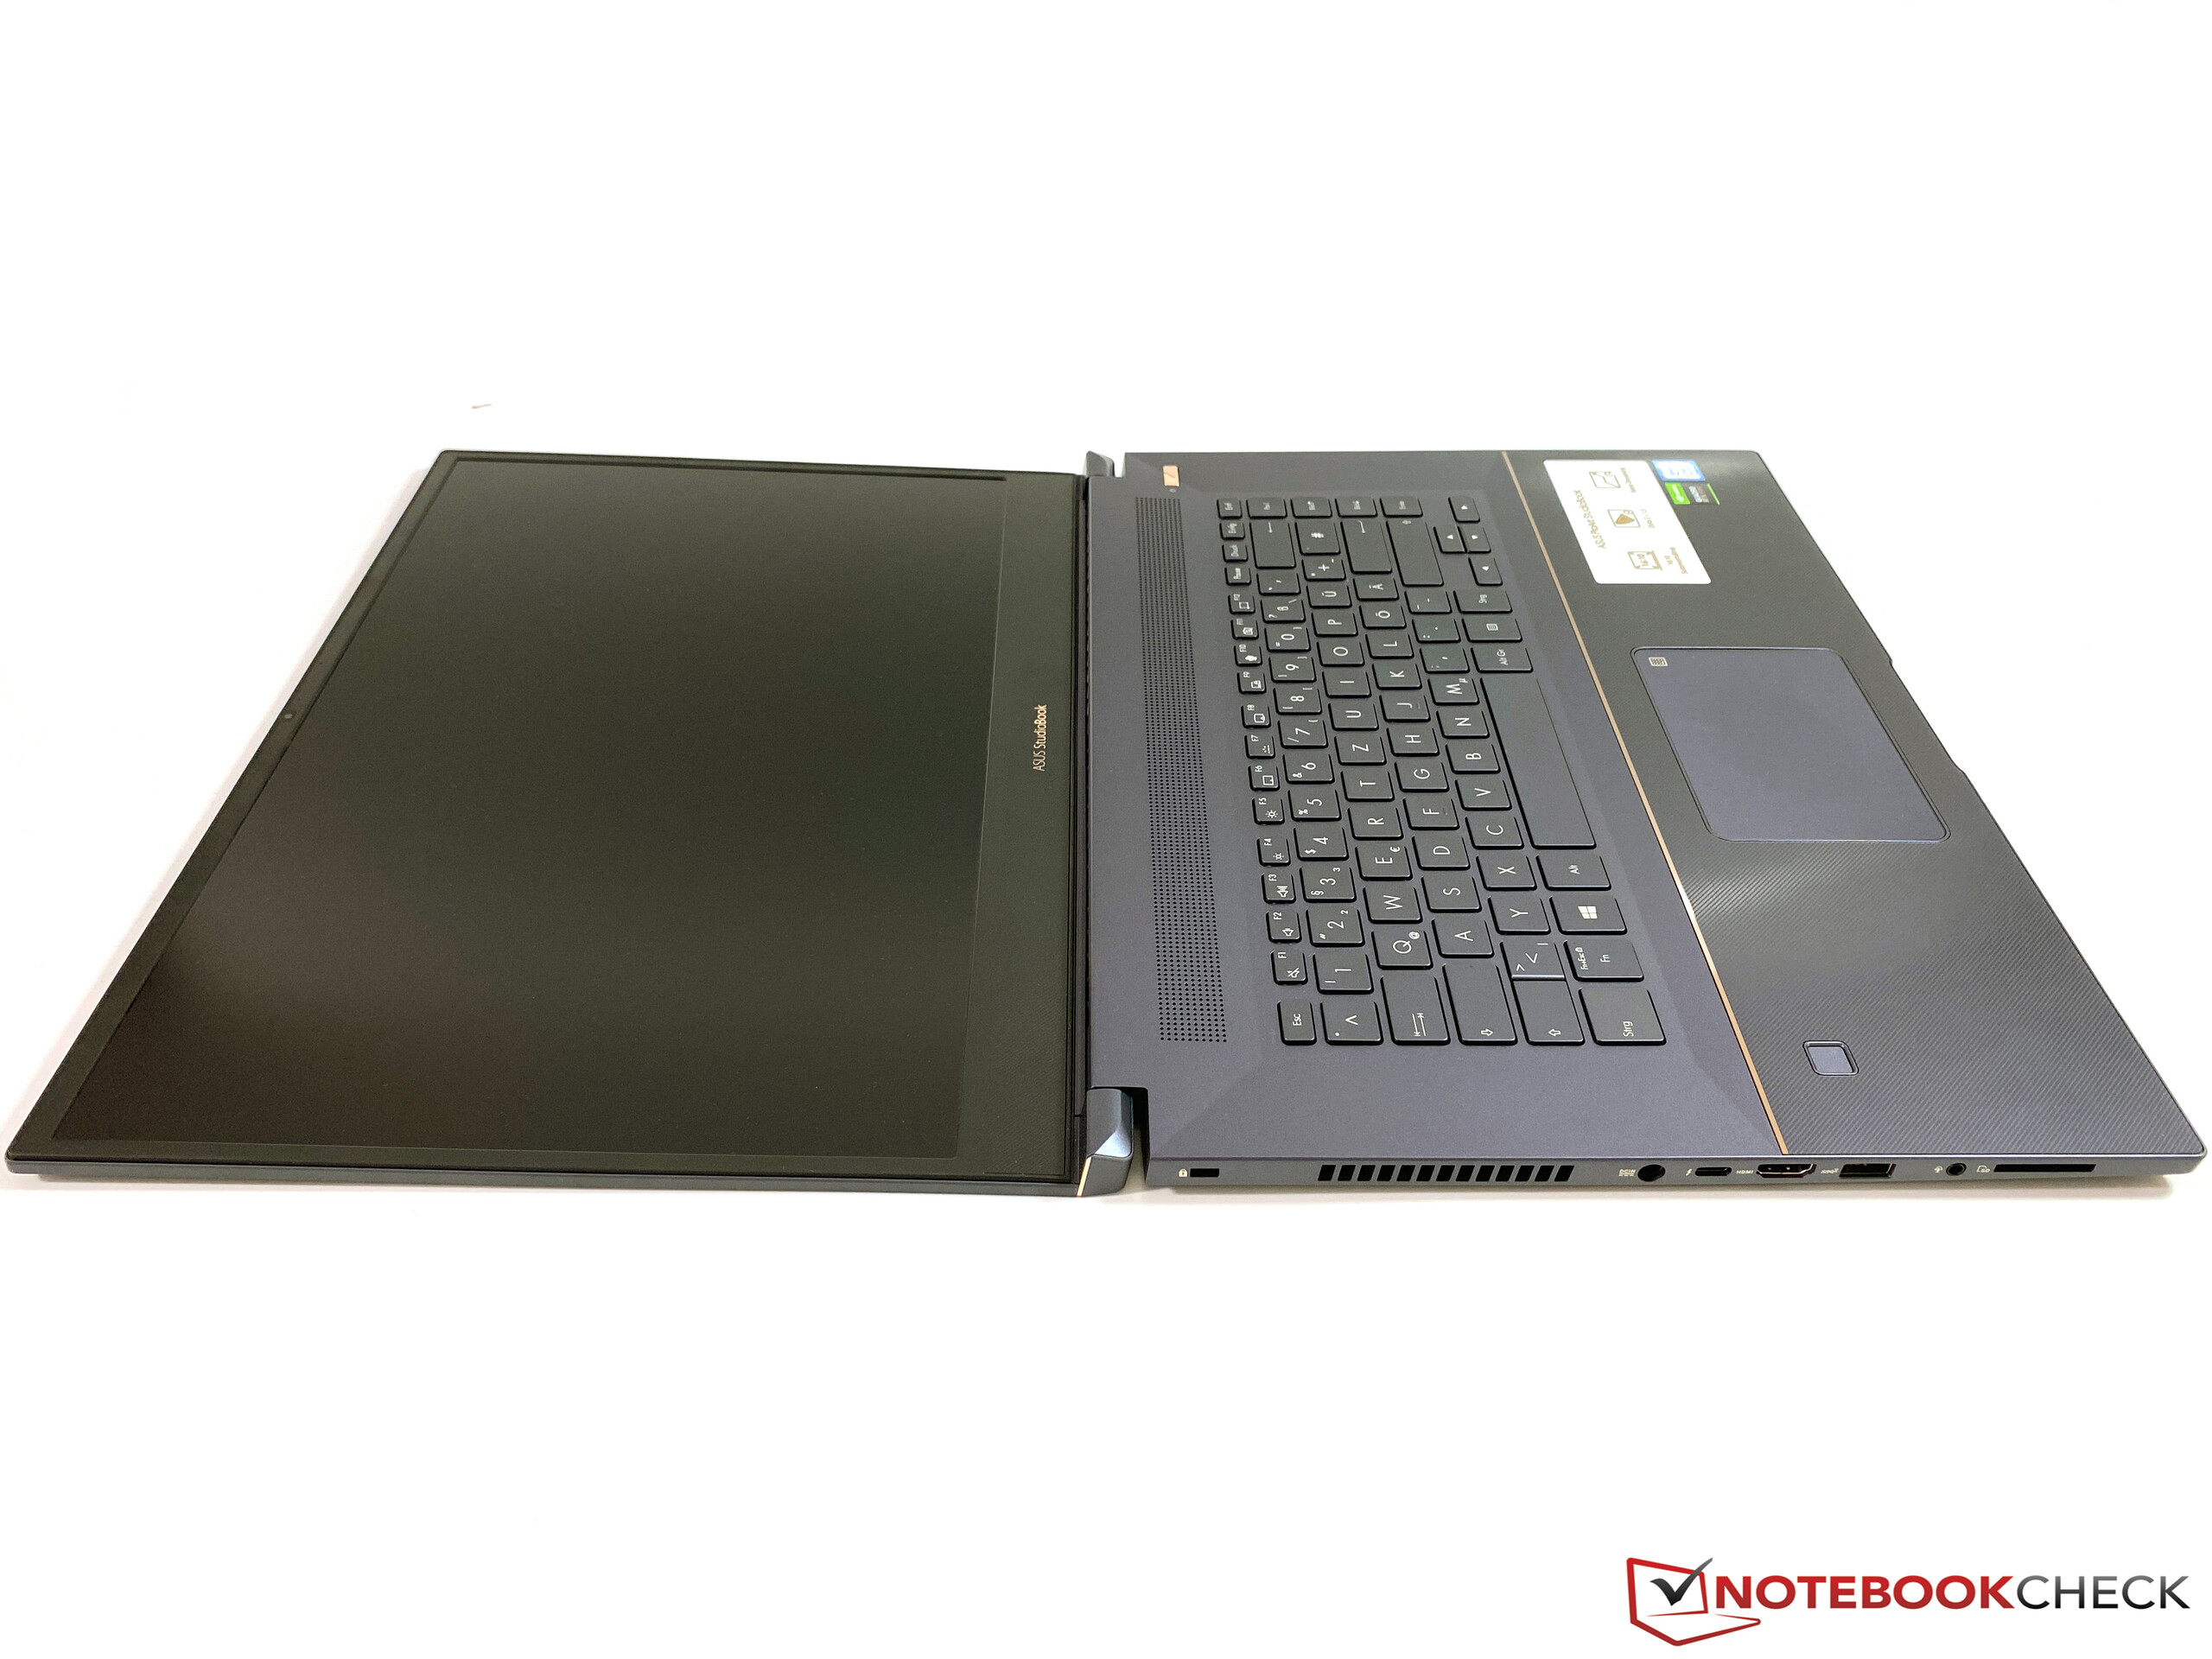
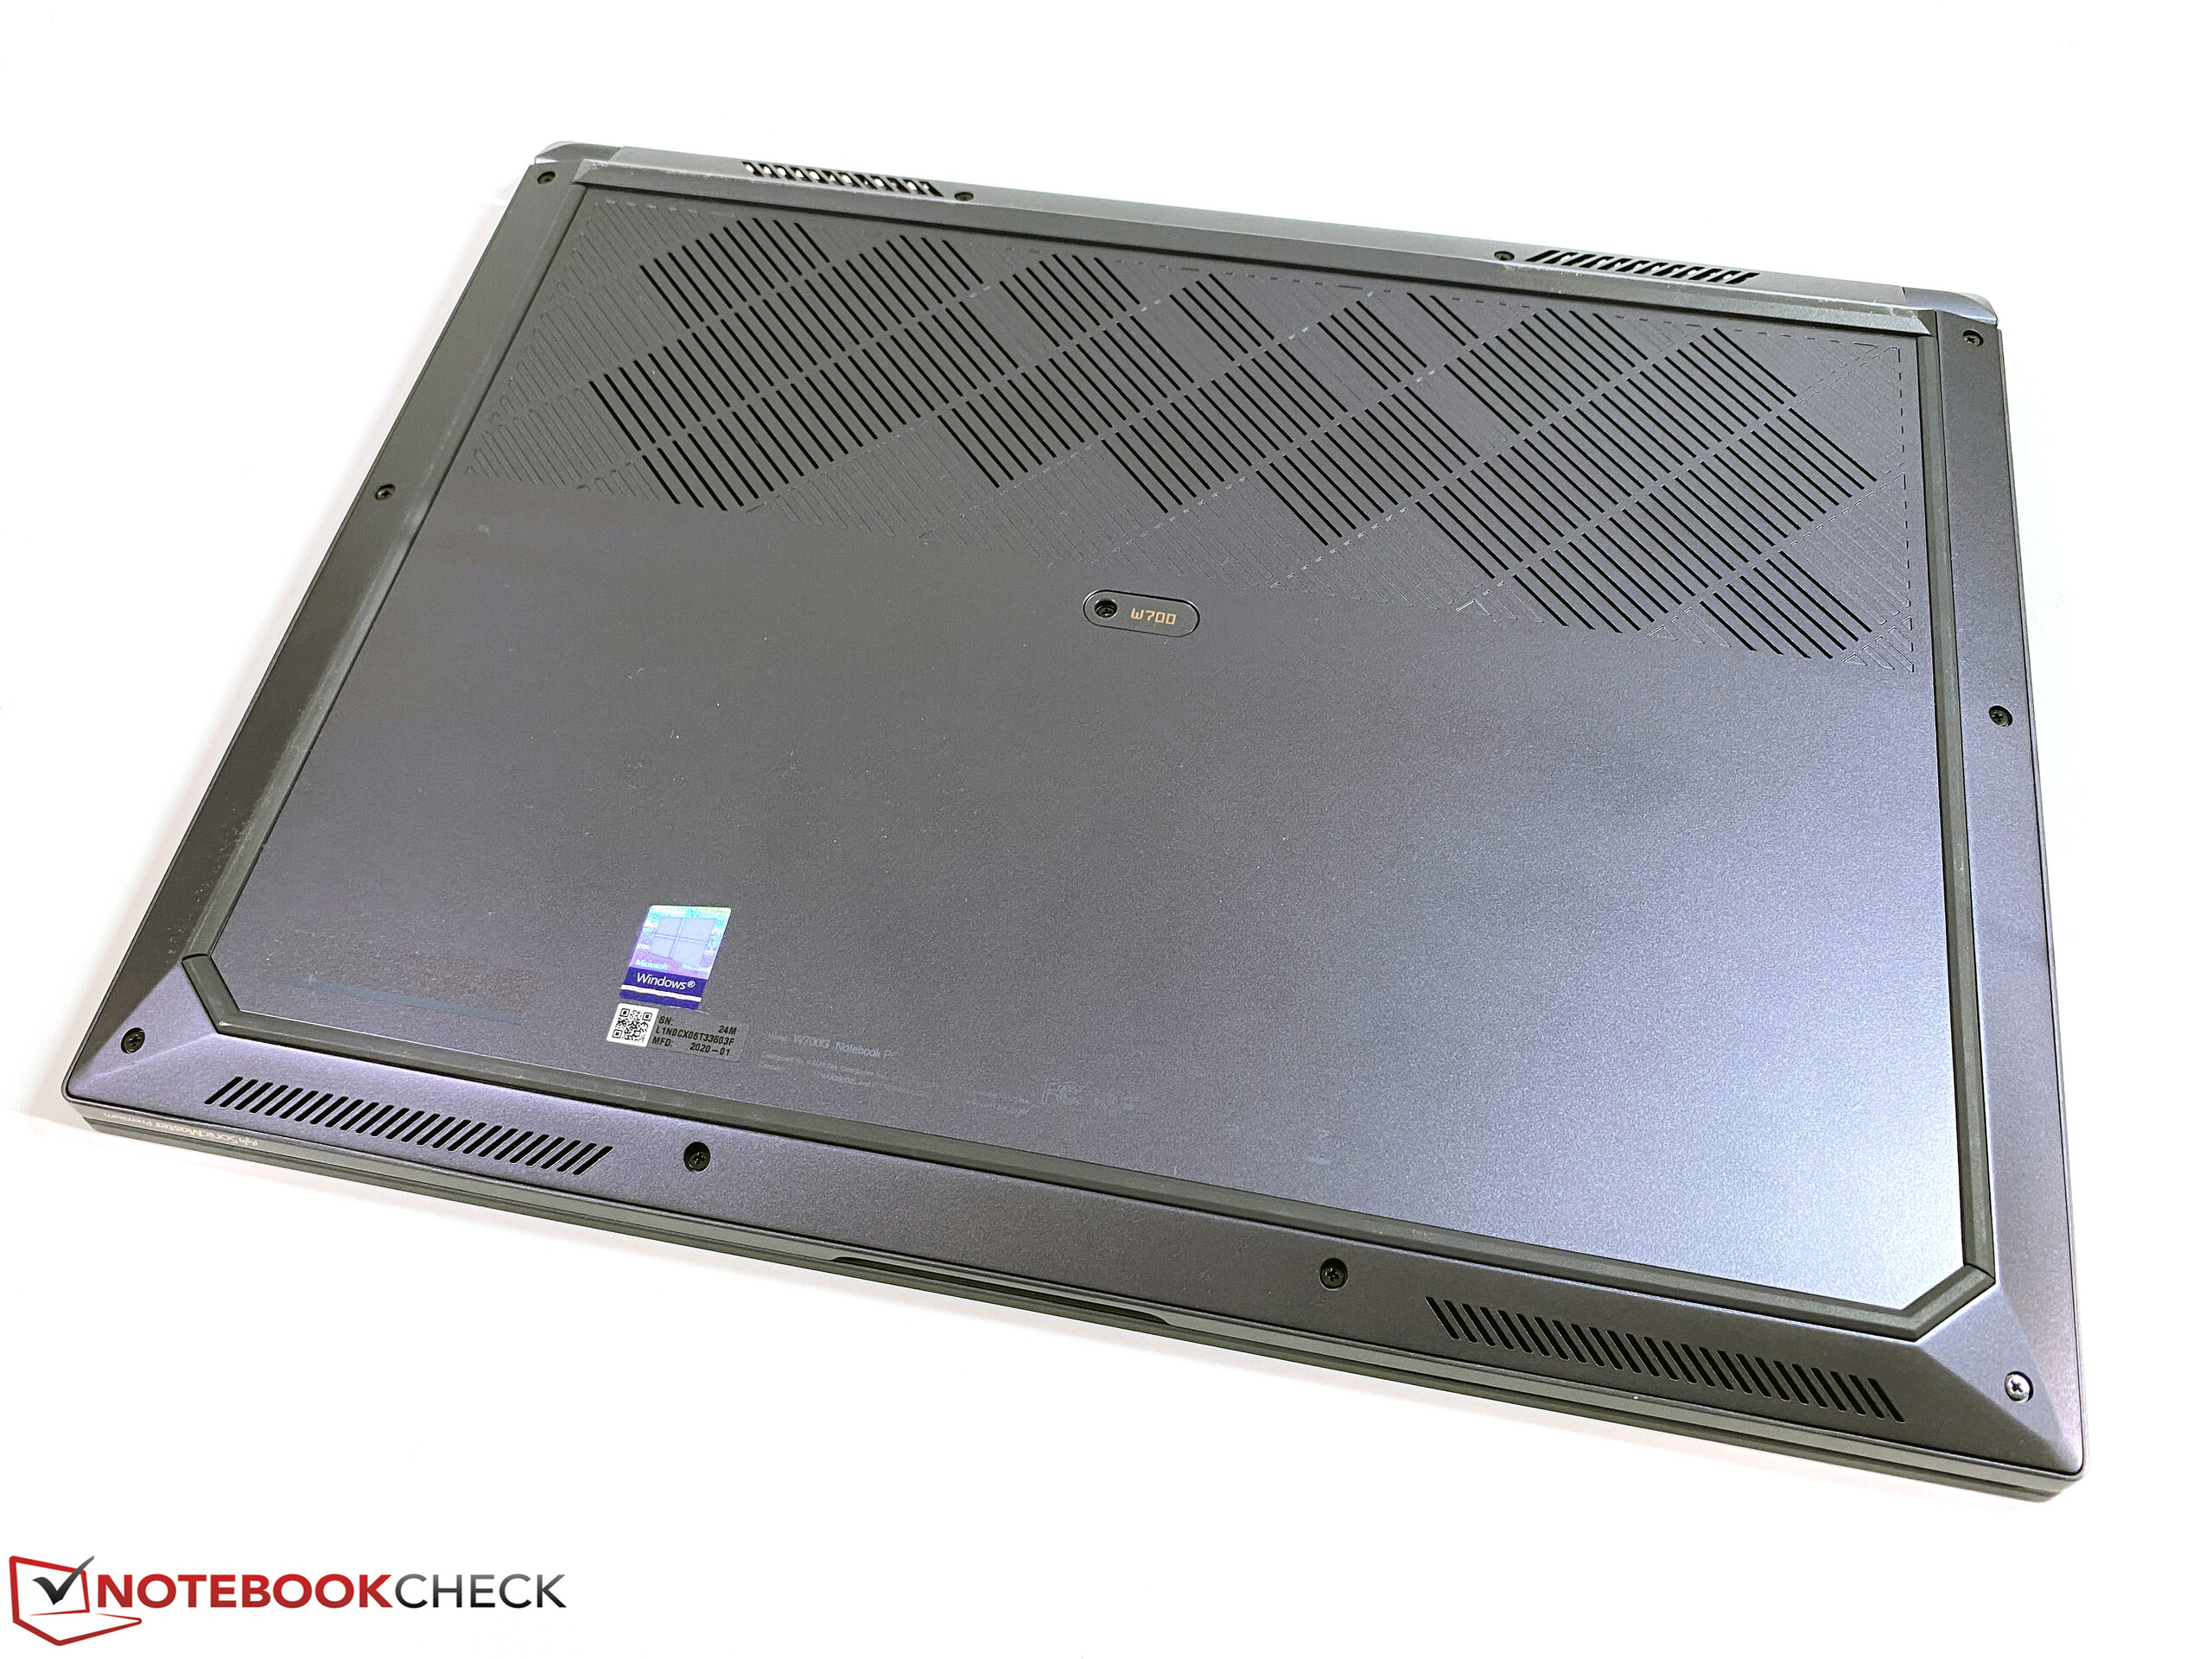
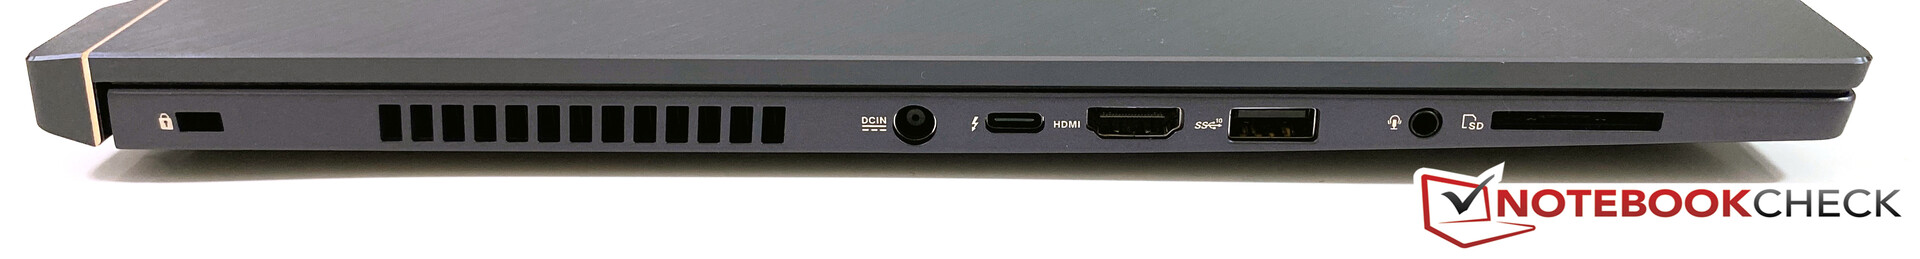
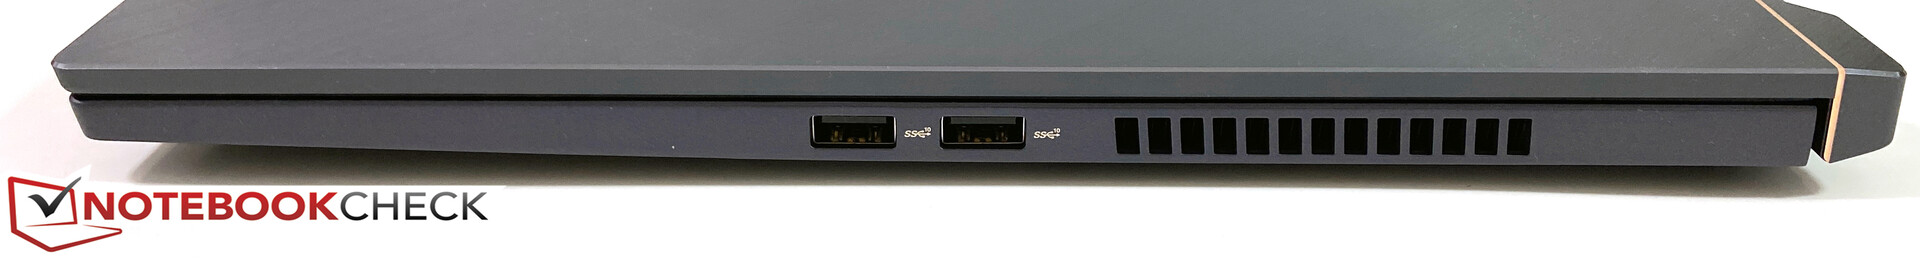
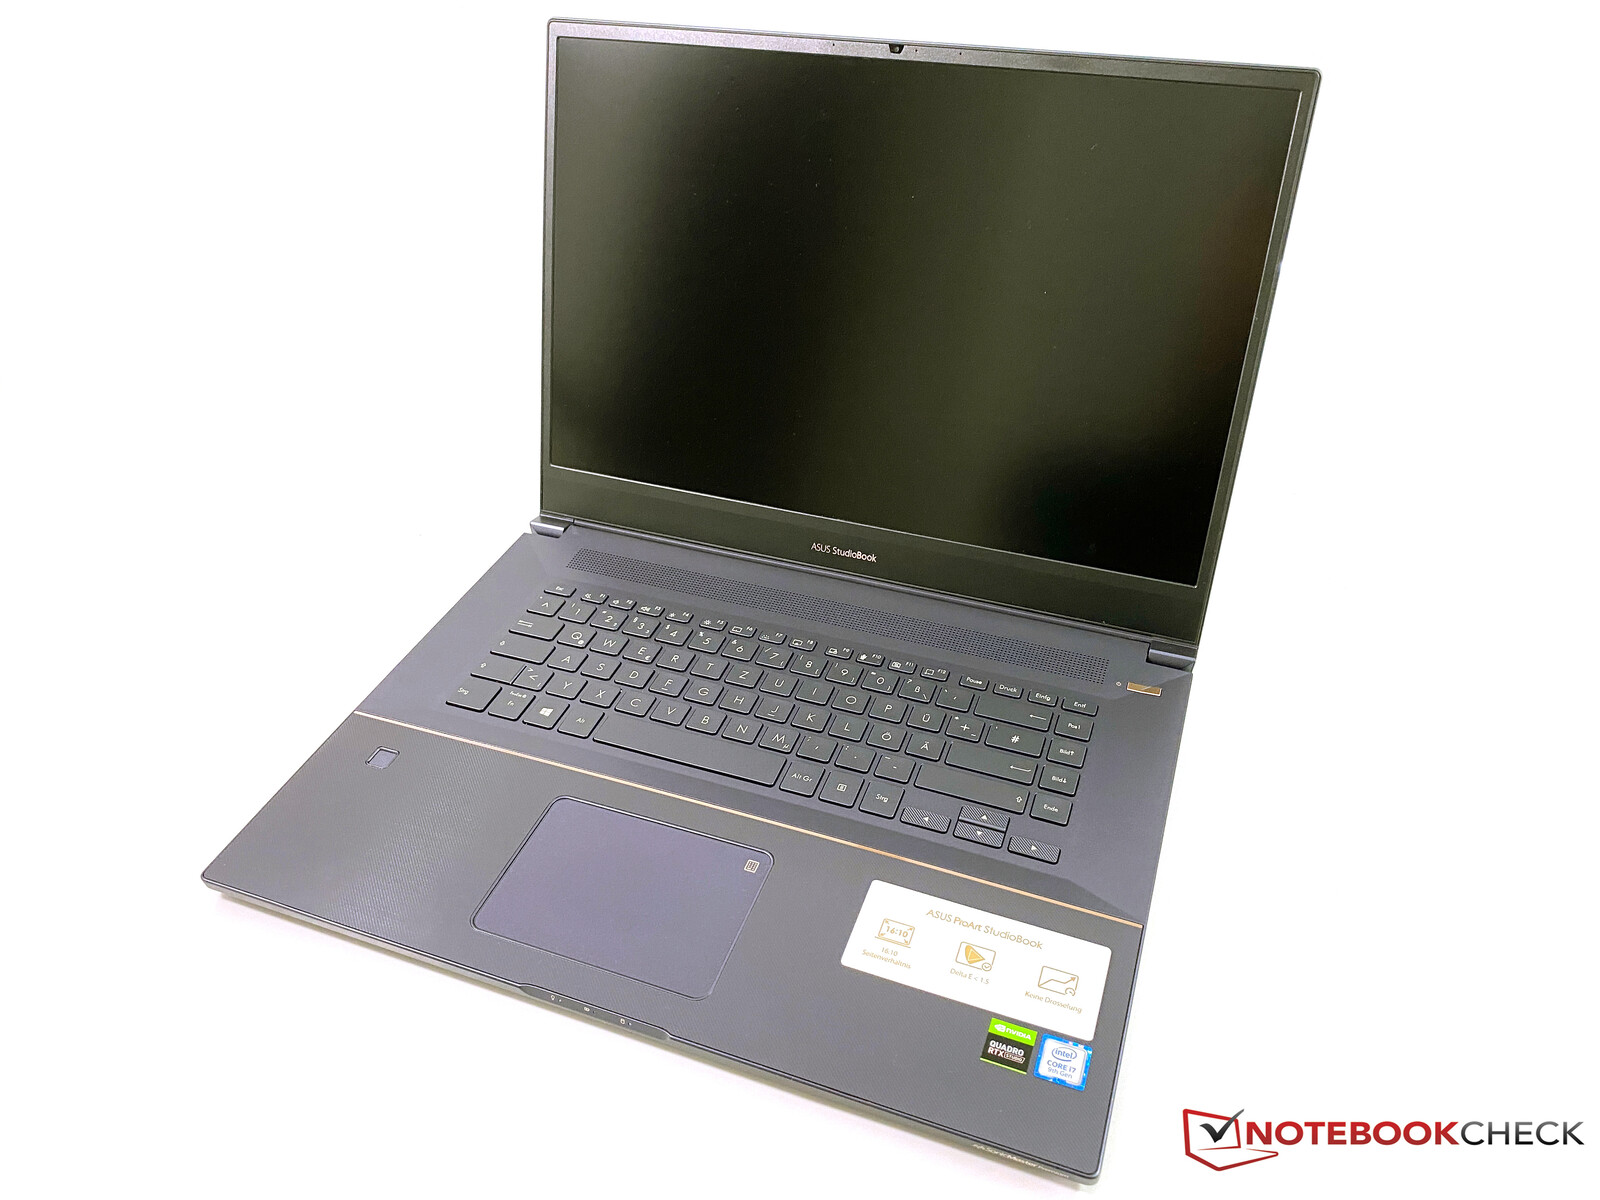
Asus probeert de StudioBook Pro 17 te verkopen aan professionals en de zogenaamde contentcreators. Het 17-inch notebook overtuigt met een slank, maar stevig chassis, maar sommige details moeten nog worden verbeterd. Zo is de indeling van de poorten, en vooral de voedingsaansluiting in het midden van de linkerzijde, in onze testperiode herhaaldelijk hinderlijk geweest. De poorten zijn behoorlijk, maar er is ook een compromis. In plaats van een speciaal numeriek toetsenbord (er zou voldoende ruimte zijn), krijg je een vrij klein touchpad met een numpadfunctie.
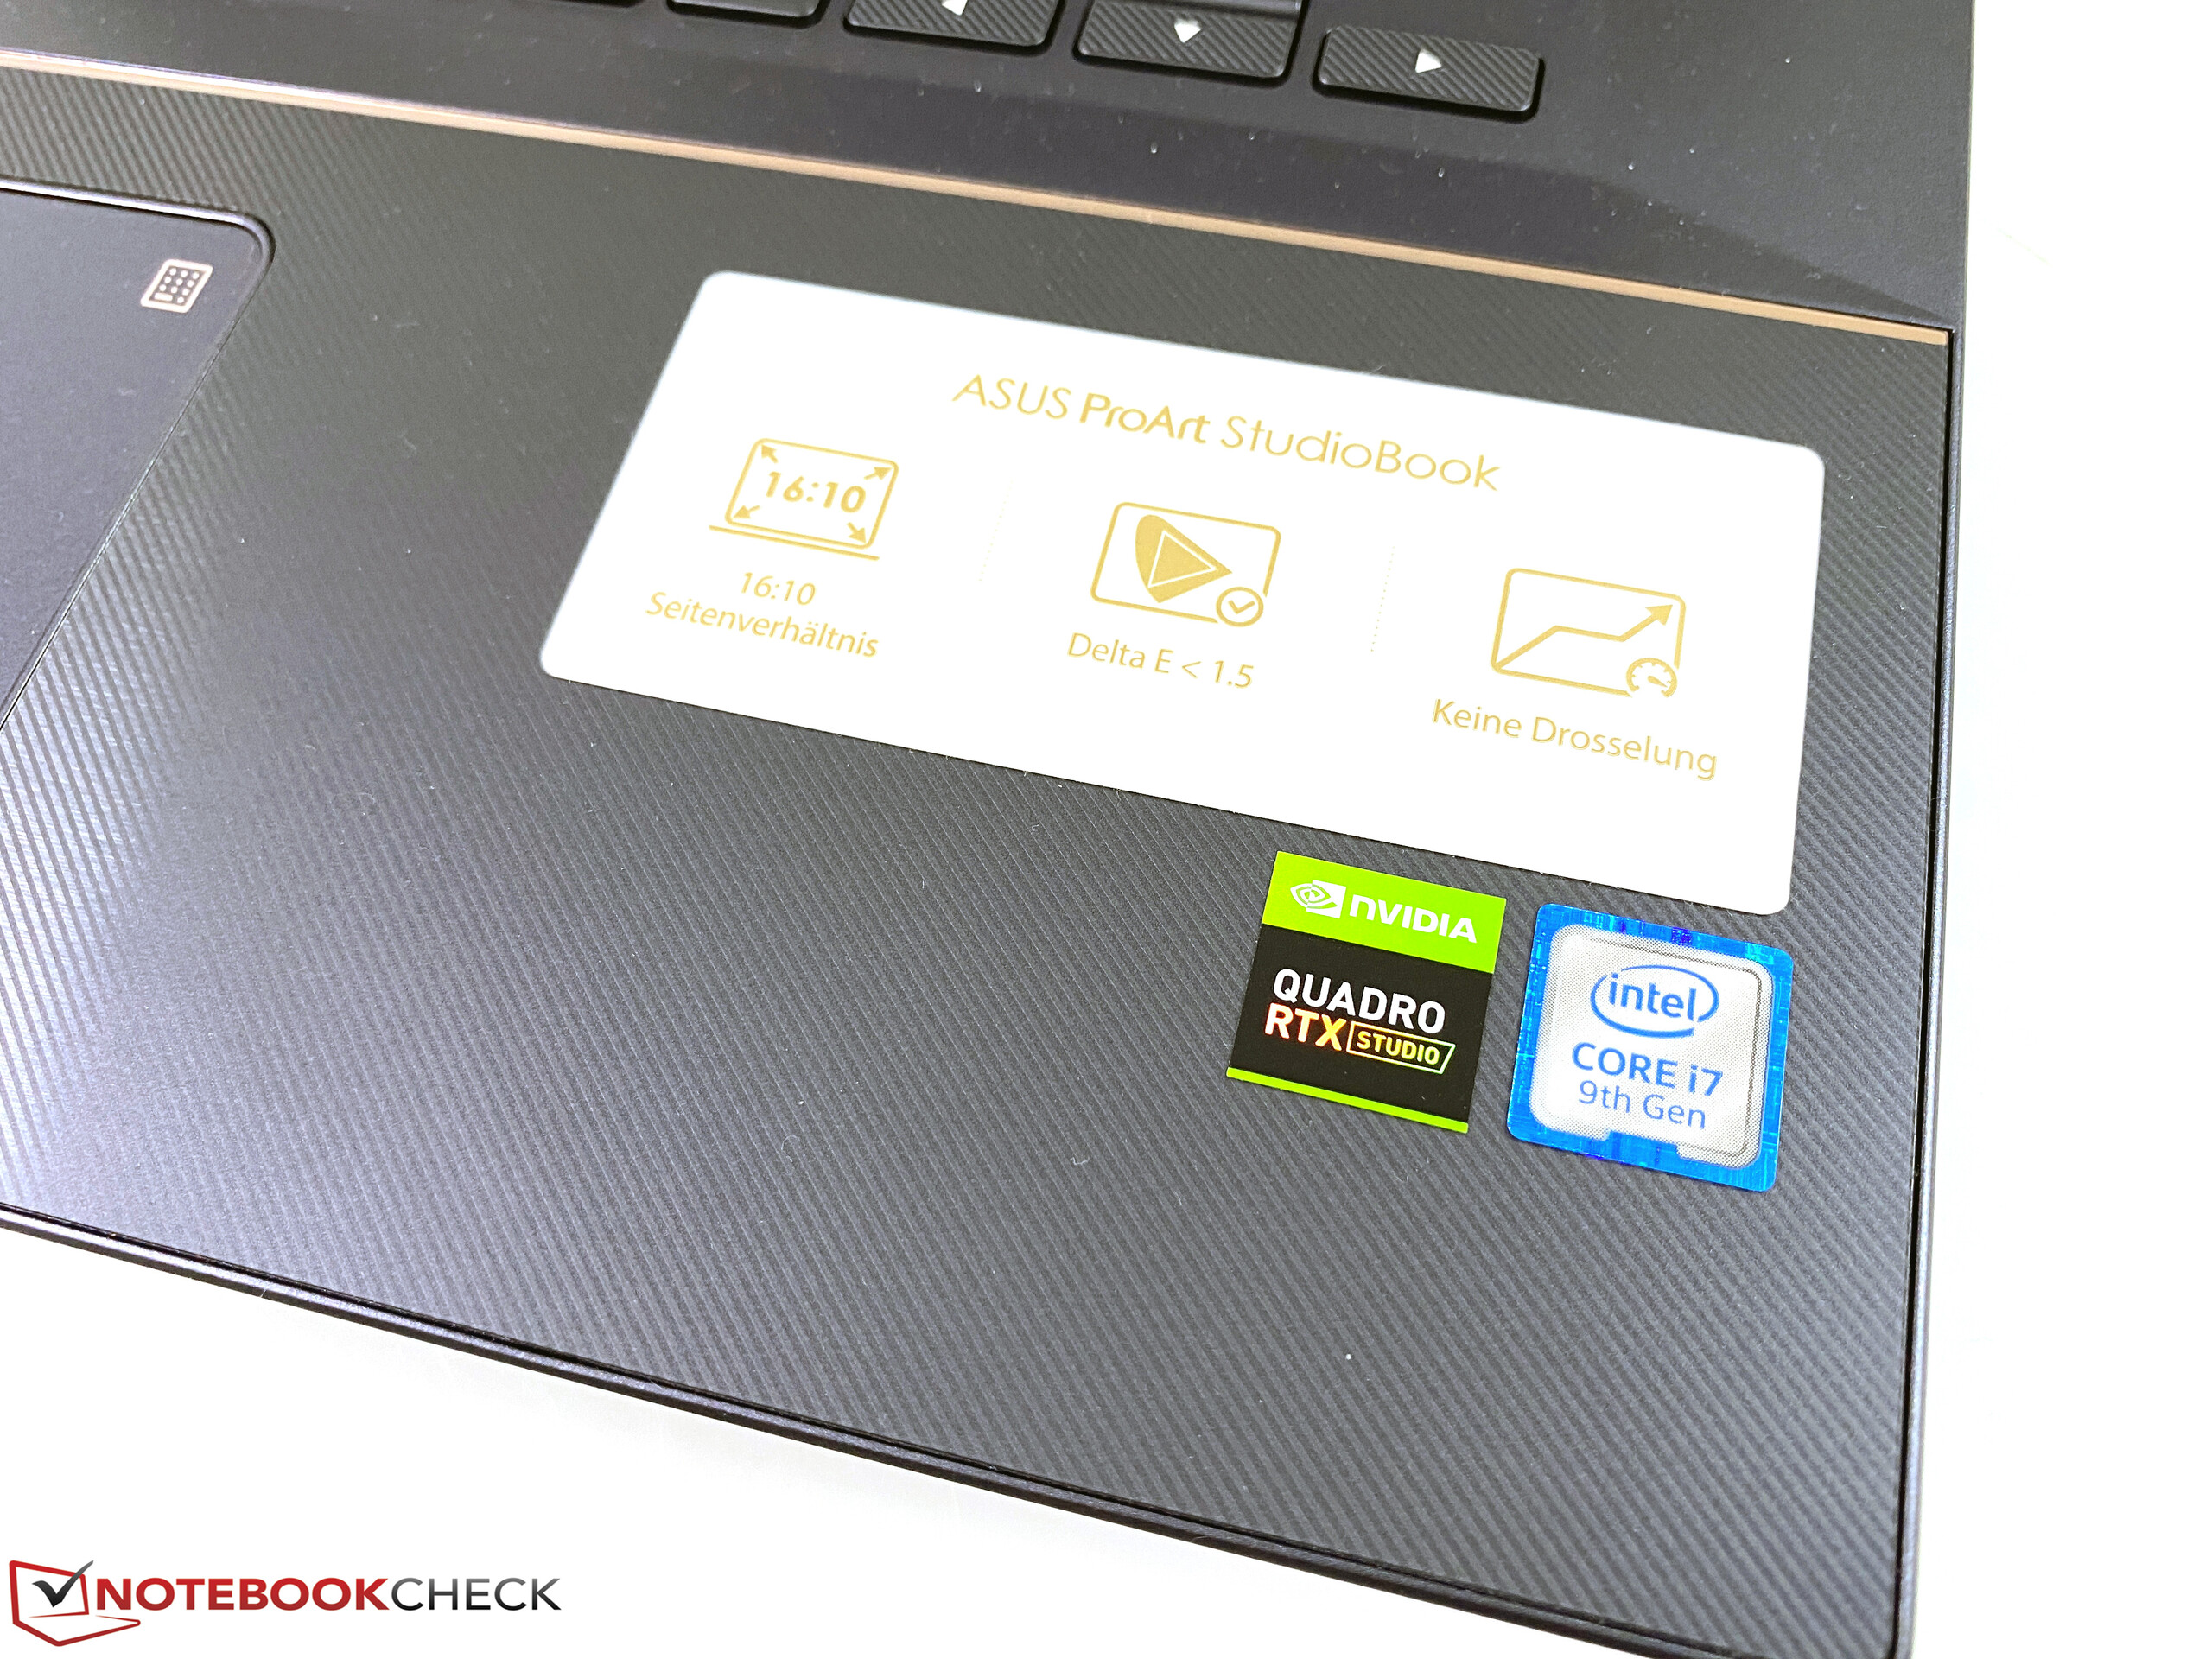
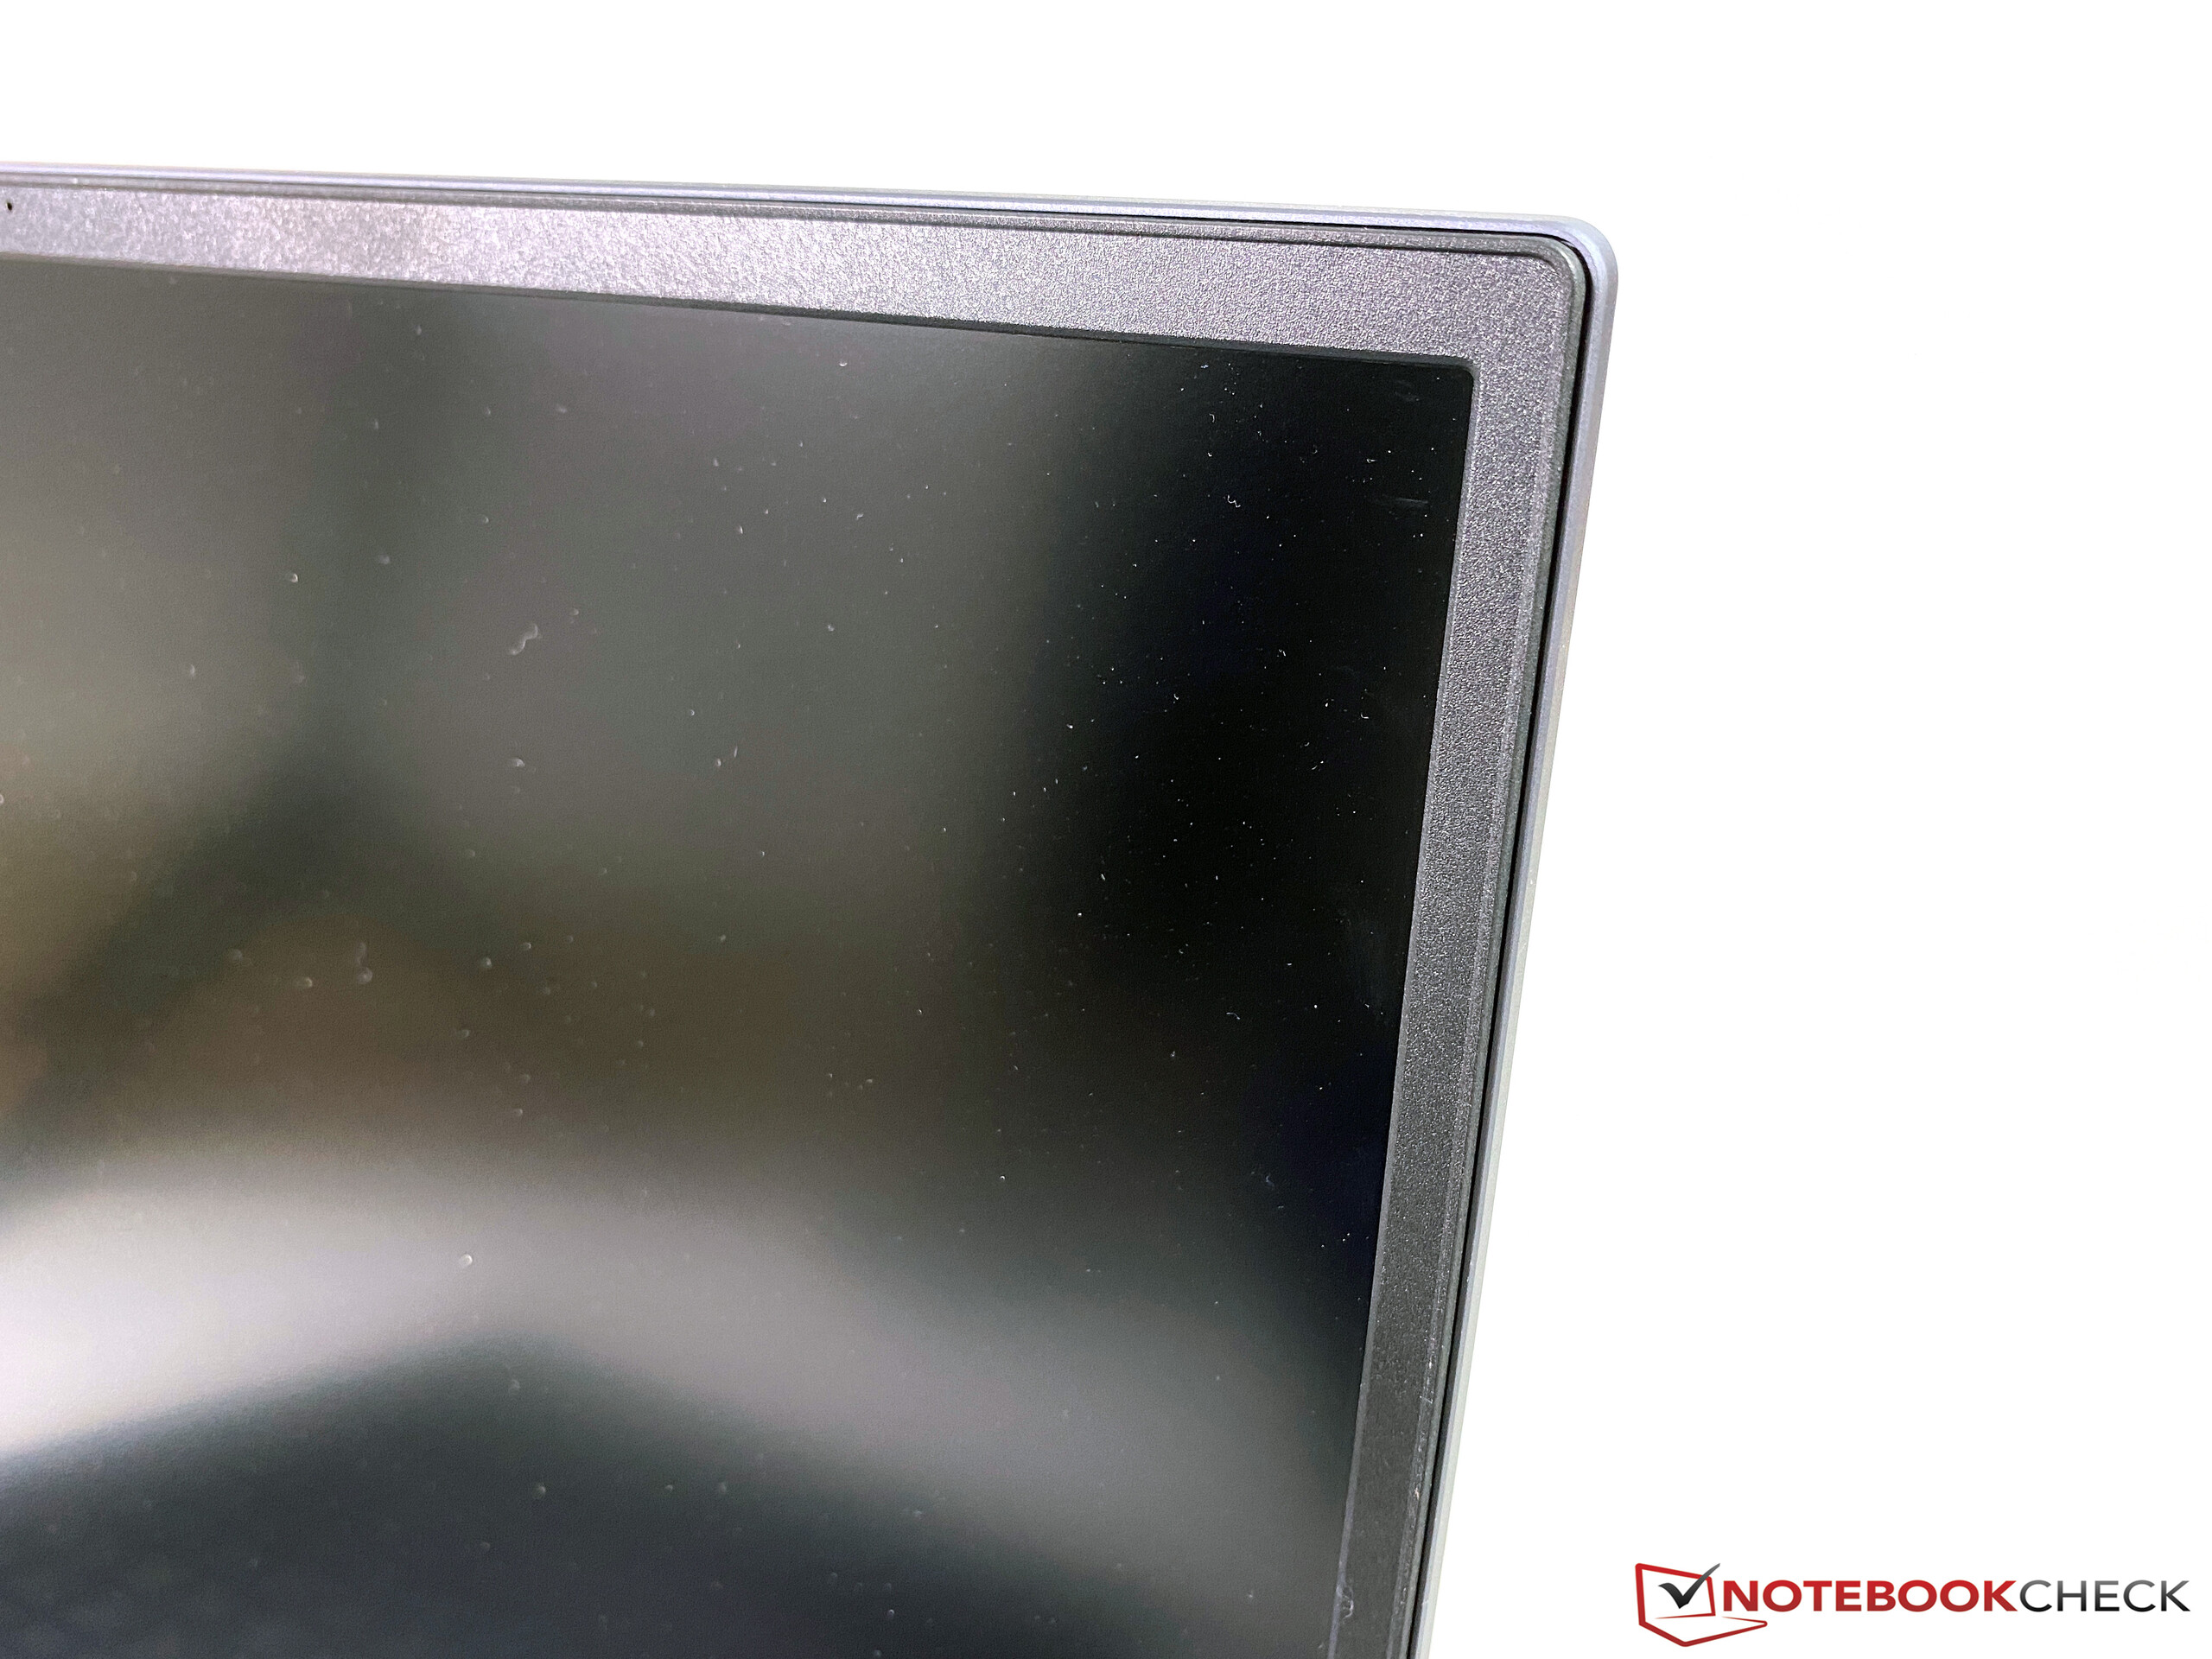
Het beeldscherm laat ook gemengde indrukken achter. We vinden het prettig dat het een mat 16:10 paneel is, dat door de fabrikant zeer goed is gekalibreerd voor het P3-gamma. De basismetingen (luminantie, zwarte waarde, contrast) zijn echter nogal teleurstellend gezien de hoge prijs en er zijn geen andere weergavemogelijkheden.
Een goede eerste poging, maar veel kleine dingen beïnvloeden de algemene indruk, vooral met het oog op de hoge prijs. We zouden graag zien dat de opvolger meer verfijnd wordt met betrekking tot de prestatieprofielen en de ventilatorregeling.
De prestaties, of preciezer gezegd de prestatiebenutting van de componenten is goed op het lichtnet, maar de ventilatorprofielen in de MyAsus app zijn niet erg goed geoptimaliseerd. De standaard "Auto" instelling houdt de ventilatoren zeer stil (ook onder belasting), maar de prestaties zijn lager, vooral wanneer je beide componenten tegelijkertijd belast. Het "Turbo"-profiel daarentegen is extreem gevoelig voor belastingsveranderingen, wat in de praktijk al snel vervelend is. We zouden ook graag een implementatie zien van de instellingen met de Windows performance slider.
Al met al is de StudioBook Pro 17 nog steeds een goed mobiel werkstation, maar de prijs van bijna 3900 euro (~$4227) is vrij hoog. Andere fabrikanten bieden ook krachtigere GPU's aan in hun slanke werkstations.
Asus ProArt StudioBook Pro 17 W700G3T
- 06-05-2020 v7 (old)
Andreas Osthoff
Price comparison
