Dell Precision 7670 werkstation review: Core i7-12850HX en CAMM RAM-debuut

De Precision 7000 serie is de thuisbasis van Dell's vlaggenschip mobiele werkstations in tegenstelling tot de midrange Precision 5000 serie of budget Precision 3000 serie. De Precision 7670 is het eerste 16-inch model in de familie en zit tussen de 15,6-inch Precision 7560 en 17,3-inch Precision 7760 in. Verwarrend genoeg produceert Dell twee varianten van de Precision 7670, genaamd de "Performance base" en "Thin base". Deze specifieke review gaat over de "Thin base" variant met de "Performance base" review komt later.
De opties zijn zeer uitgebreid, van de Core i5-12600HX tot de i9-12950HX, Iris Xe graphics tot de discrete Nvidia RTX A5500, FHD IPS tot 4K OLED scherm, en zelfs SODIMM of CAMM RAM tot 128 GB. Onze specifieke review unit is een midrange configuratie met de i7-12850HX, 95 W RTX A2000, en 4K OLED touchscreen voor ongeveer 4100 USD.
Er zijn momenteel helaas geen Xeon of ECC RAM opties voor de Precision 7670, maar vPro wordt ondersteund op alle SKU's.
Er zijn op dit moment weinig directe concurrenten, omdat de 16-inch workstationruimte nog relatief nieuw is. Huidige alternatieven zijn de Asus ProArt StudioBook Pro 16, Lenovo ThinkPad P1 G4en de HP ZBook Fury 16.
Meer Dell beoordelingen:
Potentiële concurrenten in vergelijking
Evaluatie | Datum | Model | Gewicht | Hoogte | Formaat | Resolutie | Beste prijs |
|---|---|---|---|---|---|---|---|
| 88.4 % v7 (old) | 10-2022 | Dell Precision 7670 i7-12850HX, RTX A2000 Laptop GPU | 2.7 kg | 24.7 mm | 16.00" | 3840x2400 | |
| 89.3 % v7 (old) | Lenovo ThinkPad P1 G4-20Y4Z9DVUS i7-11800H, T1200 Laptop GPU | 1.8 kg | 17.7 mm | 16.00" | 2560x1600 | ||
v (old) | 12-2021 | Asus ProArt StudioBook 16 W7600H5A-2BL2 W-11955M, RTX A5000 Laptop GPU | 2.4 kg | 21.4 mm | 16.00" | 3840x2400 | |
| 88.3 % v7 (old) | 10-2021 | Dell Precision 5000 5560 i7-11850H, RTX A2000 Laptop GPU | 2 kg | 18 mm | 15.60" | 3840x2400 | |
| 87.8 % v7 (old) | 08-2020 | Dell Precision 7550 W-10885M, Quadro RTX 5000 Max-Q | 2.8 kg | 27.36 mm | 15.60" | 3840x2160 | |
| 90.3 % v7 (old) | 10-2021 | HP ZBook Fury 15 G8 i9-11950H, RTX A5000 Laptop GPU | 2.5 kg | 25.9 mm | 15.60" | 3840x2160 |
Zaak - Klassiek Precision Kijk en voel
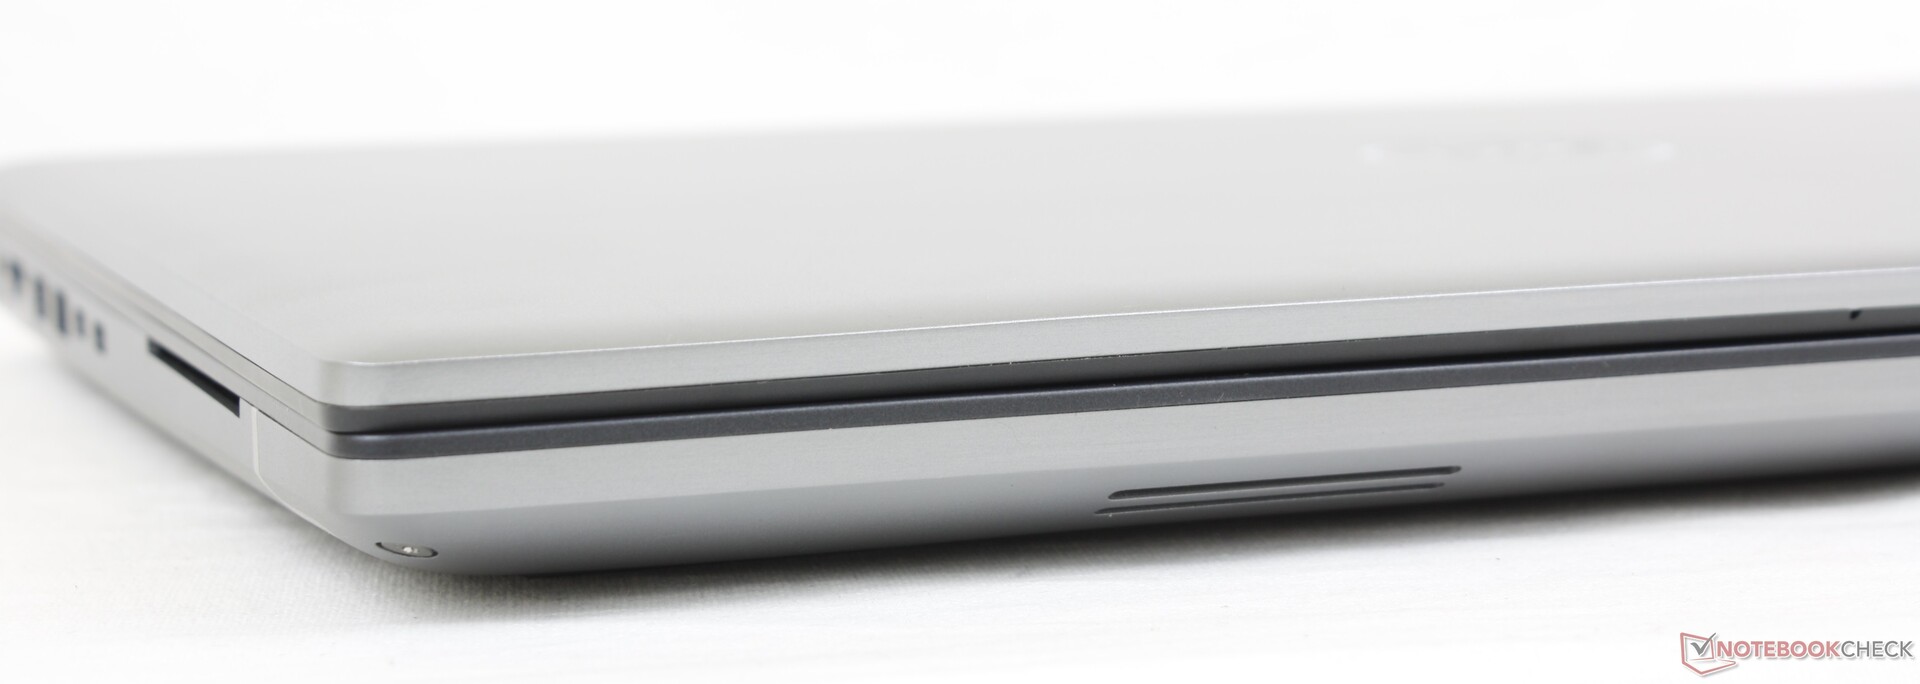
Chassisontwerp en materialen komen nauw overeen met die van de 2020 Precision 7550. Het zwarte toetsenbord, bijvoorbeeld, is nog steeds licht rubberen voor een premium gevoel, terwijl de buitenste metalen skelet blijft dik voor sterkere eerste indrukken dan de ThinkPad P1 G4 of Asus ProArt StudioBook. Druk uitoefenen op het toetsenbord centrum of buitenste deksel zal hun oppervlakken iets meer vervormen dan op een HP ZBook Studio, maar we kunnen verder geen kraken of grote zwakke plekken opmerken.

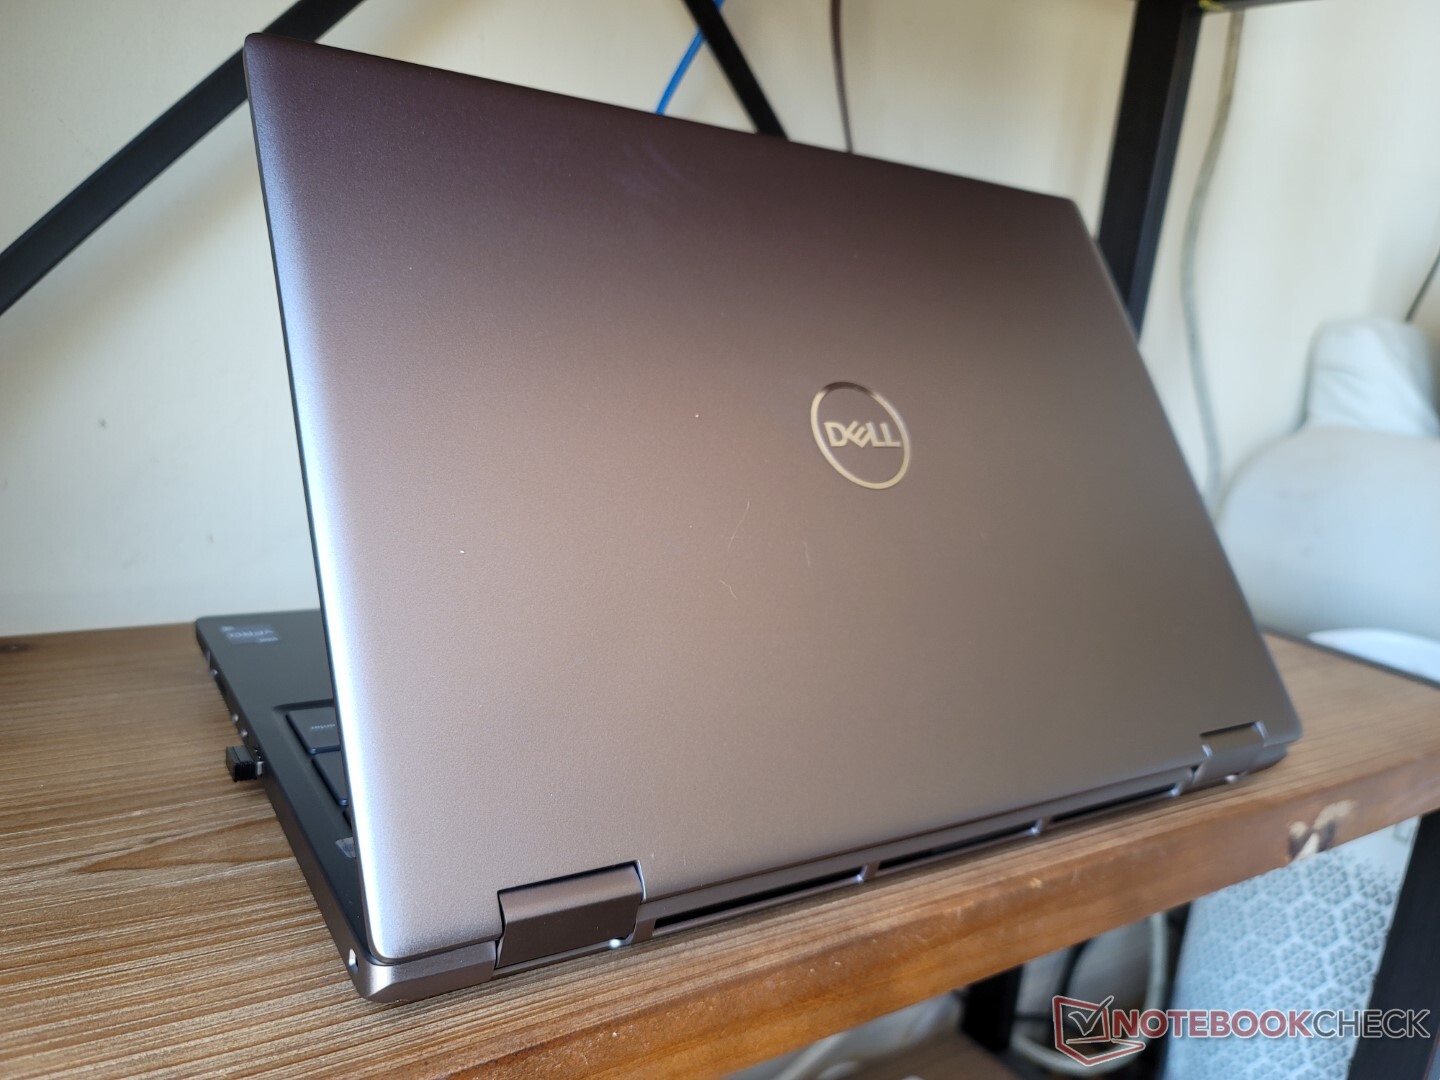
De Precision 7670 is nog steeds relatief groot en zwaar, ondanks dat onze testunit de "Thin base" versie is. Met een dikte van 24,7 mm is het systeem dikker dan de Asus ProArt StudioBook 16 en net een haartje dunner dan de HP ZBook Fury 15 G8. Het is ook veel zwaarder met enkele honderden grammen per stuk, deels door de grotere 16-inch 16:10 vormfactor.
De "Performance base" is ongeveer 3 mm dikker en minstens 70 g zwaarder dan de "Thin base", afhankelijk van de configuratie.
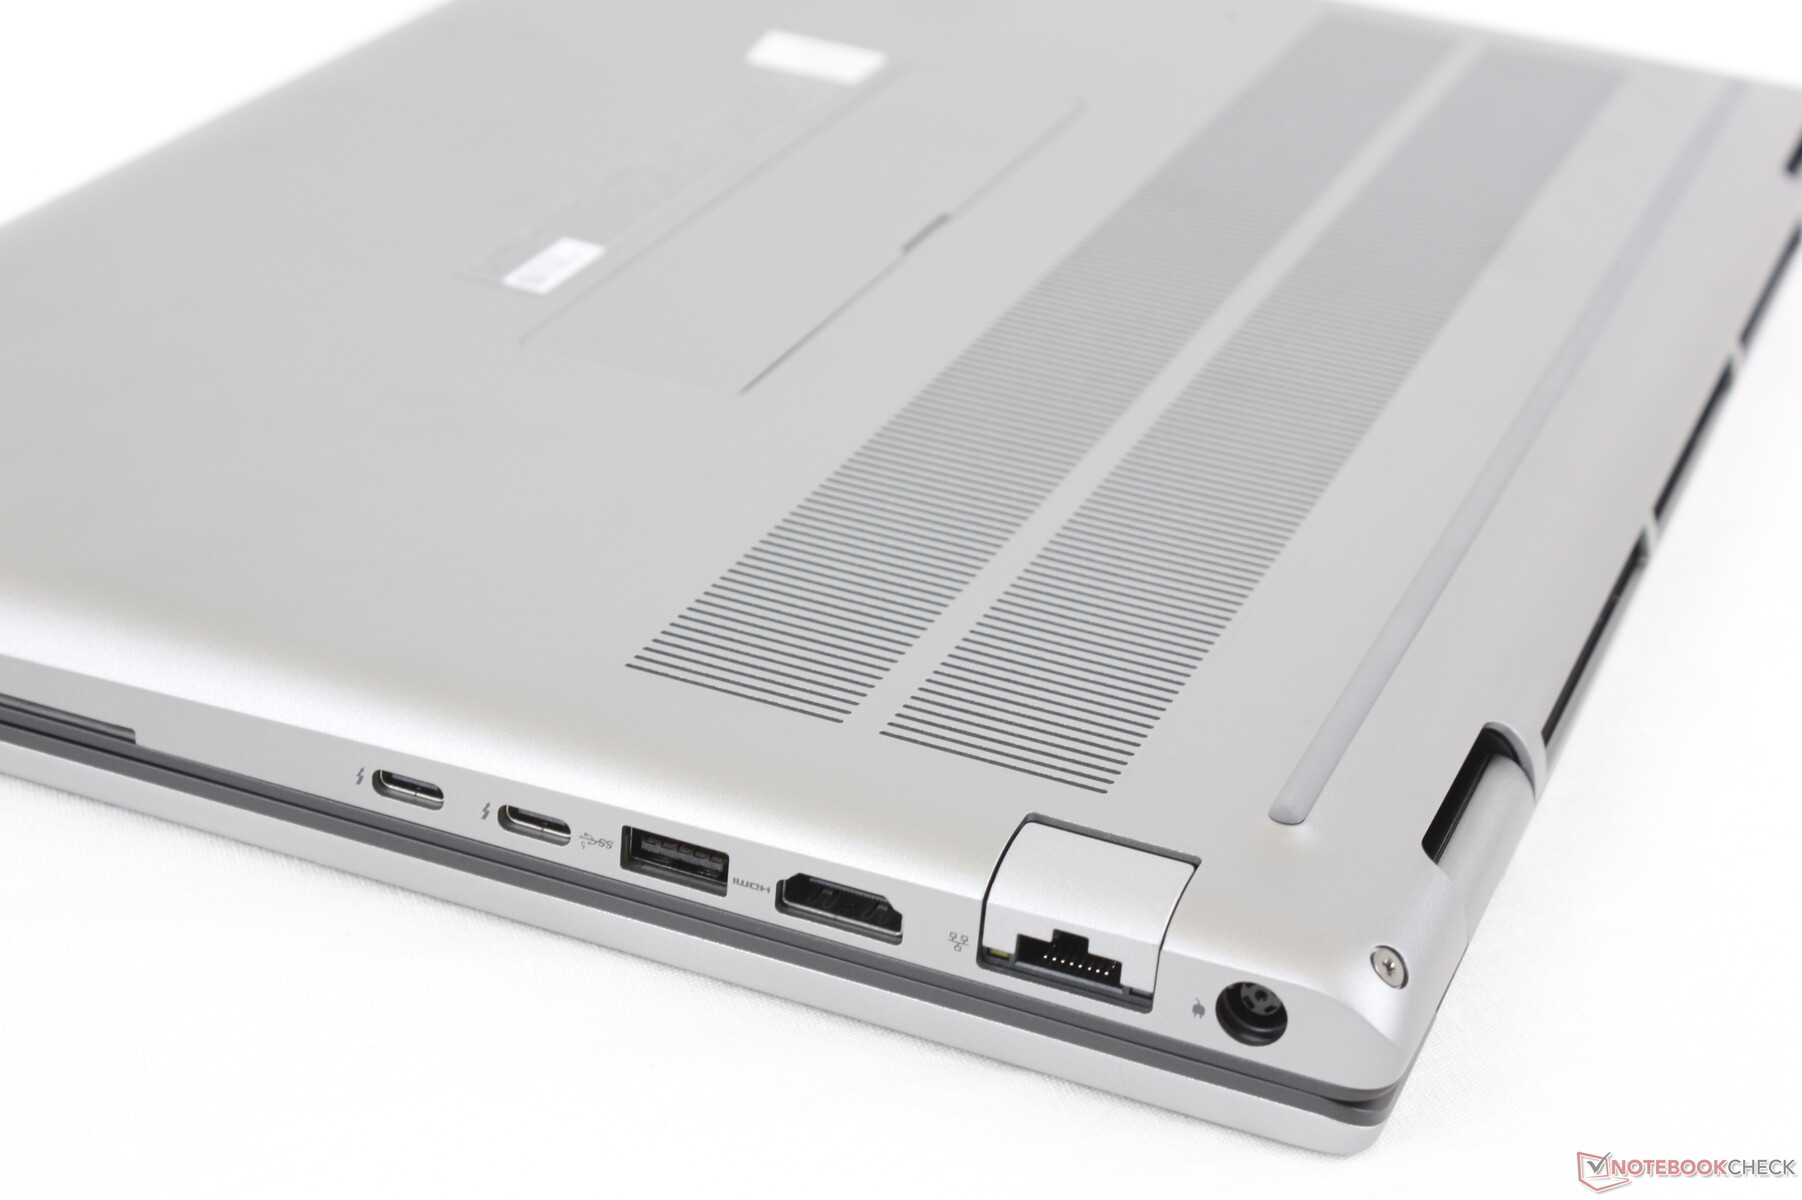
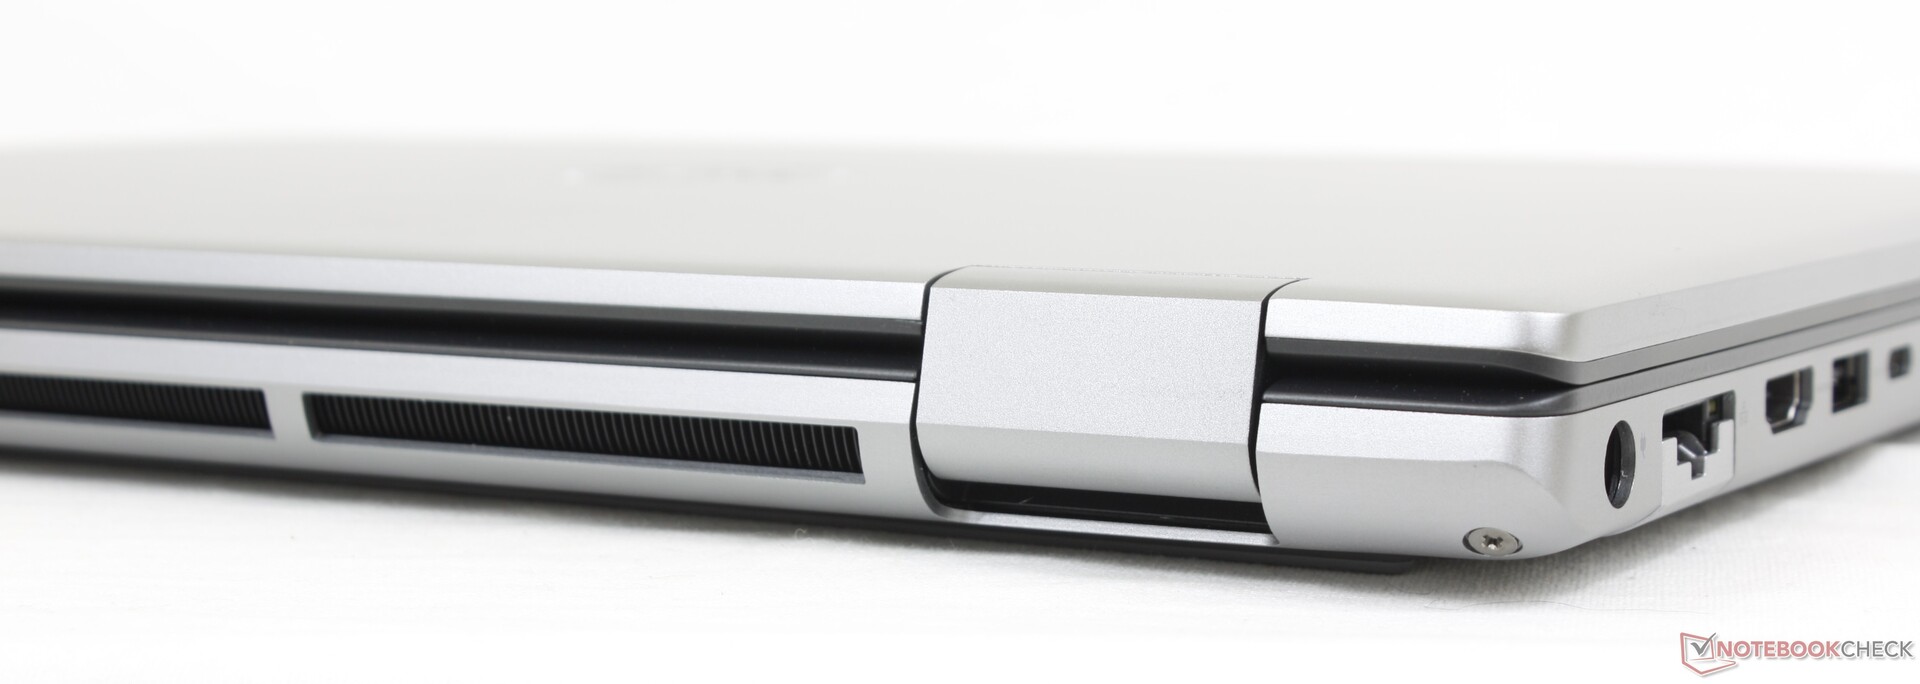
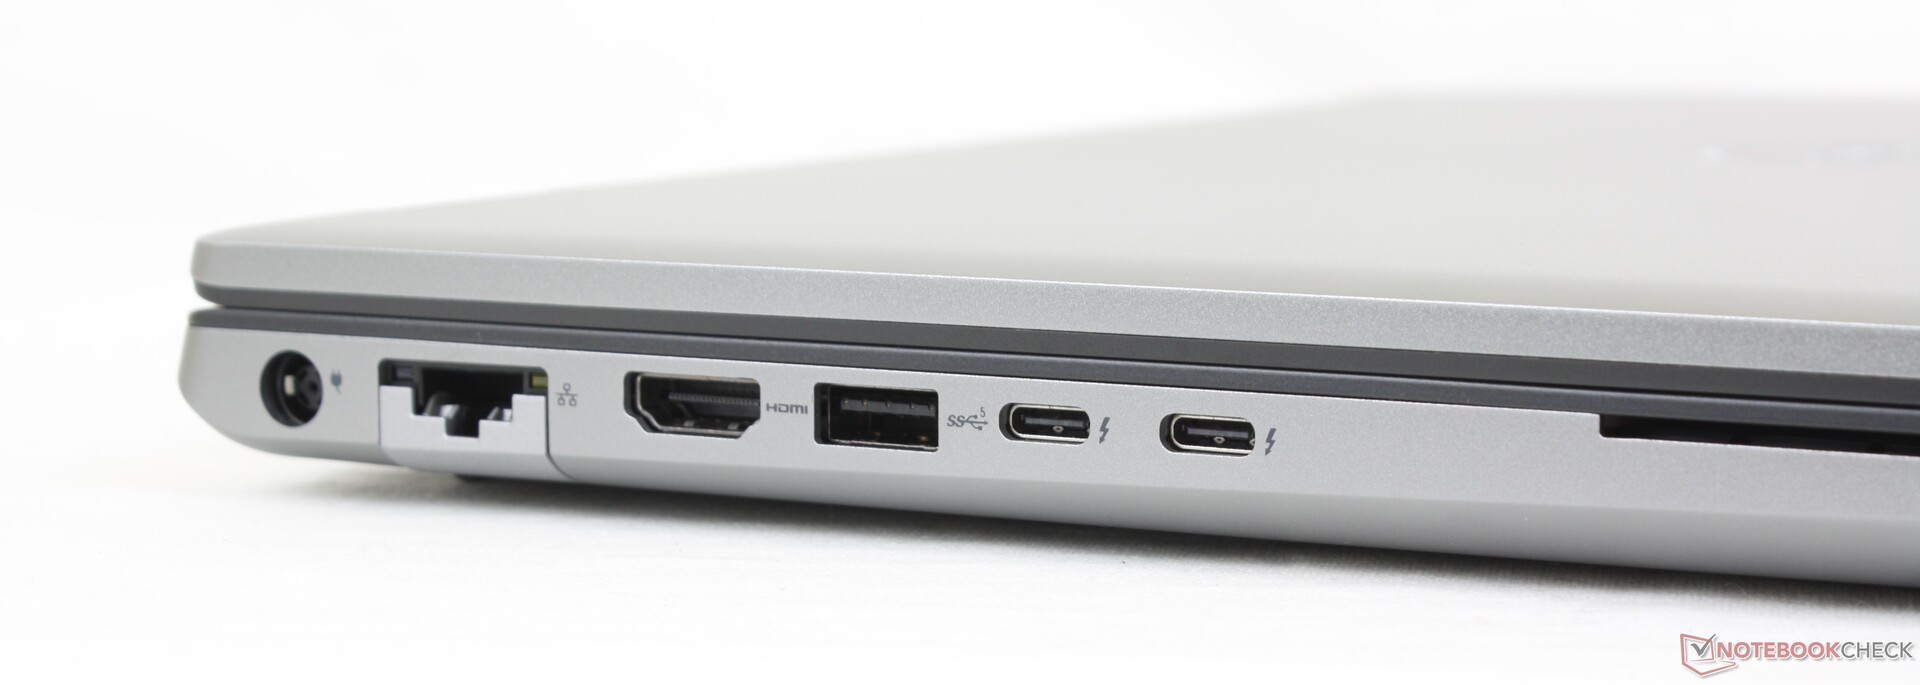
Connectiviteit - Thunderbolt 4 maar geen PD-In
De poortopties zijn uitstekend, vooral omdat er meer USB-poorten zijn dan op de meeste andere werkstations. Veel van de poorten zitten langs de linkerrand, terwijl de poorten aan de rechterrand vrij dicht bij de voorkant zitten. Merk op dat de RJ-45 poort slechts snelheden tot 1 Gbps ondersteunt in plaats van 10 Gbps.
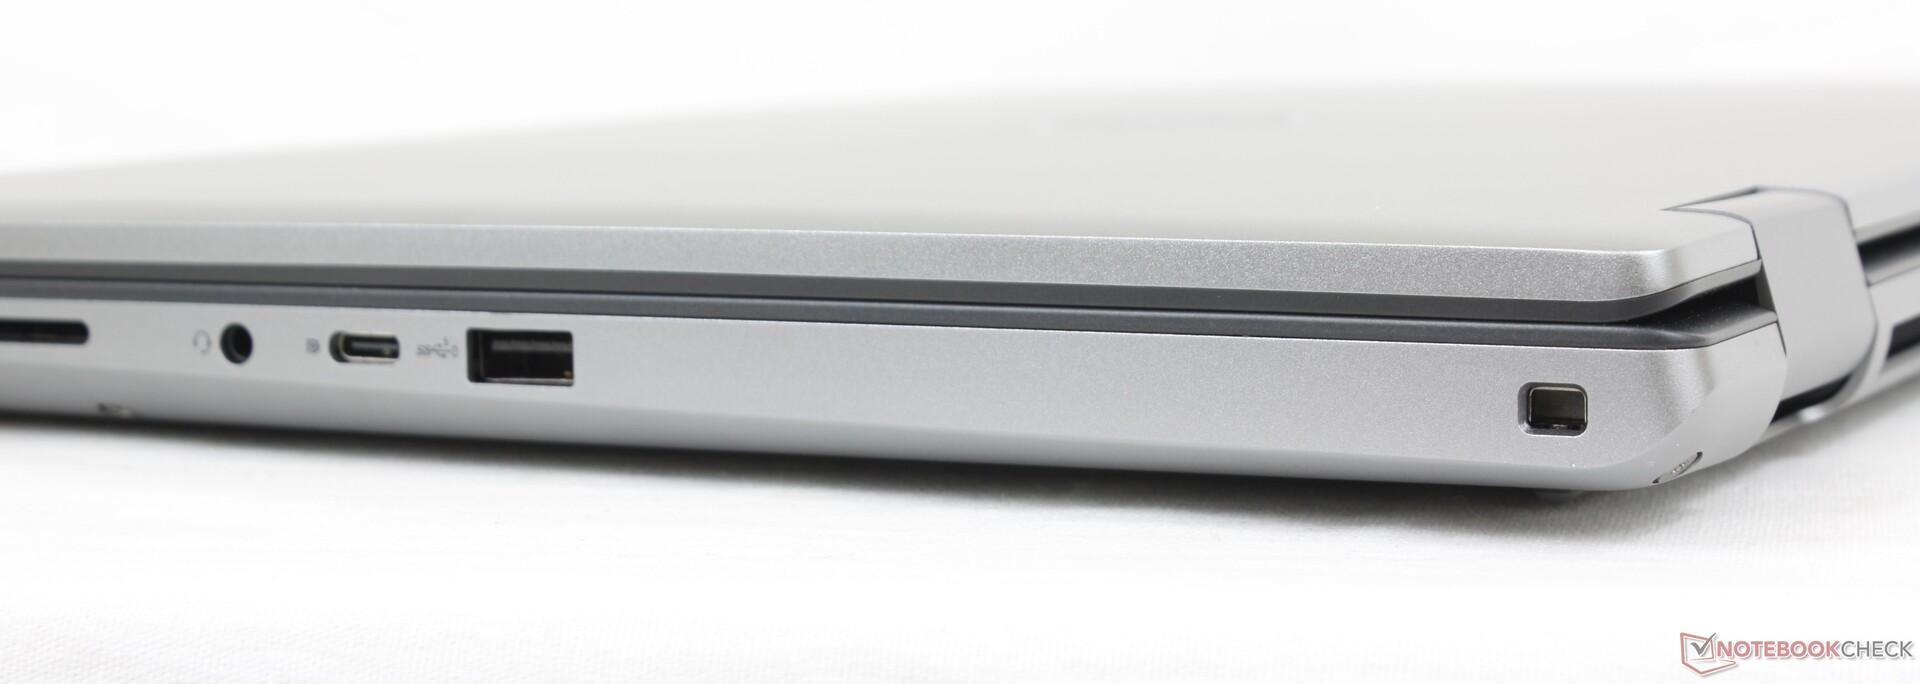
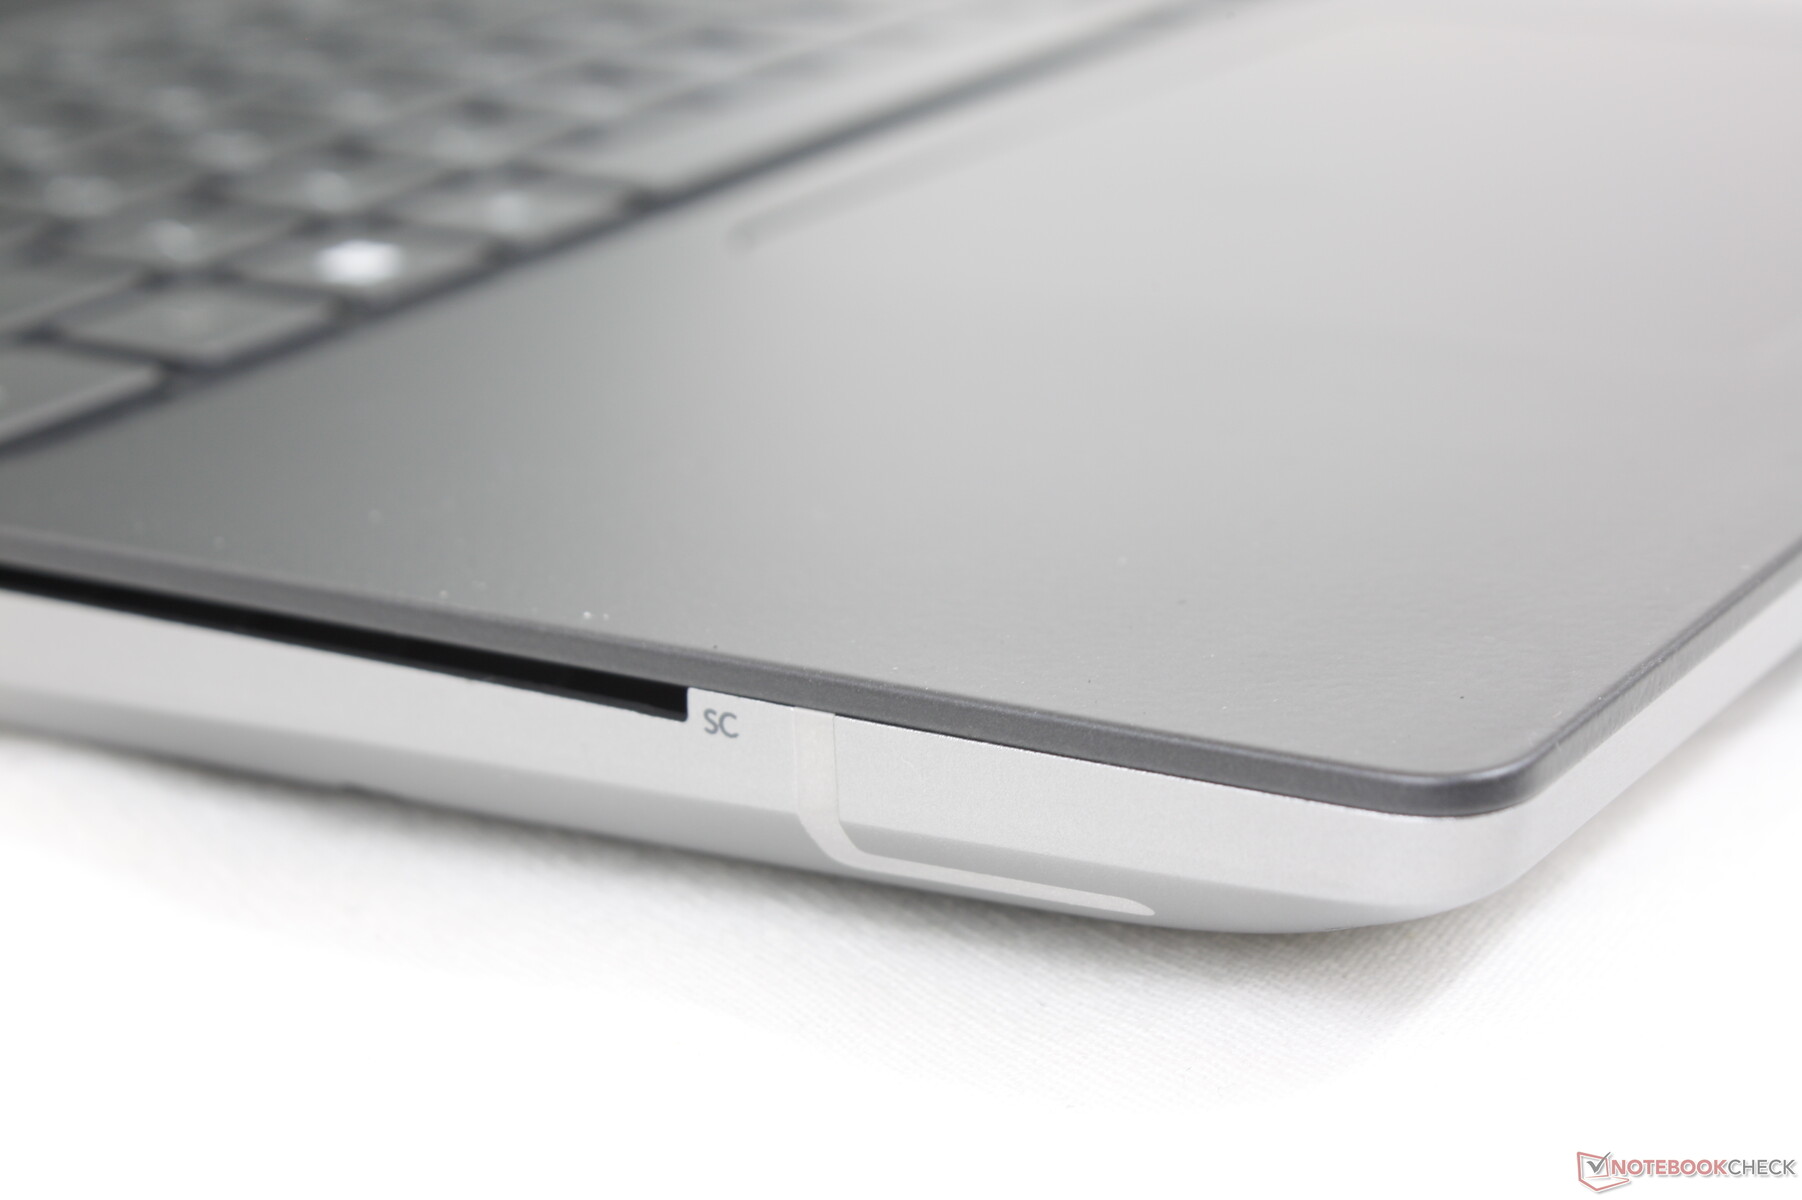
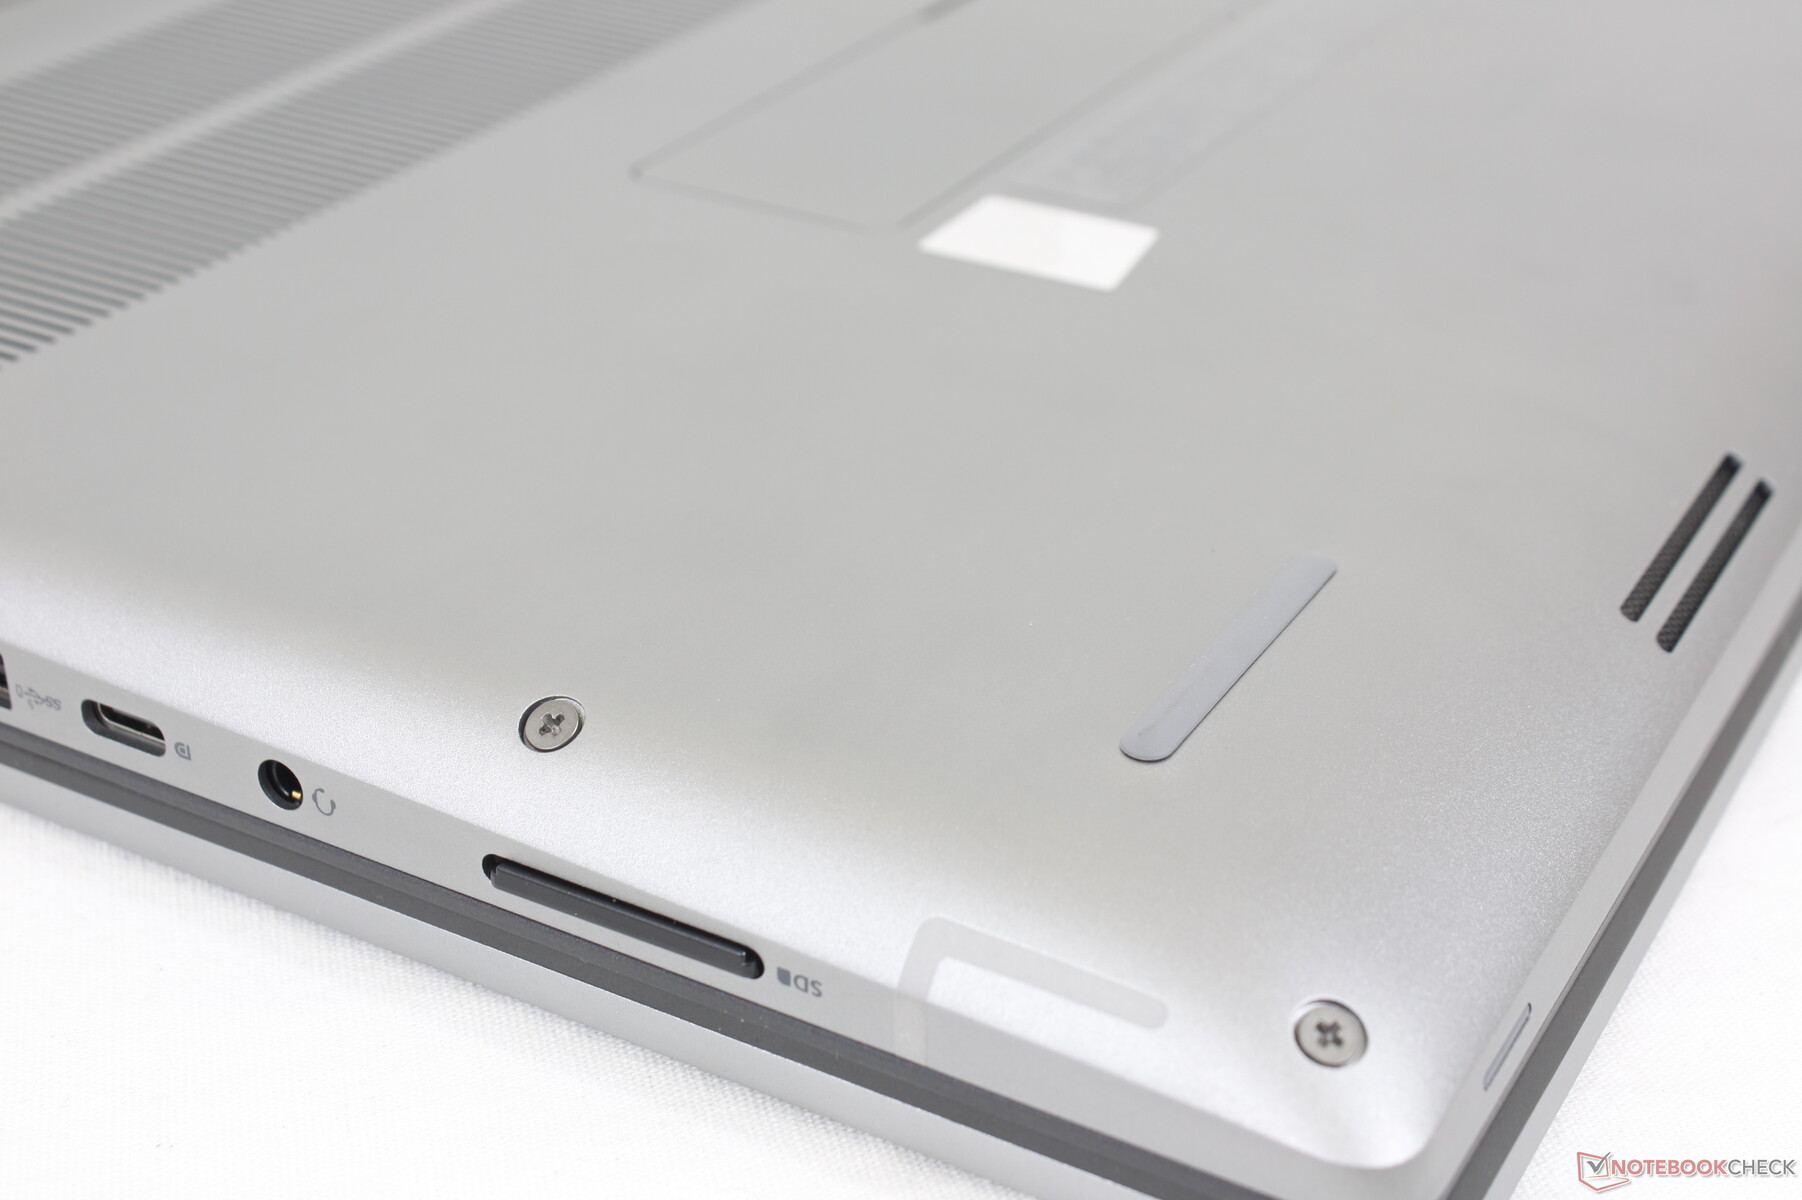
SD-kaartlezer
De overdrachtsnelheden met de veerbelaste SD-lezer zijn even snel als op de Precision 7550 of meer dan 2x sneller dan op de HP ZBook Fury G8. Het verplaatsen van 1 GB aan foto's van onze UHS-II kaart naar de desktop duurt slechts 5 tot 6 seconden.
| SD Card Reader | |
| average JPG Copy Test (av. of 3 runs) | |
| Lenovo ThinkPad P1 G4-20Y4Z9DVUS (Angelbird AV Pro V60) | |
| Dell Precision 5000 5560 (AV Pro V60) | |
| Dell Precision 7670 (Toshiba Exceria Pro SDXC 64 GB UHS-II) | |
| Dell Precision 7550 (Toshiba Exceria Pro SDXC 64 GB UHS-II) | |
| HP ZBook Fury 15 G8 (AV Pro V60) | |
| Asus ProArt StudioBook 16 W7600H5A-2BL2 (AV Pro SD microSD 128 GB V60) | |
| maximum AS SSD Seq Read Test (1GB) | |
| Dell Precision 5000 5560 (AV Pro V60) | |
| Dell Precision 7550 (Toshiba Exceria Pro SDXC 64 GB UHS-II) | |
| Dell Precision 7670 (Toshiba Exceria Pro SDXC 64 GB UHS-II) | |
| Lenovo ThinkPad P1 G4-20Y4Z9DVUS (Angelbird AV Pro V60) | |
| HP ZBook Fury 15 G8 (AV Pro V60) | |
| Asus ProArt StudioBook 16 W7600H5A-2BL2 (AV Pro SD microSD 128 GB V60) | |
Communicatie
Een Intel AX211 wordt standaard geleverd voor Wi-Fi 6E-connectiviteit en optionele Bluetooth. Helaas is Wi-Fi 6E in veel situaties niet noodzakelijkerwijs sneller dan Wi-Fi 6. Overdrachtssnelheden lijken veel meer te variëren op onze Precision 7670 in vergelijking met de meeste andere werkstations, zelfs wanneer ze slechts één tot twee meter verwijderd zijn van ons 6 GHz toegangspunt.
| Networking | |
| iperf3 transmit AX12 | |
| Lenovo ThinkPad P1 G4-20Y4Z9DVUS | |
| HP ZBook Fury 15 G8 | |
| Dell Precision 7550 | |
| Dell Precision 5000 5560 | |
| Asus ProArt StudioBook 16 W7600H5A-2BL2 | |
| iperf3 receive AX12 | |
| Dell Precision 5000 5560 | |
| Lenovo ThinkPad P1 G4-20Y4Z9DVUS | |
| Dell Precision 7550 | |
| HP ZBook Fury 15 G8 | |
| Asus ProArt StudioBook 16 W7600H5A-2BL2 | |
| iperf3 receive AXE11000 6GHz | |
| Dell Precision 7670 | |
| iperf3 transmit AXE11000 6GHz | |
| Dell Precision 7670 | |
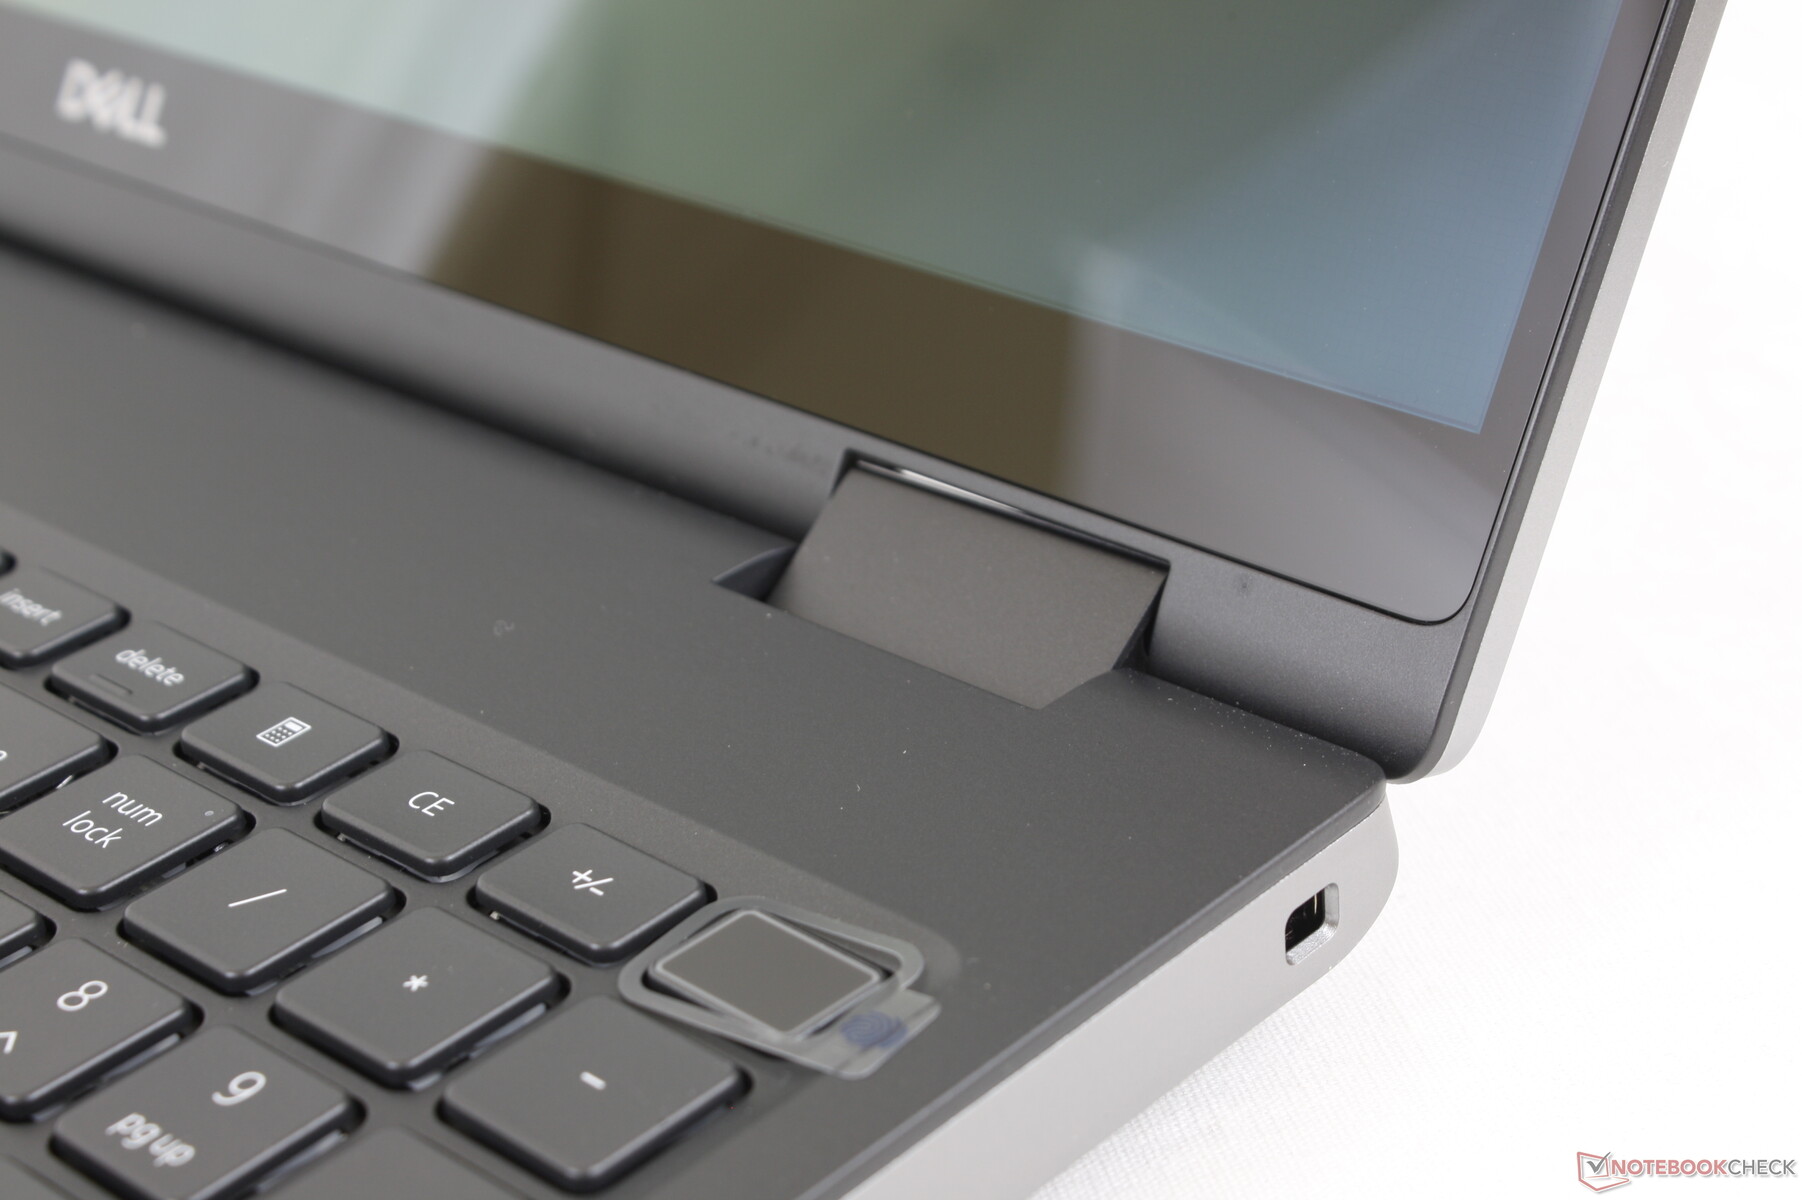
Webcam
De 2 MP webcam is een upgrade van de 1 MP webcams op de meeste XPS systemen. Het verbleekt echter nog steeds in vergelijking met de 5 MP camera's op de meeste van de nieuwste HP laptops
Zowel IR en een sluiter zijn opgenomen voor Windows Hello ondersteuning en privacy, respectievelijk.


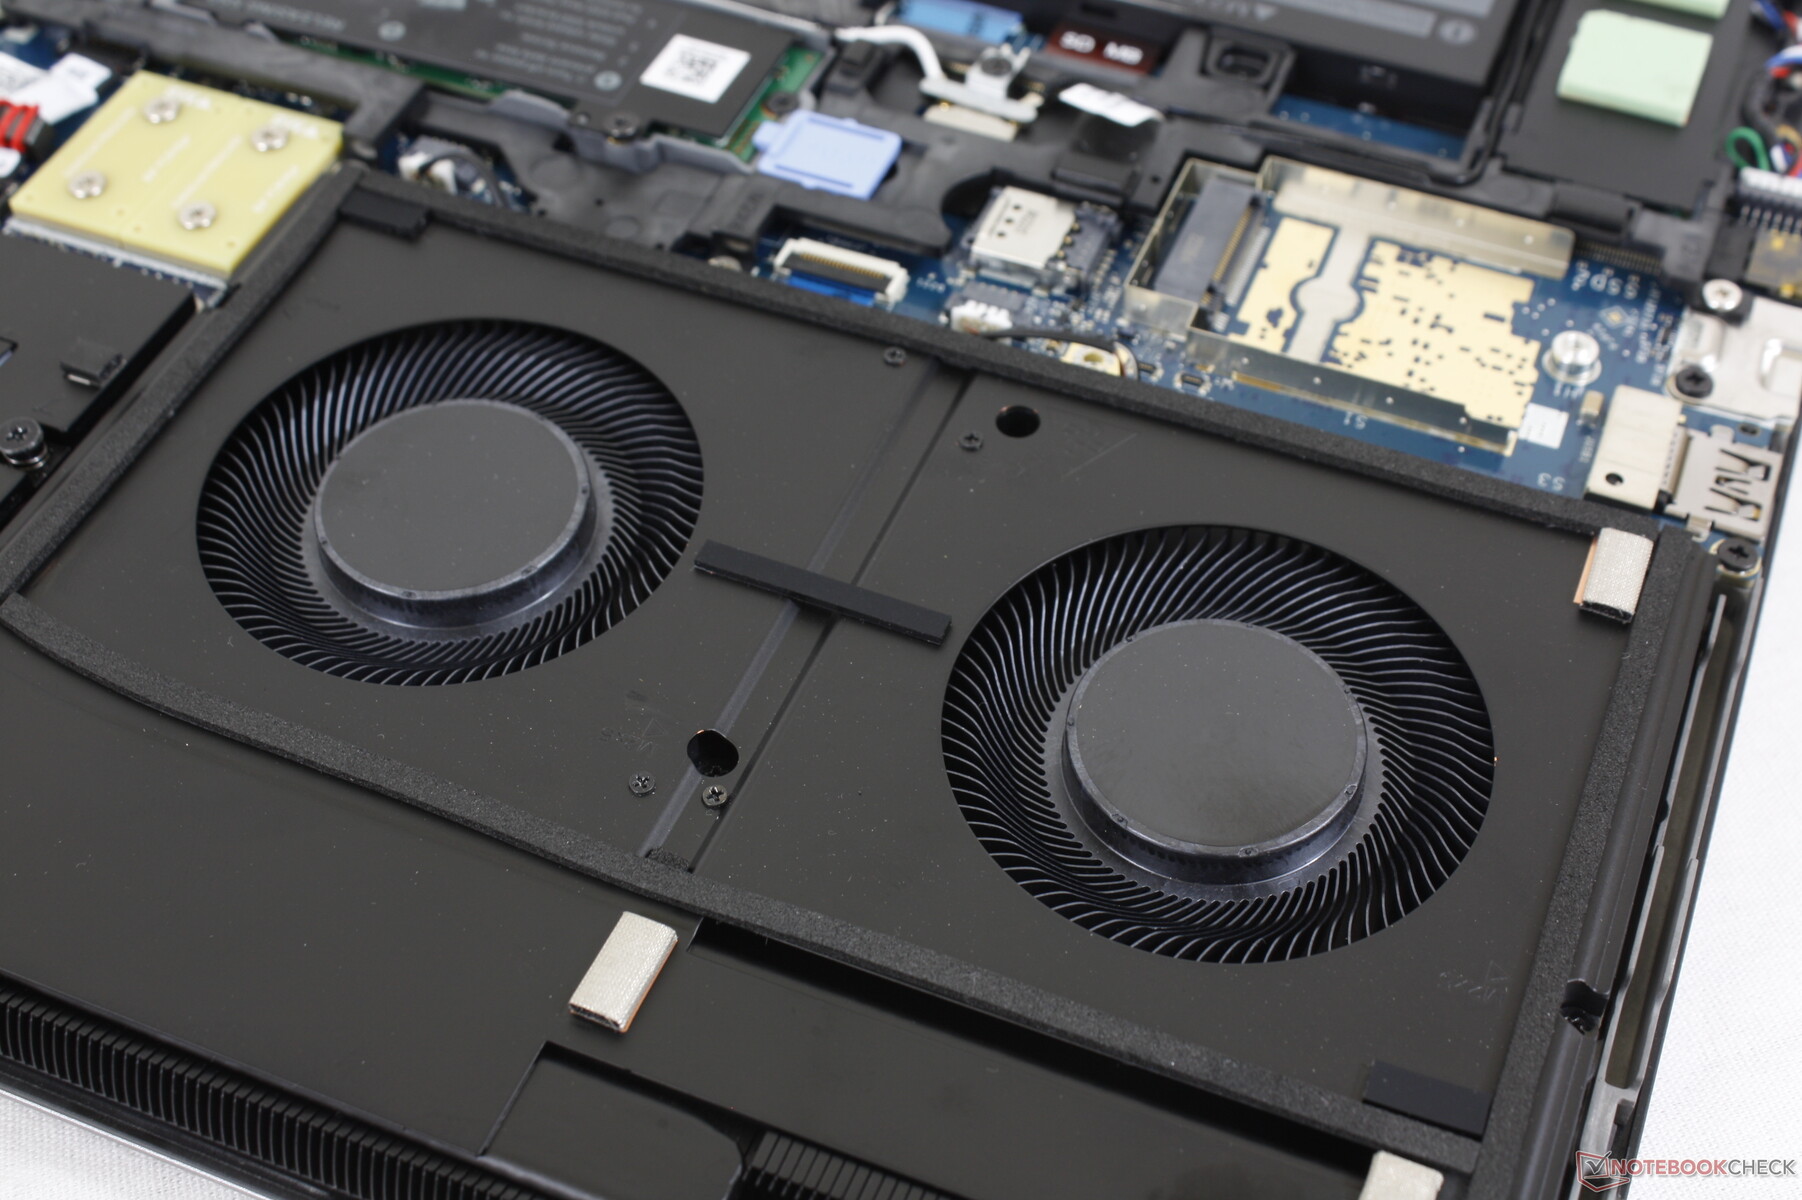
Onderhoud - Gemakkelijke toegang
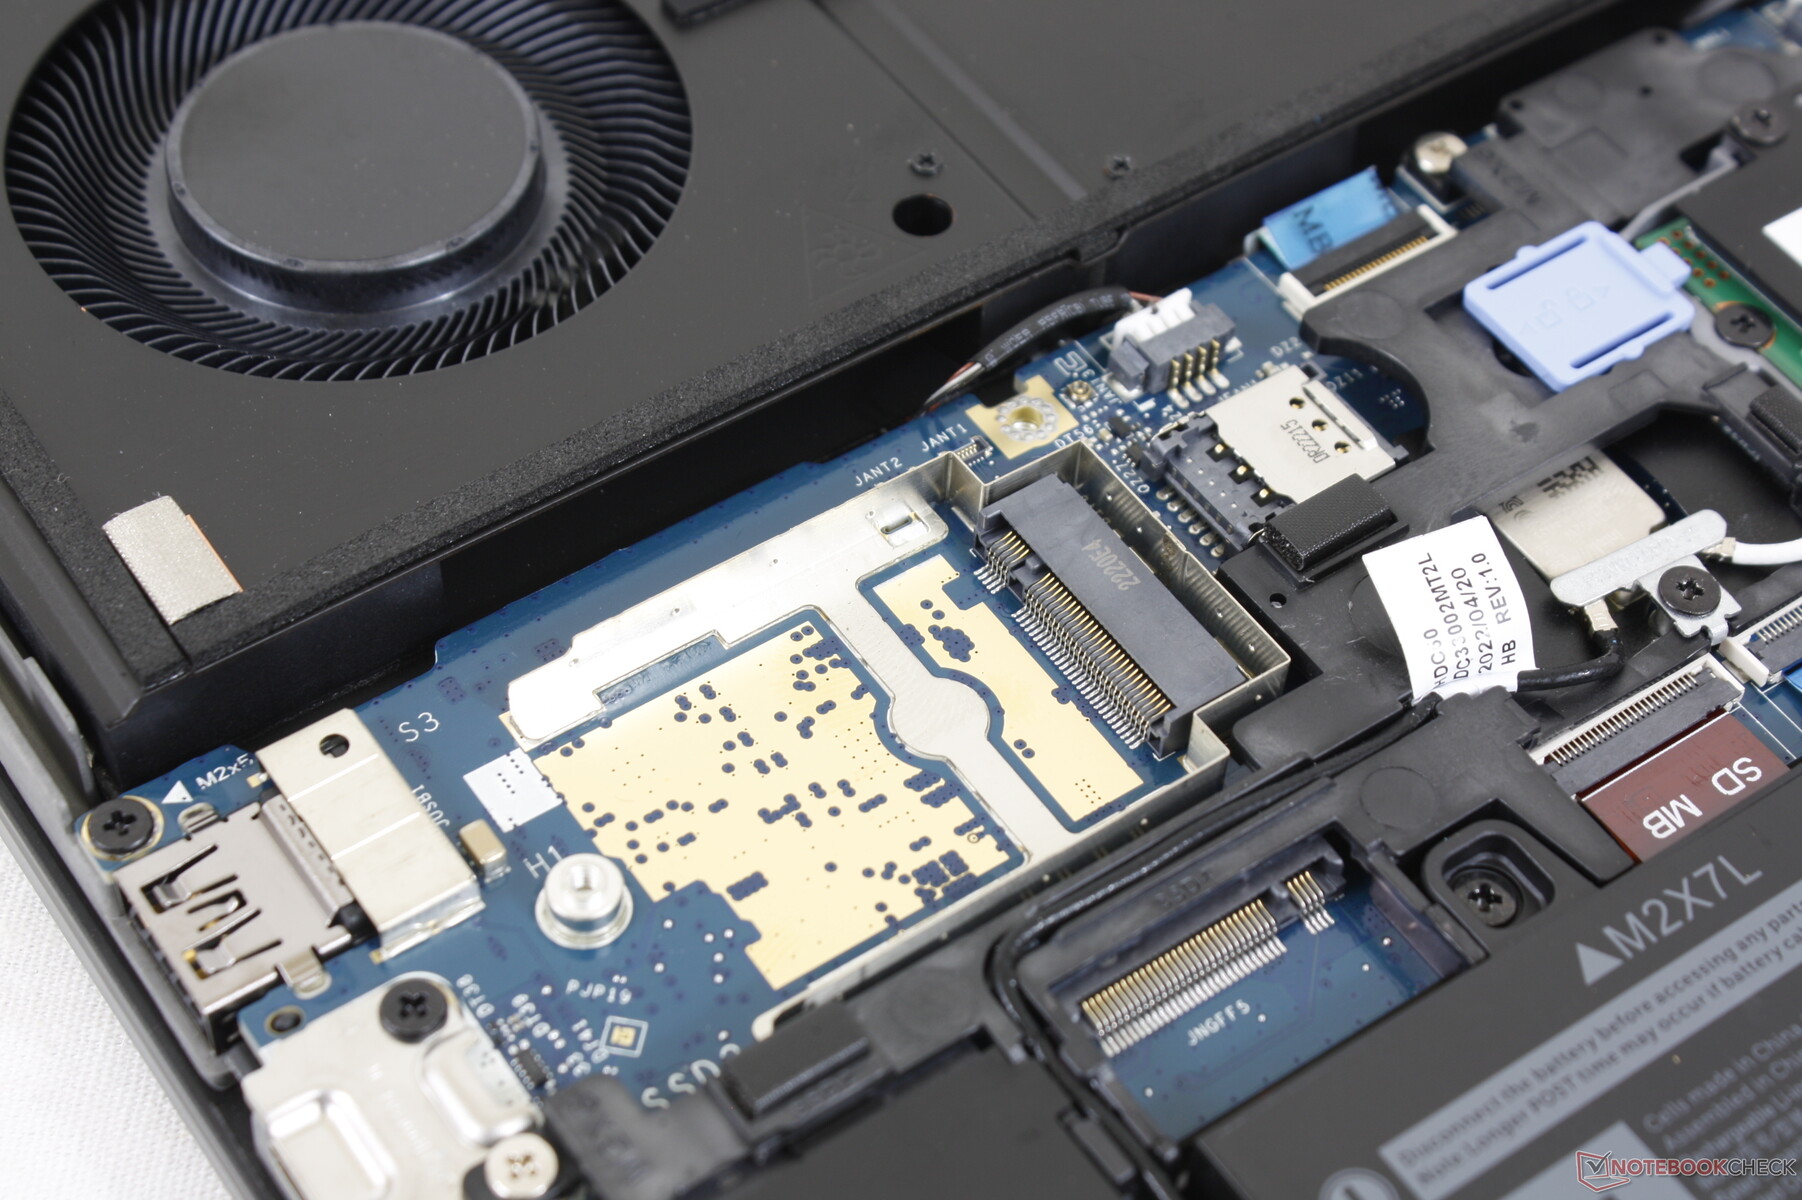
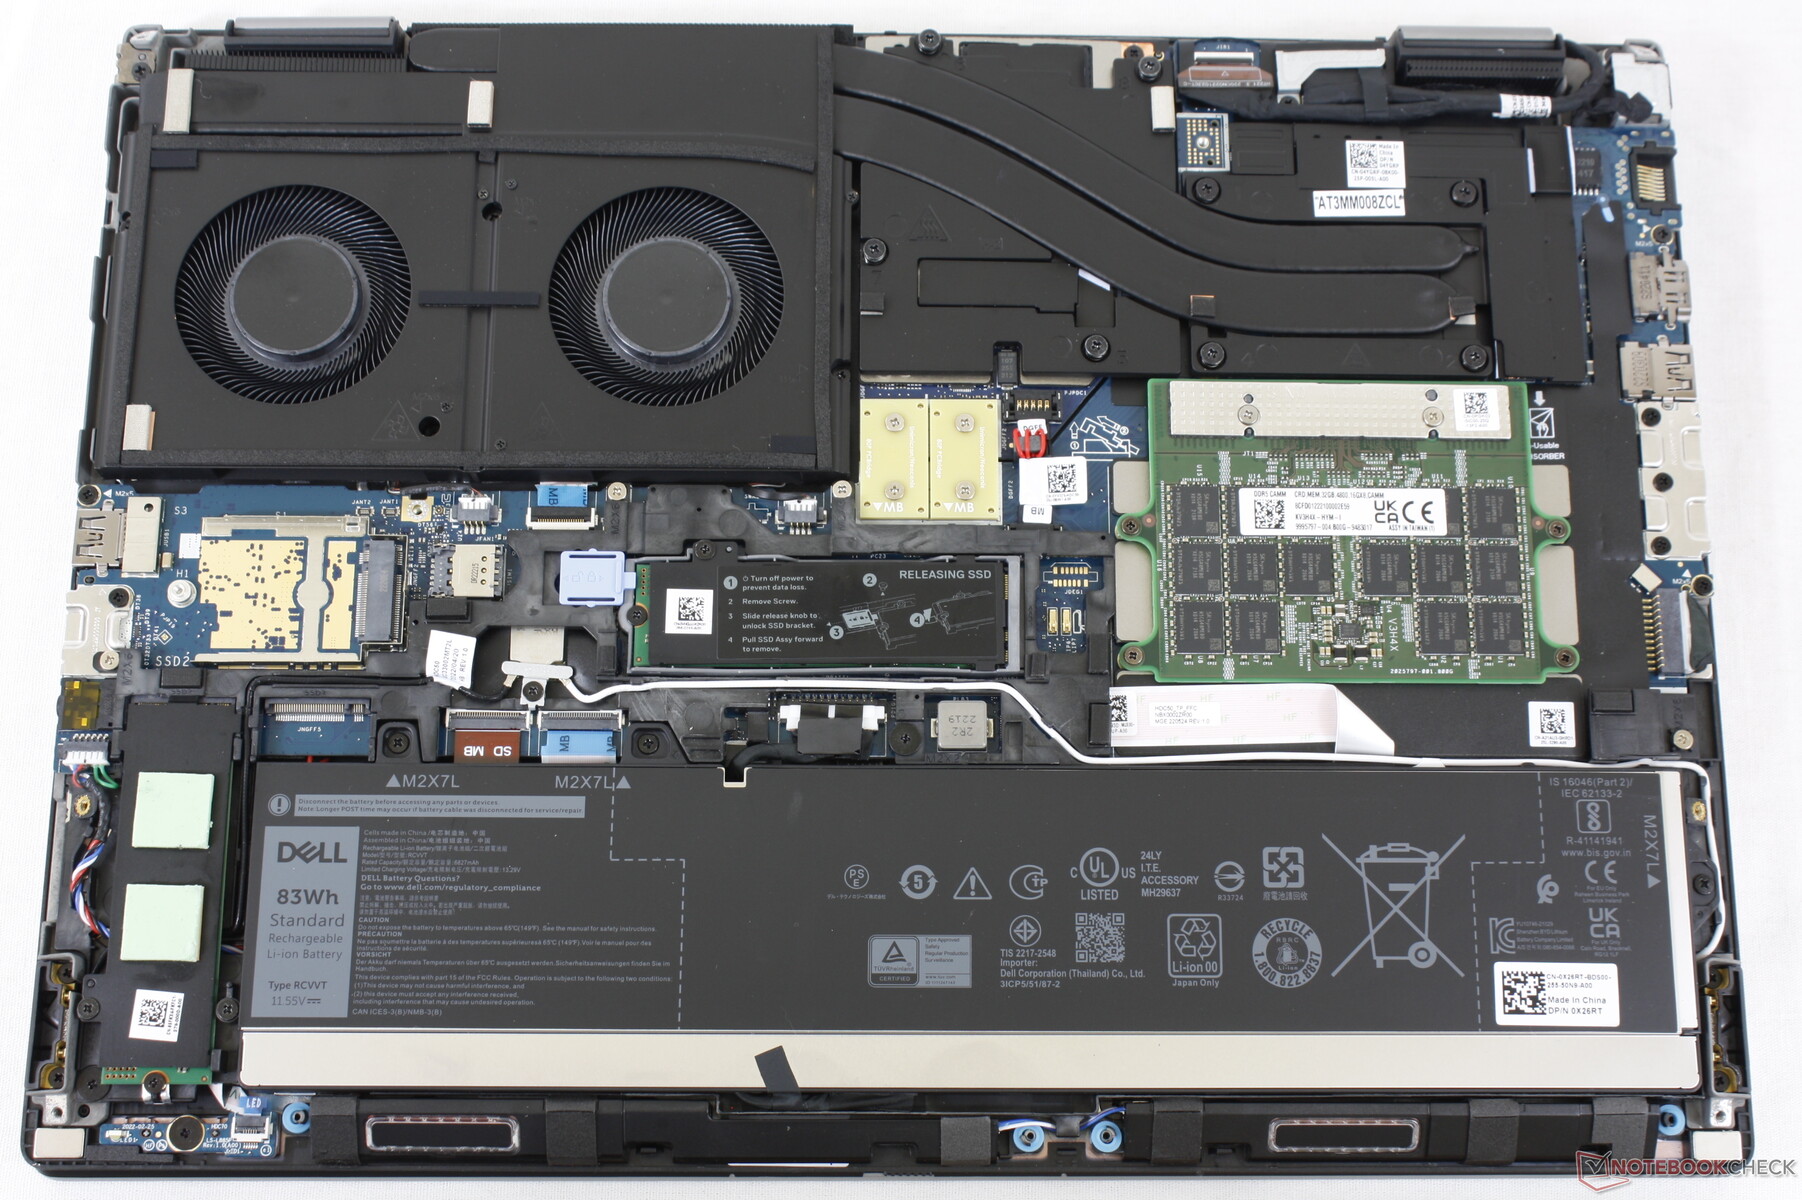
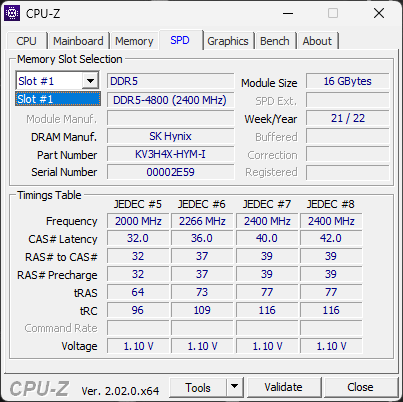
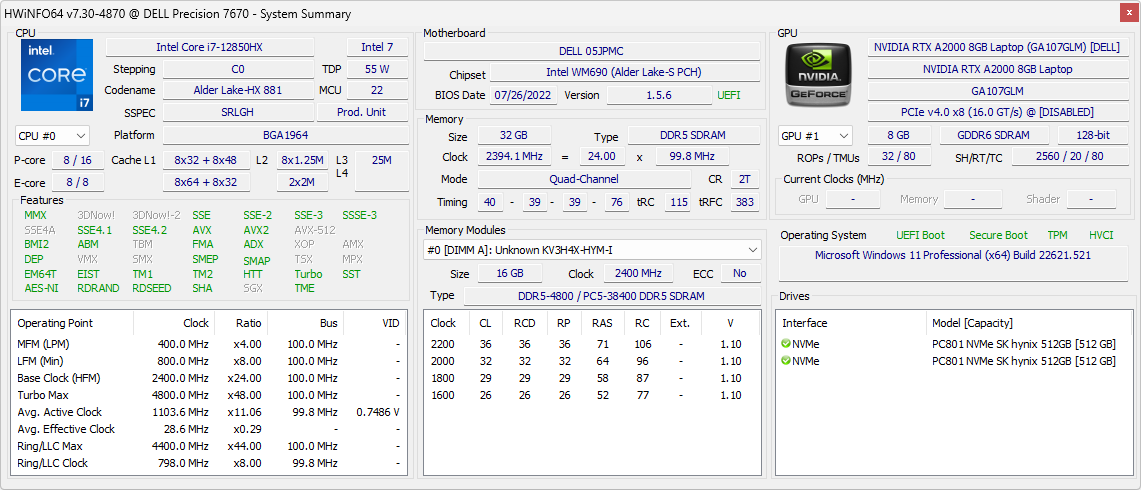
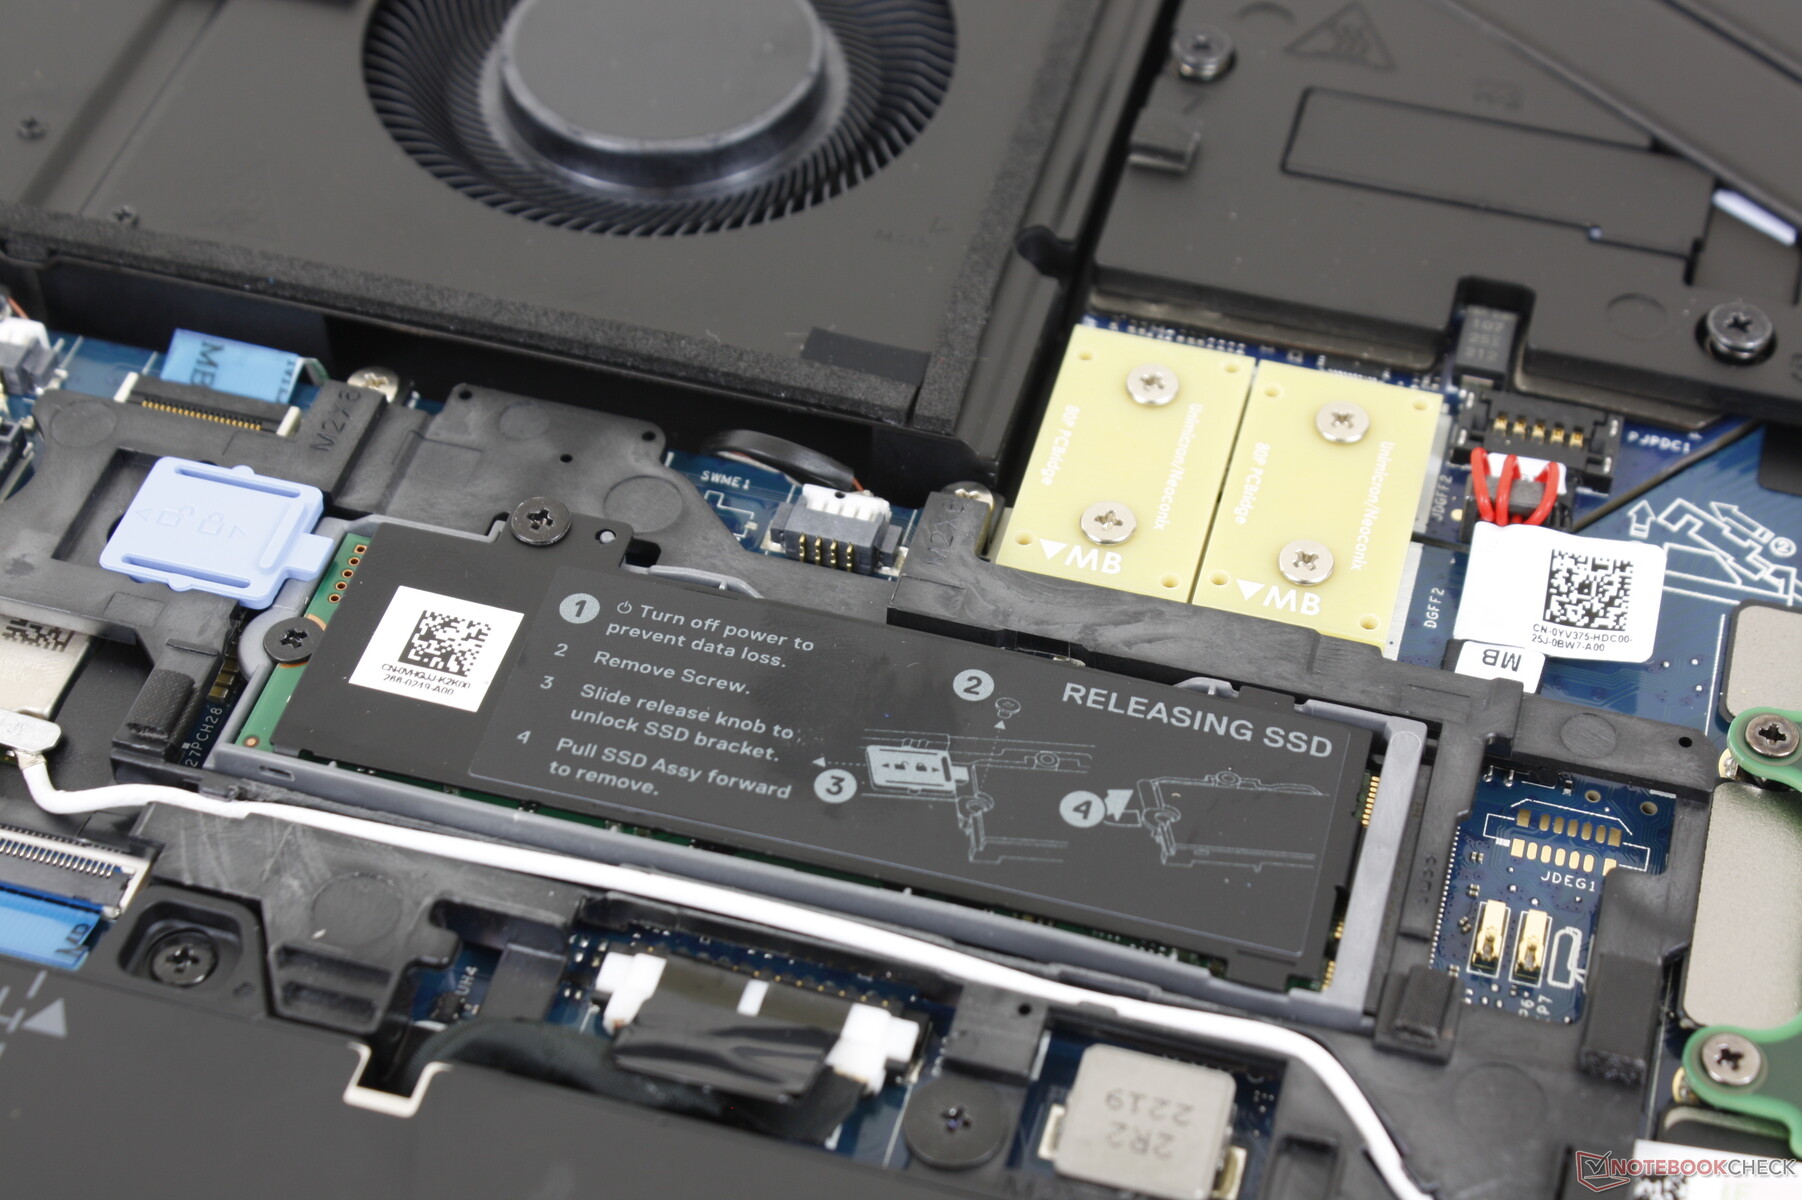
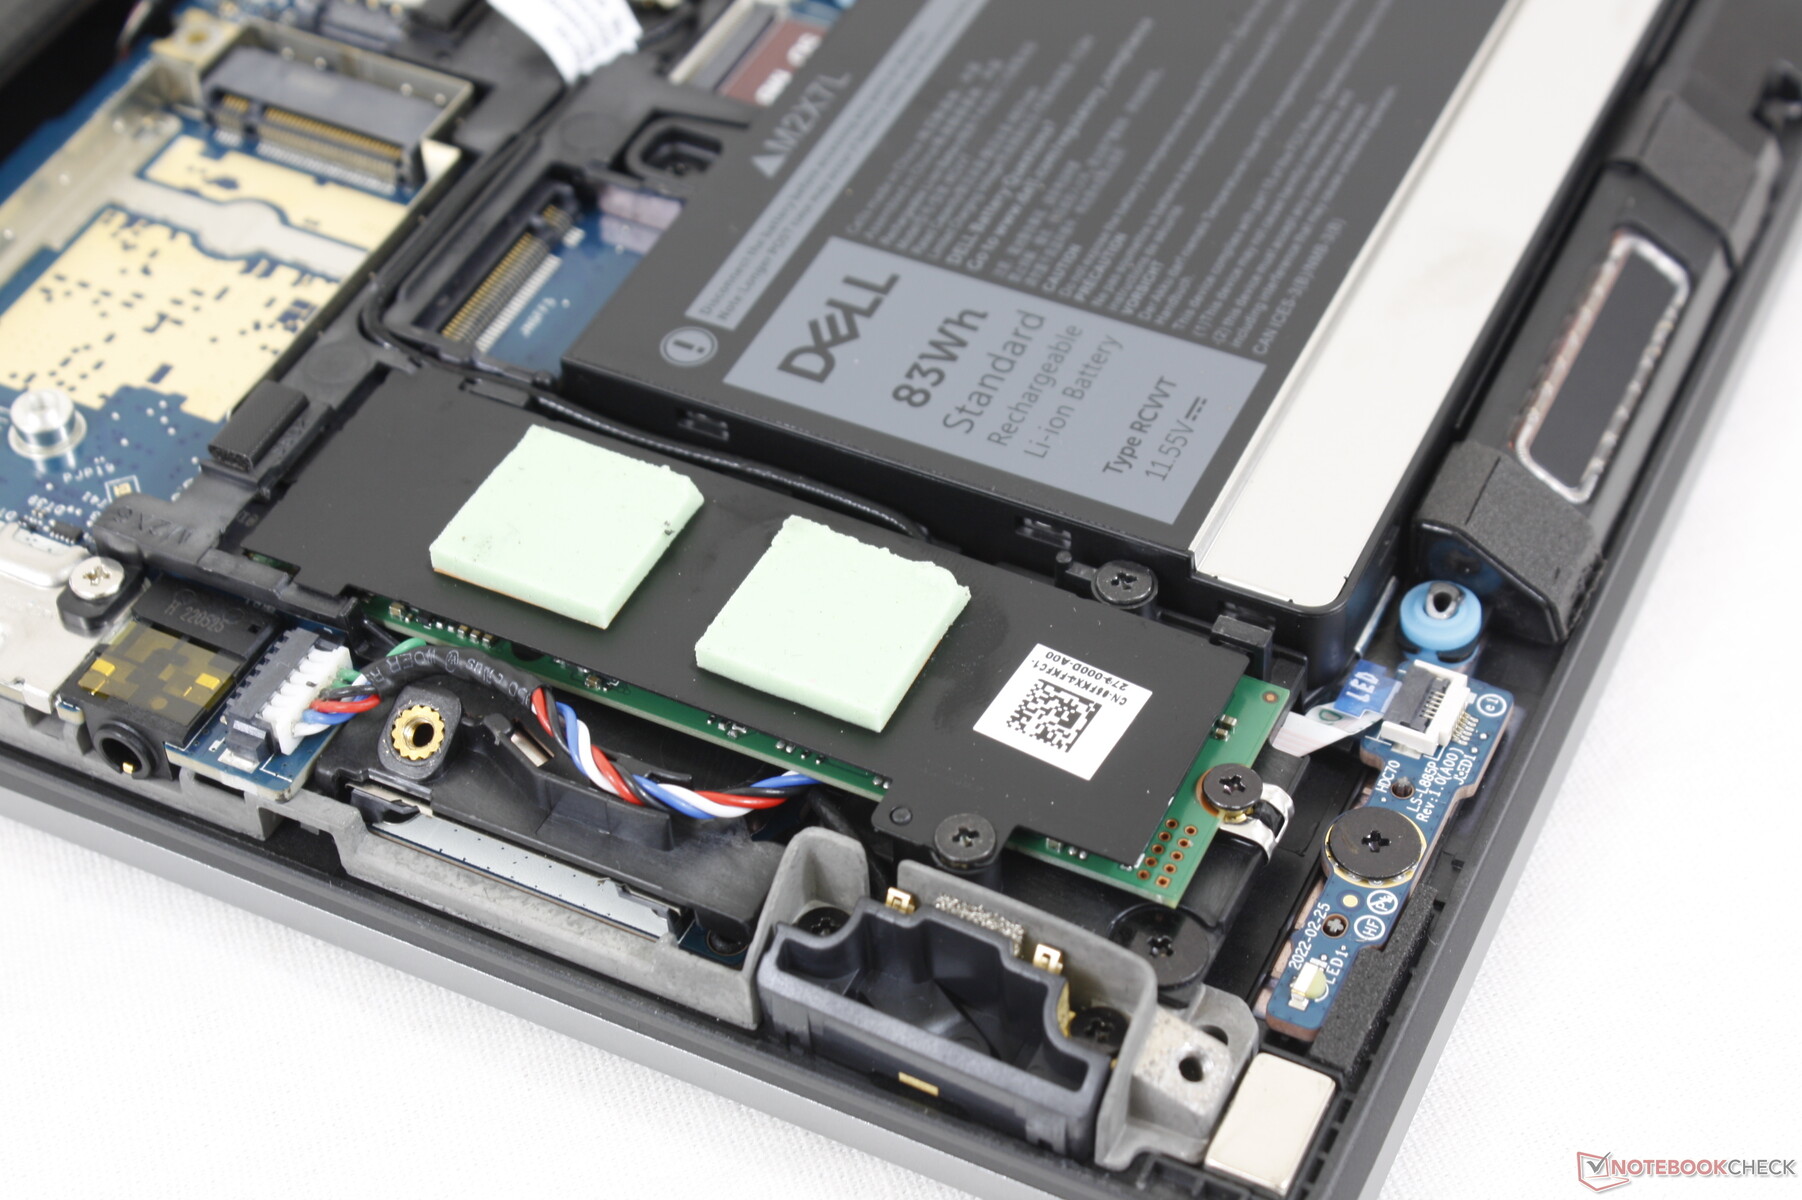
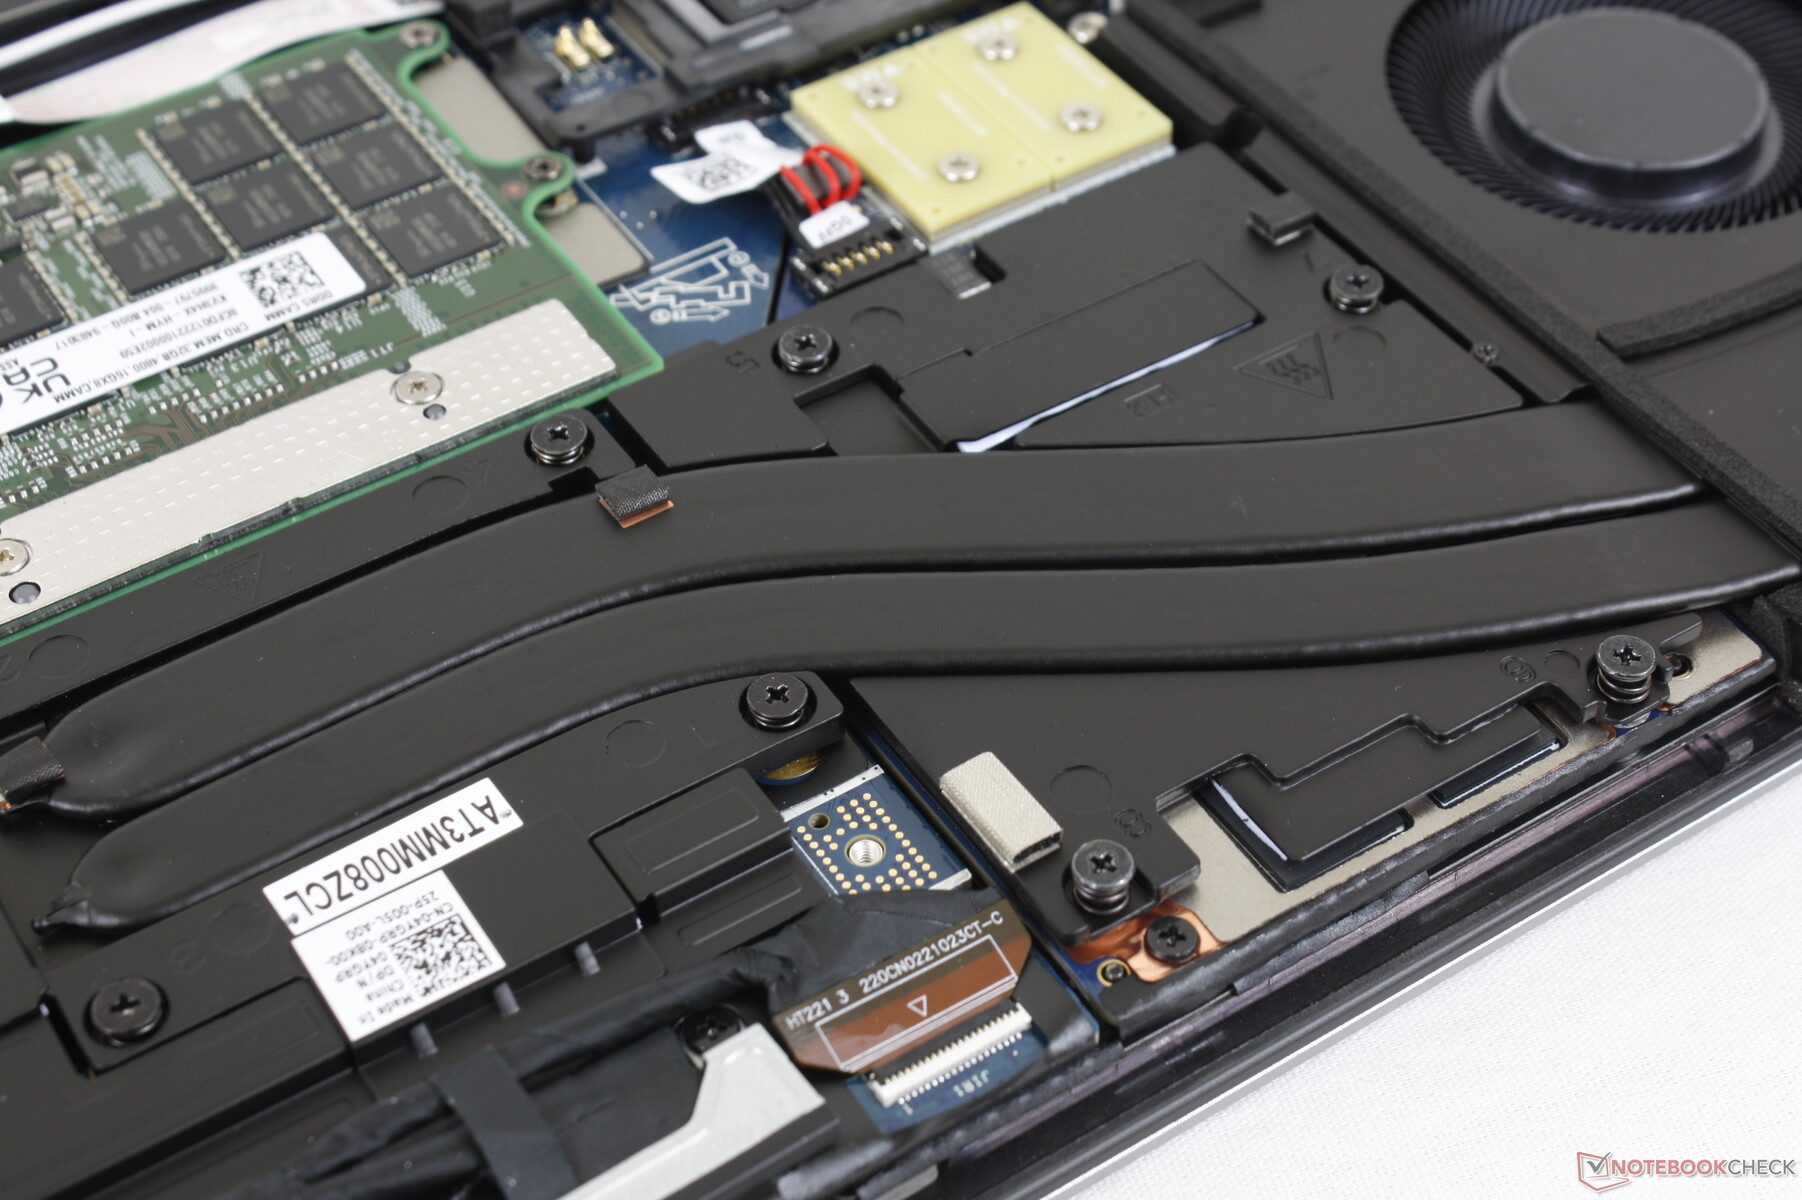
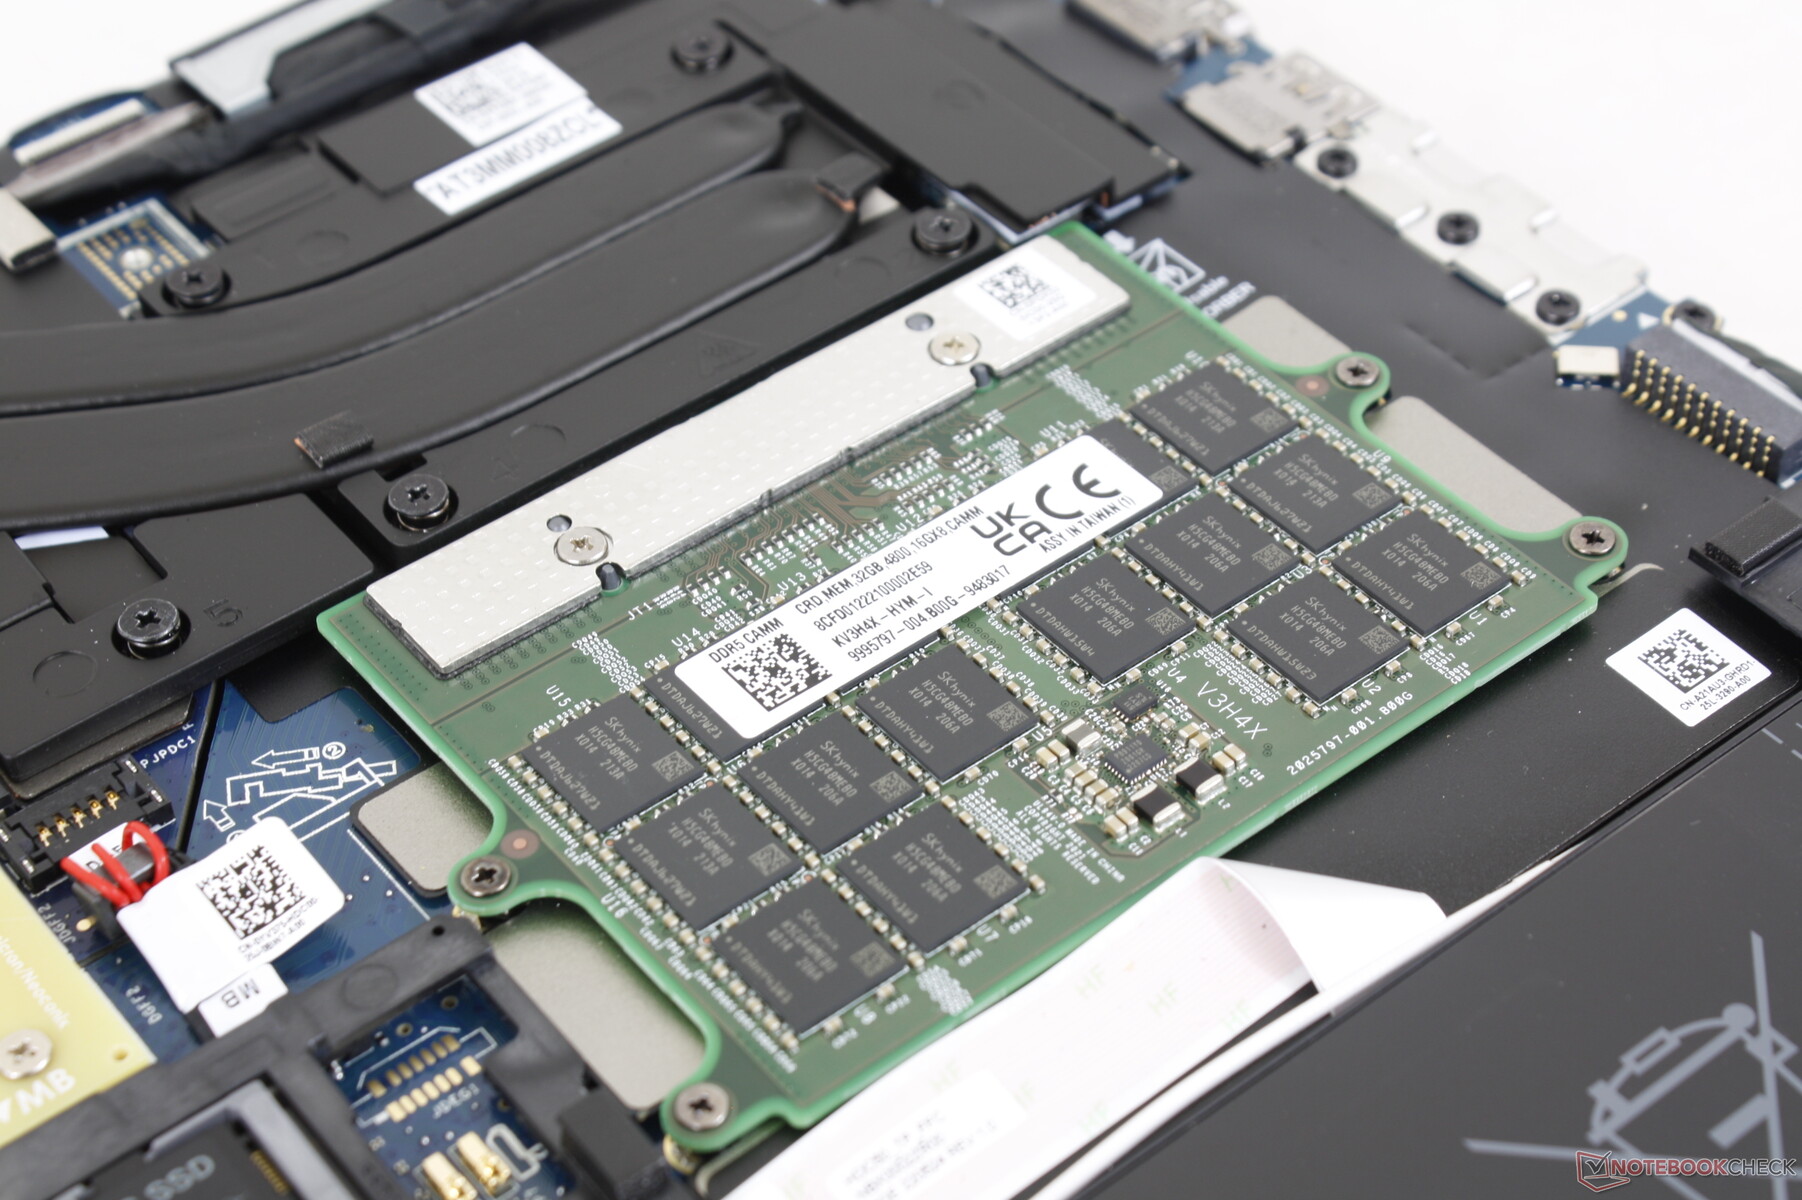
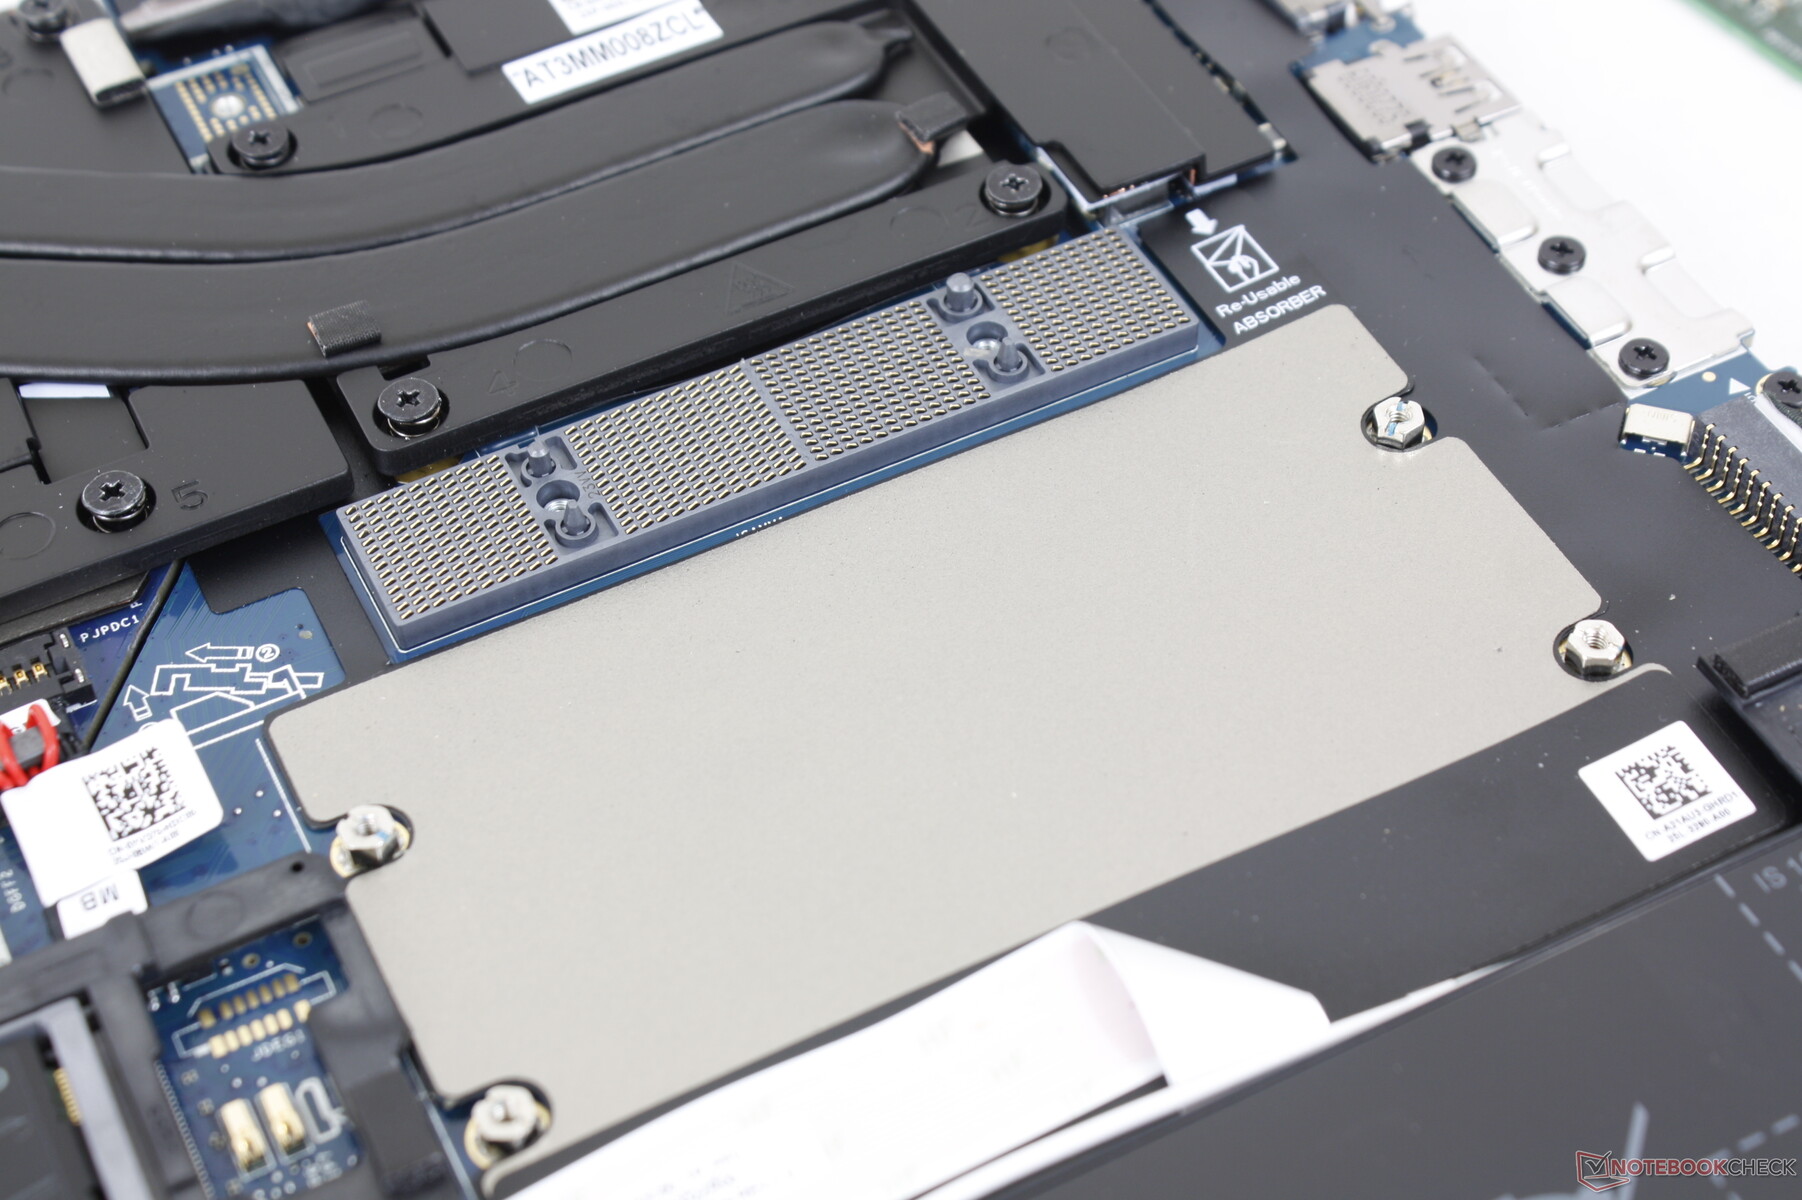
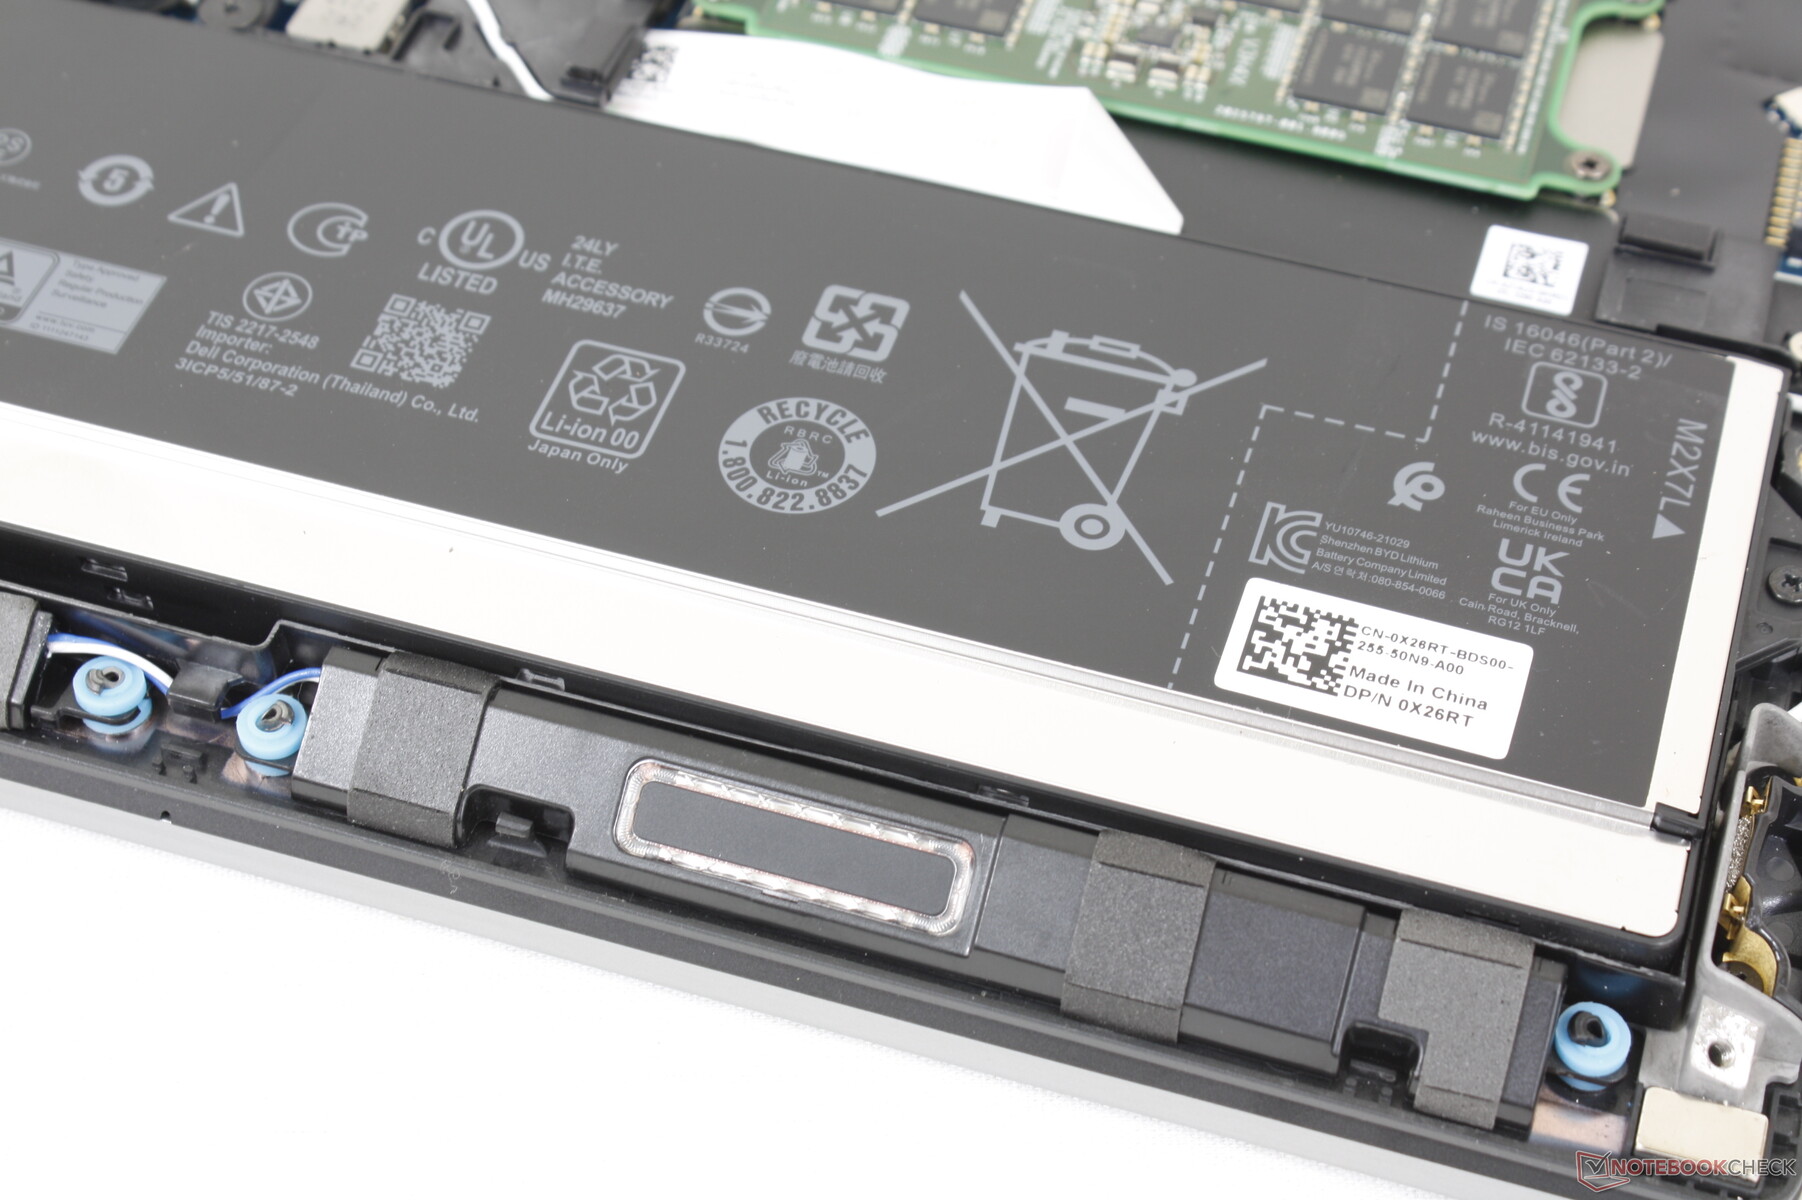
Het onderpaneel wordt vastgezet met 6 Philips-schroeven voor eenvoudig onderhoud. Gebruikers hebben toegang tot twee M.2 PCIe4 x4 2280 slots, WAN slot, Nano-SIM slot, en SODIMM of CAMM slots, afhankelijk van de configuratie. De WLAN-module is niet verwijderbaar.
Bepaalde configuraties kunnen tot drie M.2 SSD's herbergen, zoals blijkt uit het derde M.2-slot nabij de rand van de batterij.
Meer informatie over CAMM RAM kan worden gevonden op onze preview pagina hier.
Accessoires en garantie
Er zijn geen extra's in de doos behalve de AC-adapter en papierwerk. Een beperkte fabrieksgarantie van drie jaar is standaard indien rechtstreeks bij Dell gekocht.
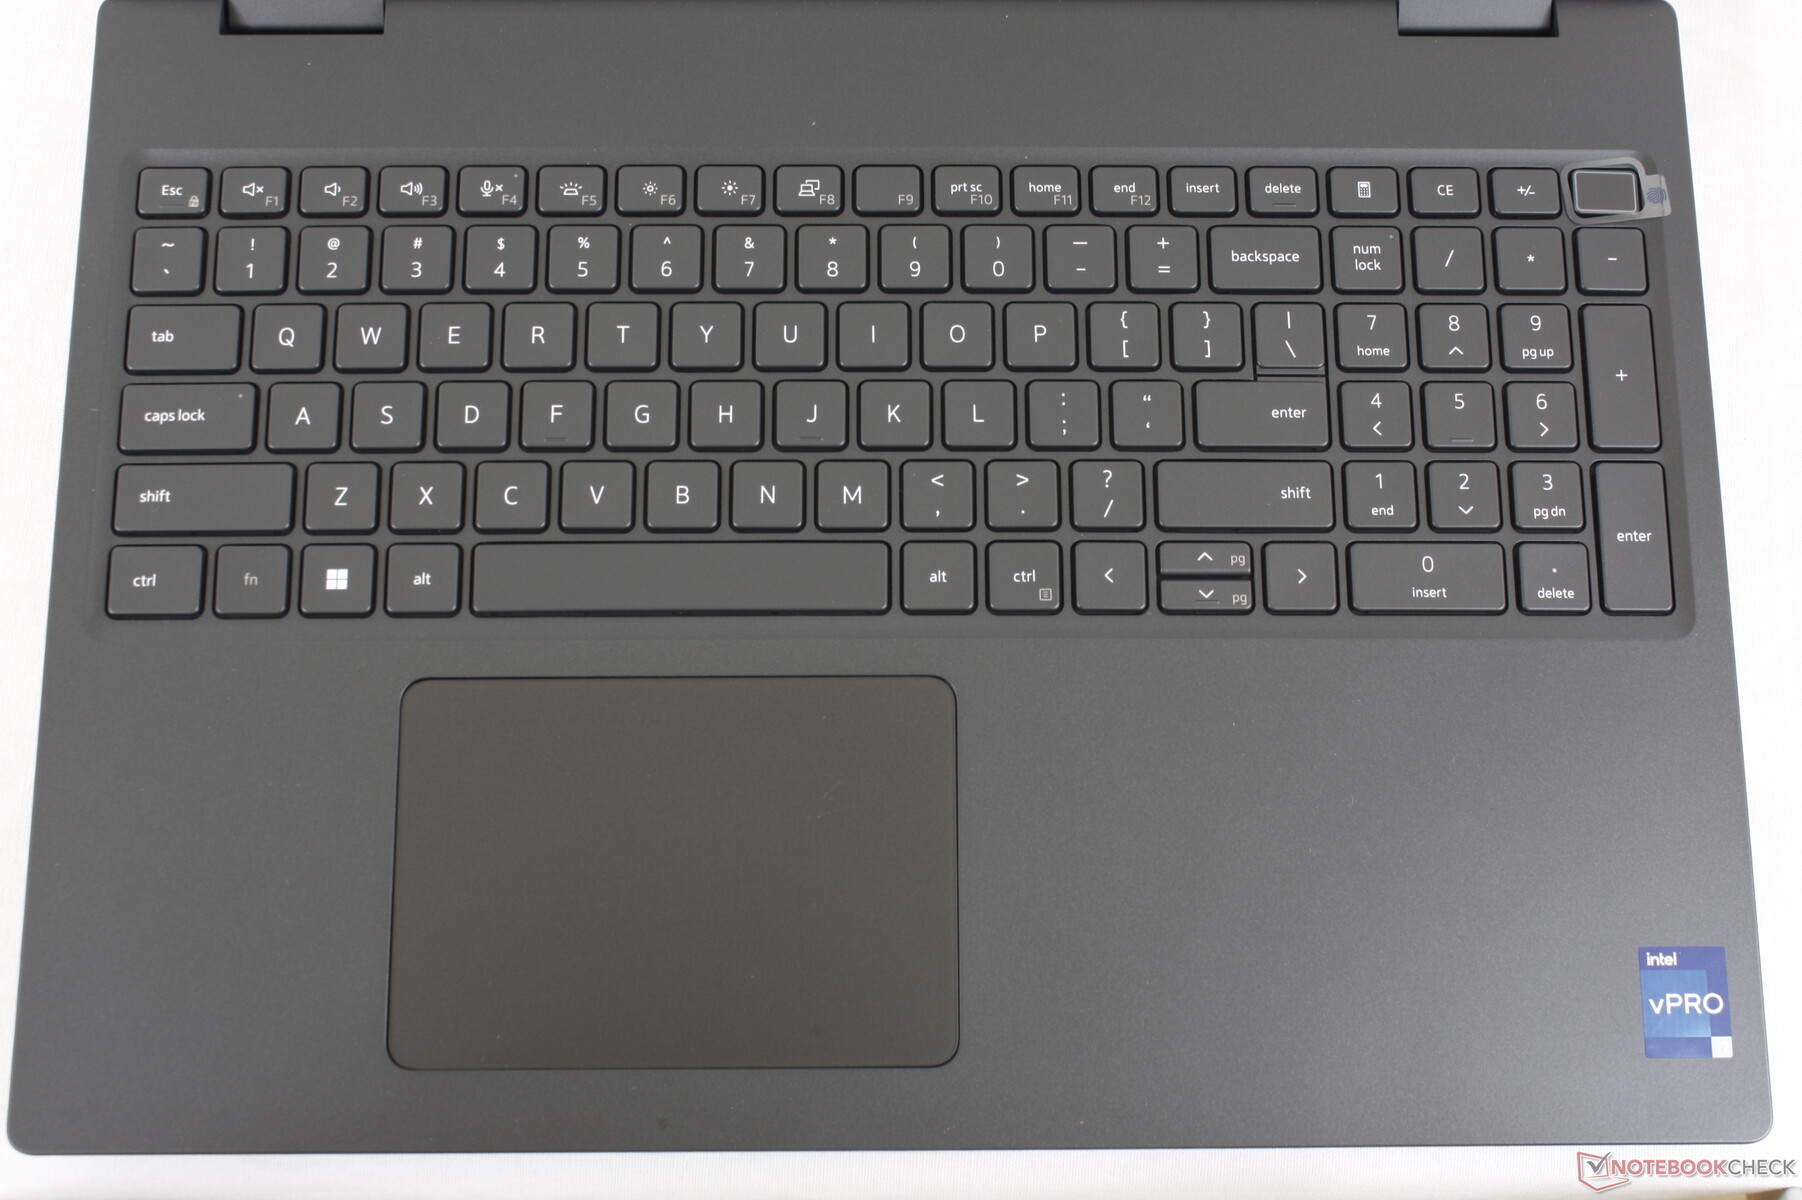
Invoerapparaten - Groot clickpad met een comfortabel toetsenbord
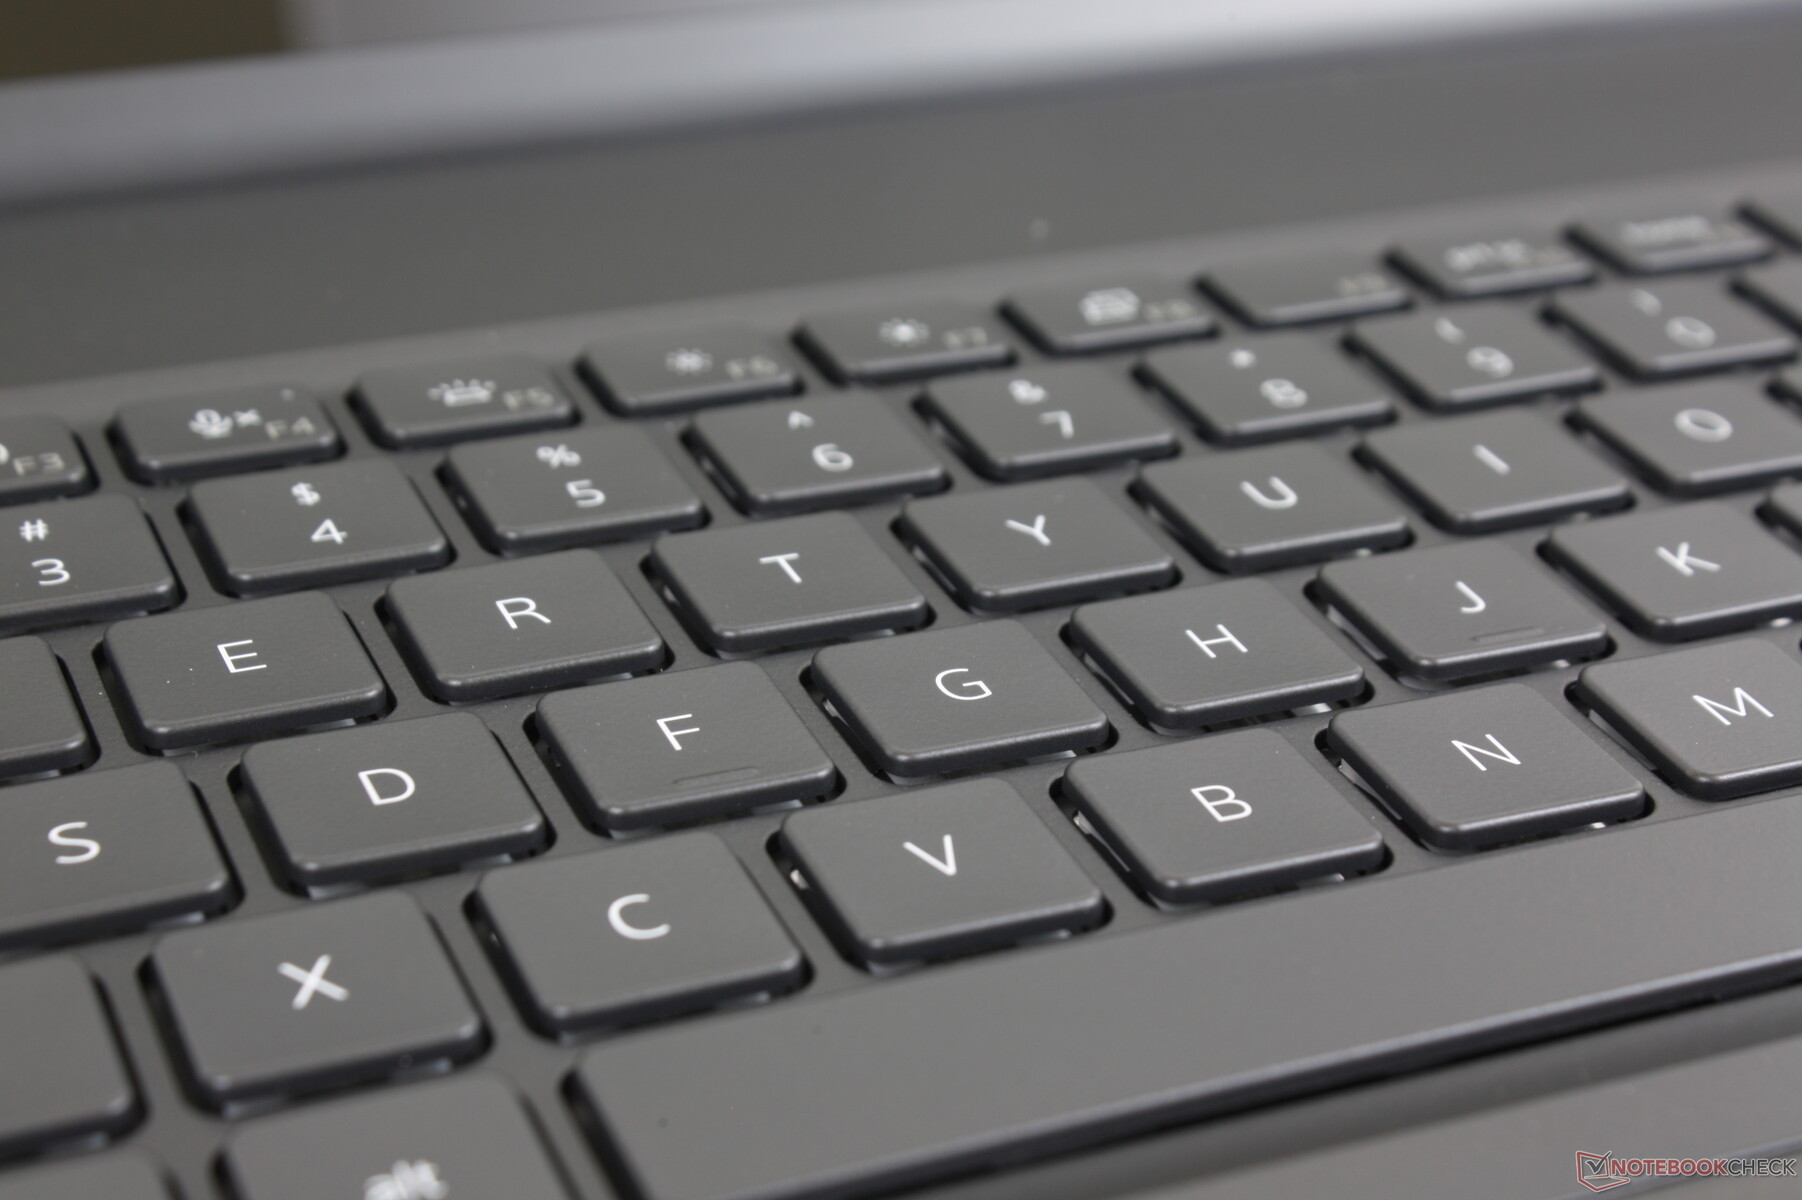
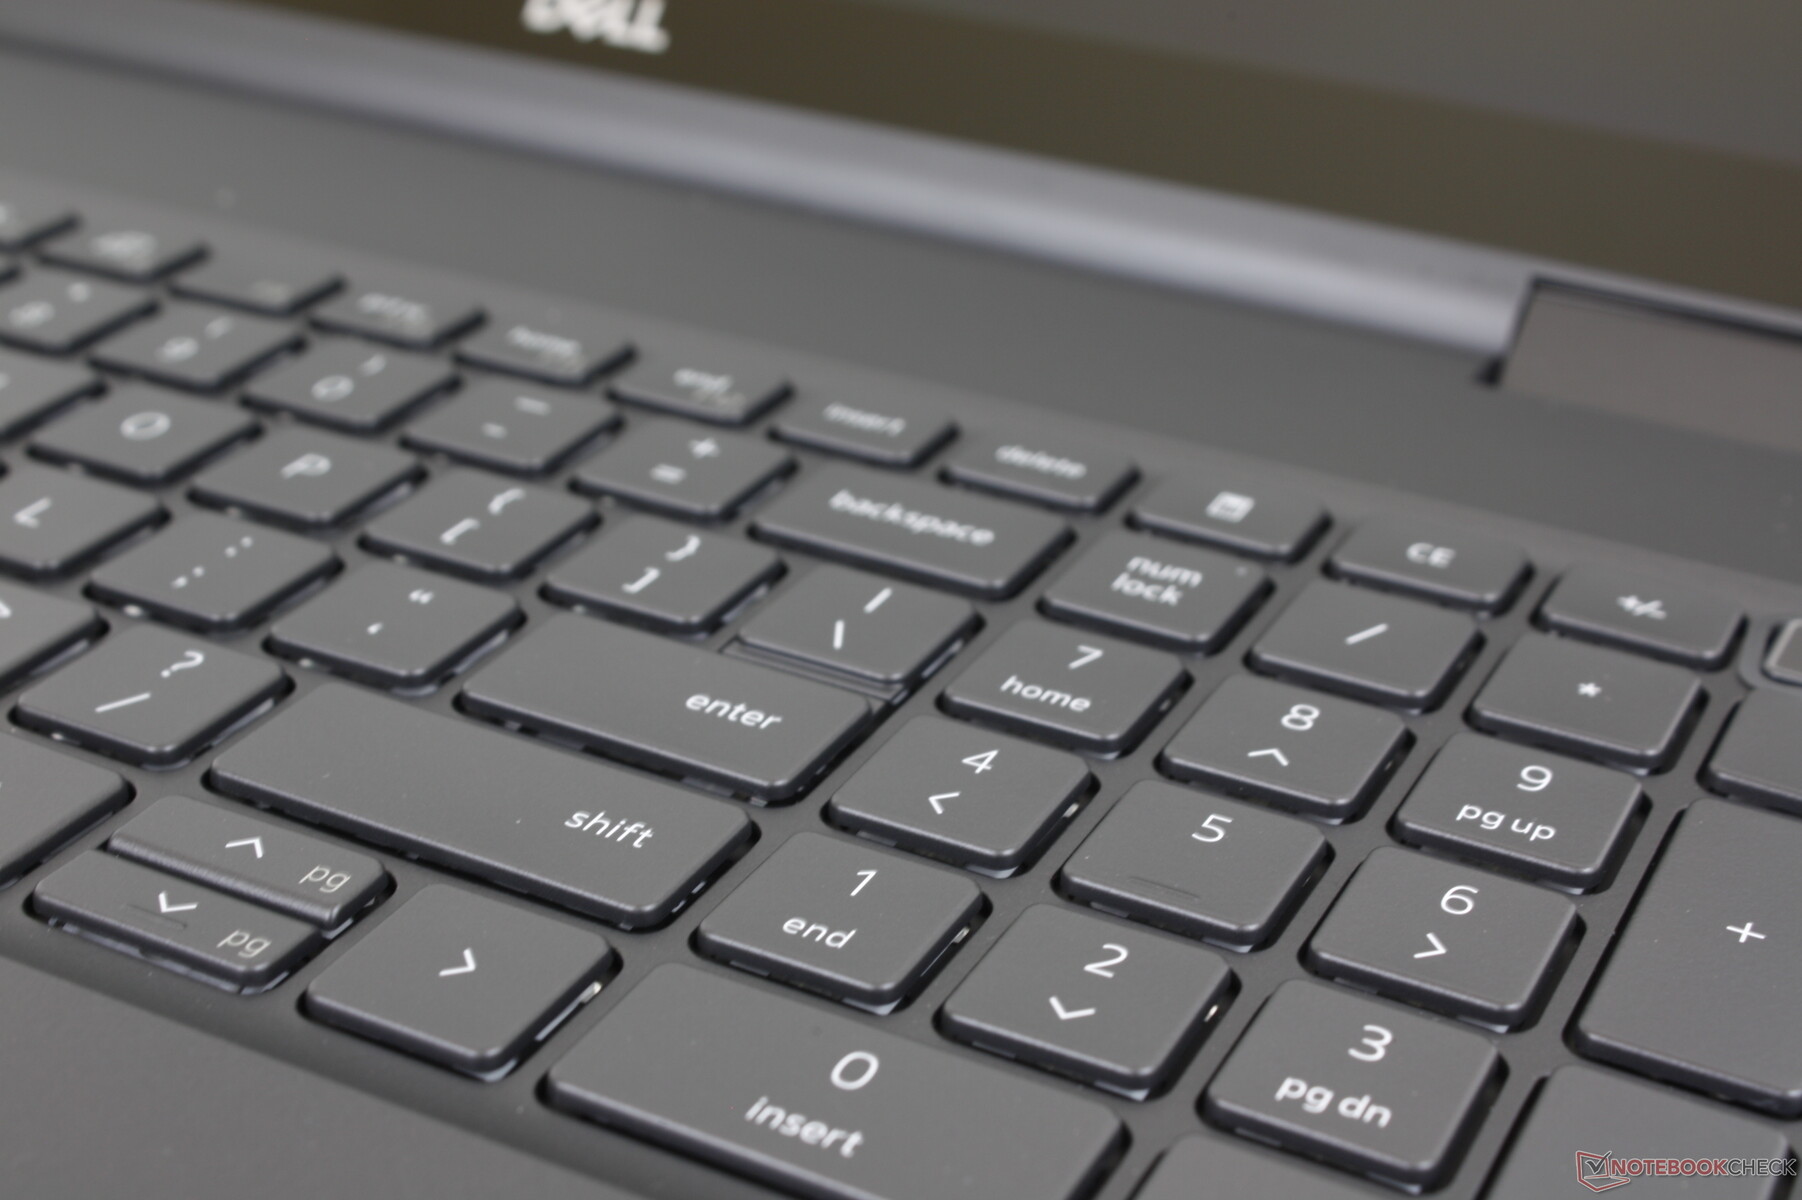
Toetsenbord
De lay-out van de toetsen en de feedback zijn niet veranderd ten opzichte van de Precision 7550. We vinden de toetsen iets luider dan de toetsen op de XPS-serie, maar met zowel een sterkere feedback als een diepere beweging. De pijltjestoetsen zijn echter nog steeds krap in tegenstelling tot de grotere pijltjestoetsen op de ThinkPad P1 G4 of Asus ProArt StudioBook.
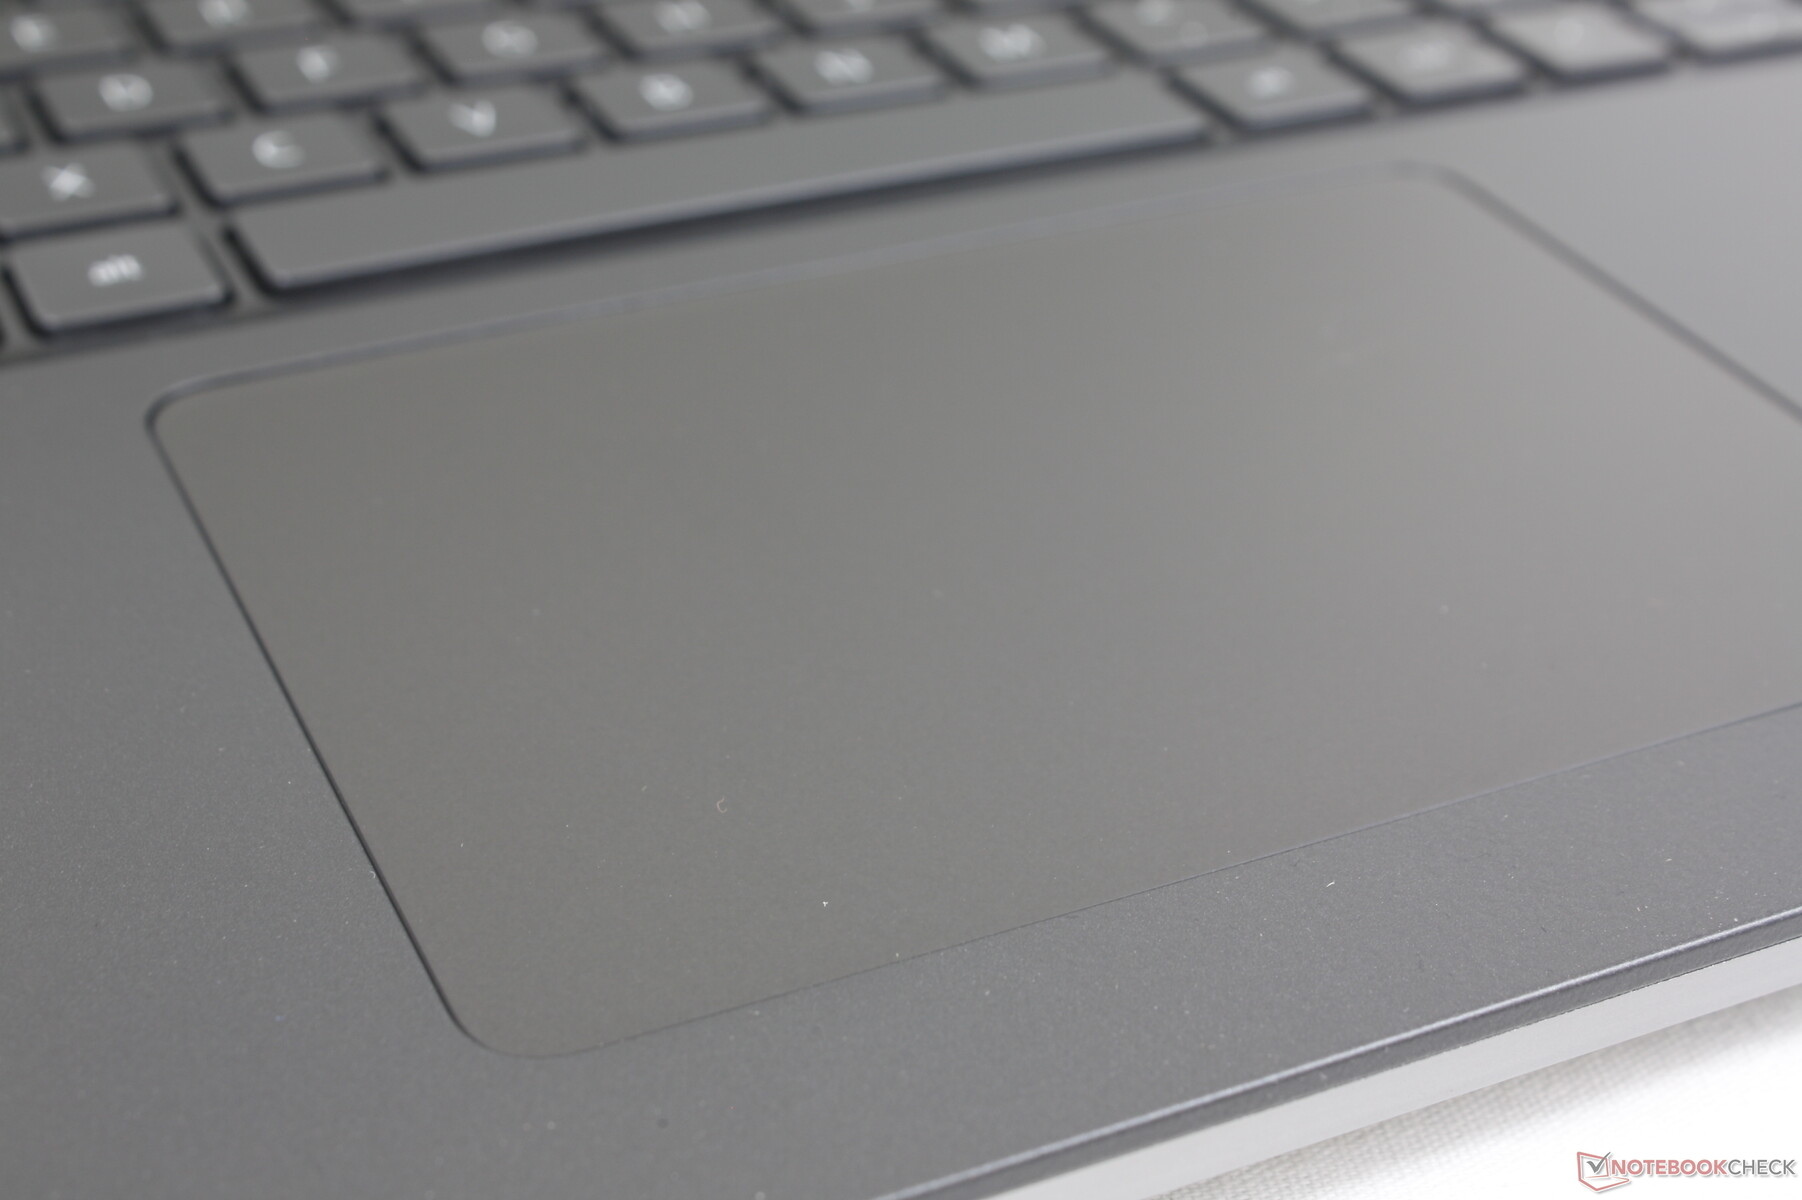
Touchpad
Het clickpad is groter dan dat van de Precision 7550 (11,5 x 8 cm vs. 10 x 6,5 cm). Er zijn echter geen speciale muisknoppen meer en dus staat de gebruikerservaring dichter bij een traditionele Ultrabook dan bij een zakelijke ThinkPad of ZBook waar muisknoppen nog prominent aanwezig zijn. Persoonlijk geven we de voorkeur aan speciale knoppen omdat drag-and-drop acties gemakkelijker worden, maar het gebrek aan knoppen heeft geresulteerd in een groter clickpad oppervlak dat anderen wellicht waarderen.
Display - Geen 120 Hz opties
Dell biedt op dit moment drie schermopties
- 1200p, 60 Hz, 60 procent sRGB, 250 nits, non-touch
- 1200p, 60 Hz, 99 procent DCI-P3, 500 nits, non-touch, IPS
- 2400p, 60 Hz, 100 procent DCI-P3, 400 nits, aanraakgevoelig, OLED
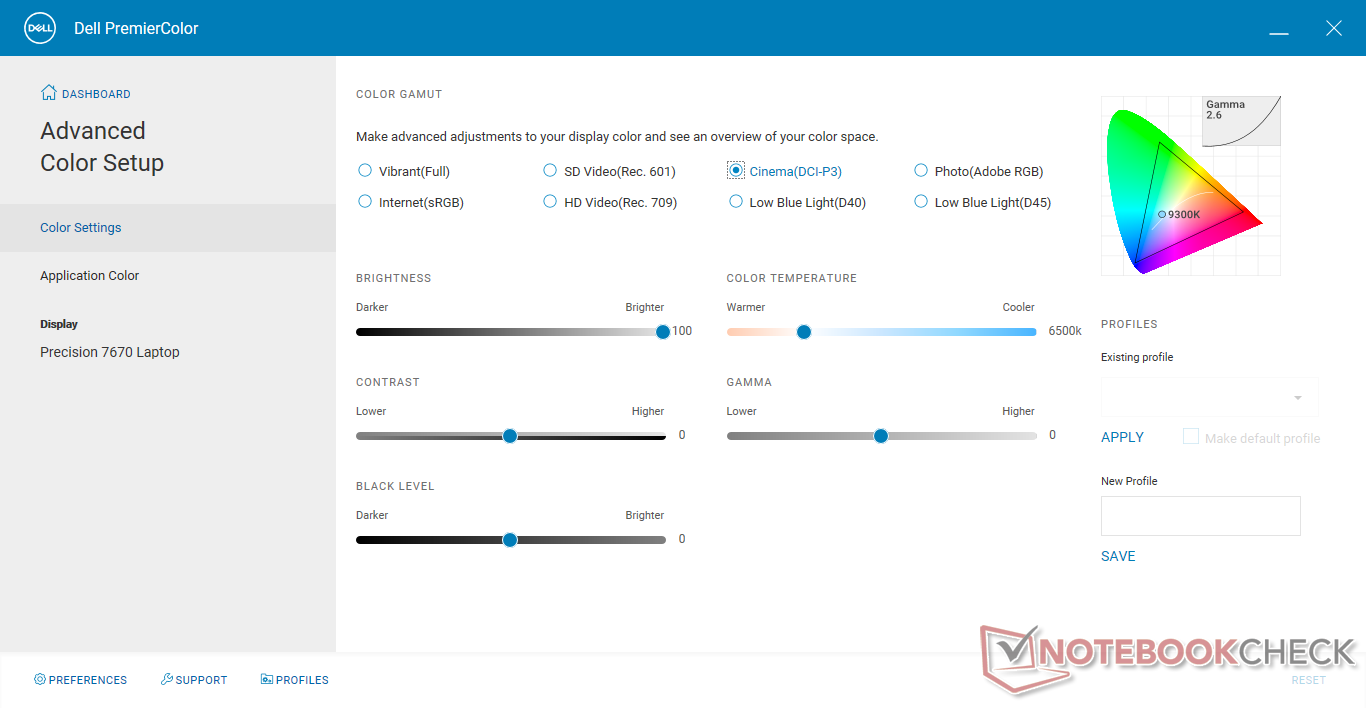
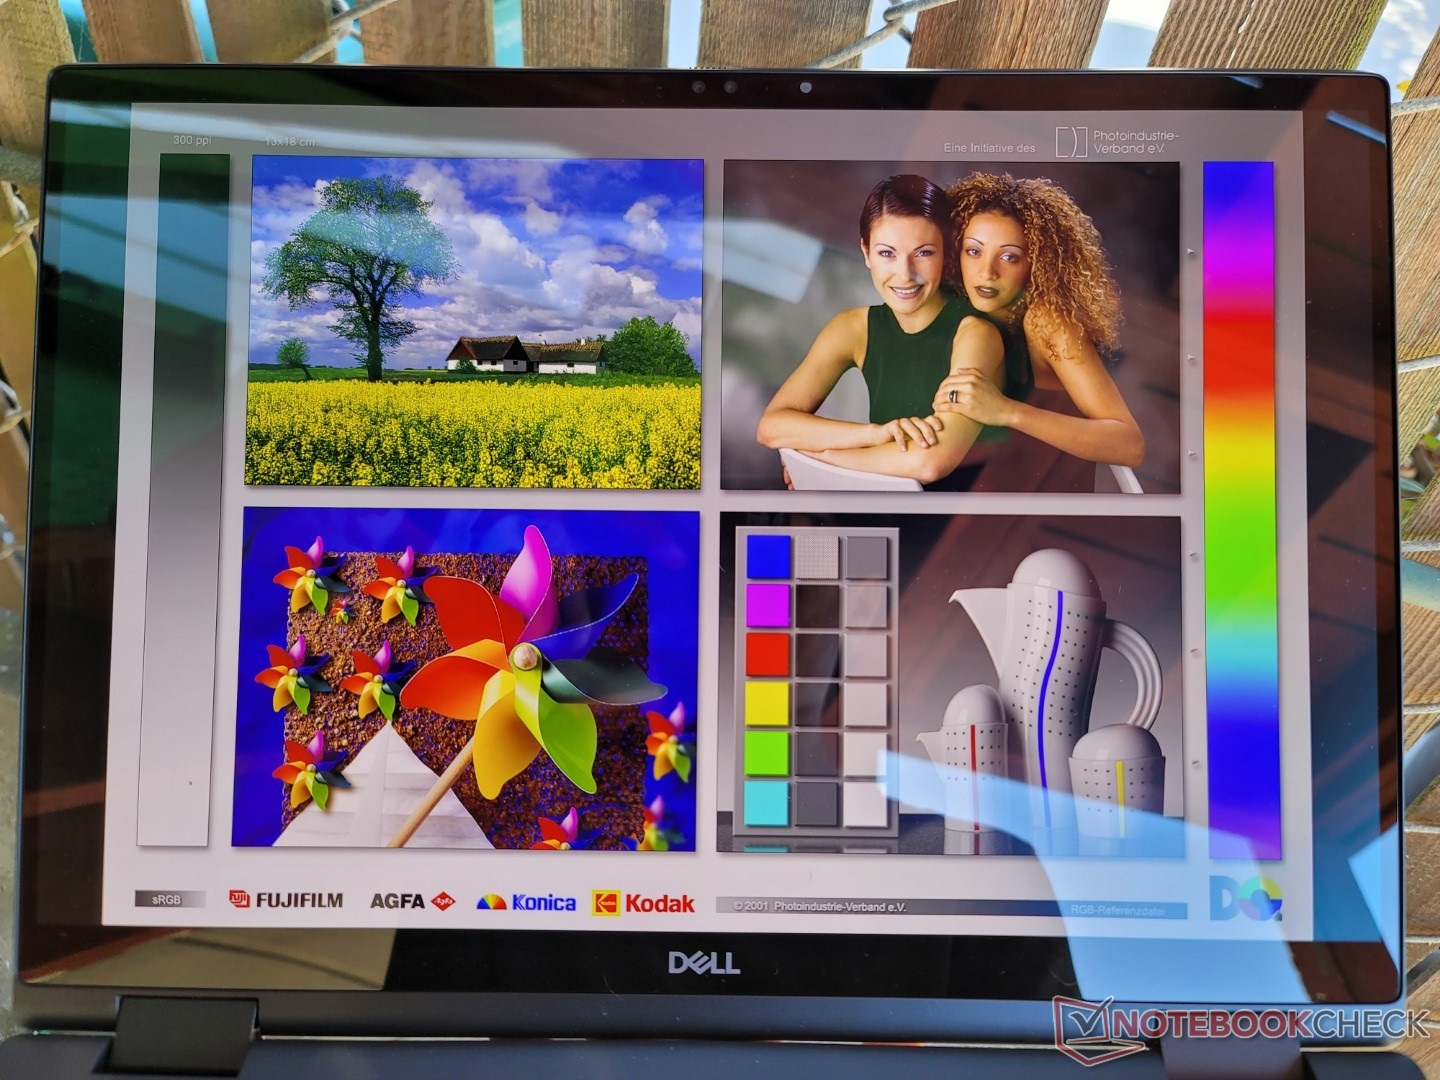
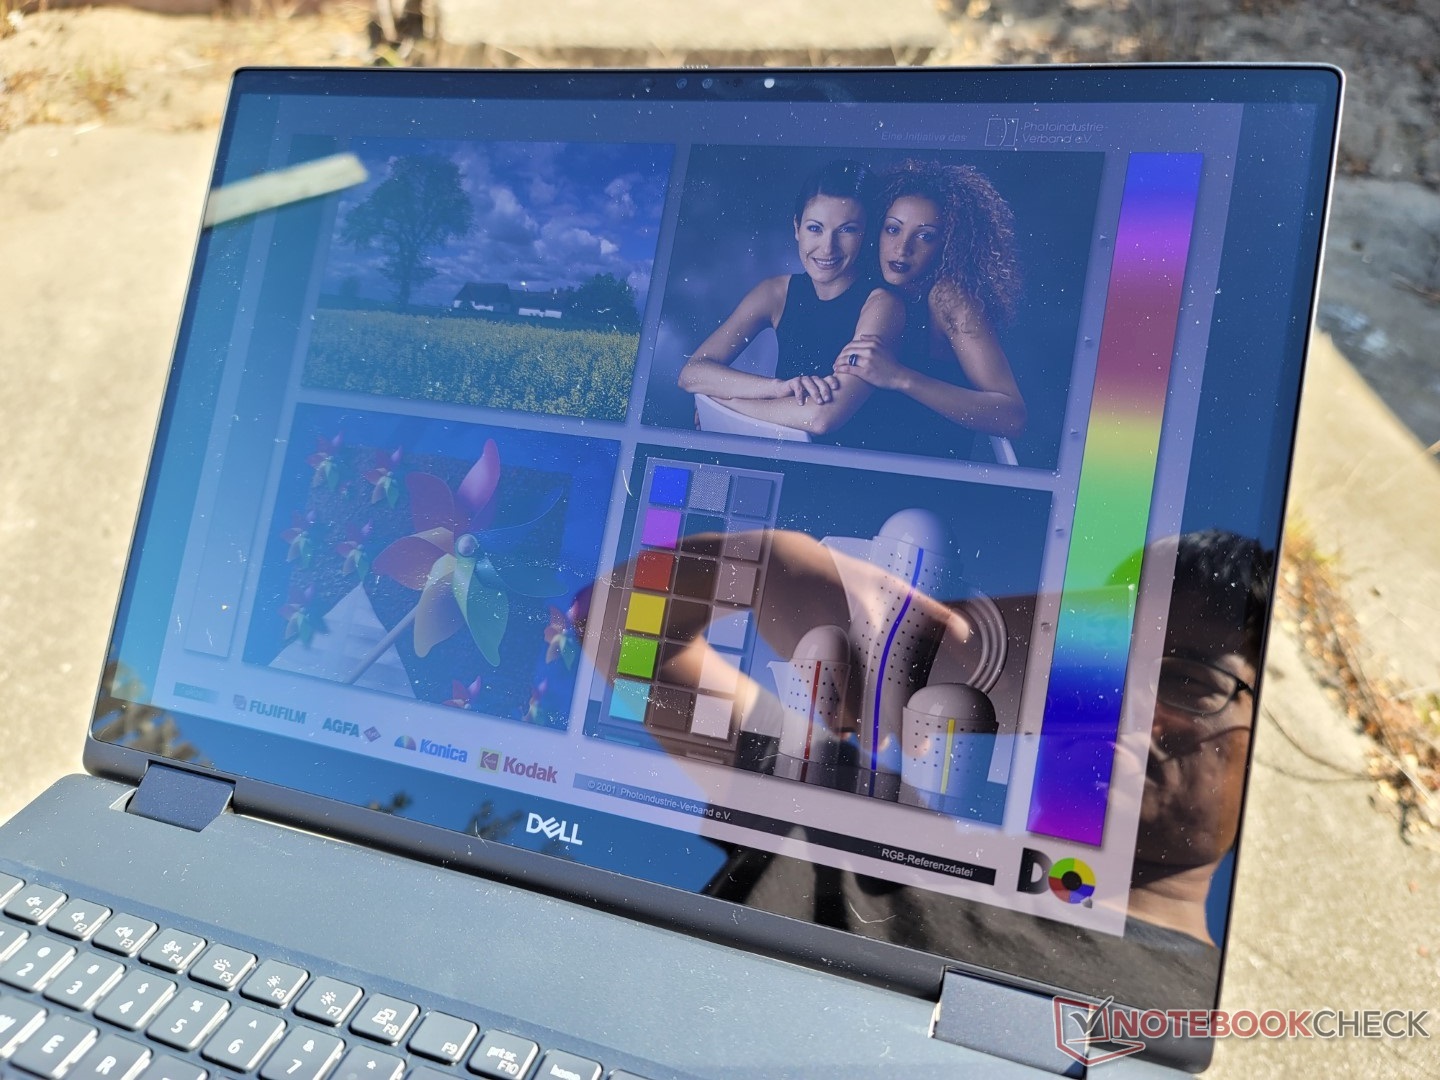
Onze onafhankelijke metingen hieronder weerspiegelen alleen de vetgedrukte optie hierboven. Als nauwkeurige kleuren belangrijk zijn voor uw werkbelasting, dan raden wij u ten zeerste aan de basisoptie met 250 nits te vermijden, aangezien de kleurweergave net zo slecht is als bij veel goedkope consumentenlaptops. Bezitters moeten vertrouwd raken met de Dell PremierColor software voor het aanpassen van het kleurprofiel van het beeldscherm
Hoewel we de volledige DCI-P3 dekking van het OLED paneel kunnen bevestigen met onze eigen X-Rite colorimeter, is de maximale helderheid van het scherm slechts ongeveer 340 nits vergeleken met de geadverteerde 400 nits, zelfs na het uitschakelen van de automatische helderheidsregeling. Dit maakt ons scherm zwakker dan op de meeste andere werkstations waar een helderheid van 450 nits of meer gebruikelijk is.
| |||||||||||||||||||||||||
Helderheidsverdeling: 98 %
Helderheid in Batterij-modus: 340.1 cd/m²
Contrast: ∞:1 (Zwart: 0 cd/m²)
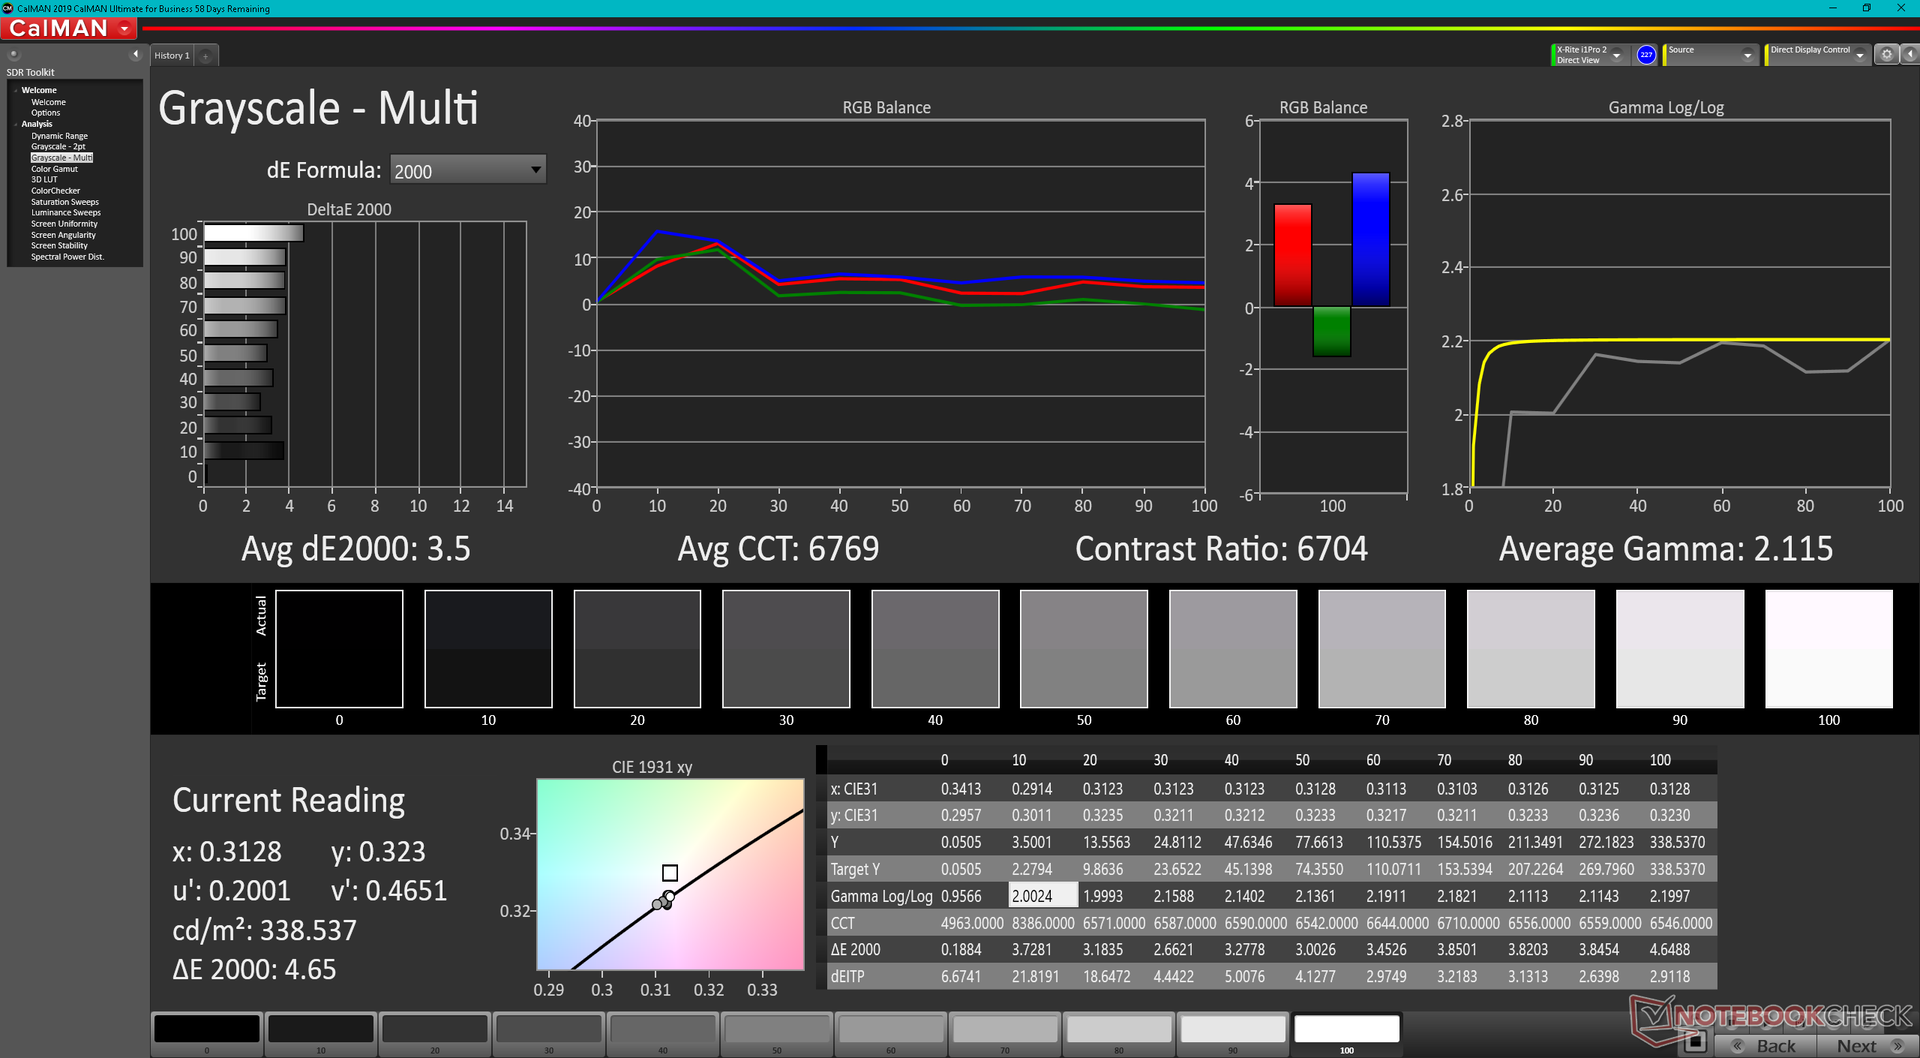
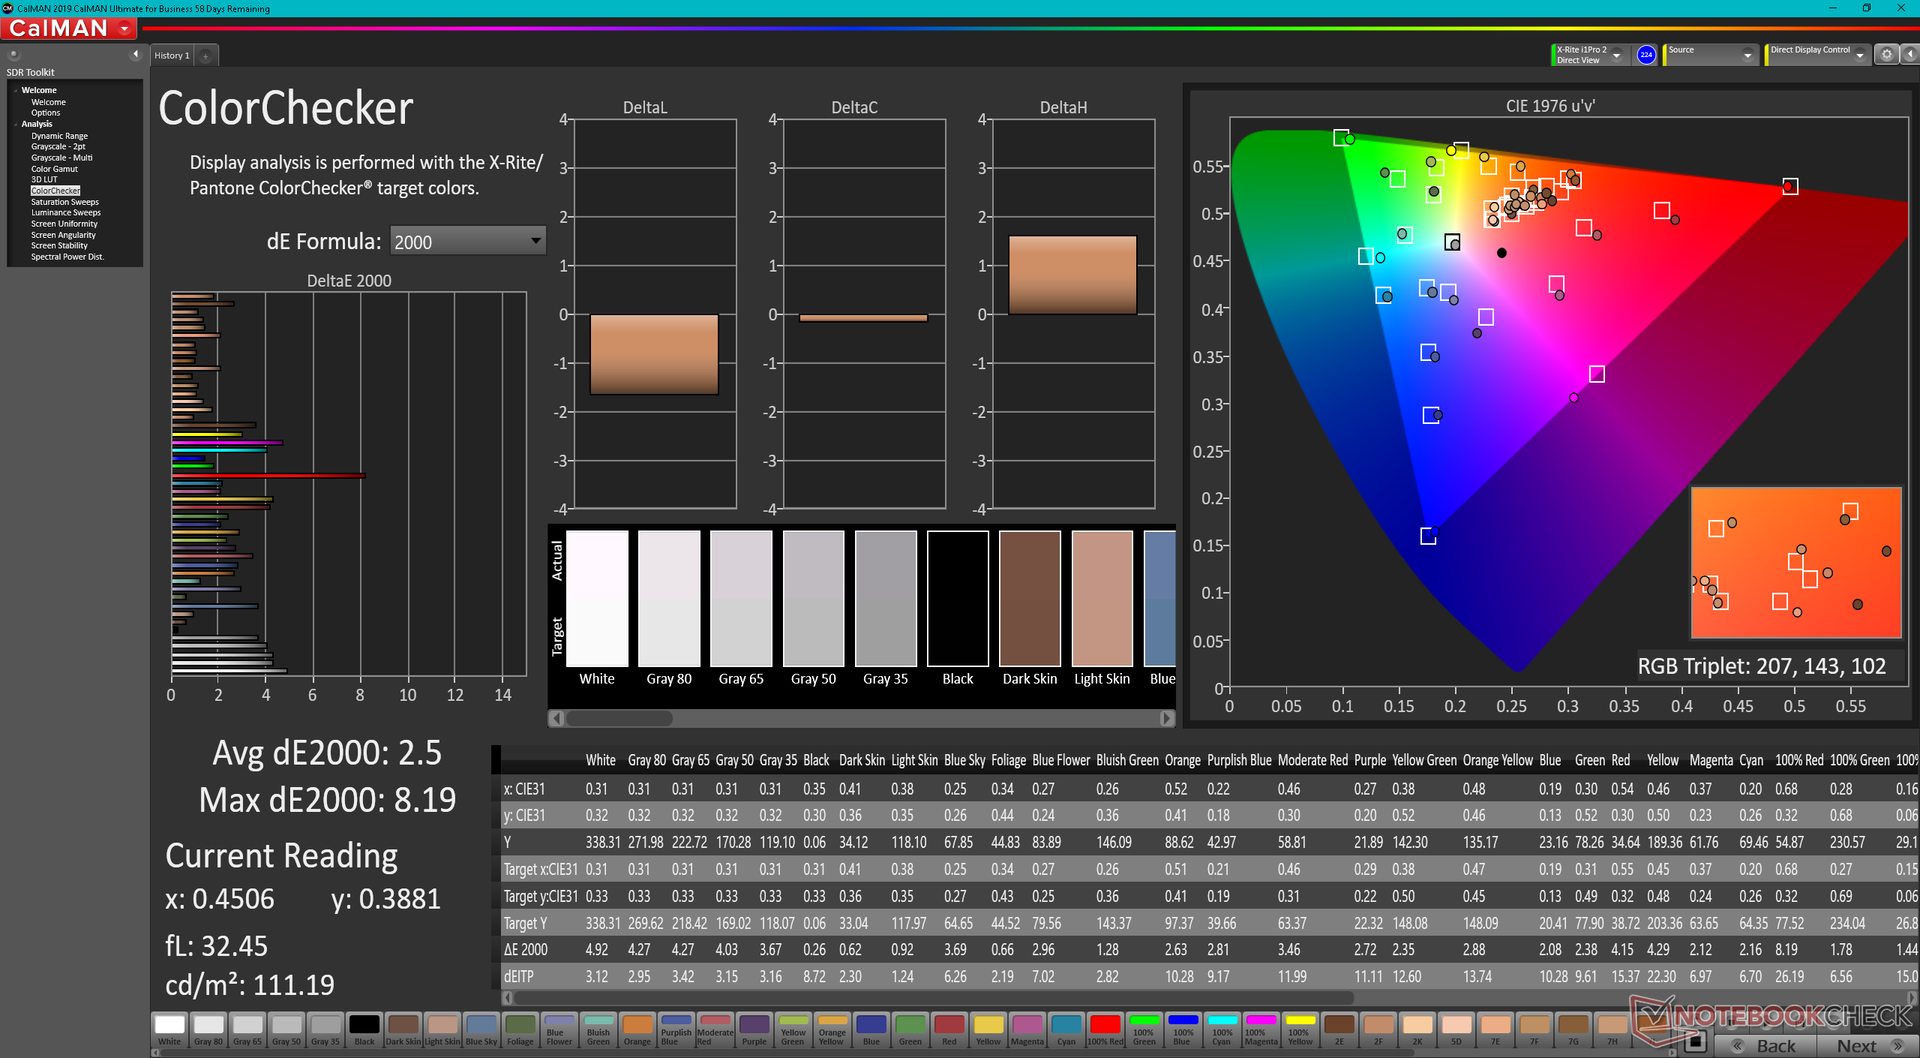
ΔE ColorChecker Calman: 2.5 | ∀{0.5-29.43 Ø4.71}
ΔE Greyscale Calman: 3.5 | ∀{0.09-98 Ø4.96}
97.5% AdobeRGB 1998 (Argyll 3D)
100% sRGB (Argyll 3D)
99.9% Display P3 (Argyll 3D)
Gamma: 2.12
CCT: 6704 K
| Dell Precision 7670 Samsung 160YV03, OLED, 3840x2400, 16" | Lenovo ThinkPad P1 G4-20Y4Z9DVUS NE160QDM-N63, IPS, 2560x1600, 16" | Asus ProArt StudioBook 16 W7600H5A-2BL2 ATNA60YV02-0, OLED, 3840x2400, 16" | Dell Precision 5000 5560 Sharp LQ156R1, IPS, 3840x2400, 15.6" | Dell Precision 7550 AU Optronics B156ZAN, IPS, 3840x2160, 15.6" | HP ZBook Fury 15 G8 BOE0969, IPS, 3840x2160, 15.6" | |
|---|---|---|---|---|---|---|
| Display | -17% | 0% | -1% | -6% | -5% | |
| Display P3 Coverage (%) | 99.9 | 72.7 -27% | 99.9 0% | 94.9 -5% | 82.1 -18% | 95.9 -4% |
| sRGB Coverage (%) | 100 | 99.3 -1% | 100 0% | 100 0% | 99.6 0% | 100 0% |
| AdobeRGB 1998 Coverage (%) | 97.5 | 74.7 -23% | 98.6 1% | 100 3% | 96.8 -1% | 87.3 -10% |
| Response Times | -1494% | -3% | -1902% | -2098% | -565% | |
| Response Time Grey 50% / Grey 80% * (ms) | 1.9 ? | 40.8 -2047% | 2 ? -5% | 47.2 ? -2384% | 51.2 ? -2595% | 14.8 ? -679% |
| Response Time Black / White * (ms) | 2 ? | 20.8 -940% | 2 ? -0% | 30.4 ? -1420% | 34 ? -1600% | 11 ? -450% |
| PWM Frequency (Hz) | 59.5 ? | 240 ? | ||||
| Screen | 7% | 18% | -4% | -16% | -10% | |
| Brightness middle (cd/m²) | 340.1 | 441 30% | 353 4% | 501.5 47% | 473.5 39% | 626 84% |
| Brightness (cd/m²) | 342 | 420 23% | 360 5% | 467 37% | 461 35% | 589 72% |
| Brightness Distribution (%) | 98 | 90 -8% | 96 -2% | 83 -15% | 90 -8% | 87 -11% |
| Black Level * (cd/m²) | 0.27 | 0.44 | 0.55 | 0.58 | ||
| Colorchecker dE 2000 * | 2.5 | 2.6 -4% | 2.45 2% | 4.73 -89% | 4.8 -92% | 5.41 -116% |
| Colorchecker dE 2000 max. * | 8.19 | 6 27% | 3.75 54% | 8.45 -3% | 8.73 -7% | 9.05 -11% |
| Greyscale dE 2000 * | 3.5 | 4.5 -29% | 1.88 46% | 3.6 -3% | 5.6 -60% | 6.2 -77% |
| Gamma | 2.12 104% | 2.18 101% | 2.31 95% | 2.08 106% | 2.34 94% | 2.66 83% |
| CCT | 6704 97% | 6623 98% | 6441 101% | 6447 101% | 7549 86% | 6101 107% |
| Contrast (:1) | 1633 | 1140 | 861 | 1079 | ||
| Colorchecker dE 2000 calibrated * | 1.2 | 2.77 | 0.51 | 3.08 | 0.6 | |
| Color Space (Percent of AdobeRGB 1998) (%) | 86.4 | |||||
| Color Space (Percent of sRGB) (%) | 99.7 | |||||
| Totaal Gemiddelde (Programma / Instellingen) | -501% /
-273% | 5% /
10% | -636% /
-348% | -707% /
-392% | -193% /
-109% |
* ... kleiner is beter
Nergens in de advertenties of materialen van Dell wordt melding gemaakt van een vooraf gekalibreerd beeldscherm in de fabriek. Grijstinten en kleuren zijn nog steeds redelijk nauwkeurig op ons OLED paneel, met gemiddelde deltaE waarden van respectievelijk slechts 3.5 en 2.5.
Responstijd Scherm
| ↔ Responstijd Zwart naar Wit | ||
|---|---|---|
| 2 ms ... stijging ↗ en daling ↘ gecombineerd | ↗ 0.8 ms stijging |  |
| ↘ 1.2 ms daling | ||
| Het scherm vertoonde erg snelle responstijden in onze tests en zou zeer geschikt moeten zijn voor snelle games. Ter vergelijking: alle testtoestellen variëren van 0.1 (minimum) tot 240 (maximum) ms. » 11 % van alle toestellen zijn beter. Dit betekent dat de gemeten responstijd beter is dan het gemiddelde (19.8 ms) van alle geteste toestellen. | ||
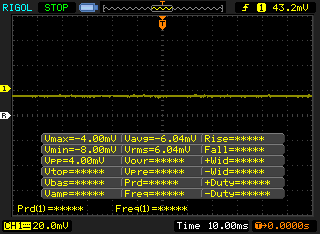
| ↔ Responstijd 50% Grijs naar 80% Grijs | ||
| 1.9 ms ... stijging ↗ en daling ↘ gecombineerd | ↗ 1.1 ms stijging | 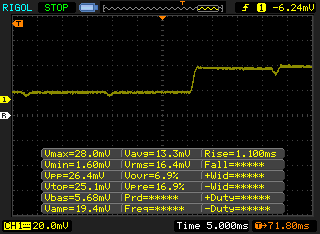 |
| ↘ 0.8 ms daling | ||
| Het scherm vertoonde erg snelle responstijden in onze tests en zou zeer geschikt moeten zijn voor snelle games. Ter vergelijking: alle testtoestellen variëren van 0.165 (minimum) tot 636 (maximum) ms. » 9 % van alle toestellen zijn beter. Dit betekent dat de gemeten responstijd beter is dan het gemiddelde (31 ms) van alle geteste toestellen. | ||
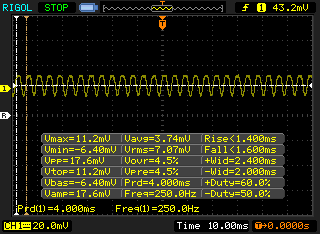
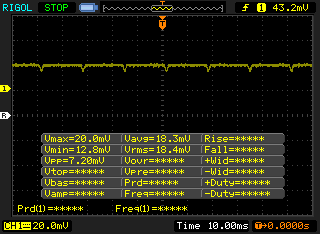
Screen Flickering / PWM (Pulse-Width Modulation)
| Screen flickering / PWM waargenomen | 59.5 Hz | ≤ 100 % helderheid instelling | 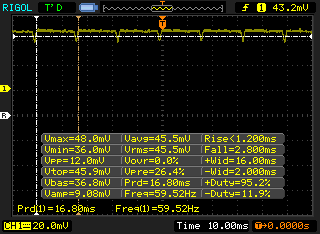 |
De achtergrondverlichting van het scherm flikkert op 59.5 Hz (in het slechtste geval, bijvoorbeeld bij gebruik van PWM) aan een helderheid van 100 % en lager. Boven deze helderheid zou er geen flickering / PWM mogen optreden. De frequentie van 59.5 Hz is erg laag en kan dus aanleiding geven tot geïrriteerde ogen en hoofdpijn bij langer gebruik. Ter vergelijking: 52 % van alle geteste toestellen maakten geen gebruik van PWM om de schermhelderheid te verlagen. Als het wel werd gebruikt, werd een gemiddelde van 7754 (minimum: 5 - maximum: 343500) Hz waargenomen. | |||
Flikkering is aanwezig op alle helderheidsniveaus, net als bij de meeste andere OLED-panelen. We detecteren een frequentie van 250 Hz van 1 tot 56 procent helderheid en 59,5 Hz van 57 procent helderheid tot maximaal.

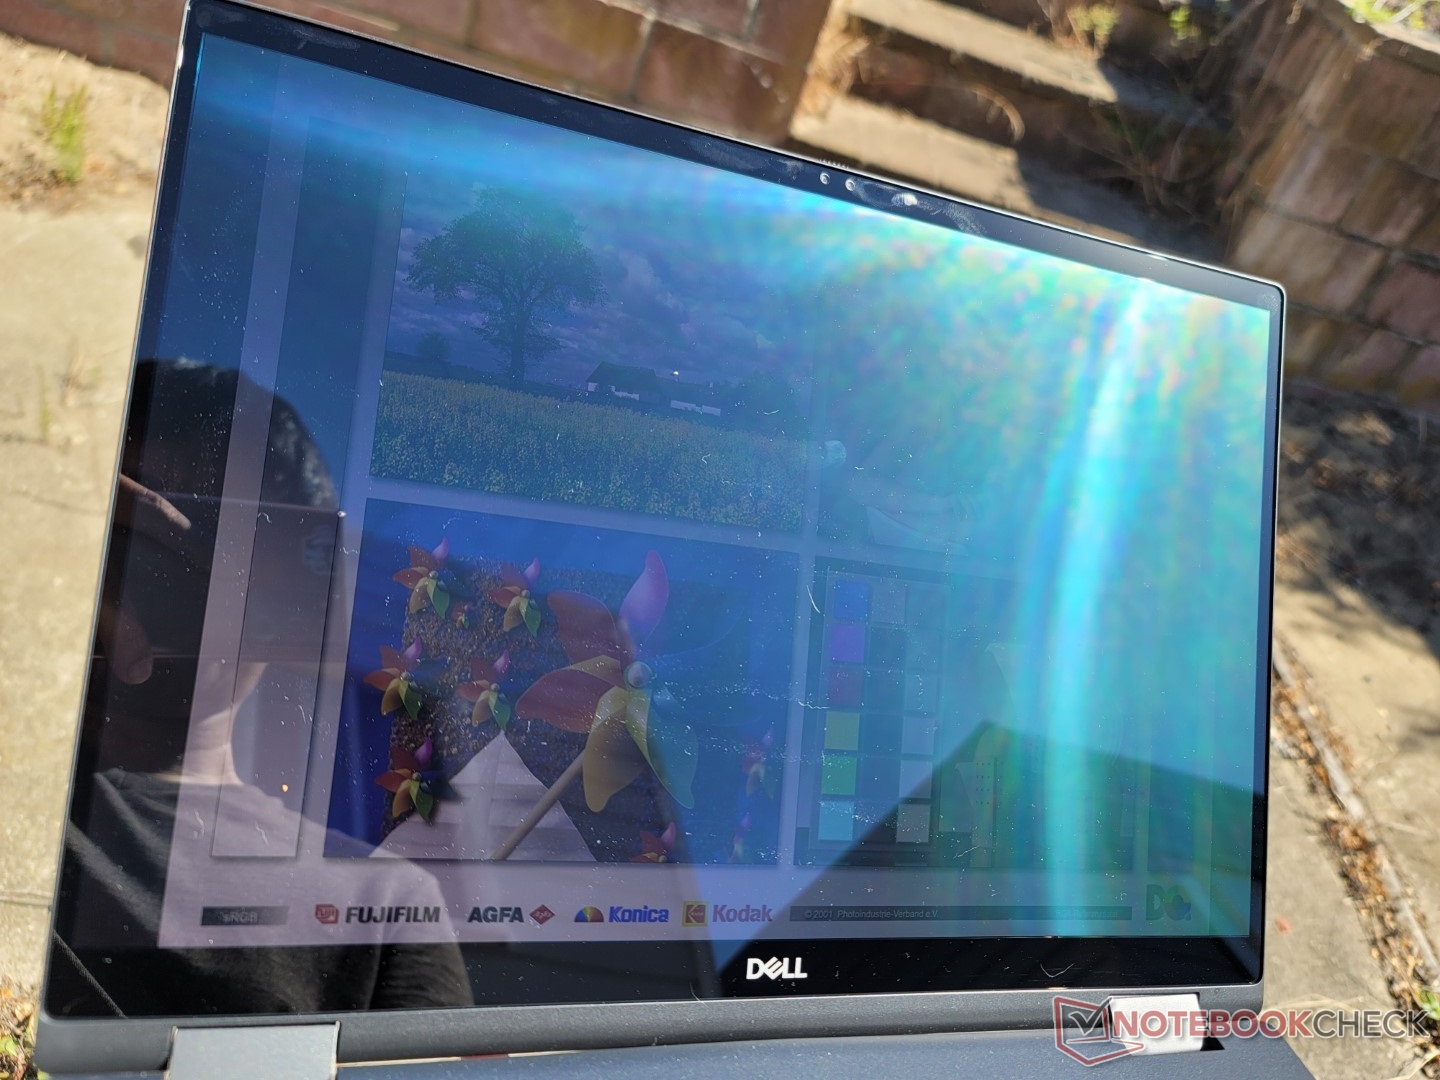
Er is veel schittering ondanks het feit dat dit technisch gezien een "anti-glare" scherm is. De achtergrondverlichting is niet helder genoeg voor comfortabel kijken in de meeste buitensituaties, tenzij je toevallig in de schaduw zit. Als outdoor zichtbaarheid belangrijk is, dan raden we aan te kijken naar deHP ZBook Fury 15 G8 met een scherm dat bijna twee keer zo helder is als ons Precision toestel.
Prestaties - Intel vPro voor iedereen
Testomstandigheden
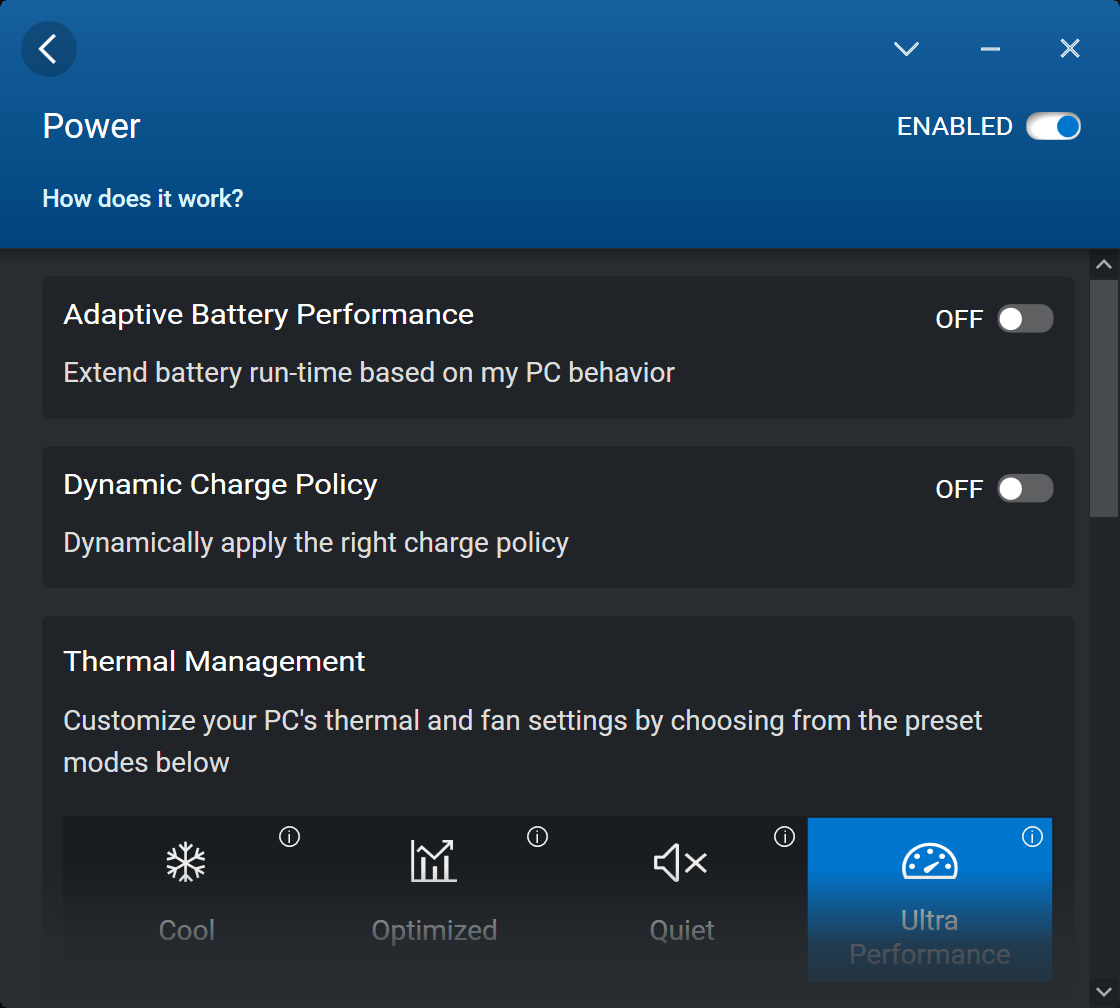
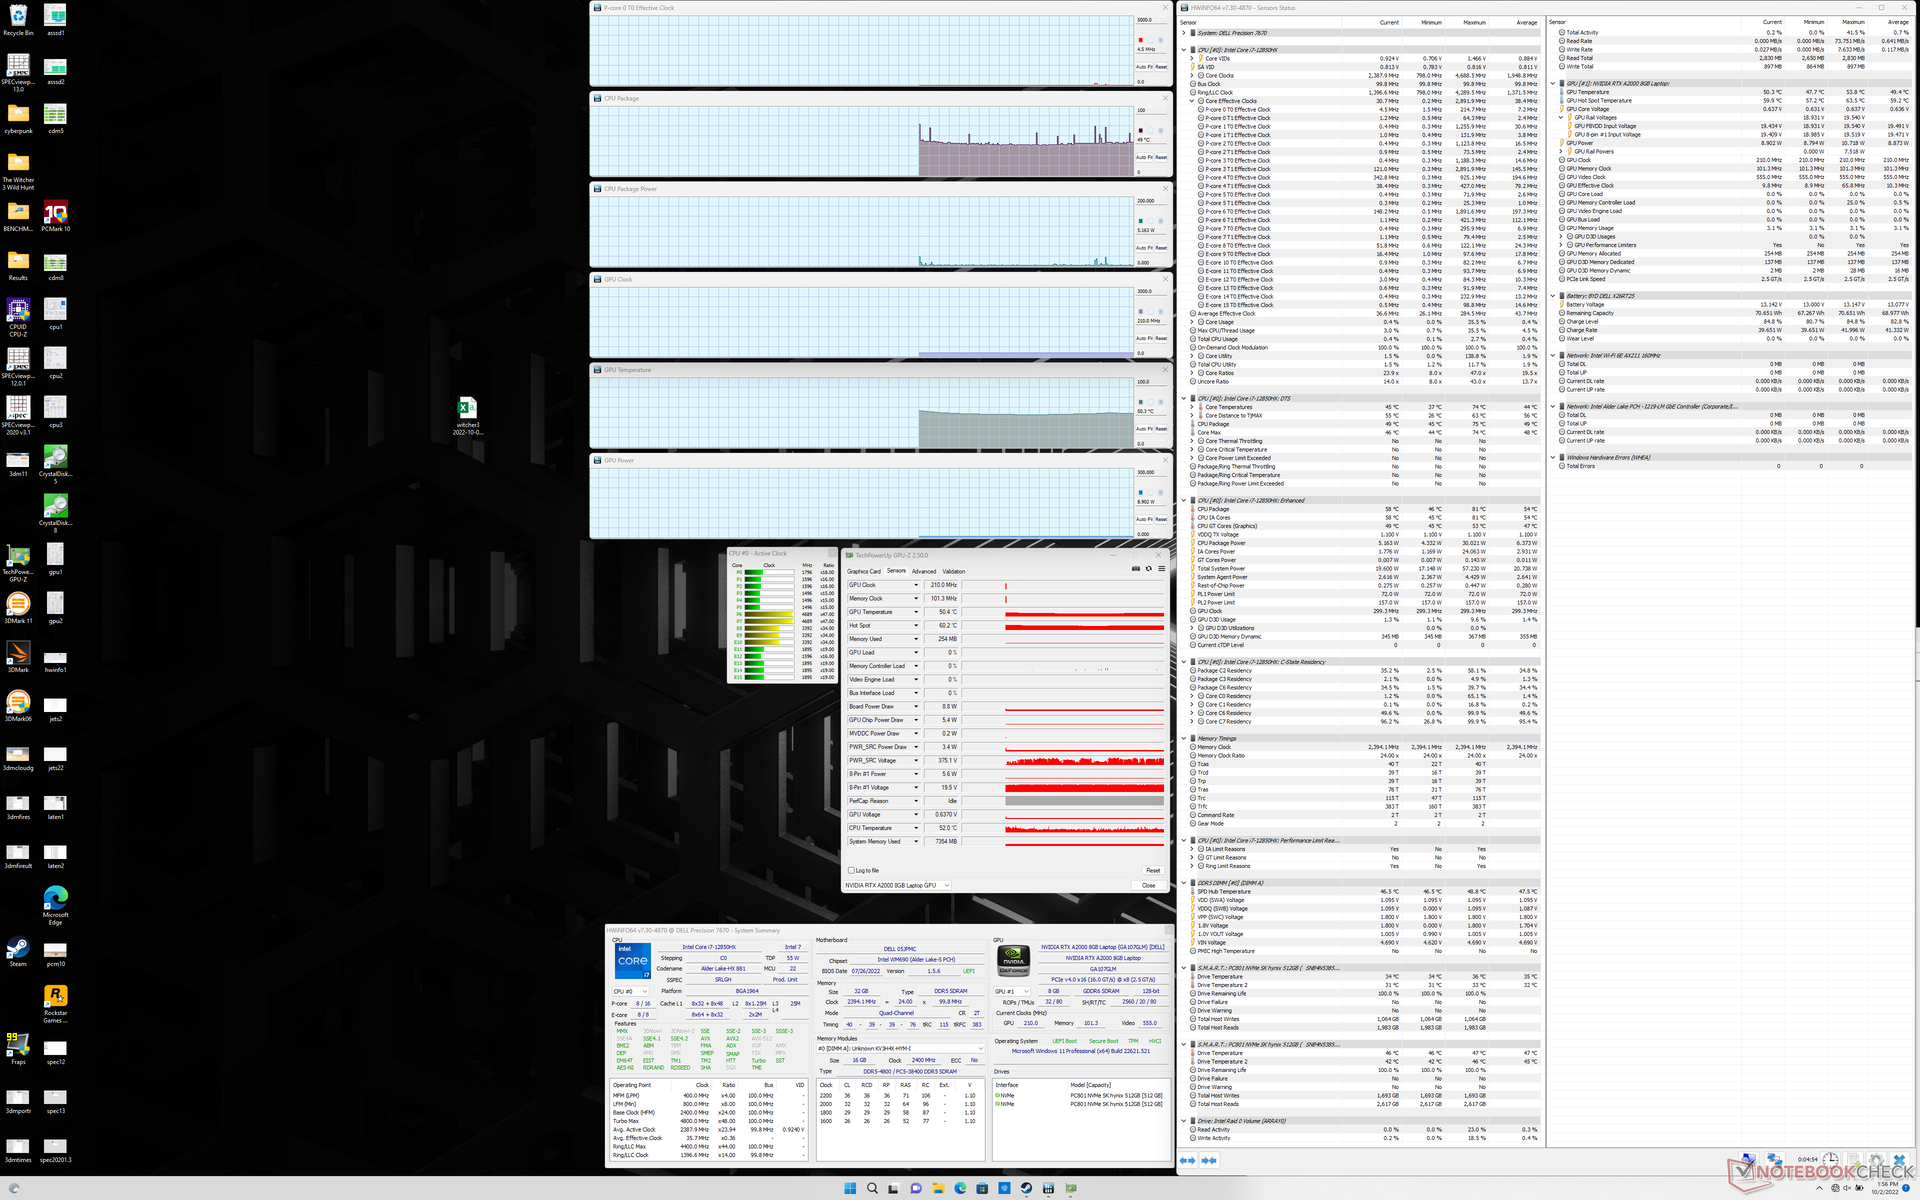
We hebben ons toestel via de Dell Optimizer software ingesteld op Ultra Performance modus en de GPU op discrete modus via het Nvidia Control Panel voordat we onderstaande benchmarks uitvoerden. Vervelend genoeg kan het energieprofiel worden ingesteld via Windows, Dell Optimizer of Dell Power Manager, wat de zaken erg verwarrend kan maken. Wij raden aan de synchronisatie van het energieprofiel tussen de drie verschillende toepassingen in te schakelen via Optimizer, zoals blijkt uit onderstaande schermafbeelding.
Processor
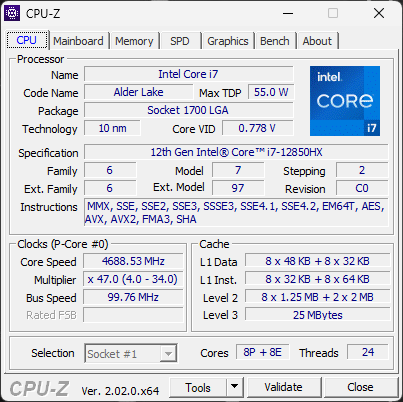
Op papier is de Core i7-12850HX deelt vergelijkbare kloksnelheden, core count, en cache maten als de i7-12800HX maar met toegevoegde vPro ondersteuning. In werkelijkheid kunnen hun prestaties echter behoorlijk verschillen
De CPU-prestaties liggen dichter bij de Core i7-12800H dan bij de Core i7-12800HX. In feite zijn multi-thread prestaties ongeveer 30 procent langzamer dan de i7-12800HX zoals gevonden op de MSI GE67 HXals gevolg van zijn meer capabele koeling oplossing. Toch zijn de prestaties nog steeds een van de snelste in vergelijking met andere werkstations, omdat velen nog steeds draaien op 11e generatie Intel CPU's.
Turbo Boost duurzaamheid had beter gekund. Bij het draaien van CineBench R15 xT in een lus, daalden de prestaties met maar liefst 25 procent na twee of drie herhalingen, wat de grote prestatieachterstand ten opzichte van de bovengenoemde Core i7-12800HX zou helpen verklaren.
Cinebench R15 Multi Loop
Cinebench R23: Multi Core | Single Core
Cinebench R15: CPU Multi 64Bit | CPU Single 64Bit
Blender: v2.79 BMW27 CPU
7-Zip 18.03: 7z b 4 | 7z b 4 -mmt1
Geekbench 5.5: Multi-Core | Single-Core
HWBOT x265 Benchmark v2.2: 4k Preset
LibreOffice : 20 Documents To PDF
R Benchmark 2.5: Overall mean
| Cinebench R20 / CPU (Multi Core) | |
| MSI GE67 HX 12UGS | |
| Gemiddeld Intel Core i7-12850HX (6217 - 6764, n=2) | |
| Dell Precision 7670 | |
| Razer Blade 17 RTX 3080 Ti | |
| Lenovo Legion 7 16ARHA7 | |
| HP Envy 16 h0112nr | |
| Asus Zenbook Pro 15 OLED UM535Q | |
| Lenovo ThinkPad P1 G4-20Y4Z9DVUS | |
| HP ZBook Fury 15 G8 | |
| Dell Precision 5000 5470 | |
| Asus ProArt StudioBook 16 W7600H5A-2BL2 | |
| Dell Precision 7550 | |
| Dell Precision 5000 5560 | |
| Cinebench R20 / CPU (Single Core) | |
| Razer Blade 17 RTX 3080 Ti | |
| Gemiddeld Intel Core i7-12850HX (687 - 708, n=2) | |
| Dell Precision 7670 | |
| Dell Precision 5000 5470 | |
| HP Envy 16 h0112nr | |
| MSI GE67 HX 12UGS | |
| HP ZBook Fury 15 G8 | |
| Lenovo Legion 7 16ARHA7 | |
| Lenovo ThinkPad P1 G4-20Y4Z9DVUS | |
| Dell Precision 5000 5560 | |
| Asus Zenbook Pro 15 OLED UM535Q | |
| Asus ProArt StudioBook 16 W7600H5A-2BL2 | |
| Dell Precision 7550 | |
| Cinebench R23 / Multi Core | |
| MSI GE67 HX 12UGS | |
| Gemiddeld Intel Core i7-12850HX (15093 - 17510, n=2) | |
| Razer Blade 17 RTX 3080 Ti | |
| Dell Precision 7670 | |
| Lenovo Legion 7 16ARHA7 | |
| HP Envy 16 h0112nr | |
| Dell Precision 5000 5470 | |
| Asus Zenbook Pro 15 OLED UM535Q | |
| Lenovo ThinkPad P1 G4-20Y4Z9DVUS | |
| HP ZBook Fury 15 G8 | |
| Asus ProArt StudioBook 16 W7600H5A-2BL2 | |
| Dell Precision 5000 5560 | |
| Cinebench R23 / Single Core | |
| Razer Blade 17 RTX 3080 Ti | |
| MSI GE67 HX 12UGS | |
| Dell Precision 5000 5470 | |
| HP Envy 16 h0112nr | |
| Gemiddeld Intel Core i7-12850HX (1596 - 1845, n=2) | |
| HP ZBook Fury 15 G8 | |
| Dell Precision 7670 | |
| Lenovo Legion 7 16ARHA7 | |
| Dell Precision 5000 5560 | |
| Lenovo ThinkPad P1 G4-20Y4Z9DVUS | |
| Asus ProArt StudioBook 16 W7600H5A-2BL2 | |
| Asus Zenbook Pro 15 OLED UM535Q | |
| Cinebench R15 / CPU Multi 64Bit | |
| MSI GE67 HX 12UGS | |
| Gemiddeld Intel Core i7-12850HX (2432 - 2926, n=2) | |
| HP Envy 16 h0112nr | |
| Dell Precision 7670 | |
| Lenovo Legion 7 16ARHA7 | |
| Dell Precision 5000 5470 | |
| Razer Blade 17 RTX 3080 Ti | |
| Asus Zenbook Pro 15 OLED UM535Q | |
| Lenovo ThinkPad P1 G4-20Y4Z9DVUS | |
| Asus ProArt StudioBook 16 W7600H5A-2BL2 | |
| HP ZBook Fury 15 G8 | |
| Dell Precision 7550 | |
| Dell Precision 5000 5560 | |
| Cinebench R15 / CPU Single 64Bit | |
| Razer Blade 17 RTX 3080 Ti | |
| Gemiddeld Intel Core i7-12850HX (253 - 268, n=2) | |
| MSI GE67 HX 12UGS | |
| HP Envy 16 h0112nr | |
| Dell Precision 7670 | |
| Lenovo Legion 7 16ARHA7 | |
| Dell Precision 5000 5470 | |
| HP ZBook Fury 15 G8 | |
| Asus Zenbook Pro 15 OLED UM535Q | |
| Dell Precision 5000 5560 | |
| Lenovo ThinkPad P1 G4-20Y4Z9DVUS | |
| Asus ProArt StudioBook 16 W7600H5A-2BL2 | |
| Dell Precision 7550 | |
| Blender / v2.79 BMW27 CPU | |
| Dell Precision 5000 5560 | |
| Dell Precision 7550 | |
| Asus ProArt StudioBook 16 W7600H5A-2BL2 | |
| HP ZBook Fury 15 G8 | |
| Lenovo ThinkPad P1 G4-20Y4Z9DVUS | |
| HP Envy 16 h0112nr | |
| Dell Precision 5000 5470 | |
| Asus Zenbook Pro 15 OLED UM535Q | |
| Razer Blade 17 RTX 3080 Ti | |
| Lenovo Legion 7 16ARHA7 | |
| Dell Precision 7670 | |
| Gemiddeld Intel Core i7-12850HX (181 - 205, n=2) | |
| MSI GE67 HX 12UGS | |
| 7-Zip 18.03 / 7z b 4 | |
| MSI GE67 HX 12UGS | |
| Lenovo Legion 7 16ARHA7 | |
| Razer Blade 17 RTX 3080 Ti | |
| Gemiddeld Intel Core i7-12850HX (53893 - 69464, n=2) | |
| Asus Zenbook Pro 15 OLED UM535Q | |
| HP Envy 16 h0112nr | |
| Dell Precision 7670 | |
| Dell Precision 5000 5470 | |
| Lenovo ThinkPad P1 G4-20Y4Z9DVUS | |
| HP ZBook Fury 15 G8 | |
| Dell Precision 7550 | |
| Asus ProArt StudioBook 16 W7600H5A-2BL2 | |
| Dell Precision 5000 5560 | |
| 7-Zip 18.03 / 7z b 4 -mmt1 | |
| Razer Blade 17 RTX 3080 Ti | |
| Gemiddeld Intel Core i7-12850HX (5608 - 5916, n=2) | |
| HP ZBook Fury 15 G8 | |
| Dell Precision 5000 5560 | |
| HP Envy 16 h0112nr | |
| Lenovo Legion 7 16ARHA7 | |
| MSI GE67 HX 12UGS | |
| Dell Precision 7670 | |
| Lenovo ThinkPad P1 G4-20Y4Z9DVUS | |
| Asus Zenbook Pro 15 OLED UM535Q | |
| Dell Precision 5000 5470 | |
| Dell Precision 7550 | |
| Asus ProArt StudioBook 16 W7600H5A-2BL2 | |
| Geekbench 5.5 / Multi-Core | |
| MSI GE67 HX 12UGS | |
| Razer Blade 17 RTX 3080 Ti | |
| HP Envy 16 h0112nr | |
| Gemiddeld Intel Core i7-12850HX (11509 - 13095, n=2) | |
| Dell Precision 5000 5470 | |
| Dell Precision 7670 | |
| Lenovo Legion 7 16ARHA7 | |
| Asus Zenbook Pro 15 OLED UM535Q | |
| Dell Precision 7550 | |
| Asus ProArt StudioBook 16 W7600H5A-2BL2 | |
| Lenovo ThinkPad P1 G4-20Y4Z9DVUS | |
| Geekbench 5.5 / Single-Core | |
| Dell Precision 5000 5470 | |
| Gemiddeld Intel Core i7-12850HX (1777 - 1787, n=2) | |
| Dell Precision 7670 | |
| HP Envy 16 h0112nr | |
| MSI GE67 HX 12UGS | |
| Razer Blade 17 RTX 3080 Ti | |
| Lenovo Legion 7 16ARHA7 | |
| Lenovo ThinkPad P1 G4-20Y4Z9DVUS | |
| Asus Zenbook Pro 15 OLED UM535Q | |
| Asus ProArt StudioBook 16 W7600H5A-2BL2 | |
| Dell Precision 7550 | |
| HWBOT x265 Benchmark v2.2 / 4k Preset | |
| MSI GE67 HX 12UGS | |
| Lenovo Legion 7 16ARHA7 | |
| Dell Precision 7670 | |
| Gemiddeld Intel Core i7-12850HX (17.2 - 17.3, n=2) | |
| Razer Blade 17 RTX 3080 Ti | |
| Asus Zenbook Pro 15 OLED UM535Q | |
| HP Envy 16 h0112nr | |
| HP ZBook Fury 15 G8 | |
| Lenovo ThinkPad P1 G4-20Y4Z9DVUS | |
| Asus ProArt StudioBook 16 W7600H5A-2BL2 | |
| Dell Precision 5000 5470 | |
| Dell Precision 7550 | |
| Dell Precision 5000 5560 | |
| LibreOffice / 20 Documents To PDF | |
| Lenovo Legion 7 16ARHA7 | |
| HP ZBook Fury 15 G8 | |
| Lenovo ThinkPad P1 G4-20Y4Z9DVUS | |
| Asus Zenbook Pro 15 OLED UM535Q | |
| Dell Precision 7670 | |
| Dell Precision 5000 5560 | |
| Gemiddeld Intel Core i7-12850HX (46.9 - 48.6, n=2) | |
| Dell Precision 7550 | |
| Razer Blade 17 RTX 3080 Ti | |
| Dell Precision 5000 5470 | |
| HP Envy 16 h0112nr | |
| MSI GE67 HX 12UGS | |
| Asus ProArt StudioBook 16 W7600H5A-2BL2 | |
| R Benchmark 2.5 / Overall mean | |
| Dell Precision 7550 | |
| Asus ProArt StudioBook 16 W7600H5A-2BL2 | |
| Lenovo ThinkPad P1 G4-20Y4Z9DVUS | |
| HP ZBook Fury 15 G8 | |
| Dell Precision 5000 5560 | |
| Asus Zenbook Pro 15 OLED UM535Q | |
| Lenovo Legion 7 16ARHA7 | |
| Dell Precision 5000 5470 | |
| Dell Precision 7670 | |
| Gemiddeld Intel Core i7-12850HX (0.45 - 0.4698, n=2) | |
| MSI GE67 HX 12UGS | |
| HP Envy 16 h0112nr | |
| Razer Blade 17 RTX 3080 Ti | |
Cinebench R23: Multi Core | Single Core
Cinebench R15: CPU Multi 64Bit | CPU Single 64Bit
Blender: v2.79 BMW27 CPU
7-Zip 18.03: 7z b 4 | 7z b 4 -mmt1
Geekbench 5.5: Multi-Core | Single-Core
HWBOT x265 Benchmark v2.2: 4k Preset
LibreOffice : 20 Documents To PDF
R Benchmark 2.5: Overall mean
* ... kleiner is beter
AIDA64: FP32 Ray-Trace | FPU Julia | CPU SHA3 | CPU Queen | FPU SinJulia | FPU Mandel | CPU AES | CPU ZLib | FP64 Ray-Trace | CPU PhotoWorxx
| Performance rating | |
| Gemiddeld Intel Core i7-12850HX | |
| HP ZBook Fury 15 G8 | |
| Lenovo ThinkPad P1 G4-20Y4Z9DVUS | |
| Dell Precision 7670 | |
| Asus ProArt StudioBook 16 W7600H5A-2BL2 -9! | |
| Dell Precision 5000 5560 -9! | |
| AIDA64 / FP32 Ray-Trace | |
| Lenovo ThinkPad P1 G4-20Y4Z9DVUS | |
| Gemiddeld Intel Core i7-12850HX (12983 - 16752, n=2) | |
| HP ZBook Fury 15 G8 | |
| Dell Precision 7670 | |
| AIDA64 / FPU Julia | |
| Gemiddeld Intel Core i7-12850HX (68219 - 87231, n=2) | |
| Dell Precision 7670 | |
| Lenovo ThinkPad P1 G4-20Y4Z9DVUS | |
| HP ZBook Fury 15 G8 | |
| AIDA64 / CPU SHA3 | |
| Lenovo ThinkPad P1 G4-20Y4Z9DVUS | |
| HP ZBook Fury 15 G8 | |
| Gemiddeld Intel Core i7-12850HX (3098 - 3818, n=2) | |
| Dell Precision 7670 | |
| AIDA64 / CPU Queen | |
| HP ZBook Fury 15 G8 | |
| Lenovo ThinkPad P1 G4-20Y4Z9DVUS | |
| Gemiddeld Intel Core i7-12850HX (26716 - 95664, n=2) | |
| Dell Precision 7670 | |
| AIDA64 / FPU SinJulia | |
| Gemiddeld Intel Core i7-12850HX (9869 - 11286, n=2) | |
| HP ZBook Fury 15 G8 | |
| Dell Precision 7670 | |
| Lenovo ThinkPad P1 G4-20Y4Z9DVUS | |
| AIDA64 / FPU Mandel | |
| Gemiddeld Intel Core i7-12850HX (34218 - 42580, n=2) | |
| Lenovo ThinkPad P1 G4-20Y4Z9DVUS | |
| HP ZBook Fury 15 G8 | |
| Dell Precision 7670 | |
| AIDA64 / CPU AES | |
| Lenovo ThinkPad P1 G4-20Y4Z9DVUS | |
| HP ZBook Fury 15 G8 | |
| Gemiddeld Intel Core i7-12850HX (63362 - 80775, n=2) | |
| Dell Precision 7670 | |
| AIDA64 / CPU ZLib | |
| Gemiddeld Intel Core i7-12850HX (817 - 1102, n=2) | |
| Dell Precision 7670 | |
| Lenovo ThinkPad P1 G4-20Y4Z9DVUS | |
| HP ZBook Fury 15 G8 | |
| Asus ProArt StudioBook 16 W7600H5A-2BL2 | |
| Asus ProArt StudioBook 16 W7600H5A-2BL2 | |
| Dell Precision 5000 5560 | |
| AIDA64 / FP64 Ray-Trace | |
| Gemiddeld Intel Core i7-12850HX (7671 - 9145, n=2) | |
| Lenovo ThinkPad P1 G4-20Y4Z9DVUS | |
| HP ZBook Fury 15 G8 | |
| Dell Precision 7670 | |
| AIDA64 / CPU PhotoWorxx | |
| Dell Precision 7670 | |
| Gemiddeld Intel Core i7-12850HX (33415 - 42035, n=2) | |
| HP ZBook Fury 15 G8 | |
| Lenovo ThinkPad P1 G4-20Y4Z9DVUS | |
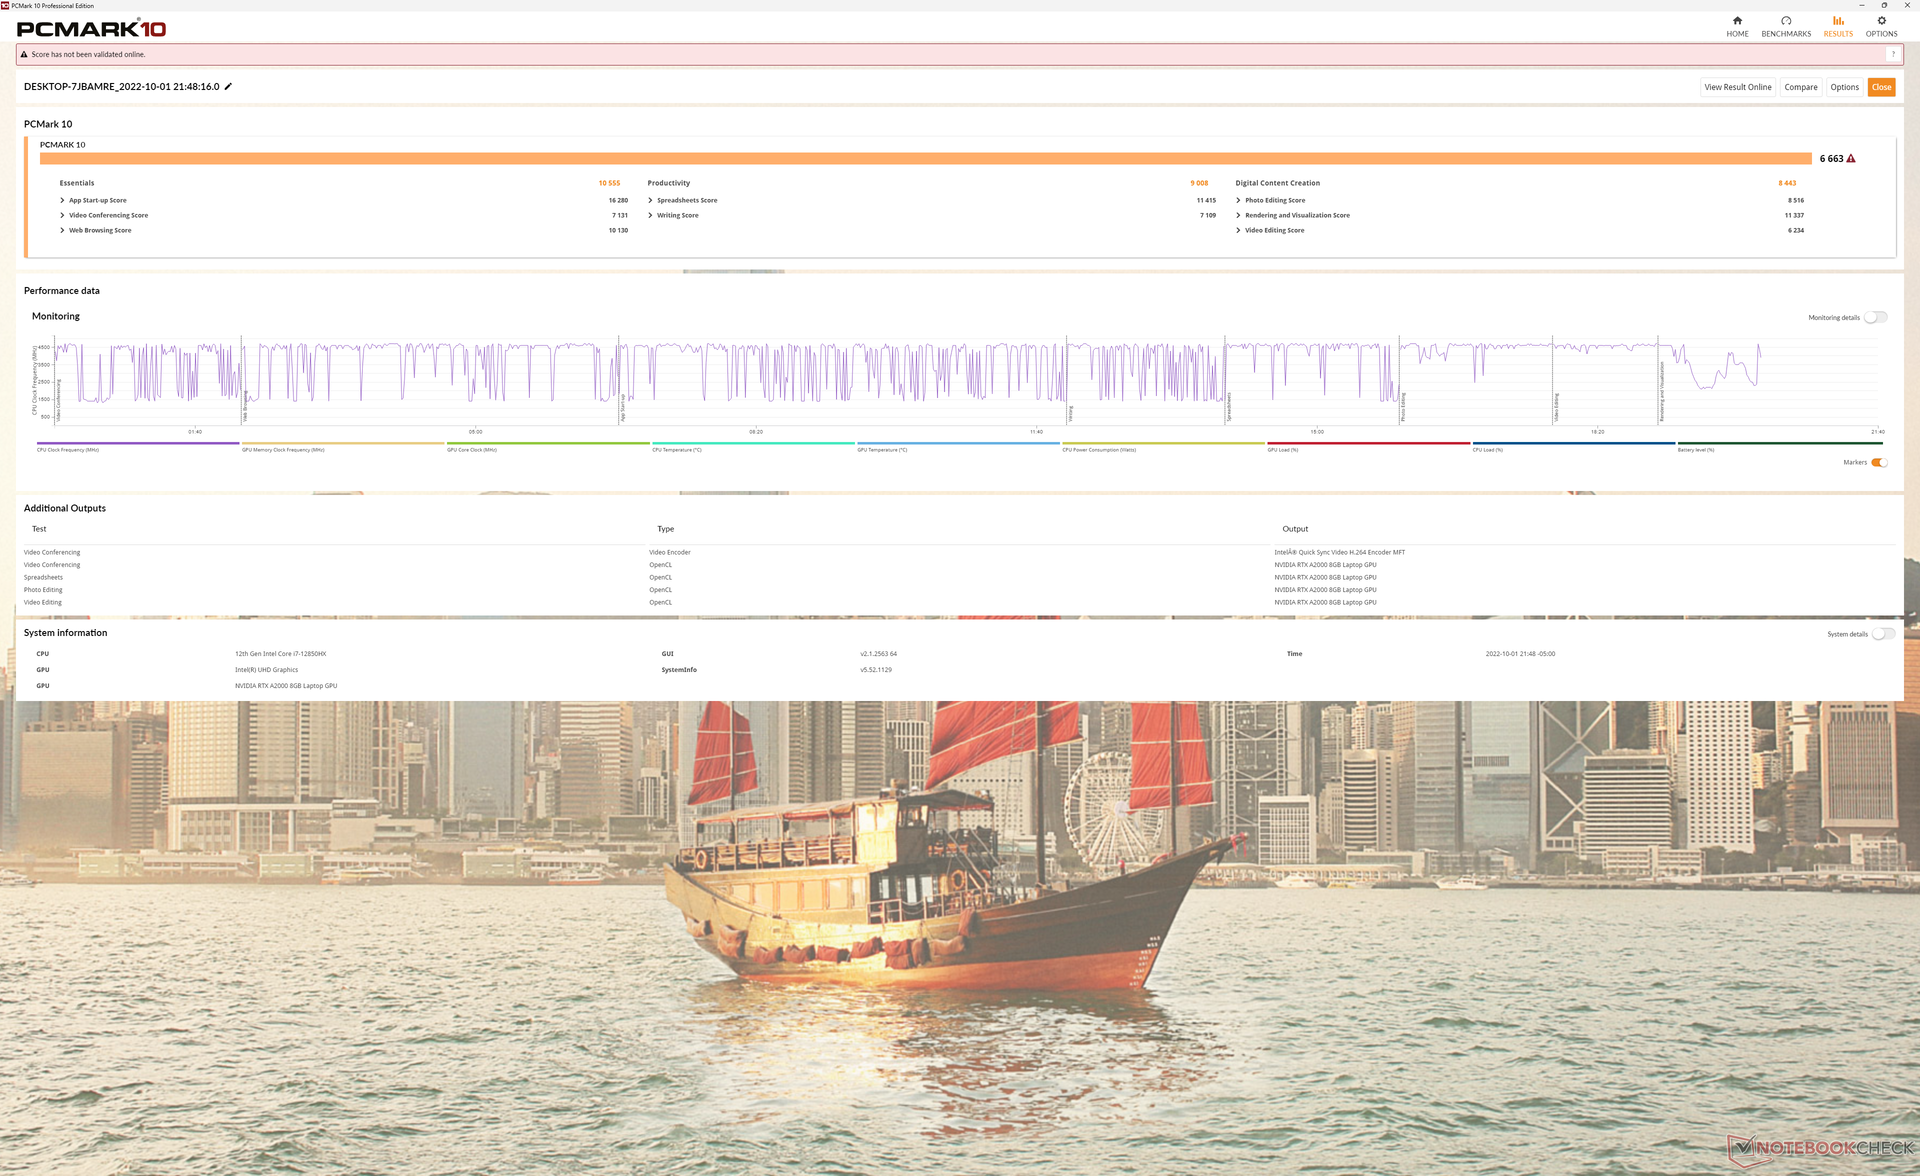
Systeemprestaties
De resultaten van PCMark 10 zijn vergelijkbaar met die van andere werkstations met Core H-serie CPU's en Nvidia Quadro GPU's. Modellen met de snellere RTX A5000 zoals de HP ZBook Fury 15 G8 presteren nog steeds beter dan onze Precision 7670 testunit in GPU-zware benchmarks zoals Digital Content Creation.
CrossMark: Overall | Productivity | Creativity | Responsiveness
| PCMark 10 / Score | |
| Asus ProArt StudioBook 16 W7600H5A-2BL2 | |
| HP ZBook Fury 15 G8 | |
| Dell Precision 5000 5560 | |
| Dell Precision 7670 | |
| Lenovo ThinkPad P1 G4-20Y4Z9DVUS | |
| Dell Precision 7550 | |
| PCMark 10 / Essentials | |
| Dell Precision 5000 5560 | |
| Dell Precision 7670 | |
| Asus ProArt StudioBook 16 W7600H5A-2BL2 | |
| HP ZBook Fury 15 G8 | |
| Lenovo ThinkPad P1 G4-20Y4Z9DVUS | |
| Dell Precision 7550 | |
| PCMark 10 / Productivity | |
| Dell Precision 7670 | |
| Dell Precision 5000 5560 | |
| Asus ProArt StudioBook 16 W7600H5A-2BL2 | |
| HP ZBook Fury 15 G8 | |
| Lenovo ThinkPad P1 G4-20Y4Z9DVUS | |
| Dell Precision 7550 | |
| PCMark 10 / Digital Content Creation | |
| Asus ProArt StudioBook 16 W7600H5A-2BL2 | |
| HP ZBook Fury 15 G8 | |
| Dell Precision 5000 5560 | |
| Dell Precision 7670 | |
| Lenovo ThinkPad P1 G4-20Y4Z9DVUS | |
| Dell Precision 7550 | |
| CrossMark / Overall | |
| Lenovo ThinkPad P1 G4-20Y4Z9DVUS | |
| Dell Precision 7670 | |
| CrossMark / Productivity | |
| Lenovo ThinkPad P1 G4-20Y4Z9DVUS | |
| Dell Precision 7670 | |
| CrossMark / Creativity | |
| Dell Precision 7670 | |
| Lenovo ThinkPad P1 G4-20Y4Z9DVUS | |
| CrossMark / Responsiveness | |
| Lenovo ThinkPad P1 G4-20Y4Z9DVUS | |
| Dell Precision 7670 | |
| PCMark 10 Score | 6663 punten | |
Help | ||
| AIDA64 / Memory Copy | |
| Dell Precision 7670 | |
| HP ZBook Fury 15 G8 | |
| Lenovo ThinkPad P1 G4-20Y4Z9DVUS | |
| AIDA64 / Memory Read | |
| Dell Precision 7670 | |
| HP ZBook Fury 15 G8 | |
| Lenovo ThinkPad P1 G4-20Y4Z9DVUS | |
| AIDA64 / Memory Write | |
| Dell Precision 7670 | |
| HP ZBook Fury 15 G8 | |
| Lenovo ThinkPad P1 G4-20Y4Z9DVUS | |
| AIDA64 / Memory Latency | |
| HP ZBook Fury 15 G8 | |
| Dell Precision 7670 | |
| Lenovo ThinkPad P1 G4-20Y4Z9DVUS | |
| Asus ProArt StudioBook 16 W7600H5A-2BL2 | |
| Asus ProArt StudioBook 16 W7600H5A-2BL2 | |
* ... kleiner is beter
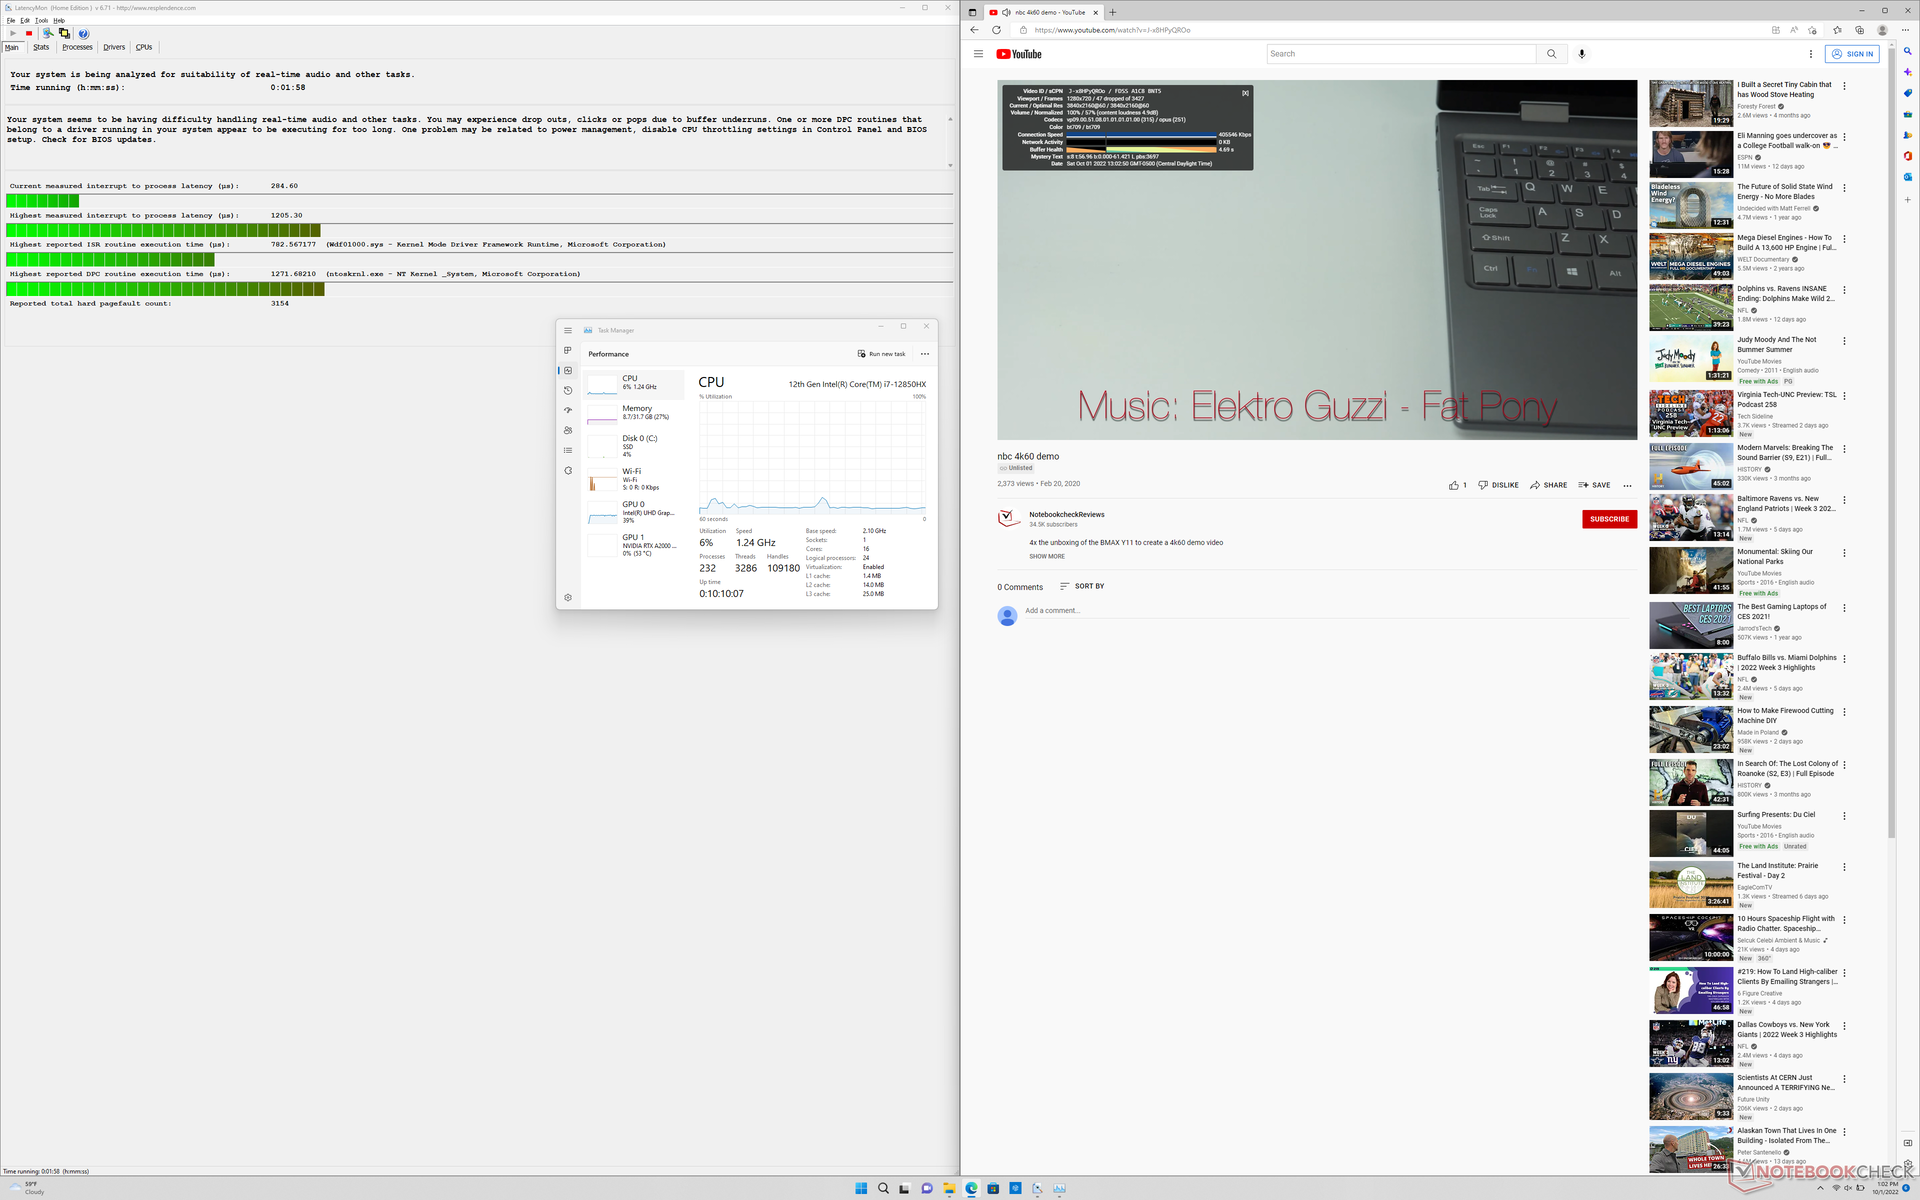
DPC latentie
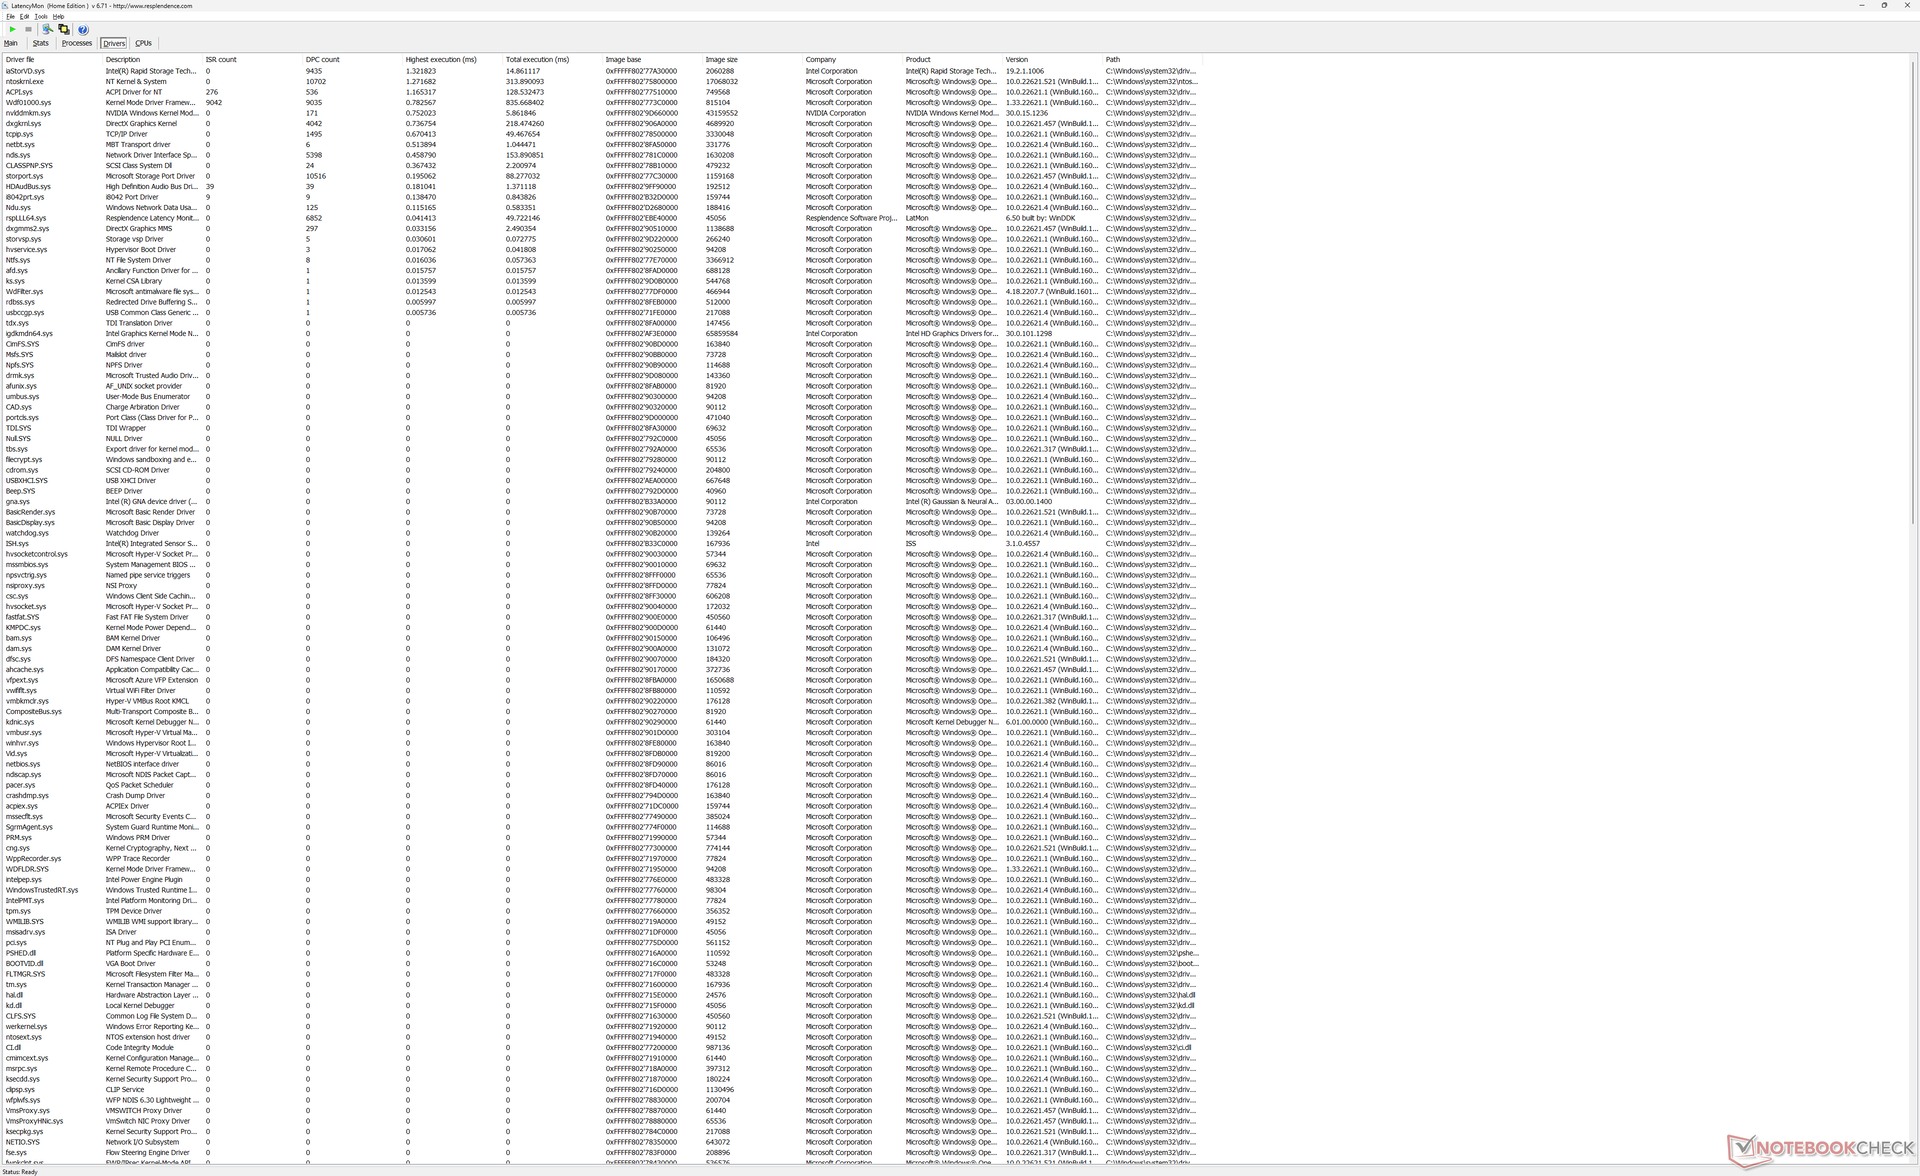
latencyMon onthult kleine DPC-problemen bij het openen van meerdere browsertabbladen van onze homepage. Verder is het afspelen van 4K-video's bij 60 FPS onvolmaakt met 47 dropped frames tijdens onze minutenlange testvideo.
| DPC Latencies / LatencyMon - interrupt to process latency (max), Web, Youtube, Prime95 | |
| Dell Precision 7550 | |
| Asus ProArt StudioBook 16 W7600H5A-2BL2 | |
| Lenovo ThinkPad P1 G4-20Y4Z9DVUS | |
| Dell Precision 7670 | |
| Dell Precision 5000 5560 | |
| HP ZBook Fury 15 G8 | |
* ... kleiner is beter
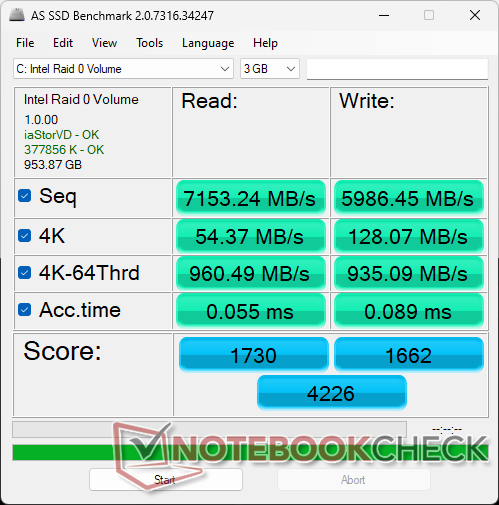
Opslagapparaten - Waanzinnige snelheden met PCIe4 x4 RAID 0
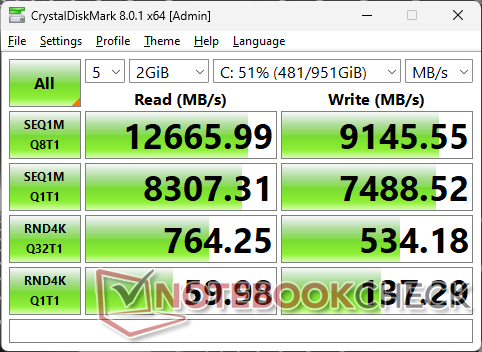
Alle configuraties kunnen tot twee M.2 SSD's ondersteunen, sommige tot drie. Onze specifieke testunit is uitgerust met twee SK Hynix PC801 PCIe4 x4 NVMe SSD's in RAID 0 voor sequentiële lees- en schrijfsnelheden van respectievelijk bijna 13000 MB/s en 9200 MB/s. Bij belasting onder DiskSpd vertoonden de schijven zelfs na lange perioden geen tekenen van prestatievermindering. Er zijn warmteverspreiders of thermische pads bovenop de meegeleverde SSD's om te helpen bij de warmteafvoer.

| Drive Performance rating - Percent | |
| Dell Precision 5000 5560 | |
| Dell Precision 7670 | |
| Lenovo ThinkPad P1 G4-20Y4Z9DVUS | |
| Asus ProArt StudioBook 16 W7600H5A-2BL2 | |
| HP ZBook Fury 15 G8 | |
| Dell Precision 7550 | |
* ... kleiner is beter
Disk Throttling: DiskSpd Read Loop, Queue Depth 8
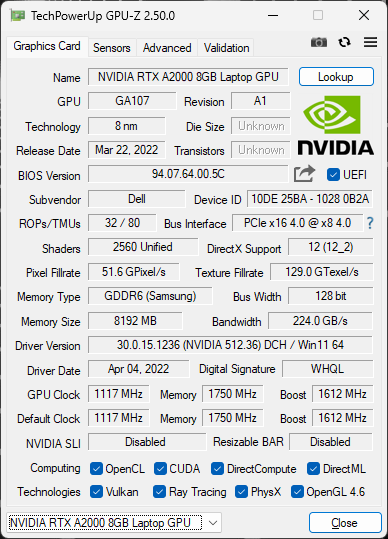
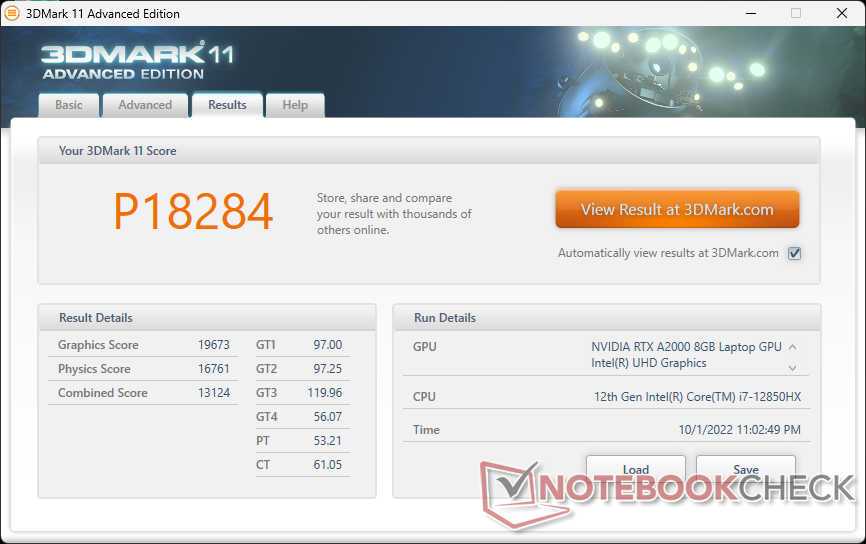
GPU-prestaties - 95 W TGP Graphics
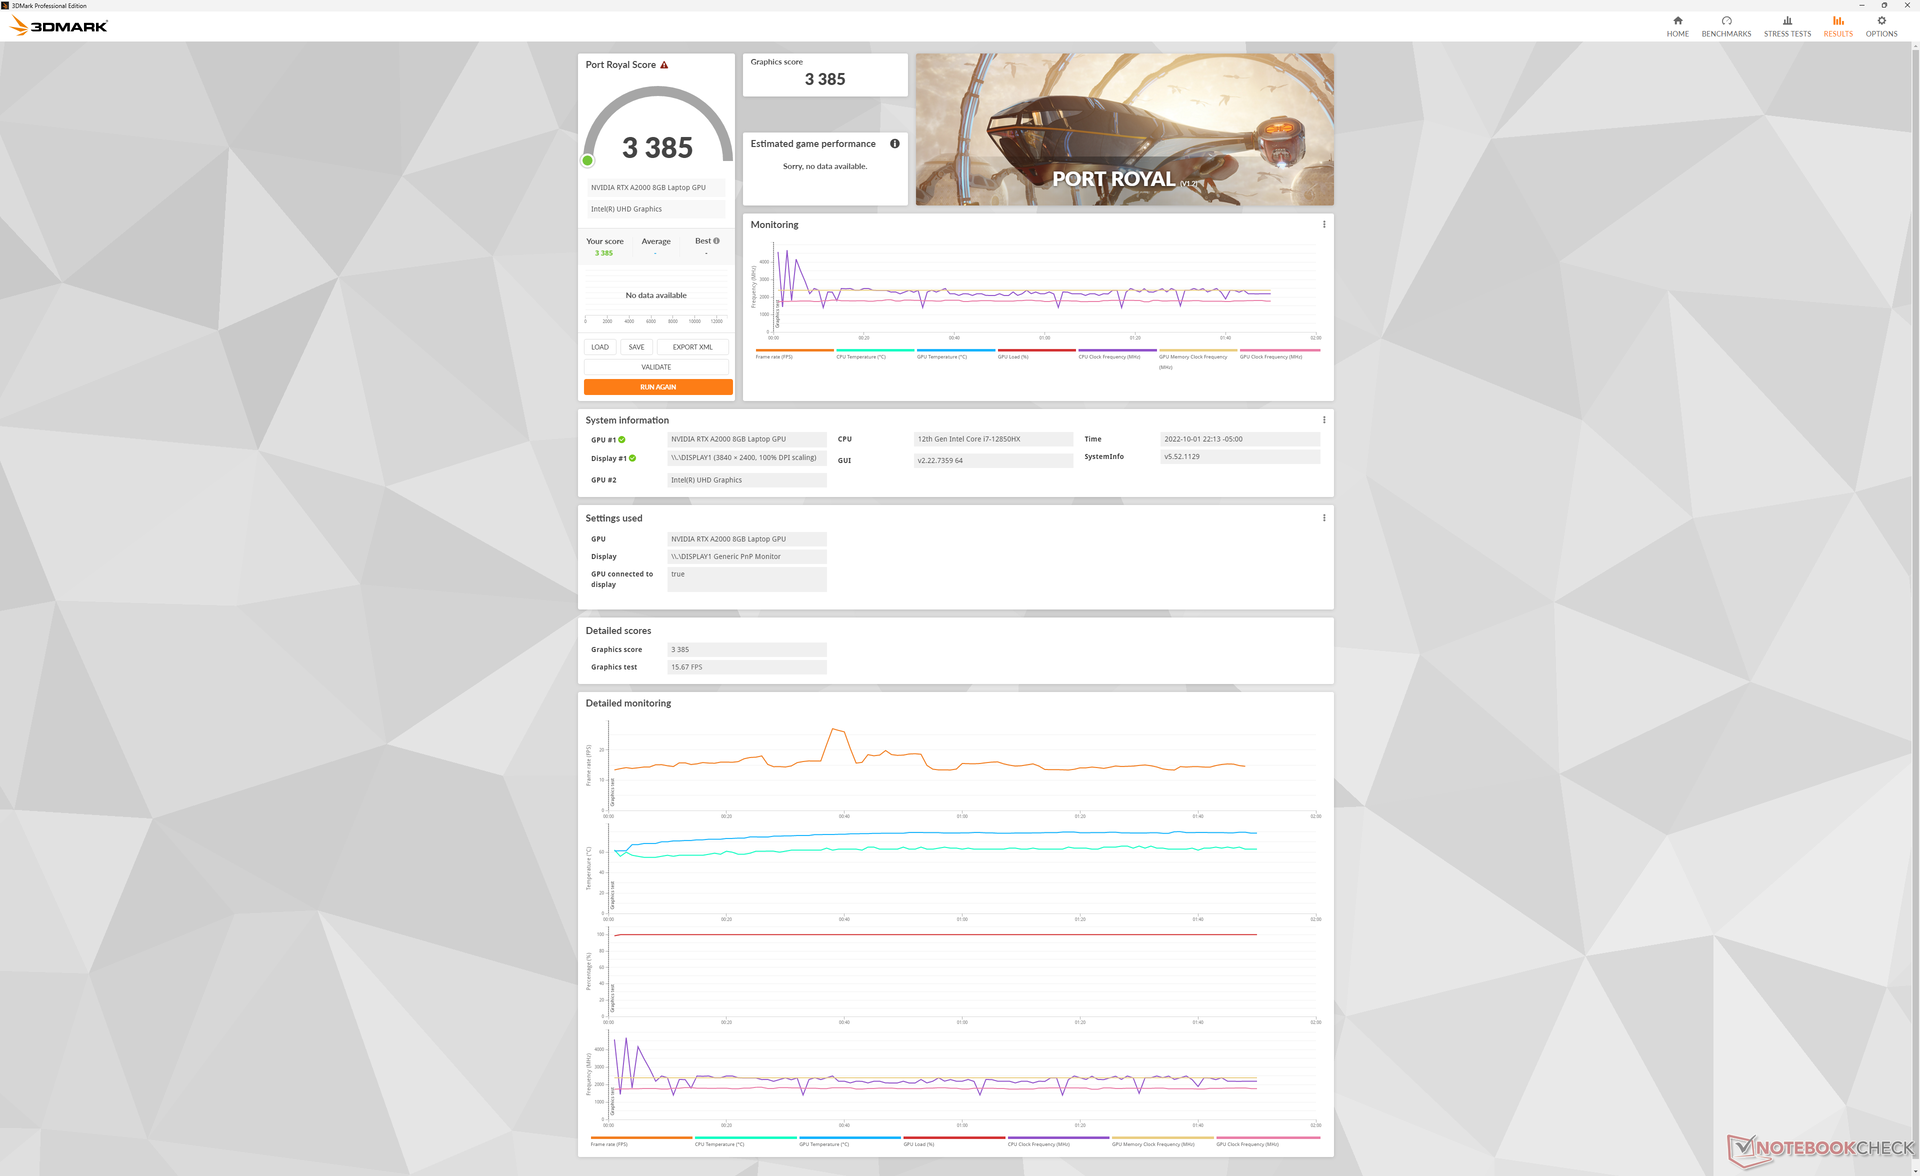
De RTX A2000 is afgeleid van de GeForce RTX 3050 Ti en dus delen beide GPU's vergelijkbare ruwe prestatiecijfers. Opwaarderen naar de RTX A3000 of RTX A5500 optie zal naar verwachting de prestaties met respectievelijk 15 tot 20 procent en 70 tot 90 procent verbeteren.
Interessant is dat de ray-tracing Port Royal prestaties aanzienlijk beter zijn dan wat we registreerden op de ouderePrecision 5560 ook al delen ze dezelfde RTX A2000 GPU. We vermoeden dat dit kan komen door zowel het veel hogere TGP-doel (95 W vs. 45 W) als het nieuwere Nvidia-stuurprogramma (512,36 vs. 472,12) van onze Precision 7670.
| 3DMark 11 - 1280x720 Performance GPU | |
| MSI GE67 HX 12UGS | |
| HP ZBook Fury 15 G8 | |
| HP Envy 16 h0112nr | |
| Dell Precision 7550 | |
| HP ZBook Fury 17 G8-4A6A9EA | |
| Dell Precision 7670 | |
| Gemiddeld NVIDIA RTX A2000 Laptop GPU (14831 - 19823, n=9) | |
| Asus Zenbook Pro 15 OLED UM535Q | |
| Dell Precision 5000 5560 | |
| Dell Precision 5000 5470 | |
| Lenovo ThinkPad P1 G4-20Y4Z9DVUS | |
| 3DMark 11 Performance | 18284 punten | |
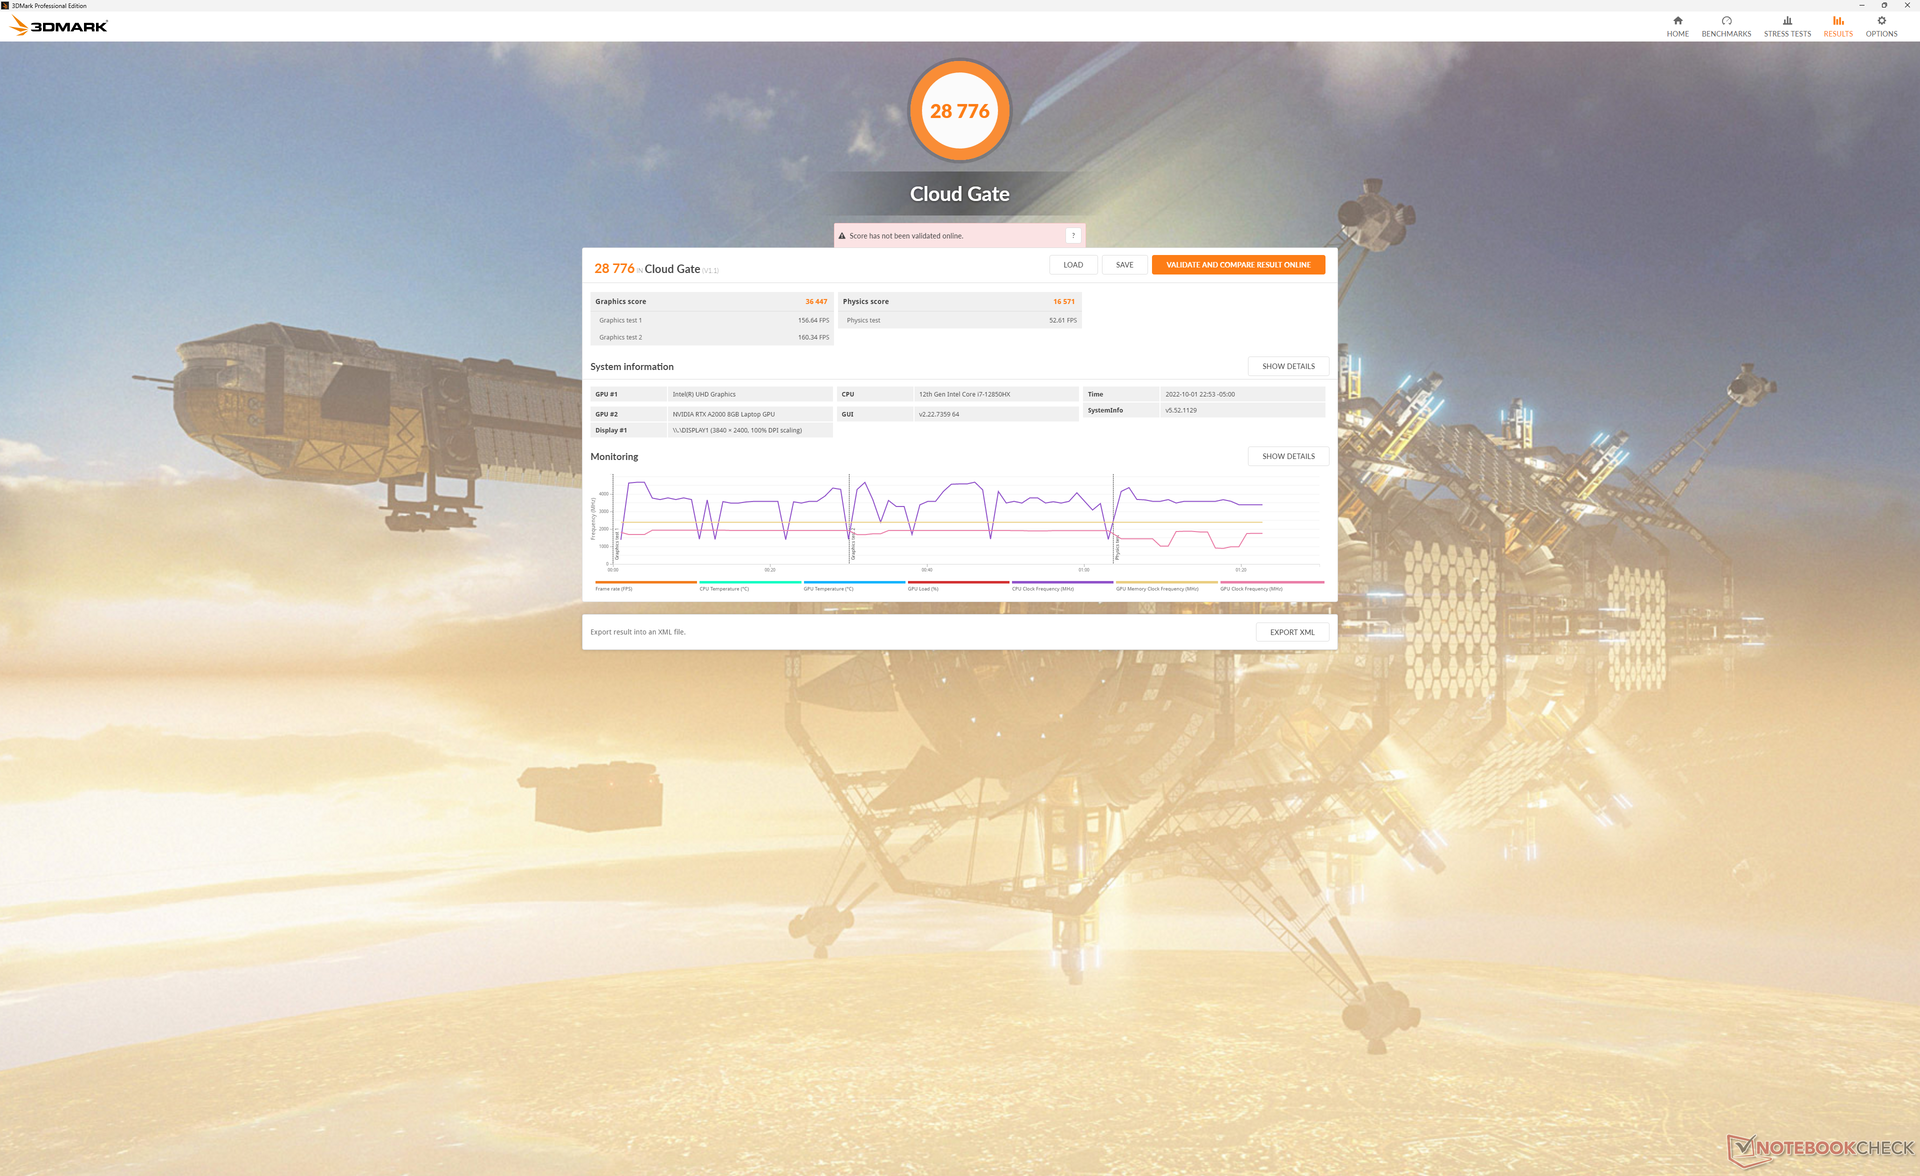
| 3DMark Cloud Gate Standard Score | 28776 punten | |
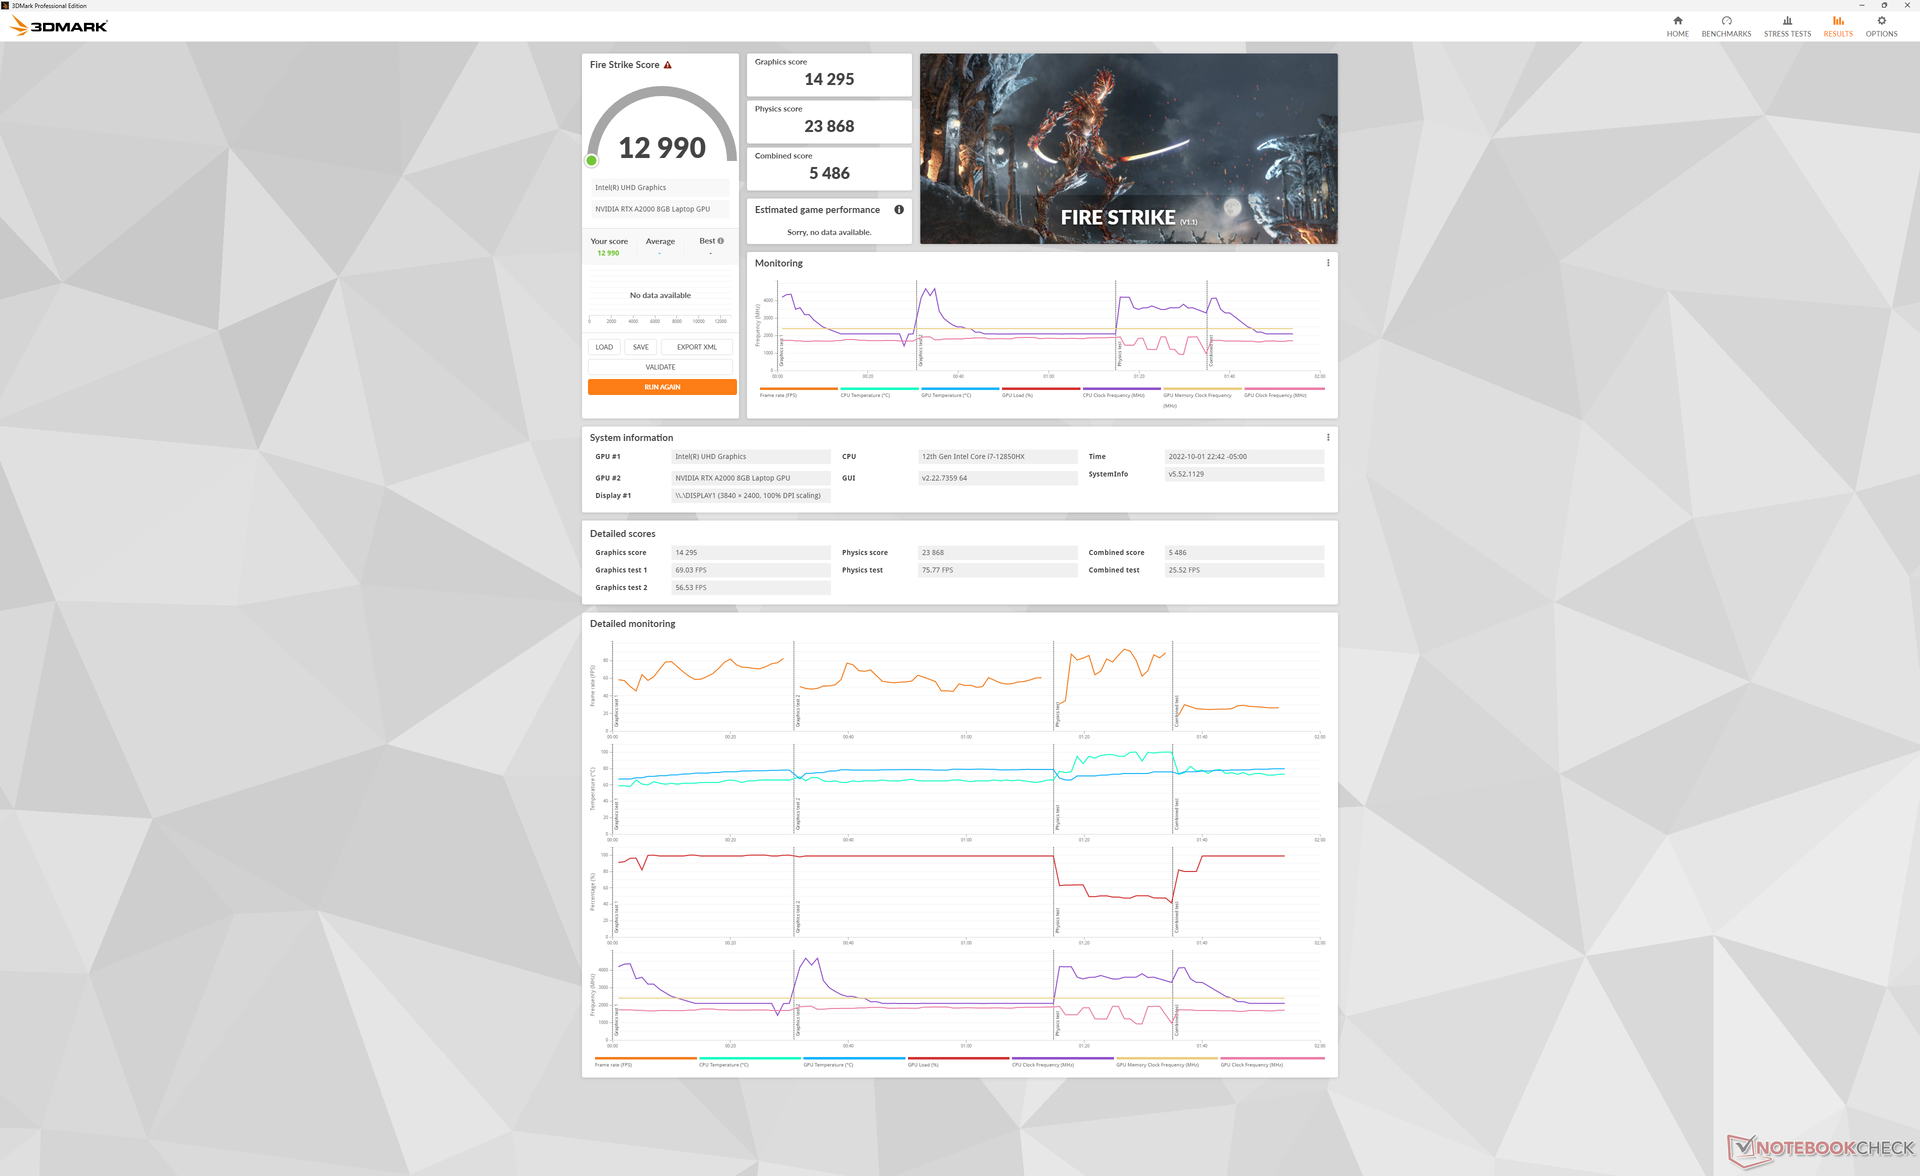
| 3DMark Fire Strike Score | 12990 punten | |
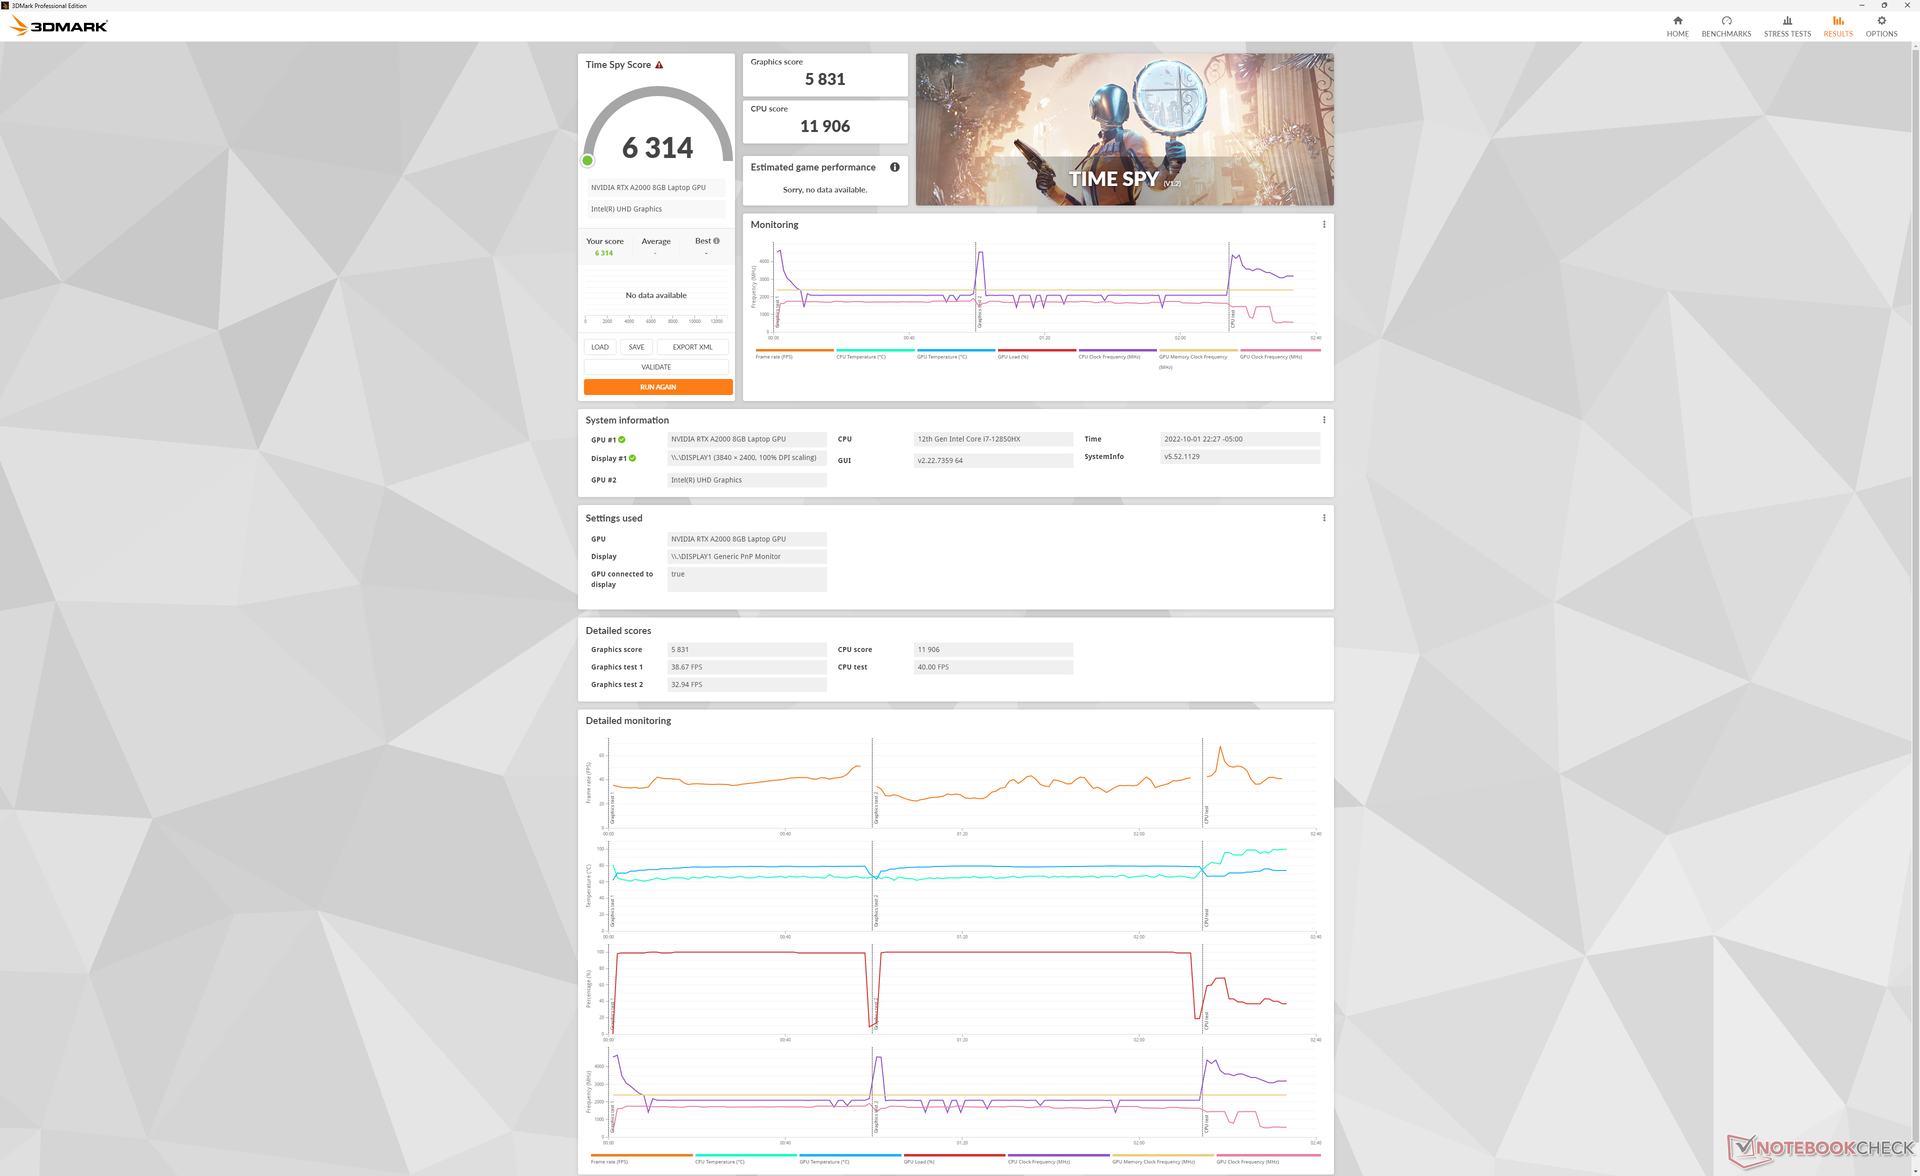
| 3DMark Time Spy Score | 6314 punten | |
Help | ||
| Blender | |
| v3.3 Classroom HIP/AMD | |
| Lenovo Legion 7 16ARHA7 | |
| v3.3 Classroom OPTIX/RTX | |
| Dell Precision 5000 5470 | |
| HP Envy 16 h0112nr | |
| Dell Precision 7670 | |
| v3.3 Classroom CUDA | |
| Dell Precision 5000 5470 | |
| HP Envy 16 h0112nr | |
| Dell Precision 7670 | |
| v3.3 Classroom CPU | |
| HP Envy 16 h0112nr | |
| Dell Precision 5000 5470 | |
| Lenovo Legion 7 16ARHA7 | |
| Dell Precision 7670 | |
* ... kleiner is beter
Witcher 3 FPS Chart
| lage | gem. | hoge | ultra | QHD | 4K | |
|---|---|---|---|---|---|---|
| GTA V (2015) | 181.7 | 177.6 | 155.1 | 79.1 | 57.1 | |
| The Witcher 3 (2015) | 297.1 | 181.7 | 108.6 | 57.4 | ||
| Dota 2 Reborn (2015) | 180.8 | 159.3 | 145.1 | 128.8 | 78.5 | |
| Final Fantasy XV Benchmark (2018) | 129.5 | 80.4 | 60.6 | 44.4 | 26 | |
| X-Plane 11.11 (2018) | 135.2 | 104.1 | 85.5 | 55.1 | ||
| Strange Brigade (2018) | 325 | 151.2 | 120.9 | 103.5 | 76.8 | |
| Cyberpunk 2077 1.6 (2022) | 78.5 | 65.1 | 55 | 44.3 | 27.4 |
Emissies
Systeemgeluid
De ventilatoren zijn bijna nooit stil, zelfs niet bij stationair draaien op de desktop, maar ze zijn toch stil en moeilijk op te merken tijdens lage belasting. Verwacht dat het geluidsniveau onder de 28 dB(A) blijft tegen een stille achtergrond van 22,7 dB(A) tijdens het afspelen van video. Het geluid van de ventilator is met 24,5 dB(A) nog stiller tijdens surfen op het web of tekstverwerking, wat vergelijkbaar is met wat we waarnamen op de ZBook Fury 15 G8 of Precision 5560
De geluidsniveaus stijgen enigszins snel wanneer hogere belastingen worden geïntroduceerd. De eerste benchmarkscène van 3DMark 06, bijvoorbeeld, veroorzaakte ventilatorgeluid tot 49 dB(A), zelfs wanneer ingesteld op het Balanced power profiel. Het ventilatorgeluid piekt op ongeveer 52 dB(A) bij extreme belastingen zoals Prime95 en FurMark, net als op de Precision 5560. Met andere woorden, de Precision 7670 draait rustig onder de meeste omstandigheden, maar wordt behoorlijk luidruchtig als er ook maar een beetje stress wordt geïntroduceerd.
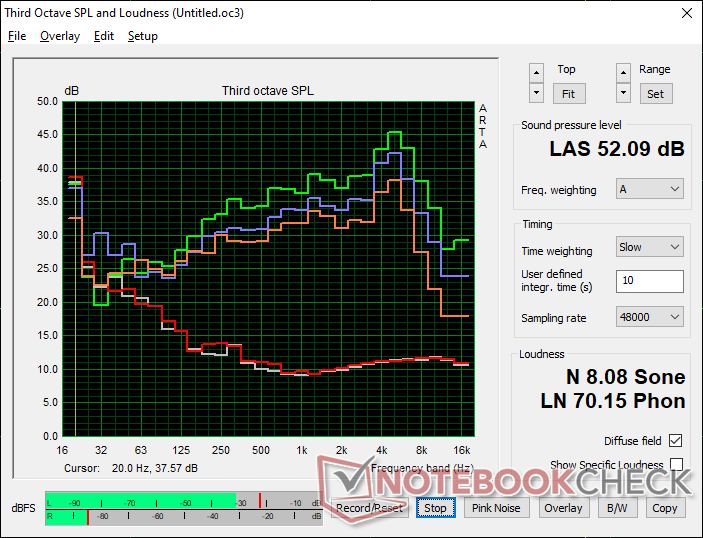
Geluidsniveau
| Onbelast |
| 22.9 / 22.9 / 24.5 dB (A) |
| Belasting |
| 48.7 / 52.1 dB (A) |
 | ||
30 dB stil 40 dB(A) hoorbaar 50 dB(A) luid |
||
min: | ||
| Dell Precision 7670 RTX A2000 Laptop GPU, i7-12850HX, SK Hynix HFS001TEJ9X115N | Lenovo ThinkPad P1 G4-20Y4Z9DVUS T1200 Laptop GPU, i7-11800H, Samsung PM9A1 MZVL2512HCJQ | Asus ProArt StudioBook 16 W7600H5A-2BL2 RTX A5000 Laptop GPU, W-11955M, 2x Micron 2300 2TB MTFDHBA2T0TDV (RAID 0) | Dell Precision 5000 5560 RTX A2000 Laptop GPU, i7-11850H, Samsung PM9A1 MZVL22T0HBLB | Dell Precision 7550 Quadro RTX 5000 Max-Q, W-10885M, SK Hynix PC601A NVMe 1TB | HP ZBook Fury 15 G8 RTX A5000 Laptop GPU, i9-11950H, Samsung PM981a MZVLB1T0HBLR | |
|---|---|---|---|---|---|---|
| Noise | -3% | -3% | 11% | -9% | 3% | |
| uit / omgeving * (dB) | 22.7 | 24.3 -7% | 26 -15% | 23.4 -3% | 25.8 -14% | 24.1 -6% |
| Idle Minimum * (dB) | 22.9 | 24.3 -6% | 26 -14% | 23.6 -3% | 25.8 -13% | 24.1 -5% |
| Idle Average * (dB) | 22.9 | 24.3 -6% | 26 -14% | 23.6 -3% | 25.8 -13% | 24.1 -5% |
| Idle Maximum * (dB) | 24.5 | 26.6 -9% | 26.5 -8% | 23.6 4% | 25.9 -6% | 24.8 -1% |
| Load Average * (dB) | 48.7 | 46.8 4% | 42 14% | 25.8 47% | 51.2 -5% | 37.8 22% |
| Witcher 3 ultra * (dB) | 45.2 | 46.8 -4% | 40.1 11% | 51.9 -15% | 44.2 2% | |
| Load Maximum * (dB) | 52.1 | 46.8 10% | 43 17% | 41.4 21% | 51.9 -0% | 44.2 15% |
* ... kleiner is beter
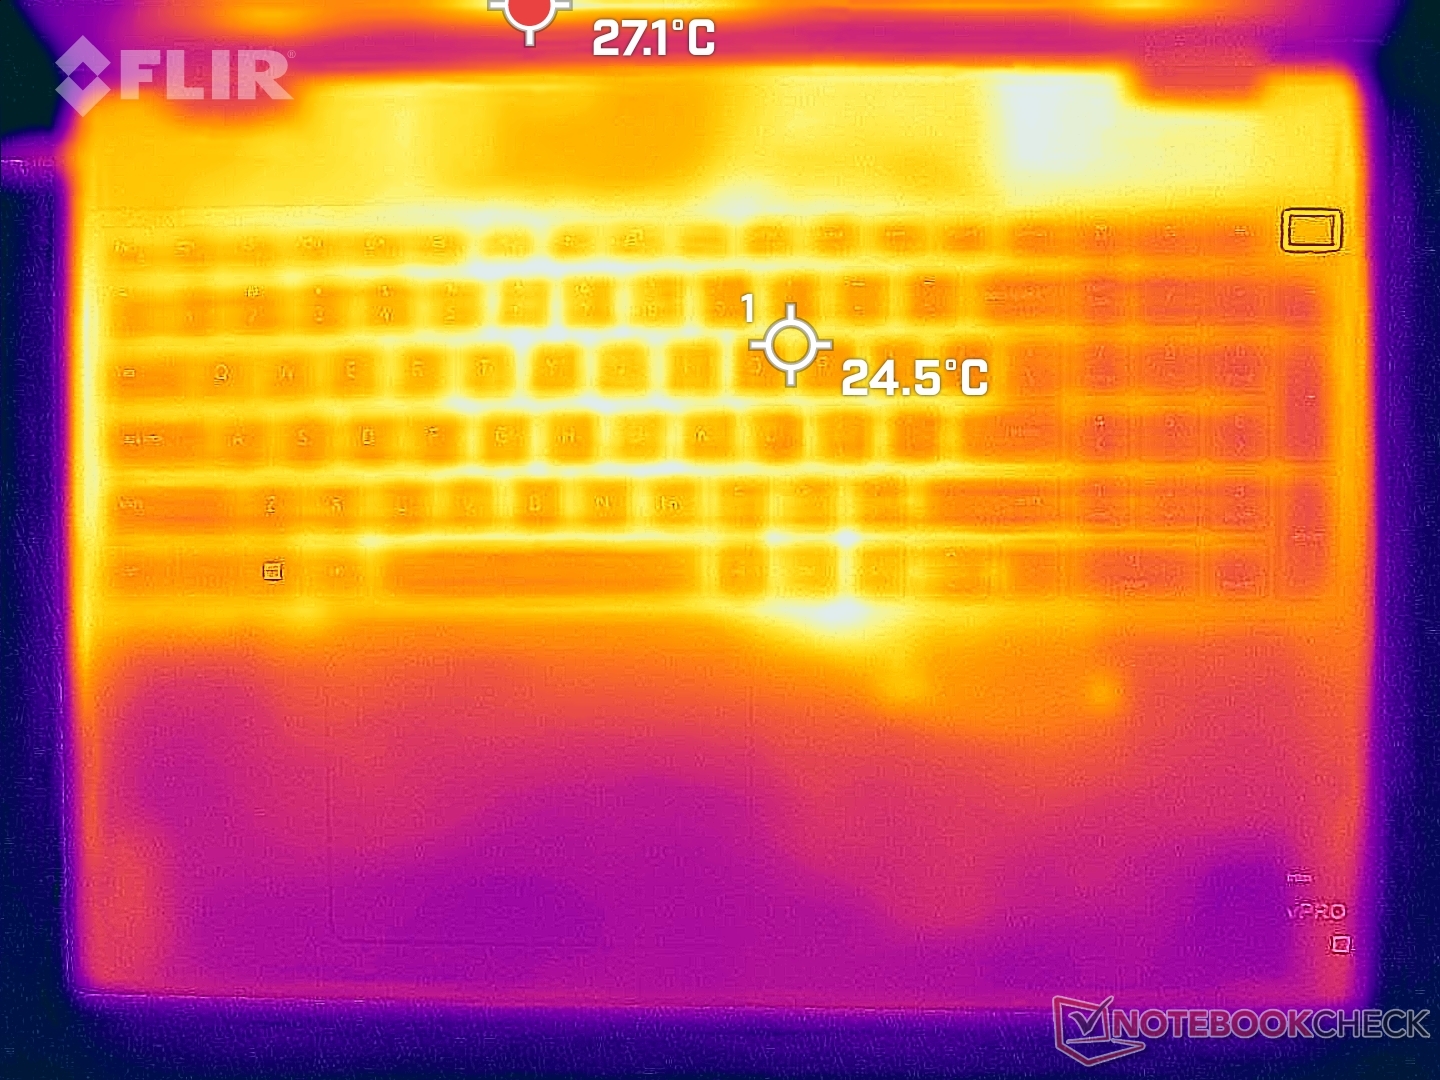
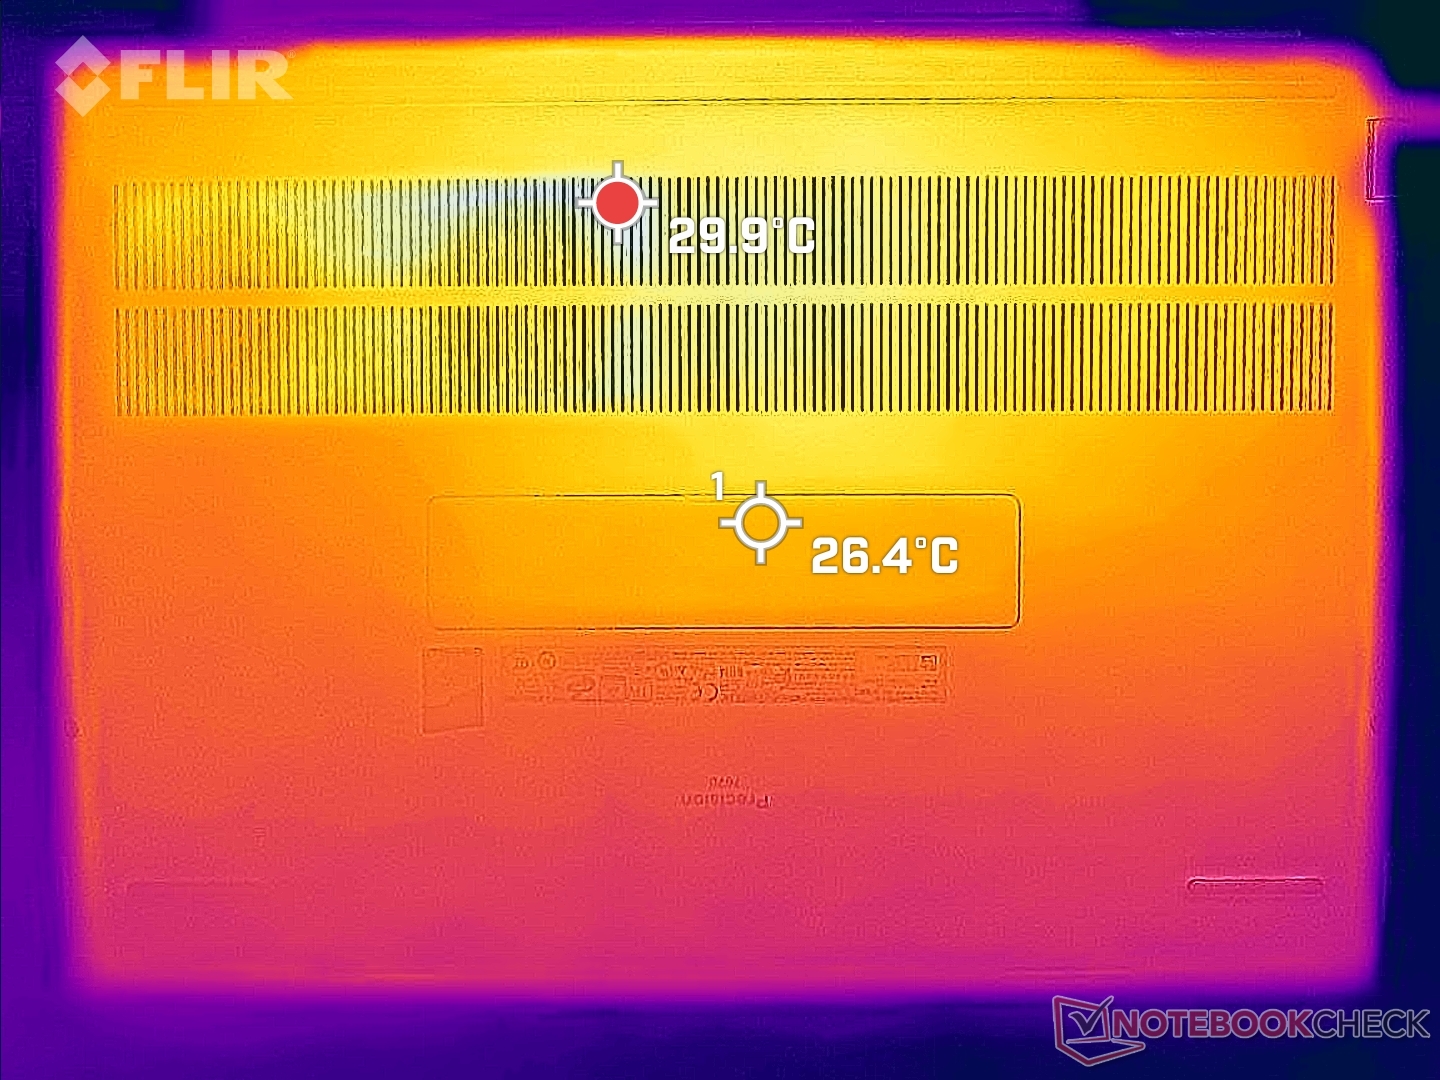
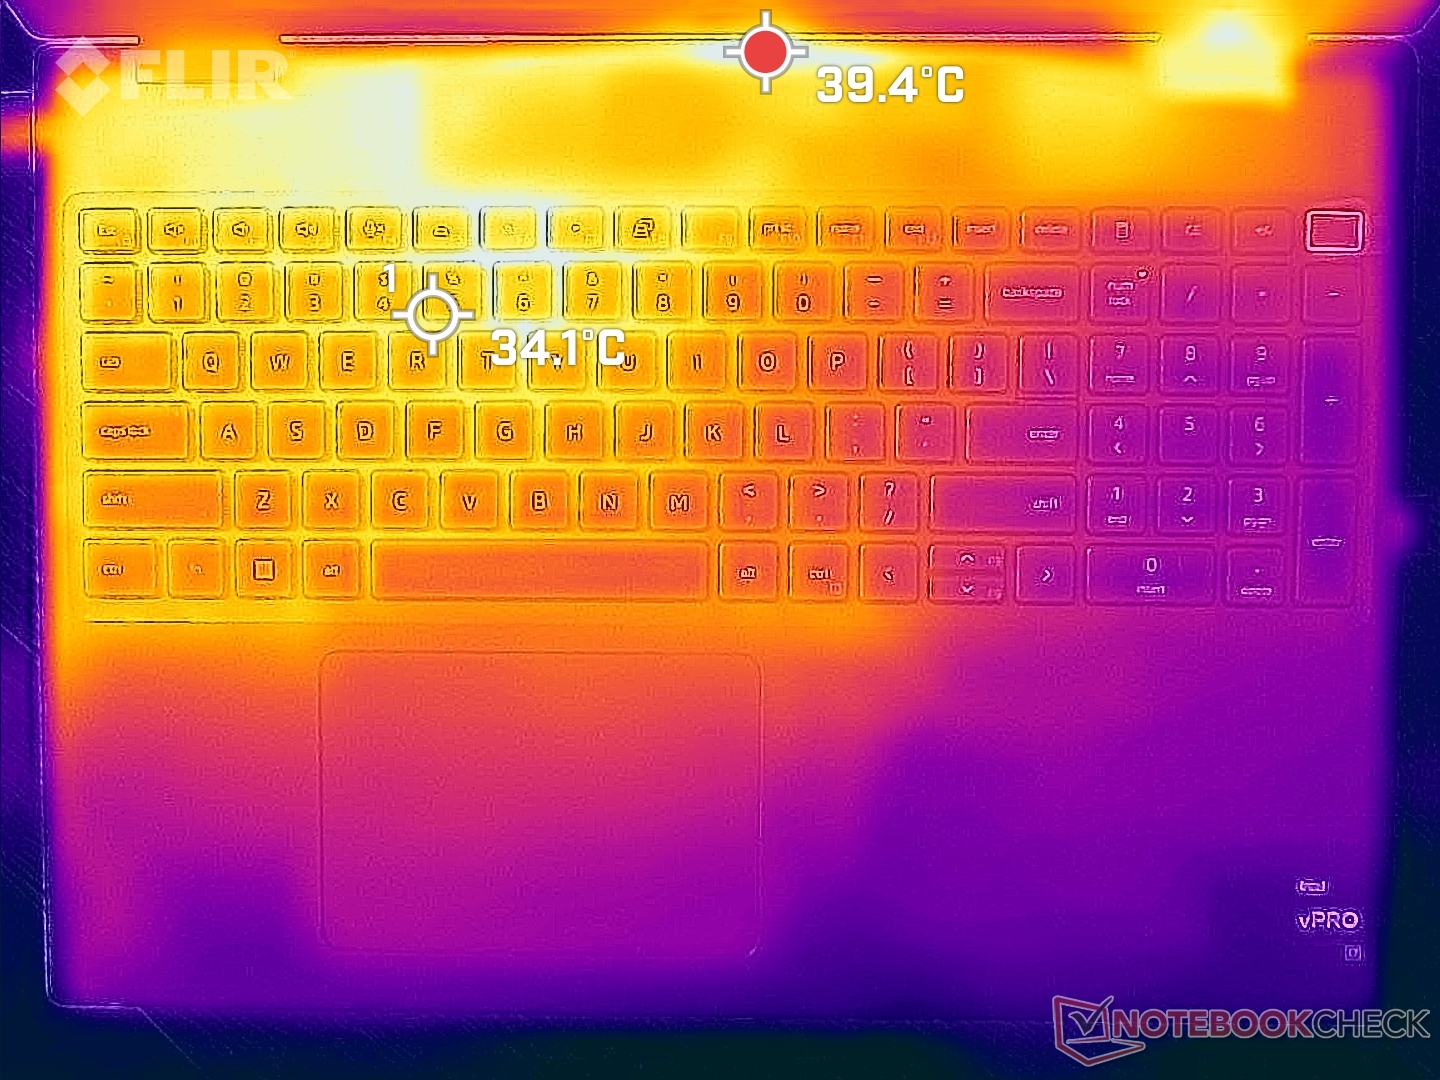
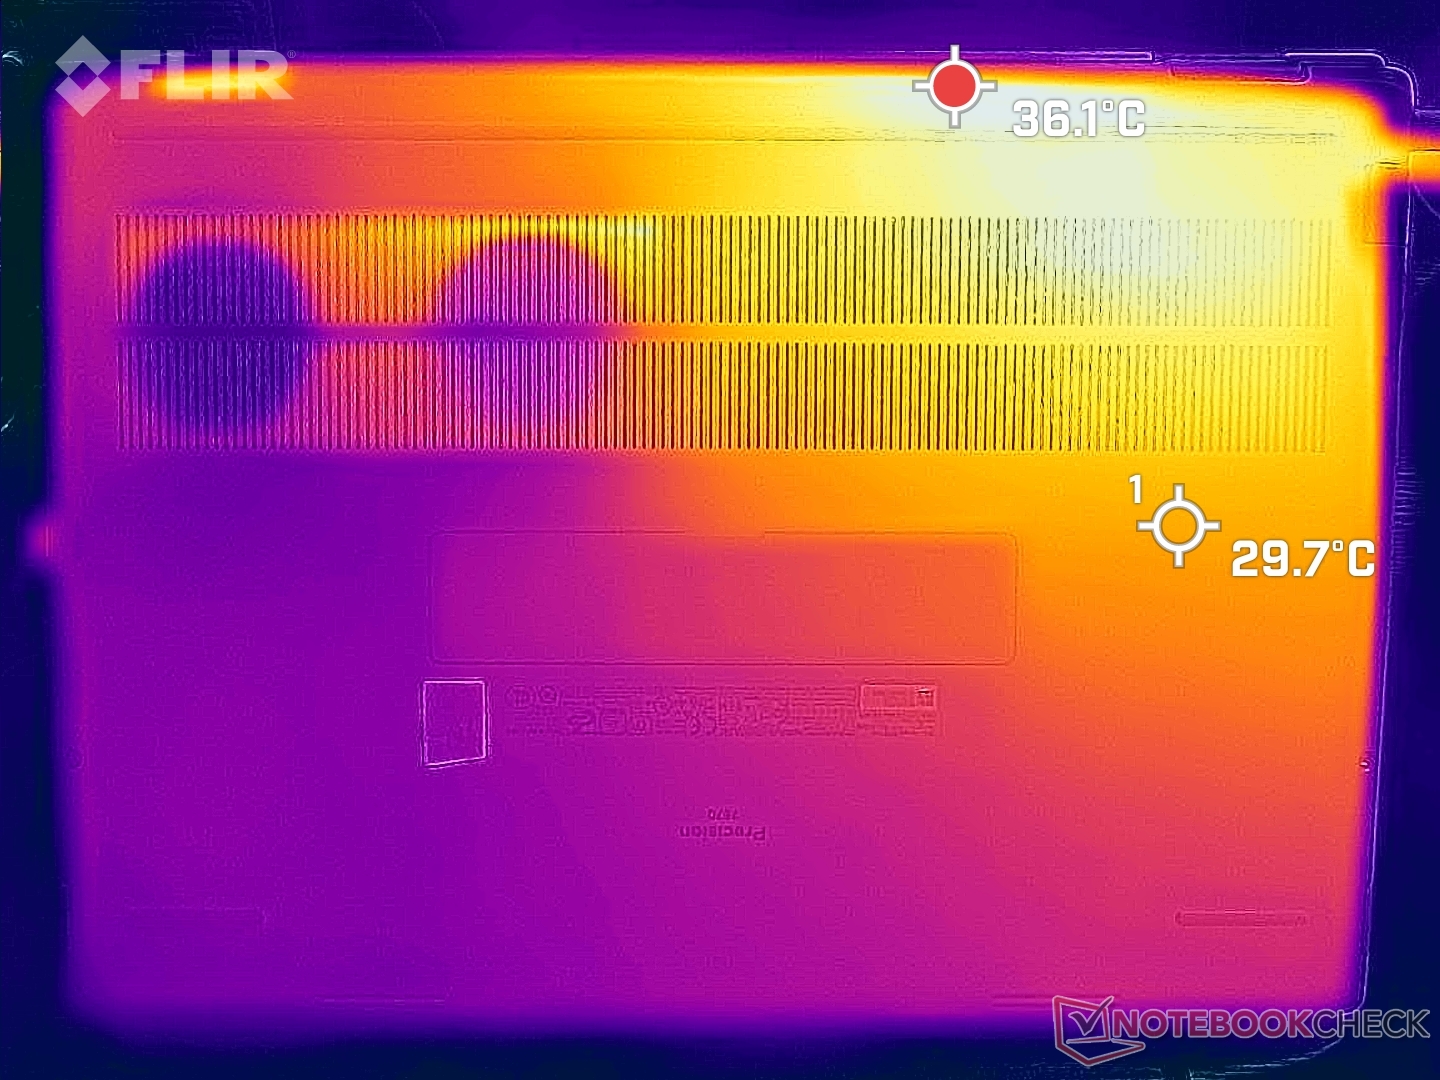
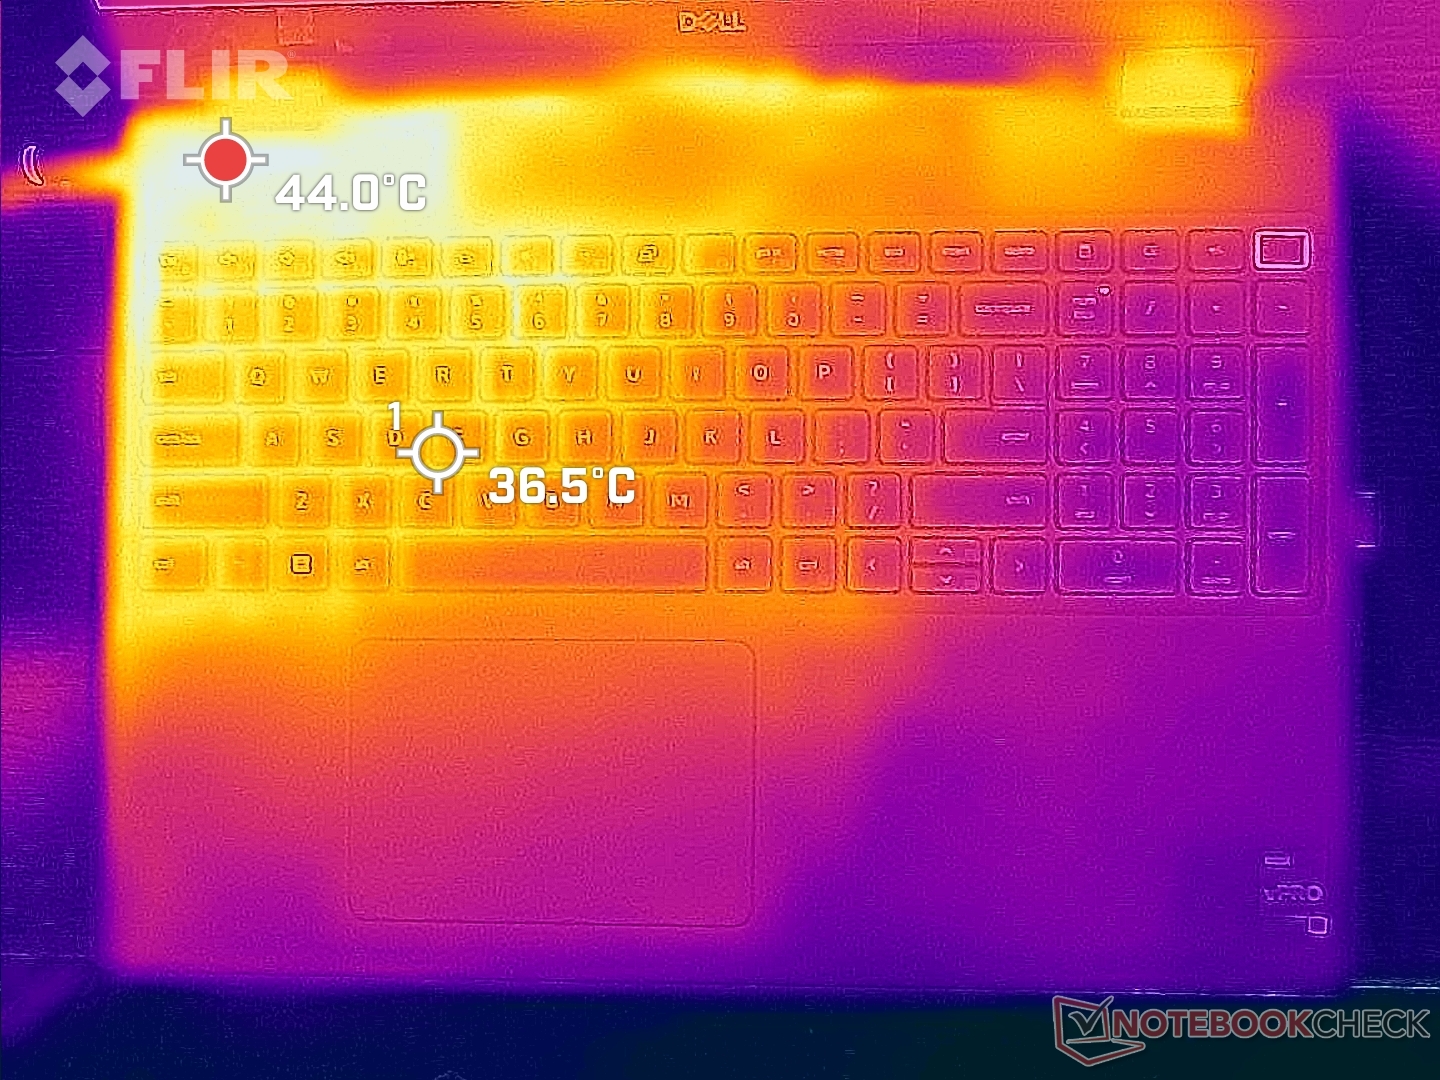
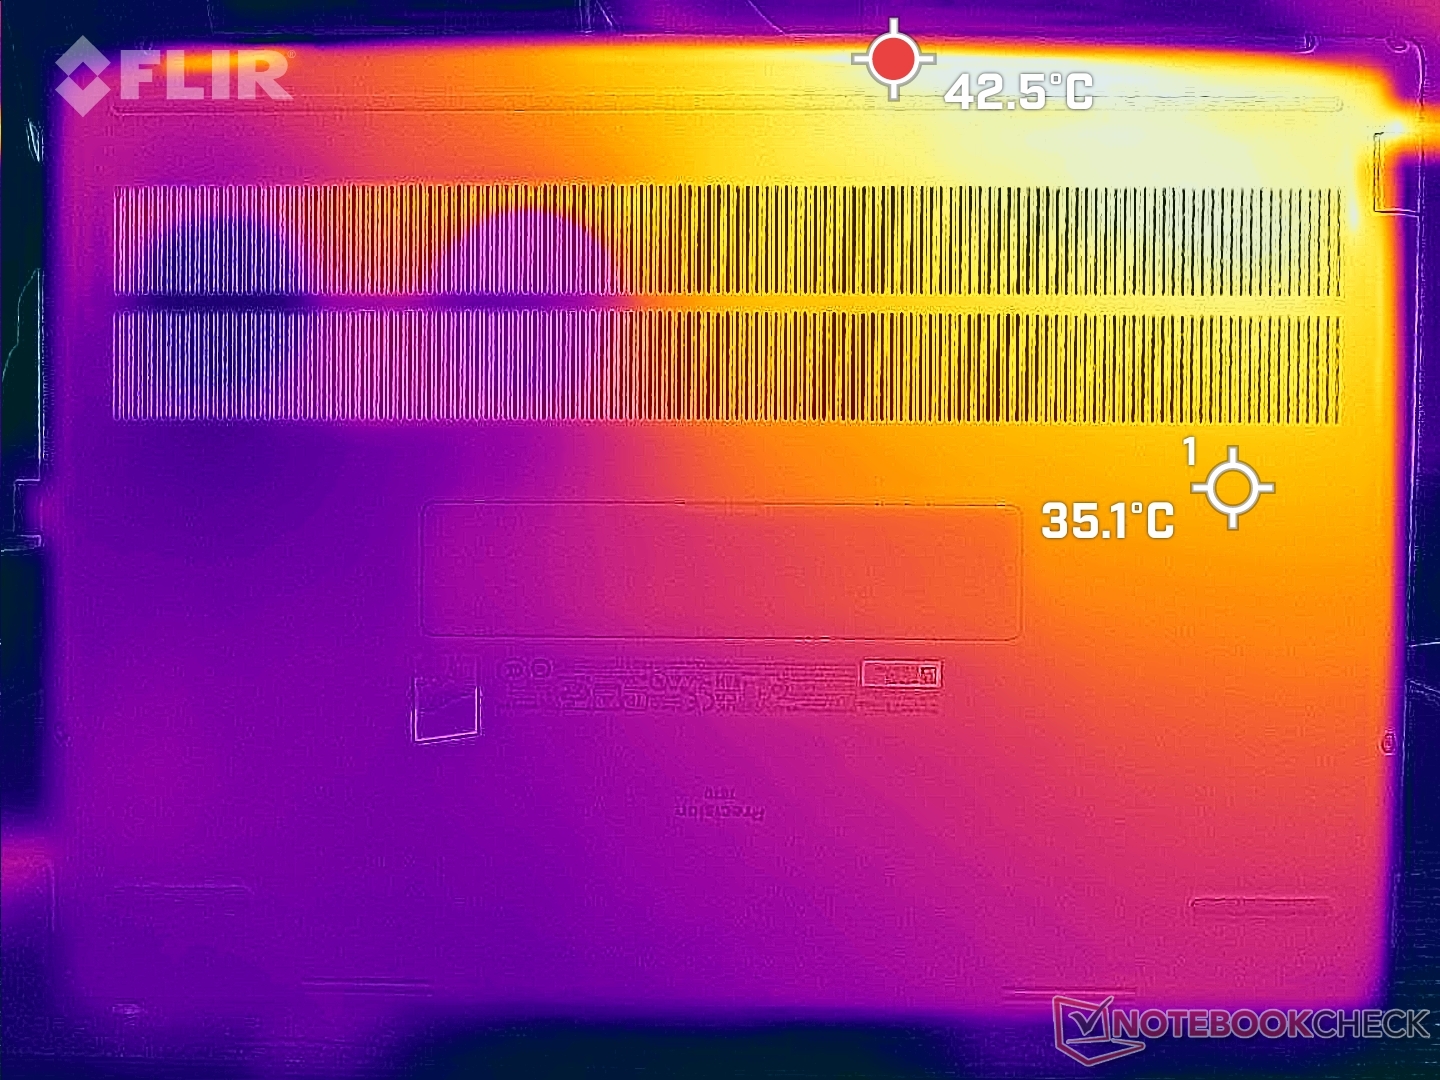
Temperatuur
De oppervlaktetemperaturen zijn altijd warm, ongeacht de belasting op het scherm. Bij stationair draaien in Power Saver-modus, bijvoorbeeld, worden het toetsenbord en de onderkant elk 30 C in vergelijking met 26 C op deLenovo ThinkPad P1 G4. DeAsus ProArt StudioBook Pro 16 kan nog warmer worden met bijna 35 C onder vergelijkbare omstandigheden.
We kunnen hete plekken van 51 C en 46 C aan de boven- en onderkant registreren, respectievelijk bij extreme belasting. De linkerhelft van de behuizing zal altijd warmer zijn dan de rechterhelft, vanwege de manier waarop de koeloplossing en de processors erin zijn geplaatst.
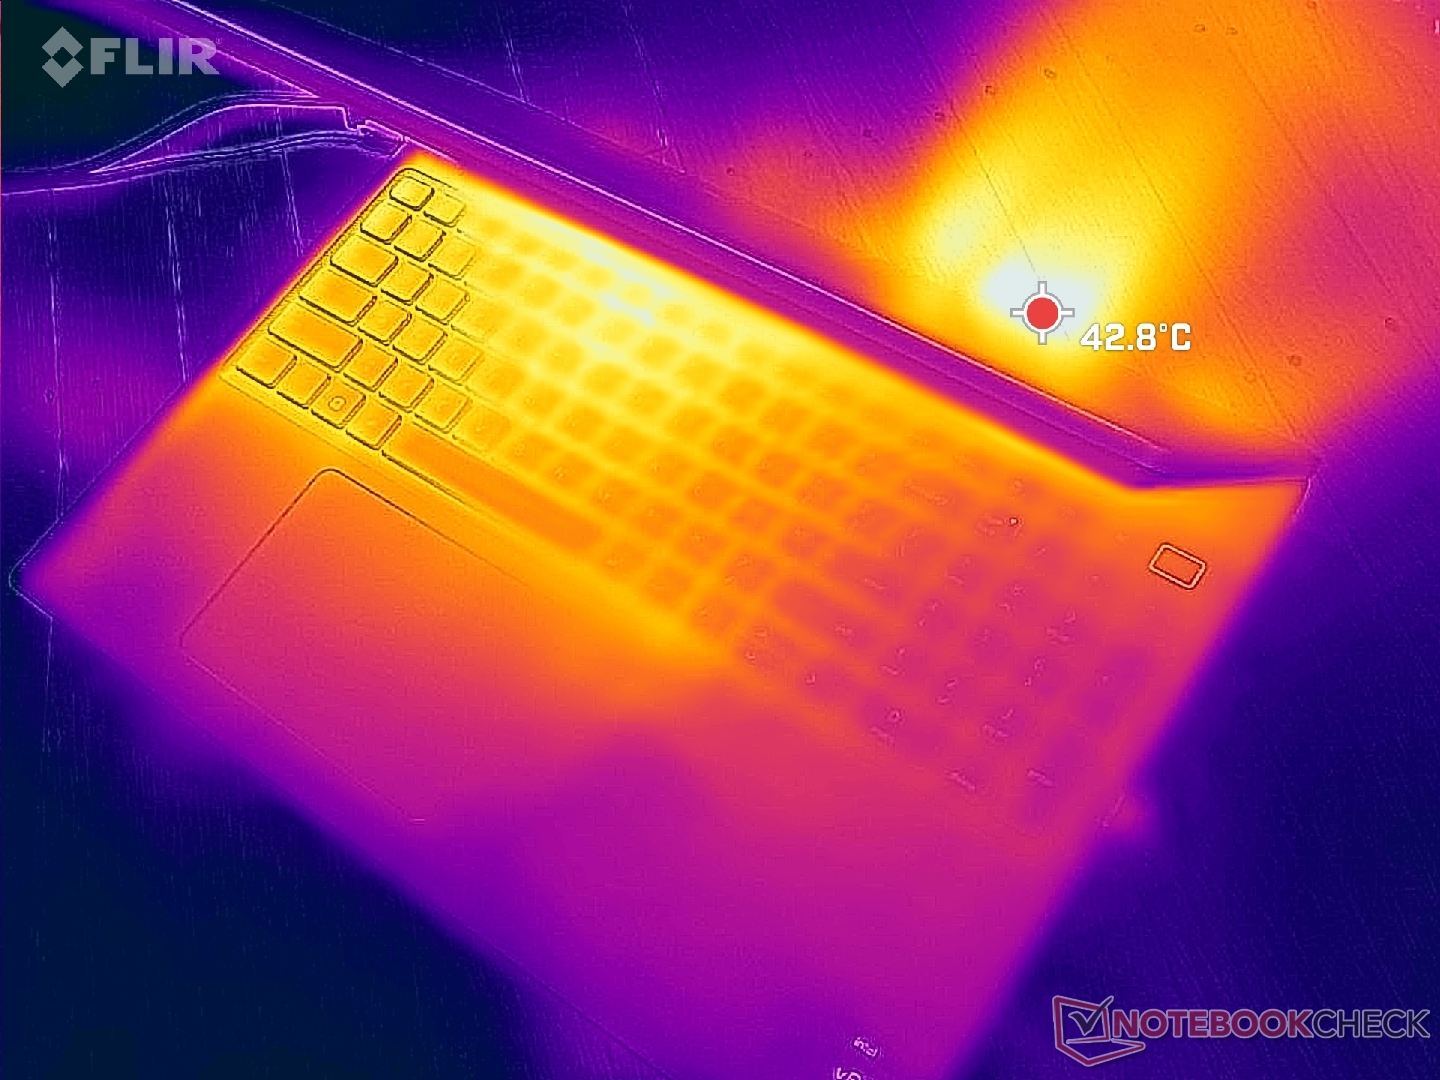
(-) De maximumtemperatuur aan de bovenzijde bedraagt 51 °C / 124 F, vergeleken met het gemiddelde van 38.2 °C / 101 F, variërend van 22.2 tot 69.8 °C voor de klasse Workstation.
(-) De bodem warmt op tot een maximum van 45.8 °C / 114 F, vergeleken met een gemiddelde van 41.1 °C / 106 F
(+) Bij onbelast gebruik bedraagt de gemiddelde temperatuur voor de bovenzijde 29.8 °C / 86 F, vergeleken met het apparaatgemiddelde van 32 °C / 90 F.
(±) Bij het spelen van The Witcher 3 is de gemiddelde temperatuur voor de bovenzijde 37.1 °C / 99 F, vergeleken met het apparaatgemiddelde van 32 °C / 90 F.
(+) De handpalmsteunen en het touchpad bereiken maximaal de huidtemperatuur (34.2 °C / 93.6 F) en zijn dus niet heet.
(-) De gemiddelde temperatuur van de handpalmsteun van soortgelijke toestellen bedroeg 27.8 °C / 82 F (-6.4 °C / -11.6 F).
| Dell Precision 7670 Intel Core i7-12850HX, NVIDIA RTX A2000 Laptop GPU | Lenovo ThinkPad P1 G4-20Y4Z9DVUS Intel Core i7-11800H, NVIDIA T1200 Laptop GPU | Asus ProArt StudioBook 16 W7600H5A-2BL2 Intel Xeon W-11955M, NVIDIA RTX A5000 Laptop GPU | Dell Precision 5000 5560 Intel Core i7-11850H, NVIDIA RTX A2000 Laptop GPU | Dell Precision 7550 Intel Xeon W-10885M, NVIDIA Quadro RTX 5000 Max-Q | HP ZBook Fury 15 G8 Intel Core i9-11950H, NVIDIA RTX A5000 Laptop GPU | |
|---|---|---|---|---|---|---|
| Heat | 5% | -3% | -1% | 2% | 4% | |
| Maximum Upper Side * (°C) | 51 | 49.9 2% | 45.7 10% | 48.2 5% | 49 4% | 45.6 11% |
| Maximum Bottom * (°C) | 45.8 | 56.7 -24% | 48.3 -5% | 42.6 7% | 51 -11% | 57.6 -26% |
| Idle Upper Side * (°C) | 31.8 | 25.5 20% | 35.3 -11% | 34.8 -9% | 28.2 11% | 26 18% |
| Idle Bottom * (°C) | 32.6 | 26.2 20% | 34.4 -6% | 35.2 -8% | 32 2% | 28.8 12% |
* ... kleiner is beter
Stresstest
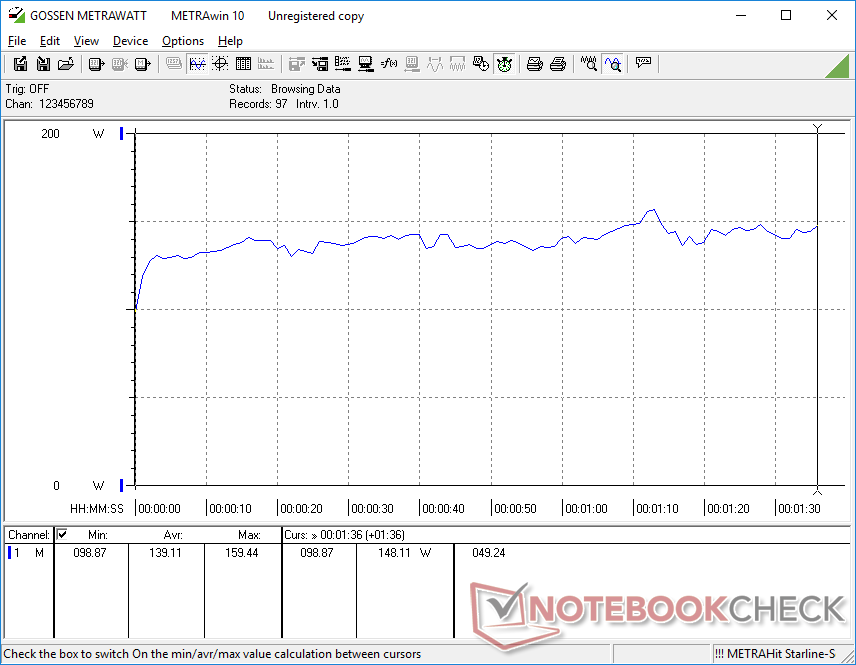
Toen Prime95 werd uitgevoerd om de CPU te belasten, piekten de kloksnelheden en het opgenomen vermogen op het bord tot respectievelijk 3,5 GHz en 153 W, en dit duurde hooguit een paar seconden. De kerntemperatuur liep in deze korte periode op tot 100 C. De kloksnelheid en het opgenomen vermogen daalden daarna gestaag en stabiliseerden zich op respectievelijk 2,2 tot 2,4 GHz en 73 W, om de kerntemperatuur van 85 C op een aanvaardbaarder niveau te houden.
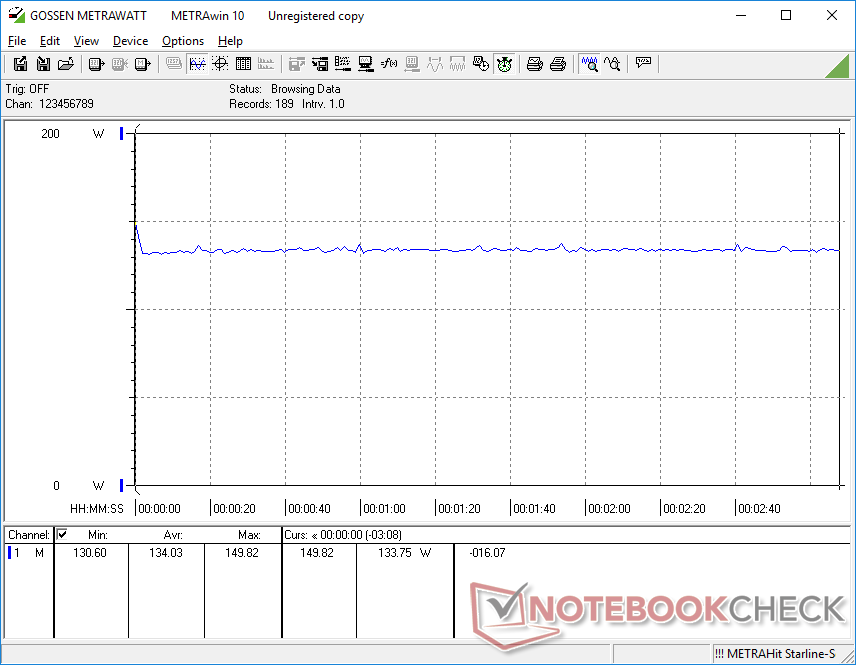
Wanneer Witcher 3 wordt uitgevoerd om een constante zware belasting weer te geven, stabiliseren de GPU-kloksnelheden, temperatuur en stroomverbruik zich op respectievelijk 1777 MHz, 80 C en 80 W, vergeleken met respectievelijk 1462 MHz, 75 C en 45 W op de kleinere Precision 5560 met dezelfde RTX A2000 GPU.
Werken op batterijen beperkt de prestaties. Een Fire Strike test op batterijen zou Physics en Graphics scores opleveren van respectievelijk 9820 en 6911 punten, vergeleken met 23868 en 14295 punten op netstroom.
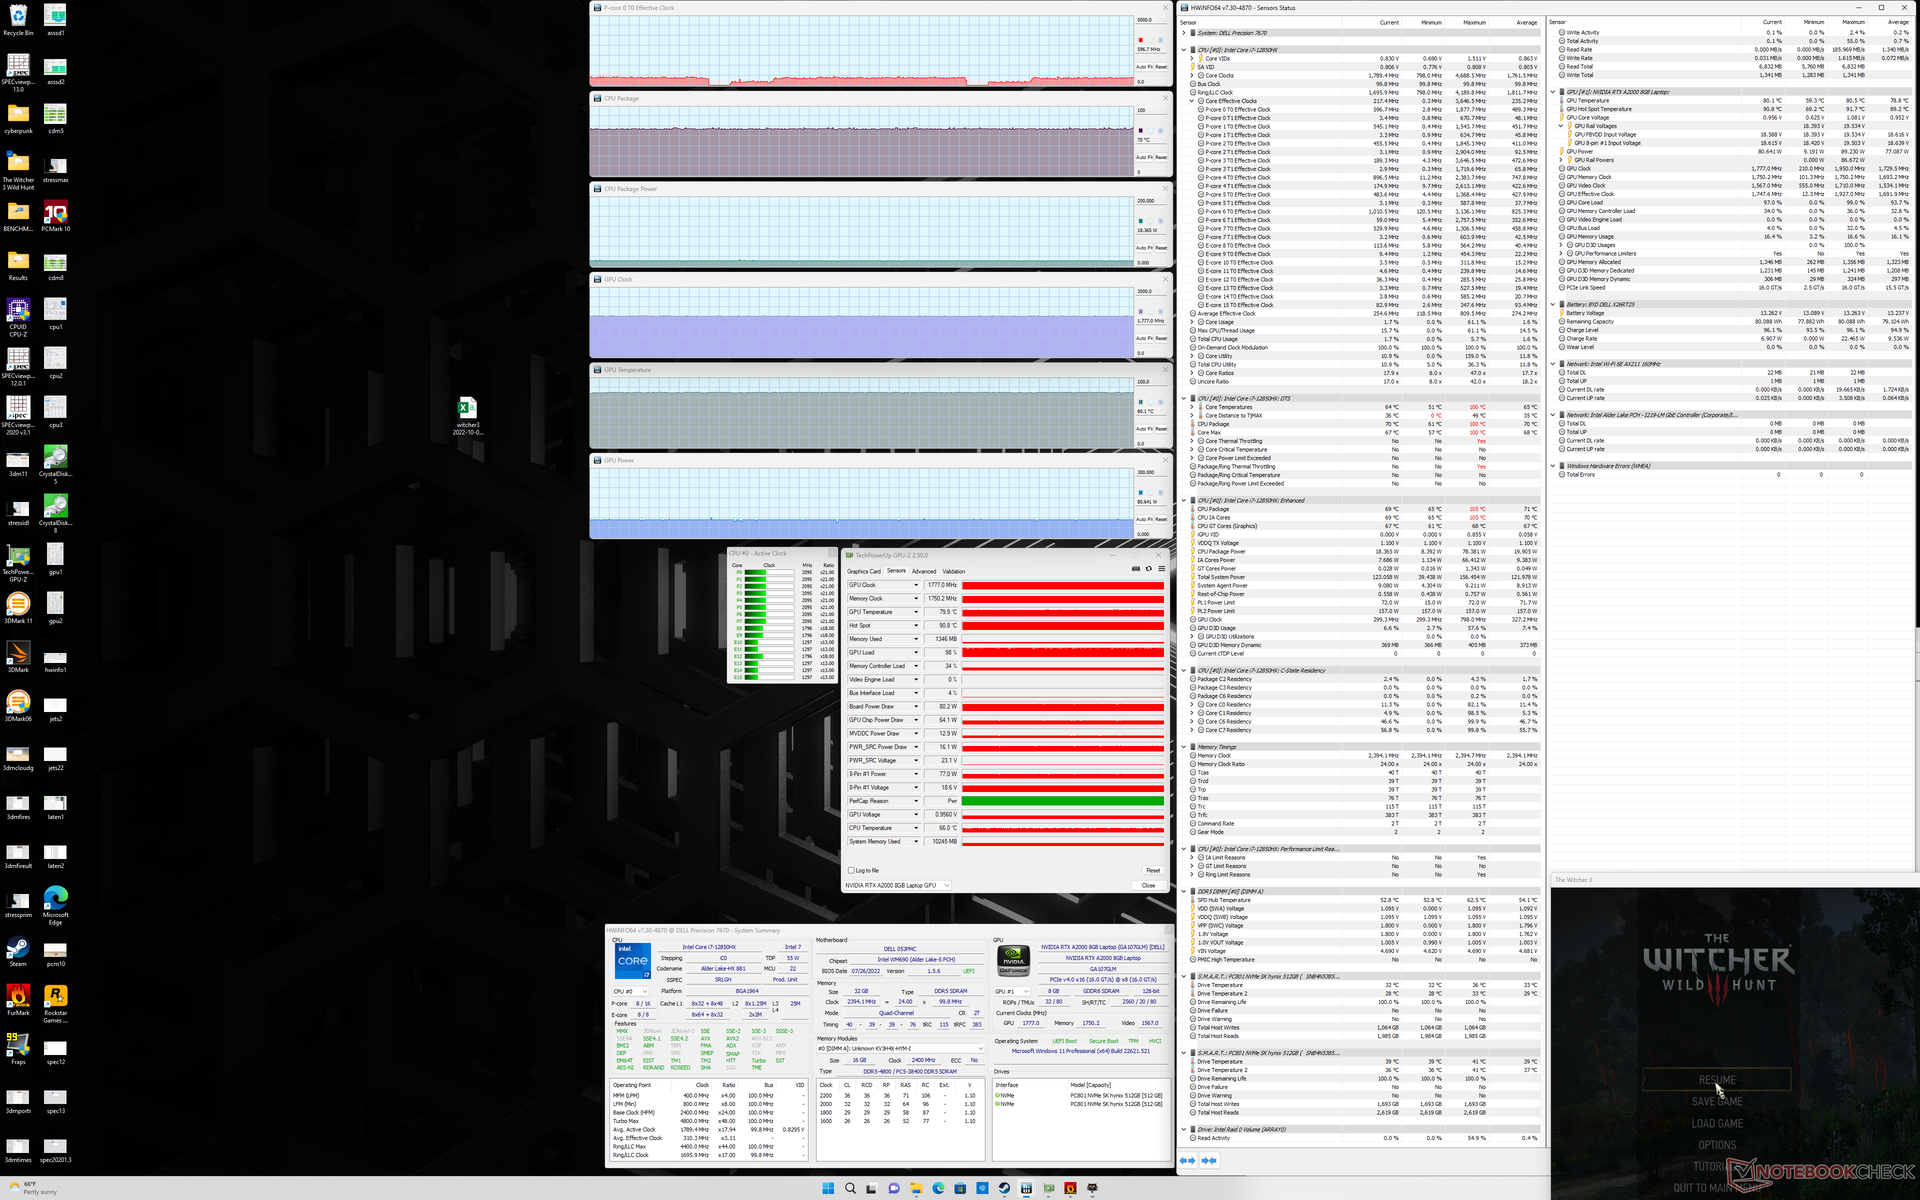
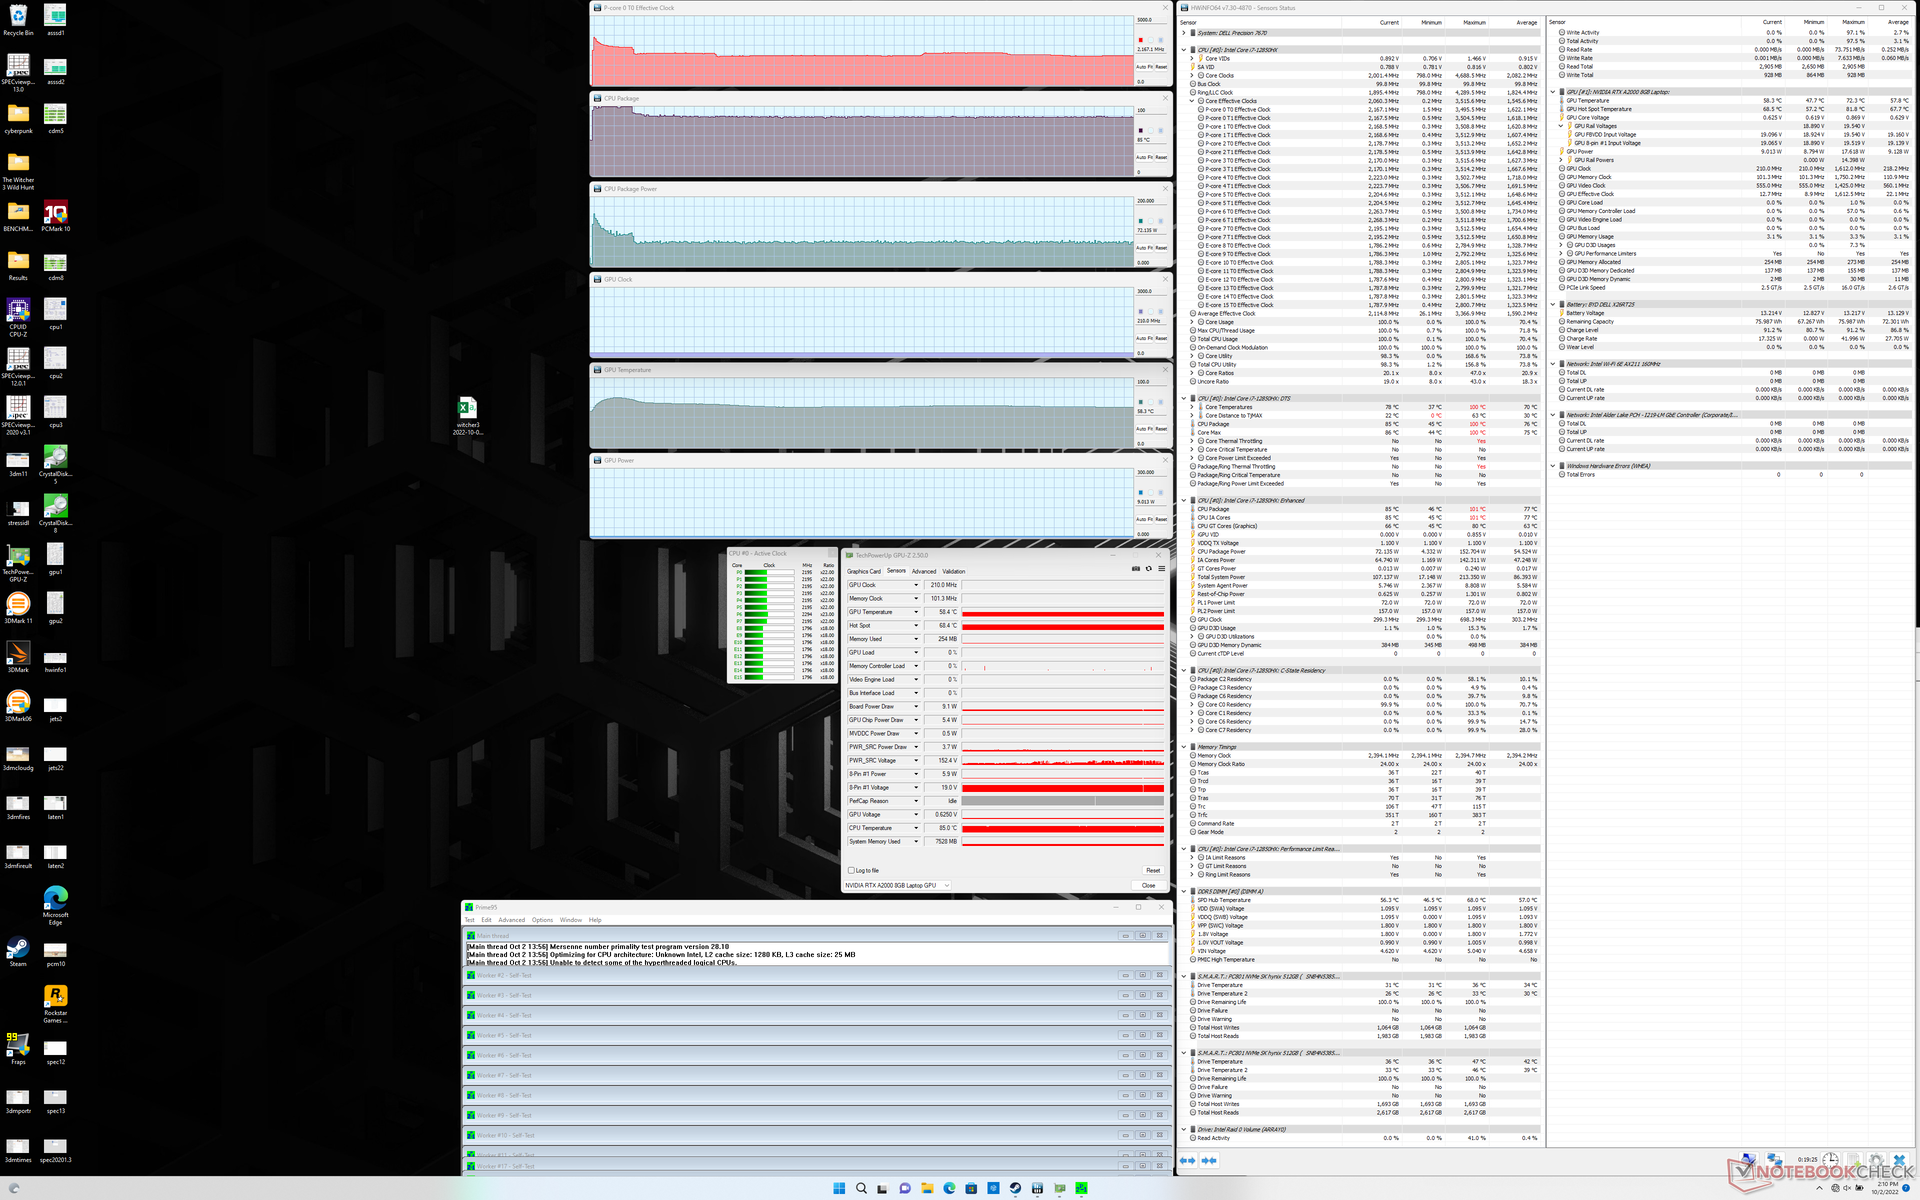
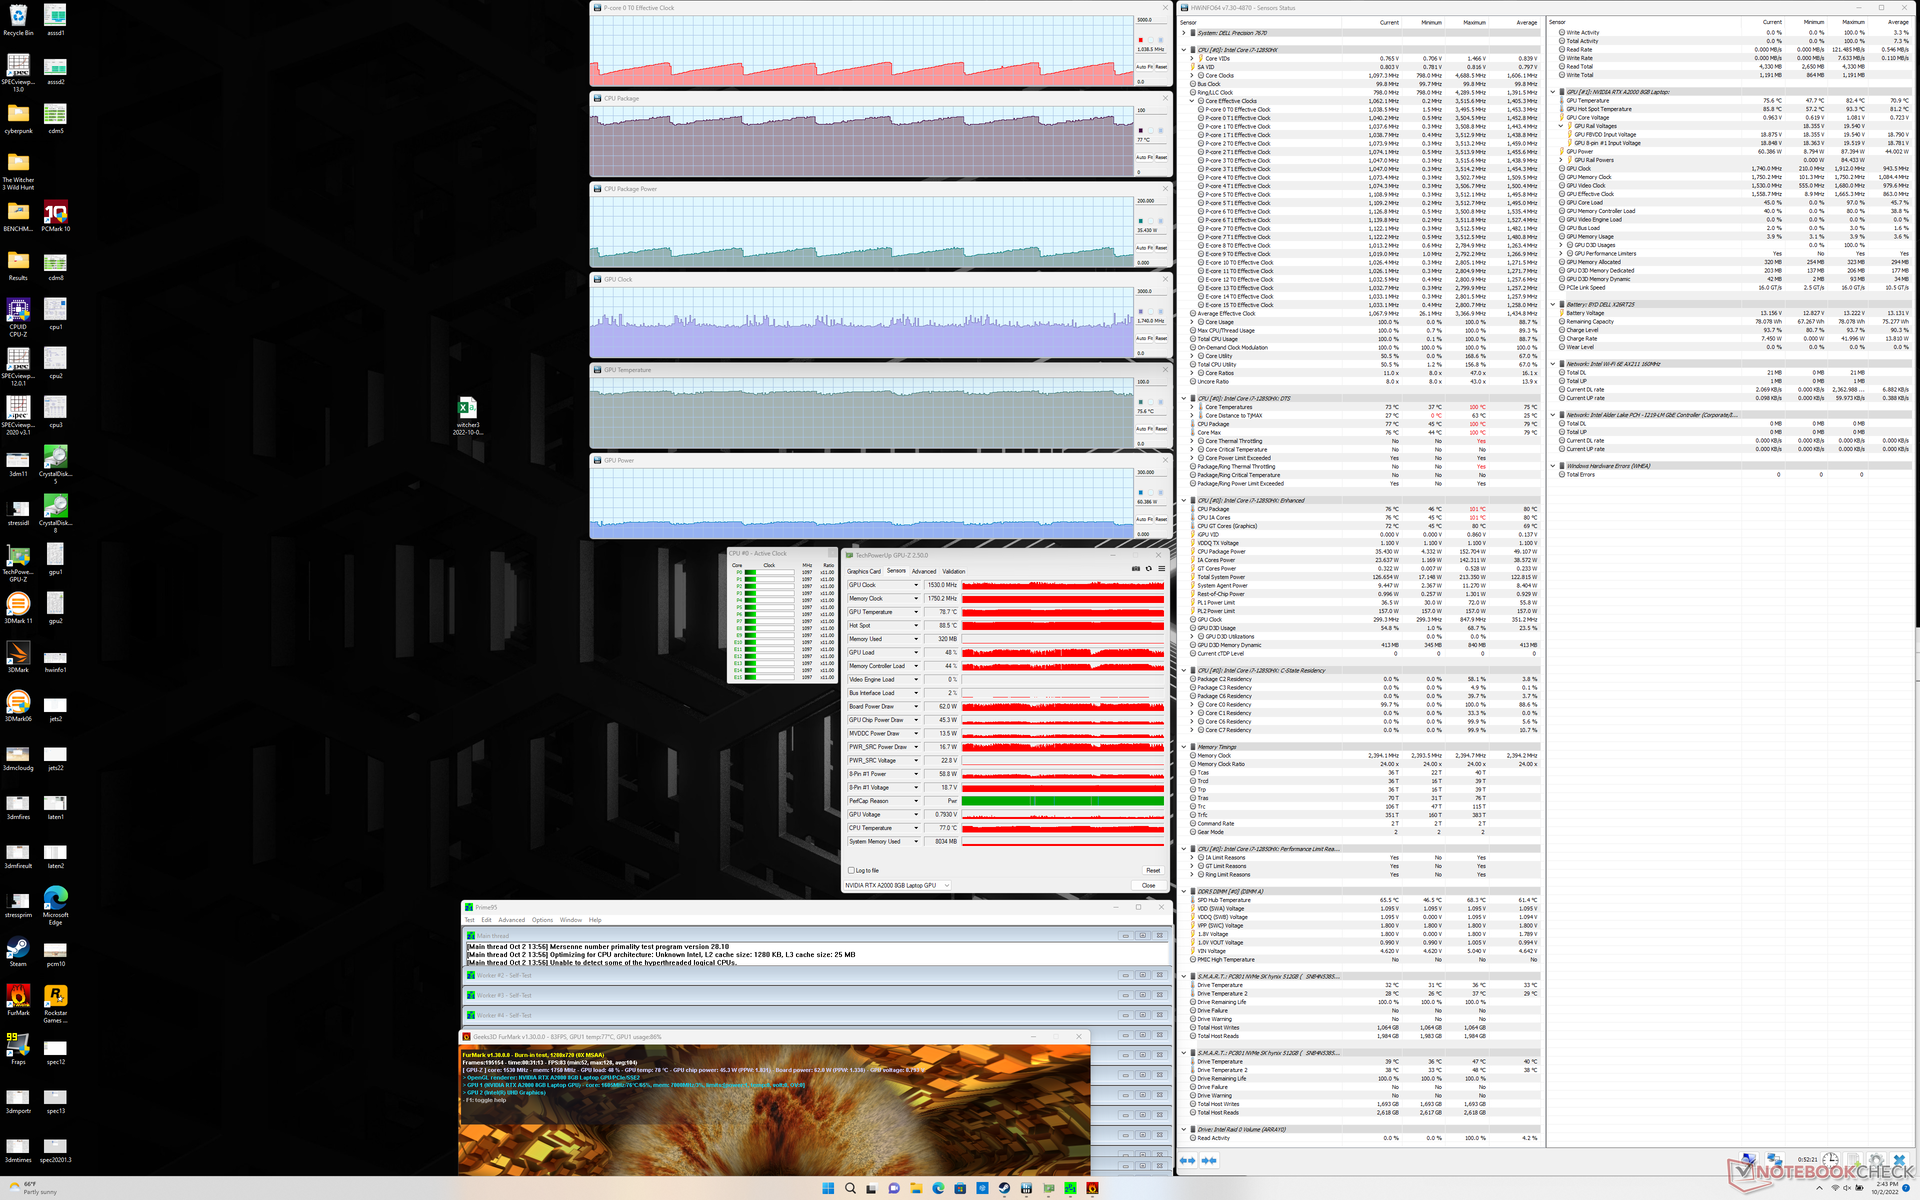
| CPU-klok (GHz) | GPU-klok (MHz) | Gemiddelde CPU-temperatuur (°C) | Gemiddelde GPU-temperatuur (°C) | |
| Inactief systeem | -- | -- | 49 | 50 |
| Prime95 Stress | 2.2 | -- | 85 | 58 |
| Prime95 + FurMark Stress | 0.8 - 1.3 | ~1450 | 76 - 86 | 62 - 72 |
| Witcher 3 Stress | 0,6 | 1777 | 70 | 80 |
Luidsprekers
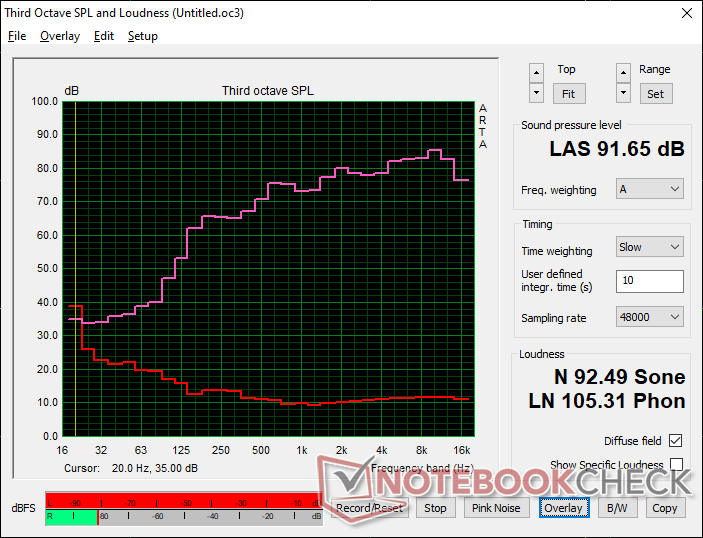
Dell Precision 7670 audioanalyse
(+) | luidsprekers kunnen relatief luid spelen (91.7 dB)
Bas 100 - 315 Hz
(-) | bijna geen lage tonen - gemiddeld 16.8% lager dan de mediaan
(+) | de lage tonen zijn lineair (6.7% delta naar de vorige frequentie)
Midden 400 - 2000 Hz
(+) | evenwichtige middens - slechts 3.5% verwijderd van de mediaan
(+) | de middentonen zijn lineair (3.9% delta ten opzichte van de vorige frequentie)
Hoog 2 - 16 kHz
(+) | evenwichtige hoogtepunten - slechts 4.6% verwijderd van de mediaan
(+) | de hoge tonen zijn lineair (2% delta naar de vorige frequentie)
Algemeen 100 - 16.000 Hz
(+) | het totale geluid is lineair (12.2% verschil met de mediaan)
Vergeleken met dezelfde klasse
» 18% van alle geteste apparaten in deze klasse waren beter, 3% vergelijkbaar, 79% slechter
» De beste had een delta van 7%, het gemiddelde was 17%, de slechtste was 35%
Vergeleken met alle geteste toestellen
» 10% van alle geteste apparaten waren beter, 2% gelijk, 88% slechter
» De beste had een delta van 4%, het gemiddelde was 23%, de slechtste was 134%
Apple MacBook Pro 16 2021 M1 Pro audioanalyse
(+) | luidsprekers kunnen relatief luid spelen (84.7 dB)
Bas 100 - 315 Hz
(+) | goede baars - slechts 3.8% verwijderd van de mediaan
(+) | de lage tonen zijn lineair (5.2% delta naar de vorige frequentie)
Midden 400 - 2000 Hz
(+) | evenwichtige middens - slechts 1.3% verwijderd van de mediaan
(+) | de middentonen zijn lineair (2.1% delta ten opzichte van de vorige frequentie)
Hoog 2 - 16 kHz
(+) | evenwichtige hoogtepunten - slechts 1.9% verwijderd van de mediaan
(+) | de hoge tonen zijn lineair (2.7% delta naar de vorige frequentie)
Algemeen 100 - 16.000 Hz
(+) | het totale geluid is lineair (4.6% verschil met de mediaan)
Vergeleken met dezelfde klasse
» 0% van alle geteste apparaten in deze klasse waren beter, 0% vergelijkbaar, 100% slechter
» De beste had een delta van 5%, het gemiddelde was 17%, de slechtste was 45%
Vergeleken met alle geteste toestellen
» 0% van alle geteste apparaten waren beter, 0% gelijk, 100% slechter
» De beste had een delta van 4%, het gemiddelde was 23%, de slechtste was 134%
Energiebeheer - Zeer veeleisend
Stroomverbruik
Het systeem is behoorlijk veeleisend onder de meeste omstandigheden. Het stroomverbruik varieert tussen 7 W en 25 W bij stationair draaien op de desktop, terwijl hogere belastingen zoals 3DMark 06 of Witcher 3 elk ongeveer 140 W verbruiken. De Asus ProArt StudioBook 16 of Precision 5560 zouden in vergelijkbare omstandigheden slechts 132 W of 96 W trekken
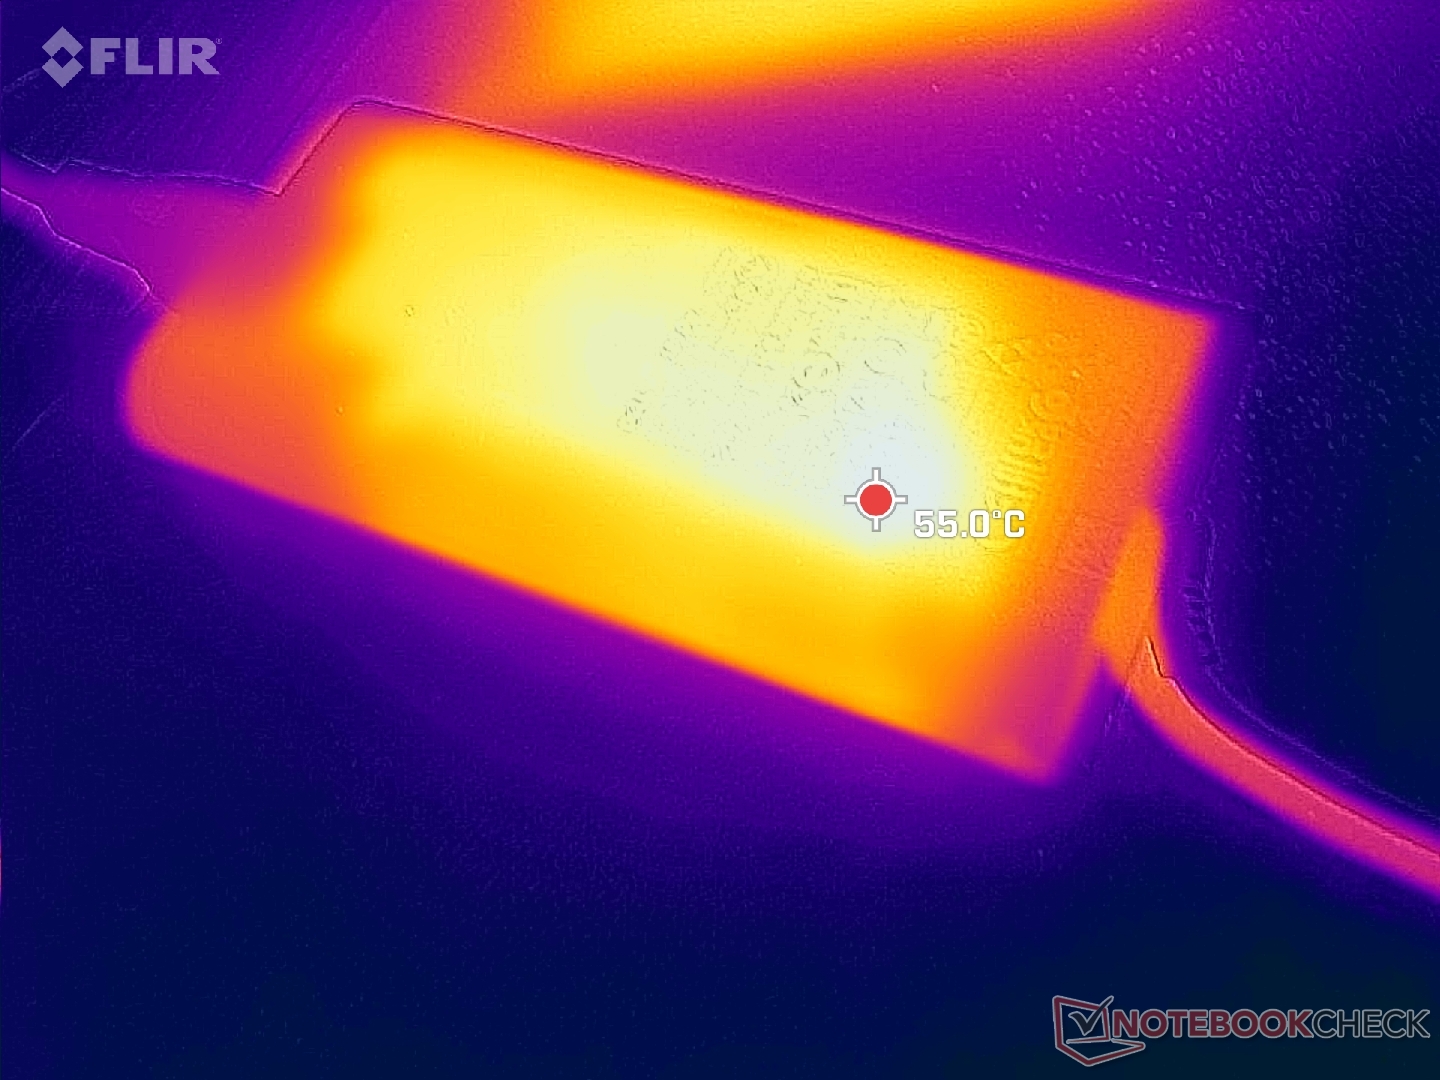
Het stroomverbruik kan oplopen tot 221 W wanneer de CPU en GPU maximaal worden gebruikt, ondanks het feit dat de middelgrote netadapter (~13,7 x 6,6 x 2,3 cm) slechts 180 W mag trekken. Deze extreem hoge snelheid duurt hooguit een minuut en daalt dan tot 114 W als de CPU wordt belast of 180 W als zowel de CPU als de GPU tegelijkertijd worden belast. De oplaadsnelheid van de laptop kan daardoor onder zulke extreme omstandigheden tot stilstand komen
Dell biedt een meer capabele 240 W AC adapter als de Precision 7670 wordt geconfigureerd met snellere GPU opties. Maar op basis van onze bevindingen met de 180 W AC-adapter, zou de 240 W optie misschien standaard moeten zijn voor alle Nvidia RTX configuraties.
| Uit / Standby | |
| Inactief | |
| Belasting |
|
Key:
min: | |
| Dell Precision 7670 i7-12850HX, RTX A2000 Laptop GPU, SK Hynix HFS001TEJ9X115N, OLED, 3840x2400, 16" | Lenovo ThinkPad P1 G4-20Y4Z9DVUS i7-11800H, T1200 Laptop GPU, Samsung PM9A1 MZVL2512HCJQ, IPS, 2560x1600, 16" | Asus ProArt StudioBook 16 W7600H5A-2BL2 W-11955M, RTX A5000 Laptop GPU, 2x Micron 2300 2TB MTFDHBA2T0TDV (RAID 0), OLED, 3840x2400, 16" | Dell Precision 5000 5560 i7-11850H, RTX A2000 Laptop GPU, Samsung PM9A1 MZVL22T0HBLB, IPS, 3840x2400, 15.6" | Dell Precision 7550 W-10885M, Quadro RTX 5000 Max-Q, SK Hynix PC601A NVMe 1TB, IPS, 3840x2160, 15.6" | HP ZBook Fury 15 G8 i9-11950H, RTX A5000 Laptop GPU, Samsung PM981a MZVLB1T0HBLR, IPS, 3840x2160, 15.6" | |
|---|---|---|---|---|---|---|
| Power Consumption | 9% | -14% | 16% | -12% | -13% | |
| Idle Minimum * (Watt) | 7.5 | 9.9 -32% | 12.4 -65% | 6.2 17% | 8.2 -9% | 8.3 -11% |
| Idle Average * (Watt) | 9.5 | 13.9 -46% | 16.5 -74% | 13.9 -46% | 16.8 -77% | 19.9 -109% |
| Idle Maximum * (Watt) | 28.4 | 14.6 49% | 25 12% | 23.8 16% | 24.4 14% | 21.8 23% |
| Load Average * (Watt) | 139.1 | 95 32% | 132 5% | 95.7 31% | 131 6% | 110.9 20% |
| Witcher 3 ultra * (Watt) | 134 | 98.9 26% | 132 1% | 87 35% | 156.6 -17% | 165 -23% |
| Load Maximum * (Watt) | 220.8 | 170.8 23% | 134 39% | 132.6 40% | 201.8 9% | 171.8 22% |
* ... kleiner is beter
Power Consumption Witcher 3 / Stresstest
Power Consumption external Monitor
Levensduur van de batterij
De WLAN gebruikstijd is net iets minder dan 6 uur en daarmee korter dan op de Precision 5560 of Precision 7550. Dit is grotendeels te wijten aan het OLED-paneel dat meer stroom verbruikt dan IPS bij het weergeven van witte kleuren. Aangezien de meeste websites overwegend wit van kleur zijn, is de over het algemeen kortere levensduur van de batterij niet onverwacht
Opladen met de meegeleverde AC-adapter duurt ongeveer 2 uur. Het systeem kan niet worden opgeladen via USB-C omdat het geen PD-in ondersteunt.
| Dell Precision 7670 i7-12850HX, RTX A2000 Laptop GPU, 83 Wh | Lenovo ThinkPad P1 G4-20Y4Z9DVUS i7-11800H, T1200 Laptop GPU, 90 Wh | Asus ProArt StudioBook 16 W7600H5A-2BL2 W-11955M, RTX A5000 Laptop GPU, 90 Wh | Dell Precision 5000 5560 i7-11850H, RTX A2000 Laptop GPU, 86 Wh | Dell Precision 7550 W-10885M, Quadro RTX 5000 Max-Q, 95 Wh | HP ZBook Fury 15 G8 i9-11950H, RTX A5000 Laptop GPU, 94 Wh | |
|---|---|---|---|---|---|---|
| Batterijduur | 49% | -15% | 32% | 23% | 5% | |
| Reader / Idle (h) | 7.9 | 12 52% | 11.1 41% | |||
| WiFi v1.3 (h) | 5.9 | 8.8 49% | 5 -15% | 6.3 7% | 8.9 51% | 6.2 5% |
| Load (h) | 1.3 | 1.8 38% | 1 -23% | |||
| H.264 (h) | 1.8 | |||||
| Witcher 3 ultra (h) | 1.6 |
Pro
Contra
Verdict - Krachtig zonder te groot te zijn
De Precision 7670 concurreert rechtstreeks met de HP ZBook Fury 16 G9. Aangezien we het HP-model nog moeten beoordelen, kunnen we onze Precision alleen vergelijken met de 16-inchLenovo ThinkPad P1 G4 ofAsus ProArt StudioBook Pro 16 W7600. Het Dell-model is in staat om aanzienlijk snellere CPU-prestaties te bieden dan beide, naast veel meer extra functies, waaronder eenvoudiger onderhoud, WAN-connectiviteit en meer opslagmogelijkheden.
De Precision 7670 is op zijn best wanneer hij is geconfigureerd met CPU- en GPU-opties uit het hogere segment. In het lagere segment zijn echter dunnere en lichtere alternatieven te vinden die ongeveer hetzelfde prestatieniveau bieden.
Het gewicht is een belangrijk nadeel van de Precision 7670, aangezien het systeem bijna net zo zwaar is als de grotere 17,3-inch Precision 7550. Daarnaast is het een beetje teleurstellend dat de Core i7-12850HX ondanks het zware gewicht de Turbo Boost kloksnelheden niet gedurende langere tijd kan volhouden. Hij is nog steeds snel, maar de onderliggende koeloplossing beperkt zijn potentieel. Het ontbreken van enige Xeon CPU opties maakt dat de Precision 7670 meer aanvoelt als een Studio-type laptop dan als een volwaardig werkstation waarvoor hij op de markt wordt gebracht.
De Precision 7670 is nog steeds geweldig voor power users die kunnen profiteren van het hebben van al die energievretende 12e gen Intel cores en een high-end RTX A5500 GPU. Voor low-end configuraties kunnen slankere en lichtere 16-inch modellen zoals de eerder genoemde Lenovo of Asus echter nog steeds fatsoenlijke alternatieven zijn.
Prijs en beschikbaarheid
De Precision 7670 is momenteel beschikbaar op Newegg in slechts één configuratie. Wij raden aan rechtstreeks bij Dell te bestellen voor een ruimere keuze aan configuraties en garantiemogelijkheden.
Dell Precision 7670
- 06-10-2022 v7 (old)
Allen Ngo
Price comparison

