Kort testrapport MSI WS66 10TMT Workstation Laptop: Sneller dan de Razer Blade 15 Studio Edition
Evaluatie | Datum | Model | Gewicht | Hoogte | Formaat | Resolutie | Beste prijs |
|---|---|---|---|---|---|---|---|
| 83.4 % v7 (old) | 08-2020 | MSI WS66 10TMT-207US i9-10980HK, Quadro RTX 5000 Max-Q | 2.3 kg | 19.8 mm | 15.60" | 1920x1080 | |
| 87.8 % v7 (old) | 08-2020 | Dell Precision 7550 W-10885M, Quadro RTX 5000 Max-Q | 2.8 kg | 27.36 mm | 15.60" | 3840x2160 | |
| 86.3 % v7 (old) | 08-2020 | Dell Precision 5550 P91F i7-10875H, Quadro T2000 Max-Q | 2 kg | 18 mm | 15.60" | 3840x2400 | |
| 87 % v7 (old) | 08-2020 | Razer Blade 15 Studio Edition 2020 i7-10875H, Quadro RTX 5000 Max-Q | 2.2 kg | 13.98 mm | 15.60" | 3840x2160 | |
| 85.6 % v6 (old) | 09-2017 | MSI WS63VR 7RL-023US i7-7700HQ, Quadro P4000 Max-Q | 1.9 kg | 18 mm | 15.60" | 3840x2160 | |
| 82.1 % v7 (old) | 03-2020 | Acer ConceptD 3 Pro CN315-71P-73W1 i7-9750H, Quadro T1000 (Laptop) | 2.4 kg | 23.4 mm | 15.60" | 1920x1080 |
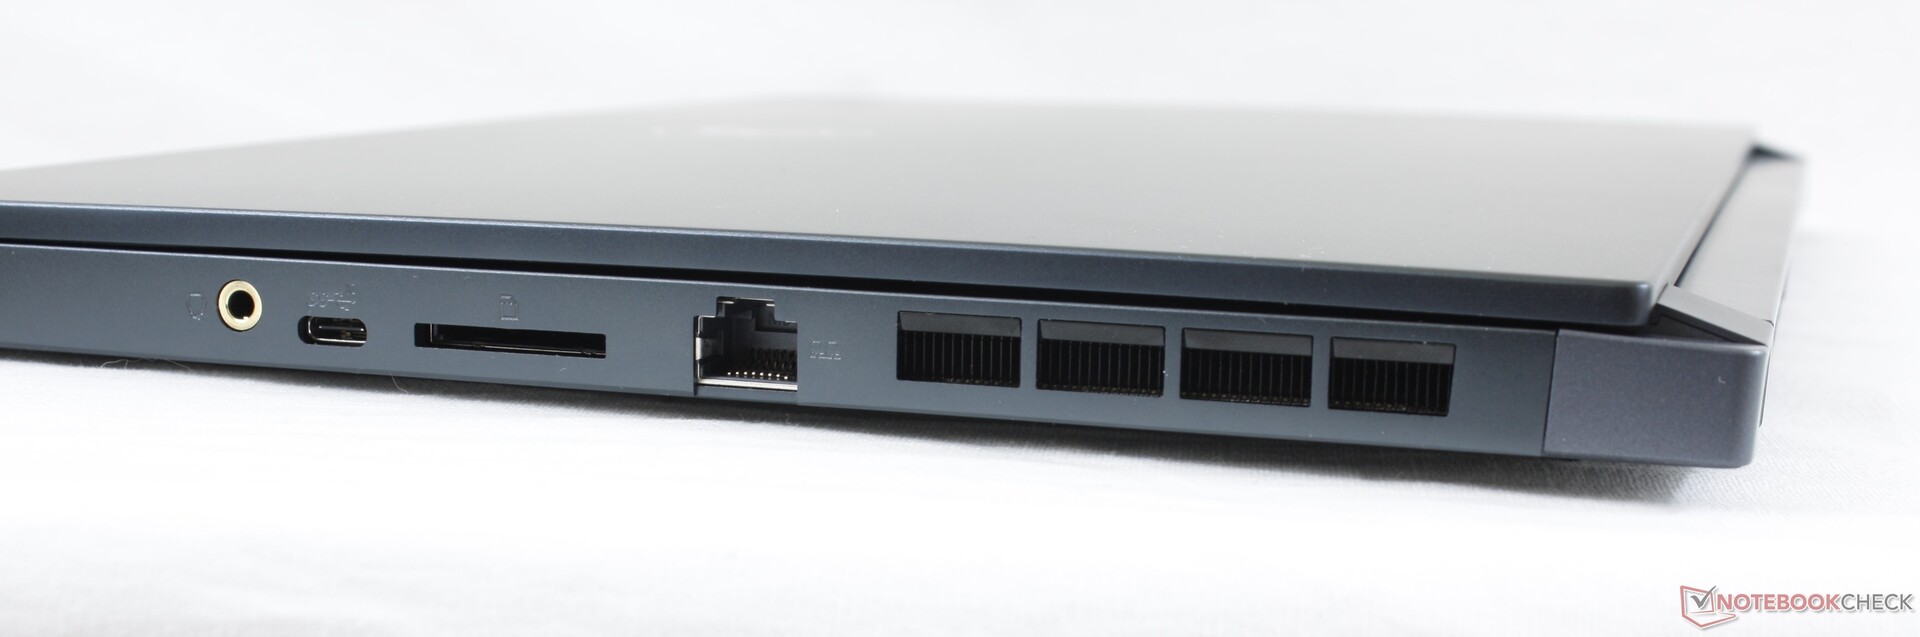
| SD Card Reader | |
| average JPG Copy Test (av. of 3 runs) | |
| MSI WS66 10TMT-207US (Toshiba Exceria Pro SDXC 64 GB UHS-II) | |
| Razer Blade 15 RTX 2070 Super Max-Q (Toshiba Exceria Pro SDXC 64 GB UHS-II) | |
| Dell Precision 5550 P91F (Toshiba Exceria Pro SDXC 64 GB UHS-II) | |
| Dell Precision 7550 (Toshiba Exceria Pro SDXC 64 GB UHS-II) | |
| MSI WS63VR 7RL-023US | |
| MSI WE75 9TK (Toshiba Exceria Pro SDXC 64 GB UHS-II) | |
| maximum AS SSD Seq Read Test (1GB) | |
| MSI WS63VR 7RL-023US | |
| MSI WS66 10TMT-207US (Toshiba Exceria Pro SDXC 64 GB UHS-II) | |
| Razer Blade 15 RTX 2070 Super Max-Q (Toshiba Exceria Pro SDXC 64 GB UHS-II) | |
| Dell Precision 5550 P91F (Toshiba Exceria Pro SDXC 64 GB UHS-II) | |
| Dell Precision 7550 (Toshiba Exceria Pro SDXC 64 GB UHS-II) | |
| MSI WE75 9TK (Toshiba Exceria Pro SDXC 64 GB UHS-II) | |


| |||||||||||||||||||||||||
Helderheidsverdeling: 91 %
Helderheid in Batterij-modus: 374.5 cd/m²
Contrast: 892:1 (Zwart: 0.42 cd/m²)
ΔE ColorChecker Calman: 4.05 | ∀{0.5-29.43 Ø4.73}
calibrated: 4.36
ΔE Greyscale Calman: 2.6 | ∀{0.09-98 Ø4.97}
86.3% sRGB (Argyll 1.6.3 3D)
56.4% AdobeRGB 1998 (Argyll 1.6.3 3D)
63.6% AdobeRGB 1998 (Argyll 3D)
86.9% sRGB (Argyll 3D)
62.8% Display P3 (Argyll 3D)
Gamma: 2.21
CCT: 7027 K
| MSI WS66 10TMT-207US AU Optronics B156HAB03.0, IPS, 15.6", 1920x1080 | Dell Precision 7550 AU Optronics B156ZAN, IPS, 15.6", 3840x2160 | Dell Precision 5550 P91F Sharp LQ156R1, IPS, 15.6", 3840x2400 | Razer Blade 15 Studio Edition 2020 Samsung SDCA029, OLED, 15.6", 3840x2160 | MSI WS63VR 7RL-023US SAMSUNG LƒFL156FL02-101 , IPS, 15.6", 3840x2160 | Acer ConceptD 3 Pro CN315-71P-73W1 Chi Mei N156HCE-EN2, IPS, 15.6", 1920x1080 | |
|---|---|---|---|---|---|---|
| Display | 33% | 38% | 42% | -22% | 36% | |
| Display P3 Coverage (%) | 62.8 | 82.1 31% | 89.9 43% | 99.9 59% | 47.43 -24% | 97.9 56% |
| sRGB Coverage (%) | 86.9 | 99.6 15% | 100 15% | 100 15% | 71.4 -18% | 99.9 15% |
| AdobeRGB 1998 Coverage (%) | 63.6 | 96.8 52% | 99.9 57% | 97.3 53% | 49 -23% | 87.2 37% |
| Response Times | -16% | -11% | 89% | 10% | 25% | |
| Response Time Grey 50% / Grey 80% * (ms) | 44.8 ? | 51.2 ? -14% | 46 ? -3% | 4 ? 91% | 36.8 ? 18% | 33 ? 26% |
| Response Time Black / White * (ms) | 28.8 ? | 34 ? -18% | 34 ? -18% | 4 ? 86% | 28.4 ? 1% | 22 ? 24% |
| PWM Frequency (Hz) | 1351 ? | |||||
| Screen | -2% | 1% | 212% | -27% | 16% | |
| Brightness middle (cd/m²) | 374.5 | 473.5 26% | 469.8 25% | 380 1% | 259.4 -31% | 343 -8% |
| Brightness (cd/m²) | 363 | 461 27% | 464 28% | 388 7% | 247 -32% | 309 -15% |
| Brightness Distribution (%) | 91 | 90 -1% | 85 -7% | 93 2% | 85 -7% | 85 -7% |
| Black Level * (cd/m²) | 0.42 | 0.55 -31% | 0.42 -0% | 0.018 96% | 0.43 -2% | 0.22 48% |
| Contrast (:1) | 892 | 861 -3% | 1119 25% | 21111 2267% | 603 -32% | 1559 75% |
| Colorchecker dE 2000 * | 4.05 | 4.8 -19% | 5.16 -27% | 5.47 -35% | 5.5 -36% | 3.73 8% |
| Colorchecker dE 2000 max. * | 8.17 | 8.73 -7% | 9.33 -14% | 8.19 -0% | 12.7 -55% | 6.51 20% |
| Colorchecker dE 2000 calibrated * | 4.36 | 3.08 29% | 3.75 14% | 3.04 30% | 1.43 67% | |
| Greyscale dE 2000 * | 2.6 | 5.6 -115% | 5.5 -112% | 5.3 -104% | 3.6 -38% | 4.24 -63% |
| Gamma | 2.21 100% | 2.34 94% | 2 110% | 2.15 102% | 2.24 98% | 2.2 100% |
| CCT | 7027 93% | 7549 86% | 6198 105% | 6128 106% | 7163 91% | 6329 103% |
| Color Space (Percent of AdobeRGB 1998) (%) | 56.4 | 86.4 53% | 89.2 58% | 86 52% | 45 -20% | 78 38% |
| Color Space (Percent of sRGB) (%) | 86.3 | 99.7 16% | 100 16% | 100 16% | 71 -18% | 100 16% |
| Totaal Gemiddelde (Programma / Instellingen) | 5% /
3% | 9% /
6% | 114% /
165% | -13% /
-21% | 26% /
21% |
* ... kleiner is beter
Responstijd Scherm
| ↔ Responstijd Zwart naar Wit | ||
|---|---|---|
| 28.8 ms ... stijging ↗ en daling ↘ gecombineerd | ↗ 17.2 ms stijging | 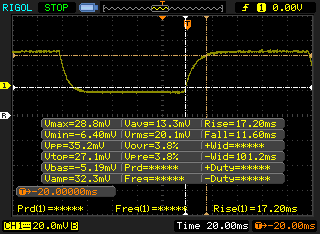 |
| ↘ 11.6 ms daling | ||
| Het scherm vertoonde relatief trage responstijden in onze tests en is misschien te traag voor games. Ter vergelijking: alle testtoestellen variëren van 0.1 (minimum) tot 240 (maximum) ms. » 76 % van alle toestellen zijn beter. Dit betekent dat de gemeten responstijd slechter is dan het gemiddelde (19.9 ms) van alle geteste toestellen. | ||
| ↔ Responstijd 50% Grijs naar 80% Grijs | ||
| 44.8 ms ... stijging ↗ en daling ↘ gecombineerd | ↗ 21.2 ms stijging | 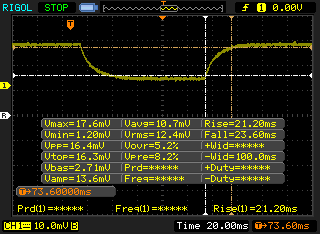 |
| ↘ 23.6 ms daling | ||
| Het scherm vertoonde trage responstijden in onze tests en is misschien te traag voor games. Ter vergelijking: alle testtoestellen variëren van 0.165 (minimum) tot 636 (maximum) ms. » 76 % van alle toestellen zijn beter. Dit betekent dat de gemeten responstijd slechter is dan het gemiddelde (31.1 ms) van alle geteste toestellen. | ||
Screen Flickering / PWM (Pulse-Width Modulation)
| Screen flickering / PWM niet waargenomen | 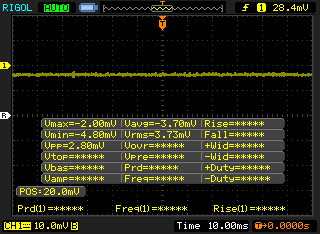 | ||
Ter vergelijking: 52 % van alle geteste toestellen maakten geen gebruik van PWM om de schermhelderheid te verlagen. Als het wel werd gebruikt, werd een gemiddelde van 7791 (minimum: 5 - maximum: 343500) Hz waargenomen. | |||
Cinebench R15: CPU Single 64Bit | CPU Multi 64Bit
Blender: v2.79 BMW27 CPU
7-Zip 18.03: 7z b 4 -mmt1 | 7z b 4
Geekbench 5.5: Single-Core | Multi-Core
HWBOT x265 Benchmark v2.2: 4k Preset
LibreOffice : 20 Documents To PDF
R Benchmark 2.5: Overall mean
| Cinebench R20 / CPU (Multi Core) | |
| Intel Core i9-9900KS, Nvidia Titan RTX | |
| Eluktronics RP-15 | |
| MSI WS66 10TMT-207US | |
| Gemiddeld Intel Core i9-10980HK (3526 - 4487, n=13) | |
| Dell Precision 7550 | |
| Dell Precision 5550 P91F | |
| Razer Blade 15 RTX 2070 Super Max-Q | |
| HP Envy 15-ep0098nr | |
| Acer ConceptD 9 Pro | |
| Acer ConceptD 3 Pro CN315-71P-73W1 | |
| Cinebench R20 / CPU (Single Core) | |
| Intel Core i9-9900KS, Nvidia Titan RTX | |
| Acer ConceptD 9 Pro | |
| MSI WS66 10TMT-207US | |
| Dell Precision 5550 P91F | |
| Eluktronics RP-15 | |
| Razer Blade 15 RTX 2070 Super Max-Q | |
| Dell Precision 7550 | |
| Gemiddeld Intel Core i9-10980HK (465 - 507, n=13) | |
| Acer ConceptD 3 Pro CN315-71P-73W1 | |
| HP Envy 15-ep0098nr | |
| Cinebench R15 / CPU Single 64Bit | |
| Intel Core i9-9900KS, Nvidia Titan RTX | |
| MSI WS66 10TMT-207US | |
| Dell Precision 7550 | |
| Gemiddeld Intel Core i9-10980HK (198 - 219, n=15) | |
| Dell Precision 5550 P91F | |
| Razer Blade 15 RTX 2070 Super Max-Q | |
| Acer ConceptD 9 Pro | |
| HP Envy 15-ep0098nr | |
| Eluktronics RP-15 | |
| Acer ConceptD 3 Pro CN315-71P-73W1 | |
| Cinebench R15 / CPU Multi 64Bit | |
| Intel Core i9-9900KS, Nvidia Titan RTX | |
| Eluktronics RP-15 | |
| Gemiddeld Intel Core i9-10980HK (1606 - 1862, n=15) | |
| MSI WS66 10TMT-207US | |
| Dell Precision 7550 | |
| Acer ConceptD 9 Pro | |
| Dell Precision 5550 P91F | |
| Razer Blade 15 RTX 2070 Super Max-Q | |
| HP Envy 15-ep0098nr | |
| Acer ConceptD 3 Pro CN315-71P-73W1 | |
| Blender / v2.79 BMW27 CPU | |
| Acer ConceptD 3 Pro CN315-71P-73W1 | |
| HP Envy 15-ep0098nr | |
| Dell Precision 5550 P91F | |
| Razer Blade 15 RTX 2070 Super Max-Q | |
| Dell Precision 7550 | |
| Gemiddeld Intel Core i9-10980HK (239 - 299, n=13) | |
| MSI WS66 10TMT-207US | |
| Eluktronics RP-15 | |
| Intel Core i9-9900KS, Nvidia Titan RTX | |
| 7-Zip 18.03 / 7z b 4 -mmt1 | |
| Intel Core i9-9900KS, Nvidia Titan RTX | |
| Dell Precision 7550 | |
| Acer ConceptD 9 Pro | |
| Gemiddeld Intel Core i9-10980HK (5081 - 5542, n=13) | |
| Dell Precision 5550 P91F | |
| MSI WS66 10TMT-207US | |
| Razer Blade 15 RTX 2070 Super Max-Q | |
| Eluktronics RP-15 | |
| Acer ConceptD 3 Pro CN315-71P-73W1 | |
| HP Envy 15-ep0098nr | |
| Geekbench 5.5 / Single-Core | |
| MSI WS66 10TMT-207US | |
| Gemiddeld Intel Core i9-10980HK (1283 - 1401, n=12) | |
| Dell Precision 7550 | |
| Dell Precision 5550 P91F | |
| Acer ConceptD 9 Pro | |
| Razer Blade 15 RTX 2070 Super Max-Q | |
| HP Envy 15-ep0098nr | |
| Eluktronics RP-15 | |
| Acer ConceptD 3 Pro CN315-71P-73W1 | |
| Geekbench 5.5 / Multi-Core | |
| Eluktronics RP-15 | |
| Dell Precision 5550 P91F | |
| Dell Precision 7550 | |
| MSI WS66 10TMT-207US | |
| Gemiddeld Intel Core i9-10980HK (7634 - 8666, n=12) | |
| Acer ConceptD 9 Pro | |
| Razer Blade 15 RTX 2070 Super Max-Q | |
| HP Envy 15-ep0098nr | |
| Acer ConceptD 3 Pro CN315-71P-73W1 | |
| HWBOT x265 Benchmark v2.2 / 4k Preset | |
| Intel Core i9-9900KS, Nvidia Titan RTX | |
| Eluktronics RP-15 | |
| Dell Precision 7550 | |
| MSI WS66 10TMT-207US | |
| Gemiddeld Intel Core i9-10980HK (12 - 14.6, n=13) | |
| Razer Blade 15 RTX 2070 Super Max-Q | |
| Dell Precision 5550 P91F | |
| HP Envy 15-ep0098nr | |
| Acer ConceptD 3 Pro CN315-71P-73W1 | |
| LibreOffice / 20 Documents To PDF | |
| Eluktronics RP-15 | |
| Acer ConceptD 9 Pro | |
| Acer ConceptD 3 Pro CN315-71P-73W1 | |
| Gemiddeld Intel Core i9-10980HK (44 - 89, n=13) | |
| HP Envy 15-ep0098nr | |
| Dell Precision 7550 | |
| Razer Blade 15 RTX 2070 Super Max-Q | |
| MSI WS66 10TMT-207US | |
| Dell Precision 5550 P91F | |
| R Benchmark 2.5 / Overall mean | |
| Acer ConceptD 3 Pro CN315-71P-73W1 | |
| HP Envy 15-ep0098nr | |
| Dell Precision 5550 P91F | |
| Razer Blade 15 RTX 2070 Super Max-Q | |
| Gemiddeld Intel Core i9-10980HK (0.561 - 0.596, n=13) | |
| Eluktronics RP-15 | |
| MSI WS66 10TMT-207US | |
| Dell Precision 7550 | |
* ... kleiner is beter
| PCMark 8 Home Score Accelerated v2 | 4418 punten | |
| PCMark 8 Work Score Accelerated v2 | 5629 punten | |
| PCMark 10 Score | 5846 punten | |
Help | ||
| DPC Latencies / LatencyMon - interrupt to process latency (max), Web, Youtube, Prime95 | |
| Dell Precision 7550 | |
| MSI WS66 10TMT-207US | |
| Razer Blade 15 RTX 2070 Super Max-Q | |
| Acer ConceptD 3 Pro CN315-71P-73W1 | |
| Razer Blade 15 Studio Edition 2020 | |
| Dell Precision 5550 P91F | |
* ... kleiner is beter
| MSI WS66 10TMT-207US WDC PC SN730 SDBPNTY-1T00 | Dell Precision 7550 SK Hynix PC601A NVMe 1TB | Dell Precision 5550 P91F SK Hynix PC601A NVMe 1TB | Razer Blade 15 Studio Edition 2020 Samsung PM981a MZVLB1T0HBLR | MSI WS63VR 7RL-023US Toshiba NVMe THNSN5512GPU7 | Acer ConceptD 3 Pro CN315-71P-73W1 WDC PC SN720 SDAPNTW-512G | |
|---|---|---|---|---|---|---|
| AS SSD | -30% | -117% | -18% | -47% | -22% | |
| Seq Read (MB/s) | 2321 | 2028 -13% | 2039 -12% | 1982 -15% | 2133 -8% | 2973 28% |
| Seq Write (MB/s) | 2620 | 1193 -54% | 1376 -47% | 2252 -14% | 1287 -51% | 2429 -7% |
| 4K Read (MB/s) | 48.57 | 42.31 -13% | 44.11 -9% | 47.13 -3% | 40.2 -17% | 24.7 -49% |
| 4K Write (MB/s) | 165.1 | 105.5 -36% | 113.3 -31% | 88.2 -47% | 114.6 -31% | 115.3 -30% |
| 4K-64 Read (MB/s) | 1712 | 1128 -34% | 1094 -36% | 1481 -13% | 710 -59% | 1243 -27% |
| 4K-64 Write (MB/s) | 2174 | 1537 -29% | 1630 -25% | 1842 -15% | 314 -86% | 835 -62% |
| Access Time Read * (ms) | 0.057 | 0.069 -21% | 0.059 -4% | 0.087 -53% | 0.128 -125% | |
| Access Time Write * (ms) | 0.068 | 0.106 -56% | 0.99 -1356% | 0.04 41% | 0.033 51% | 0.034 50% |
| Score Read (Points) | 1993 | 1373 -31% | 1342 -33% | 1726 -13% | 962 -52% | 1565 -21% |
| Score Write (Points) | 2601 | 1762 -32% | 1881 -28% | 2155 -17% | 557 -79% | 1193 -54% |
| Score Total (Points) | 5630 | 3801 -32% | 3883 -31% | 4781 -15% | 1979 -65% | 3525 -37% |
| Copy ISO MB/s (MB/s) | 2589 | 1768 -32% | 2489 -4% | 1982 -23% | 2136 -17% | |
| Copy Program MB/s (MB/s) | 791 | 627 -21% | 682 -14% | 501 -37% | 489.6 -38% | |
| Copy Game MB/s (MB/s) | 1625 | 1477 -9% | 1515 -7% | 1140 -30% | 1163 -28% | |
| CrystalDiskMark 5.2 / 6 | -16% | -17% | -6% | -27% | -19% | |
| Write 4K (MB/s) | 185.8 | 121 -35% | 122.6 -34% | 132.9 -28% | 157.1 -15% | 113.2 -39% |
| Read 4K (MB/s) | 47.21 | 42.16 -11% | 42.4 -10% | 46.73 -1% | 43.82 -7% | 31.1 -34% |
| Write Seq (MB/s) | 2874 | 2150 -25% | 2167 -25% | 2214 -23% | 1110 -61% | 2540 -12% |
| Read Seq (MB/s) | 1786 | 1755 -2% | 1747 -2% | 2018 13% | 1162 -35% | 2005 12% |
| Write 4K Q32T1 (MB/s) | 466.8 | 395.3 -15% | 388.8 -17% | 478.9 3% | 361.3 -23% | 331.4 -29% |
| Read 4K Q32T1 (MB/s) | 563 | 381.8 -32% | 367.3 -35% | 540 -4% | 563 0% | 368.3 -35% |
| Write Seq Q32T1 (MB/s) | 3091 | 2730 -12% | 2629 -15% | 2975 -4% | 1558 -50% | 2535 -18% |
| Read Seq Q32T1 (MB/s) | 3395 | 3468 2% | 3460 2% | 3195 -6% | 2635 -22% | 3427 1% |
| Totaal Gemiddelde (Programma / Instellingen) | -23% /
-25% | -67% /
-81% | -12% /
-14% | -37% /
-39% | -21% /
-21% |
* ... kleiner is beter

Disk Throttling: DiskSpd Read Loop, Queue Depth 8
| 3DMark 11 Performance | 23789 punten | |
| 3DMark Cloud Gate Standard Score | 52005 punten | |
| 3DMark Fire Strike Score | 18226 punten | |
| 3DMark Time Spy Score | 7920 punten | |
Help | ||
| lage | gem. | hoge | ultra | |
|---|---|---|---|---|
| The Witcher 3 (2015) | 353.2 | 249.8 | 158.2 | 81.1 |
| Dota 2 Reborn (2015) | 161 | 143 | 130 | 122 |
| Final Fantasy XV Benchmark (2018) | 177 | 103 | 80.8 | |
| X-Plane 11.11 (2018) | 113 | 98.9 | 82 |
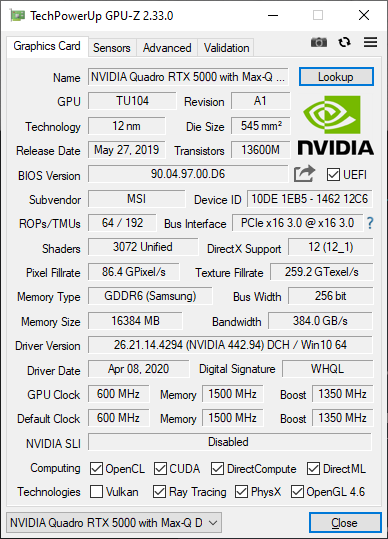
| MSI WS66 10TMT-207US Quadro RTX 5000 Max-Q, i9-10980HK, WDC PC SN730 SDBPNTY-1T00 | Dell Precision 7550 Quadro RTX 5000 Max-Q, W-10885M, SK Hynix PC601A NVMe 1TB | Dell Precision 5550 P91F Quadro T2000 Max-Q, i7-10875H, SK Hynix PC601A NVMe 1TB | Razer Blade 15 Studio Edition 2020 Quadro RTX 5000 Max-Q, i7-10875H, Samsung PM981a MZVLB1T0HBLR | MSI WS63VR 7RL-023US Quadro P4000 Max-Q, i7-7700HQ, Toshiba NVMe THNSN5512GPU7 | Acer ConceptD 3 Pro CN315-71P-73W1 Quadro T1000 (Laptop), i7-9750H, WDC PC SN720 SDAPNTW-512G | |
|---|---|---|---|---|---|---|
| Noise | 6% | 13% | 4% | 4% | 7% | |
| uit / omgeving * (dB) | 26 | 25.8 1% | 26.2 -1% | 30.1 -16% | 28 -8% | 31.2 -20% |
| Idle Minimum * (dB) | 32 | 25.8 19% | 26.2 18% | 30.1 6% | 33.2 -4% | 31.2 2% |
| Idle Average * (dB) | 32 | 25.8 19% | 26.2 18% | 30.1 6% | 33.2 -4% | 31.2 2% |
| Idle Maximum * (dB) | 32 | 25.9 19% | 26.2 18% | 30.1 6% | 33.2 -4% | 31.5 2% |
| Load Average * (dB) | 42 | 51.2 -22% | 39.2 7% | 42.3 -1% | 41.4 1% | 38.4 9% |
| Witcher 3 ultra * (dB) | 47.4 | 51.9 -9% | 39 18% | 48.2 -2% | 38.4 19% | 36.9 22% |
| Load Maximum * (dB) | 59.7 | 51.9 13% | 50.6 15% | 42.1 29% | 43.5 27% | 41.2 31% |
* ... kleiner is beter
Geluidsniveau
| Onbelast |
| 32 / 32 / 32 dB (A) |
| Belasting |
| 42 / 59.7 dB (A) |
 | ||
30 dB stil 40 dB(A) hoorbaar 50 dB(A) luid |
||
min: | ||
(±) De maximumtemperatuur aan de bovenzijde bedraagt 44.2 °C / 112 F, vergeleken met het gemiddelde van 38.2 °C / 101 F, variërend van 22.2 tot 69.8 °C voor de klasse Workstation.
(-) De bodem warmt op tot een maximum van 46.2 °C / 115 F, vergeleken met een gemiddelde van 41.1 °C / 106 F
(+) Bij onbelast gebruik bedraagt de gemiddelde temperatuur voor de bovenzijde 29 °C / 84 F, vergeleken met het apparaatgemiddelde van 32 °C / 90 F.
(±) Bij het spelen van The Witcher 3 is de gemiddelde temperatuur voor de bovenzijde 36.8 °C / 98 F, vergeleken met het apparaatgemiddelde van 32 °C / 90 F.
(+) De handpalmsteunen en het touchpad bereiken maximaal de huidtemperatuur (32 °C / 89.6 F) en zijn dus niet heet.
(-) De gemiddelde temperatuur van de handpalmsteun van soortgelijke toestellen bedroeg 27.8 °C / 82 F (-4.2 °C / -7.6 F).
MSI WS66 10TMT-207US audioanalyse
(±) | luidspreker luidheid is gemiddeld maar goed (80.5 dB)
Bas 100 - 315 Hz
(-) | bijna geen lage tonen - gemiddeld 22.6% lager dan de mediaan
(±) | lineariteit van de lage tonen is gemiddeld (9.8% delta ten opzichte van de vorige frequentie)
Midden 400 - 2000 Hz
(±) | hogere middens - gemiddeld 7.5% hoger dan de mediaan
(±) | lineariteit van de middentonen is gemiddeld (11.7% delta ten opzichte van de vorige frequentie)
Hoog 2 - 16 kHz
(+) | evenwichtige hoogtepunten - slechts 3.4% verwijderd van de mediaan
(±) | lineariteit van de hoogtepunten is gemiddeld (8.5% delta ten opzichte van de vorige frequentie)
Algemeen 100 - 16.000 Hz
(±) | lineariteit van het totale geluid is gemiddeld (26.1% verschil met de mediaan)
Vergeleken met dezelfde klasse
» 88% van alle geteste apparaten in deze klasse waren beter, 6% vergelijkbaar, 6% slechter
» De beste had een delta van 7%, het gemiddelde was 17%, de slechtste was 35%
Vergeleken met alle geteste toestellen
» 80% van alle geteste apparaten waren beter, 4% gelijk, 16% slechter
» De beste had een delta van 4%, het gemiddelde was 24%, de slechtste was 134%
Apple MacBook 12 (Early 2016) 1.1 GHz audioanalyse
(+) | luidsprekers kunnen relatief luid spelen (83.6 dB)
Bas 100 - 315 Hz
(±) | verminderde zeebaars - gemiddeld 11.3% lager dan de mediaan
(±) | lineariteit van de lage tonen is gemiddeld (14.2% delta ten opzichte van de vorige frequentie)
Midden 400 - 2000 Hz
(+) | evenwichtige middens - slechts 2.4% verwijderd van de mediaan
(+) | de middentonen zijn lineair (5.5% delta ten opzichte van de vorige frequentie)
Hoog 2 - 16 kHz
(+) | evenwichtige hoogtepunten - slechts 2% verwijderd van de mediaan
(+) | de hoge tonen zijn lineair (4.5% delta naar de vorige frequentie)
Algemeen 100 - 16.000 Hz
(+) | het totale geluid is lineair (10.2% verschil met de mediaan)
Vergeleken met dezelfde klasse
» 7% van alle geteste apparaten in deze klasse waren beter, 2% vergelijkbaar, 91% slechter
» De beste had een delta van 5%, het gemiddelde was 18%, de slechtste was 53%
Vergeleken met alle geteste toestellen
» 5% van alle geteste apparaten waren beter, 1% gelijk, 94% slechter
» De beste had een delta van 4%, het gemiddelde was 24%, de slechtste was 134%
| Uit / Standby | |
| Inactief | |
| Belasting |
|
Key:
min: | |
| MSI WS66 10TMT-207US i9-10980HK, Quadro RTX 5000 Max-Q, WDC PC SN730 SDBPNTY-1T00, IPS, 1920x1080, 15.6" | Dell Precision 7550 W-10885M, Quadro RTX 5000 Max-Q, SK Hynix PC601A NVMe 1TB, IPS, 3840x2160, 15.6" | Dell Precision 5550 P91F i7-10875H, Quadro T2000 Max-Q, SK Hynix PC601A NVMe 1TB, IPS, 3840x2400, 15.6" | Razer Blade 15 Studio Edition 2020 i7-10875H, Quadro RTX 5000 Max-Q, Samsung PM981a MZVLB1T0HBLR, OLED, 3840x2160, 15.6" | MSI WS63VR 7RL-023US i7-7700HQ, Quadro P4000 Max-Q, Toshiba NVMe THNSN5512GPU7, IPS, 3840x2160, 15.6" | Acer ConceptD 3 Pro CN315-71P-73W1 i7-9750H, Quadro T1000 (Laptop), WDC PC SN720 SDAPNTW-512G, IPS, 1920x1080, 15.6" | |
|---|---|---|---|---|---|---|
| Power Consumption | 13% | 40% | 12% | 29% | 58% | |
| Idle Minimum * (Watt) | 13.8 | 8.2 41% | 5.6 59% | 13.4 3% | 13.3 4% | 2.9 79% |
| Idle Average * (Watt) | 18.4 | 16.8 9% | 11.2 39% | 18 2% | 17.2 7% | 5.5 70% |
| Idle Maximum * (Watt) | 41.5 | 24.4 41% | 18.4 56% | 26.1 37% | 17.9 57% | 10.6 74% |
| Load Average * (Watt) | 110.5 | 131 -19% | 114 -3% | 115 -4% | 83.7 24% | 86 22% |
| Witcher 3 ultra * (Watt) | 151.6 | 156.6 -3% | 76.7 49% | 145 4% | 101.9 33% | 83 45% |
| Load Maximum * (Watt) | 227.1 | 201.8 11% | 134.2 41% | 165 27% | 114.3 50% | 100.7 56% |
* ... kleiner is beter
| MSI WS66 10TMT-207US i9-10980HK, Quadro RTX 5000 Max-Q, 99.99 Wh | Dell Precision 7550 W-10885M, Quadro RTX 5000 Max-Q, 95 Wh | Dell Precision 5550 P91F i7-10875H, Quadro T2000 Max-Q, 86 Wh | Razer Blade 15 Studio Edition 2020 i7-10875H, Quadro RTX 5000 Max-Q, 80 Wh | MSI WS63VR 7RL-023US i7-7700HQ, Quadro P4000 Max-Q, 48 Wh | Acer ConceptD 3 Pro CN315-71P-73W1 i7-9750H, Quadro T1000 (Laptop), 58.7 Wh | |
|---|---|---|---|---|---|---|
| Batterijduur | 10% | 68% | 15% | -47% | 4% | |
| Reader / Idle (h) | 8.3 | 11.1 34% | 22.6 172% | 8.8 6% | 3.9 -53% | |
| WiFi v1.3 (h) | 7.8 | 8.9 14% | 9 15% | 5.7 -27% | 2.9 -63% | 8.1 4% |
| Load (h) | 1.2 | 1 -17% | 1.4 17% | 2 67% | 0.9 -25% |
Pro
Contra
Voor het volledige, Engelse testrapport, klik hier.
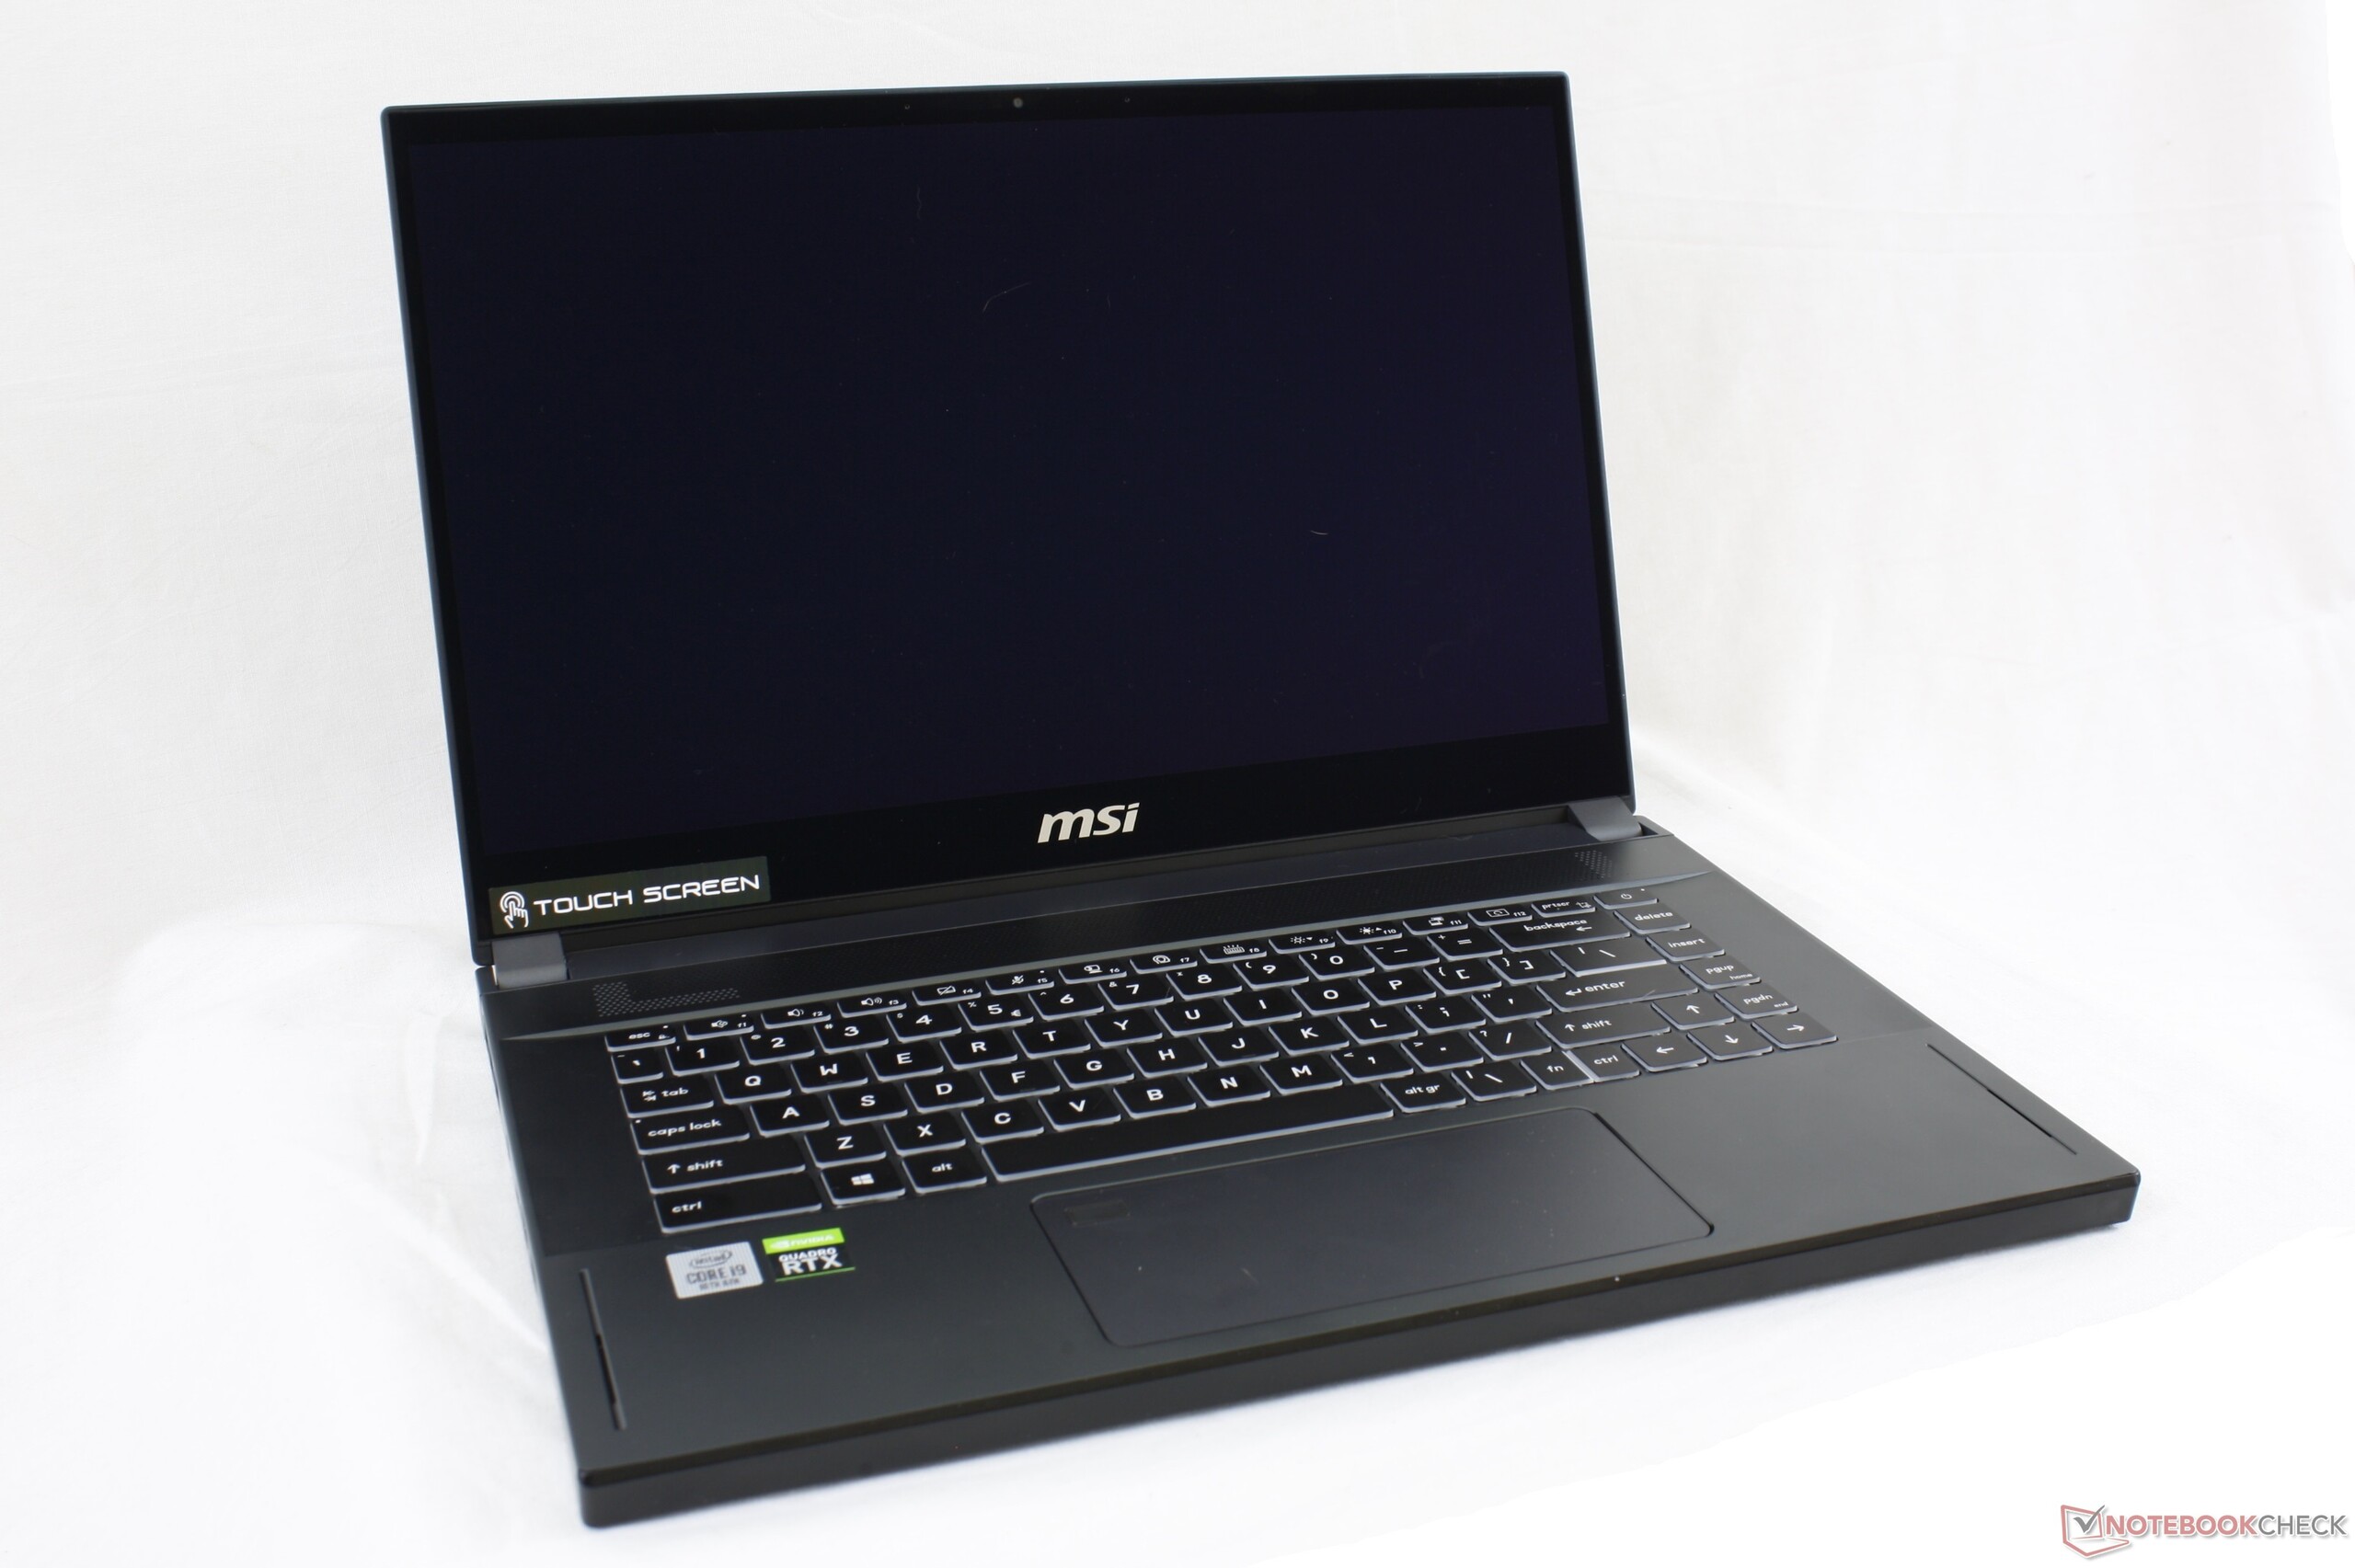
Als je de snelst mogelijke prestaties wilt uit een superdun chassisontwerp, dan zal de MSI WS66 je niet teleurstellen. De Core i9-CPU is constant sneller dan de Razer Blade 15 Studio, vooral omdat deze beperkt is tot een Core i7.
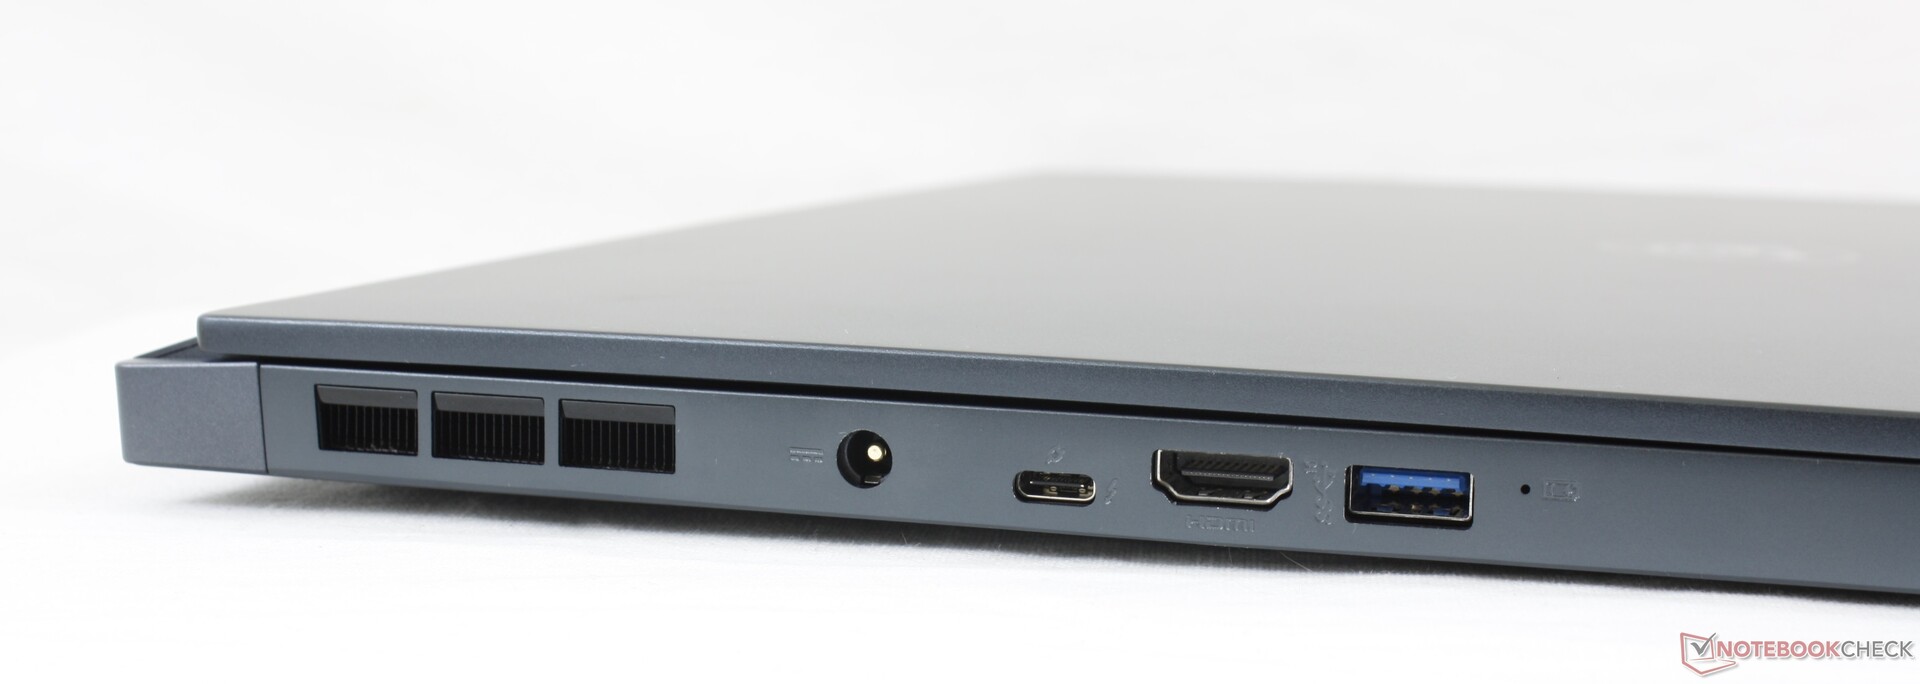
De "prestatie ten koste van alles" mentaliteit van de WS66 heeft een groot aantal nadelen. Het meest opvallende is dat het ventilatorgeluid aanzienlijk luider is dan de eerder genoemde Razer en de meeste andere werkstations. Bovendien betekent de gaming-oorsprong van de ultradunne WS66 dat het systeem veel basisfuncties uitsluit die traditionele werkstations dragen. Je zult grotere modellen zoals de Dell Precision 7550, Lenovo ThinkPad P53 of HP ZBook 15 moeten bekijken als functies zoals smartcardlezers, breed kleurengamma, muisknoppen, numerieke toetsen, NFC, SIM of matte paneelopties belangrijk zijn voor je werk.
De MSI WS66 is lasergericht op het maximaliseren van de prestaties om sneller te zijn dan wat het dunne ontwerp anders doet vermoeden. Extra functies ontbreken echter, en het ventilatorgeluid zal erg hoog zijn als je het meeste uit het systeem wilt halen.
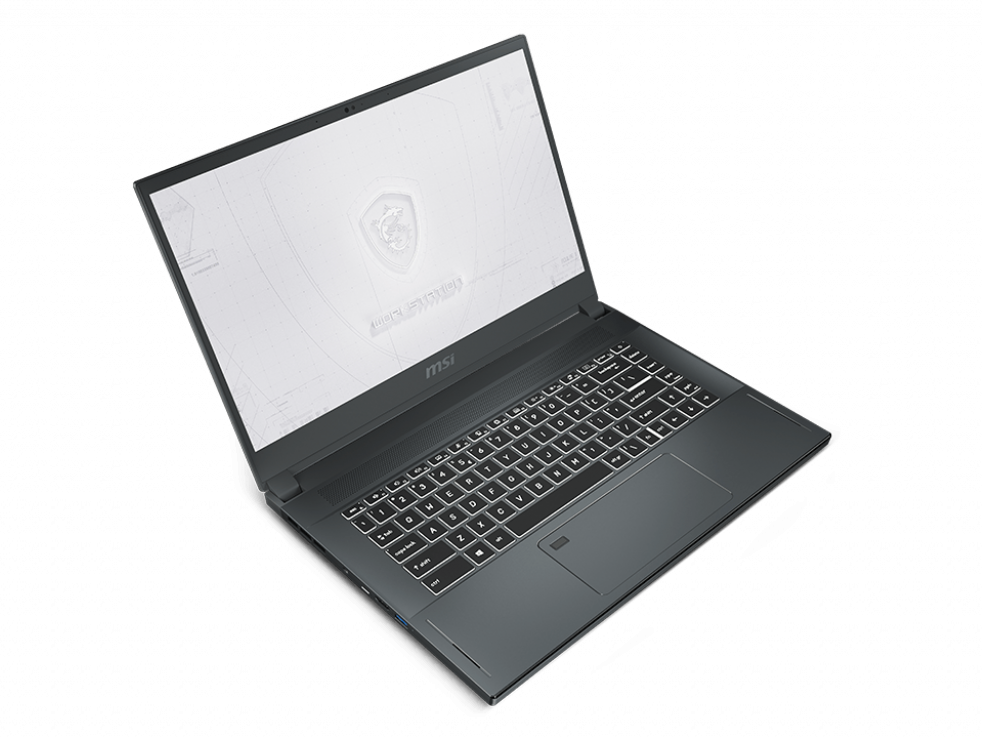
MSI WS66 10TMT-207US
- 30-08-2020 v7 (old)
Allen Ngo
Price comparison
