Intel Core i7-1265U debuut: Dell Latitude 13 7330 laptop van 1 kg review
Niet te verwarren met de Dell Latitude 7330 Rugged, de Latitude 7330 is uw meer traditionele laptop voor kantoren en bedrijven. Hij wordt geleverd in zowel clamshell als converteerbare 2-in-1 opties, elk met vergelijkbare Intel 12e generatie Core-U CPU-opties, poorten en algemeen chassisontwerp, maar met verschillende beeldscherm- en chassismateriaalopties om uit te kiezen. We raden aan de productpagina of de publiek beschikbare technische PDF te bekijken voor de Latitude 7330, omdat deze meer configureerbare opties biedt dan de meeste andere laptops, variërend van verschillende webcams, batterijformaten, WAN, en zelfs MicroSD lezers
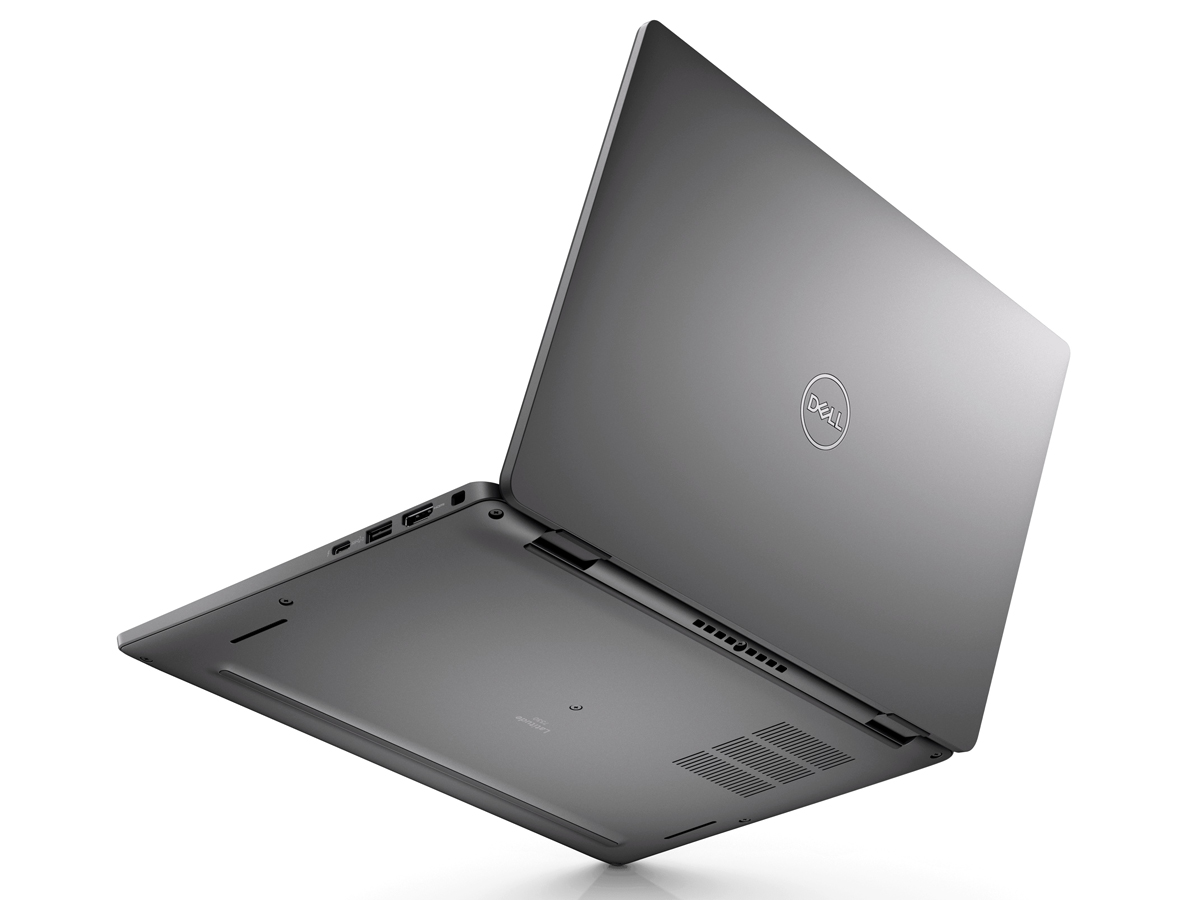
Onze specifieke review unit is de Magnesium legering Latitude 7330 clamshell met een gewicht van slechts 1 kg als een van de lichtste 13.3-inch zakelijke laptops op de markt. Een paar andere laptops hebben in het verleden ook soortgelijke superlichte ontwerpen beloofd, zoals de LG Gram-serie, Samsung Galaxy Book Pro serie, HP Elite Dragonflyof de Toshiba Portege Z serie die allemaal als alternatief kunnen dienen voor de Latitude 7330. De door ons geteste configuratie kost ongeveer $2000 USD.
Meer Dell reviews
Potentiële concurrenten in vergelijking
Evaluatie | Datum | Model | Gewicht | Hoogte | Formaat | Resolutie | Beste prijs |
|---|---|---|---|---|---|---|---|
| 89 % v7 (old) | 07-2022 | Dell Latitude 13 7330 i7-1265U, Iris Xe G7 96EUs | 1 kg | 16.96 mm | 13.30" | 1920x1080 | |
| 87.9 % v7 (old) | 10-2020 | Lenovo ThinkPad X13 Yoga 20SX0004GE i7-10510U, UHD Graphics 620 | 1.3 kg | 15.95 mm | 13.30" | 1920x1080 | |
| 85.1 % v7 (old) | 07-2022 | Framework Laptop 13.5 12th Gen Intel i7-1260P, Iris Xe G7 96EUs | 1.3 kg | 15.85 mm | 13.50" | 2256x1504 | |
| 86.6 % v7 (old) | 12-2020 | Razer Book 13 FHD i7-1165G7, Iris Xe G7 96EUs | 1.4 kg | 15.15 mm | 13.40" | 1920x1200 | |
| 89.4 % v7 (old) | 07-2020 | Dell Latitude 7310 i7-10610U, UHD Graphics 620 | 1.2 kg | 18.3 mm | 13.30" | 1920x1080 | |
| 85.2 % v7 (old) | 05-2021 | Microsoft Surface Laptop 4 13 Ryzen 5 R5 4680U, Vega 7 | 1.3 kg | 14 mm | 13.50" | 2256x1504 |
Geval - Drie verschillende opties
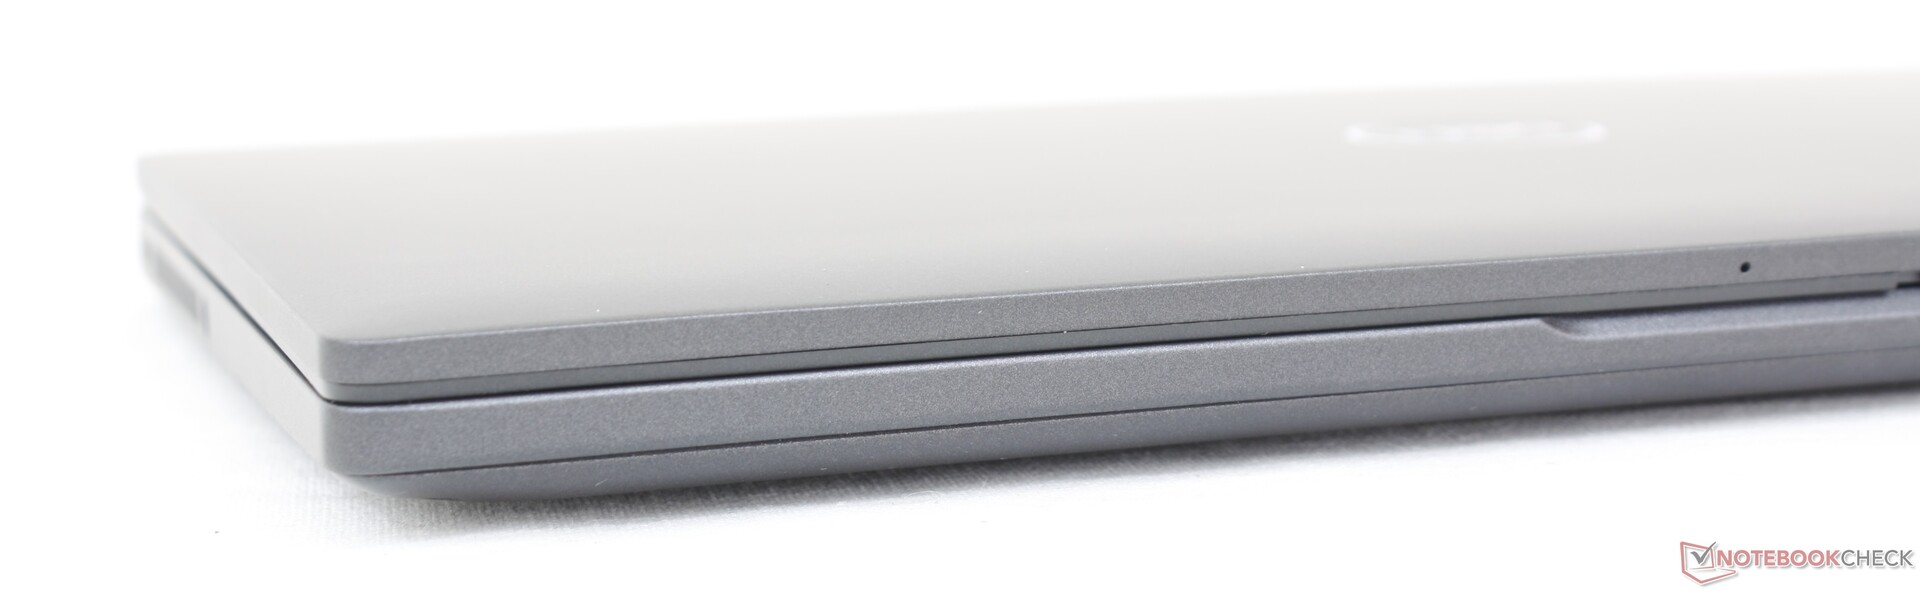
er bestaan al 13-inch laptops die beloven 1 kg of zelfs lichter te zijn, maar ze komen bijna altijd met enkele kanttekeningen. Het meest opmerkelijk is dat dergelijke modellen meestal veel meer buigen voor een algehele zwakkere indruk als het gaat om duurzaamheid. Besteed slechts een minuut met de LG Gram 13 in vergelijking met de zwaardere Dell XPS 13 9310 en de dunheidsverschillen in hun skeletten worden onmiddellijk merkbaar. De Latitude 7330 heeft op de een of andere manier de trend omzeild door steviger te zijn dan verwacht voor een 1 kg zware build. De basis, bijvoorbeeld, verdraait of buigt lang niet zo veel als bij de eerder genoemde LG. De algehele stijfheid ligt ergens tussen die van de Gram 13 en XPS 13 in, wat wij een redelijke afweging vinden als je waarde hecht aan het superlichte gewicht.
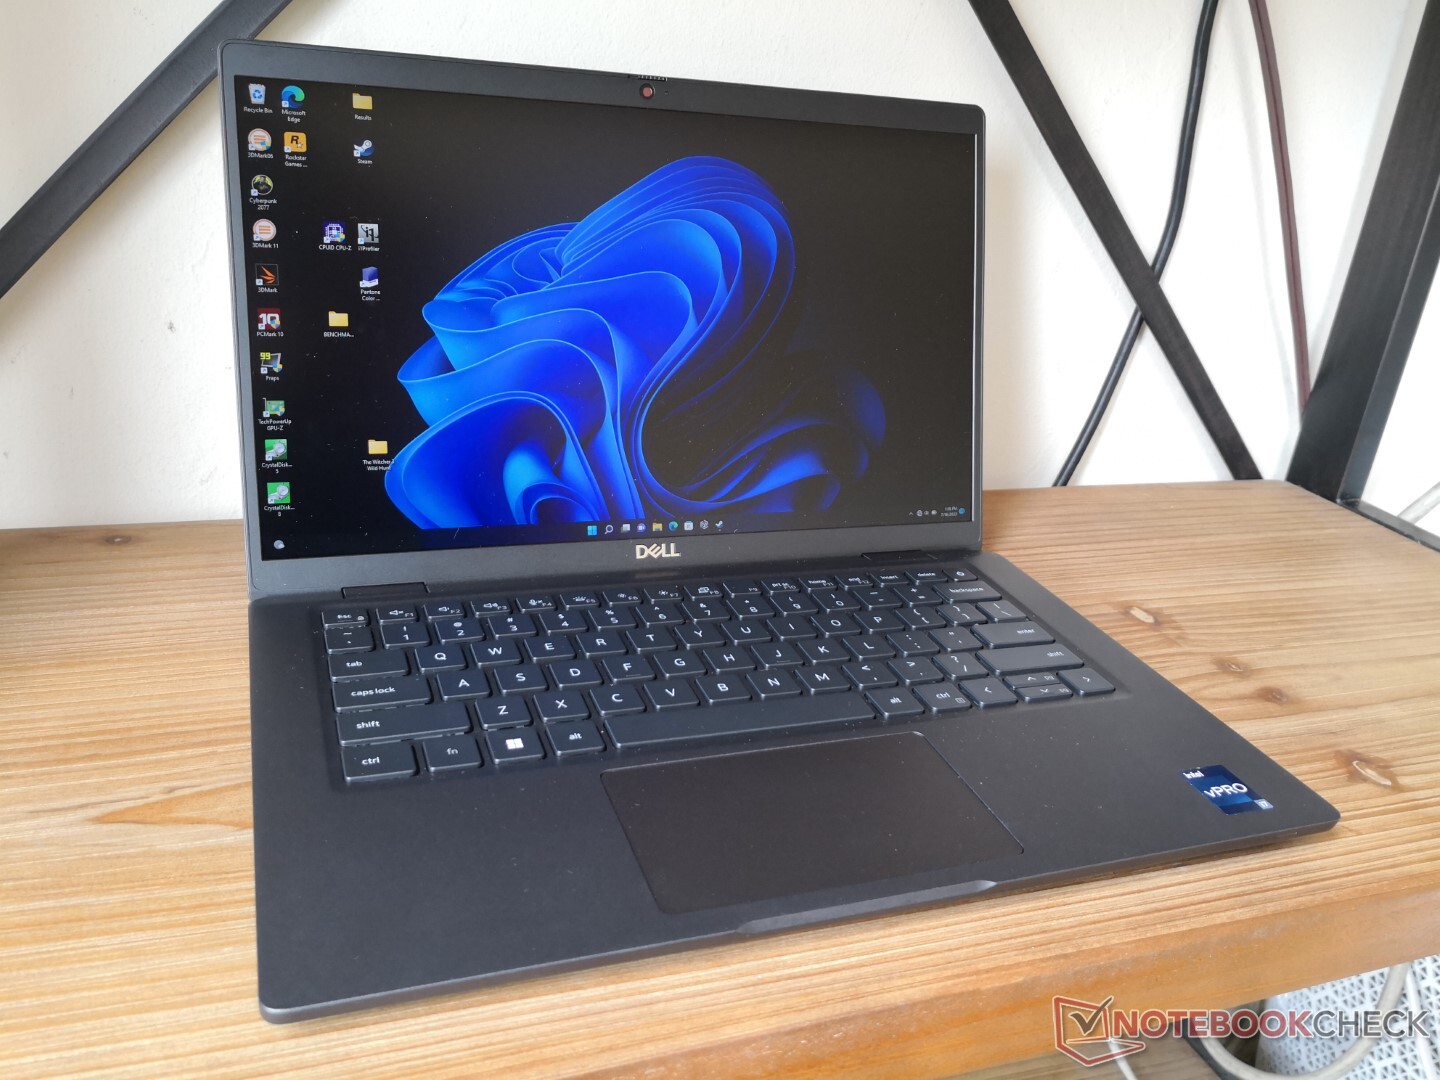
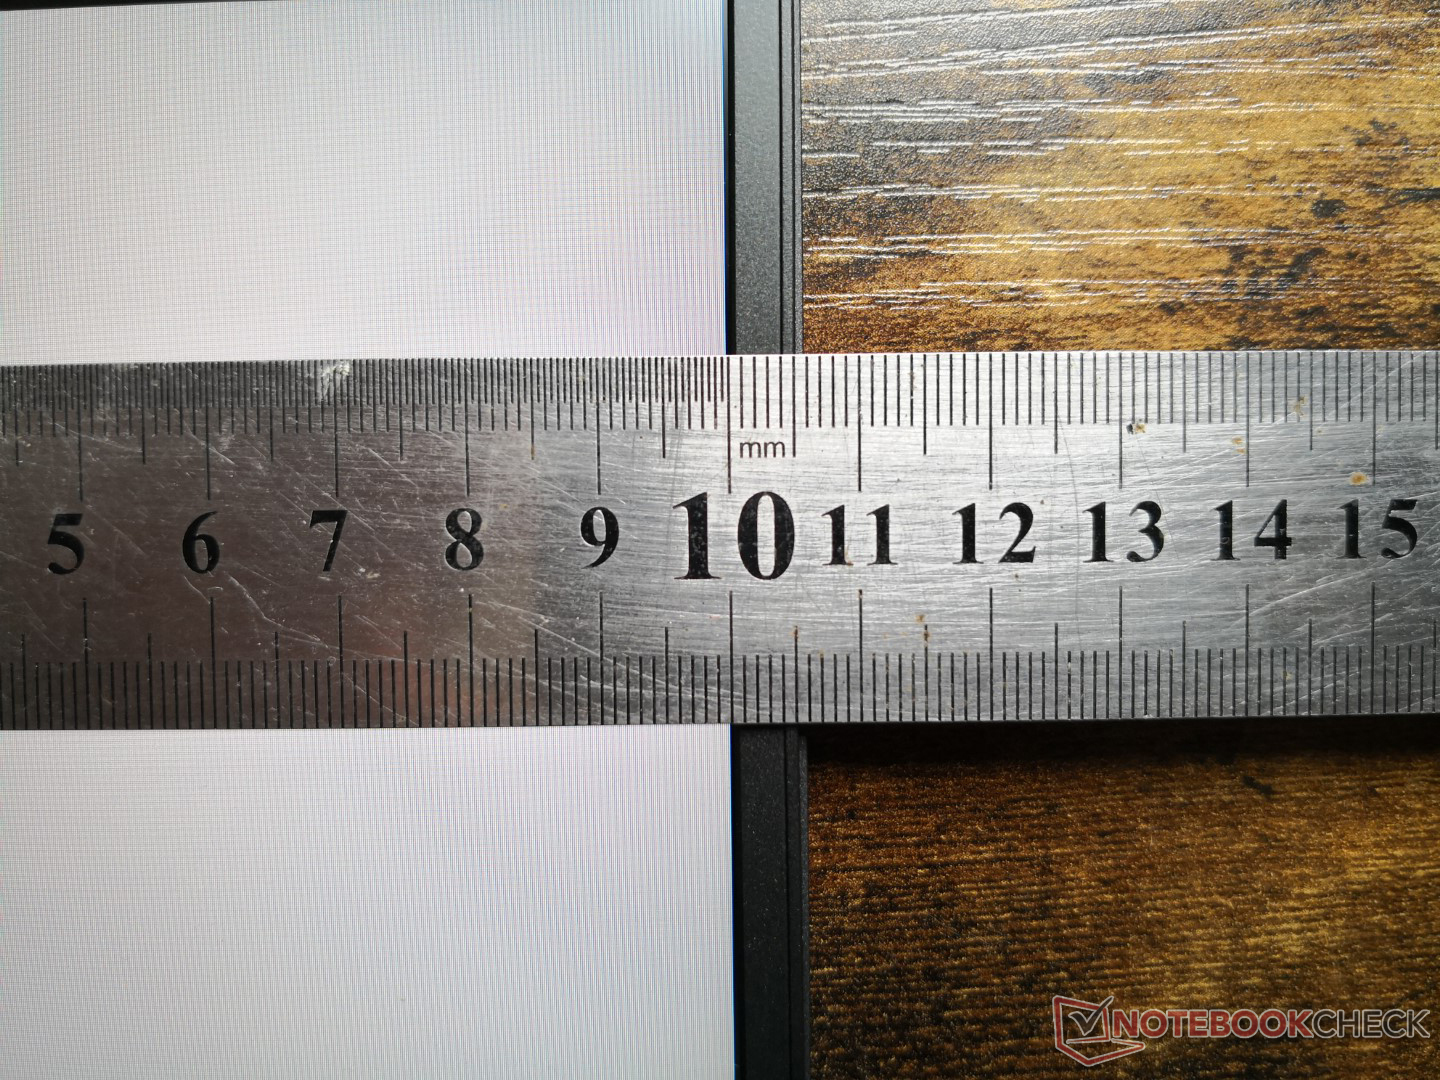
Het zeer lage gewicht van slechts 1 kg is het belangrijkste verkoopargument van de magnesiumlegering optie. De meeste subnotebooks in deze groottecategorie zijn doorgaans een paar honderd gram zwaarder, zodat ze tijdens het reizen of onderweg werken goed opvallen. De totale afmetingen zijn net iets kleiner dan bij de Latitude 7310 die al vrij klein was
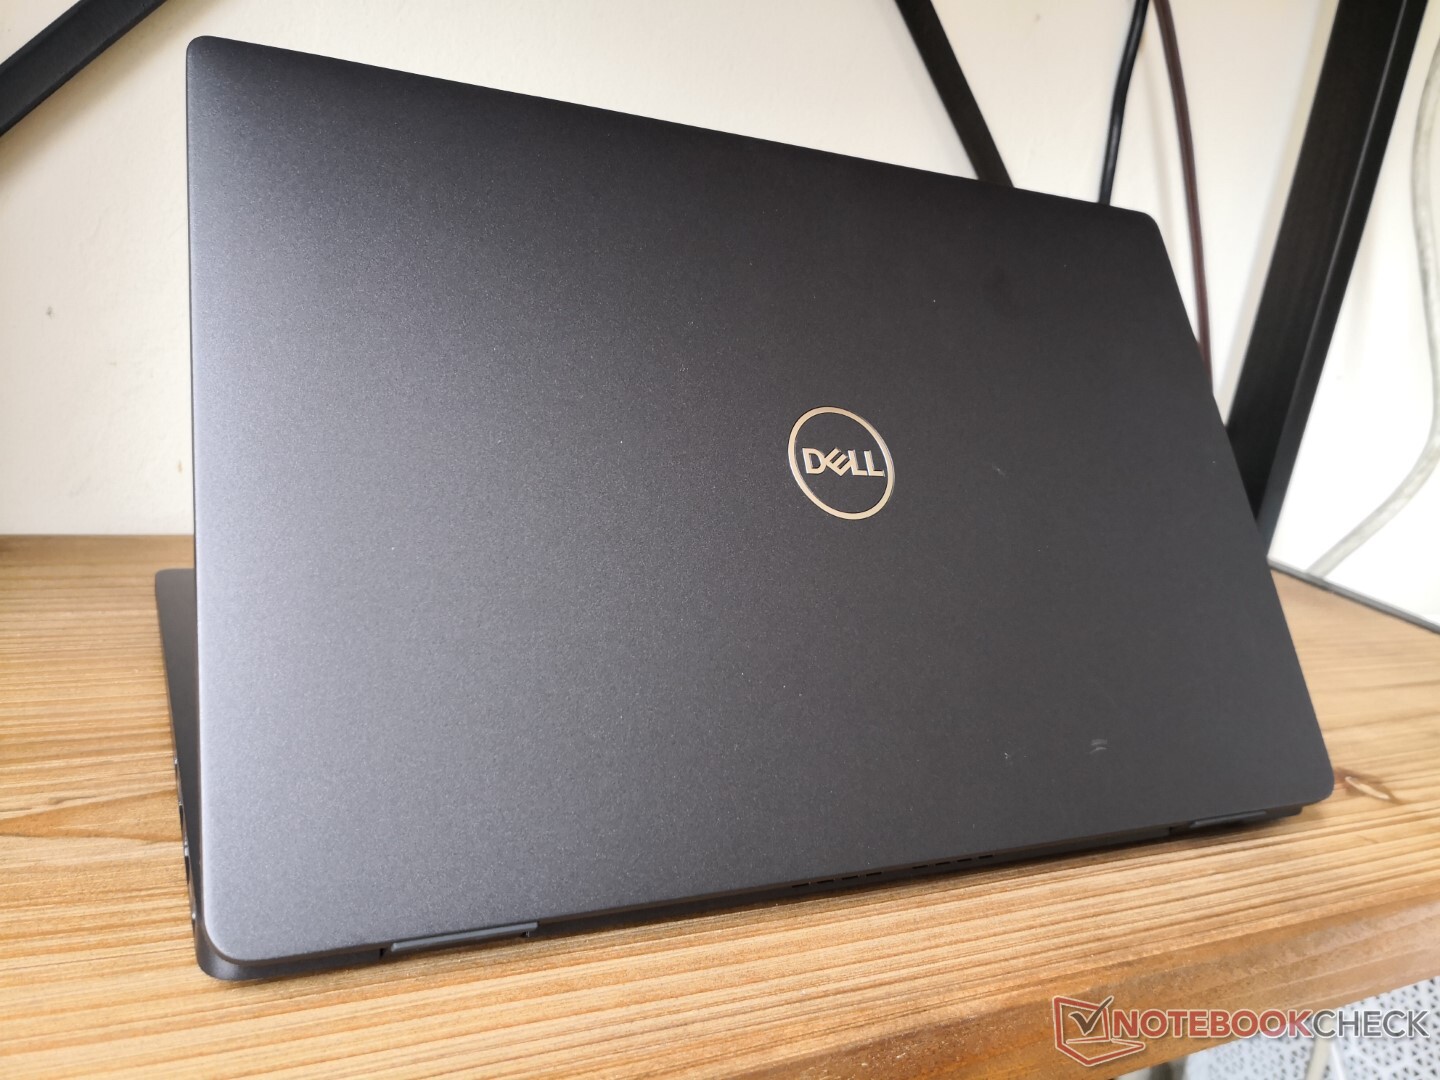
Kiezen voor de koolstofvezel of aluminium opties in plaats daarvan zal een gewichtstoename met zich meebrengen van ongeveer 160 g en 240 g, respectievelijk, ten opzichte van onze magnesium optie.
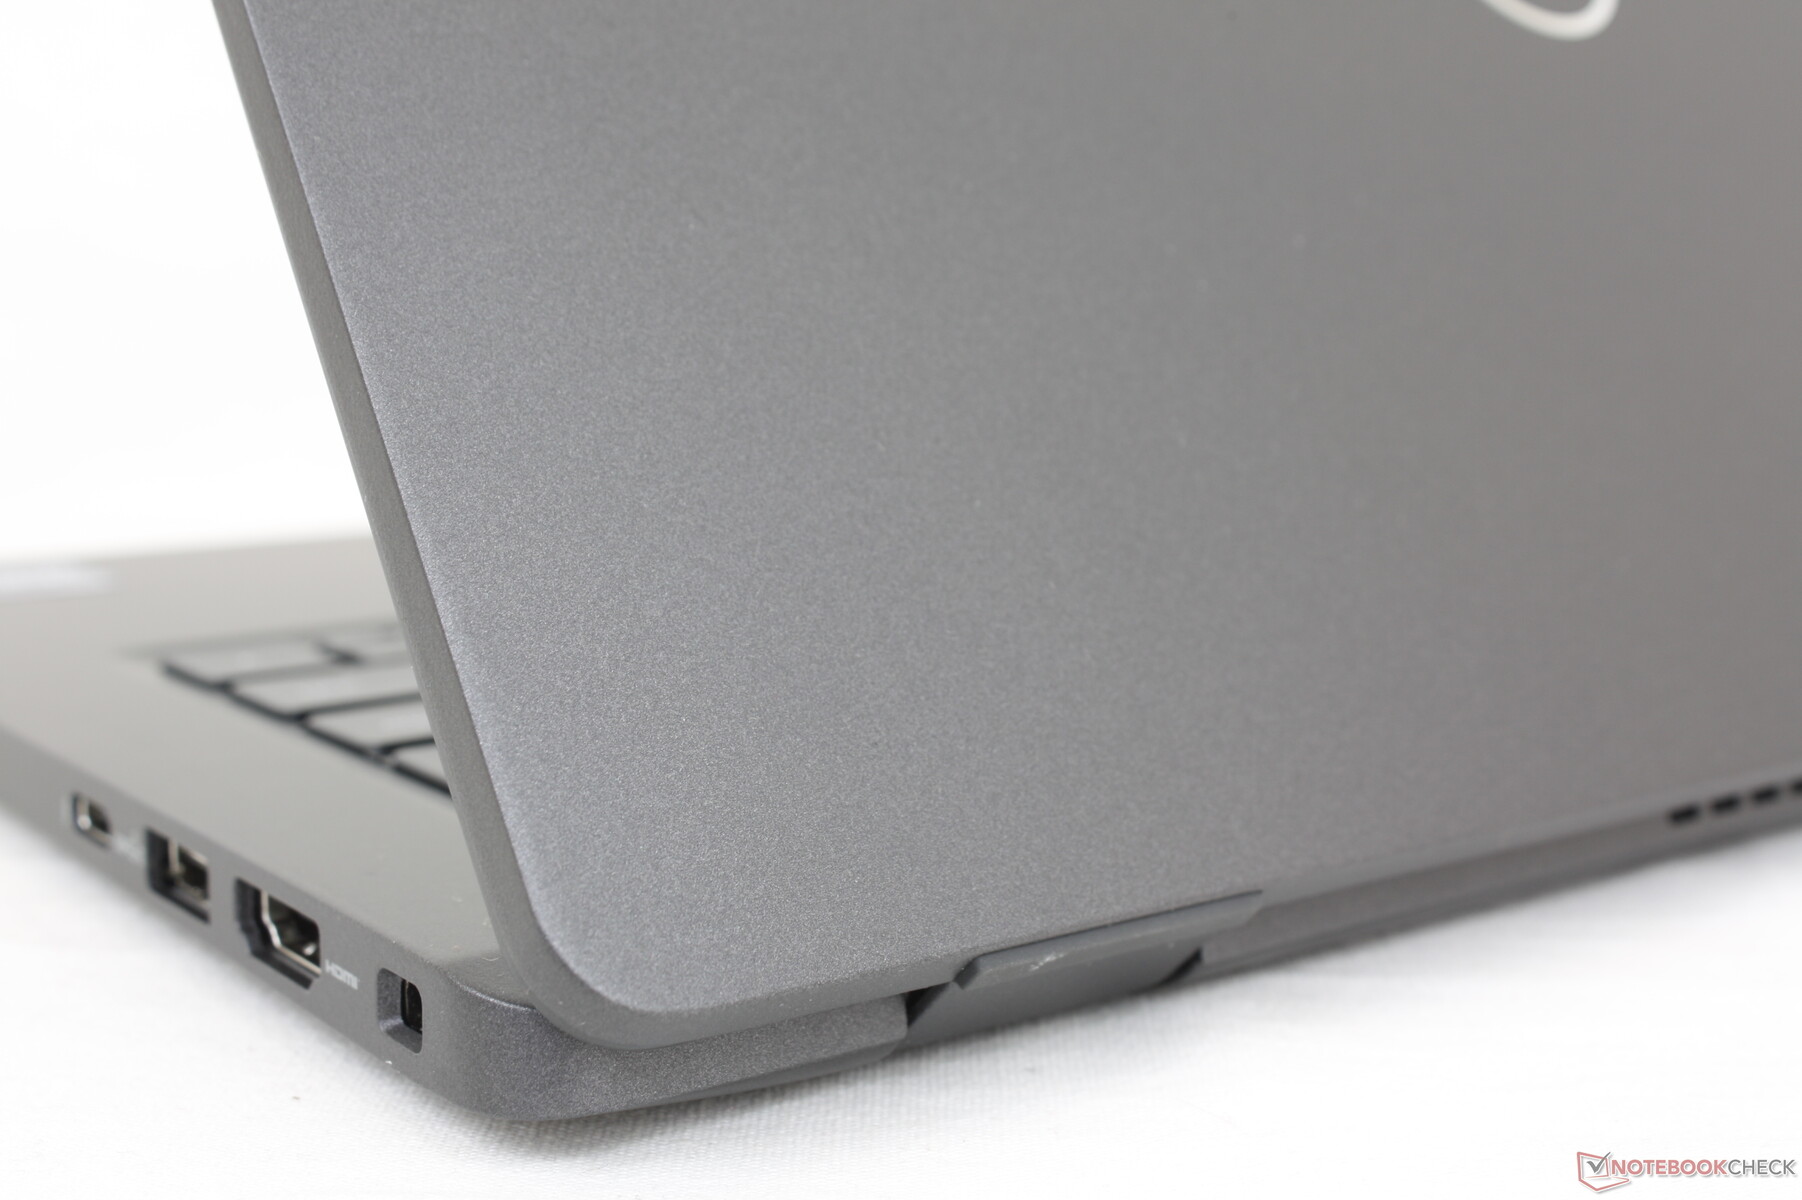
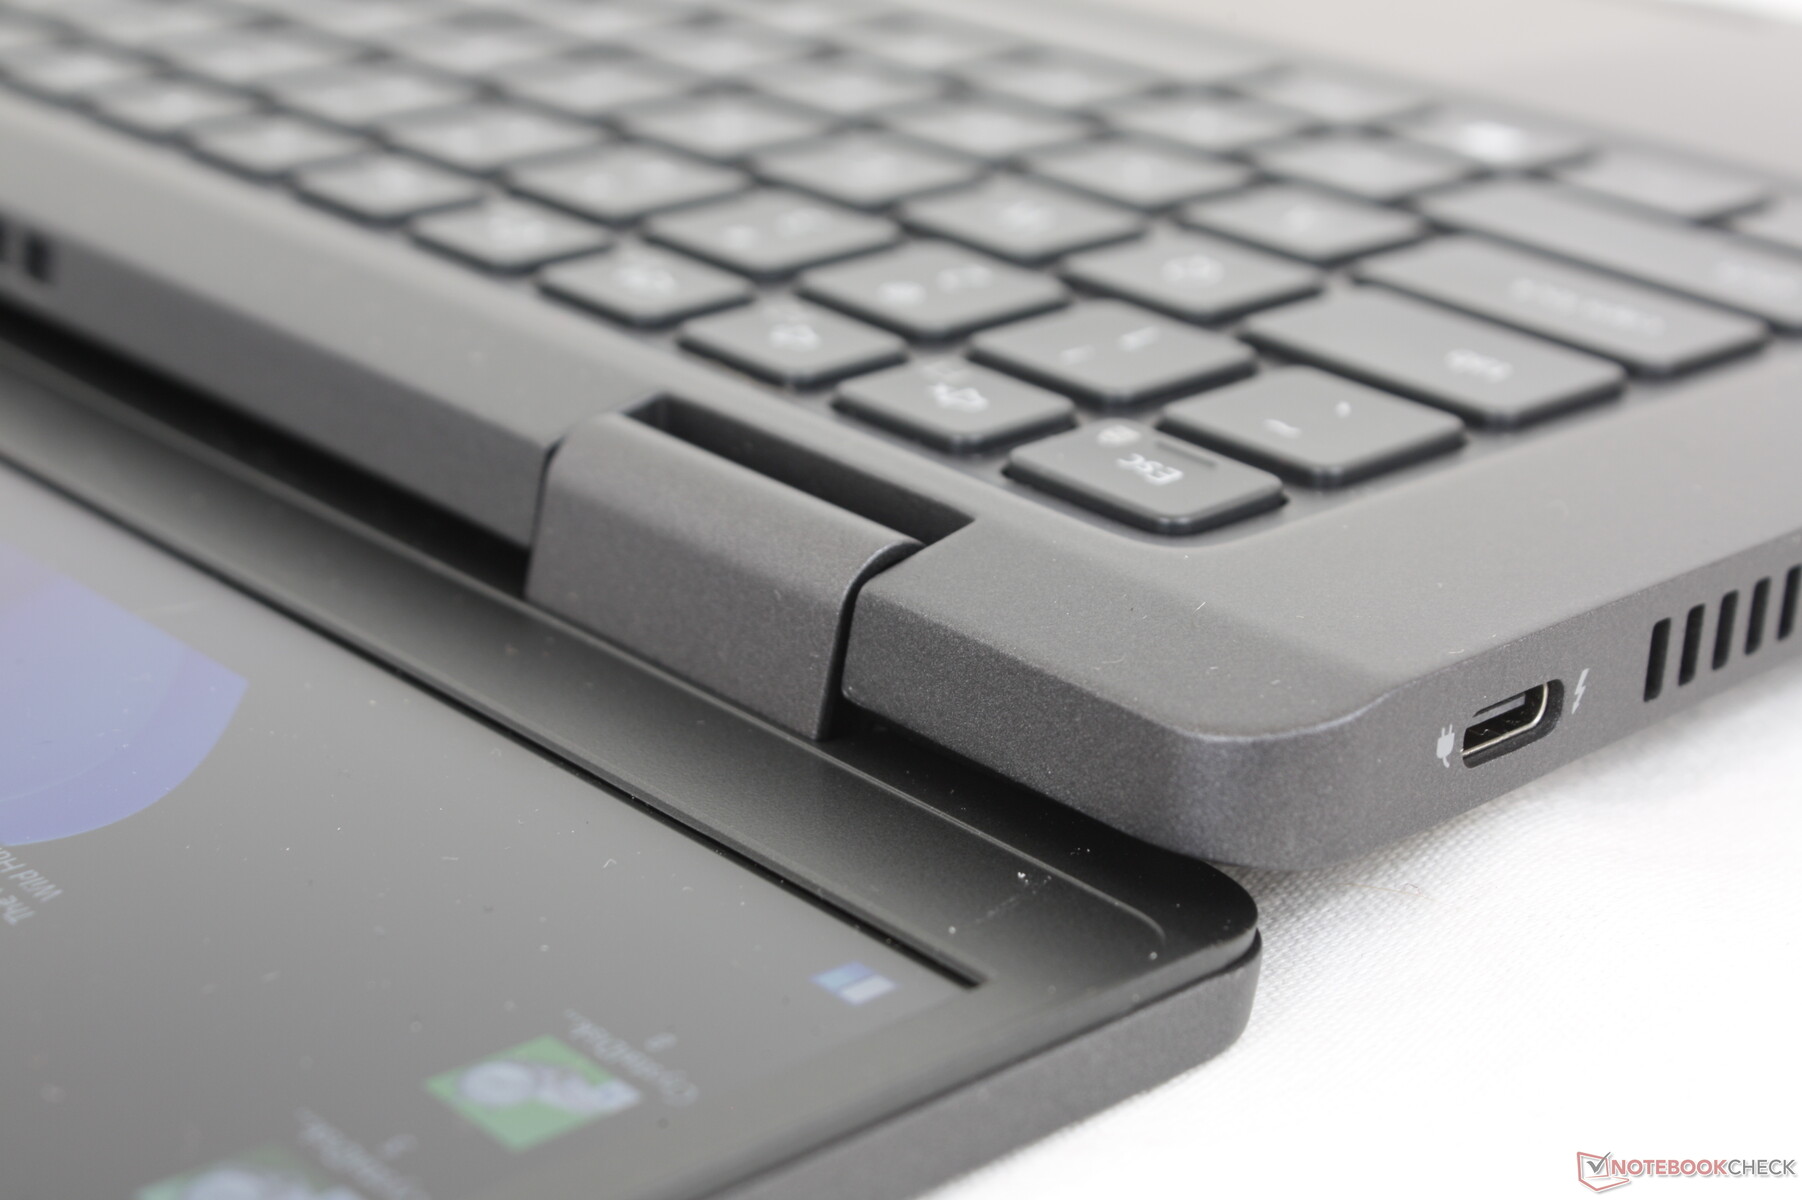
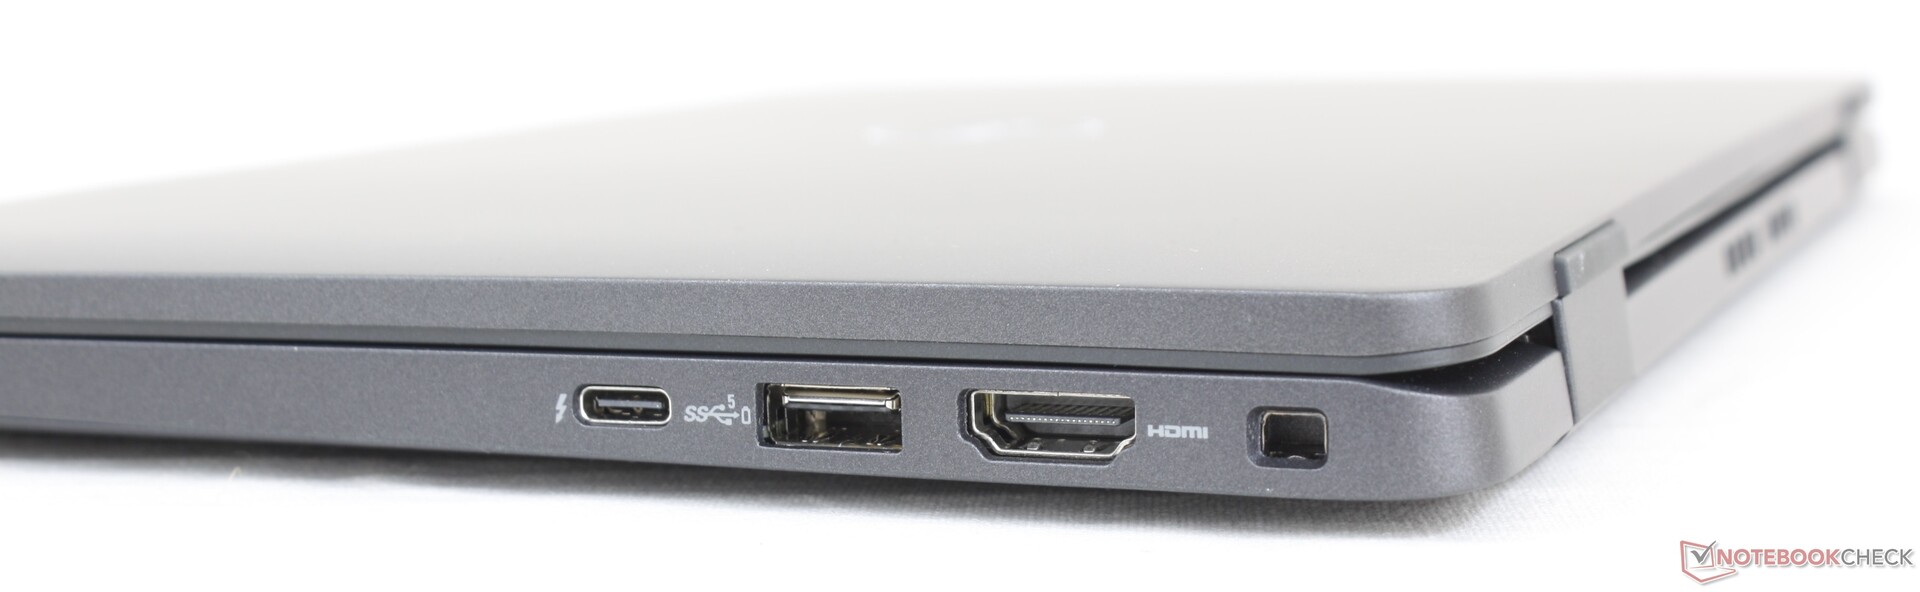
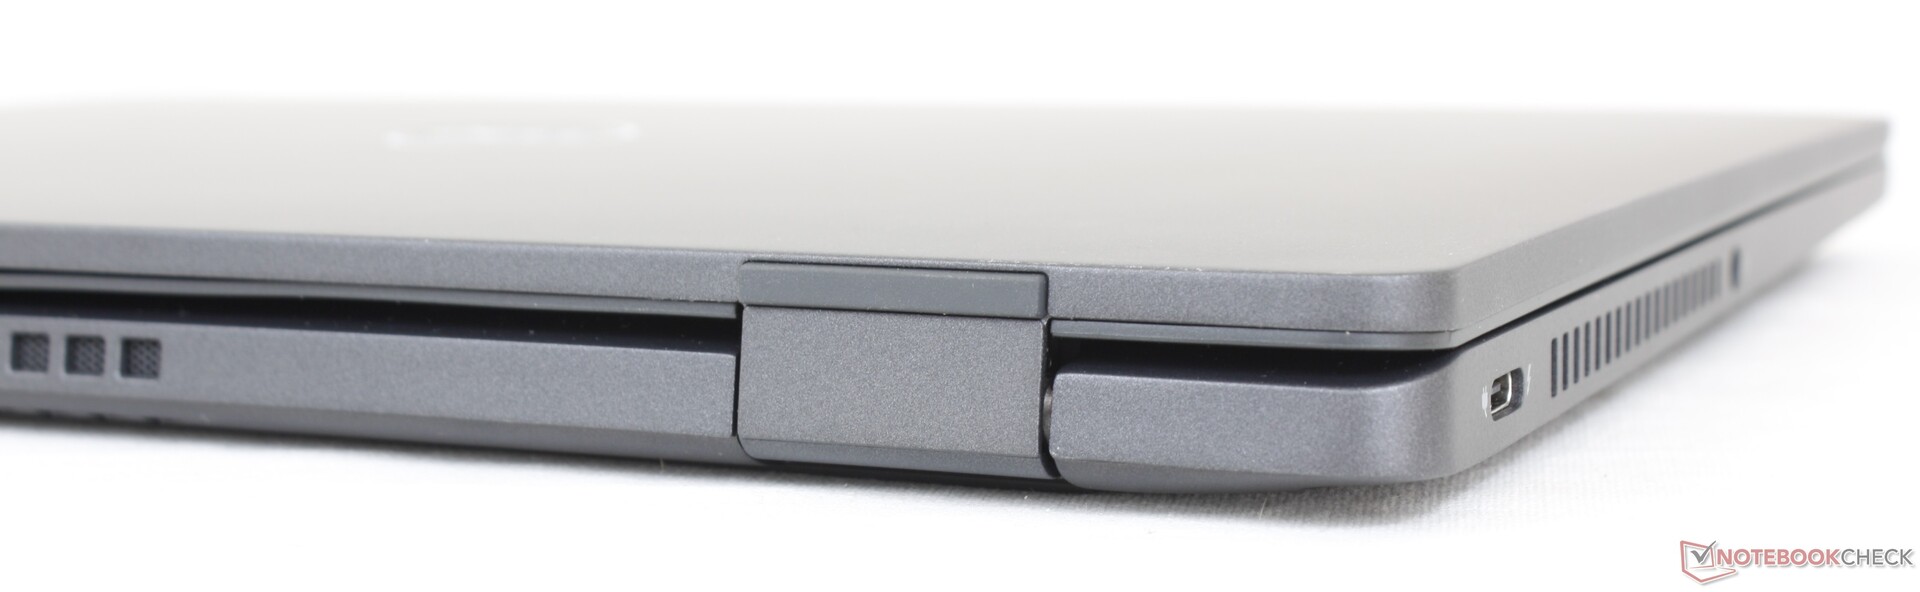
Connectiviteit - Thunderbolt 4 ondersteuning
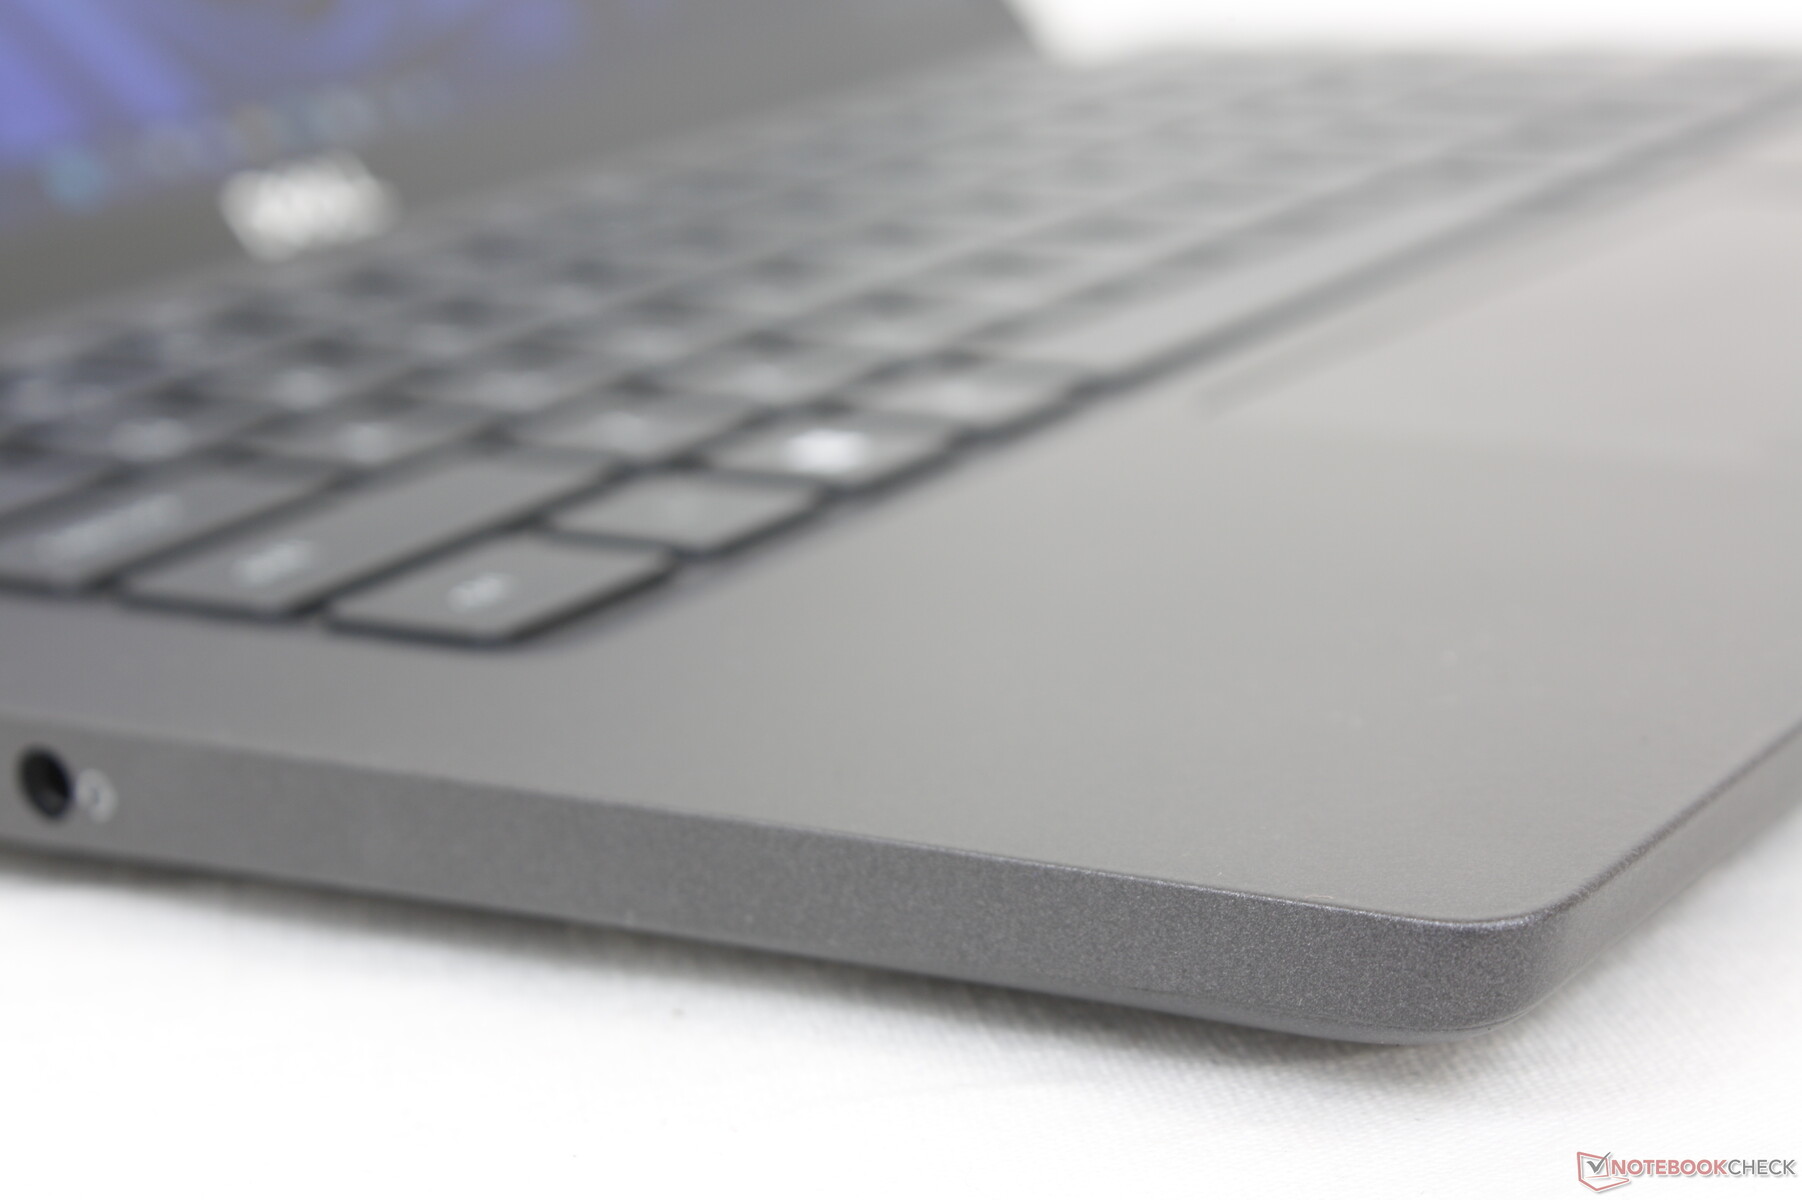
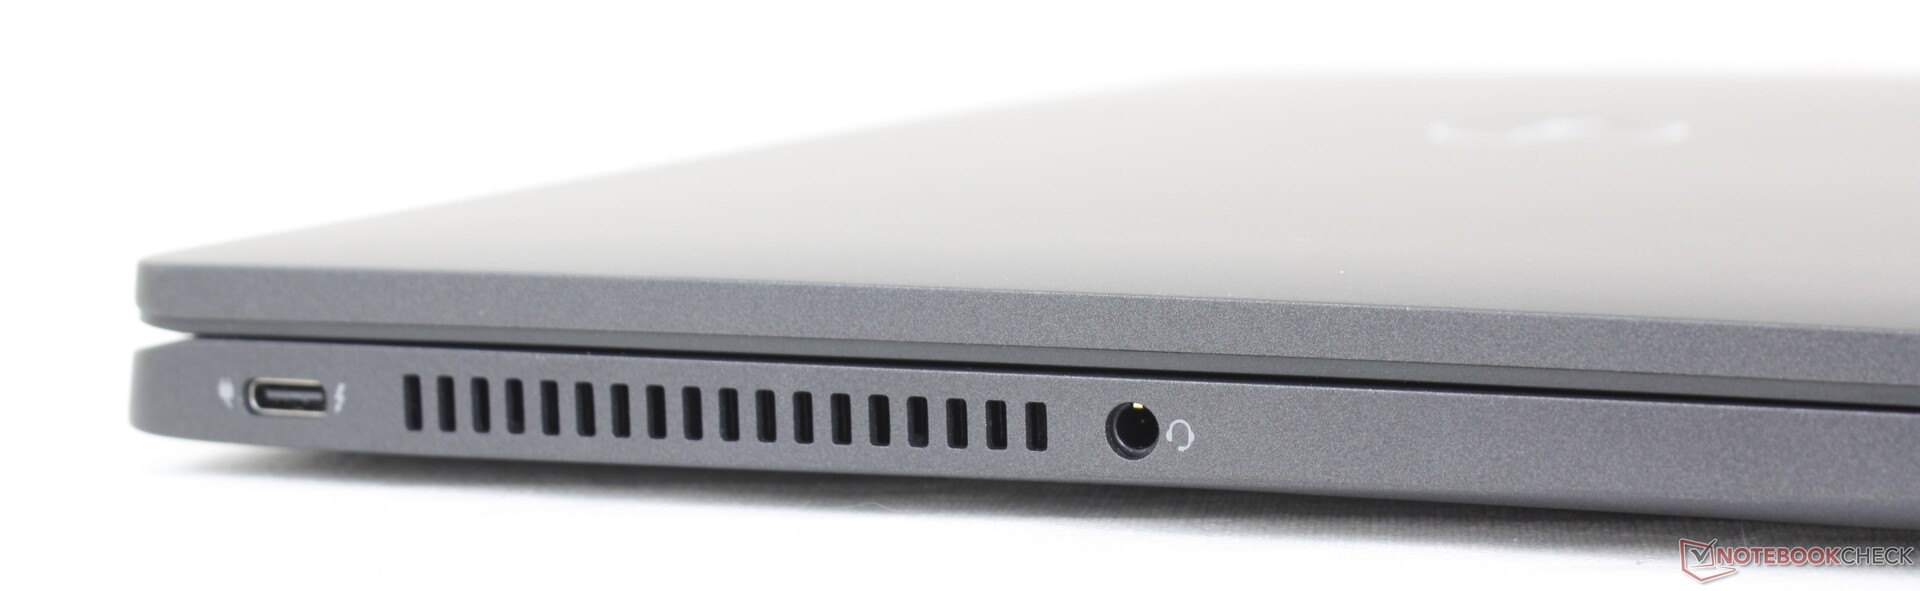
De poortopties zijn hetzelfde als op de Latitude 7310, maar anders ingedeeld om het gebruiksgemak te verbeteren. De twee USB-C poorten bevinden zich nu bijvoorbeeld elk aan de linker- en rechterrand van het chassis, in vergelijking met alleen de linkerrand op het oudere model. Dankzij deze wijziging kunnen gebruikers de laptop vanaf beide kanten opladen.
Communicatie - Optioneel LTE
De Intel AX211 wordt standaard geleverd met Wi-Fi 6E en Bluetooth 5.2 connectiviteit. We hebben geen grote connectiviteitsproblemen ondervonden bij het koppelen aan ons 6 GHz netwerk. De prestatieverschillen tussen Wi-Fi 6 en Wi-Fi 6E zullen voor de meeste gebruikers minimaal zijn.
Hoewel ons toestel niet is geconfigureerd met WAN, hebben gebruikers de optie om te configureren met een eSIM-enabled Qualcomm Snapdragon X20 LTE-A CAT 9 of CAT 16 module.
| Networking | |
| iperf3 transmit AX12 | |
| Microsoft Surface Laptop 4 13 Ryzen 5 | |
| Dell Latitude 7310 | |
| Razer Book 13 FHD | |
| Lenovo ThinkPad X13 Yoga 20SX0004GE | |
| iperf3 receive AX12 | |
| Razer Book 13 FHD | |
| Microsoft Surface Laptop 4 13 Ryzen 5 | |
| Dell Latitude 7310 | |
| Lenovo ThinkPad X13 Yoga 20SX0004GE | |
| iperf3 receive AXE11000 6GHz | |
| Framework Laptop 13.5 12th Gen Intel | |
| Dell Latitude 13 7330 | |
| iperf3 transmit AXE11000 6GHz | |
| Dell Latitude 13 7330 | |
| Framework Laptop 13.5 12th Gen Intel | |
Webcam
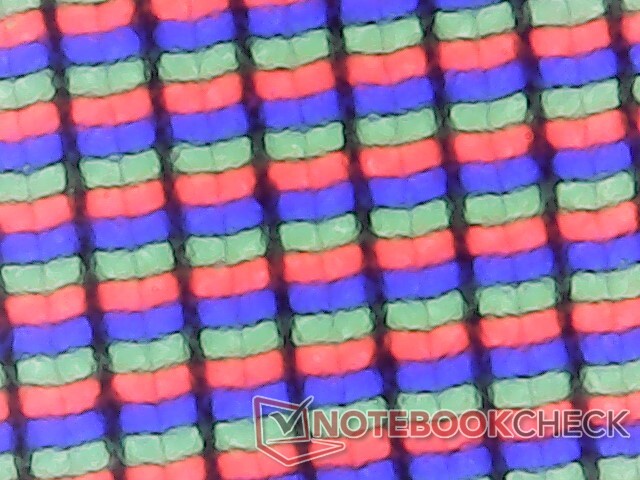
Gebruikers kunnen kiezen tussen een HD (720p) of FHD (1080p) webcam met optionele IR voor Windows Hello ondersteuning. We raden aan om te upgraden naar 1080p, aangezien de beeldkwaliteit van onze 720p configuratie wazig en bruut verouderd is.
Een handmatige sluiter schuif is geïnstalleerd voor privacy.


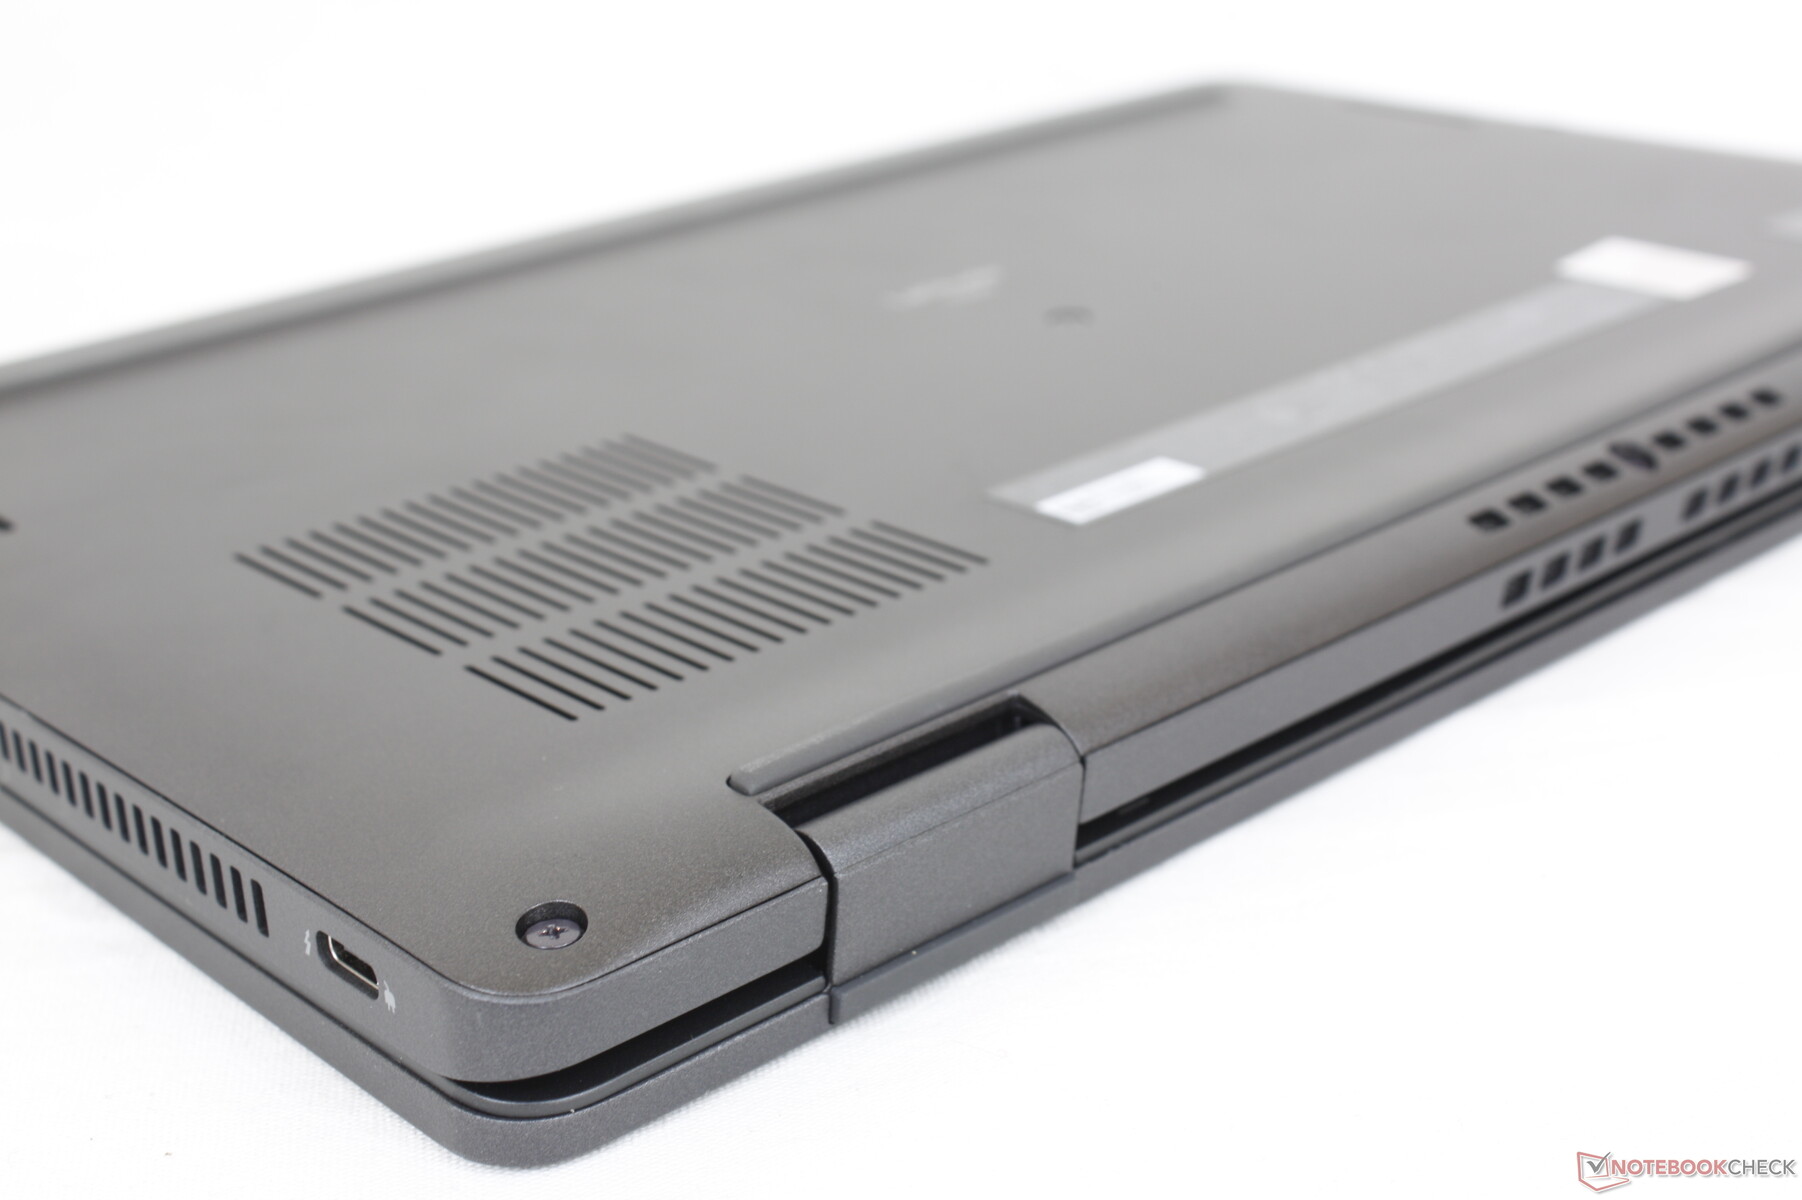
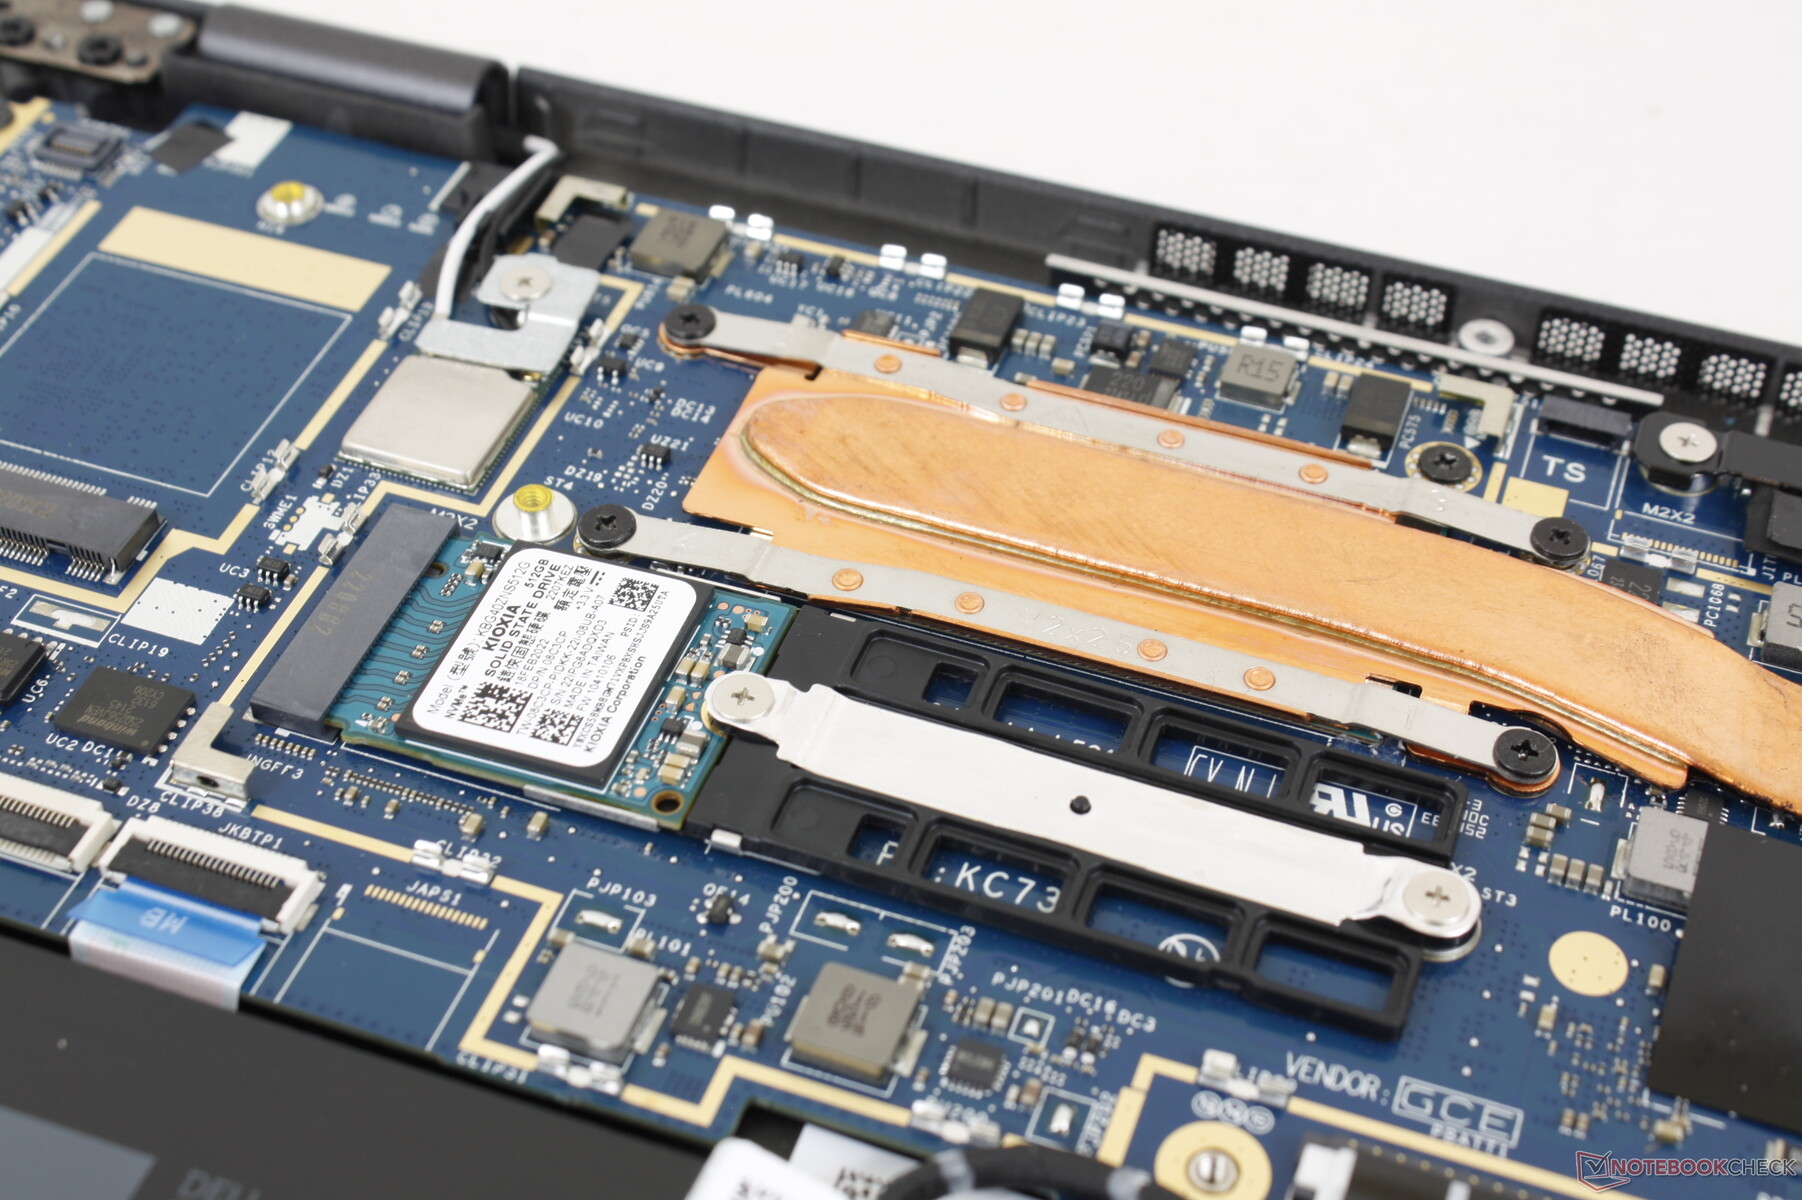
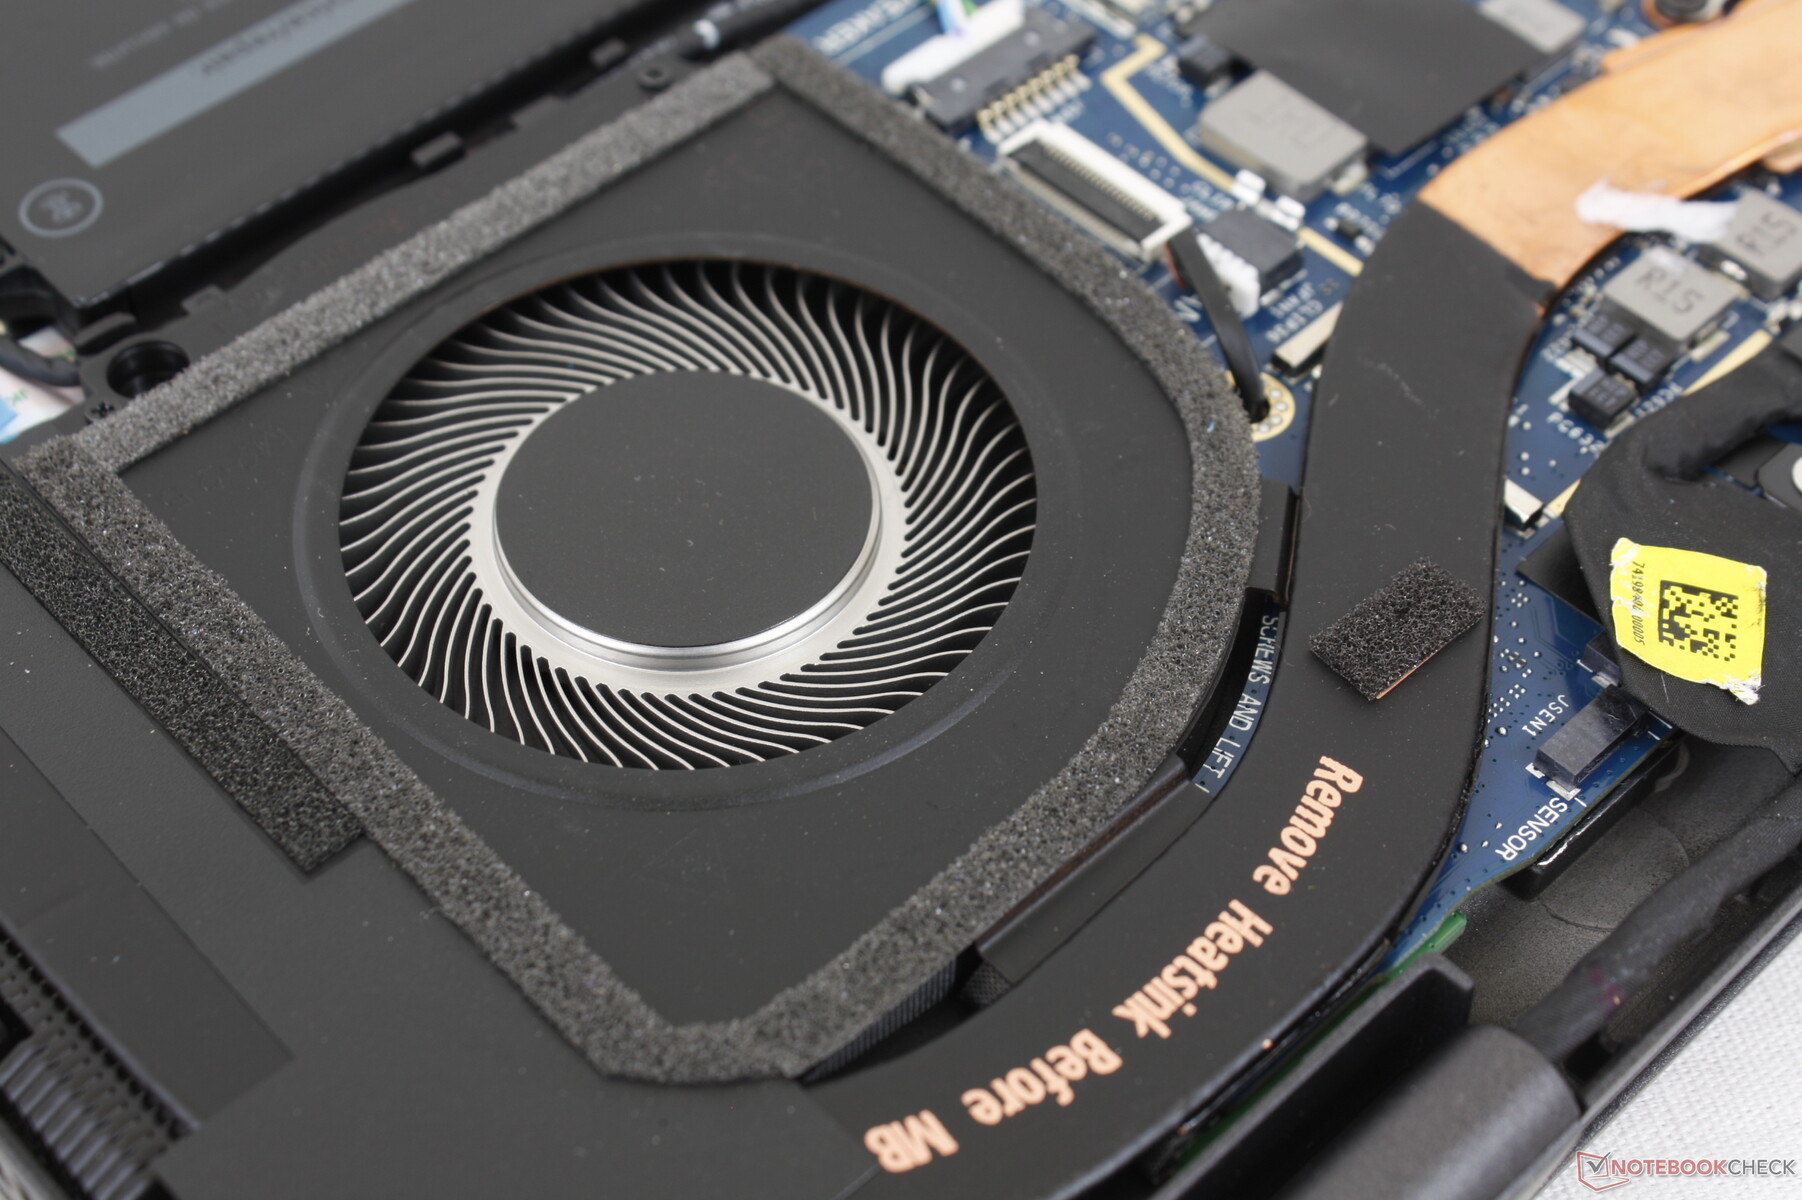
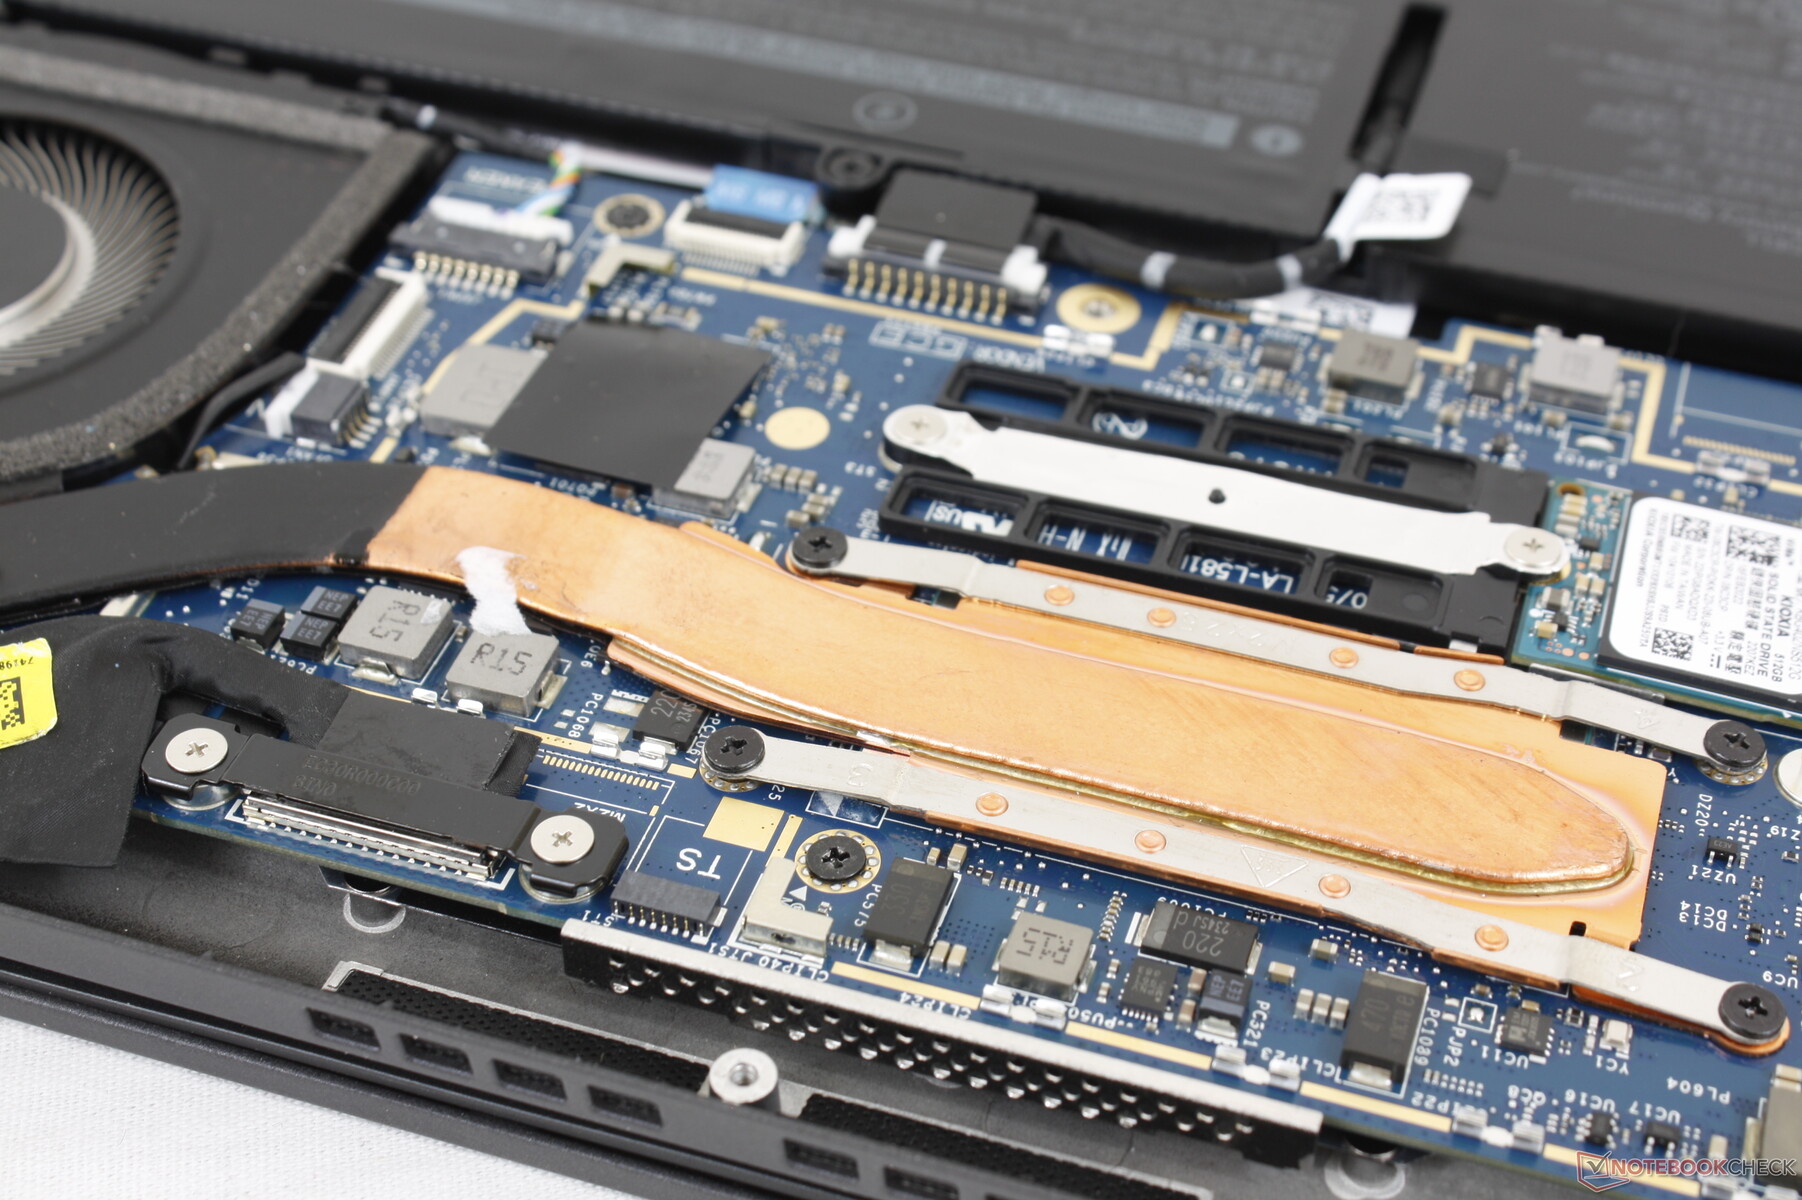
Onderhoud
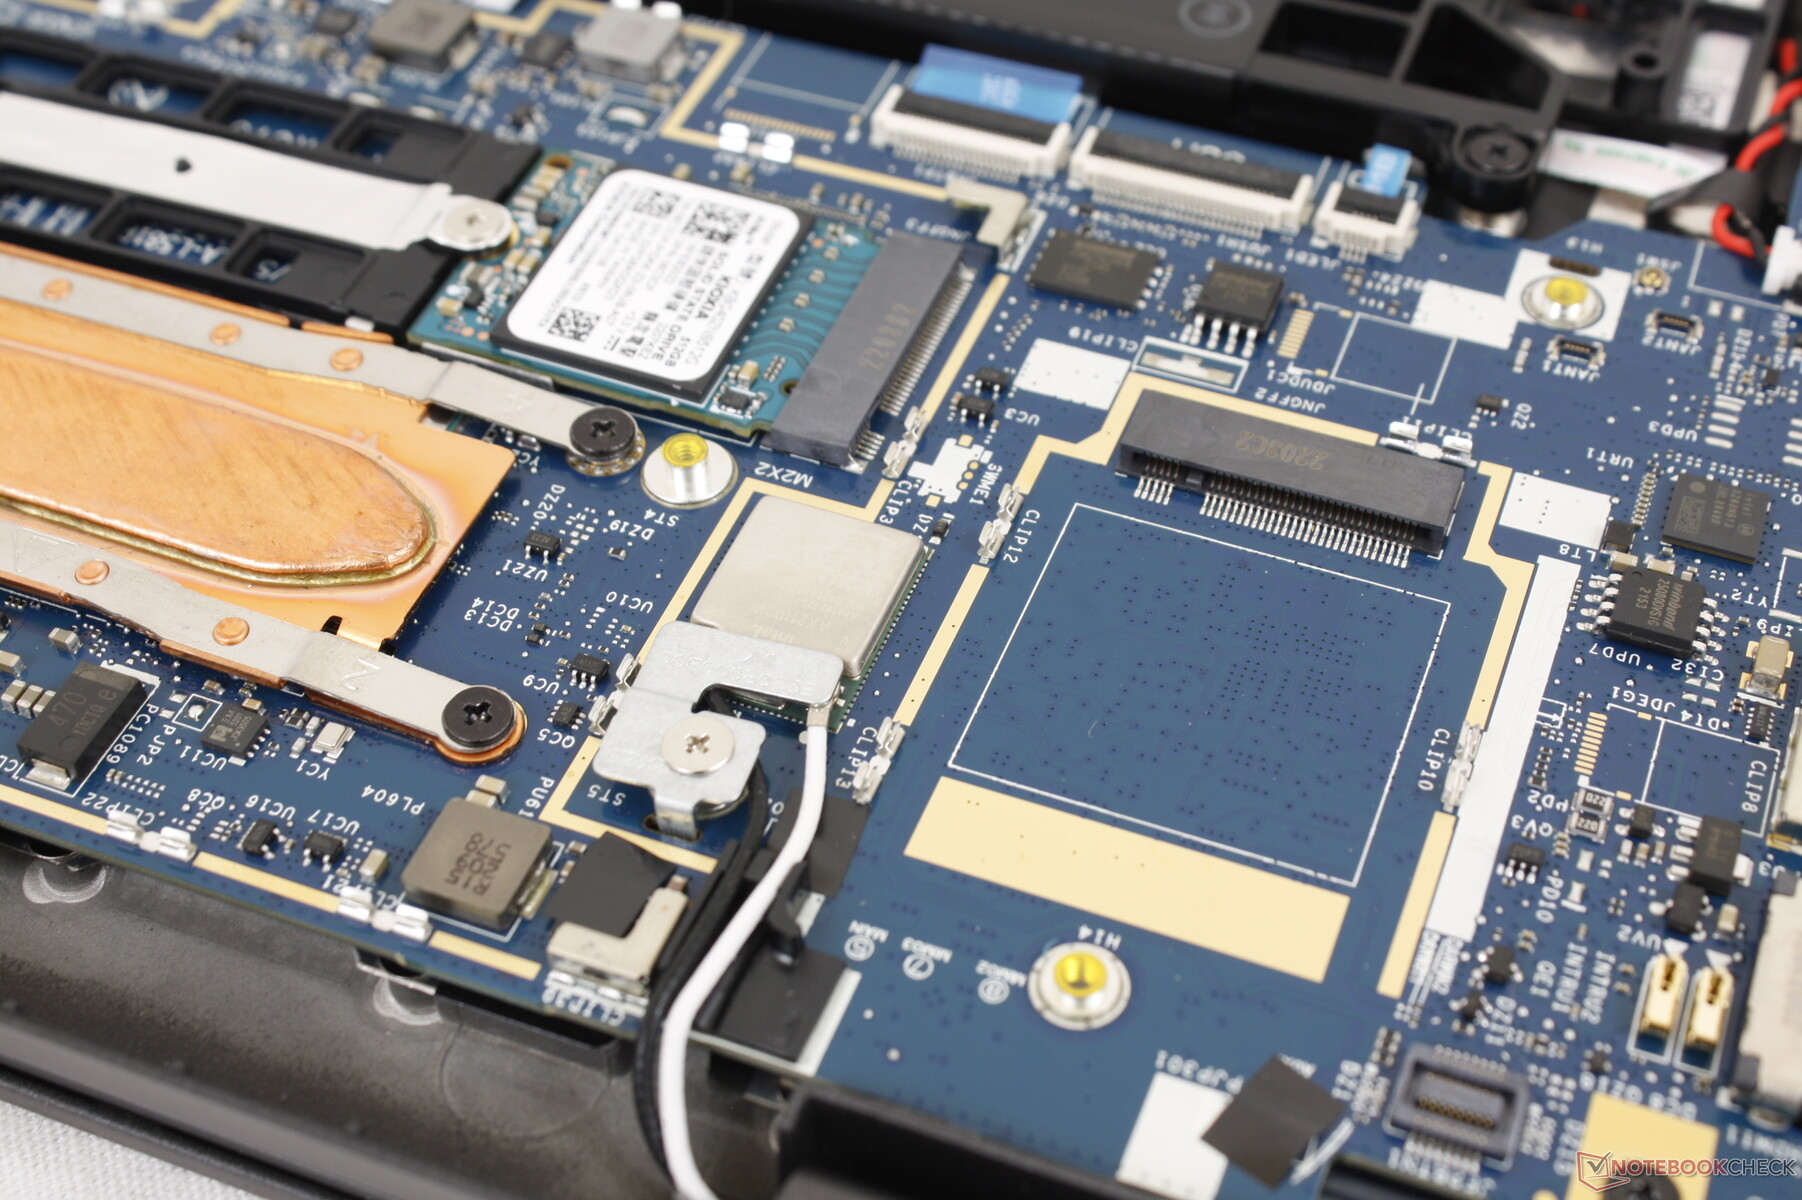
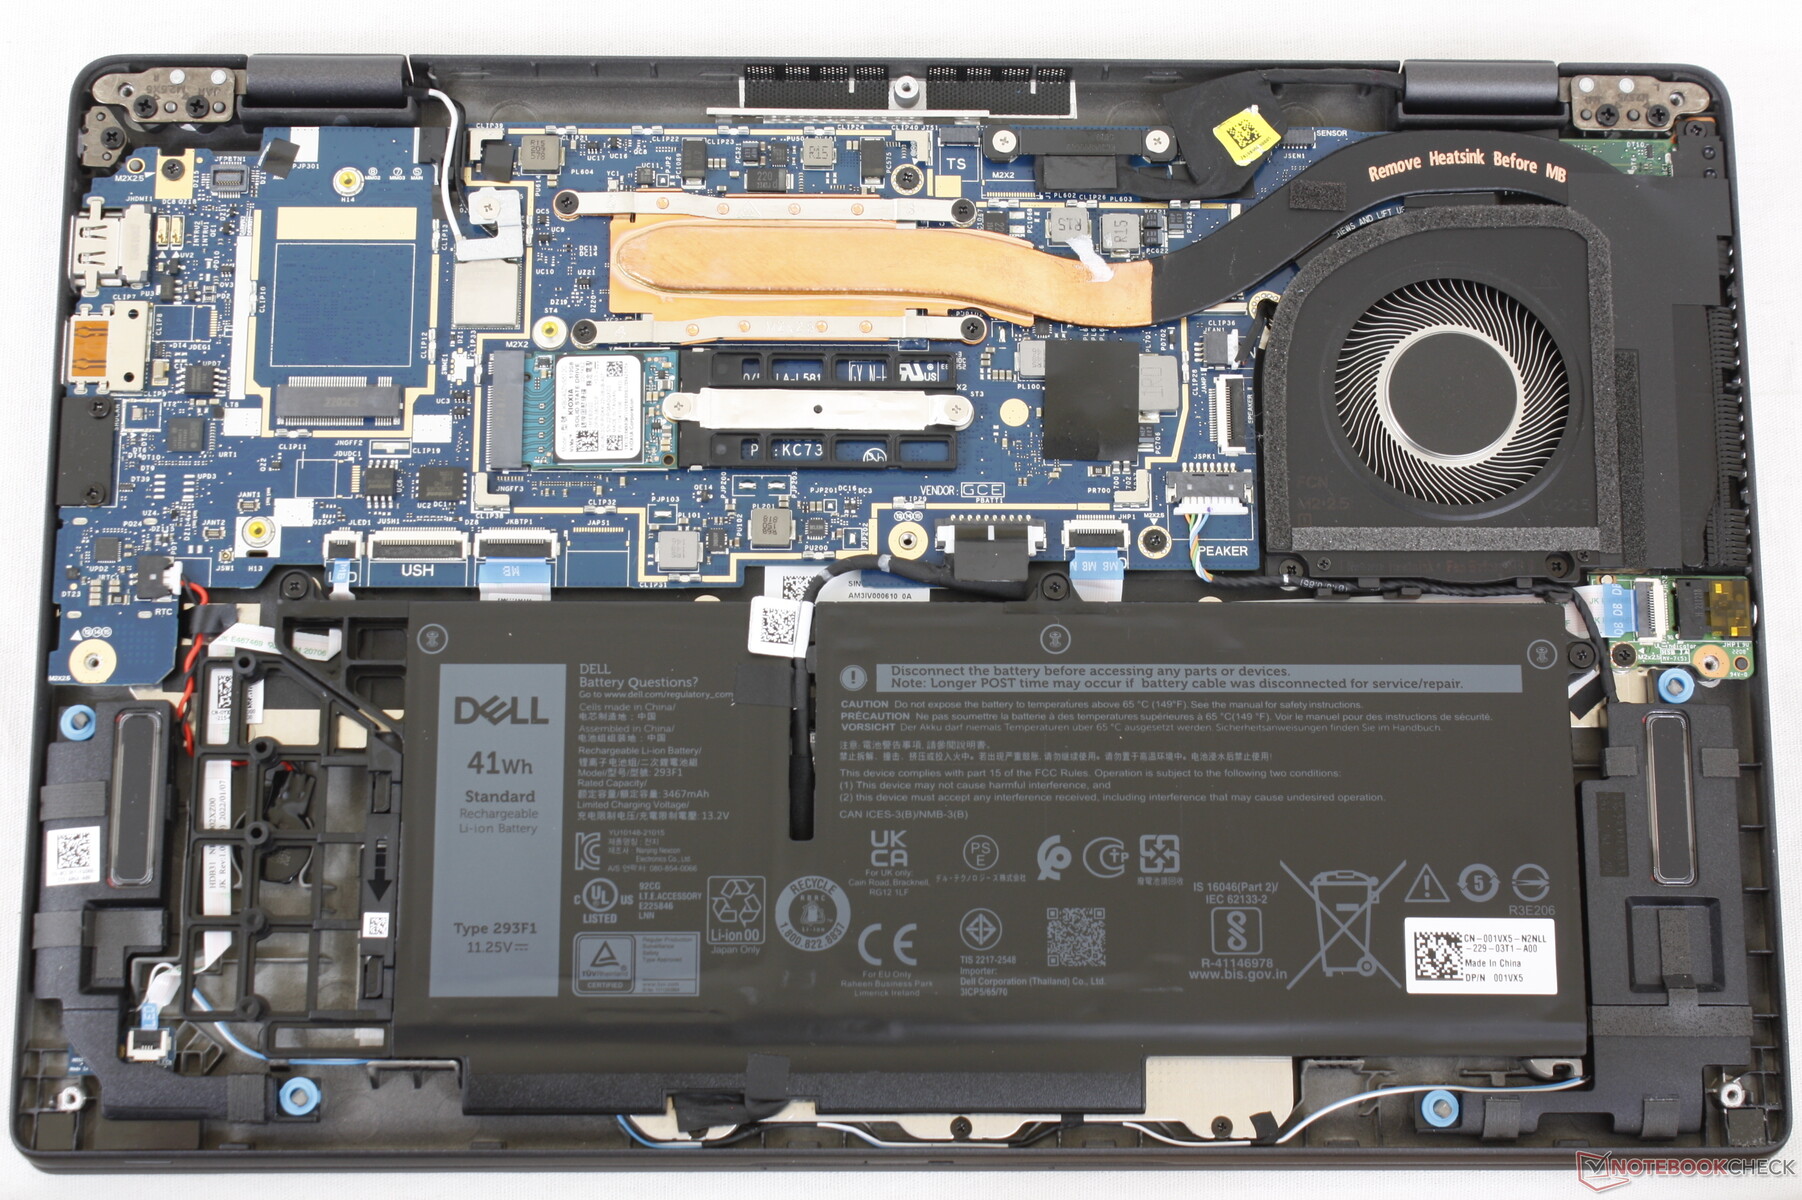
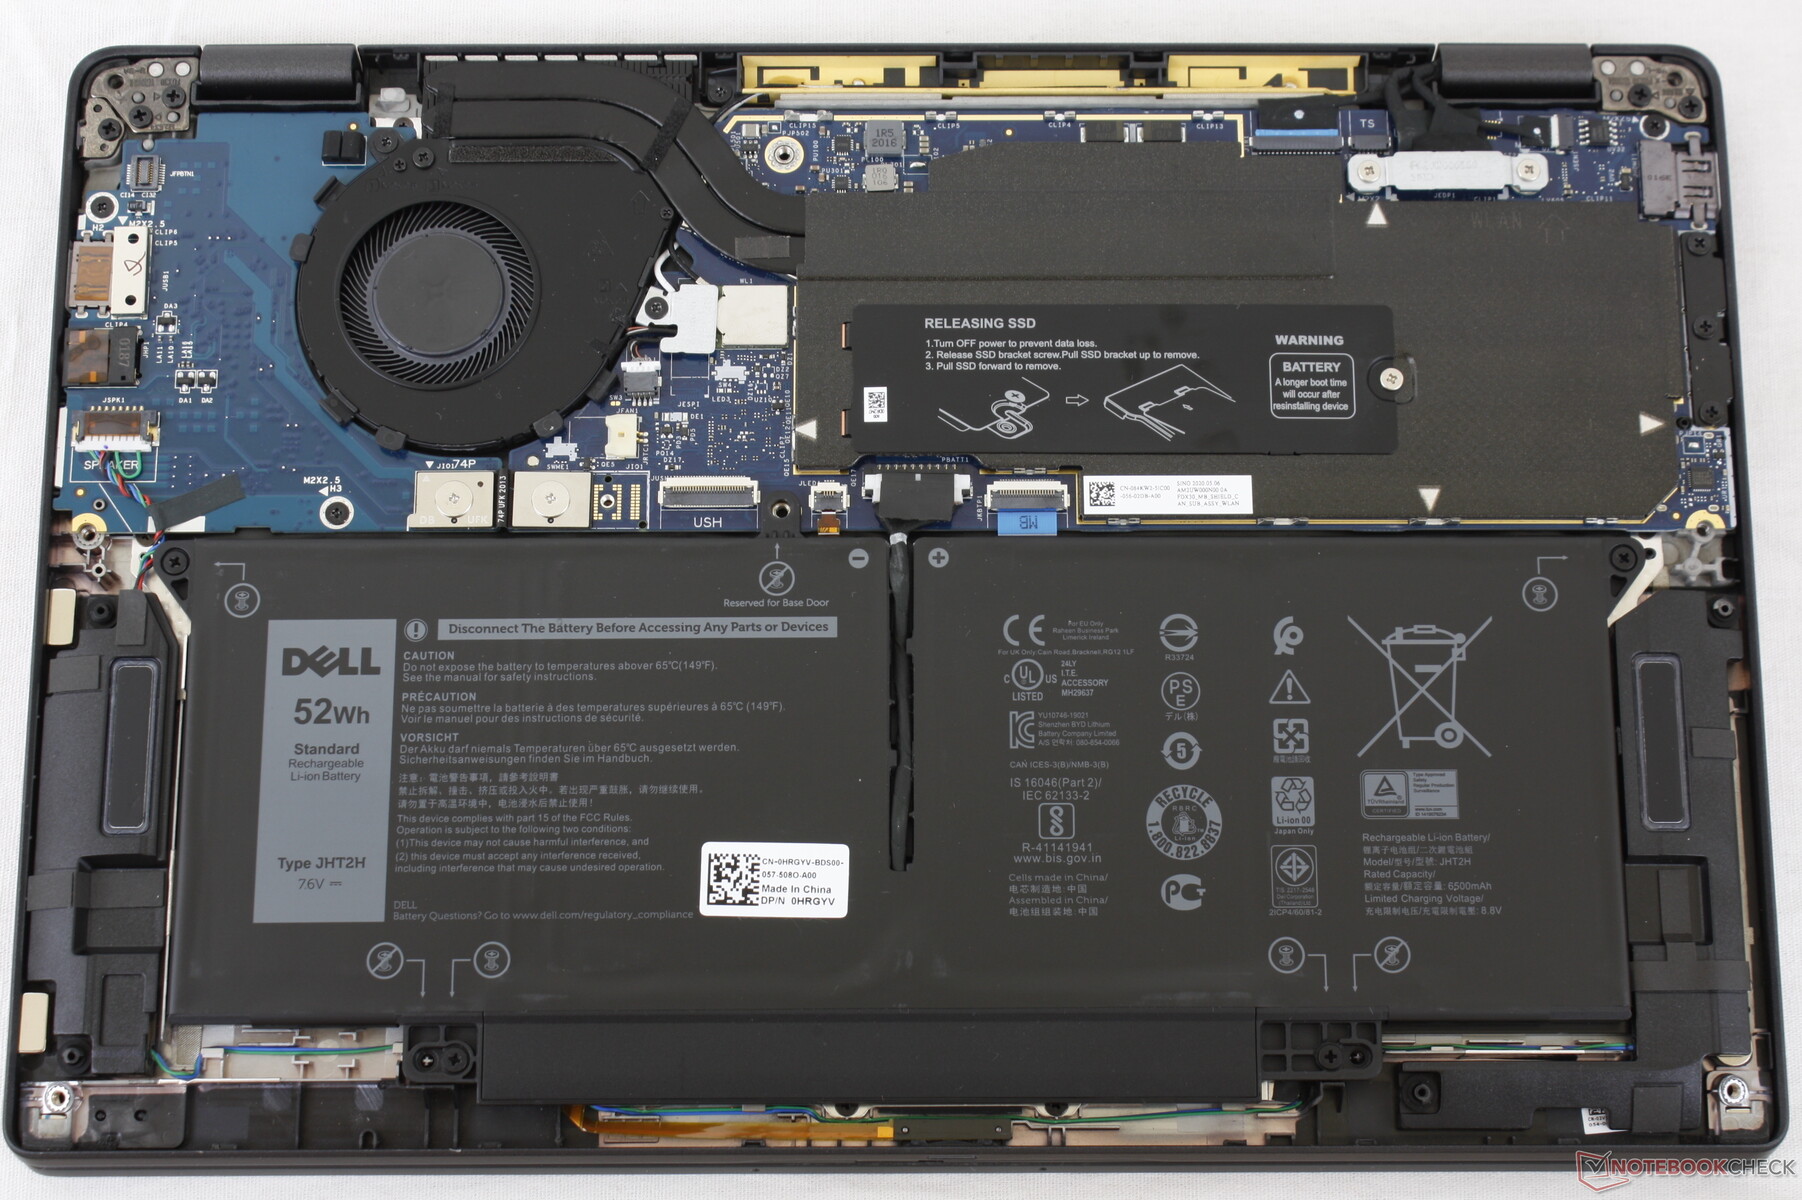
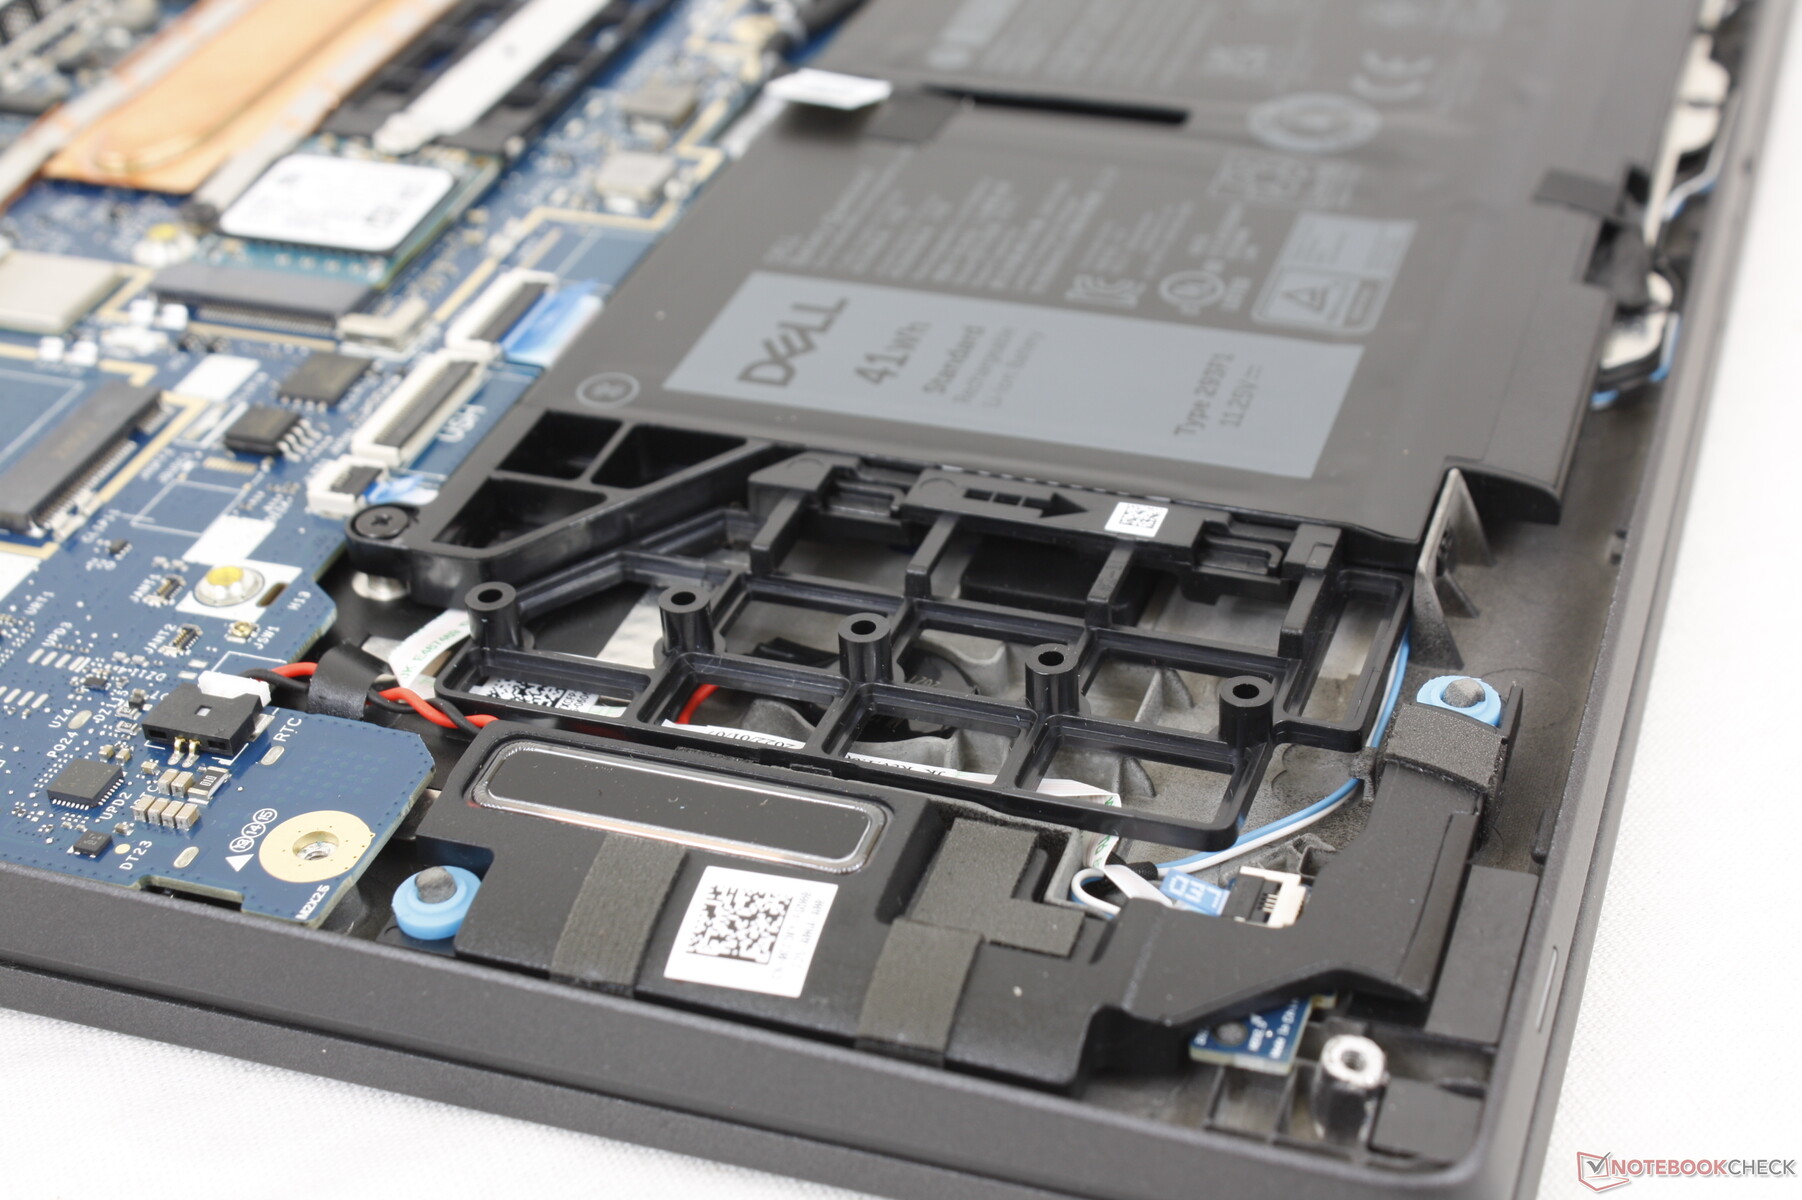
Het bodempaneel is gemakkelijk te verwijderen met slechts een Philips schroevendraaier. Buiten de M.2 SSD en batterij is er niet veel te onderhouden, aangezien de WLAN en RAM modules gesoldeerd zijn.
Merk op dat er geen antenne wordt meegeleverd als de configuratie zonder WAN wordt uitgevoerd, om eigenaars te ontmoedigen hun eigen WAN module te installeren. Let ook op de lege ruimte links van de 41 Wh batterij om het gewicht te verminderen; deze ruimte wordt in beslag genomen bij configuratie met de grotere 58 Wh optie.
Accessoires en garantie
Er zitten geen extra's in de doos, behalve de wisselstroomadapter en de papieren. Een garantie van drie jaar is standaard, zoals gebruikelijk is voor de meeste Latitude modellen.
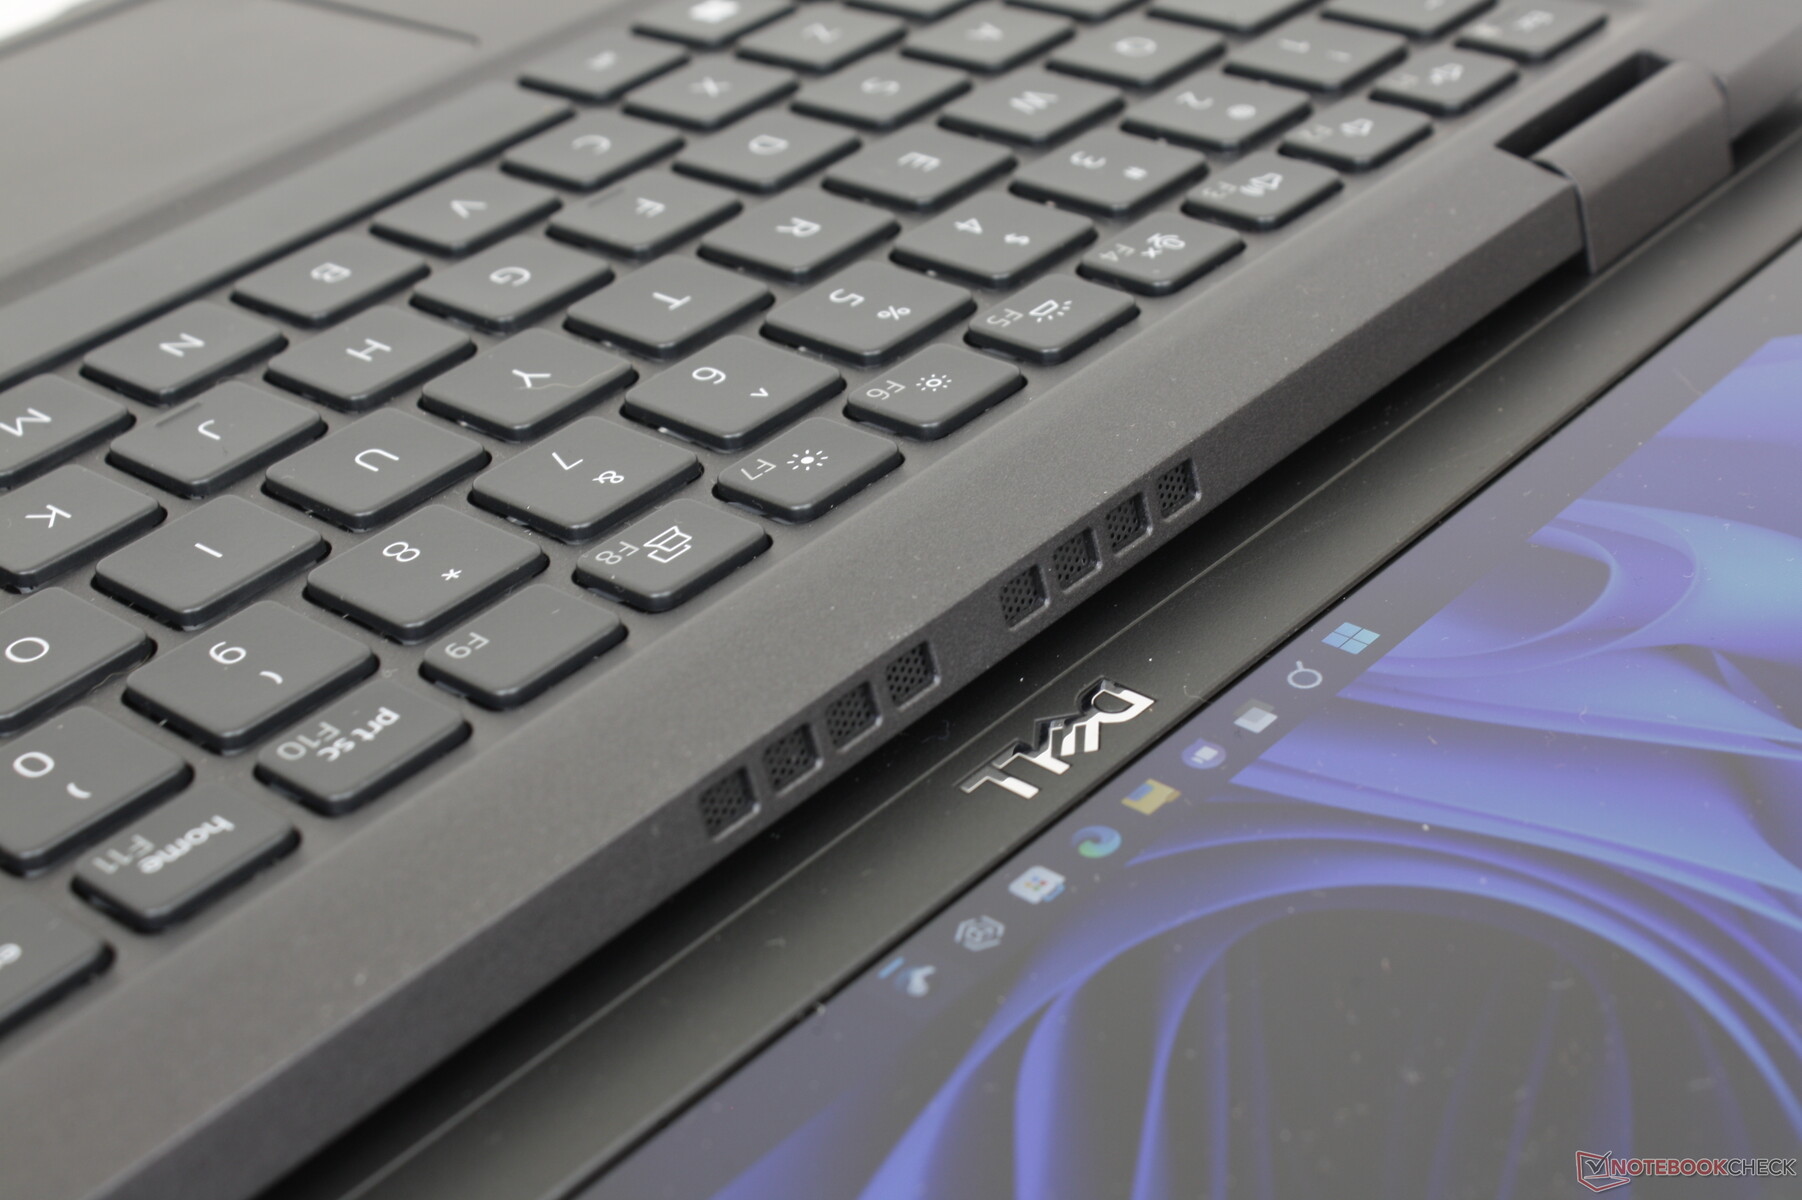
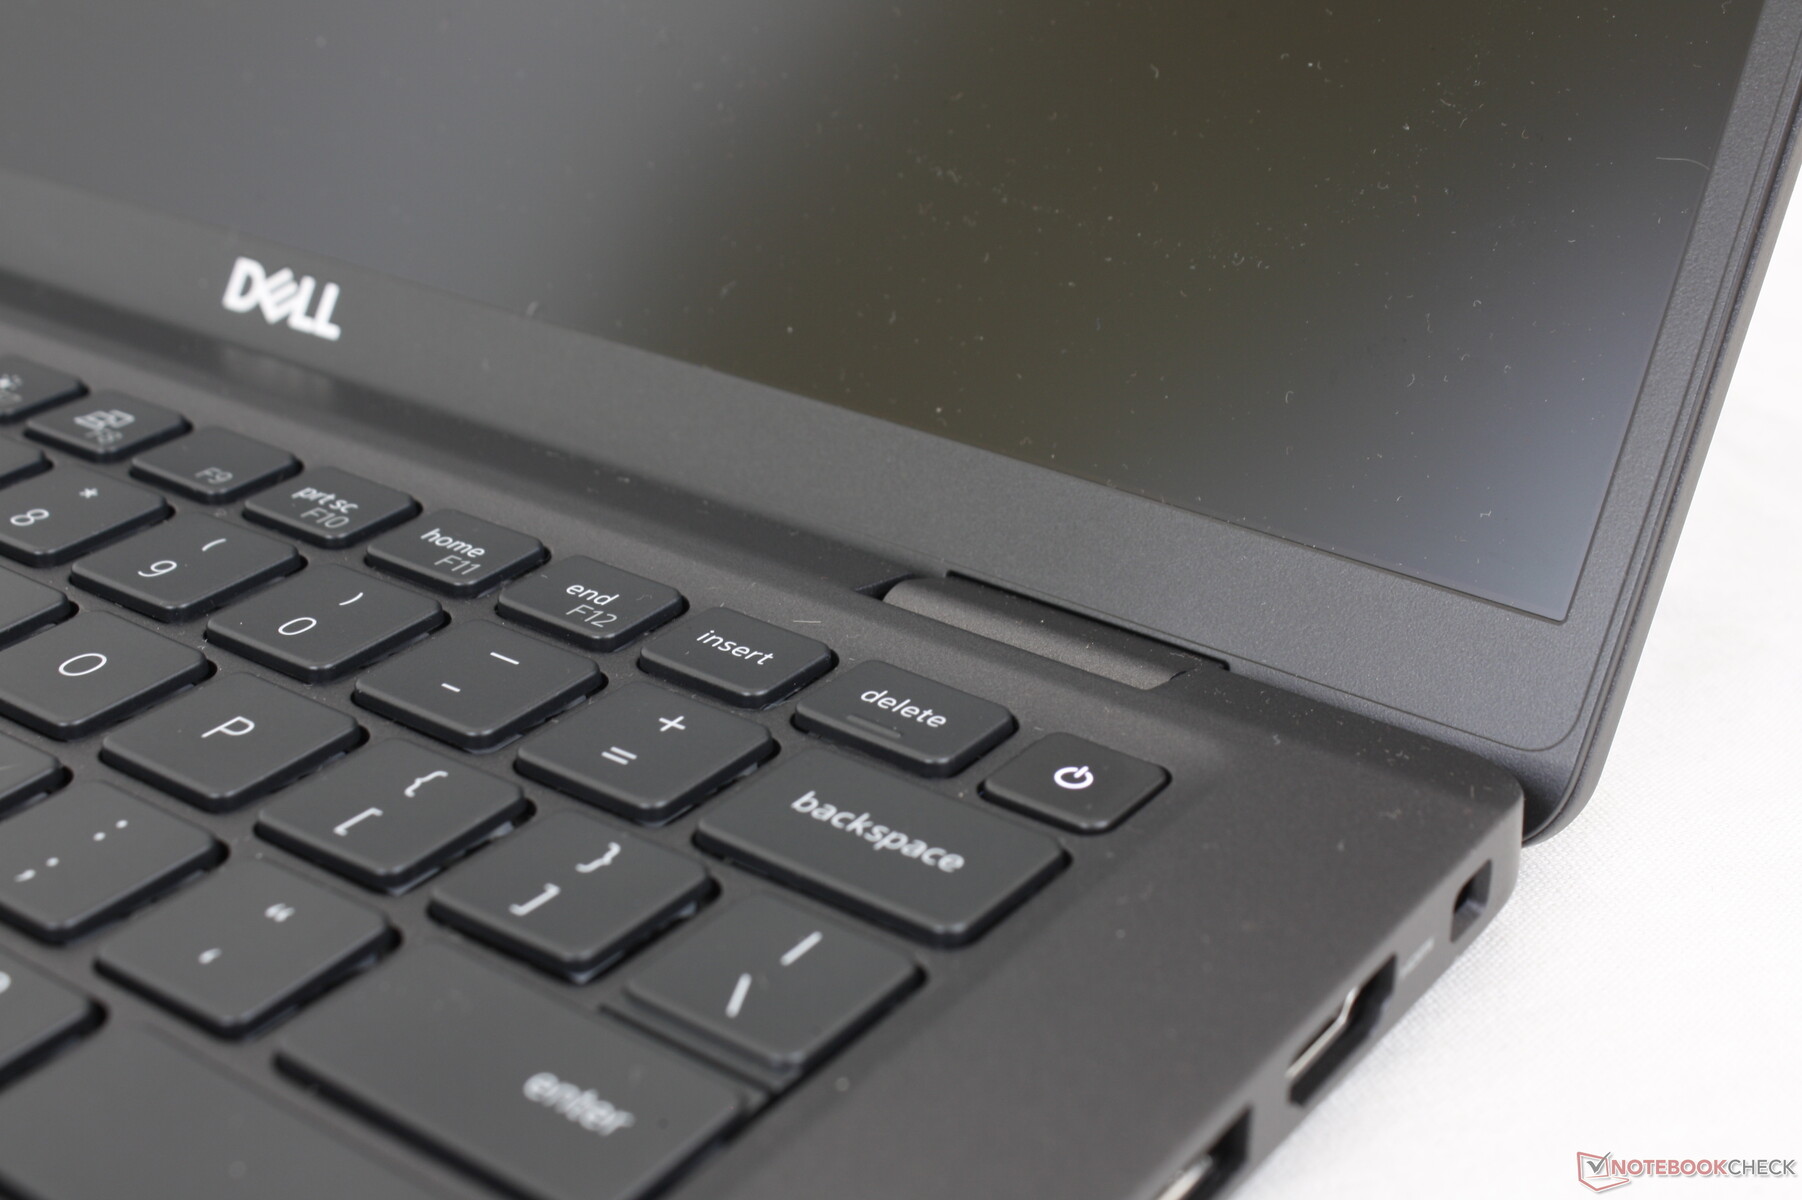
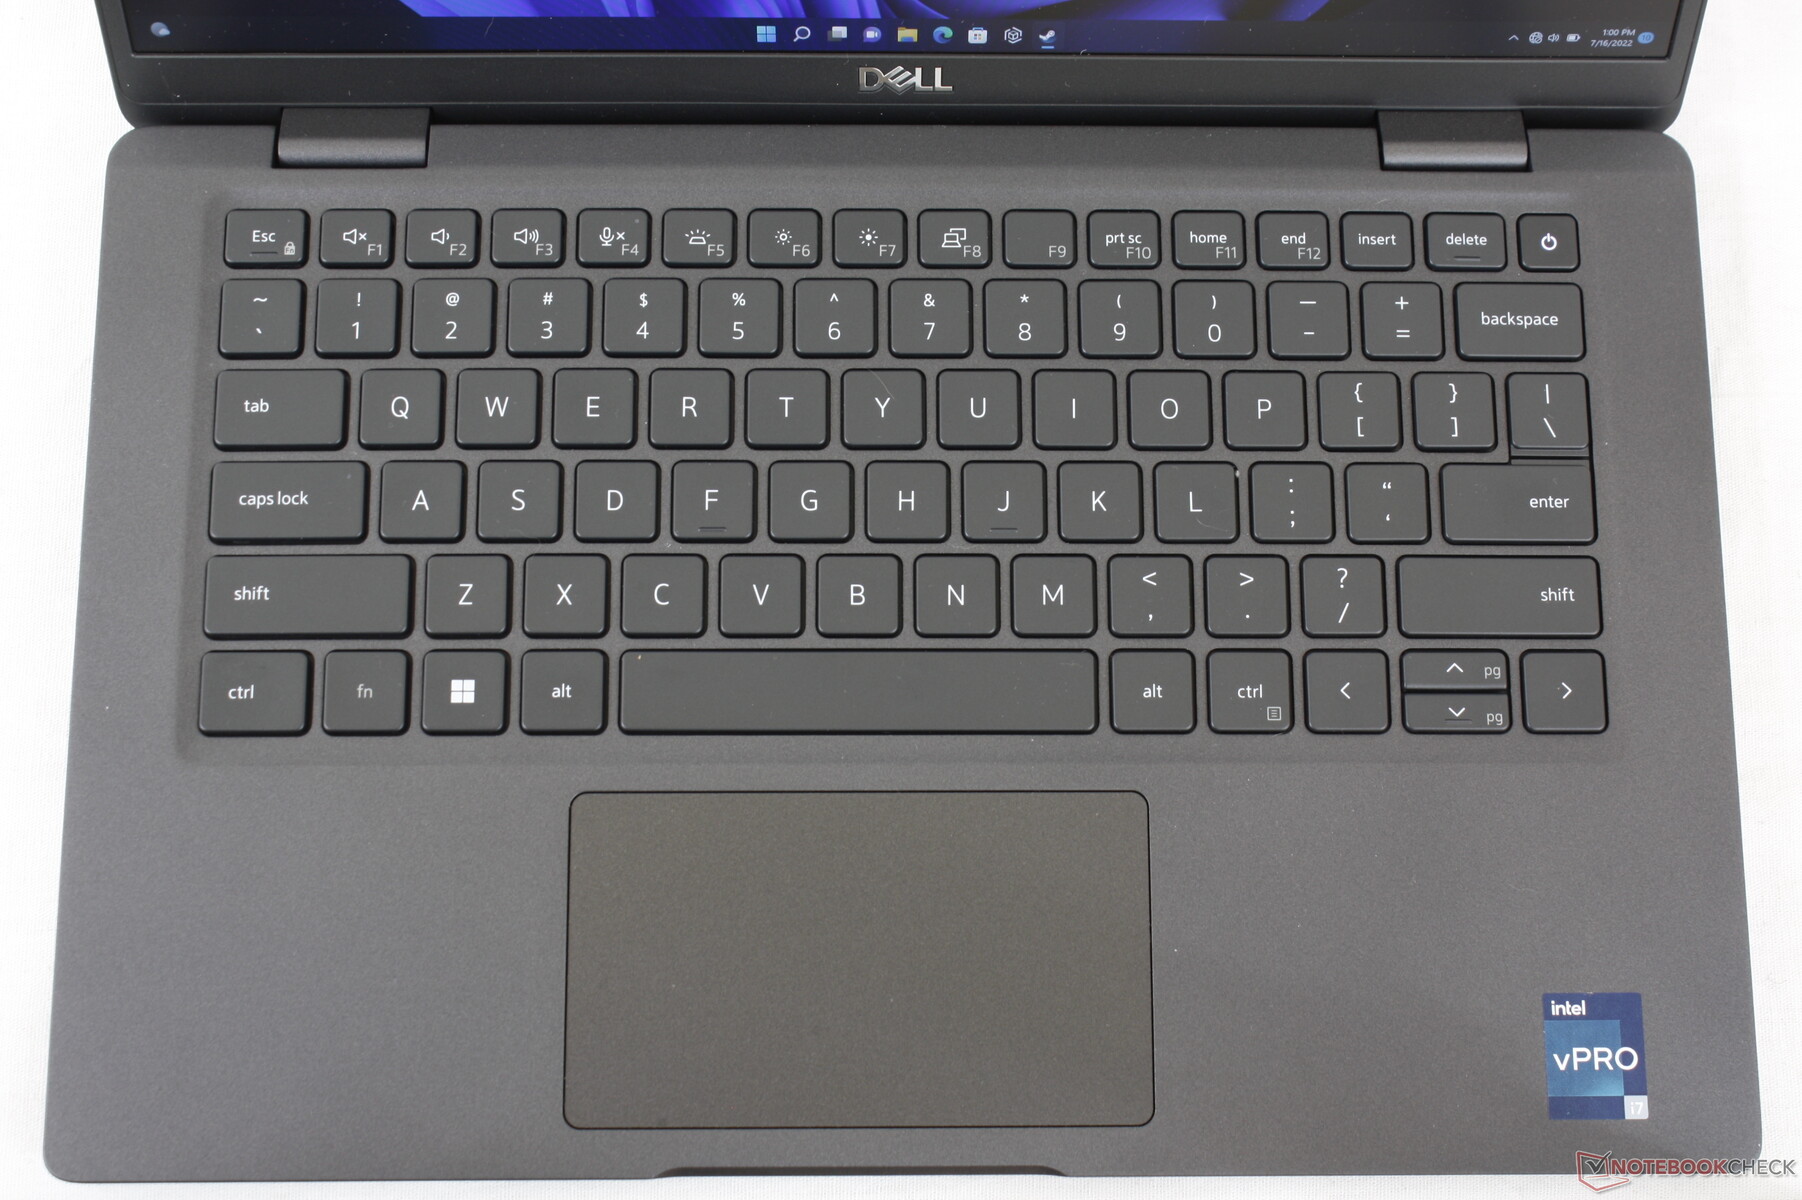
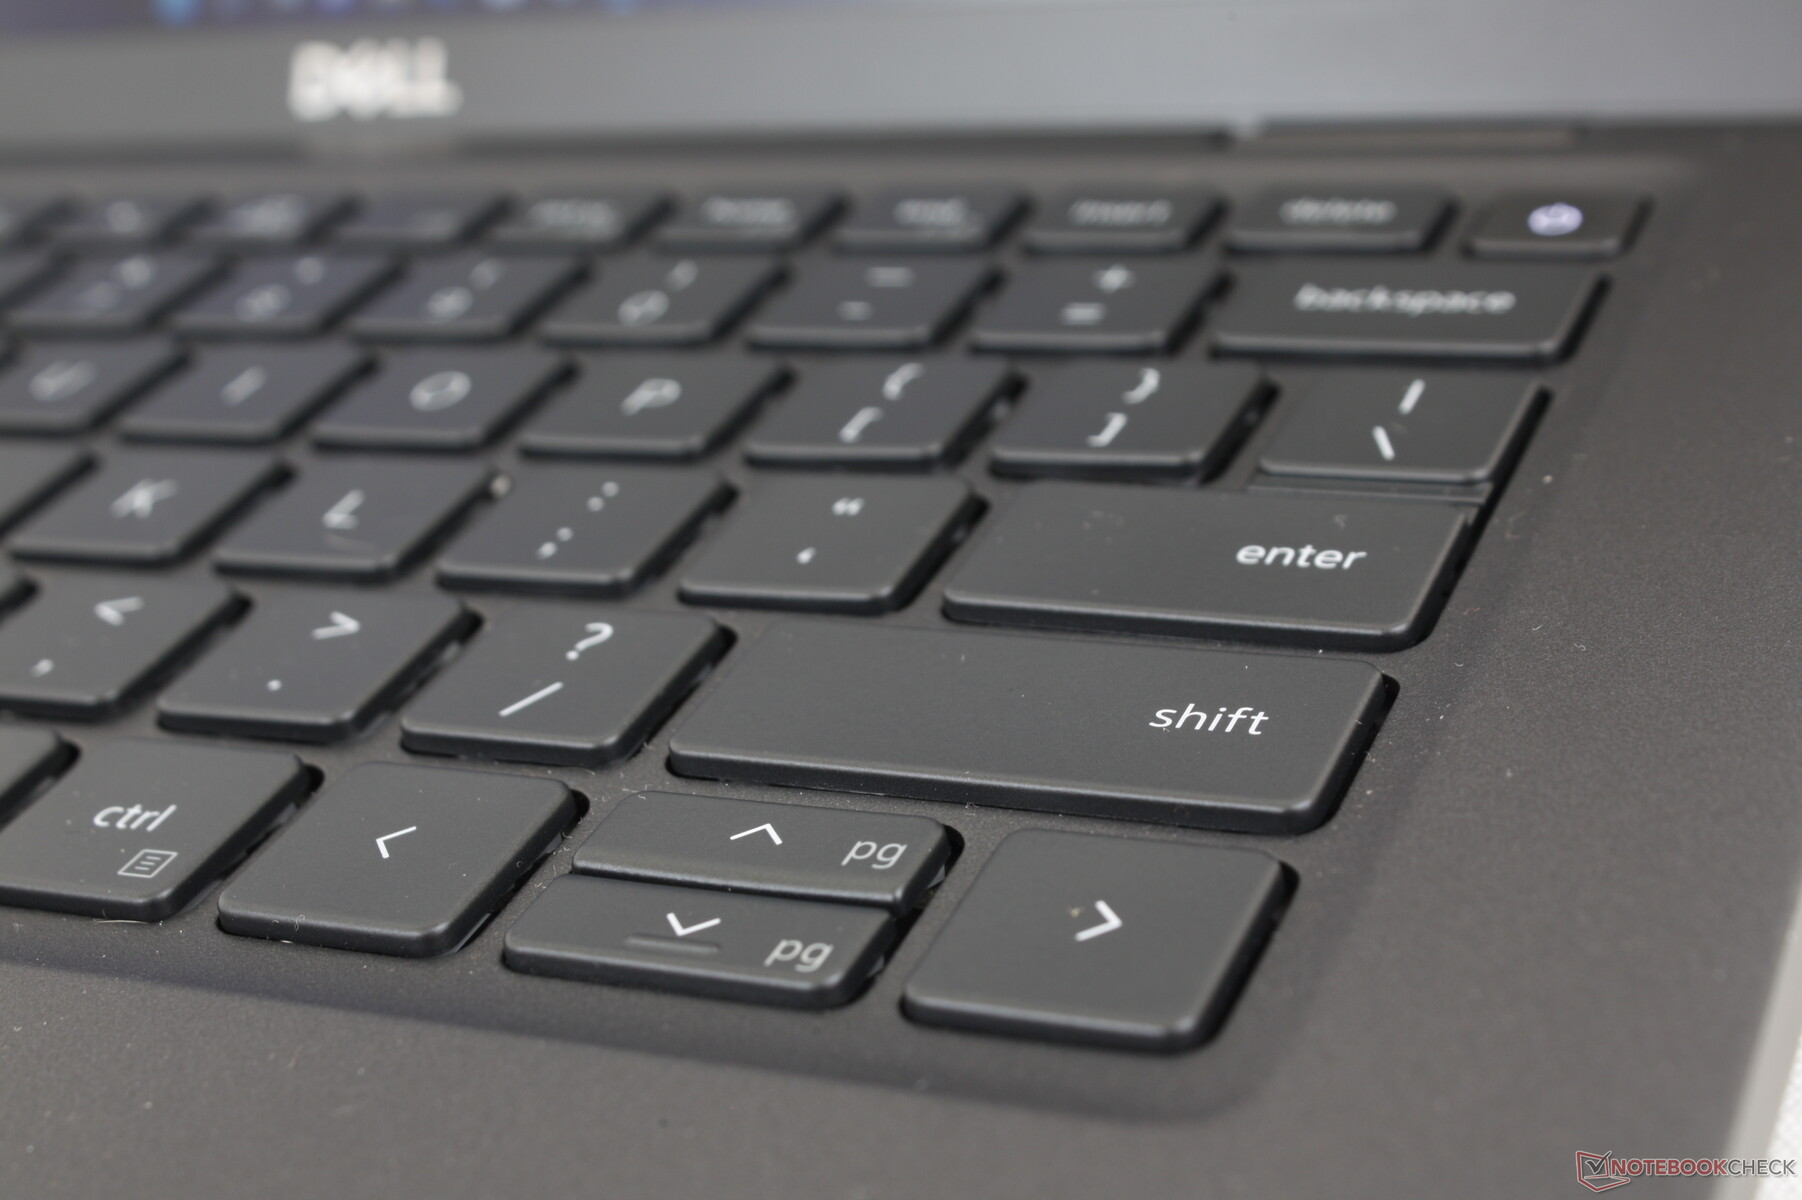
Invoerapparaten - hetzelfde als voorheen
Toetsenbord
Dell heeft geen wijzigingen aangebracht aan het toetsenbord tussen de Latitude 7310 en Latitude 7330. In feite hebben veel van de nieuwere Latitude modellen hetzelfde toetsenbordontwerp en dezelfde indeling, waaronder de Latitude 7400 7410, 7310, en 7330. Wij vinden de stevigere toetsen van de Latitude comfortabeler om te typen dan de lichtere toetsen van de XPS 13. De toetsen op de LG Gram 14 of HP EliteBook serie hebben een scherpere of scherpere feedback.
Touchpad
De afmetingen van het clickpad zijn niet veranderd ten opzichte van de oudere Latitude 7310 en bedragen ongeveer 10 x 6,1 cm. We zouden echter willen dat hij groter was, omdat verticale cursorbewegingen en multi-touch scrollen een beetje krap aanvoelen. De geïntegreerde muisknoppen zijn ook zachter dan we zouden willen en ze worden vermoeiend om in te drukken na een korte tijd.


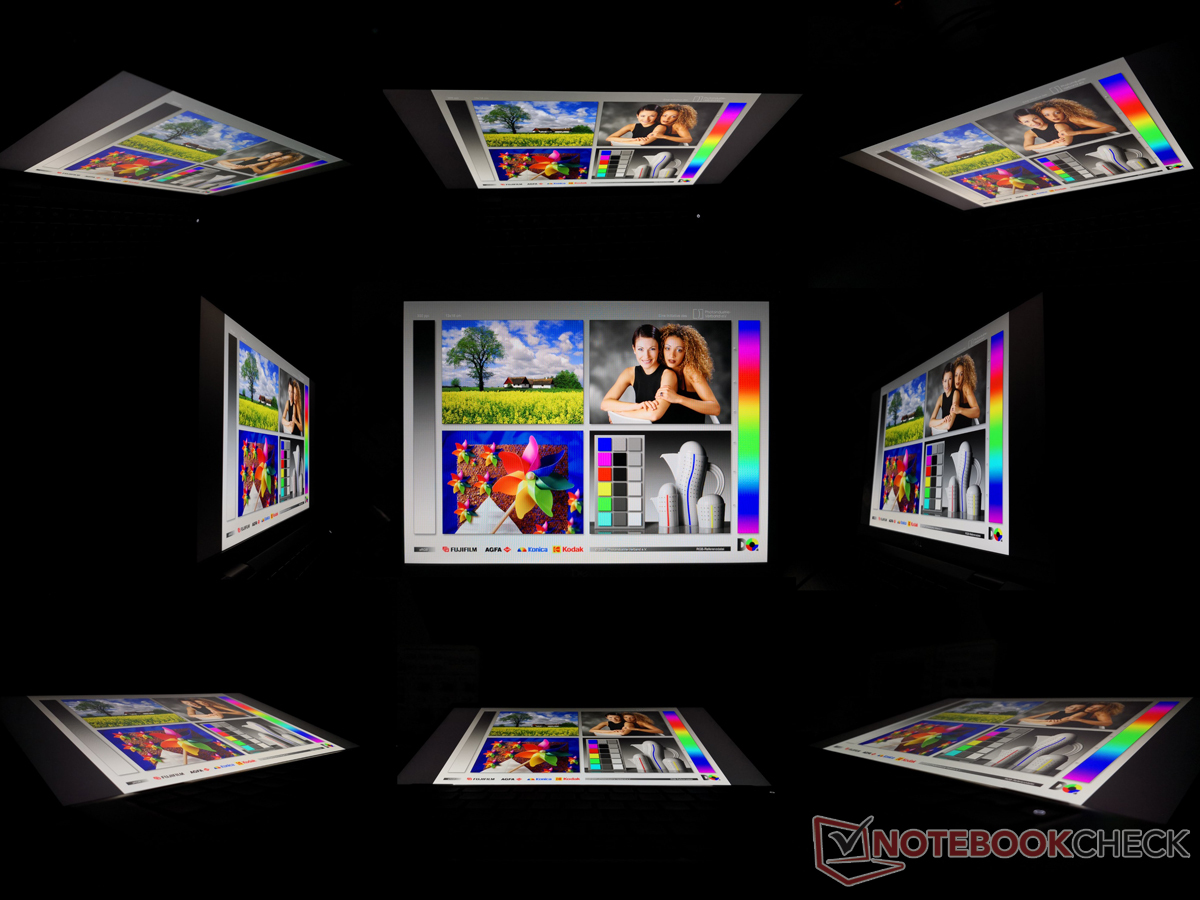
Beeldscherm - geen OLED of snelle verversingssnelheid
Er zijn vier weergave-opties beschikbaar, als volgt van slechtst naar best
- Non-touch, 250 nits, ~60% sRGB
- Aanraakscherm, 300 nits, ~60% sRGB
- Niet-aanraak, 400 nits, 100% sRGB, weinig blauw licht, laag stroomverbruik
- Niet-aanraking, 400 nits, 100% sRGB, weinig blauw licht, laag stroomverbruik, ultralicht
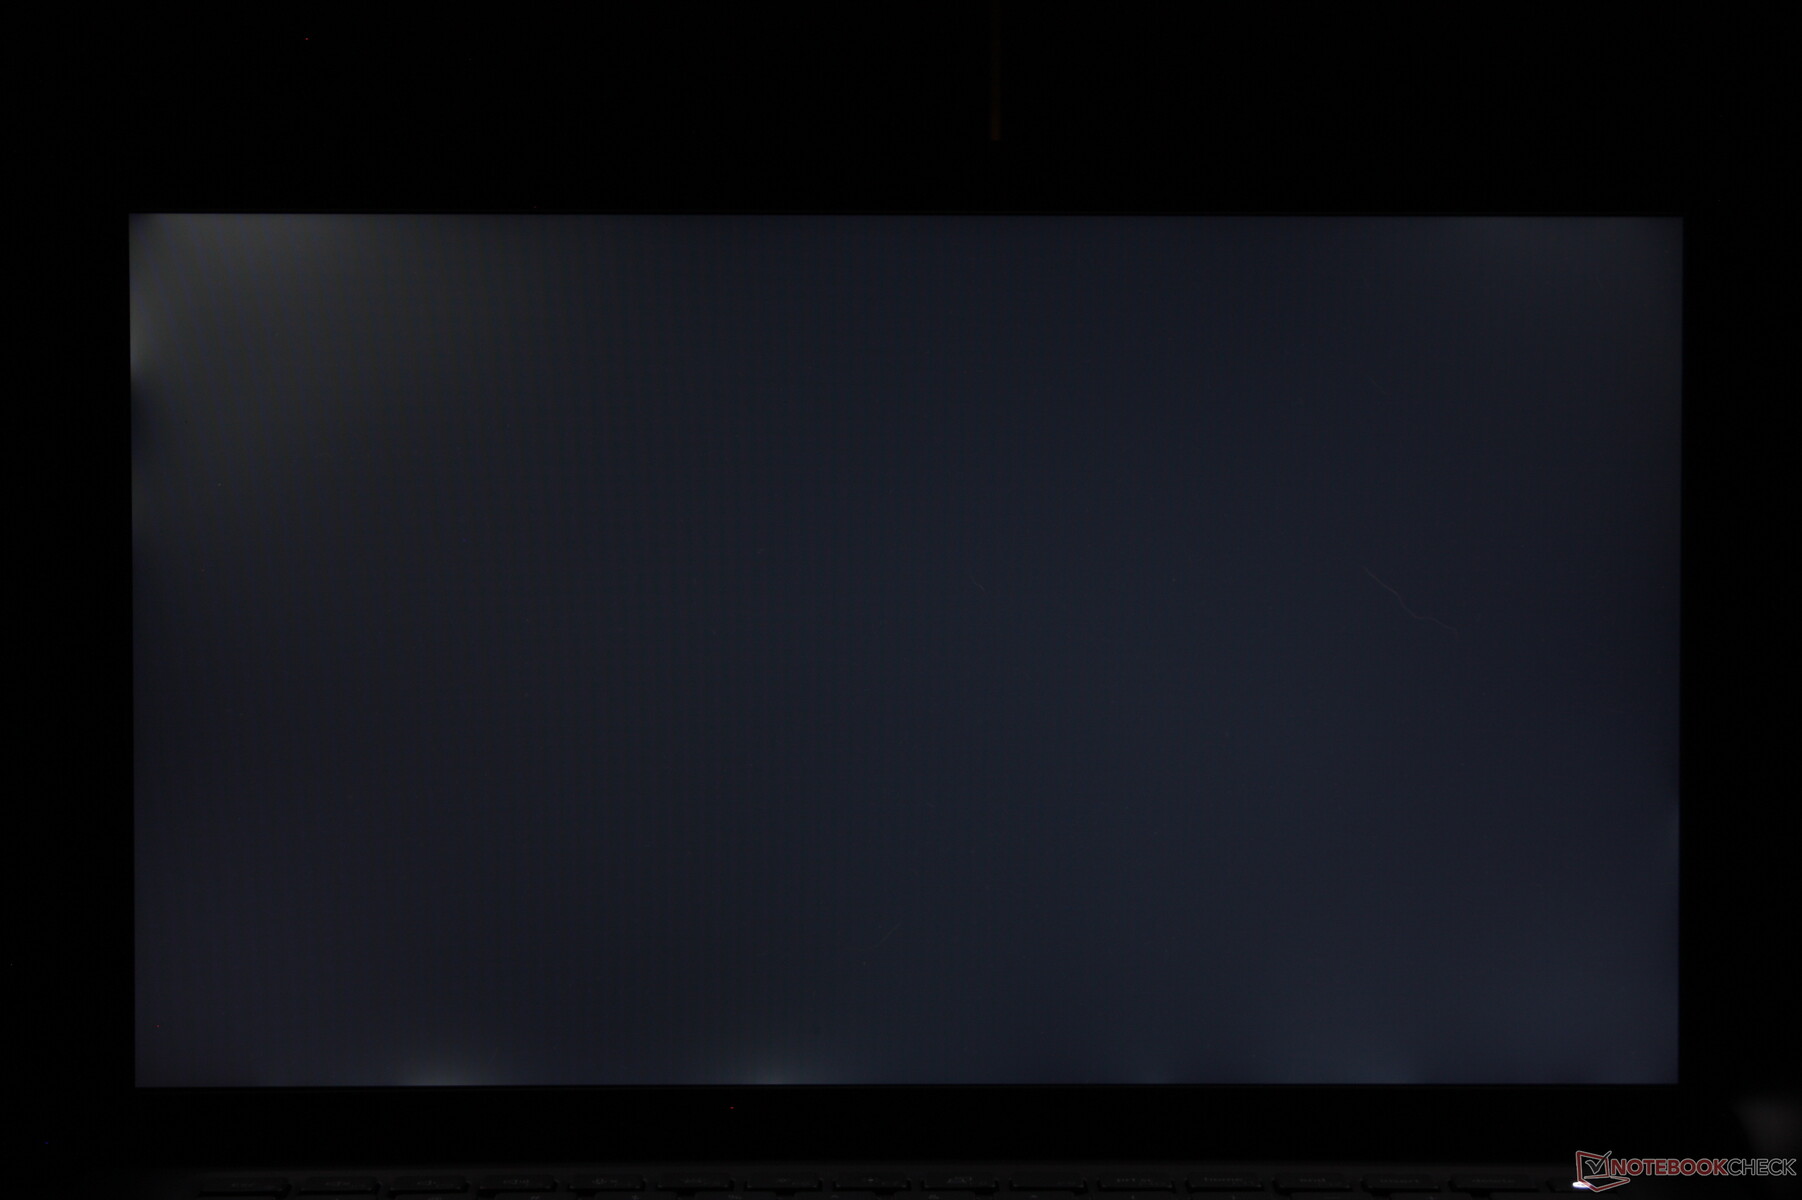
Alle opties zijn FHD, WVA/IPS, en alleen mat, wat betekent dat er geen 2K, 4K, OLED of glanzende alternatieven zijn. We raden aan om het eerste paneel te vermijden, vanwege de zwakke achtergrondverlichting en het zeer smalle kleurbereik. Onze specifieke testeenheid is uitgerust met de vierde optie hierboven.
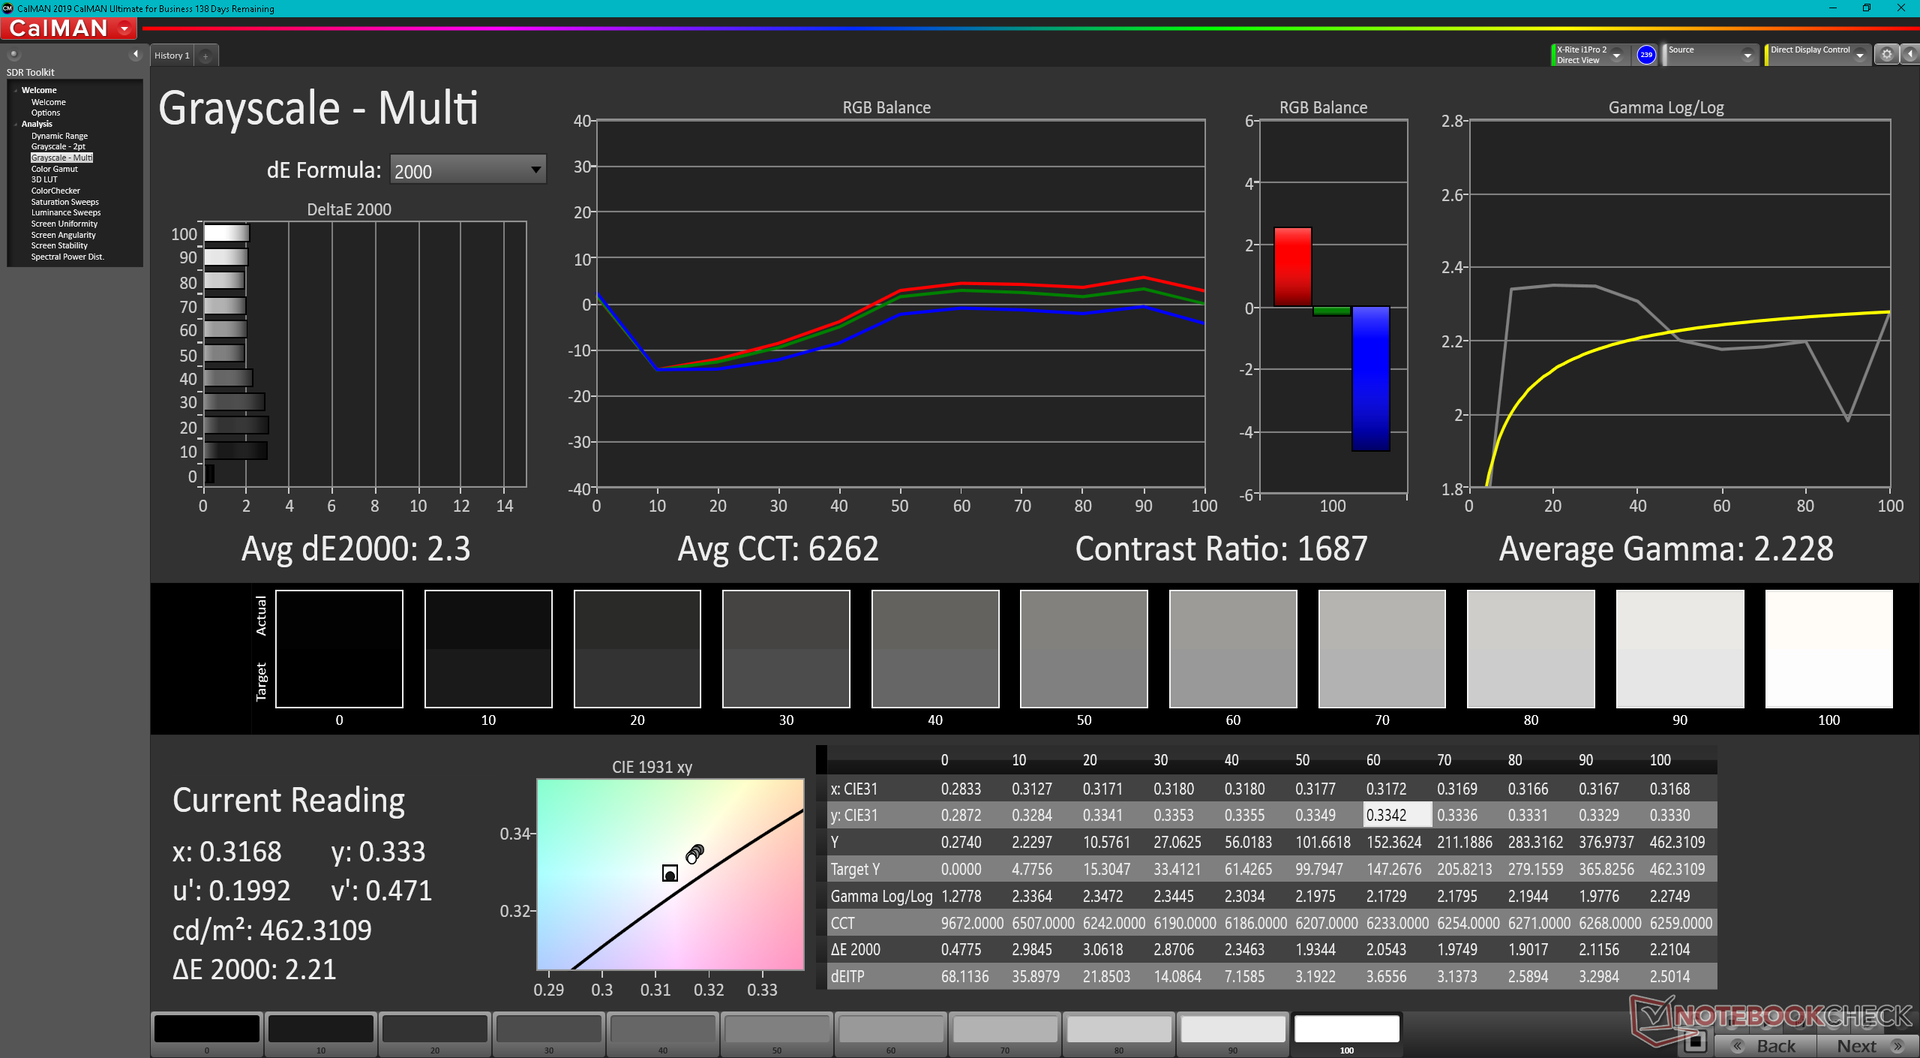
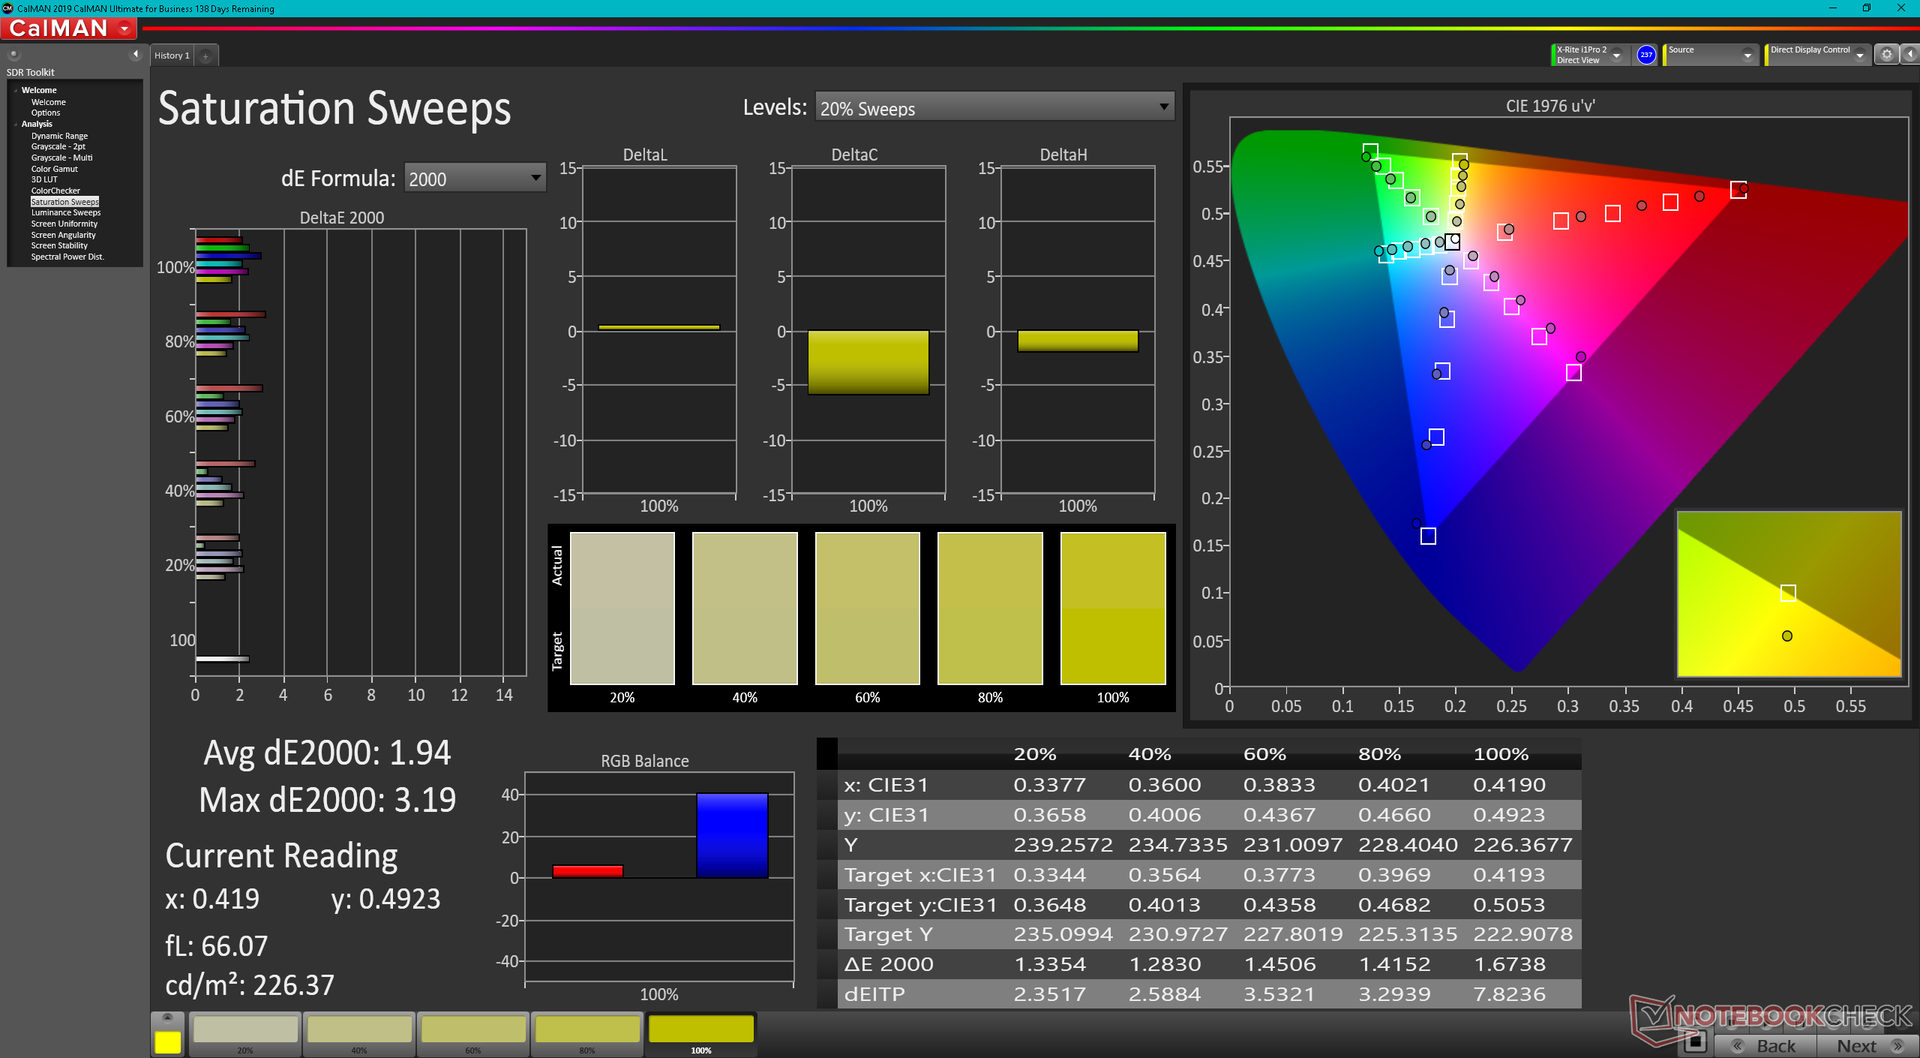
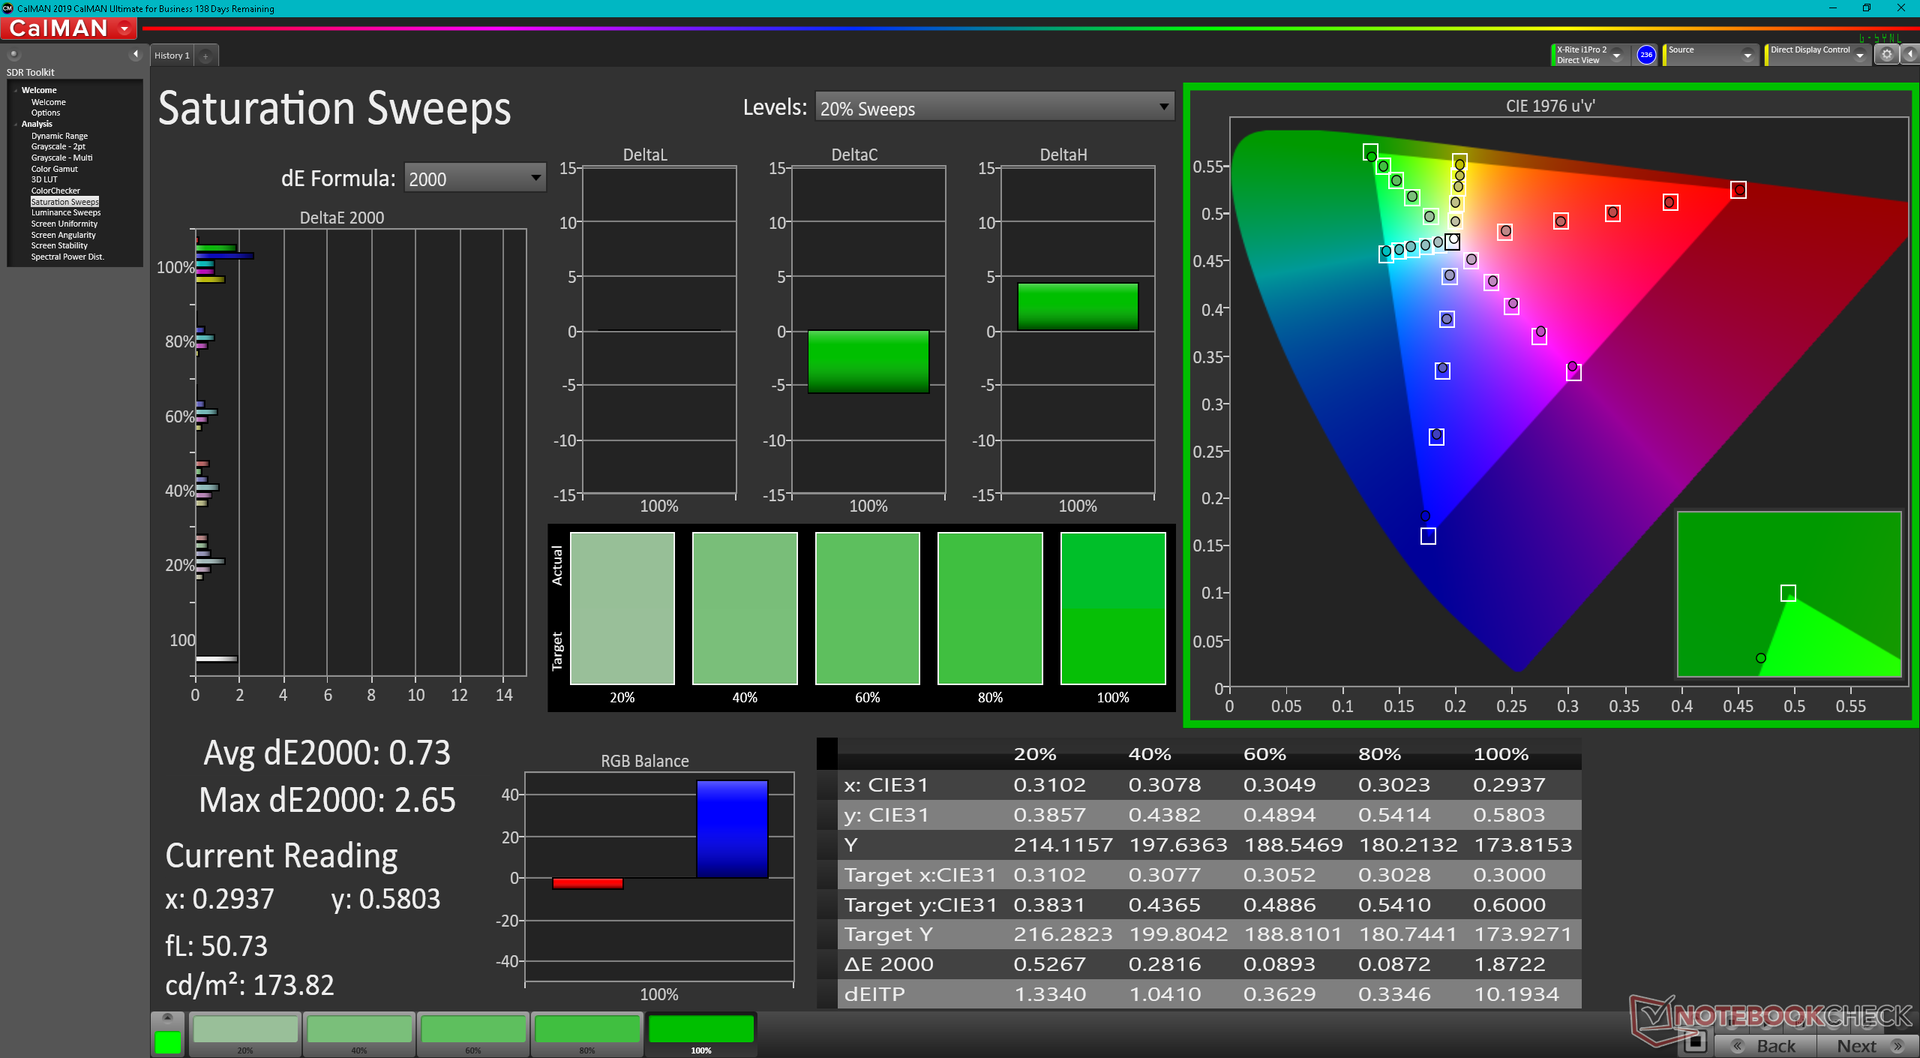
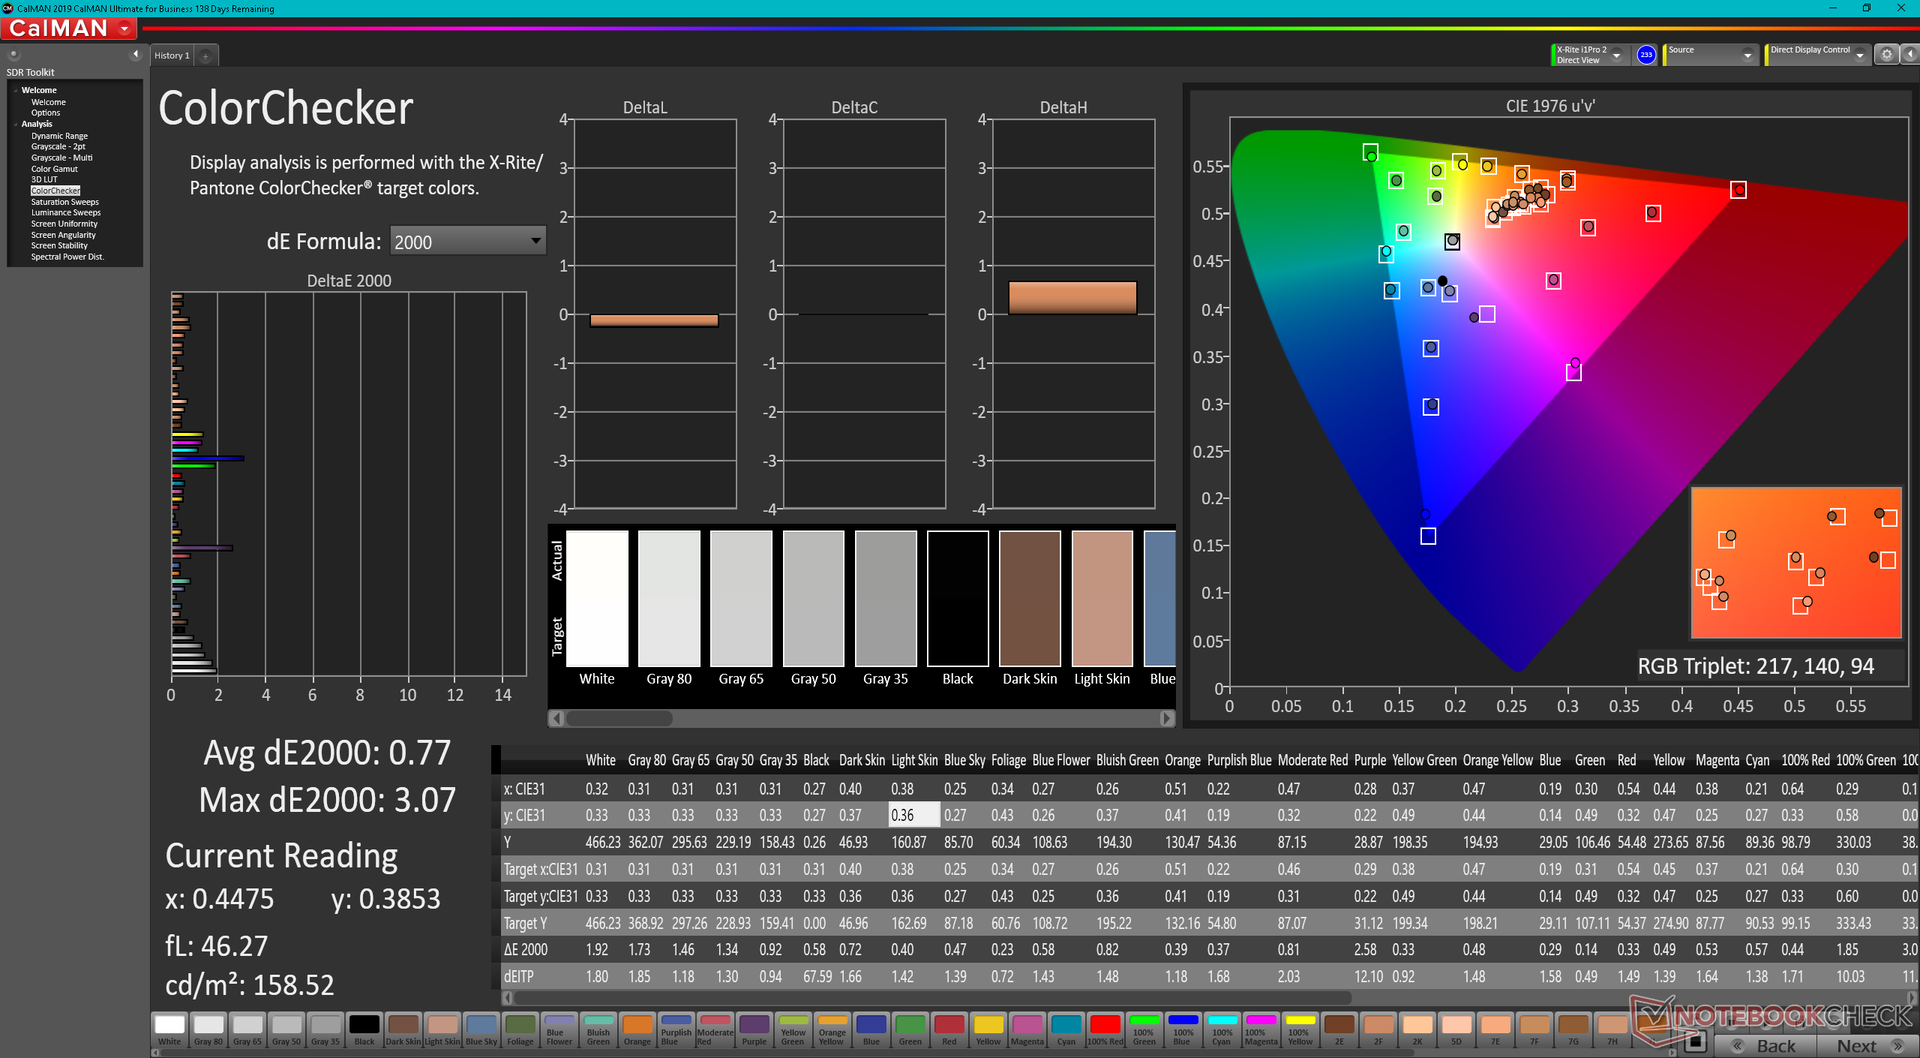
Onze onafhankelijke metingen tonen een iets kleinere sRGB-dekking van 93 procent, maar een iets helderdere gemiddelde maximale helderheid van 445 nits. Het is nog steeds een kwaliteitsscherm gezien de hoge contrastverhouding van meer dan 1000:1, maar we hopen dat toekomstige SKU's OLED zullen bevatten voor snellere zwart-wit en grijs-grijs reactietijden of op zijn minst panelen met een hogere verversingssnelheid voor een vloeiendere UI.
| |||||||||||||||||||||||||
Helderheidsverdeling: 89 %
Helderheid in Batterij-modus: 460.1 cd/m²
Contrast: 1484:1 (Zwart: 0.31 cd/m²)
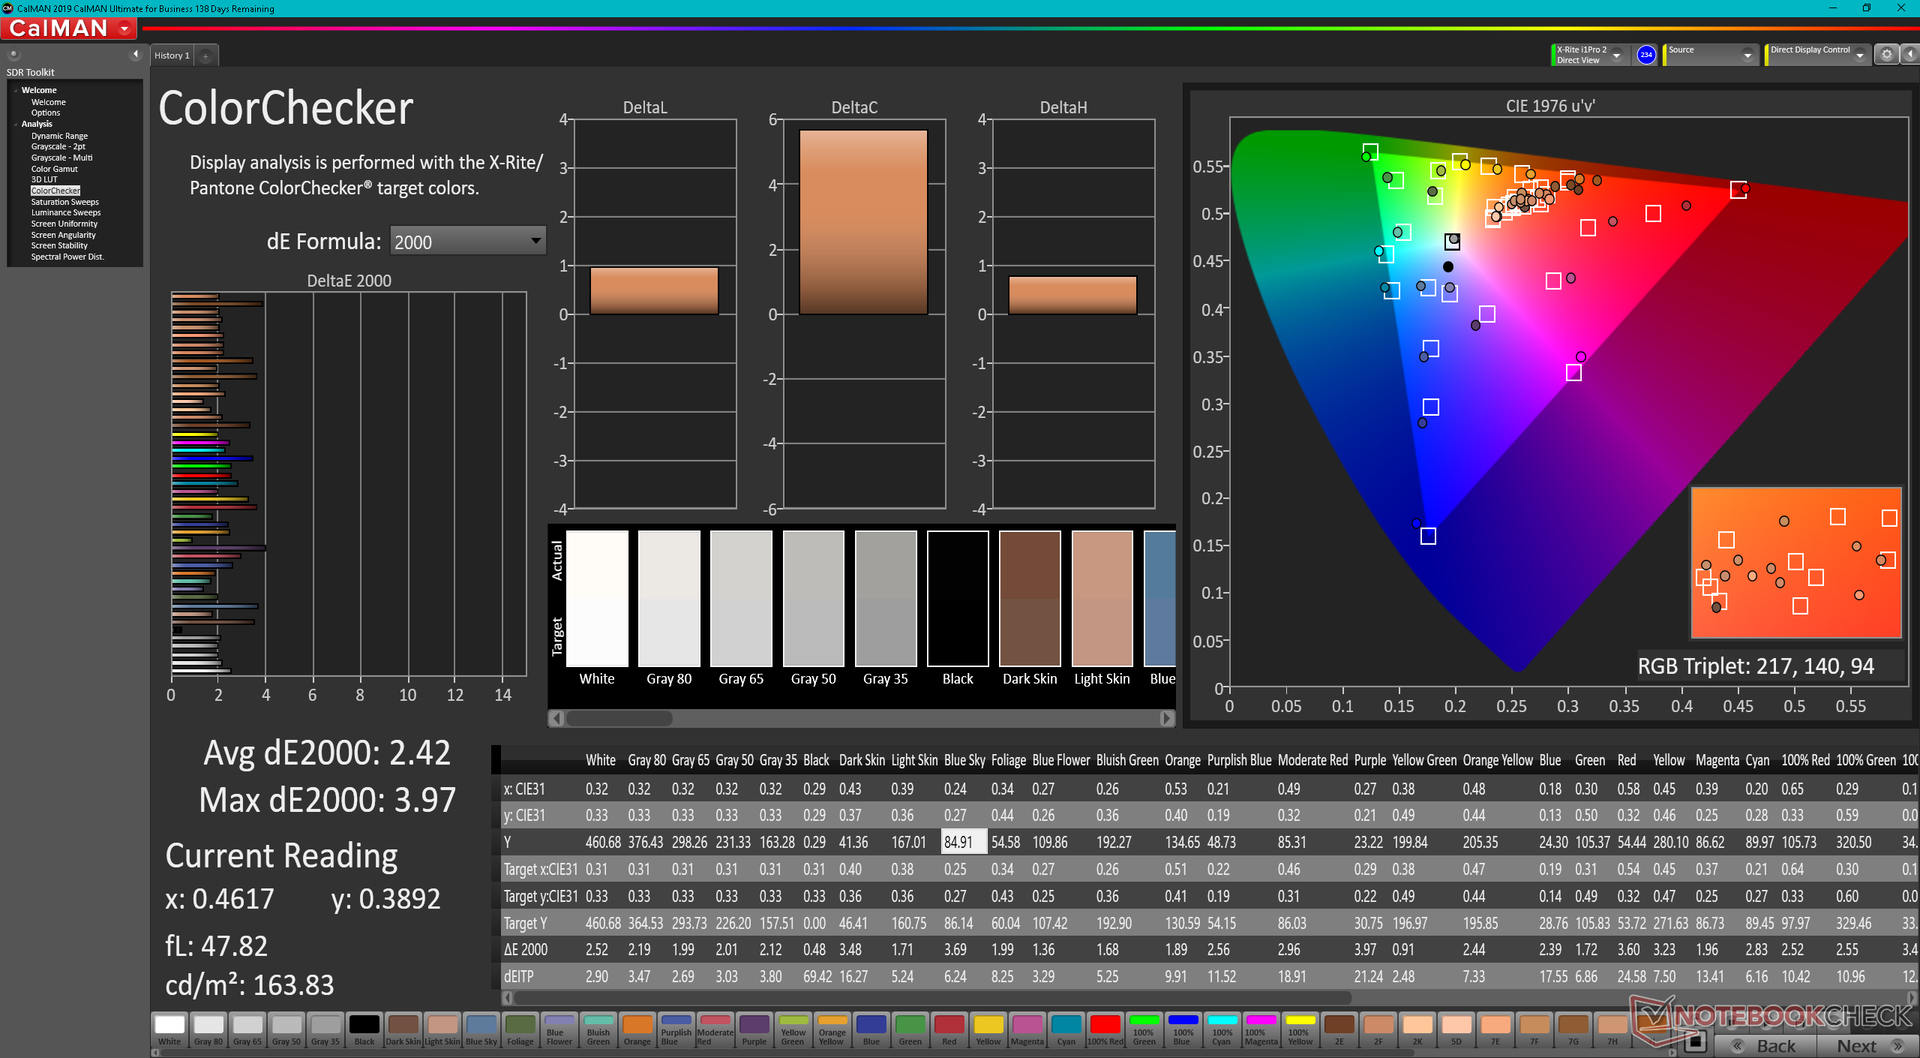
ΔE ColorChecker Calman: 2.42 | ∀{0.5-29.43 Ø4.71}
calibrated: 0.77
ΔE Greyscale Calman: 2.3 | ∀{0.09-98 Ø4.96}
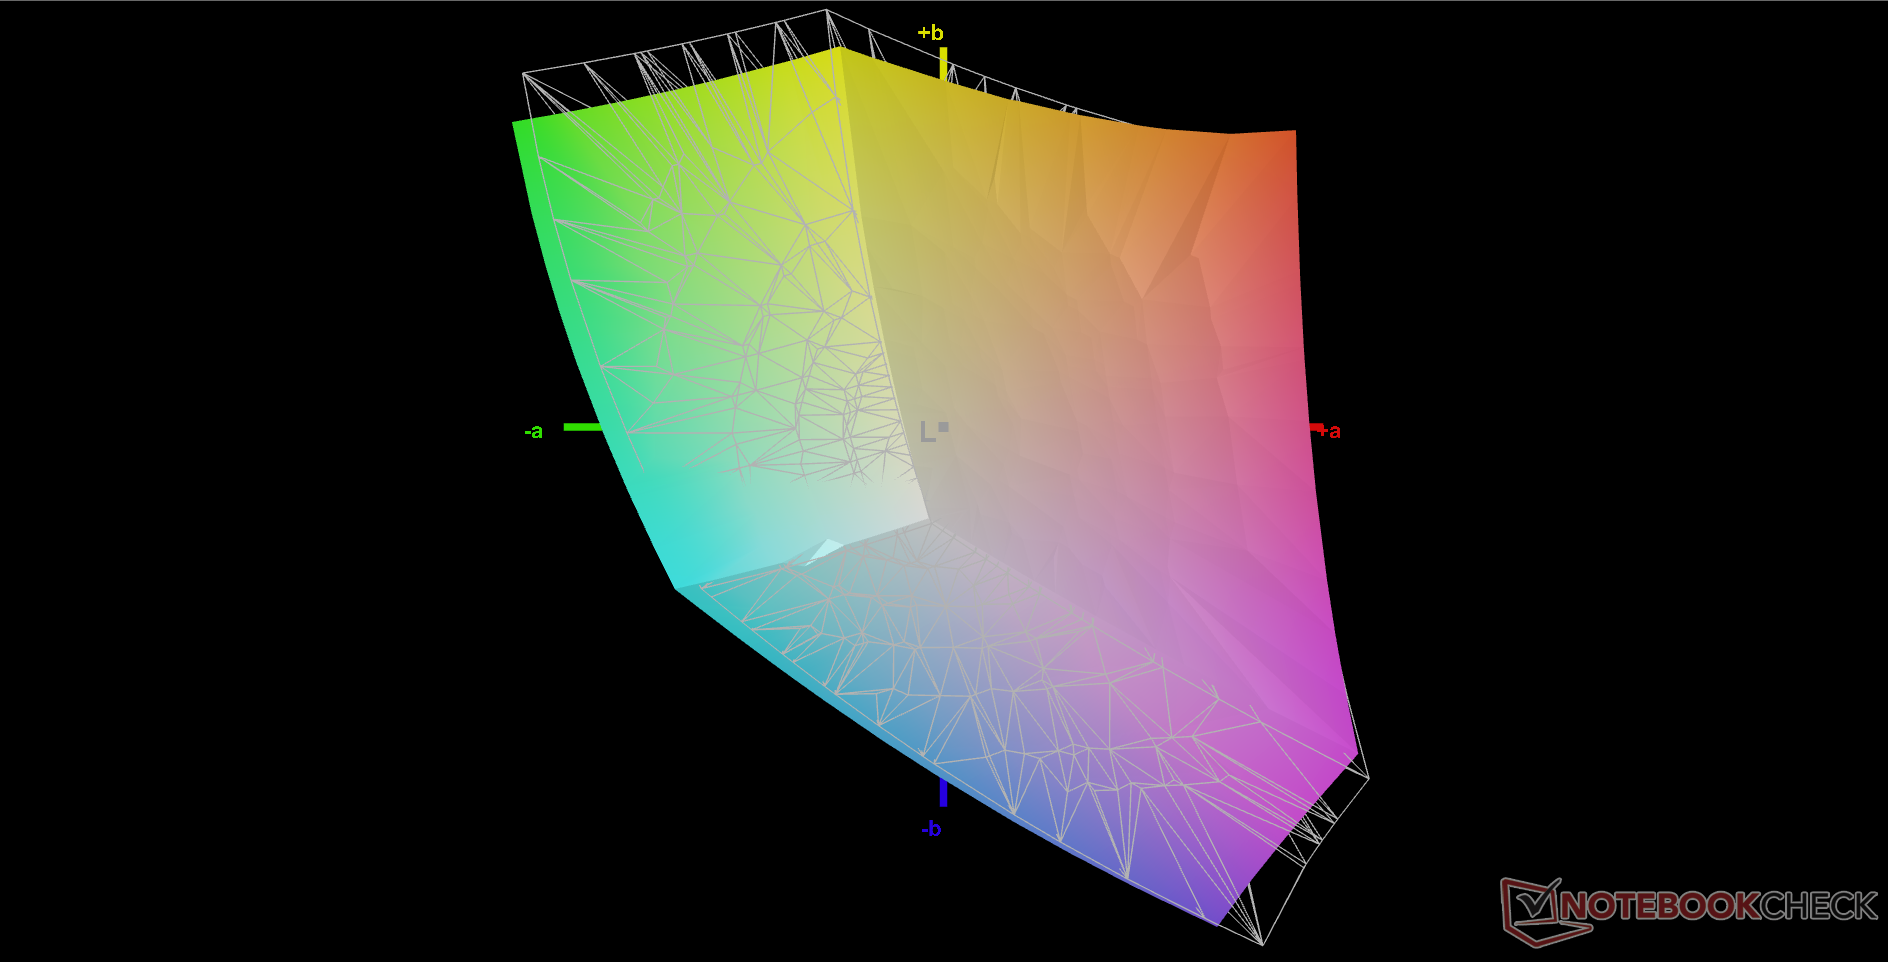
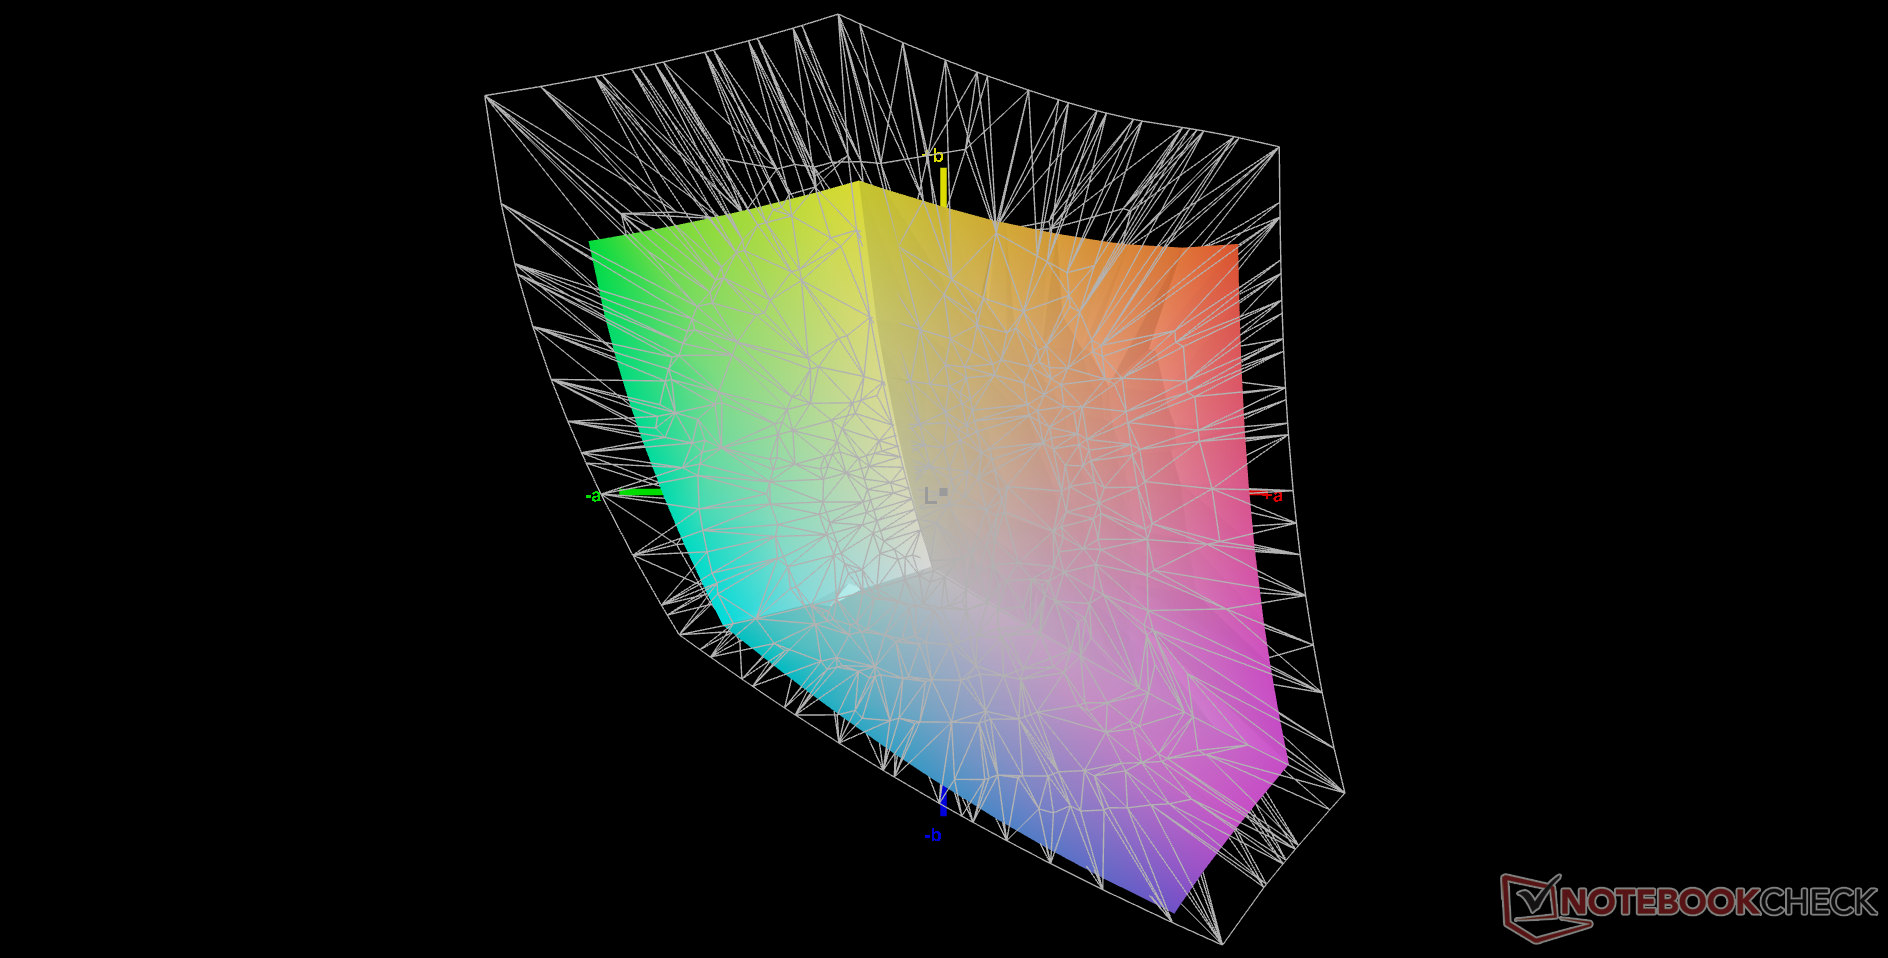
68.2% AdobeRGB 1998 (Argyll 3D)
93.5% sRGB (Argyll 3D)
66.1% Display P3 (Argyll 3D)
Gamma: 2.23
CCT: 6262 K
| Dell Latitude 13 7330 LG Philips 133WF9, IPS, 1920x1080, 13.3" | Lenovo ThinkPad X13 Yoga 20SX0004GE N133HCG-GR3, IPS, 1920x1080, 13.3" | Framework Laptop 13.5 12th Gen Intel BOE CQ NE135FBM-N41, IPS, 2256x1504, 13.5" | Razer Book 13 FHD Sharp LQ134N1JW48, IPS, 1920x1200, 13.4" | Dell Latitude 7310 AU Optronics B133HAN, IPS, 1920x1080, 13.3" | Microsoft Surface Laptop 4 13 i7 LQ135P1JX51, IPS, 2256x1504, 13.5" | |
|---|---|---|---|---|---|---|
| Display | 3% | 5% | 6% | 7% | 0% | |
| Display P3 Coverage (%) | 66.1 | 67.2 2% | 69.9 6% | 70.1 6% | 71.8 9% | 64.7 -2% |
| sRGB Coverage (%) | 93.5 | 98.1 5% | 99.4 6% | 99.3 6% | 99.3 6% | 97.2 4% |
| AdobeRGB 1998 Coverage (%) | 68.2 | 69 1% | 71.1 4% | 71.6 5% | 72.4 6% | 66.9 -2% |
| Response Times | -6% | 18% | -24% | 10% | -32% | |
| Response Time Grey 50% / Grey 80% * (ms) | 48.4 ? | 56 ? -16% | 34.7 ? 28% | 56.8 ? -17% | 40.8 ? 16% | 62.8 ? -30% |
| Response Time Black / White * (ms) | 29.6 ? | 28 ? 5% | 27.5 ? 7% | 38.8 ? -31% | 28.8 ? 3% | 39.8 ? -34% |
| PWM Frequency (Hz) | 2475 ? | 21930 ? | ||||
| Screen | 2% | -25% | -9% | -9% | -11% | |
| Brightness middle (cd/m²) | 460.1 | 401 -13% | 449.6 -2% | 545.3 19% | 332.7 -28% | 413 -10% |
| Brightness (cd/m²) | 445 | 383 -14% | 431 -3% | 507 14% | 329 -26% | 400 -10% |
| Brightness Distribution (%) | 89 | 91 2% | 90 1% | 88 -1% | 89 0% | 94 6% |
| Black Level * (cd/m²) | 0.31 | 0.16 48% | 0.31 -0% | 0.31 -0% | 0.25 19% | 0.29 6% |
| Contrast (:1) | 1484 | 2506 69% | 1450 -2% | 1759 19% | 1331 -10% | 1424 -4% |
| Colorchecker dE 2000 * | 2.42 | 2.6 -7% | 2.76 -14% | 1.39 43% | 2.15 11% | 2.8 -16% |
| Colorchecker dE 2000 max. * | 3.97 | 4.2 -6% | 7.96 -101% | 2.61 34% | 3.89 2% | 7.2 -81% |
| Colorchecker dE 2000 calibrated * | 0.77 | 0.9 -17% | 0.58 25% | 2.72 -253% | 1.09 -42% | 0.8 -4% |
| Greyscale dE 2000 * | 2.3 | 3.3 -43% | 5.2 -126% | 1.3 43% | 2.5 -9% | 1.9 17% |
| Gamma | 2.23 99% | 2.01 109% | 2.23 99% | 2.2 100% | 2.3 96% | 2.12 104% |
| CCT | 6262 104% | 6076 107% | 6475 100% | 6476 100% | 6347 102% | 6510 100% |
| Color Space (Percent of AdobeRGB 1998) (%) | 62.7 | 65.9 | 64.1 | 61.6 | ||
| Color Space (Percent of sRGB) (%) | 98.1 | 99.6 | 99.4 | 97.2 | ||
| Totaal Gemiddelde (Programma / Instellingen) | -0% /
1% | -1% /
-12% | -9% /
-8% | 3% /
-3% | -14% /
-11% |
* ... kleiner is beter
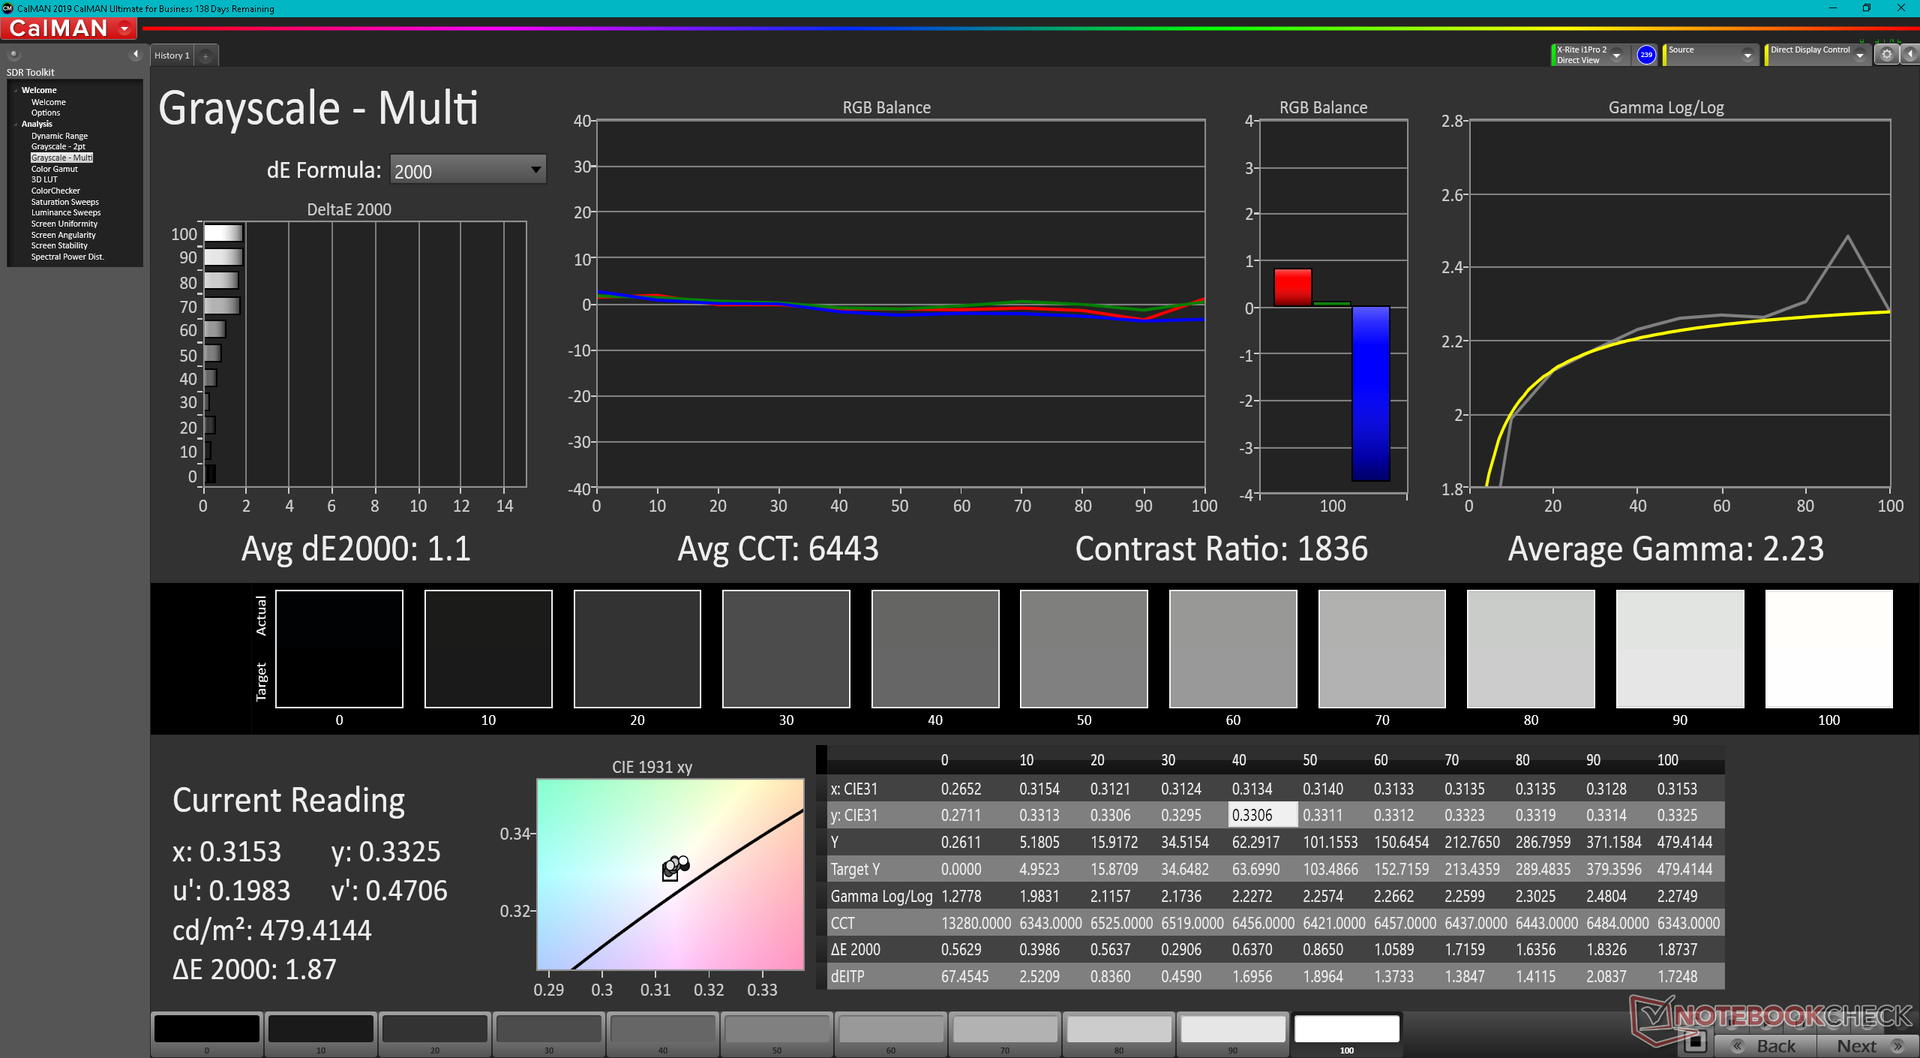
Het scherm is uit de doos goed gekalibreerd met gemiddelde grijswaarden en deltaE waarden van respectievelijk slechts 2,3 en 2,42, zoals blijkt uit onze CalMAN resultaten hieronder. Door het scherm zelf nog verder te kalibreren met een X-Rite colorimeter zouden de gemiddelde DeltaE-waarden verbeteren tot minder dan 1.
Responstijd Scherm
| ↔ Responstijd Zwart naar Wit | ||
|---|---|---|
| 29.6 ms ... stijging ↗ en daling ↘ gecombineerd | ↗ 14.8 ms stijging | 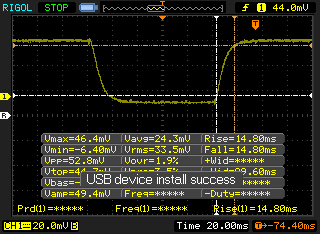 |
| ↘ 14.8 ms daling | ||
| Het scherm vertoonde relatief trage responstijden in onze tests en is misschien te traag voor games. Ter vergelijking: alle testtoestellen variëren van 0.1 (minimum) tot 240 (maximum) ms. » 79 % van alle toestellen zijn beter. Dit betekent dat de gemeten responstijd slechter is dan het gemiddelde (19.8 ms) van alle geteste toestellen. | ||
| ↔ Responstijd 50% Grijs naar 80% Grijs | ||
| 48.4 ms ... stijging ↗ en daling ↘ gecombineerd | ↗ 23.6 ms stijging | 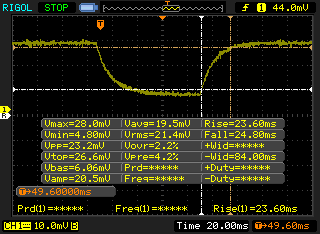 |
| ↘ 24.8 ms daling | ||
| Het scherm vertoonde trage responstijden in onze tests en is misschien te traag voor games. Ter vergelijking: alle testtoestellen variëren van 0.165 (minimum) tot 636 (maximum) ms. » 84 % van alle toestellen zijn beter. Dit betekent dat de gemeten responstijd slechter is dan het gemiddelde (31 ms) van alle geteste toestellen. | ||
Screen Flickering / PWM (Pulse-Width Modulation)
| Screen flickering / PWM niet waargenomen | 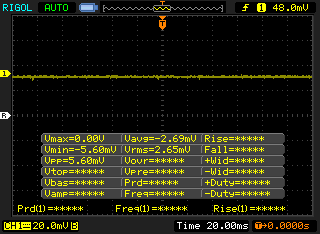 | ||
Ter vergelijking: 52 % van alle geteste toestellen maakten geen gebruik van PWM om de schermhelderheid te verlagen. Als het wel werd gebruikt, werd een gemiddelde van 7754 (minimum: 5 - maximum: 343500) Hz waargenomen. | |||
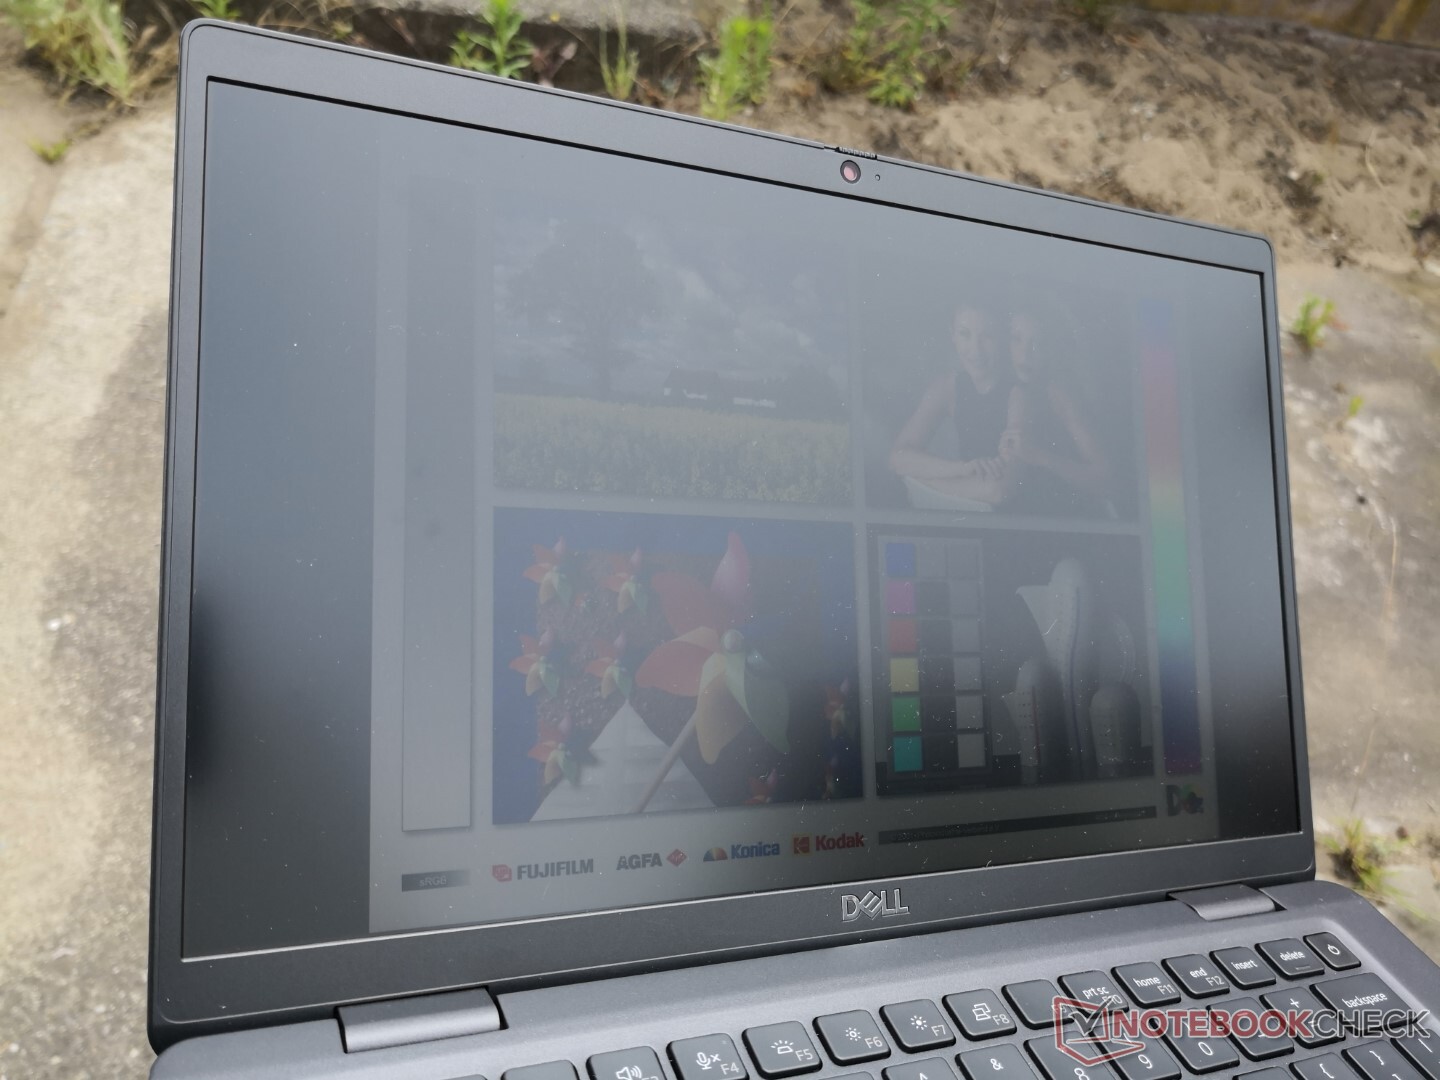
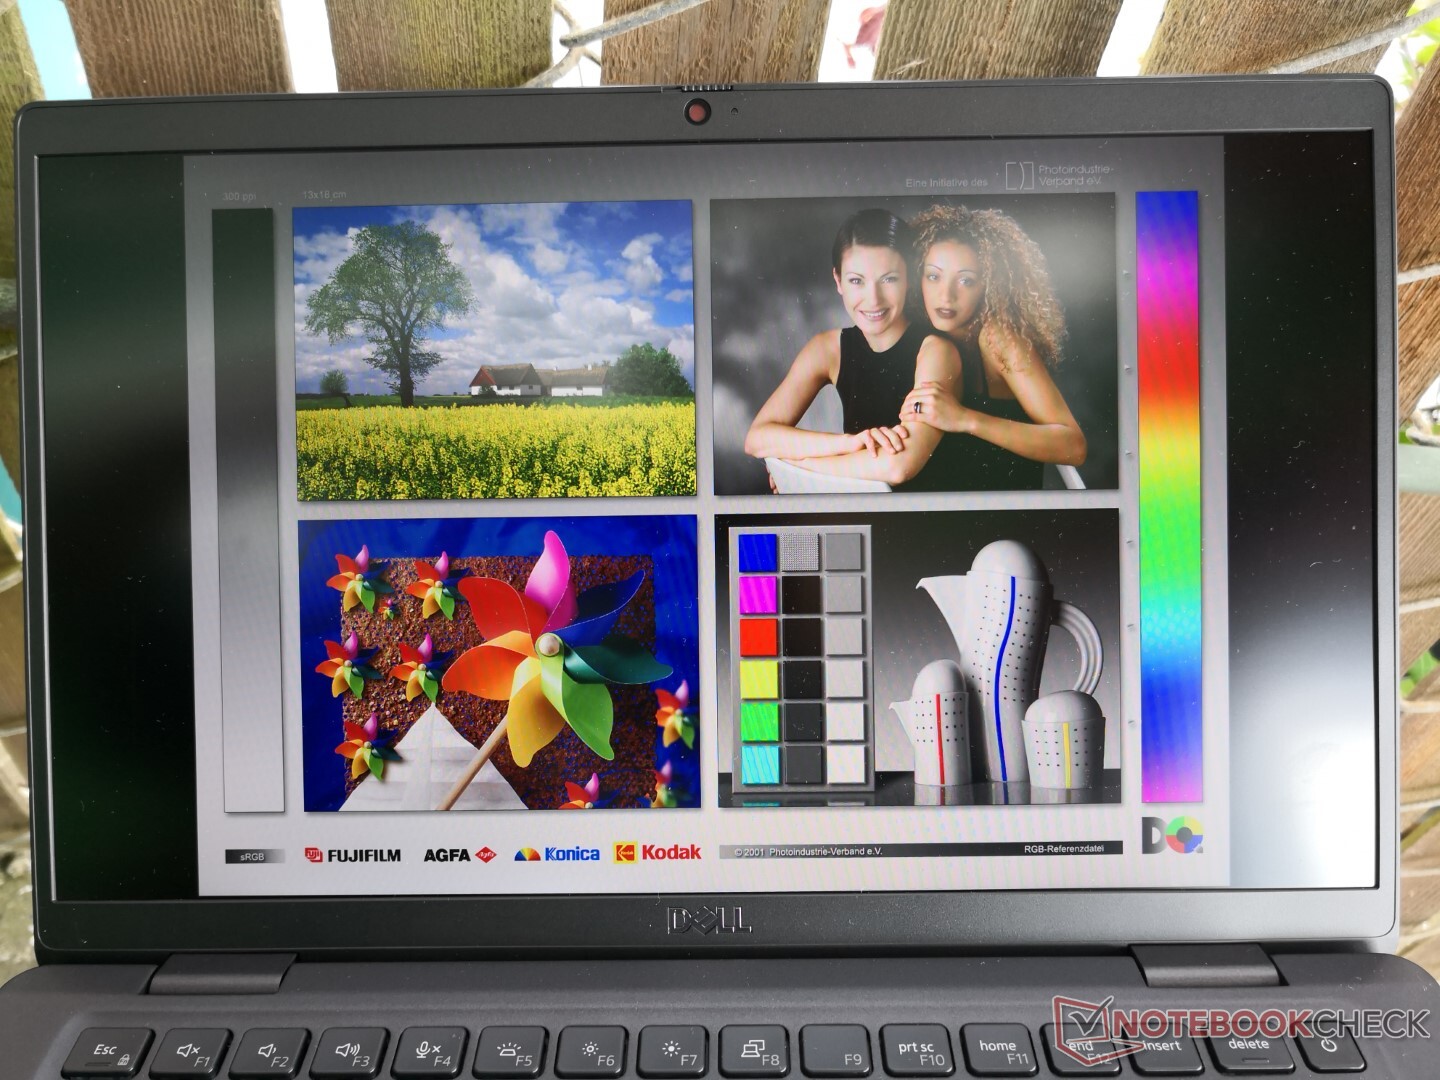
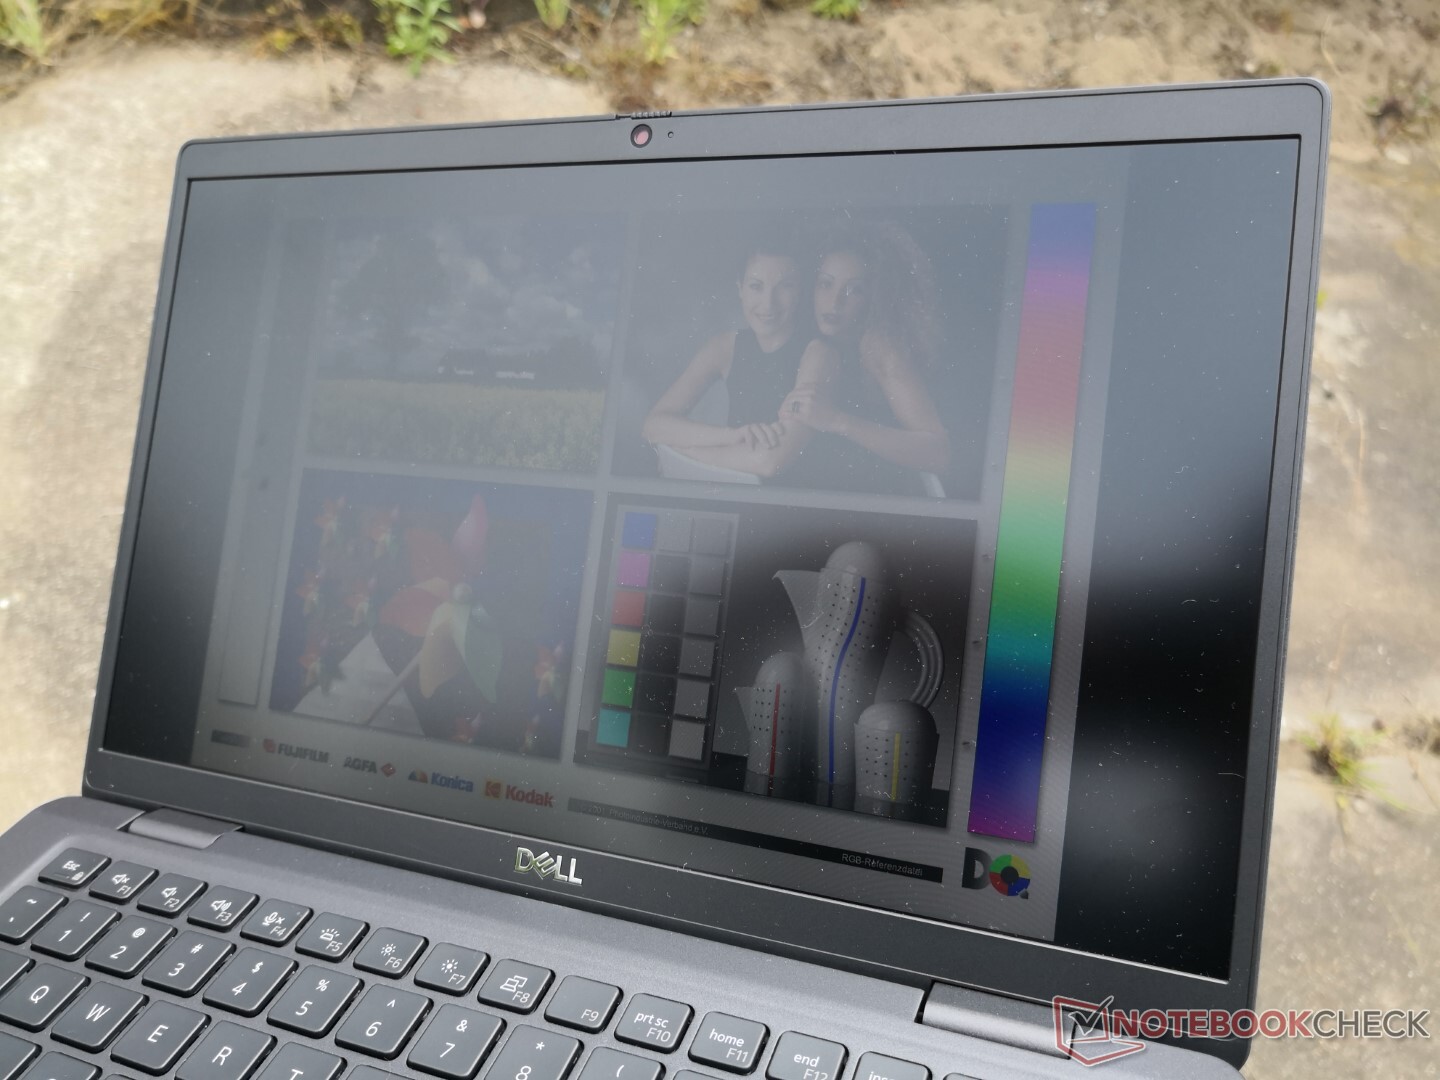
De zichtbaarheid buitenshuis is vrij goed als je in de schaduw werkt, dankzij het relatief heldere ~450-nit scherm en de matte overlay om schittering te verminderen. Het is echter nog steeds niet helder genoeg om comfortabel te kunnen kijken op zonnige of bewolkte dagen.
Prestaties - Core i7-1265U maakt indruk
Testomstandigheden
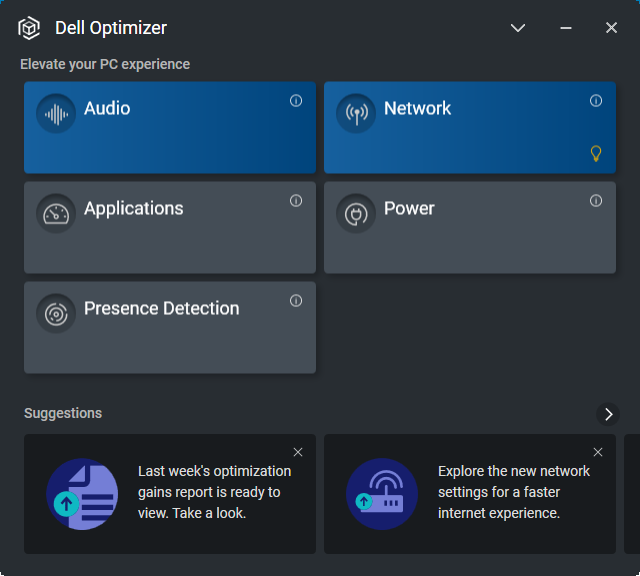
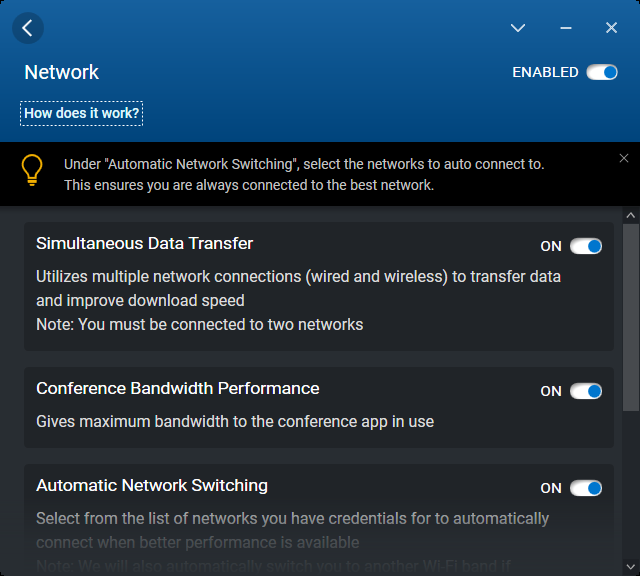
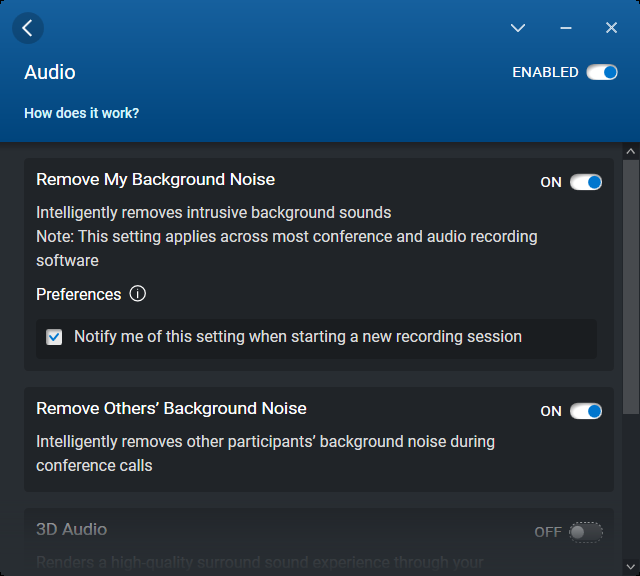
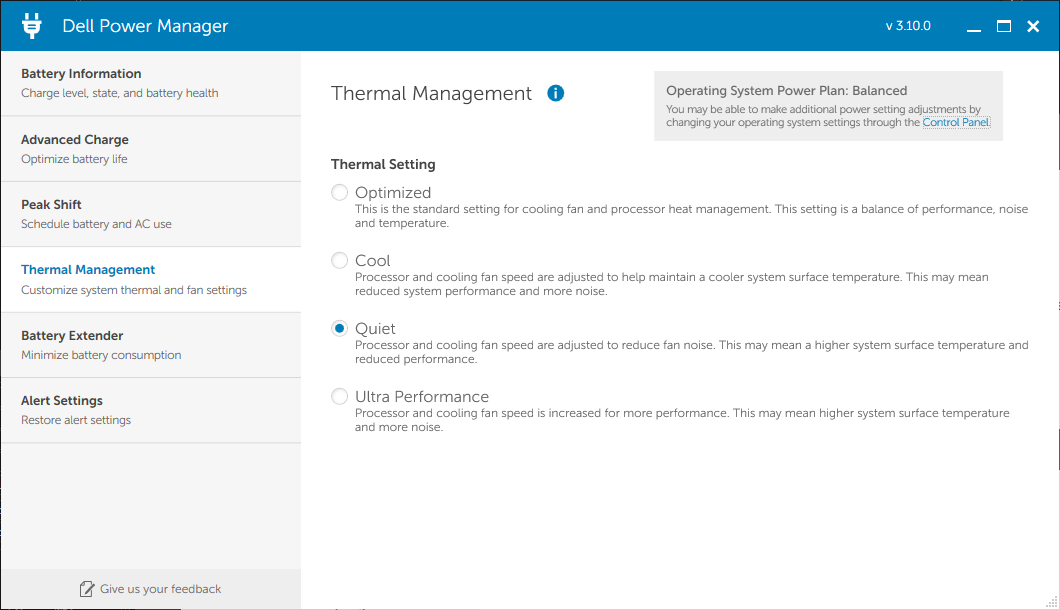
Wij hebben ons toestel ingesteld op respectievelijk de prestatiemodus en de ultra-prestatiemodus in Windows en de Dell Power Manager-software, voordat wij onderstaande benchmarks uitvoerden. Wij raden eigenaars aan vertrouwd te raken met de vooraf geïnstalleerde Dell Power Manager, Optimizer en Command applicaties, aangezien deze dienen als hubs voor het schakelen tussen modelspecifieke updates en functies.
Processor
Na teleurgesteld te zijn teleurgesteld met de Core i5-1235Uwaren onze verwachtingen niet erg hoog gespannen voor de Core i7-1265U. Gelukkig blijkt de i7-1265U een echte snelheidsduivel te zijn, ondanks het feit dat hij tot de U-serie familie behoort. De ruwe single-thread en multi-thread prestaties zijn 20 procent en 60 procent hoger dan de gemiddelde laptop in onze database die is uitgerust met de laatste generatie Core i7-1165G7. In feite ligt de CPU slechts zo'n 10 tot 25 procent achter op de meer veeleisende Core i7-1260P. Sommige high-end AMD CPU's zoals de Ryzen 7 5700U of5800U kunnen de Core i7-1265U evenaren of overtreffen in multi-threaded werkbelastingen, maar ze blijven achter in single-threaded bewerkingen
De duurzaamheid van de prestaties is goed, maar het kan zeker beter. Het draaien van CineBench R15 xT in een loop laat een aanvankelijke score zien van 1379 punten, alvorens gestaag te dalen en te stabiliseren rond de 1000 punten, wat een prestatiedip vertegenwoordigt van ongeveer 27 procent. De beperkte koelmogelijkheden van de kleine koeloplossing verhinderen waarschijnlijk dat de CPU langere tijd op hogere kloksnelheden kan draaien.
Cinebench R15 Multi Loop
Cinebench R23: Multi Core | Single Core
Cinebench R15: CPU Multi 64Bit | CPU Single 64Bit
Blender: v2.79 BMW27 CPU
7-Zip 18.03: 7z b 4 | 7z b 4 -mmt1
Geekbench 5.5: Multi-Core | Single-Core
HWBOT x265 Benchmark v2.2: 4k Preset
LibreOffice : 20 Documents To PDF
R Benchmark 2.5: Overall mean
| Cinebench R23 / Multi Core | |
| Framework Laptop 13.5 12th Gen Intel | |
| MSI Summit E14 Flip Evo A12MT | |
| Dell Latitude 13 7330 | |
| HP Pavilion Aero 13 be0097nr | |
| Asus ZenBook 13 OLED UM325UA | |
| Gemiddeld Intel Core i7-1265U (4332 - 9219, n=10) | |
| Microsoft Surface Laptop 4 13 Ryzen 5 | |
| Razer Book 13 FHD | |
| Samsung Galaxy Book2 Pro 13 NP930XED-KA1DE | |
| Gemiddeld Intel Core i7-1165G7 (2525 - 6862, n=64) | |
| Gateway Ultra Slim 14.1 GWTC51427 | |
| Dell Latitude 5320-TM4V2 | |
| Cinebench R23 / Single Core | |
| MSI Summit E14 Flip Evo A12MT | |
| Dell Latitude 13 7330 | |
| Framework Laptop 13.5 12th Gen Intel | |
| Gemiddeld Intel Core i7-1265U (1144 - 1820, n=10) | |
| Gateway Ultra Slim 14.1 GWTC51427 | |
| Gemiddeld Intel Core i7-1165G7 (1110 - 1539, n=59) | |
| HP Pavilion Aero 13 be0097nr | |
| Dell Latitude 5320-TM4V2 | |
| Asus ZenBook 13 OLED UM325UA | |
| Microsoft Surface Laptop 4 13 Ryzen 5 | |
| Samsung Galaxy Book2 Pro 13 NP930XED-KA1DE | |
| HWBOT x265 Benchmark v2.2 / 4k Preset | |
| MSI Summit E14 Flip Evo A12MT | |
| Framework Laptop 13.5 12th Gen Intel | |
| HP Pavilion Aero 13 be0097nr | |
| Dell Latitude 13 7330 | |
| Asus ZenBook 13 OLED UM325UA | |
| Gemiddeld Intel Core i7-1265U (5.09 - 10.6, n=10) | |
| Razer Book 13 FHD | |
| Microsoft Surface Laptop 4 13 Ryzen 5 | |
| Samsung Galaxy Book2 Pro 13 NP930XED-KA1DE | |
| Gemiddeld Intel Core i7-1165G7 (1.39 - 8.47, n=80) | |
| Gateway Ultra Slim 14.1 GWTC51427 | |
| Asus Zenbook S UX393JA | |
| Dell Latitude 7310 | |
| Lenovo ThinkPad X13 Yoga 20SX0004GE | |
| Dell XPS 13 9300 i5 FHD | |
Cinebench R23: Multi Core | Single Core
Cinebench R15: CPU Multi 64Bit | CPU Single 64Bit
Blender: v2.79 BMW27 CPU
7-Zip 18.03: 7z b 4 | 7z b 4 -mmt1
Geekbench 5.5: Multi-Core | Single-Core
HWBOT x265 Benchmark v2.2: 4k Preset
LibreOffice : 20 Documents To PDF
R Benchmark 2.5: Overall mean
* ... kleiner is beter
AIDA64: FP32 Ray-Trace | FPU Julia | CPU SHA3 | CPU Queen | FPU SinJulia | FPU Mandel | CPU AES | CPU ZLib | FP64 Ray-Trace | CPU PhotoWorxx
| Performance rating | |
| Microsoft Surface Laptop 4 13 Ryzen 5 | |
| Framework Laptop 13.5 12th Gen Intel | |
| Dell Latitude 13 7330 | |
| Dell Latitude 7310 | |
| Lenovo ThinkPad X13 Yoga 20SX0004GE | |
| AIDA64 / FP32 Ray-Trace | |
| Microsoft Surface Laptop 4 13 Ryzen 5 | |
| Dell Latitude 13 7330 | |
| Framework Laptop 13.5 12th Gen Intel | |
| Dell Latitude 7310 | |
| Lenovo ThinkPad X13 Yoga 20SX0004GE | |
| AIDA64 / FPU Julia | |
| Microsoft Surface Laptop 4 13 Ryzen 5 | |
| Dell Latitude 13 7330 | |
| Framework Laptop 13.5 12th Gen Intel | |
| Dell Latitude 7310 | |
| Lenovo ThinkPad X13 Yoga 20SX0004GE | |
| AIDA64 / CPU SHA3 | |
| Dell Latitude 13 7330 | |
| Framework Laptop 13.5 12th Gen Intel | |
| Microsoft Surface Laptop 4 13 Ryzen 5 | |
| Lenovo ThinkPad X13 Yoga 20SX0004GE | |
| Dell Latitude 7310 | |
| AIDA64 / CPU Queen | |
| Framework Laptop 13.5 12th Gen Intel | |
| Microsoft Surface Laptop 4 13 Ryzen 5 | |
| Dell Latitude 13 7330 | |
| Dell Latitude 7310 | |
| Lenovo ThinkPad X13 Yoga 20SX0004GE | |
| AIDA64 / FPU SinJulia | |
| Microsoft Surface Laptop 4 13 Ryzen 5 | |
| Framework Laptop 13.5 12th Gen Intel | |
| Dell Latitude 13 7330 | |
| Dell Latitude 7310 | |
| Lenovo ThinkPad X13 Yoga 20SX0004GE | |
| AIDA64 / FPU Mandel | |
| Microsoft Surface Laptop 4 13 Ryzen 5 | |
| Dell Latitude 13 7330 | |
| Framework Laptop 13.5 12th Gen Intel | |
| Dell Latitude 7310 | |
| Lenovo ThinkPad X13 Yoga 20SX0004GE | |
| AIDA64 / CPU AES | |
| Framework Laptop 13.5 12th Gen Intel | |
| Dell Latitude 13 7330 | |
| Microsoft Surface Laptop 4 13 Ryzen 5 | |
| Lenovo ThinkPad X13 Yoga 20SX0004GE | |
| Dell Latitude 7310 | |
| AIDA64 / CPU ZLib | |
| Framework Laptop 13.5 12th Gen Intel | |
| Microsoft Surface Laptop 4 13 Ryzen 5 | |
| Dell Latitude 13 7330 | |
| Lenovo ThinkPad X13 Yoga 20SX0004GE | |
| Dell Latitude 7310 | |
| AIDA64 / FP64 Ray-Trace | |
| Microsoft Surface Laptop 4 13 Ryzen 5 | |
| Dell Latitude 13 7330 | |
| Framework Laptop 13.5 12th Gen Intel | |
| Dell Latitude 7310 | |
| Lenovo ThinkPad X13 Yoga 20SX0004GE | |
| AIDA64 / CPU PhotoWorxx | |
| Framework Laptop 13.5 12th Gen Intel | |
| Dell Latitude 13 7330 | |
| Dell Latitude 7310 | |
| Microsoft Surface Laptop 4 13 Ryzen 5 | |
| Lenovo ThinkPad X13 Yoga 20SX0004GE | |
Systeemprestaties
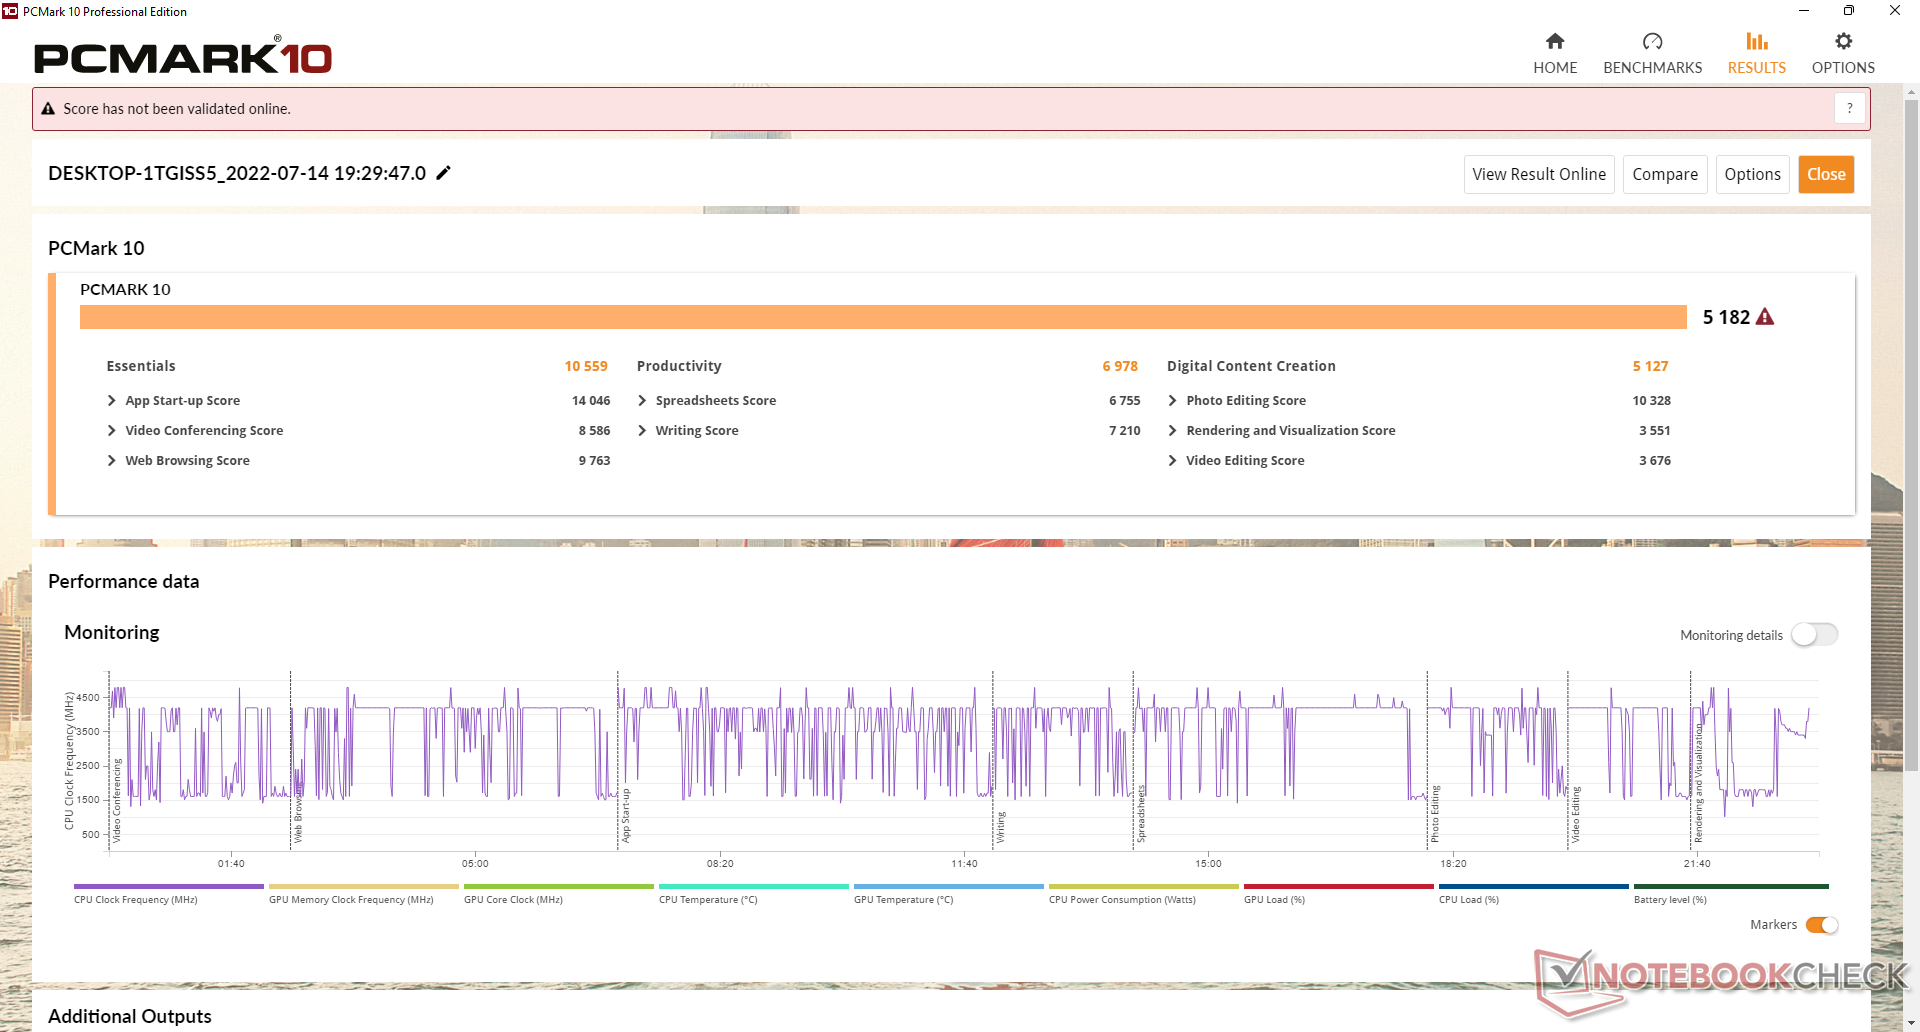
PCMark scores zijn hoger dan op veel andere zakelijke laptops die draaien op de laatste generatie of oudere CPU's, zoals deMicrosoft Surface Laptop 4 of vooral de Latitude 7310. DeRazer Book 13 komt heel dicht in de buurt door zijn snellere SSD en geïntegreerde grafische prestaties.
CrossMark: Overall | Productivity | Creativity | Responsiveness
| PCMark 10 / Score | |
| Framework Laptop 13.5 12th Gen Intel | |
| Gemiddeld Intel Core i7-1265U, Intel Iris Xe Graphics G7 96EUs (4753 - 5766, n=7) | |
| Dell Latitude 13 7330 | |
| Razer Book 13 FHD | |
| Microsoft Surface Laptop 4 13 Ryzen 5 | |
| Dell Latitude 7310 | |
| Lenovo ThinkPad X13 Yoga 20SX0004GE | |
| PCMark 10 / Essentials | |
| Framework Laptop 13.5 12th Gen Intel | |
| Dell Latitude 13 7330 | |
| Gemiddeld Intel Core i7-1265U, Intel Iris Xe Graphics G7 96EUs (9278 - 11418, n=7) | |
| Razer Book 13 FHD | |
| Lenovo ThinkPad X13 Yoga 20SX0004GE | |
| Dell Latitude 7310 | |
| Microsoft Surface Laptop 4 13 Ryzen 5 | |
| PCMark 10 / Productivity | |
| Dell Latitude 7310 | |
| Framework Laptop 13.5 12th Gen Intel | |
| Dell Latitude 13 7330 | |
| Lenovo ThinkPad X13 Yoga 20SX0004GE | |
| Razer Book 13 FHD | |
| Gemiddeld Intel Core i7-1265U, Intel Iris Xe Graphics G7 96EUs (5828 - 7311, n=7) | |
| Microsoft Surface Laptop 4 13 Ryzen 5 | |
| PCMark 10 / Digital Content Creation | |
| Framework Laptop 13.5 12th Gen Intel | |
| Gemiddeld Intel Core i7-1265U, Intel Iris Xe Graphics G7 96EUs (5127 - 6330, n=7) | |
| Razer Book 13 FHD | |
| Dell Latitude 13 7330 | |
| Microsoft Surface Laptop 4 13 Ryzen 5 | |
| Dell Latitude 7310 | |
| Lenovo ThinkPad X13 Yoga 20SX0004GE | |
| CrossMark / Overall | |
| Framework Laptop 13.5 12th Gen Intel | |
| Gemiddeld Intel Core i7-1265U, Intel Iris Xe Graphics G7 96EUs (1301 - 1615, n=7) | |
| Dell Latitude 13 7330 | |
| CrossMark / Productivity | |
| Framework Laptop 13.5 12th Gen Intel | |
| Dell Latitude 13 7330 | |
| Gemiddeld Intel Core i7-1265U, Intel Iris Xe Graphics G7 96EUs (1230 - 1586, n=7) | |
| CrossMark / Creativity | |
| Framework Laptop 13.5 12th Gen Intel | |
| Gemiddeld Intel Core i7-1265U, Intel Iris Xe Graphics G7 96EUs (1413 - 1706, n=7) | |
| Dell Latitude 13 7330 | |
| CrossMark / Responsiveness | |
| Framework Laptop 13.5 12th Gen Intel | |
| Gemiddeld Intel Core i7-1265U, Intel Iris Xe Graphics G7 96EUs (1193 - 1521, n=7) | |
| Dell Latitude 13 7330 | |
| PCMark 10 Score | 5182 punten | |
Help | ||
| AIDA64 / Memory Copy | |
| Gemiddeld Intel Core i7-1265U (40212 - 72204, n=10) | |
| Framework Laptop 13.5 12th Gen Intel | |
| Dell Latitude 13 7330 | |
| Microsoft Surface Laptop 4 13 Ryzen 5 | |
| Dell Latitude 7310 | |
| Lenovo ThinkPad X13 Yoga 20SX0004GE | |
| AIDA64 / Memory Read | |
| Gemiddeld Intel Core i7-1265U (41808 - 69493, n=10) | |
| Framework Laptop 13.5 12th Gen Intel | |
| Microsoft Surface Laptop 4 13 Ryzen 5 | |
| Dell Latitude 13 7330 | |
| Dell Latitude 7310 | |
| Lenovo ThinkPad X13 Yoga 20SX0004GE | |
| AIDA64 / Memory Write | |
| Gemiddeld Intel Core i7-1265U (41382 - 76027, n=10) | |
| Framework Laptop 13.5 12th Gen Intel | |
| Dell Latitude 13 7330 | |
| Microsoft Surface Laptop 4 13 Ryzen 5 | |
| Dell Latitude 7310 | |
| Lenovo ThinkPad X13 Yoga 20SX0004GE | |
| AIDA64 / Memory Latency | |
| Microsoft Surface Laptop 4 13 Ryzen 5 | |
| Gemiddeld Intel Core i7-1265U (74.6 - 112.4, n=10) | |
| Lenovo ThinkPad X13 Yoga 20SX0004GE | |
| Dell Latitude 7310 | |
| Framework Laptop 13.5 12th Gen Intel | |
| Dell Latitude 13 7330 | |
* ... kleiner is beter
DPC latentie
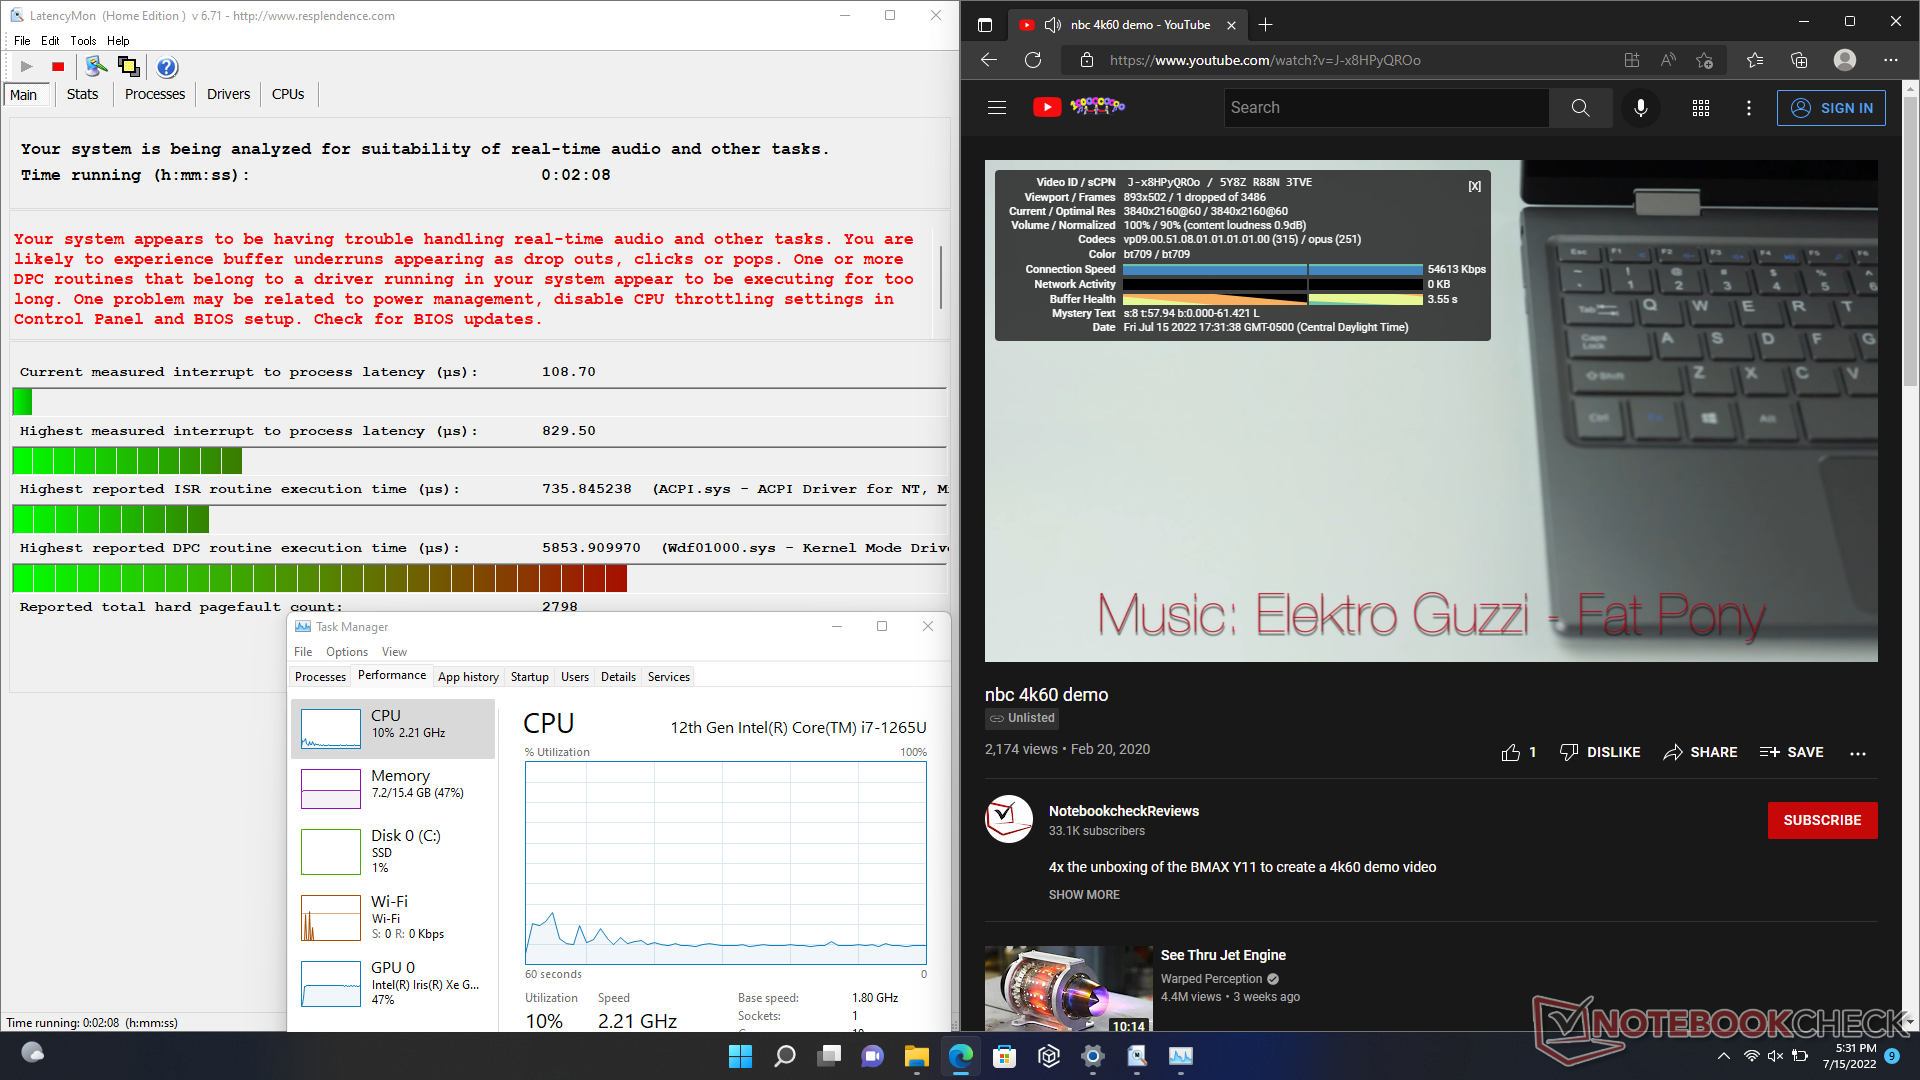
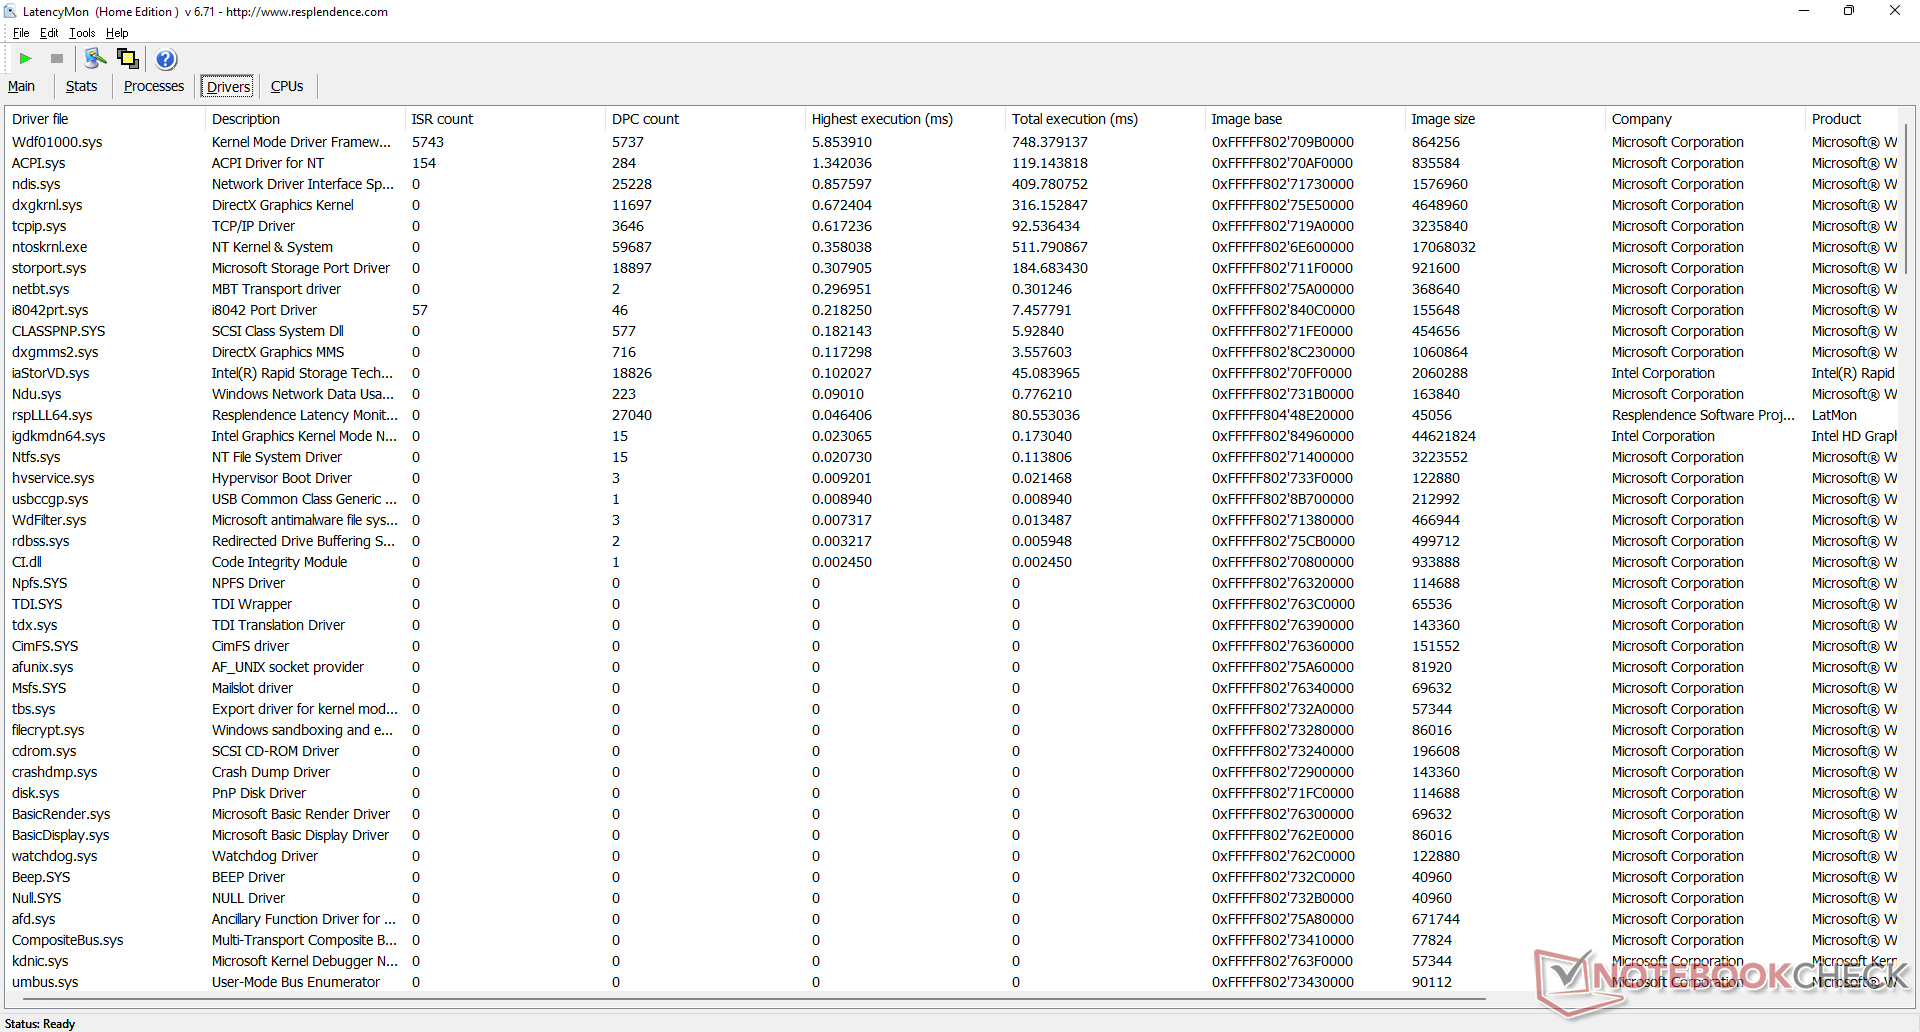
LatencyMon onthult DPC-problemen bij het openen van meerdere browsertabbladen op onze startpagina. het afspelen van 4K-video's bij 60 FPS is verder perfect met slechts één dropped frame tijdens onze 60-seconden durende testvideo.
| DPC Latencies / LatencyMon - interrupt to process latency (max), Web, Youtube, Prime95 | |
| Razer Book 13 FHD | |
| Framework Laptop 13.5 12th Gen Intel | |
| Lenovo ThinkPad X13 Yoga 20SX0004GE | |
| Microsoft Surface Laptop 4 13 Ryzen 5 | |
| Dell Latitude 13 7330 | |
| Dell Latitude 7310 | |
* ... kleiner is beter
Opslagapparatuur - alleen één interne schijf
Dell levert veel van zijn subnotebooks graag met kortere M.2 2230 SSD's in vergelijking met de langere 2280 schijven op de meeste andere laptops. De 512 GB Kioxia PCIe3 x4 schijf in onze testeenheid haalde een top van 2400 MB/s gedurende slechts een korte periode, voordat throttling ingrijpt en de overdrachtsnelheden verlaagt naar slechts 1200 MB/s, zoals blijkt uit onze DiskSpd loop testresultaten hieronder. De schijf heeft waarschijnlijk te kampen met temperatuurbeperkingen wanneer deze wordt belast. Ter vergelijking, deHP EliteBook 845 G9 aanzienlijk hogere overdrachtsnelheden gedurende langere perioden met de meegeleverde PCIe4 x4 schijf wanneer deze wordt onderworpen aan dezelfde testomstandigheden.

| Drive Performance rating - Percent | |
| Lenovo ThinkPad X13 Yoga 20SX0004GE | |
| Framework Laptop 13.5 12th Gen Intel | |
| Dell Latitude 7310 | |
| Razer Book 13 FHD | |
| Dell Latitude 13 7330 | |
| Microsoft Surface Laptop 4 13 Ryzen 5 | |
* ... kleiner is beter
Disk Throttling: DiskSpd Read Loop, Queue Depth 8
GPU-prestaties - Iris Xe gaat mee
De grafische prestaties zijn ruwweg 5 tot 20 procent langzamer dan de gemiddelde laptop in onze database die is uitgerust met dezelfde Iris Xe 96 EUs GPU. Het is nog steeds snel voor een geïntegreerde grafische chip, maar er zijn zeker snellere opties beschikbaar, zoals de Razer Book 13 of AMD-aangedreven Asus Zenbook S 13 als het maximaliseren van GPU-prestaties een prioriteit is.
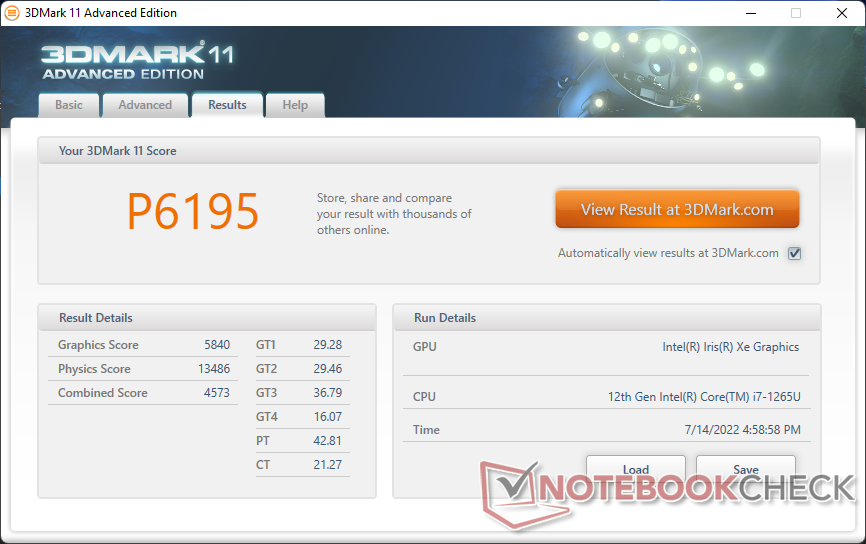
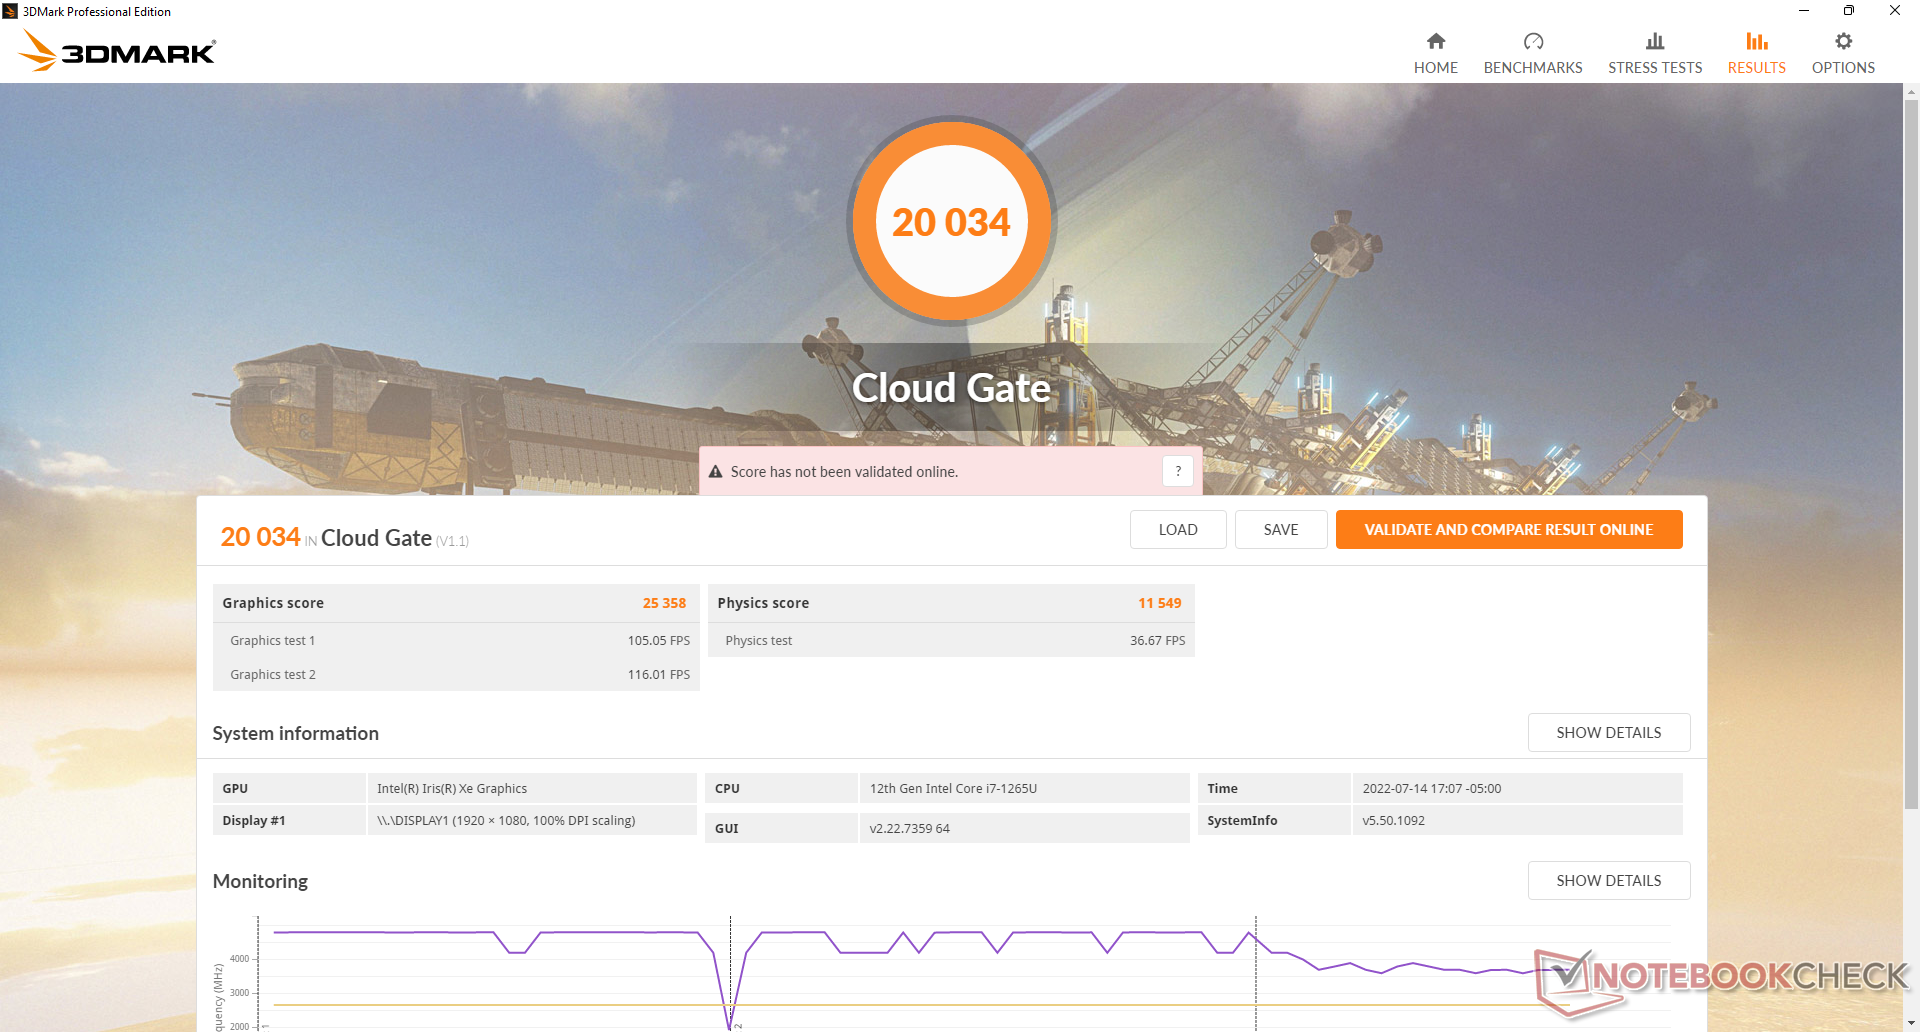
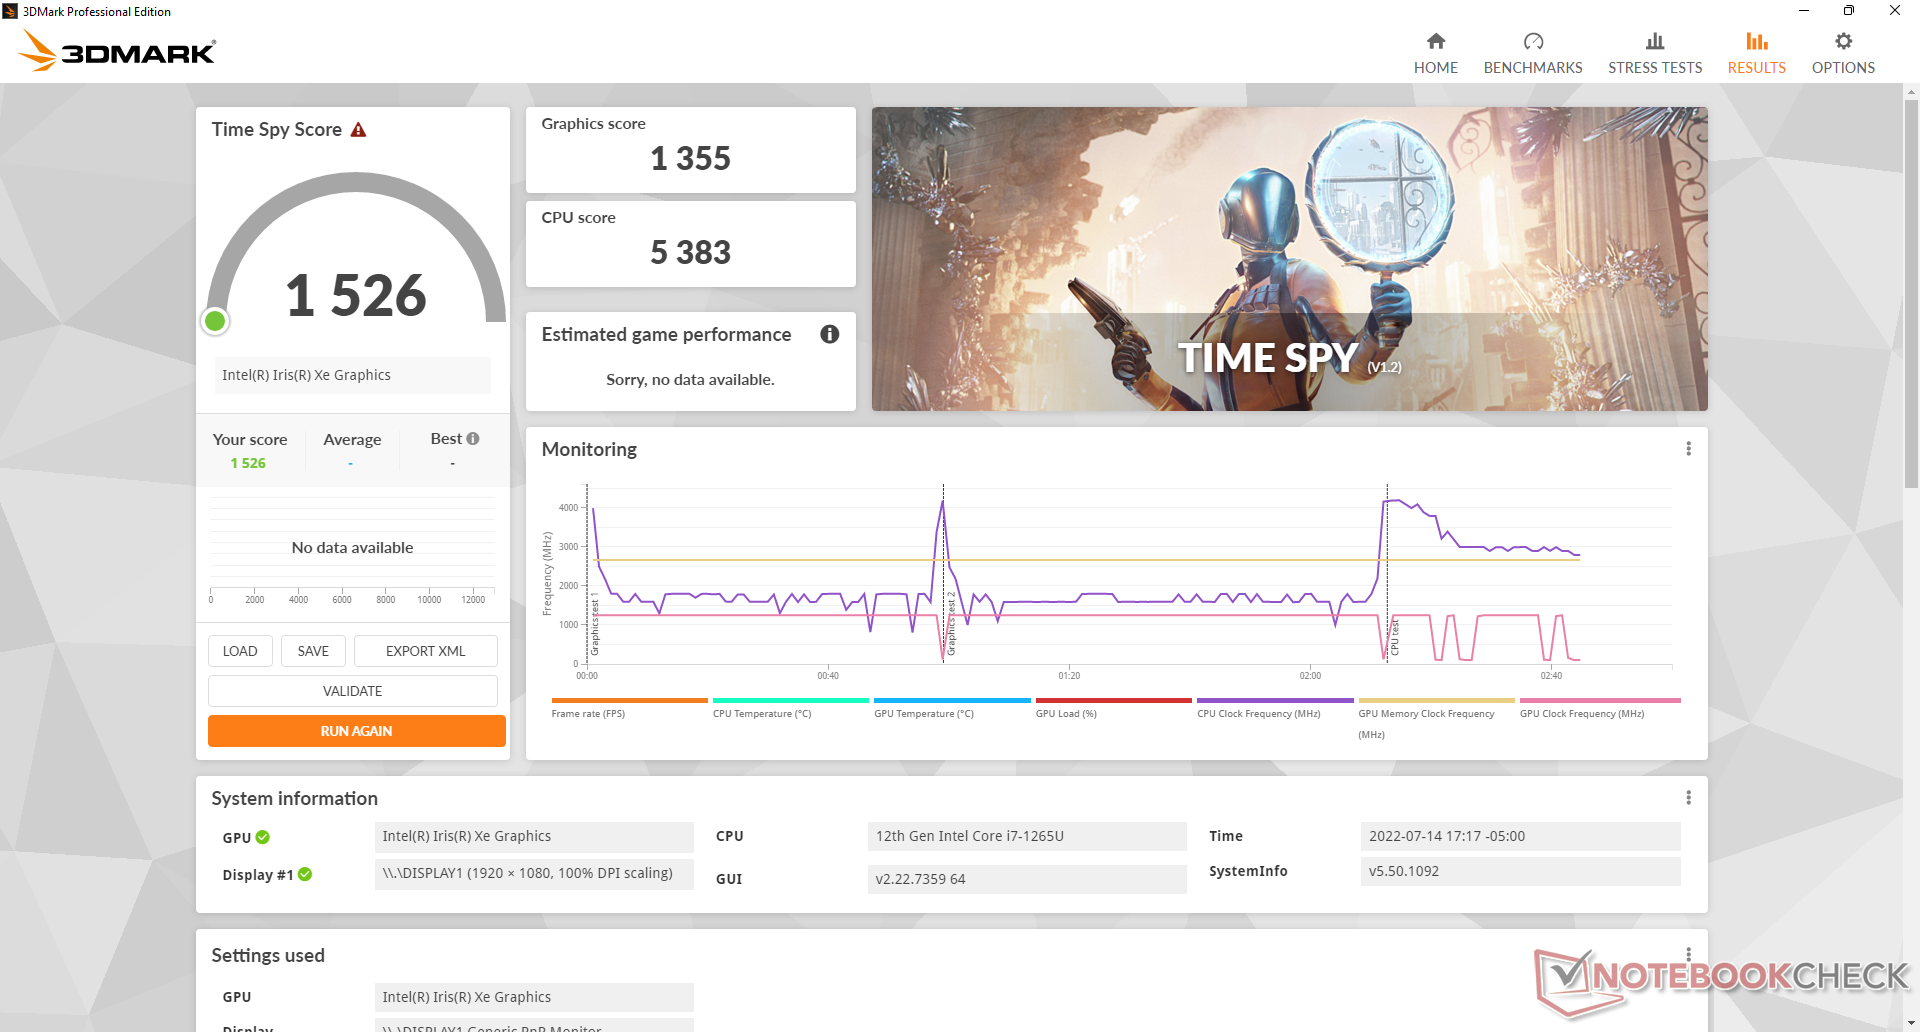
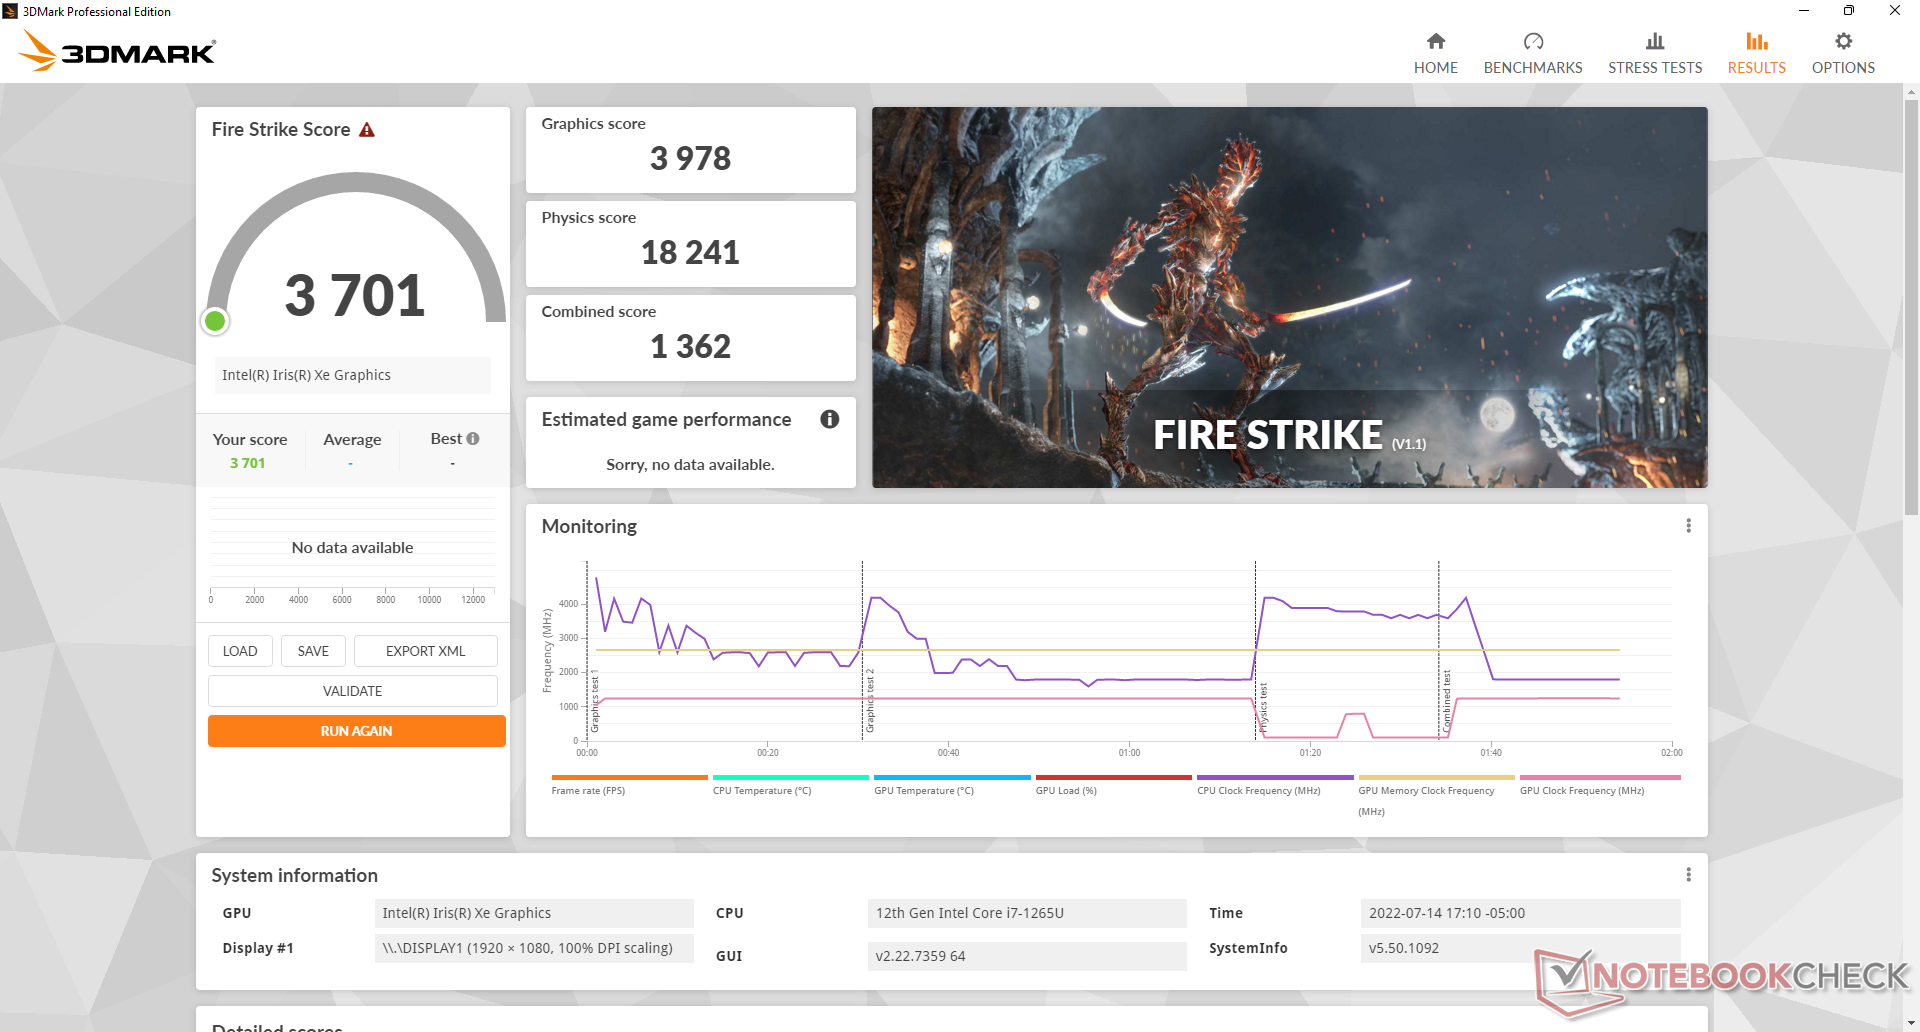
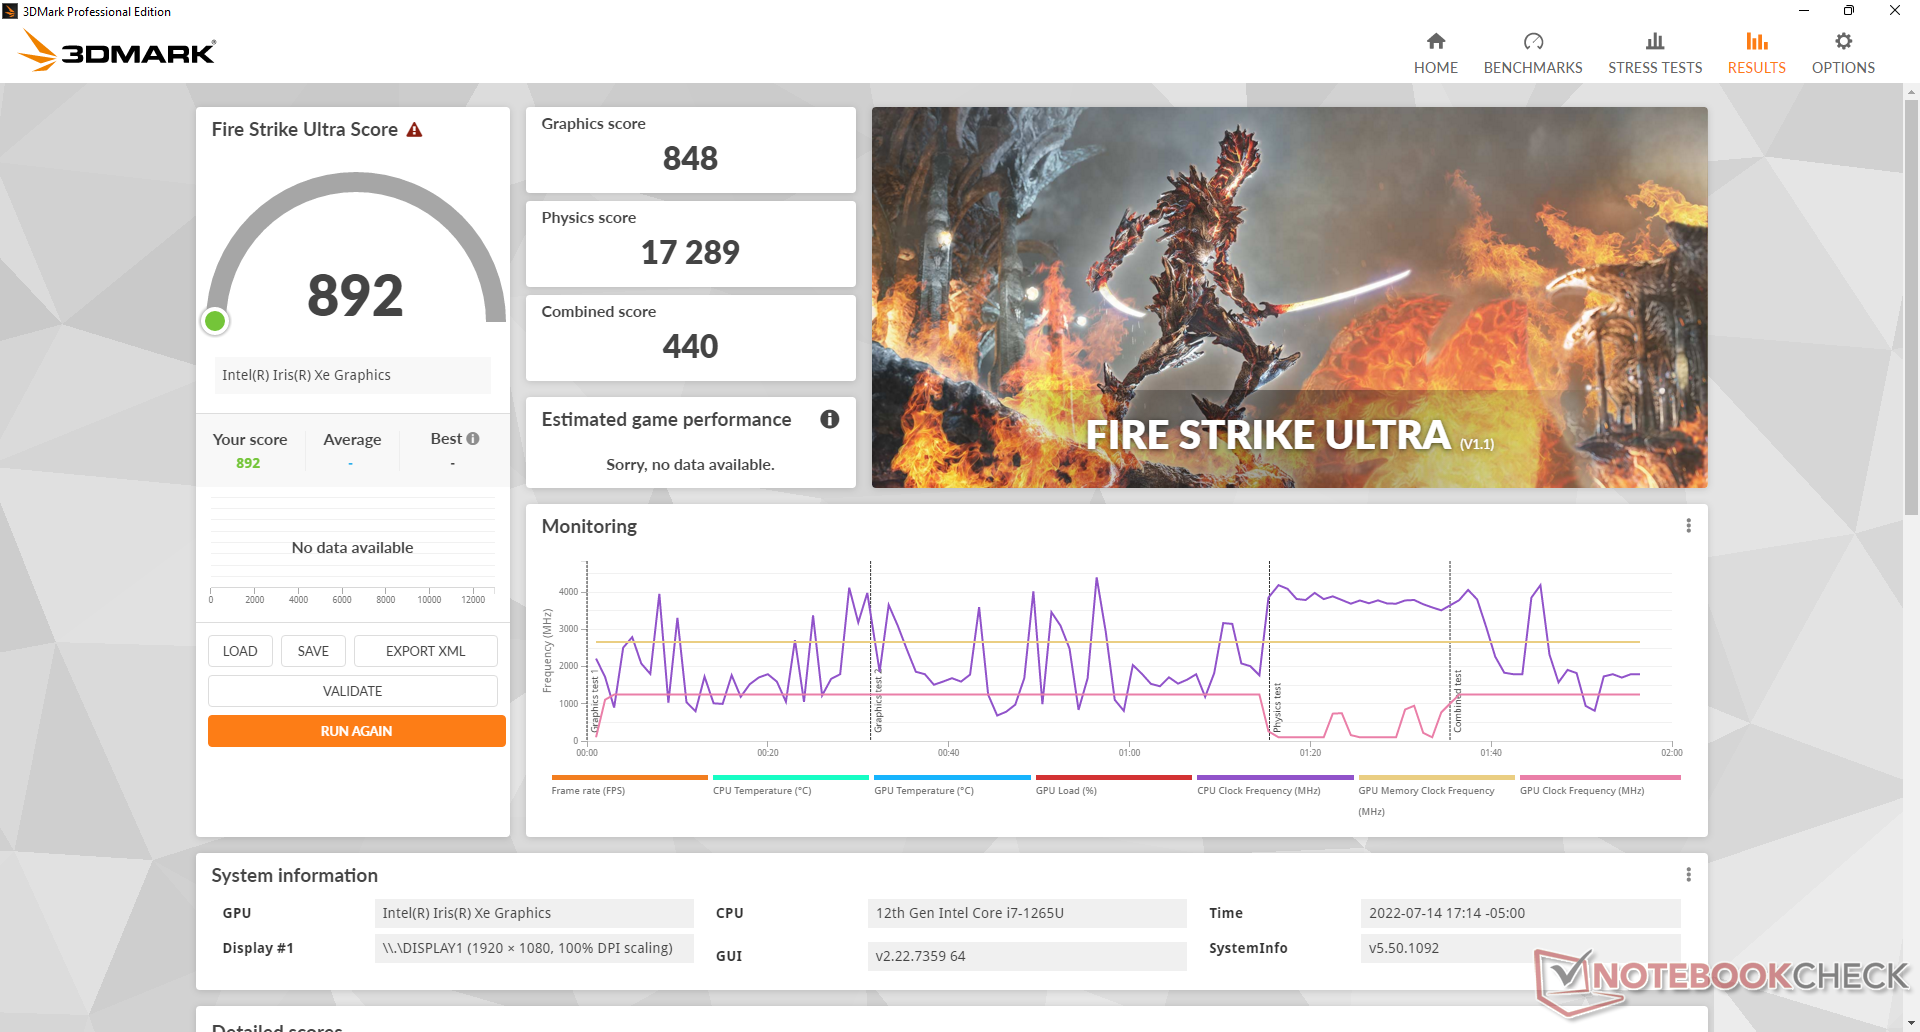
| 3DMark 11 Performance | 6195 punten | |
| 3DMark Cloud Gate Standard Score | 20034 punten | |
| 3DMark Fire Strike Score | 3701 punten | |
| 3DMark Time Spy Score | 1526 punten | |
Help | ||
| Cyberpunk 2077 1.6 | |
| 1920x1080 Low Preset | |
| Framework Laptop 13.5 12th Gen Intel | |
| Gemiddeld Intel Iris Xe Graphics G7 96EUs (13 - 25.9, n=42) | |
| Dell Latitude 13 7330 | |
| 1920x1080 Medium Preset | |
| Framework Laptop 13.5 12th Gen Intel | |
| Gemiddeld Intel Iris Xe Graphics G7 96EUs (10.8 - 21.7, n=37) | |
| Dell Latitude 13 7330 | |
| 1920x1080 High Preset | |
| Framework Laptop 13.5 12th Gen Intel | |
| Gemiddeld Intel Iris Xe Graphics G7 96EUs (9.8 - 16.9, n=34) | |
| Dell Latitude 13 7330 | |
Witcher 3 FPS Chart
| lage | gem. | hoge | ultra | |
|---|---|---|---|---|
| GTA V (2015) | 84.5 | 64.7 | 13.9 | 6.15 |
| The Witcher 3 (2015) | 71.6 | 47.3 | 23.6 | 11.9 |
| Dota 2 Reborn (2015) | 109.7 | 79.6 | 50.6 | 44.9 |
| Final Fantasy XV Benchmark (2018) | 32.9 | 17.5 | 12.9 | |
| X-Plane 11.11 (2018) | 47.3 | 33.8 | 30.3 | |
| Strange Brigade (2018) | 75.8 | 29.8 | 24.9 | 20 |
| Cyberpunk 2077 1.6 (2022) | 18.7 | 15.4 | 11.2 |
Emissies
Systeemgeluid - Meestal stil
Het ventilatorgeluid schommelt tussen een stille achtergrond van 23,4 dB(A) en 25,3 dB(A) tijdens het webbrowsen of tekstverwerken en is in de meeste omgevingen bijna onhoorbaar. Het begint echter snel op te lopen bij het draaien van meer veeleisende belastingen zoals 3DMark 06, waar het ventilatorgeluid kan oplopen tot 38 dB(A) en daarmee luider is dan wat we registreerden op de ThinkPad X13 Yoga, Razer Book 13, of oudere Latitude 7310. Het geluid van de ventilator schommelde tussen 37 en 39 dB(A) tijdens het draaien Witcher 3 in plaats van constant te blijven, wat beter zou zijn geweest.
Wanneer Prime95 werd gebruikt, piekte het ventilatorgeluid slechts kortstondig tot 43 dB(A) voordat het snel weer daalde tot 39 dB(A).
Geluidsniveau
| Onbelast |
| 23.4 / 23.4 / 23.4 dB (A) |
| Belasting |
| 37.8 / 43 dB (A) |
 | ||
30 dB stil 40 dB(A) hoorbaar 50 dB(A) luid |
||
min: | ||
| Dell Latitude 13 7330 Iris Xe G7 96EUs, i7-1265U, Toshiba KBG40ZNS512G NVMe | Lenovo ThinkPad X13 Yoga 20SX0004GE UHD Graphics 620, i7-10510U, Samsung SSD PM981a MZVLB512HBJQ | Framework Laptop 13.5 12th Gen Intel Iris Xe G7 96EUs, i7-1260P, WDC PC SN730 SDBPNTY-512G | Razer Book 13 FHD Iris Xe G7 96EUs, i7-1165G7, Samsung SSD PM981a MZVLB256HBHQ | Dell Latitude 7310 UHD Graphics 620, i7-10610U, Samsung SSD PM981a MZVLB512HBJQ | Microsoft Surface Laptop 4 13 Ryzen 5 Vega 7, R5 4680U, Samsung PM991 MZ9LQ256HBJQ | |
|---|---|---|---|---|---|---|
| Noise | -13% | -8% | -4% | -12% | -3% | |
| uit / omgeving * (dB) | 23.4 | 29.3 -25% | 22.8 3% | 27 -15% | 29 -24% | 24.6 -5% |
| Idle Minimum * (dB) | 23.4 | 29.3 -25% | 23 2% | 27 -15% | 29 -24% | 24.6 -5% |
| Idle Average * (dB) | 23.4 | 29.3 -25% | 23 2% | 27 -15% | 29 -24% | 24.6 -5% |
| Idle Maximum * (dB) | 23.4 | 31.4 -34% | 23 2% | 27.1 -16% | 29 -24% | 24.6 -5% |
| Load Average * (dB) | 37.8 | 33 13% | 47.3 -25% | 29 23% | 30.1 20% | 39.5 -4% |
| Witcher 3 ultra * (dB) | 39.2 | 47.3 -21% | 33.3 15% | |||
| Load Maximum * (dB) | 43 | 34.9 19% | 49.8 -16% | 44.8 -4% | 41.3 4% | 39.5 8% |
* ... kleiner is beter
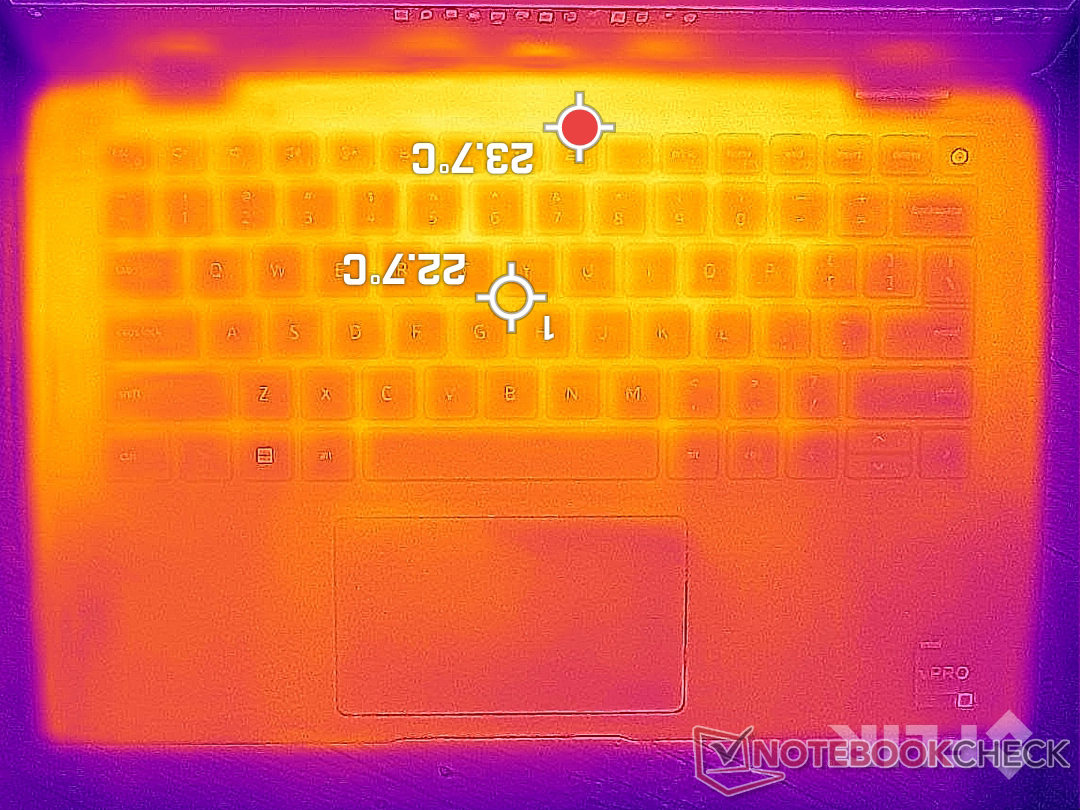
Temperatuur
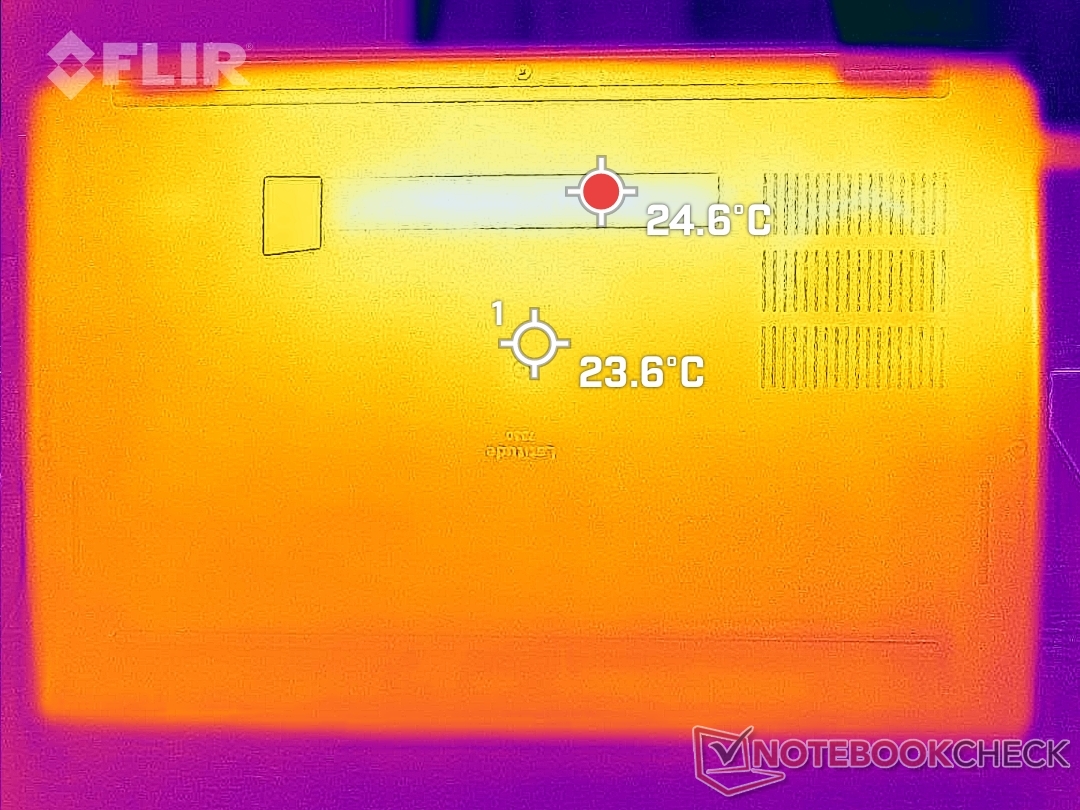
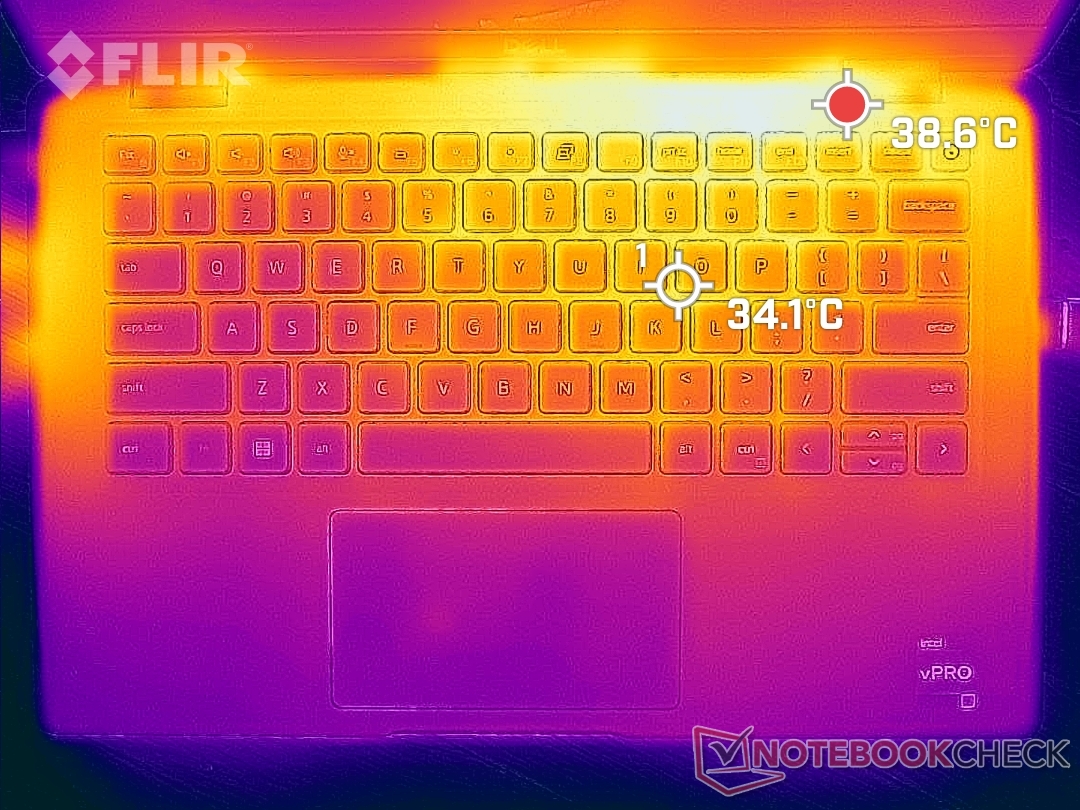
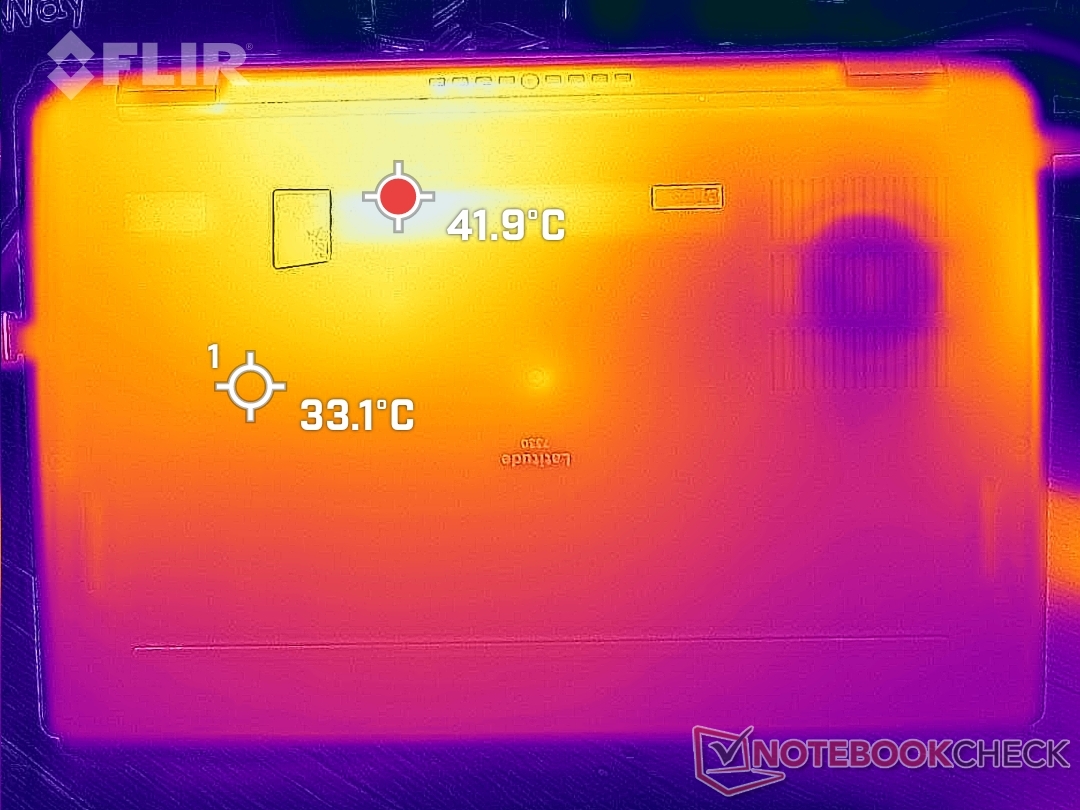
Oppervlaktetemperaturen zijn geen probleem op de Latitude 7330. In het slechtste geval registreren we hotspots van 39 C en 42 C op het boven- en onderoppervlak, respectievelijk koeler dan de 46 C en 53 C die we registreerden op de oudere Latitude 7310. Deze hotspots bevinden zich ook aan de achterkant van de behuizing, weg van de toetsen van het toetsenbord en de palmsteunen.
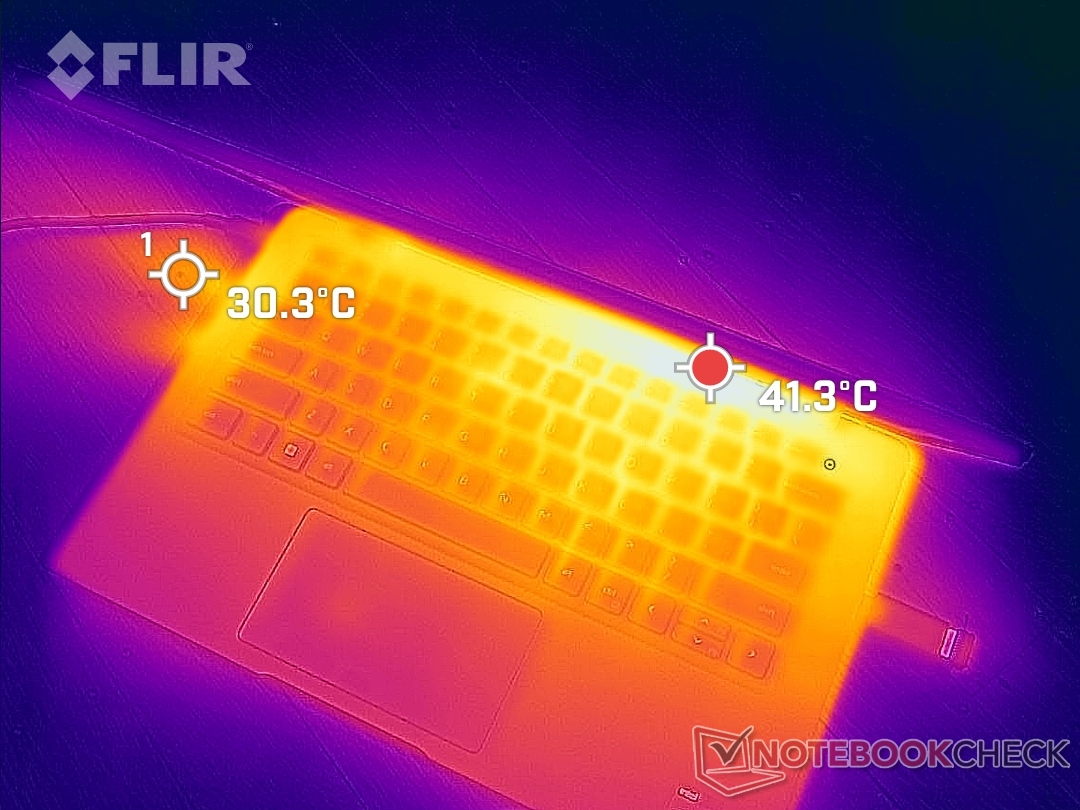
(+) De maximumtemperatuur aan de bovenzijde bedraagt 38.6 °C / 101 F, vergeleken met het gemiddelde van 34.3 °C / 94 F, variërend van 21.2 tot 62.5 °C voor de klasse Office.
(±) De bodem warmt op tot een maximum van 42 °C / 108 F, vergeleken met een gemiddelde van 36.8 °C / 98 F
(+) Bij onbelast gebruik bedraagt de gemiddelde temperatuur voor de bovenzijde 22.2 °C / 72 F, vergeleken met het apparaatgemiddelde van 29.5 °C / 85 F.
(+) De palmsteunen en het touchpad zijn met een maximum van ###max## °C / 73.8 F koeler dan de huidtemperatuur en voelen daarom koel aan.
(+) De gemiddelde temperatuur van de handpalmsteun van soortgelijke toestellen bedroeg 27.5 °C / 81.5 F (+4.3 °C / 7.7 F).
| Dell Latitude 13 7330 Intel Core i7-1265U, Intel Iris Xe Graphics G7 96EUs | Lenovo ThinkPad X13 Yoga 20SX0004GE Intel Core i7-10510U, Intel UHD Graphics 620 | Framework Laptop 13.5 12th Gen Intel Intel Core i7-1260P, Intel Iris Xe Graphics G7 96EUs | Razer Book 13 FHD Intel Core i7-1165G7, Intel Iris Xe Graphics G7 96EUs | Dell Latitude 7310 Intel Core i7-10610U, Intel UHD Graphics 620 | Microsoft Surface Laptop 4 13 Ryzen 5 AMD Ryzen 5 4680U, AMD Radeon RX Vega 7 | |
|---|---|---|---|---|---|---|
| Heat | -31% | -4% | -3% | -22% | -9% | |
| Maximum Upper Side * (°C) | 38.6 | 43.8 -13% | 36.8 5% | 39.2 -2% | 45.2 -17% | 45.8 -19% |
| Maximum Bottom * (°C) | 42 | 65 -55% | 42.4 -1% | 44 -5% | 52.8 -26% | 45.5 -8% |
| Idle Upper Side * (°C) | 23.8 | 29.2 -23% | 24.2 -2% | 23 3% | 28.2 -18% | 24.9 -5% |
| Idle Bottom * (°C) | 24.6 | 32.7 -33% | 29 -18% | 26.8 -9% | 31.6 -28% | 25.7 -4% |
* ... kleiner is beter
Stresstest
Bij het draaien van Prime95, zou de CPU kloksnelheid gedurende de eerste paar seconden oplopen tot 3,8 GHz bij een stroomverbruik en kerntemperatuur van respectievelijk 44 W en 97 C. Na slechts een paar seconden begonnen de kloksnelheden echter gestaag te dalen, voordat ze stabiliseerden op 2,1 tot 2,5 GHz en 72 tot 85 C. Het stroomverbruik van het bord daalde ook tot 23 à 25 W, aangezien hoge Turbo Boost kloksnelheden niet vol te houden zijn. Deze resultaten komen overeen met onze CineBench R15 loop observaties hierboven. Herhaling van deze test op de Razer Book 13 zou resulteren in een veel koelere kerntemperatuur van 60 C.
Het draaien van Witcher 3 om hoge belastingen weer te geven zou resulteren in een stabiele GPU kloksnelheid en temperatuur van respectievelijk 1247 MHz en 83 C, vergeleken met 1300 MHz en slechts 59 C op de eerder genoemde Razer. De processor in de Latitude moet warmer draaien om te compenseren voor de kleinere koeloplossing.
Op de batterij werken beperkt de prestaties. Een 3DMark 11 test op de batterij leverde een score voor Physics en Graphics op van respectievelijk 8511 en 4764 punten, vergeleken met 13486 en 5840 punten op de netvoeding.
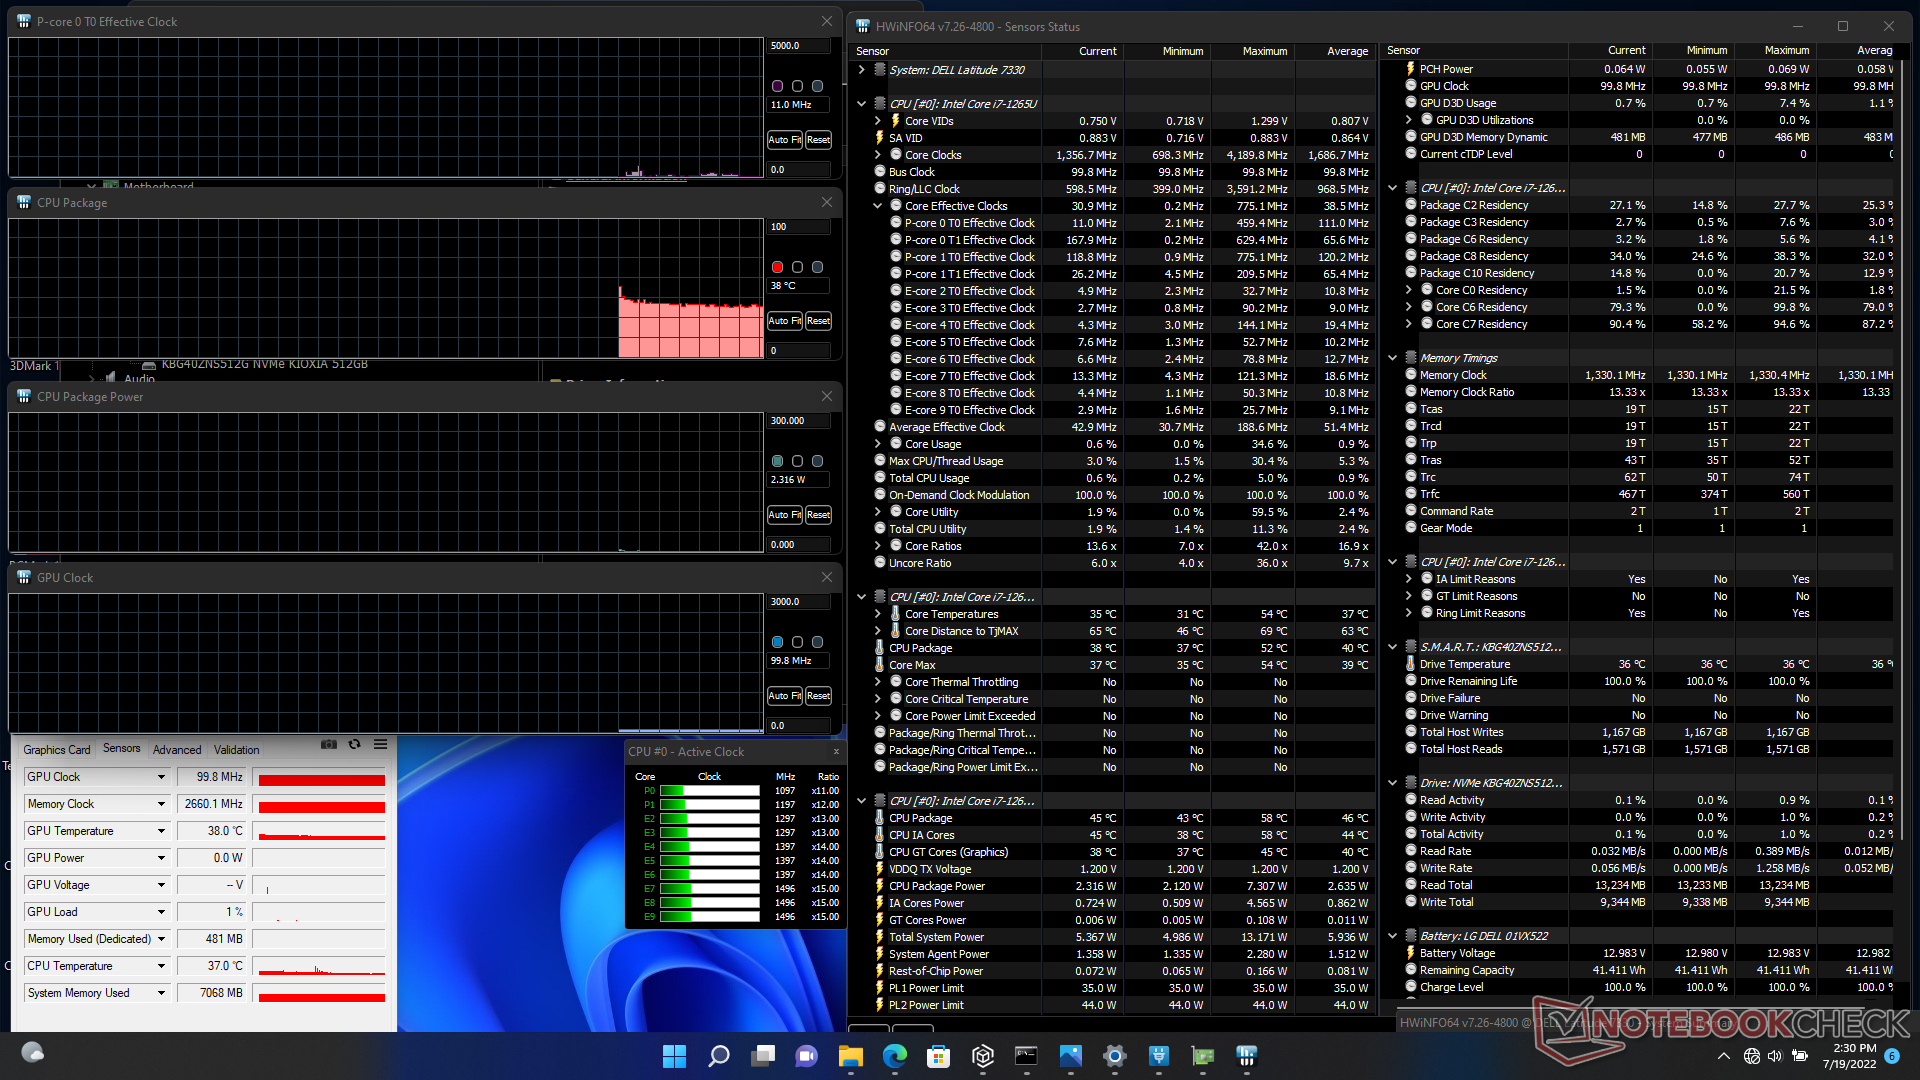
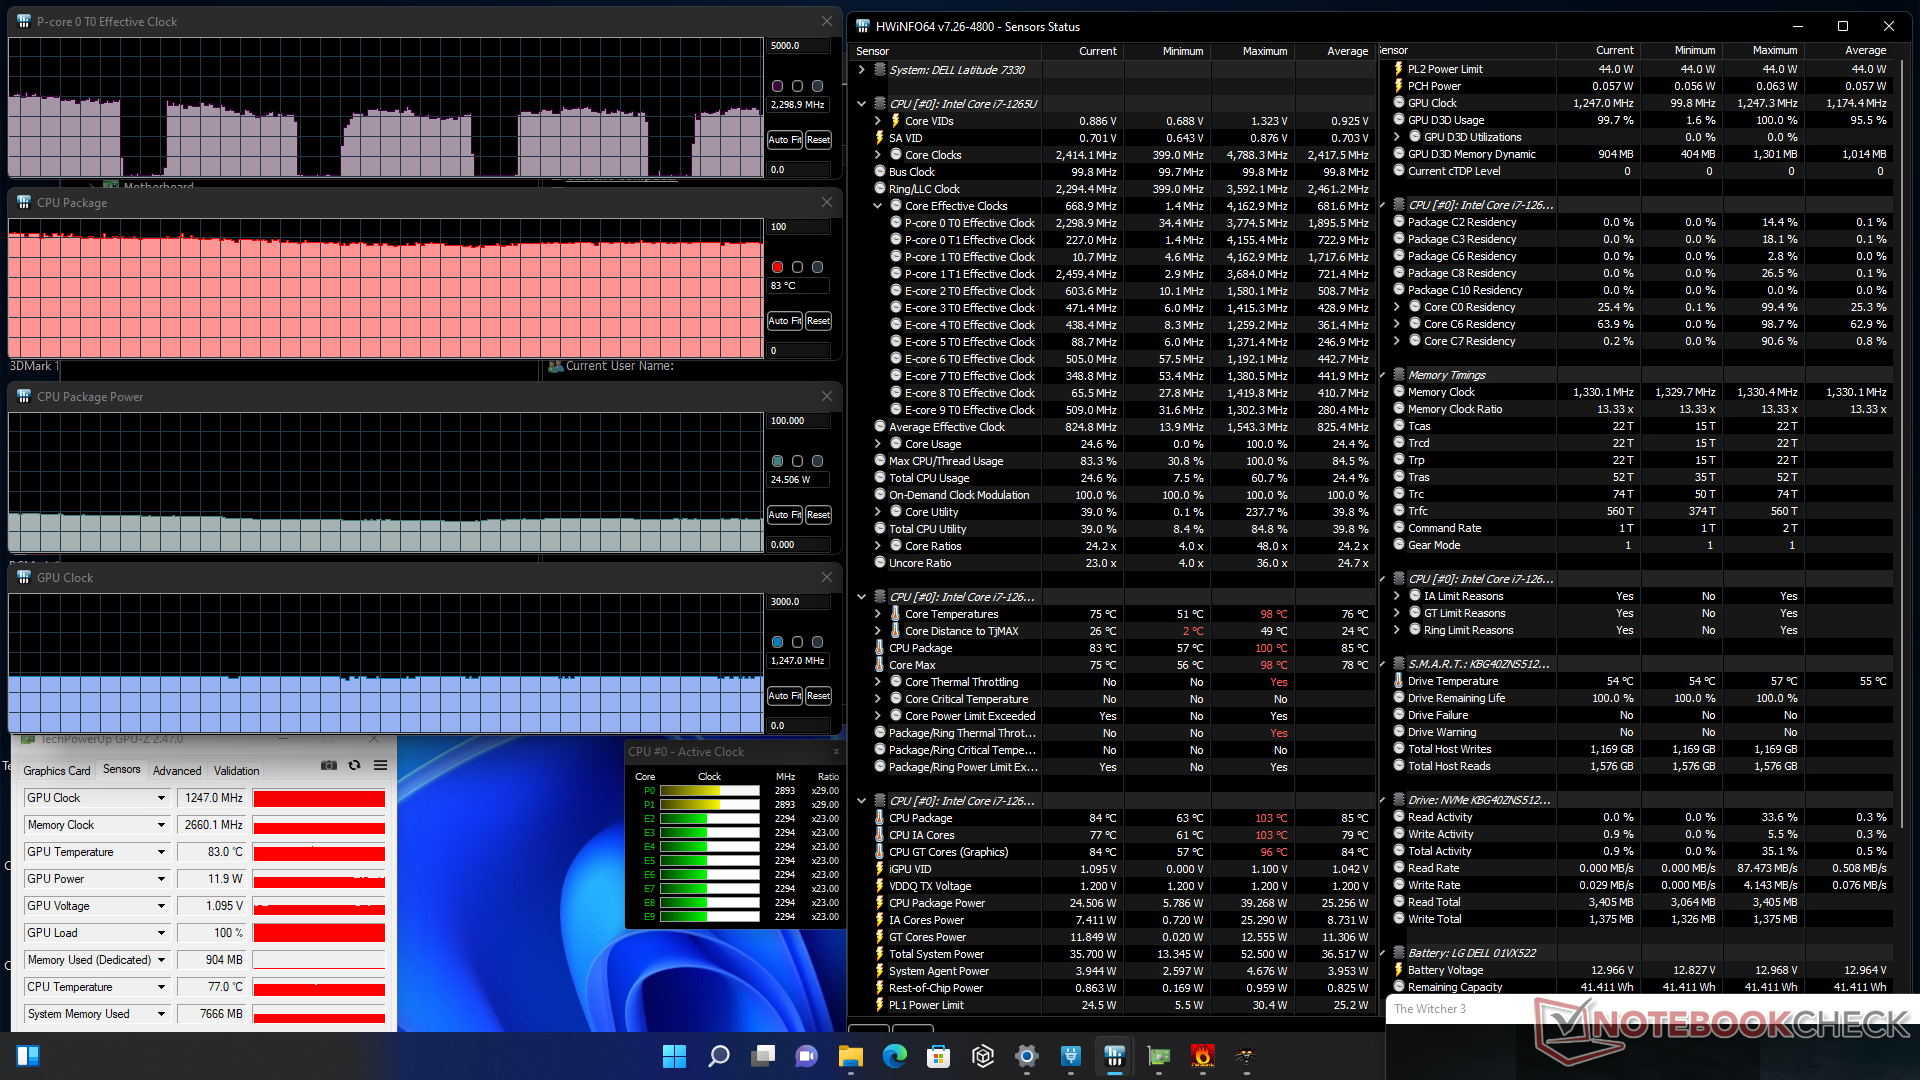
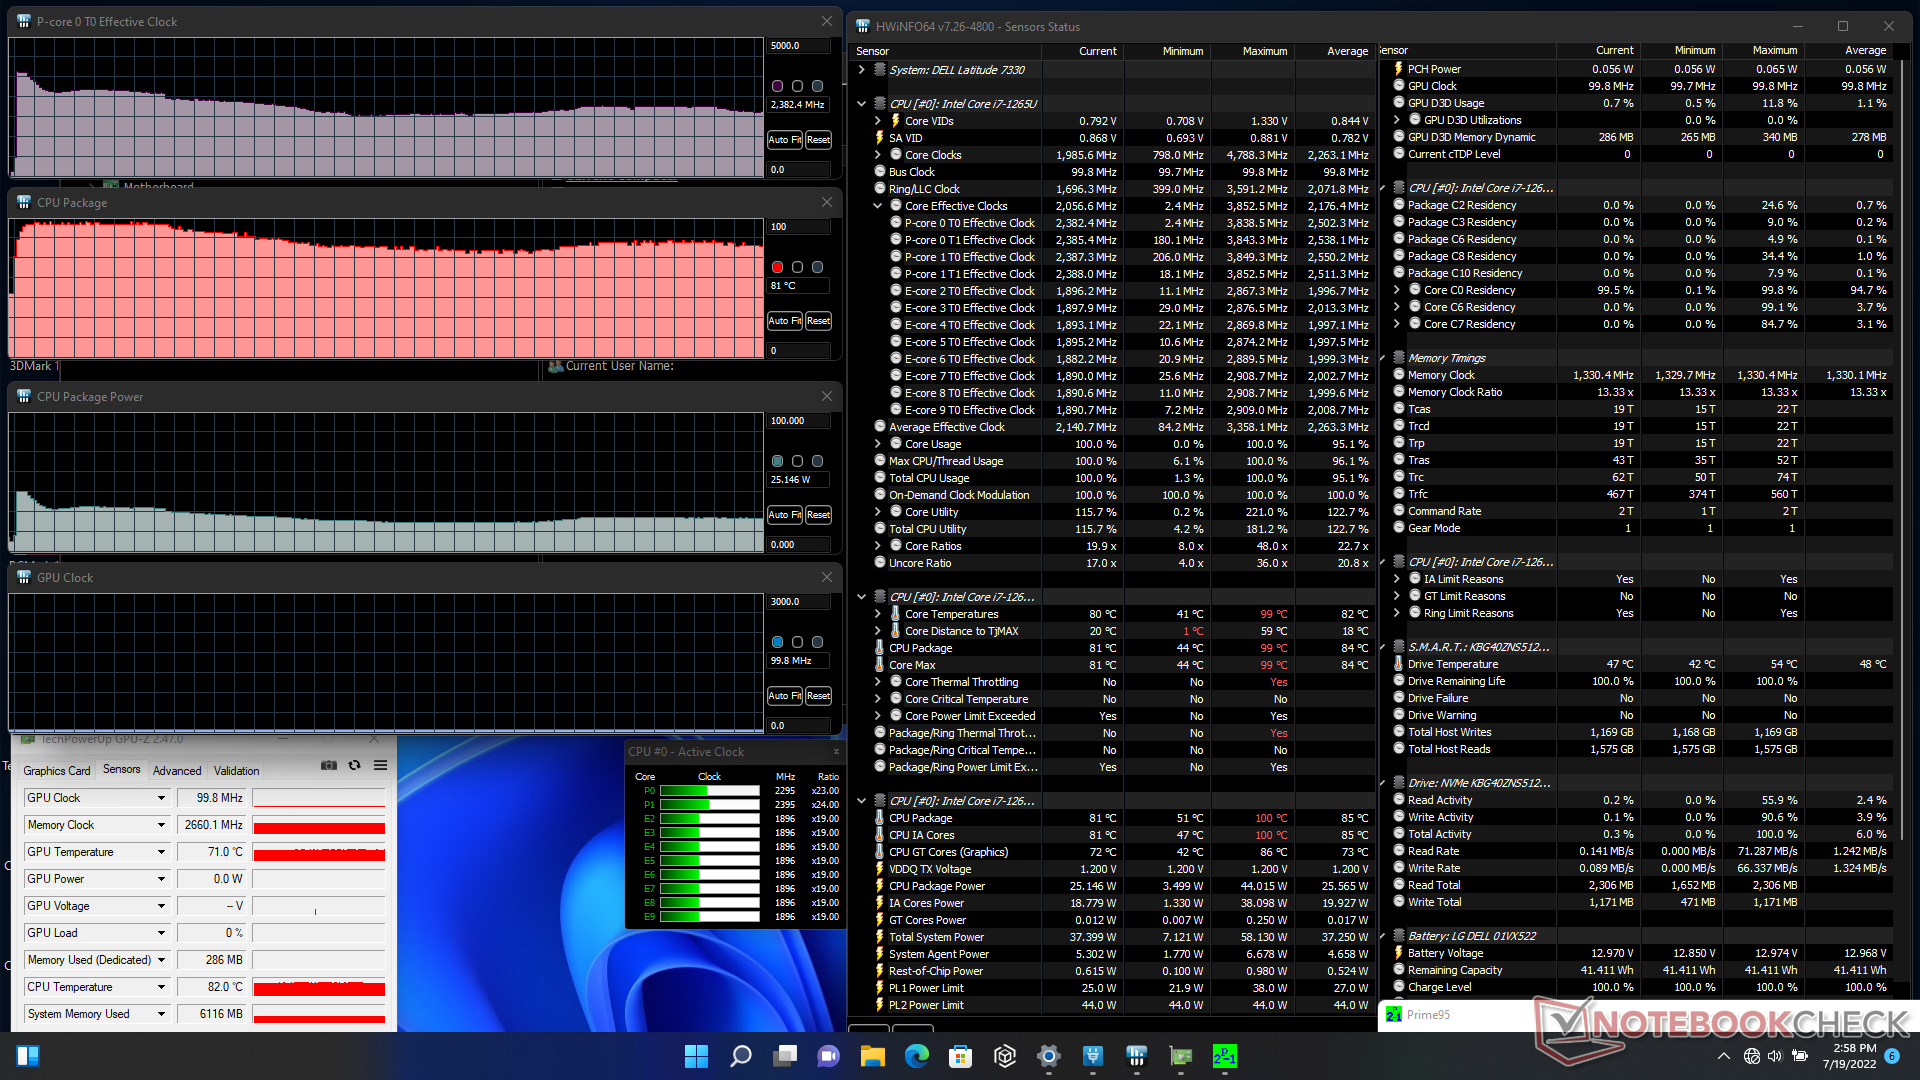
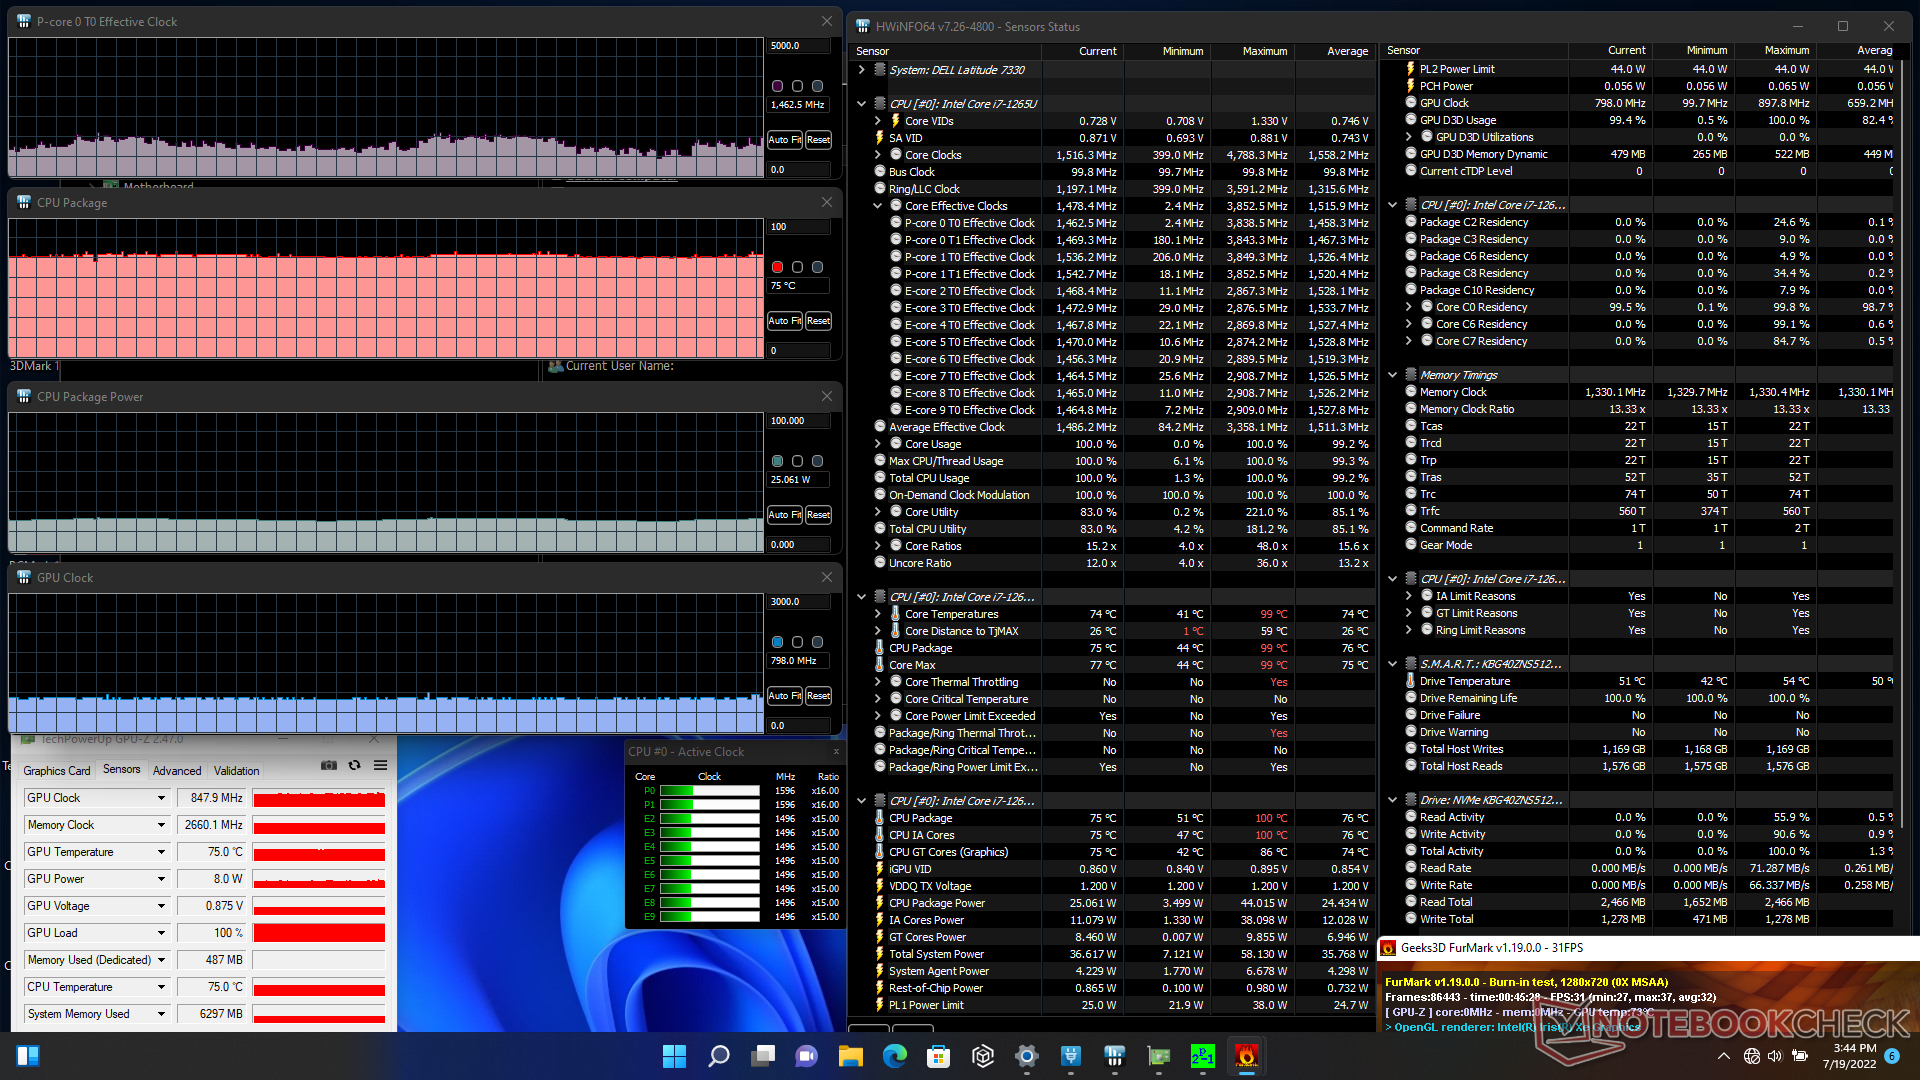
| CPU Klok (GHz) | GPU Klok (MHz) | Gemiddelde CPU Temperatuur (°C) | |
| Systeem in rusttoestand | -- | -- | 38 |
| Prime95 Stress | 2.1 - 2.5 | -- | 72 - 85 |
| Prime95 + FurMark Stress | ~1.4 | 848 | 75 |
| Witcher 3 Stress | ~2.3 | 1247 | 83 |
Sprekers
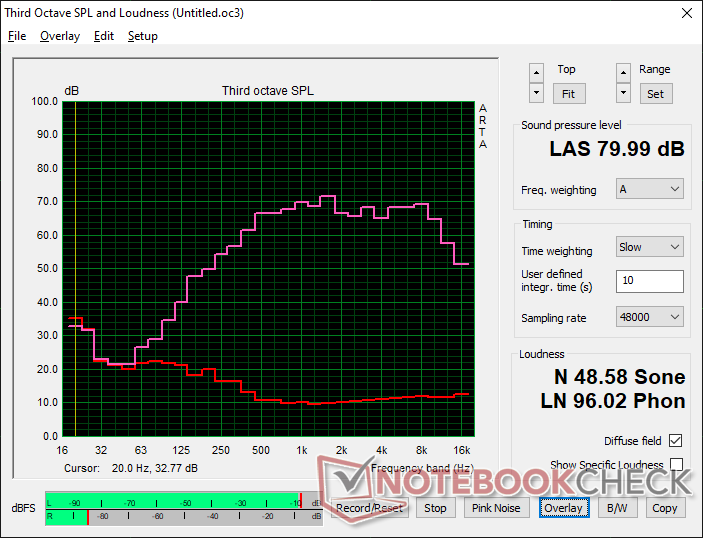
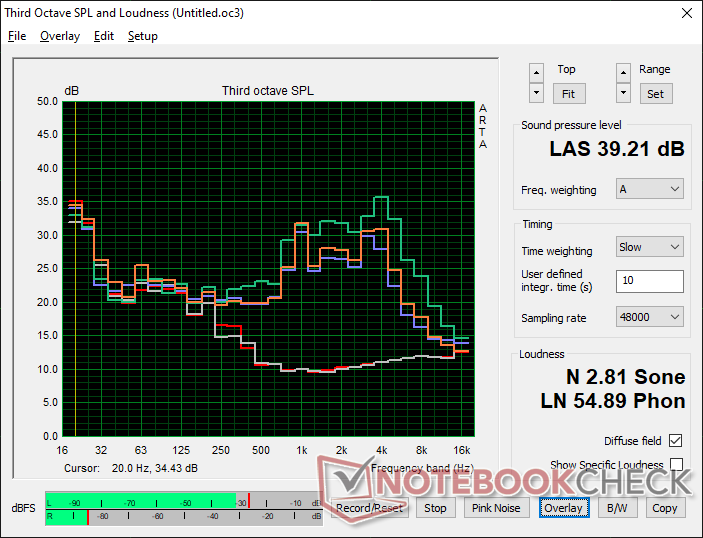
Dell Latitude 13 7330 audioanalyse
(±) | luidspreker luidheid is gemiddeld maar goed (80 dB)
Bas 100 - 315 Hz
(-) | bijna geen lage tonen - gemiddeld 18.6% lager dan de mediaan
(±) | lineariteit van de lage tonen is gemiddeld (8.6% delta ten opzichte van de vorige frequentie)
Midden 400 - 2000 Hz
(+) | evenwichtige middens - slechts 2.7% verwijderd van de mediaan
(+) | de middentonen zijn lineair (5.1% delta ten opzichte van de vorige frequentie)
Hoog 2 - 16 kHz
(+) | evenwichtige hoogtepunten - slechts 1.9% verwijderd van de mediaan
(+) | de hoge tonen zijn lineair (4.1% delta naar de vorige frequentie)
Algemeen 100 - 16.000 Hz
(+) | het totale geluid is lineair (14.8% verschil met de mediaan)
Vergeleken met dezelfde klasse
» 13% van alle geteste apparaten in deze klasse waren beter, 4% vergelijkbaar, 83% slechter
» De beste had een delta van 7%, het gemiddelde was 21%, de slechtste was 53%
Vergeleken met alle geteste toestellen
» 20% van alle geteste apparaten waren beter, 4% gelijk, 76% slechter
» De beste had een delta van 4%, het gemiddelde was 23%, de slechtste was 134%
Apple MacBook Pro 16 2021 M1 Pro audioanalyse
(+) | luidsprekers kunnen relatief luid spelen (84.7 dB)
Bas 100 - 315 Hz
(+) | goede baars - slechts 3.8% verwijderd van de mediaan
(+) | de lage tonen zijn lineair (5.2% delta naar de vorige frequentie)
Midden 400 - 2000 Hz
(+) | evenwichtige middens - slechts 1.3% verwijderd van de mediaan
(+) | de middentonen zijn lineair (2.1% delta ten opzichte van de vorige frequentie)
Hoog 2 - 16 kHz
(+) | evenwichtige hoogtepunten - slechts 1.9% verwijderd van de mediaan
(+) | de hoge tonen zijn lineair (2.7% delta naar de vorige frequentie)
Algemeen 100 - 16.000 Hz
(+) | het totale geluid is lineair (4.6% verschil met de mediaan)
Vergeleken met dezelfde klasse
» 0% van alle geteste apparaten in deze klasse waren beter, 0% vergelijkbaar, 100% slechter
» De beste had een delta van 5%, het gemiddelde was 17%, de slechtste was 45%
Vergeleken met alle geteste toestellen
» 0% van alle geteste apparaten waren beter, 0% gelijk, 100% slechter
» De beste had een delta van 4%, het gemiddelde was 23%, de slechtste was 134%
Energiebeheer
Stroomverbruik - meer veeleisend
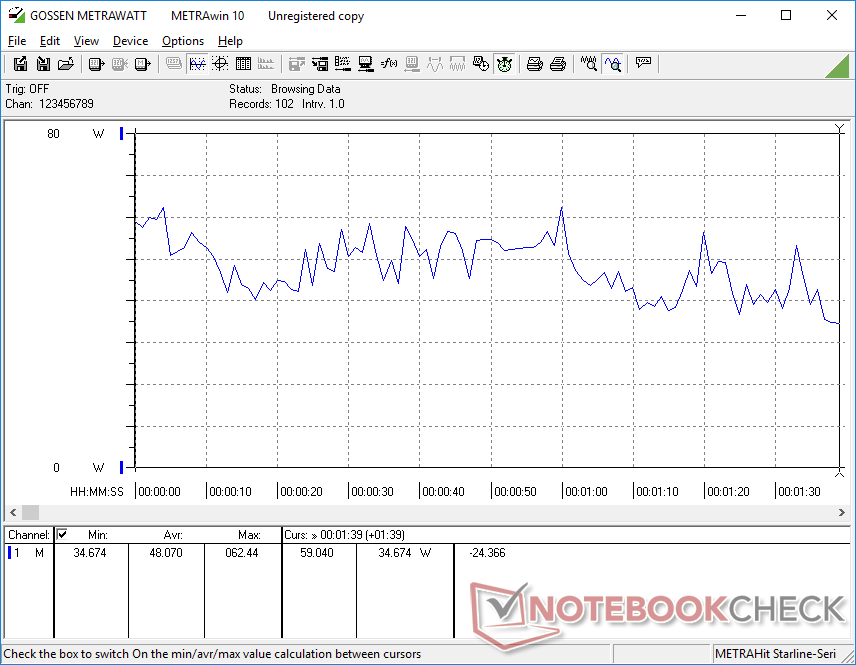
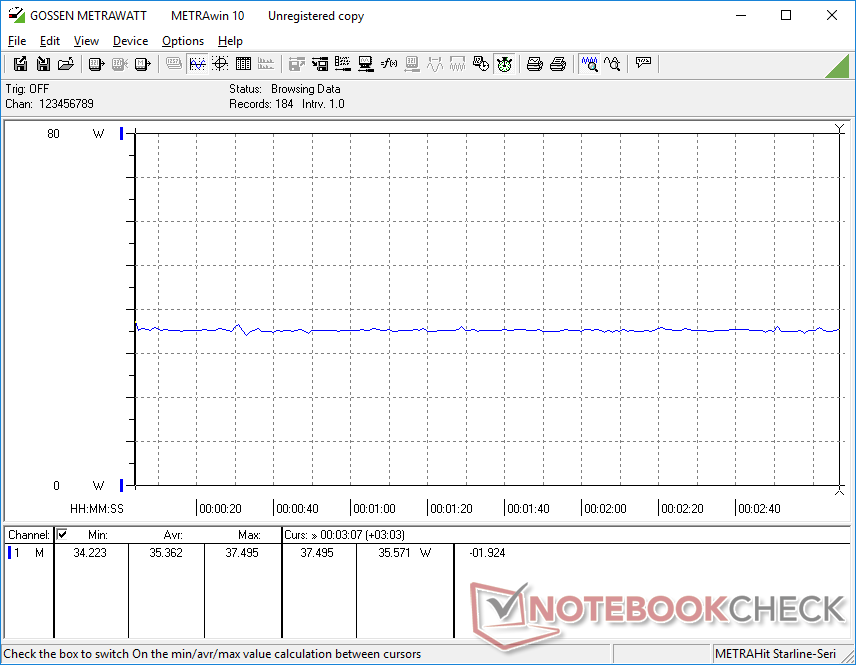
Het stroomverbruik is over het algemeen hoger dan laptops die op hardware van de vorige generatie draaien, wat overeenkomt met onze observaties over het Alder Lake-platform in zijn geheel. Het draaien van 3DMark06 en Prime95, bijvoorbeeld, zou 30 procent en 21 procent meer stroom verbruiken, respectievelijk, dan op de Core i7-1165G7 Razer Book 13. De prestaties mogen dan hoger zijn, maar de prestaties-per-watt zijn niet zo hoog als we hadden gehoopt dat ze zouden zijn.
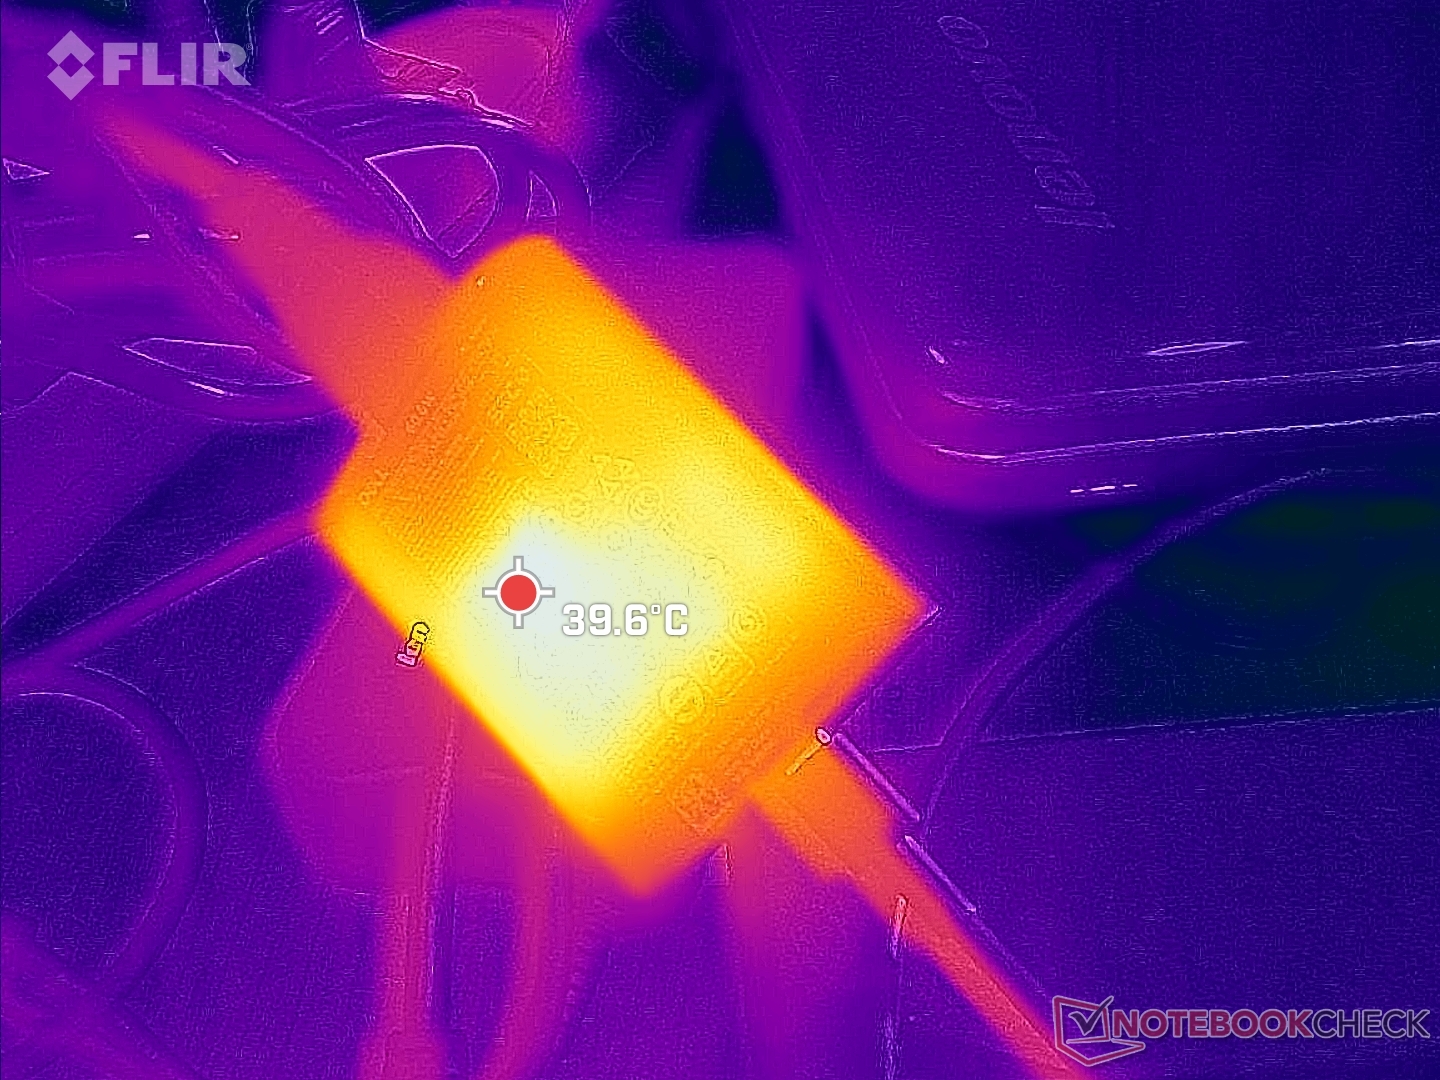
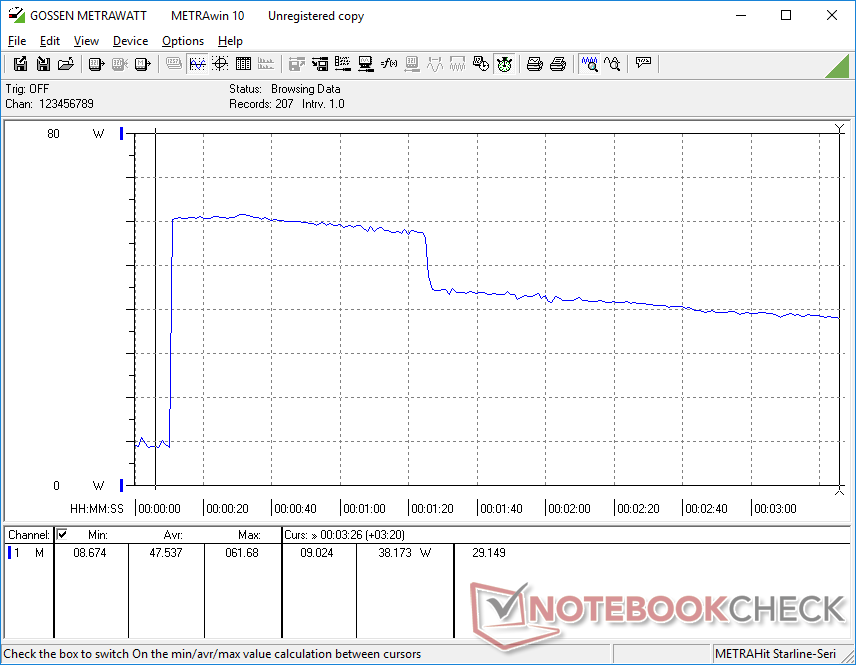
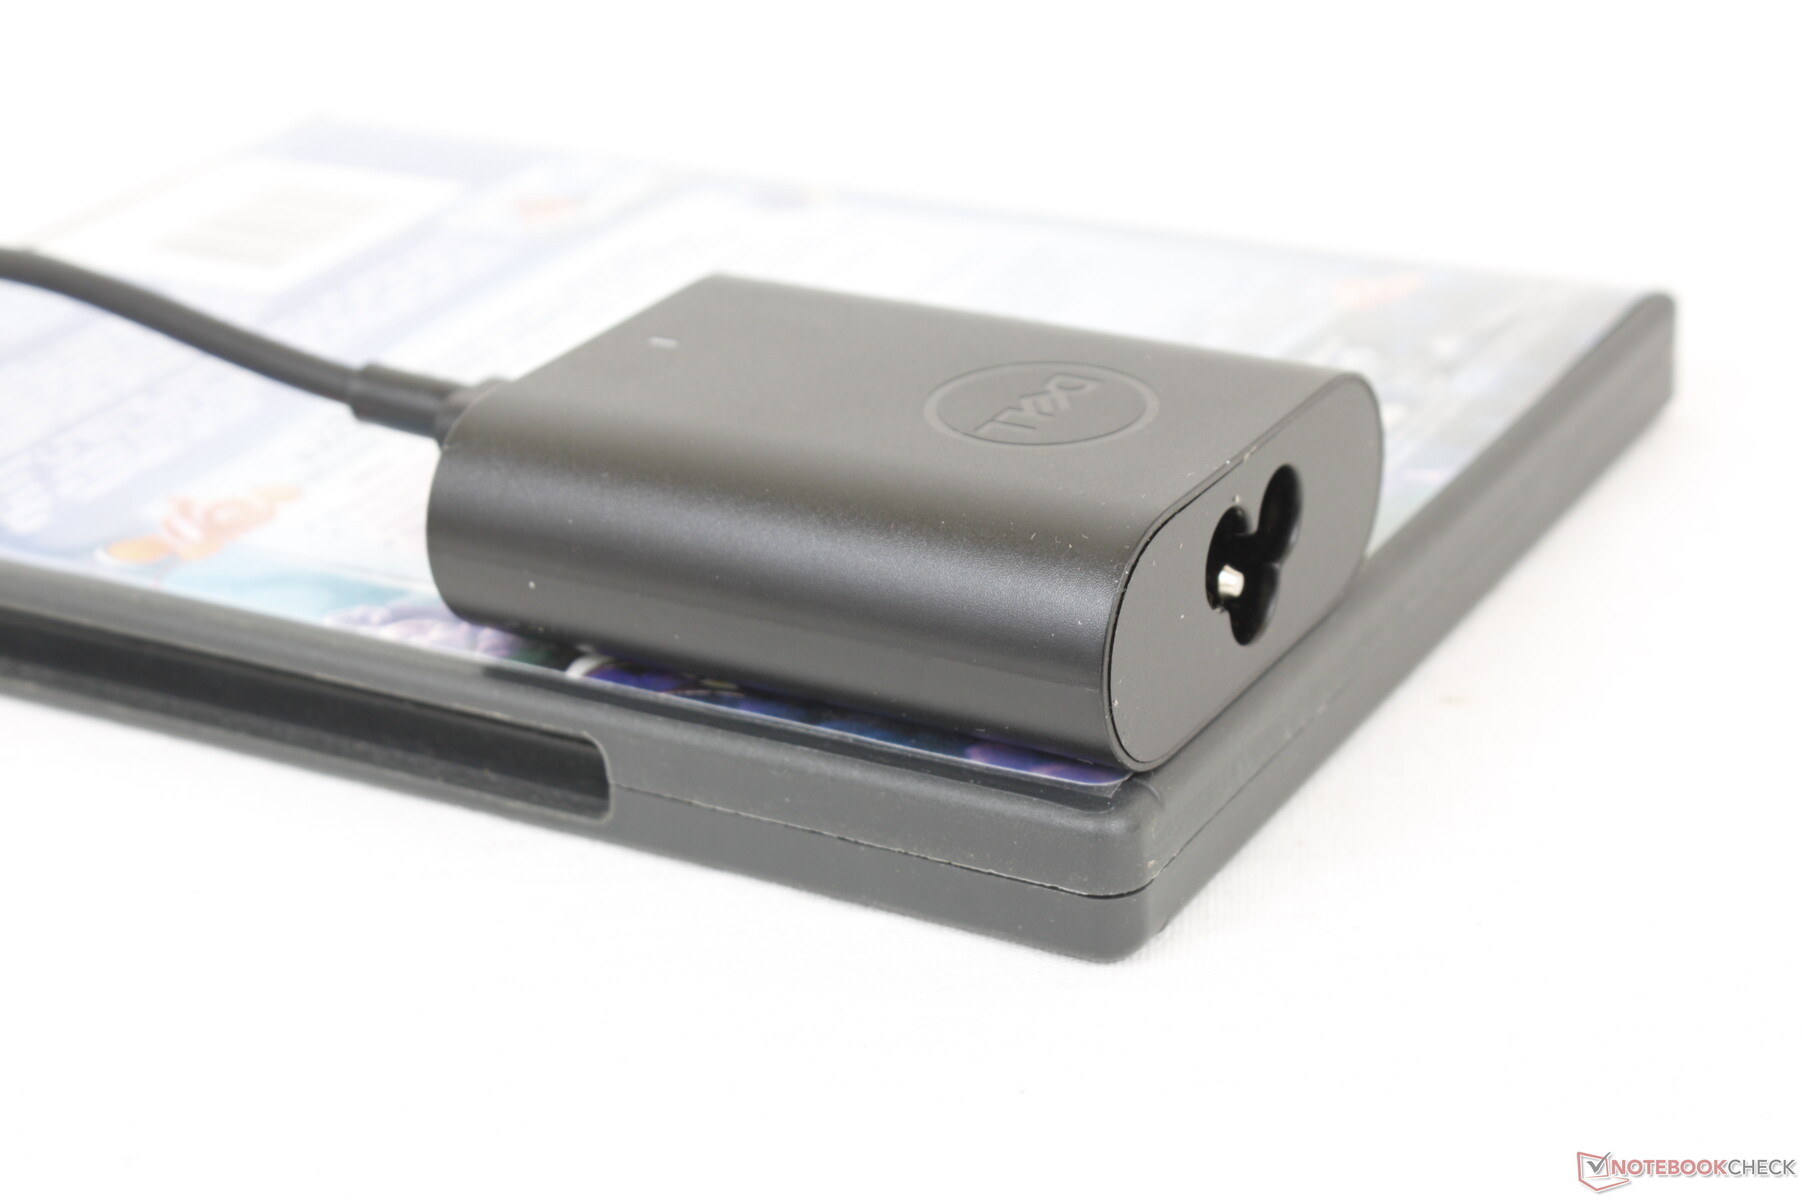
We zijn in staat om een maximale trek van 63,6 W te registreren van de zeer kleine (~6,6 x 5,5 x 2,2 cm) 60 W USB-C AC adapter. Deze snelheid is slechts tijdelijk, zoals blijkt uit de schermafbeelding hieronder, vanwege de thermische beperkingen van de CPU koeloplossing. Het systeem zal nog steeds met een behoorlijke snelheid opladen wanneer het onder zware verwerkingsstress staat.
Grotere 65 W of 90 W AC-adapters zijn ook opties, afhankelijk van de configuratie.

| Uit / Standby | |
| Inactief | |
| Belasting |
|
Key:
min: | |
| Dell Latitude 13 7330 i7-1265U, Iris Xe G7 96EUs, Toshiba KBG40ZNS512G NVMe, IPS, 1920x1080, 13.3" | Lenovo ThinkPad X13 Yoga 20SX0004GE i7-10510U, UHD Graphics 620, Samsung SSD PM981a MZVLB512HBJQ, IPS, 1920x1080, 13.3" | Framework Laptop 13.5 12th Gen Intel i7-1260P, Iris Xe G7 96EUs, WDC PC SN730 SDBPNTY-512G, IPS, 2256x1504, 13.5" | Razer Book 13 FHD i7-1165G7, Iris Xe G7 96EUs, Samsung SSD PM981a MZVLB256HBHQ, IPS, 1920x1200, 13.4" | Dell Latitude 7310 i7-10610U, UHD Graphics 620, Samsung SSD PM981a MZVLB512HBJQ, IPS, 1920x1080, 13.3" | Microsoft Surface Laptop 4 13 Ryzen 5 R5 4680U, Vega 7, Samsung PM991 MZ9LQ256HBJQ, IPS, 2256x1504, 13.5" | |
|---|---|---|---|---|---|---|
| Power Consumption | -3% | -44% | -2% | 13% | -8% | |
| Idle Minimum * (Watt) | 2.8 | 3.4 -21% | 5.3 -89% | 3.3 -18% | 2.7 4% | 3.4 -21% |
| Idle Average * (Watt) | 4.8 | 4.98 -4% | 8.4 -75% | 6.4 -33% | 4.4 8% | 6.3 -31% |
| Idle Maximum * (Watt) | 7.3 | 8.1 -11% | 11.2 -53% | 7 4% | 4.8 34% | 8.1 -11% |
| Load Average * (Watt) | 48.1 | 37.2 23% | 57.4 -19% | 37.3 22% | 33.4 31% | 36.2 25% |
| Witcher 3 ultra * (Watt) | 35.4 | 46.7 -32% | 36.4 -3% | |||
| Load Maximum * (Watt) | 63.6 | 63.3 -0% | 61.2 4% | 53.7 16% | 69.7 -10% | 64.1 -1% |
* ... kleiner is beter
Power Consumption Witcher 3 / Stresstest
Power Consumption external Monitor
Levensduur batterij
Gebruikers kunnen kiezen tussen een lichtere 41 Wh batterij of een zwaardere maar duurzamere 58 Wh batterij. We zijn in staat om iets meer dan 8 uur WLAN-gebruik in de praktijk uit onze 41 Wh testunit te persen, wat meer dan voldoende zou moeten zijn voor de meeste gebruikers.
Het opladen van een lege batterij tot een volle batterij met de meegeleverde USB-C AC-adapter duurt tussen de 2 en 2,5 uur.
| Dell Latitude 13 7330 i7-1265U, Iris Xe G7 96EUs, 41 Wh | Lenovo ThinkPad X13 Yoga 20SX0004GE i7-10510U, UHD Graphics 620, 50 Wh | Framework Laptop 13.5 12th Gen Intel i7-1260P, Iris Xe G7 96EUs, 55 Wh | Razer Book 13 FHD i7-1165G7, Iris Xe G7 96EUs, 55 Wh | Dell Latitude 7310 i7-10610U, UHD Graphics 620, 52 Wh | Microsoft Surface Laptop 4 13 Ryzen 5 R5 4680U, Vega 7, 47.4 Wh | |
|---|---|---|---|---|---|---|
| Batterijduur | 53% | -10% | 65% | 51% | 31% | |
| Reader / Idle (h) | 21.9 | 36.8 68% | 37.4 71% | |||
| WiFi v1.3 (h) | 8.3 | 8.2 -1% | 7.5 -10% | 14.8 78% | 12.6 52% | 10.9 31% |
| Load (h) | 1.4 | 2.9 107% | 2.1 50% | 1.8 29% |
Pro
Contra
Verdict - Opties, Opties, Opties
Het hoge niveau van configuraties helpen de Latitude 7330 te onderscheiden van andere zakelijke subnotebooks. Functies zoals een MicroSD-lezer, 4G LTE-connectiviteit, 1080p webcam, 2-in-1 vormfactor, koolstofvezel, batterijformaat, en zelfs AC-adapter zijn allemaal optioneel, afhankelijk van de behoeften van de koper. Als je voor je dagelijkse werkzaamheden bepaalde functies niet nodig hebt, dan kun je ze bij het afrekenen gewoon weglaten voor een lichter totaalgewicht. Andere ultralichte laptops zoals de LG Gram 13 of Toshiba X30 serie hebben veel minder configureerbare opties als gevolg van hun kleinere productieschalen ten opzichte van de Dell Latitude serie.
De Latitude 7330 serie is groot in configureerbare opties en aanpassingen om beter aan de specifieke behoeften van de gebruiker te voldoen. De 16:9 beeldverhouding begint echter zijn leeftijd te tonen.
De dichtstbijzijnde alternatieven voor de Latitude 7330 zijn de HP EliteBook 830 G8 en G9 modellen die kenmerken bieden als een grotere 16:10 beeldverhouding, scherpere 5 MP webcam, verwisselbare RAM modules, en aanzienlijk helderder 1000-nit beeldscherm opties die allemaal niet beschikbaar zijn op de Latitude 7330. Ze zijn echter iets zwaarder dan onze Dell, maar de sterkere eigenschappen kunnen voor sommige gebruikers de gewichtstoename waard zijn.
Prijs en beschikbaarheid
De Latitude 7330 is nog niet overal verkrijgbaar via Amazon of Best Buy. De aankoop van rechtstreeks bij Dell wordt aanbevolen, waar de prijzen momenteel rond de $2000 USD schommelen.
Dell Latitude 13 7330
- 22-07-2022 v7 (old)
Allen Ngo
Price comparison

