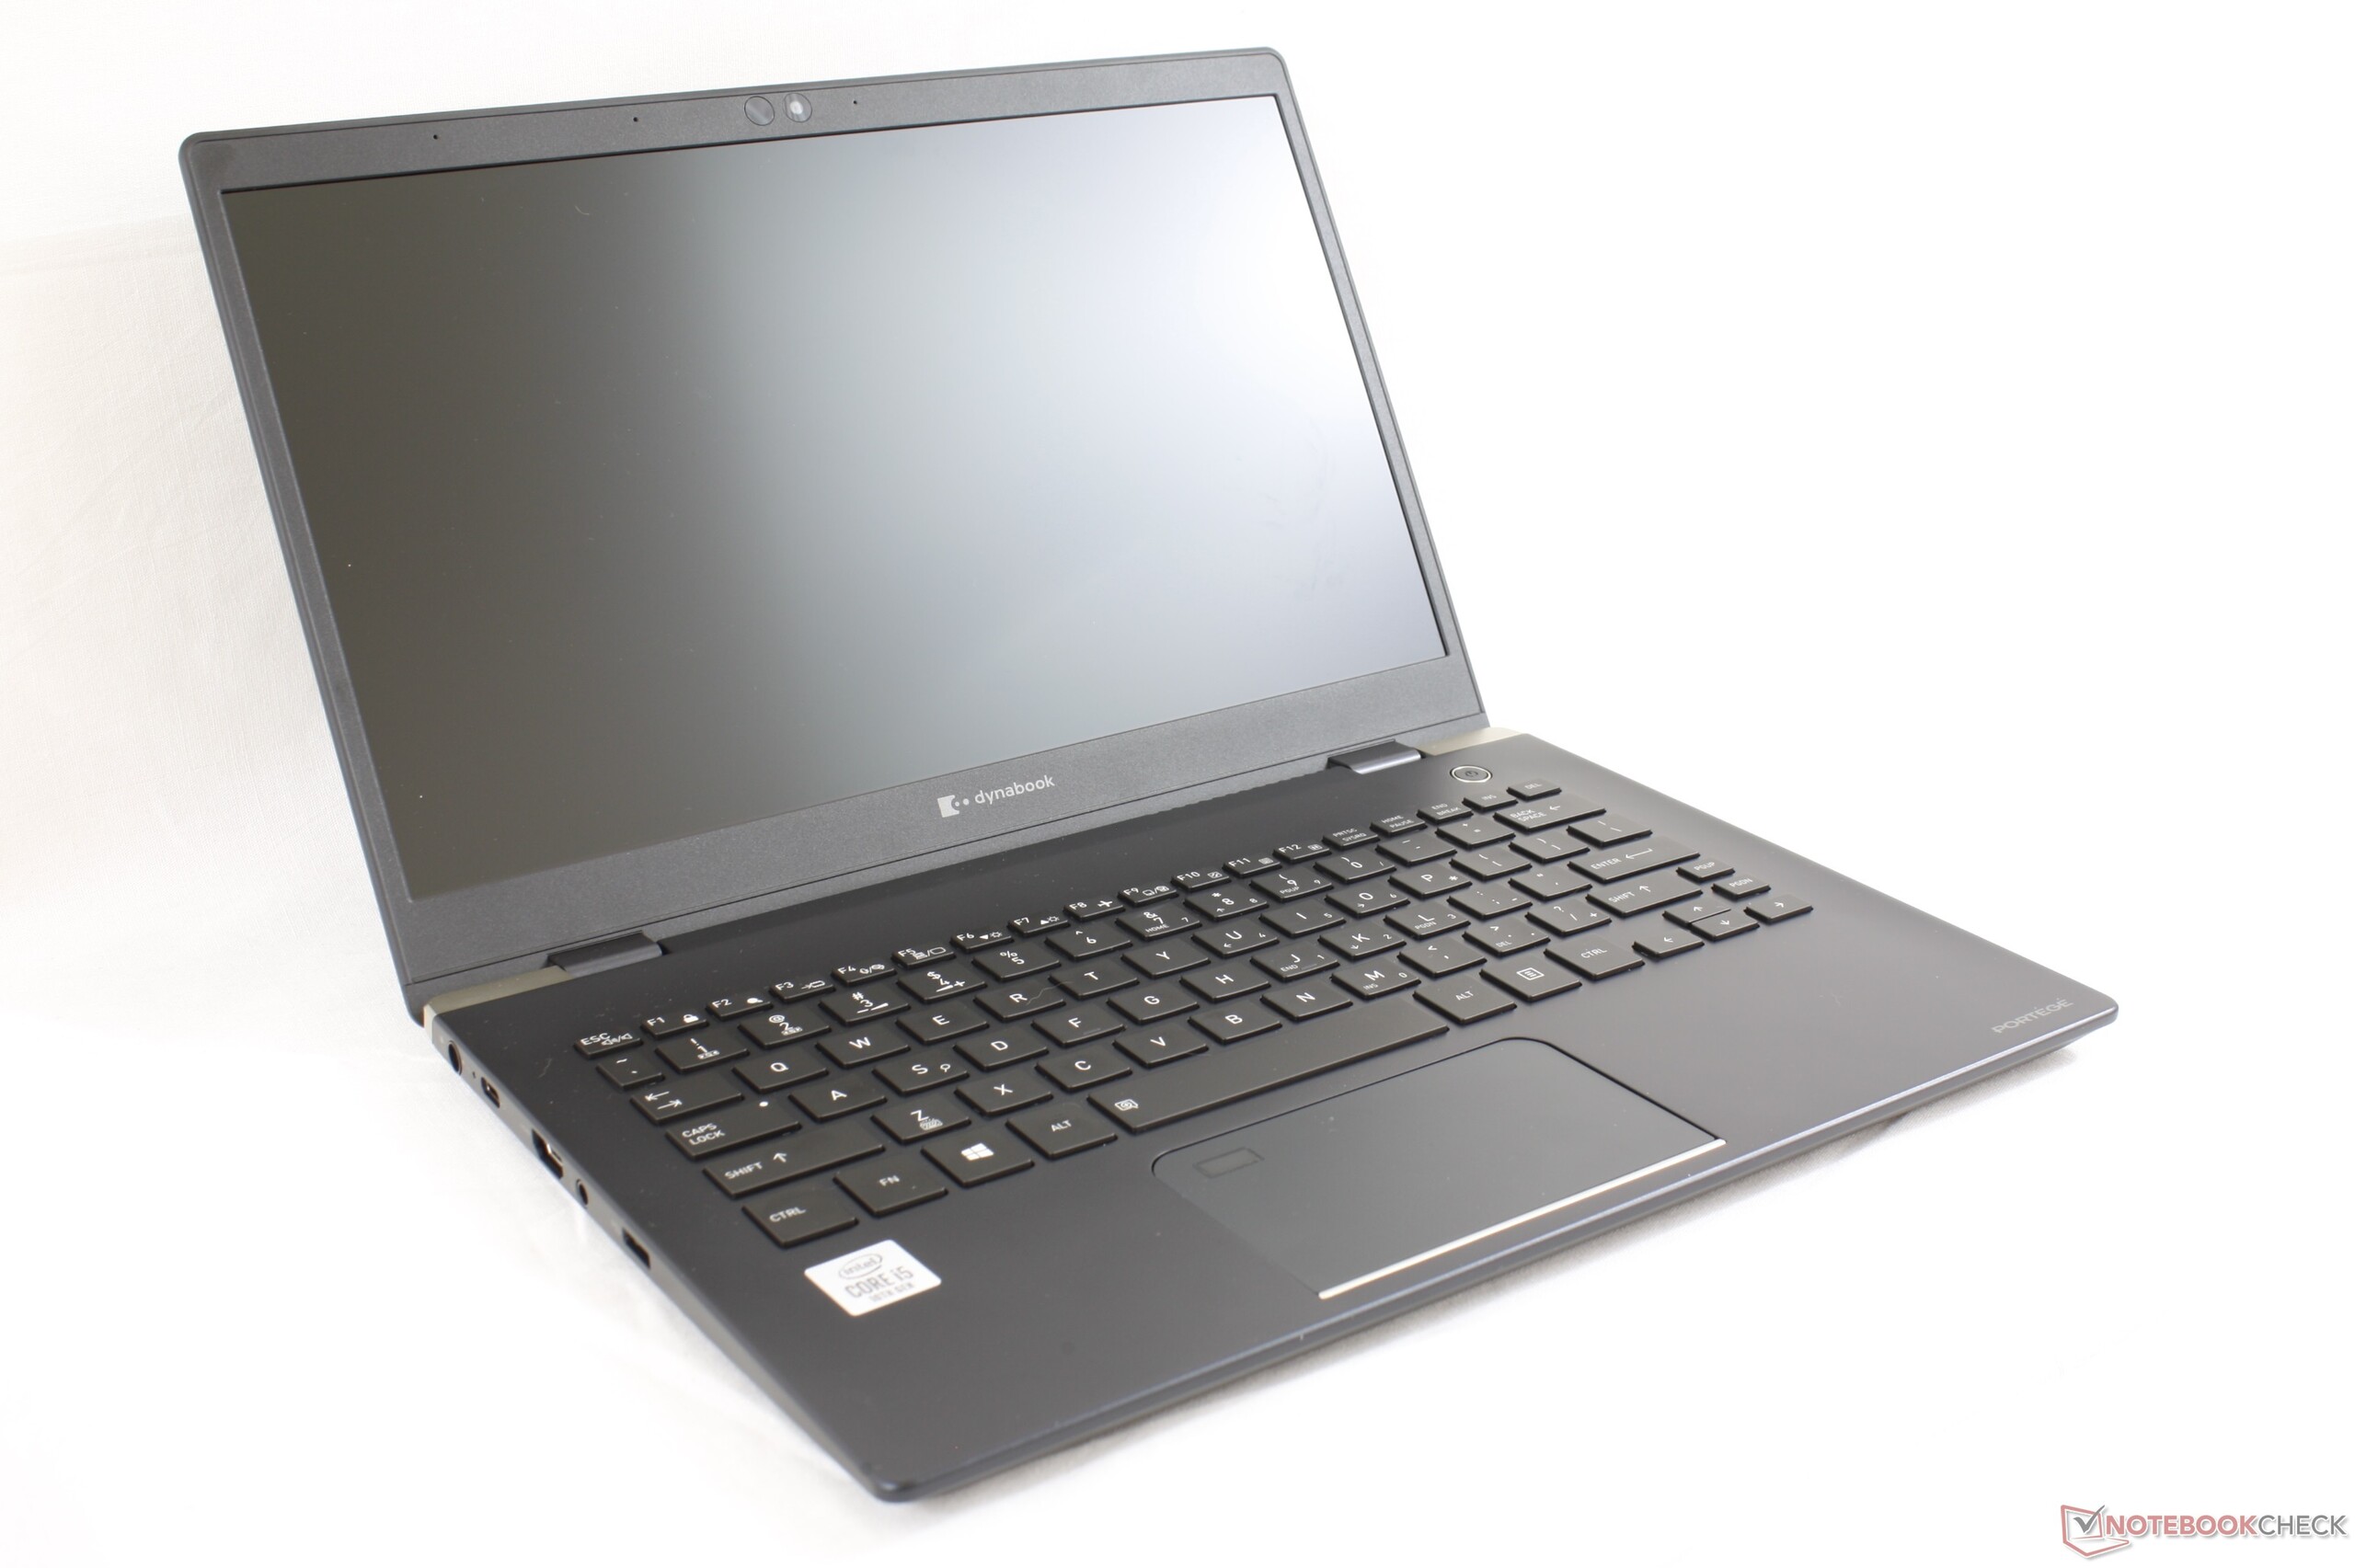
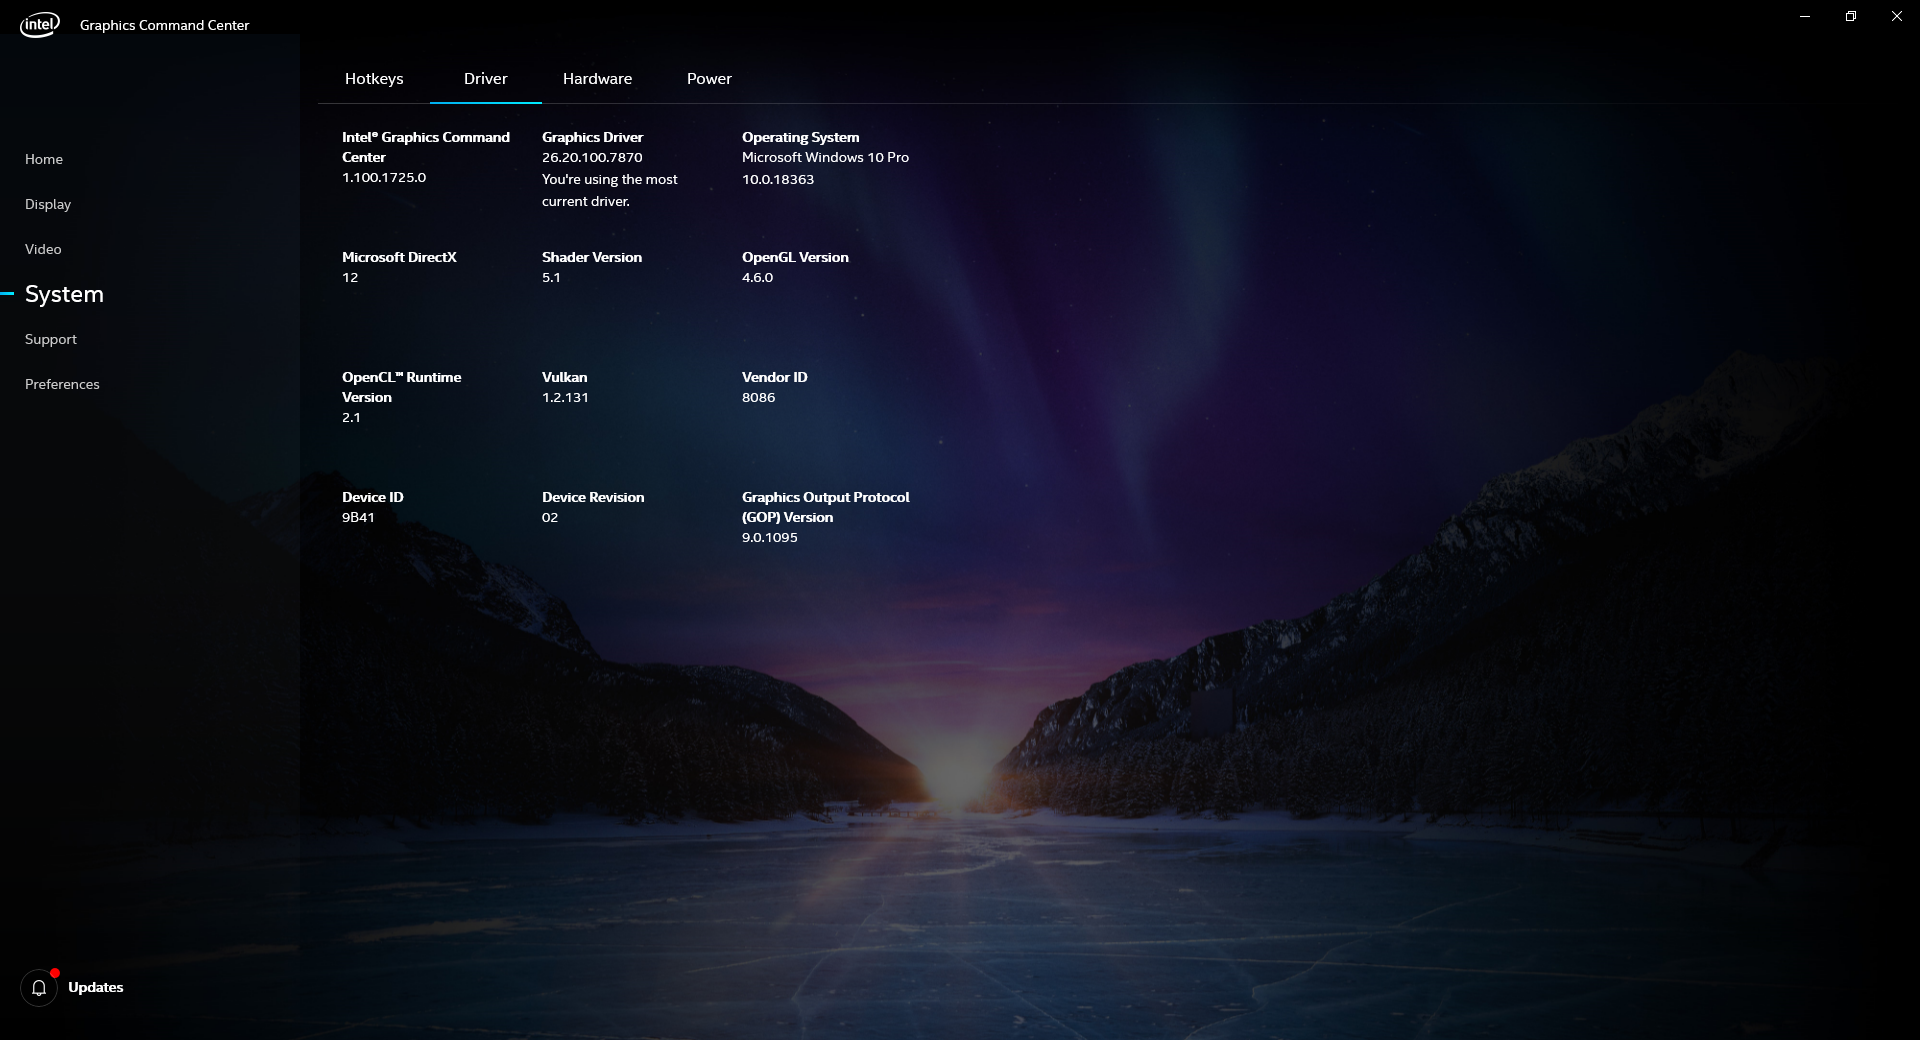
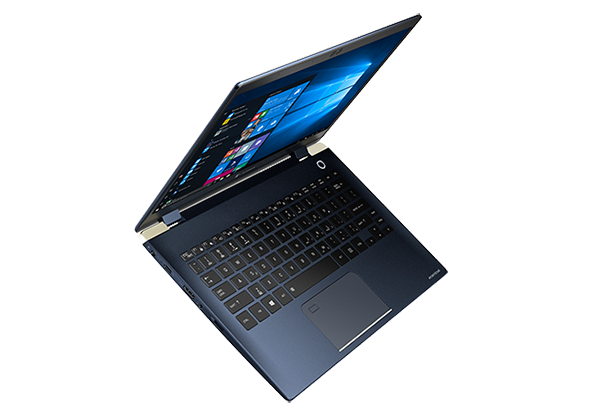
Kort testrapport Dynabook Portege X30L-G Laptop: een nieuwe lichtgewicht maatstaf
Evaluatie | Datum | Model | Gewicht | Hoogte | Formaat | Resolutie | Beste prijs |
|---|---|---|---|---|---|---|---|
| 85.1 % v7 (old) | 05-2020 | Dynabook Portege X30L-G1331 i5-10210U, UHD Graphics 620 | 859 g | 17.9 mm | 13.30" | 1920x1080 | |
| 88.9 % v7 (old) | 04-2020 | Dell XPS 13 9300 Core i7-1065G7 i7-1065G7, Iris Plus Graphics G7 (Ice Lake 64 EU) | 1.2 kg | 14.8 mm | 13.40" | 1920x1200 | |
| 81.9 % v6 (old) | 04-2018 | LG Gram 13Z980-A i5-8250U, UHD Graphics 620 | 965 g | 15 mm | 13.30" | 1920x1080 | |
| 86 % v7 (old) | 07-2019 | Lenovo ThinkBook 13s-20R90071GE i5-8265U, UHD Graphics 620 | 1.3 kg | 15.9 mm | 13.30" | 1920x1080 | |
| 88.2 % v6 (old) | 07-2018 | HP EliteBook 830 G5-3JX74EA i5-8550U, UHD Graphics 620 | 1.3 kg | 17.7 mm | 13.30" | 1920x1080 |
| SD Card Reader | |
| average JPG Copy Test (av. of 3 runs) | |
| HP EliteBook 1050 G1-4QY20EA (Toshiba Exceria Pro SDXC 64 GB UHS-II) | |
| Dell XPS 13 9300 Core i7-1065G7 (Toshiba Exceria Pro M501 64 GB UHS-II) | |
| Dynabook Portege X30L-G1331 (Toshiba Exceria Pro M501 64 GB UHS-II) | |
| LG Gram 13Z980-A (Toshiba Exceria Pro M501 UHS-II) | |
| maximum AS SSD Seq Read Test (1GB) | |
| HP EliteBook 1050 G1-4QY20EA (Toshiba Exceria Pro SDXC 64 GB UHS-II) | |
| Dell XPS 13 9300 Core i7-1065G7 (Toshiba Exceria Pro M501 64 GB UHS-II) | |
| LG Gram 13Z980-A (Toshiba Exceria Pro M501 UHS-II) | |
| Dynabook Portege X30L-G1331 (Toshiba Exceria Pro M501 64 GB UHS-II) | |


| |||||||||||||||||||||||||
Helderheidsverdeling: 91 %
Helderheid in Batterij-modus: 482 cd/m²
Contrast: 1205:1 (Zwart: 0.4 cd/m²)
ΔE ColorChecker Calman: 1.85 | ∀{0.5-29.43 Ø4.73}
calibrated: 1.2
ΔE Greyscale Calman: 2 | ∀{0.09-98 Ø4.97}
97.7% sRGB (Argyll 1.6.3 3D)
62.5% AdobeRGB 1998 (Argyll 1.6.3 3D)
67.8% AdobeRGB 1998 (Argyll 3D)
97.6% sRGB (Argyll 3D)
66.9% Display P3 (Argyll 3D)
Gamma: 2.1
CCT: 6822 K
| Dynabook Portege X30L-G1331 Toshiba TOS508F, IPS, 13.3", 1920x1080 | Dell XPS 13 9300 Core i7-1065G7 Sharp LQ134N1, IPS, 13.4", 1920x1200 | LG Gram 13Z980-A LG LP133WF6-SPC1, IPS, 13.3", 1920x1080 | Apple MacBook Pro 13 2019 2TB3 APPA03D, IPS, 13.3", 2560x1600 | Lenovo ThinkBook 13s-20R90071GE N133HCE-EN2, a-Si IPS LED, 13.3", 1920x1080 | HP EliteBook 830 G5-3JX74EA IVO M133NVF3-R0, IPS LED, 13.3", 1920x1080 | |
|---|---|---|---|---|---|---|
| Display | 0% | 0% | 24% | 1% | -6% | |
| Display P3 Coverage (%) | 66.9 | 66.3 -1% | 66.9 0% | 96.1 44% | 67 0% | 64.2 -4% |
| sRGB Coverage (%) | 97.6 | 97.3 0% | 97.3 0% | 99.4 2% | 99.1 2% | 89.2 -9% |
| AdobeRGB 1998 Coverage (%) | 67.8 | 68.5 1% | 67.9 0% | 85.6 26% | 69.2 2% | 65.2 -4% |
| Response Times | 8% | 27% | 5% | 23% | 32% | |
| Response Time Grey 50% / Grey 80% * (ms) | 54.8 ? | 50 ? 9% | 37.6 ? 31% | 50.4 ? 8% | 40.4 ? 26% | 36 ? 34% |
| Response Time Black / White * (ms) | 35.6 ? | 33.2 ? 7% | 27.6 ? 22% | 35.2 ? 1% | 28.8 ? 19% | 24.8 ? 30% |
| PWM Frequency (Hz) | 23810 ? | 2500 ? | 116300 ? | 25000 ? | 1020 ? | |
| Screen | -30% | -37% | 16% | -19% | -66% | |
| Brightness middle (cd/m²) | 482 | 607.6 26% | 347.8 -28% | 603 25% | 319 -34% | 316 -34% |
| Brightness (cd/m²) | 452 | 595 32% | 331 -27% | 577 28% | 309 -32% | 326 -28% |
| Brightness Distribution (%) | 91 | 96 5% | 89 -2% | 92 1% | 92 1% | 85 -7% |
| Black Level * (cd/m²) | 0.4 | 0.4 -0% | 0.36 10% | 0.35 13% | 0.28 30% | 0.19 52% |
| Contrast (:1) | 1205 | 1519 26% | 966 -20% | 1723 43% | 1139 -5% | 1663 38% |
| Colorchecker dE 2000 * | 1.85 | 3.23 -75% | 2.37 -28% | 1.7 8% | 2.4 -30% | 4.5 -143% |
| Colorchecker dE 2000 max. * | 3.08 | 8.67 -181% | 4.21 -37% | 3.1 -1% | 6.3 -105% | 12.1 -293% |
| Colorchecker dE 2000 calibrated * | 1.2 | 1.01 16% | 4.21 -251% | 0.7 42% | 0.6 50% | 2.9 -142% |
| Greyscale dE 2000 * | 2 | 5.5 -175% | 2.5 -25% | 2.1 -5% | 3.8 -90% | 5 -150% |
| Gamma | 2.1 105% | 2.12 104% | 2.15 102% | 2.18 101% | 2.16 102% | 2.22 99% |
| CCT | 6822 95% | 6413 101% | 6384 102% | 6843 95% | 7335 89% | 6018 108% |
| Color Space (Percent of AdobeRGB 1998) (%) | 62.5 | 63 1% | 62.5 0% | 76.7 23% | 63.5 2% | 57.9 -7% |
| Color Space (Percent of sRGB) (%) | 97.7 | 97.5 0% | 97 -1% | 99.4 2% | 99.1 1% | 87.3 -11% |
| Totaal Gemiddelde (Programma / Instellingen) | -7% /
-19% | -3% /
-22% | 15% /
16% | 2% /
-10% | -13% /
-42% |
* ... kleiner is beter
Responstijd Scherm
| ↔ Responstijd Zwart naar Wit | ||
|---|---|---|
| 35.6 ms ... stijging ↗ en daling ↘ gecombineerd | ↗ 19.2 ms stijging | 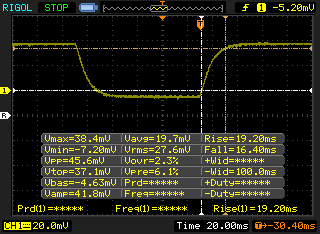 |
| ↘ 16.4 ms daling | ||
| Het scherm vertoonde trage responstijden in onze tests en is misschien te traag voor games. Ter vergelijking: alle testtoestellen variëren van 0.1 (minimum) tot 240 (maximum) ms. » 93 % van alle toestellen zijn beter. Dit betekent dat de gemeten responstijd slechter is dan het gemiddelde (19.9 ms) van alle geteste toestellen. | ||
| ↔ Responstijd 50% Grijs naar 80% Grijs | ||
| 54.8 ms ... stijging ↗ en daling ↘ gecombineerd | ↗ 26 ms stijging | 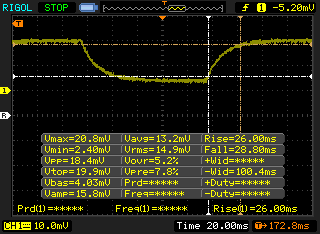 |
| ↘ 28.8 ms daling | ||
| Het scherm vertoonde trage responstijden in onze tests en is misschien te traag voor games. Ter vergelijking: alle testtoestellen variëren van 0.165 (minimum) tot 636 (maximum) ms. » 91 % van alle toestellen zijn beter. Dit betekent dat de gemeten responstijd slechter is dan het gemiddelde (31.1 ms) van alle geteste toestellen. | ||
Screen Flickering / PWM (Pulse-Width Modulation)
| Screen flickering / PWM waargenomen | 23810 Hz | ≤ 24 % helderheid instelling | 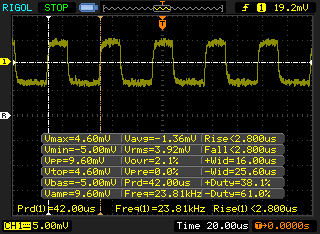 |
De achtergrondverlichting van het scherm flikkert op 23810 Hz (in het slechtste geval, bijvoorbeeld bij gebruik van PWM) aan een helderheid van 24 % en lager. Boven deze helderheid zou er geen flickering / PWM mogen optreden. De frequentie van 23810 Hz is redelijk hoog en de meeste mensen die gevoelig zijn aan flickering zouden dit dus niet mogen waarnemen of geïrriteerde ogen krijgen. Ter vergelijking: 52 % van alle geteste toestellen maakten geen gebruik van PWM om de schermhelderheid te verlagen. Als het wel werd gebruikt, werd een gemiddelde van 7794 (minimum: 5 - maximum: 343500) Hz waargenomen. | |||
Cinebench R15: CPU Multi 64Bit | CPU Single 64Bit
Blender: v2.79 BMW27 CPU
7-Zip 18.03: 7z b 4 -mmt1 | 7z b 4
Geekbench 5.5: Single-Core | Multi-Core
HWBOT x265 Benchmark v2.2: 4k Preset
LibreOffice : 20 Documents To PDF
R Benchmark 2.5: Overall mean
| Cinebench R20 / CPU (Multi Core) | |
| Dell XPS 13 7390 Core i7-10710U | |
| Lenovo ThinkPad X1 Carbon G7 20R1-000YUS | |
| Dell XPS 13 9300 i5 FHD | |
| Dell Inspiron 15 5000 5585 | |
| Honor Magicbook 14 | |
| Dell XPS 13 9300 4K UHD | |
| Gemiddeld Intel Core i5-10210U (722 - 1820, n=30) | |
| Dynabook Portégé X30-F-10N | |
| Dynabook Portege A30-E-174 | |
| Dynabook Portege X30L-G1331 | |
| Dell Latitude 13 3390 | |
| Cinebench R20 / CPU (Single Core) | |
| Dell XPS 13 7390 Core i7-10710U | |
| Dell XPS 13 9300 4K UHD | |
| Lenovo ThinkPad X1 Carbon G7 20R1-000YUS | |
| Dell XPS 13 9300 i5 FHD | |
| Dynabook Portege X30L-G1331 | |
| Gemiddeld Intel Core i5-10210U (322 - 428, n=30) | |
| Dynabook Portégé X30-F-10N | |
| Dynabook Portege A30-E-174 | |
| Honor Magicbook 14 | |
| Dell Latitude 13 3390 | |
| Dell Inspiron 15 5000 5585 | |
| Cinebench R15 / CPU Multi 64Bit | |
| Dell XPS 13 7390 Core i7-10710U | |
| Lenovo ThinkPad X1 Carbon G7 20R1-000YUS | |
| Dell XPS 13 9300 4K UHD | |
| Dell Inspiron 15 5000 5585 | |
| Honor Magicbook 14 | |
| Dell XPS 13 9300 i5 FHD | |
| Dell XPS 13 9300 i5 FHD | |
| Gemiddeld Intel Core i5-10210U (320 - 790, n=35) | |
| Dell Latitude 13 3390 | |
| Dynabook Portégé X30-F-10N | |
| Dynabook Portege A30-E-174 | |
| Dynabook Portege X30L-G1331 | |
| Cinebench R15 / CPU Single 64Bit | |
| Lenovo ThinkPad X1 Carbon G7 20R1-000YUS | |
| Dell XPS 13 9300 4K UHD | |
| Dell XPS 13 7390 Core i7-10710U | |
| Dell XPS 13 9300 i5 FHD | |
| Dynabook Portege X30L-G1331 | |
| Gemiddeld Intel Core i5-10210U (134 - 174, n=35) | |
| Dynabook Portégé X30-F-10N | |
| Dynabook Portege A30-E-174 | |
| Honor Magicbook 14 | |
| Dell Latitude 13 3390 | |
| Dell Inspiron 15 5000 5585 | |
| Blender / v2.79 BMW27 CPU | |
| Dell Latitude 13 3390 | |
| Dynabook Portege X30L-G1331 | |
| Gemiddeld Intel Core i5-10210U (585 - 1339, n=24) | |
| Dell XPS 13 9300 i5 FHD | |
| Honor Magicbook 14 | |
| Dell XPS 13 9300 4K UHD | |
| Dell XPS 13 7390 Core i7-10710U | |
| 7-Zip 18.03 / 7z b 4 -mmt1 | |
| Dell XPS 13 9300 4K UHD | |
| Dell XPS 13 7390 Core i7-10710U | |
| Dynabook Portege X30L-G1331 | |
| Gemiddeld Intel Core i5-10210U (3504 - 4467, n=24) | |
| Dell XPS 13 9300 i5 FHD | |
| Dell Latitude 13 3390 | |
| Honor Magicbook 14 | |
| 7-Zip 18.03 / 7z b 4 | |
| Dell XPS 13 7390 Core i7-10710U | |
| Dell XPS 13 9300 4K UHD | |
| Dell XPS 13 9300 i5 FHD | |
| Honor Magicbook 14 | |
| Gemiddeld Intel Core i5-10210U (10920 - 21679, n=24) | |
| Dynabook Portege X30L-G1331 | |
| Dell Latitude 13 3390 | |
| Geekbench 5.5 / Single-Core | |
| Dell XPS 13 9300 4K UHD | |
| Dell XPS 13 9300 i5 FHD | |
| Dynabook Portege X30L-G1331 | |
| Gemiddeld Intel Core i5-10210U (949 - 1133, n=27) | |
| Honor Magicbook 14 | |
| Geekbench 5.5 / Multi-Core | |
| Dell XPS 13 9300 4K UHD | |
| Dell XPS 13 9300 i5 FHD | |
| Dynabook Portege X30L-G1331 | |
| Gemiddeld Intel Core i5-10210U (2079 - 4256, n=27) | |
| Honor Magicbook 14 | |
| HWBOT x265 Benchmark v2.2 / 4k Preset | |
| Dell XPS 13 9300 4K UHD | |
| Dell XPS 13 7390 Core i7-10710U | |
| Gemiddeld Intel Core i5-10210U (2.36 - 6.28, n=24) | |
| Dell XPS 13 9300 i5 FHD | |
| Dynabook Portege X30L-G1331 | |
| Honor Magicbook 14 | |
| Dell Latitude 13 3390 | |
| LibreOffice / 20 Documents To PDF | |
| Dell XPS 13 9300 4K UHD | |
| Gemiddeld Intel Core i5-10210U (49.6 - 80.3, n=18) | |
| Dynabook Portege X30L-G1331 | |
| R Benchmark 2.5 / Overall mean | |
| Honor Magicbook 14 | |
| Gemiddeld Intel Core i5-10210U (0.658 - 0.901, n=24) | |
| Dell XPS 13 9300 i5 FHD | |
| Dynabook Portege X30L-G1331 | |
| Dell XPS 13 9300 4K UHD | |
* ... kleiner is beter
| PCMark 8 Home Score Accelerated v2 | 3641 punten | |
| PCMark 8 Work Score Accelerated v2 | 5039 punten | |
| PCMark 10 Score | 4217 punten | |
Help | ||
| DPC Latencies / LatencyMon - interrupt to process latency (max), Web, Youtube, Prime95 | |
| Dynabook Portege X30L-G1331 | |
* ... kleiner is beter
| Dynabook Portege X30L-G1331 Samsung SSD PM981a MZVLB512HBJQ | Dell XPS 13 9300 Core i7-1065G7 Intel SSDPEMKF512G8 NVMe SSD | LG Gram 13Z980-A SK Hynix HFS256G39TND-N210A | Apple MacBook Pro 13 2019 2TB3 Apple SSD AP0256 | Lenovo ThinkBook 13s-20R90071GE SK hynix BC501 HFM512GDHTNG-8310A | |
|---|---|---|---|---|---|
| AS SSD | -36% | -83% | -105% | -38% | |
| Seq Read (MB/s) | 2067 | 1956 -5% | 496.4 -76% | 974 -53% | 1264 -39% |
| Seq Write (MB/s) | 2444 | 1227 -50% | 241.7 -90% | 1340 -45% | 518 -79% |
| 4K Read (MB/s) | 55.8 | 63 13% | 27.16 -51% | 11.35 -80% | 40.31 -28% |
| 4K Write (MB/s) | 124.6 | 156.6 26% | 61 -51% | 15.95 -87% | 119.1 -4% |
| 4K-64 Read (MB/s) | 1601 | 475.6 -70% | 376.7 -76% | 643 -60% | 772 -52% |
| 4K-64 Write (MB/s) | 1696 | 539 -68% | 231.3 -86% | 163 -90% | 672 -60% |
| Access Time Read * (ms) | 0.048 | 0.042 12% | 0.084 -75% | 0.316 -558% | 0.046 4% |
| Access Time Write * (ms) | 0.091 | 0.105 -15% | 0.235 -158% | 0.258 -184% | 0.031 66% |
| Score Read (Points) | 1864 | 734 -61% | 453 -76% | 752 -60% | 939 -50% |
| Score Write (Points) | 2065 | 818 -60% | 316 -85% | 313 -85% | 843 -59% |
| Score Total (Points) | 4908 | 1915 -61% | 997 -80% | 1465 -70% | 2234 -54% |
| Copy ISO MB/s (MB/s) | 2051 | 1022 -50% | 204.5 -90% | 1404 -32% | 943 -54% |
| Copy Program MB/s (MB/s) | 572 | 302.8 -47% | 127.6 -78% | 406.9 -29% | 292.2 -49% |
| Copy Game MB/s (MB/s) | 1447 | 491.4 -66% | 191.7 -87% | 850 -41% | 374.1 -74% |
| CrystalDiskMark 5.2 / 6 | 3% | -68% | -41% | ||
| Write 4K (MB/s) | 164.1 | 186.8 14% | 73.9 -55% | 89.3 -46% | |
| Read 4K (MB/s) | 49.34 | 71.4 45% | 25.67 -48% | 37.4 -24% | |
| Write Seq (MB/s) | 1777 | 1203 -32% | 255.2 -86% | 608 -66% | |
| Read Seq (MB/s) | 1752 | 2600 48% | 480.7 -73% | 1019 -42% | |
| Write 4K Q32T1 (MB/s) | 401.1 | 514 28% | 197.2 -51% | 487.9 22% | |
| Read 4K Q32T1 (MB/s) | 498.7 | 570 14% | 214.4 -57% | 284.8 -43% | |
| Write Seq Q32T1 (MB/s) | 2988 | 786 -74% | 254.9 -91% | 872 -71% | |
| Read Seq Q32T1 (MB/s) | 3544 | 2947 -17% | 554 -84% | 1635 -54% | |
| Write 4K Q8T8 (MB/s) | 387.3 | ||||
| Read 4K Q8T8 (MB/s) | 757 | ||||
| Totaal Gemiddelde (Programma / Instellingen) | -17% /
-22% | -76% /
-77% | -105% /
-105% | -40% /
-39% |
* ... kleiner is beter

Disk Throttling: DiskSpd Read Loop, Queue Depth 8
| 3DMark 11 Performance | 2008 punten | |
| 3DMark Fire Strike Score | 1173 punten | |
| 3DMark Time Spy Score | 460 punten | |
Help | ||
| lage | gem. | hoge | ultra | |
|---|---|---|---|---|
| Dota 2 Reborn (2015) | 71.5 | 45.3 | 21.1 | 18.8 |
| X-Plane 11.11 (2018) | 21.9 | 14.9 | 13.2 |
| Dynabook Portege X30L-G1331 UHD Graphics 620, i5-10210U, Samsung SSD PM981a MZVLB512HBJQ | Dell XPS 13 9300 Core i7-1065G7 Iris Plus Graphics G7 (Ice Lake 64 EU), i7-1065G7, Intel SSDPEMKF512G8 NVMe SSD | LG Gram 13Z980-A UHD Graphics 620, i5-8250U, SK Hynix HFS256G39TND-N210A | Apple MacBook Pro 13 2019 2TB3 Iris Plus Graphics 645, i5-8257U, Apple SSD AP0256 | Lenovo ThinkBook 13s-20R90071GE UHD Graphics 620, i5-8265U, SK hynix BC501 HFM512GDHTNG-8310A | HP EliteBook 830 G5-3JX74EA UHD Graphics 620, i5-8550U, Samsung SSD PM961 1TB M.2 PCIe 3.0 x4 NVMe (MZVLW1T0) | |
|---|---|---|---|---|---|---|
| Noise | -0% | 1% | -3% | -1% | -2% | |
| uit / omgeving * (dB) | 28.5 | 28.3 1% | 28.1 1% | 29.5 -4% | 28.8 -1% | 29.3 -3% |
| Idle Minimum * (dB) | 28.5 | 28.3 1% | 28.1 1% | 29.5 -4% | 28.8 -1% | 29.3 -3% |
| Idle Average * (dB) | 28.5 | 28.3 1% | 28.1 1% | 29.5 -4% | 28.8 -1% | 29.3 -3% |
| Idle Maximum * (dB) | 28.5 | 28.3 1% | 28.1 1% | 29.5 -4% | 29.7 -4% | 29.3 -3% |
| Load Average * (dB) | 32 | 32.5 -2% | 34.3 -7% | 31.1 3% | 30.7 4% | 33.2 -4% |
| Load Maximum * (dB) | 38 | 39.3 -3% | 34.3 10% | 39.3 -3% | 38.3 -1% | 36.1 5% |
| Witcher 3 ultra * (dB) | 39.3 |
* ... kleiner is beter
Geluidsniveau
| Onbelast |
| 28.5 / 28.5 / 28.5 dB (A) |
| Belasting |
| 32 / 38 dB (A) |
 | ||
30 dB stil 40 dB(A) hoorbaar 50 dB(A) luid |
||
min: | ||
(±) De maximumtemperatuur aan de bovenzijde bedraagt 41.2 °C / 106 F, vergeleken met het gemiddelde van 34.3 °C / 94 F, variërend van 21.2 tot 62.5 °C voor de klasse Office.
(±) De bodem warmt op tot een maximum van 44 °C / 111 F, vergeleken met een gemiddelde van 36.8 °C / 98 F
(+) Bij onbelast gebruik bedraagt de gemiddelde temperatuur voor de bovenzijde 28.5 °C / 83 F, vergeleken met het apparaatgemiddelde van 29.5 °C / 85 F.
(+) De palmsteunen en het touchpad zijn met een maximum van ###max## °C / 78.8 F koeler dan de huidtemperatuur en voelen daarom koel aan.
(±) De gemiddelde temperatuur van de handpalmsteun van soortgelijke toestellen bedroeg 27.5 °C / 81.5 F (+1.5 °C / 2.7 F).
Dynabook Portege X30L-G1331 audioanalyse
(+) | luidsprekers kunnen relatief luid spelen (83.1 dB)
Bas 100 - 315 Hz
(-) | bijna geen lage tonen - gemiddeld 29.8% lager dan de mediaan
(±) | lineariteit van de lage tonen is gemiddeld (8.6% delta ten opzichte van de vorige frequentie)
Midden 400 - 2000 Hz
(±) | lagere middens - gemiddeld 6.8% lager dan de mediaan
(±) | lineariteit van de middentonen is gemiddeld (8.5% delta ten opzichte van de vorige frequentie)
Hoog 2 - 16 kHz
(+) | evenwichtige hoogtepunten - slechts 3.2% verwijderd van de mediaan
(+) | de hoge tonen zijn lineair (5.4% delta naar de vorige frequentie)
Algemeen 100 - 16.000 Hz
(±) | lineariteit van het totale geluid is gemiddeld (26% verschil met de mediaan)
Vergeleken met dezelfde klasse
» 79% van alle geteste apparaten in deze klasse waren beter, 7% vergelijkbaar, 14% slechter
» De beste had een delta van 7%, het gemiddelde was 21%, de slechtste was 53%
Vergeleken met alle geteste toestellen
» 80% van alle geteste apparaten waren beter, 4% gelijk, 16% slechter
» De beste had een delta van 4%, het gemiddelde was 24%, de slechtste was 134%
Apple MacBook 12 (Early 2016) 1.1 GHz audioanalyse
(+) | luidsprekers kunnen relatief luid spelen (83.6 dB)
Bas 100 - 315 Hz
(±) | verminderde zeebaars - gemiddeld 11.3% lager dan de mediaan
(±) | lineariteit van de lage tonen is gemiddeld (14.2% delta ten opzichte van de vorige frequentie)
Midden 400 - 2000 Hz
(+) | evenwichtige middens - slechts 2.4% verwijderd van de mediaan
(+) | de middentonen zijn lineair (5.5% delta ten opzichte van de vorige frequentie)
Hoog 2 - 16 kHz
(+) | evenwichtige hoogtepunten - slechts 2% verwijderd van de mediaan
(+) | de hoge tonen zijn lineair (4.5% delta naar de vorige frequentie)
Algemeen 100 - 16.000 Hz
(+) | het totale geluid is lineair (10.2% verschil met de mediaan)
Vergeleken met dezelfde klasse
» 7% van alle geteste apparaten in deze klasse waren beter, 2% vergelijkbaar, 91% slechter
» De beste had een delta van 5%, het gemiddelde was 18%, de slechtste was 53%
Vergeleken met alle geteste toestellen
» 5% van alle geteste apparaten waren beter, 1% gelijk, 94% slechter
» De beste had een delta van 4%, het gemiddelde was 24%, de slechtste was 134%
| Uit / Standby | |
| Inactief | |
| Belasting |
|
Key:
min: | |
| Dynabook Portege X30L-G1331 i5-10210U, UHD Graphics 620, Samsung SSD PM981a MZVLB512HBJQ, IPS, 1920x1080, 13.3" | Dell XPS 13 9300 Core i7-1065G7 i7-1065G7, Iris Plus Graphics G7 (Ice Lake 64 EU), Intel SSDPEMKF512G8 NVMe SSD, IPS, 1920x1200, 13.4" | LG Gram 13Z980-A i5-8250U, UHD Graphics 620, SK Hynix HFS256G39TND-N210A, IPS, 1920x1080, 13.3" | Apple MacBook Pro 13 2019 2TB3 i5-8257U, Iris Plus Graphics 645, Apple SSD AP0256, IPS, 2560x1600, 13.3" | Lenovo ThinkBook 13s-20R90071GE i5-8265U, UHD Graphics 620, SK hynix BC501 HFM512GDHTNG-8310A, a-Si IPS LED, 1920x1080, 13.3" | HP EliteBook 830 G5-3JX74EA i5-8550U, UHD Graphics 620, Samsung SSD PM961 1TB M.2 PCIe 3.0 x4 NVMe (MZVLW1T0), IPS LED, 1920x1080, 13.3" | |
|---|---|---|---|---|---|---|
| Power Consumption | -16% | -12% | -14% | -2% | -28% | |
| Idle Minimum * (Watt) | 2.8 | 4.2 -50% | 3.9 -39% | 2.1 25% | 3.1 -11% | 4.5 -61% |
| Idle Average * (Watt) | 4.9 | 6.9 -41% | 7.3 -49% | 6.9 -41% | 5.87 -20% | 6.4 -31% |
| Idle Maximum * (Watt) | 9 | 7.5 17% | 7.4 18% | 7.8 13% | 6.6 27% | 9.2 -2% |
| Load Average * (Watt) | 31.2 | 33.3 -7% | 36.1 -16% | 42 -35% | 35.3 -13% | 35.7 -14% |
| Load Maximum * (Watt) | 49.4 | 48.4 2% | 35.8 28% | 64.5 -31% | 46.5 6% | 65.4 -32% |
| Witcher 3 ultra * (Watt) | 37.1 |
* ... kleiner is beter
| Dynabook Portege X30L-G1331 i5-10210U, UHD Graphics 620, 42 Wh | Dell XPS 13 9300 Core i7-1065G7 i7-1065G7, Iris Plus Graphics G7 (Ice Lake 64 EU), 52 Wh | LG Gram 13Z980-A i5-8250U, UHD Graphics 620, 72 Wh | Apple MacBook Pro 13 2019 2TB3 i5-8257U, Iris Plus Graphics 645, 58.2 Wh | Lenovo ThinkBook 13s-20R90071GE i5-8265U, UHD Graphics 620, 45 Wh | HP EliteBook 830 G5-3JX74EA i5-8550U, UHD Graphics 620, 49 Wh | |
|---|---|---|---|---|---|---|
| Batterijduur | 53% | 46% | 57% | 10% | -14% | |
| WiFi v1.3 (h) | 8.3 | 12.7 53% | 12.1 46% | 13 57% | 9.1 10% | 7.1 -14% |
| Load (h) | 1.4 | 2.3 | ||||
| Reader / Idle (h) | 12.8 |
Pro
Contra
Dit is de verkorte versie van het originele artikel. Het volledige, Engelse testrapport vind je hier.
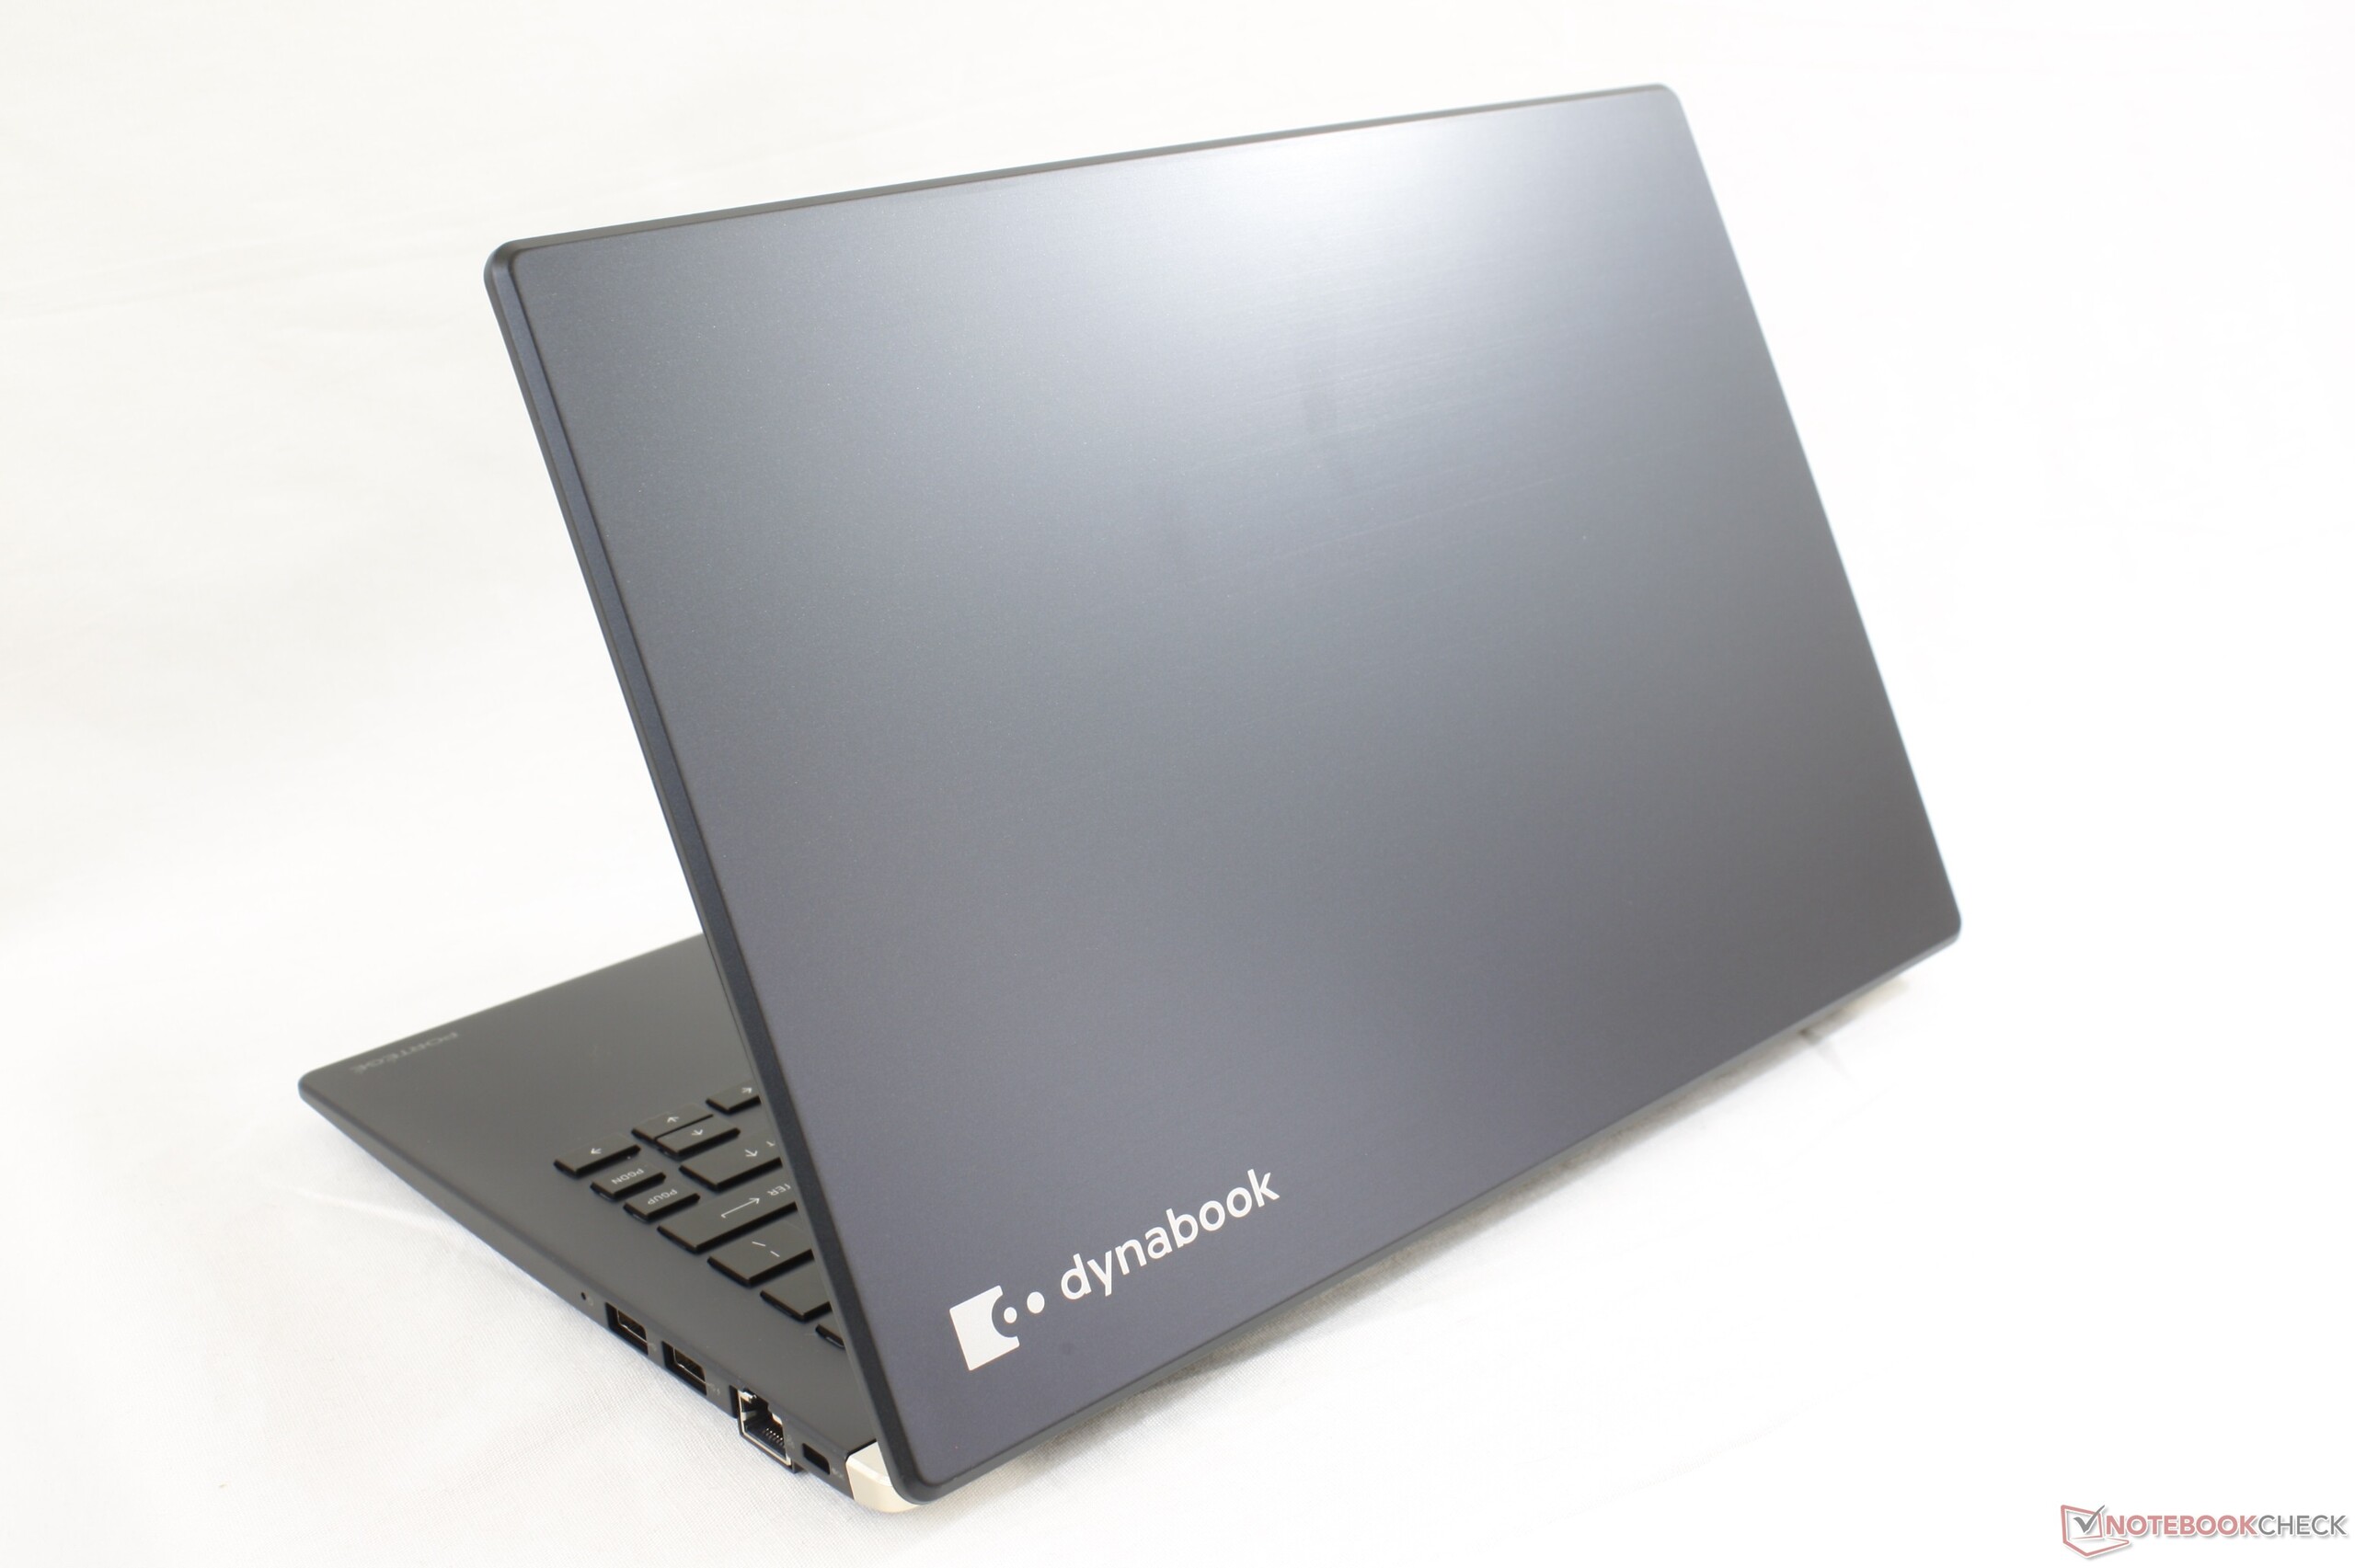
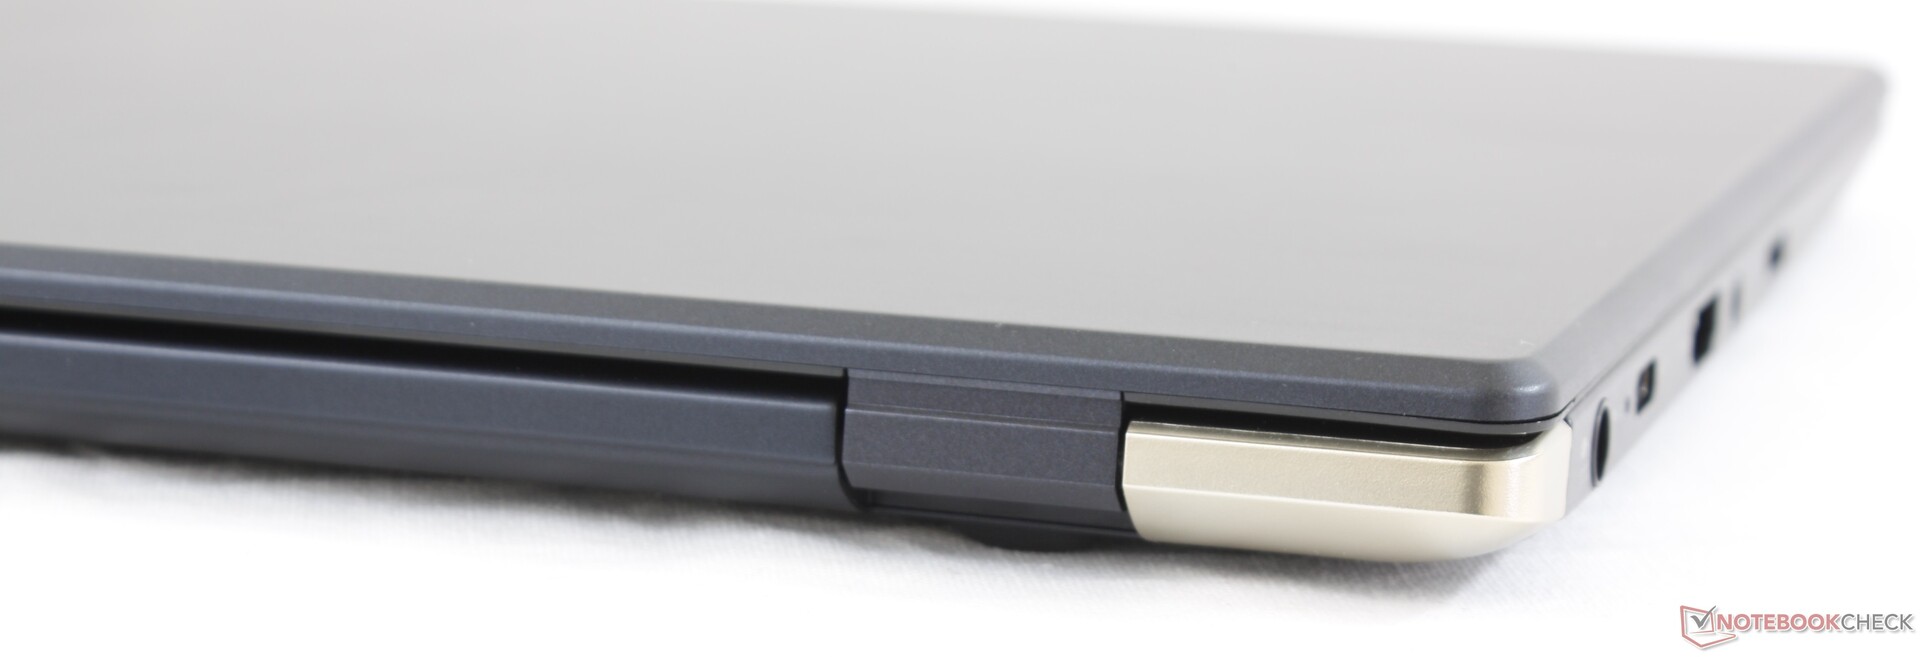
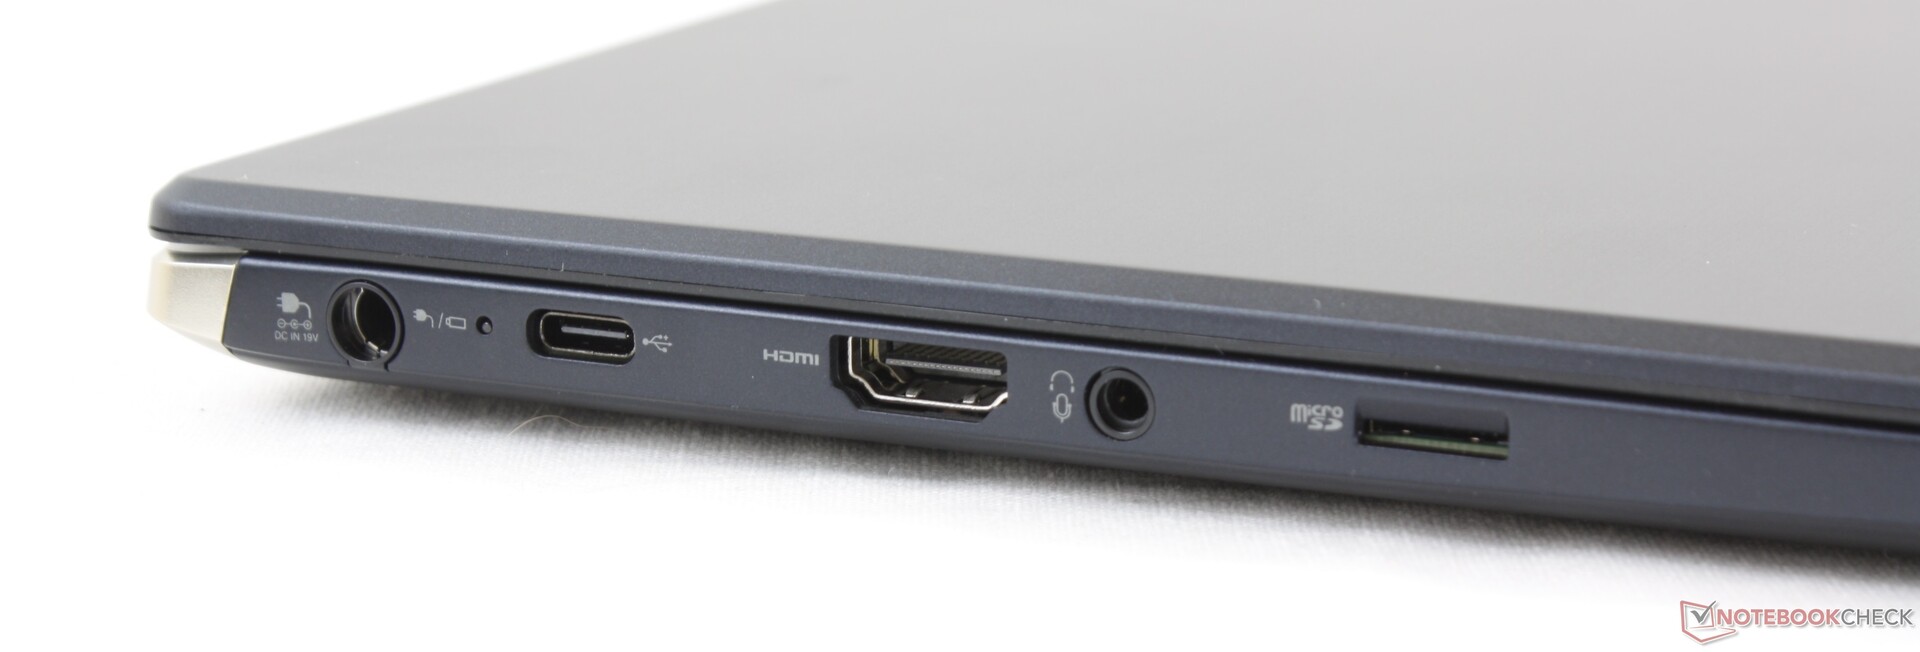
De grootste reden om een Dynabook Portege X30L te bezitten in plaats van alternatieven zoals de HP EliteBook, Dell Latitude of Lenovo ThinkPad X-serie, is het erg lage gewicht. We kunnen niet benadrukken hoeveel verschil een paar honderd gram kan maken, vooral als je je laptop graag overal mee naartoe sleept. Zelfs de LG Gram 13 is niet zo licht als onze Portege en wordt op de markt gebracht als een van de lichtste subnotebooks die je kunt kopen.
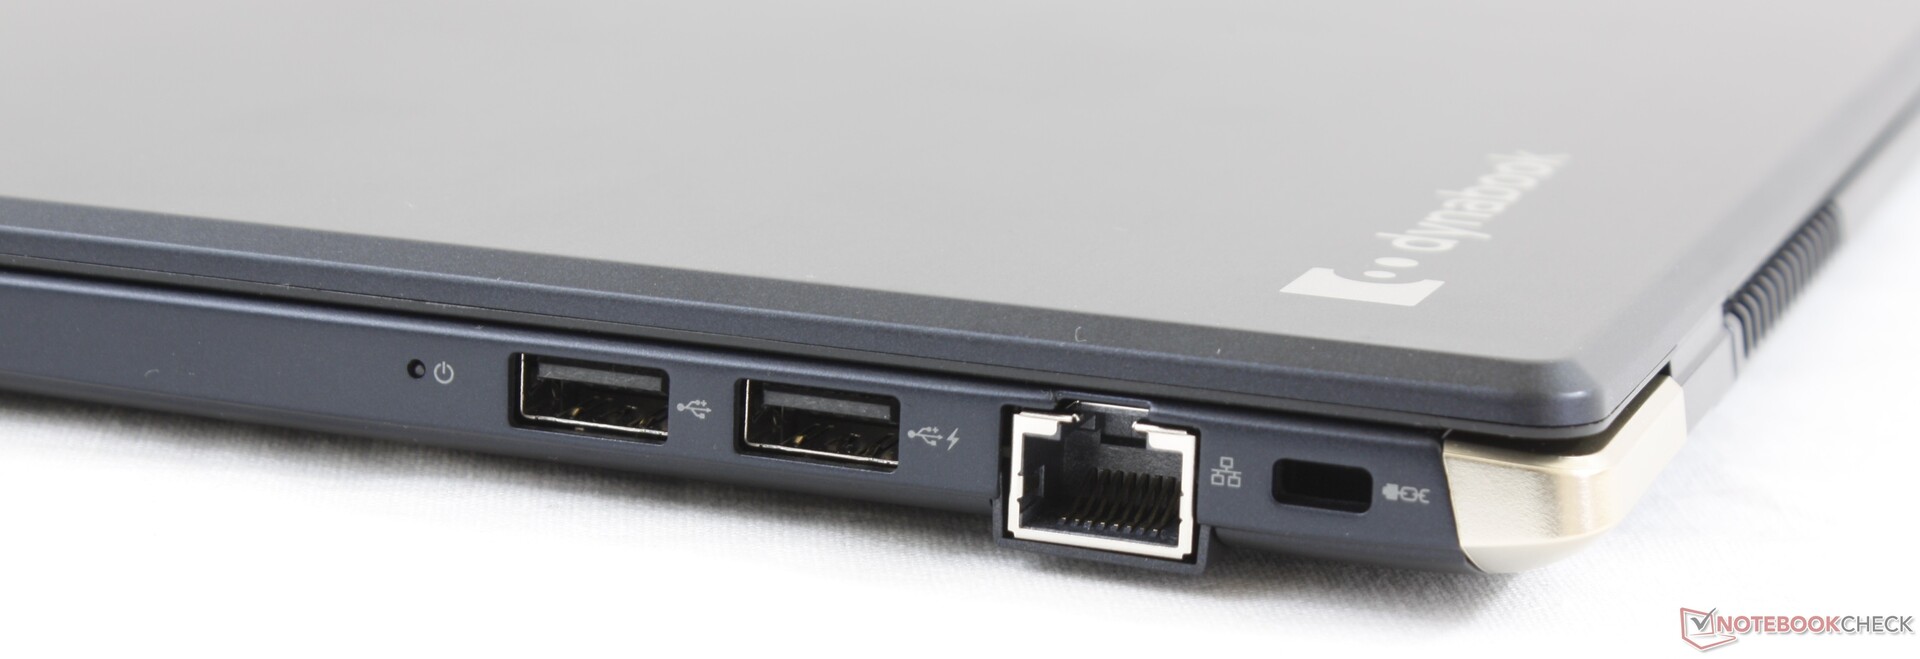
Als gewicht niet je grootste zorg is, bieden andere laptops doorgaans snellere CPU- en GPU-prestaties, stevigere toetsenborden, extra connectiviteitsopties zoals Thunderbolt en WAN, een stijver chassis, een langere batterijduur en gemakkelijker toegang tot de interne SSD. De HP EliteBook x360 1030 is bijvoorbeeld helderder, dunner en veelzijdiger onderweg, hoewel dit ten koste gaat van wat extra gewicht.
De Dynabook Portege X30L werkt het beste wanneer je vaak onderweg bent en een lichtgewicht metgezel wilt die niet beknibbelt op poortopties of kwaliteit. Als je echter het grootste deel van je dag op één plek werkt, zijn er betere opties omdat je het belangrijkste verkoopargument van het systeem niet zou benutten.
Dynabook Portege X30L-G1331
- 18-05-2020 v7 (old)
Allen Ngo
Price comparison
