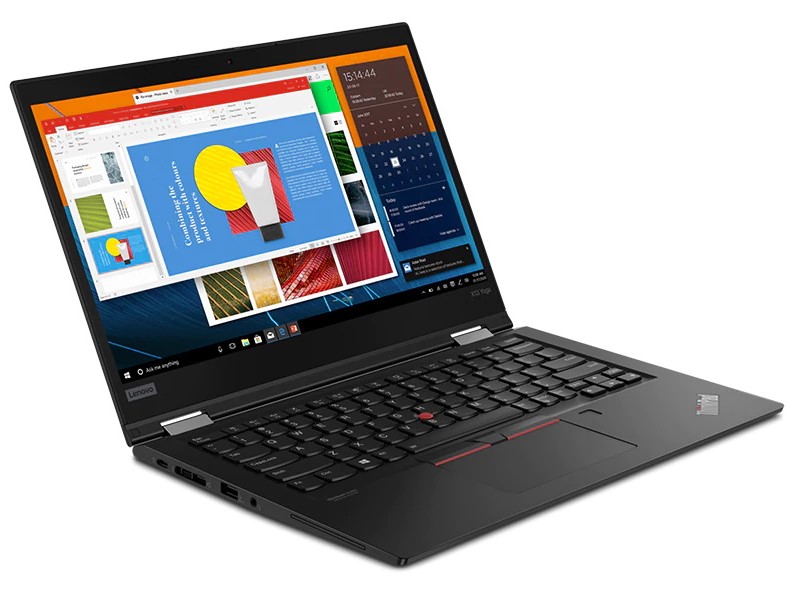
Kort testrapport Lenovo ThinkPad X13 Yoga: Goed uitgerust business-convertible
Evaluatie | Datum | Model | Gewicht | Hoogte | Formaat | Resolutie | Beste prijs |
|---|---|---|---|---|---|---|---|
| 87.9 % v7 (old) | 10-2020 | Lenovo ThinkPad X13 Yoga 20SX0004GE i7-10510U, UHD Graphics 620 | 1.3 kg | 15.95 mm | 13.30" | 1920x1080 | |
| 87.4 % v6 (old) | 06-2019 | Lenovo ThinkPad X390 Yoga-20NQS05R00 i7-8565U, UHD Graphics 620 | 1.3 kg | 15.95 mm | 13.30" | 1920x1080 | |
| 88.1 % v7 (old) | 09-2020 | Acer Spin 5 SP513-54N-79EY i7-1065G7, Iris Plus Graphics G7 (Ice Lake 64 EU) | 1.2 kg | 14.9 mm | 13.50" | 2256x1504 | |
| 80.7 % v7 (old) | 09-2020 | Asus VivoBook Flip 14 TM420IA R7 4700U, Vega 7 | 1.6 kg | 18.2 mm | 14.00" | 1920x1080 | |
| 80.4 % v7 (old) | 06-2020 | HP Envy x360 15-dr1679cl i7-10510U, UHD Graphics 620 | 2.1 kg | 17.2 mm | 15.60" | 1920x1080 |
| SD Card Reader | |
| average JPG Copy Test (av. of 3 runs) | |
| Lenovo ThinkPad X13 Yoga 20SX0004GE (Toshiba Exceria Pro M501 64 GB UHS-II) | |
| Lenovo ThinkPad X390 Yoga-20NQS05R00 (Toshiba Exceria Pro M501) | |
| HP Envy x360 15-dr1679cl (Toshiba Exceria Pro SDXC 64 GB UHS-II) | |
| Gemiddelde van klas Office (19.8 - 198.5, n=22, laatste 2 jaar) | |
| Asus VivoBook Flip 14 TM420IA (Toshiba Exceria Pro M501 microSDXC 64GB) | |
| Acer Spin 5 SP513-54N-79EY (Toshiba Exceria Pro M501 microSDXC 64GB) | |
| maximum AS SSD Seq Read Test (1GB) | |
| Lenovo ThinkPad X13 Yoga 20SX0004GE (Toshiba Exceria Pro M501 64 GB UHS-II) | |
| Lenovo ThinkPad X390 Yoga-20NQS05R00 (Toshiba Exceria Pro M501) | |
| HP Envy x360 15-dr1679cl (Toshiba Exceria Pro SDXC 64 GB UHS-II) | |
| Gemiddelde van klas Office (27.4 - 249, n=21, laatste 2 jaar) | |
| Asus VivoBook Flip 14 TM420IA (Toshiba Exceria Pro M501 microSDXC 64GB) | |
| Acer Spin 5 SP513-54N-79EY (Toshiba Exceria Pro M501 microSDXC 64GB) | |


| |||||||||||||||||||||||||
Helderheidsverdeling: 91 %
Helderheid in Batterij-modus: 401 cd/m²
Contrast: 2506:1 (Zwart: 0.16 cd/m²)
ΔE ColorChecker Calman: 2.6 | ∀{0.5-29.43 Ø4.71}
calibrated: 0.9
ΔE Greyscale Calman: 3.3 | ∀{0.09-98 Ø4.96}
98.1% sRGB (Argyll 1.6.3 3D)
62.7% AdobeRGB 1998 (Argyll 1.6.3 3D)
69% AdobeRGB 1998 (Argyll 3D)
98.1% sRGB (Argyll 3D)
67.2% Display P3 (Argyll 3D)
Gamma: 2.01
CCT: 6076 K
| Lenovo ThinkPad X13 Yoga 20SX0004GE N133HCG-GR3, IPS, 1920x1080, 13.3" | Lenovo ThinkPad X390 Yoga-20NQS05R00 LP133WF7-SPA1, IPS LED, 1920x1080, 13.3" | Acer Spin 5 SP513-54N-79EY BOE08BC, IPS, 2256x1504, 13.5" | Asus VivoBook Flip 14 TM420IA BOE NV140FHM-N49, IPS, 1920x1080, 14" | HP Envy x360 15-dr1679cl AU Optronics B156HW02, IPS, 1920x1080, 15.6" | |
|---|---|---|---|---|---|
| Display | -2% | 3% | -39% | -41% | |
| Display P3 Coverage (%) | 67.2 | 65.2 -3% | 69.4 3% | 40.47 -40% | 39.28 -42% |
| sRGB Coverage (%) | 98.1 | 97 -1% | 99.6 2% | 60 -39% | 58.8 -40% |
| AdobeRGB 1998 Coverage (%) | 69 | 67.3 -2% | 71 3% | 41.81 -39% | 40.58 -41% |
| Response Times | -8% | 6% | 13% | 23% | |
| Response Time Grey 50% / Grey 80% * (ms) | 56 ? | 59.2 ? -6% | 49 ? 12% | 36.4 ? 35% | 39.6 ? 29% |
| Response Time Black / White * (ms) | 28 ? | 30.8 ? -10% | 28 ? -0% | 30.4 ? -9% | 23.6 ? 16% |
| PWM Frequency (Hz) | 208 ? | ||||
| Screen | -45% | 5% | -109% | -100% | |
| Brightness middle (cd/m²) | 401 | 319 -20% | 454 13% | 272.5 -32% | 261.2 -35% |
| Brightness (cd/m²) | 383 | 306 -20% | 426 11% | 260 -32% | 248 -35% |
| Brightness Distribution (%) | 91 | 90 -1% | 91 0% | 88 -3% | 92 1% |
| Black Level * (cd/m²) | 0.16 | 0.15 6% | 0.33 -106% | 0.42 -163% | 0.38 -138% |
| Contrast (:1) | 2506 | 2127 -15% | 1376 -45% | 649 -74% | 687 -73% |
| Colorchecker dE 2000 * | 2.6 | 6.1 -135% | 1.27 51% | 4.65 -79% | 5.4 -108% |
| Colorchecker dE 2000 max. * | 4.2 | 9.7 -131% | 2.42 42% | 17.78 -323% | 16.31 -288% |
| Colorchecker dE 2000 calibrated * | 0.9 | 1 -11% | 0.78 13% | 4.34 -382% | 3.81 -323% |
| Greyscale dE 2000 * | 3.3 | 8.6 -161% | 1.07 68% | 4.4 -33% | 4.1 -24% |
| Gamma | 2.01 109% | 2.62 84% | 2.39 92% | 2.2 100% | 2.53 87% |
| CCT | 6076 107% | 6613 98% | 6530 100% | 6984 93% | 6611 98% |
| Color Space (Percent of AdobeRGB 1998) (%) | 62.7 | 61.9 -1% | 65 4% | 38.4 -39% | 37.4 -40% |
| Color Space (Percent of sRGB) (%) | 98.1 | 96.8 -1% | 100 2% | 59.8 -39% | 58.7 -40% |
| Totaal Gemiddelde (Programma / Instellingen) | -18% /
-32% | 5% /
5% | -45% /
-81% | -39% /
-74% |
* ... kleiner is beter
Responstijd Scherm
| ↔ Responstijd Zwart naar Wit | ||
|---|---|---|
| 28 ms ... stijging ↗ en daling ↘ gecombineerd | ↗ 11.2 ms stijging | 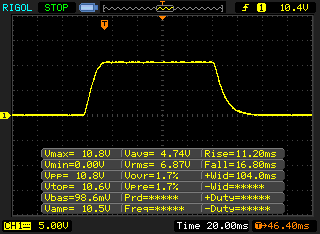 |
| ↘ 16.8 ms daling | ||
| Het scherm vertoonde relatief trage responstijden in onze tests en is misschien te traag voor games. Ter vergelijking: alle testtoestellen variëren van 0.1 (minimum) tot 240 (maximum) ms. » 71 % van alle toestellen zijn beter. Dit betekent dat de gemeten responstijd slechter is dan het gemiddelde (19.8 ms) van alle geteste toestellen. | ||
| ↔ Responstijd 50% Grijs naar 80% Grijs | ||
| 56 ms ... stijging ↗ en daling ↘ gecombineerd | ↗ 26.8 ms stijging | 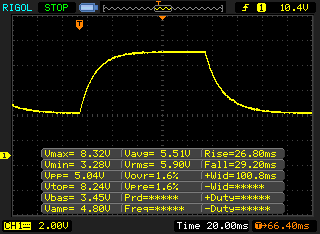 |
| ↘ 29.2 ms daling | ||
| Het scherm vertoonde trage responstijden in onze tests en is misschien te traag voor games. Ter vergelijking: alle testtoestellen variëren van 0.165 (minimum) tot 636 (maximum) ms. » 93 % van alle toestellen zijn beter. Dit betekent dat de gemeten responstijd slechter is dan het gemiddelde (30.9 ms) van alle geteste toestellen. | ||
Screen Flickering / PWM (Pulse-Width Modulation)
| Screen flickering / PWM niet waargenomen | 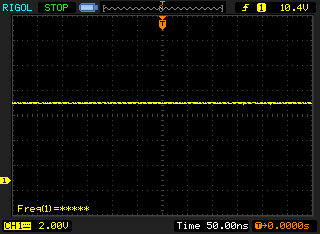 | ||
Ter vergelijking: 52 % van alle geteste toestellen maakten geen gebruik van PWM om de schermhelderheid te verlagen. Als het wel werd gebruikt, werd een gemiddelde van 7748 (minimum: 5 - maximum: 343500) Hz waargenomen. | |||
Cinebench R15: CPU Single 64Bit | CPU Multi 64Bit
Blender: v2.79 BMW27 CPU
7-Zip 18.03: 7z b 4 -mmt1 | 7z b 4
Geekbench 5.5: Single-Core | Multi-Core
HWBOT x265 Benchmark v2.2: 4k Preset
LibreOffice : 20 Documents To PDF
R Benchmark 2.5: Overall mean
| Cinebench R20 / CPU (Single Core) | |
| Gemiddelde van klas Office (345 - 816, n=75, laatste 2 jaar) | |
| Asus VivoBook Flip 14 TM420IA | |
| Acer Spin 5 SP513-54N-79EY | |
| Gemiddeld Intel Core i7-10510U (362 - 497, n=37) | |
| Lenovo ThinkPad X390 Yoga-20NQS05R00 | |
| HP Envy x360 15-dr1679cl | |
| Lenovo ThinkPad X13 Yoga 20SX0004GE | |
| Cinebench R20 / CPU (Multi Core) | |
| Gemiddelde van klas Office (648 - 8840, n=75, laatste 2 jaar) | |
| Asus VivoBook Flip 14 TM420IA | |
| Acer Spin 5 SP513-54N-79EY | |
| HP Envy x360 15-dr1679cl | |
| Gemiddeld Intel Core i7-10510U (1015 - 1897, n=38) | |
| Lenovo ThinkPad X390 Yoga-20NQS05R00 | |
| Lenovo ThinkPad X13 Yoga 20SX0004GE | |
| Cinebench R15 / CPU Single 64Bit | |
| Gemiddelde van klas Office (99.5 - 316, n=77, laatste 2 jaar) | |
| Asus VivoBook Flip 14 TM420IA | |
| Lenovo ThinkPad X390 Yoga-20NQS05R00 | |
| Gemiddeld Intel Core i7-10510U (113 - 202, n=42) | |
| Acer Spin 5 SP513-54N-79EY | |
| HP Envy x360 15-dr1679cl | |
| Lenovo ThinkPad X13 Yoga 20SX0004GE | |
| Cinebench R15 / CPU Multi 64Bit | |
| Gemiddelde van klas Office (250 - 3380, n=77, laatste 2 jaar) | |
| Asus VivoBook Flip 14 TM420IA | |
| Gemiddeld Intel Core i7-10510U (482 - 856, n=45) | |
| Acer Spin 5 SP513-54N-79EY | |
| HP Envy x360 15-dr1679cl | |
| Lenovo ThinkPad X390 Yoga-20NQS05R00 | |
| Lenovo ThinkPad X13 Yoga 20SX0004GE | |
| Blender / v2.79 BMW27 CPU | |
| Lenovo ThinkPad X390 Yoga-20NQS05R00 | |
| Lenovo ThinkPad X13 Yoga 20SX0004GE | |
| Gemiddeld Intel Core i7-10510U (628 - 1051, n=31) | |
| HP Envy x360 15-dr1679cl | |
| Acer Spin 5 SP513-54N-79EY | |
| Asus VivoBook Flip 14 TM420IA | |
| Gemiddelde van klas Office (158 - 1940, n=76, laatste 2 jaar) | |
| 7-Zip 18.03 / 7z b 4 -mmt1 | |
| Gemiddelde van klas Office (3387 - 6469, n=77, laatste 2 jaar) | |
| Lenovo ThinkPad X390 Yoga-20NQS05R00 | |
| HP Envy x360 15-dr1679cl | |
| Gemiddeld Intel Core i7-10510U (3747 - 4981, n=31) | |
| Lenovo ThinkPad X13 Yoga 20SX0004GE | |
| Asus VivoBook Flip 14 TM420IA | |
| Acer Spin 5 SP513-54N-79EY | |
| 7-Zip 18.03 / 7z b 4 | |
| Gemiddelde van klas Office (7098 - 76886, n=77, laatste 2 jaar) | |
| Asus VivoBook Flip 14 TM420IA | |
| Acer Spin 5 SP513-54N-79EY | |
| HP Envy x360 15-dr1679cl | |
| Gemiddeld Intel Core i7-10510U (12196 - 21298, n=31) | |
| Lenovo ThinkPad X390 Yoga-20NQS05R00 | |
| Lenovo ThinkPad X13 Yoga 20SX0004GE | |
| Geekbench 5.5 / Single-Core | |
| Gemiddelde van klas Office (811 - 2175, n=73, laatste 2 jaar) | |
| Acer Spin 5 SP513-54N-79EY | |
| Lenovo ThinkPad X13 Yoga 20SX0004GE | |
| Gemiddeld Intel Core i7-10510U (977 - 1287, n=31) | |
| Asus VivoBook Flip 14 TM420IA | |
| HP Envy x360 15-dr1679cl | |
| Geekbench 5.5 / Multi-Core | |
| Gemiddelde van klas Office (1483 - 16999, n=73, laatste 2 jaar) | |
| Asus VivoBook Flip 14 TM420IA | |
| Acer Spin 5 SP513-54N-79EY | |
| Gemiddeld Intel Core i7-10510U (2474 - 4484, n=31) | |
| Lenovo ThinkPad X13 Yoga 20SX0004GE | |
| HP Envy x360 15-dr1679cl | |
| HWBOT x265 Benchmark v2.2 / 4k Preset | |
| Gemiddelde van klas Office (2.21 - 26, n=76, laatste 2 jaar) | |
| Asus VivoBook Flip 14 TM420IA | |
| HP Envy x360 15-dr1679cl | |
| Gemiddeld Intel Core i7-10510U (3.41 - 6.04, n=31) | |
| Lenovo ThinkPad X13 Yoga 20SX0004GE | |
| Lenovo ThinkPad X390 Yoga-20NQS05R00 | |
| LibreOffice / 20 Documents To PDF | |
| HP Envy x360 15-dr1679cl | |
| Gemiddeld Intel Core i7-10510U (50.7 - 77.8, n=27) | |
| Asus VivoBook Flip 14 TM420IA | |
| Gemiddelde van klas Office (39.9 - 102.3, n=76, laatste 2 jaar) | |
| Lenovo ThinkPad X13 Yoga 20SX0004GE | |
| Acer Spin 5 SP513-54N-79EY | |
| R Benchmark 2.5 / Overall mean | |
| HP Envy x360 15-dr1679cl | |
| Gemiddeld Intel Core i7-10510U (0.637 - 0.81, n=28) | |
| Lenovo ThinkPad X13 Yoga 20SX0004GE | |
| Asus VivoBook Flip 14 TM420IA | |
| Gemiddelde van klas Office (0.393 - 0.888, n=76, laatste 2 jaar) | |
* ... kleiner is beter
| PCMark 10 Score | 4276 punten | |
Help | ||
| DPC Latencies / LatencyMon - interrupt to process latency (max), Web, Youtube, Prime95 | |
| HP Envy x360 15-dr1679cl | |
| Lenovo ThinkPad X13 Yoga 20SX0004GE | |
| Acer Spin 5 SP513-54N-79EY | |
| Asus VivoBook Flip 14 TM420IA | |
* ... kleiner is beter
| Lenovo ThinkPad X13 Yoga 20SX0004GE Samsung SSD PM981a MZVLB512HBJQ | Lenovo ThinkPad X390 Yoga-20NQS05R00 Intel SSD Pro 7600p SSDPEKKF512G8L | Acer Spin 5 SP513-54N-79EY Samsung PM991 MZVLQ1T0HALB | Asus VivoBook Flip 14 TM420IA Samsung PM991 MZVLQ512HALU | HP Envy x360 15-dr1679cl Intel Optane Memory H10 with Solid State Storage 32GB + 512GB HBRPEKNX0202A(L/H) | Gemiddeld Samsung SSD PM981a MZVLB512HBJQ | |
|---|---|---|---|---|---|---|
| CrystalDiskMark 5.2 / 6 | 21% | 19% | -4% | 5% | 45% | |
| Write 4K (MB/s) | 134.5 | 144.1 7% | 168.4 25% | 121.2 -10% | 125.6 -7% | 140.8 ? 5% |
| Read 4K (MB/s) | 61.2 | 63.5 4% | 55 -10% | 49.91 -18% | 145.8 138% | 48.6 ? -21% |
| Write Seq (MB/s) | 931 | 1496 61% | 1090 17% | 509 -45% | 2106 ? 126% | |
| Read Seq (MB/s) | 2534 | 2677 6% | 1533 -40% | 1536 -39% | 2099 ? -17% | |
| Write 4K Q32T1 (MB/s) | 375.9 | 357.4 -5% | 476.1 27% | 393.3 5% | 362.4 -4% | 451 ? 20% |
| Read 4K Q32T1 (MB/s) | 343.7 | 482.3 40% | 506 47% | 406 18% | 307.3 -11% | 482 ? 40% |
| Write Seq Q32T1 (MB/s) | 934 | 1558 67% | 1492 60% | 1225 31% | 1320 41% | 2903 ? 211% |
| Read Seq Q32T1 (MB/s) | 3548 | 3021 -15% | 2357 -34% | 2277 -36% | 2489 -30% | 3511 ? -1% |
| Write 4K Q8T8 (MB/s) | 989 | 930 | 914 ? | |||
| Read 4K Q8T8 (MB/s) | 883 | 963 | 1017 ? | |||
| AS SSD | -2% | -17% | -48% | -78% | 4% | |
| Seq Read (MB/s) | 2844 | 2742 -4% | 2071 -27% | 1397 -51% | 931 -67% | 2412 ? -15% |
| Seq Write (MB/s) | 1483 | 1511 2% | 1462 -1% | 783 -47% | 331.5 -78% | 1983 ? 34% |
| 4K Read (MB/s) | 56.1 | 66.3 18% | 49.82 -11% | 48.08 -14% | 72.8 30% | 53.1 ? -5% |
| 4K Write (MB/s) | 138.1 | 175.2 27% | 140.7 2% | 134.6 -3% | 119 -14% | 131.1 ? -5% |
| 4K-64 Read (MB/s) | 870 | 873 0% | 869 0% | 835 -4% | 389.7 -55% | 1201 ? 38% |
| 4K-64 Write (MB/s) | 1311 | 594 -55% | 729 -44% | 734 -44% | 573 -56% | 1726 ? 32% |
| Access Time Read * (ms) | 0.049 | 0.035 29% | 0.069 -41% | 0.081 -65% | 0.07 -43% | 0.05525 ? -13% |
| Access Time Write * (ms) | 0.027 | 0.021 22% | 0.028 -4% | 0.084 -211% | 0.138 -411% | 0.05394 ? -100% |
| Score Read (Points) | 1210 | 1213 0% | 1126 -7% | 1022 -16% | 556 -54% | 1495 ? 24% |
| Score Write (Points) | 1598 | 920 -42% | 1016 -36% | 947 -41% | 725 -55% | 2055 ? 29% |
| Score Total (Points) | 3373 | 2712 -20% | 2700 -20% | 2474 -27% | 1565 -54% | 4303 ? 28% |
| Totaal Gemiddelde (Programma / Instellingen) | 10% /
7% | 1% /
-4% | -26% /
-29% | -37% /
-43% | 25% /
22% |
* ... kleiner is beter

Continuous load read: DiskSpd Read Loop, Queue Depth 8
| 3DMark 11 Performance | 2046 punten | |
| 3DMark Cloud Gate Standard Score | 8824 punten | |
| 3DMark Fire Strike Score | 1118 punten | |
| 3DMark Time Spy Score | 451 punten | |
Help | ||
| Far Cry 5 - 1280x720 Low Preset AA:T | |
| Gemiddelde van klas Office (38 - 99, n=13, laatste 2 jaar) | |
| Acer Spin 5 SP513-54N-79EY | |
| Gemiddeld Intel UHD Graphics 620 (6 - 16, n=12) | |
| Lenovo ThinkPad X13 Yoga 20SX0004GE | |
| lage | gem. | hoge | ultra | |
|---|---|---|---|---|
| Dota 2 Reborn (2015) | 76.7 | 44.7 | 21.4 | 19 |
| X-Plane 11.11 (2018) | 15.7 | 11.9 | 12.5 | |
| Far Cry 5 (2018) | 12 |
Geluidsniveau
| Onbelast |
| 29.3 / 29.3 / 31.4 dB (A) |
| Belasting |
| 33 / 34.9 dB (A) |
 | ||
30 dB stil 40 dB(A) hoorbaar 50 dB(A) luid |
||
min: | ||
(±) De maximumtemperatuur aan de bovenzijde bedraagt 43.8 °C / 111 F, vergeleken met het gemiddelde van 34.3 °C / 94 F, variërend van 21.2 tot 62.5 °C voor de klasse Office.
(-) De bodem warmt op tot een maximum van 65 °C / 149 F, vergeleken met een gemiddelde van 36.8 °C / 98 F
(+) Bij onbelast gebruik bedraagt de gemiddelde temperatuur voor de bovenzijde 27.3 °C / 81 F, vergeleken met het apparaatgemiddelde van 29.5 °C / 85 F.
(+) De palmsteunen en het touchpad zijn met een maximum van ###max## °C / 78.1 F koeler dan de huidtemperatuur en voelen daarom koel aan.
(±) De gemiddelde temperatuur van de handpalmsteun van soortgelijke toestellen bedroeg 27.5 °C / 81.5 F (+1.9 °C / 3.4 F).
Lenovo ThinkPad X13 Yoga 20SX0004GE audioanalyse
(±) | luidspreker luidheid is gemiddeld maar goed (76.4 dB)
Bas 100 - 315 Hz
(-) | bijna geen lage tonen - gemiddeld 17.7% lager dan de mediaan
(±) | lineariteit van de lage tonen is gemiddeld (14.9% delta ten opzichte van de vorige frequentie)
Midden 400 - 2000 Hz
(±) | hogere middens - gemiddeld 7.8% hoger dan de mediaan
(+) | de middentonen zijn lineair (3.9% delta ten opzichte van de vorige frequentie)
Hoog 2 - 16 kHz
(±) | lagere maxima - gemiddeld 6.6% lager dan de mediaan
(±) | lineariteit van de hoogtepunten is gemiddeld (7.6% delta ten opzichte van de vorige frequentie)
Algemeen 100 - 16.000 Hz
(±) | lineariteit van het totale geluid is gemiddeld (28.8% verschil met de mediaan)
Vergeleken met dezelfde klasse
» 89% van alle geteste apparaten in deze klasse waren beter, 2% vergelijkbaar, 8% slechter
» De beste had een delta van 7%, het gemiddelde was 21%, de slechtste was 53%
Vergeleken met alle geteste toestellen
» 86% van alle geteste apparaten waren beter, 3% gelijk, 11% slechter
» De beste had een delta van 4%, het gemiddelde was 23%, de slechtste was 134%
Lenovo ThinkPad X390 Yoga-20NQS05R00 audioanalyse
(±) | luidspreker luidheid is gemiddeld maar goed (74.1 dB)
Bas 100 - 315 Hz
(-) | bijna geen lage tonen - gemiddeld 15.8% lager dan de mediaan
(±) | lineariteit van de lage tonen is gemiddeld (10.6% delta ten opzichte van de vorige frequentie)
Midden 400 - 2000 Hz
(±) | hogere middens - gemiddeld 6.5% hoger dan de mediaan
(±) | lineariteit van de middentonen is gemiddeld (10.3% delta ten opzichte van de vorige frequentie)
Hoog 2 - 16 kHz
(+) | evenwichtige hoogtepunten - slechts 2.8% verwijderd van de mediaan
(±) | lineariteit van de hoogtepunten is gemiddeld (11% delta ten opzichte van de vorige frequentie)
Algemeen 100 - 16.000 Hz
(±) | lineariteit van het totale geluid is gemiddeld (24% verschil met de mediaan)
Vergeleken met dezelfde klasse
» 73% van alle geteste apparaten in deze klasse waren beter, 5% vergelijkbaar, 22% slechter
» De beste had een delta van 6%, het gemiddelde was 20%, de slechtste was 57%
Vergeleken met alle geteste toestellen
» 72% van alle geteste apparaten waren beter, 6% gelijk, 22% slechter
» De beste had een delta van 4%, het gemiddelde was 23%, de slechtste was 134%
| Uit / Standby | |
| Inactief | |
| Belasting |
|
Key:
min: | |
| Lenovo ThinkPad X13 Yoga 20SX0004GE i7-10510U, UHD Graphics 620, Samsung SSD PM981a MZVLB512HBJQ, IPS, 1920x1080, 13.3" | Lenovo ThinkPad X390 Yoga-20NQS05R00 i7-8565U, UHD Graphics 620, Intel SSD Pro 7600p SSDPEKKF512G8L, IPS LED, 1920x1080, 13.3" | Acer Spin 5 SP513-54N-79EY i7-1065G7, Iris Plus Graphics G7 (Ice Lake 64 EU), Samsung PM991 MZVLQ1T0HALB, IPS, 2256x1504, 13.5" | Asus VivoBook Flip 14 TM420IA R7 4700U, Vega 7, Samsung PM991 MZVLQ512HALU, IPS, 1920x1080, 14" | HP Envy x360 15-dr1679cl i7-10510U, UHD Graphics 620, Intel Optane Memory H10 with Solid State Storage 32GB + 512GB HBRPEKNX0202A(L/H), IPS, 1920x1080, 15.6" | Gemiddeld Intel UHD Graphics 620 | Gemiddelde van klas Office | |
|---|---|---|---|---|---|---|---|
| Power Consumption | -12% | 12% | 1% | -15% | -6% | -20% | |
| Idle Minimum * (Watt) | 3.4 | 3.46 -2% | 2.8 18% | 4 -18% | 4.3 -26% | 3.81 ? -12% | 4.26 ? -25% |
| Idle Average * (Watt) | 4.98 | 5.88 -18% | 5.4 -8% | 6.4 -29% | 7.2 -45% | 6.94 ? -39% | 7.31 ? -47% |
| Idle Maximum * (Watt) | 8.1 | 9.12 -13% | 7.6 6% | 7 14% | 7.5 7% | 8.75 ? -8% | 8.55 ? -6% |
| Load Average * (Watt) | 37.2 | 45.6 -23% | 36.6 2% | 34.6 7% | 40.4 -9% | 35 ? 6% | 43.8 ? -18% |
| Load Maximum * (Watt) | 63.3 | 65.9 -4% | 37 42% | 45.1 29% | 65.7 -4% | 47.5 ? 25% | 64.5 ? -2% |
| Witcher 3 ultra * (Watt) | 35 |
* ... kleiner is beter
| Lenovo ThinkPad X13 Yoga 20SX0004GE i7-10510U, UHD Graphics 620, 50 Wh | Lenovo ThinkPad X390 Yoga-20NQS05R00 i7-8565U, UHD Graphics 620, 50 Wh | Acer Spin 5 SP513-54N-79EY i7-1065G7, Iris Plus Graphics G7 (Ice Lake 64 EU), 55 Wh | Asus VivoBook Flip 14 TM420IA R7 4700U, Vega 7, 42 Wh | HP Envy x360 15-dr1679cl i7-10510U, UHD Graphics 620, 55.67 Wh | Gemiddelde van klas Office | |
|---|---|---|---|---|---|---|
| Batterijduur | -24% | 9% | -2% | -5% | 12% | |
| WiFi v1.3 (h) | 8.2 | 8.2 0% | 10.8 32% | 8 -2% | 9.2 12% | 13.2 ? 61% |
| Load (h) | 2.9 | 1.5 -48% | 2.5 -14% | 2.3 -21% | 1.808 ? -38% |
Pro
Contra
Conclusie - Niets nieuw met Comet Lake

Dit is de verkorte versie van het originele artikel. Het volledige, Engelse testrapport vind je hier.
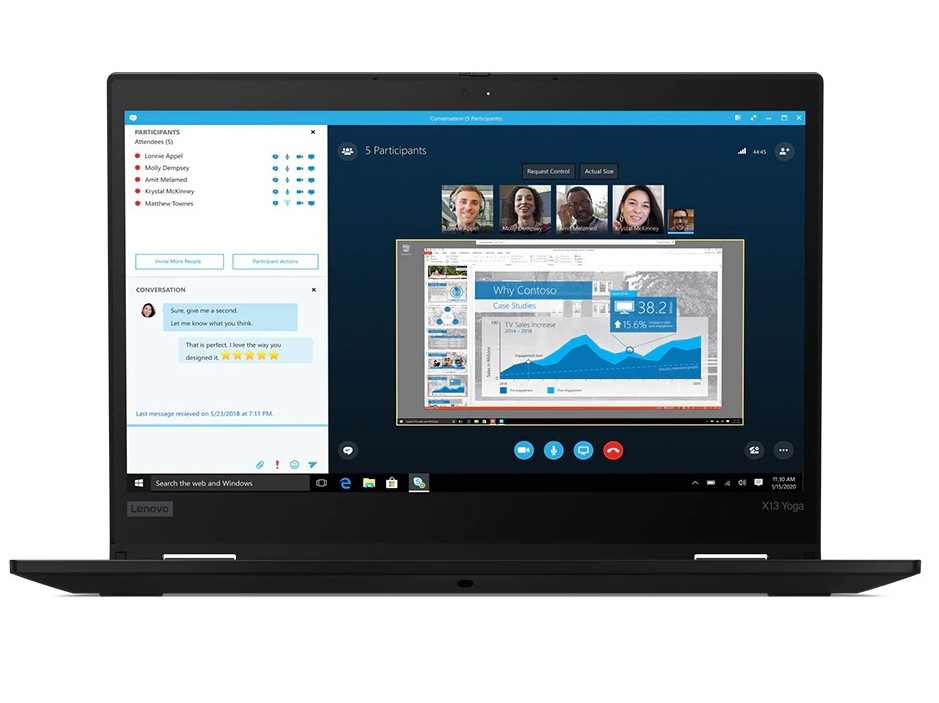
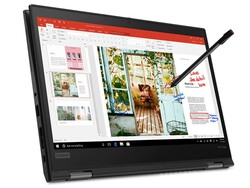
Met de ThinkPad X13 Yoga levert Lenovo een hardware-upgrade voor Intel's nieuwste generatie van processoren. Dit resulteert echter niet in een aanzienlijke prestatieverbetering en de Intel Core i7-10510U, die eigenlijk energiezuiniger is, heeft ook geen positief effect op de batterijduur. Desalniettemin blijft de Windows-convertible een degelijk toestel met een hoogwaardige bouwkwaliteit die goed dienst kan doen in het alledaagse leven.
De Lenovo ThinkPad X13 Yoga is praktisch identiek aan de 390 Yoga, maar dit geldt ook op het vlak van prestaties.
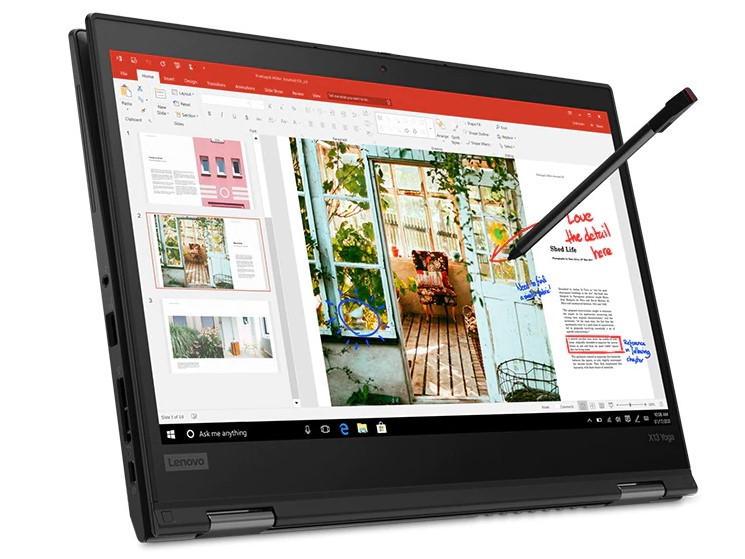
Voor potentiële kopers roept dit uiteindelijk de vraag op of zij hun geld beter in het voorgaande model kunnen investeren. Uiteindelijk biedt dit alles wat ook in de nieuwe editie beschikbaar is, inclusief de ThinkPad Pen Pro, die in de doos zit. Afhankelijk van de prijs kan je dus enkele euro's besparen.
Lenovo ThinkPad X13 Yoga 20SX0004GE
- 24-09-2020 v7 (old)
Mike Wobker
Price comparison
