Kort testrapport Dell Latitude 7310 Core i7 Laptop: Betere looks, dezelfde prestaties
Evaluatie | Datum | Model | Gewicht | Hoogte | Formaat | Resolutie | Beste prijs |
|---|---|---|---|---|---|---|---|
| 89.4 % v7 (old) | 07-2020 | Dell Latitude 7310 i7-10610U, UHD Graphics 620 | 1.2 kg | 18.3 mm | 13.30" | 1920x1080 | |
| 88.8 % v7 (old) | Lenovo ThinkPad X395 R3 PRO 3300U, Vega 6 | 1.3 kg | 16.9 mm | 13.30" | 1920x1080 | ||
| 86 % v7 (old) | HP EliteBook 735 G6 7KN29EA R5 PRO 3500U, Vega 8 | 1.5 kg | 17.7 mm | 13.30" | 1920x1080 | ||
| 92.1 % v7 (old) | 06-2020 | Apple MacBook Pro 13 2020 2GHz i5 10th-Gen i5-1038NG7, Iris Plus Graphics G7 (Ice Lake 64 EU) | 1.4 kg | 15.6 mm | 13.30" | 2560x1600 | |
| 82.6 % v7 (old) | 07-2020 | HP ProBook 455 G7-175W8EA R7 4700U, Vega 7 | 1.8 kg | 19 mm | 15.60" | 1920x1080 |
| SD Card Reader | |
| average JPG Copy Test (av. of 3 runs) | |
| Dell Latitude 7300-P99G (Toshiba Exceria Pro M501 microSDXC 64GB) | |
| Dell Latitude 7310 (Toshiba Exceria Pro M501 64 GB UHS-II) | |
| Lenovo ThinkPad X395 | |
| Asus ZenBook S13 UX392FN (Toshiba Exceria Pro M501 64 GB UHS-II) | |
| maximum AS SSD Seq Read Test (1GB) | |
| Dell Latitude 7310 (Toshiba Exceria Pro M501 64 GB UHS-II) | |
| Dell Latitude 7300-P99G (Toshiba Exceria Pro M501 microSDXC 64GB) | |
| Lenovo ThinkPad X395 | |
| Asus ZenBook S13 UX392FN (Toshiba Exceria Pro M501 64 GB UHS-II) | |
| Networking | |
| iperf3 transmit AX12 | |
| Asus Zephyrus G14 GA401IV | |
| Dell Latitude 7310 | |
| Dell XPS 13 9300 4K UHD | |
| Dell Latitude 7410 | |
| iperf3 receive AX12 | |
| Dell XPS 13 9300 4K UHD | |
| Asus Zephyrus G14 GA401IV | |
| Dell Latitude 7410 | |
| Dell Latitude 7310 | |


| |||||||||||||||||||||||||
Helderheidsverdeling: 89 %
Helderheid in Batterij-modus: 332.7 cd/m²
Contrast: 1331:1 (Zwart: 0.25 cd/m²)
ΔE ColorChecker Calman: 2.15 | ∀{0.5-29.43 Ø4.72}
calibrated: 1.09
ΔE Greyscale Calman: 2.5 | ∀{0.09-98 Ø4.97}
99.4% sRGB (Argyll 1.6.3 3D)
64.1% AdobeRGB 1998 (Argyll 1.6.3 3D)
72.4% AdobeRGB 1998 (Argyll 3D)
99.3% sRGB (Argyll 3D)
71.8% Display P3 (Argyll 3D)
Gamma: 2.3
CCT: 6347 K
| Dell Latitude 7310 AU Optronics B133HAN, IPS, 13.3", 1920x1080 | Dell Latitude 7300-P99G B133HAK, IPS LED, 13.3", 1920x1080 | Asus ZenBook S13 UX392FN Tianma XM, IPS, 13.9", 1920x1080 | Lenovo ThinkPad X395 LP133WF7-SPB1, IPS, 13.3", 1920x1080 | HP EliteBook 735 G6 7KN29EA CMN139E, IPS LED, 13.3", 1920x1080 | Apple MacBook Pro 13 2020 2GHz i5 10th-Gen APPA03D, IPS, 13.3", 2560x1600 | |
|---|---|---|---|---|---|---|
| Display | -9% | -5% | -8% | -40% | 19% | |
| Display P3 Coverage (%) | 71.8 | 64.6 -10% | 67.5 -6% | 64.1 -11% | 41.53 -42% | 98.8 38% |
| sRGB Coverage (%) | 99.3 | 91.5 -8% | 95.8 -4% | 95.2 -4% | 61.7 -38% | 99.9 1% |
| AdobeRGB 1998 Coverage (%) | 72.4 | 65.5 -10% | 69 -5% | 65.8 -9% | 43 -41% | 86.4 19% |
| Response Times | 5% | -1% | -23% | 8% | -13% | |
| Response Time Grey 50% / Grey 80% * (ms) | 40.8 ? | 39 ? 4% | 47.2 ? -16% | 55 ? -35% | 38 ? 7% | 46 ? -13% |
| Response Time Black / White * (ms) | 28.8 ? | 27 ? 6% | 24.8 ? 14% | 32 ? -11% | 26.4 ? 8% | 32.4 ? -13% |
| PWM Frequency (Hz) | 26040 | 113600 ? | ||||
| Screen | -66% | -0% | -9% | -114% | 17% | |
| Brightness middle (cd/m²) | 332.7 | 341 2% | 466 40% | 356 7% | 294 -12% | 512 54% |
| Brightness (cd/m²) | 329 | 306 -7% | 462 40% | 336 2% | 277 -16% | 491 49% |
| Brightness Distribution (%) | 89 | 79 -11% | 90 1% | 88 -1% | 87 -2% | 91 2% |
| Black Level * (cd/m²) | 0.25 | 0.31 -24% | 0.33 -32% | 0.16 36% | 0.18 28% | 0.32 -28% |
| Contrast (:1) | 1331 | 1100 -17% | 1412 6% | 2225 67% | 1633 23% | 1600 20% |
| Colorchecker dE 2000 * | 2.15 | 6.43 -199% | 1.93 10% | 3.6 -67% | 6.8 -216% | 1.7 21% |
| Colorchecker dE 2000 max. * | 3.89 | 10.33 -166% | 4.26 -10% | 5.5 -41% | 23.8 -512% | 3.4 13% |
| Colorchecker dE 2000 calibrated * | 1.09 | 2.36 -117% | 1.99 -83% | 1.11 -2% | 4.8 -340% | 1 8% |
| Greyscale dE 2000 * | 2.5 | 6.9 -176% | 1.7 32% | 4.7 -88% | 5.9 -136% | 1.9 24% |
| Gamma | 2.3 96% | 2.23 99% | 2.15 102% | 2.92 75% | 1.96 112% | 2.19 100% |
| CCT | 6347 102% | 8338 78% | 6382 102% | 6222 104% | 6979 93% | 6817 95% |
| Color Space (Percent of AdobeRGB 1998) (%) | 64.1 | 59 -8% | 62.2 -3% | 61 -5% | 39.6 -38% | 77.4 21% |
| Color Space (Percent of sRGB) (%) | 99.4 | 91 -8% | 95.7 -4% | 96 -3% | 61.5 -38% | 99.9 1% |
| Totaal Gemiddelde (Programma / Instellingen) | -23% /
-47% | -2% /
-1% | -13% /
-10% | -49% /
-85% | 8% /
14% |
* ... kleiner is beter
Responstijd Scherm
| ↔ Responstijd Zwart naar Wit | ||
|---|---|---|
| 28.8 ms ... stijging ↗ en daling ↘ gecombineerd | ↗ 14.8 ms stijging | 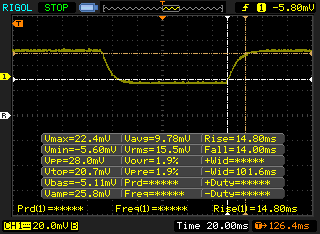 |
| ↘ 14 ms daling | ||
| Het scherm vertoonde relatief trage responstijden in onze tests en is misschien te traag voor games. Ter vergelijking: alle testtoestellen variëren van 0.1 (minimum) tot 240 (maximum) ms. » 76 % van alle toestellen zijn beter. Dit betekent dat de gemeten responstijd slechter is dan het gemiddelde (19.8 ms) van alle geteste toestellen. | ||
| ↔ Responstijd 50% Grijs naar 80% Grijs | ||
| 40.8 ms ... stijging ↗ en daling ↘ gecombineerd | ↗ 22.4 ms stijging | 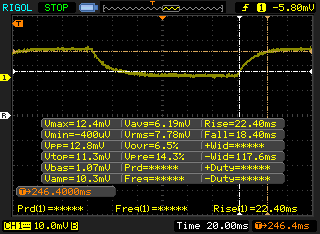 |
| ↘ 18.4 ms daling | ||
| Het scherm vertoonde trage responstijden in onze tests en is misschien te traag voor games. Ter vergelijking: alle testtoestellen variëren van 0.165 (minimum) tot 636 (maximum) ms. » 64 % van alle toestellen zijn beter. Dit betekent dat de gemeten responstijd slechter is dan het gemiddelde (31 ms) van alle geteste toestellen. | ||
Screen Flickering / PWM (Pulse-Width Modulation)
| Screen flickering / PWM niet waargenomen | 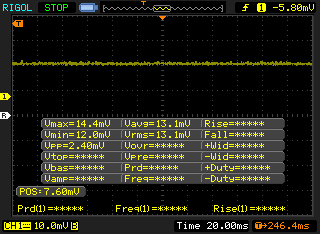 | ||
Ter vergelijking: 52 % van alle geteste toestellen maakten geen gebruik van PWM om de schermhelderheid te verlagen. Als het wel werd gebruikt, werd een gemiddelde van 7763 (minimum: 5 - maximum: 343500) Hz waargenomen. | |||
Cinebench R15: CPU Multi 64Bit | CPU Single 64Bit
Blender: v2.79 BMW27 CPU
7-Zip 18.03: 7z b 4 -mmt1 | 7z b 4
Geekbench 5.5: Single-Core | Multi-Core
HWBOT x265 Benchmark v2.2: 4k Preset
LibreOffice : 20 Documents To PDF
R Benchmark 2.5: Overall mean
| Cinebench R15 / CPU Multi 64Bit | |
| Dell XPS 13 7390 Core i7-10710U | |
| HP ProBook 455 G7-175W8EA | |
| HP Envy x360 13-ay0010nr | |
| Dell XPS 13 9300 4K UHD | |
| Lenovo ThinkPad X1 Carbon 2020-20UAS04T00 | |
| Dell Latitude 7300-P99G | |
| Dell XPS 13 9300 i5 FHD | |
| Dell XPS 13 9300 i5 FHD | |
| Gemiddeld Intel Core i7-10610U (548 - 738, n=6) | |
| Acer Swift 3 SF314-42-R27B | |
| Dell Latitude 7310 | |
| HP EliteBook x360 830 G6 | |
| Lenovo ThinkPad L13 Yoga 20R6S00800 | |
| Dell XPS 13 7390 2-in-1 Core i3 | |
| Lenovo ThinkPad 13 20J1005TPB | |
| Cinebench R15 / CPU Single 64Bit | |
| Dell Latitude 7300-P99G | |
| Lenovo ThinkPad X1 Carbon 2020-20UAS04T00 | |
| Dell XPS 13 9300 4K UHD | |
| HP ProBook 455 G7-175W8EA | |
| Dell XPS 13 7390 Core i7-10710U | |
| Dell Latitude 7310 | |
| Gemiddeld Intel Core i7-10610U (133 - 200, n=6) | |
| HP Envy x360 13-ay0010nr | |
| Dell XPS 13 9300 i5 FHD | |
| Acer Swift 3 SF314-42-R27B | |
| Lenovo ThinkPad L13 Yoga 20R6S00800 | |
| HP EliteBook x360 830 G6 | |
| Dell XPS 13 7390 2-in-1 Core i3 | |
| Lenovo ThinkPad 13 20J1005TPB | |
| Geekbench 5.5 / Single-Core | |
| Dell XPS 13 9300 4K UHD | |
| Dell Latitude 7310 | |
| Dell XPS 13 9300 i5 FHD | |
| Gemiddeld Intel Core i7-10610U (1155 - 1261, n=6) | |
| Lenovo ThinkPad X1 Carbon 2020-20UAS04T00 | |
| HP ProBook 455 G7-175W8EA | |
| Lenovo ThinkPad L13 Yoga 20R6S00800 | |
| HP Envy x360 13-ay0010nr | |
| Acer Swift 3 SF314-42-R27B | |
| Geekbench 5.5 / Multi-Core | |
| Dell XPS 13 9300 4K UHD | |
| HP ProBook 455 G7-175W8EA | |
| HP Envy x360 13-ay0010nr | |
| Dell XPS 13 9300 i5 FHD | |
| Lenovo ThinkPad L13 Yoga 20R6S00800 | |
| Gemiddeld Intel Core i7-10610U (3731 - 4622, n=6) | |
| Lenovo ThinkPad X1 Carbon 2020-20UAS04T00 | |
| Dell Latitude 7310 | |
| Acer Swift 3 SF314-42-R27B | |
| LibreOffice / 20 Documents To PDF | |
| HP ProBook 455 G7-175W8EA | |
| Dell XPS 13 9300 4K UHD | |
| Gemiddeld Intel Core i7-10610U (56.1 - 106, n=6) | |
| Acer Swift 3 SF314-42-R27B | |
| HP Envy x360 13-ay0010nr | |
| Dell Latitude 7310 | |
| Lenovo ThinkPad X1 Carbon 2020-20UAS04T00 | |
| R Benchmark 2.5 / Overall mean | |
| Dell XPS 13 9300 i5 FHD | |
| Gemiddeld Intel Core i7-10610U (0.637 - 0.855, n=6) | |
| Lenovo ThinkPad L13 Yoga 20R6S00800 | |
| Acer Swift 3 SF314-42-R27B | |
| Dell XPS 13 9300 4K UHD | |
| Lenovo ThinkPad X1 Carbon 2020-20UAS04T00 | |
| Dell Latitude 7310 | |
| HP ProBook 455 G7-175W8EA | |
| HP Envy x360 13-ay0010nr | |
Cinebench R15: CPU Multi 64Bit | CPU Single 64Bit
Blender: v2.79 BMW27 CPU
7-Zip 18.03: 7z b 4 -mmt1 | 7z b 4
Geekbench 5.5: Single-Core | Multi-Core
HWBOT x265 Benchmark v2.2: 4k Preset
LibreOffice : 20 Documents To PDF
R Benchmark 2.5: Overall mean
* ... kleiner is beter
| PCMark 10 | |
| Score | |
| Dell Latitude 7310 | |
| Gemiddeld Intel Core i7-10610U, Intel UHD Graphics 620 (4120 - 4437, n=4) | |
| Dell Latitude 7300-P99G | |
| Lenovo ThinkPad X395 | |
| HP EliteBook 735 G6 7KN29EA | |
| Apple MacBook Pro 13 2020 2GHz i5 10th-Gen | |
| Essentials | |
| Dell Latitude 7310 | |
| Dell Latitude 7300-P99G | |
| Gemiddeld Intel Core i7-10610U, Intel UHD Graphics 620 (8541 - 9667, n=4) | |
| Apple MacBook Pro 13 2020 2GHz i5 10th-Gen | |
| Lenovo ThinkPad X395 | |
| HP EliteBook 735 G6 7KN29EA | |
| Productivity | |
| Dell Latitude 7310 | |
| Gemiddeld Intel Core i7-10610U, Intel UHD Graphics 620 (6710 - 7607, n=4) | |
| Dell Latitude 7300-P99G | |
| Lenovo ThinkPad X395 | |
| HP EliteBook 735 G6 7KN29EA | |
| Apple MacBook Pro 13 2020 2GHz i5 10th-Gen | |
| Digital Content Creation | |
| Gemiddeld Intel Core i7-10610U, Intel UHD Graphics 620 (3156 - 3344, n=4) | |
| Apple MacBook Pro 13 2020 2GHz i5 10th-Gen | |
| Dell Latitude 7310 | |
| Lenovo ThinkPad X395 | |
| HP EliteBook 735 G6 7KN29EA | |
| Dell Latitude 7300-P99G | |
| PCMark 8 | |
| Home Score Accelerated v2 | |
| Dell Latitude 7300-P99G | |
| Apple MacBook Pro 13 2020 2GHz i5 10th-Gen | |
| Dell Latitude 7310 | |
| Gemiddeld Intel Core i7-10610U, Intel UHD Graphics 620 (3334 - 3783, n=4) | |
| HP EliteBook 735 G6 7KN29EA | |
| Lenovo ThinkPad X395 | |
| Work Score Accelerated v2 | |
| Dell Latitude 7310 | |
| Dell Latitude 7300-P99G | |
| Gemiddeld Intel Core i7-10610U, Intel UHD Graphics 620 (4528 - 5232, n=4) | |
| HP EliteBook 735 G6 7KN29EA | |
| Lenovo ThinkPad X395 | |
| Apple MacBook Pro 13 2020 2GHz i5 10th-Gen | |
| PCMark 8 Home Score Accelerated v2 | 3783 punten | |
| PCMark 8 Work Score Accelerated v2 | 5232 punten | |
| PCMark 10 Score | 4437 punten | |
Help | ||
| DPC Latencies / LatencyMon - interrupt to process latency (max), Web, Youtube, Prime95 | |
| Dell XPS 13 9300 4K UHD | |
| HP EliteBook 735 G6 7KN29EA | |
| Dell XPS 13 9300 i5 FHD | |
| HP Envy x360 13-ay0010nr | |
| HP ProBook 455 G7-175W8EA | |
| Acer Swift 3 SF314-42-R27B | |
| Dell Latitude 7410 | |
| Dell Latitude 7310 | |
* ... kleiner is beter
| Dell Latitude 7310 Samsung SSD PM981a MZVLB512HBJQ | Dell Latitude 7300-P99G Samsung SSD PM981 MZVLB512HAJQ | Asus ZenBook S13 UX392FN WDC PC SN520 SDAPNUW-512G | HP EliteBook 735 G6 7KN29EA WDC PC SN520 SDAPNUW-256G | Apple MacBook Pro 13 2020 2GHz i5 10th-Gen Apple SSD SM0512F | |
|---|---|---|---|---|---|
| AS SSD | 21% | -4% | -53% | -70% | |
| Seq Read (MB/s) | 2054 | 2749 34% | 1224 -40% | 1499 -27% | 1300 -37% |
| Seq Write (MB/s) | 1575 | 1367 -13% | 907 -42% | 1172 -26% | 1518 -4% |
| 4K Read (MB/s) | 52.1 | 49.94 -4% | 41.46 -20% | 35.42 -32% | 14.09 -73% |
| 4K Write (MB/s) | 137.3 | 137.6 0% | 126.2 -8% | 77.2 -44% | 24.25 -82% |
| 4K-64 Read (MB/s) | 618 | 987 60% | 1021 65% | 463.6 -25% | 725 17% |
| 4K-64 Write (MB/s) | 1317 | 1465 11% | 1251 -5% | 413.3 -69% | 169.6 -87% |
| Access Time Read * (ms) | 0.044 | 0.042 5% | 0.053 -20% | 0.133 -202% | 0.172 -291% |
| Access Time Write * (ms) | 0.083 | 0.029 65% | 0.027 67% | 0.049 41% | 0.155 -87% |
| Score Read (Points) | 876 | 1312 50% | 1185 35% | 649 -26% | 869 -1% |
| Score Write (Points) | 1611 | 1739 8% | 1468 -9% | 608 -62% | 346 -79% |
| Score Total (Points) | 2927 | 3662 25% | 3250 11% | 1582 -46% | 1667 -43% |
| Copy ISO MB/s (MB/s) | 2297 | 2761 20% | 1404 -39% | 1249 -46% | |
| Copy Program MB/s (MB/s) | 540 | 622 15% | 402.4 -25% | 53.5 -90% | |
| Copy Game MB/s (MB/s) | 1288 | 1584 23% | 902 -30% | 201.3 -84% | |
| CrystalDiskMark 5.2 / 6 | 2% | -14% | -41% | -38% | |
| Write 4K (MB/s) | 135.2 | 141.1 4% | 149.2 10% | 116 -14% | 28.16 -79% |
| Read 4K (MB/s) | 50.7 | 46.37 -9% | 47.18 -7% | 39.81 -21% | 17.5 -65% |
| Write Seq (MB/s) | 2155 | 1994 -7% | 750 -65% | 1300 -40% | 1195 -45% |
| Read Seq (MB/s) | 2504 | 2275 -9% | 1137 -55% | 803 -68% | 1470 -41% |
| Write 4K Q32T1 (MB/s) | 395.6 | 493.3 25% | 749 89% | 187.6 -53% | 205 -48% |
| Read 4K Q32T1 (MB/s) | 394.5 | 429 9% | 478.7 21% | 305.9 -22% | 692 75% |
| Write Seq Q32T1 (MB/s) | 2987 | 2992 0% | 1453 -51% | 1299 -57% | 1475 -51% |
| Read Seq Q32T1 (MB/s) | 3564 | 3562 0% | 1713 -52% | 1741 -51% | 1920 -46% |
| Write 4K Q8T8 (MB/s) | 409.1 | ||||
| Read 4K Q8T8 (MB/s) | 1137 | ||||
| Totaal Gemiddelde (Programma / Instellingen) | 12% /
14% | -9% /
-8% | -47% /
-48% | -54% /
-56% |
* ... kleiner is beter

Disk Throttling: DiskSpd Read Loop, Queue Depth 8
| 3DMark 11 Performance | 2197 punten | |
| 3DMark Cloud Gate Standard Score | 8989 punten | |
| 3DMark Fire Strike Score | 1209 punten | |
| 3DMark Time Spy Score | 476 punten | |
Help | ||
| lage | gem. | hoge | ultra | |
|---|---|---|---|---|
| The Witcher 3 (2015) | 20.7 | 10.9 | ||
| Dota 2 Reborn (2015) | 84.5 | 49.3 | 22.8 | 20.3 |
| X-Plane 11.11 (2018) | 13.2 | 10.7 | 11.2 |
| Dell Latitude 7310 UHD Graphics 620, i7-10610U, Samsung SSD PM981a MZVLB512HBJQ | Dell Latitude 7300-P99G UHD Graphics 620, i7-8665U, Samsung SSD PM981 MZVLB512HAJQ | Asus ZenBook S13 UX392FN GeForce MX150, i7-8565U, WDC PC SN520 SDAPNUW-512G | Lenovo ThinkPad X395 Vega 6, R3 PRO 3300U, Samsung SSD PM981a MZVLB256HBHQ | HP EliteBook 735 G6 7KN29EA Vega 8, R5 PRO 3500U, WDC PC SN520 SDAPNUW-256G | Apple MacBook Pro 13 2020 2GHz i5 10th-Gen Iris Plus Graphics G7 (Ice Lake 64 EU), i5-1038NG7, Apple SSD SM0512F | |
|---|---|---|---|---|---|---|
| Noise | -2% | -5% | -2% | -1% | -4% | |
| uit / omgeving * (dB) | 29 | 30 -3% | 28.1 3% | 30.2 -4% | 29.6 -2% | 29.6 -2% |
| Idle Minimum * (dB) | 29 | 30 -3% | 28.1 3% | 30.2 -4% | 29.6 -2% | 29.6 -2% |
| Idle Average * (dB) | 29 | 30 -3% | 28.1 3% | 30.2 -4% | 29.6 -2% | 29.6 -2% |
| Idle Maximum * (dB) | 29 | 30 -3% | 29 -0% | 30.2 -4% | 30.9 -7% | 29.6 -2% |
| Load Average * (dB) | 30.1 | 35 -16% | 41.1 -37% | 34.3 -14% | 33.9 -13% | 34.4 -14% |
| Load Maximum * (dB) | 41.3 | 35 15% | 41.1 -0% | 34.3 17% | 33.9 18% | 42.1 -2% |
| Witcher 3 ultra * (dB) | 41.1 | 36.1 |
* ... kleiner is beter
Geluidsniveau
| Onbelast |
| 29 / 29 / 29 dB (A) |
| Belasting |
| 30.1 / 41.3 dB (A) |
 | ||
30 dB stil 40 dB(A) hoorbaar 50 dB(A) luid |
||
min: | ||
(-) De maximumtemperatuur aan de bovenzijde bedraagt 45.2 °C / 113 F, vergeleken met het gemiddelde van 34.3 °C / 94 F, variërend van 21.2 tot 62.5 °C voor de klasse Office.
(-) De bodem warmt op tot een maximum van 52.8 °C / 127 F, vergeleken met een gemiddelde van 36.8 °C / 98 F
(+) Bij onbelast gebruik bedraagt de gemiddelde temperatuur voor de bovenzijde 26.3 °C / 79 F, vergeleken met het apparaatgemiddelde van 29.5 °C / 85 F.
(+) De palmsteunen en het touchpad zijn met een maximum van ###max## °C / 81 F koeler dan de huidtemperatuur en voelen daarom koel aan.
(±) De gemiddelde temperatuur van de handpalmsteun van soortgelijke toestellen bedroeg 27.5 °C / 81.5 F (+0.3 °C / 0.5 F).
Dell Latitude 7310 audioanalyse
(+) | luidsprekers kunnen relatief luid spelen (84 dB)
Bas 100 - 315 Hz
(-) | bijna geen lage tonen - gemiddeld 16.2% lager dan de mediaan
(±) | lineariteit van de lage tonen is gemiddeld (11.5% delta ten opzichte van de vorige frequentie)
Midden 400 - 2000 Hz
(+) | evenwichtige middens - slechts 2.8% verwijderd van de mediaan
(+) | de middentonen zijn lineair (4.4% delta ten opzichte van de vorige frequentie)
Hoog 2 - 16 kHz
(+) | evenwichtige hoogtepunten - slechts 2.5% verwijderd van de mediaan
(+) | de hoge tonen zijn lineair (4% delta naar de vorige frequentie)
Algemeen 100 - 16.000 Hz
(+) | het totale geluid is lineair (12.4% verschil met de mediaan)
Vergeleken met dezelfde klasse
» 5% van alle geteste apparaten in deze klasse waren beter, 2% vergelijkbaar, 93% slechter
» De beste had een delta van 7%, het gemiddelde was 21%, de slechtste was 53%
Vergeleken met alle geteste toestellen
» 11% van alle geteste apparaten waren beter, 2% gelijk, 87% slechter
» De beste had een delta van 4%, het gemiddelde was 24%, de slechtste was 134%
Apple MacBook 12 (Early 2016) 1.1 GHz audioanalyse
(+) | luidsprekers kunnen relatief luid spelen (83.6 dB)
Bas 100 - 315 Hz
(±) | verminderde zeebaars - gemiddeld 11.3% lager dan de mediaan
(±) | lineariteit van de lage tonen is gemiddeld (14.2% delta ten opzichte van de vorige frequentie)
Midden 400 - 2000 Hz
(+) | evenwichtige middens - slechts 2.4% verwijderd van de mediaan
(+) | de middentonen zijn lineair (5.5% delta ten opzichte van de vorige frequentie)
Hoog 2 - 16 kHz
(+) | evenwichtige hoogtepunten - slechts 2% verwijderd van de mediaan
(+) | de hoge tonen zijn lineair (4.5% delta naar de vorige frequentie)
Algemeen 100 - 16.000 Hz
(+) | het totale geluid is lineair (10.2% verschil met de mediaan)
Vergeleken met dezelfde klasse
» 7% van alle geteste apparaten in deze klasse waren beter, 2% vergelijkbaar, 91% slechter
» De beste had een delta van 5%, het gemiddelde was 18%, de slechtste was 53%
Vergeleken met alle geteste toestellen
» 5% van alle geteste apparaten waren beter, 1% gelijk, 94% slechter
» De beste had een delta van 4%, het gemiddelde was 24%, de slechtste was 134%
| Uit / Standby | |
| Inactief | |
| Belasting |
|
Key:
min: | |
| Dell Latitude 7310 i7-10610U, UHD Graphics 620, Samsung SSD PM981a MZVLB512HBJQ, IPS, 1920x1080, 13.3" | Dell Latitude 7300-P99G i7-8665U, UHD Graphics 620, Samsung SSD PM981 MZVLB512HAJQ, IPS LED, 1920x1080, 13.3" | Asus ZenBook S13 UX392FN i7-8565U, GeForce MX150, WDC PC SN520 SDAPNUW-512G, IPS, 1920x1080, 13.9" | Lenovo ThinkPad X395 R3 PRO 3300U, Vega 6, Samsung SSD PM981a MZVLB256HBHQ, IPS, 1920x1080, 13.3" | HP EliteBook 735 G6 7KN29EA R5 PRO 3500U, Vega 8, WDC PC SN520 SDAPNUW-256G, IPS LED, 1920x1080, 13.3" | Apple MacBook Pro 13 2020 2GHz i5 10th-Gen i5-1038NG7, Iris Plus Graphics G7 (Ice Lake 64 EU), Apple SSD SM0512F, IPS, 2560x1600, 13.3" | |
|---|---|---|---|---|---|---|
| Power Consumption | -26% | -46% | -29% | -53% | -60% | |
| Idle Minimum * (Watt) | 2.7 | 2.5 7% | 3.4 -26% | 4 -48% | 5.6 -107% | 3.8 -41% |
| Idle Average * (Watt) | 4.4 | 6.6 -50% | 6.3 -43% | 6.3 -43% | 8.1 -84% | 8.6 -95% |
| Idle Maximum * (Watt) | 4.8 | 8.7 -81% | 10.4 -117% | 9.3 -94% | 9.6 -100% | 10.3 -115% |
| Load Average * (Watt) | 33.4 | 35.4 -6% | 51 -53% | 34 -2% | 34.3 -3% | 52.1 -56% |
| Load Maximum * (Watt) | 69.7 | 68.1 2% | 62.7 10% | 42 40% | 48.6 30% | 65.2 6% |
| Witcher 3 ultra * (Watt) | 39 | 48.2 |
* ... kleiner is beter
| Dell Latitude 7310 i7-10610U, UHD Graphics 620, 52 Wh | Dell Latitude 7300-P99G i7-8665U, UHD Graphics 620, 60 Wh | Asus ZenBook S13 UX392FN i7-8565U, GeForce MX150, 50 Wh | Lenovo ThinkPad X395 R3 PRO 3300U, Vega 6, 48 Wh | HP EliteBook 735 G6 7KN29EA R5 PRO 3500U, Vega 8, 50 Wh | Apple MacBook Pro 13 2020 2GHz i5 10th-Gen i5-1038NG7, Iris Plus Graphics G7 (Ice Lake 64 EU), 58 Wh | |
|---|---|---|---|---|---|---|
| Batterijduur | -4% | -21% | 16% | -35% | -4% | |
| Reader / Idle (h) | 37.4 | 28.5 -24% | 18.4 -51% | |||
| WiFi v1.3 (h) | 12.6 | 10.8 -14% | 8.4 -33% | 10.9 -13% | 8.2 -35% | 12.1 -4% |
| Load (h) | 1.8 | 1.9 6% | 1.7 -6% | 3.8 111% |
Pro
Contra
Voor het volledige, Engelse testrapport, klik hier.
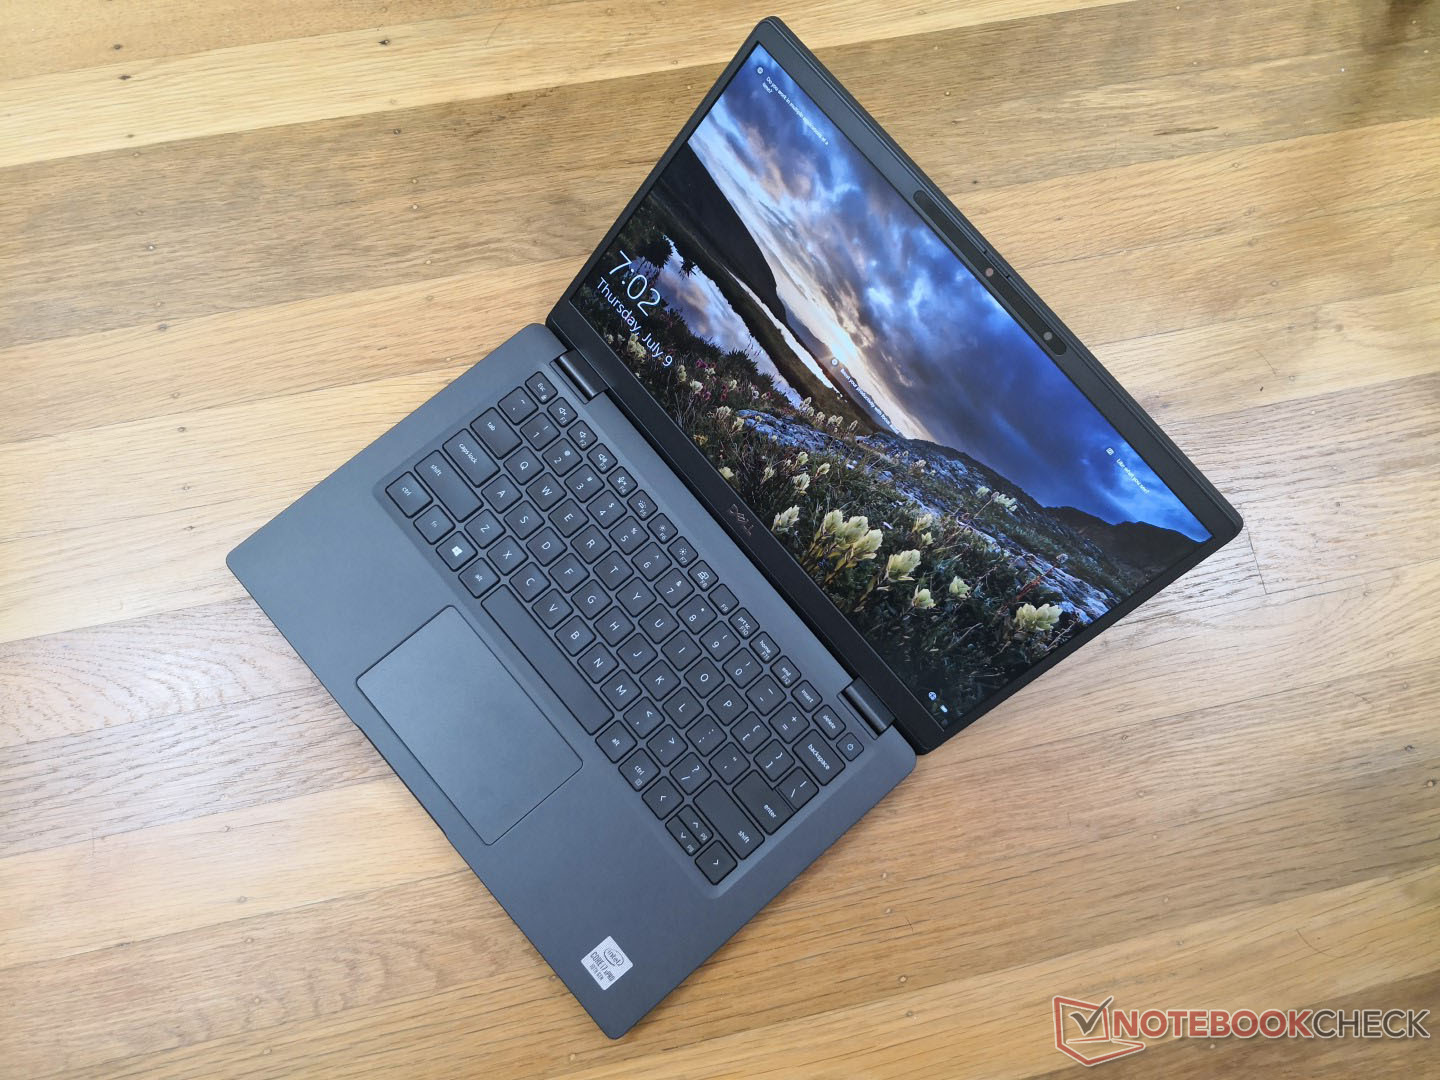
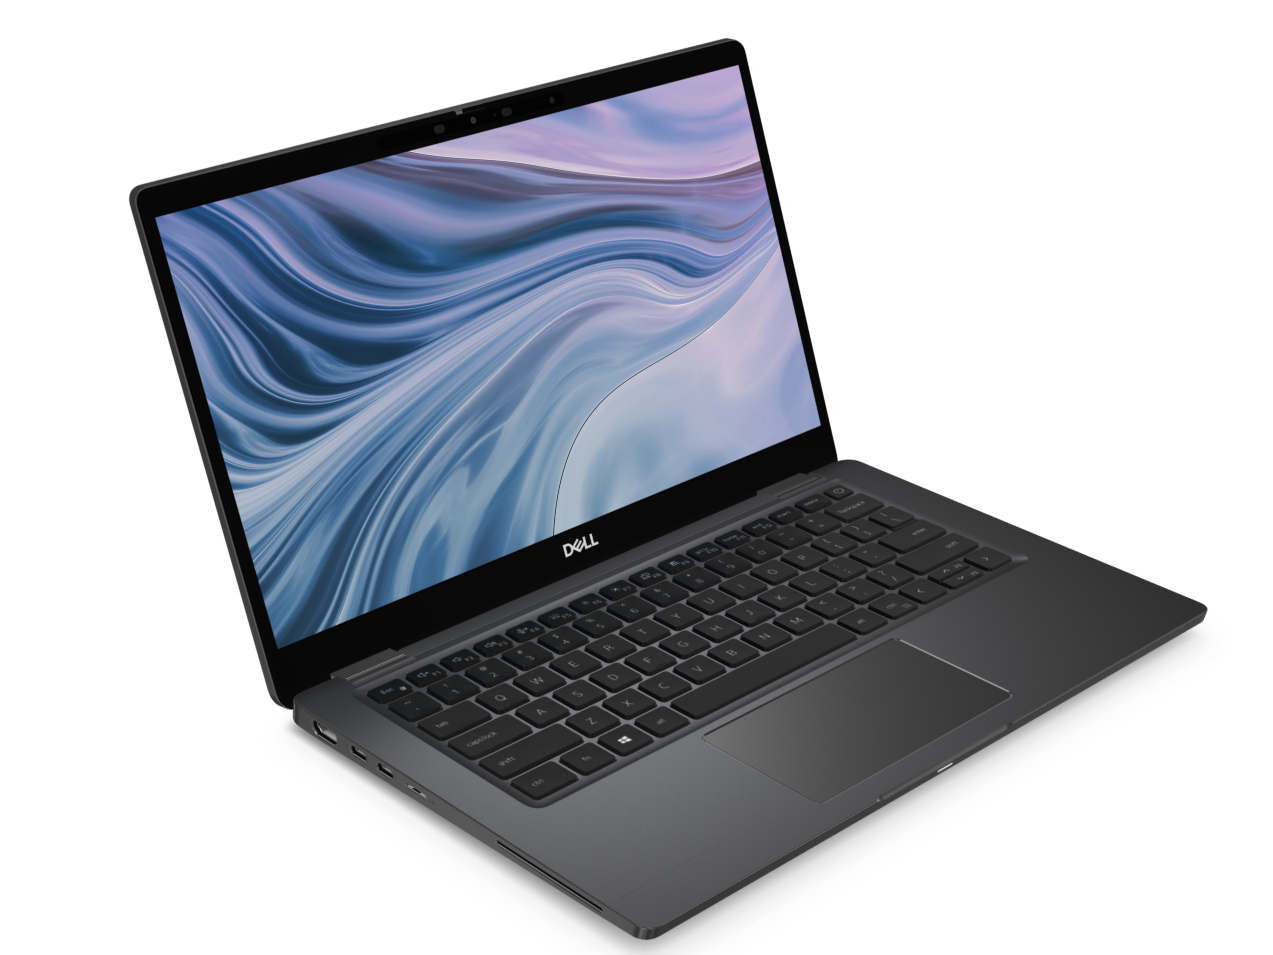
Alsof de Latitude 7300 van vorig jaar niet compact genoeg was, is de Latitude 7310 nu nog kleiner, lichter en discreter om in vrijwel elke kantoor- of werkomgeving te passen. Afgezien van het sponsachtige clickpad, valt er niet veel te haten aan Dell's nieuwste high-end subnotebook.
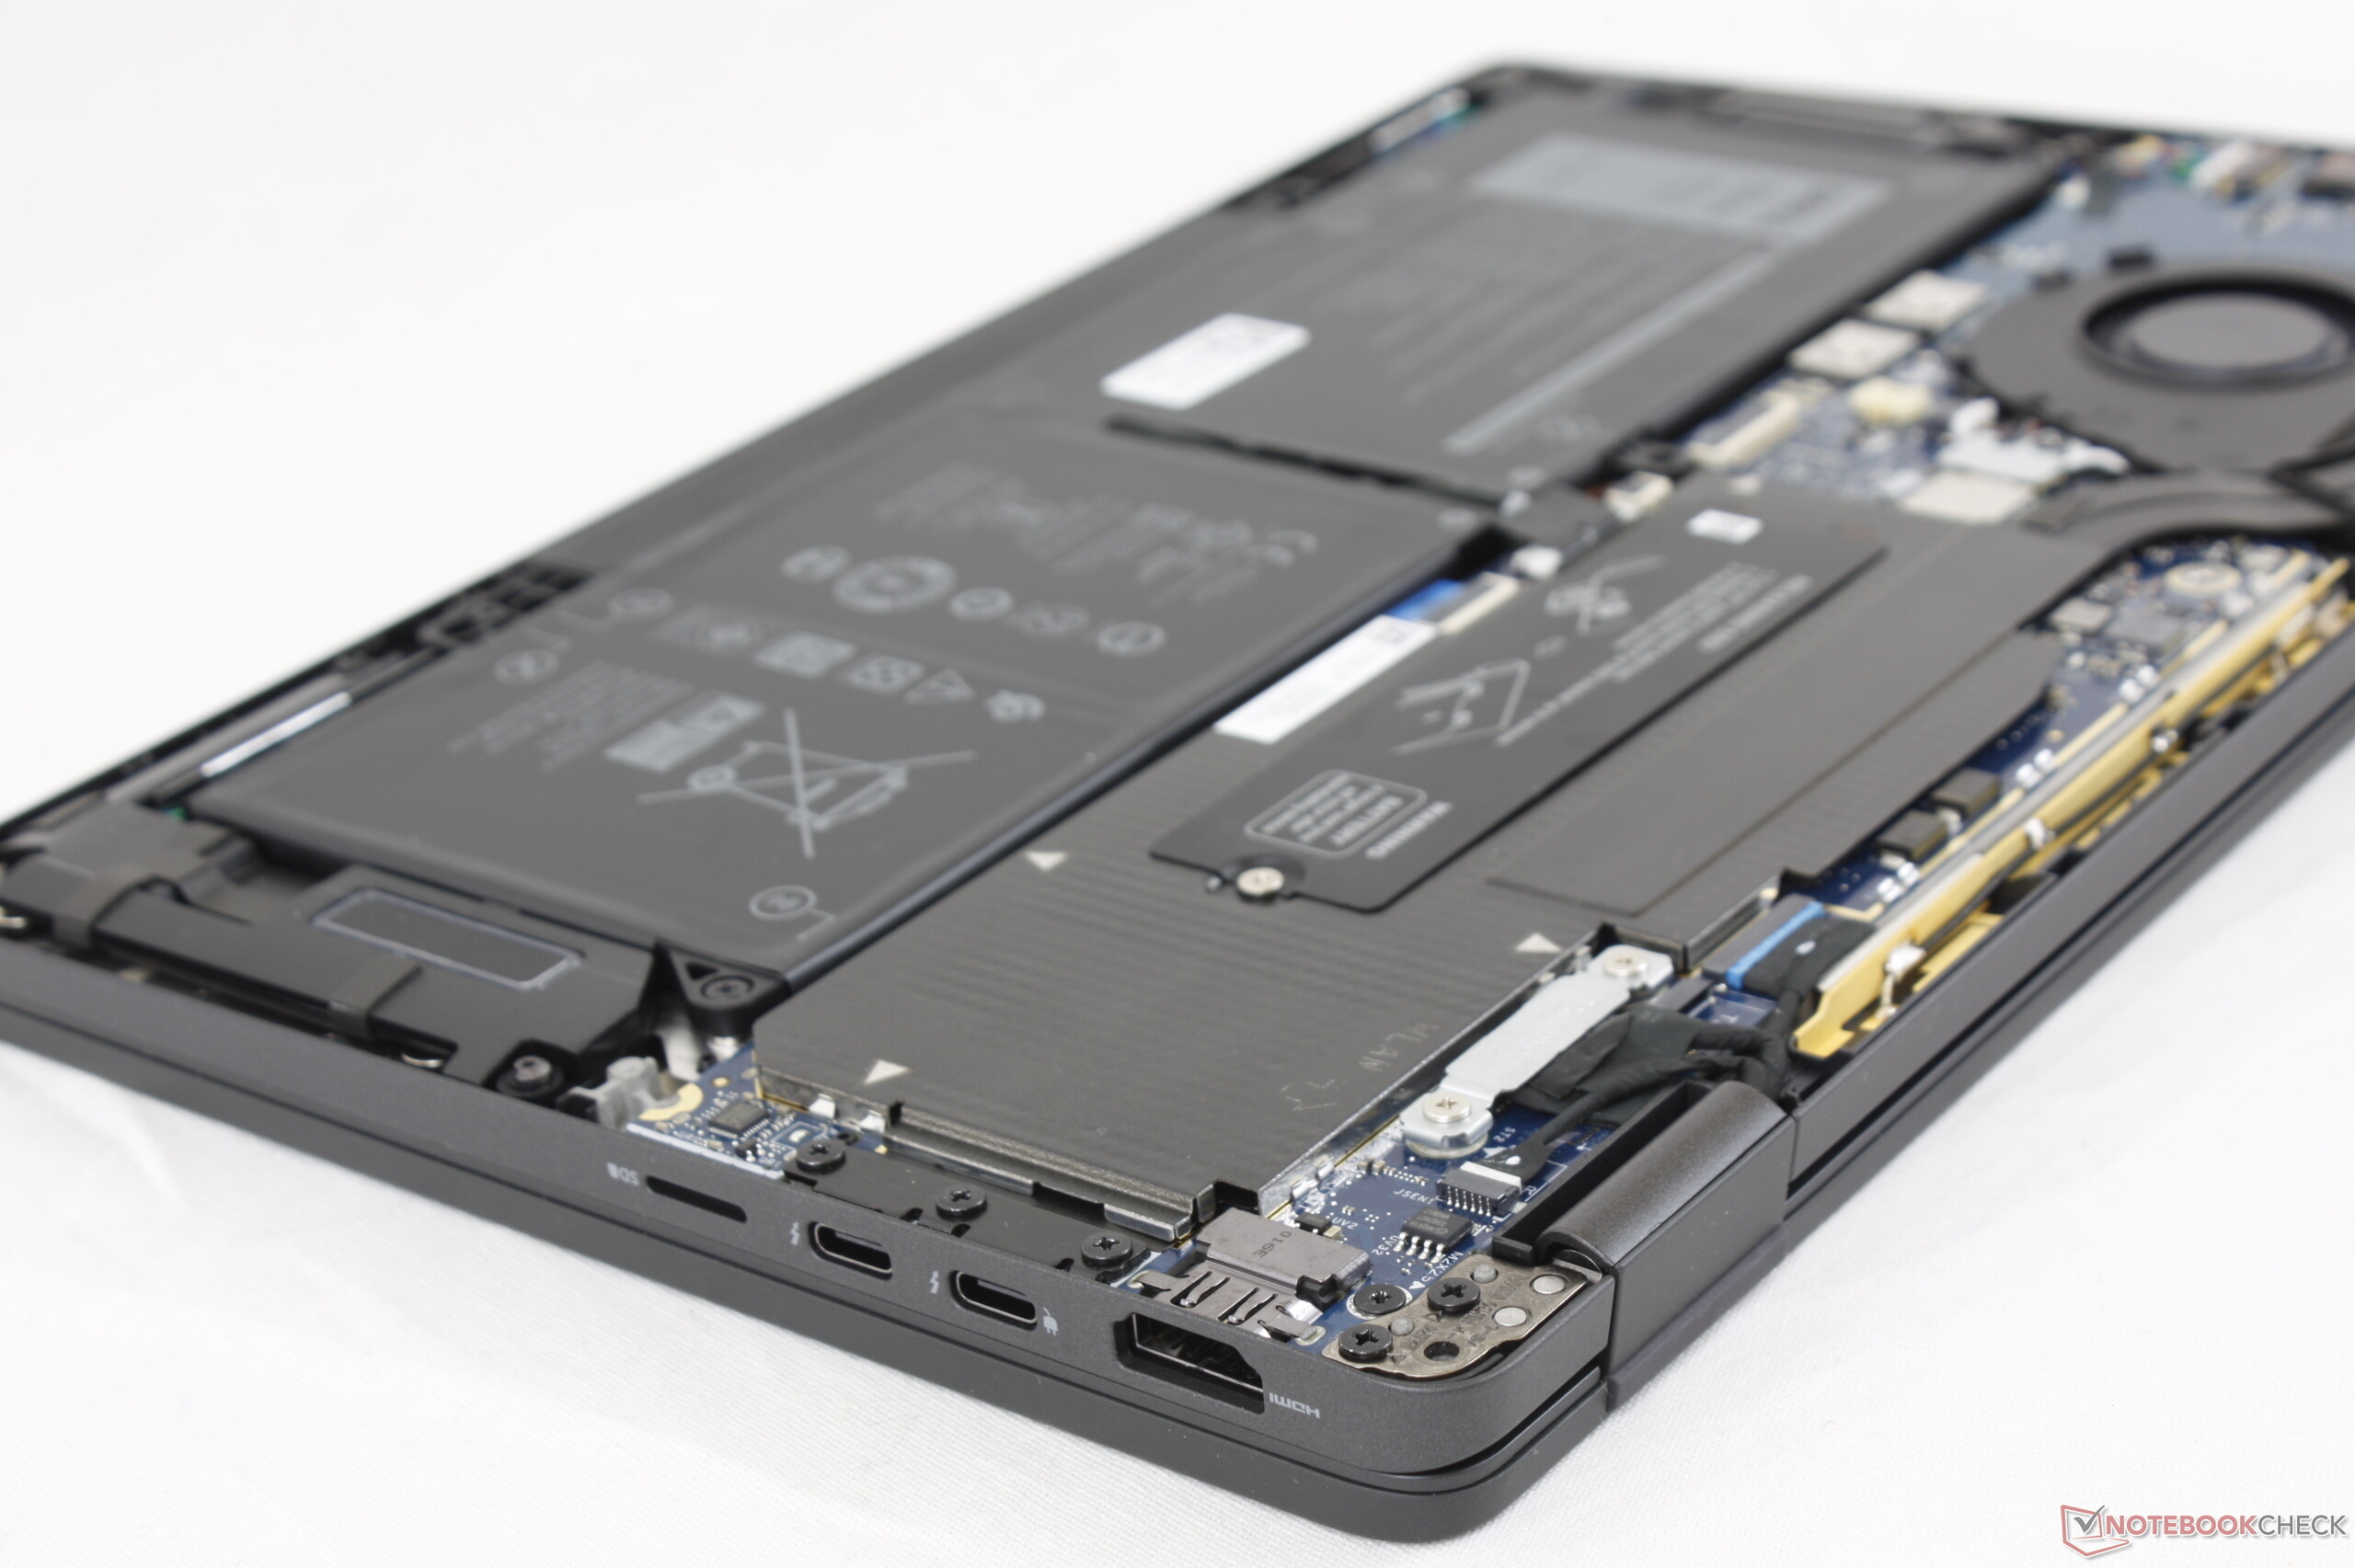
Wat ons meer stoort, is het ontbreken van bepaalde functies. Denk daarbij aan de TrackPoint en speciale muisknoppen die het klikken en de cursorbesturing absoluut eenvoudiger en nauwkeuriger zouden hebben gemaakt. Gebruikers die liever tactiele muisknoppen en upgradebare RAM en WLAN hebben, hebben nog steeds sterke redenen om de voorkeur te geven aan de Latitude 7300 boven de 7310. Bovendien zou een helderdere 500-nit of hoger beeldscherm-optie de laptop een nog betere outdoor- of reisgenoot hebben gemaakt.
Het gebrek aan betere processoropties buiten de quad-core Comet Lake-U wordt ook steeds duidelijker. Hoewel de laptop niet gericht is op gebruikers met hoge prestaties, beginnen concurrenten veel snellere AMD Ryzen-CPU's aan te bieden met hetzelfde of vergelijkbare energieverbruik voor superieure prestaties per Watt. Het feit dat de Latitude 7300 bijna identiek kan presteren aan de Latitude 7310, helpt daar ook niet bij.
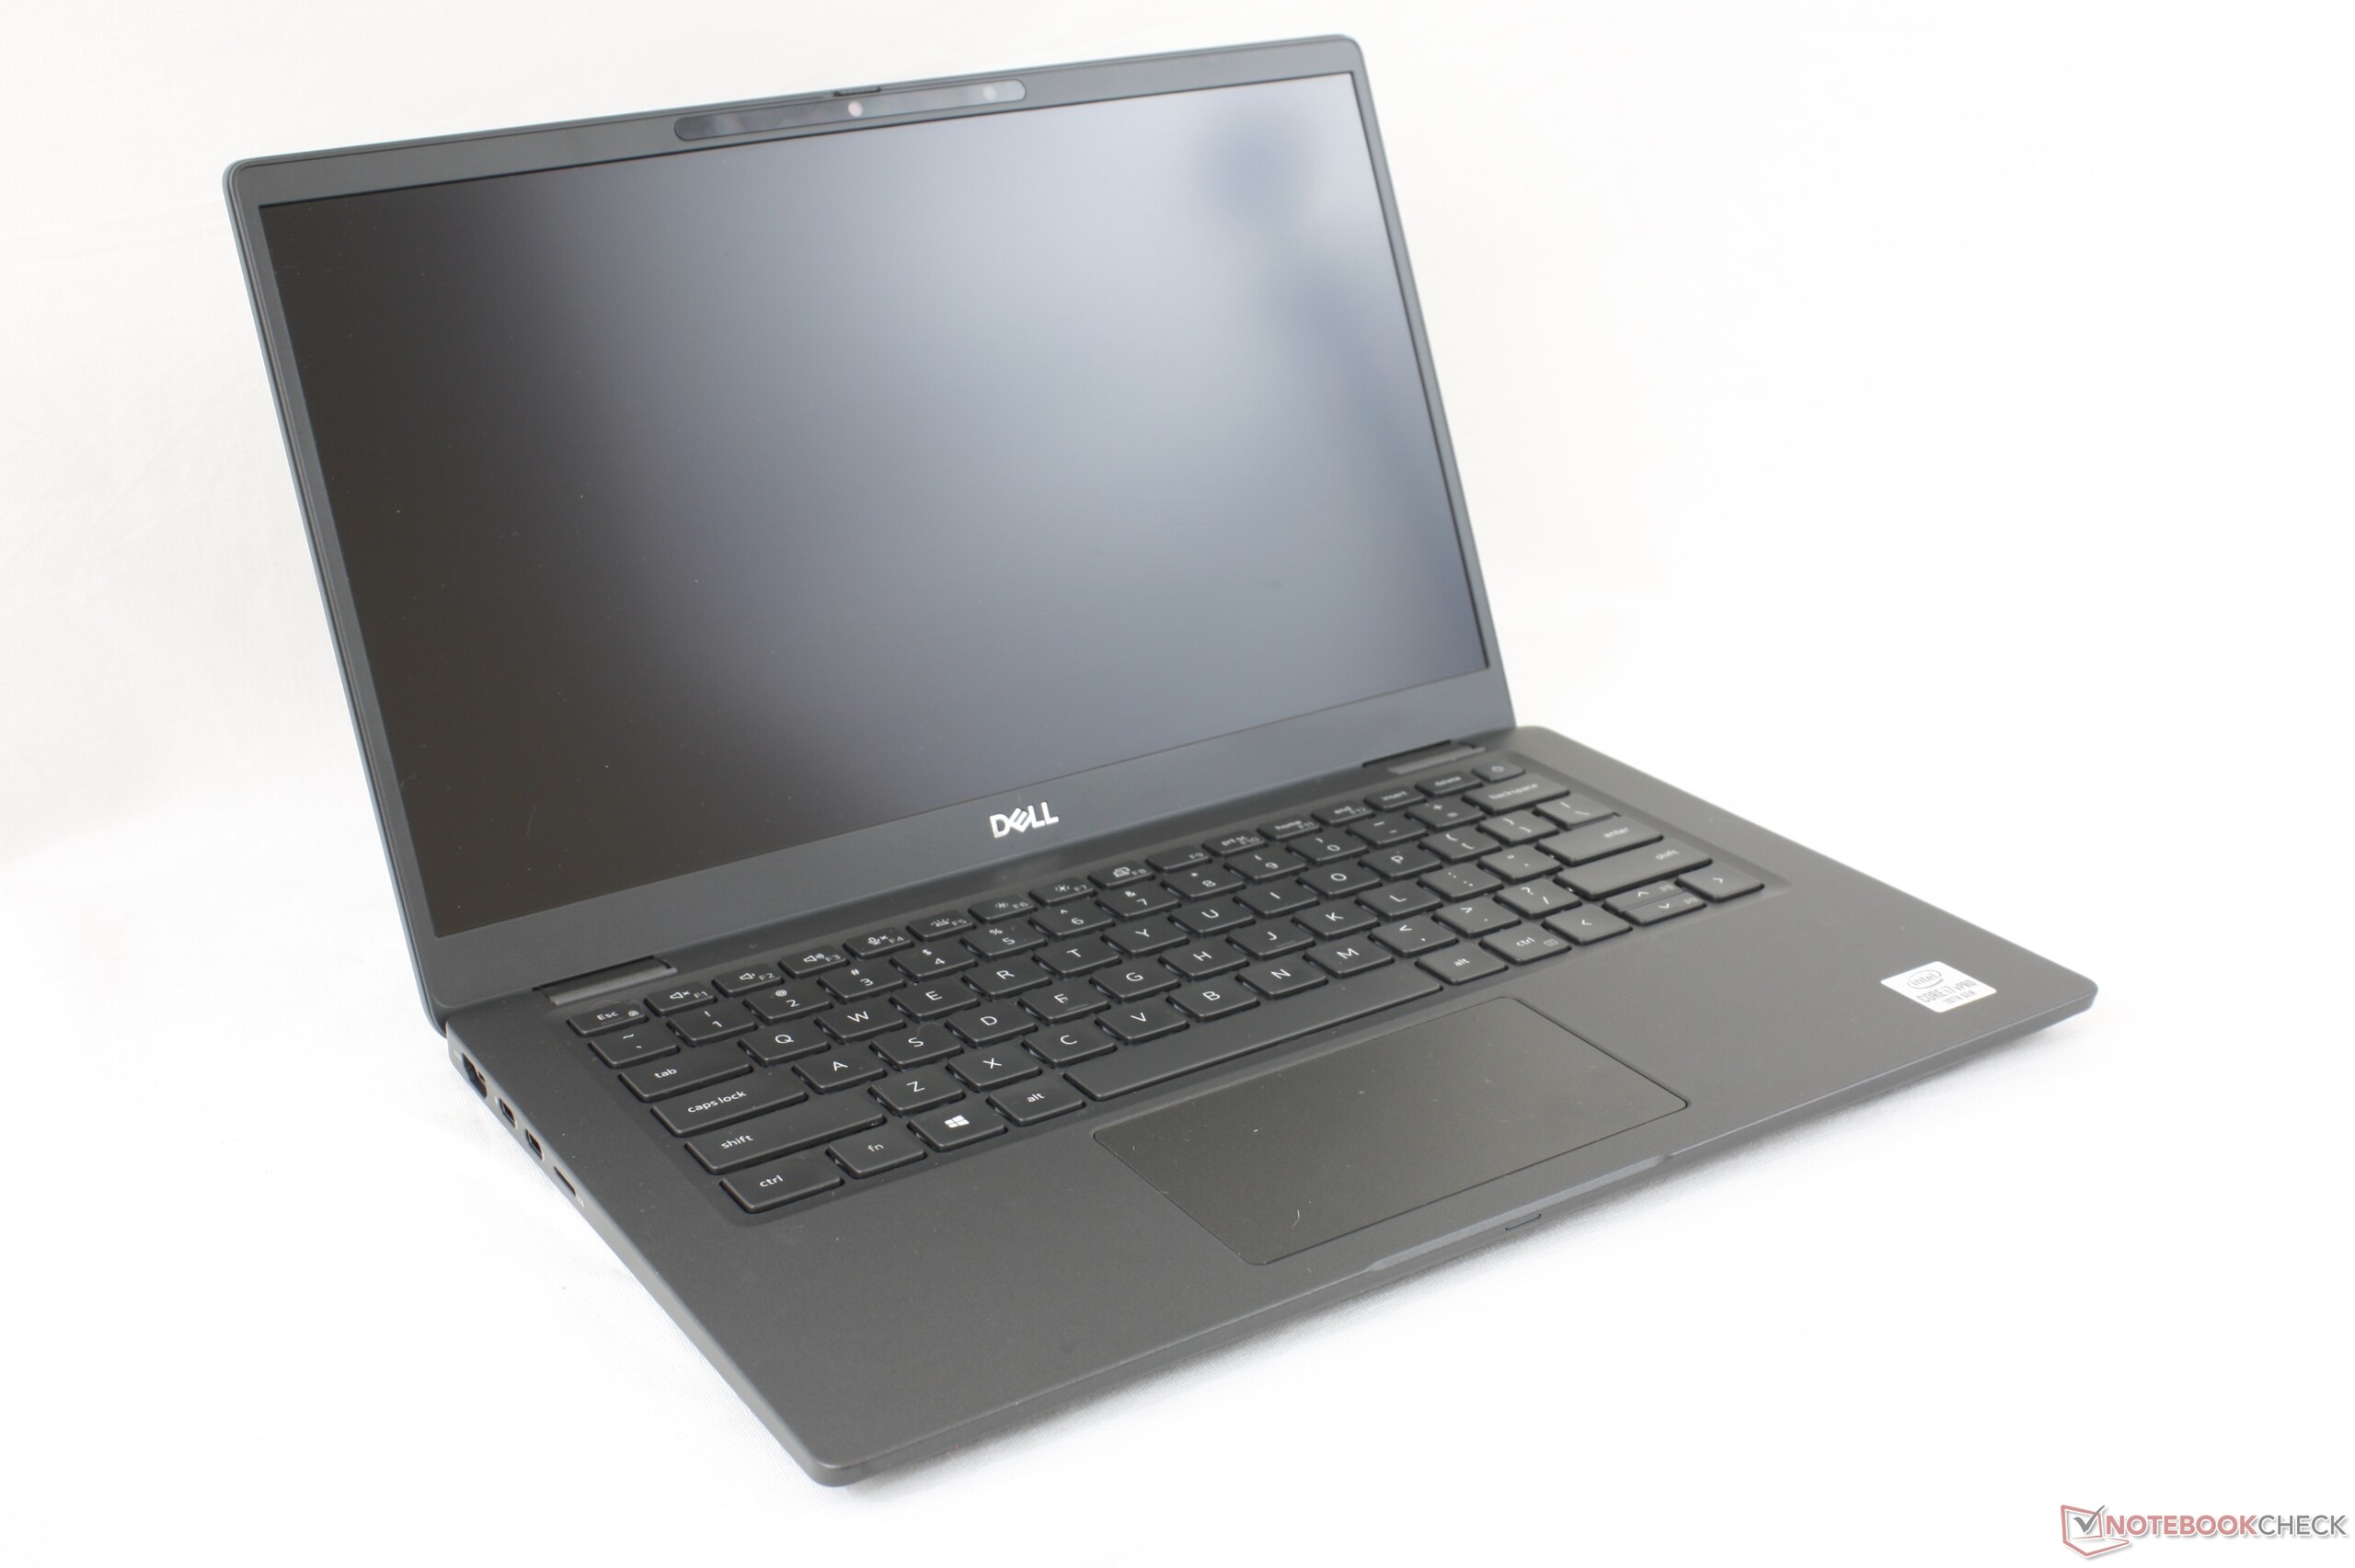
De Latitude 7310 is een meer verfijnde versie van de Latitude 7300. Hij laat onderweg een aantal functies achterwege, maar het slankere en meer draagbare ontwerp is de moeite waard voor reizigers of zakelijke gebruikers die constant onderweg zijn.
Dell Latitude 7310
- 13-07-2020 v7 (old)
Allen Ngo
Price comparison
