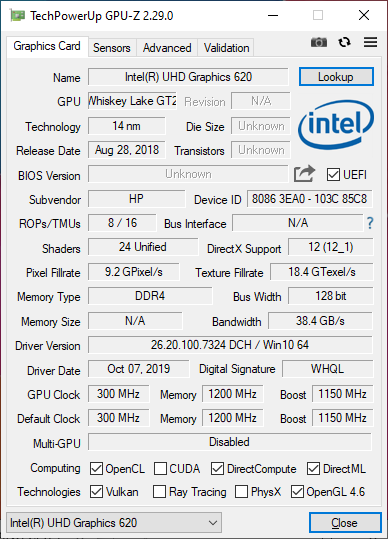
Kort testrapport HP Pavilion x360 15 2019 Convertible: laat deze configuratie links liggen
Evaluatie | Datum | Model | Gewicht | Hoogte | Formaat | Resolutie | Beste prijs |
|---|---|---|---|---|---|---|---|
| 72 % v7 (old) | 02-2020 | HP Pavilion x360 15-dq0065cl i7-8565U, UHD Graphics 620 | 1.9 kg | 20.6 mm | 15.60" | 1366x768 | |
| 78.9 % v6 (old) | 07-2018 | Asus VivoBook Flip 15 TP510UA-E8073T i5-8250U, UHD Graphics 620 | 2.3 kg | 18 mm | 15.60" | 1920x1080 | |
| 82.6 % v7 (old) | 12-2019 | Lenovo Ideapad C340-15IWL-81N5004QGE i5-8265U, GeForce MX230 | 2 kg | 20.5 mm | 15.60" | 1920x1080 | |
| 80.1 % v6 (old) | 04-2018 | HP Envy x360 15-bq102ng R5 2500U, Vega 8 | 2.1 kg | 19.6 mm | 15.60" | 1920x1080 | |
| 77.6 % v6 (old) | 06-2019 | Dell Inspiron 15 3585 (2300U, Vega 6) R3 2300U, Vega 6 | 1.9 kg | 20 mm | 15.60" | 1920x1080 |
| SD Card Reader | |
| average JPG Copy Test (av. of 3 runs) | |
| Dell XPS 15 7590 i5 iGPU FHD (Toshiba Exceria Pro SDXC 64 GB UHS-II) | |
| HP Pavilion x360 15-dq0065cl (Toshiba Exceria Pro SDXC 64 GB UHS-II) | |
| Lenovo Ideapad C340-15IWL-81N5004QGE (Toshiba Exceria Pro SDXC 64 GB UHS-II) | |
| HP Envy x360 15-bq102ng (Toshiba Exceria Pro SDXC 64 GB UHS-II) | |
| Dell Inspiron 15 3585 (2300U, Vega 6) (Toshiba Exceria Pro SDXC 64 GB UHS-II) | |
| Asus VivoBook Flip 15 TP510UA-E8073T (Toshiba Exceria Pro SDXC 64 GB UHS-II) | |
| maximum AS SSD Seq Read Test (1GB) | |
| Dell XPS 15 7590 i5 iGPU FHD (Toshiba Exceria Pro SDXC 64 GB UHS-II) | |
| Lenovo Ideapad C340-15IWL-81N5004QGE (Toshiba Exceria Pro SDXC 64 GB UHS-II) | |
| HP Envy x360 15-bq102ng (Toshiba Exceria Pro SDXC 64 GB UHS-II) | |
| HP Pavilion x360 15-dq0065cl (Toshiba Exceria Pro SDXC 64 GB UHS-II) | |
| Dell Inspiron 15 3585 (2300U, Vega 6) (Toshiba Exceria Pro SDXC 64 GB UHS-II) | |
| Asus VivoBook Flip 15 TP510UA-E8073T (Toshiba Exceria Pro SDXC 64 GB UHS-II) | |
| |||||||||||||||||||||||||
Helderheidsverdeling: 88 %
Helderheid in Batterij-modus: 195.7 cd/m²
Contrast: 288:1 (Zwart: 0.68 cd/m²)
ΔE ColorChecker Calman: 11.99 | ∀{0.5-29.43 Ø4.71}
calibrated: 4.63
ΔE Greyscale Calman: 12.8 | ∀{0.09-98 Ø4.96}
57.8% sRGB (Argyll 1.6.3 3D)
36.7% AdobeRGB 1998 (Argyll 1.6.3 3D)
39.93% AdobeRGB 1998 (Argyll 3D)
58.2% sRGB (Argyll 3D)
38.65% Display P3 (Argyll 3D)
Gamma: 2.15
CCT: 14252 K
| HP Pavilion x360 15-dq0065cl BOE076E, TN LED, 15.6", 1366x768 | Asus VivoBook Flip 15 TP510UA-E8073T AU Optronics B156HAN02.1, IPS, 15.6", 1920x1080 | Lenovo Ideapad C340-15IWL-81N5004QGE BOE CQ NV156FHM-N48, IPS, 15.6", 1920x1080 | HP Envy x360 15-bq102ng Chi Mei CM15E9, IPS, 15.6", 1920x1080 | Dell Inspiron 15 3585 (2300U, Vega 6) BOE0802, TN, 15.6", 1920x1080 | Dell XPS 15 7590 i5 iGPU FHD LQ156M1, IPS, 15.6", 1920x1080 | |
|---|---|---|---|---|---|---|
| Display | 1% | 0% | 7% | 1% | 70% | |
| Display P3 Coverage (%) | 38.65 | 39.19 1% | 39.05 1% | 41.36 7% | 39.22 1% | 66.5 72% |
| sRGB Coverage (%) | 58.2 | 58.9 1% | 57.3 -2% | 62.2 7% | 58.9 1% | 98 68% |
| AdobeRGB 1998 Coverage (%) | 39.93 | 40.49 1% | 40.35 1% | 42.74 7% | 40.52 1% | 68.4 71% |
| Response Times | -25% | -48% | -13% | 33% | -41% | |
| Response Time Grey 50% / Grey 80% * (ms) | 68.8 ? | 44 ? 36% | 57 ? 17% | 40 ? 42% | 39 ? 43% | 52.8 ? 23% |
| Response Time Black / White * (ms) | 15.6 ? | 29 ? -86% | 33 ? -112% | 26 ? -67% | 12 ? 23% | 32 ? -105% |
| PWM Frequency (Hz) | 1000 ? | 352 ? | 25000 ? | 250 ? | 1020 ? | |
| Screen | 71% | 64% | 81% | 13% | 118% | |
| Brightness middle (cd/m²) | 195.7 | 229 17% | 266 36% | 221 13% | 225 15% | 588 200% |
| Brightness (cd/m²) | 186 | 221 19% | 251 35% | 207 11% | 213 15% | 555 198% |
| Brightness Distribution (%) | 88 | 76 -14% | 81 -8% | 87 -1% | 88 0% | 89 1% |
| Black Level * (cd/m²) | 0.68 | 0.15 78% | 0.165 76% | 0.15 78% | 0.535 21% | 0.4 41% |
| Contrast (:1) | 288 | 1527 430% | 1612 460% | 1473 411% | 421 46% | 1470 410% |
| Colorchecker dE 2000 * | 11.99 | 5.03 58% | 6.33 47% | 4.35 64% | 10.37 14% | 2.5 79% |
| Colorchecker dE 2000 max. * | 21.31 | 8.89 58% | 21.03 1% | 8.98 58% | 19.75 7% | 6.3 70% |
| Colorchecker dE 2000 calibrated * | 4.63 | 5.23 -13% | 3.89 16% | 0.6 87% | ||
| Greyscale dE 2000 * | 12.8 | 5.56 57% | 3.81 70% | 3.09 76% | 12.09 6% | 4.5 65% |
| Gamma | 2.15 102% | 2.64 83% | 2.38 92% | 2.23 99% | 2.72 81% | 2.2 100% |
| CCT | 14252 46% | 7015 93% | 6057 107% | 6068 107% | 13335 49% | 6836 95% |
| Color Space (Percent of AdobeRGB 1998) (%) | 36.7 | 37 1% | 37 1% | 56 53% | 37 1% | 63.2 72% |
| Color Space (Percent of sRGB) (%) | 57.8 | 59 2% | 57 -1% | 86 49% | 59 2% | 98 70% |
| Totaal Gemiddelde (Programma / Instellingen) | 16% /
44% | 5% /
38% | 25% /
54% | 16% /
13% | 49% /
89% |
* ... kleiner is beter
Responstijd Scherm
| ↔ Responstijd Zwart naar Wit | ||
|---|---|---|
| 15.6 ms ... stijging ↗ en daling ↘ gecombineerd | ↗ 9.2 ms stijging | 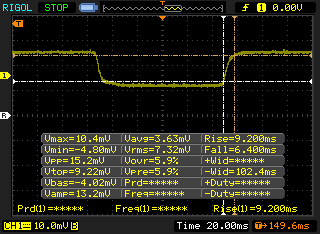 |
| ↘ 6.4 ms daling | ||
| Het scherm vertoonde prima responstijden in onze tests maar is misschien wat te traag voor competitieve games. Ter vergelijking: alle testtoestellen variëren van 0.1 (minimum) tot 240 (maximum) ms. » 37 % van alle toestellen zijn beter. Dit betekent dat de gemeten responstijd beter is dan het gemiddelde (19.8 ms) van alle geteste toestellen. | ||
| ↔ Responstijd 50% Grijs naar 80% Grijs | ||
| 68.8 ms ... stijging ↗ en daling ↘ gecombineerd | ↗ 30 ms stijging | 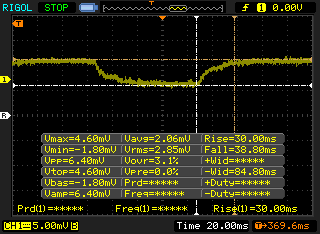 |
| ↘ 38.8 ms daling | ||
| Het scherm vertoonde trage responstijden in onze tests en is misschien te traag voor games. Ter vergelijking: alle testtoestellen variëren van 0.165 (minimum) tot 636 (maximum) ms. » 98 % van alle toestellen zijn beter. Dit betekent dat de gemeten responstijd slechter is dan het gemiddelde (31 ms) van alle geteste toestellen. | ||
Screen Flickering / PWM (Pulse-Width Modulation)
| Screen flickering / PWM waargenomen | 1000 Hz | ≤ 99 % helderheid instelling | 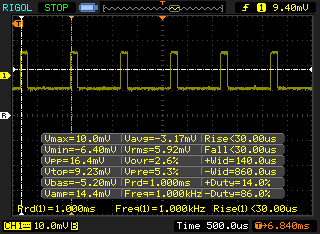 |
De achtergrondverlichting van het scherm flikkert op 1000 Hz (in het slechtste geval, bijvoorbeeld bij gebruik van PWM) aan een helderheid van 99 % en lager. Boven deze helderheid zou er geen flickering / PWM mogen optreden. De frequentie van 1000 Hz is redelijk hoog en de meeste mensen die gevoelig zijn aan flickering zouden dit dus niet mogen waarnemen of geïrriteerde ogen krijgen. Ter vergelijking: 52 % van alle geteste toestellen maakten geen gebruik van PWM om de schermhelderheid te verlagen. Als het wel werd gebruikt, werd een gemiddelde van 7754 (minimum: 5 - maximum: 343500) Hz waargenomen. | |||
| Cinebench R10 | |
| Rendering Multiple CPUs 32Bit | |
| Dell XPS 13 7390 Core i7-10710U | |
| Gemiddeld Intel Core i7-8565U (13806 - 23118, n=16) | |
| Dynabook Portege A30-E-174 | |
| Rendering Single 32Bit | |
| Dell XPS 13 7390 Core i7-10710U | |
| Gemiddeld Intel Core i7-8565U (2682 - 8906, n=16) | |
| Dynabook Portege A30-E-174 | |
| wPrime 2.10 - 1024m | |
| Gemiddeld Intel Core i7-8565U (263 - 420, n=7) | |
| Dell XPS 13 7390 Core i7-10710U | |
* ... kleiner is beter
| PCMark 8 Home Score Accelerated v2 | 3335 punten | |
| PCMark 8 Work Score Accelerated v2 | 5132 punten | |
| PCMark 10 Score | 3787 punten | |
Help | ||
| HP Pavilion x360 15-dq0065cl Intel SSD 660p SSDPEKNW512G8 | Asus VivoBook Flip 15 TP510UA-E8073T SanDisk SD8SN8U128G1002 | Lenovo Ideapad C340-15IWL-81N5004QGE SK hynix BC501 HFM128GDJTNG-831 | HP Envy x360 15-bq102ng Samsung PM961 MZVLW256HEHP | Dell Inspiron 15 3585 (2300U, Vega 6) Toshiba BG3 KBG30ZMS256G | Dell XPS 15 7590 i5 iGPU FHD Toshiba XG6 KXG60ZNV512G | |
|---|---|---|---|---|---|---|
| AS SSD | -60% | -35% | 19% | -73% | 70% | |
| Seq Read (MB/s) | 1301 | 474.8 -64% | 1399 8% | 2465 89% | 1291 -1% | 2357 81% |
| Seq Write (MB/s) | 931 | 229.3 -75% | 369.8 -60% | 1318 42% | 688 -26% | 1235 33% |
| 4K Read (MB/s) | 52.8 | 26.42 -50% | 40 -24% | 42.97 -19% | 21.87 -59% | 43.29 -18% |
| 4K Write (MB/s) | 127.5 | 49.85 -61% | 109.2 -14% | 81.9 -36% | 35.62 -72% | 99.7 -22% |
| 4K-64 Read (MB/s) | 323.4 | 364.5 13% | 264.3 -18% | 1025 217% | 632 95% | 1020 215% |
| 4K-64 Write (MB/s) | 667 | 93.2 -86% | 181.9 -73% | 338.6 -49% | 221.2 -67% | 1502 125% |
| Access Time Read * (ms) | 0.048 | 0.13 -171% | 0.07 -46% | 0.077 -60% | 0.33 -588% | 0.07 -46% |
| Access Time Write * (ms) | 0.136 | 0.088 35% | 0.041 70% | 0.046 66% | 0.234 -72% | 0.039 71% |
| Score Read (Points) | 506 | 438 -13% | 444 -12% | 1314 160% | 783 55% | 1299 157% |
| Score Write (Points) | 887 | 166 -81% | 328 -63% | 552 -38% | 326 -63% | 1726 95% |
| Score Total (Points) | 1655 | 825 -50% | 963 -42% | 2488 50% | 1489 -10% | 3640 120% |
| Copy ISO MB/s (MB/s) | 905 | 317.8 -65% | 265.8 -71% | 700 -23% | 432.6 -52% | 2145 137% |
| Copy Program MB/s (MB/s) | 607 | 80.8 -87% | 158.7 -74% | 167.2 -72% | 95.6 -84% | 565 -7% |
| Copy Game MB/s (MB/s) | 911 | 127.1 -86% | 216.8 -76% | 370.4 -59% | 263.4 -71% | 1320 45% |
| CrystalDiskMark 5.2 / 6 | -39% | 4% | -39% | 32% | ||
| Write 4K (MB/s) | 179 | 105 -41% | 116 -35% | 87.3 -51% | 93.6 -48% | |
| Read 4K (MB/s) | 58.7 | 39.72 -32% | 42.73 -27% | 23.54 -60% | 41.87 -29% | |
| Write Seq (MB/s) | 974 | 326.9 -66% | 1222 25% | 824 -15% | 1698 74% | |
| Read Seq (MB/s) | 1614 | 1033 -36% | 1608 0% | 715 -56% | 1978 23% | |
| Write 4K Q32T1 (MB/s) | 445.4 | 269.1 -40% | 280.1 -37% | 147.8 -67% | 383.1 -14% | |
| Read 4K Q32T1 (MB/s) | 338.7 | 284.8 -16% | 333.6 -2% | 256.1 -24% | 326.9 -3% | |
| Write Seq Q32T1 (MB/s) | 986 | 321 -67% | 1291 31% | 733 -26% | 2778 182% | |
| Read Seq Q32T1 (MB/s) | 1824 | 1606 -12% | 3183 75% | 1525 -16% | 3119 71% | |
| Totaal Gemiddelde (Programma / Instellingen) | -60% /
-60% | -37% /
-37% | 12% /
14% | -56% /
-60% | 51% /
56% |
* ... kleiner is beter

| 3DMark 11 Performance | 1933 punten | |
| 3DMark Cloud Gate Standard Score | 7819 punten | |
| 3DMark Fire Strike Score | 1008 punten | |
| 3DMark Time Spy Score | 427 punten | |
Help | ||
| Shadow of the Tomb Raider - 1280x720 Lowest Preset | |
| MSI Modern 14 A10RB-459US | |
| Dell Inspiron 15 5000 5585 | |
| Microsoft Surface Laptop 3 15 i7-1065G7 | |
| Dell Inspiron 15 3585 (2300U, Vega 6) | |
| Dell XPS 13 7390 Core i7-10710U | |
| Gemiddeld Intel UHD Graphics 620 (12 - 21.7, n=13) | |
| lage | gem. | hoge | ultra | |
|---|---|---|---|---|
| BioShock Infinite (2013) | 49.1 | 30.5 | 24.7 | |
| The Witcher 3 (2015) | 16.8 | 10.5 | ||
| Rocket League (2017) | 62.7 |
| HP Pavilion x360 15-dq0065cl UHD Graphics 620, i7-8565U, Intel SSD 660p SSDPEKNW512G8 | Asus VivoBook Flip 15 TP510UA-E8073T UHD Graphics 620, i5-8250U, SanDisk SD8SN8U128G1002 | Lenovo Ideapad C340-15IWL-81N5004QGE GeForce MX230, i5-8265U, SK hynix BC501 HFM128GDJTNG-831 | HP Envy x360 15-bq102ng Vega 8, R5 2500U, Samsung PM961 MZVLW256HEHP | Dell Inspiron 15 3585 (2300U, Vega 6) Vega 6, R3 2300U, Toshiba BG3 KBG30ZMS256G | Dell XPS 15 7590 i5 iGPU FHD UHD Graphics 630, i5-9300H, Toshiba XG6 KXG60ZNV512G | |
|---|---|---|---|---|---|---|
| Noise | -6% | -8% | -9% | -10% | -3% | |
| uit / omgeving * (dB) | 28.4 | 30.2 -6% | 30.3 -7% | 30.13 -6% | 30.6 -8% | 29.3 -3% |
| Idle Minimum * (dB) | 28.4 | 30.9 -9% | 30.6 -8% | 30.13 -6% | 30.6 -8% | 29.3 -3% |
| Idle Average * (dB) | 28.4 | 30.9 -9% | 30.6 -8% | 30.13 -6% | 30.6 -8% | 29.3 -3% |
| Idle Maximum * (dB) | 28.4 | 30.9 -9% | 30.6 -8% | 30.13 -6% | 30.6 -8% | 29.8 -5% |
| Load Average * (dB) | 31.5 | 34.2 -9% | 36.4 -16% | 38.8 -23% | 36.7 -17% | 32.4 -3% |
| Load Maximum * (dB) | 37.4 | 34.2 9% | 36.8 2% | 38.8 -4% | 41.1 -10% | 37.2 1% |
* ... kleiner is beter
Geluidsniveau
| Onbelast |
| 28.4 / 28.4 / 28.4 dB (A) |
| Belasting |
| 31.5 / 37.4 dB (A) |
 | ||
30 dB stil 40 dB(A) hoorbaar 50 dB(A) luid |
||
min: | ||
(+) De maximumtemperatuur aan de bovenzijde bedraagt 31.6 °C / 89 F, vergeleken met het gemiddelde van 36.8 °C / 98 F, variërend van 21 tot 71 °C voor de klasse Multimedia.
(±) De bodem warmt op tot een maximum van 41.6 °C / 107 F, vergeleken met een gemiddelde van 39.1 °C / 102 F
(+) Bij onbelast gebruik bedraagt de gemiddelde temperatuur voor de bovenzijde 22.9 °C / 73 F, vergeleken met het apparaatgemiddelde van 31.3 °C / 88 F.
(+) De palmsteunen en het touchpad zijn met een maximum van ###max## °C / 85.6 F koeler dan de huidtemperatuur en voelen daarom koel aan.
(±) De gemiddelde temperatuur van de handpalmsteun van soortgelijke toestellen bedroeg 28.7 °C / 83.7 F (-1.1 °C / -1.9 F).
HP Pavilion x360 15-dq0065cl audioanalyse
(±) | luidspreker luidheid is gemiddeld maar goed (80.3 dB)
Bas 100 - 315 Hz
(±) | verminderde zeebaars - gemiddeld 12.7% lager dan de mediaan
(-) | de lage tonen zijn niet lineair (15.3% delta naar de vorige frequentie)
Midden 400 - 2000 Hz
(+) | evenwichtige middens - slechts 3.6% verwijderd van de mediaan
(±) | lineariteit van de middentonen is gemiddeld (7% delta ten opzichte van de vorige frequentie)
Hoog 2 - 16 kHz
(+) | evenwichtige hoogtepunten - slechts 3.6% verwijderd van de mediaan
(±) | lineariteit van de hoogtepunten is gemiddeld (7% delta ten opzichte van de vorige frequentie)
Algemeen 100 - 16.000 Hz
(±) | lineariteit van het totale geluid is gemiddeld (20.1% verschil met de mediaan)
Vergeleken met dezelfde klasse
» 67% van alle geteste apparaten in deze klasse waren beter, 8% vergelijkbaar, 25% slechter
» De beste had een delta van 5%, het gemiddelde was 17%, de slechtste was 45%
Vergeleken met alle geteste toestellen
» 52% van alle geteste apparaten waren beter, 8% gelijk, 40% slechter
» De beste had een delta van 4%, het gemiddelde was 23%, de slechtste was 134%
Apple MacBook 12 (Early 2016) 1.1 GHz audioanalyse
(+) | luidsprekers kunnen relatief luid spelen (83.6 dB)
Bas 100 - 315 Hz
(±) | verminderde zeebaars - gemiddeld 11.3% lager dan de mediaan
(±) | lineariteit van de lage tonen is gemiddeld (14.2% delta ten opzichte van de vorige frequentie)
Midden 400 - 2000 Hz
(+) | evenwichtige middens - slechts 2.4% verwijderd van de mediaan
(+) | de middentonen zijn lineair (5.5% delta ten opzichte van de vorige frequentie)
Hoog 2 - 16 kHz
(+) | evenwichtige hoogtepunten - slechts 2% verwijderd van de mediaan
(+) | de hoge tonen zijn lineair (4.5% delta naar de vorige frequentie)
Algemeen 100 - 16.000 Hz
(+) | het totale geluid is lineair (10.2% verschil met de mediaan)
Vergeleken met dezelfde klasse
» 7% van alle geteste apparaten in deze klasse waren beter, 2% vergelijkbaar, 90% slechter
» De beste had een delta van 5%, het gemiddelde was 18%, de slechtste was 53%
Vergeleken met alle geteste toestellen
» 5% van alle geteste apparaten waren beter, 1% gelijk, 94% slechter
» De beste had een delta van 4%, het gemiddelde was 23%, de slechtste was 134%
| Uit / Standby | |
| Inactief | |
| Belasting |
|
Key:
min: | |
| HP Pavilion x360 15-dq0065cl i7-8565U, UHD Graphics 620, Intel SSD 660p SSDPEKNW512G8, TN LED, 1366x768, 15.6" | Asus VivoBook Flip 15 TP510UA-E8073T i5-8250U, UHD Graphics 620, SanDisk SD8SN8U128G1002, IPS, 1920x1080, 15.6" | Lenovo Ideapad C340-15IWL-81N5004QGE i5-8265U, GeForce MX230, SK hynix BC501 HFM128GDJTNG-831, IPS, 1920x1080, 15.6" | HP Envy x360 15-bq102ng R5 2500U, Vega 8, Samsung PM961 MZVLW256HEHP, IPS, 1920x1080, 15.6" | Dell Inspiron 15 3585 (2300U, Vega 6) R3 2300U, Vega 6, Toshiba BG3 KBG30ZMS256G, TN, 1920x1080, 15.6" | Dell XPS 15 7590 i5 iGPU FHD i5-9300H, UHD Graphics 630, Toshiba XG6 KXG60ZNV512G, IPS, 1920x1080, 15.6" | |
|---|---|---|---|---|---|---|
| Power Consumption | -28% | -48% | -43% | -59% | -96% | |
| Idle Minimum * (Watt) | 3.6 | 3.9 -8% | 3.23 10% | 4.8 -33% | 6.3 -75% | 3.79 -5% |
| Idle Average * (Watt) | 5.4 | 7.2 -33% | 6.3 -17% | 7 -30% | 9.2 -70% | 6.9 -28% |
| Idle Maximum * (Watt) | 6.5 | 9.5 -46% | 8 -23% | 9.5 -46% | 9.6 -48% | 9.2 -42% |
| Load Average * (Watt) | 26.7 | 36.8 -38% | 47 -76% | 40.8 -53% | 38 -42% | 62 -132% |
| Load Maximum * (Watt) | 28.8 | 33.1 -15% | 67.3 -134% | 44.3 -54% | 46 -60% | 108 -275% |
* ... kleiner is beter
| HP Pavilion x360 15-dq0065cl i7-8565U, UHD Graphics 620, 41 Wh | Asus VivoBook Flip 15 TP510UA-E8073T i5-8250U, UHD Graphics 620, 42 Wh | Lenovo Ideapad C340-15IWL-81N5004QGE i5-8265U, GeForce MX230, 52.5 Wh | HP Envy x360 15-bq102ng R5 2500U, Vega 8, 55.8 Wh | Dell Inspiron 15 3585 (2300U, Vega 6) R3 2300U, Vega 6, 42 Wh | Dell XPS 15 7590 i5 iGPU FHD i5-9300H, UHD Graphics 630, 97 Wh | |
|---|---|---|---|---|---|---|
| Batterijduur | 40% | 100% | 65% | 4% | 125% | |
| Reader / Idle (h) | 12.3 | 7.3 -41% | ||||
| WiFi v1.3 (h) | 4.3 | 6 40% | 8.6 100% | 7.1 65% | 5.3 23% | 14.1 228% |
| Load (h) | 1.4 | 1.8 29% | 1.7 21% |
Pro
Contra
Dit is de verkorte versie van het originele artikel. Het volledige, Engelse testrapport vind je hier.
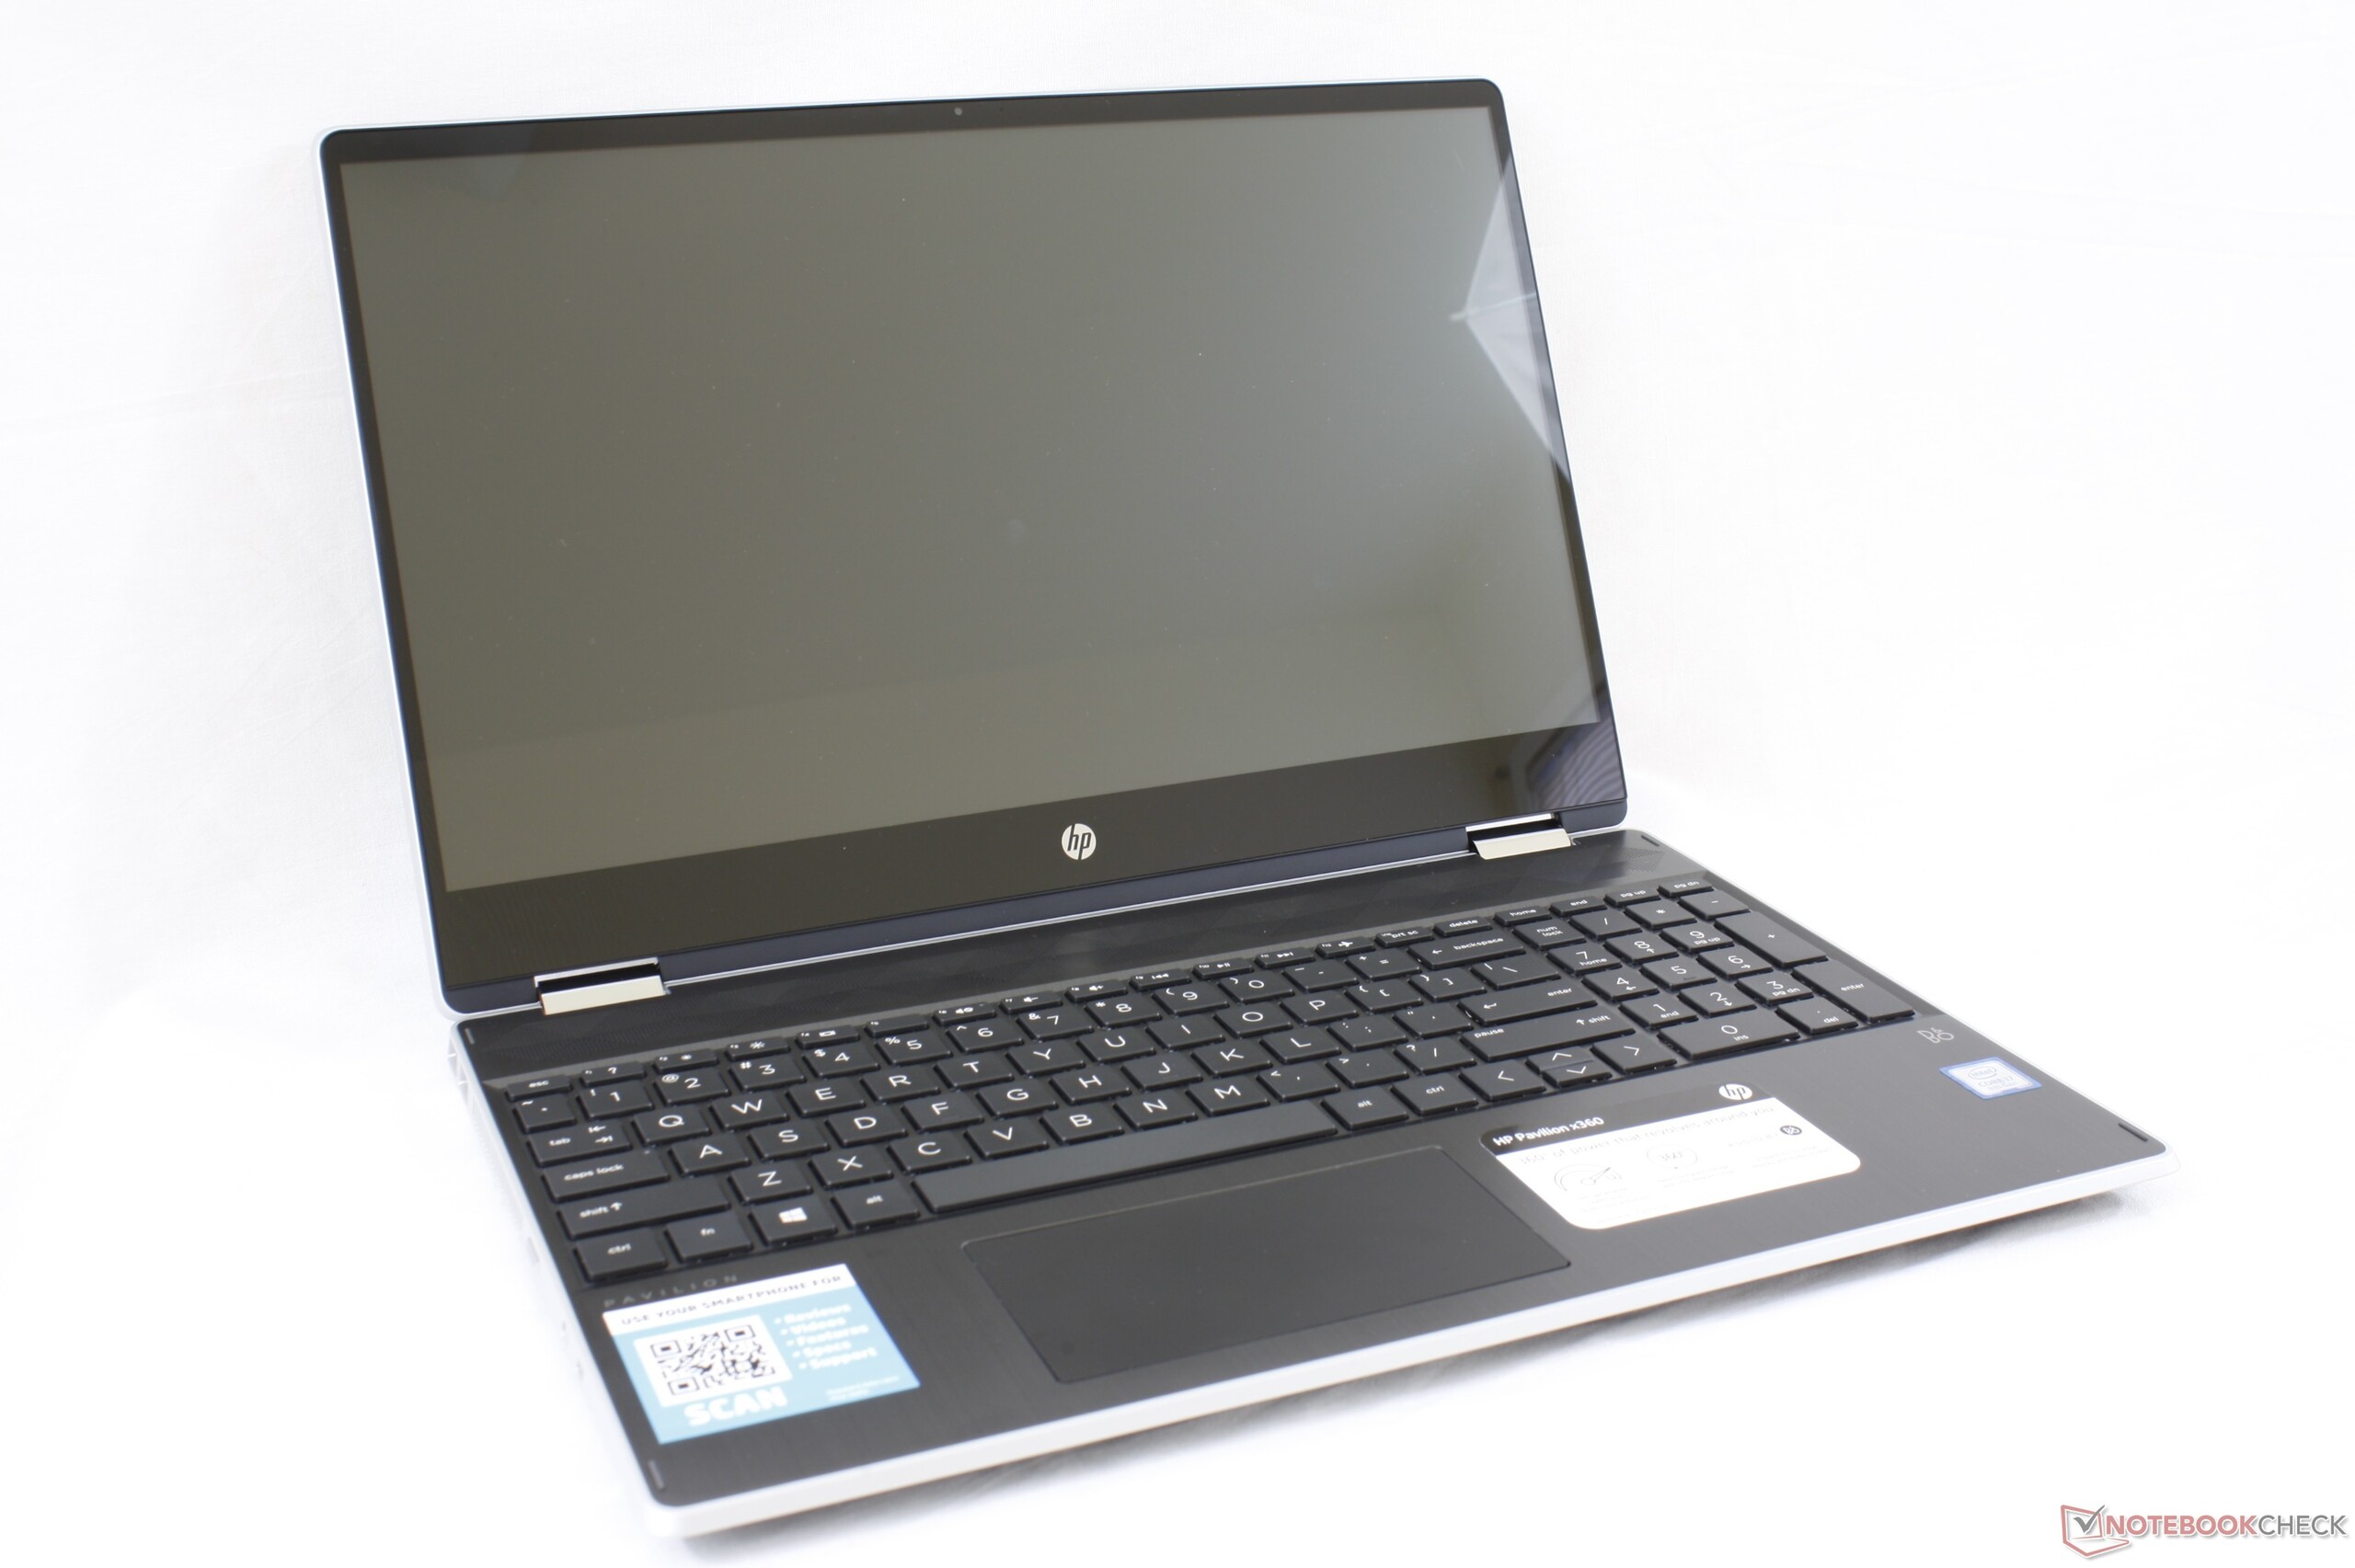
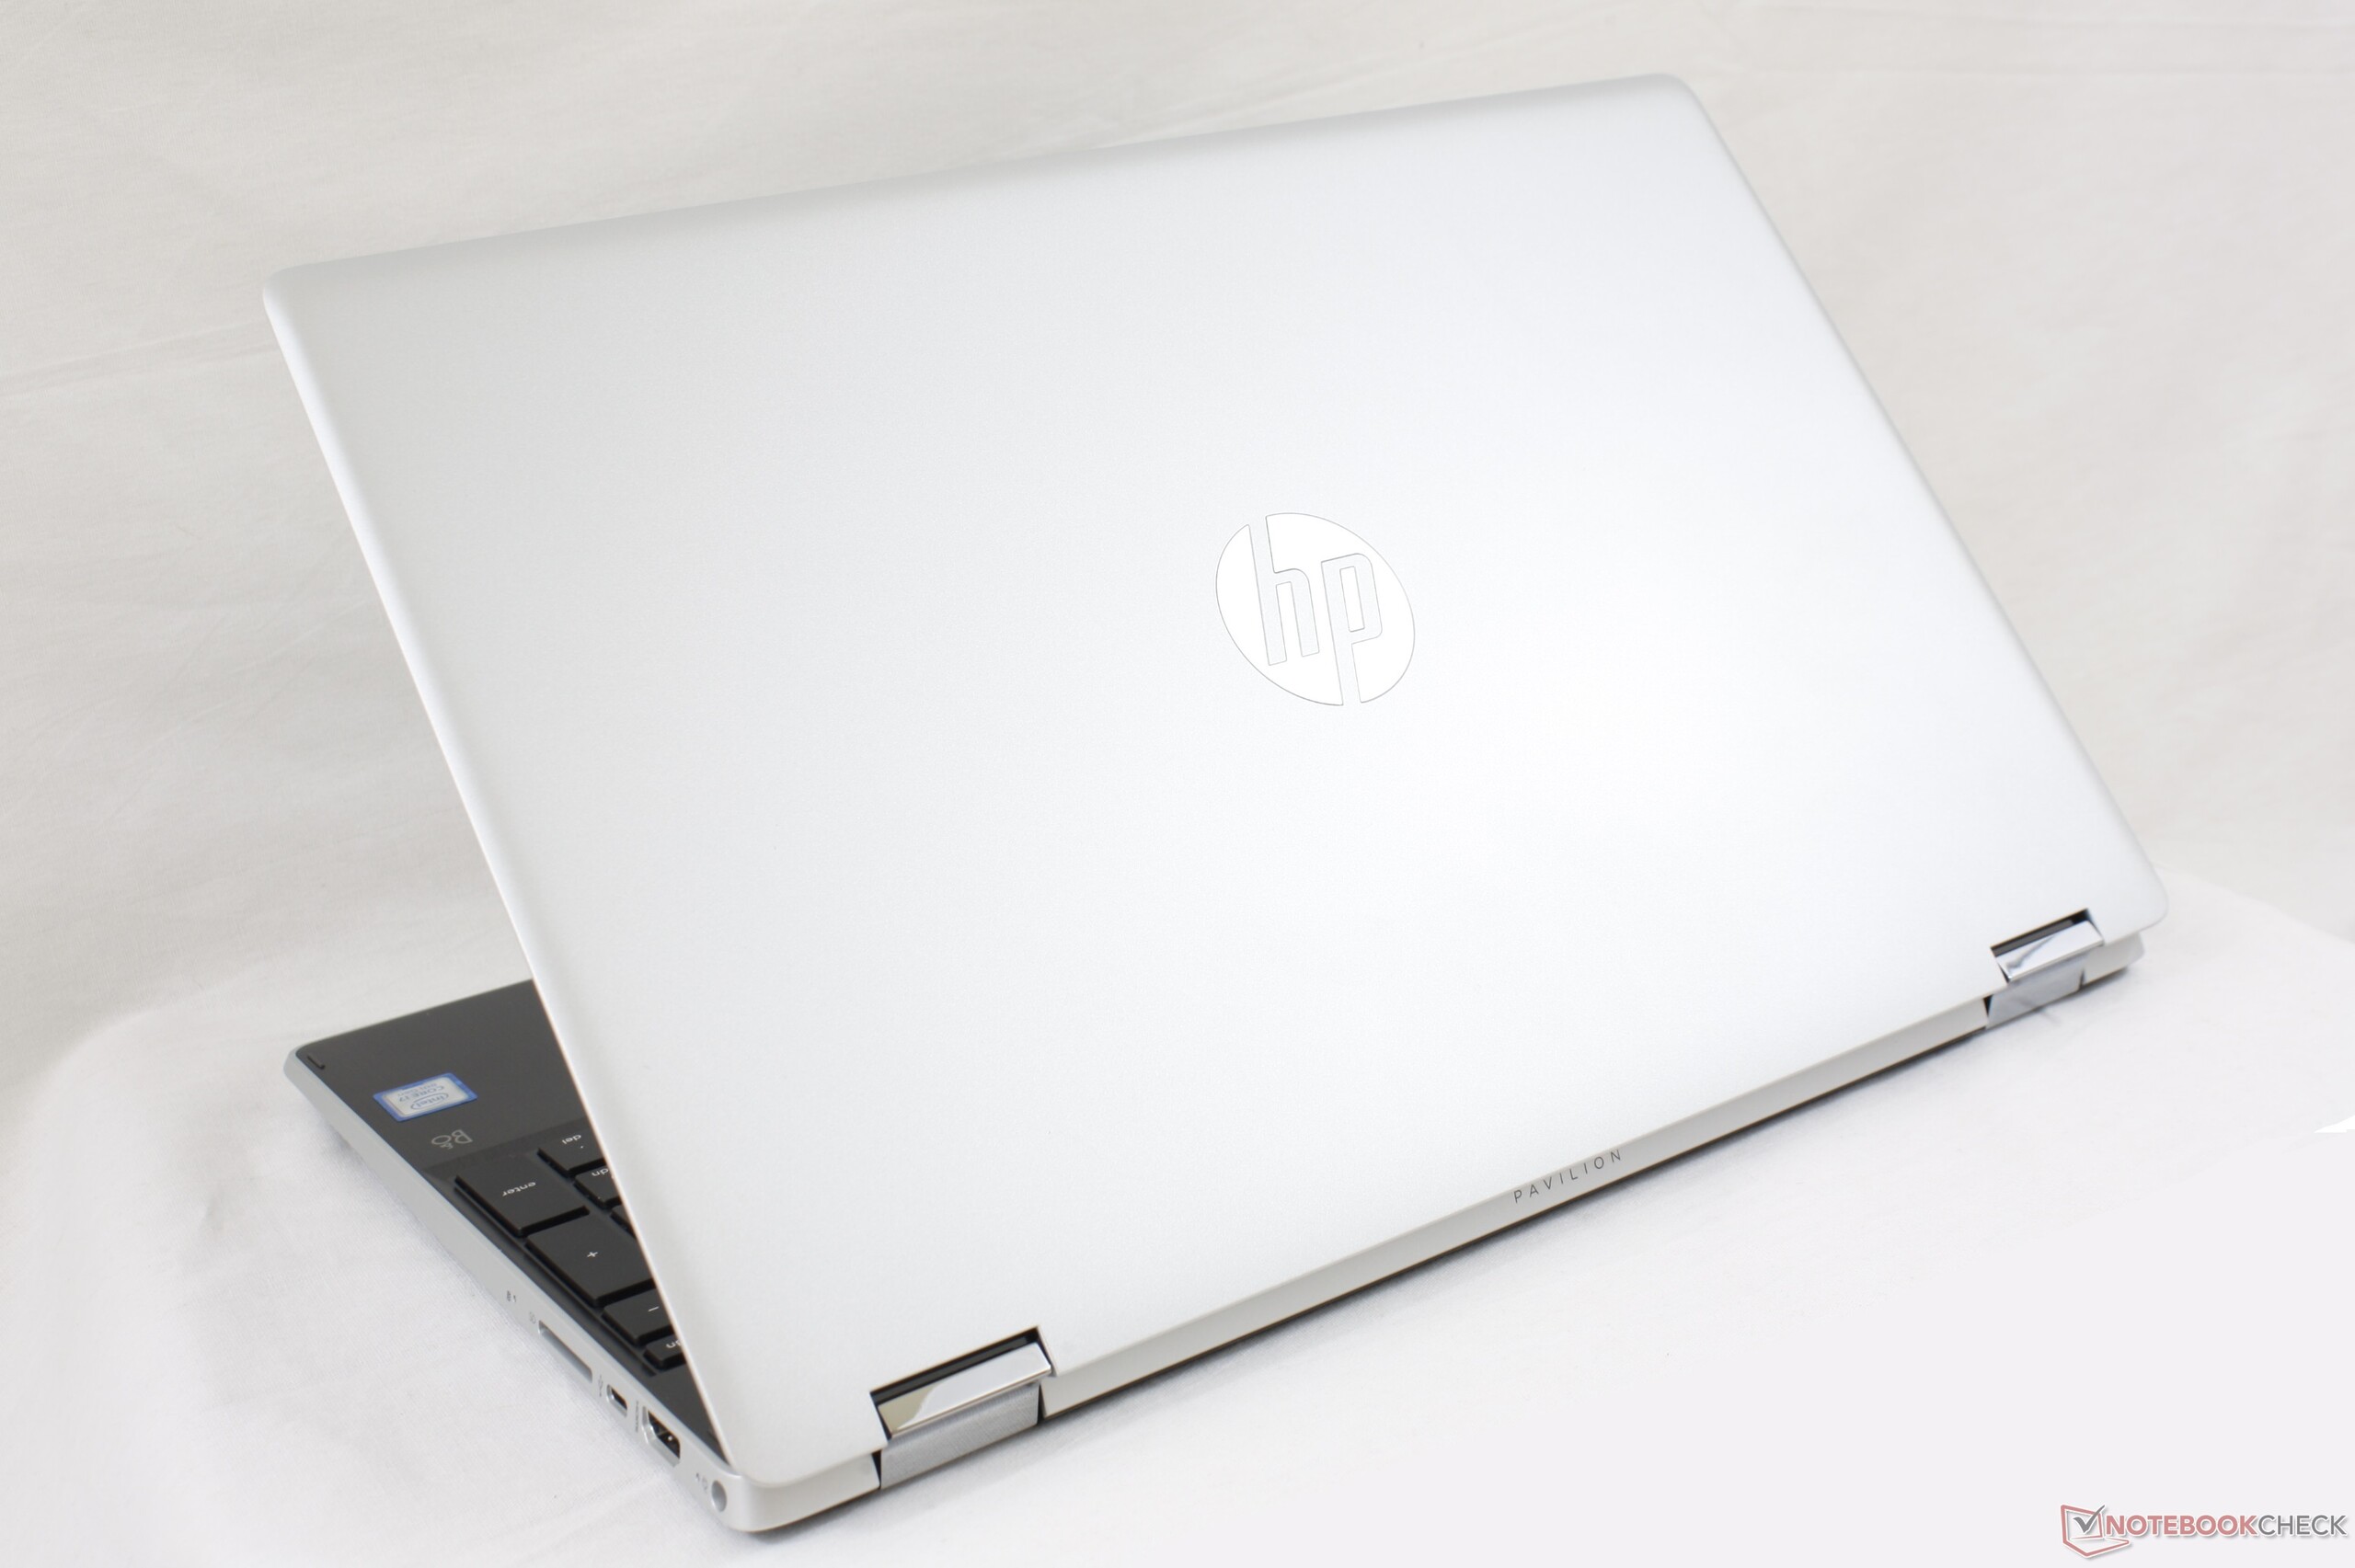
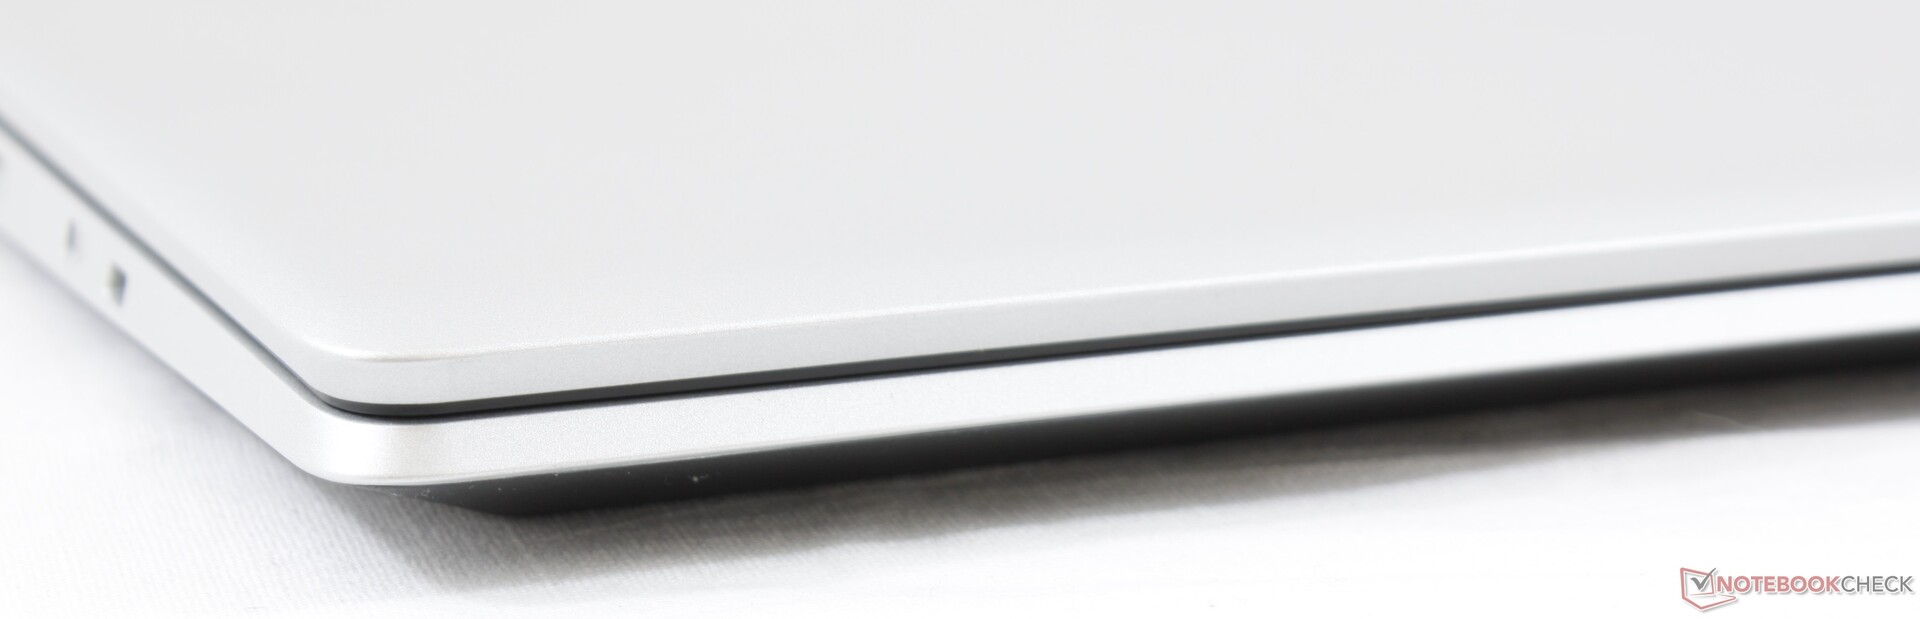
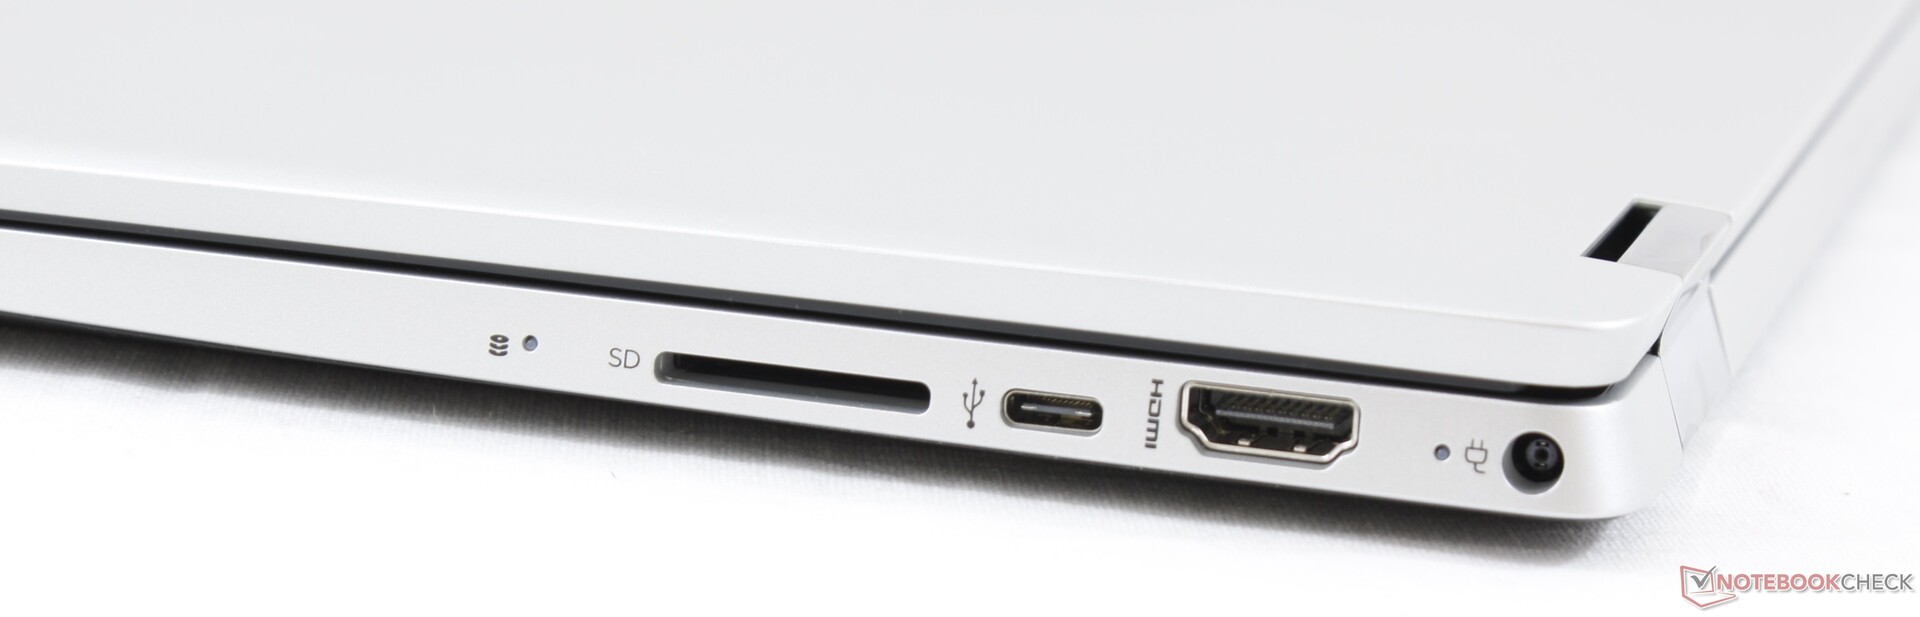
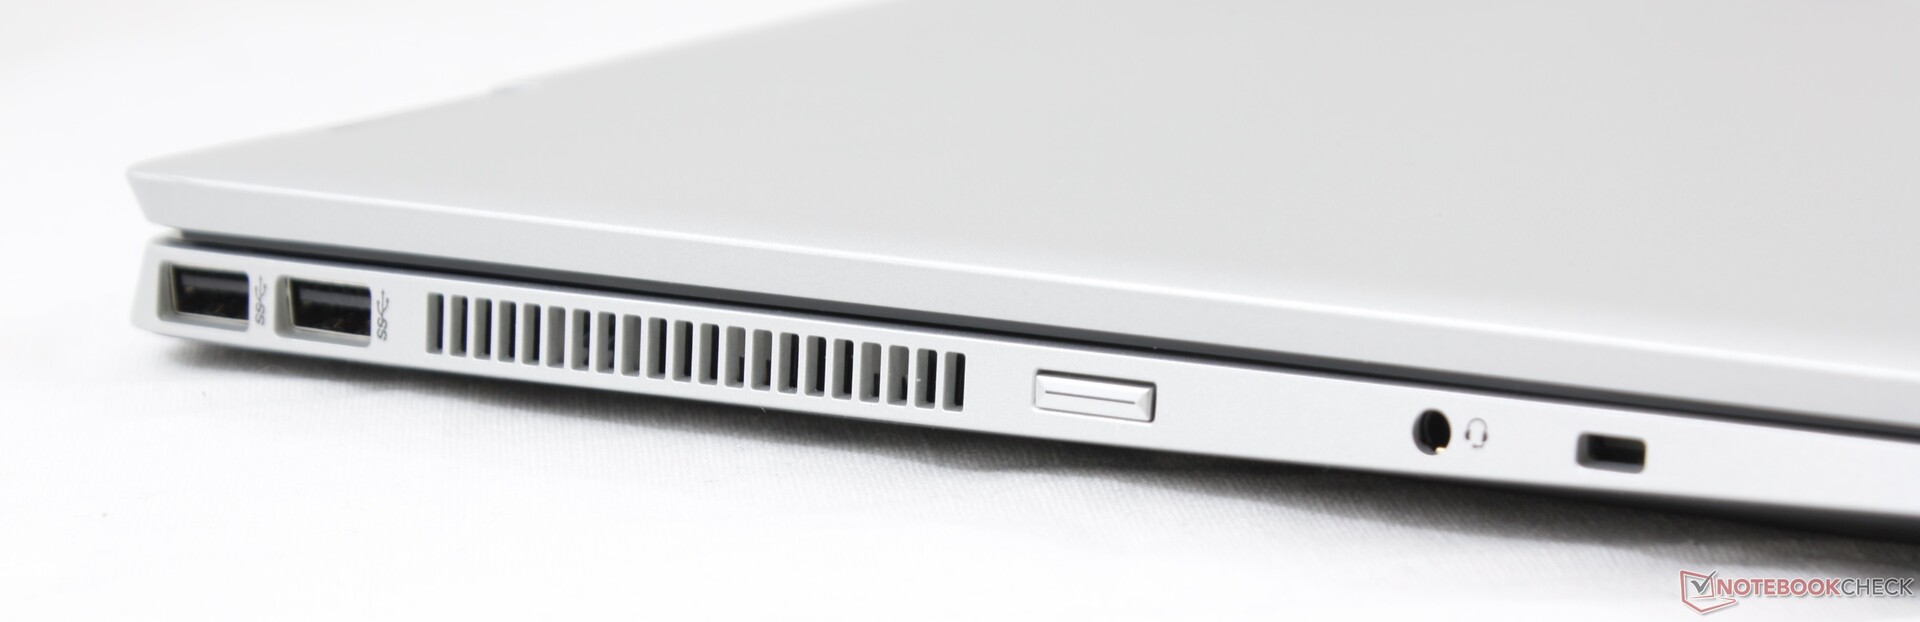
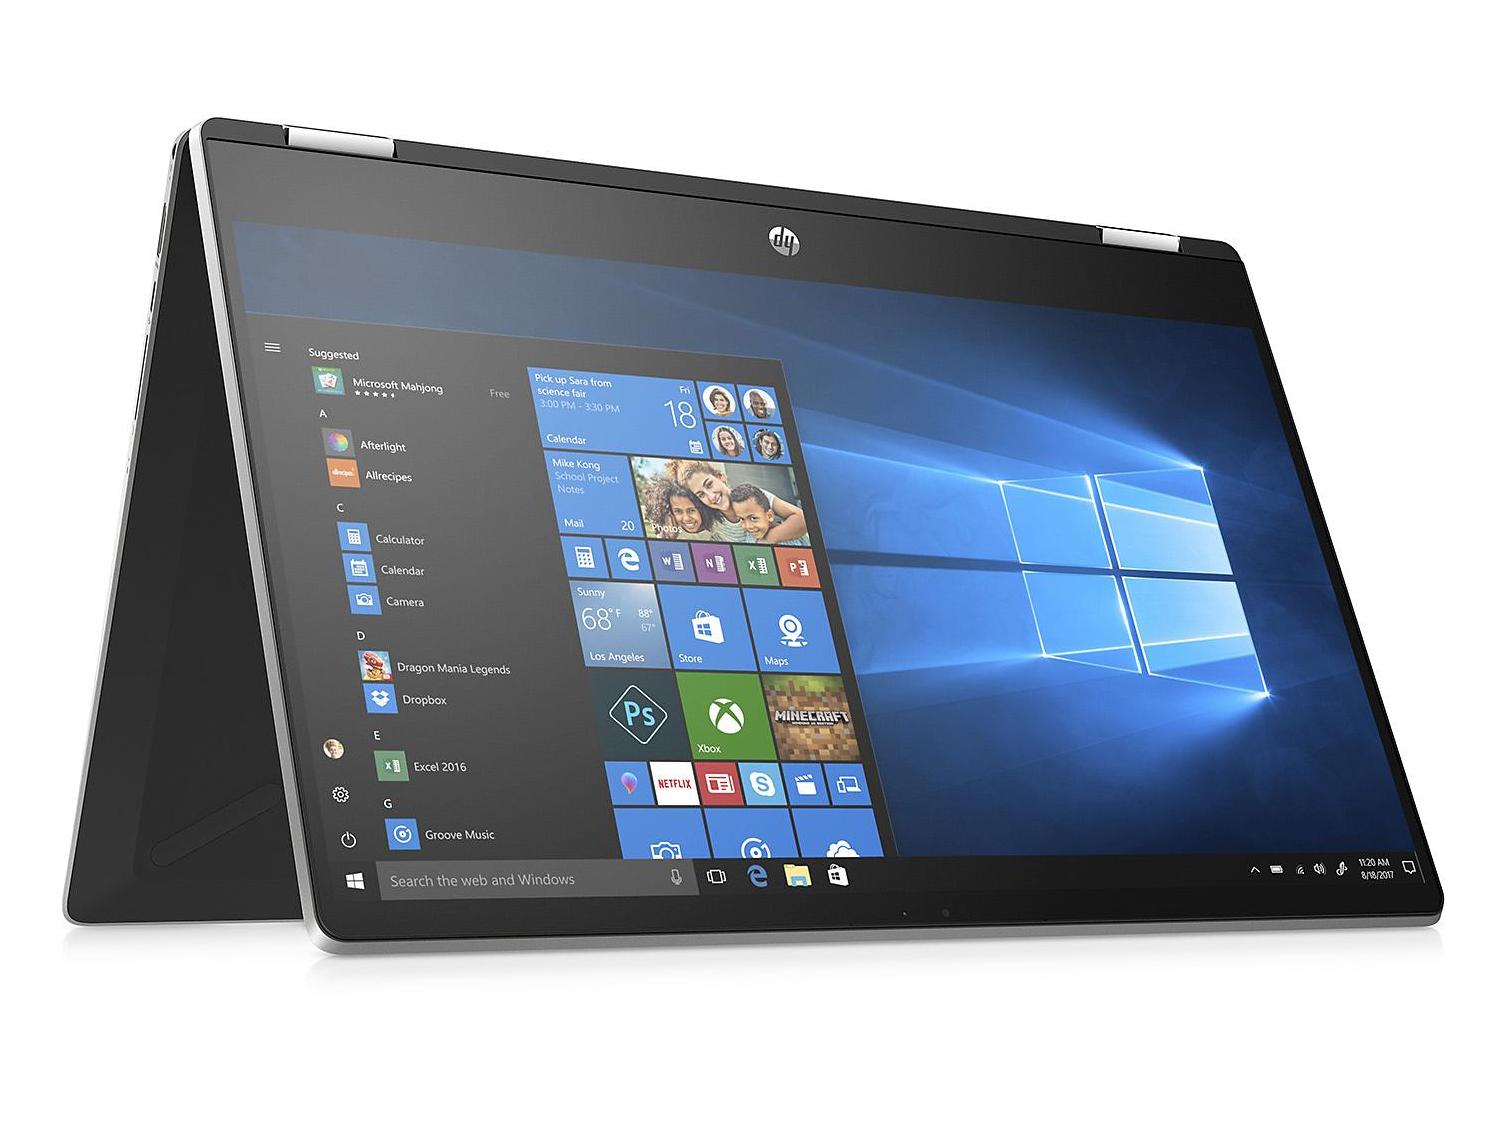
De grootste pluspunten van de 2019 Pavilion x360 15 zijn de dunne beeldschermranden, het lage gewicht en de kleine afmetingen vergeleken met andere convertibels in deze categorie. Aanbod van poorten is goed en de koeling is relatief stil door de beperkte Turbo Boost en goede temperaturen.
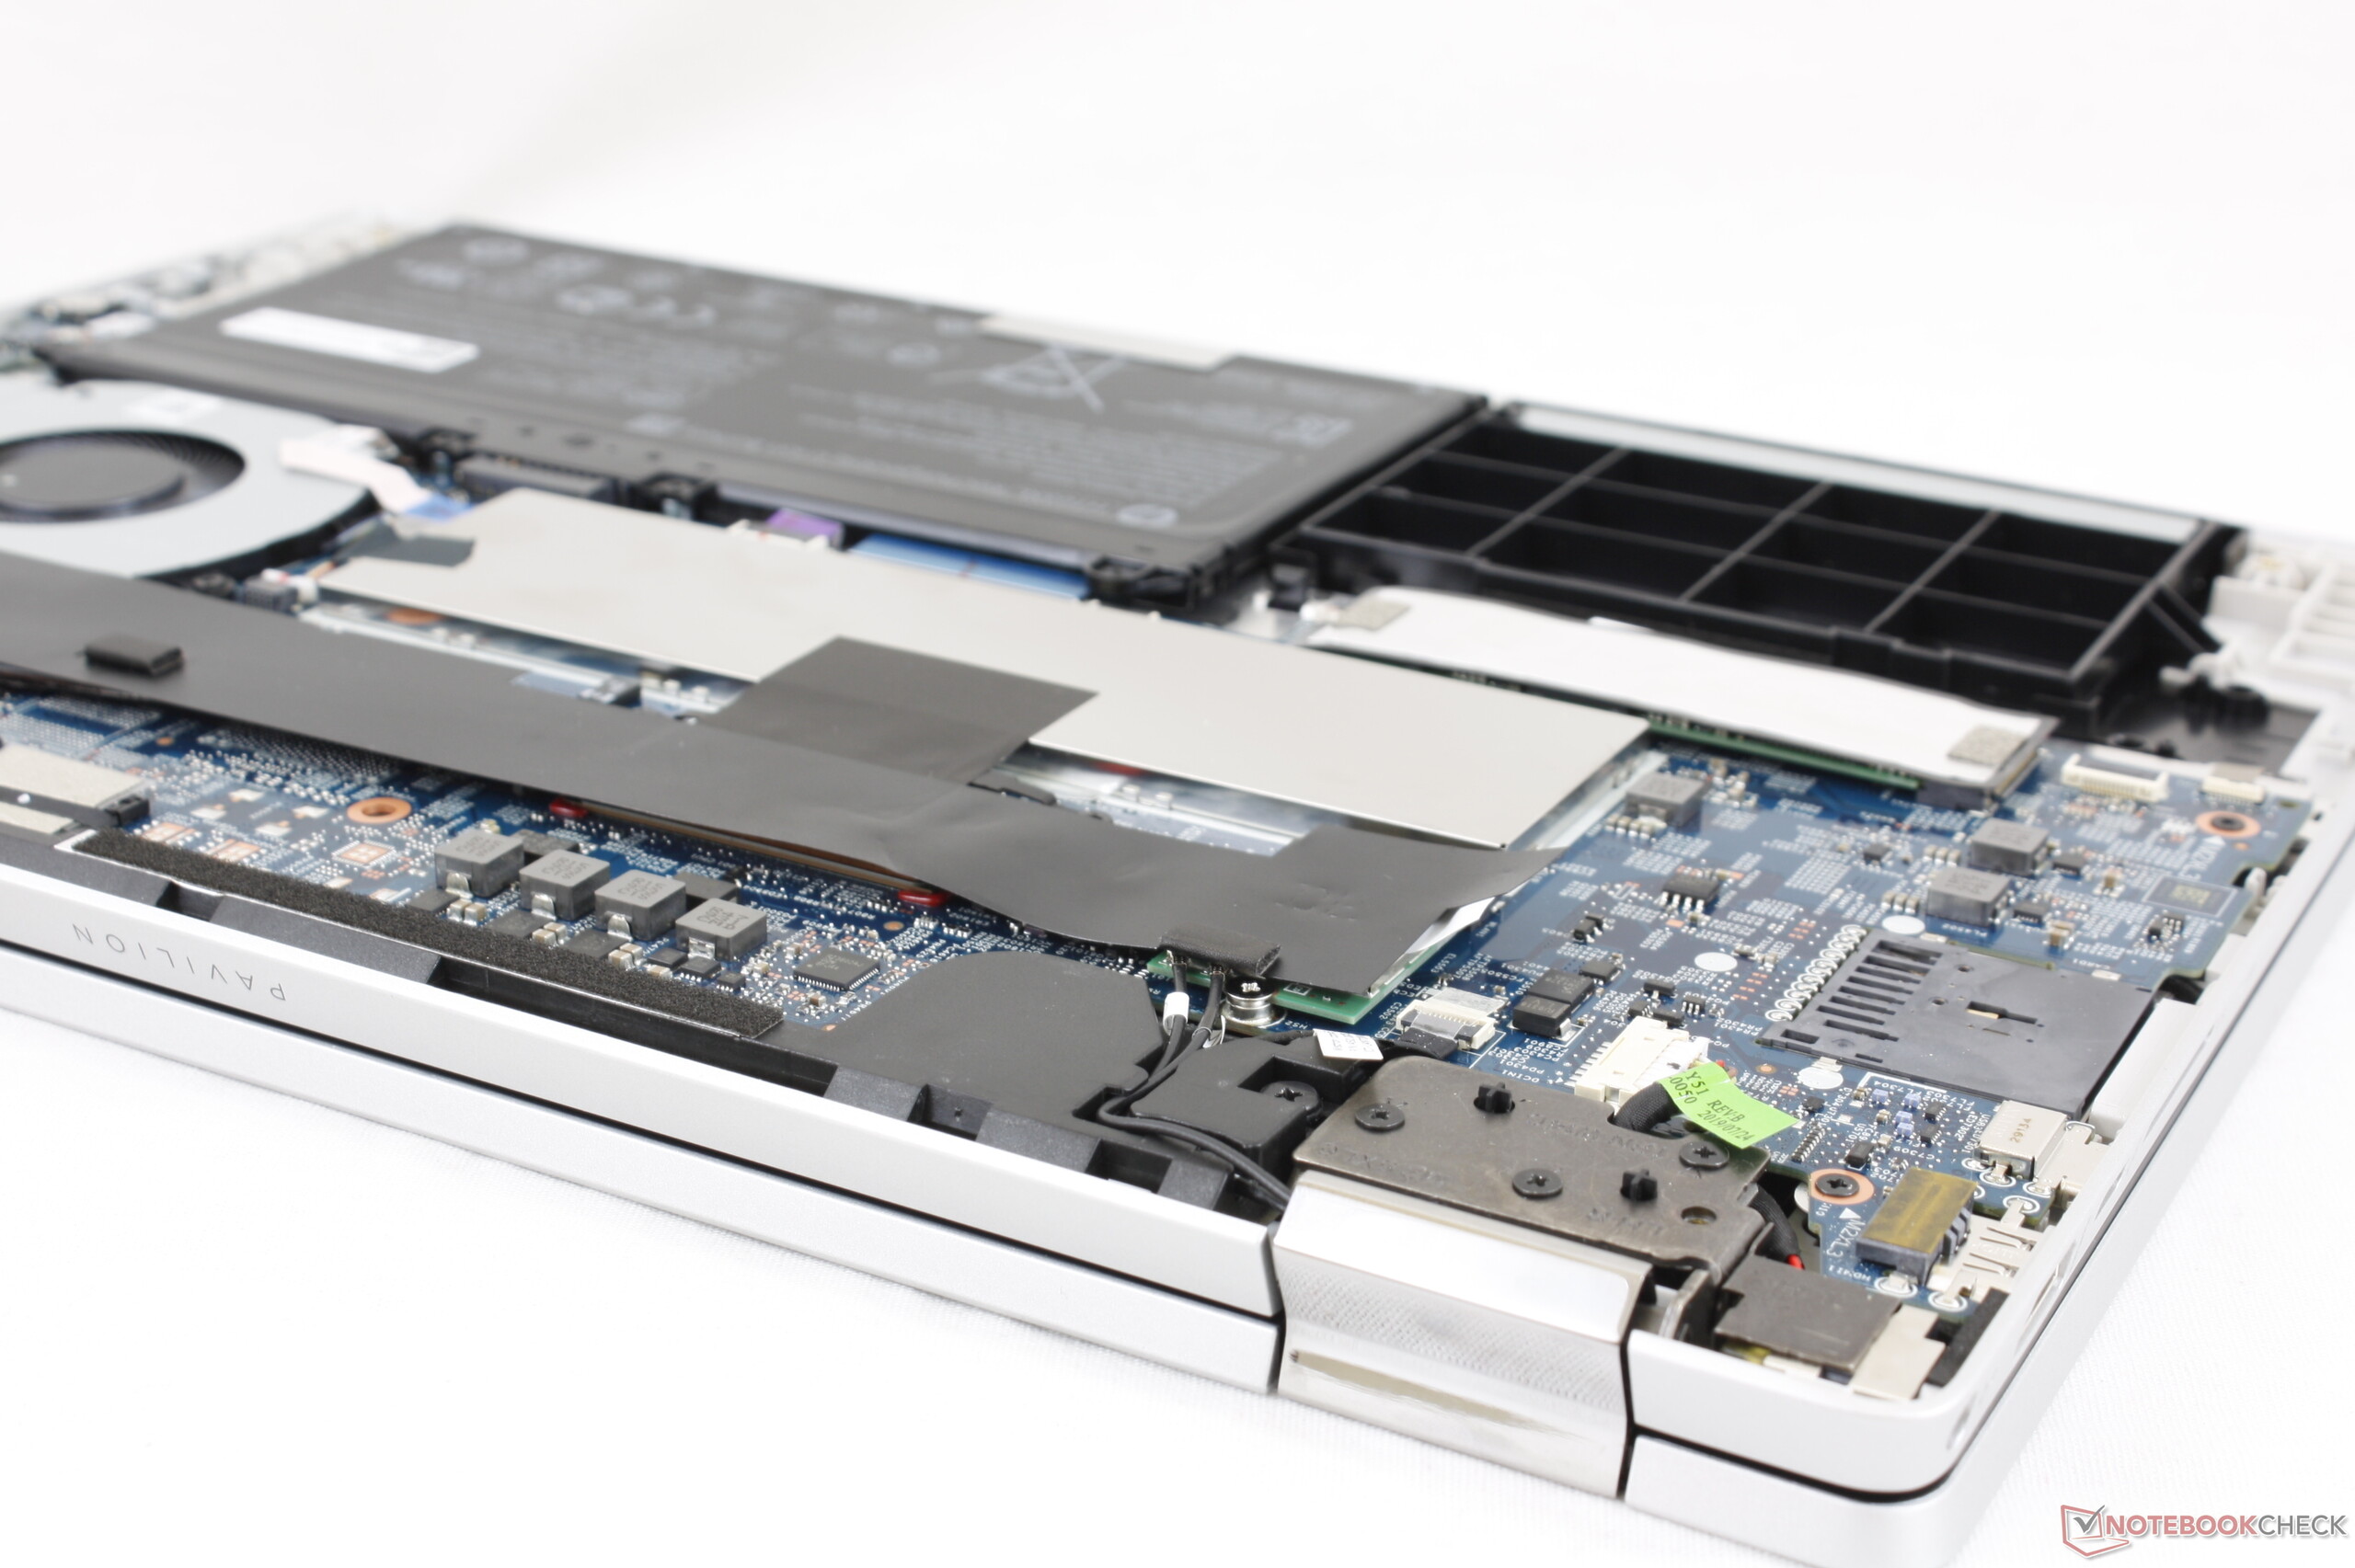
Helaas stopt het daar met de positieve punten. Voor € 1000 biedt de Pavilion x360 15 een korte batterijduur, een zwakke behuizing en een van de slechtste beeldschermen die je kunt vinden in een notebook met een Whiskey Lake-U CPU. Het beeldscherm is donker, het contrast is laag, de kleuren zijn slecht en de kijkhoeken zijn beperkt door het TN-paneel, waarmee de voordelen van een 2-in-1 vorm vrijwel geheel teniet gedaan worden. In deze prijsklasse zouden dit soort configuraties helemaal niet voor moeten komen.
De Pavilion x360 15 is niet slecht als een budget notebook. Versies met een low-end configuratie zijn te koop voor rond de € 500, wat een veel redelijker bedrag is. En dan nog raden we met klem aan om te kiezen voor een configuratie met een 1080p beeldscherm. Als de convertibel vorm niet een vereiste is, dan is de Walmart Motile wellicht een geschikt alternatief.
De exorbitant hoge prijs niet waard. Als je € 1000 wilt uitgeven aan een nieuwe notebook, overweeg dan liever een HP Envy of Spectre.
HP Pavilion x360 15-dq0065cl
- 09-02-2020 v7 (old)
Allen Ngo
Price comparison
