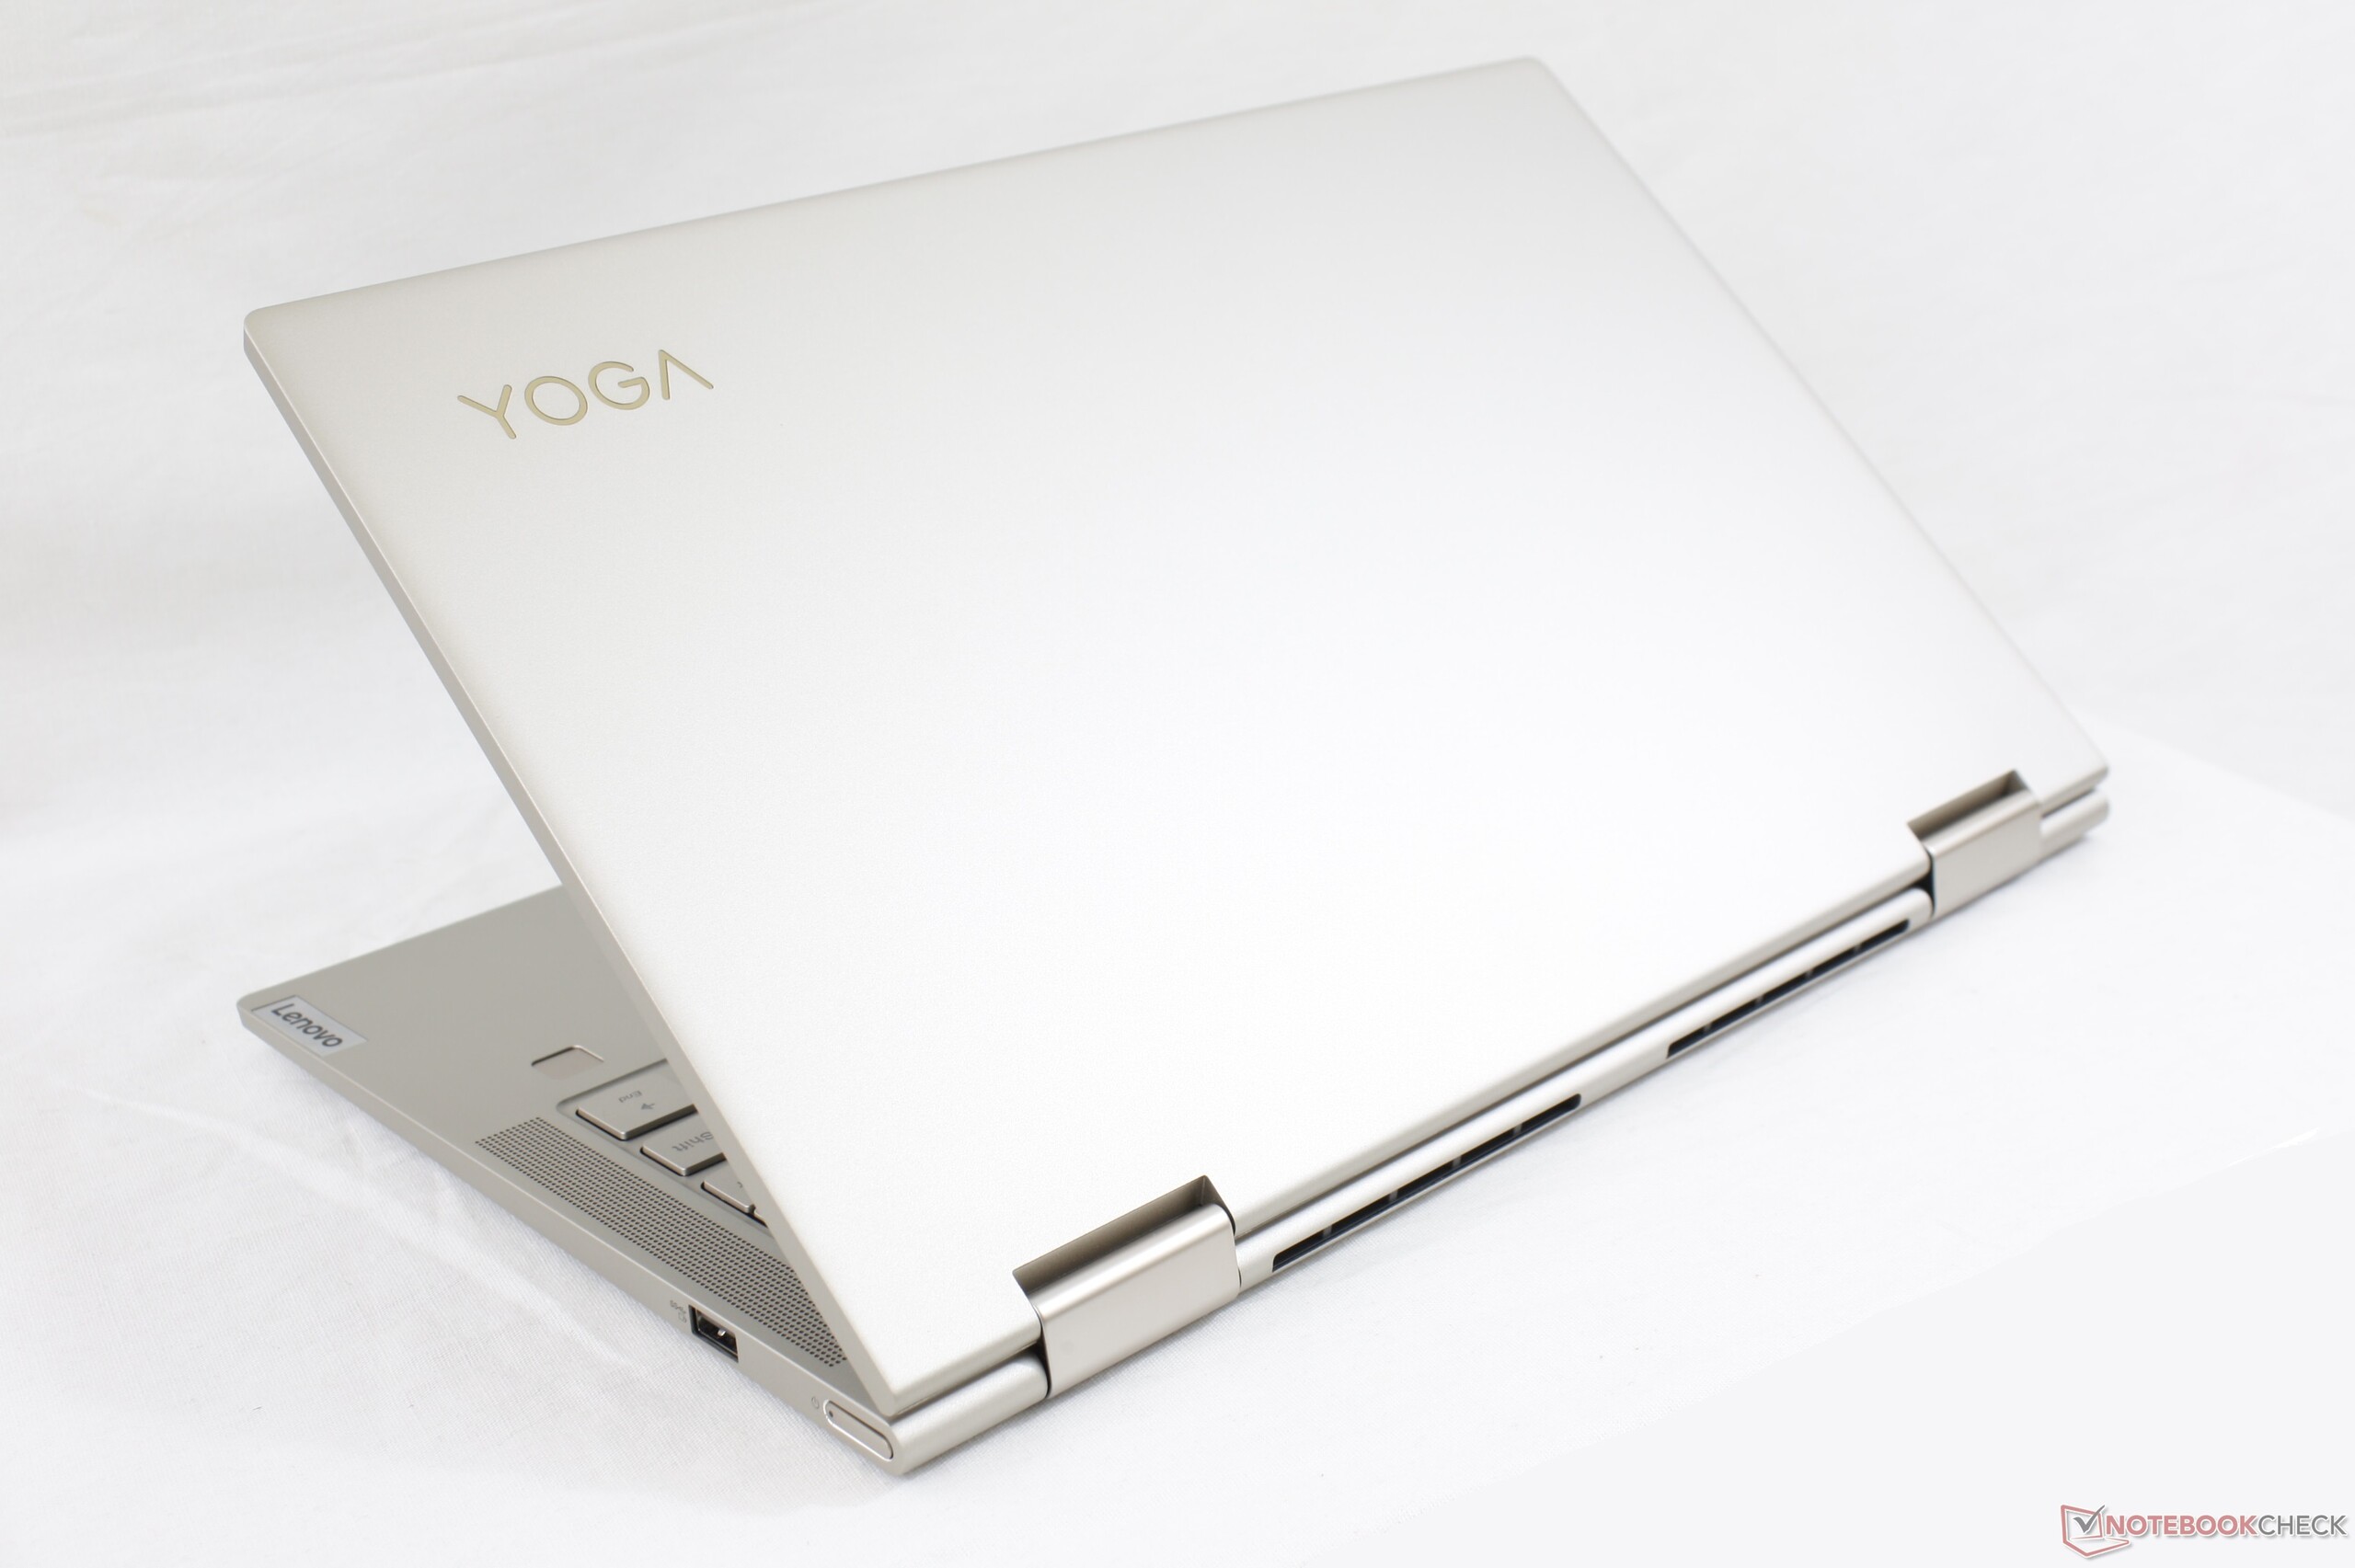
Kort testrapport Lenovo Yoga C740-14IML Convertible: eersteklas uiterlijk, gematigde prijs
Evaluatie | Datum | Model | Gewicht | Hoogte | Formaat | Resolutie | Beste prijs |
|---|---|---|---|---|---|---|---|
| 84.3 % v7 (old) | 03-2020 | Lenovo Yoga C740-14IML i5-10210U, UHD Graphics 620 | 1.4 kg | 16.9 mm | 14.00" | 1920x1080 | |
| 85.9 % v7 (old) | 09-2019 | Dell XPS 13 7390 2-in-1 Core i3 i3-1005G1, UHD Graphics G1 (Ice Lake 32 EU) | 1.3 kg | 13 mm | 13.40" | 1920x1200 | |
| 81.2 % v7 (old) | 03-2020 | Asus ZenBook Flip 14 UM462DA-AI023T R7 3700U, Vega 10 | 1.6 kg | 18.9 mm | 14.00" | 1920x1080 | |
| 88.1 % v7 (old) | 02-2020 | Microsoft Surface Pro 7 i7-1065G7, Iris Plus Graphics G7 (Ice Lake 64 EU) | 790 g | 8.5 mm | 12.30" | 2736x1824 | |
| 88.4 % v7 (old) | 12-2019 | HP Spectre x360 13-aw0013dx i7-1065G7, Iris Plus Graphics G7 (Ice Lake 64 EU) | 1.2 kg | 16.9 mm | 13.30" | 1920x1080 |

| Networking | |
| iperf3 transmit AX12 | |
| Acer Aspire 5 A514-52 | |
| MSI Prestige 15 A10SC | |
| Lenovo Yoga C740-14IML | |
| Alienware m17 R2 P41E | |
| iperf3 receive AX12 | |
| MSI Prestige 15 A10SC | |
| Acer Aspire 5 A514-52 | |
| Lenovo Yoga C740-14IML | |
| Alienware m17 R2 P41E | |

| |||||||||||||||||||||||||
Helderheidsverdeling: 90 %
Helderheid in Batterij-modus: 329.9 cd/m²
Contrast: 1138:1 (Zwart: 0.29 cd/m²)
ΔE ColorChecker Calman: 3.68 | ∀{0.5-29.43 Ø4.73}
calibrated: 1.03
ΔE Greyscale Calman: 6.4 | ∀{0.09-98 Ø4.97}
98.4% sRGB (Argyll 1.6.3 3D)
63.6% AdobeRGB 1998 (Argyll 1.6.3 3D)
70.1% AdobeRGB 1998 (Argyll 3D)
98.3% sRGB (Argyll 3D)
67.9% Display P3 (Argyll 3D)
Gamma: 2.17
CCT: 6195 K
| Lenovo Yoga C740-14IML CMN N140HCE-ET2, IPS, 14", 1920x1080 | Lenovo Yoga C940-14IIL 81Q9 BOE HF NV140QUM-N54, IPS, 14", 3840x2160 | Dell XPS 13 7390 2-in-1 Core i3 Sharp LQ134N1, IPS, 13.4", 1920x1200 | Asus ZenBook Flip 14 UM462DA-AI023T IPS, 14", 1920x1080 | Microsoft Surface Laptop 3 13 Core i5-1035G7 Sharp LQ135P1JX51, IPS, 13.5", 2256x1504 | HP Spectre x360 13-aw0013dx AU Optronics AUO5E2D, IPS, 13.3", 1920x1080 | |
|---|---|---|---|---|---|---|
| Display | 15% | 0% | -9% | -2% | 2% | |
| Display P3 Coverage (%) | 67.9 | 83.8 23% | 68.6 1% | 65.5 -4% | 65.7 -3% | 69.6 3% |
| sRGB Coverage (%) | 98.3 | 99.9 2% | 98.2 0% | 85.2 -13% | 98.6 0% | 98.9 1% |
| AdobeRGB 1998 Coverage (%) | 70.1 | 83.3 19% | 70.4 0% | 62.2 -11% | 67.8 -3% | 71.5 2% |
| Response Times | 1% | -10% | -5% | -40% | -36% | |
| Response Time Grey 50% / Grey 80% * (ms) | 35.6 ? | 44.4 ? -25% | 46 ? -29% | 42 ? -18% | 59.2 ? -66% | 60.8 ? -71% |
| Response Time Black / White * (ms) | 36.8 ? | 27.2 ? 26% | 33.6 ? 9% | 34 ? 8% | 41.6 ? -13% | 36.8 ? -0% |
| PWM Frequency (Hz) | 27030 ? | 2525 ? | 21740 ? | |||
| Screen | -5% | 31% | -33% | 24% | 4% | |
| Brightness middle (cd/m²) | 329.9 | 501.7 52% | 576.3 75% | 306 -7% | 403.4 22% | 447.4 36% |
| Brightness (cd/m²) | 315 | 501 59% | 555 76% | 294 -7% | 397 26% | 420 33% |
| Brightness Distribution (%) | 90 | 82 -9% | 88 -2% | 81 -10% | 89 -1% | 85 -6% |
| Black Level * (cd/m²) | 0.29 | 0.32 -10% | 0.33 -14% | 0.39 -34% | 0.34 -17% | 0.31 -7% |
| Contrast (:1) | 1138 | 1568 38% | 1746 53% | 785 -31% | 1186 4% | 1443 27% |
| Colorchecker dE 2000 * | 3.68 | 5.48 -49% | 1.45 61% | 5.16 -40% | 0.94 74% | 4.23 -15% |
| Colorchecker dE 2000 max. * | 8.64 | 10.03 -16% | 4.12 52% | 9.9 -15% | 2.92 66% | 9.34 -8% |
| Colorchecker dE 2000 calibrated * | 1.03 | 2.22 -116% | 1.19 -16% | 3.07 -198% | 0.99 4% | 1.32 -28% |
| Greyscale dE 2000 * | 6.4 | 8.1 -27% | 3.1 52% | 5.86 8% | 0.9 86% | 6.1 5% |
| Gamma | 2.17 101% | 2.07 106% | 2.27 97% | 2.31 95% | 2.13 103% | 2.11 104% |
| CCT | 6195 105% | 6730 97% | 6931 94% | 6349 102% | 6620 98% | 6136 106% |
| Color Space (Percent of AdobeRGB 1998) (%) | 63.6 | 74.1 17% | 64.2 1% | 56 -12% | 62.3 -2% | 64.8 2% |
| Color Space (Percent of sRGB) (%) | 98.4 | 100 2% | 98.5 0% | 85 -14% | 98.7 0% | 98.9 1% |
| Totaal Gemiddelde (Programma / Instellingen) | 4% /
-1% | 7% /
20% | -16% /
-25% | -6% /
11% | -10% /
-2% |
* ... kleiner is beter
Responstijd Scherm
| ↔ Responstijd Zwart naar Wit | ||
|---|---|---|
| 36.8 ms ... stijging ↗ en daling ↘ gecombineerd | ↗ 17.2 ms stijging | 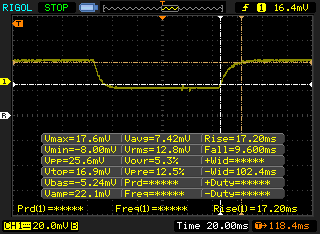 |
| ↘ 9.6 ms daling | ||
| Het scherm vertoonde trage responstijden in onze tests en is misschien te traag voor games. Ter vergelijking: alle testtoestellen variëren van 0.1 (minimum) tot 240 (maximum) ms. » 95 % van alle toestellen zijn beter. Dit betekent dat de gemeten responstijd slechter is dan het gemiddelde (19.9 ms) van alle geteste toestellen. | ||
| ↔ Responstijd 50% Grijs naar 80% Grijs | ||
| 35.6 ms ... stijging ↗ en daling ↘ gecombineerd | ↗ 19.2 ms stijging | 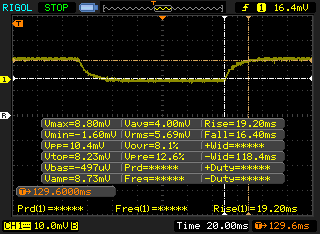 |
| ↘ 16.4 ms daling | ||
| Het scherm vertoonde trage responstijden in onze tests en is misschien te traag voor games. Ter vergelijking: alle testtoestellen variëren van 0.165 (minimum) tot 636 (maximum) ms. » 50 % van alle toestellen zijn beter. Dit betekent dat de gemeten responstijd slechter is dan het gemiddelde (31.1 ms) van alle geteste toestellen. | ||
Screen Flickering / PWM (Pulse-Width Modulation)
| Screen flickering / PWM waargenomen | 27030 Hz | ≤ 67 % helderheid instelling | 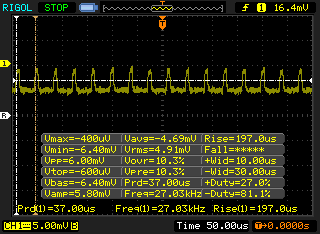 |
De achtergrondverlichting van het scherm flikkert op 27030 Hz (in het slechtste geval, bijvoorbeeld bij gebruik van PWM) aan een helderheid van 67 % en lager. Boven deze helderheid zou er geen flickering / PWM mogen optreden. De frequentie van 27030 Hz is redelijk hoog en de meeste mensen die gevoelig zijn aan flickering zouden dit dus niet mogen waarnemen of geïrriteerde ogen krijgen. Ter vergelijking: 52 % van alle geteste toestellen maakten geen gebruik van PWM om de schermhelderheid te verlagen. Als het wel werd gebruikt, werd een gemiddelde van 7798 (minimum: 5 - maximum: 343500) Hz waargenomen. | |||
| Cinebench R20 | |
| CPU (Single Core) | |
| MSI Modern 15 A10RB | |
| Dell XPS 13 7390 Core i7-10710U | |
| Microsoft Surface Laptop 3 15 i7-1065G7 | |
| Lenovo Yoga C740-14IML | |
| MSI GF63 Thin 9SC | |
| Gemiddeld Intel Core i5-10210U (322 - 428, n=30) | |
| Dynabook Portege A30-E-174 | |
| Lenovo ThinkPad P43s-20RH001FGE | |
| Walmart Motile M142 | |
| Dell Latitude 13 3390 | |
| Dell Inspiron 15 5000 5585 | |
| CPU (Multi Core) | |
| Dell XPS 13 7390 Core i7-10710U | |
| MSI Modern 15 A10RB | |
| Microsoft Surface Laptop 3 15 i7-1065G7 | |
| MSI GF63 Thin 9SC | |
| Dell Inspiron 15 5000 5585 | |
| Walmart Motile M142 | |
| Lenovo Yoga C740-14IML | |
| Gemiddeld Intel Core i5-10210U (722 - 1820, n=30) | |
| Dynabook Portege A30-E-174 | |
| Dell Latitude 13 3390 | |
| Lenovo ThinkPad P43s-20RH001FGE | |
| Cinebench R15 | |
| CPU Single 64Bit | |
| MSI Modern 15 A10RB | |
| Microsoft Surface Laptop 3 15 i7-1065G7 | |
| Dell XPS 13 7390 Core i7-10710U | |
| MSI GF63 Thin 9SC | |
| Lenovo Yoga C740-14IML | |
| Gemiddeld Intel Core i5-10210U (134 - 174, n=35) | |
| Dynabook Portege A30-E-174 | |
| Lenovo ThinkPad P43s-20RH001FGE | |
| Walmart Motile M142 | |
| Dell Latitude 13 3390 | |
| Dell Inspiron 15 5000 5585 | |
| CPU Multi 64Bit | |
| Dell XPS 13 7390 Core i7-10710U | |
| MSI Modern 15 A10RB | |
| MSI GF63 Thin 9SC | |
| Microsoft Surface Laptop 3 15 i7-1065G7 | |
| Lenovo Yoga C740-14IML | |
| Dell Inspiron 15 5000 5585 | |
| Walmart Motile M142 | |
| Gemiddeld Intel Core i5-10210U (320 - 790, n=35) | |
| Dell Latitude 13 3390 | |
| Dynabook Portege A30-E-174 | |
| Lenovo ThinkPad P43s-20RH001FGE | |
| Cinebench R10 | |
| Rendering Multiple CPUs 32Bit | |
| Dell XPS 13 7390 Core i7-10710U | |
| Gemiddeld Intel Core i5-10210U (15037 - 22164, n=3) | |
| Dynabook Portege A30-E-174 | |
| Lenovo ThinkPad P43s-20RH001FGE | |
| Rendering Single 32Bit | |
| Dell XPS 13 7390 Core i7-10710U | |
| Gemiddeld Intel Core i5-10210U (6410 - 6613, n=3) | |
| Dynabook Portege A30-E-174 | |
| Lenovo ThinkPad P43s-20RH001FGE | |
| wPrime 2.10 - 1024m | |
| Gemiddeld Intel Core i5-10210U (n=1) | |
| Dell XPS 13 7390 Core i7-10710U | |
* ... kleiner is beter
| PCMark 8 Home Score Accelerated v2 | 3695 punten | |
| PCMark 8 Work Score Accelerated v2 | 5098 punten | |
| PCMark 10 Score | 4323 punten | |
Help | ||
| Lenovo Yoga C740-14IML Samsung SSD PM981a MZVLB256HBHQ | Lenovo Yoga C940-14IIL 81Q9 Samsung PM981a MZVLB1T0HBLR | Dell XPS 13 7390 2-in-1 Core i3 Toshiba BG4 KBG40ZPZ256G | Microsoft Surface Laptop 3 13 Core i5-1035G7 SK hynix BC501 HFM256GDGTNG | Lenovo ThinkBook 15 Samsung SSD PM981 MZVLB512HAJQ | |
|---|---|---|---|---|---|
| AS SSD | 29% | -60% | -33% | 53% | |
| Seq Read (MB/s) | 1719 | 2213 29% | 1558 -9% | 1387 -19% | 2564 49% |
| Seq Write (MB/s) | 1211 | 1401 16% | 1103 -9% | 504 -58% | 2268 87% |
| 4K Read (MB/s) | 53.1 | 55.2 4% | 37.52 -29% | 42.35 -20% | 57 7% |
| 4K Write (MB/s) | 131.4 | 130.3 -1% | 59 -55% | 120 -9% | 141.4 8% |
| 4K-64 Read (MB/s) | 508 | 878 73% | 1684 231% | 497.4 -2% | 1175 131% |
| 4K-64 Write (MB/s) | 883 | 1478 67% | 198.9 -77% | 354.9 -60% | 1665 89% |
| Access Time Read * (ms) | 0.05 | 0.036 28% | 0.099 -98% | 0.055 -10% | 0.032 36% |
| Access Time Write * (ms) | 0.085 | 0.086 -1% | 0.722 -749% | 0.093 -9% | 0.025 71% |
| Score Read (Points) | 733 | 1154 57% | 1877 156% | 678 -8% | 1488 103% |
| Score Write (Points) | 1135 | 1748 54% | 368 -68% | 525 -54% | 2033 79% |
| Score Total (Points) | 2235 | 3467 55% | 3180 42% | 1520 -32% | 4279 91% |
| Copy ISO MB/s (MB/s) | 1636 | 2161 32% | 677 -59% | 764 -53% | 2118 29% |
| Copy Program MB/s (MB/s) | 698 | 572 -18% | 298.4 -57% | 256.1 -63% | 495.6 -29% |
| Copy Game MB/s (MB/s) | 1246 | 1433 15% | 496.1 -60% | 368.4 -70% | 1174 -6% |
| CrystalDiskMark 5.2 / 6 | 11% | -28% | -29% | 15% | |
| Write 4K (MB/s) | 125.6 | 128.6 2% | 61.6 -51% | 112.3 -11% | 176.3 40% |
| Read 4K (MB/s) | 43.46 | 45.25 4% | 39.12 -10% | 42.13 -3% | 48.98 13% |
| Write Seq (MB/s) | 2011 | 1949 -3% | 1220 -39% | 630 -69% | 1789 -11% |
| Read Seq (MB/s) | 2046 | 2359 15% | 1590 -22% | 1023 -50% | 1671 -18% |
| Write 4K Q32T1 (MB/s) | 375.8 | 445 18% | 283.4 -25% | 336.6 -10% | 433.5 15% |
| Read 4K Q32T1 (MB/s) | 338.1 | 404.5 20% | 350.3 4% | 399.6 18% | 526 56% |
| Write Seq Q32T1 (MB/s) | 2346 | 3019 29% | 1238 -47% | 821 -65% | 2983 27% |
| Read Seq Q32T1 (MB/s) | 3562 | 3564 0% | 2330 -35% | 2030 -43% | 3555 0% |
| Write 4K Q8T8 (MB/s) | 1688 | ||||
| Read 4K Q8T8 (MB/s) | 1036 | ||||
| Totaal Gemiddelde (Programma / Instellingen) | 20% /
23% | -44% /
-48% | -31% /
-32% | 34% /
39% |
* ... kleiner is beter

| 3DMark 11 Performance | 2047 punten | |
| 3DMark Cloud Gate Standard Score | 8981 punten | |
| 3DMark Fire Strike Score | 1156 punten | |
| 3DMark Time Spy Score | 467 punten | |
Help | ||
| lage | gem. | hoge | ultra | |
|---|---|---|---|---|
| BioShock Infinite (2013) | 75.6 | 38.2 | 31.8 | 10.5 |
| Rocket League (2017) | 70.4 | 33.6 | 20.6 | |
| Shadow of the Tomb Raider (2018) | 13 |
| Lenovo Yoga C740-14IML UHD Graphics 620, i5-10210U, Samsung SSD PM981a MZVLB256HBHQ | Lenovo Yoga C940-14IIL 81Q9 Iris Plus Graphics G7 (Ice Lake 64 EU), i7-1065G7, Samsung PM981a MZVLB1T0HBLR | Dell XPS 13 7390 2-in-1 Core i3 UHD Graphics G1 (Ice Lake 32 EU), i3-1005G1, Toshiba BG4 KBG40ZPZ256G | Asus ZenBook Flip 14 UM462DA-AI023T Vega 10, R7 3700U | Microsoft Surface Laptop 3 13 Core i5-1035G7 Iris Plus Graphics G7 (Ice Lake 64 EU), i5-1035G7, SK hynix BC501 HFM256GDGTNG | HP Spectre x360 13-aw0013dx Iris Plus Graphics G7 (Ice Lake 64 EU), i7-1065G7, Intel Optane Memory H10 with Solid State Storage 32GB + 512GB HBRPEKNX0202A(L/H) | |
|---|---|---|---|---|---|---|
| Noise | 1% | 1% | -2% | 3% | 5% | |
| uit / omgeving * (dB) | 29 | 28.5 2% | 28 3% | 30 -3% | 28.5 2% | 28.5 2% |
| Idle Minimum * (dB) | 29 | 28.5 2% | 28 3% | 30 -3% | 28.5 2% | 28.5 2% |
| Idle Average * (dB) | 29 | 28.5 2% | 28 3% | 30 -3% | 28.5 2% | 28.5 2% |
| Idle Maximum * (dB) | 29.7 | 29 2% | 28 6% | 30 -1% | 28.5 4% | 28.5 4% |
| Load Average * (dB) | 32.6 | 33 -1% | 31.7 3% | 34.2 -5% | 28.5 13% | 28.5 13% |
| Load Maximum * (dB) | 39 | 39.5 -1% | 43.5 -12% | 37.5 4% | 40.4 -4% | 35.3 9% |
| Witcher 3 ultra * (dB) | 40.7 | 40.4 | 35.3 |
* ... kleiner is beter
Geluidsniveau
| Onbelast |
| 29 / 29 / 29.7 dB (A) |
| Belasting |
| 32.6 / 39 dB (A) |
 | ||
30 dB stil 40 dB(A) hoorbaar 50 dB(A) luid |
||
min: | ||
(+) De maximumtemperatuur aan de bovenzijde bedraagt 38.6 °C / 101 F, vergeleken met het gemiddelde van 35.4 °C / 96 F, variërend van 19.6 tot 60 °C voor de klasse Convertible.
(±) De bodem warmt op tot een maximum van 42.6 °C / 109 F, vergeleken met een gemiddelde van 36.9 °C / 98 F
(+) Bij onbelast gebruik bedraagt de gemiddelde temperatuur voor de bovenzijde 25.2 °C / 77 F, vergeleken met het apparaatgemiddelde van 30.3 °C / 87 F.
(+) De palmsteunen en het touchpad zijn met een maximum van ###max## °C / 81.7 F koeler dan de huidtemperatuur en voelen daarom koel aan.
(±) De gemiddelde temperatuur van de handpalmsteun van soortgelijke toestellen bedroeg 28 °C / 82.4 F (+0.4 °C / 0.7 F).
Lenovo Yoga C740-14IML audioanalyse
(+) | luidsprekers kunnen relatief luid spelen (82.6 dB)
Bas 100 - 315 Hz
(±) | verminderde zeebaars - gemiddeld 13.1% lager dan de mediaan
(±) | lineariteit van de lage tonen is gemiddeld (9.4% delta ten opzichte van de vorige frequentie)
Midden 400 - 2000 Hz
(+) | evenwichtige middens - slechts 4.7% verwijderd van de mediaan
(±) | lineariteit van de middentonen is gemiddeld (7.2% delta ten opzichte van de vorige frequentie)
Hoog 2 - 16 kHz
(+) | evenwichtige hoogtepunten - slechts 4.2% verwijderd van de mediaan
(+) | de hoge tonen zijn lineair (6.1% delta naar de vorige frequentie)
Algemeen 100 - 16.000 Hz
(±) | lineariteit van het totale geluid is gemiddeld (21.1% verschil met de mediaan)
Vergeleken met dezelfde klasse
» 56% van alle geteste apparaten in deze klasse waren beter, 11% vergelijkbaar, 33% slechter
» De beste had een delta van 6%, het gemiddelde was 20%, de slechtste was 57%
Vergeleken met alle geteste toestellen
» 58% van alle geteste apparaten waren beter, 7% gelijk, 35% slechter
» De beste had een delta van 4%, het gemiddelde was 24%, de slechtste was 134%
Apple MacBook 12 (Early 2016) 1.1 GHz audioanalyse
(+) | luidsprekers kunnen relatief luid spelen (83.6 dB)
Bas 100 - 315 Hz
(±) | verminderde zeebaars - gemiddeld 11.3% lager dan de mediaan
(±) | lineariteit van de lage tonen is gemiddeld (14.2% delta ten opzichte van de vorige frequentie)
Midden 400 - 2000 Hz
(+) | evenwichtige middens - slechts 2.4% verwijderd van de mediaan
(+) | de middentonen zijn lineair (5.5% delta ten opzichte van de vorige frequentie)
Hoog 2 - 16 kHz
(+) | evenwichtige hoogtepunten - slechts 2% verwijderd van de mediaan
(+) | de hoge tonen zijn lineair (4.5% delta naar de vorige frequentie)
Algemeen 100 - 16.000 Hz
(+) | het totale geluid is lineair (10.2% verschil met de mediaan)
Vergeleken met dezelfde klasse
» 7% van alle geteste apparaten in deze klasse waren beter, 2% vergelijkbaar, 91% slechter
» De beste had een delta van 5%, het gemiddelde was 18%, de slechtste was 53%
Vergeleken met alle geteste toestellen
» 5% van alle geteste apparaten waren beter, 1% gelijk, 94% slechter
» De beste had een delta van 4%, het gemiddelde was 24%, de slechtste was 134%
| Uit / Standby | |
| Inactief | |
| Belasting |
|
Key:
min: | |
| Lenovo Yoga C740-14IML i5-10210U, UHD Graphics 620, Samsung SSD PM981a MZVLB256HBHQ, IPS, 1920x1080, 14" | Lenovo Yoga C940-14IIL 81Q9 i7-1065G7, Iris Plus Graphics G7 (Ice Lake 64 EU), Samsung PM981a MZVLB1T0HBLR, IPS, 3840x2160, 14" | Dell XPS 13 7390 2-in-1 Core i3 i3-1005G1, UHD Graphics G1 (Ice Lake 32 EU), Toshiba BG4 KBG40ZPZ256G, IPS, 1920x1200, 13.4" | Asus ZenBook Flip 14 UM462DA-AI023T R7 3700U, Vega 10, , IPS, 1920x1080, 14" | Microsoft Surface Laptop 3 13 Core i5-1035G7 i5-1035G7, Iris Plus Graphics G7 (Ice Lake 64 EU), SK hynix BC501 HFM256GDGTNG, IPS, 2256x1504, 13.5" | Lenovo Yoga C740-15IML i7-10510U, UHD Graphics 620, Samsung SSD PM981 MZVLB512HAJQ, IPS LED, 1920x1080, 15.6" | |
|---|---|---|---|---|---|---|
| Power Consumption | -69% | 2% | -15% | -29% | -23% | |
| Idle Minimum * (Watt) | 3 | 5.6 -87% | 3 -0% | 3.7 -23% | 4.4 -47% | 2.97 1% |
| Idle Average * (Watt) | 3.9 | 10.5 -169% | 5.4 -38% | 6.9 -77% | 7.5 -92% | 7.2 -85% |
| Idle Maximum * (Watt) | 7.3 | 12 -64% | 7.3 -0% | 9.4 -29% | 7.8 -7% | 9.9 -36% |
| Load Average * (Watt) | 42.5 | 53.3 -25% | 33.4 21% | 34 20% | 41.9 1% | 40.8 4% |
| Load Maximum * (Watt) | 65.5 | 64.6 1% | 48.3 26% | 44 33% | 63.9 2% | 64.7 1% |
| Witcher 3 ultra * (Watt) | 46.9 | 40.8 |
* ... kleiner is beter
| Lenovo Yoga C740-14IML i5-10210U, UHD Graphics 620, 51 Wh | Lenovo Yoga C940-14IIL 81Q9 i7-1065G7, Iris Plus Graphics G7 (Ice Lake 64 EU), 60 Wh | Dell XPS 13 7390 2-in-1 Core i3 i3-1005G1, UHD Graphics G1 (Ice Lake 32 EU), 51 Wh | Asus ZenBook Flip 14 UM462DA-AI023T R7 3700U, Vega 10, 42 Wh | Microsoft Surface Laptop 3 13 Core i5-1035G7 i5-1035G7, Iris Plus Graphics G7 (Ice Lake 64 EU), 45 Wh | HP Spectre x360 13-aw0013dx i7-1065G7, Iris Plus Graphics G7 (Ice Lake 64 EU), 60 Wh | |
|---|---|---|---|---|---|---|
| Batterijduur | -21% | 39% | -18% | 29% | 55% | |
| Reader / Idle (h) | 18.6 | 35.7 92% | 34.4 85% | 37.1 99% | ||
| WiFi v1.3 (h) | 9.2 | 7.3 -21% | 8.9 -3% | 7.5 -18% | 8.3 -10% | 9.9 8% |
| Load (h) | 1.7 | 2.2 29% | 1.9 12% | 2.7 59% |
Pro
Contra
Dit is de verkorte versie van het originele artikel. Het volledige, Engelse testrapport vind je hier.
Lenovo heeft de Yoga C740-14 vrij goed gepositioneerd in de huidige markt. Het toestel is honderden euro's goedkoper dan zowel de Dell XPS 13 7390 2-in-1 als de Asus ZenBook Flip 14 geconfigureerd met dezelfde RAM- en opslagcapaciteiten terwijl het een groter scherm heeft dan de HP Spectre x360 13. Het beste van al: de Yoga De C740 behoudt een hoogwaardige uitstraling die de meeste gebruikers van een vlaggenschipmodel verwachten, ook al ligt de prijs een stuk onder de duizend euro. De Yoga C740-14 is een geweldige optie als je niet geïnteresseerd bent in features als 4K, Thunderbolt 3 of Ice Lake.
Toch zijn er ook heel wat nadelen. De onregelmatige schermverlichting, relatief lage helderheid, weinig accurate kleuren, het sponsachtige toetsenbord en vervelende ventilatorgeluid bij belasting tasten stuk voor stuk de totaalervaring aan. Toch is het voor de prijs een evenwichtige convertible en zeker de extra investering waard ten opzichte van een toestel zoals de afschuwelijke HP Pavilion x360 of goedkope VivoBook Flip.
De Lenovo Yoga C740-14 behoort tot de betere mid-range convertibles, omdat hij hoogwaardiger aanvoelt dan de duurdere high-end modellen zonder meer te kosten.
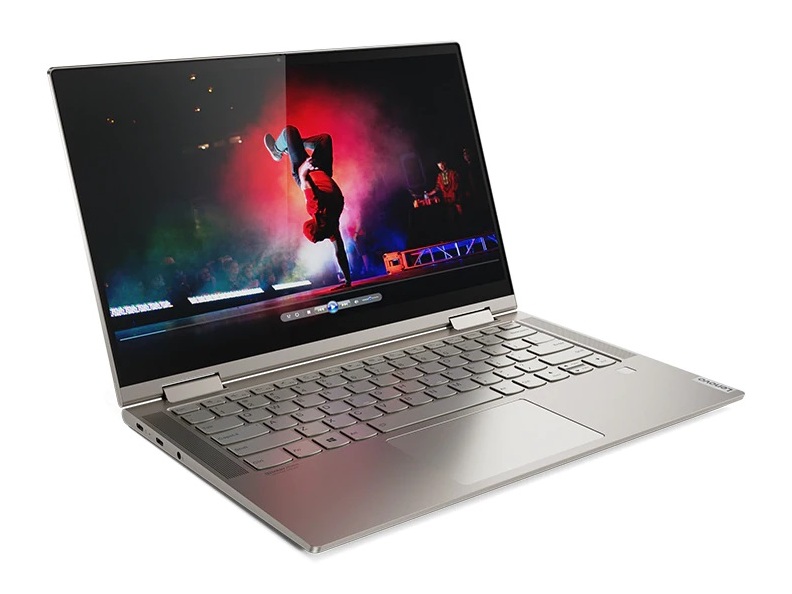
Lenovo Yoga C740-14IML
- 03-03-2020 v7 (old)
Allen Ngo
Price comparison
