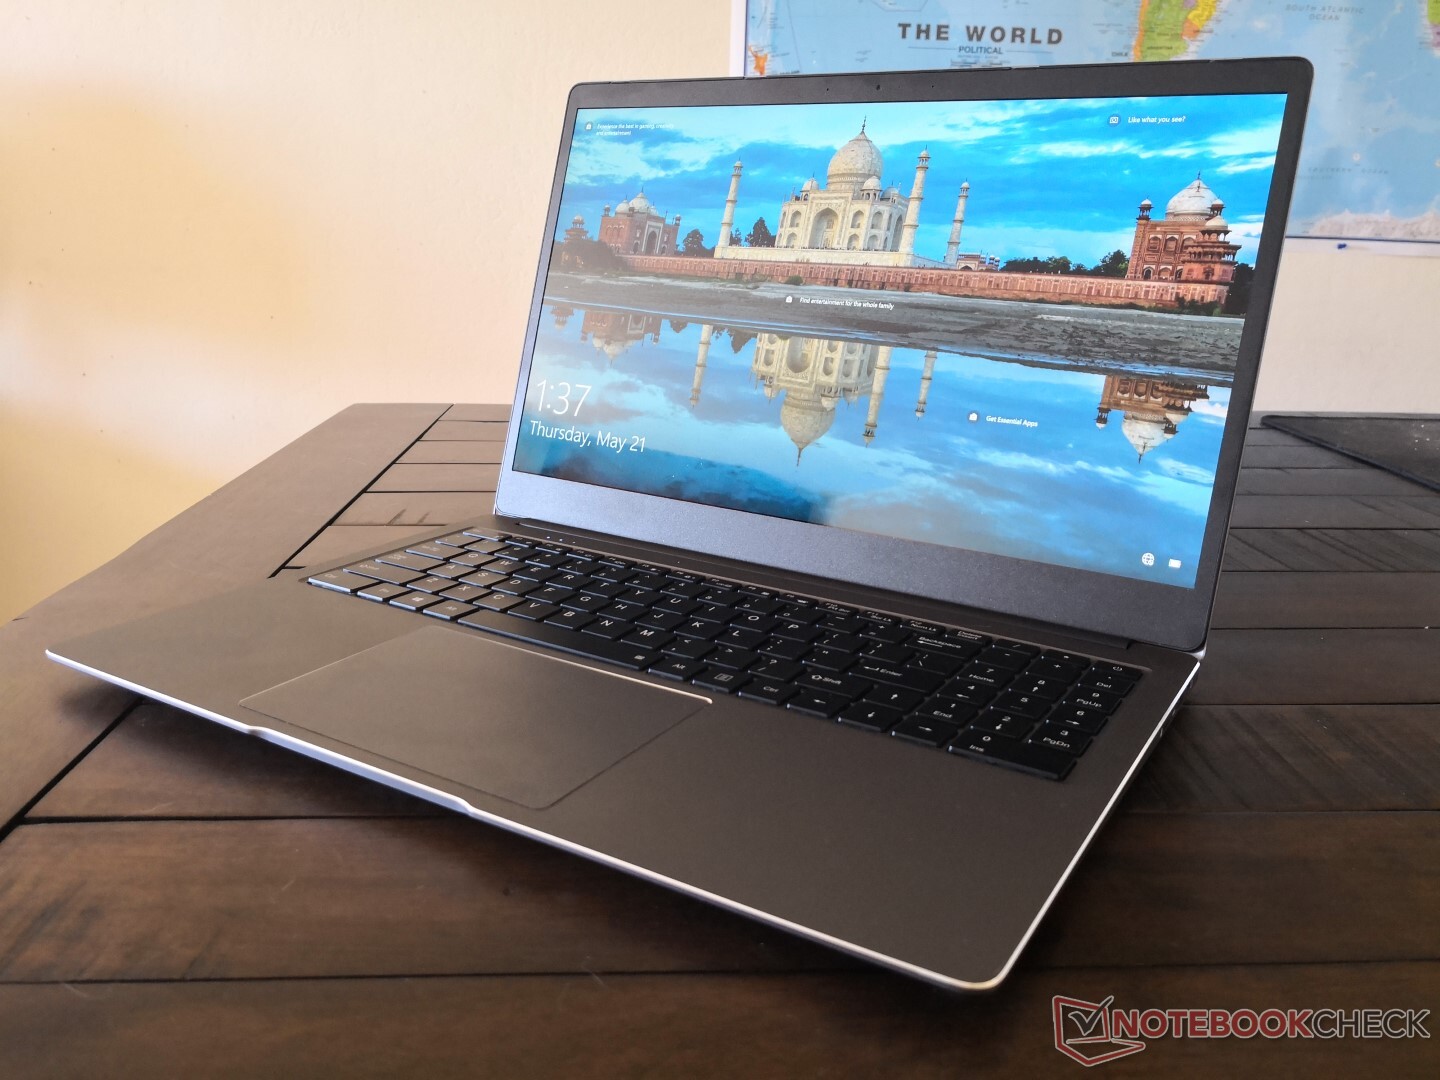
Kort testrapport Chuwi AeroBook Plus 4K Laptop: 6e Gen Intel Skylake-U in 2020
Evaluatie | Datum | Model | Gewicht | Hoogte | Formaat | Resolutie | Beste prijs |
|---|---|---|---|---|---|---|---|
| 73.2 % v7 (old) | 05-2020 | Chuwi AeroBook Plus 6287U, Iris Graphics 550 | 1.7 kg | 15.9 mm | 15.60" | 3840x2160 | |
| 87.9 % v7 (old) | 07-2018 | Apple MacBook Pro 15 2018 (2.6 GHz, 560X) i7-8850H, Radeon Pro 560X | 1.8 kg | 15.5 mm | 15.40" | 2880x1800 | |
| 81.4 % v7 (old) | 02-2020 | Lenovo Ideapad S540-15IML i5-10210U, GeForce MX250 | 1.9 kg | 17 mm | 15.60" | 1920x1080 | |
| 80.1 % v6 (old) | 04-2018 | HP Envy x360 15-bq102ng R5 2500U, Vega 8 | 2.1 kg | 19.6 mm | 15.60" | 1920x1080 | |
| 73.1 % v7 (old) | 12-2020 | Asus Vivobook 15 F512DA-SH31 R3 3200U, Vega 3 | 1.8 kg | 19.9 mm | 15.60" | 1920x1080 |
| SD Card Reader | |
| average JPG Copy Test (av. of 3 runs) | |
| Dell XPS 15 7590 i5 iGPU FHD (Toshiba Exceria Pro SDXC 64 GB UHS-II) | |
| HP Envy x360 15-bq102ng (Toshiba Exceria Pro SDXC 64 GB UHS-II) | |
| Asus Vivobook 15 F512DA-SH31 (Toshiba Exceria Pro M501 64 GB UHS-II) | |
| Chuwi AeroBook Plus (Toshiba Exceria Pro M501 64 GB UHS-II) | |
| maximum AS SSD Seq Read Test (1GB) | |
| Dell XPS 15 7590 i5 iGPU FHD (Toshiba Exceria Pro SDXC 64 GB UHS-II) | |
| HP Envy x360 15-bq102ng (Toshiba Exceria Pro SDXC 64 GB UHS-II) | |
| Asus Vivobook 15 F512DA-SH31 (Toshiba Exceria Pro M501 64 GB UHS-II) | |
| Chuwi AeroBook Plus (Toshiba Exceria Pro M501 64 GB UHS-II) | |
| Networking | |
| iperf3 transmit AX12 | |
| Dynabook Portégé X30L-G | |
| Microsoft Surface Laptop 3 13 Core i5-1035G7 | |
| LG Gram 14Z90N | |
| Chuwi AeroBook Plus | |
| iperf3 receive AX12 | |
| LG Gram 14Z90N | |
| Dynabook Portégé X30L-G | |
| Microsoft Surface Laptop 3 13 Core i5-1035G7 | |
| Chuwi AeroBook Plus | |


| |||||||||||||||||||||||||
Helderheidsverdeling: 86 %
Helderheid in Batterij-modus: 336.9 cd/m²
Contrast: 1047:1 (Zwart: 0.33 cd/m²)
ΔE ColorChecker Calman: 4.25 | ∀{0.5-29.43 Ø4.71}
calibrated: 3.49
ΔE Greyscale Calman: 5.8 | ∀{0.09-98 Ø4.96}
88% sRGB (Argyll 1.6.3 3D)
57.2% AdobeRGB 1998 (Argyll 1.6.3 3D)
64.7% AdobeRGB 1998 (Argyll 3D)
88.4% sRGB (Argyll 3D)
66.7% Display P3 (Argyll 3D)
Gamma: 2.13
CCT: 7771 K
| Chuwi AeroBook Plus BOE06C3, IPS, 15.6", 3840x2160 | Apple MacBook Pro 15 2018 (2.6 GHz, 560X) APPA040, IPS, 15.4", 2880x1800 | Dell XPS 15 7590 i5 iGPU FHD LQ156M1, IPS, 15.6", 1920x1080 | Lenovo Yoga C740-15IML B156HAN02.5, IPS LED, 15.6", 1920x1080 | HP Envy x360 15-bq102ng Chi Mei CM15E9, IPS, 15.6", 1920x1080 | Asus Vivobook 15 F512DA-SH31 AU Optronics B156HAN02.1, IPS, 15.6", 1920x1080 | |
|---|---|---|---|---|---|---|
| Display | 32% | 6% | -38% | -34% | -38% | |
| Display P3 Coverage (%) | 66.7 | 98.7 48% | 66.5 0% | 39.04 -41% | 41.36 -38% | 38.71 -42% |
| sRGB Coverage (%) | 88.4 | 99.9 13% | 98 11% | 57.9 -35% | 62.2 -30% | 58.2 -34% |
| AdobeRGB 1998 Coverage (%) | 64.7 | 86.6 34% | 68.4 6% | 40.33 -38% | 42.74 -34% | 40 -38% |
| Response Times | -11% | -25% | -23% | 3% | 1% | |
| Response Time Grey 50% / Grey 80% * (ms) | 39.6 ? | 43.2 ? -9% | 52.8 ? -33% | 50.8 ? -28% | 40 ? -1% | 36 ? 9% |
| Response Time Black / White * (ms) | 27.6 ? | 31.2 ? -13% | 32 ? -16% | 32.4 ? -17% | 26 ? 6% | 29.6 ? -7% |
| PWM Frequency (Hz) | 943 ? | 117000 ? | 1020 ? | 25000 ? | ||
| Screen | 43% | 33% | -27% | 7% | -39% | |
| Brightness middle (cd/m²) | 345.4 | 520 51% | 588 70% | 286 -17% | 221 -36% | 252.8 -27% |
| Brightness (cd/m²) | 318 | 492 55% | 555 75% | 268 -16% | 207 -35% | 237 -25% |
| Brightness Distribution (%) | 86 | 88 2% | 89 3% | 83 -3% | 87 1% | 89 3% |
| Black Level * (cd/m²) | 0.33 | 0.39 -18% | 0.4 -21% | 0.2 39% | 0.15 55% | 0.86 -161% |
| Contrast (:1) | 1047 | 1333 27% | 1470 40% | 1430 37% | 1473 41% | 294 -72% |
| Colorchecker dE 2000 * | 4.25 | 1.2 72% | 2.5 41% | 7.3 -72% | 4.35 -2% | 4.83 -14% |
| Colorchecker dE 2000 max. * | 9.34 | 2.3 75% | 6.3 33% | 21.7 -132% | 8.98 4% | 16.38 -75% |
| Colorchecker dE 2000 calibrated * | 3.49 | 0.6 83% | 5.1 -46% | 3.78 -8% | ||
| Greyscale dE 2000 * | 5.8 | 1.3 78% | 4.5 22% | 7 -21% | 3.09 47% | 4.6 21% |
| Gamma | 2.13 103% | 2.18 101% | 2.2 100% | 2.35 94% | 2.23 99% | 2.34 94% |
| CCT | 7771 84% | 6738 96% | 6836 95% | 5847 111% | 6068 107% | 6841 95% |
| Color Space (Percent of AdobeRGB 1998) (%) | 57.2 | 63.2 10% | 36.9 -35% | 56 -2% | 36.9 -35% | |
| Color Space (Percent of sRGB) (%) | 88 | 98 11% | 57.5 -35% | 86 -2% | 58.1 -34% | |
| Totaal Gemiddelde (Programma / Instellingen) | 21% /
32% | 5% /
21% | -29% /
-29% | -8% /
-2% | -25% /
-34% |
* ... kleiner is beter
Responstijd Scherm
| ↔ Responstijd Zwart naar Wit | ||
|---|---|---|
| 27.6 ms ... stijging ↗ en daling ↘ gecombineerd | ↗ 13.6 ms stijging | 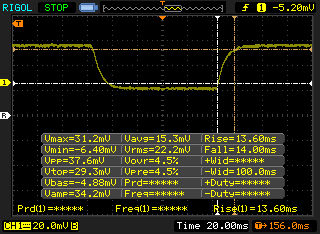 |
| ↘ 14 ms daling | ||
| Het scherm vertoonde relatief trage responstijden in onze tests en is misschien te traag voor games. Ter vergelijking: alle testtoestellen variëren van 0.1 (minimum) tot 240 (maximum) ms. » 70 % van alle toestellen zijn beter. Dit betekent dat de gemeten responstijd slechter is dan het gemiddelde (19.8 ms) van alle geteste toestellen. | ||
| ↔ Responstijd 50% Grijs naar 80% Grijs | ||
| 39.6 ms ... stijging ↗ en daling ↘ gecombineerd | ↗ 20.4 ms stijging | 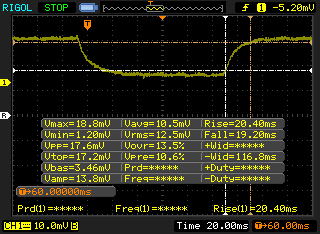 |
| ↘ 19.2 ms daling | ||
| Het scherm vertoonde trage responstijden in onze tests en is misschien te traag voor games. Ter vergelijking: alle testtoestellen variëren van 0.165 (minimum) tot 636 (maximum) ms. » 61 % van alle toestellen zijn beter. Dit betekent dat de gemeten responstijd slechter is dan het gemiddelde (30.9 ms) van alle geteste toestellen. | ||
Screen Flickering / PWM (Pulse-Width Modulation)
| Screen flickering / PWM waargenomen | 943 Hz | ≤ 99 % helderheid instelling | 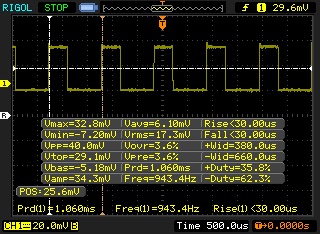 |
De achtergrondverlichting van het scherm flikkert op 943 Hz (in het slechtste geval, bijvoorbeeld bij gebruik van PWM) aan een helderheid van 99 % en lager. Boven deze helderheid zou er geen flickering / PWM mogen optreden. De frequentie van 943 Hz is redelijk hoog en de meeste mensen die gevoelig zijn aan flickering zouden dit dus niet mogen waarnemen of geïrriteerde ogen krijgen. Ter vergelijking: 52 % van alle geteste toestellen maakten geen gebruik van PWM om de schermhelderheid te verlagen. Als het wel werd gebruikt, werd een gemiddelde van 7744 (minimum: 5 - maximum: 343500) Hz waargenomen. | |||
Cinebench R20: CPU (Multi Core) | CPU (Single Core)
Blender: v2.79 BMW27 CPU
7-Zip 18.03: 7z b 4 -mmt1 | 7z b 4
Geekbench 5.5: Single-Core | Multi-Core
HWBOT x265 Benchmark v2.2: 4k Preset
LibreOffice : 20 Documents To PDF
R Benchmark 2.5: Overall mean
| Cinebench R15 / CPU Multi 64Bit | |
| Asus ZenBook 15 UX534FTC-A8190T | |
| Apple MacBook Pro 13 2020 2GHz i5 10th-Gen | |
| Dell XPS 13 9300 Core i7-1065G7 | |
| Microsoft Surface Laptop 3 13 Core i5-1035G7 | |
| Dell Inspiron 15 5000 5585 | |
| Lenovo Yoga 530-14ARR-81H9000VGE | |
| Lenovo IdeaPad S540-15IWL 81SW0015GE | |
| Acer Aspire 5 A515-54G | |
| Dell Latitude 13 3390 | |
| Dynabook Portege A30-E-174 | |
| Wacom MobileStudio Pro 13 i7 256GB | |
| Chuwi AeroBook Plus | |
| Gemiddeld Intel Core i5-6287U (n=1) | |
| Apple MacBook Air 2020 i3 | |
| Asus ZenBook UX530UX-FY070T | |
| Cinebench R15 / CPU Single 64Bit | |
| Lenovo IdeaPad S540-15IWL 81SW0015GE | |
| Asus ZenBook 15 UX534FTC-A8190T | |
| Dell XPS 13 9300 Core i7-1065G7 | |
| Microsoft Surface Laptop 3 13 Core i5-1035G7 | |
| Apple MacBook Pro 13 2020 2GHz i5 10th-Gen | |
| Acer Aspire 5 A515-54G | |
| Dynabook Portege A30-E-174 | |
| Wacom MobileStudio Pro 13 i7 256GB | |
| Dell Latitude 13 3390 | |
| Chuwi AeroBook Plus | |
| Gemiddeld Intel Core i5-6287U (n=1) | |
| Asus ZenBook UX530UX-FY070T | |
| Apple MacBook Air 2020 i3 | |
| Lenovo Yoga 530-14ARR-81H9000VGE | |
| Dell Inspiron 15 5000 5585 | |
| Cinebench R20 / CPU (Multi Core) | |
| Apple MacBook Pro 13 2020 2GHz i5 10th-Gen | |
| Dell XPS 13 9300 Core i7-1065G7 | |
| Asus ZenBook 15 UX534FTC-A8190T | |
| Microsoft Surface Laptop 3 13 Core i5-1035G7 | |
| Lenovo Yoga 530-14ARR-81H9000VGE | |
| Dell Inspiron 15 5000 5585 | |
| Lenovo IdeaPad S540-15IWL 81SW0015GE | |
| Acer Aspire 5 A515-54G | |
| Dynabook Portege A30-E-174 | |
| Dell Latitude 13 3390 | |
| Wacom MobileStudio Pro 13 i7 256GB | |
| Chuwi AeroBook Plus | |
| Gemiddeld Intel Core i5-6287U (n=1) | |
| Apple MacBook Air 2020 i3 | |
| Cinebench R20 / CPU (Single Core) | |
| Lenovo IdeaPad S540-15IWL 81SW0015GE | |
| Asus ZenBook 15 UX534FTC-A8190T | |
| Dell XPS 13 9300 Core i7-1065G7 | |
| Microsoft Surface Laptop 3 13 Core i5-1035G7 | |
| Apple MacBook Pro 13 2020 2GHz i5 10th-Gen | |
| Acer Aspire 5 A515-54G | |
| Dynabook Portege A30-E-174 | |
| Wacom MobileStudio Pro 13 i7 256GB | |
| Lenovo Yoga 530-14ARR-81H9000VGE | |
| Chuwi AeroBook Plus | |
| Gemiddeld Intel Core i5-6287U (n=1) | |
| Dell Latitude 13 3390 | |
| Apple MacBook Air 2020 i3 | |
| Dell Inspiron 15 5000 5585 | |
| Blender / v2.79 BMW27 CPU | |
| Apple MacBook Air 2020 i3 | |
| Chuwi AeroBook Plus | |
| Gemiddeld Intel Core i5-6287U (n=1) | |
| Wacom MobileStudio Pro 13 i7 256GB | |
| Dell Latitude 13 3390 | |
| Acer Aspire 5 A515-54G | |
| Microsoft Surface Laptop 3 13 Core i5-1035G7 | |
| Lenovo IdeaPad S540-15IWL 81SW0015GE | |
| Apple MacBook Pro 13 2020 2GHz i5 10th-Gen | |
| 7-Zip 18.03 / 7z b 4 -mmt1 | |
| Lenovo IdeaPad S540-15IWL 81SW0015GE | |
| Microsoft Surface Laptop 3 13 Core i5-1035G7 | |
| Acer Aspire 5 A515-54G | |
| Apple MacBook Pro 13 2020 2GHz i5 10th-Gen | |
| Chuwi AeroBook Plus | |
| Gemiddeld Intel Core i5-6287U (n=1) | |
| Wacom MobileStudio Pro 13 i7 256GB | |
| Dell Latitude 13 3390 | |
| Apple MacBook Air 2020 i3 | |
| 7-Zip 18.03 / 7z b 4 | |
| Apple MacBook Pro 13 2020 2GHz i5 10th-Gen | |
| Lenovo IdeaPad S540-15IWL 81SW0015GE | |
| Microsoft Surface Laptop 3 13 Core i5-1035G7 | |
| Acer Aspire 5 A515-54G | |
| Dell Latitude 13 3390 | |
| Chuwi AeroBook Plus | |
| Gemiddeld Intel Core i5-6287U (n=1) | |
| Wacom MobileStudio Pro 13 i7 256GB | |
| Apple MacBook Air 2020 i3 | |
| Geekbench 5.5 / Single-Core | |
| Apple MacBook Pro 13 2020 2GHz i5 10th-Gen | |
| Asus ZenBook 15 UX534FTC-A8190T | |
| Apple MacBook Air 2020 i3 | |
| Acer Aspire 5 A515-54G | |
| Wacom MobileStudio Pro 13 i7 256GB | |
| Chuwi AeroBook Plus | |
| Gemiddeld Intel Core i5-6287U (825 - 939, n=2) | |
| Geekbench 5.5 / Multi-Core | |
| Apple MacBook Pro 13 2020 2GHz i5 10th-Gen | |
| Asus ZenBook 15 UX534FTC-A8190T | |
| Acer Aspire 5 A515-54G | |
| Wacom MobileStudio Pro 13 i7 256GB | |
| Chuwi AeroBook Plus | |
| Apple MacBook Air 2020 i3 | |
| Gemiddeld Intel Core i5-6287U (1935 - 2042, n=2) | |
| HWBOT x265 Benchmark v2.2 / 4k Preset | |
| Apple MacBook Pro 13 2020 2GHz i5 10th-Gen | |
| Lenovo IdeaPad S540-15IWL 81SW0015GE | |
| Microsoft Surface Laptop 3 13 Core i5-1035G7 | |
| Acer Aspire 5 A515-54G | |
| Dell Latitude 13 3390 | |
| Wacom MobileStudio Pro 13 i7 256GB | |
| Chuwi AeroBook Plus | |
| Gemiddeld Intel Core i5-6287U (n=1) | |
| Apple MacBook Air 2020 i3 | |
| LibreOffice / 20 Documents To PDF | |
| Apple MacBook Air 2020 i3 | |
| Apple MacBook Pro 13 2020 2GHz i5 10th-Gen | |
| Chuwi AeroBook Plus | |
| Gemiddeld Intel Core i5-6287U (n=1) | |
| Acer Aspire 5 A515-54G | |
| R Benchmark 2.5 / Overall mean | |
| Apple MacBook Air 2020 i3 | |
| Chuwi AeroBook Plus | |
| Gemiddeld Intel Core i5-6287U (n=1) | |
| Acer Aspire 5 A515-54G | |
| Apple MacBook Pro 13 2020 2GHz i5 10th-Gen | |
Cinebench R20: CPU (Multi Core) | CPU (Single Core)
Blender: v2.79 BMW27 CPU
7-Zip 18.03: 7z b 4 -mmt1 | 7z b 4
Geekbench 5.5: Single-Core | Multi-Core
HWBOT x265 Benchmark v2.2: 4k Preset
LibreOffice : 20 Documents To PDF
R Benchmark 2.5: Overall mean
* ... kleiner is beter
| PCMark 8 | |
| Home Score Accelerated v2 | |
| Lenovo Yoga C740-15IML | |
| Dell Latitude 15 3590 | |
| HP Envy x360 15-bq102ng | |
| Chuwi AeroBook Plus | |
| Asus Vivobook 15 F512DA-SH31 | |
| Work Score Accelerated v2 | |
| Lenovo Yoga C740-15IML | |
| Dell Latitude 15 3590 | |
| Asus Vivobook 15 F512DA-SH31 | |
| HP Envy x360 15-bq102ng | |
| Chuwi AeroBook Plus | |
| PCMark 8 Home Score Accelerated v2 | 2764 punten | |
| PCMark 8 Work Score Accelerated v2 | 3609 punten | |
| PCMark 10 Score | 3528 punten | |
Help | ||
| DPC Latencies / LatencyMon - interrupt to process latency (max), Web, Youtube, Prime95 | |
| Chuwi AeroBook Plus | |
* ... kleiner is beter
| Chuwi AeroBook Plus HIKVision HS-SSD-C100N M.2 SATA III SSD 256 GB | HP Envy x360 15-bq102ng Samsung PM961 MZVLW256HEHP | Dell XPS 15 7590 i5 iGPU FHD Toshiba XG6 KXG60ZNV512G | Lenovo Yoga C740-15IML Samsung SSD PM981 MZVLB512HAJQ | Asus Vivobook 15 F512DA-SH31 SanDisk X600 SD9SN8W-128G | |
|---|---|---|---|---|---|
| AS SSD | 268% | 640% | 678% | -12% | |
| Seq Read (MB/s) | 469 | 2465 426% | 2357 403% | 2732 483% | 341.4 -27% |
| Seq Write (MB/s) | 418.3 | 1318 215% | 1235 195% | 1477 253% | 134.2 -68% |
| 4K Read (MB/s) | 21.17 | 42.97 103% | 43.29 104% | 57.7 173% | 27.83 31% |
| 4K Write (MB/s) | 48.31 | 81.9 70% | 99.7 106% | 136.3 182% | 54.9 14% |
| 4K-64 Read (MB/s) | 155.4 | 1025 560% | 1020 556% | 1021 557% | 217.1 40% |
| 4K-64 Write (MB/s) | 56.6 | 338.6 498% | 1502 2554% | 1651 2817% | 68.1 20% |
| Access Time Read * (ms) | 0.11 | 0.077 30% | 0.07 36% | 0.062 44% | 0.153 -39% |
| Access Time Write * (ms) | 0.726 | 0.046 94% | 0.039 95% | 0.028 96% | 1.075 -48% |
| Score Read (Points) | 223 | 1314 489% | 1299 483% | 1352 506% | 279 25% |
| Score Write (Points) | 147 | 552 276% | 1726 1074% | 1935 1216% | 136 -7% |
| Score Total (Points) | 490 | 2488 408% | 3640 643% | 3929 702% | 559 14% |
| Copy ISO MB/s (MB/s) | 407 | 700 72% | 2145 427% | 1972 385% | 115.9 -72% |
| Copy Program MB/s (MB/s) | 80.6 | 167.2 107% | 565 601% | 642 697% | 44.51 -45% |
| Copy Game MB/s (MB/s) | 73.9 | 370.4 401% | 1320 1686% | 1090 1375% | 74.3 1% |
| CrystalDiskMark 5.2 / 6 | 152% | 218% | 275% | -22% | |
| Write 4K (MB/s) | 115.3 | 116 1% | 93.6 -19% | 142.3 23% | 65.2 -43% |
| Read 4K (MB/s) | 28.98 | 42.73 47% | 41.87 44% | 47.56 64% | 31.22 8% |
| Write Seq (MB/s) | 352.8 | 1222 246% | 1698 381% | 2185 519% | 284.8 -19% |
| Read Seq (MB/s) | 506 | 1608 218% | 1978 291% | 2235 342% | 497.5 -2% |
| Write 4K Q32T1 (MB/s) | 275.9 | 280.1 2% | 383.1 39% | 515 87% | 164 -41% |
| Read 4K Q32T1 (MB/s) | 219.9 | 333.6 52% | 326.9 49% | 413.4 88% | 230.2 5% |
| Write Seq Q32T1 (MB/s) | 466.2 | 1291 177% | 2778 496% | 2981 539% | 221.7 -52% |
| Read Seq Q32T1 (MB/s) | 558 | 3183 470% | 3119 459% | 3565 539% | 389.7 -30% |
| Totaal Gemiddelde (Programma / Instellingen) | 210% /
226% | 429% /
487% | 477% /
531% | -17% /
-15% |
* ... kleiner is beter

Disk Throttling: DiskSpd Read Loop, Queue Depth 8
| 3DMark 11 Performance | 2695 punten | |
| 3DMark Cloud Gate Standard Score | 8532 punten | |
| 3DMark Fire Strike Score | 1552 punten | |
| 3DMark Time Spy Score | 599 punten | |
Help | ||
| lage | gem. | hoge | ultra | |
|---|---|---|---|---|
| Dota 2 Reborn (2015) | 82.5 | 43.5 | 26.9 | 23.6 |
| X-Plane 11.11 (2018) | 22.7 | 15.9 | 14.1 |
| Chuwi AeroBook Plus Iris Graphics 550, 6287U, HIKVision HS-SSD-C100N M.2 SATA III SSD 256 GB | Apple MacBook Pro 15 2018 (2.6 GHz, 560X) Radeon Pro 560X, i7-8850H, Apple SSD AP0512 | Dell XPS 15 7590 i5 iGPU FHD UHD Graphics 630, i5-9300H, Toshiba XG6 KXG60ZNV512G | Lenovo Yoga C740-15IML UHD Graphics 620, i7-10510U, Samsung SSD PM981 MZVLB512HAJQ | HP Envy x360 15-bq102ng Vega 8, R5 2500U, Samsung PM961 MZVLW256HEHP | Asus Vivobook 15 F512DA-SH31 Vega 3, R3 3200U, SanDisk X600 SD9SN8W-128G | |
|---|---|---|---|---|---|---|
| Noise | -7% | 5% | 7% | -0% | 8% | |
| uit / omgeving * (dB) | 28.5 | 29.6 -4% | 29.3 -3% | 29.3 -3% | 30.13 -6% | 29.2 -2% |
| Idle Minimum * (dB) | 28.5 | 30.1 -6% | 29.3 -3% | 29.3 -3% | 30.13 -6% | 29.2 -2% |
| Idle Average * (dB) | 31.1 | 30.1 3% | 29.3 6% | 29.3 6% | 30.13 3% | 29.2 6% |
| Idle Maximum * (dB) | 33 | 30.1 9% | 29.8 10% | 29.6 10% | 30.13 9% | 29.2 12% |
| Load Average * (dB) | 36.4 | 46.8 -29% | 32.4 11% | 32.4 11% | 38.8 -7% | 30.5 16% |
| Load Maximum * (dB) | 41.2 | 46.8 -14% | 37.2 10% | 33.3 19% | 38.8 6% | 34 17% |
| Witcher 3 ultra * (dB) | 36 |
* ... kleiner is beter
Geluidsniveau
| Onbelast |
| 28.5 / 31.1 / 33 dB (A) |
| Belasting |
| 36.4 / 41.2 dB (A) |
 | ||
30 dB stil 40 dB(A) hoorbaar 50 dB(A) luid |
||
min: | ||
(±) De maximumtemperatuur aan de bovenzijde bedraagt 44.8 °C / 113 F, vergeleken met het gemiddelde van 36.8 °C / 98 F, variërend van 21 tot 71 °C voor de klasse Multimedia.
(-) De bodem warmt op tot een maximum van 49.2 °C / 121 F, vergeleken met een gemiddelde van 39.1 °C / 102 F
(+) Bij onbelast gebruik bedraagt de gemiddelde temperatuur voor de bovenzijde 30.3 °C / 87 F, vergeleken met het apparaatgemiddelde van 31.3 °C / 88 F.
(+) De palmsteunen en het touchpad zijn met een maximum van ###max## °C / 87.8 F koeler dan de huidtemperatuur en voelen daarom koel aan.
(-) De gemiddelde temperatuur van de handpalmsteun van soortgelijke toestellen bedroeg 28.7 °C / 83.7 F (-2.3 °C / -4.1 F).
Chuwi AeroBook Plus audioanalyse
(±) | luidspreker luidheid is gemiddeld maar goed (79.4 dB)
Bas 100 - 315 Hz
(-) | bijna geen lage tonen - gemiddeld 17.5% lager dan de mediaan
(±) | lineariteit van de lage tonen is gemiddeld (10.3% delta ten opzichte van de vorige frequentie)
Midden 400 - 2000 Hz
(±) | hogere middens - gemiddeld 6.1% hoger dan de mediaan
(±) | lineariteit van de middentonen is gemiddeld (8.8% delta ten opzichte van de vorige frequentie)
Hoog 2 - 16 kHz
(+) | evenwichtige hoogtepunten - slechts 4.8% verwijderd van de mediaan
(±) | lineariteit van de hoogtepunten is gemiddeld (10.8% delta ten opzichte van de vorige frequentie)
Algemeen 100 - 16.000 Hz
(±) | lineariteit van het totale geluid is gemiddeld (24.3% verschil met de mediaan)
Vergeleken met dezelfde klasse
» 86% van alle geteste apparaten in deze klasse waren beter, 5% vergelijkbaar, 9% slechter
» De beste had een delta van 5%, het gemiddelde was 17%, de slechtste was 45%
Vergeleken met alle geteste toestellen
» 74% van alle geteste apparaten waren beter, 6% gelijk, 21% slechter
» De beste had een delta van 4%, het gemiddelde was 23%, de slechtste was 134%
Apple MacBook 12 (Early 2016) 1.1 GHz audioanalyse
(+) | luidsprekers kunnen relatief luid spelen (83.6 dB)
Bas 100 - 315 Hz
(±) | verminderde zeebaars - gemiddeld 11.3% lager dan de mediaan
(±) | lineariteit van de lage tonen is gemiddeld (14.2% delta ten opzichte van de vorige frequentie)
Midden 400 - 2000 Hz
(+) | evenwichtige middens - slechts 2.4% verwijderd van de mediaan
(+) | de middentonen zijn lineair (5.5% delta ten opzichte van de vorige frequentie)
Hoog 2 - 16 kHz
(+) | evenwichtige hoogtepunten - slechts 2% verwijderd van de mediaan
(+) | de hoge tonen zijn lineair (4.5% delta naar de vorige frequentie)
Algemeen 100 - 16.000 Hz
(+) | het totale geluid is lineair (10.2% verschil met de mediaan)
Vergeleken met dezelfde klasse
» 7% van alle geteste apparaten in deze klasse waren beter, 2% vergelijkbaar, 90% slechter
» De beste had een delta van 5%, het gemiddelde was 18%, de slechtste was 53%
Vergeleken met alle geteste toestellen
» 5% van alle geteste apparaten waren beter, 1% gelijk, 94% slechter
» De beste had een delta van 4%, het gemiddelde was 23%, de slechtste was 134%
| Uit / Standby | |
| Inactief | |
| Belasting |
|
Key:
min: | |
| Chuwi AeroBook Plus 6287U, Iris Graphics 550, HIKVision HS-SSD-C100N M.2 SATA III SSD 256 GB, IPS, 3840x2160, 15.6" | Apple MacBook Pro 15 2018 (2.6 GHz, 560X) i7-8850H, Radeon Pro 560X, Apple SSD AP0512, IPS, 2880x1800, 15.4" | Dell XPS 15 7590 i5 iGPU FHD i5-9300H, UHD Graphics 630, Toshiba XG6 KXG60ZNV512G, IPS, 1920x1080, 15.6" | Lenovo Yoga C740-15IML i7-10510U, UHD Graphics 620, Samsung SSD PM981 MZVLB512HAJQ, IPS LED, 1920x1080, 15.6" | HP Envy x360 15-bq102ng R5 2500U, Vega 8, Samsung PM961 MZVLW256HEHP, IPS, 1920x1080, 15.6" | Dell Latitude 15 3590 i5-8250U, UHD Graphics 620, Samsung SSD PM871b MZ7LN256HAJQ, TN LED, 1920x1080, 15.6" | |
|---|---|---|---|---|---|---|
| Power Consumption | -2% | 11% | 35% | 39% | 47% | |
| Idle Minimum * (Watt) | 11.8 | 3.4 71% | 3.79 68% | 2.97 75% | 4.8 59% | 4.3 64% |
| Idle Average * (Watt) | 13.3 | 11 17% | 6.9 48% | 7.2 46% | 7 47% | 7.2 46% |
| Idle Maximum * (Watt) | 16.4 | 14.9 9% | 9.2 44% | 9.9 40% | 9.5 42% | 9.8 40% |
| Load Average * (Watt) | 52.2 | 78.9 -51% | 62 -19% | 40.8 22% | 40.8 22% | 38 27% |
| Load Maximum * (Watt) | 58.6 | 91.2 -56% | 108 -84% | 64.7 -10% | 44.3 24% | 24 59% |
* ... kleiner is beter
| Chuwi AeroBook Plus 6287U, Iris Graphics 550, 55 Wh | Apple MacBook Pro 15 2018 (2.6 GHz, 560X) i7-8850H, Radeon Pro 560X, 83 Wh | Dell XPS 15 7590 i5 iGPU FHD i5-9300H, UHD Graphics 630, 97 Wh | Lenovo Yoga C740-15IML i7-10510U, UHD Graphics 620, 60.3 Wh | HP Envy x360 15-bq102ng R5 2500U, Vega 8, 55.8 Wh | Asus Vivobook 15 F512DA-SH31 R3 3200U, Vega 3, 37 Wh | |
|---|---|---|---|---|---|---|
| Batterijduur | 149% | 244% | 154% | 73% | 46% | |
| WiFi v1.3 (h) | 4.1 | 10.2 149% | 14.1 244% | 10.4 154% | 7.1 73% | 6 46% |
| Witcher 3 ultra (h) | 1.5 | |||||
| Load (h) | 1.7 | 2 |
Pro
Contra
Dit is de verkorte versie van het originele artikel. Het volledige, Engelse testrapport vind je hier.
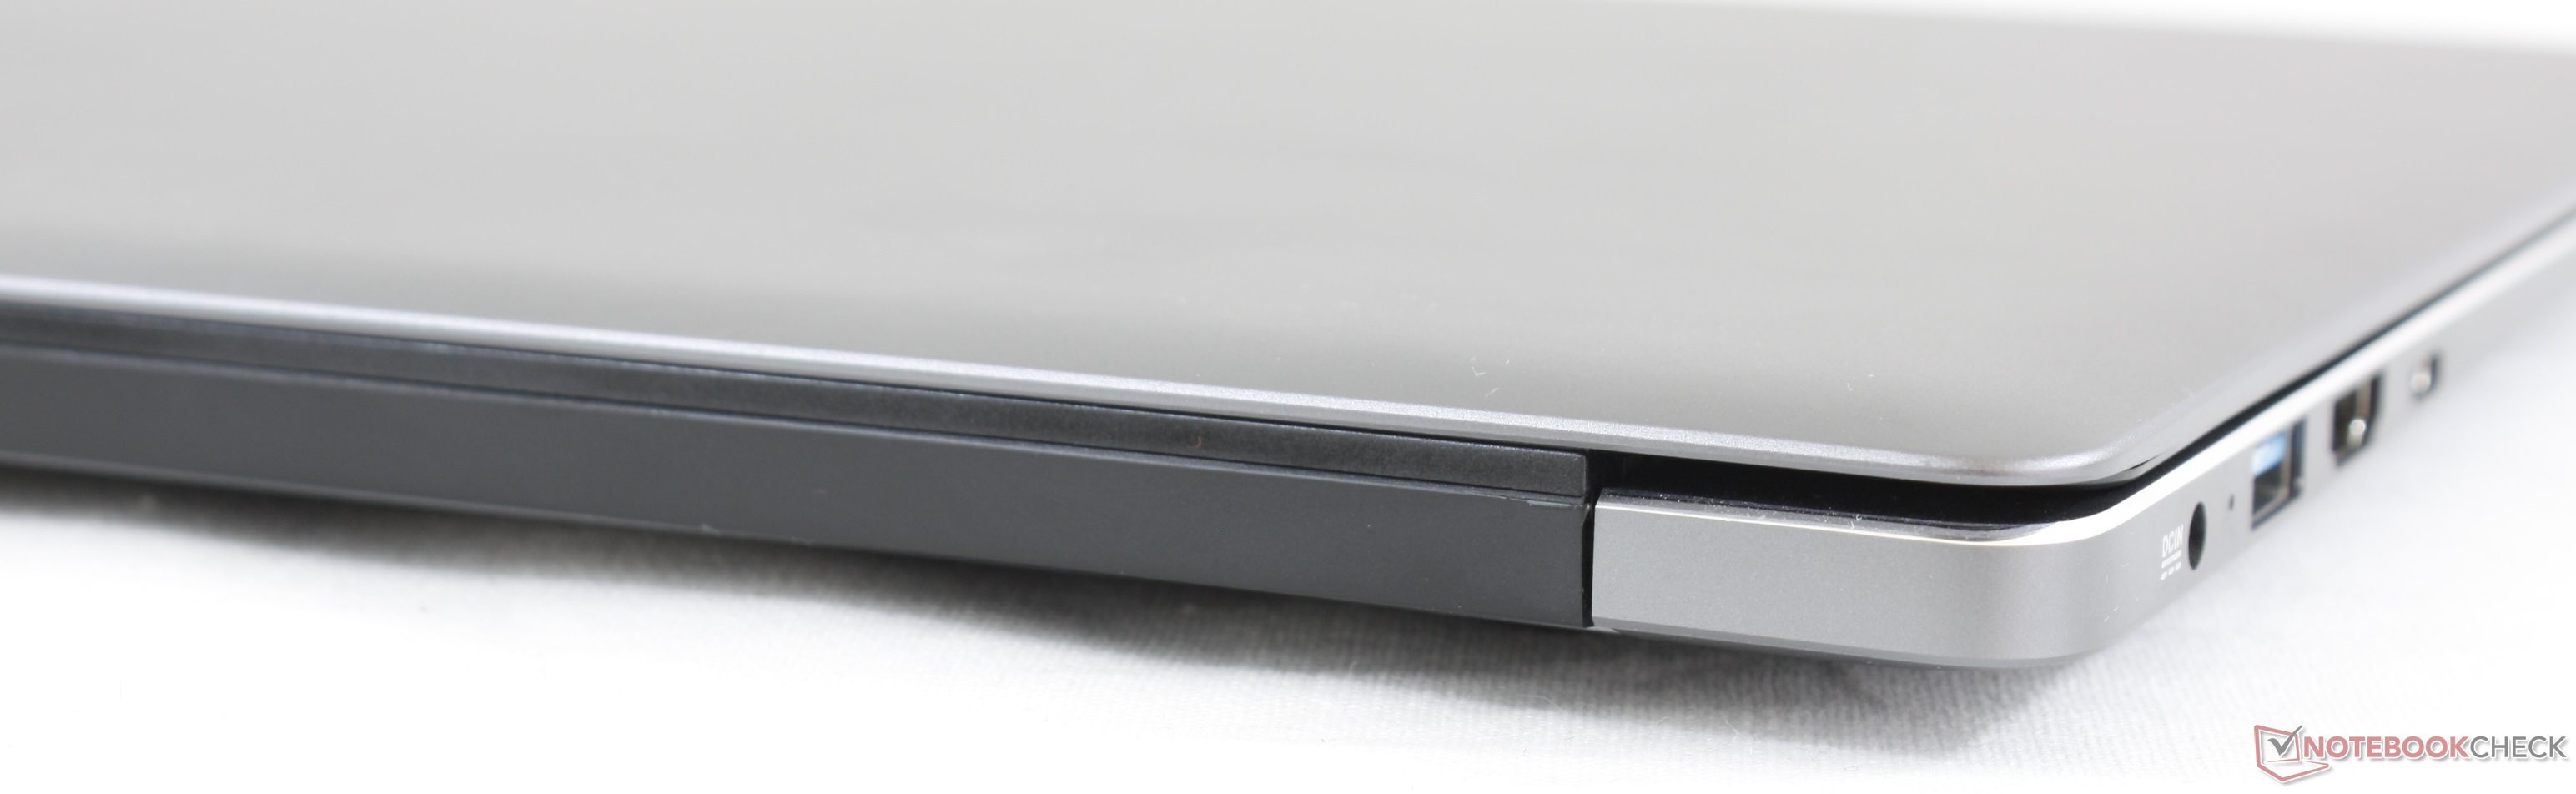
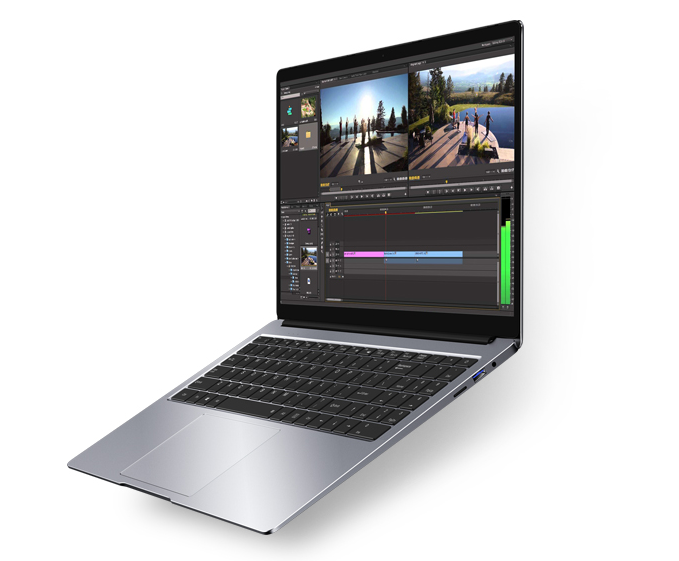
De Chuwi AeroBook Plus bespaart op veel vlakken om een prachtig 4K-scherm aan te bieden tegen deze prijs. Soms op een redelijke manier, zoals 1x1 WLAN, gesoldeerd RAM, SATA III SSD en gebrek aan ondersteuning voor Thunderbolt 3. Anderen zijn echter onaanvaardbaar. Het onbetrouwbare toetsenbord en de clickpad maken de laptop moeilijker te gebruiken dan nodig is en de levensduur van de scharnieren is twijfelachtig. De kwaliteitscontrole van Chuwi-producten lijkt ons tekort te schieten op basis van onze ervaring met verschillende van hun laptops tot nu toe. Toch erkennen we dat ons specifieke toestel een pre-productiesysteem kan zijn, aangezien de AeroBook Plus zich nog in de crowdfunding-fase bevindt.
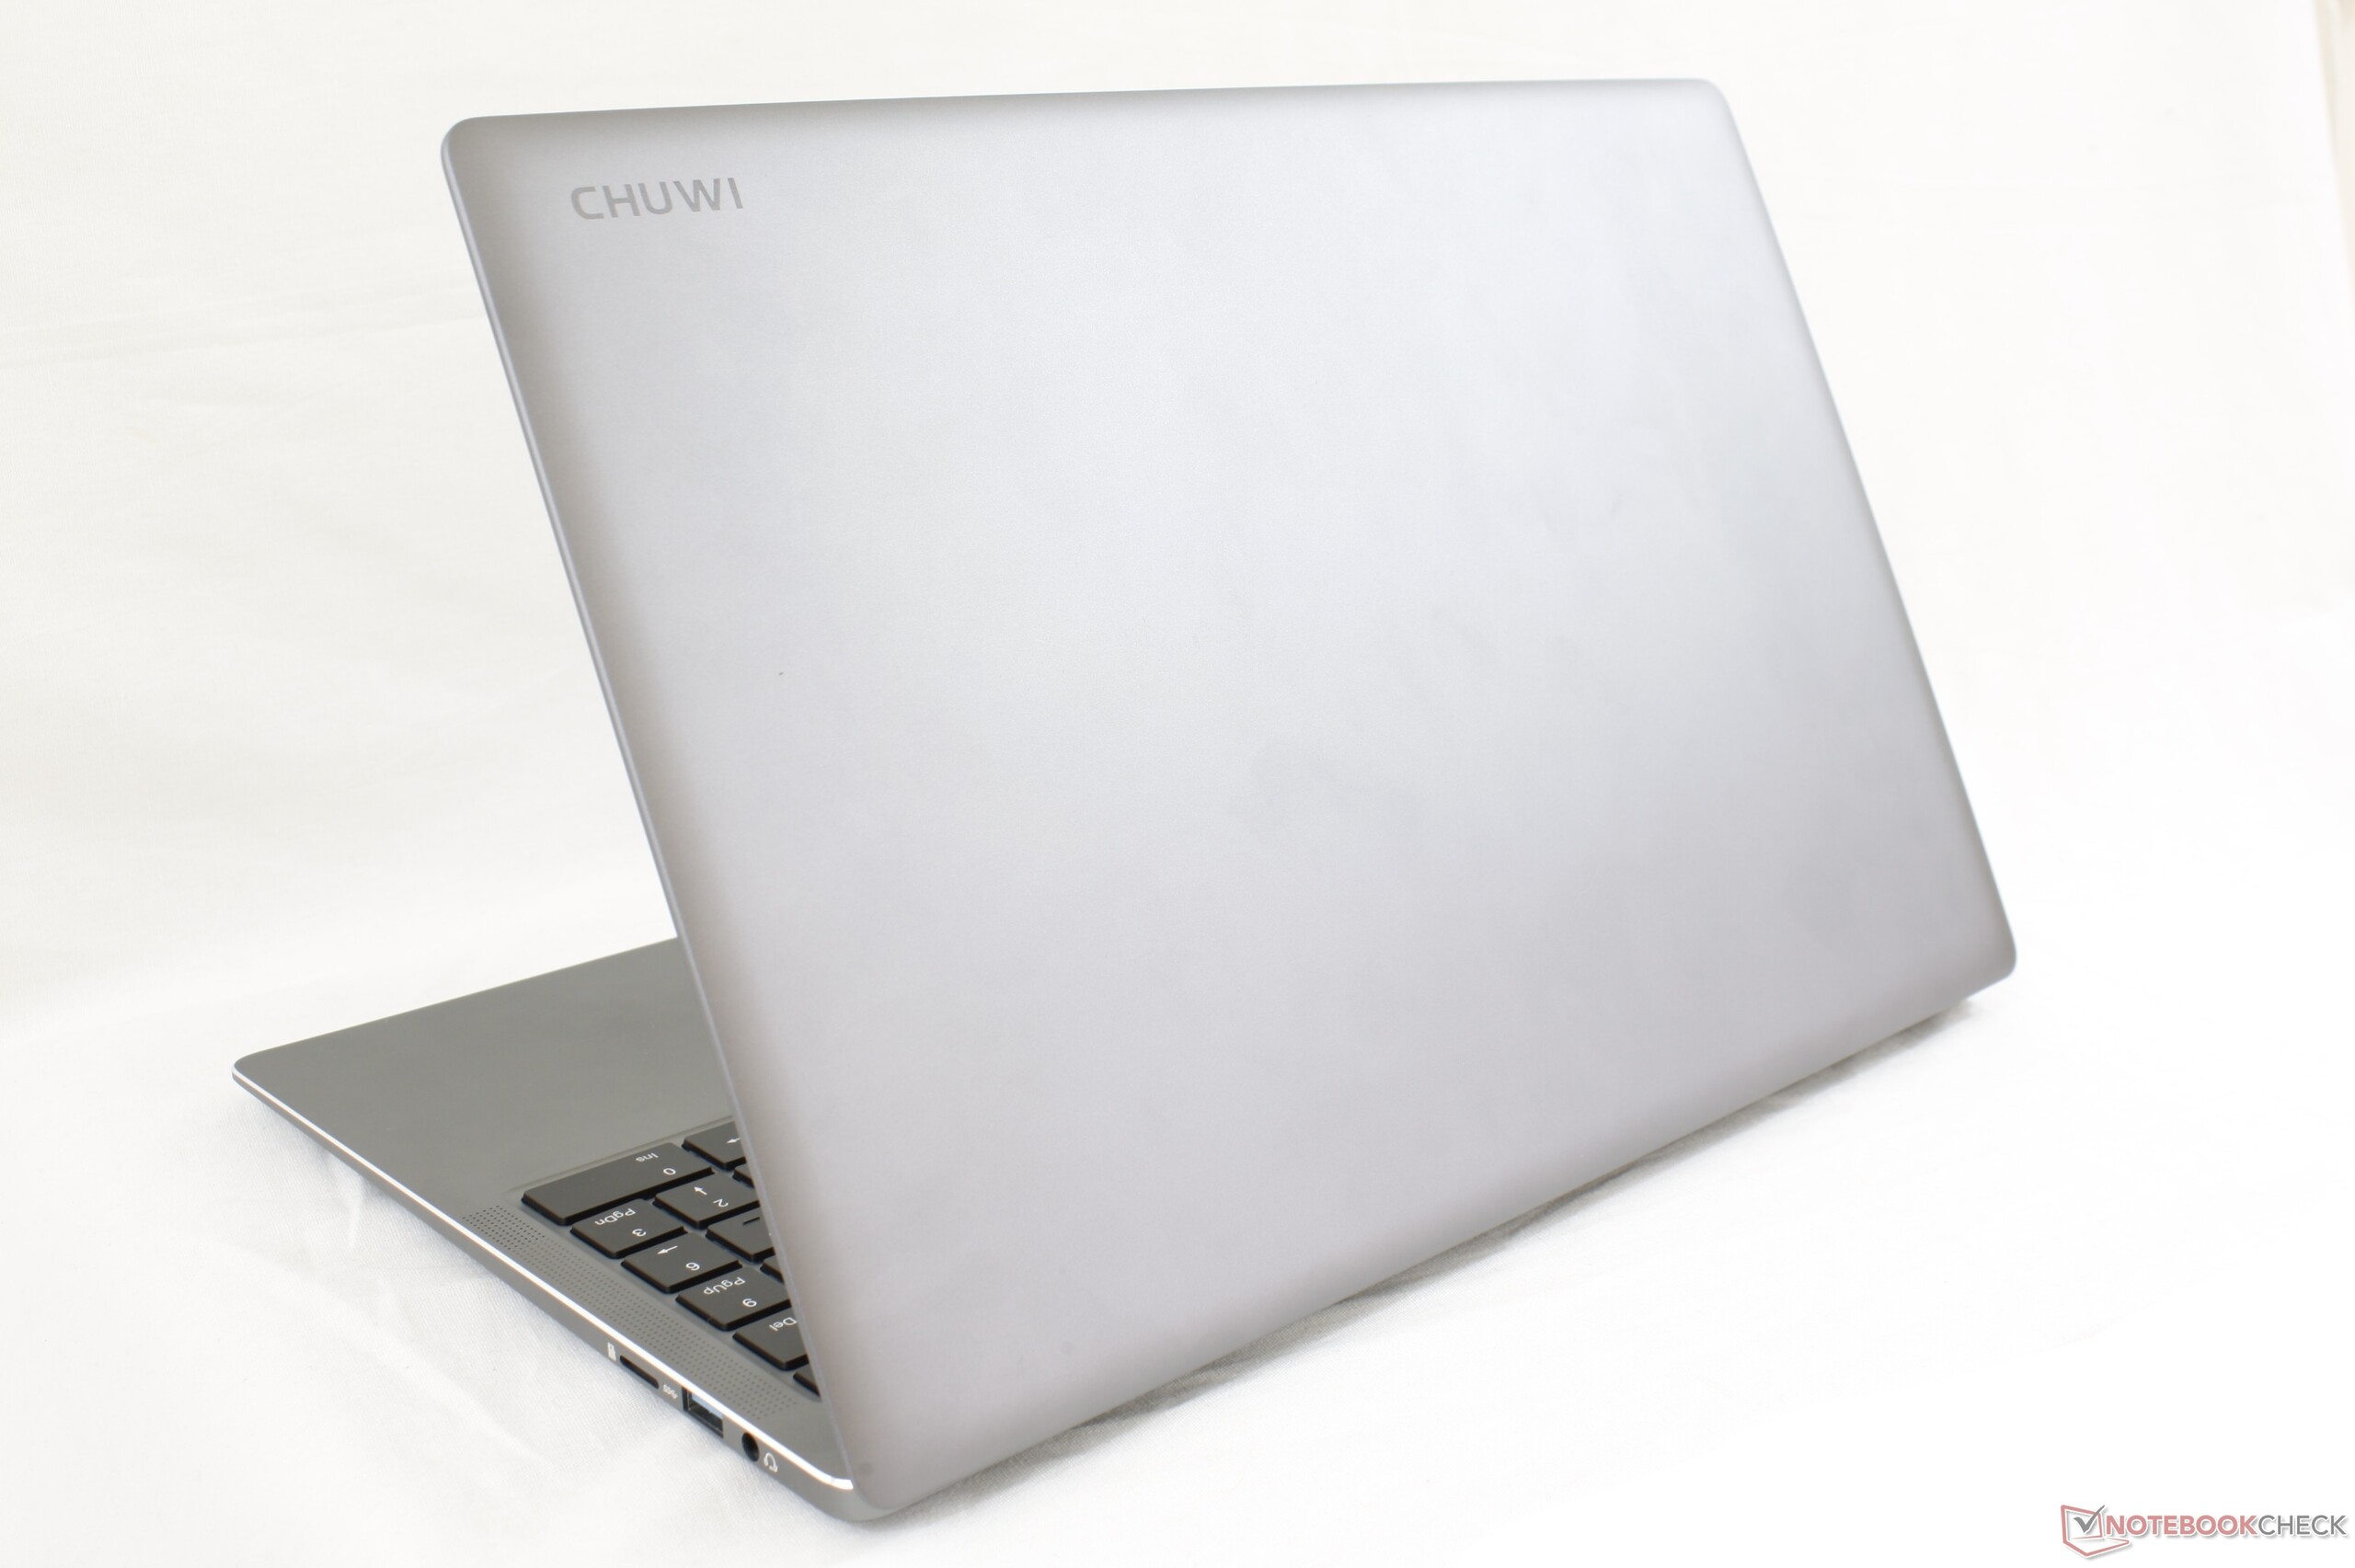
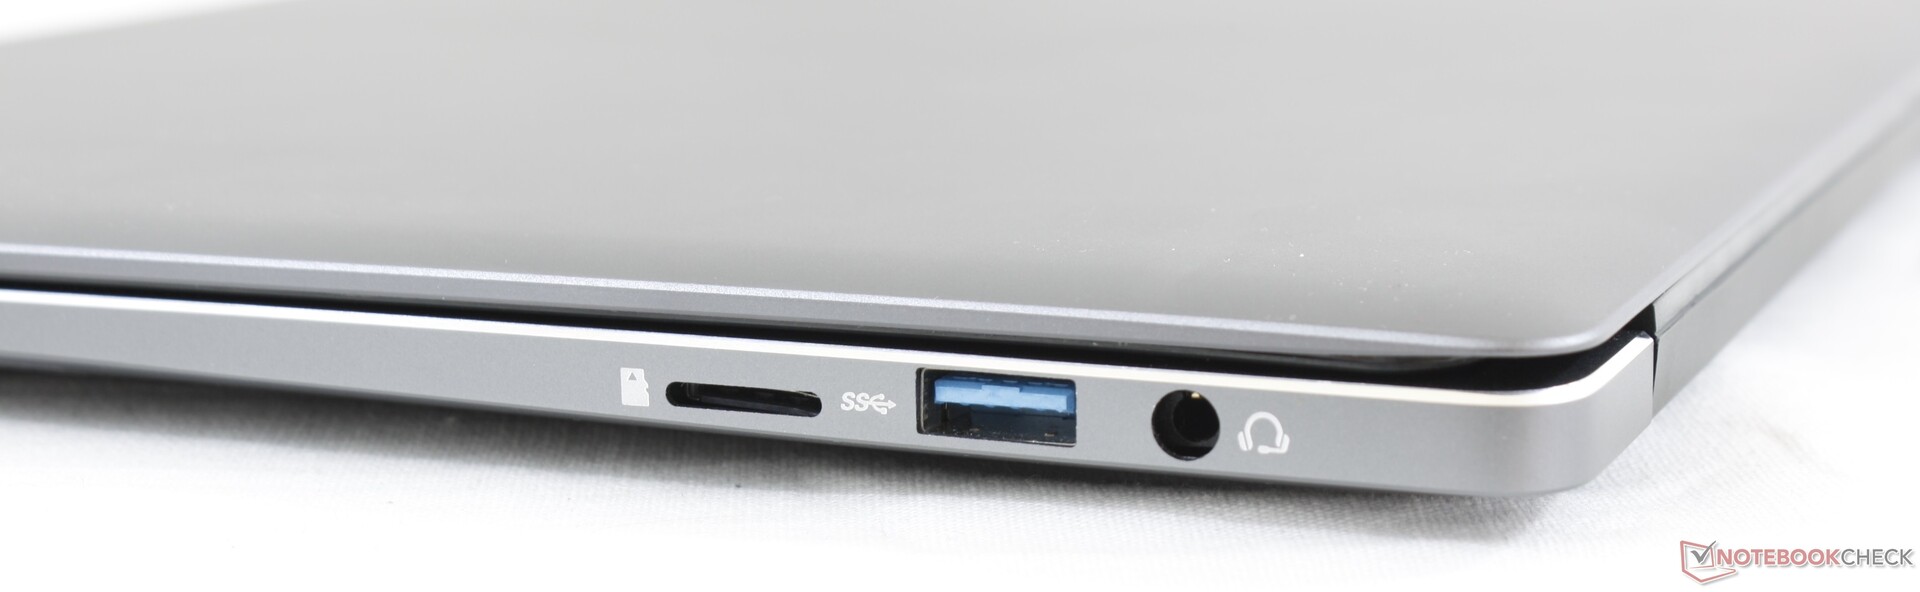
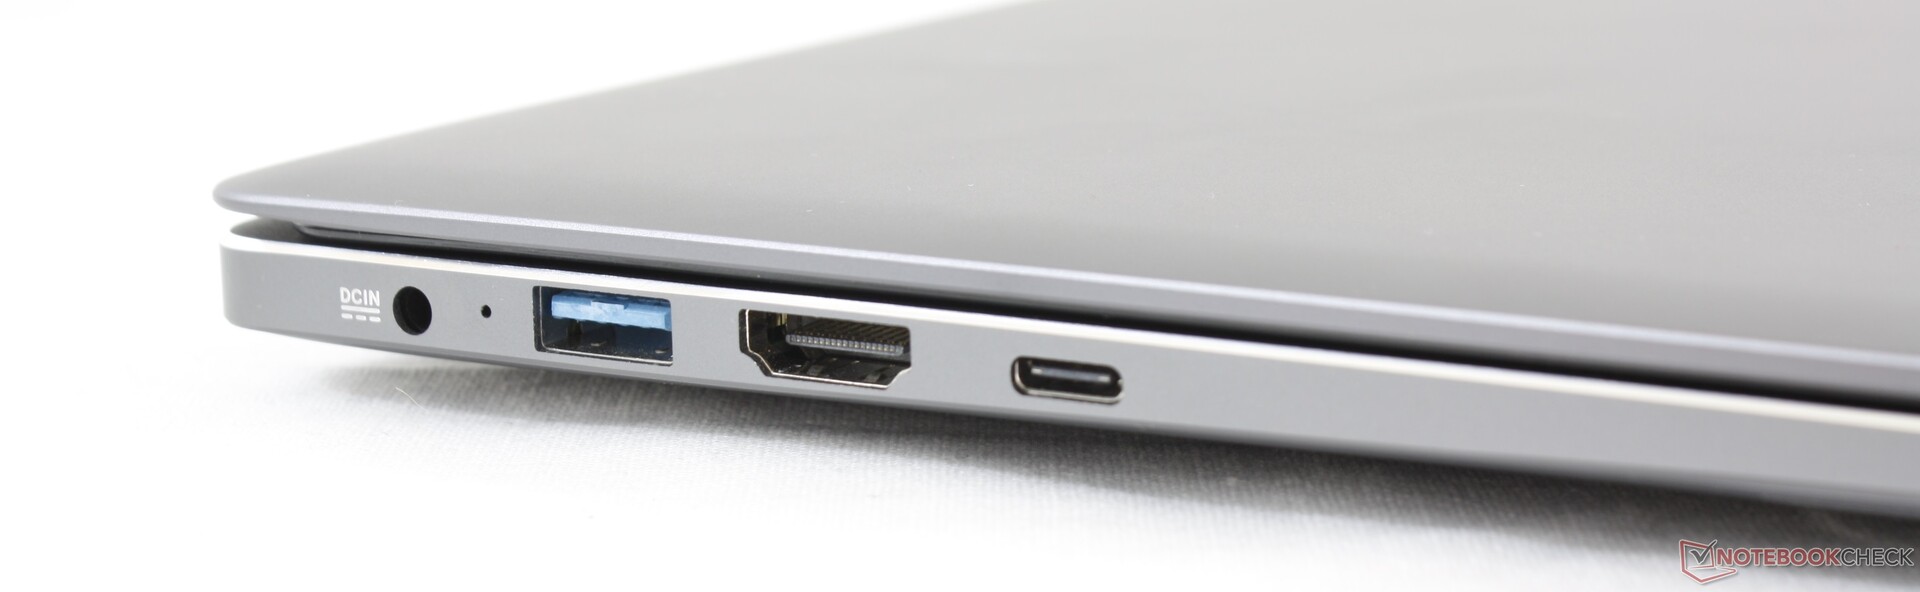
Er zijn een paar aspecten van het systeem die lof verdienen. Dankzij het zeer grote clickpad, de goede feedback van het toetsenbord, de royale selectie aan poorten en het aantrekkelijke visuele ontwerp onderscheidt de AeroBook Plus zich van de massa. Andere laptops in zijn prijsklasse zoals de Asus VivoBook, Dell Inspiron of HP Pavilion zijn meestal van plastic en minder slank.
Als je echt een Ultrabook met een 4K-scherm wilt, zonder al te diep in de buidel te tasten, raden we oudere Kaby Lake- of Kaby Lake-R-laptops van Dell, HP of Lenovo aan, omdat deze betere garantieopties en kwaliteitscontrole bieden.
Geweldige looks met een geweldig 4K-scherm. Bijna al de rest is slechts gemiddeld of gewoon defect, zoals het springerige klikpad, de zwakke scharnieren of toetsen die niet registreren.
Chuwi AeroBook Plus
- 22-05-2020 v7 (old)
Allen Ngo
Price comparison
