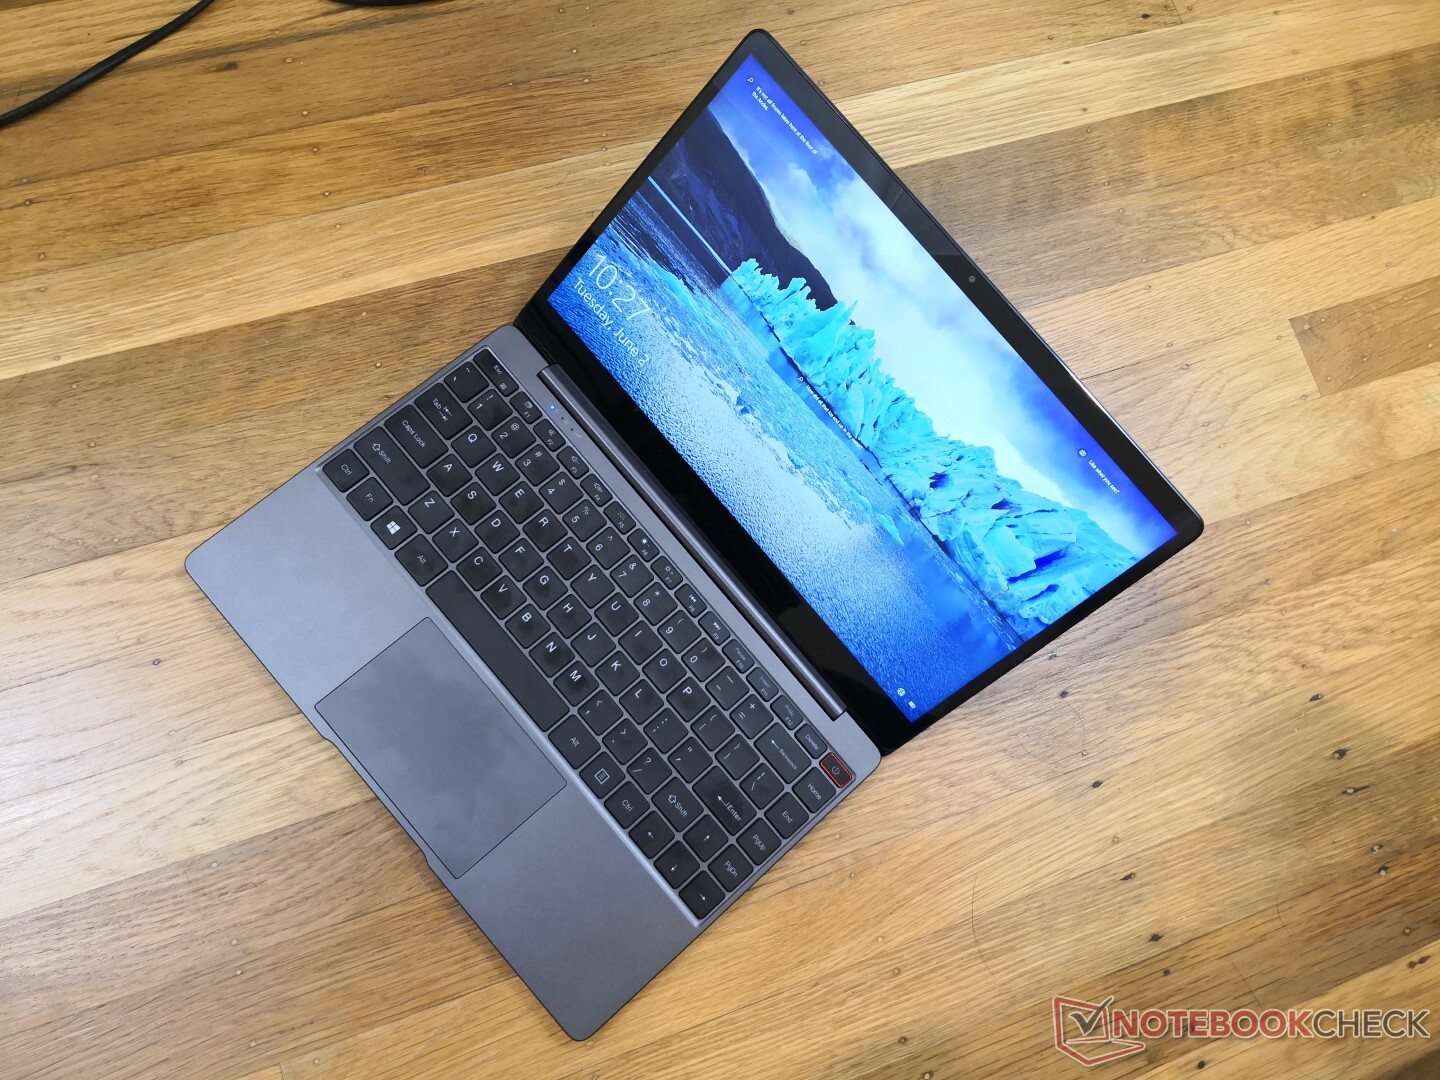
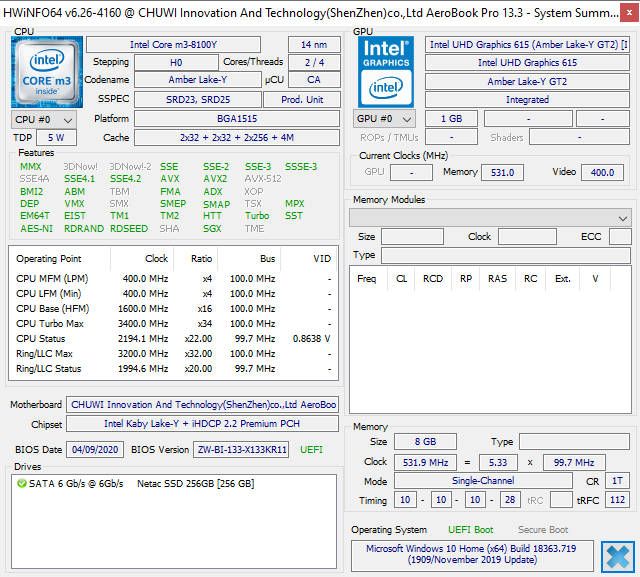
Kort testrapport Chuwi AeroBook Pro Laptop: Core m3 toont zijn leeftijd
Evaluatie | Datum | Model | Gewicht | Hoogte | Formaat | Resolutie | Beste prijs |
|---|---|---|---|---|---|---|---|
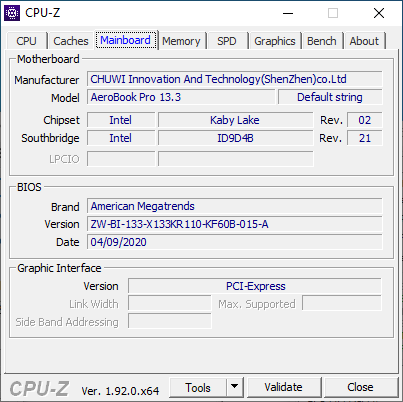
| 77.7 % v7 (old) | 06-2020 | Chuwi AeroBook Pro m3-8100Y, UHD Graphics 615 | 1.3 kg | 15.2 mm | 13.30" | 1920x1080 | |
| 88 % v7 (old) | 04-2020 | Apple MacBook Air 2020 i5 i5-1030NG7, Iris Plus Graphics G7 (Ice Lake 64 EU) | 1.3 kg | 16.1 mm | 13.30" | 2560x1600 | |
| 88.8 % v7 (old) | 03-2020 | Dell XPS 13 9300 i5 FHD i5-1035G1, UHD Graphics G1 (Ice Lake 32 EU) | 1.2 kg | 14.8 mm | 13.40" | 1920x1200 | |
| 84.6 % v6 (old) | 01-2018 | Lenovo Yoga 720-12IKB i5-7200U, HD Graphics 620 | 1.2 kg | 15.8 mm | 12.50" | 1920x1080 | |
| 67.7 % v7 (old) | 04-2020 | Jumper EZbook X3 Celeron N3350, HD Graphics 500 | 1.3 kg | 18 mm | 13.30" | 1920x1080 | |
| 86.6 % v6 (old) | 03-2019 | Lenovo Ideapad S530-13IWL i5-8265U, UHD Graphics 620 | 1.2 kg | 14.8 mm | 13.30" | 1920x1080 |
| SD Card Reader | |
| average JPG Copy Test (av. of 3 runs) | |
| Dell XPS 13 9300 i5 FHD (Toshiba Exceria Pro M501 64 GB UHS-II) | |
| Chuwi AeroBook Pro (Toshiba Exceria Pro M501 64 GB UHS-II) | |
| Jumper EZbook X3 | |
| maximum AS SSD Seq Read Test (1GB) | |
| Dell XPS 13 9300 i5 FHD (Toshiba Exceria Pro M501 64 GB UHS-II) | |
| Chuwi AeroBook Pro (Toshiba Exceria Pro M501 64 GB UHS-II) | |
| Jumper EZbook X3 | |
| Networking | |
| iperf3 transmit AX12 | |
| Dell XPS 13 9300 i5 FHD | |
| Apple MacBook Air 2020 i5 | |
| Jumper EZbook X3 | |
| Chuwi AeroBook Pro | |
| iperf3 receive AX12 | |
| Dell XPS 13 9300 i5 FHD | |
| Apple MacBook Air 2020 i5 | |
| Chuwi AeroBook Pro | |
| Jumper EZbook X3 | |


| |||||||||||||||||||||||||
Helderheidsverdeling: 88 %
Helderheid in Batterij-modus: 242.3 cd/m²
Contrast: 782:1 (Zwart: 0.31 cd/m²)
ΔE ColorChecker Calman: 6.72 | ∀{0.5-29.43 Ø4.71}
calibrated: 3.95
ΔE Greyscale Calman: 6 | ∀{0.09-98 Ø4.96}
87.7% sRGB (Argyll 1.6.3 3D)
57.5% AdobeRGB 1998 (Argyll 1.6.3 3D)
64.4% AdobeRGB 1998 (Argyll 3D)
88% sRGB (Argyll 3D)
68.7% Display P3 (Argyll 3D)
Gamma: 2.18
CCT: 7159 K
| Chuwi AeroBook Pro BOE NV133FHM-N6A, IPS, 13.3", 1920x1080 | Apple MacBook Air 2020 i5 APPA042, IPS, 13.3", 2560x1600 | Dell XPS 13 9300 i5 FHD SHP14CB, IPS, 13.4", 1920x1200 | Jumper EZbook X3 PBTB133F006 A, IPS, 13.3", 1920x1080 | Lenovo Ideapad S530-13IWL BOE07D7, IPS, 13.3", 1920x1080 | |
|---|---|---|---|---|---|
| Display | 8% | 10% | -5% | 1% | |
| Display P3 Coverage (%) | 68.7 | 70.4 2% | 71.5 4% | 60.4 -12% | 68.6 0% |
| sRGB Coverage (%) | 88 | 97.7 11% | 99.4 13% | 88.7 1% | 89.7 2% |
| AdobeRGB 1998 Coverage (%) | 64.4 | 71.7 11% | 73.5 14% | 61.7 -4% | 65.6 2% |
| Response Times | -10% | -49% | -7% | -13% | |
| Response Time Grey 50% / Grey 80% * (ms) | 31 ? | 38.7 ? -25% | 60 ? -94% | 34 ? -10% | 41 ? -32% |
| Response Time Black / White * (ms) | 32 ? | 30.44 ? 5% | 33.2 ? -4% | 33 ? -3% | 30 ? 6% |
| PWM Frequency (Hz) | 201.6 ? | 117000 ? | 2500 ? | 192 ? | |
| Screen | 47% | 57% | -1% | 18% | |
| Brightness middle (cd/m²) | 242.3 | 430 77% | 619 155% | 209 -14% | 306 26% |
| Brightness (cd/m²) | 233 | 405 74% | 591 154% | 203 -13% | 287 23% |
| Brightness Distribution (%) | 88 | 89 1% | 91 3% | 95 8% | 78 -11% |
| Black Level * (cd/m²) | 0.31 | 0.32 -3% | 0.35 -13% | 0.2 35% | 0.21 32% |
| Contrast (:1) | 782 | 1344 72% | 1769 126% | 1045 34% | 1457 86% |
| Colorchecker dE 2000 * | 6.72 | 1.8 73% | 3 55% | 8.43 -25% | 5.96 11% |
| Colorchecker dE 2000 max. * | 11.67 | 4.6 61% | 8.2 30% | 14.77 -27% | 11.34 3% |
| Colorchecker dE 2000 calibrated * | 3.95 | 1.6 59% | 1 75% | 1.68 57% | 2.69 32% |
| Greyscale dE 2000 * | 6 | 1.1 82% | 5.2 13% | 9.81 -64% | 6.9 -15% |
| Gamma | 2.18 101% | 2.14 103% | 2.46 89% | 2.35 94% | |
| CCT | 7159 91% | 6644 98% | 6340 103% | 10135 64% | 7554 86% |
| Color Space (Percent of AdobeRGB 1998) (%) | 57.5 | 64.2 12% | 66.9 16% | 57 -1% | 59 3% |
| Color Space (Percent of sRGB) (%) | 87.7 | 97.6 11% | 99.3 13% | 89 1% | 90 3% |
| Totaal Gemiddelde (Programma / Instellingen) | 15% /
33% | 6% /
35% | -4% /
-2% | 2% /
11% |
* ... kleiner is beter
Responstijd Scherm
| ↔ Responstijd Zwart naar Wit | ||
|---|---|---|
| 32 ms ... stijging ↗ en daling ↘ gecombineerd | ↗ 16 ms stijging | 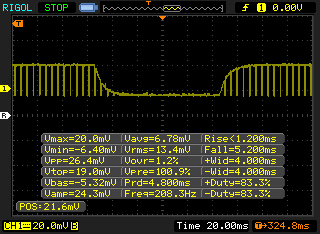 |
| ↘ 16 ms daling | ||
| Het scherm vertoonde trage responstijden in onze tests en is misschien te traag voor games. Ter vergelijking: alle testtoestellen variëren van 0.1 (minimum) tot 240 (maximum) ms. » 86 % van alle toestellen zijn beter. Dit betekent dat de gemeten responstijd slechter is dan het gemiddelde (19.8 ms) van alle geteste toestellen. | ||
| ↔ Responstijd 50% Grijs naar 80% Grijs | ||
| 31 ms ... stijging ↗ en daling ↘ gecombineerd | ↗ 16 ms stijging | 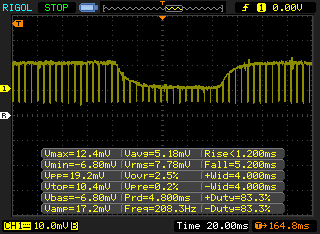 |
| ↘ 15 ms daling | ||
| Het scherm vertoonde trage responstijden in onze tests en is misschien te traag voor games. Ter vergelijking: alle testtoestellen variëren van 0.165 (minimum) tot 636 (maximum) ms. » 42 % van alle toestellen zijn beter. Dit betekent dat de gemeten responstijd vergelijkbaar is met het gemiddelde (30.9 ms) van alle geteste toestellen. | ||
Screen Flickering / PWM (Pulse-Width Modulation)
| Screen flickering / PWM waargenomen | 201.6 Hz | ≤ 100 % helderheid instelling | 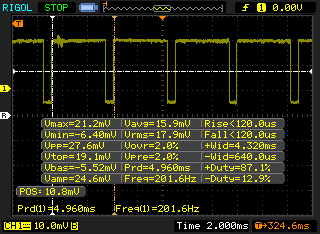 |
De achtergrondverlichting van het scherm flikkert op 201.6 Hz (in het slechtste geval, bijvoorbeeld bij gebruik van PWM) aan een helderheid van 100 % en lager. Boven deze helderheid zou er geen flickering / PWM mogen optreden. De frequentie van 201.6 Hz is redelijk laag en de meeste mensen die gevoelig zijn aan flickering kunnen dit dus waarnemen of geïrriteerde ogen krijgen (gebruikmakend van de vermelde helderheid en lager). Ter vergelijking: 52 % van alle geteste toestellen maakten geen gebruik van PWM om de schermhelderheid te verlagen. Als het wel werd gebruikt, werd een gemiddelde van 7741 (minimum: 5 - maximum: 343500) Hz waargenomen. | |||
Cinebench R20: CPU (Multi Core) | CPU (Single Core)
Blender: v2.79 BMW27 CPU
7-Zip 18.03: 7z b 4 -mmt1 | 7z b 4
Geekbench 5.5: Single-Core | Multi-Core
HWBOT x265 Benchmark v2.2: 4k Preset
LibreOffice : 20 Documents To PDF
R Benchmark 2.5: Overall mean
| Cinebench R15 / CPU Multi 64Bit | |
| Dynabook Portege X30L-G1331 | |
| Dell Latitude 3400 | |
| Apple MacBook Air 2020 i3 | |
| HP Pavilion x360 14-cd0002ng | |
| Lenovo Thinkpad 13-20J1001BUS | |
| HP EliteBook Folio G1 V1C37EA | |
| Eve-Tech Eve V m3 | |
| Medion Akoya P3401T 2in1 | |
| Chuwi AeroBook 13 inch 2019 | |
| Gemiddeld Intel Core m3-8100Y (157 - 247, n=4) | |
| Chuwi UBook CWI509 | |
| Chuwi AeroBook Pro | |
| Jumper EZbook X3 | |
| Cinebench R15 / CPU Single 64Bit | |
| Dynabook Portege X30L-G1331 | |
| Dell Latitude 3400 | |
| Apple MacBook Air 2020 i3 | |
| HP Pavilion x360 14-cd0002ng | |
| HP EliteBook Folio G1 V1C37EA | |
| Eve-Tech Eve V m3 | |
| Medion Akoya P3401T 2in1 | |
| Gemiddeld Intel Core m3-8100Y (91 - 121, n=4) | |
| Chuwi AeroBook Pro | |
| Lenovo Thinkpad 13-20J1001BUS | |
| Chuwi UBook CWI509 | |
| Chuwi AeroBook 13 inch 2019 | |
| Jumper EZbook X3 | |
| Cinebench R20 / CPU (Multi Core) | |
| Dynabook Portege X30L-G1331 | |
| Dell Latitude 3400 | |
| Apple MacBook Air 2020 i3 | |
| Gemiddeld Intel Core m3-8100Y (382 - 527, n=3) | |
| Chuwi UBook CWI509 | |
| Chuwi AeroBook Pro | |
| Jumper EZbook X3 | |
| Cinebench R20 / CPU (Single Core) | |
| Dynabook Portege X30L-G1331 | |
| Apple MacBook Air 2020 i3 | |
| Dell Latitude 3400 | |
| Gemiddeld Intel Core m3-8100Y (232 - 298, n=3) | |
| Chuwi AeroBook Pro | |
| Chuwi UBook CWI509 | |
| Jumper EZbook X3 | |
| Blender / v2.79 BMW27 CPU | |
| Jumper EZbook X3 | |
| Chuwi AeroBook Pro | |
| Gemiddeld Intel Core m3-8100Y (1893 - 2519, n=2) | |
| Apple MacBook Air 2020 i3 | |
| Eve-Tech Eve V m3 | |
| Dynabook Portege X30L-G1331 | |
| 7-Zip 18.03 / 7z b 4 -mmt1 | |
| Dynabook Portege X30L-G1331 | |
| Apple MacBook Air 2020 i3 | |
| Gemiddeld Intel Core m3-8100Y (2683 - 3282, n=2) | |
| Chuwi AeroBook Pro | |
| Jumper EZbook X3 | |
| 7-Zip 18.03 / 7z b 4 | |
| Dynabook Portege X30L-G1331 | |
| Apple MacBook Air 2020 i3 | |
| Gemiddeld Intel Core m3-8100Y (4937 - 7554, n=2) | |
| Chuwi AeroBook Pro | |
| Jumper EZbook X3 | |
| Geekbench 5.5 / Single-Core | |
| Apple MacBook Air 2020 i3 | |
| Dynabook Portege X30L-G1331 | |
| Gemiddeld Intel Core m3-8100Y (809 - 882, n=2) | |
| Chuwi AeroBook Pro | |
| Jumper EZbook X3 | |
| Geekbench 5.5 / Multi-Core | |
| Dynabook Portege X30L-G1331 | |
| Apple MacBook Air 2020 i3 | |
| Gemiddeld Intel Core m3-8100Y (1178 - 1615, n=2) | |
| Chuwi AeroBook Pro | |
| Jumper EZbook X3 | |
| HWBOT x265 Benchmark v2.2 / 4k Preset | |
| Dynabook Portege X30L-G1331 | |
| Apple MacBook Air 2020 i3 | |
| Gemiddeld Intel Core m3-8100Y (1.42 - 1.96, n=2) | |
| Chuwi AeroBook Pro | |
| Jumper EZbook X3 | |
| LibreOffice / 20 Documents To PDF | |
| Jumper EZbook X3 | |
| Chuwi AeroBook Pro | |
| Gemiddeld Intel Core m3-8100Y (85.4 - 128, n=2) | |
| Apple MacBook Air 2020 i3 | |
| Dynabook Portege X30L-G1331 | |
| R Benchmark 2.5 / Overall mean | |
| Jumper EZbook X3 | |
| Chuwi AeroBook Pro | |
| Gemiddeld Intel Core m3-8100Y (0.942 - 1.204, n=2) | |
| Apple MacBook Air 2020 i3 | |
| Dynabook Portege X30L-G1331 | |
Cinebench R20: CPU (Multi Core) | CPU (Single Core)
Blender: v2.79 BMW27 CPU
7-Zip 18.03: 7z b 4 -mmt1 | 7z b 4
Geekbench 5.5: Single-Core | Multi-Core
HWBOT x265 Benchmark v2.2: 4k Preset
LibreOffice : 20 Documents To PDF
R Benchmark 2.5: Overall mean
* ... kleiner is beter
| PCMark 8 Home Score Accelerated v2 | 2280 punten | |
| PCMark 8 Work Score Accelerated v2 | 3805 punten | |
| PCMark 10 Score | 2447 punten | |
Help | ||
| DPC Latencies / LatencyMon - interrupt to process latency (max), Web, Youtube, Prime95 | |
| Chuwi AeroBook Pro | |
| Apple MacBook Air 2020 i5 | |
| Dell XPS 13 9300 i5 FHD | |
* ... kleiner is beter
| Chuwi AeroBook Pro Netac SSD 256GB | Apple MacBook Air 2020 i5 Apple SSD AP0512 | Dell XPS 13 9300 i5 FHD Toshiba XG6 KXG60ZNV512G | Lenovo Yoga 720-12IKB Liteonit CV3-8D128 | Jumper EZbook X3 64 GB eMMC Flash | Lenovo Ideapad S530-13IWL Lenovo UMIS AM610 RPFTJ256PDD2MWX | |
|---|---|---|---|---|---|---|
| AS SSD | 73% | 229% | -11% | -93% | 132% | |
| Seq Read (MB/s) | 445.4 | 1153 159% | 2328 423% | 361.6 -19% | 246.2 -45% | 1377 209% |
| Seq Write (MB/s) | 418.9 | 1367 226% | 1137 171% | 240.8 -43% | 155.8 -63% | 805 92% |
| 4K Read (MB/s) | 22.81 | 12.95 -43% | 48.07 111% | 23.81 4% | 18.41 -19% | 45.01 97% |
| 4K Write (MB/s) | 83.3 | 24.52 -71% | 120.6 45% | 61.8 -26% | 22 -74% | 88.9 7% |
| 4K-64 Read (MB/s) | 180.6 | 665 268% | 899 398% | 232.6 29% | 22.45 -88% | 767 325% |
| 4K-64 Write (MB/s) | 281.5 | 159.5 -43% | 1220 333% | 89.3 -68% | 22.73 -92% | 611 117% |
| Access Time Read * (ms) | 0.113 | 0.295 -161% | 0.085 25% | 0.109 4% | 0.246 -118% | 0.141 -25% |
| Access Time Write * (ms) | 0.161 | 0.163 -1% | 0.033 80% | 0.067 58% | 0.621 -286% | 0.043 73% |
| Score Read (Points) | 248 | 793 220% | 1180 376% | 296 19% | 65 -74% | 950 283% |
| Score Write (Points) | 408 | 321 -21% | 1455 257% | 175 -57% | 60 -85% | 781 91% |
| Score Total (Points) | 789 | 1528 94% | 3189 304% | 620 -21% | 163 -79% | 2200 179% |
| Copy ISO MB/s (MB/s) | 410.8 | 1433 249% | ||||
| Copy Program MB/s (MB/s) | 204.4 | 363 78% | ||||
| Copy Game MB/s (MB/s) | 435.5 | 725 66% | ||||
| CrystalDiskMark 5.2 / 6 | 207% | -77% | 55% | |||
| Write 4K (MB/s) | 113.1 | 121.9 8% | 19.21 -83% | 101.5 -10% | ||
| Read 4K (MB/s) | 30.21 | 50 66% | 7.435 -75% | 44.47 47% | ||
| Write Seq (MB/s) | 439.8 | 1497 240% | 138.8 -68% | 603 37% | ||
| Read Seq (MB/s) | 536 | 2111 294% | 219.8 -59% | 686 28% | ||
| Write 4K Q32T1 (MB/s) | 279.1 | 365.9 31% | 24.39 -91% | 298.1 7% | ||
| Read 4K Q32T1 (MB/s) | 227.3 | 384.6 69% | 22.2 -90% | 358.7 58% | ||
| Write Seq Q32T1 (MB/s) | 469.7 | 2748 485% | 122.3 -74% | 872 86% | ||
| Read Seq Q32T1 (MB/s) | 555 | 3119 462% | 147.6 -73% | 1611 190% | ||
| Totaal Gemiddelde (Programma / Instellingen) | 73% /
73% | 218% /
220% | -11% /
-11% | -85% /
-86% | 94% /
100% |
* ... kleiner is beter

Disk Throttling: DiskSpd Read Loop, Queue Depth 8
| 3DMark 11 | |
| 1280x720 Performance GPU | |
| Schenker VIA 15 | |
| Chuwi AeroBook Plus | |
| HP 14s-dq1431ng | |
| Dell XPS 15 9500 Core i5 | |
| Dell Latitude 3400 | |
| Acer Swift 7 SF714-52T-76MR | |
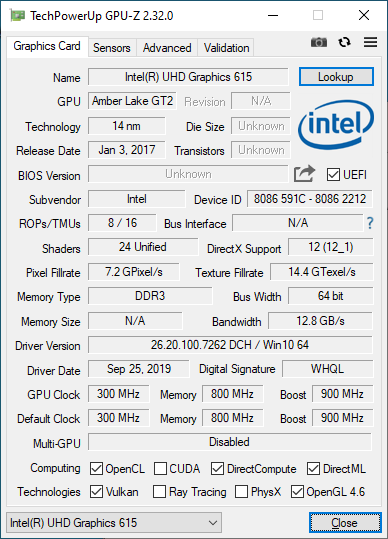
| Gemiddeld Intel UHD Graphics 615 (821 - 1378, n=10) | |
| Chuwi AeroBook 13 inch 2019 | |
| Chuwi AeroBook Pro | |
| Trekstor Primetab T13B | |
| 1280x720 Performance Combined | |
| HP 14s-dq1431ng | |
| Chuwi AeroBook Plus | |
| Schenker VIA 15 | |
| Dell XPS 15 9500 Core i5 | |
| Dell Latitude 3400 | |
| Gemiddeld Intel UHD Graphics 615 (734 - 1294, n=10) | |
| Acer Swift 7 SF714-52T-76MR | |
| Chuwi AeroBook 13 inch 2019 | |
| Chuwi AeroBook Pro | |
| Trekstor Primetab T13B | |
| 3DMark | |
| 1280x720 Cloud Gate Standard Graphics | |
| Chuwi AeroBook Plus | |
| HP 14s-dq1431ng | |
| Dell XPS 15 9500 Core i5 | |
| Dell Latitude 3400 | |
| Acer Swift 7 SF714-52T-76MR | |
| Gemiddeld Intel UHD Graphics 615 (4521 - 7568, n=10) | |
| Chuwi AeroBook 13 inch 2019 | |
| Chuwi AeroBook Pro | |
| 1920x1080 Fire Strike Graphics | |
| Chuwi AeroBook Plus | |
| HP 14s-dq1431ng | |
| Dell XPS 15 9500 Core i5 | |
| Acer Swift 7 SF714-52T-76MR | |
| Dell Latitude 3400 | |
| Gemiddeld Intel UHD Graphics 615 (563 - 976, n=11) | |
| Chuwi AeroBook 13 inch 2019 | |
| Chuwi AeroBook Pro | |
| Jumper EZbook X3 | |
| 1920x1080 Ice Storm Extreme Graphics | |
| Chuwi AeroBook Plus | |
| Dell XPS 15 9500 Core i5 | |
| Dell Latitude 3400 | |
| Gemiddeld Intel UHD Graphics 615 (23099 - 35452, n=6) | |
| Acer Swift 7 SF714-52T-76MR | |
| Chuwi AeroBook Pro | |
| Acer Chromebook 514 CB514-1HT-P1BM | |
| 3DMark 11 Performance | 1021 punten | |
| 3DMark Cloud Gate Standard Score | 3689 punten | |
| 3DMark Fire Strike Score | 588 punten | |
| 3DMark Time Spy Score | 232 punten | |
Help | ||
| lage | gem. | hoge | ultra | |
|---|---|---|---|---|
| Dota 2 Reborn (2015) | 40.8 | 17.7 | 8.5 | 7.6 |
| X-Plane 11.11 (2018) | 10 | 7.2 |
(±) De maximumtemperatuur aan de bovenzijde bedraagt 44.2 °C / 112 F, vergeleken met het gemiddelde van 35.9 °C / 97 F, variërend van 21.4 tot 59 °C voor de klasse Subnotebook.
(-) De bodem warmt op tot een maximum van 49 °C / 120 F, vergeleken met een gemiddelde van 39.2 °C / 103 F
(+) Bij onbelast gebruik bedraagt de gemiddelde temperatuur voor de bovenzijde 27.2 °C / 81 F, vergeleken met het apparaatgemiddelde van 30.8 °C / 87 F.
(±) De palmsteunen en het touchpad kunnen zeer heet aanvoelen met een maximum van ###max## °C / 99.3 F.
(-) De gemiddelde temperatuur van de handpalmsteun van soortgelijke toestellen bedroeg 28.2 °C / 82.8 F (-9.2 °C / -16.5 F).
Chuwi AeroBook Pro audioanalyse
(+) | luidsprekers kunnen relatief luid spelen (82.8 dB)
Bas 100 - 315 Hz
(-) | bijna geen lage tonen - gemiddeld 24.7% lager dan de mediaan
(+) | de lage tonen zijn lineair (4.8% delta naar de vorige frequentie)
Midden 400 - 2000 Hz
(±) | lagere middens - gemiddeld 7.2% lager dan de mediaan
(±) | lineariteit van de middentonen is gemiddeld (10.8% delta ten opzichte van de vorige frequentie)
Hoog 2 - 16 kHz
(±) | higher highs - on average 9.4% higher than median
(±) | lineariteit van de hoogtepunten is gemiddeld (12% delta ten opzichte van de vorige frequentie)
Algemeen 100 - 16.000 Hz
(-) | het totale geluid is niet lineair (37.3% verschil met de mediaan)
Vergeleken met dezelfde klasse
» 97% van alle geteste apparaten in deze klasse waren beter, 1% vergelijkbaar, 1% slechter
» De beste had een delta van 5%, het gemiddelde was 18%, de slechtste was 53%
Vergeleken met alle geteste toestellen
» 94% van alle geteste apparaten waren beter, 1% gelijk, 5% slechter
» De beste had een delta van 4%, het gemiddelde was 23%, de slechtste was 134%
Apple MacBook 12 (Early 2016) 1.1 GHz audioanalyse
(+) | luidsprekers kunnen relatief luid spelen (83.6 dB)
Bas 100 - 315 Hz
(±) | verminderde zeebaars - gemiddeld 11.3% lager dan de mediaan
(±) | lineariteit van de lage tonen is gemiddeld (14.2% delta ten opzichte van de vorige frequentie)
Midden 400 - 2000 Hz
(+) | evenwichtige middens - slechts 2.4% verwijderd van de mediaan
(+) | de middentonen zijn lineair (5.5% delta ten opzichte van de vorige frequentie)
Hoog 2 - 16 kHz
(+) | evenwichtige hoogtepunten - slechts 2% verwijderd van de mediaan
(+) | de hoge tonen zijn lineair (4.5% delta naar de vorige frequentie)
Algemeen 100 - 16.000 Hz
(+) | het totale geluid is lineair (10.2% verschil met de mediaan)
Vergeleken met dezelfde klasse
» 7% van alle geteste apparaten in deze klasse waren beter, 2% vergelijkbaar, 90% slechter
» De beste had een delta van 5%, het gemiddelde was 18%, de slechtste was 53%
Vergeleken met alle geteste toestellen
» 5% van alle geteste apparaten waren beter, 1% gelijk, 94% slechter
» De beste had een delta van 4%, het gemiddelde was 23%, de slechtste was 134%
| Uit / Standby | |
| Inactief | |
| Belasting |
|
Key:
min: | |
| Chuwi AeroBook Pro m3-8100Y, UHD Graphics 615, Netac SSD 256GB, IPS, 1920x1080, 13.3" | Apple MacBook Air 2020 i5 i5-1030NG7, Iris Plus Graphics G7 (Ice Lake 64 EU), Apple SSD AP0512, IPS, 2560x1600, 13.3" | Dell XPS 13 9300 i5 FHD i5-1035G1, UHD Graphics G1 (Ice Lake 32 EU), Toshiba XG6 KXG60ZNV512G, IPS, 1920x1200, 13.4" | Lenovo Yoga 720-12IKB i5-7200U, HD Graphics 620, Liteonit CV3-8D128, IPS, 1920x1080, 12.5" | Jumper EZbook X3 Celeron N3350, HD Graphics 500, 64 GB eMMC Flash, IPS, 1920x1080, 13.3" | Lenovo Ideapad S530-13IWL i5-8265U, UHD Graphics 620, Lenovo UMIS AM610 RPFTJ256PDD2MWX, IPS, 1920x1080, 13.3" | |
|---|---|---|---|---|---|---|
| Power Consumption | 0% | -27% | 3% | 32% | -27% | |
| Idle Minimum * (Watt) | 5.7 | 2.4 58% | 3.4 40% | 3.7 35% | 3.3 42% | 2.8 51% |
| Idle Average * (Watt) | 8.2 | 6.8 17% | 6 27% | 5.7 30% | 6.4 22% | 5.6 32% |
| Idle Maximum * (Watt) | 9.2 | 10.5 -14% | 10.2 -11% | 6.9 25% | 7 24% | 7.4 20% |
| Load Average * (Watt) | 17.5 | 25.7 -47% | 36.6 -109% | 29.6 -69% | 13.4 23% | 41.6 -138% |
| Load Maximum * (Watt) | 27.2 | 30.4 -12% | 49.3 -81% | 29.4 -8% | 14 49% | 55 -102% |
| Witcher 3 ultra * (Watt) | 24.5 |
* ... kleiner is beter
| Chuwi AeroBook Pro m3-8100Y, UHD Graphics 615, 38 Wh | Apple MacBook Air 2020 i5 i5-1030NG7, Iris Plus Graphics G7 (Ice Lake 64 EU), 49.9 Wh | Dell XPS 13 9300 i5 FHD i5-1035G1, UHD Graphics G1 (Ice Lake 32 EU), 52 Wh | Lenovo Yoga 720-12IKB i5-7200U, HD Graphics 620, 36 Wh | Jumper EZbook X3 Celeron N3350, HD Graphics 500, 34.9 Wh | Lenovo Ideapad S530-13IWL i5-8265U, UHD Graphics 620, 45 Wh | |
|---|---|---|---|---|---|---|
| Batterijduur | 106% | 134% | 20% | 58% | 32% | |
| WiFi v1.3 (h) | 5 | 10.3 106% | 11.7 134% | 6 20% | 7.9 58% | 6.6 32% |
| Load (h) | 2.9 | 3.4 | 1.5 | 1.3 | ||
| Reader / Idle (h) | 11.5 | 13.5 |
Pro
Contra
Voor het volledige, Engelse testrapport, klik hier.
Een upgrade van AeroBook naar AeroBook Pro zou upgrades over de hele linie moeten betekenen. Helaas is de AeroBook Pro ondanks de processorswap in wezen hetzelfde en zijn de schermveranderingen eigenlijk een downgrade. Systeemprestaties blijven ongelooflijk traag tot het punt dat zelfs lichte multitasking als een last voelt.
Als je op zoek bent naar een goedkope Ultrabook om je te redden, investeer dan in een oudere generatie Core U-serie laptop zoals de Dell XPS 13, HP Spectre 13 of Asus ZenBook 13. Zelfs een Core i3 2016-tijdperk configuratie zal beide langer meegaan en beter presteren dan de AeroBook Pro zonder dat het veel meer kost.
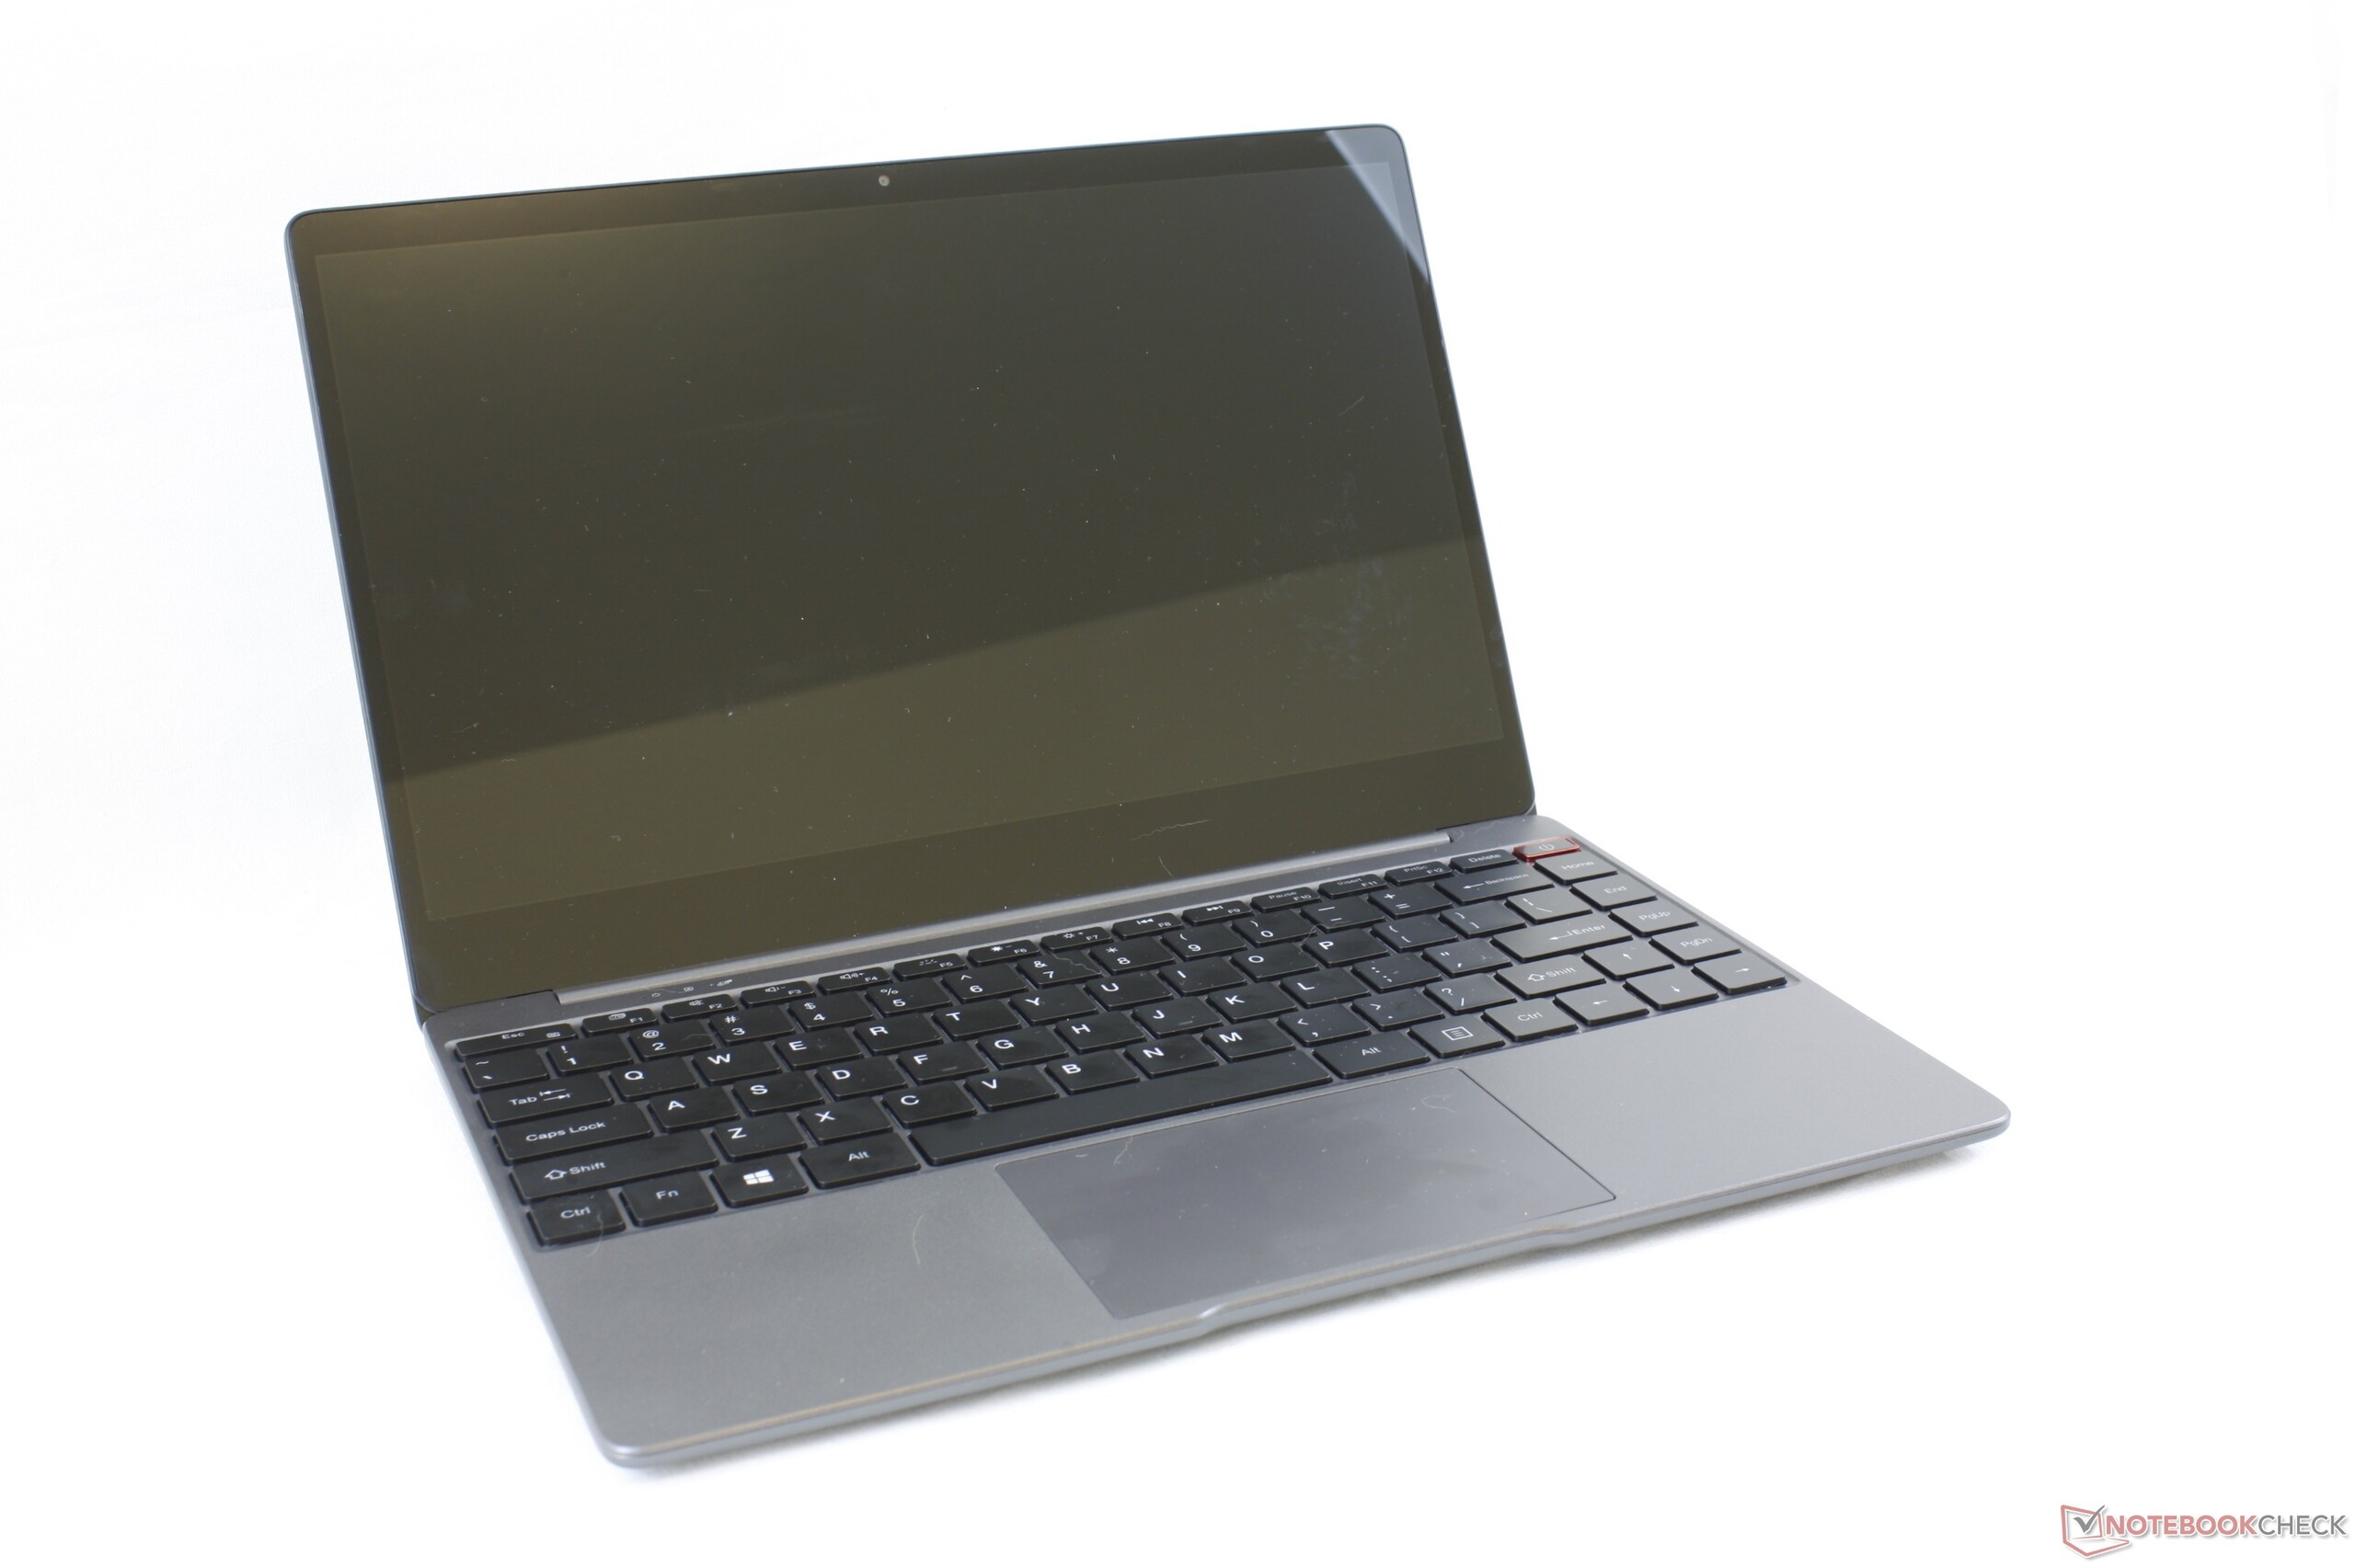
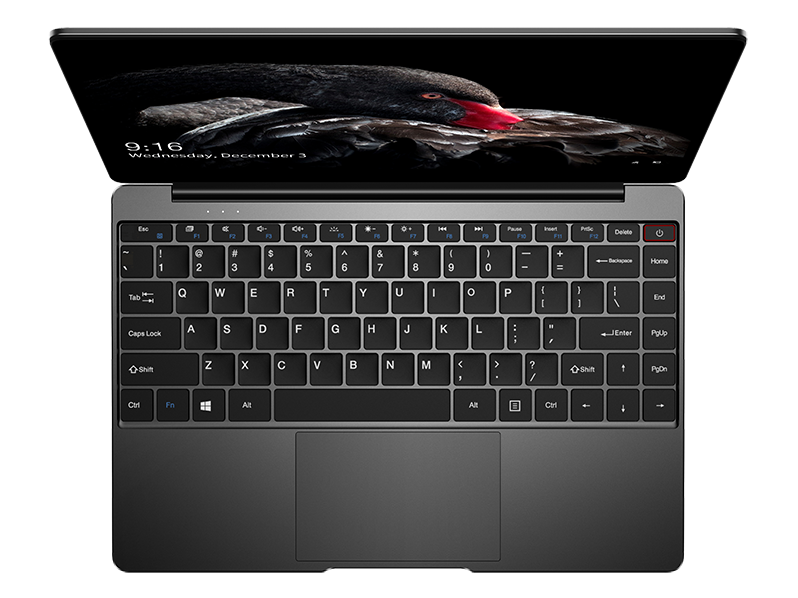
De AeroBook Pro heeft een geweldig scherm, een geweldig chassisontwerp en een geweldig toetsenbord, vooral voor de prijs. De zeer trage Core m3-processor haalt naar beneden wat anders een behoorlijke budgetdeal had kunnen zijn.
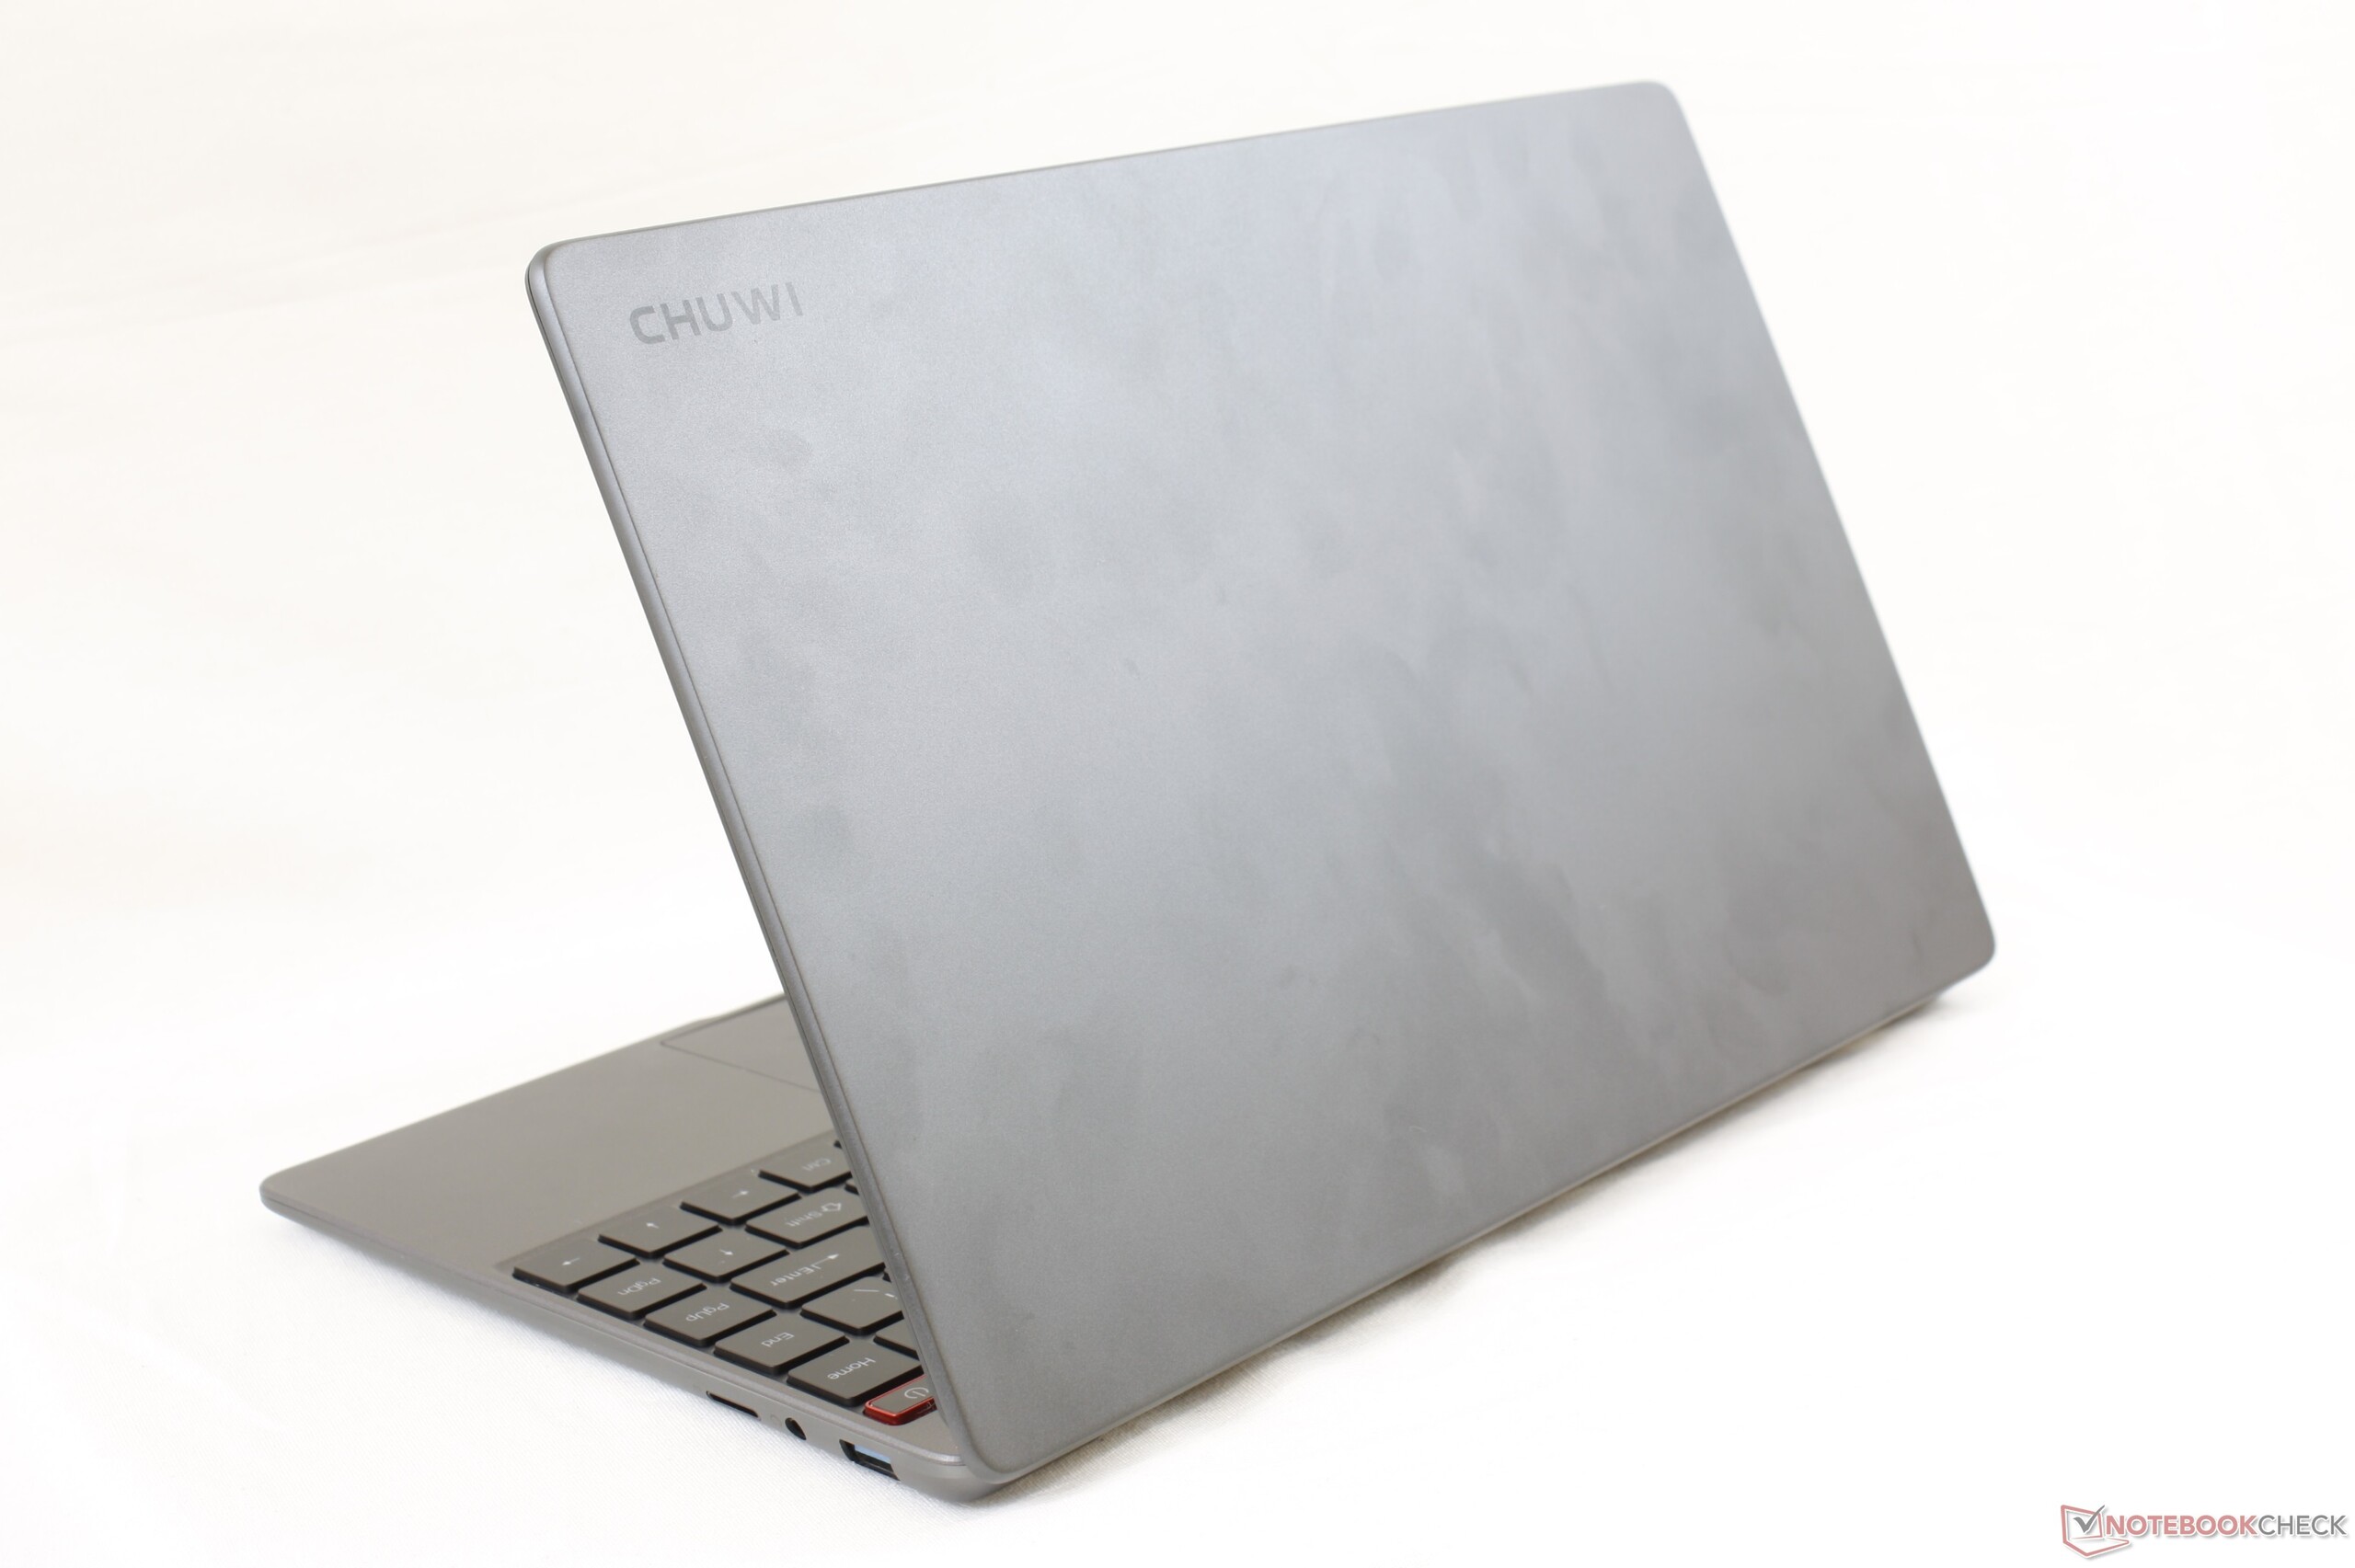
Chuwi AeroBook Pro
- 04-06-2020 v7 (old)
Allen Ngo
Price comparison
