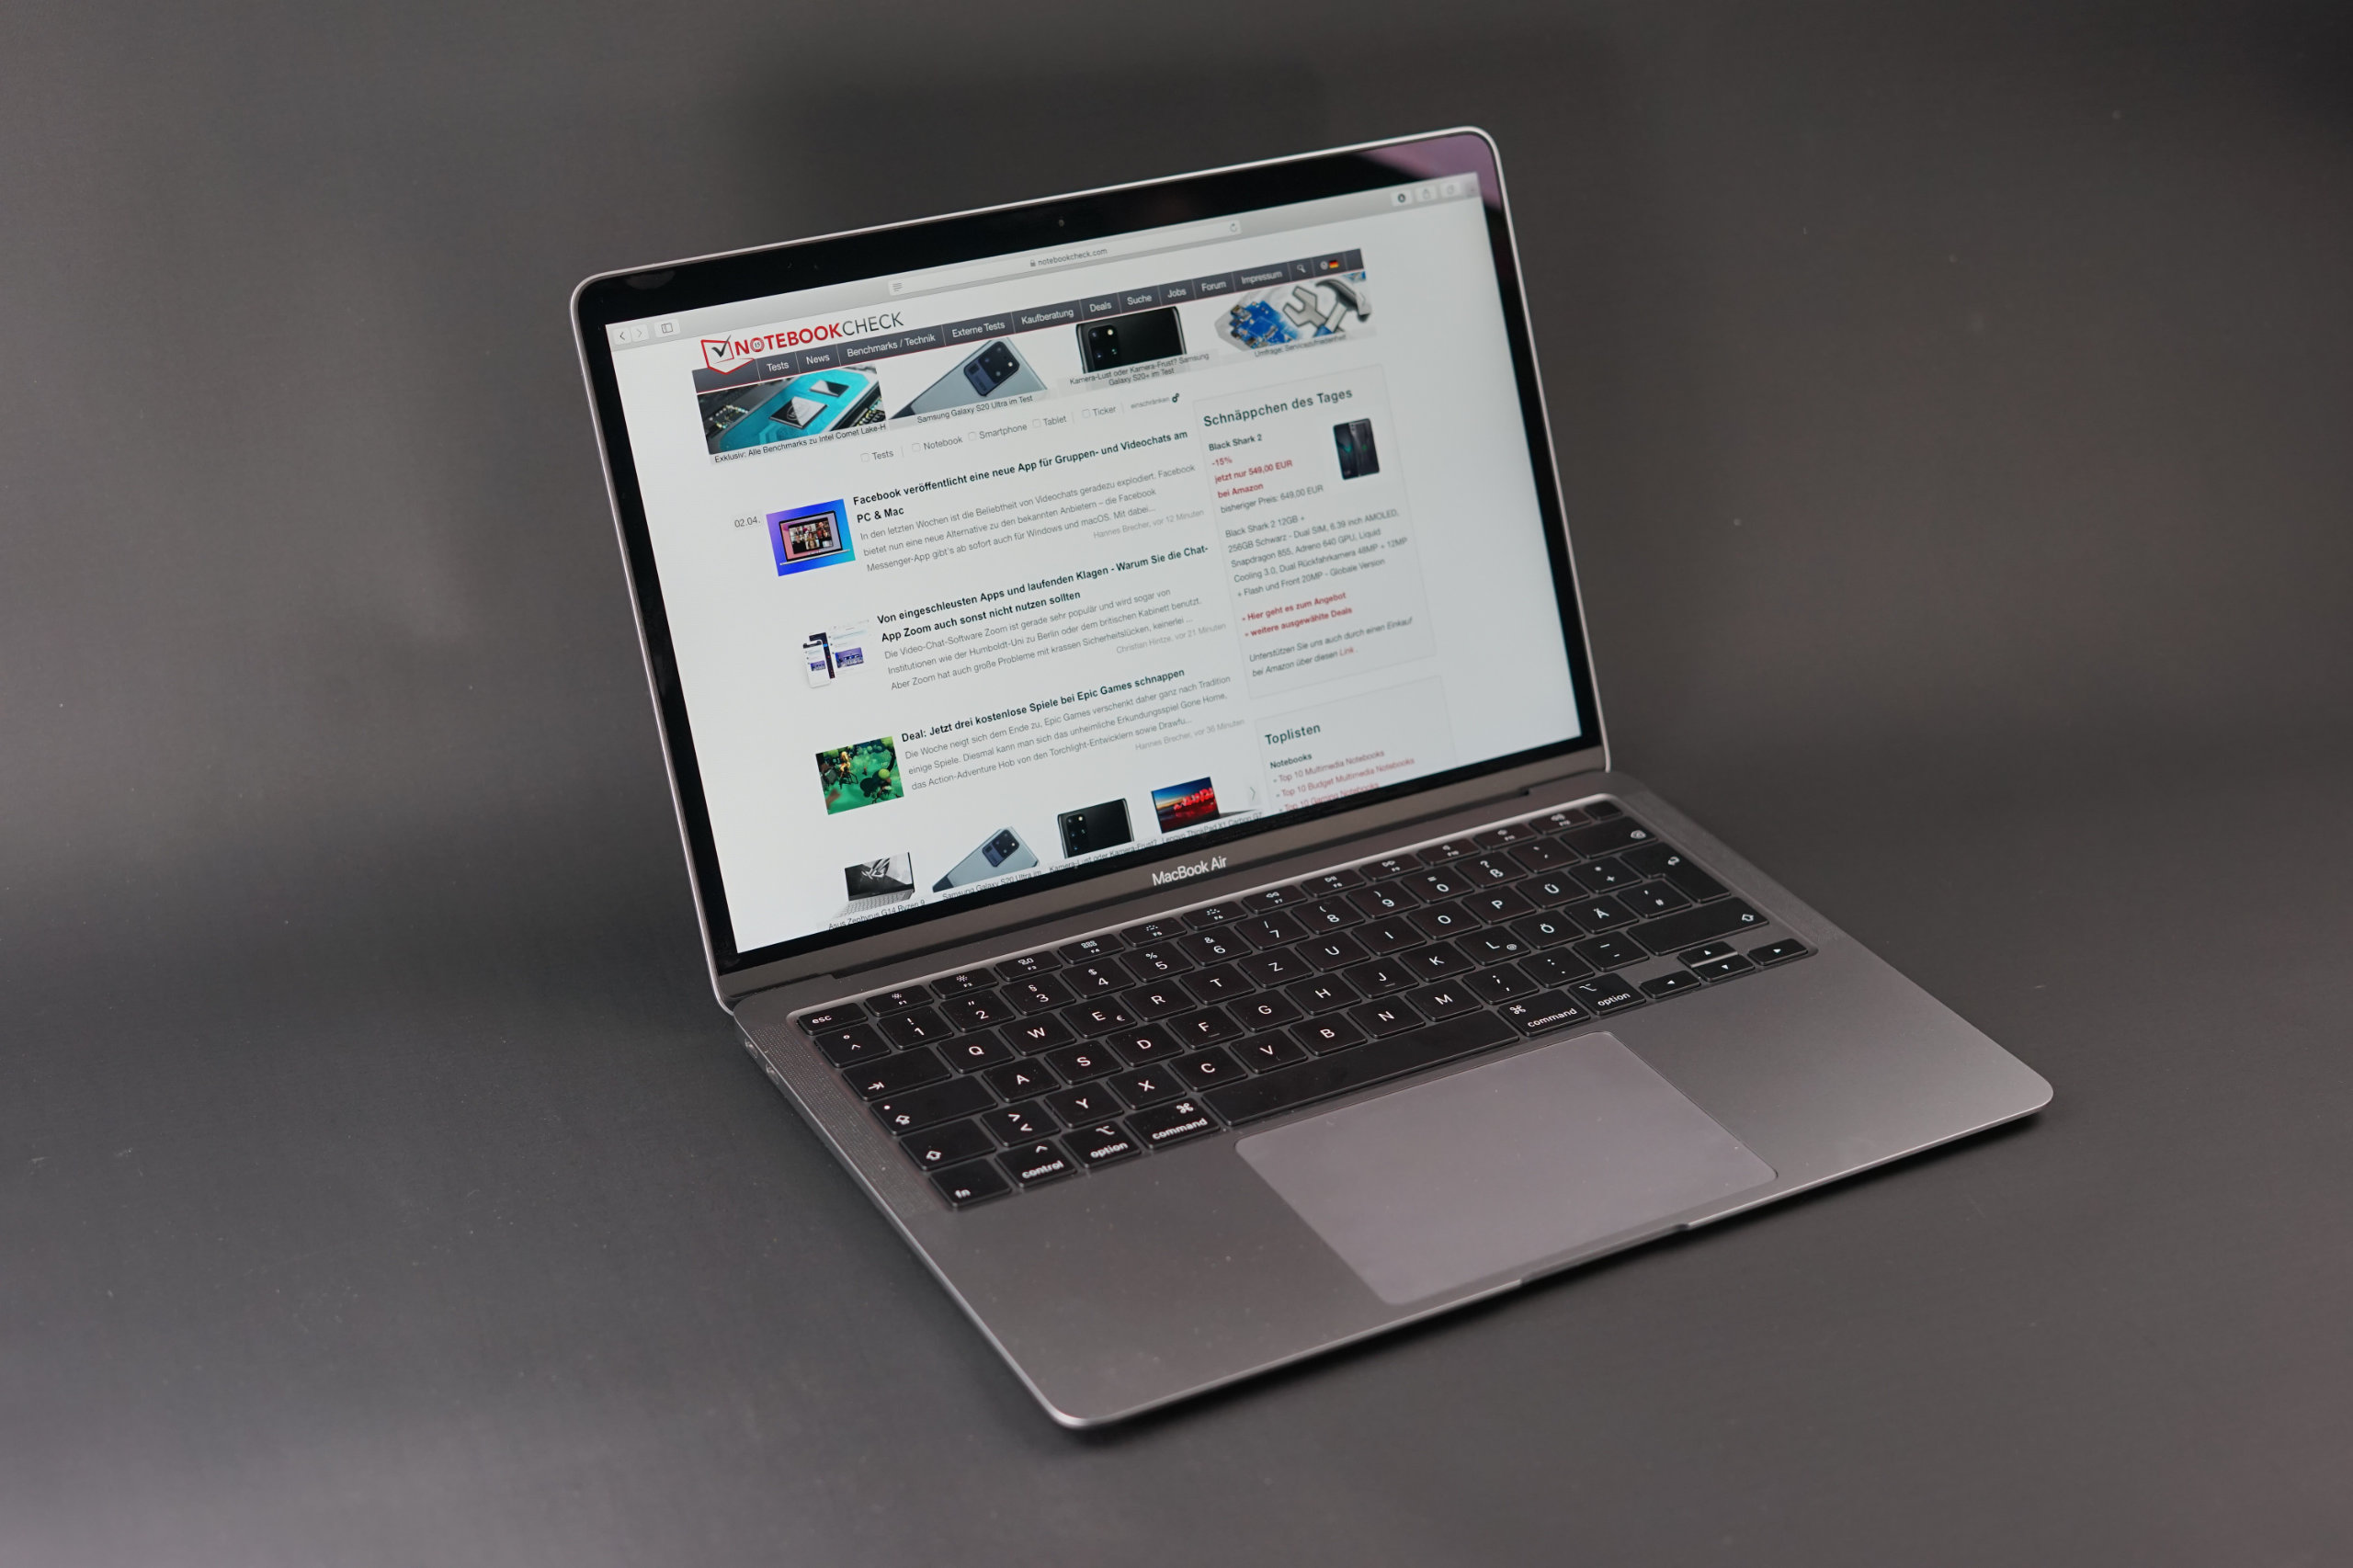
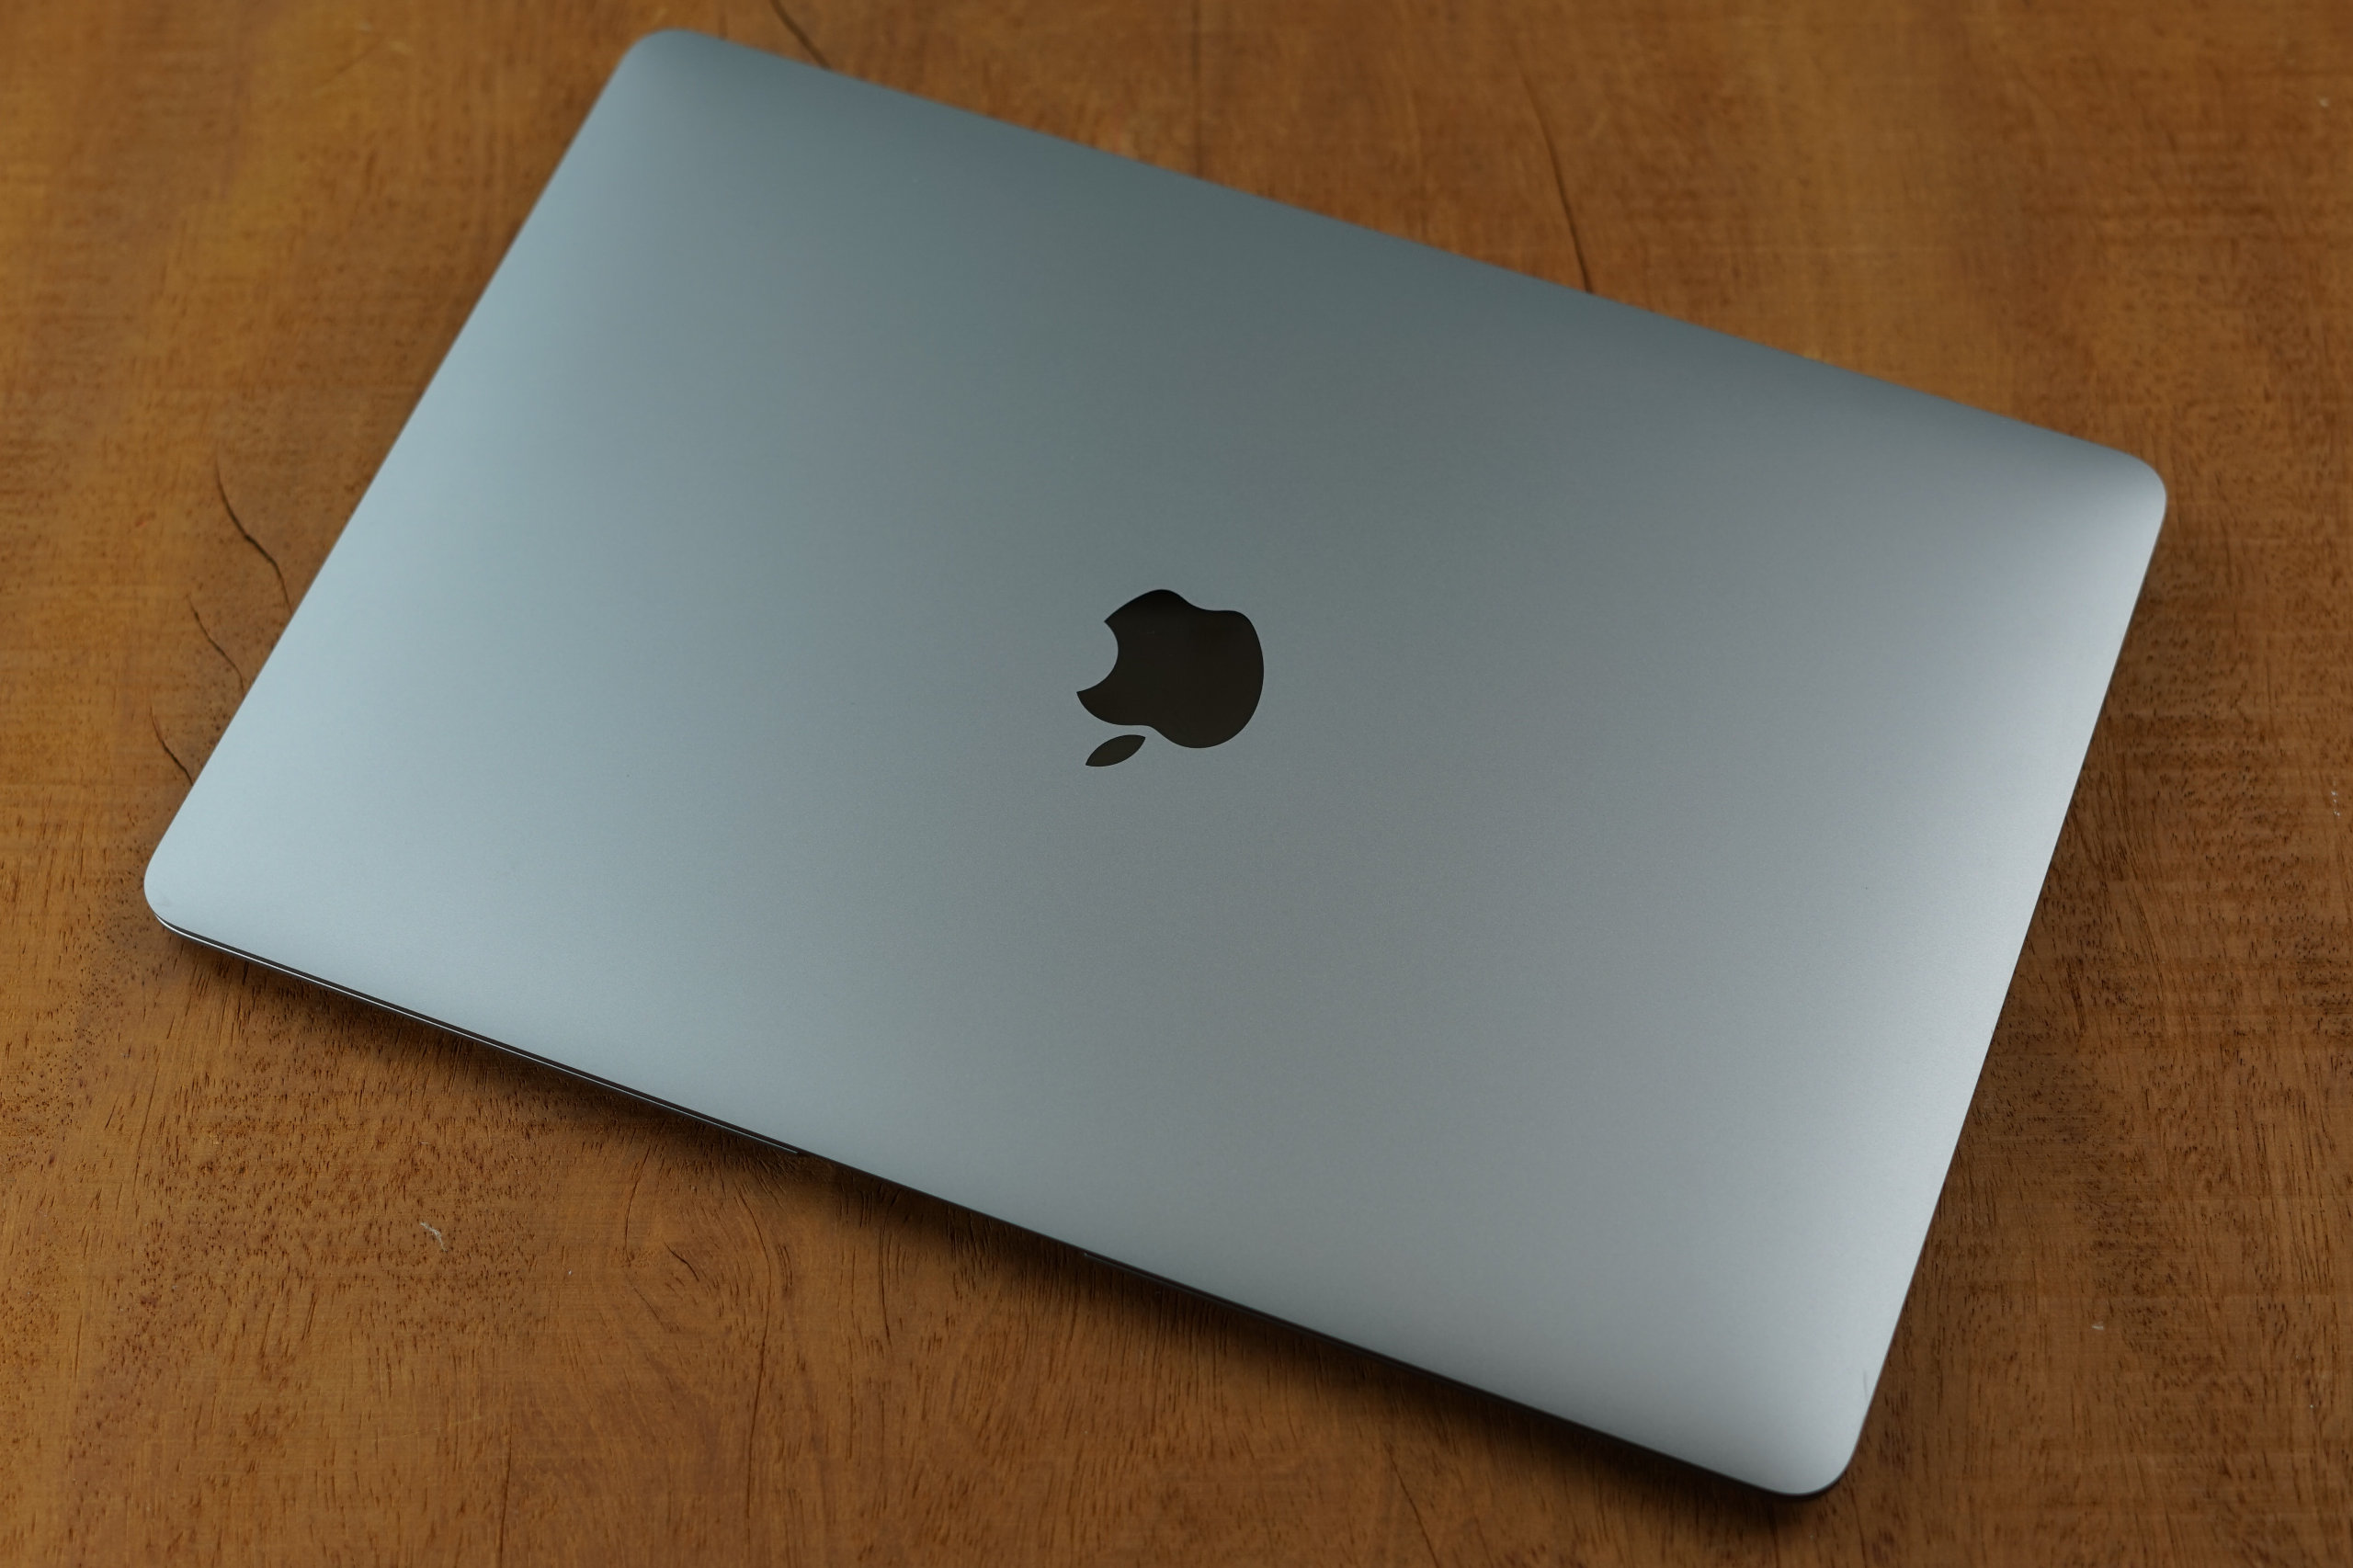
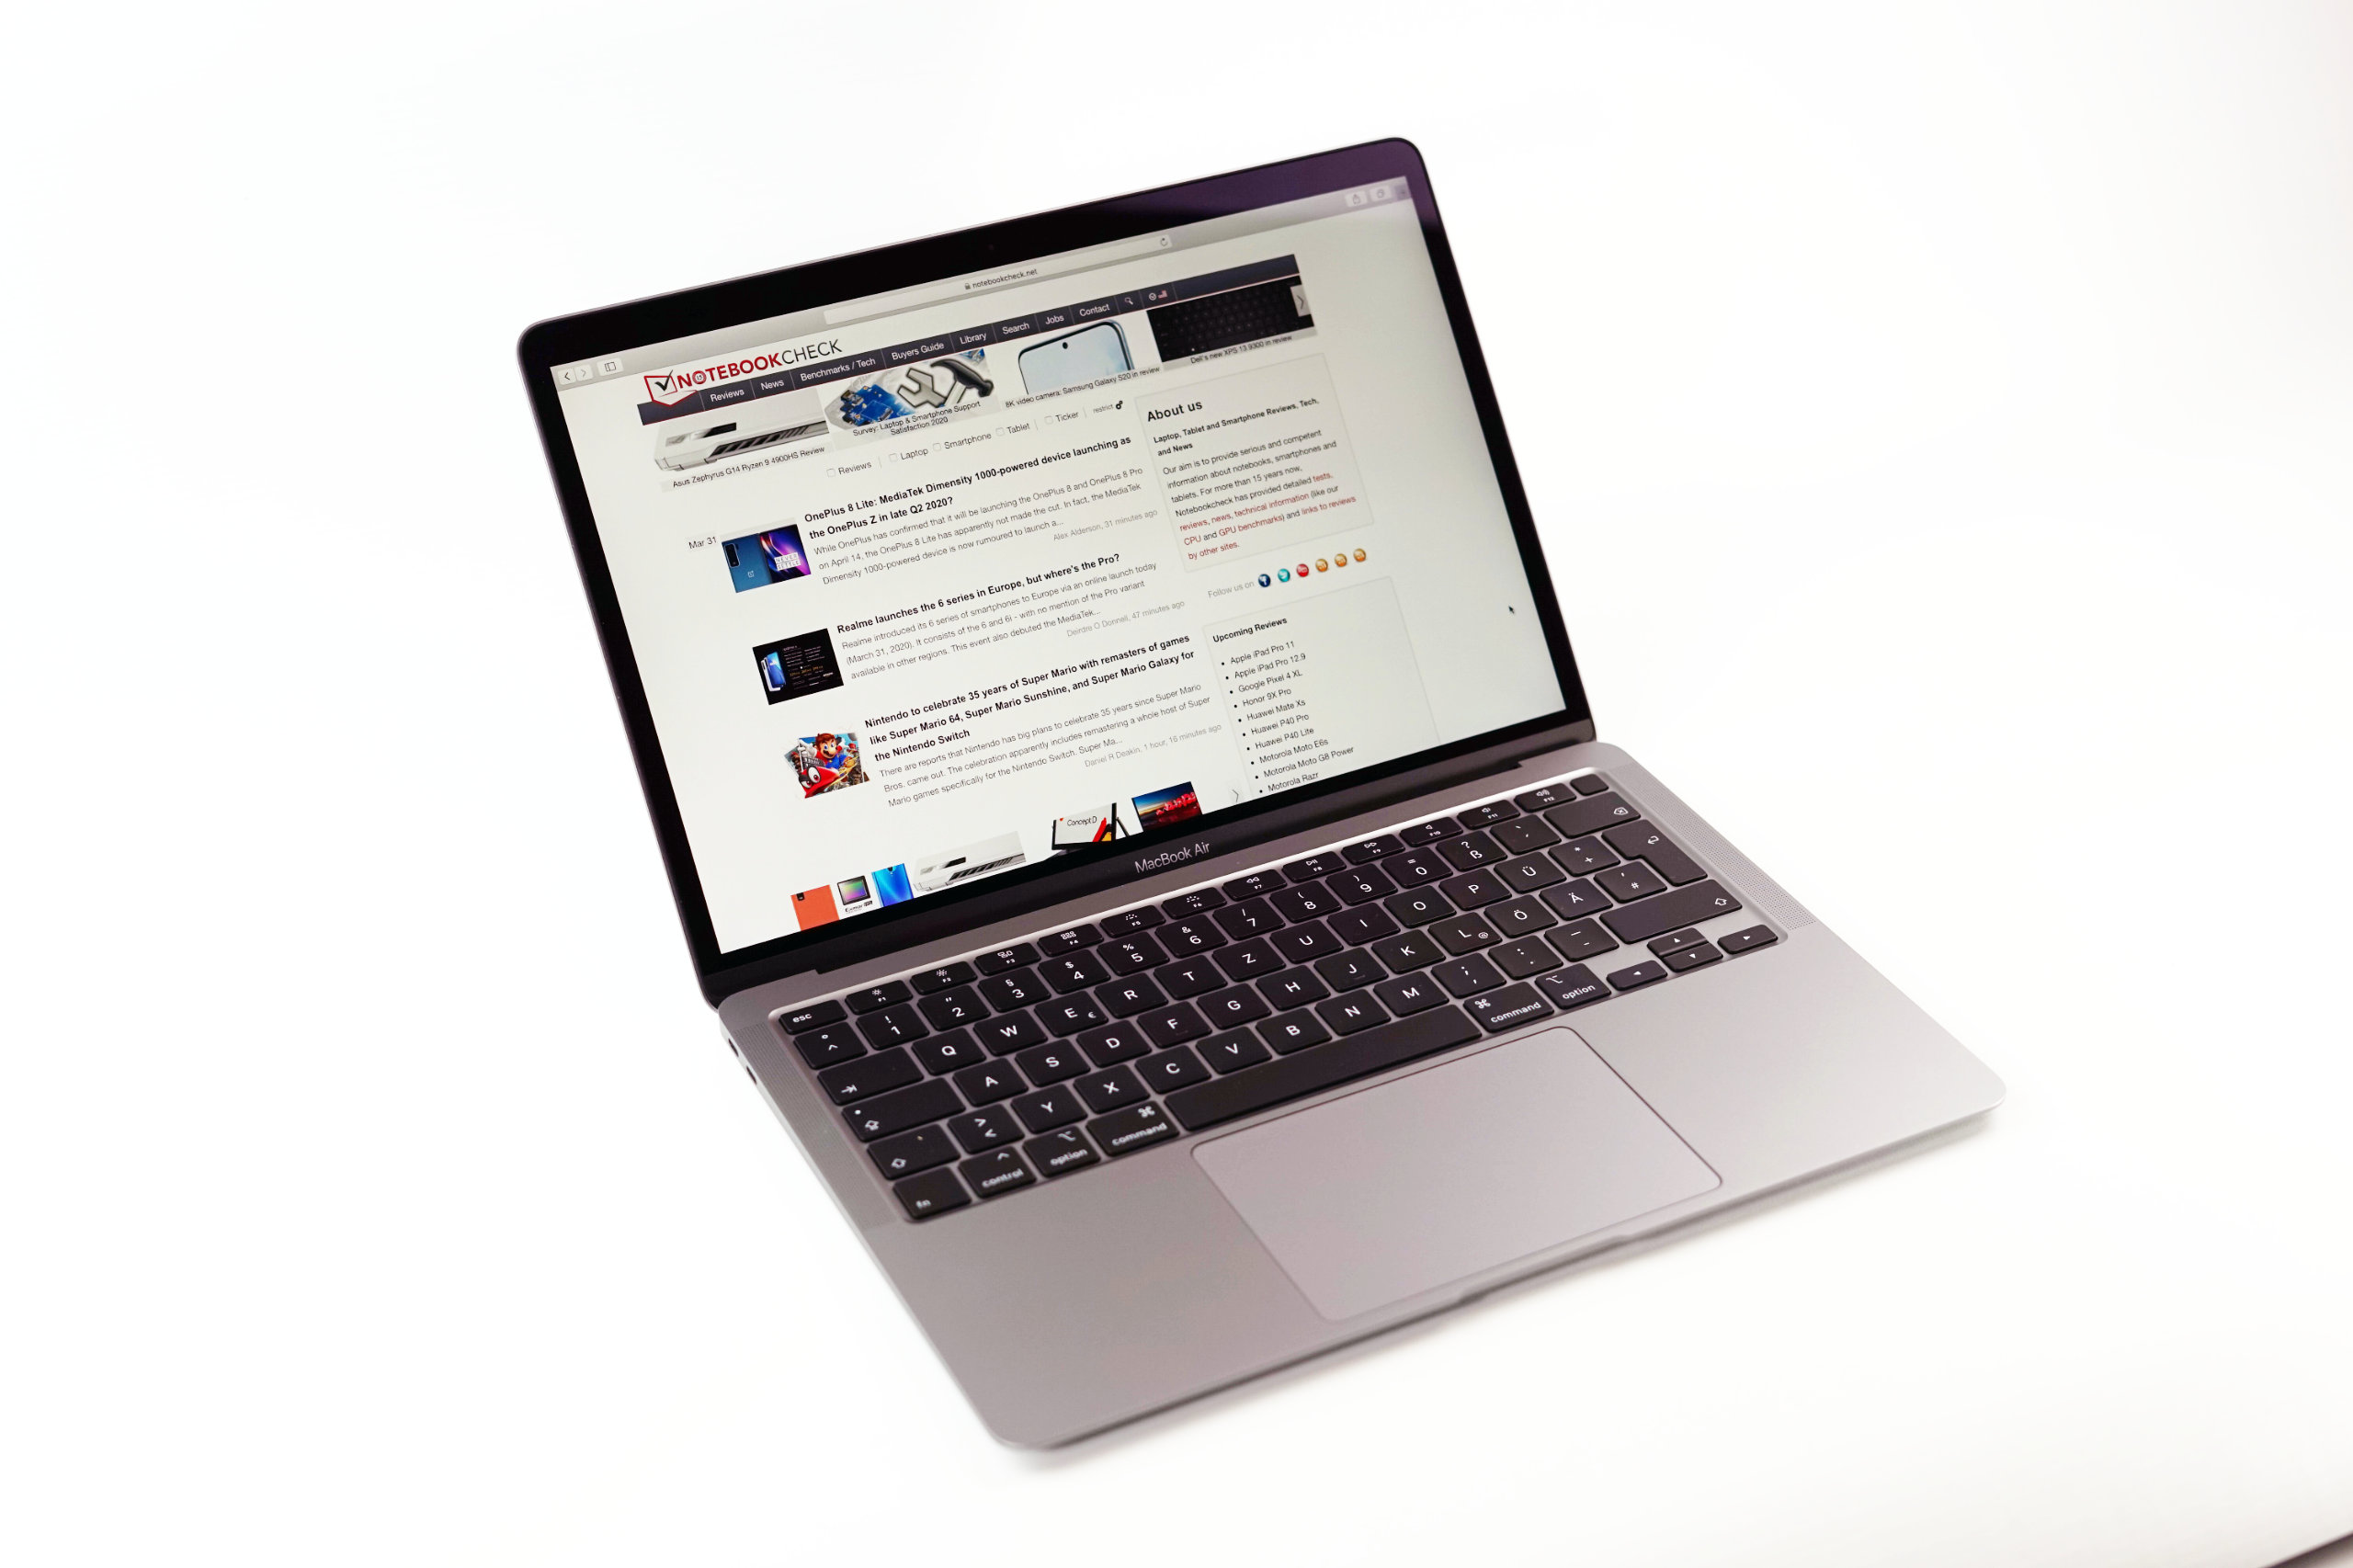
Kort testrapport Apple MacBook Air 2020 Core i5: de beste MacBook die je kan krijgen?
Evaluatie | Datum | Model | Gewicht | Hoogte | Formaat | Resolutie | Beste prijs |
|---|---|---|---|---|---|---|---|
| 88 % v7 (old) | 04-2020 | Apple MacBook Air 2020 i5 i5-1030NG7, Iris Plus Graphics G7 (Ice Lake 64 EU) | 1.3 kg | 16.1 mm | 13.30" | 2560x1600 | |
| 85.6 % v7 (old) | 08-2019 | Apple Macbook Air 2019 i5-8210Y, UHD Graphics 617 | 1.3 kg | 15.6 mm | 13.30" | 2560x1600 | |
| 90.6 % v7 (old) | 02-2020 | Apple MacBook Pro 13 2019 2TB3 i5-8257U, Iris Plus Graphics 645 | 1.4 kg | 14.9 mm | 13.30" | 2560x1600 | |
| 84 % v7 (old) | 02-2020 | Microsoft Surface Laptop 3 13 Core i5-1035G7 i5-1035G7, Iris Plus Graphics G7 (Ice Lake 64 EU) | 1.3 kg | 14.5 mm | 13.50" | 2256x1504 | |
| 87 % v7 (old) | 02-2020 | Acer Swift 3 SF313-52-71Y7 i7-1065G7, Iris Plus Graphics G7 (Ice Lake 64 EU) | 1.2 kg | 16.6 mm | 13.50" | 2256x1504 | |
| 88.8 % v7 (old) | 03-2020 | Dell XPS 13 9300 i5 FHD i5-1035G1, UHD Graphics G1 (Ice Lake 32 EU) | 1.2 kg | 14.8 mm | 13.40" | 1920x1200 |


, i5-1030NG7, Apple SSD AP0512")
, i5-1030NG7, Apple SSD AP0512")
| |||||||||||||||||||||||||
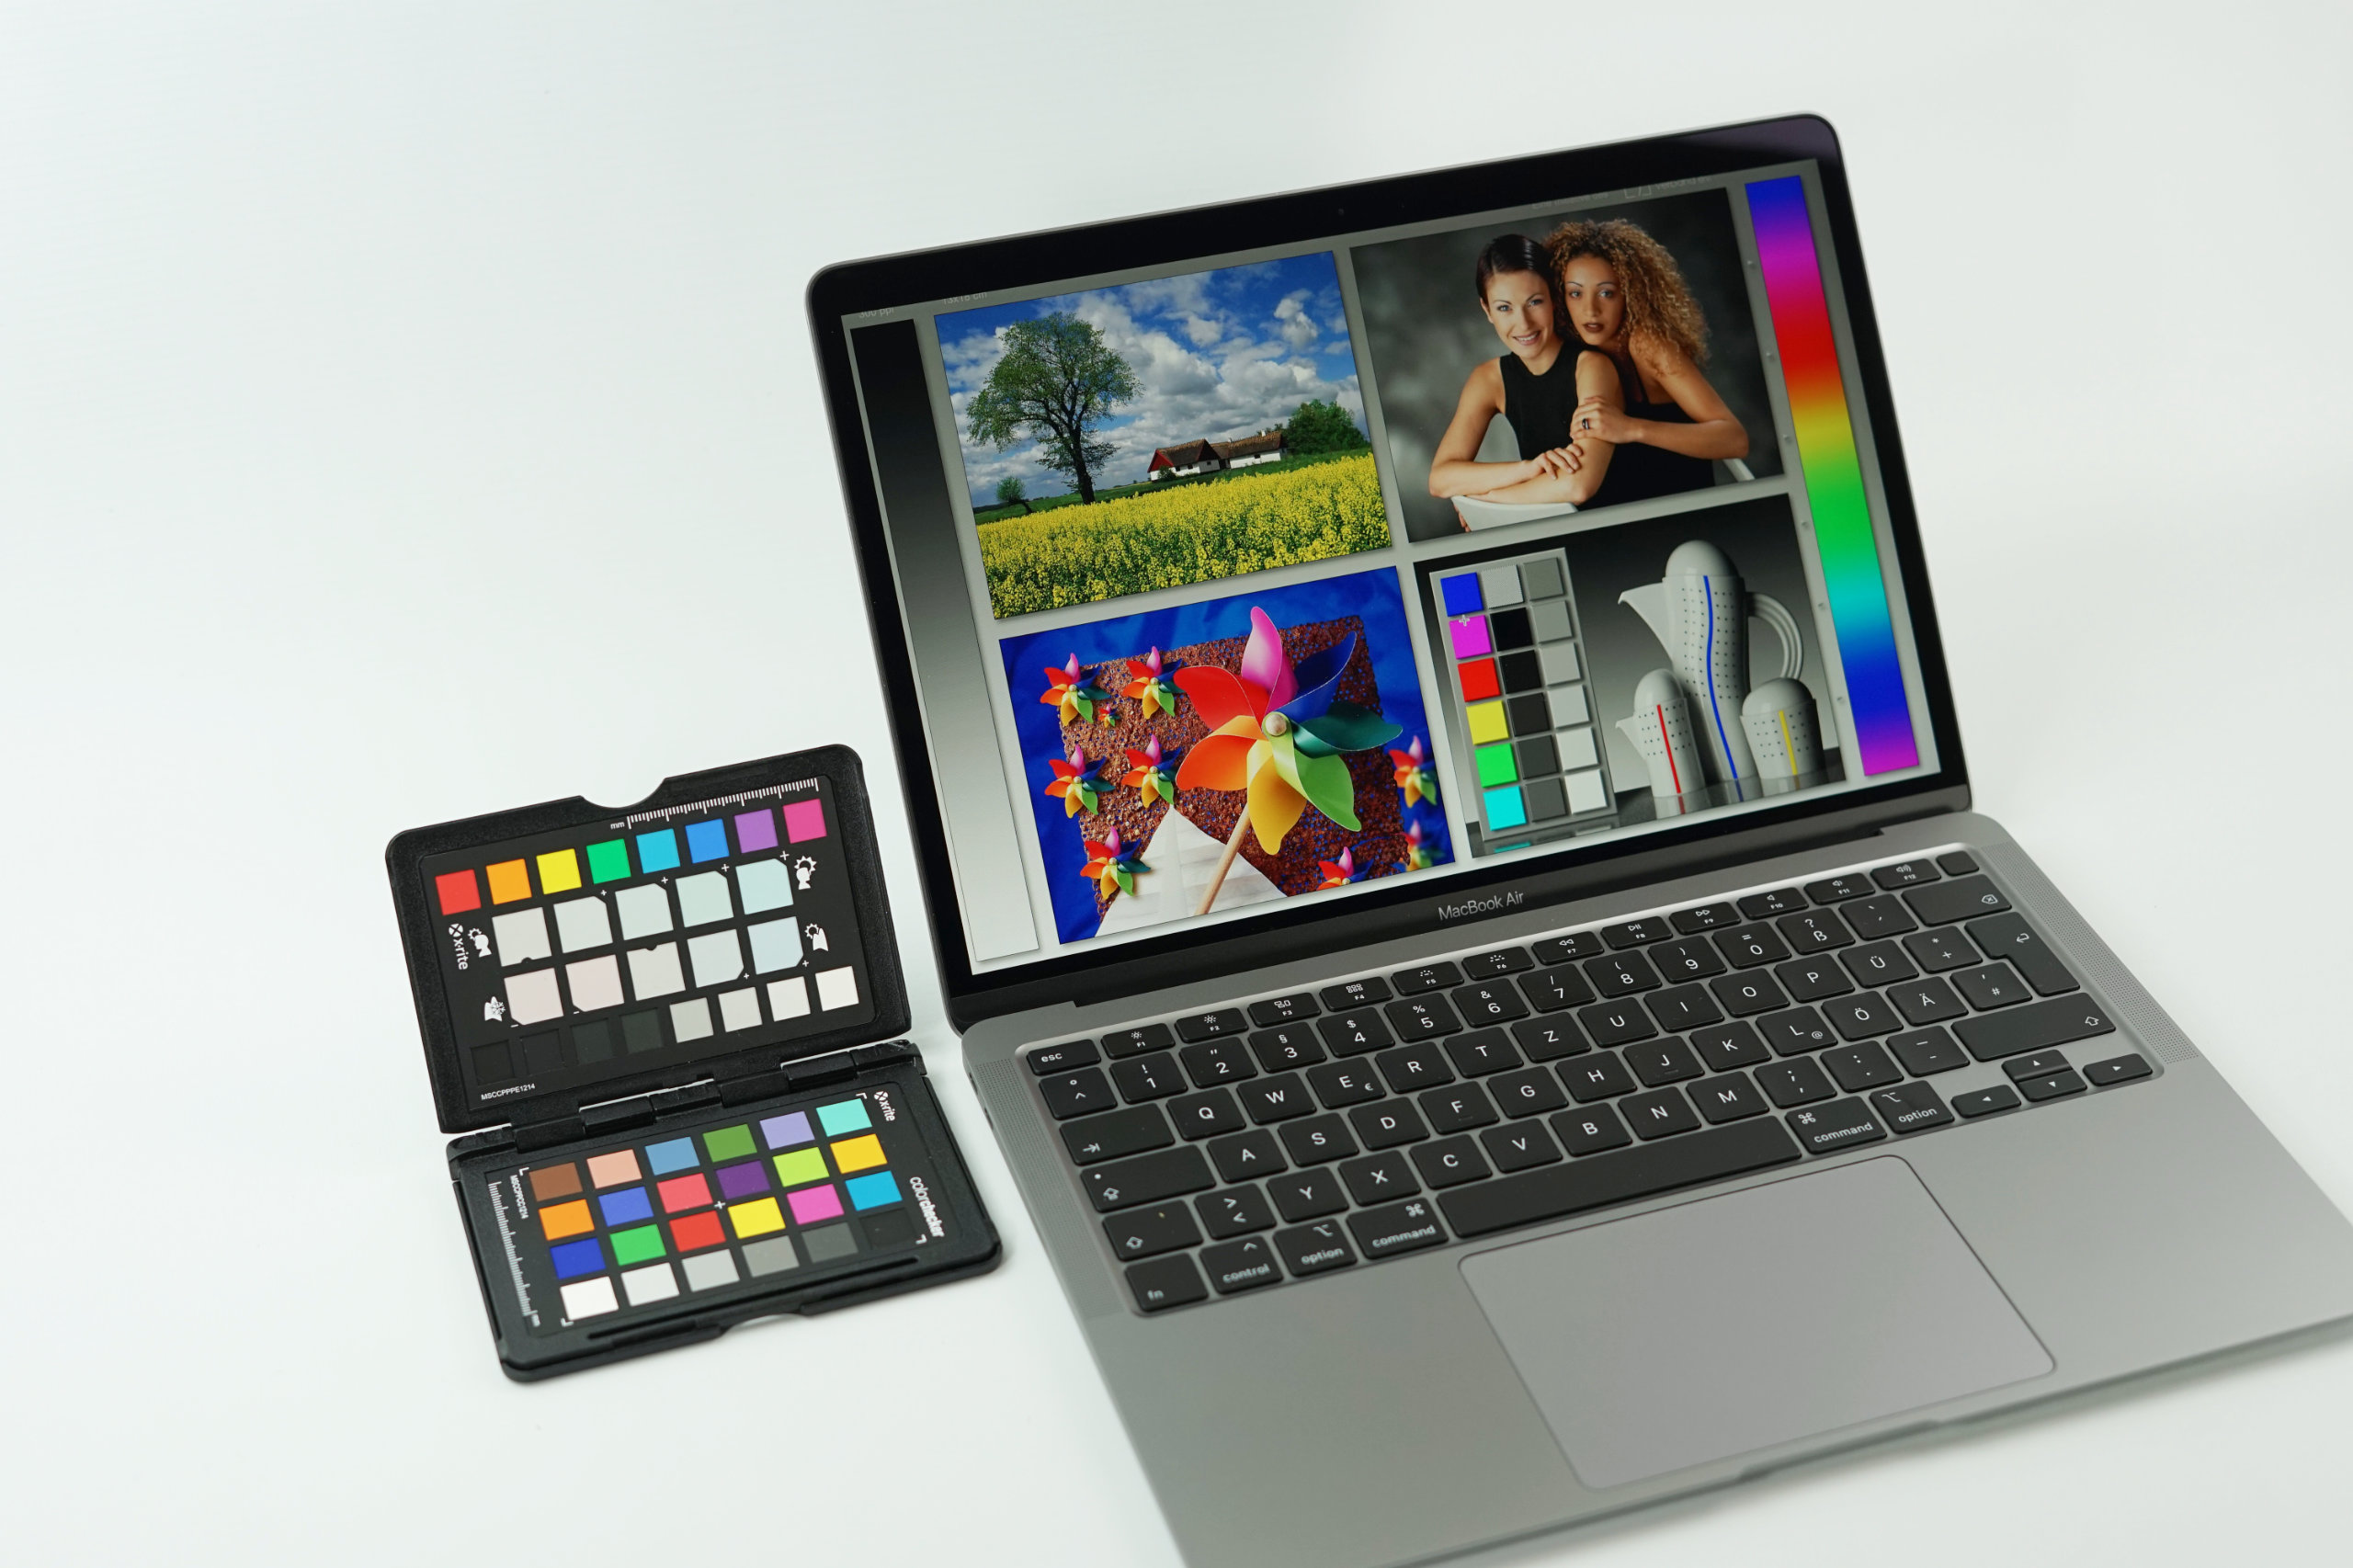
Helderheidsverdeling: 89 %
Helderheid in Batterij-modus: 427 cd/m²
Contrast: 1344:1 (Zwart: 0.32 cd/m²)
ΔE ColorChecker Calman: 1.8 | ∀{0.5-29.43 Ø4.72}
calibrated: 1.6
ΔE Greyscale Calman: 1.1 | ∀{0.09-98 Ø4.97}
98.3% sRGB (Calman 2D)
97.6% sRGB (Argyll 1.6.3 3D)
64.2% AdobeRGB 1998 (Argyll 1.6.3 3D)
71.7% AdobeRGB 1998 (Argyll 3D)
97.7% sRGB (Argyll 3D)
70.4% Display P3 (Argyll 3D)
CCT: 6644 K
| Apple MacBook Air 2020 i5 APPA042, IPS, 2560x1600, 13.3" | Apple Macbook Air 2019 APPA041, IPS, 2560x1600, 13.3" | Apple MacBook Pro 13 2019 2TB3 APPA03D, IPS, 2560x1600, 13.3" | Microsoft Surface Laptop 3 13 Core i5-1035G7 Sharp LQ135P1JX51, IPS, 2256x1504, 13.5" | Acer Swift 3 SF313-52-71Y7 BOE, NE135FBM-N41, IPS, 2256x1504, 13.5" | Dell XPS 13 9300 i5 FHD SHP14CB, IPS, 1920x1200, 13.4" | |
|---|---|---|---|---|---|---|
| Display | -4% | 19% | -4% | 0% | 2% | |
| Display P3 Coverage (%) | 70.4 | 67.4 -4% | 96.1 37% | 65.7 -7% | 70.1 0% | 71.5 2% |
| sRGB Coverage (%) | 97.7 | 94.7 -3% | 99.4 2% | 98.6 1% | 99.8 2% | 99.4 2% |
| AdobeRGB 1998 Coverage (%) | 71.7 | 69.1 -4% | 85.6 19% | 67.8 -5% | 71.2 -1% | 73.5 3% |
| Response Times | -4% | -23% | -45% | -22% | -32% | |
| Response Time Grey 50% / Grey 80% * (ms) | 38.7 ? | 42.4 ? -10% | 50.4 ? -30% | 59.2 ? -53% | 55 ? -42% | 60 ? -55% |
| Response Time Black / White * (ms) | 30.44 ? | 29.6 ? 3% | 35.2 ? -16% | 41.6 ? -37% | 31 ? -2% | 33.2 ? -9% |
| PWM Frequency (Hz) | 117000 ? | 111100 ? | 116300 ? | 21740 ? | 208 ? | 2500 ? |
| Screen | -0% | 12% | 10% | -30% | -33% | |
| Brightness middle (cd/m²) | 430 | 421 -2% | 603 40% | 403.4 -6% | 474 10% | 619 44% |
| Brightness (cd/m²) | 405 | 393 -3% | 577 42% | 397 -2% | 426 5% | 591 46% |
| Brightness Distribution (%) | 89 | 88 -1% | 92 3% | 89 0% | 82 -8% | 91 2% |
| Black Level * (cd/m²) | 0.32 | 0.34 -6% | 0.35 -9% | 0.34 -6% | 0.29 9% | 0.35 -9% |
| Contrast (:1) | 1344 | 1238 -8% | 1723 28% | 1186 -12% | 1634 22% | 1769 32% |
| Colorchecker dE 2000 * | 1.8 | 1.5 17% | 1.7 6% | 0.94 48% | 2.38 -32% | 3 -67% |
| Colorchecker dE 2000 max. * | 4.6 | 3.8 17% | 3.1 33% | 2.92 37% | 5.88 -28% | 8.2 -78% |
| Colorchecker dE 2000 calibrated * | 1.6 | 0.7 56% | 0.99 38% | 2.69 -68% | 1 37% | |
| Greyscale dE 2000 * | 1.1 | 1.2 -9% | 2.1 -91% | 0.9 18% | 3.75 -241% | 5.2 -373% |
| CCT | 6644 98% | 6694 97% | 6843 95% | 6620 98% | 6466 101% | 6340 103% |
| Color Space (Percent of AdobeRGB 1998) (%) | 64.2 | 61.3 -5% | 76.7 19% | 62.3 -3% | 65 1% | 66.9 4% |
| Color Space (Percent of sRGB) (%) | 97.6 | 94.6 -3% | 99.4 2% | 98.7 1% | 100 2% | 99.3 2% |
| Gamma | 2.21 100% | 2.18 101% | 2.13 103% | 2.37 93% | 2.14 103% | |
| Totaal Gemiddelde (Programma / Instellingen) | -3% /
-1% | 3% /
9% | -13% /
1% | -17% /
-23% | -21% /
-26% |
* ... kleiner is beter

Responstijd Scherm
| ↔ Responstijd Zwart naar Wit | ||
|---|---|---|
| 30.44 ms ... stijging ↗ en daling ↘ gecombineerd | ↗ 17.9 ms stijging | 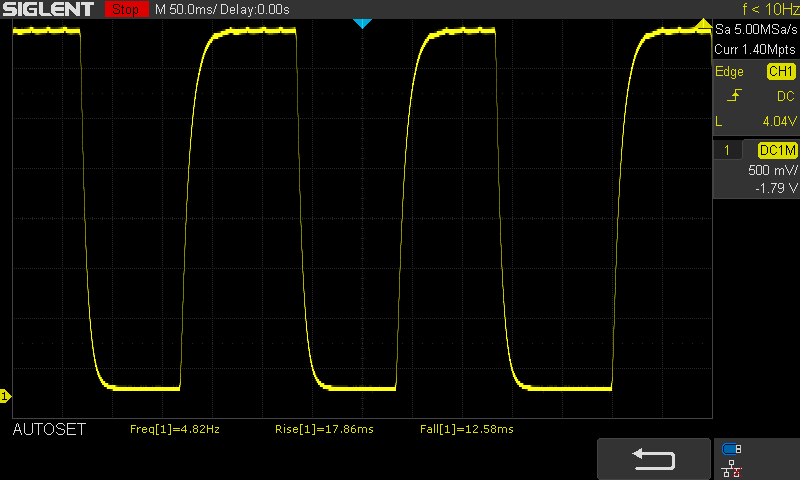 |
| ↘ 12.6 ms daling | ||
| Het scherm vertoonde trage responstijden in onze tests en is misschien te traag voor games. Ter vergelijking: alle testtoestellen variëren van 0.1 (minimum) tot 240 (maximum) ms. » 83 % van alle toestellen zijn beter. Dit betekent dat de gemeten responstijd slechter is dan het gemiddelde (19.8 ms) van alle geteste toestellen. | ||
| ↔ Responstijd 50% Grijs naar 80% Grijs | ||
| 38.7 ms ... stijging ↗ en daling ↘ gecombineerd | ↗ 19.6 ms stijging | 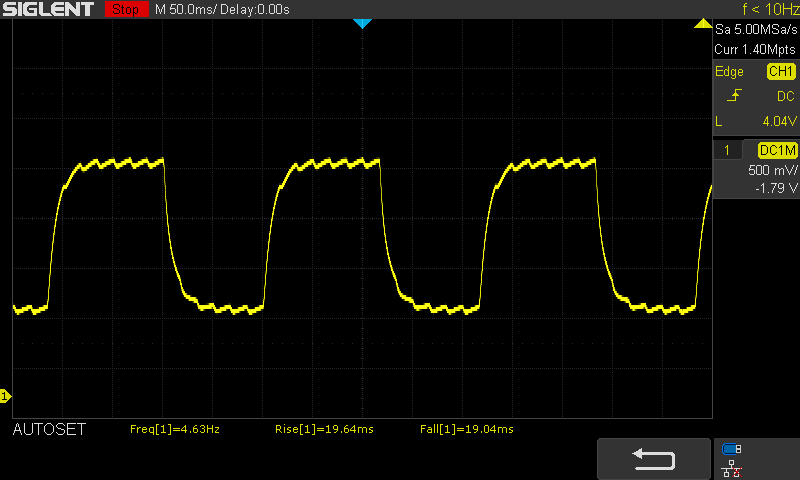 |
| ↘ 19 ms daling | ||
| Het scherm vertoonde trage responstijden in onze tests en is misschien te traag voor games. Ter vergelijking: alle testtoestellen variëren van 0.165 (minimum) tot 636 (maximum) ms. » 58 % van alle toestellen zijn beter. Dit betekent dat de gemeten responstijd slechter is dan het gemiddelde (31 ms) van alle geteste toestellen. | ||
Screen Flickering / PWM (Pulse-Width Modulation)
| Screen flickering / PWM waargenomen | 117000 Hz | ≤ 75 % helderheid instelling | 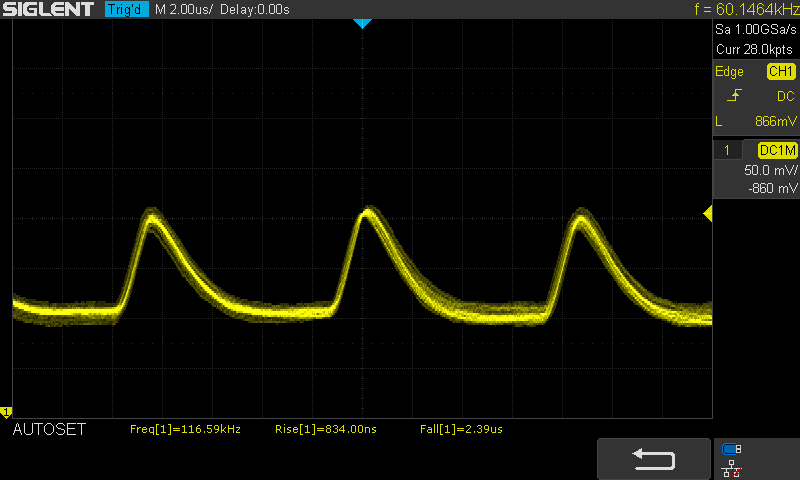 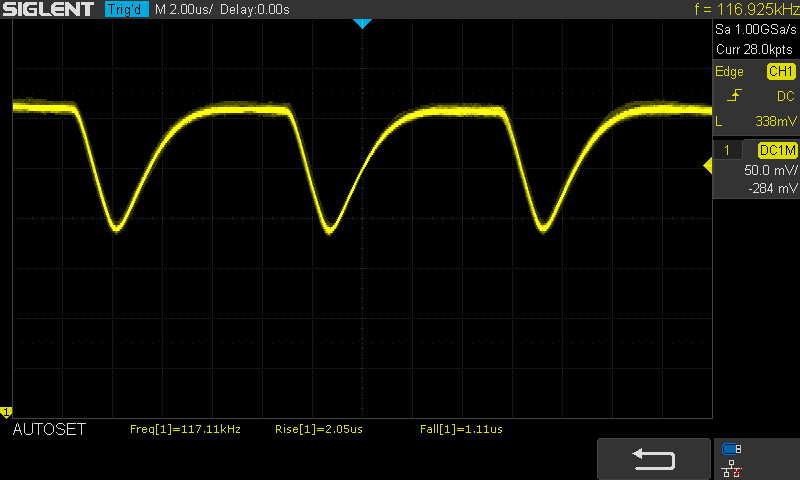 |
De achtergrondverlichting van het scherm flikkert op 117000 Hz (in het slechtste geval, bijvoorbeeld bij gebruik van PWM) aan een helderheid van 75 % en lager. Boven deze helderheid zou er geen flickering / PWM mogen optreden. De frequentie van 117000 Hz is redelijk hoog en de meeste mensen die gevoelig zijn aan flickering zouden dit dus niet mogen waarnemen of geïrriteerde ogen krijgen. Ter vergelijking: 52 % van alle geteste toestellen maakten geen gebruik van PWM om de schermhelderheid te verlagen. Als het wel werd gebruikt, werd een gemiddelde van 7778 (minimum: 5 - maximum: 343500) Hz waargenomen. | |||
| Blackmagic RAW Speed Test - 12:1 8K CPU | |
| Gemiddelde van klas Subnotebook (22 - 49, n=5, laatste 2 jaar) | |
| Apple MacBook Pro 16 2019 i9 5500M | |
| Apple MacBook Air 2020 i5 | |
| R Benchmark 2.5 - Overall mean | |
| Apple MacBook Air 2020 i5 (macOS) | |
| Apple MacBook Air 2020 i5 (Win 10) | |
| Dell XPS 13 9300 i5 FHD | |
| Acer Swift 3 SF313-52-71Y7 | |
| Apple MacBook Pro 16 2019 i9 5500M (macOS) | |
| Apple MacBook Pro 16 2019 i9 5500M (Win 10) | |
| Gemiddelde van klas Subnotebook (0.4024 - 1.456, n=57, laatste 2 jaar) | |
* ... kleiner is beter
| DPC Latencies / LatencyMon - interrupt to process latency (max), Web, Youtube, Prime95 | |
| Dell XPS 13 9300 Core i7-1065G7 | |
| Lenovo ThinkPad X1 Carbon G7 20R1-000YUS | |
| Eve-Tech Eve V i7 | |
| Asus Zephyrus G14 GA401IV | |
| Apple MacBook Air 2020 i5 | |
| Schenker VIA 14 | |
| BMAX MaxBook Y11 H1M6 | |
| Gemiddelde van klas Subnotebook (316 - 8148, n=39, laatste 2 jaar) | |
| Dell XPS 13 9300 i5 FHD | |
| LG Gram 14T90N | |
| Dell XPS 13 2016 9350 (FHD, i7-6560U) | |
* ... kleiner is beter
| Apple MacBook Air 2020 i5 Apple SSD AP0512 | Apple Macbook Air 2019 Apple SSD AP0256 | Apple MacBook Pro 13 2019 2TB3 Apple SSD AP0256 | Microsoft Surface Laptop 3 13 Core i5-1035G7 SK hynix BC501 HFM256GDGTNG | Acer Swift 3 SF313-52-71Y7 Intel SSD 660p 1TB SSDPEKNW010T8 | Dell XPS 13 9300 i5 FHD Toshiba XG6 KXG60ZNV512G | Apple MacBook Pro 16 2019 i9 5500M Apple SSD AP1024 7171 | Gemiddelde van klas Subnotebook | |
|---|---|---|---|---|---|---|---|---|
| AS SSD | -16% | -4% | 50% | 139% | 218% | 194% | 294% | |
| Seq Read (MB/s) | 1153 | 933 -19% | 974 -16% | 1387 20% | 1703 48% | 2328 102% | 2531 120% | 4499 ? 290% |
| Seq Write (MB/s) | 1367 | 1139 -17% | 1340 -2% | 504 -63% | 1373 0% | 1137 -17% | 2289 67% | 2974 ? 118% |
| 4K Read (MB/s) | 12.95 | 10.53 -19% | 11.35 -12% | 42.35 227% | 56.8 339% | 48.07 271% | 15.85 22% | 59.5 ? 359% |
| 4K Write (MB/s) | 24.52 | 15.03 -39% | 15.95 -35% | 120 389% | 164.4 570% | 120.6 392% | 39.88 63% | 168.1 ? 586% |
| 4K-64 Read (MB/s) | 665 | 534 -20% | 643 -3% | 497.4 -25% | 584 -12% | 899 35% | 1267 91% | 862 ? 30% |
| 4K-64 Write (MB/s) | 159.5 | 181.6 14% | 163 2% | 354.9 123% | 783 391% | 1220 665% | 1749 997% | 1701 ? 966% |
| Score Read (Points) | 793 | 638 -20% | 752 -5% | 678 -15% | 811 2% | 1180 49% | 1536 94% | 1370 ? 73% |
| Score Write (Points) | 321 | 311 -3% | 313 -2% | 525 64% | 1085 238% | 1455 353% | 2018 529% | 2166 ? 575% |
| Score Total (Points) | 1528 | 1283 -16% | 1465 -4% | 1520 -1% | 2313 51% | 3189 109% | 4317 183% | 4175 ? 173% |
| Copy ISO MB/s (MB/s) | 1433 | 1205 -16% | 1404 -2% | 764 -47% | 1401 -2% | 1995 39% | 2594 ? 81% | |
| Copy Program MB/s (MB/s) | 363 | 302.1 -17% | 406.9 12% | 256.1 -29% | 480.4 32% | 584 61% | 829 ? 128% | |
| Copy Game MB/s (MB/s) | 725 | 627 -14% | 850 17% | 368.4 -49% | 820 13% | 1135 57% | 1783 ? 146% |

| Unigine Valley 1.0 - 1920x1080 Extreme HD Preset OpenGL AA:x8 | |
| Apple MacBook Pro 16 2019 i9 5500M | |
| Gemiddelde van klas Subnotebook (4.7 - 26.2, n=5, laatste 2 jaar) | |
| Apple MacBook Pro 13 2018 Touchbar i5 | |
| Apple MacBook Pro 13 2017 Touchbar i5 | |
| Apple MacBook Air 2020 i5 | |
| Gemiddeld Intel Iris Plus Graphics G7 (Ice Lake 64 EU) (n=1) | |
| Basemark GPU 1.2 | |
| 3840x2160 Metal High Offscreen | |
| Apple iPad Pro 11 2020 | |
| Apple MacBook Pro 16 2019 i9 5500M | |
| Apple MacBook Air 2020 i5 | |
| Gemiddeld Intel Iris Plus Graphics G7 (Ice Lake 64 EU) (n=1) | |
| 1920x1080 Metal Medium Offscreen | |
| Apple MacBook Pro 16 2019 i9 5500M | |
| Apple iPad Pro 11 2018 | |
| Apple iPad Pro 11 2020 | |
| Apple MacBook Air 2020 i5 | |
| Gemiddeld Intel Iris Plus Graphics G7 (Ice Lake 64 EU) (n=1) | |
| 3DMark 06 Standard Score | 8821 punten | |
| 3DMark 11 Performance | 2848 punten | |
| 3DMark Fire Strike Score | 1605 punten | |
| 3DMark Time Spy Score | 587 punten | |
Help | ||
| The Witcher 3 - 1024x768 Low Graphics & Postprocessing | |
| Gemiddelde van klas Subnotebook (38.8 - 176, n=13, laatste 2 jaar) | |
| Microsoft Surface Laptop 3 13 Core i5-1035G7 | |
| Gemiddeld Intel Iris Plus Graphics G7 (Ice Lake 64 EU) (28.2 - 58, n=20) | |
| Apple MacBook Air 2020 i5 | |
| Shadow of the Tomb Raider - 1280x720 Lowest Preset | |
| Gemiddelde van klas Subnotebook (41 - 109, n=7, laatste 2 jaar) | |
| Gemiddeld Intel Iris Plus Graphics G7 (Ice Lake 64 EU) (15.6 - 33, n=13) | |
| Microsoft Surface Laptop 3 13 Core i5-1035G7 | |
| Apple MacBook Air 2020 i5 | |
| lage | gem. | hoge | ultra | |
|---|---|---|---|---|
| BioShock Infinite (2013) | 55.6 | 33.5 | 29.1 | 10.9 |
| GTA V (2015) | 24.8 | |||
| The Witcher 3 (2015) | 28.2 | 5.13 | ||
| Dota 2 Reborn (2015) | 59.4 | 30.7 | 20.5 | 19.8 |
| Rocket League (2017) | 22.1 | 24.9 | ||
| X-Plane 11.11 (2018) | 24 | 11.6 | 10.8 | |
| World of Tanks enCore (2018) | 92.9 | 14.6 | ||
| Far Cry 5 (2018) | 11 | |||
| Shadow of the Tomb Raider (2018) | 15.6 | |||
| Battlefield V (2018) | 7.87 | |||
| Anno 1800 (2019) | 19 | |||
| FIFA 20 (2019) | 0 het spel wil niet beginnen |
Geluidsniveau
| Onbelast |
| 30 / 30 / 30 dB (A) |
| Belasting |
| 45.5 / 45.8 dB (A) |
 | ||
30 dB stil 40 dB(A) hoorbaar 50 dB(A) luid |
||
min: | ||
| Apple MacBook Air 2020 i5 Iris Plus Graphics G7 (Ice Lake 64 EU), i5-1030NG7, Apple SSD AP0512 | Apple Macbook Air 2019 UHD Graphics 617, i5-8210Y, Apple SSD AP0256 | Apple MacBook Pro 13 2019 2TB3 Iris Plus Graphics 645, i5-8257U, Apple SSD AP0256 | Microsoft Surface Laptop 3 13 Core i5-1035G7 Iris Plus Graphics G7 (Ice Lake 64 EU), i5-1035G7, SK hynix BC501 HFM256GDGTNG | Acer Swift 3 SF313-52-71Y7 Iris Plus Graphics G7 (Ice Lake 64 EU), i7-1065G7, Intel SSD 660p 1TB SSDPEKNW010T8 | Dell XPS 13 9300 i5 FHD UHD Graphics G1 (Ice Lake 32 EU), i5-1035G1, Toshiba XG6 KXG60ZNV512G | |
|---|---|---|---|---|---|---|
| Noise | 7% | 9% | 12% | 9% | 12% | |
| uit / omgeving * (dB) | 30 | 29.5 2% | 29.5 2% | 28.5 5% | 30.3 -1% | 29.3 2% |
| Idle Minimum * (dB) | 30 | 29.5 2% | 29.5 2% | 28.5 5% | 30.3 -1% | 29.3 2% |
| Idle Average * (dB) | 30 | 29.5 2% | 29.5 2% | 28.5 5% | 30.3 -1% | 29.3 2% |
| Idle Maximum * (dB) | 30 | 29.5 2% | 29.5 2% | 28.5 5% | 30.3 -1% | 29.3 2% |
| Load Average * (dB) | 45.5 | 34 25% | 31.1 32% | 28.5 37% | 31.7 30% | 30 34% |
| Load Maximum * (dB) | 45.8 | 41 10% | 39.3 14% | 40.4 12% | 32.7 29% | 32.4 29% |
| Witcher 3 ultra * (dB) | 40.4 |
* ... kleiner is beter
(-) De maximumtemperatuur aan de bovenzijde bedraagt 48 °C / 118 F, vergeleken met het gemiddelde van 35.9 °C / 97 F, variërend van 21.4 tot 59 °C voor de klasse Subnotebook.
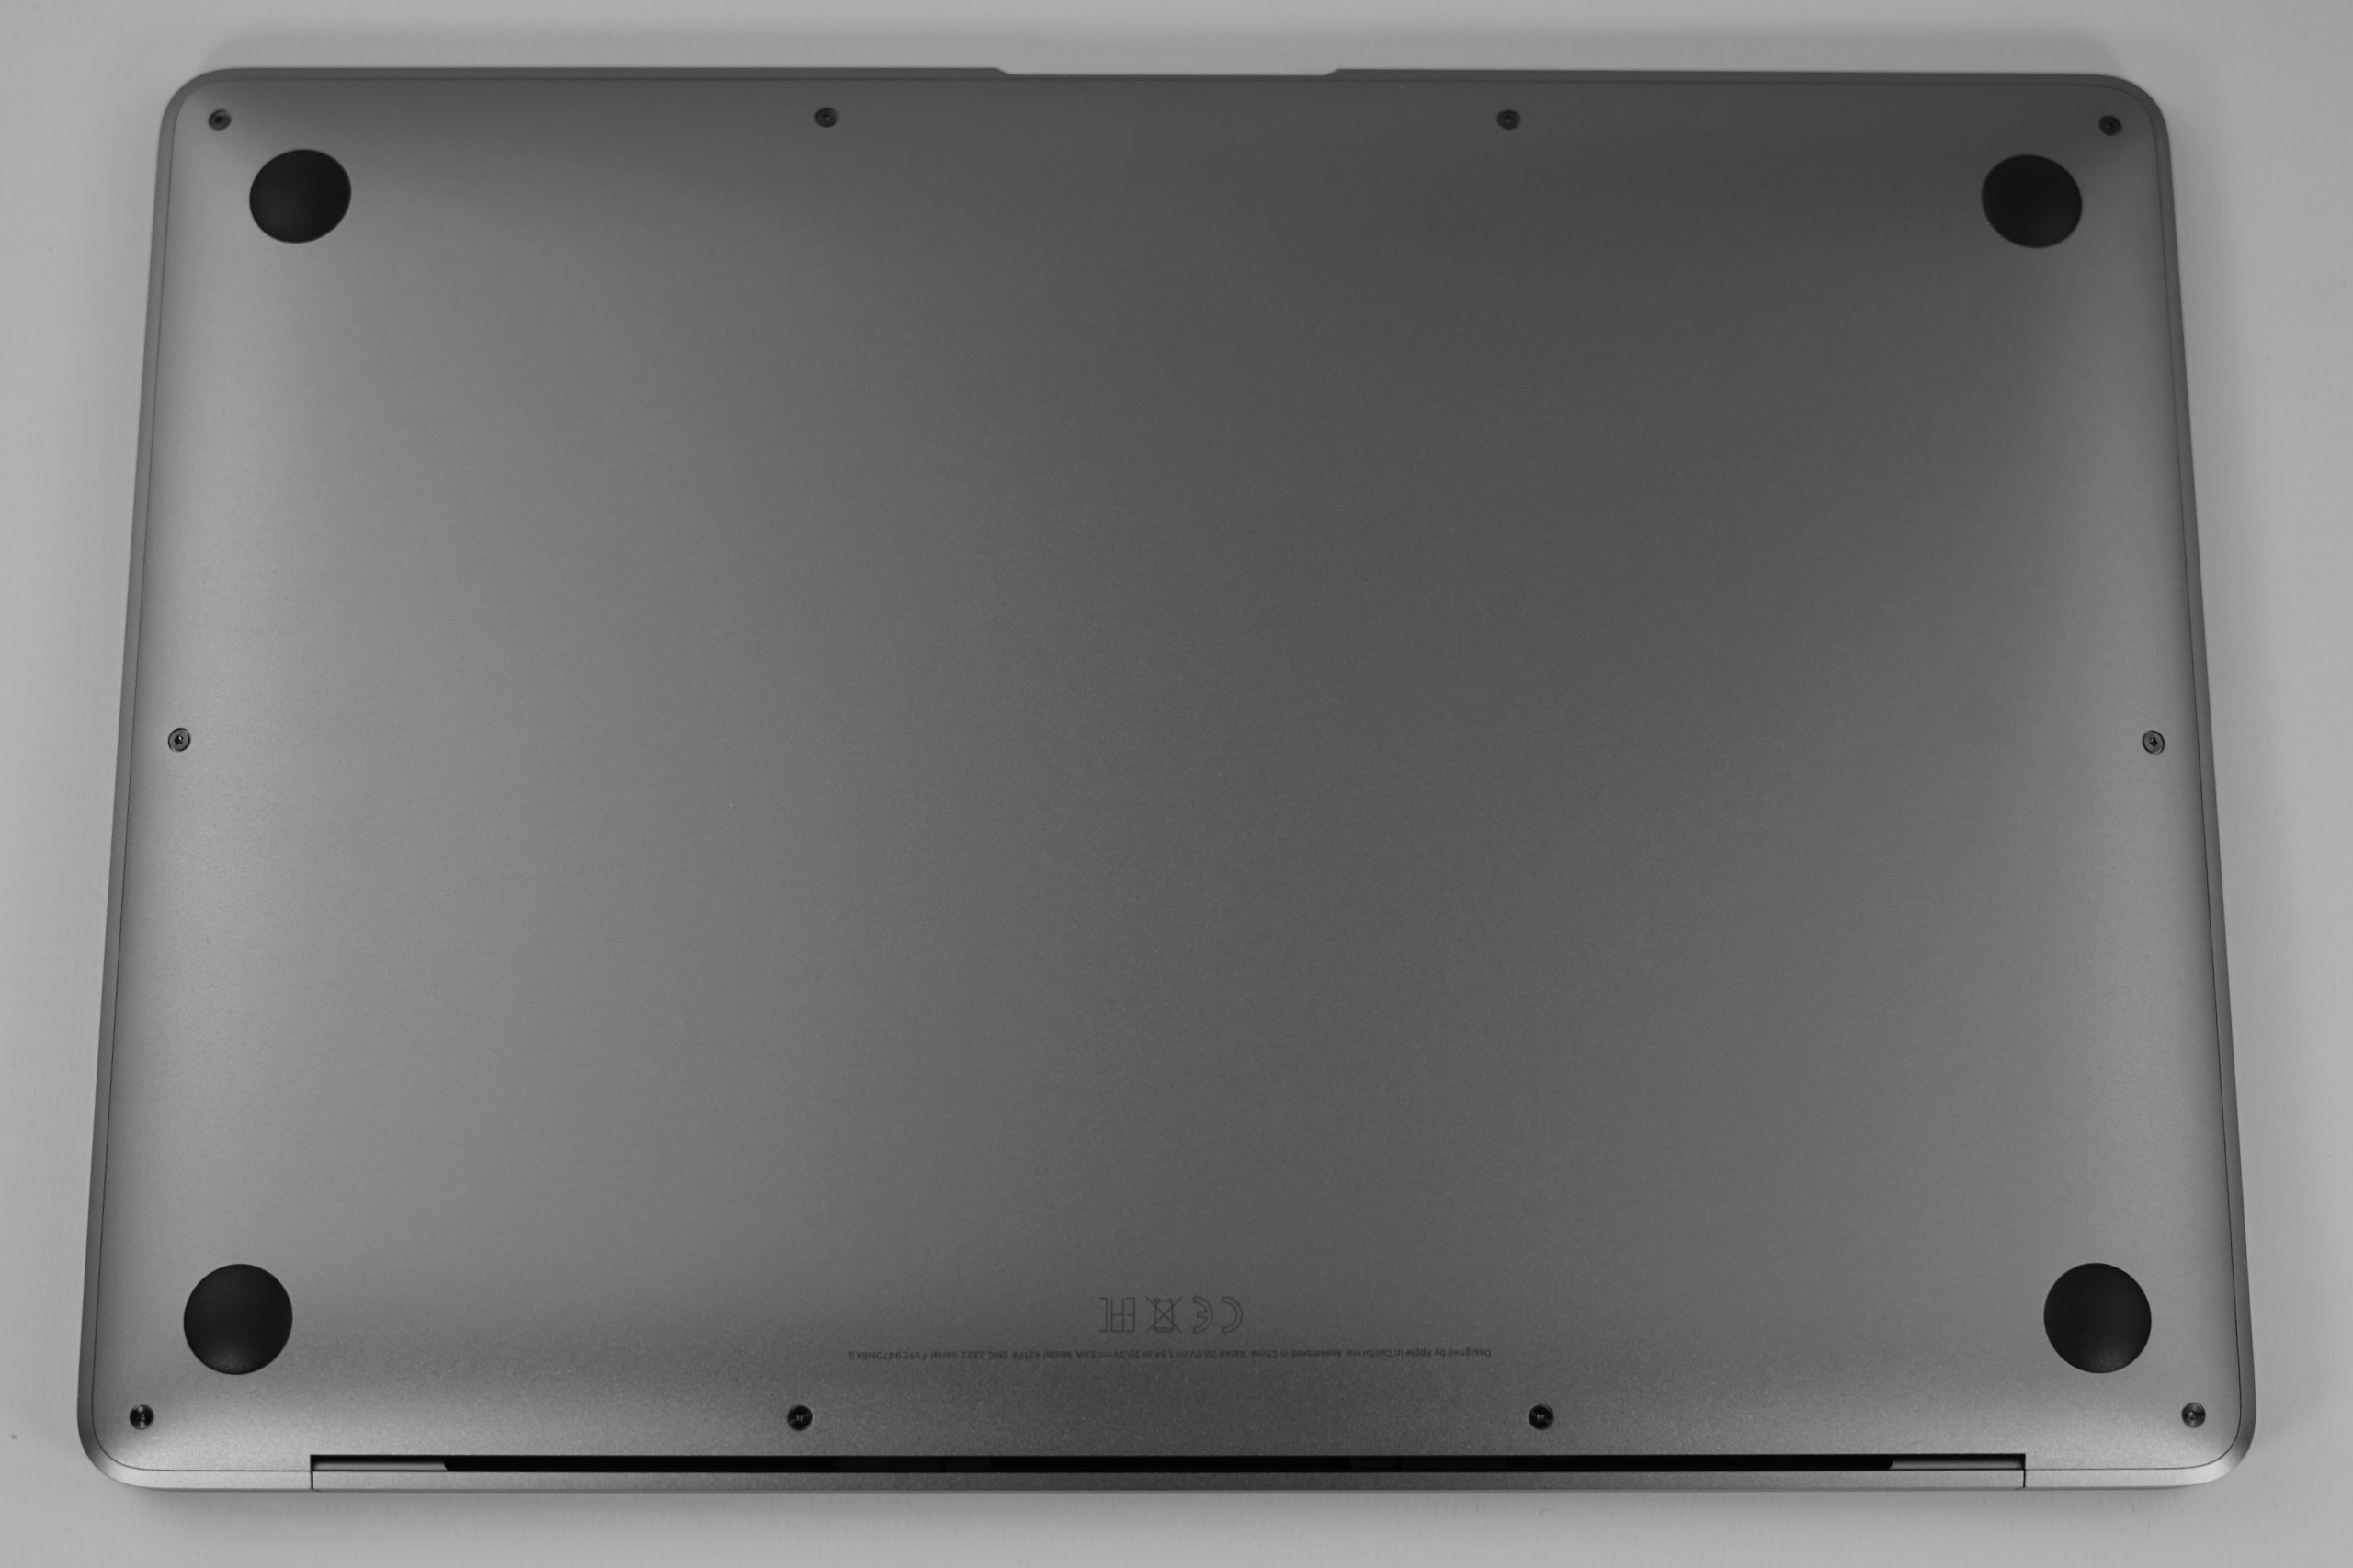
(±) De bodem warmt op tot een maximum van 40 °C / 104 F, vergeleken met een gemiddelde van 39.2 °C / 103 F
(+) Bij onbelast gebruik bedraagt de gemiddelde temperatuur voor de bovenzijde 27.7 °C / 82 F, vergeleken met het apparaatgemiddelde van 30.8 °C / 87 F.
(±) Bij het spelen van The Witcher 3 is de gemiddelde temperatuur voor de bovenzijde 32.8 °C / 91 F, vergeleken met het apparaatgemiddelde van 30.8 °C / 87 F.
(+) De palmsteunen en het touchpad zijn met een maximum van ###max## °C / 84.2 F koeler dan de huidtemperatuur en voelen daarom koel aan.
(±) De gemiddelde temperatuur van de handpalmsteun van soortgelijke toestellen bedroeg 28.2 °C / 82.8 F (-0.8 °C / -1.4 F).
Apple MacBook Air 2020 i5 audioanalyse
(±) | luidspreker luidheid is gemiddeld maar goed (78.1 dB)
Bas 100 - 315 Hz
(+) | goede baars - slechts 4.3% verwijderd van de mediaan
(±) | lineariteit van de lage tonen is gemiddeld (11.5% delta ten opzichte van de vorige frequentie)
Midden 400 - 2000 Hz
(+) | evenwichtige middens - slechts 3.4% verwijderd van de mediaan
(+) | de middentonen zijn lineair (6.2% delta ten opzichte van de vorige frequentie)
Hoog 2 - 16 kHz
(+) | evenwichtige hoogtepunten - slechts 2% verwijderd van de mediaan
(+) | de hoge tonen zijn lineair (3.7% delta naar de vorige frequentie)
Algemeen 100 - 16.000 Hz
(+) | het totale geluid is lineair (9.9% verschil met de mediaan)
Vergeleken met dezelfde klasse
» 7% van alle geteste apparaten in deze klasse waren beter, 1% vergelijkbaar, 92% slechter
» De beste had een delta van 5%, het gemiddelde was 18%, de slechtste was 53%
Vergeleken met alle geteste toestellen
» 4% van alle geteste apparaten waren beter, 1% gelijk, 95% slechter
» De beste had een delta van 4%, het gemiddelde was 24%, de slechtste was 134%
Apple Macbook Air 2019 audioanalyse
(±) | luidspreker luidheid is gemiddeld maar goed (75.8 dB)
Bas 100 - 315 Hz
(±) | verminderde zeebaars - gemiddeld 8.9% lager dan de mediaan
(±) | lineariteit van de lage tonen is gemiddeld (11.6% delta ten opzichte van de vorige frequentie)
Midden 400 - 2000 Hz
(+) | evenwichtige middens - slechts 3% verwijderd van de mediaan
(+) | de middentonen zijn lineair (5.1% delta ten opzichte van de vorige frequentie)
Hoog 2 - 16 kHz
(+) | evenwichtige hoogtepunten - slechts 2.9% verwijderd van de mediaan
(+) | de hoge tonen zijn lineair (4.7% delta naar de vorige frequentie)
Algemeen 100 - 16.000 Hz
(+) | het totale geluid is lineair (14.3% verschil met de mediaan)
Vergeleken met dezelfde klasse
» 28% van alle geteste apparaten in deze klasse waren beter, 6% vergelijkbaar, 66% slechter
» De beste had een delta van 5%, het gemiddelde was 18%, de slechtste was 53%
Vergeleken met alle geteste toestellen
» 17% van alle geteste apparaten waren beter, 4% gelijk, 79% slechter
» De beste had een delta van 4%, het gemiddelde was 24%, de slechtste was 134%
Apple MacBook Pro 16 2019 i9 5500M audioanalyse
(+) | luidsprekers kunnen relatief luid spelen (82.3 dB)
Bas 100 - 315 Hz
(+) | goede baars - slechts 2.3% verwijderd van de mediaan
(+) | de lage tonen zijn lineair (5% delta naar de vorige frequentie)
Midden 400 - 2000 Hz
(+) | evenwichtige middens - slechts 2.7% verwijderd van de mediaan
(+) | de middentonen zijn lineair (3.4% delta ten opzichte van de vorige frequentie)
Hoog 2 - 16 kHz
(+) | evenwichtige hoogtepunten - slechts 2.1% verwijderd van de mediaan
(+) | de hoge tonen zijn lineair (2.6% delta naar de vorige frequentie)
Algemeen 100 - 16.000 Hz
(+) | het totale geluid is lineair (6.9% verschil met de mediaan)
Vergeleken met dezelfde klasse
» 5% van alle geteste apparaten in deze klasse waren beter, 1% vergelijkbaar, 94% slechter
» De beste had een delta van 5%, het gemiddelde was 17%, de slechtste was 45%
Vergeleken met alle geteste toestellen
» 1% van alle geteste apparaten waren beter, 0% gelijk, 99% slechter
» De beste had een delta van 4%, het gemiddelde was 24%, de slechtste was 134%
Microsoft Surface Laptop 3 13 Core i5-1035G7 audioanalyse
(±) | luidspreker luidheid is gemiddeld maar goed (79 dB)
Bas 100 - 315 Hz
(+) | goede baars - slechts 4.2% verwijderd van de mediaan
(±) | lineariteit van de lage tonen is gemiddeld (10.5% delta ten opzichte van de vorige frequentie)
Midden 400 - 2000 Hz
(+) | evenwichtige middens - slechts 3.6% verwijderd van de mediaan
(±) | lineariteit van de middentonen is gemiddeld (7.1% delta ten opzichte van de vorige frequentie)
Hoog 2 - 16 kHz
(+) | evenwichtige hoogtepunten - slechts 1.8% verwijderd van de mediaan
(+) | de hoge tonen zijn lineair (6.5% delta naar de vorige frequentie)
Algemeen 100 - 16.000 Hz
(+) | het totale geluid is lineair (11.4% verschil met de mediaan)
Vergeleken met dezelfde klasse
» 3% van alle geteste apparaten in deze klasse waren beter, 2% vergelijkbaar, 95% slechter
» De beste had een delta van 7%, het gemiddelde was 21%, de slechtste was 53%
Vergeleken met alle geteste toestellen
» 7% van alle geteste apparaten waren beter, 2% gelijk, 91% slechter
» De beste had een delta van 4%, het gemiddelde was 24%, de slechtste was 134%
Dell XPS 13 9300 i5 FHD audioanalyse
(±) | luidspreker luidheid is gemiddeld maar goed (78.4 dB)
Bas 100 - 315 Hz
(±) | verminderde zeebaars - gemiddeld 9.4% lager dan de mediaan
(±) | lineariteit van de lage tonen is gemiddeld (12.5% delta ten opzichte van de vorige frequentie)
Midden 400 - 2000 Hz
(±) | hogere middens - gemiddeld 6.7% hoger dan de mediaan
(+) | de middentonen zijn lineair (5.6% delta ten opzichte van de vorige frequentie)
Hoog 2 - 16 kHz
(+) | evenwichtige hoogtepunten - slechts 4% verwijderd van de mediaan
(+) | de hoge tonen zijn lineair (5% delta naar de vorige frequentie)
Algemeen 100 - 16.000 Hz
(±) | lineariteit van het totale geluid is gemiddeld (19.8% verschil met de mediaan)
Vergeleken met dezelfde klasse
» 62% van alle geteste apparaten in deze klasse waren beter, 7% vergelijkbaar, 31% slechter
» De beste had een delta van 5%, het gemiddelde was 18%, de slechtste was 53%
Vergeleken met alle geteste toestellen
» 50% van alle geteste apparaten waren beter, 7% gelijk, 43% slechter
» De beste had een delta van 4%, het gemiddelde was 24%, de slechtste was 134%
| Uit / Standby | |
| Inactief | |
| Belasting |
|
Key:
min: | |
| Apple MacBook Air 2020 i5 i5-1030NG7, Iris Plus Graphics G7 (Ice Lake 64 EU), Apple SSD AP0512, IPS, 2560x1600, 13.3" | Apple MacBook Air 2018 i5-8210Y, UHD Graphics 617, Apple SSD AP0256, IPS, 2560x1600, 13.3" | Apple MacBook Pro 13 2019 2TB3 i5-8257U, Iris Plus Graphics 645, Apple SSD AP0256, IPS, 2560x1600, 13.3" | Microsoft Surface Laptop 3 13 Core i5-1035G7 i5-1035G7, Iris Plus Graphics G7 (Ice Lake 64 EU), SK hynix BC501 HFM256GDGTNG, IPS, 2256x1504, 13.5" | Acer Swift 3 SF313-52-71Y7 i7-1065G7, Iris Plus Graphics G7 (Ice Lake 64 EU), Intel SSD 660p 1TB SSDPEKNW010T8, IPS, 2256x1504, 13.5" | Dell XPS 13 9300 i5 FHD i5-1035G1, UHD Graphics G1 (Ice Lake 32 EU), Toshiba XG6 KXG60ZNV512G, IPS, 1920x1200, 13.4" | Gemiddeld Intel Iris Plus Graphics G7 (Ice Lake 64 EU) | Gemiddelde van klas Subnotebook | |
|---|---|---|---|---|---|---|---|---|
| Power Consumption | 5% | -28% | -51% | 21% | -26% | -35% | -42% | |
| Idle Minimum * (Watt) | 2.4 | 2.2 8% | 2.1 12% | 4.4 -83% | 1.8 25% | 3.4 -42% | 3.91 ? -63% | 3.86 ? -61% |
| Idle Average * (Watt) | 6.8 | 5.7 16% | 6.9 -1% | 7.5 -10% | 4.6 32% | 6 12% | 7.33 ? -8% | 6.61 ? 3% |
| Idle Maximum * (Watt) | 10.5 | 10.3 2% | 7.8 26% | 7.8 26% | 6.1 42% | 10.2 3% | 9.16 ? 13% | 8 ? 24% |
| Load Average * (Watt) | 25.7 | 25.6 -0% | 42 -63% | 41.9 -63% | 27.4 -7% | 36.6 -42% | 39.2 ? -53% | 42.2 ? -64% |
| Witcher 3 ultra * (Watt) | 24.5 | 40.8 -67% | ||||||
| Load Maximum * (Watt) | 30.4 | 30.6 -1% | 64.5 -112% | 63.9 -110% | 27 11% | 49.3 -62% | 49.8 ? -64% | 64.5 ? -112% |
* ... kleiner is beter
| Apple MacBook Air 2020 i5 i5-1030NG7, Iris Plus Graphics G7 (Ice Lake 64 EU), 49.9 Wh | Apple MacBook Air 2018 i5-8210Y, UHD Graphics 617, 50.3 Wh | Apple Macbook Air 2019 i5-8210Y, UHD Graphics 617, 49.9 Wh | Apple MacBook Pro 13 2019 2TB3 i5-8257U, Iris Plus Graphics 645, 58.2 Wh | Microsoft Surface Laptop 3 13 Core i5-1035G7 i5-1035G7, Iris Plus Graphics G7 (Ice Lake 64 EU), 45 Wh | Acer Swift 3 SF313-52-71Y7 i7-1065G7, Iris Plus Graphics G7 (Ice Lake 64 EU), 54.5 Wh | Dell XPS 13 9300 i5 FHD i5-1035G1, UHD Graphics G1 (Ice Lake 32 EU), 52 Wh | Gemiddelde van klas Subnotebook | |
|---|---|---|---|---|---|---|---|---|
| Batterijduur | -0% | 12% | 26% | -27% | -8% | 22% | 16% | |
| H.264 (h) | 10.7 | 12.3 15% | 10.5 -2% | 14.4 35% | 15.4 ? 44% | |||
| WiFi v1.3 (h) | 10.3 | 11.1 8% | 11.5 12% | 13 26% | 8.3 -19% | 10.3 0% | 11.7 14% | 14 ? 36% |
| Load (h) | 2.9 | 2.2 -24% | 1.9 -34% | 2.3 -21% | 3.4 17% | 1.969 ? -32% | ||
| Reader / Idle (h) | 34.4 | 21.4 | 28.6 ? |
Pro
Contra
Conclusie – Prestaties zijn nog altijd de achilleshiel van de MacBook Air

Dit is de verkorte versie van het originele artikel. Het volledige, Engelse testrapport vind je hier.
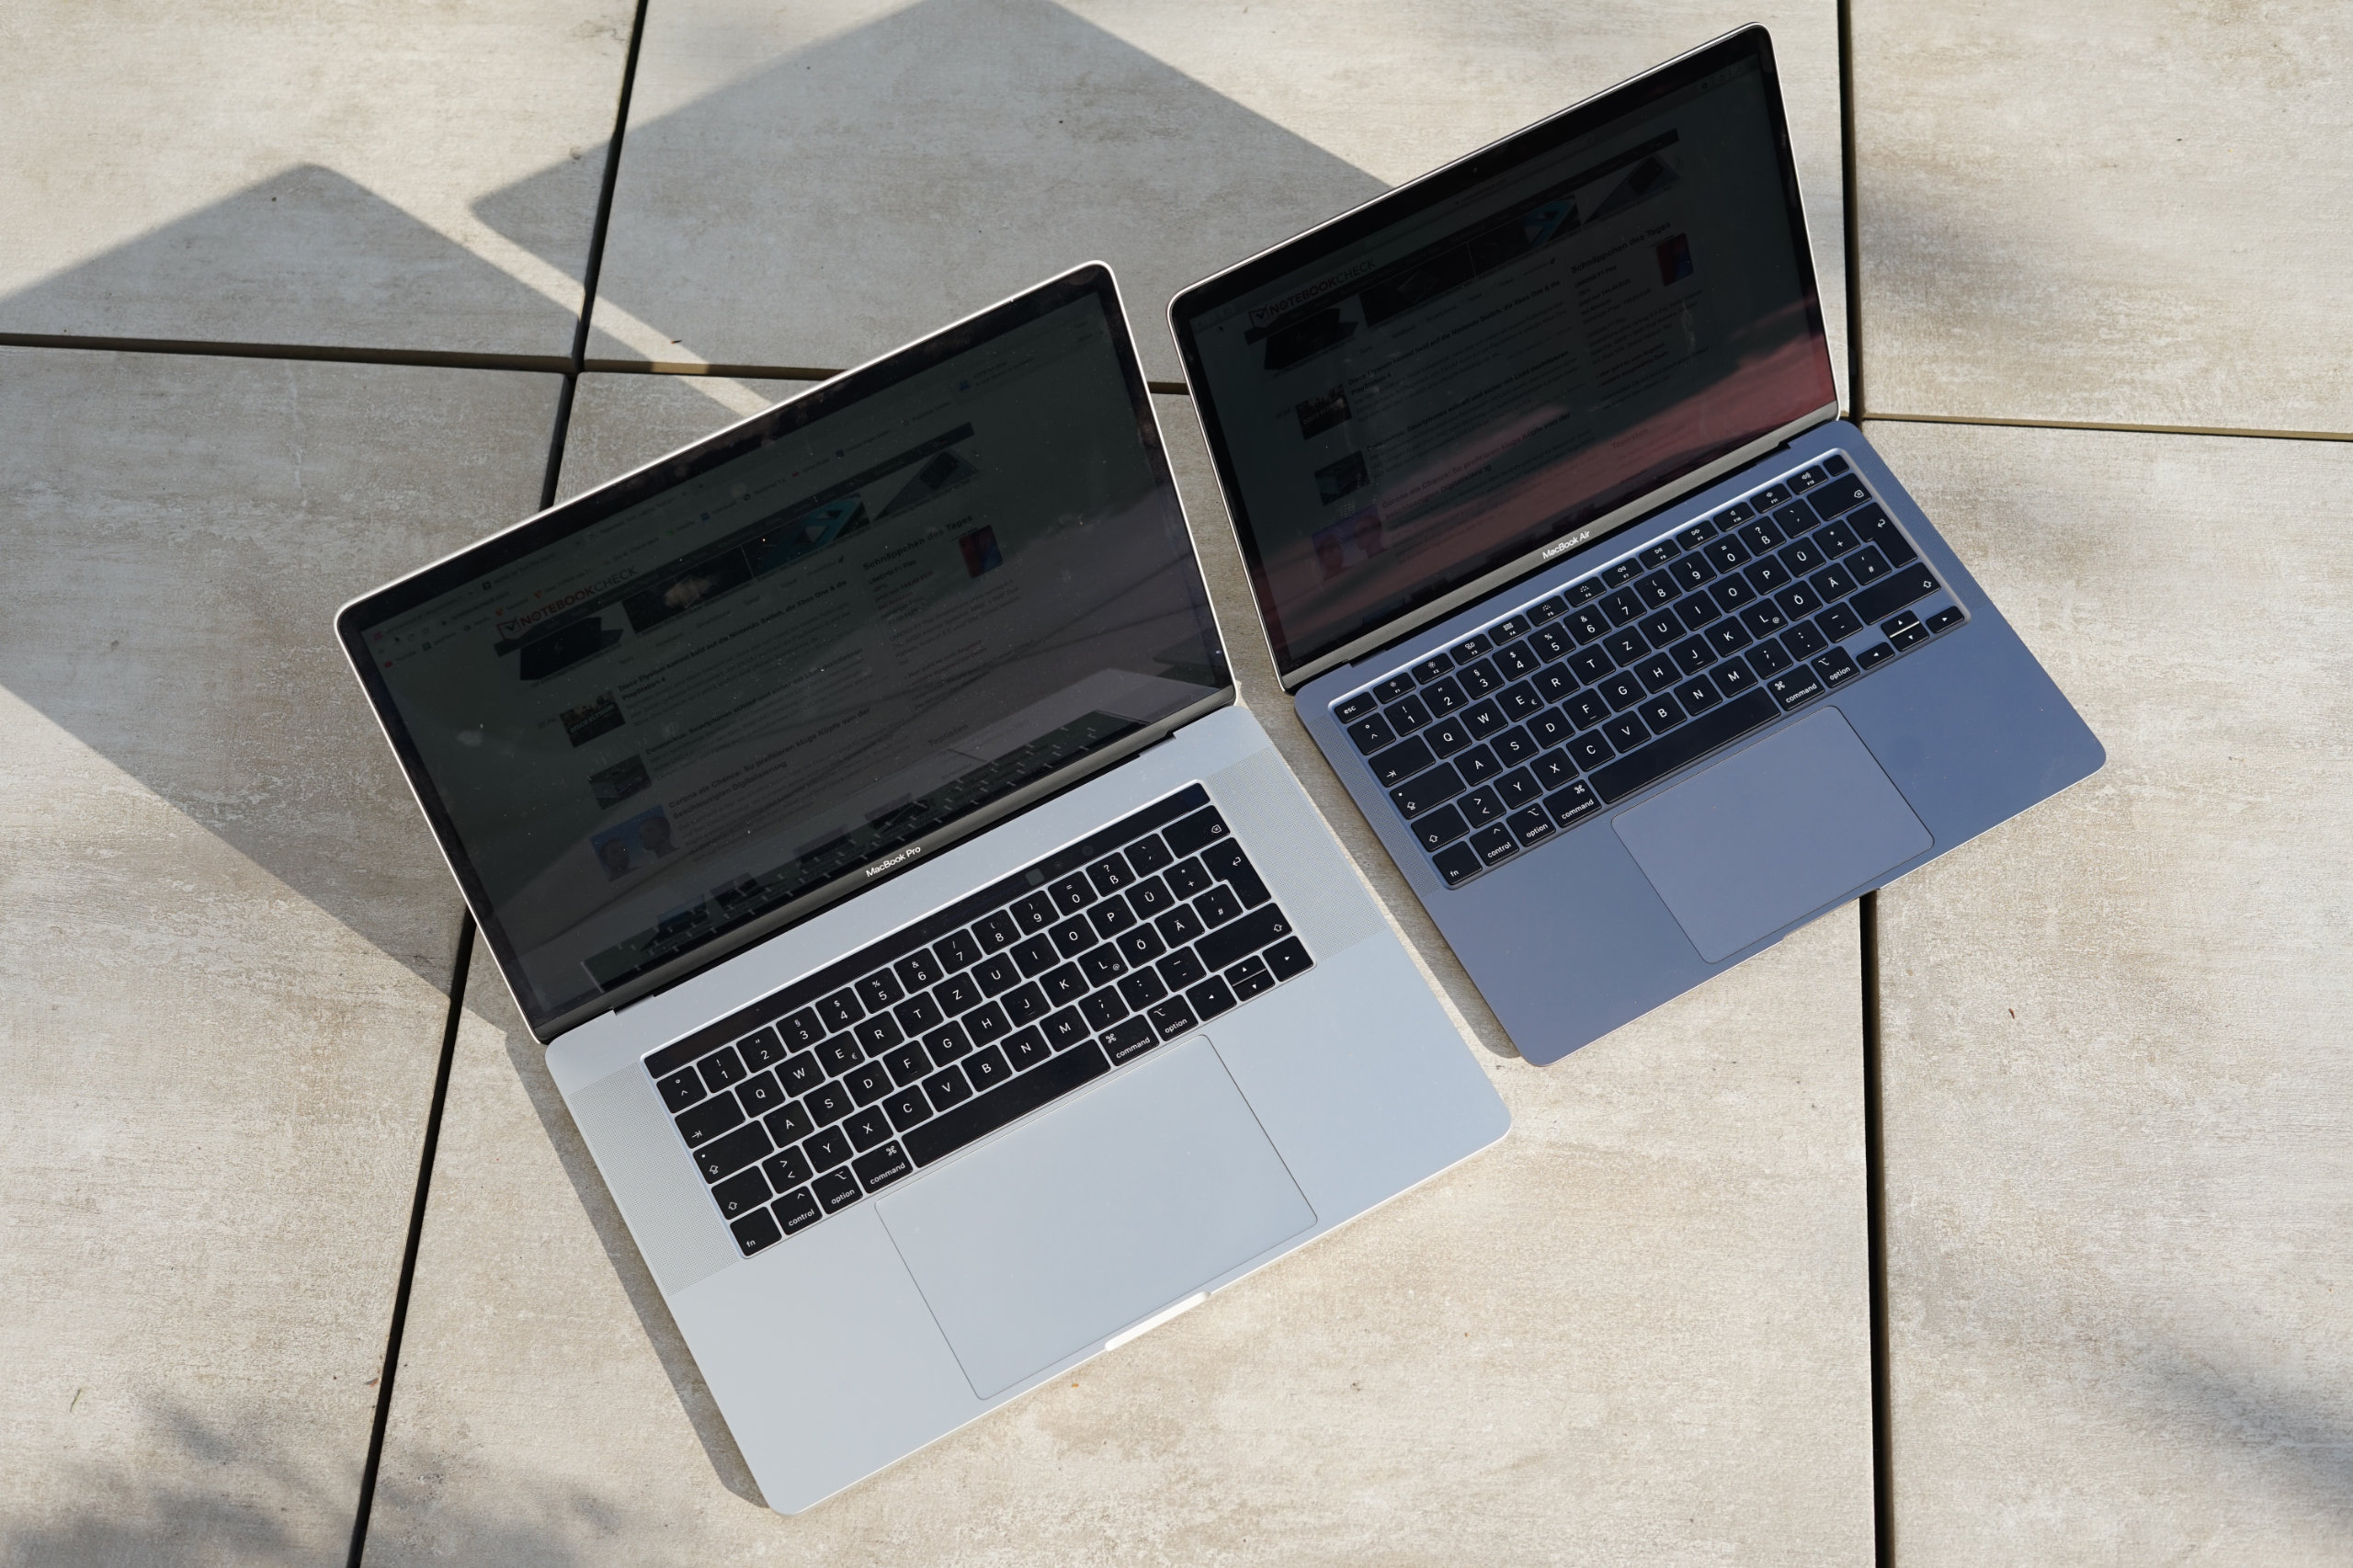
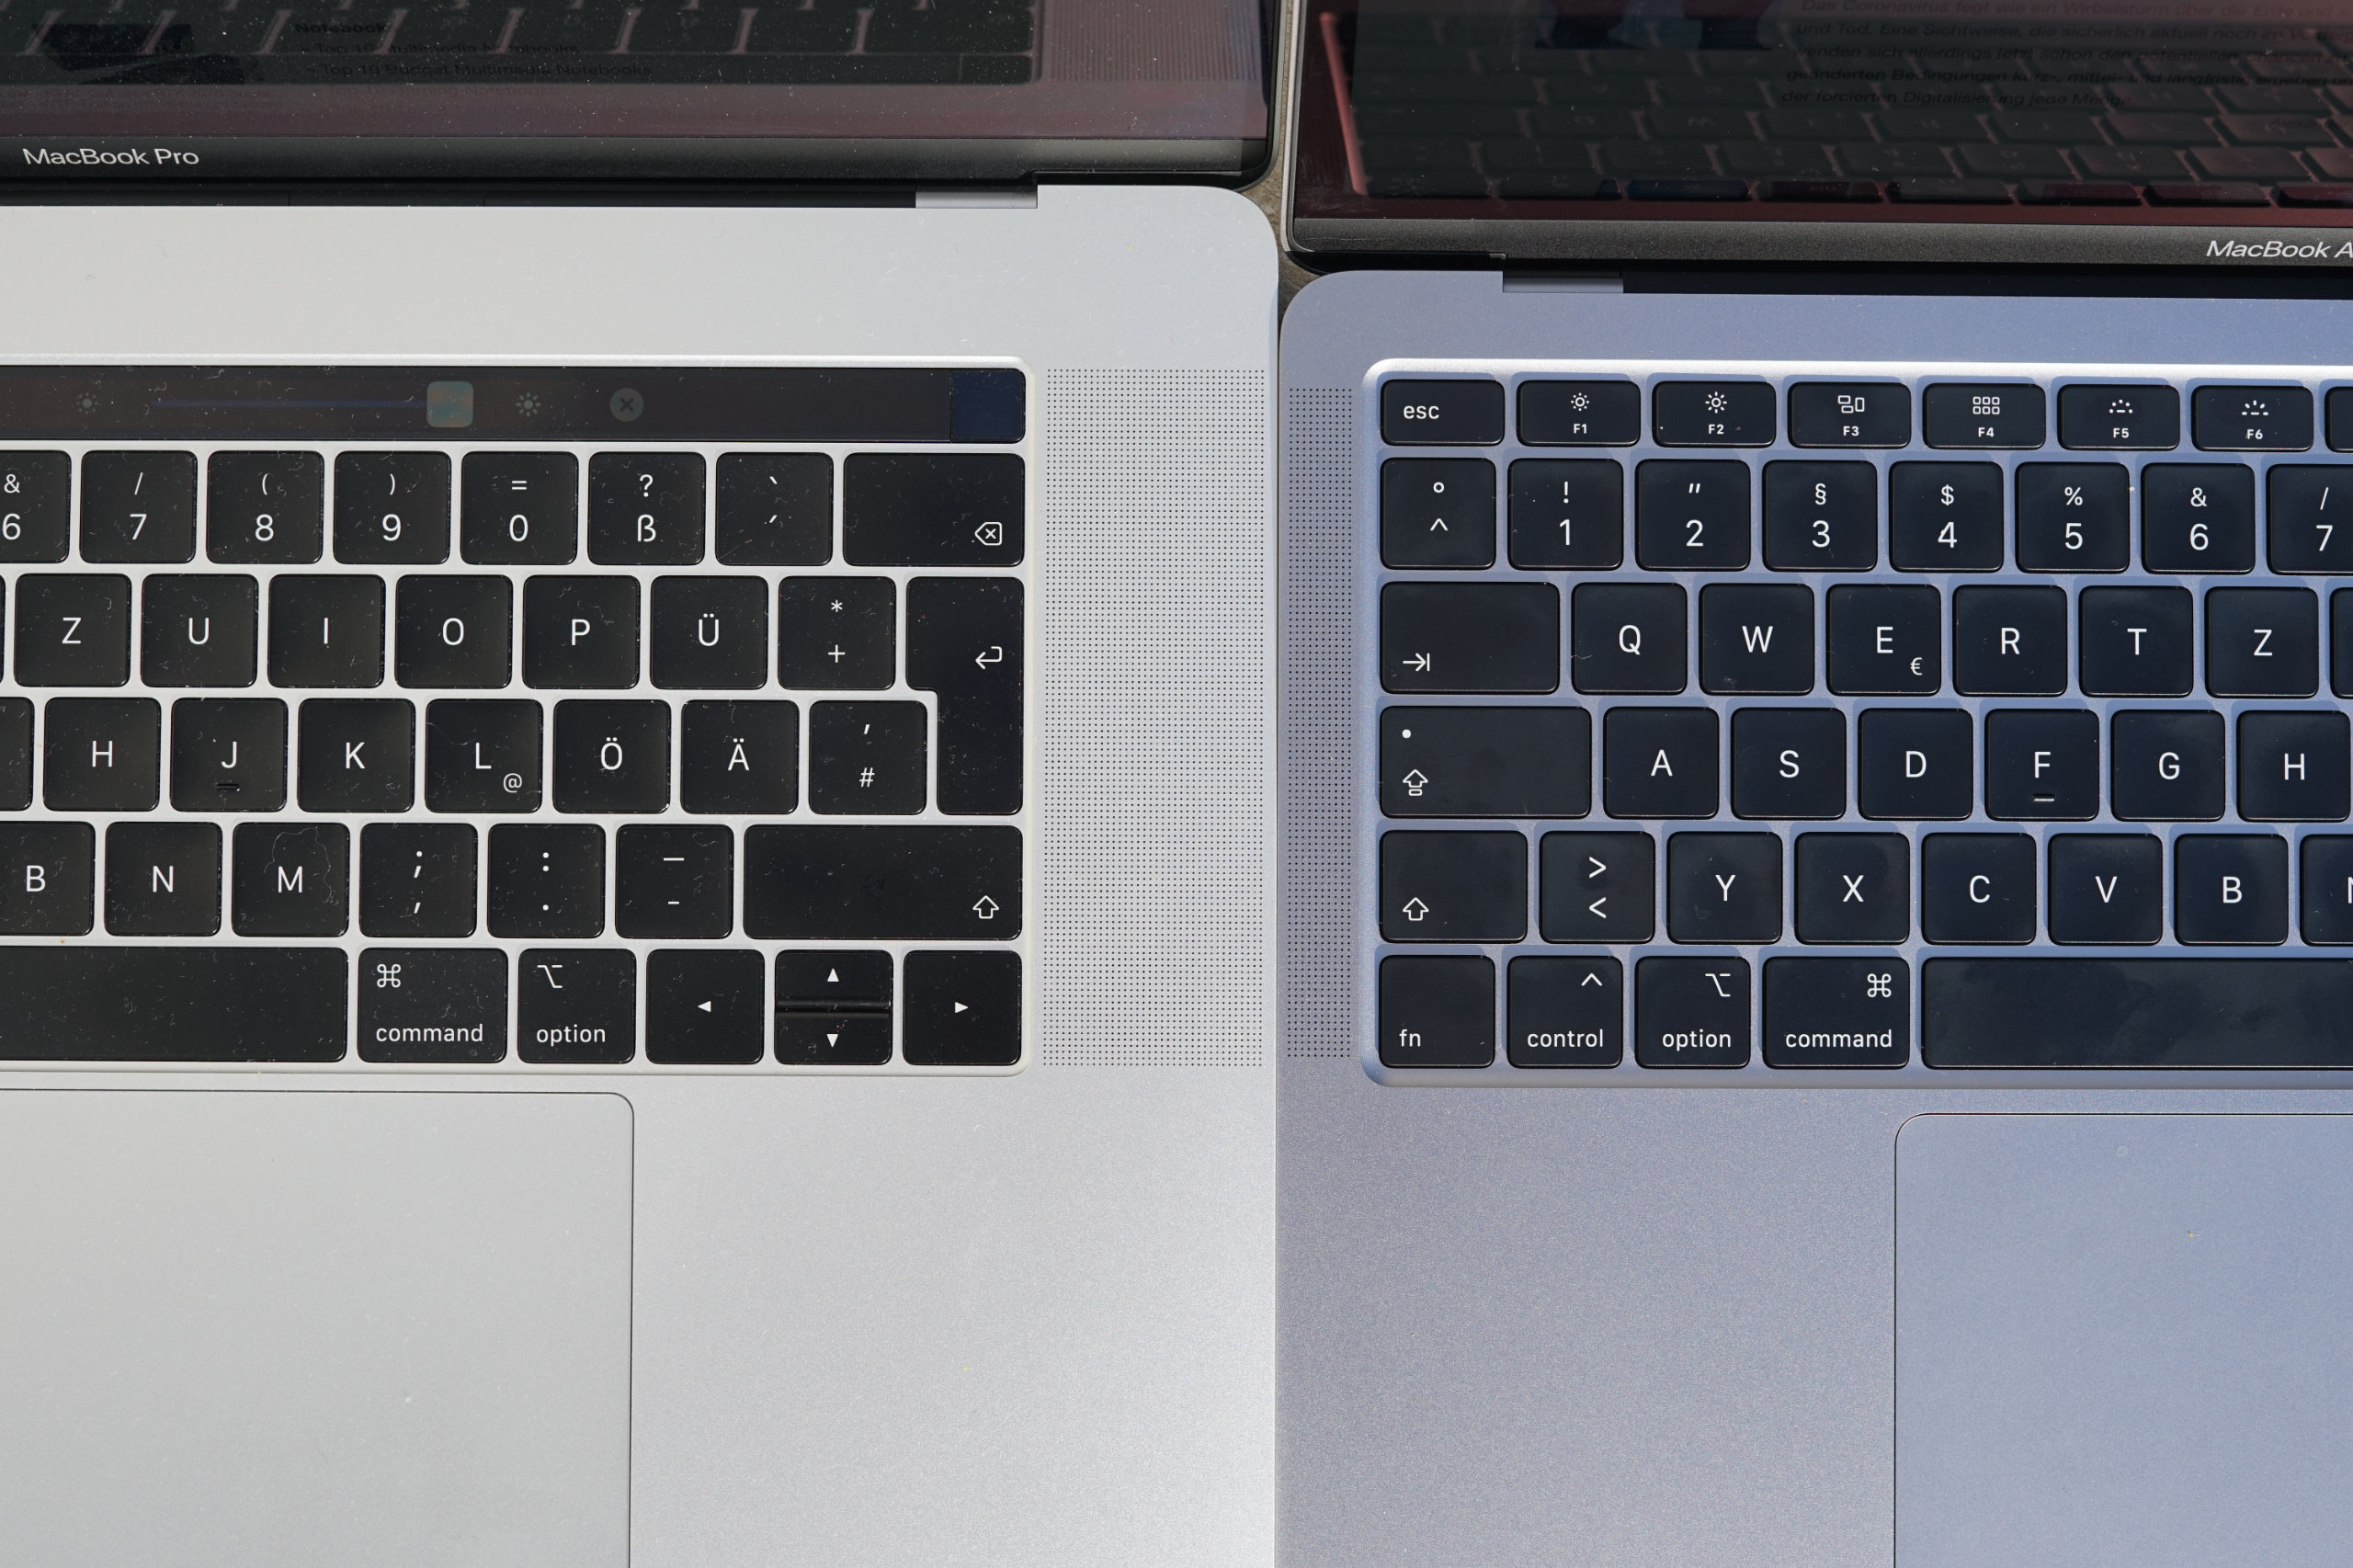
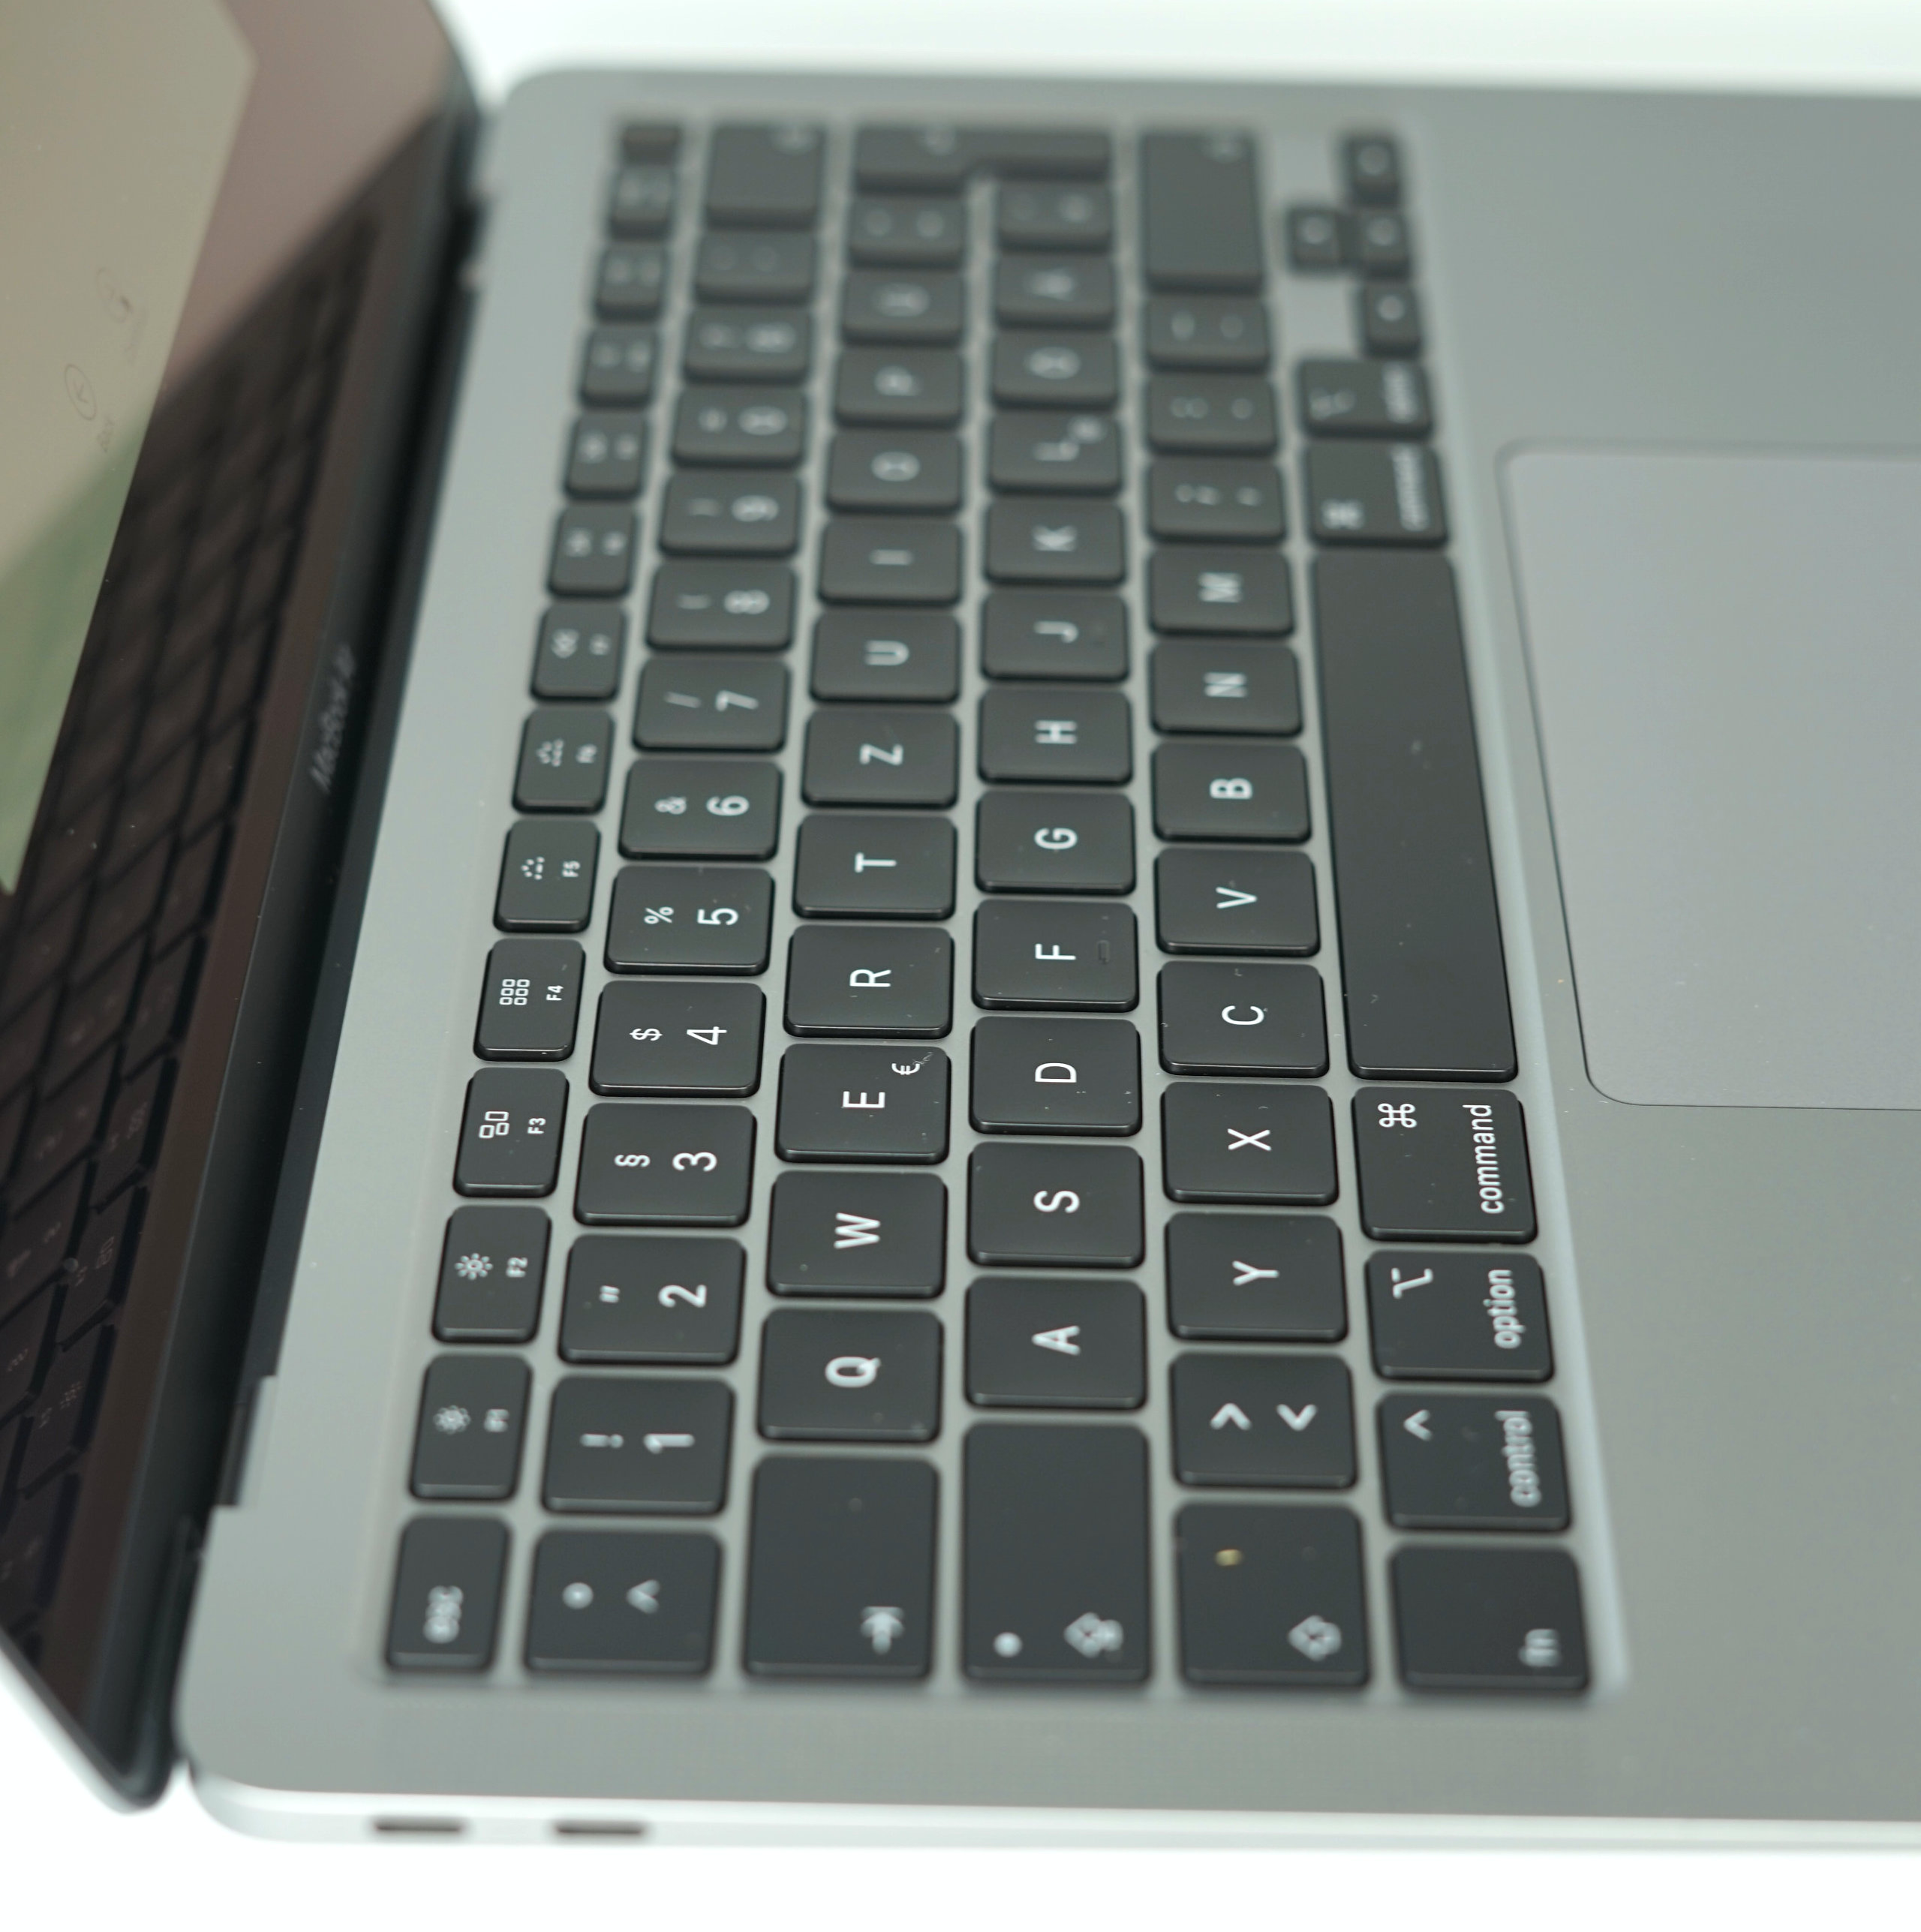
Er zijn momenteel veel reviews te lezen die zeggen dat de nieuwe MacBook Air de beste MacBook is die je nu kunt krijgen. Na onze uitgebreide testen kunnen we deze bewering niet bevestigen. Ja, het toetsenbord is nu beter en de prestaties zijn wat hoger, maar Apple beperkt nog steeds (onnodig) het potentieel van het toestel omwille van het gekozen koelsysteem. De kleine chassisventilator is gewoon niet erg efficiënt en kan een prestatievermindering niet voorkomen. Het is ook erg luid onder zwaardere werklasten.
Het is eigenlijk logisch dat Apple een langzamere processor implementeert en afstand houdt tot de MacBook Pro 13. En dit is over het algemeen geen slechte zaak, omdat de prestaties voldoende zijn voor basistaken zonder veel multitasken. We hadden echter graag een volledig passief gekoeld toestel gezien. Een geruisloos toestel zou het veel gemakkelijker hebben gemaakt om de lagere prestatiecijfers te accepteren. Misschien wil Apple deze stap reserveren voor komende generaties met zijn eigen ARM-processors (waarover al langer geruchten bestaan).
De prijs is gewoon te hoog: de processor van de nieuwe MacBook Air is simpelweg niet competitief in een machine van 1500 euro en het koelsysteem is te luidruchtig onder belasting. Wil je toch de nieuwe MacBook Air, dan raden we je aan te wachten op speciale aanbiedingen.
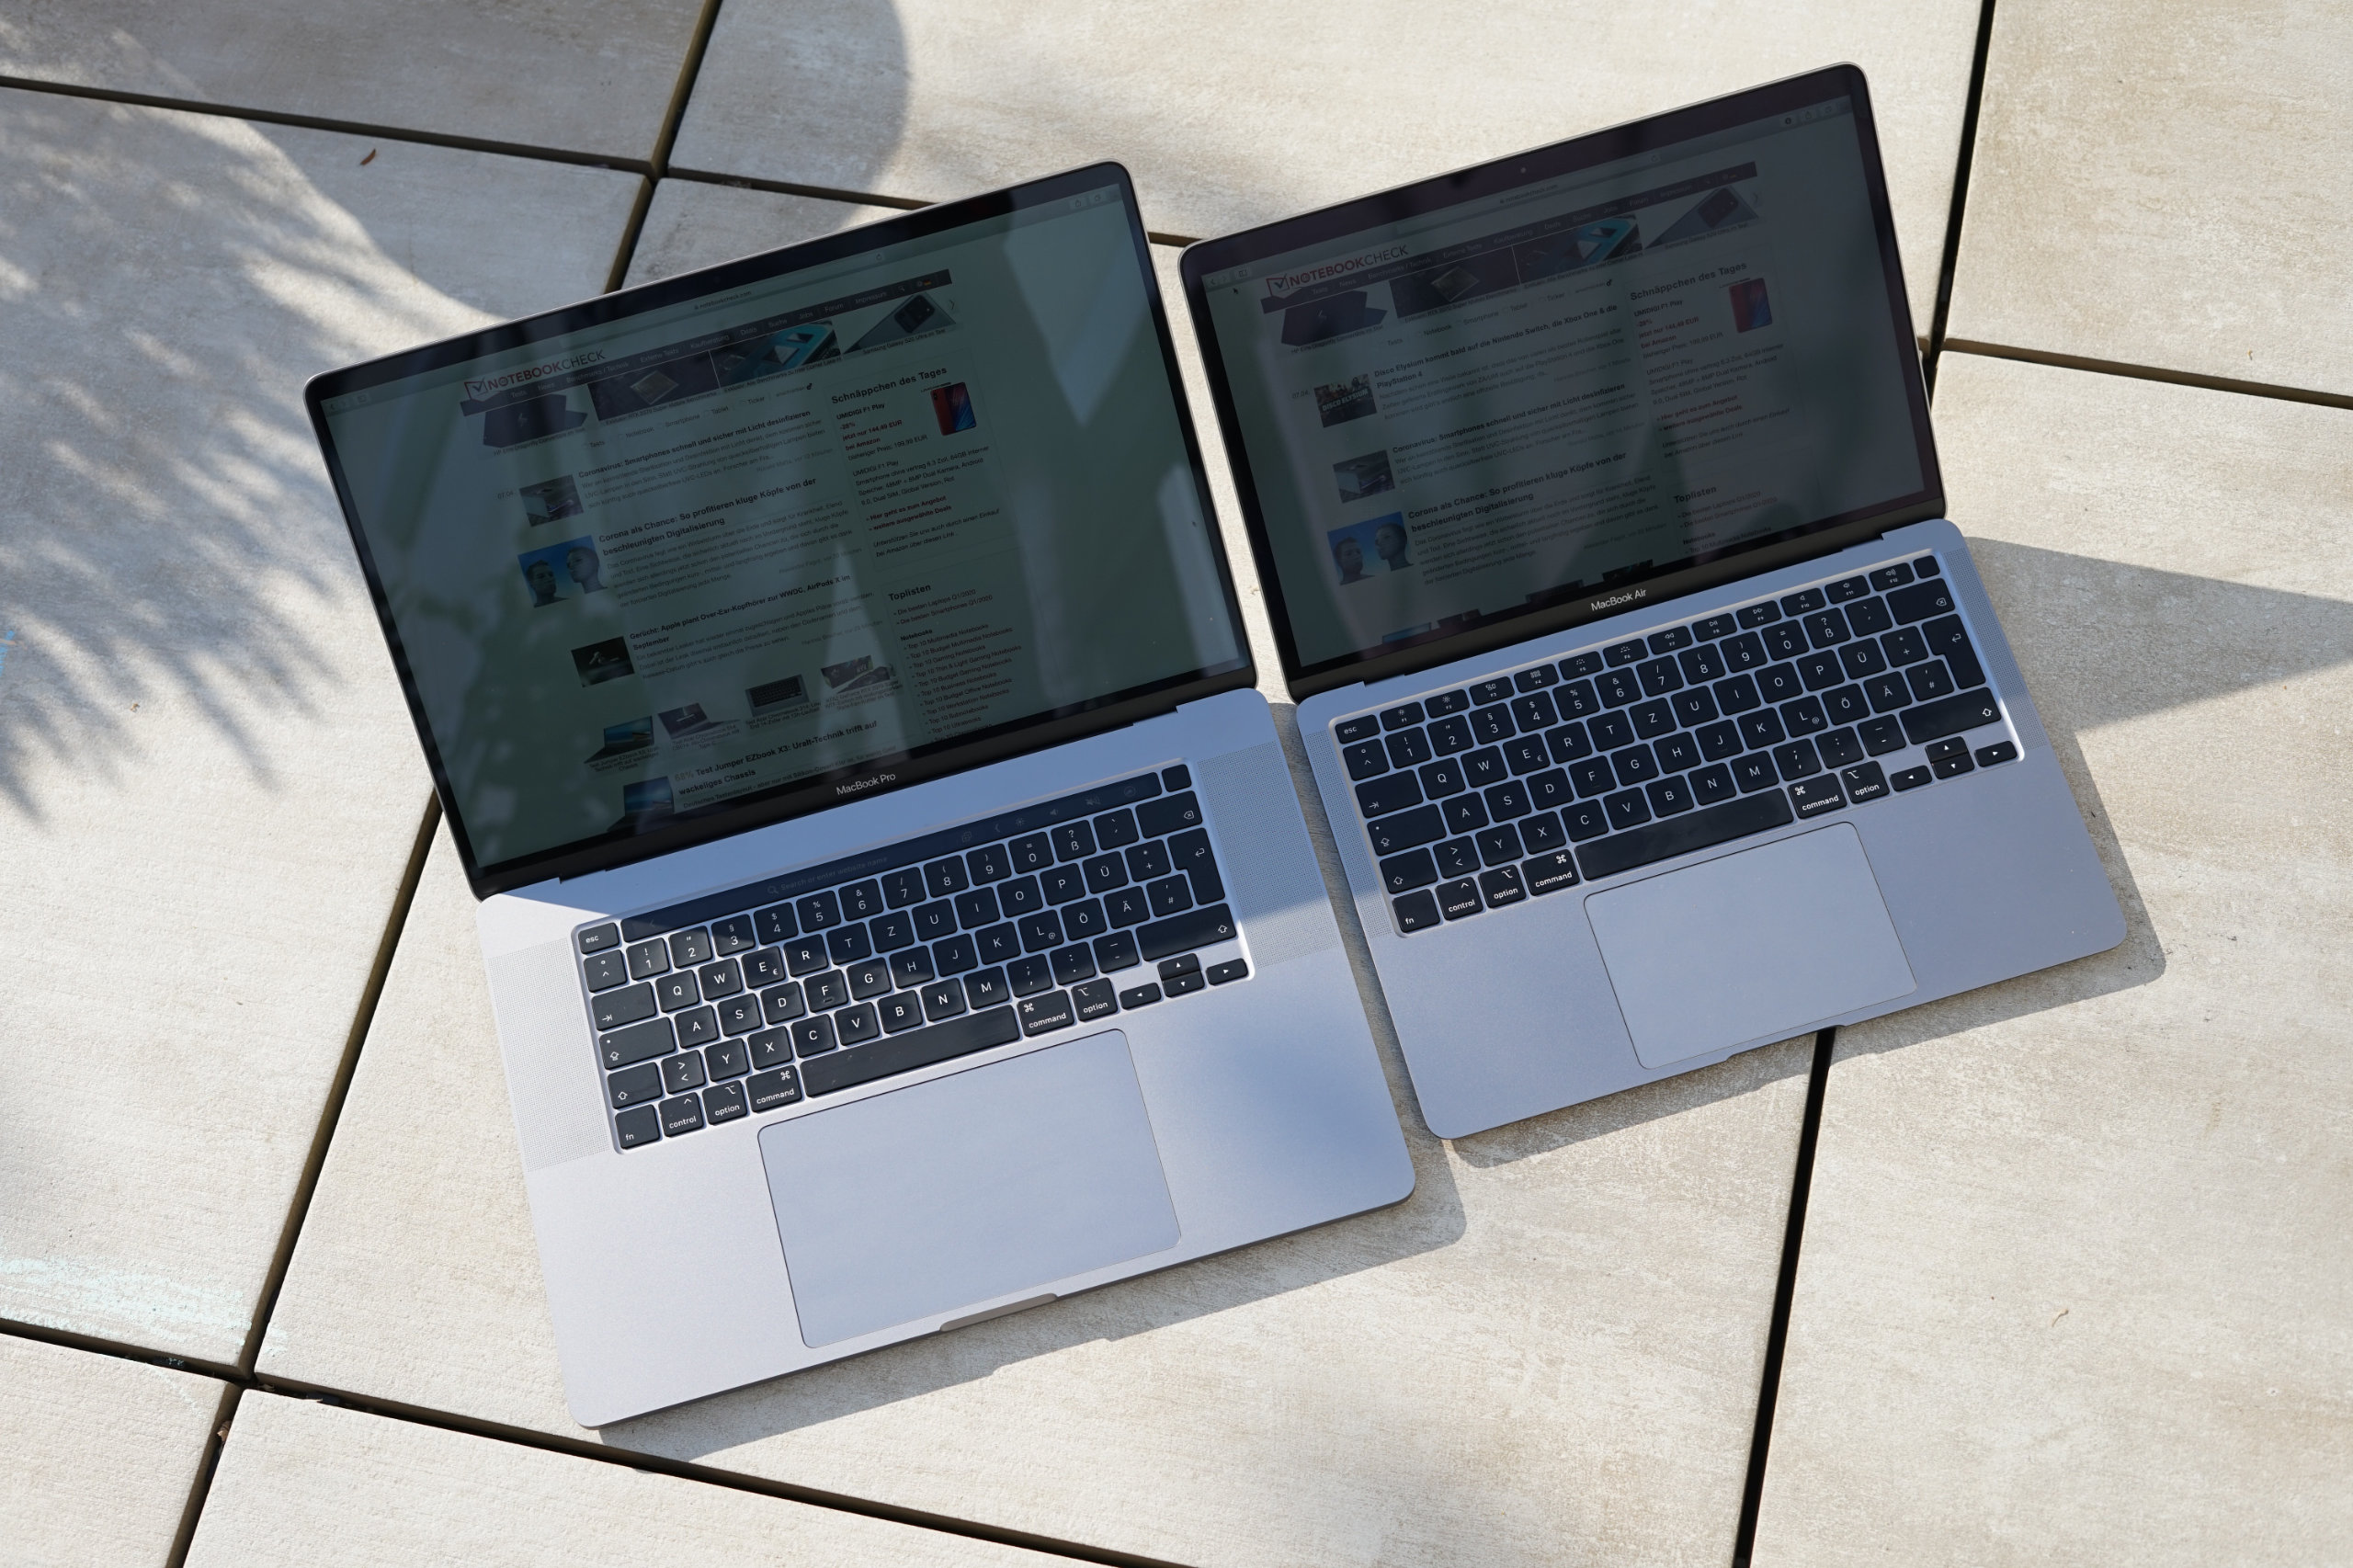
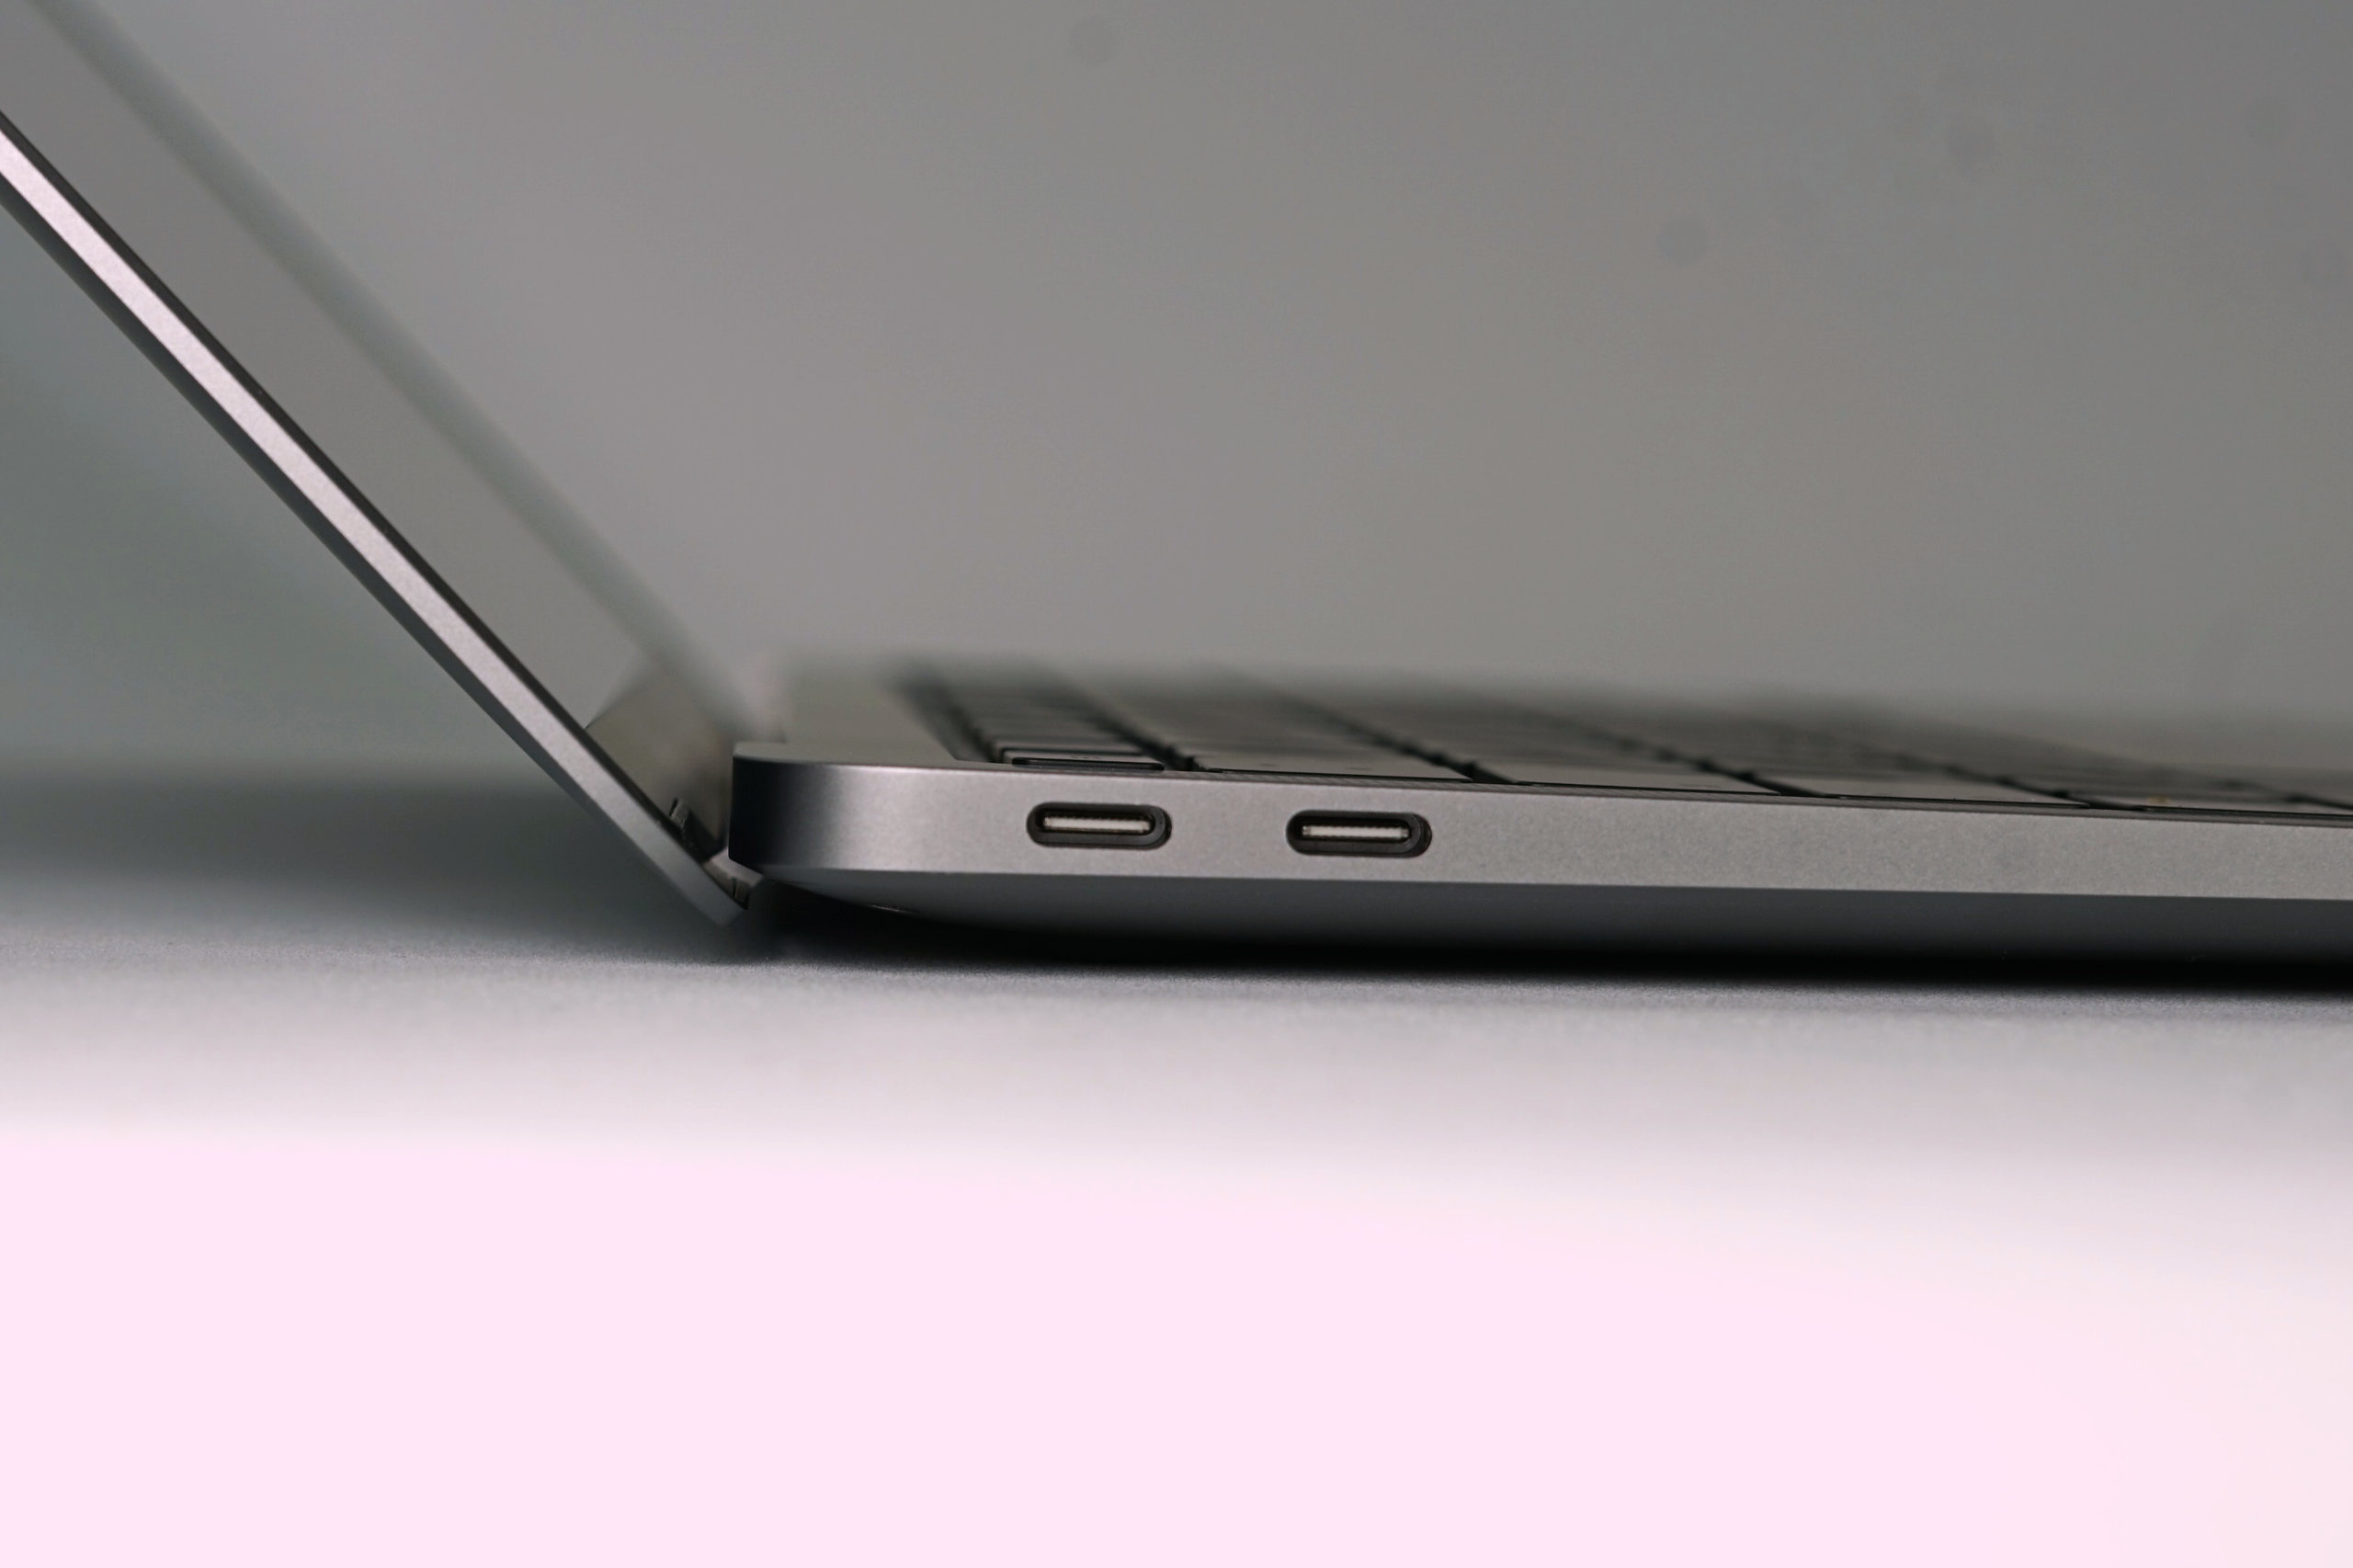
Het probleem is de hoge prijs, omdat je voor 1500 euro veel krachtigere laptops kunt krijgen, waaronder Apple's eigen MacBook Pro 13. Maar de Windows-concurrentie, zoals de nieuwe Dell XPS 139300 of de Acer Swift 3, hoeft zich zeker niet weg te stoppen en bieden zelfs meer features zoals Wi-Fi 6 en hogere prestaties.
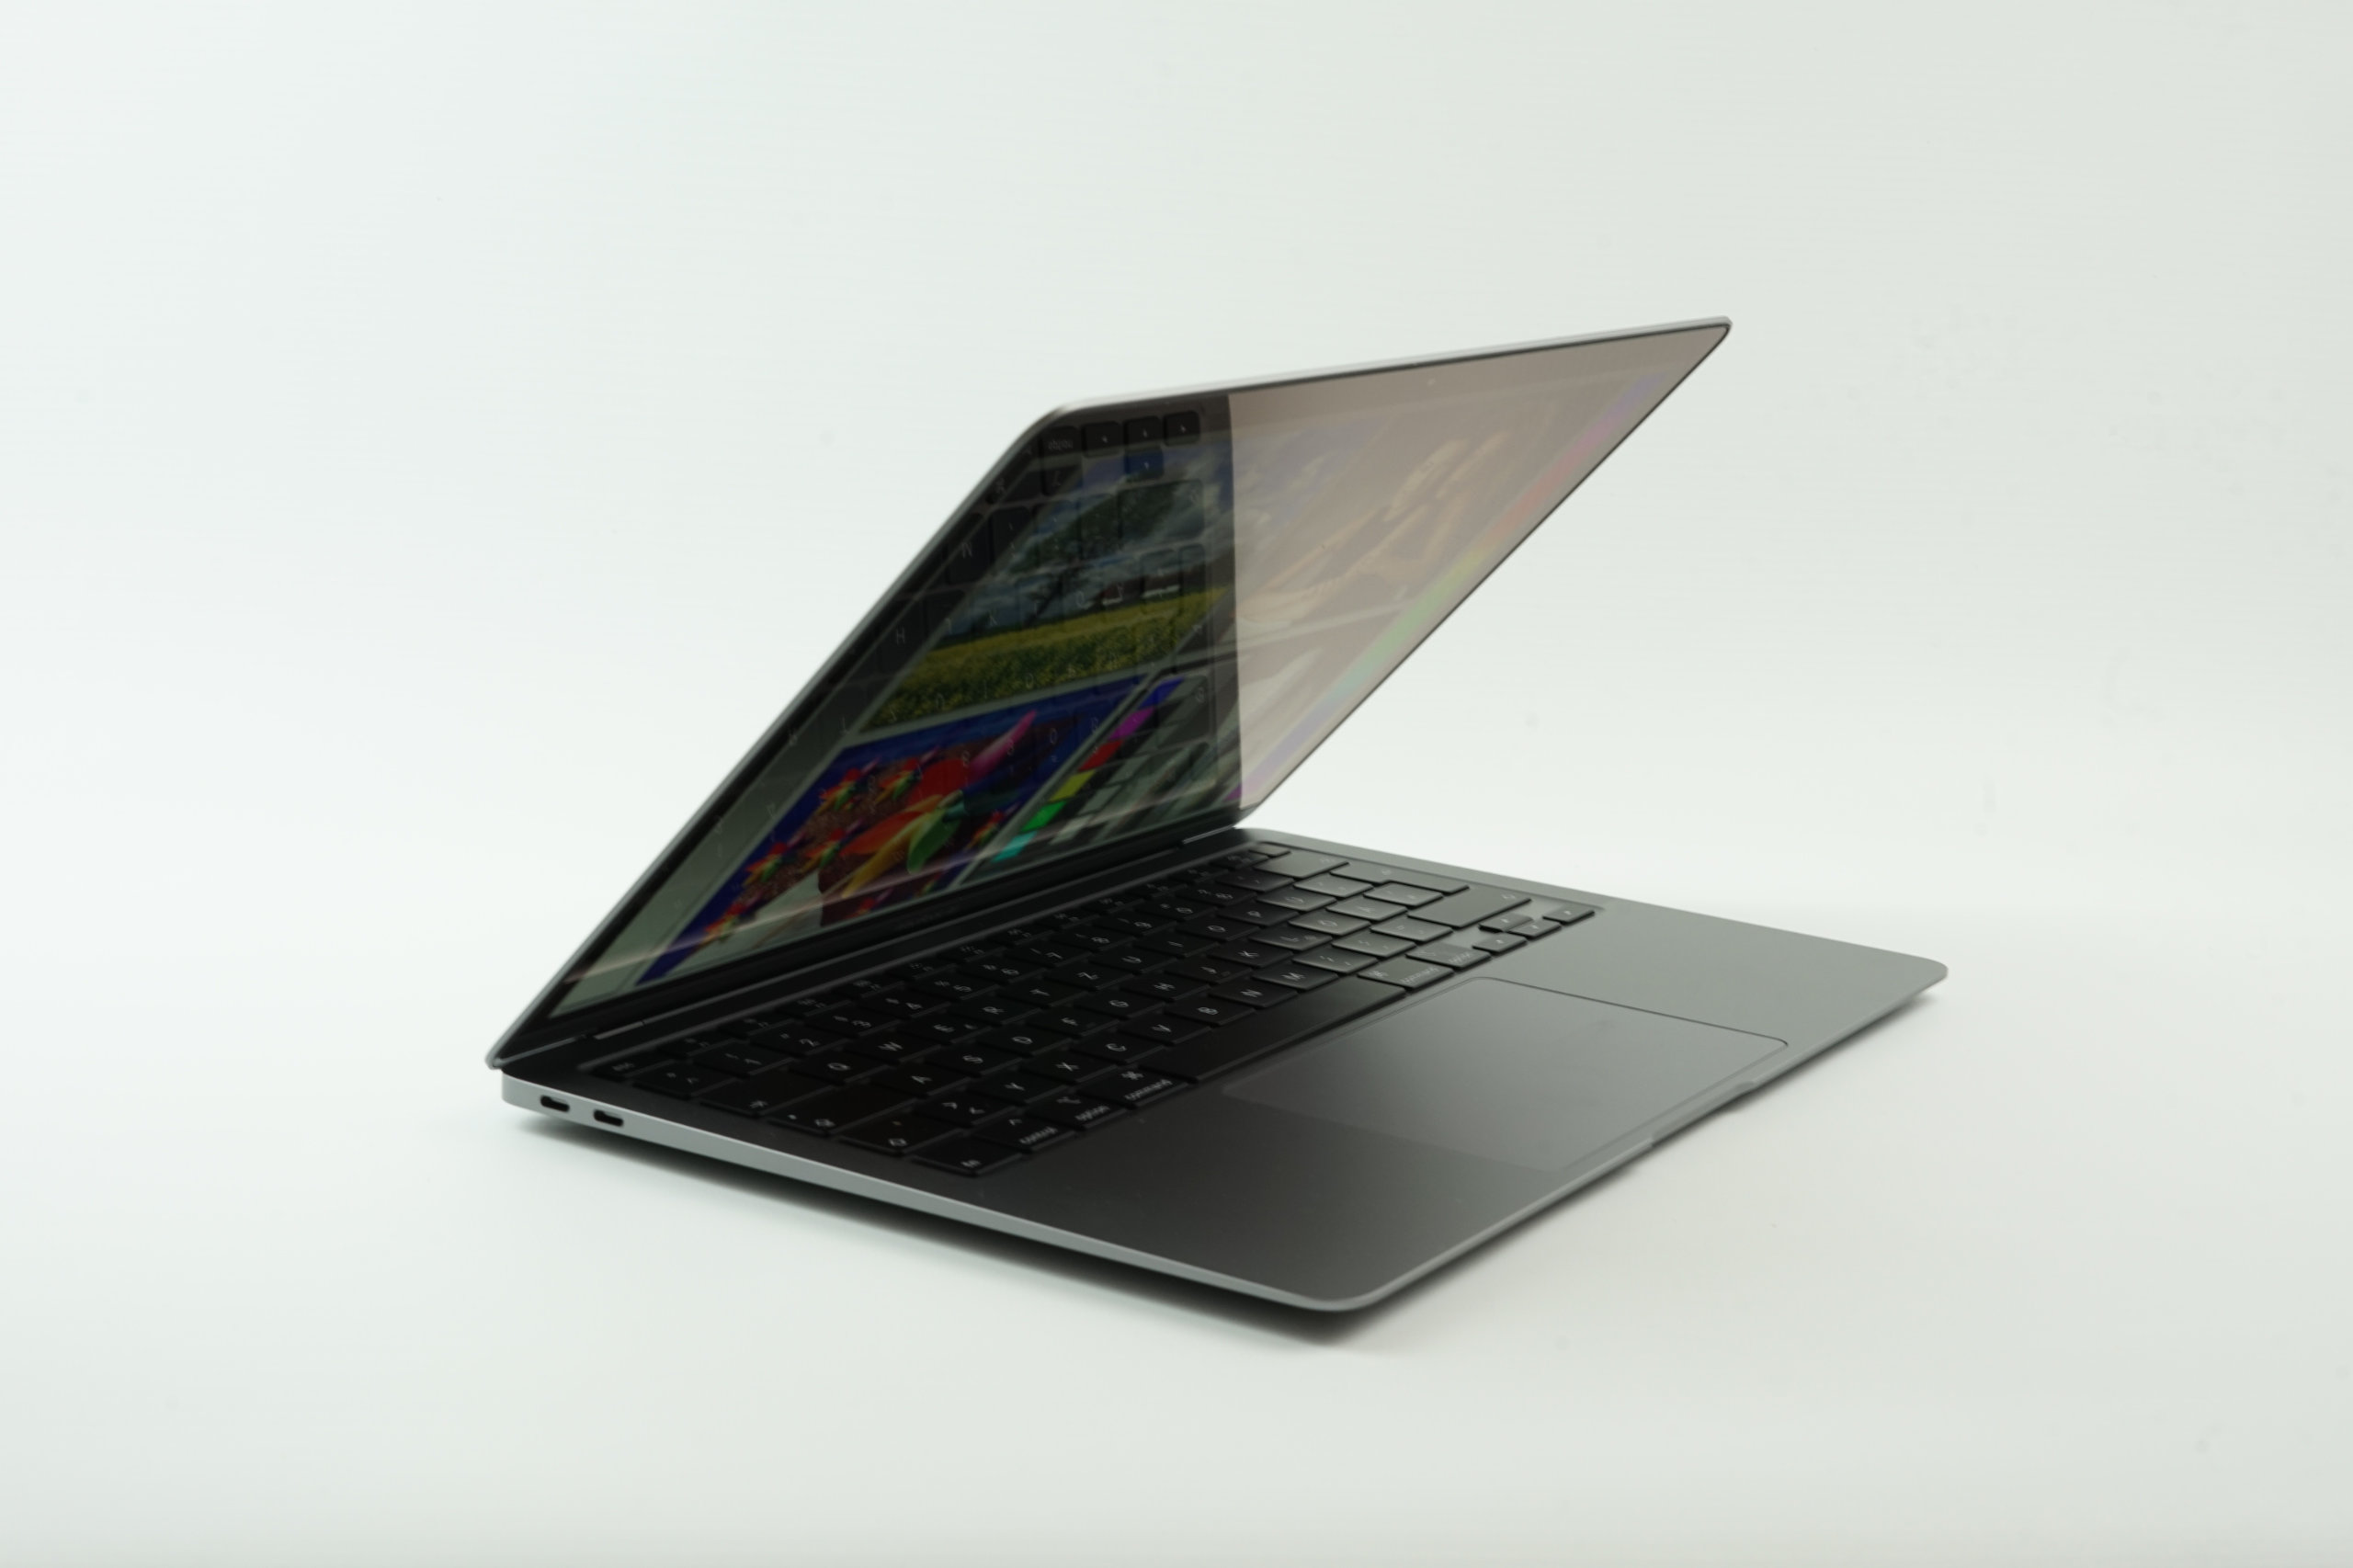
Als je kunt leven met de prestaties van de MacBook Air en deze alleen nodig hebt voor basistaken, maar veel waarde hecht aan een geweldige behuizing, een goed scherm en een lange batterijduur, dan krijg je met de nieuwe MacBook Air opnieuw een uitstekende mobiele metgezel.
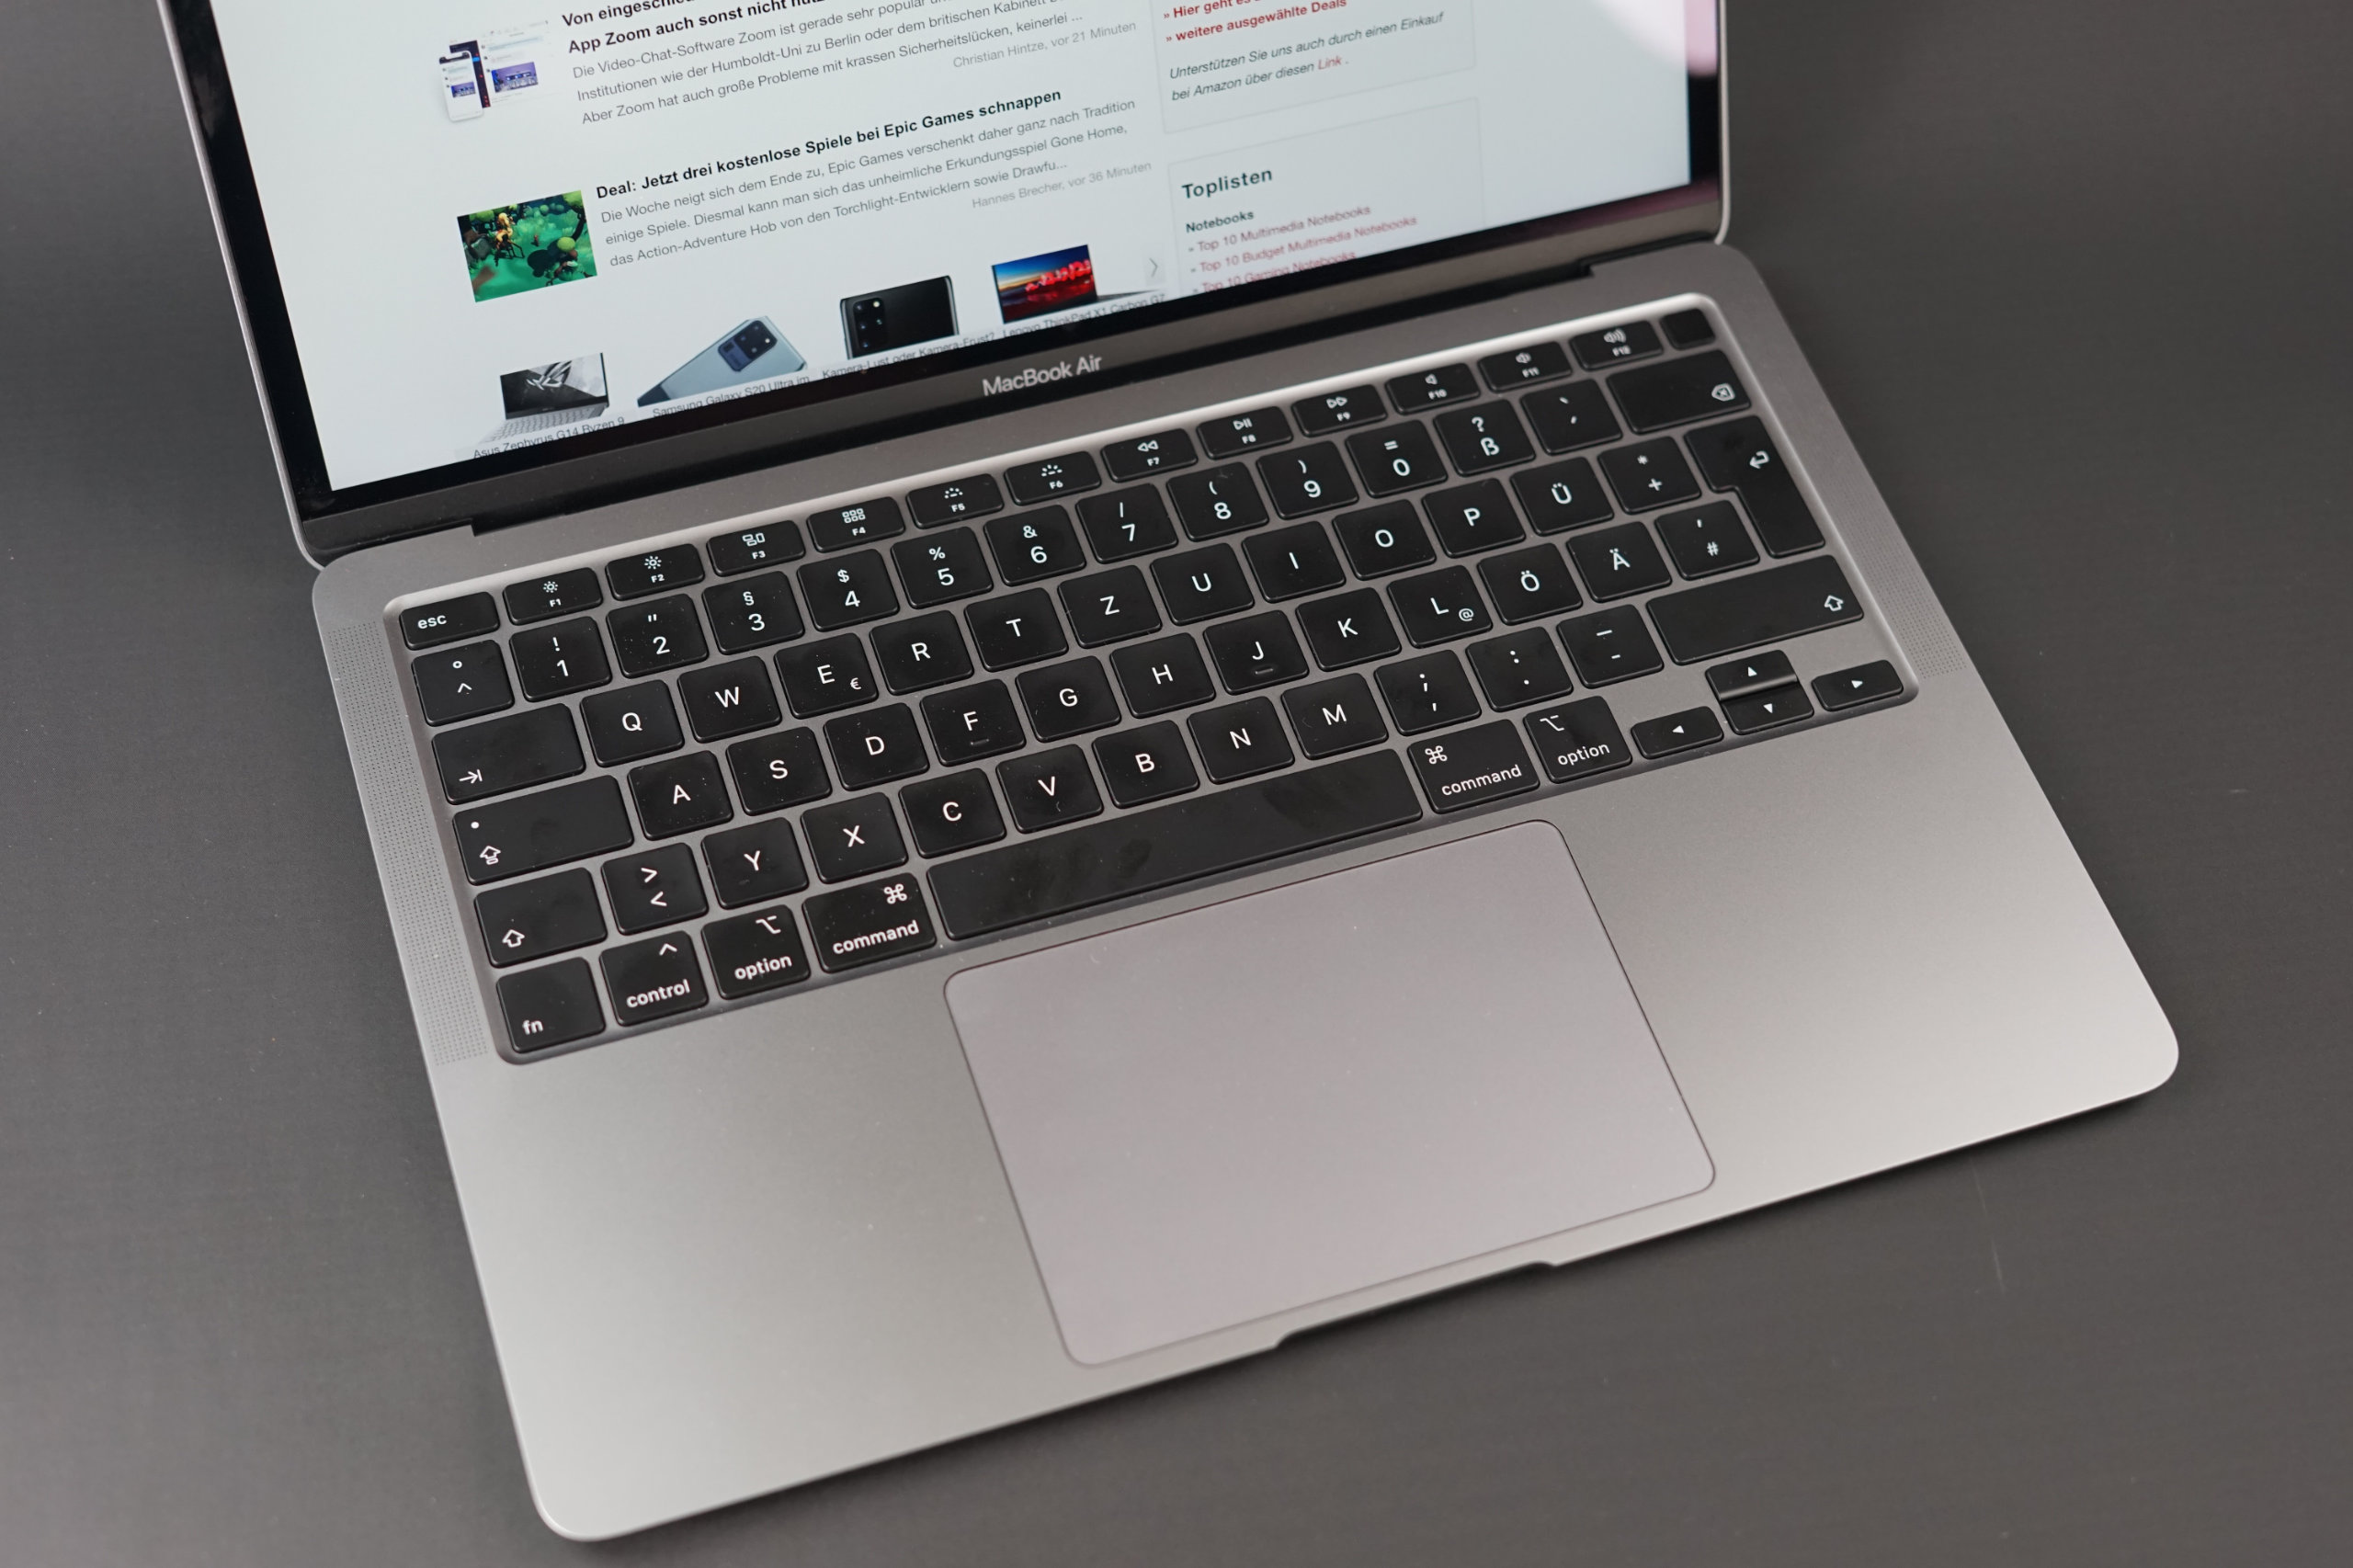
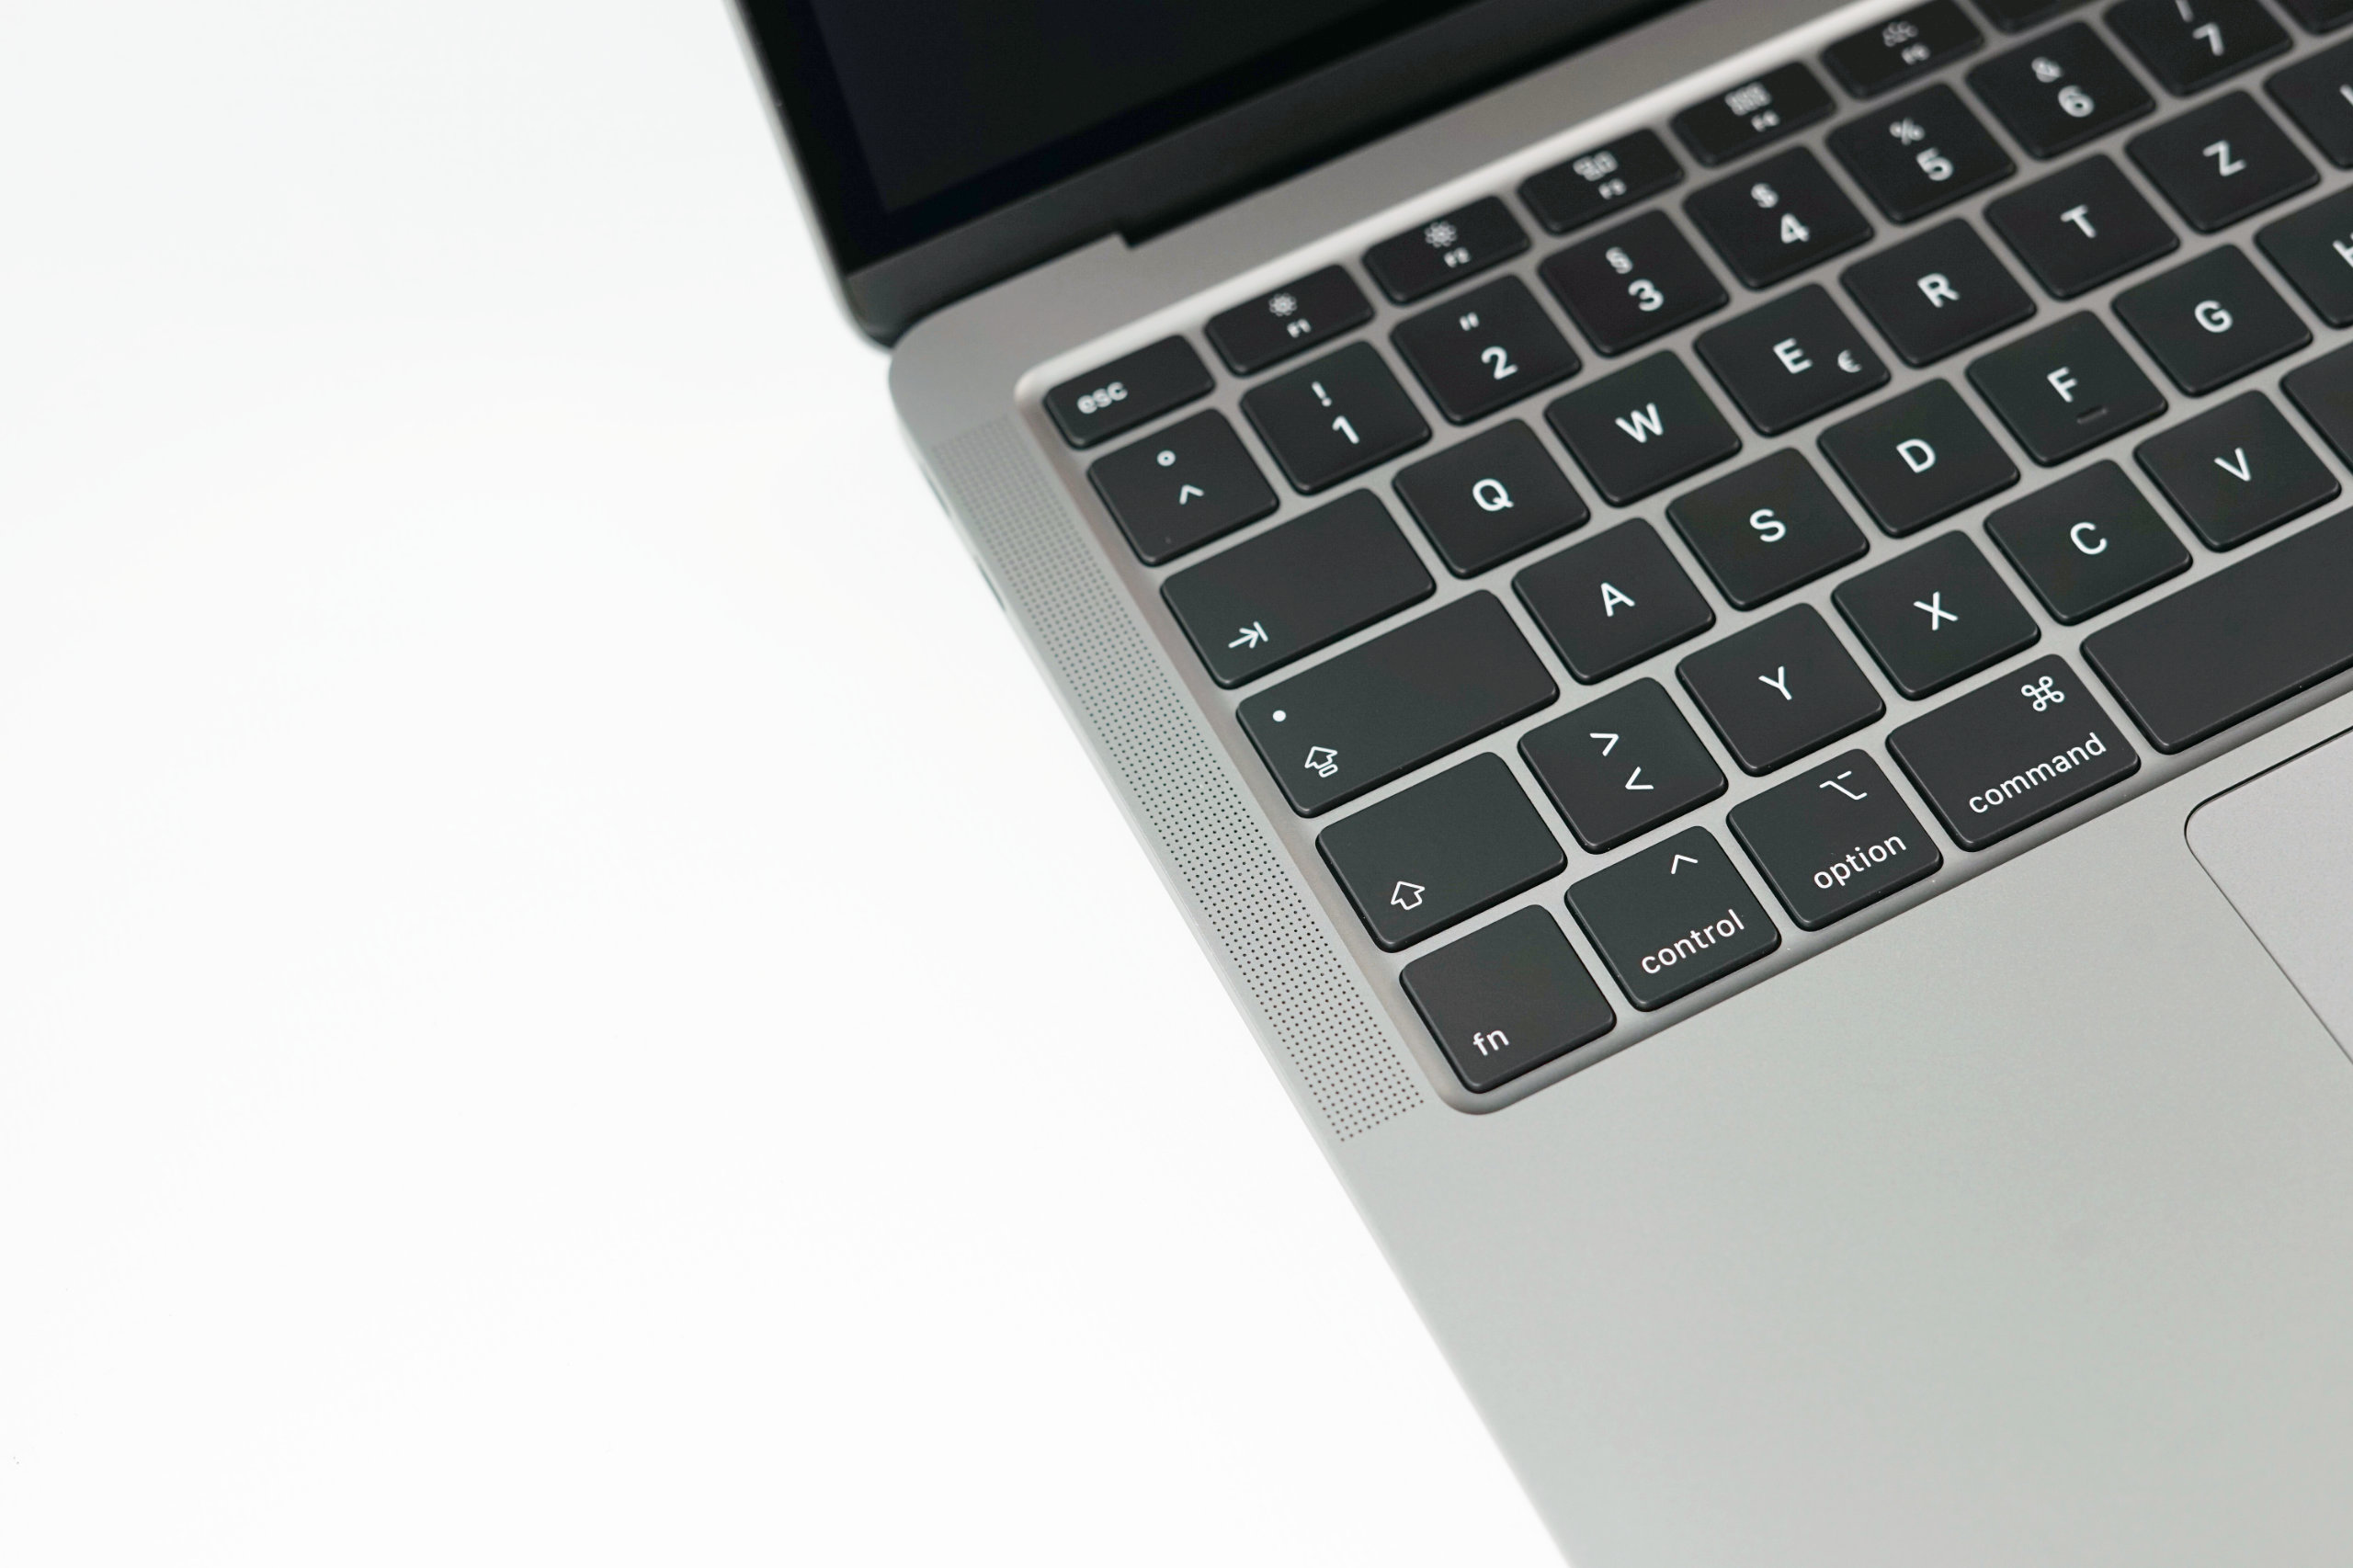
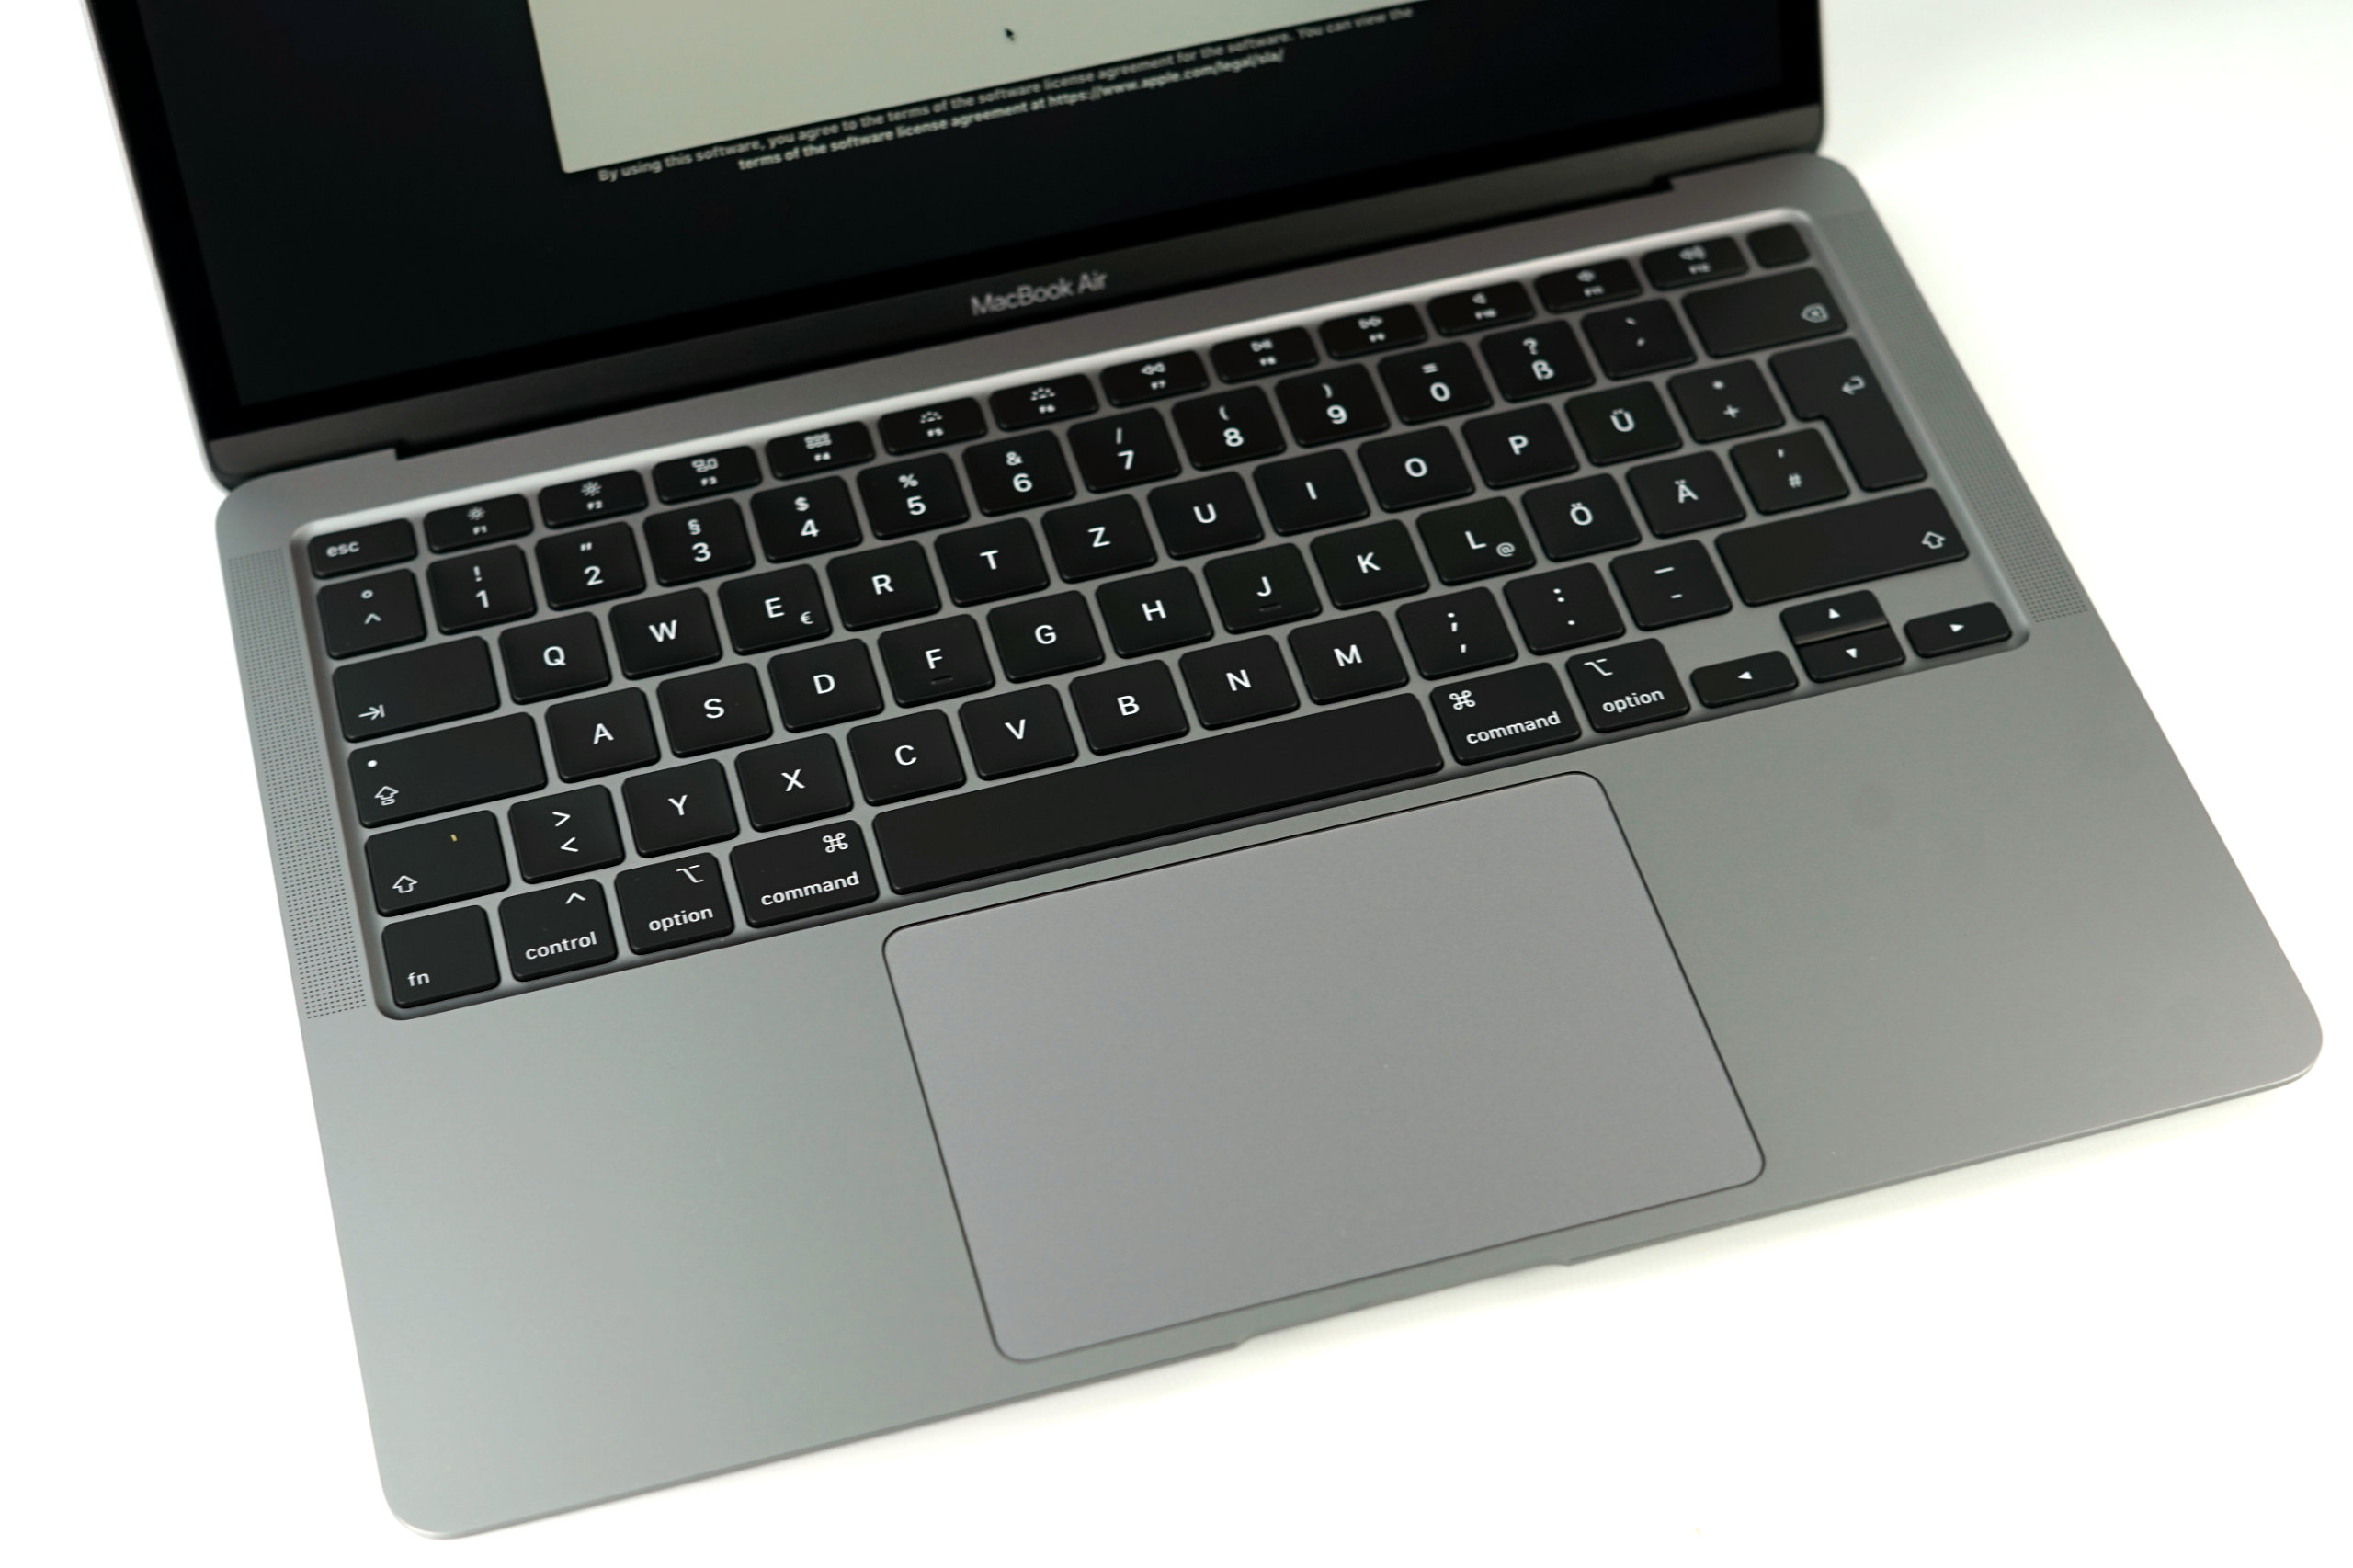
Er zijn zeker ook veel positieve punten op te merken aan de nieuwe 2020 MacBook Air, en alleen al de productnaam zal veel klanten aantrekken. De prestaties zijn momenteel perfect voldoende voor basistaken, scherm en behuizing zijn nog steeds erg goed, het toetsenbord is eindelijk verbeterd en de problemen met betrouwbaarheid zijn hopelijk verleden tijd. Als het de nieuwe MacBook Air moet zijn, raden we aan te wachten op speciale aanbiedingen of kortingen, die er zonder enige twijfel aan zullen komen.
Apple MacBook Air 2020 i5
- 08-04-2020 v7 (old)
Klaus Hinum, Andreas Osthoff
Price comparison
