Kort testrapport Dell Latitude 5480 (7600U, FHD) Laptop

| SD Card Reader | |
| average JPG Copy Test (av. of 3 runs) | |
| Dell Latitude 5480 | |
| Lenovo ThinkPad T470-20HD002HGE | |
| HP ProBook 440 G4-Y8B51EA | |
| Acer TravelMate P648-M-757N | |
| Toshiba Tecra Z40-C-106 | |
| Lenovo ThinkPad T460s-20F9003SGE | |
| maximum AS SSD Seq Read Test (1GB) | |
| Dell Latitude 5480 | |
| Lenovo ThinkPad T470-20HD002HGE | |
| HP ProBook 440 G4-Y8B51EA | |
| Lenovo ThinkPad T460s-20F9003SGE | |
| Toshiba Tecra Z40-C-106 | |
| Networking | |
| iperf3 transmit AX12 | |
| Lenovo ThinkPad T470-20HD002HGE | |
| HP Spectre x360 15-bl002xx | |
| Dell Latitude 5480 | |
| iperf3 receive AX12 | |
| Lenovo ThinkPad T470-20HD002HGE | |
| Dell Latitude 5480 | |
| HP Spectre x360 15-bl002xx | |
| |||||||||||||||||||||||||
Helderheidsverdeling: 90 %
Helderheid in Batterij-modus: 215.9 cd/m²
Contrast: 981:1 (Zwart: 0.22 cd/m²)
ΔE ColorChecker Calman: 5.1 | ∀{0.5-29.43 Ø4.73}
ΔE Greyscale Calman: 4 | ∀{0.09-98 Ø4.97}
61.15% sRGB (Argyll 1.6.3 3D)
41.96% AdobeRGB 1998 (Argyll 1.6.3 3D)
41.96% AdobeRGB 1998 (Argyll 3D)
61.2% sRGB (Argyll 3D)
40.62% Display P3 (Argyll 3D)
Gamma: 2.41
CCT: 6856 K
| Dell Latitude 5480 LG Philips LGD0553, IPS, 14", 1920x1080 | Dell Latitude 14 E5470 LP140WF3, AH-IPS, WLED, 14", 1920x1080 | Lenovo ThinkPad T460s-20F9003SGE N140HCE-EAA, LEN40A9, IPS, 14", 1920x1080 | HP ProBook 440 G4-Y8B51EA AUO1E3D, TN, 14", 1920x1080 | Lenovo ThinkPad X1 Carbon 20FB-005XUS IPS, 14", 1920x1080 | Acer TravelMate P648-M-757N AU Optronics B140HAN02.1, IPS, 14", 1920x1080 | Lenovo ThinkPad T470-20HD002HGE N140HCA-EAB, IPS, 14", 1920x1080 | Toshiba Tecra Z40-C-106 Toshiba TOS508F, IPS, 14", 1920x1080 | |
|---|---|---|---|---|---|---|---|---|
| Display | 49% | 2% | -7% | 42% | -13% | 2% | 48% | |
| Display P3 Coverage (%) | 40.62 | 64.8 60% | 41.65 3% | 37.6 -7% | 58.9 45% | 35.53 -13% | 41.6 2% | 64.8 60% |
| sRGB Coverage (%) | 61.2 | 84.8 39% | 61.6 1% | 56.6 -8% | 83.1 36% | 53.3 -13% | 61.9 1% | 84.4 38% |
| AdobeRGB 1998 Coverage (%) | 41.96 | 62 48% | 43.14 3% | 38.85 -7% | 60.3 44% | 36.72 -12% | 43.06 3% | 61.7 47% |
| Response Times | -9% | -20% | -12% | -25% | -15% | -28% | 3% | |
| Response Time Grey 50% / Grey 80% * (ms) | 32.8 ? | 39 ? -19% | 42 ? -28% | 43.2 ? -32% | 47.2 ? -44% | 44 ? -34% | 41.6 ? -27% | 32.8 ? -0% |
| Response Time Black / White * (ms) | 26.4 ? | 26 ? 2% | 29.2 ? -11% | 24.4 ? 8% | 27.6 ? -5% | 25 ? 5% | 34 ? -29% | 25.2 ? 5% |
| PWM Frequency (Hz) | ||||||||
| Screen | 6% | -8% | -40% | 24% | 13% | -1% | 5% | |
| Brightness middle (cd/m²) | 215.9 | 323 50% | 226 5% | 216 0% | 321.7 49% | 254 18% | 306 42% | 269 25% |
| Brightness (cd/m²) | 205 | 316 54% | 211 3% | 203 -1% | 301 47% | 243 19% | 287 40% | 257 25% |
| Brightness Distribution (%) | 90 | 79 -12% | 89 -1% | 83 -8% | 89 -1% | 90 0% | 88 -2% | 86 -4% |
| Black Level * (cd/m²) | 0.22 | 0.57 -159% | 0.22 -0% | 0.47 -114% | 0.294 -34% | 0.19 14% | 0.3 -36% | 0.52 -136% |
| Contrast (:1) | 981 | 567 -42% | 1027 5% | 460 -53% | 1094 12% | 1337 36% | 1020 4% | 517 -47% |
| Colorchecker dE 2000 * | 5.1 | 3.68 28% | 6.44 -26% | 8.98 -76% | 3.96 22% | 4.93 3% | 6.2 -22% | 3.45 32% |
| Colorchecker dE 2000 max. * | 15.6 | 8.33 47% | 17.18 -10% | 14.07 10% | 6.69 57% | 10.14 35% | 13.6 13% | 9.34 40% |
| Greyscale dE 2000 * | 4 | 2.99 25% | 5.87 -47% | 9.61 -140% | 3.15 21% | 2.71 32% | 5.8 -45% | 2.28 43% |
| Gamma | 2.41 91% | 2.49 88% | 2.37 93% | 2.63 84% | 2.34 94% | 2.36 93% | 2.04 108% | 2.38 92% |
| CCT | 6856 95% | 6572 99% | 6856 95% | 11265 58% | 7082 92% | 6914 94% | 6277 104% | 6230 104% |
| Color Space (Percent of AdobeRGB 1998) (%) | 41.96 | 55 31% | 39.58 -6% | 35.9 -14% | 53.8 28% | 34 -19% | 39.62 -6% | 55.24 32% |
| Color Space (Percent of sRGB) (%) | 61.15 | 85 39% | 61.15 0% | 56.7 -7% | 82.7 35% | 53 -13% | 61.44 0% | 84.32 38% |
| Totaal Gemiddelde (Programma / Instellingen) | 15% /
13% | -9% /
-7% | -20% /
-30% | 14% /
21% | -5% /
4% | -9% /
-4% | 19% /
13% |
* ... kleiner is beter
Responstijd Scherm
| ↔ Responstijd Zwart naar Wit | ||
|---|---|---|
| 26.4 ms ... stijging ↗ en daling ↘ gecombineerd | ↗ 5.2 ms stijging | 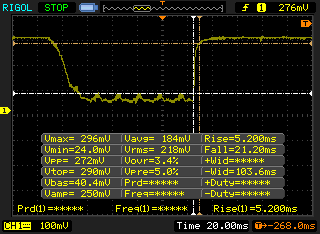 |
| ↘ 21.2 ms daling | ||
| Het scherm vertoonde relatief trage responstijden in onze tests en is misschien te traag voor games. Ter vergelijking: alle testtoestellen variëren van 0.1 (minimum) tot 240 (maximum) ms. » 66 % van alle toestellen zijn beter. Dit betekent dat de gemeten responstijd slechter is dan het gemiddelde (19.9 ms) van alle geteste toestellen. | ||
| ↔ Responstijd 50% Grijs naar 80% Grijs | ||
| 32.8 ms ... stijging ↗ en daling ↘ gecombineerd | ↗ 14 ms stijging | 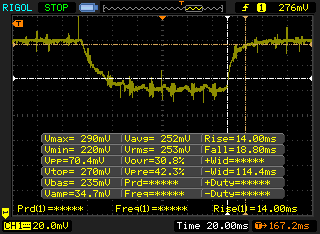 |
| ↘ 18.8 ms daling | ||
| Het scherm vertoonde trage responstijden in onze tests en is misschien te traag voor games. Ter vergelijking: alle testtoestellen variëren van 0.165 (minimum) tot 636 (maximum) ms. » 44 % van alle toestellen zijn beter. Dit betekent dat de gemeten responstijd vergelijkbaar is met het gemiddelde (31.1 ms) van alle geteste toestellen. | ||
Screen Flickering / PWM (Pulse-Width Modulation)
| Screen flickering / PWM niet waargenomen | 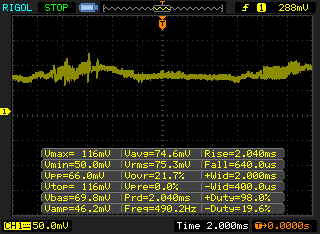 | ||
Ter vergelijking: 52 % van alle geteste toestellen maakten geen gebruik van PWM om de schermhelderheid te verlagen. Als het wel werd gebruikt, werd een gemiddelde van 7784 (minimum: 5 - maximum: 343500) Hz waargenomen. | |||
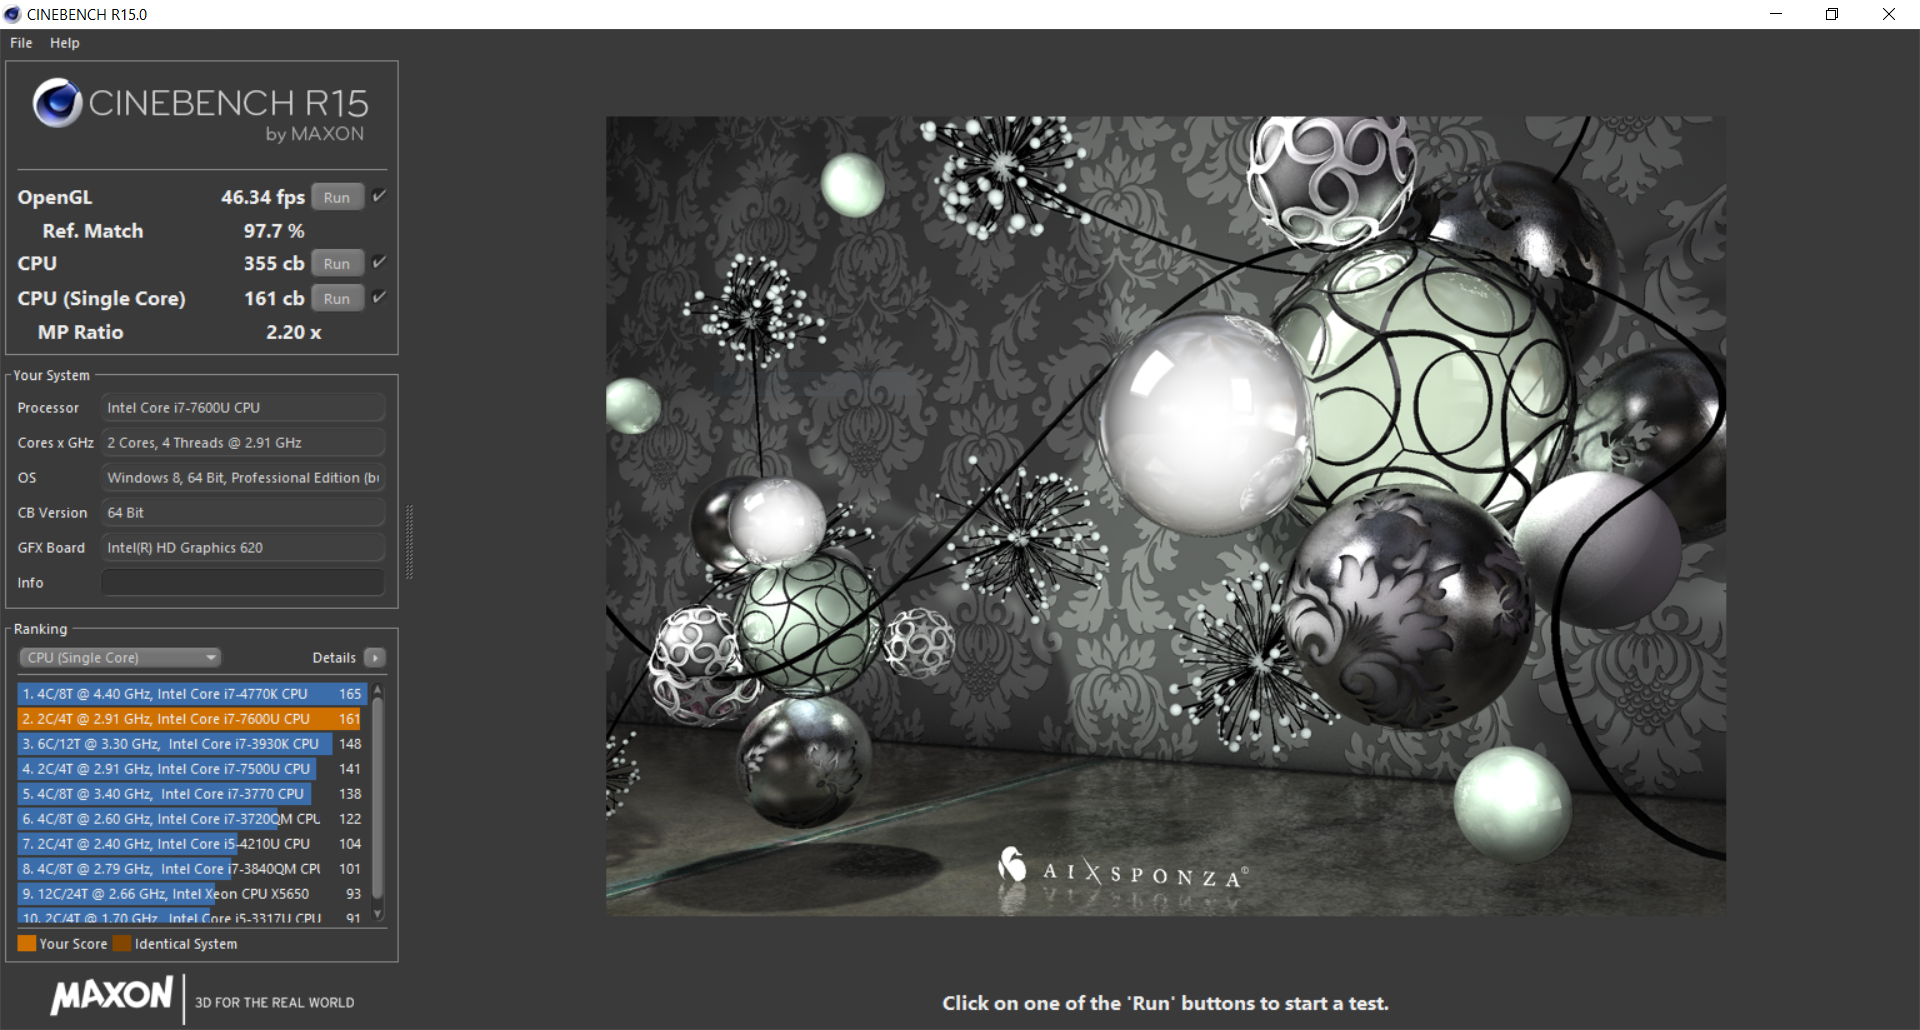
| Cinebench R15 | |
| CPU Single 64Bit | |
| Dell Latitude 5480 | |
| HP ProBook 440 G4-Y8B51EA | |
| Dell Latitude 14 E5470 | |
| Lenovo ThinkPad T460s-20F9003SGE | |
| Acer TravelMate P648-M-757N | |
| Lenovo ThinkPad X1 Carbon 20FB-005XUS | |
| Toshiba Tecra Z40-C-106 | |
| CPU Multi 64Bit | |
| Dell Latitude 14 E5470 | |
| Dell Latitude 5480 | |
| HP ProBook 440 G4-Y8B51EA | |
| Lenovo ThinkPad X1 Carbon 20FB-005XUS | |
| Lenovo ThinkPad T460s-20F9003SGE | |
| Acer TravelMate P648-M-757N | |
| Toshiba Tecra Z40-C-106 | |
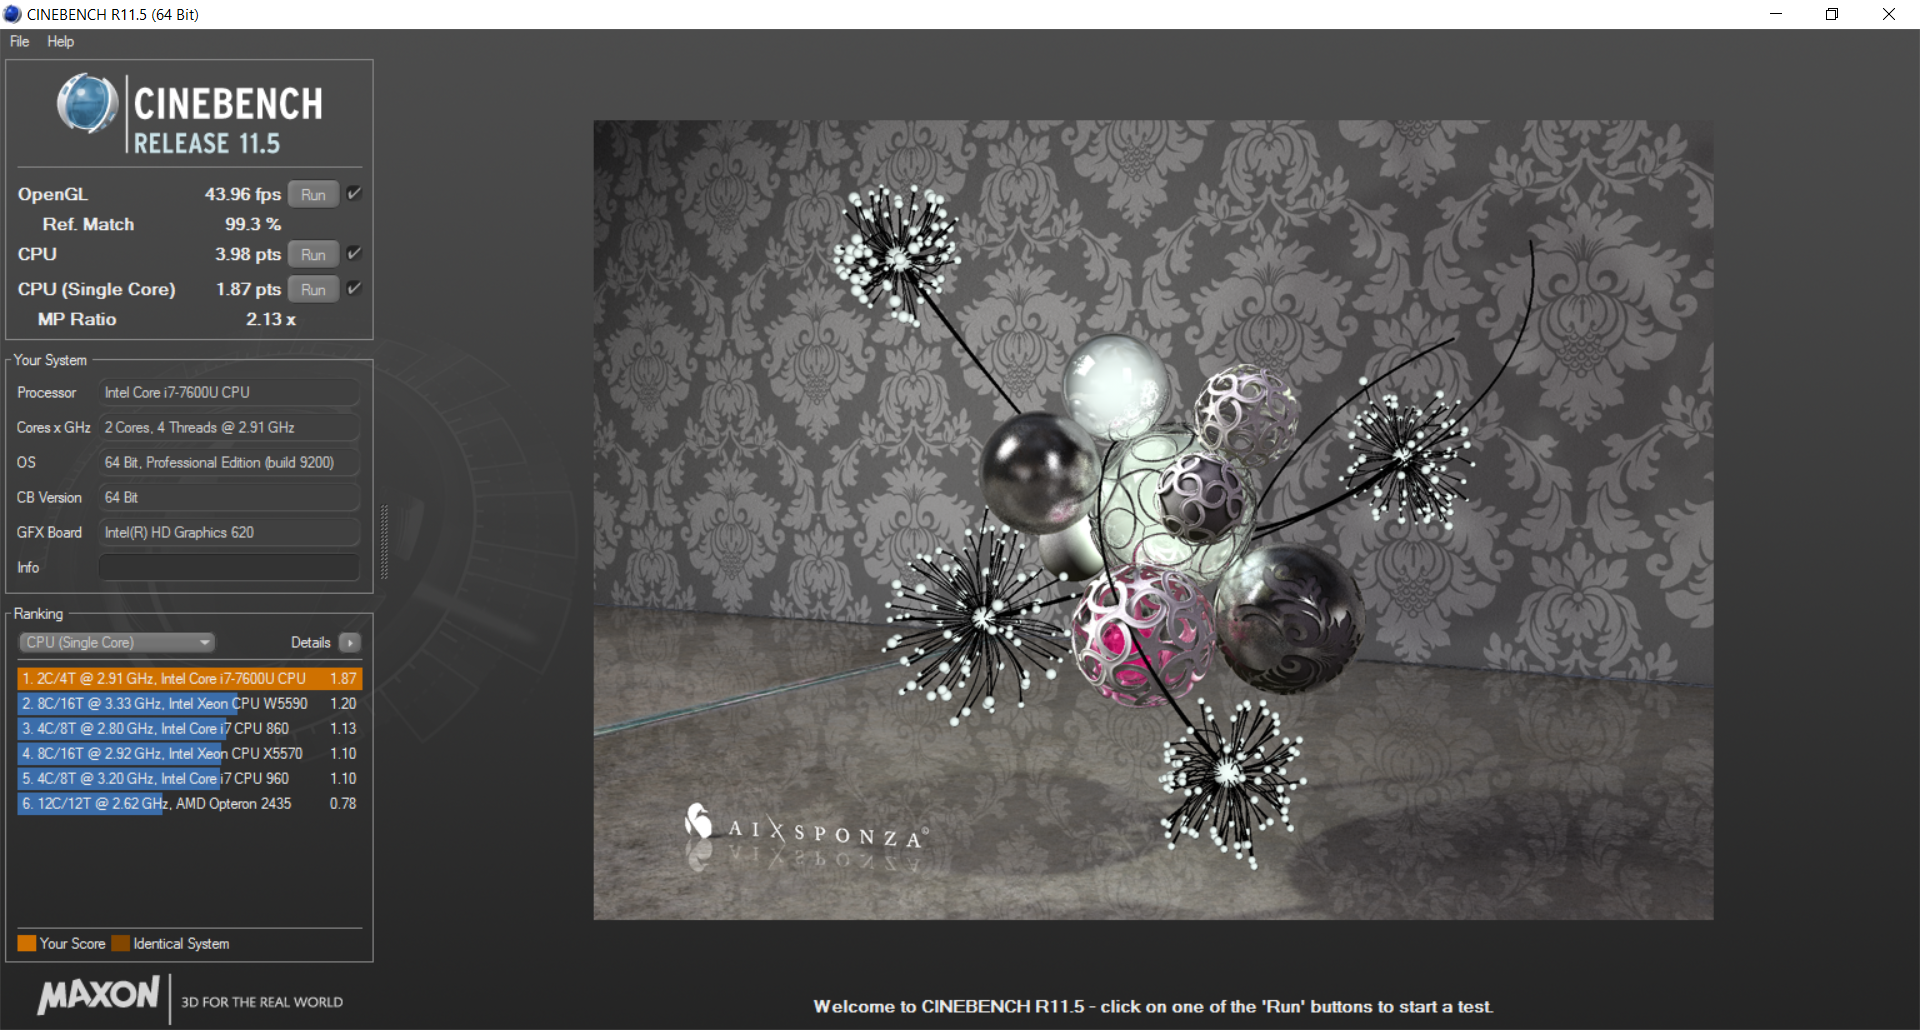
| Cinebench R11.5 | |
| CPU Single 64Bit | |
| Dell Latitude 5480 | |
| HP ProBook 440 G4-Y8B51EA | |
| Dell Latitude 14 E5470 | |
| Lenovo ThinkPad T460s-20F9003SGE | |
| Acer TravelMate P648-M-757N | |
| Lenovo ThinkPad X1 Carbon 20FB-005XUS | |
| Toshiba Tecra Z40-C-106 | |
| CPU Multi 64Bit | |
| Dell Latitude 14 E5470 | |
| Dell Latitude 5480 | |
| HP ProBook 440 G4-Y8B51EA | |
| Lenovo ThinkPad X1 Carbon 20FB-005XUS | |
| Lenovo ThinkPad T460s-20F9003SGE | |
| Acer TravelMate P648-M-757N | |
| Toshiba Tecra Z40-C-106 | |
| Cinebench R10 | |
| Rendering Single 32Bit | |
| Dell Latitude 5480 | |
| HP ProBook 440 G4-Y8B51EA | |
| Dell Latitude 14 E5470 | |
| Lenovo ThinkPad X1 Carbon 20FB-005XUS | |
| Acer TravelMate P648-M-757N | |
| Rendering Multiple CPUs 32Bit | |
| Dell Latitude 14 E5470 | |
| Dell Latitude 5480 | |
| HP ProBook 440 G4-Y8B51EA | |
| Acer TravelMate P648-M-757N | |
| Lenovo ThinkPad X1 Carbon 20FB-005XUS | |
| wPrime 2.10 - 1024m | |
| Lenovo ThinkPad X1 Carbon 20FB-005XUS | |
| Dell Latitude 5480 | |
* ... kleiner is beter
| PCMark 8 | |
| Home Score Accelerated v2 | |
| Dell Latitude 5480 | |
| HP ProBook 440 G4-Y8B51EA | |
| Acer TravelMate P648-M-757N | |
| Dell Latitude 14 E5470 | |
| Lenovo ThinkPad X1 Carbon 20FB-005XUS | |
| Toshiba Tecra Z40-C-106 | |
| Lenovo ThinkPad T460s-20F9003SGE | |
| Work Score Accelerated v2 | |
| Dell Latitude 5480 | |
| HP ProBook 440 G4-Y8B51EA | |
| Dell Latitude 14 E5470 | |
| Acer TravelMate P648-M-757N | |
| Toshiba Tecra Z40-C-106 | |
| Lenovo ThinkPad T460s-20F9003SGE | |
| Lenovo ThinkPad X1 Carbon 20FB-005XUS | |
| Creative Score Accelerated v2 | |
| Dell Latitude 5480 | |
| HP ProBook 440 G4-Y8B51EA | |
| Dell Latitude 14 E5470 | |
| Lenovo ThinkPad X1 Carbon 20FB-005XUS | |
| Acer TravelMate P648-M-757N | |
| Lenovo ThinkPad T460s-20F9003SGE | |
| PCMark 8 Home Score Accelerated v2 | 3913 punten | |
| PCMark 8 Creative Score Accelerated v2 | 4923 punten | |
| PCMark 8 Work Score Accelerated v2 | 4992 punten | |
Help | ||
| Dell Latitude 5480 Toshiba SG5 256GB THNSNK256GVN8 | Dell Latitude 14 E5470 Micron SSD 1100 (MTFDDAV256TBN) | Lenovo ThinkPad T460s-20F9003SGE Samsung CM871 MZ7LF192HCGS | HP ProBook 440 G4-Y8B51EA SanDisk SD8SNAT256G1002 | Lenovo ThinkPad X1 Carbon 20FB-005XUS Samsung SM951 MZVPV256 m.2 | Acer TravelMate P648-M-757N Lite-On CV1-8B256 | Toshiba Tecra Z40-C-106 Toshiba HG6 THNSNJ256G8NY | |
|---|---|---|---|---|---|---|---|
| CrystalDiskMark 3.0 | -7% | -52% | -11% | 177% | 6% | 3% | |
| Read Seq (MB/s) | 469.4 | 465.4 -1% | 446.5 -5% | 491.2 5% | 1720 266% | 531 13% | 521 11% |
| Write Seq (MB/s) | 264.8 | 363.1 37% | 171.1 -35% | 322.2 22% | 1263 377% | 358.8 35% | 444.5 68% |
| Read 512 (MB/s) | 408.1 | 338.4 -17% | 259.2 -36% | 310.1 -24% | 1223 200% | 384.8 -6% | 420.2 3% |
| Write 512 (MB/s) | 265.5 | 246.1 -7% | 167.2 -37% | 276 4% | 1249 370% | 363 37% | 421 59% |
| Read 4k (MB/s) | 24.66 | 25.83 5% | 5.78 -77% | 19.57 -21% | 49.65 101% | 31.3 27% | 20.32 -18% |
| Write 4k (MB/s) | 114.8 | 80.3 -30% | 35.47 -69% | 77.8 -32% | 123 7% | 80.3 -30% | 79.6 -31% |
| Read 4k QD32 (MB/s) | 380.3 | 246.1 -35% | 94.9 -75% | 146.3 -62% | 464.6 22% | 239.4 -37% | 229 -40% |
| Write 4k QD32 (MB/s) | 207.2 | 197.7 -5% | 36.43 -82% | 241.4 17% | 354.7 71% | 225.3 9% | 153.6 -26% |

| 3DMark 11 | |
| 1280x720 Performance GPU | |
| HP ProBook 440 G4-Y8B51EA | |
| Dell Latitude 5480 | |
| HP EliteBook 820 G4 Z2V72ET | |
| Dell Latitude 14 E5470 | |
| Acer TravelMate P648-M-757N | |
| Lenovo ThinkPad X1 Carbon 20FB-005XUS | |
| Lenovo ThinkPad T460s-20F9003SGE | |
| Toshiba Tecra Z40-C-106 | |
| 1280x720 Performance Combined | |
| HP ProBook 440 G4-Y8B51EA | |
| Dell Latitude 5480 | |
| Lenovo ThinkPad X1 Carbon 20FB-005XUS | |
| Acer TravelMate P648-M-757N | |
| HP EliteBook 820 G4 Z2V72ET | |
| Dell Latitude 14 E5470 | |
| Toshiba Tecra Z40-C-106 | |
| Lenovo ThinkPad T460s-20F9003SGE | |
| 3DMark 11 Performance | 1845 punten | |
| 3DMark Ice Storm Standard Score | 67522 punten | |
| 3DMark Cloud Gate Standard Score | 6916 punten | |
| 3DMark Fire Strike Score | 952 punten | |
| 3DMark Fire Strike Extreme Score | 444 punten | |
Help | ||
| Tomb Raider | |
| 1024x768 Low Preset (sorteer op waarde) | |
| Dell Latitude 5480 | |
| Lenovo ThinkPad T460s-20F9003SGE | |
| HP ProBook 440 G4-Y8B51EA | |
| Acer TravelMate P648-M-757N | |
| 1366x768 Normal Preset AA:FX AF:4x (sorteer op waarde) | |
| Dell Latitude 5480 | |
| Lenovo ThinkPad T460s-20F9003SGE | |
| HP ProBook 440 G4-Y8B51EA | |
| Acer TravelMate P648-M-757N | |
| 1366x768 High Preset AA:FX AF:8x (sorteer op waarde) | |
| Dell Latitude 5480 | |
| Lenovo ThinkPad T460s-20F9003SGE | |
| HP ProBook 440 G4-Y8B51EA | |
| Acer TravelMate P648-M-757N | |
| 1920x1080 Ultra Preset AA:FX AF:16x (sorteer op waarde) | |
| Dell Latitude 5480 | |
| HP ProBook 440 G4-Y8B51EA | |
| Acer TravelMate P648-M-757N | |
| lage | gem. | hoge | ultra | |
|---|---|---|---|---|
| Anno 2070 (2011) | 88.9 | 49.7 | 30.3 | 13.8 |
| Tomb Raider (2013) | 86.2 | 45.1 | 28.6 | 13.2 |
Geluidsniveau
| Onbelast |
| 29.6 / 29.6 / 29.6 dB (A) |
| Belasting |
| 42 / 47.1 dB (A) |
 | ||
30 dB stil 40 dB(A) hoorbaar 50 dB(A) luid |
||
min: | ||
| Dell Latitude 5480 HD Graphics 620, i7-7600U, Toshiba SG5 256GB THNSNK256GVN8 | Acer TravelMate P648-M-757N HD Graphics 520, 6500U, Lite-On CV1-8B256 | Lenovo ThinkPad T460s-20F9003SGE HD Graphics 520, 6200U, Samsung CM871 MZ7LF192HCGS | HP ProBook 440 G4-Y8B51EA GeForce 930MX, i7-7500U, SanDisk SD8SNAT256G1002 | Lenovo ThinkPad X1 Carbon 20FB-005XUS HD Graphics 520, 6300U, Samsung SM951 MZVPV256 m.2 | Toshiba Tecra Z40-C-106 HD Graphics 520, 6200U, Toshiba HG6 THNSNJ256G8NY | Dell Latitude 14 E5470 HD Graphics 530, 6440HQ, Micron SSD 1100 (MTFDDAV256TBN) | |
|---|---|---|---|---|---|---|---|
| Noise | 7% | 10% | 7% | 10% | 8% | 9% | |
| Idle Minimum * (dB) | 29.6 | 31.2 -5% | 29.1 2% | 29 2% | 28.8 3% | 29.8 -1% | 30.3 -2% |
| Idle Average * (dB) | 29.6 | 31.2 -5% | 29.1 2% | 29 2% | 28.9 2% | 29.8 -1% | 30.3 -2% |
| Idle Maximum * (dB) | 29.6 | 31.6 -7% | 29.1 2% | 29 2% | 28.9 2% | 29.8 -1% | 30.3 -2% |
| Load Average * (dB) | 42 | 33.3 21% | 32.3 23% | 37.4 11% | 35 17% | 32.6 22% | 31.6 25% |
| Load Maximum * (dB) | 47.1 | 32.4 31% | 36.6 22% | 39 17% | 35.8 24% | 37.2 21% | 35 26% |
| uit / omgeving * (dB) | 31.2 | 29.1 | 29 | 28.8 | 29 | 30.3 |
* ... kleiner is beter
(+) De maximumtemperatuur aan de bovenzijde bedraagt 36.4 °C / 98 F, vergeleken met het gemiddelde van 34.3 °C / 94 F, variërend van 21.2 tot 62.5 °C voor de klasse Office.
(±) De bodem warmt op tot een maximum van 45 °C / 113 F, vergeleken met een gemiddelde van 36.8 °C / 98 F
(+) Bij onbelast gebruik bedraagt de gemiddelde temperatuur voor de bovenzijde 24 °C / 75 F, vergeleken met het apparaatgemiddelde van 29.5 °C / 85 F.
(+) De palmsteunen en het touchpad zijn met een maximum van ###max## °C / 76.6 F koeler dan de huidtemperatuur en voelen daarom koel aan.
(+) De gemiddelde temperatuur van de handpalmsteun van soortgelijke toestellen bedroeg 27.5 °C / 81.5 F (+2.7 °C / 4.9 F).
Dell Latitude 5480 audioanalyse
(±) | luidspreker luidheid is gemiddeld maar goed (80.5 dB)
Bas 100 - 315 Hz
(±) | verminderde zeebaars - gemiddeld 8.7% lager dan de mediaan
(±) | lineariteit van de lage tonen is gemiddeld (10.1% delta ten opzichte van de vorige frequentie)
Midden 400 - 2000 Hz
(+) | evenwichtige middens - slechts 3.6% verwijderd van de mediaan
(±) | lineariteit van de middentonen is gemiddeld (7.8% delta ten opzichte van de vorige frequentie)
Hoog 2 - 16 kHz
(±) | higher highs - on average 5.7% higher than median
(±) | lineariteit van de hoogtepunten is gemiddeld (9.2% delta ten opzichte van de vorige frequentie)
Algemeen 100 - 16.000 Hz
(±) | lineariteit van het totale geluid is gemiddeld (15.6% verschil met de mediaan)
Vergeleken met dezelfde klasse
» 16% van alle geteste apparaten in deze klasse waren beter, 4% vergelijkbaar, 80% slechter
» De beste had een delta van 7%, het gemiddelde was 21%, de slechtste was 53%
Vergeleken met alle geteste toestellen
» 23% van alle geteste apparaten waren beter, 5% gelijk, 72% slechter
» De beste had een delta van 4%, het gemiddelde was 24%, de slechtste was 134%
Apple MacBook 12 (Early 2016) 1.1 GHz audioanalyse
(+) | luidsprekers kunnen relatief luid spelen (83.6 dB)
Bas 100 - 315 Hz
(±) | verminderde zeebaars - gemiddeld 11.3% lager dan de mediaan
(±) | lineariteit van de lage tonen is gemiddeld (14.2% delta ten opzichte van de vorige frequentie)
Midden 400 - 2000 Hz
(+) | evenwichtige middens - slechts 2.4% verwijderd van de mediaan
(+) | de middentonen zijn lineair (5.5% delta ten opzichte van de vorige frequentie)
Hoog 2 - 16 kHz
(+) | evenwichtige hoogtepunten - slechts 2% verwijderd van de mediaan
(+) | de hoge tonen zijn lineair (4.5% delta naar de vorige frequentie)
Algemeen 100 - 16.000 Hz
(+) | het totale geluid is lineair (10.2% verschil met de mediaan)
Vergeleken met dezelfde klasse
» 7% van alle geteste apparaten in deze klasse waren beter, 2% vergelijkbaar, 91% slechter
» De beste had een delta van 5%, het gemiddelde was 18%, de slechtste was 53%
Vergeleken met alle geteste toestellen
» 5% van alle geteste apparaten waren beter, 1% gelijk, 94% slechter
» De beste had een delta van 4%, het gemiddelde was 24%, de slechtste was 134%
| Uit / Standby | |
| Inactief | |
| Belasting |
|
Key:
min: | |
| Dell Latitude 5480 i7-7600U, HD Graphics 620, Toshiba SG5 256GB THNSNK256GVN8, IPS, 1920x1080, 14" | Acer TravelMate P648-M-757N 6500U, HD Graphics 520, Lite-On CV1-8B256, IPS, 1920x1080, 14" | Lenovo ThinkPad T460s-20F9003SGE 6200U, HD Graphics 520, Samsung CM871 MZ7LF192HCGS, IPS, 1920x1080, 14" | HP ProBook 440 G4-Y8B51EA i7-7500U, GeForce 930MX, SanDisk SD8SNAT256G1002, TN, 1920x1080, 14" | Lenovo ThinkPad X1 Carbon 20FB-005XUS 6300U, HD Graphics 520, Samsung SM951 MZVPV256 m.2, IPS, 1920x1080, 14" | Toshiba Tecra Z40-C-106 6200U, HD Graphics 520, Toshiba HG6 THNSNJ256G8NY, IPS, 1920x1080, 14" | Dell Latitude 14 E5470 6440HQ, HD Graphics 530, Micron SSD 1100 (MTFDDAV256TBN), AH-IPS, WLED, 1920x1080, 14" | |
|---|---|---|---|---|---|---|---|
| Power Consumption | -14% | 11% | -4% | -9% | 5% | -19% | |
| Idle Minimum * (Watt) | 6.64 | 5.3 20% | 3.7 44% | 3 55% | 7.6 -14% | 4.3 35% | 4.1 38% |
| Idle Average * (Watt) | 6.67 | 9.3 -39% | 6.8 -2% | 5.4 19% | 9 -35% | 7.6 -14% | 8.1 -21% |
| Idle Maximum * (Watt) | 7.78 | 11.5 -48% | 7.3 6% | 6.3 19% | 9.6 -23% | 8.3 -7% | 11.4 -47% |
| Load Average * (Watt) | 30.83 | 30.8 -0% | 26.3 15% | 37.5 -22% | 24.5 21% | 26.8 13% | 33.5 -9% |
| Load Maximum * (Watt) | 31.7 | 32 -1% | 34.6 -9% | 61.1 -93% | 30.3 4% | 32.6 -3% | 49 -55% |
* ... kleiner is beter
| Dell Latitude 5480 i7-7600U, HD Graphics 620, 68 Wh | Acer TravelMate P648-M-757N 6500U, HD Graphics 520, 54 Wh | Lenovo ThinkPad T460s-20F9003SGE 6200U, HD Graphics 520, 49 Wh | HP ProBook 440 G4-Y8B51EA i7-7500U, GeForce 930MX, 48 Wh | Lenovo ThinkPad X1 Carbon 20FB-005XUS 6300U, HD Graphics 520, 52 Wh | Toshiba Tecra Z40-C-106 6200U, HD Graphics 520, 64 Wh | Dell Latitude 14 E5470 6440HQ, HD Graphics 530, 62 Wh | |
|---|---|---|---|---|---|---|---|
| Batterijduur | -34% | -42% | -30% | -42% | -24% | -47% | |
| Reader / Idle (h) | 24.1 | 18.1 -25% | 15.3 -37% | 18.1 -25% | 12.9 -46% | 17.4 -28% | 15.2 -37% |
| WiFi v1.3 (h) | 16.1 | 9.1 -43% | 6.6 -59% | 6.9 -57% | 6.9 -57% | 9 -44% | 7.2 -55% |
| Load (h) | 2.7 | 1.8 -33% | 1.9 -30% | 2.5 -7% | 2.1 -22% | 2.7 0% | 1.4 -48% |
Pro
Contra
Dit is de verkorte versie van het originele artikel. Het volledige, Engelse testrapport vind je hier.
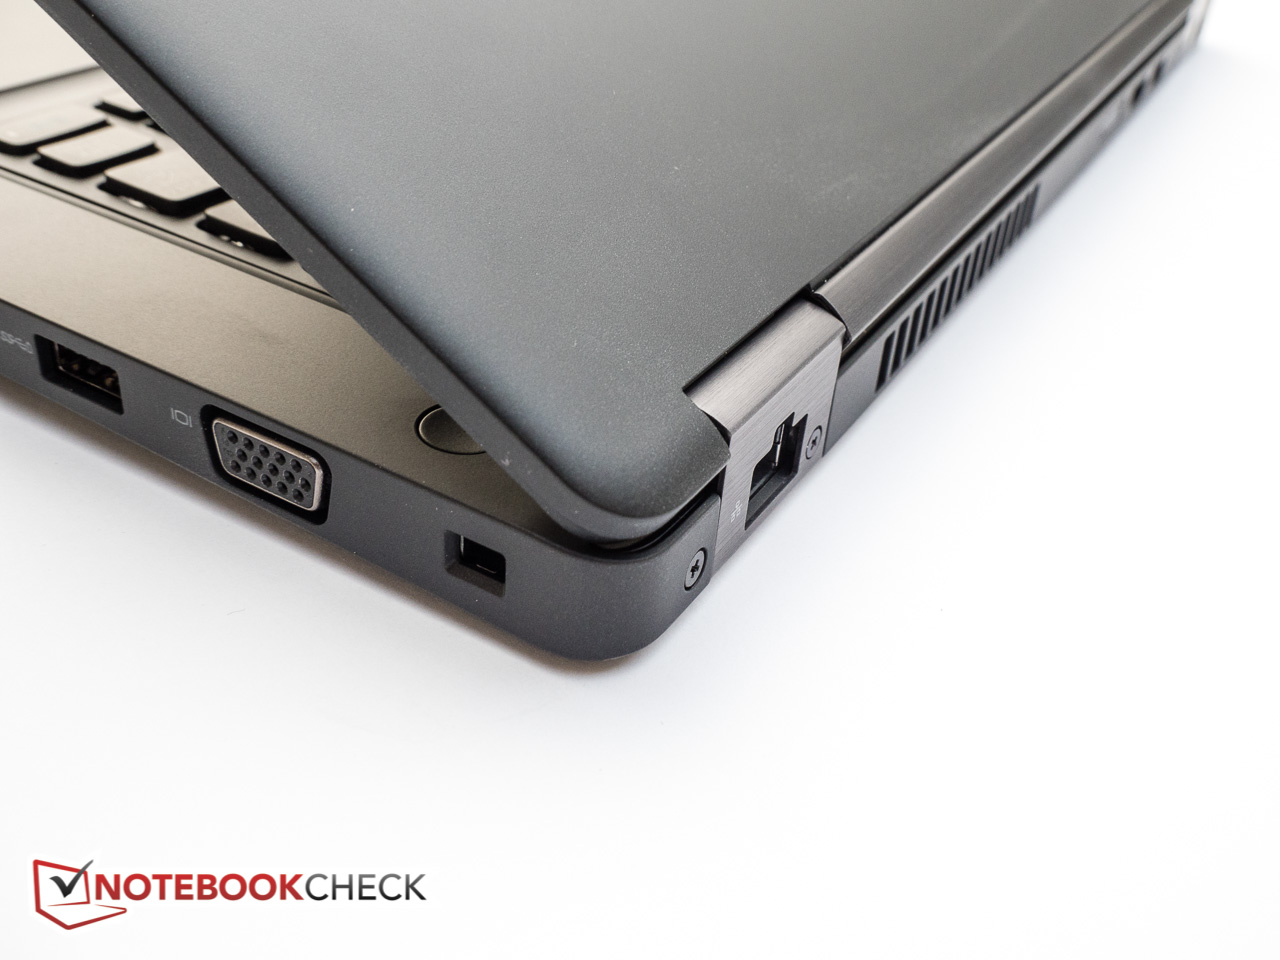
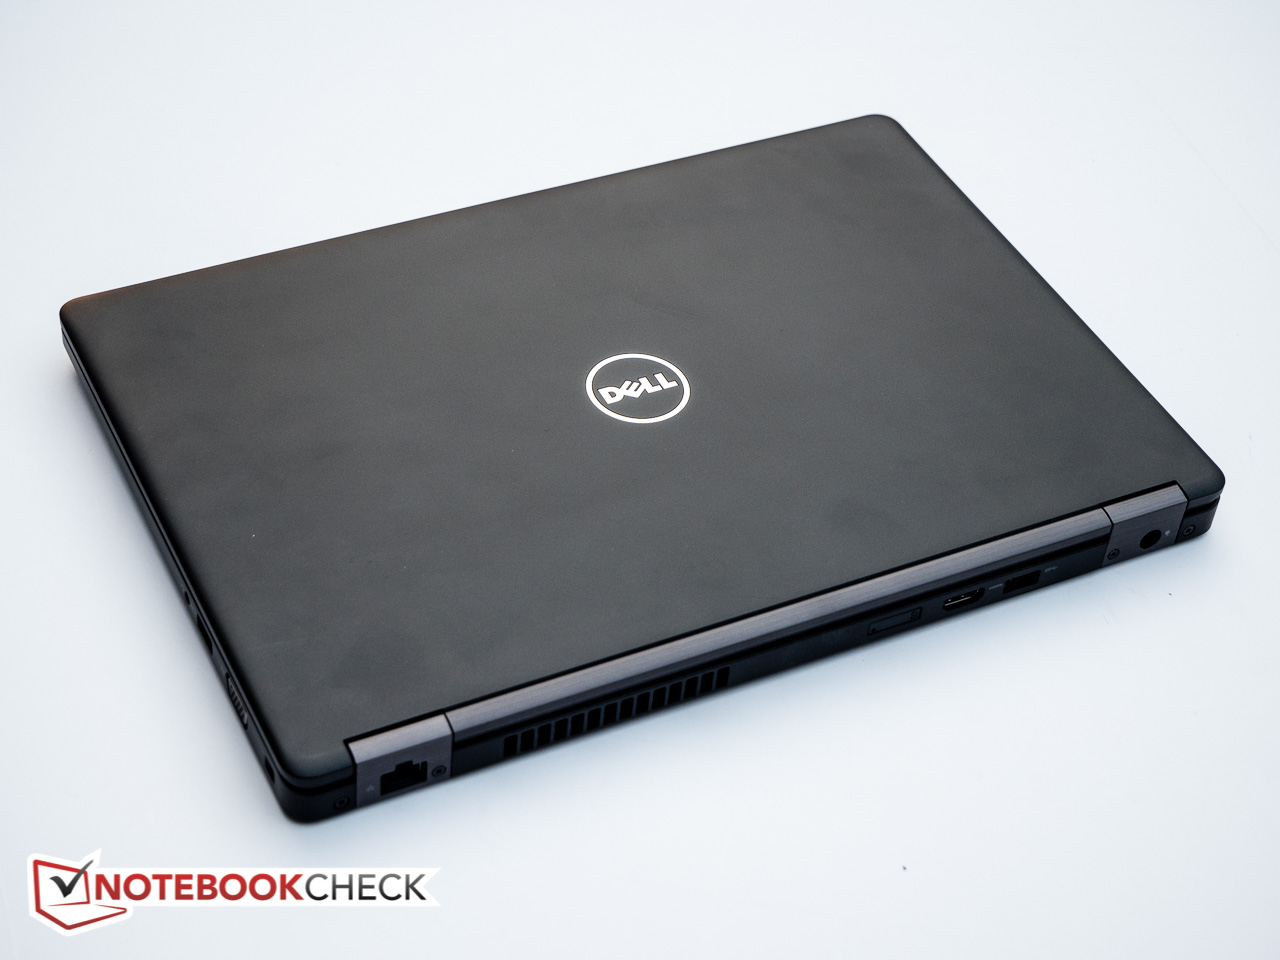
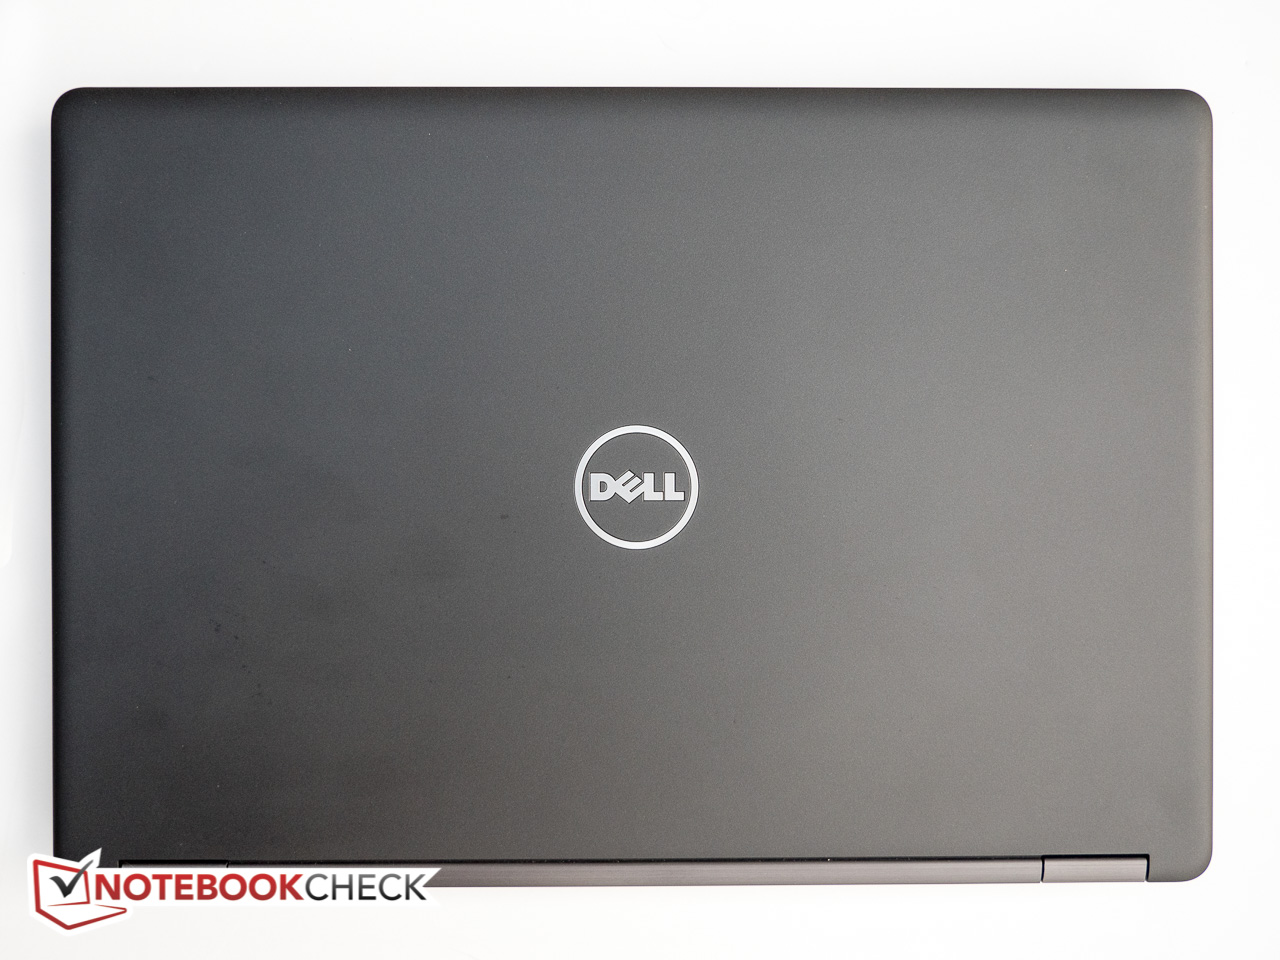
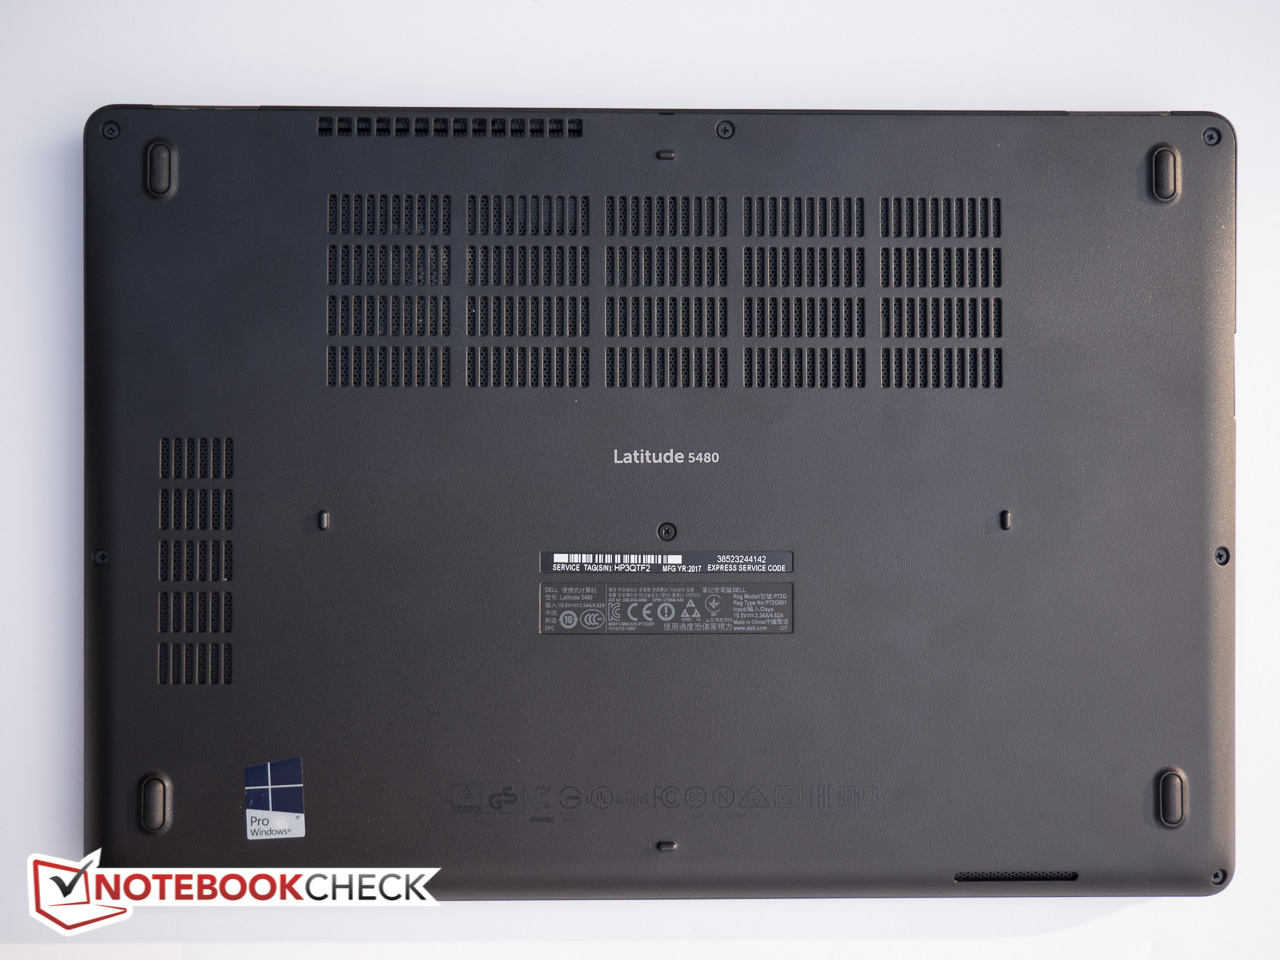
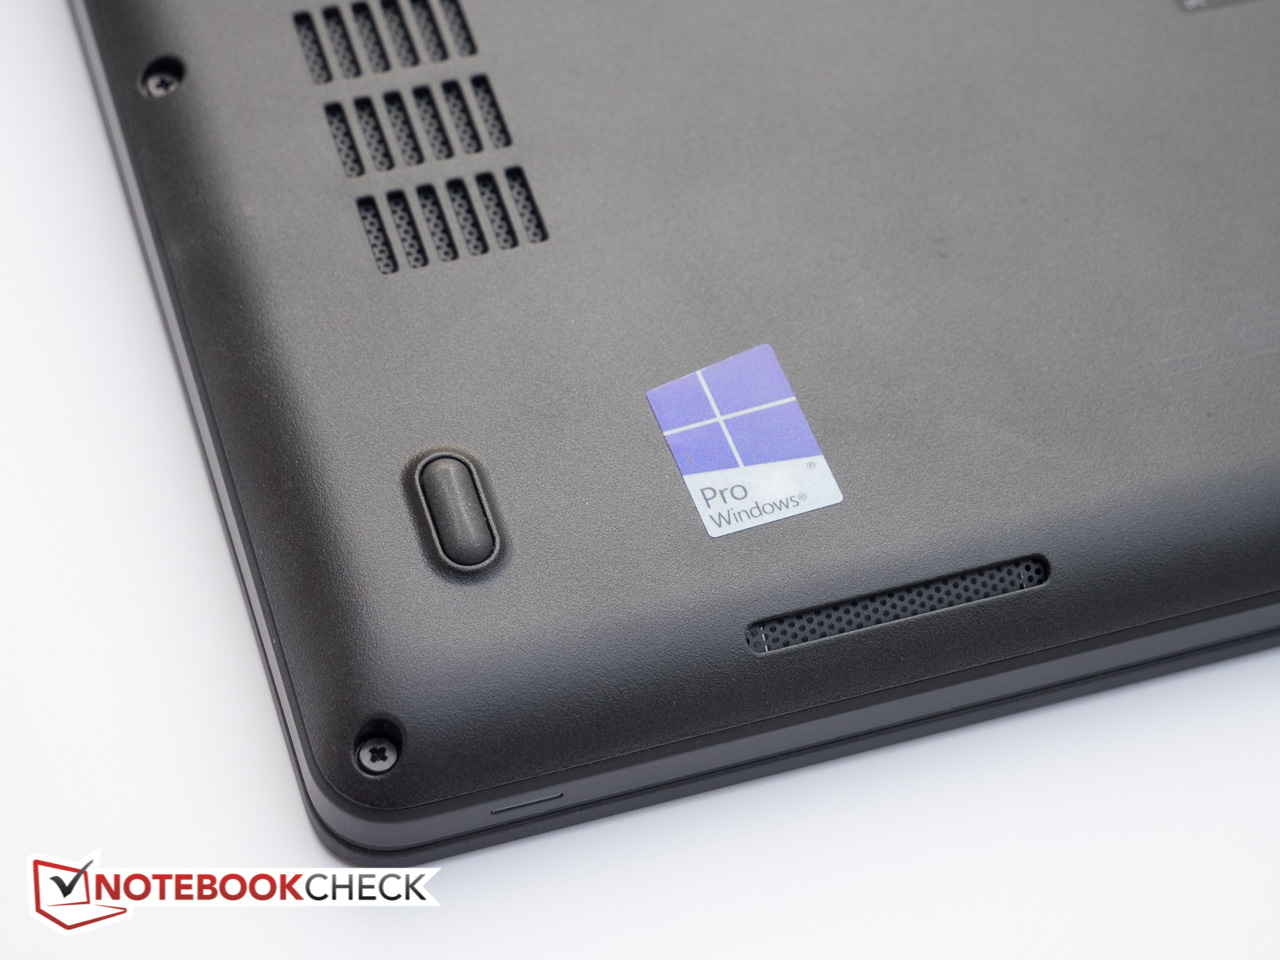
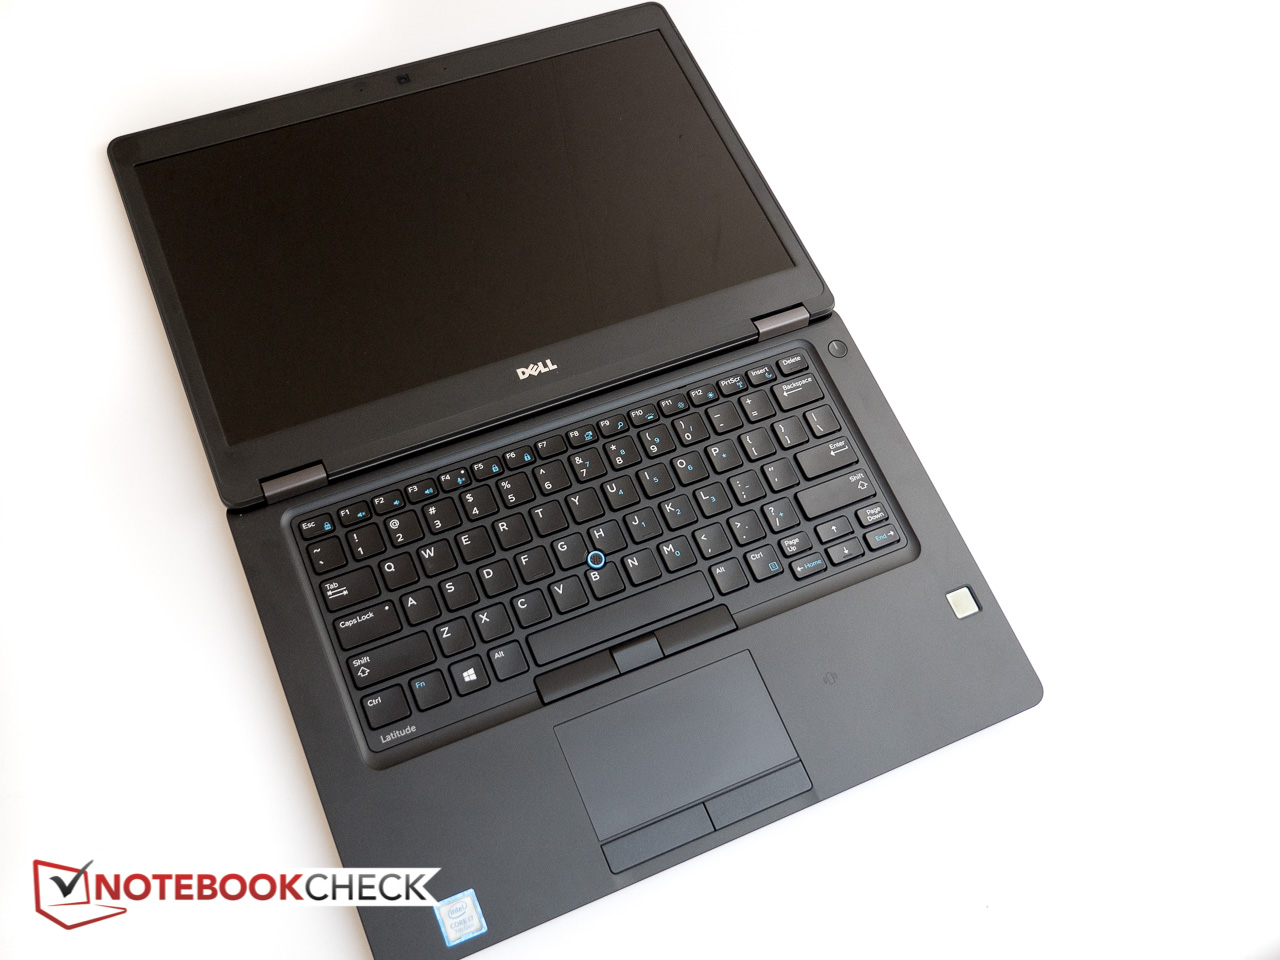
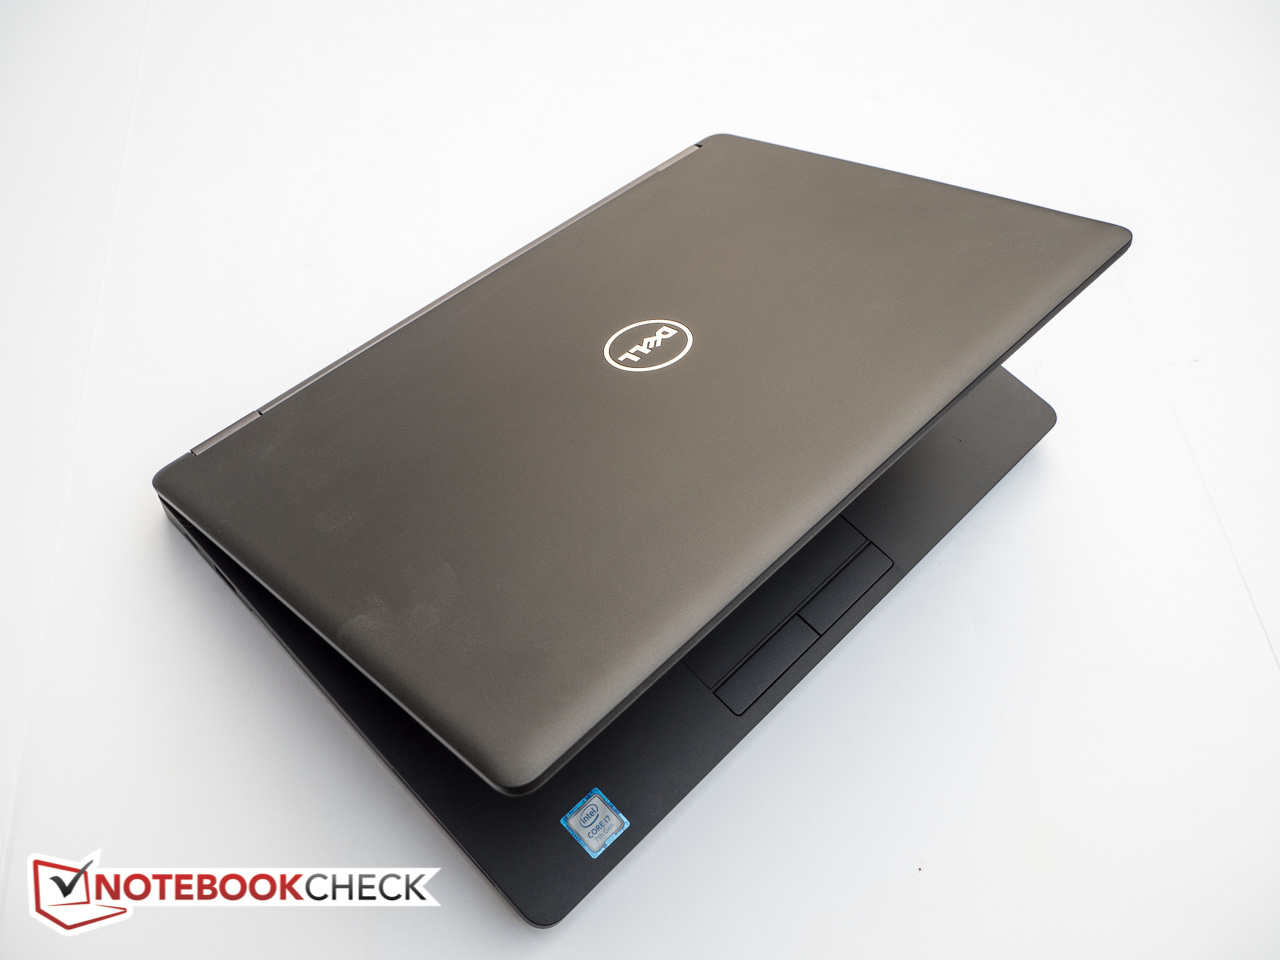
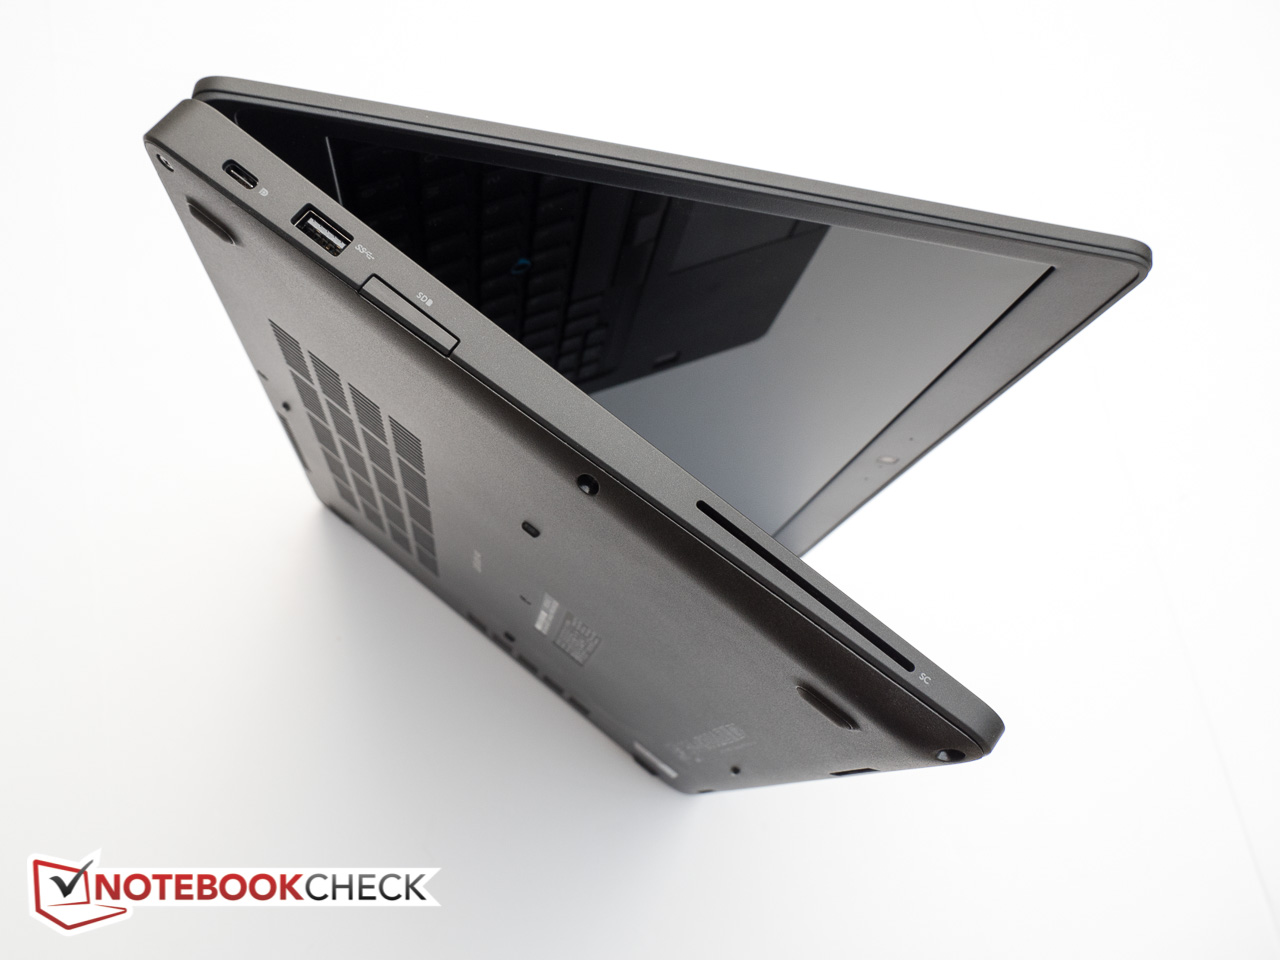
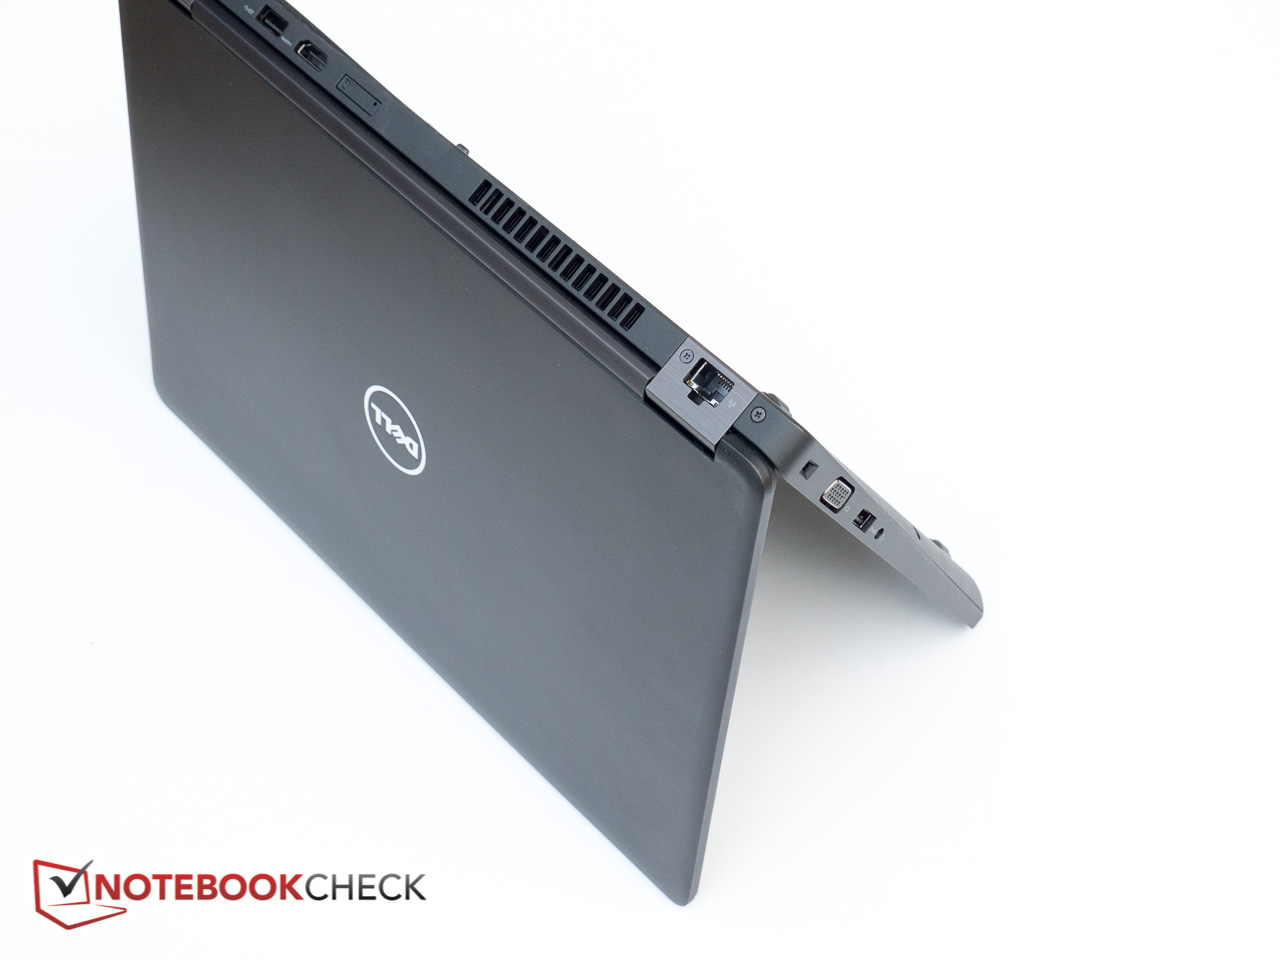
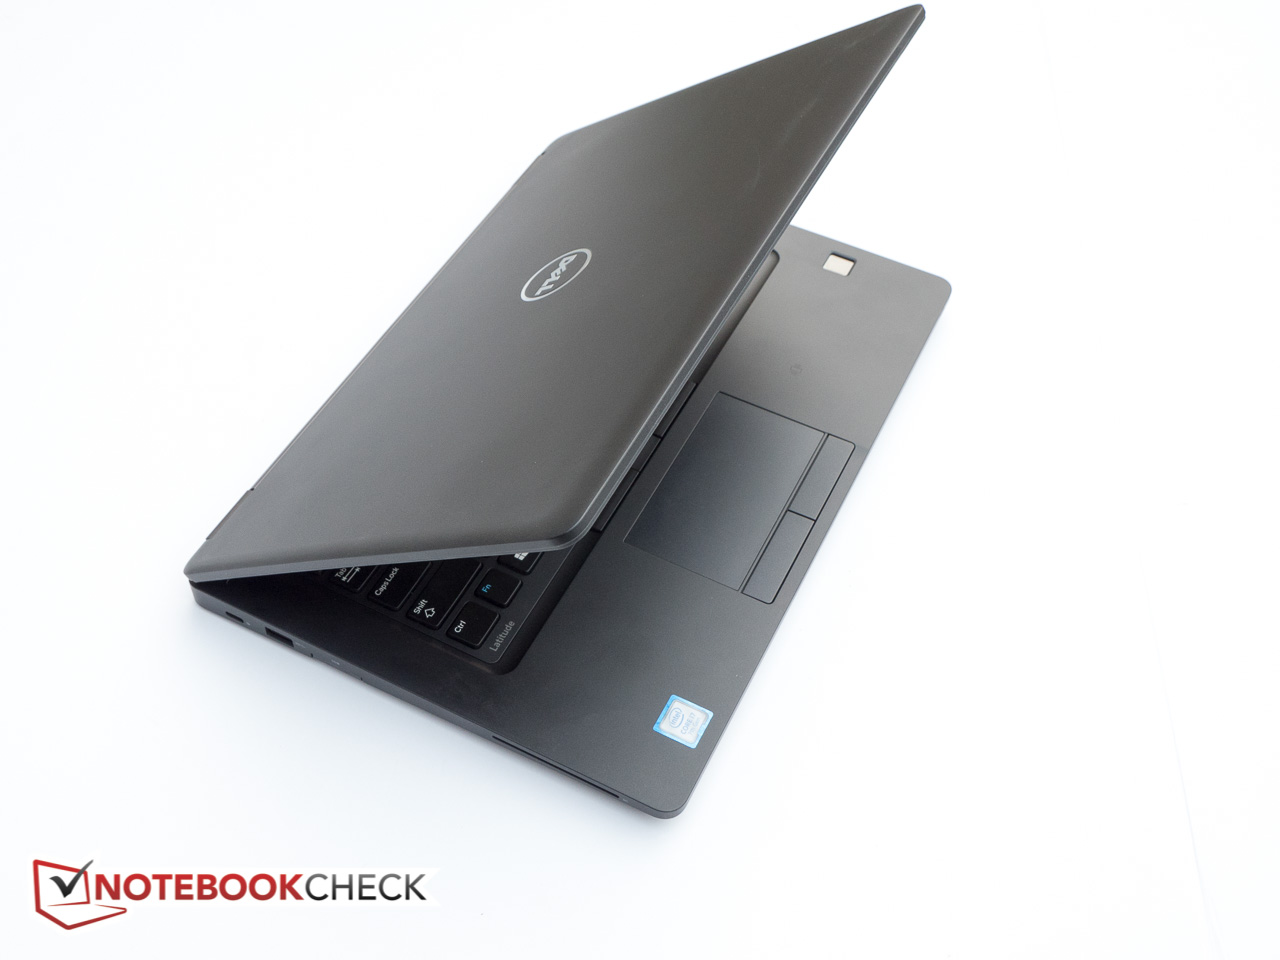
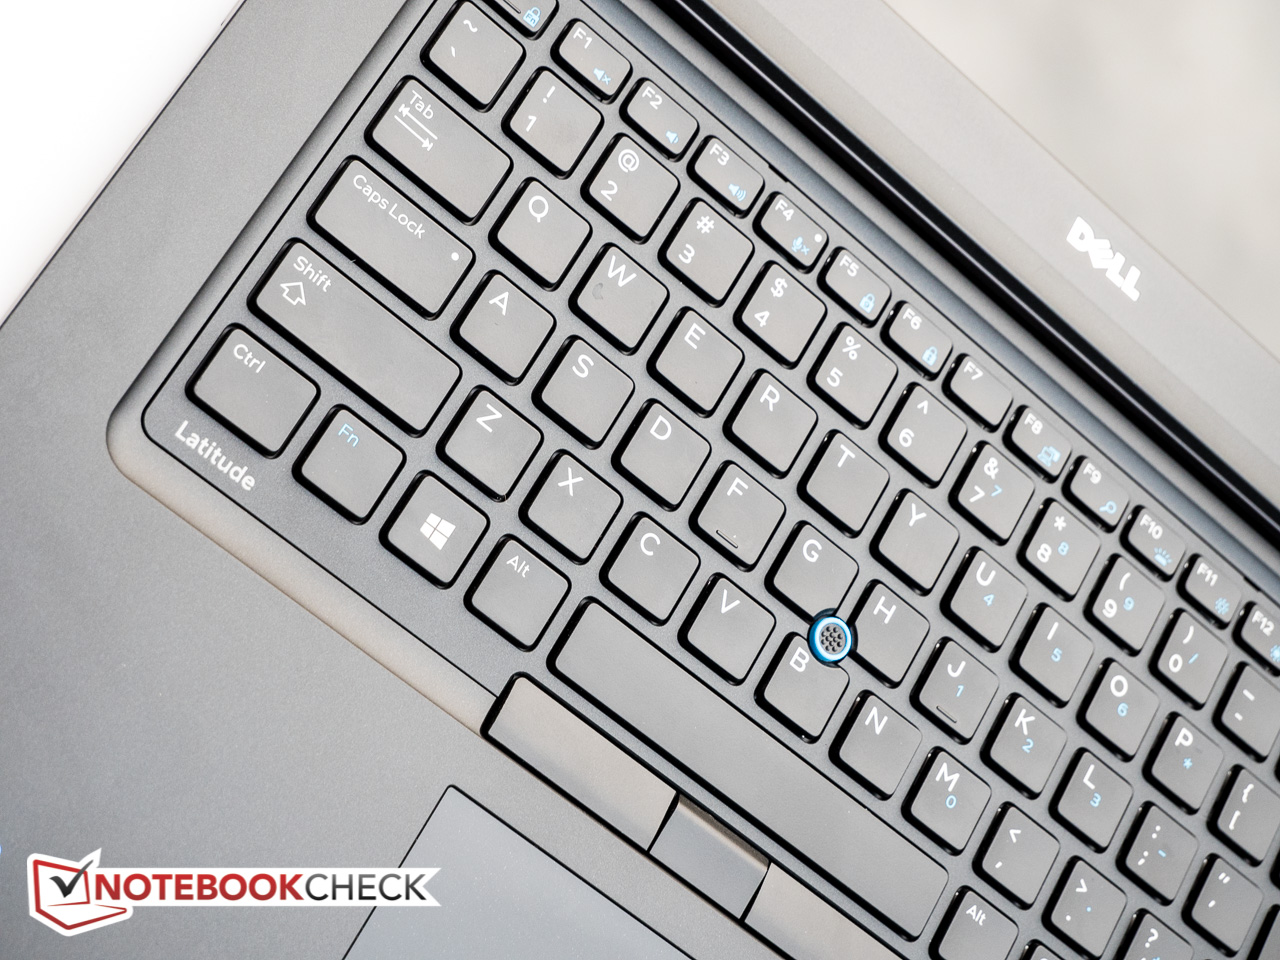
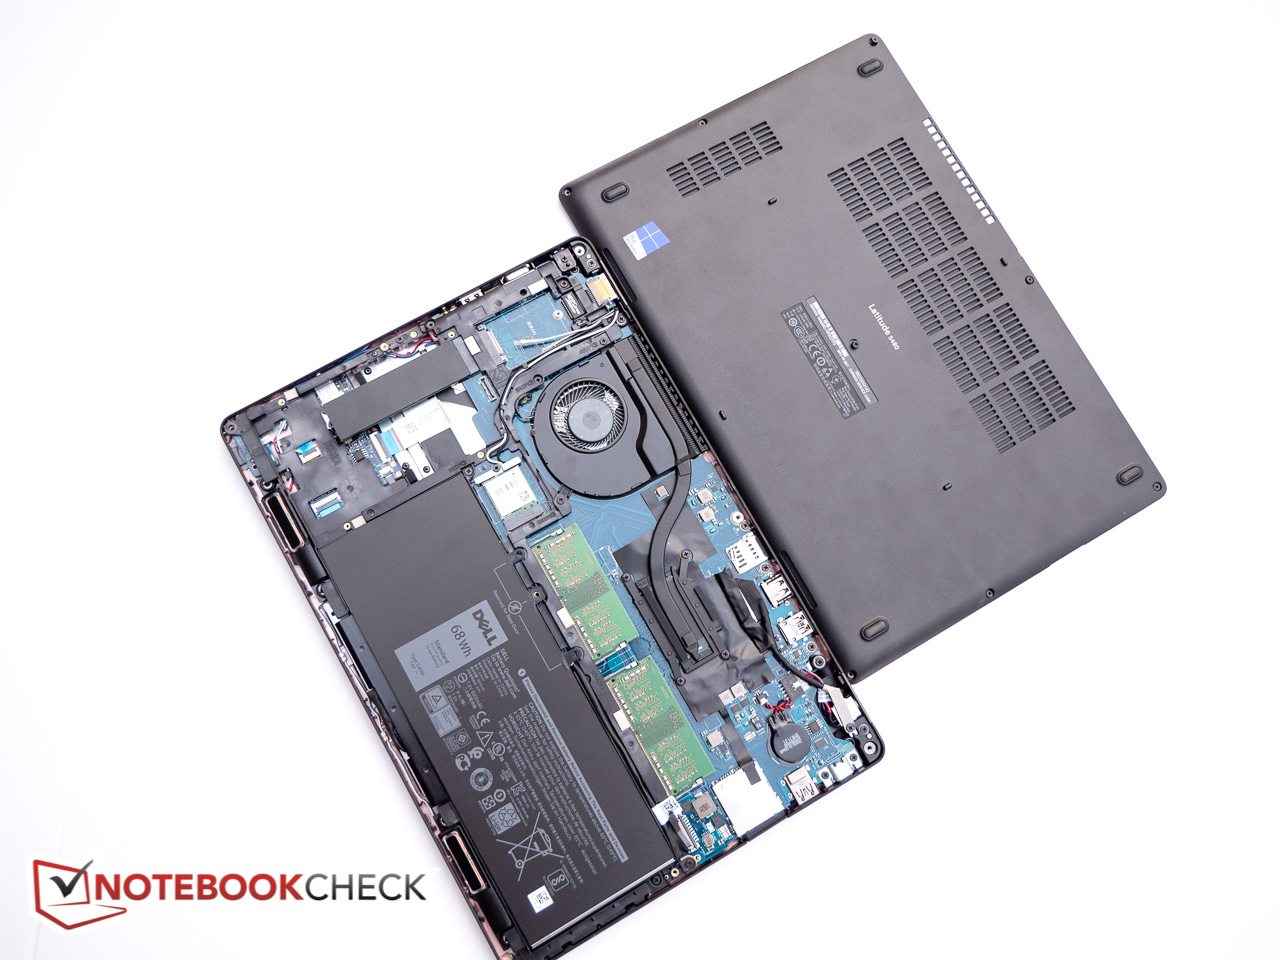
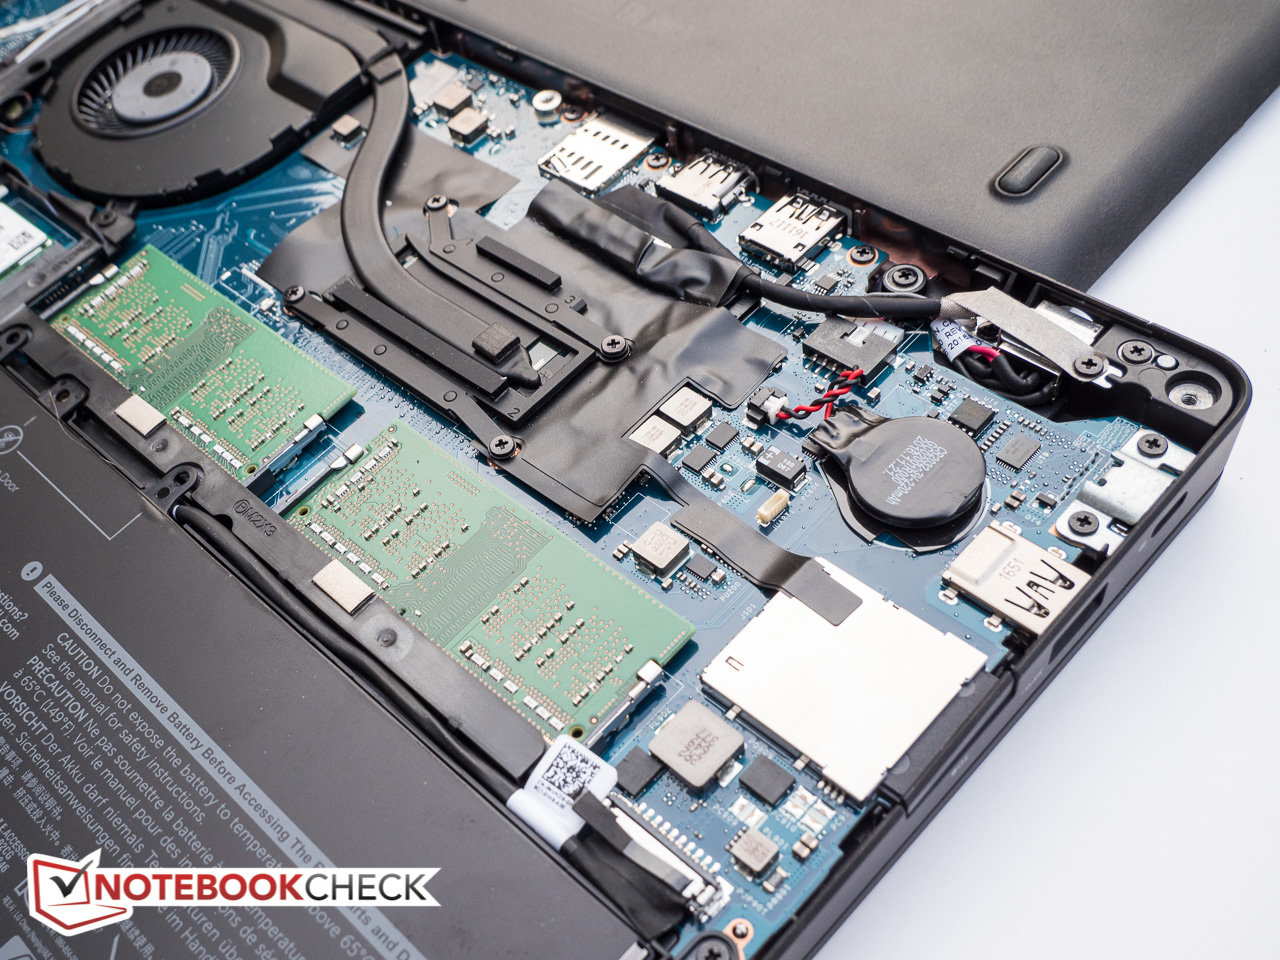
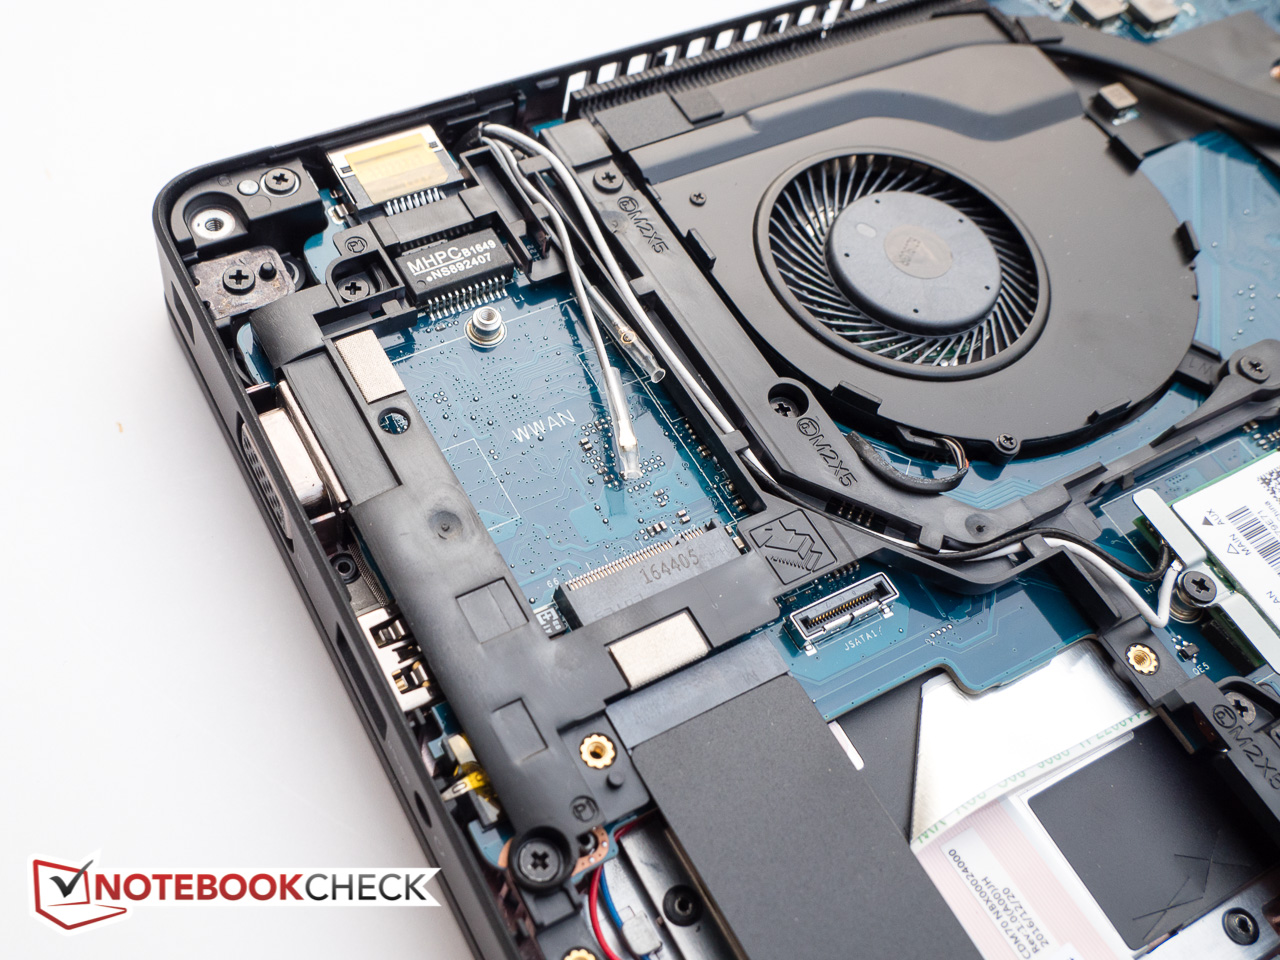
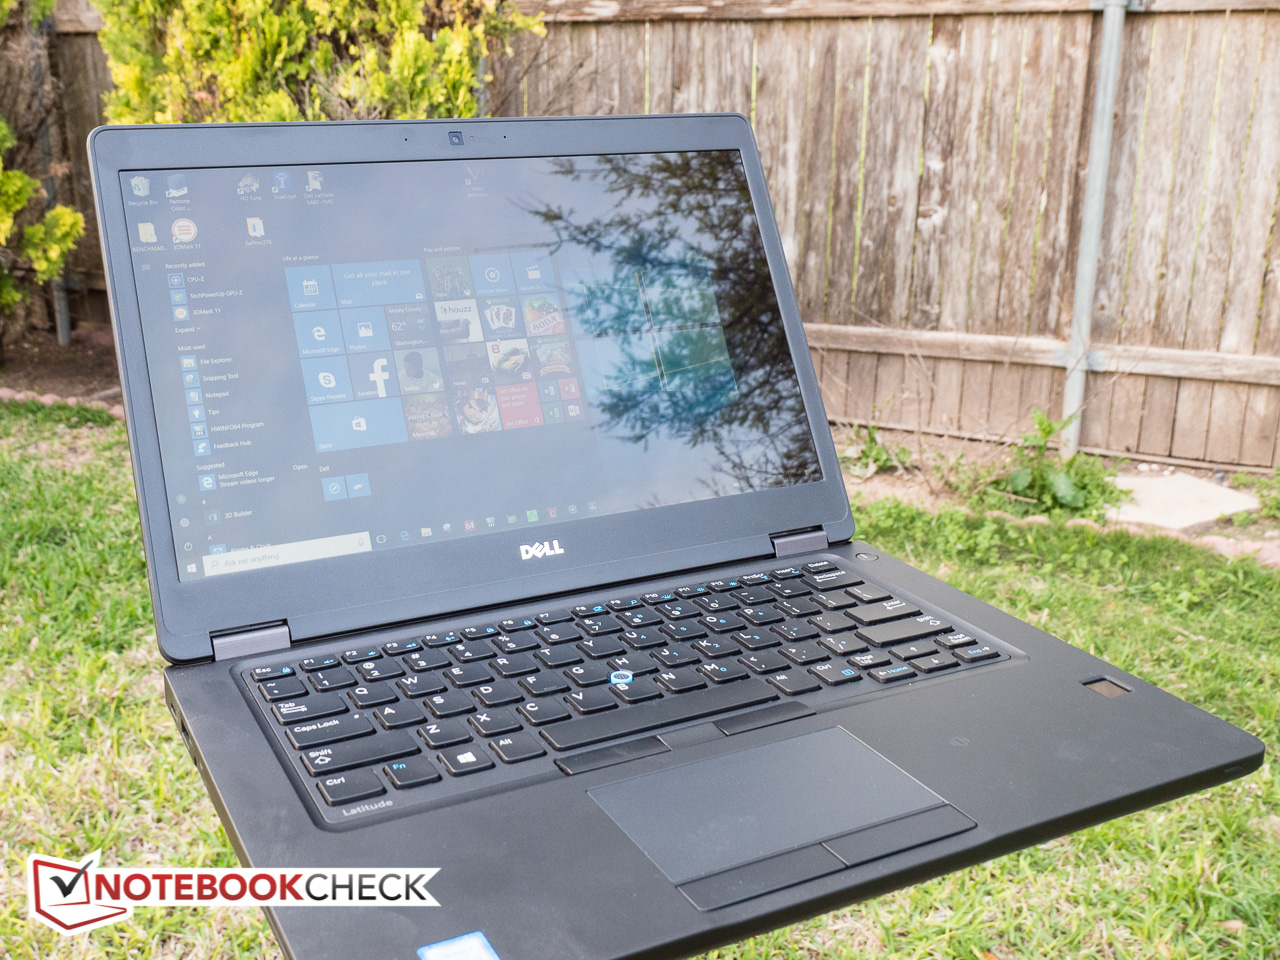
Op het eerste zicht is er weinig veranderd: met zijn sobere design en effen zwarte kleur lijkt de Dell Latitude 5480 erg op zijn voorganger, de Latitude 14 E5470. De high-end Kaby Lake i7 dual-core CPU biedt uitstekende prestaties die meer dan toereikend zijn voor business-gerichte taken. De geïntegreerde GPU is een stuk minder krachtig; gebruikers die meer grafische rekenkracht nodig hebben, kunnen opteren voor een Latitude-model met een discrete Nvidia GeForce 930MX GPU. De bouwkwaliteit is uitstekend met gelijkmatige materiaalovergangen en kleine toleranties, hoewel het toetsenbord in het midden volgens ons iets te gemakkelijk indrukbaar is. De invoerapparatuur - inclusief het touchscreen - werkt prima en typisten zullen graag met het toetsenbord aan de slag gaan. Pointstick-gebruikers die van een Thinkpad komen zullen echter minder onder de indruk zijn van het design van de muisknoppen.
Eén van de grootste verschillen - en volgens ons ook een grote stap in de verkeerde richting - is het nieuwe scherm. Hoewel het contrast beter is, zijn de kleurweergave en vooral de helderheid - het nieuwe paneel is 35% donkerder - er sterk op achteruitgegaan. Het is wel positief dat de batterijduur een stuk verbeterd is en nu met kop en schouders boven de concurrentie uitsteekt.
De batterijduur van de Latitude 5480 is ongeëvenaard - 16 uur WLAN-surfen zou voldoende moeten zijn voor zelfs de meest ijverige werkbijen. We zouden echter graag een paar uren looptijd inruilen voor een helderder schermpaneel.
Dell Latitude 5480
- 18-04-2017 v6 (old)
Bernhard Pechlaner
Price comparison
