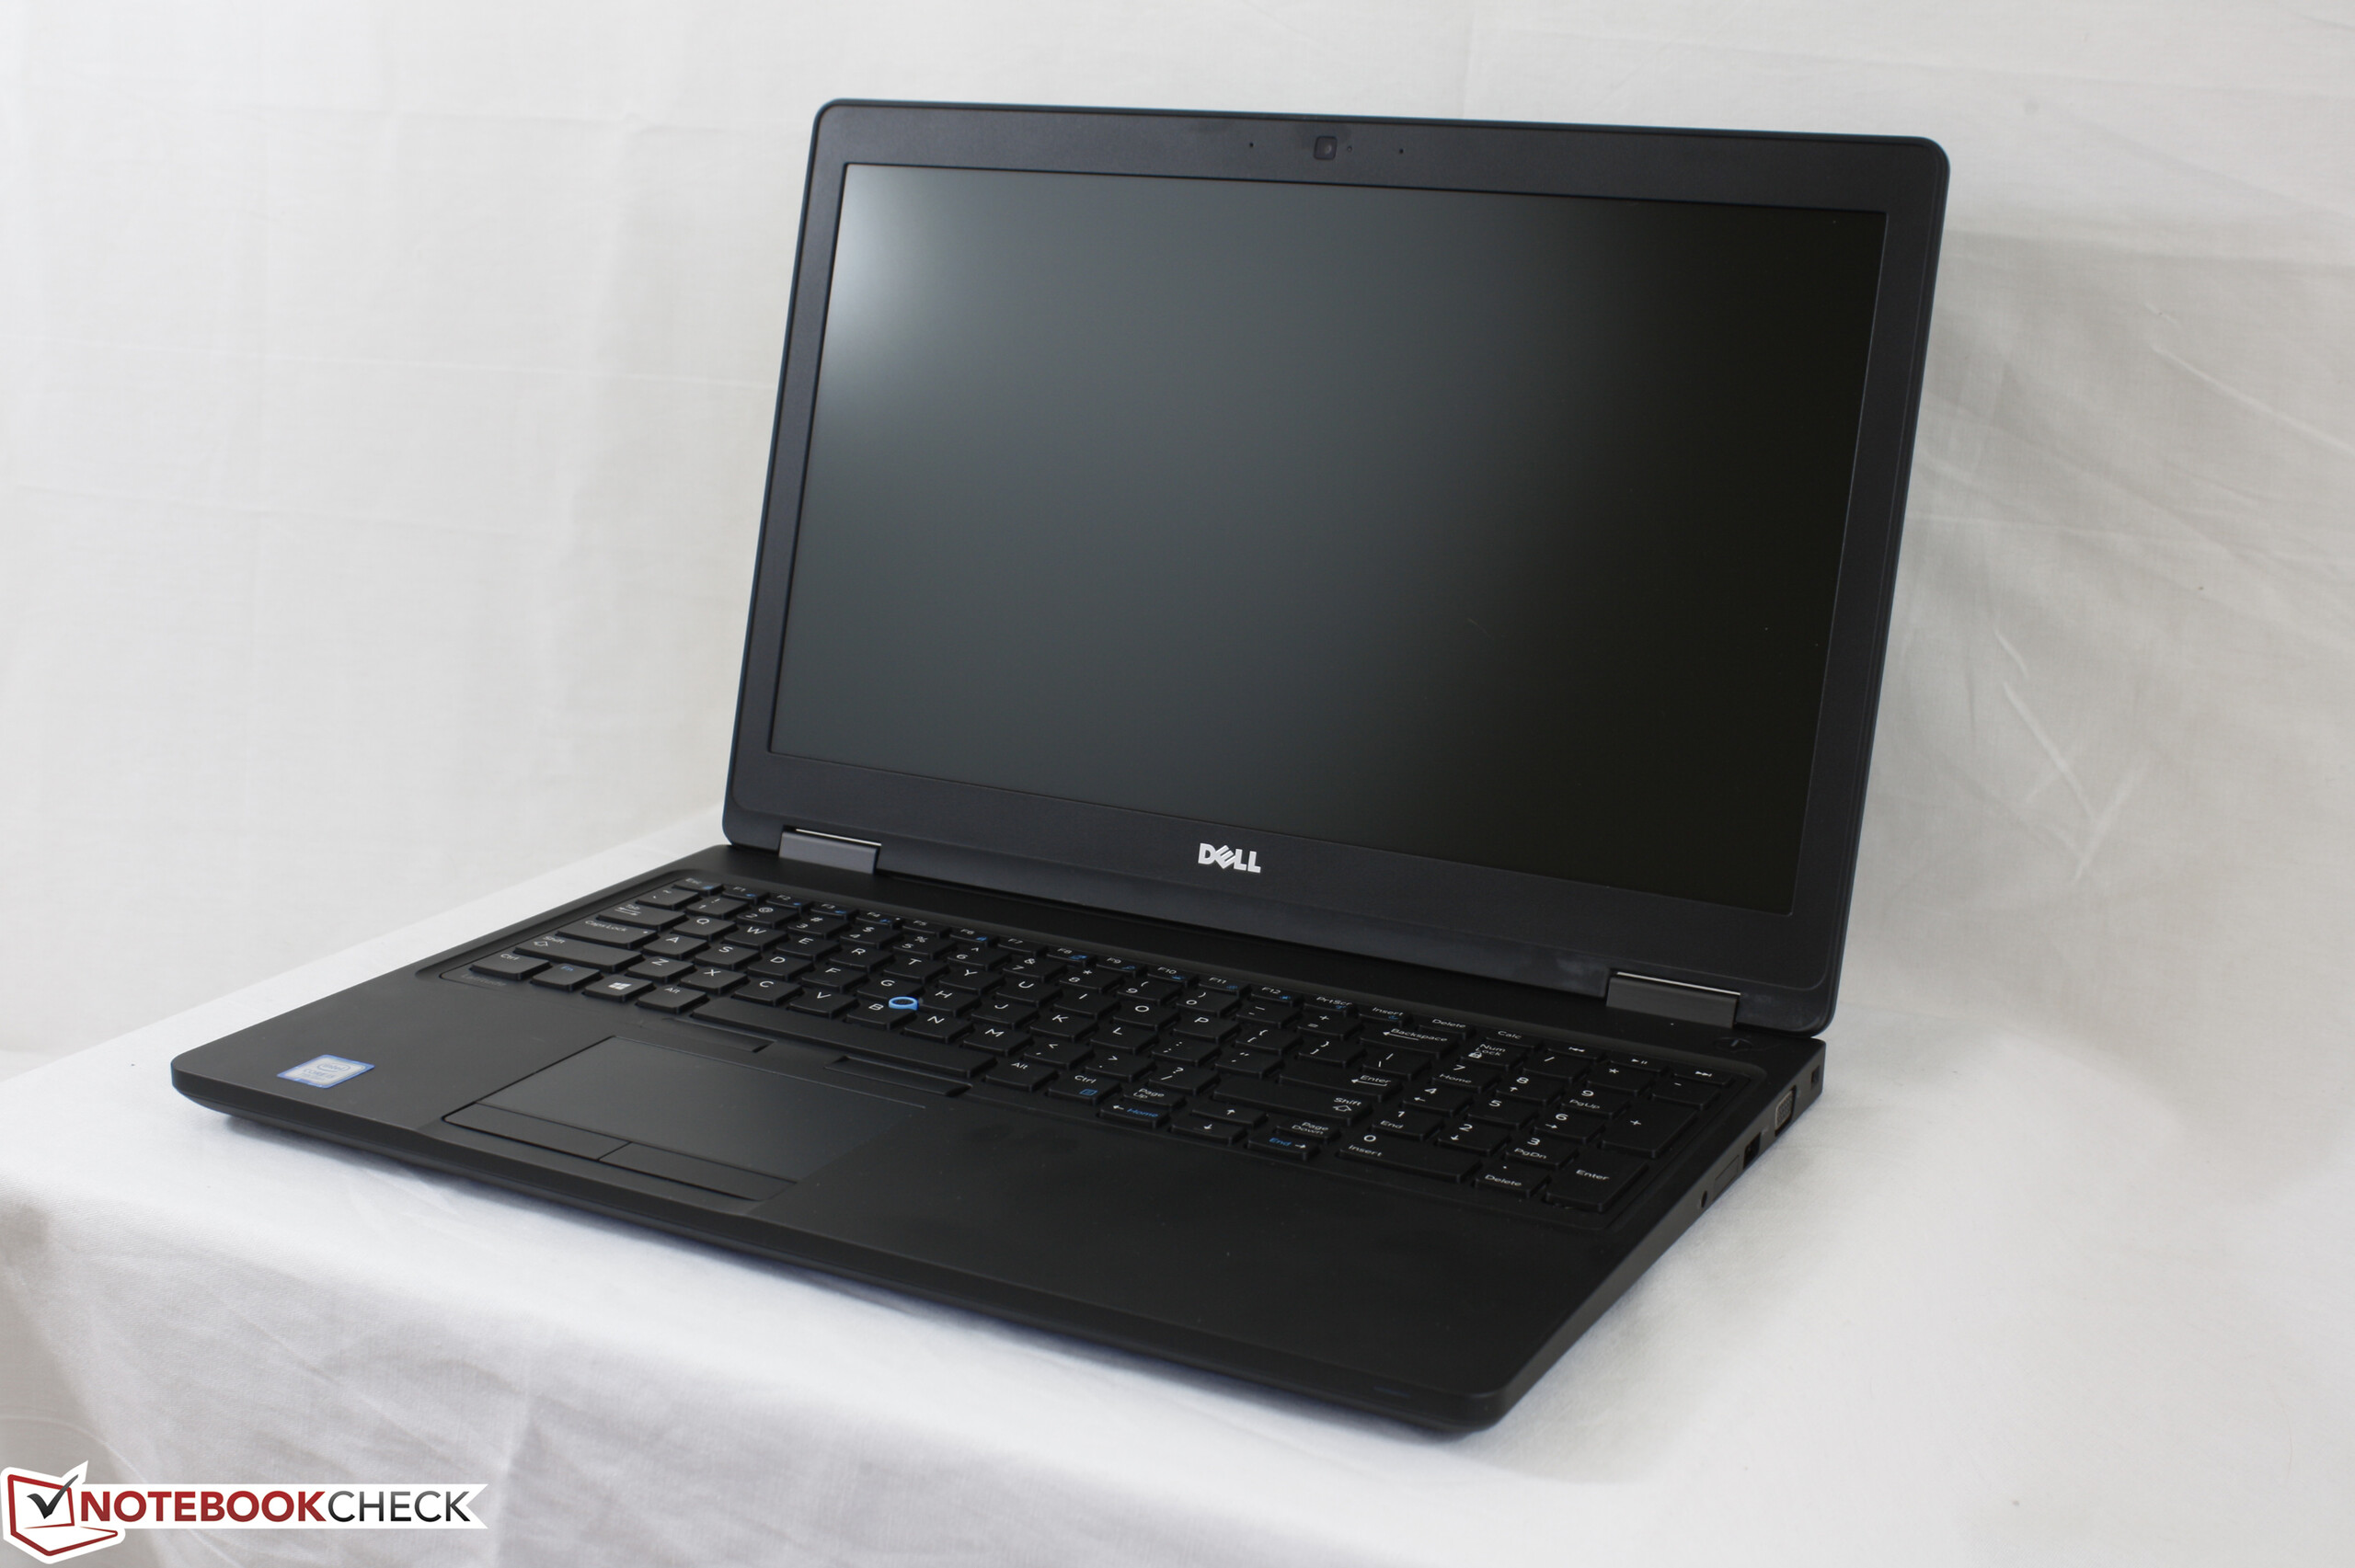
Kort testrapport Dell Latitude 5580 (i5-7200U, HD) Laptop
| SD Card Reader | |
| average JPG Copy Test (av. of 3 runs) | |
| Dell XPS 15 9560 (i7-7700HQ, UHD) | |
| Dell Latitude 5580 | |
| Lenovo ThinkPad T570-20H90002GE | |
| maximum AS SSD Seq Read Test (1GB) | |
| Dell Latitude 5580 | |
| Dell XPS 15 9560 (i7-7700HQ, UHD) | |
| Lenovo ThinkPad T570-20H90002GE | |
| Networking | |
| iperf3 transmit AX12 | |
| Asus AsusPro P4540UQ-FY0056R | |
| Lenovo ThinkPad T570-20H90002GE | |
| Dell Latitude 5580 | |
| iperf3 receive AX12 | |
| Dell Latitude 5580 | |
| Lenovo ThinkPad T570-20H90002GE | |
| Asus AsusPro P4540UQ-FY0056R | |
| |||||||||||||||||||||||||
Helderheidsverdeling: 83 %
Helderheid in Batterij-modus: 238 cd/m²
Contrast: 449:1 (Zwart: 0.53 cd/m²)
ΔE ColorChecker Calman: 10.8 | ∀{0.5-29.43 Ø4.73}
ΔE Greyscale Calman: 12.1 | ∀{0.09-98 Ø4.97}
59.9% sRGB (Argyll 1.6.3 3D)
38.3% AdobeRGB 1998 (Argyll 1.6.3 3D)
41.5% AdobeRGB 1998 (Argyll 3D)
60% sRGB (Argyll 3D)
40.13% Display P3 (Argyll 3D)
Gamma: 2.25
CCT: 14344 K
| Dell Latitude 5580 TN LED, 15.6", 1366x768 | Lenovo ThinkPad T570-20H90002GE N156HCA-EAA, IPS, 15.6", 1920x1080 | Asus AsusPro P4540UQ-FY0056R LG Philips LP156WF6-SPB6, IPS, 15.6", 1920x1080 | Toshiba Satellite Pro R50-C-16V Toshiba, TN LED, 15.6", 1366x768 | HP Probook 650 G3 Z2W44ET AU Optronics, TN LED, 15.6", 1920x1080 | |
|---|---|---|---|---|---|
| Display | 10% | 48% | 1% | 37% | |
| Display P3 Coverage (%) | 40.13 | 44.08 10% | 63.3 58% | 40.6 1% | 55.2 38% |
| sRGB Coverage (%) | 60 | 65.6 9% | 83.6 39% | 61.2 2% | 81.1 35% |
| AdobeRGB 1998 Coverage (%) | 41.5 | 45.66 10% | 61.1 47% | 41.95 1% | 57 37% |
| Response Times | -5% | -13% | -58% | -9% | |
| Response Time Grey 50% / Grey 80% * (ms) | 30 ? | 41.6 ? -39% | 38 ? -27% | 68 ? -127% | 38 ? -27% |
| Response Time Black / White * (ms) | 29.6 ? | 20.8 ? 30% | 29 ? 2% | 26 ? 12% | 27 ? 9% |
| PWM Frequency (Hz) | 201.6 ? | 26040 ? | 21000 ? | 217 ? | 200 ? |
| Screen | 44% | 52% | 5% | 22% | |
| Brightness middle (cd/m²) | 238 | 262 10% | 276 16% | 226 -5% | 351 47% |
| Brightness (cd/m²) | 216 | 245 13% | 283 31% | 217 0% | 345 60% |
| Brightness Distribution (%) | 83 | 89 7% | 85 2% | 91 10% | 95 14% |
| Black Level * (cd/m²) | 0.53 | 0.24 55% | 0.27 49% | 0.58 -9% | 0.65 -23% |
| Contrast (:1) | 449 | 1092 143% | 1022 128% | 390 -13% | 540 20% |
| Colorchecker dE 2000 * | 10.8 | 4.5 58% | 3.92 64% | 9.84 9% | 11.02 -2% |
| Colorchecker dE 2000 max. * | 29.3 | 10.5 64% | 9.13 69% | 16.77 43% | 17.68 40% |
| Greyscale dE 2000 * | 12.1 | 3.5 71% | 2.6 79% | 11.1 8% | 13.14 -9% |
| Gamma | 2.25 98% | 2.32 95% | 2.53 87% | 2.35 94% | 2.7 81% |
| CCT | 14344 45% | 6524 100% | 6561 99% | 11979 54% | 16626 39% |
| Color Space (Percent of AdobeRGB 1998) (%) | 38.3 | 42.04 10% | 54.5 42% | 39 2% | 52 36% |
| Color Space (Percent of sRGB) (%) | 59.9 | 65.4 9% | 83.7 40% | 61 2% | 81 35% |
| Totaal Gemiddelde (Programma / Instellingen) | 16% /
31% | 29% /
43% | -17% /
-4% | 17% /
21% |
* ... kleiner is beter
Responstijd Scherm
| ↔ Responstijd Zwart naar Wit | ||
|---|---|---|
| 29.6 ms ... stijging ↗ en daling ↘ gecombineerd | ↗ 21.2 ms stijging | 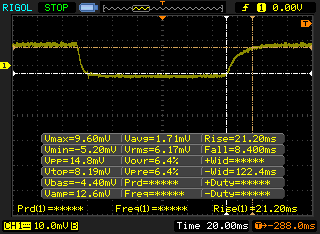 |
| ↘ 8.4 ms daling | ||
| Het scherm vertoonde relatief trage responstijden in onze tests en is misschien te traag voor games. Ter vergelijking: alle testtoestellen variëren van 0.1 (minimum) tot 240 (maximum) ms. » 79 % van alle toestellen zijn beter. Dit betekent dat de gemeten responstijd slechter is dan het gemiddelde (19.9 ms) van alle geteste toestellen. | ||
| ↔ Responstijd 50% Grijs naar 80% Grijs | ||
| 30 ms ... stijging ↗ en daling ↘ gecombineerd | ↗ 19.2 ms stijging | 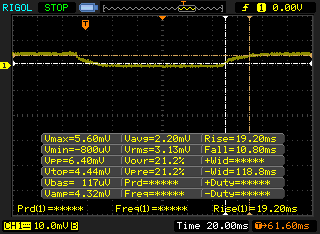 |
| ↘ 10.8 ms daling | ||
| Het scherm vertoonde trage responstijden in onze tests en is misschien te traag voor games. Ter vergelijking: alle testtoestellen variëren van 0.165 (minimum) tot 636 (maximum) ms. » 40 % van alle toestellen zijn beter. Dit betekent dat de gemeten responstijd vergelijkbaar is met het gemiddelde (31.1 ms) van alle geteste toestellen. | ||
Screen Flickering / PWM (Pulse-Width Modulation)
| Screen flickering / PWM waargenomen | 201.6 Hz | ≤ 99 % helderheid instelling | 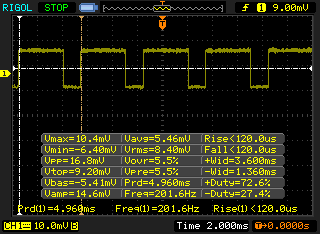 |
De achtergrondverlichting van het scherm flikkert op 201.6 Hz (in het slechtste geval, bijvoorbeeld bij gebruik van PWM) aan een helderheid van 99 % en lager. Boven deze helderheid zou er geen flickering / PWM mogen optreden. De frequentie van 201.6 Hz is redelijk laag en de meeste mensen die gevoelig zijn aan flickering kunnen dit dus waarnemen of geïrriteerde ogen krijgen (gebruikmakend van de vermelde helderheid en lager). Ter vergelijking: 52 % van alle geteste toestellen maakten geen gebruik van PWM om de schermhelderheid te verlagen. Als het wel werd gebruikt, werd een gemiddelde van 7798 (minimum: 5 - maximum: 343500) Hz waargenomen. | |||
| wPrime 2.10 - 1024m | |
| Lenovo Thinkpad 13-20J1001BUS | |
| Dell Latitude 7480 | |
| Dell Latitude 5580 | |
| Lenovo ThinkPad T470s-20HF0012US | |
| Apple MacBook Pro 15 2016 (2.7 GHz, 455) | |
* ... kleiner is beter
| PCMark 8 | |
| Home Score Accelerated v2 | |
| Lenovo ThinkPad T570-20H90002GE | |
| Asus AsusPro P4540UQ-FY0056R | |
| Dell Latitude 5580 | |
| HP Probook 650 G3 Z2W44ET | |
| Toshiba Satellite Pro R50-C-16V | |
| Work Score Accelerated v2 | |
| Lenovo ThinkPad T570-20H90002GE | |
| Asus AsusPro P4540UQ-FY0056R | |
| Dell Latitude 5580 | |
| HP Probook 650 G3 Z2W44ET | |
| Toshiba Satellite Pro R50-C-16V | |
| Creative Score Accelerated v2 | |
| Lenovo ThinkPad T570-20H90002GE | |
| Asus AsusPro P4540UQ-FY0056R | |
| Dell Latitude 5580 | |
| HP Probook 650 G3 Z2W44ET | |
| Toshiba Satellite Pro R50-C-16V | |
| PCMark 8 Home Score Accelerated v2 | 3345 punten | |
| PCMark 8 Creative Score Accelerated v2 | 3942 punten | |
| PCMark 8 Work Score Accelerated v2 | 4390 punten | |
Help | ||
| Dell Latitude 5580 Seagate ST500LM021-1KJ15 | Lenovo ThinkPad T570-20H90002GE Samsung PM961 MZVLW256HEHP | Asus AsusPro P4540UQ-FY0056R SK Hynix HFS256G39TND-N210A | Toshiba Satellite Pro R50-C-16V TOSHIBA MQ01ABD075 | HP ProBook 650 G3 Z2N47EA Samsung SSD 850 EVO 250GB | |
|---|---|---|---|---|---|
| CrystalDiskMark 3.0 | 16541% | 10100% | -30% | 7088% | |
| Read Seq (MB/s) | 132.3 | 1318 896% | 498.4 277% | 96.5 -27% | 506 282% |
| Write Seq (MB/s) | 131.1 | 1166 789% | 257.1 96% | 77.9 -41% | 475.2 262% |
| Read 512 (MB/s) | 27.04 | 933 3350% | 309.3 1044% | 20.82 -23% | 435.9 1512% |
| Write 512 (MB/s) | 56.6 | 860 1419% | 264.2 367% | 19.83 -65% | 367.2 549% |
| Read 4k (MB/s) | 0.459 | 56.6 12231% | 30.6 6567% | 0.342 -25% | 41.78 9002% |
| Write 4k (MB/s) | 0.812 | 130.6 15984% | 77.3 9420% | 0.836 3% | 86.1 10503% |
| Read 4k QD32 (MB/s) | 1.1 | 510 46264% | 357.4 32391% | 0.595 -46% | 263.2 23827% |
| Write 4k QD32 (MB/s) | 0.828 | 426.4 51398% | 254.5 30637% | 0.706 -15% | 90 10770% |

| 3DMark 11 | |
| 1280x720 Performance GPU | |
| Dell Latitude 12 5285 2-in-1 | |
| Lenovo ThinkPad T470s-20HF0012US | |
| Dell Latitude 5480 N005L548014EMEA | |
| Lenovo Miix 510 Pro 80U10006GE | |
| Dell Latitude 5580 | |
| Toshiba Portege Z20t-C-121 | |
| Asus Vivobook F556UQ-XO626D | |
| Asus PU551LA-XO359G | |
| Acer Aspire One Cloudbook 14 AO1-431-C6QM | |
| 1280x720 Performance Combined | |
| Dell Latitude 5480 N005L548014EMEA | |
| Lenovo ThinkPad T470s-20HF0012US | |
| Dell Latitude 12 5285 2-in-1 | |
| Lenovo Miix 510 Pro 80U10006GE | |
| Asus Vivobook F556UQ-XO626D | |
| Dell Latitude 5580 | |
| Asus PU551LA-XO359G | |
| Toshiba Portege Z20t-C-121 | |
| Acer Aspire One Cloudbook 14 AO1-431-C6QM | |
| 3DMark | |
| 1280x720 Cloud Gate Standard Graphics | |
| Dell Latitude 12 5285 2-in-1 | |
| Dell Latitude 5480 N005L548014EMEA | |
| Lenovo ThinkPad T470s-20HF0012US | |
| Lenovo Miix 510 Pro 80U10006GE | |
| Dell Latitude 5580 | |
| Asus Vivobook F556UQ-XO626D | |
| Acer Aspire One Cloudbook 14 AO1-431-C6QM | |
| 1920x1080 Fire Strike Graphics | |
| Dell Latitude 12 5285 2-in-1 | |
| Dell Latitude 5480 N005L548014EMEA | |
| Lenovo ThinkPad T470s-20HF0012US | |
| Dell Latitude 5580 | |
| Asus PU551LA-XO359G | |
| Asus Vivobook F556UQ-XO626D | |
| Acer Aspire One Cloudbook 14 AO1-431-C6QM | |
| 1280x720 Ice Storm Standard Graphics | |
| Dell Latitude 5480 N005L548014EMEA | |
| Lenovo ThinkPad T470s-20HF0012US | |
| Asus Vivobook F556UQ-XO626D | |
| Asus PU551LA-XO359G | |
| Dell Latitude 5580 | |
| Acer Aspire One Cloudbook 14 AO1-431-C6QM | |
| Dell Latitude 12 5285 2-in-1 | |
| 1920x1080 Ice Storm Extreme Graphics | |
| Dell Latitude 5480 N005L548014EMEA | |
| Dell Latitude 12 5285 2-in-1 | |
| Dell Latitude 5580 | |
| Asus PU551LA-XO359G | |
| Asus Vivobook F556UQ-XO626D | |
| 3DMark 11 Performance | 1354 punten | |
| 3DMark Ice Storm Standard Score | 47545 punten | |
| 3DMark Cloud Gate Standard Score | 5273 punten | |
| 3DMark Fire Strike Score | 621 punten | |
Help | ||
| lage | gem. | hoge | ultra | |
|---|---|---|---|---|
| BioShock Infinite (2013) | 52 | 29 | ||
| Rise of the Tomb Raider (2016) | 19.1 | 11.2 |
Geluidsniveau
| Onbelast |
| 32.6 / 32.6 / 32.8 dB (A) |
| HDD |
| 33.2 dB (A) |
| Belasting |
| 33.5 / 34.7 dB (A) |
 | ||
30 dB stil 40 dB(A) hoorbaar 50 dB(A) luid |
||
min: | ||
| Dell Latitude 5580 HD Graphics 620, i5-7200U, Seagate ST500LM021-1KJ15 | Lenovo ThinkPad T570-20H90002GE HD Graphics 620, i5-7200U, Samsung PM961 MZVLW256HEHP | Asus AsusPro P4540UQ-FY0056R GeForce 940MX, i5-7200U, SK Hynix HFS256G39TND-N210A | Toshiba Satellite Pro R50-C-16V HD Graphics 520, 6006U, TOSHIBA MQ01ABD075 | HP ProBook 650 G3 Z2N47EA HD Graphics 620, i5-7200U, Samsung SSD 850 EVO 250GB | |
|---|---|---|---|---|---|
| Noise | 1% | 0% | 2% | -7% | |
| uit / omgeving * (dB) | 28.2 | 29.3 -4% | 30.3 -7% | 30.4 -8% | |
| Idle Minimum * (dB) | 32.6 | 29.3 10% | 30.3 7% | 31.8 2% | 32.5 -0% |
| Idle Average * (dB) | 32.6 | 29.3 10% | 30.3 7% | 31.8 2% | 33.1 -2% |
| Idle Maximum * (dB) | 32.8 | 31.2 5% | 30.3 8% | 31.8 3% | 33.7 -3% |
| Load Average * (dB) | 33.5 | 35.1 -5% | 35.4 -6% | 31.9 5% | 37 -10% |
| Load Maximum * (dB) | 34.7 | 38.7 -12% | 37.2 -7% | 31.8 8% | 42.5 -22% |
* ... kleiner is beter
(+) De maximumtemperatuur aan de bovenzijde bedraagt 36.2 °C / 97 F, vergeleken met het gemiddelde van 34.3 °C / 94 F, variërend van 21.2 tot 62.5 °C voor de klasse Office.
(-) De bodem warmt op tot een maximum van 45.6 °C / 114 F, vergeleken met een gemiddelde van 36.8 °C / 98 F
(+) Bij onbelast gebruik bedraagt de gemiddelde temperatuur voor de bovenzijde 25 °C / 77 F, vergeleken met het apparaatgemiddelde van 29.5 °C / 85 F.
(+) De palmsteunen en het touchpad zijn met een maximum van ###max## °C / 81 F koeler dan de huidtemperatuur en voelen daarom koel aan.
(±) De gemiddelde temperatuur van de handpalmsteun van soortgelijke toestellen bedroeg 27.5 °C / 81.5 F (+0.3 °C / 0.5 F).
Dell Latitude 5580 audioanalyse
(-) | niet erg luide luidsprekers (70.2 dB)
Bas 100 - 315 Hz
(±) | verminderde zeebaars - gemiddeld 12.5% lager dan de mediaan
(±) | lineariteit van de lage tonen is gemiddeld (10.4% delta ten opzichte van de vorige frequentie)
Midden 400 - 2000 Hz
(+) | evenwichtige middens - slechts 4.6% verwijderd van de mediaan
(±) | lineariteit van de middentonen is gemiddeld (8.9% delta ten opzichte van de vorige frequentie)
Hoog 2 - 16 kHz
(±) | higher highs - on average 5.1% higher than median
(±) | lineariteit van de hoogtepunten is gemiddeld (9.9% delta ten opzichte van de vorige frequentie)
Algemeen 100 - 16.000 Hz
(±) | lineariteit van het totale geluid is gemiddeld (24.6% verschil met de mediaan)
Vergeleken met dezelfde klasse
» 72% van alle geteste apparaten in deze klasse waren beter, 7% vergelijkbaar, 21% slechter
» De beste had een delta van 7%, het gemiddelde was 21%, de slechtste was 53%
Vergeleken met alle geteste toestellen
» 75% van alle geteste apparaten waren beter, 5% gelijk, 20% slechter
» De beste had een delta van 4%, het gemiddelde was 24%, de slechtste was 134%
Apple MacBook 12 (Early 2016) 1.1 GHz audioanalyse
(+) | luidsprekers kunnen relatief luid spelen (83.6 dB)
Bas 100 - 315 Hz
(±) | verminderde zeebaars - gemiddeld 11.3% lager dan de mediaan
(±) | lineariteit van de lage tonen is gemiddeld (14.2% delta ten opzichte van de vorige frequentie)
Midden 400 - 2000 Hz
(+) | evenwichtige middens - slechts 2.4% verwijderd van de mediaan
(+) | de middentonen zijn lineair (5.5% delta ten opzichte van de vorige frequentie)
Hoog 2 - 16 kHz
(+) | evenwichtige hoogtepunten - slechts 2% verwijderd van de mediaan
(+) | de hoge tonen zijn lineair (4.5% delta naar de vorige frequentie)
Algemeen 100 - 16.000 Hz
(+) | het totale geluid is lineair (10.2% verschil met de mediaan)
Vergeleken met dezelfde klasse
» 7% van alle geteste apparaten in deze klasse waren beter, 2% vergelijkbaar, 91% slechter
» De beste had een delta van 5%, het gemiddelde was 18%, de slechtste was 53%
Vergeleken met alle geteste toestellen
» 5% van alle geteste apparaten waren beter, 1% gelijk, 94% slechter
» De beste had een delta van 4%, het gemiddelde was 24%, de slechtste was 134%
| Uit / Standby | |
| Inactief | |
| Belasting |
|
Key:
min: | |
| Dell Latitude 5580 i5-7200U, HD Graphics 620, Seagate ST500LM021-1KJ15, TN LED, 1366x768, 15.6" | Lenovo ThinkPad T570-20H90002GE i5-7200U, HD Graphics 620, Samsung PM961 MZVLW256HEHP, IPS, 1920x1080, 15.6" | Asus AsusPro P4540UQ-FY0056R i5-7200U, GeForce 940MX, SK Hynix HFS256G39TND-N210A, IPS, 1920x1080, 15.6" | Toshiba Satellite Pro R50-C-16V 6006U, HD Graphics 520, TOSHIBA MQ01ABD075, TN LED, 1366x768, 15.6" | HP ProBook 650 G3 Z2N47EA i5-7200U, HD Graphics 620, Samsung SSD 850 EVO 250GB, podświetlanie diodami LED, 1920x1080, 15.6" | |
|---|---|---|---|---|---|
| Power Consumption | -18% | -54% | -16% | -40% | |
| Idle Minimum * (Watt) | 3.5 | 3.6 -3% | 4.9 -40% | 6 -71% | 7 -100% |
| Idle Average * (Watt) | 6 | 7.7 -28% | 8.1 -35% | 8.7 -45% | 9.2 -53% |
| Idle Maximum * (Watt) | 7.3 | 8.2 -12% | 9.4 -29% | 9.2 -26% | 10.3 -41% |
| Load Average * (Watt) | 30.8 | 30.8 -0% | 50 -62% | 18.6 40% | 25.8 16% |
| Load Maximum * (Watt) | 31 | 46.1 -49% | 63.7 -105% | 23.8 23% | 37.5 -21% |
* ... kleiner is beter
| Dell Latitude 5580 i5-7200U, HD Graphics 620, 68 Wh | Lenovo ThinkPad T570-20H90002GE i5-7200U, HD Graphics 620, 56 Wh | Asus AsusPro P4540UQ-FY0056R i5-7200U, GeForce 940MX, 72 Wh | Toshiba Satellite Pro R50-C-16V 6006U, HD Graphics 520, 44 Wh | HP Probook 650 G3 Z2W44ET i5-7200U, HD Graphics 620, 48 Wh | |
|---|---|---|---|---|---|
| Batterijduur | 9% | -1% | -49% | -9% | |
| Reader / Idle (h) | 18.4 | 19.5 6% | 12.8 -30% | ||
| WiFi v1.3 (h) | 11.6 | 7.6 -34% | 11.5 -1% | 5.9 -49% | 7.8 -33% |
| Load (h) | 2.2 | 3.4 55% | 3 36% |
Pro
Contra
Dit is de verkorte versie van het originele artikel. Het volledige, Engelse testrapport vind je hier.
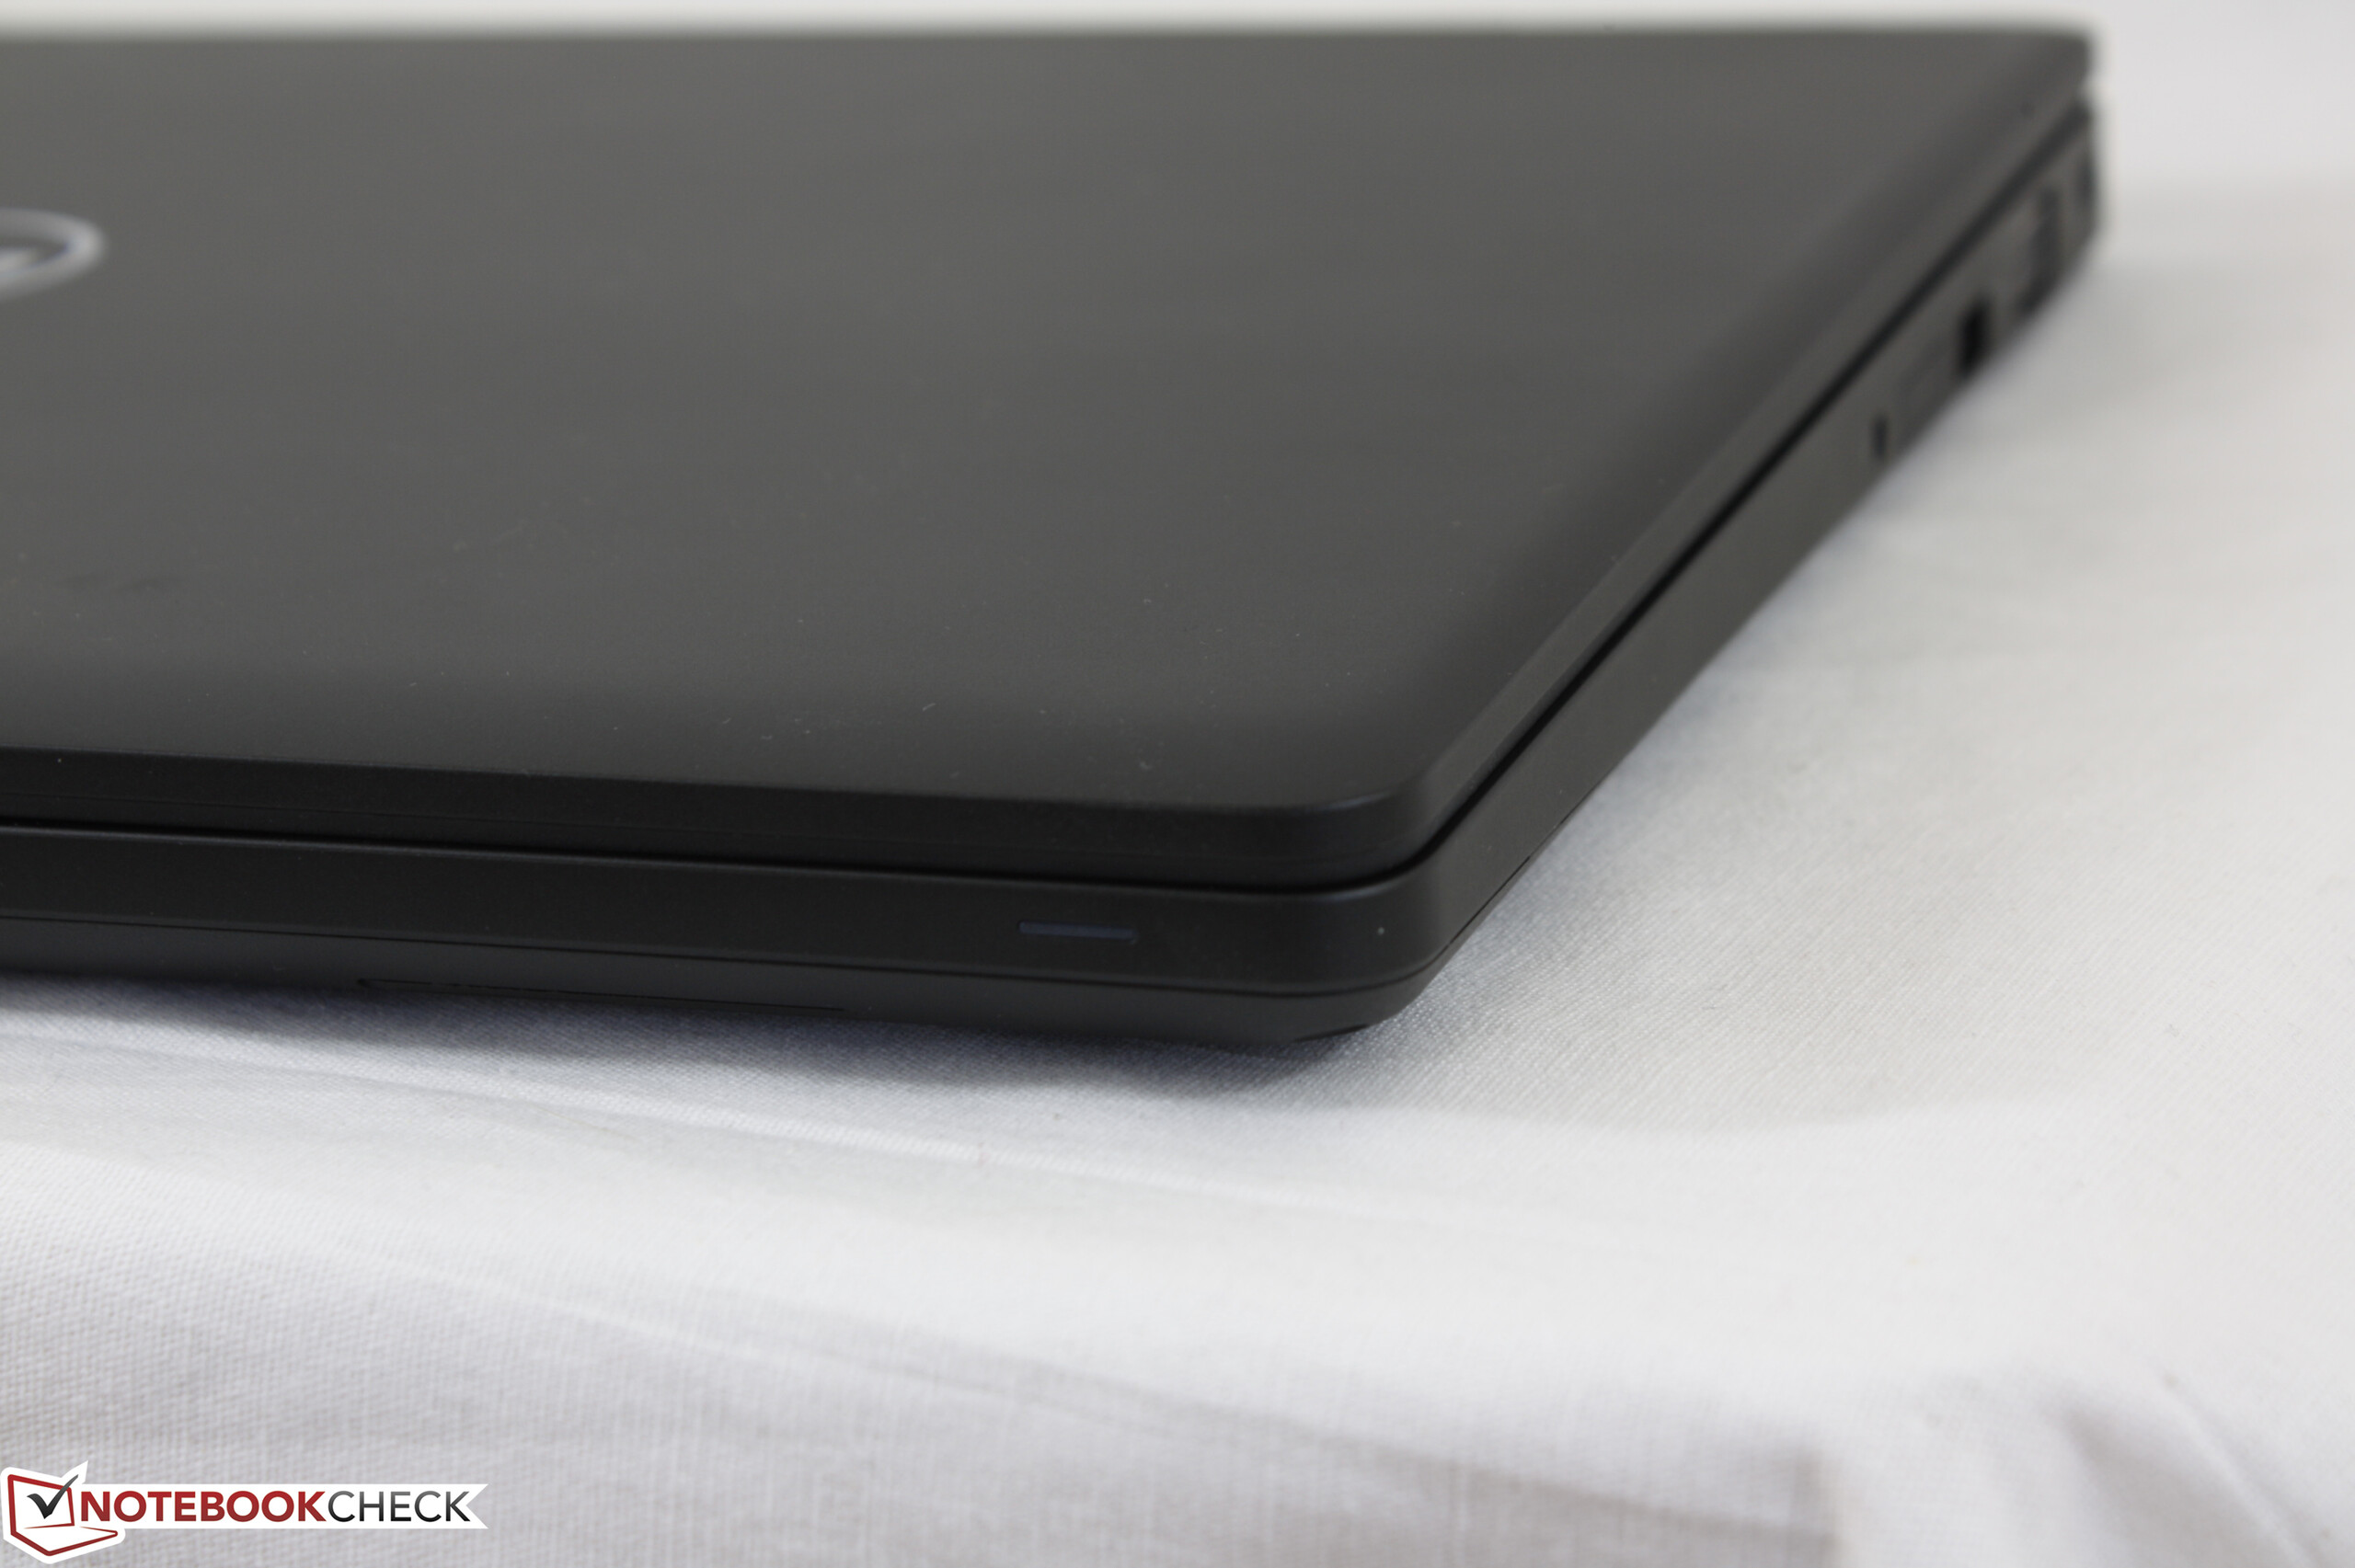
Er is niet specifiek iets speciaals aan de Latitude 5580 dat niet al genoemd is in onze bestaande E5550/E5570-testrapporten. De lange batterijlevensduur, makkelijk onderhoud, erg ruime keuze aan opties, Linux-gecertificeerd en comfortabel toetsenbord vormen allen een aantrekkelijk en erg veelzijdig zakelijk notebook voor de meeste soorten kantoorwerk.
Prijs is het grootste pijnpunt voor de 5580. Terwijl de instapniveau-configuraties zoals de onze beginnen bij $ 700, brengen waardevolle zakelijke eigenschappen zoals Smart Card, Thunderbolt 3, WWAN, NFC en vingerafdrukscanners de prijzen al snel boven de $ 1000. Verder adviseren we om het afschuwelijke HD beeldscherm over te slaan en te investeren in een FHD beeldscherm, maar deze optie alleen al brengt de prijs naar minimaal $ 1100. Configuraties met snellere HQ-klasse processoren beginnen vanaf $ 1000 en hebben dan slechts 4 GB RAM, het voorgenoemde HD beeldscherm en geen SSD. Om het beste uit de Latitude 5580-behuizing te halen zul je bereid moeten zijn om veel meer te investeren.
In de nabije toekomst zullen we waarschijnlijk een high-end versie van de Latitude 5580 testen om een beter inzicht te krijgen in wat deze serie te bieden heeft. Een HQ-klasse CPU heeft een twee keer zo hoog TDP als een U-klasse CPU en het FHD beeldscherm zal vrijwel zeker een betere ervaring geven. Welke invloed deze veeleisender componenten hebben op de batterijlevensduur, systeemgeluid en prestaties verdient nader onderzoek.
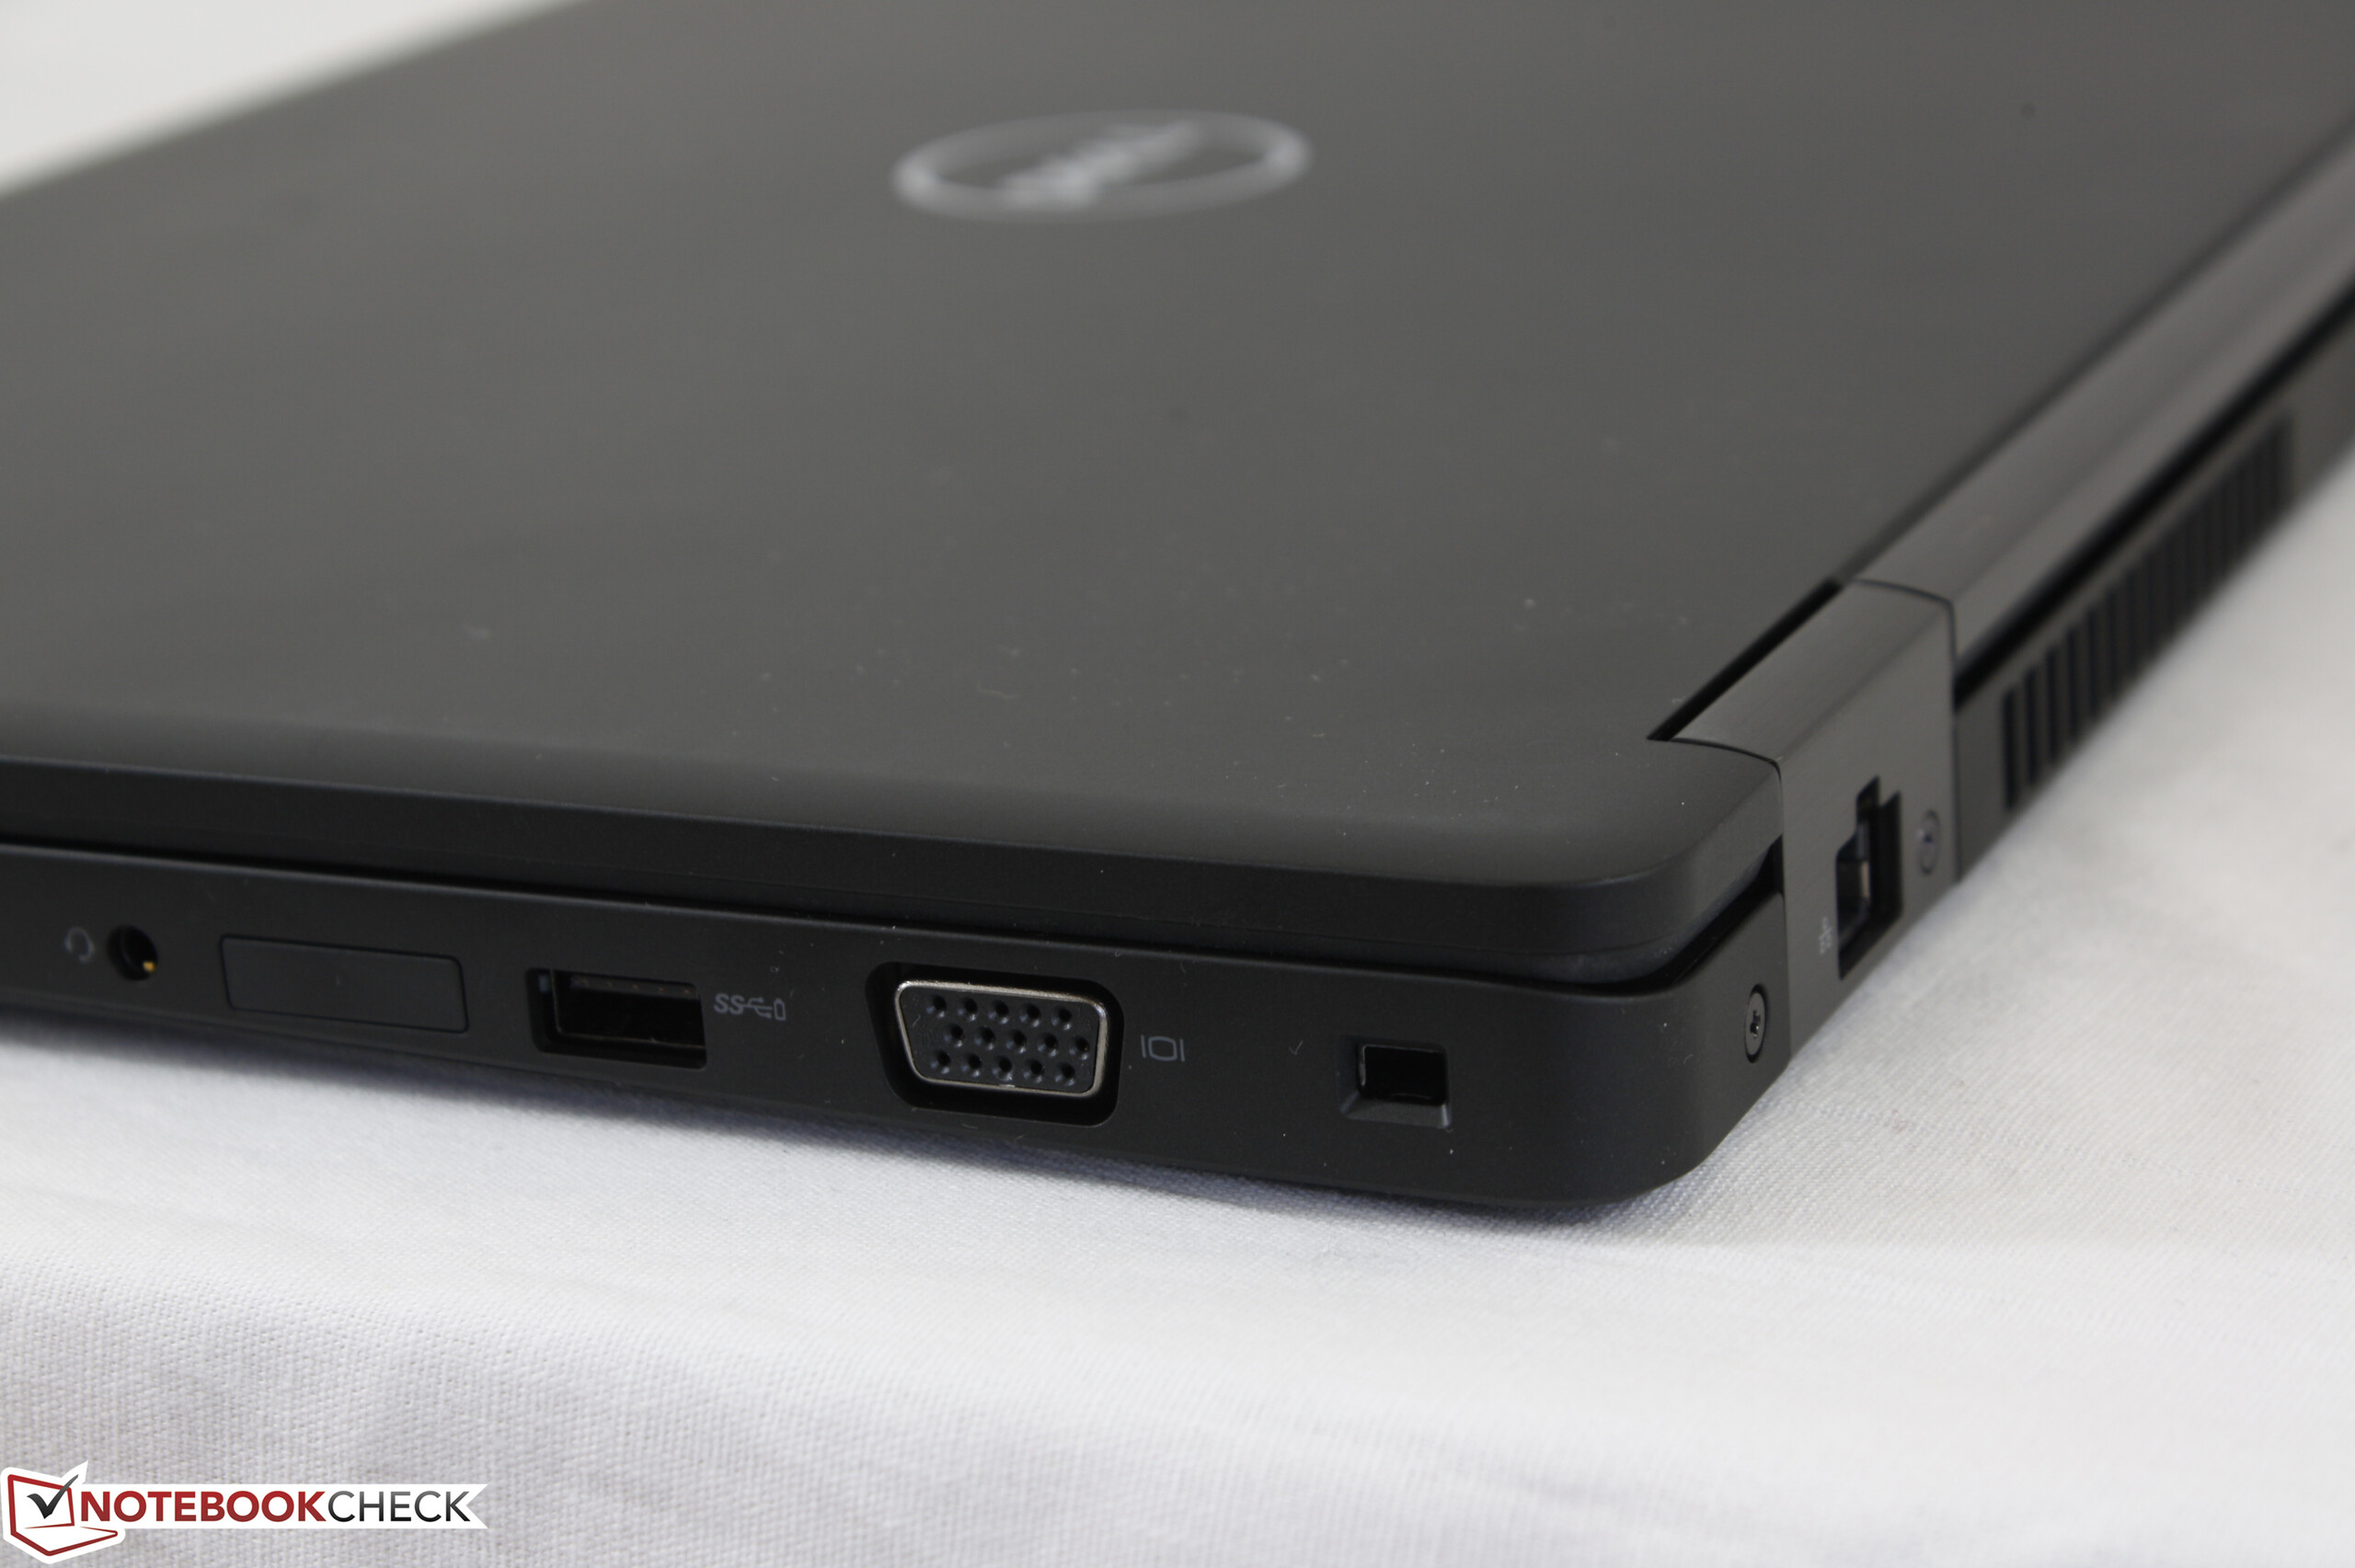
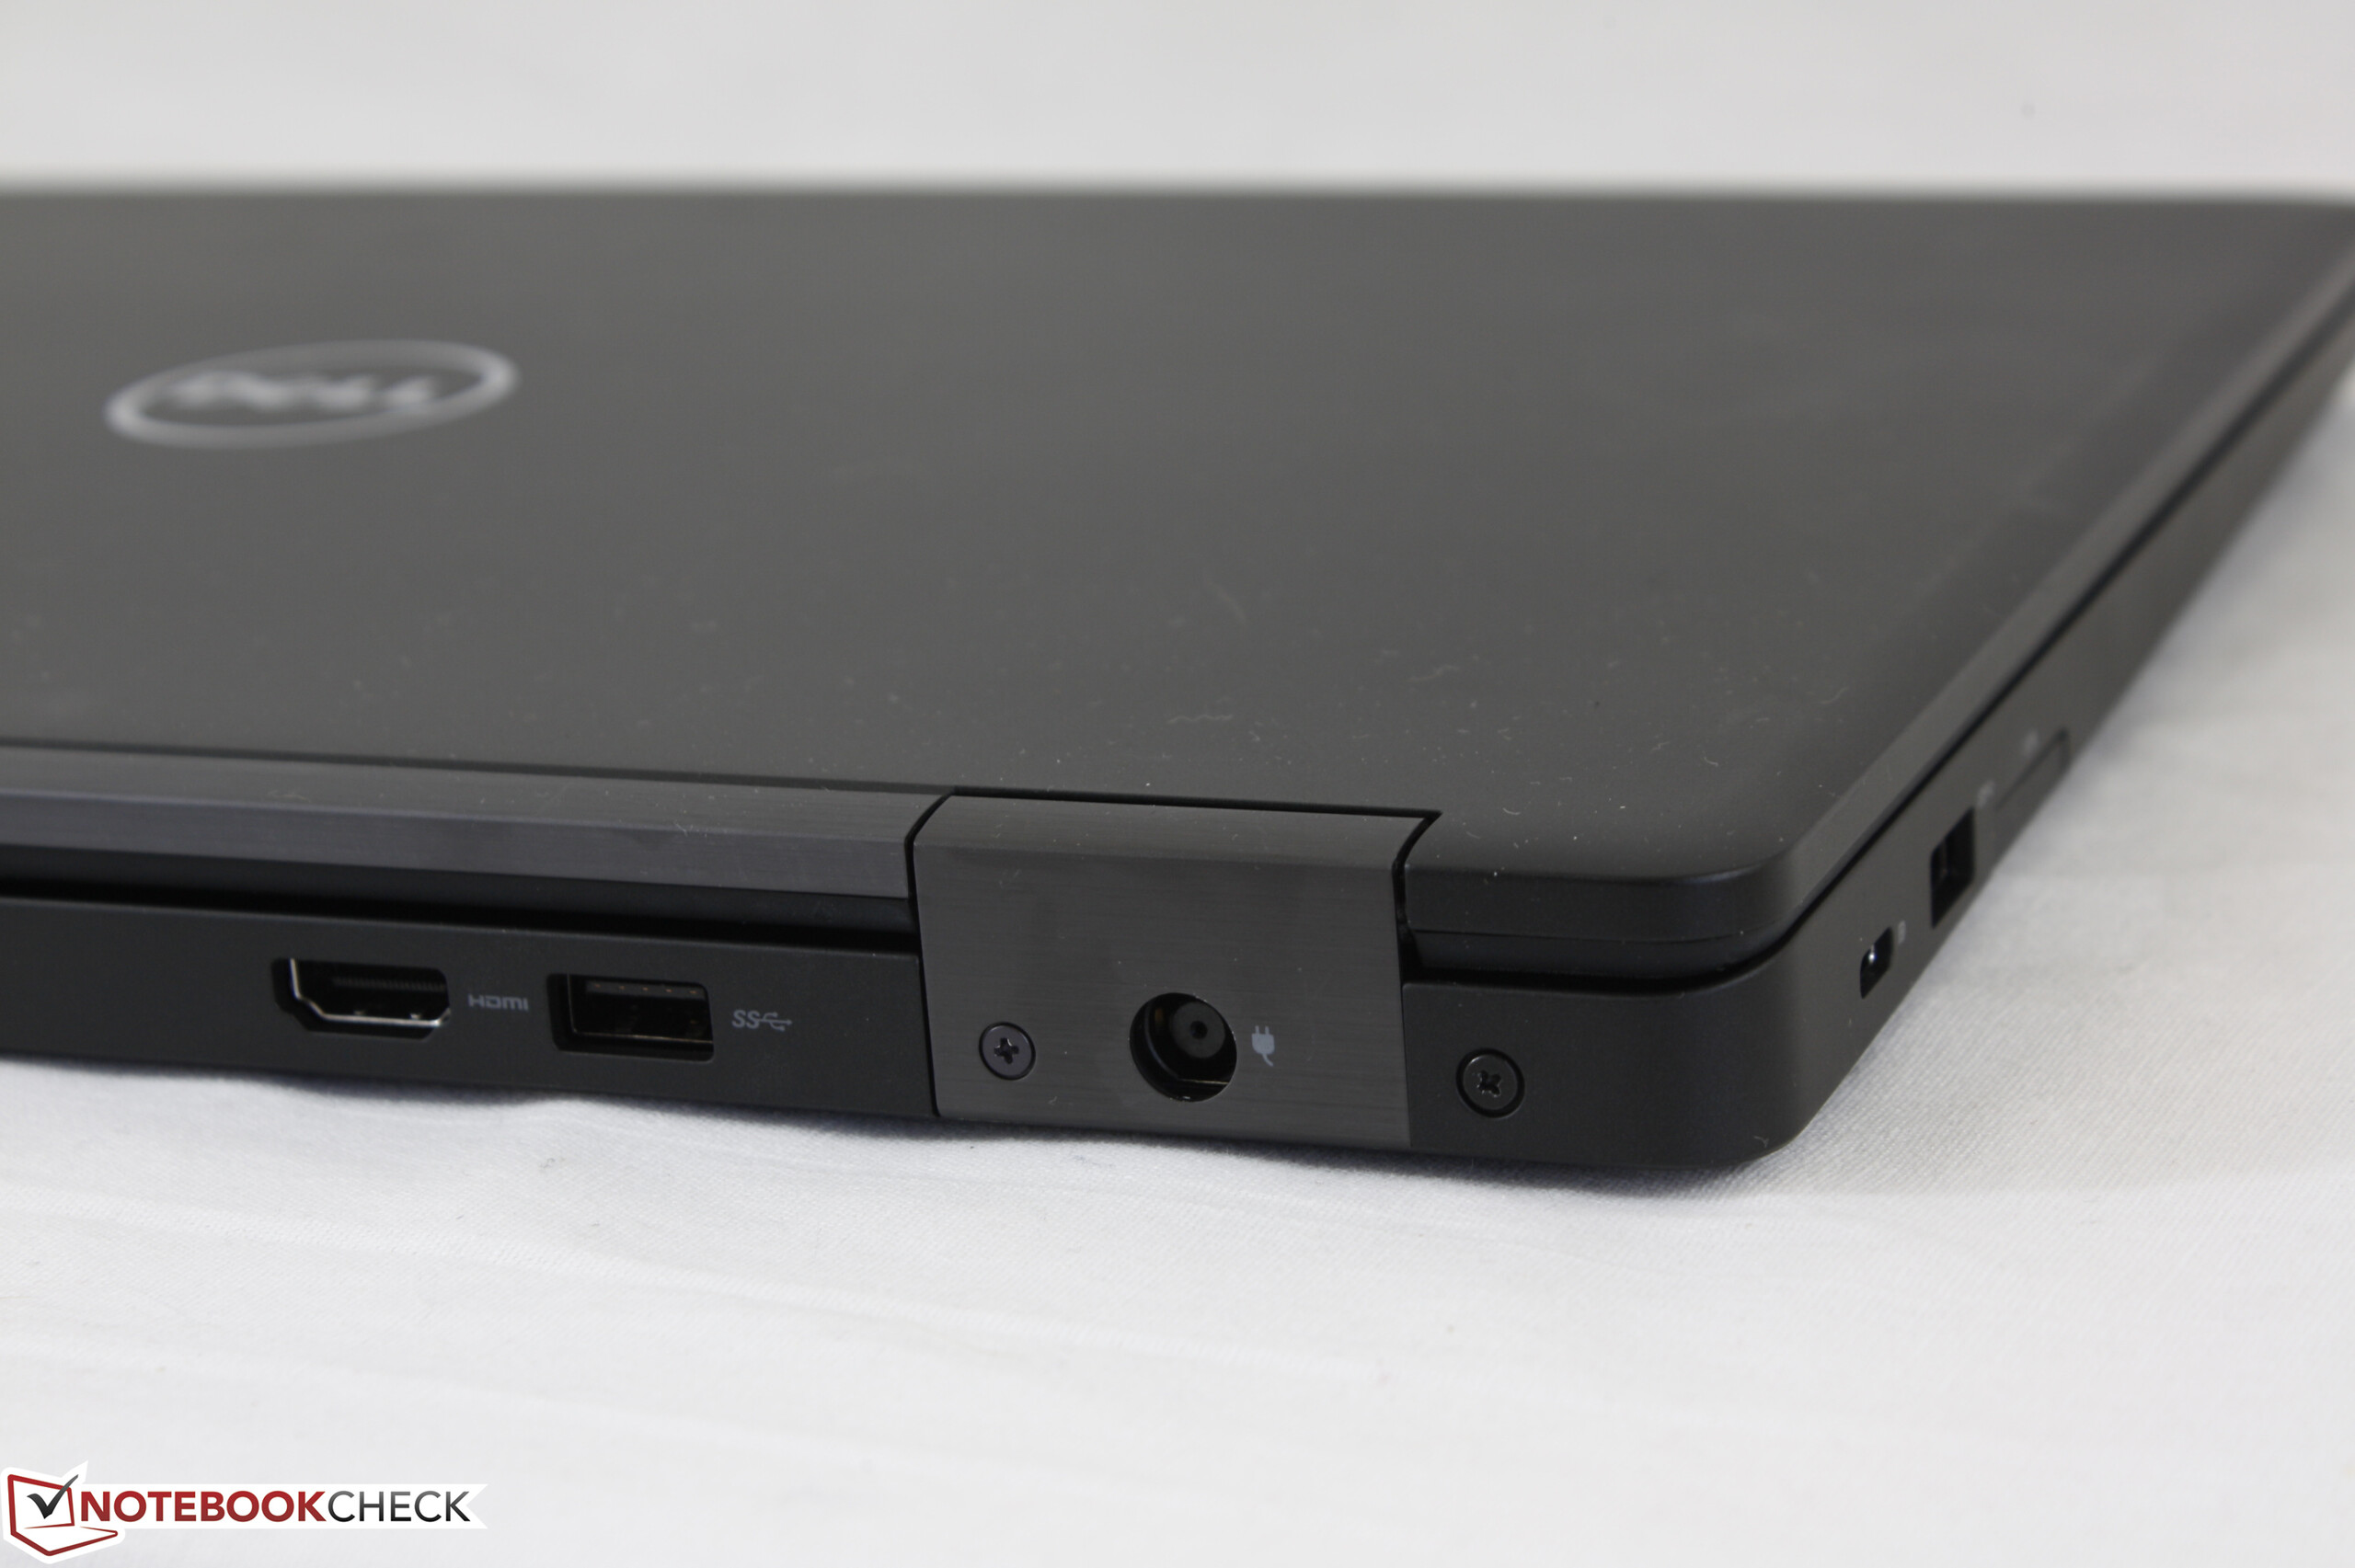
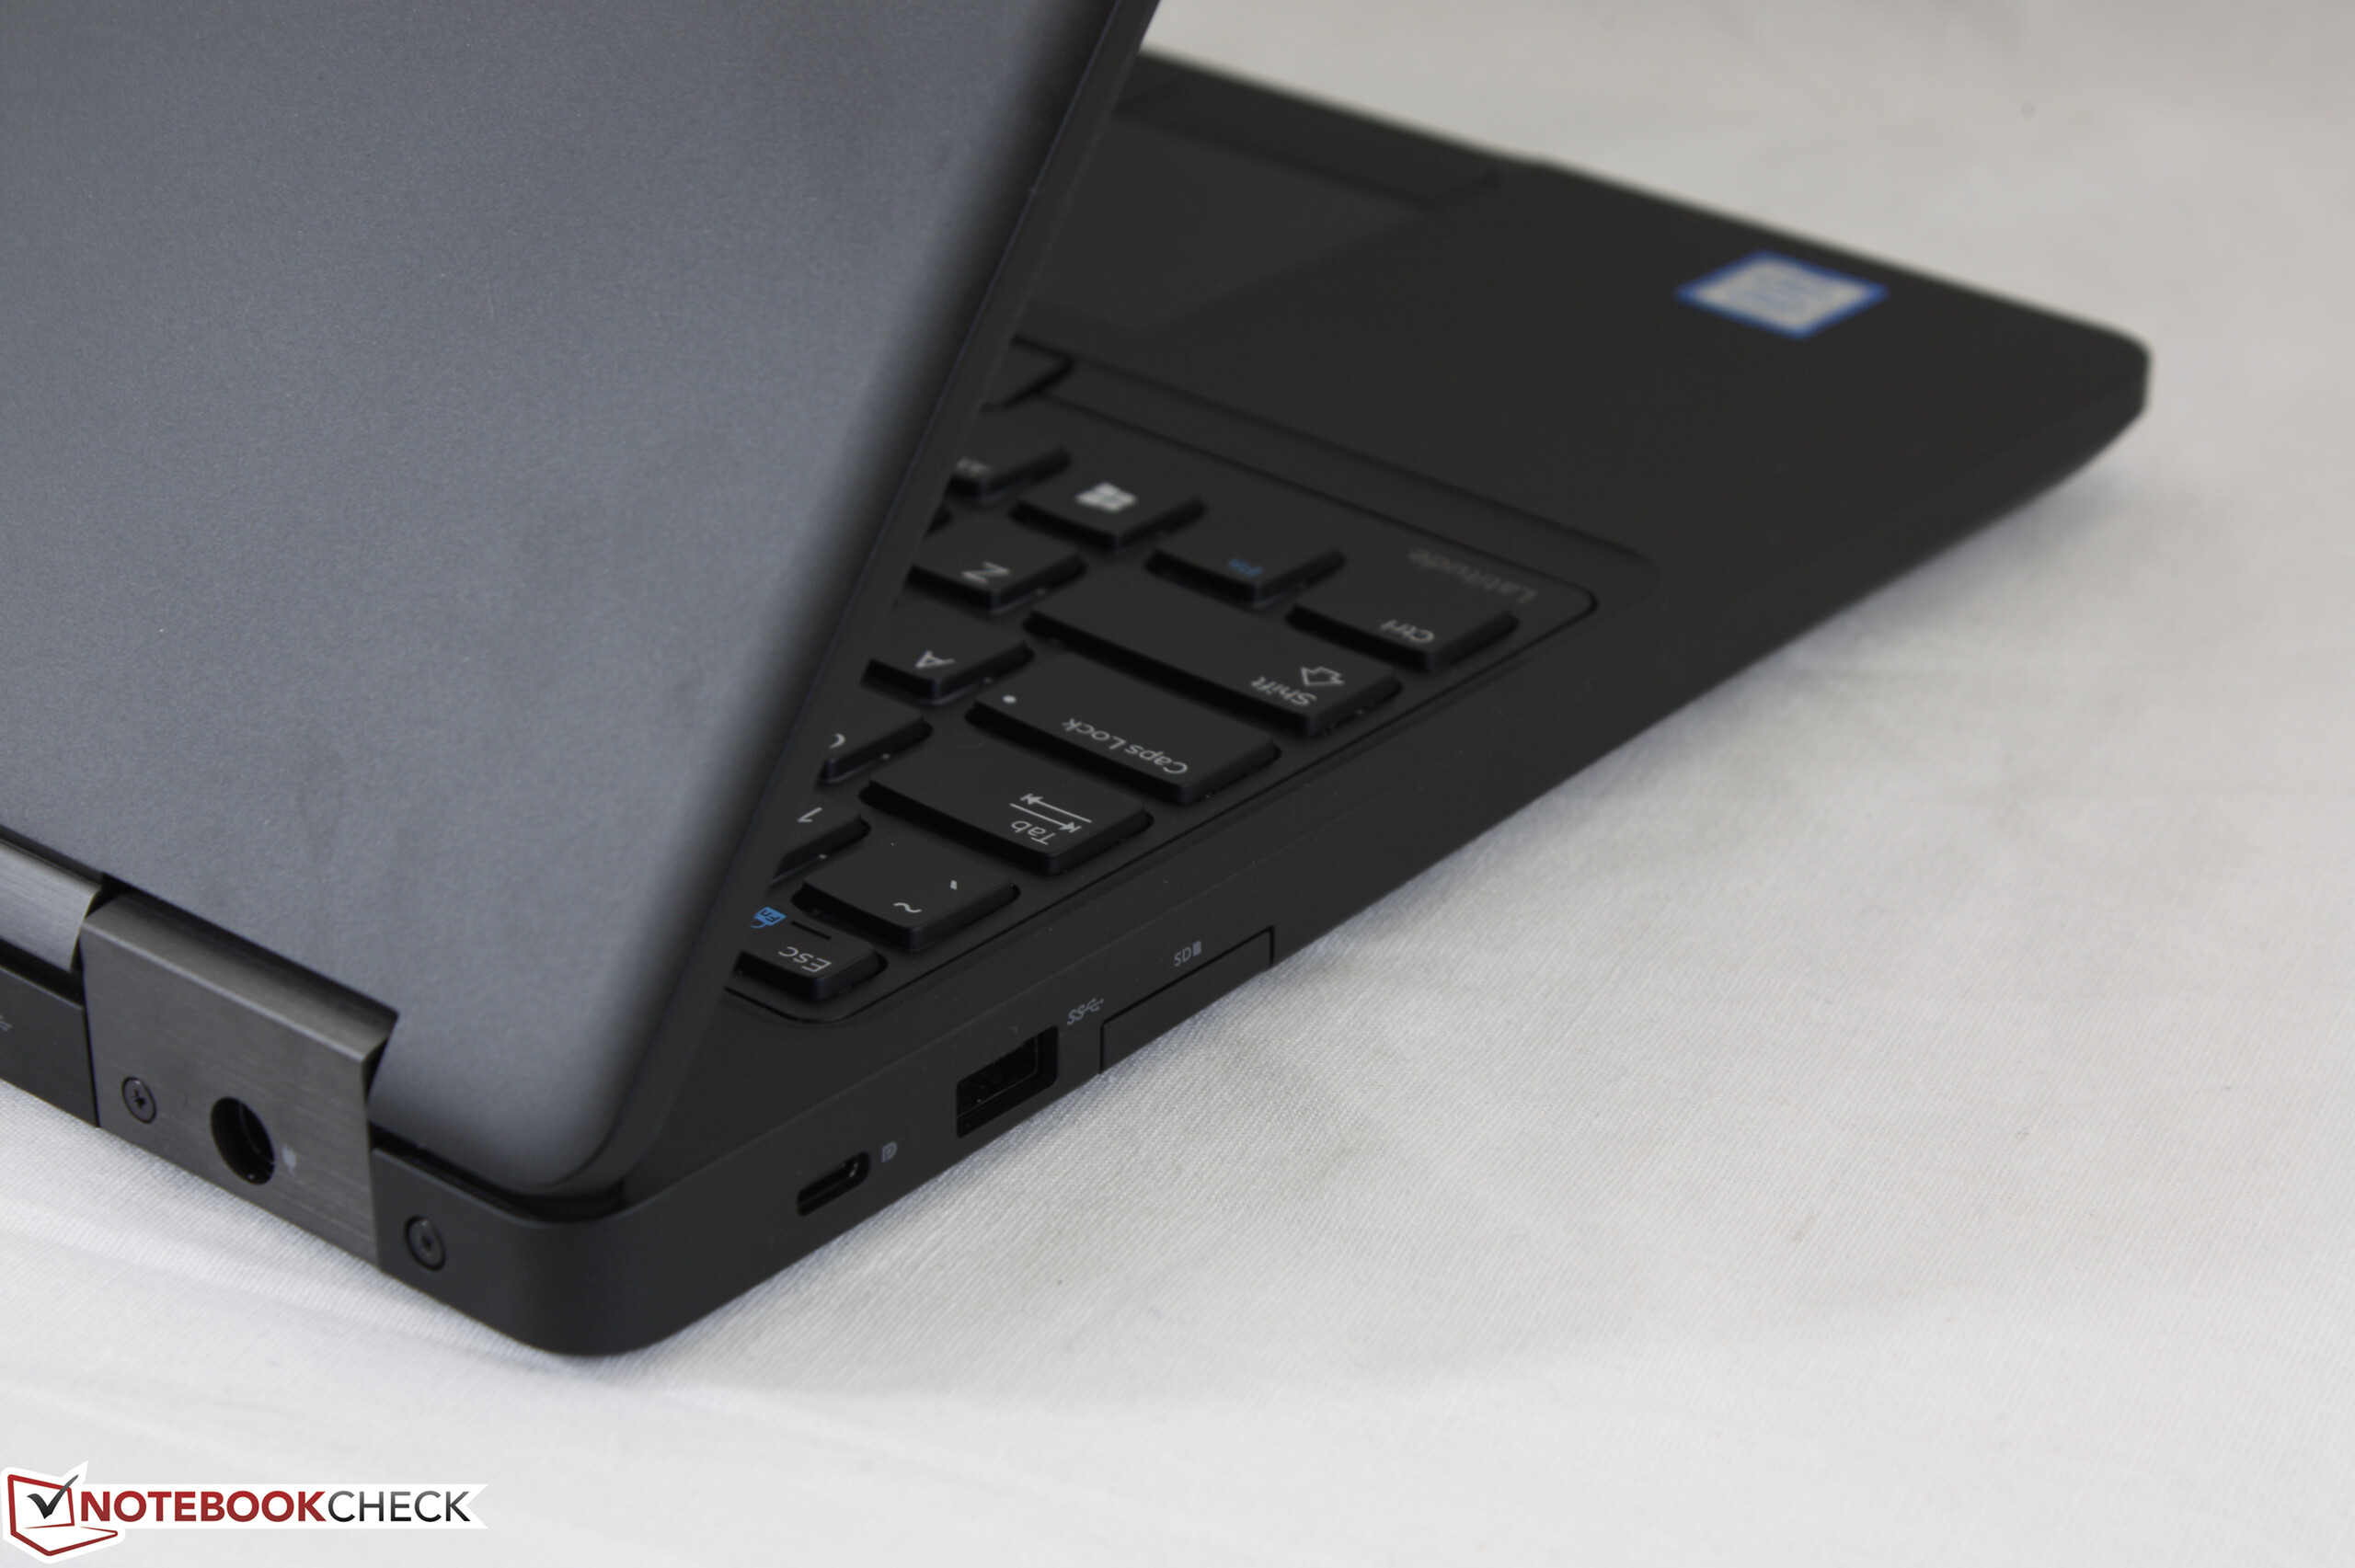
Mijdt de instap-SKU's daar deze geleverd worden met een ondermaats HD beeldscherm en vrijwel geen features. Zowel Thunderbolt 3 als een FHD paneel zijn essentieel voor een betere ervaring en voor het compenseren van de ontbrekende E-poort.
Dell Latitude 5580
- 11-05-2017 v6 (old)
Allen Ngo
Price comparison
