Framework Laptop 13.5 Review: Als Microsoft een repareerbare Surface Laptop zou maken, zou dit hem zijn
Laptops zullen nooit zo upgradebaar of repareerbaar worden als desktops, maar dat betekent niet dat ze het niet zouden moeten proberen. Een klein team van ontwikkelaars bij Framework heeft hun eigen ultradunne laptop ontworpen om zo goed mogelijk door de eindgebruiker te kunnen worden onderhouden. Meer details over hun project en doelstellingen zijn te vinden op hun website hier
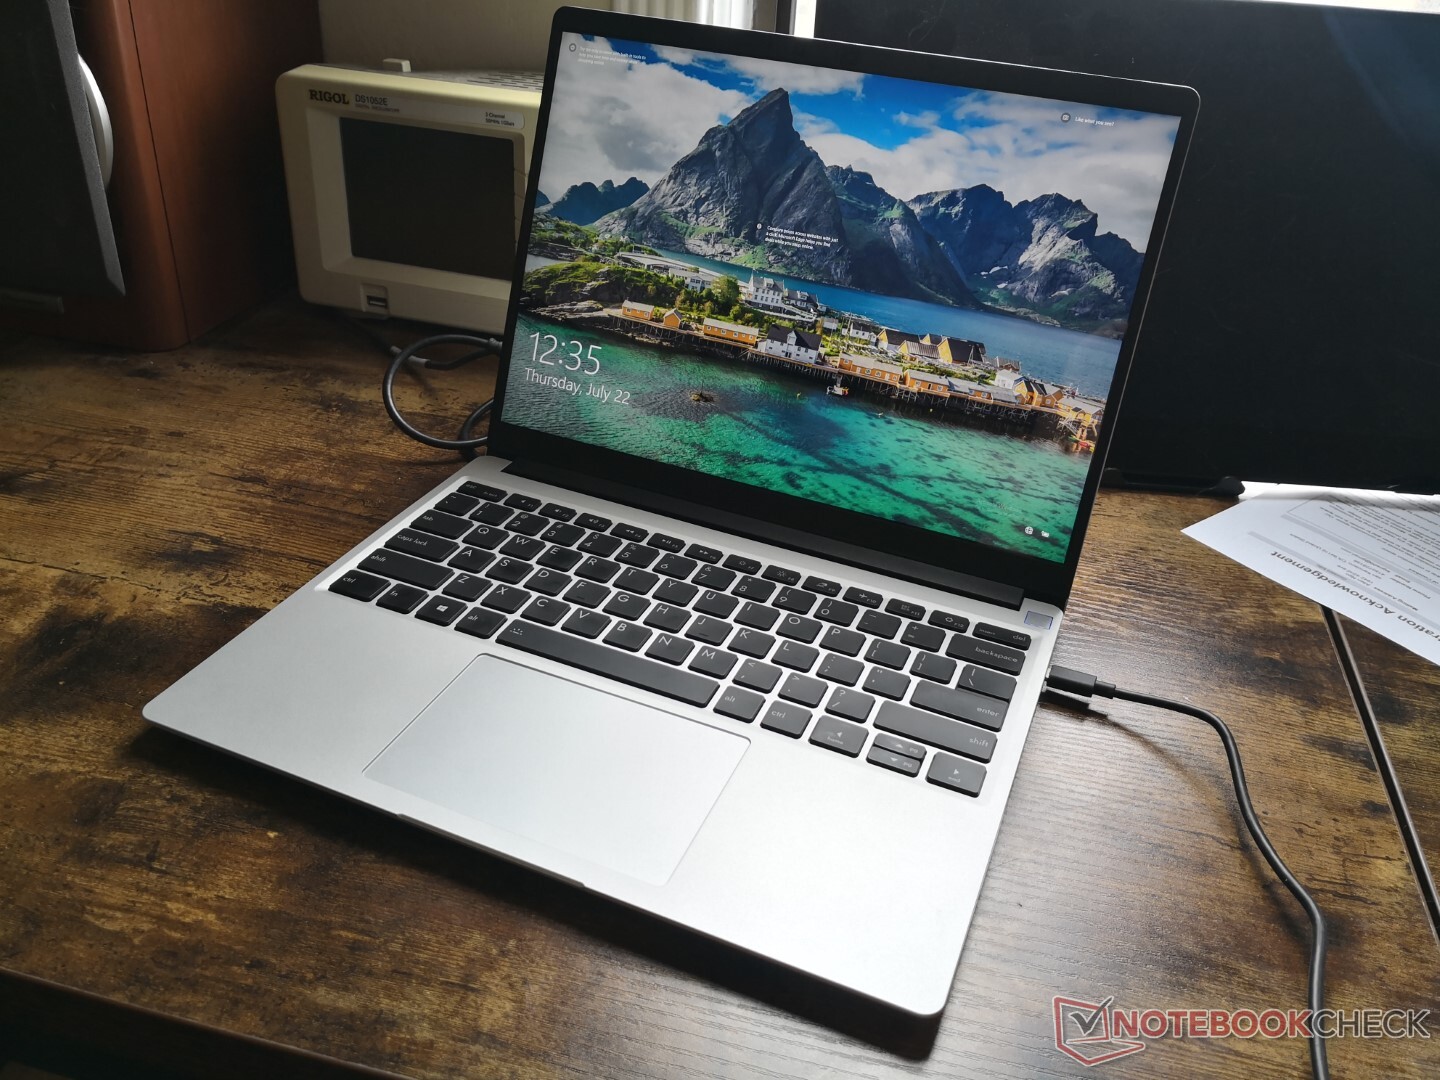
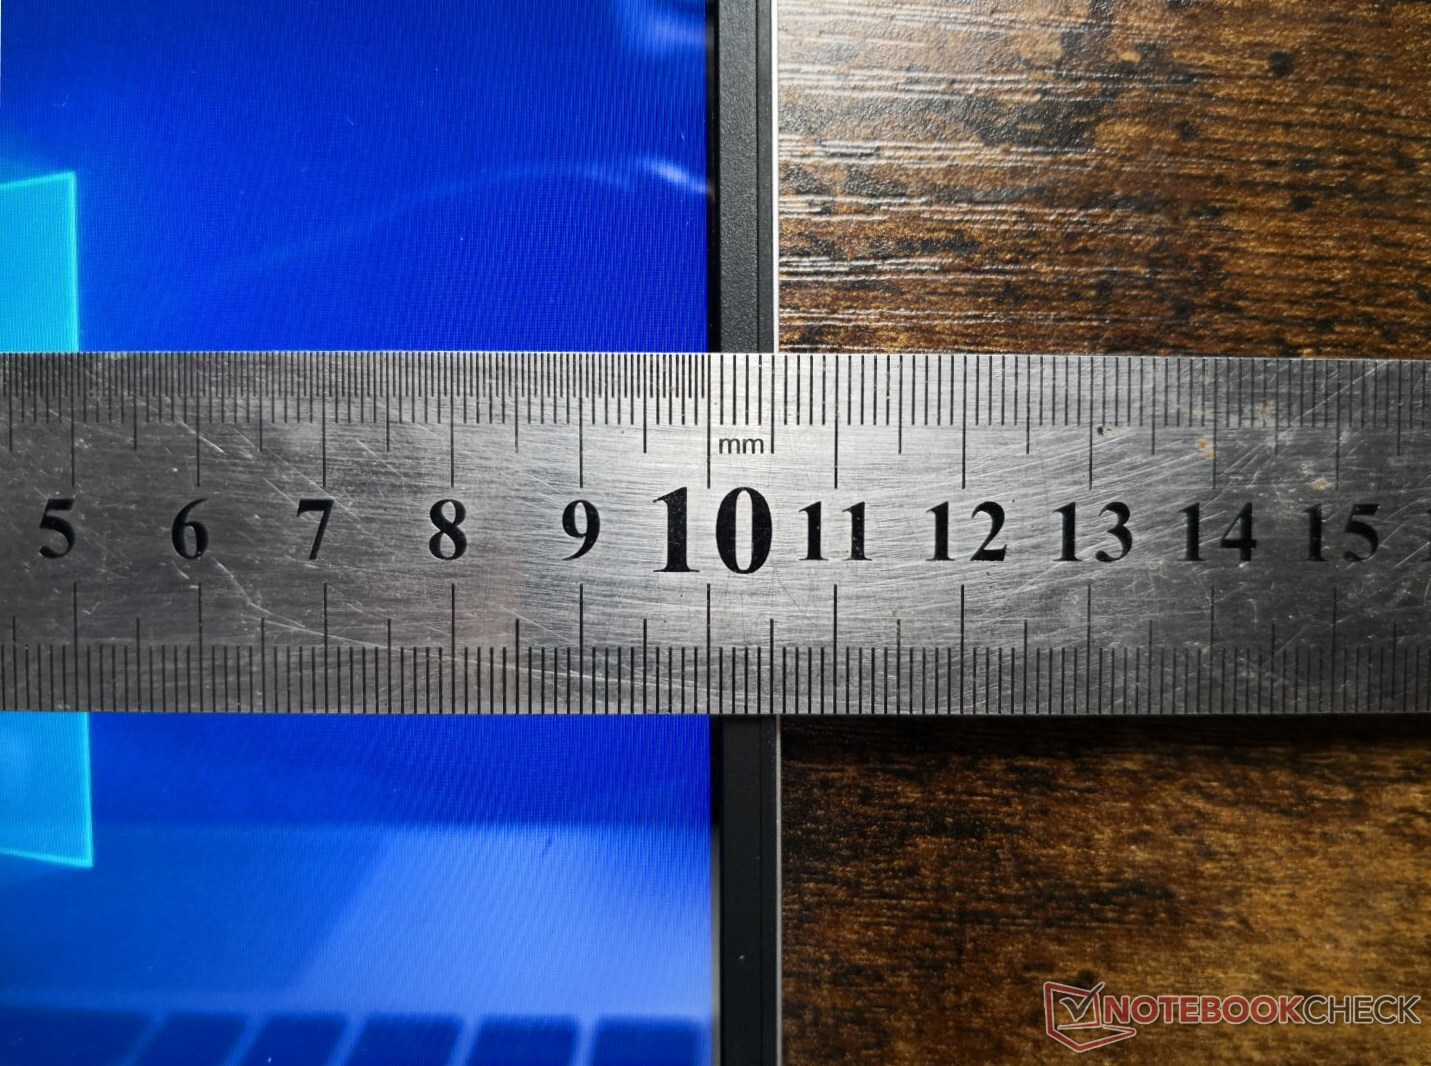
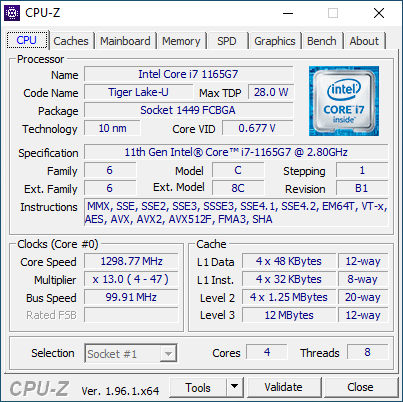
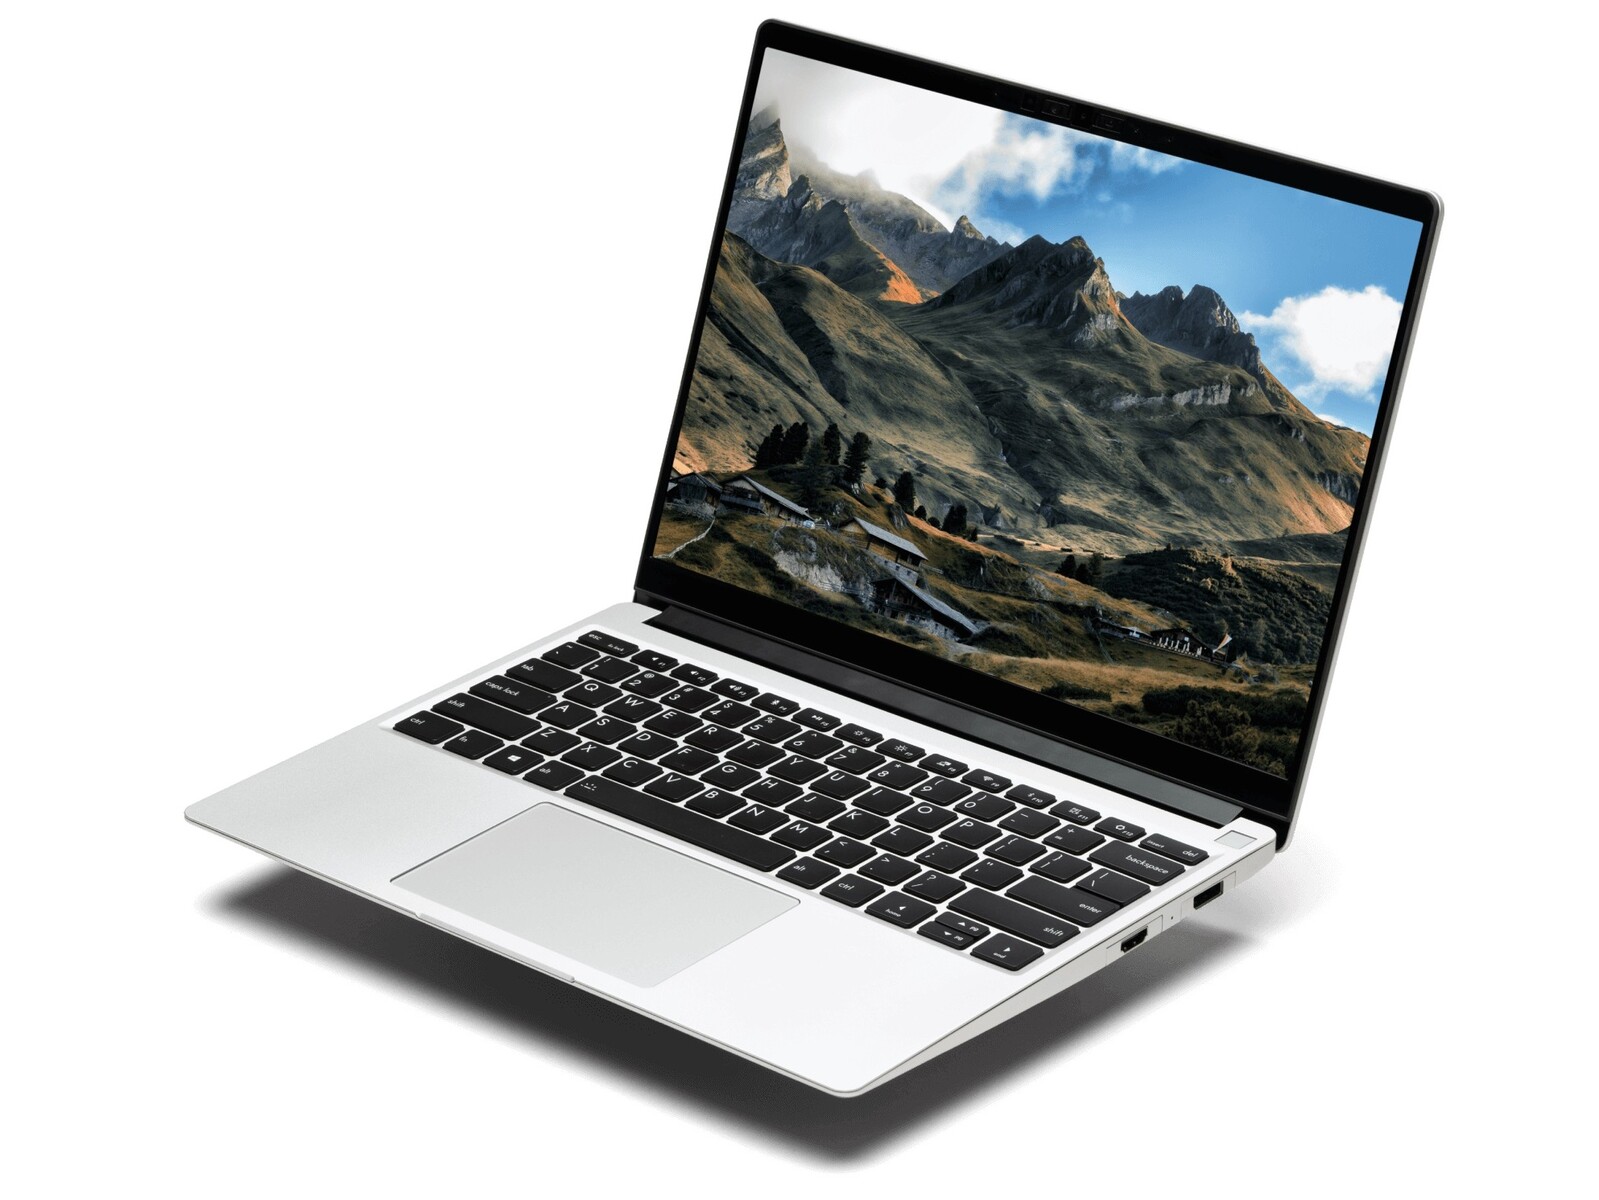
De 13,5-inch Framework Laptop is een 3:2 vormfactor systeem in dezelfde trant als de HP Spectre x360 14 of Microsoft Surface Laptop 3. Het loopt op dezelfde 11e generatie Intel Tiger Lake-U platform dat de meeste van de nieuwste Ultrabooks van meer gevestigde OEM's aandrijft. Tiger Lake is ook de sleutel tot veel van de aanpasbare functies van de Framework Laptop. In deze review worden de prestaties van de Core i7 Framework configuratie onderzocht om te zien hoe deze zich verhoudt tot de grote jongens van HP, Lenovo, Microsoft, en anderen.
potential competitors in comparison
Evaluatie | Datum | Model | Gewicht | Hoogte | Formaat | Resolutie | Beste prijs |
|---|---|---|---|---|---|---|---|
| 85.4 % v7 (old) | 07-2021 | Framework Laptop 13.5 i7-1165G7, Iris Xe G7 96EUs | 1.3 kg | 15.85 mm | 13.50" | 2256x1504 | |
| 89.5 % v7 (old) | 05-2021 | HP Spectre x360 14-ea0378ng i7-1165G7, Iris Xe G7 96EUs | 1.3 kg | 16.9 mm | 13.50" | 3000x2000 | |
| 84.7 % v7 (old) | 05-2021 | Microsoft Surface Laptop 4 13 i7 i7-1185G7, Iris Xe G7 96EUs | 1.3 kg | 14.5 mm | 13.50" | 2256x1504 | |
| 87.3 % v7 (old) | 04-2021 | Lenovo ThinkPad X1 Titanium Yoga G1 20QA001RGE i7-1160G7, Iris Xe G7 96EUs | 1.2 kg | 11.5 mm | 13.50" | 2256x1504 | |
| 85.7 % v7 (old) | 08-2021 | HP ProBook x360 435 G8 R7-5800U R7 5800U, Vega 8 | 1.5 kg | 18 mm | 13.30" | 1920x1080 | |
| 84.7 % v7 (old) | 07-2021 | Lenovo Yoga 6 13 82ND0009US R5 5500U, Vega 7 | 1.3 kg | 18.2 mm | 13.30" | 1920x1080 |
Zaak
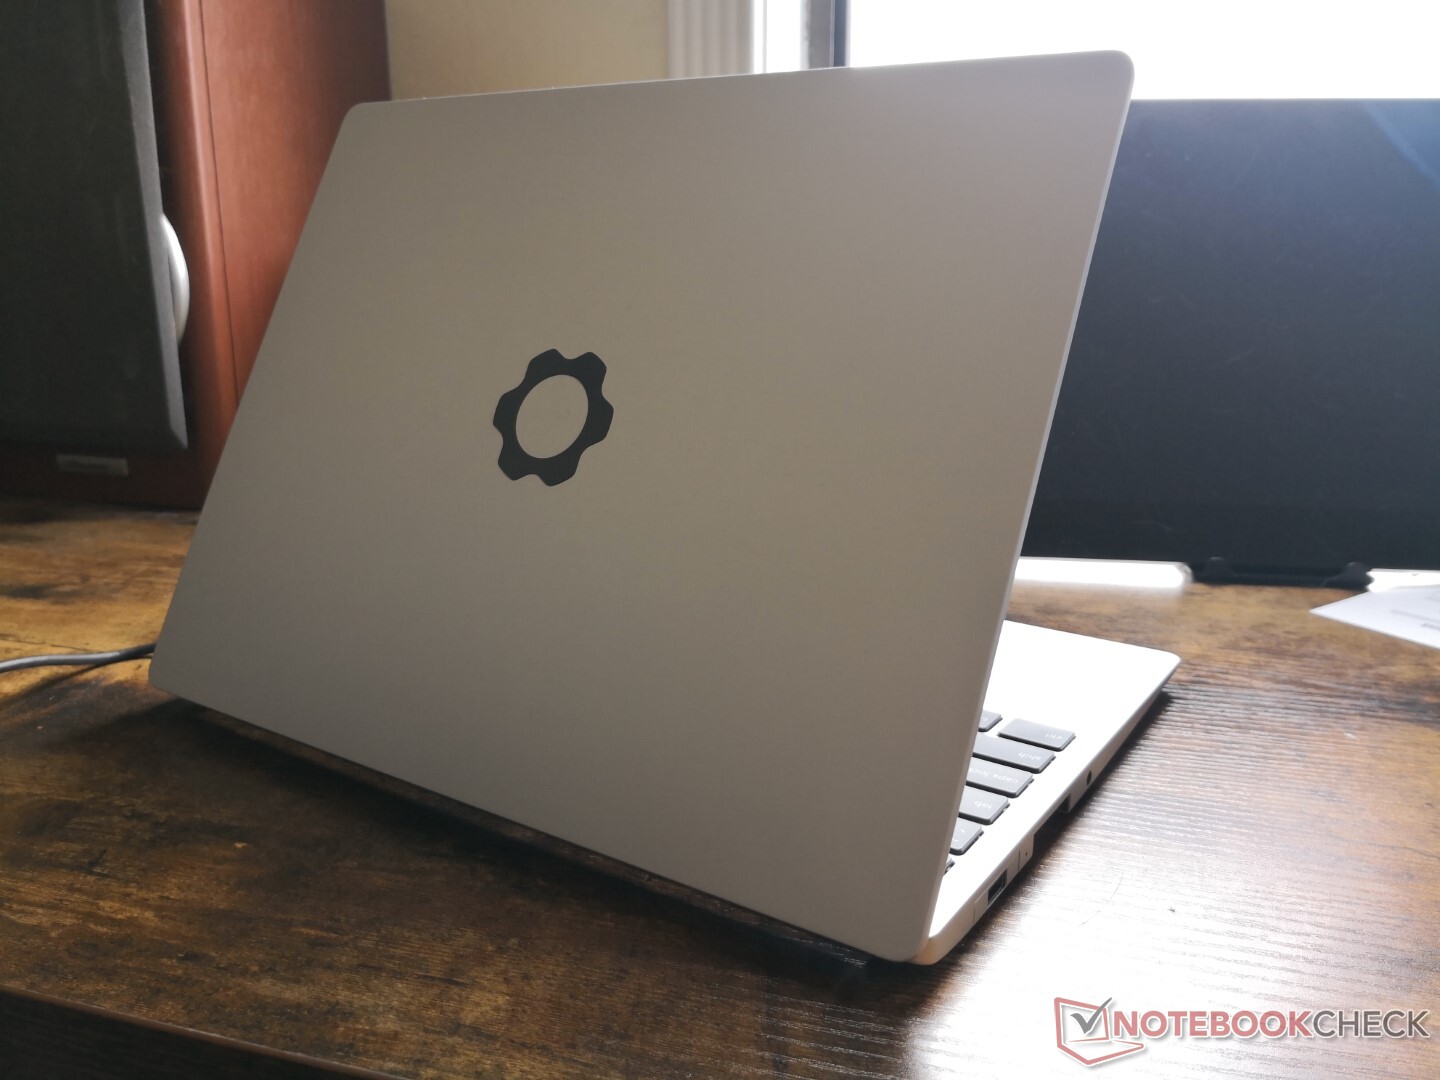
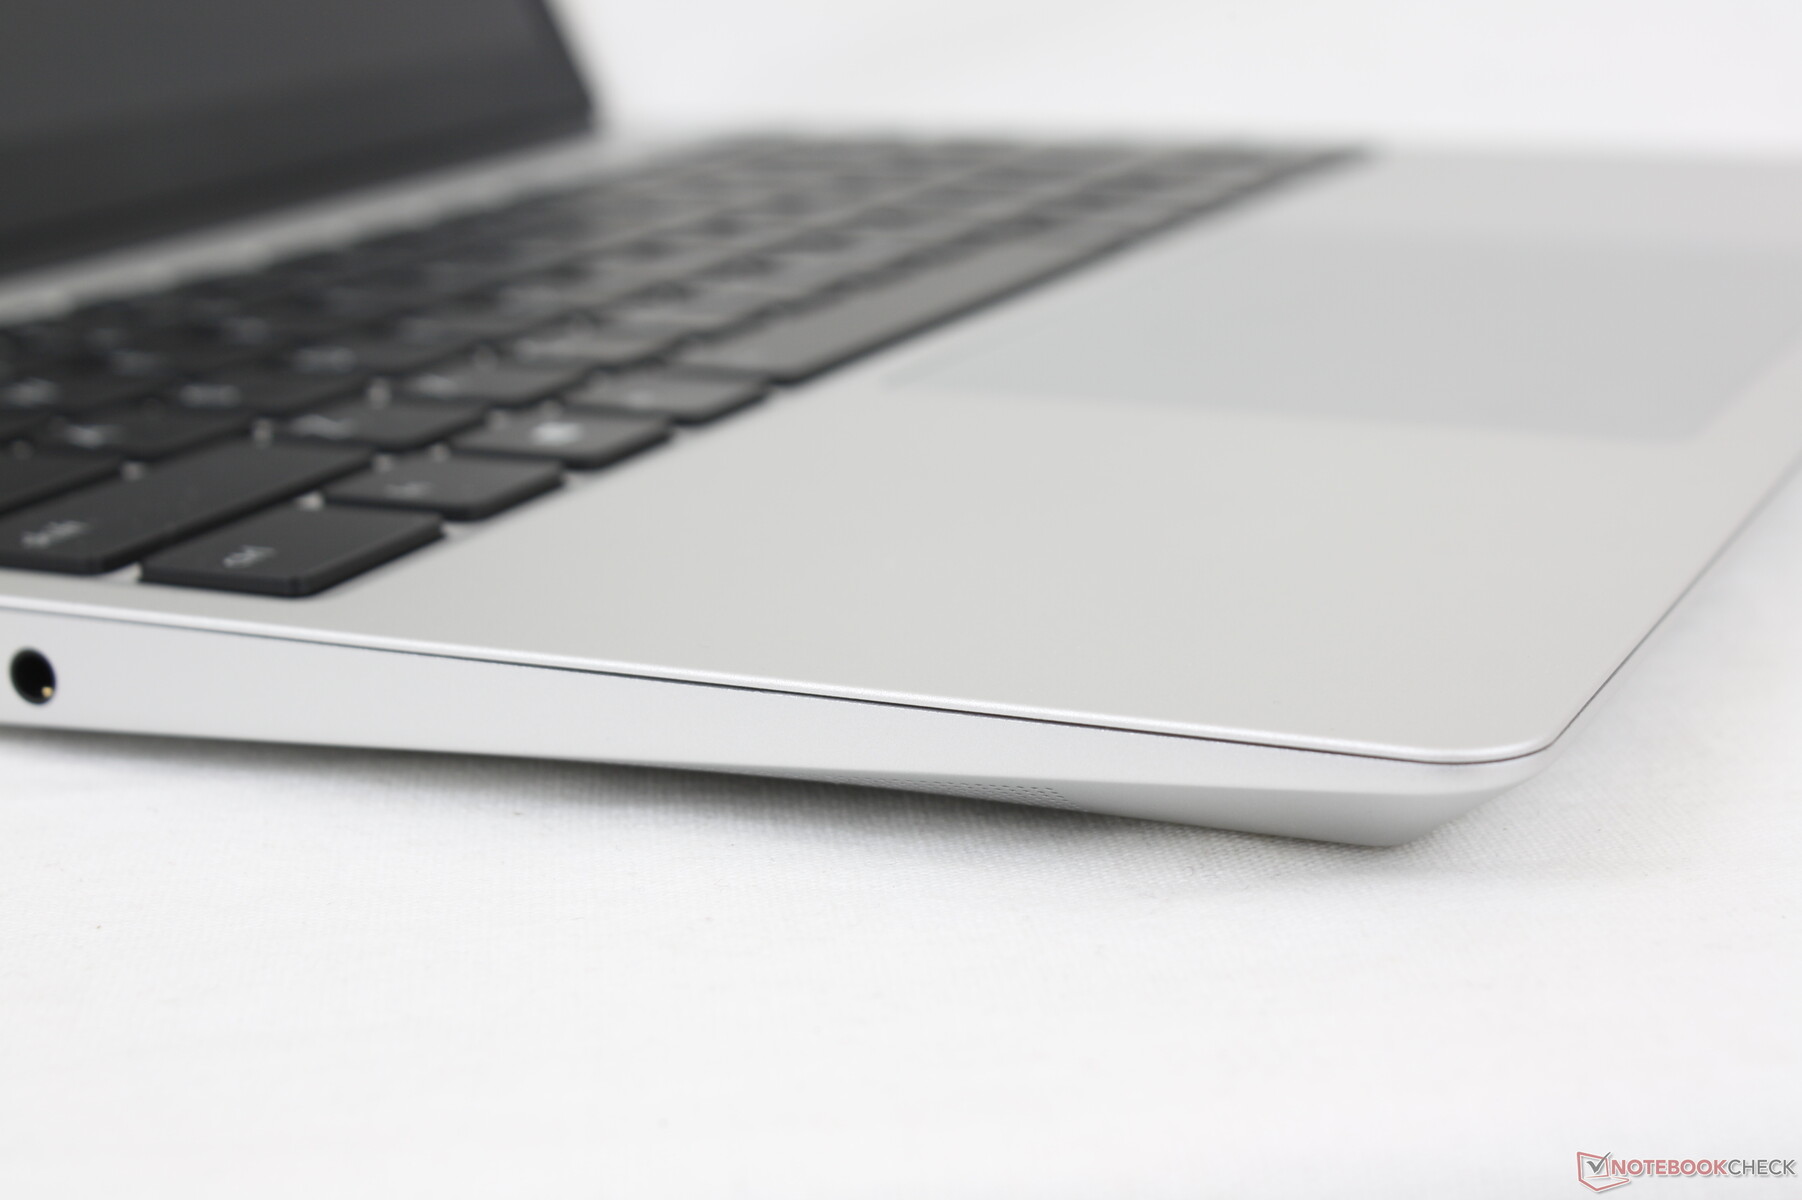
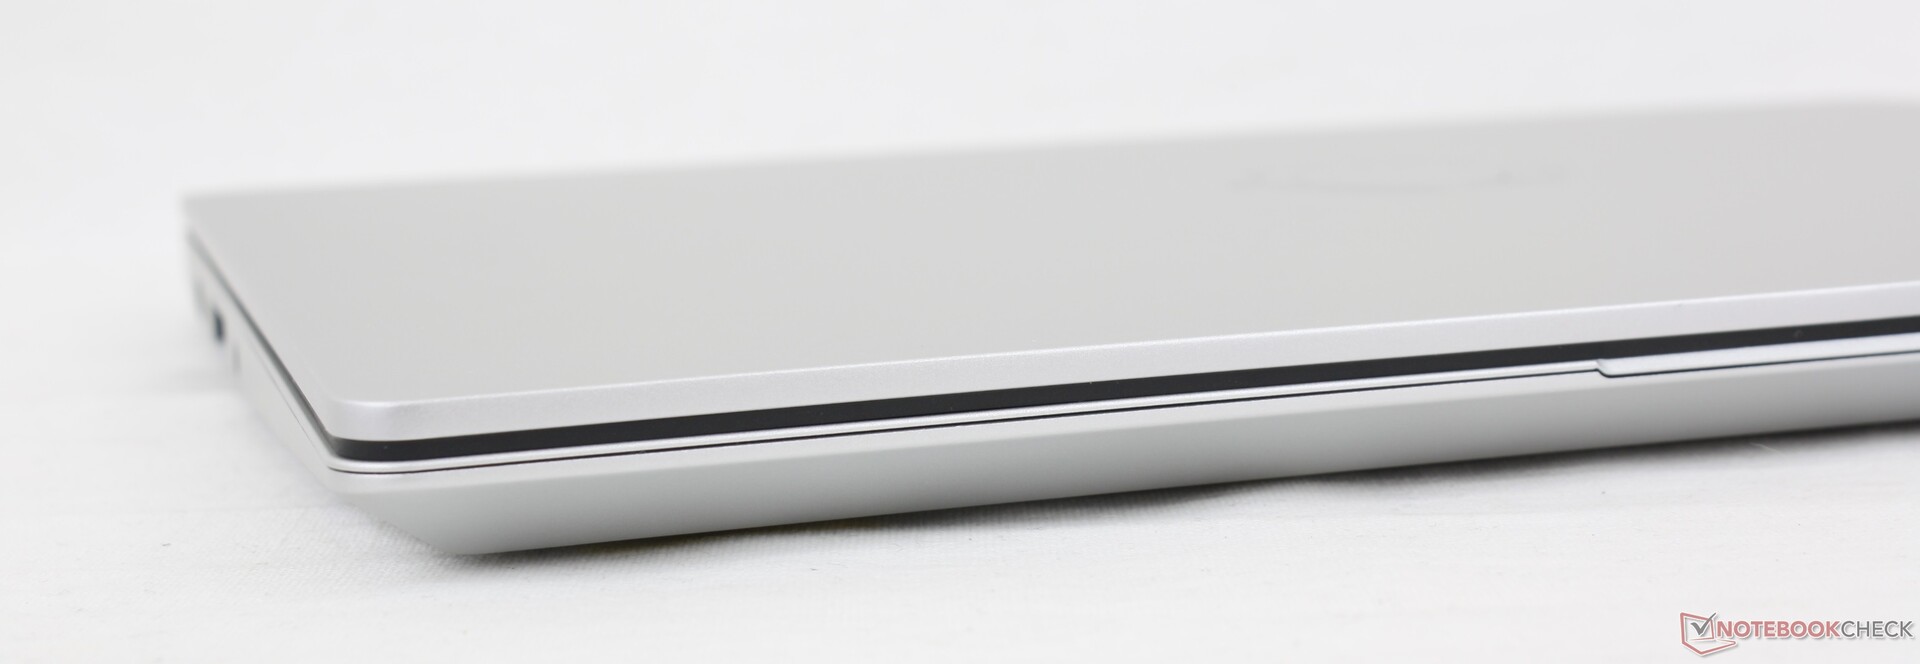
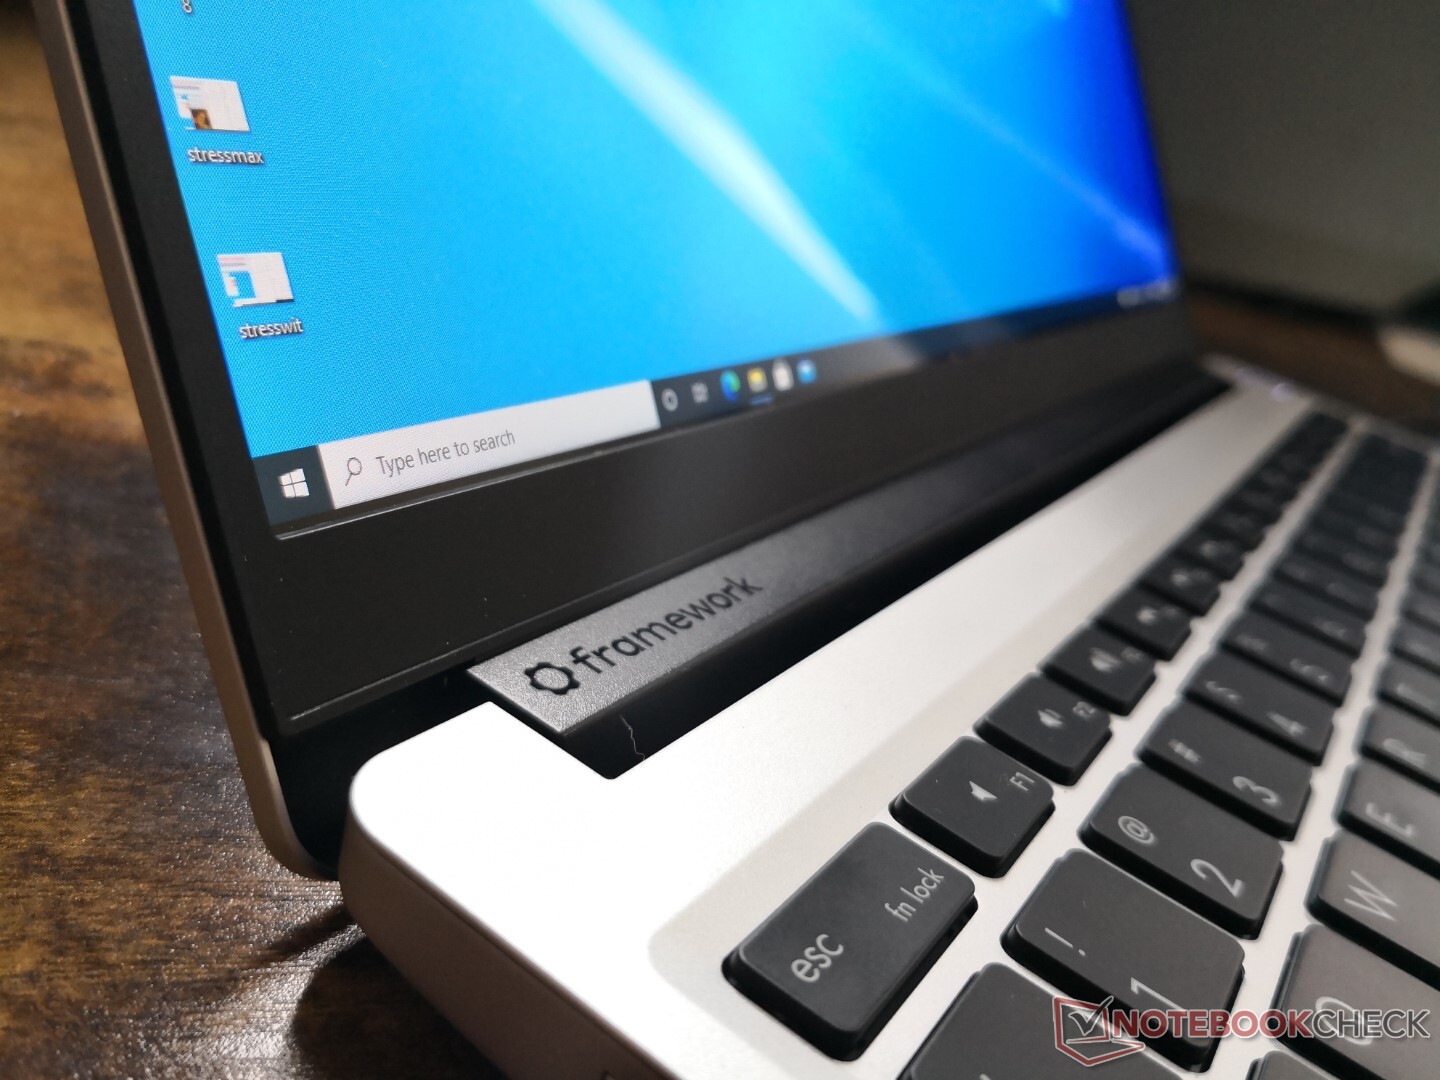
Het is duidelijk dat de makers van de Framework Laptop inspiratie hebben gehaald uit de Apple MacBook als het gaat om het ontwerp van het chassis. De stevigheid van het chassis is echter lang niet zo goed als bij het Framework systeem. Het beeldscherm buigt erg gemakkelijk door en de scharnieren hadden strakker gemogen om het wankelen te verminderen. De afmetingen en het gewicht van het chassis zijn verder vergelijkbaar met de 13,5-inch ThinkPad X1 Titanium Yoga G1 of iets kleiner dan deAcer Swift 3 SF313.
Connectiviteit
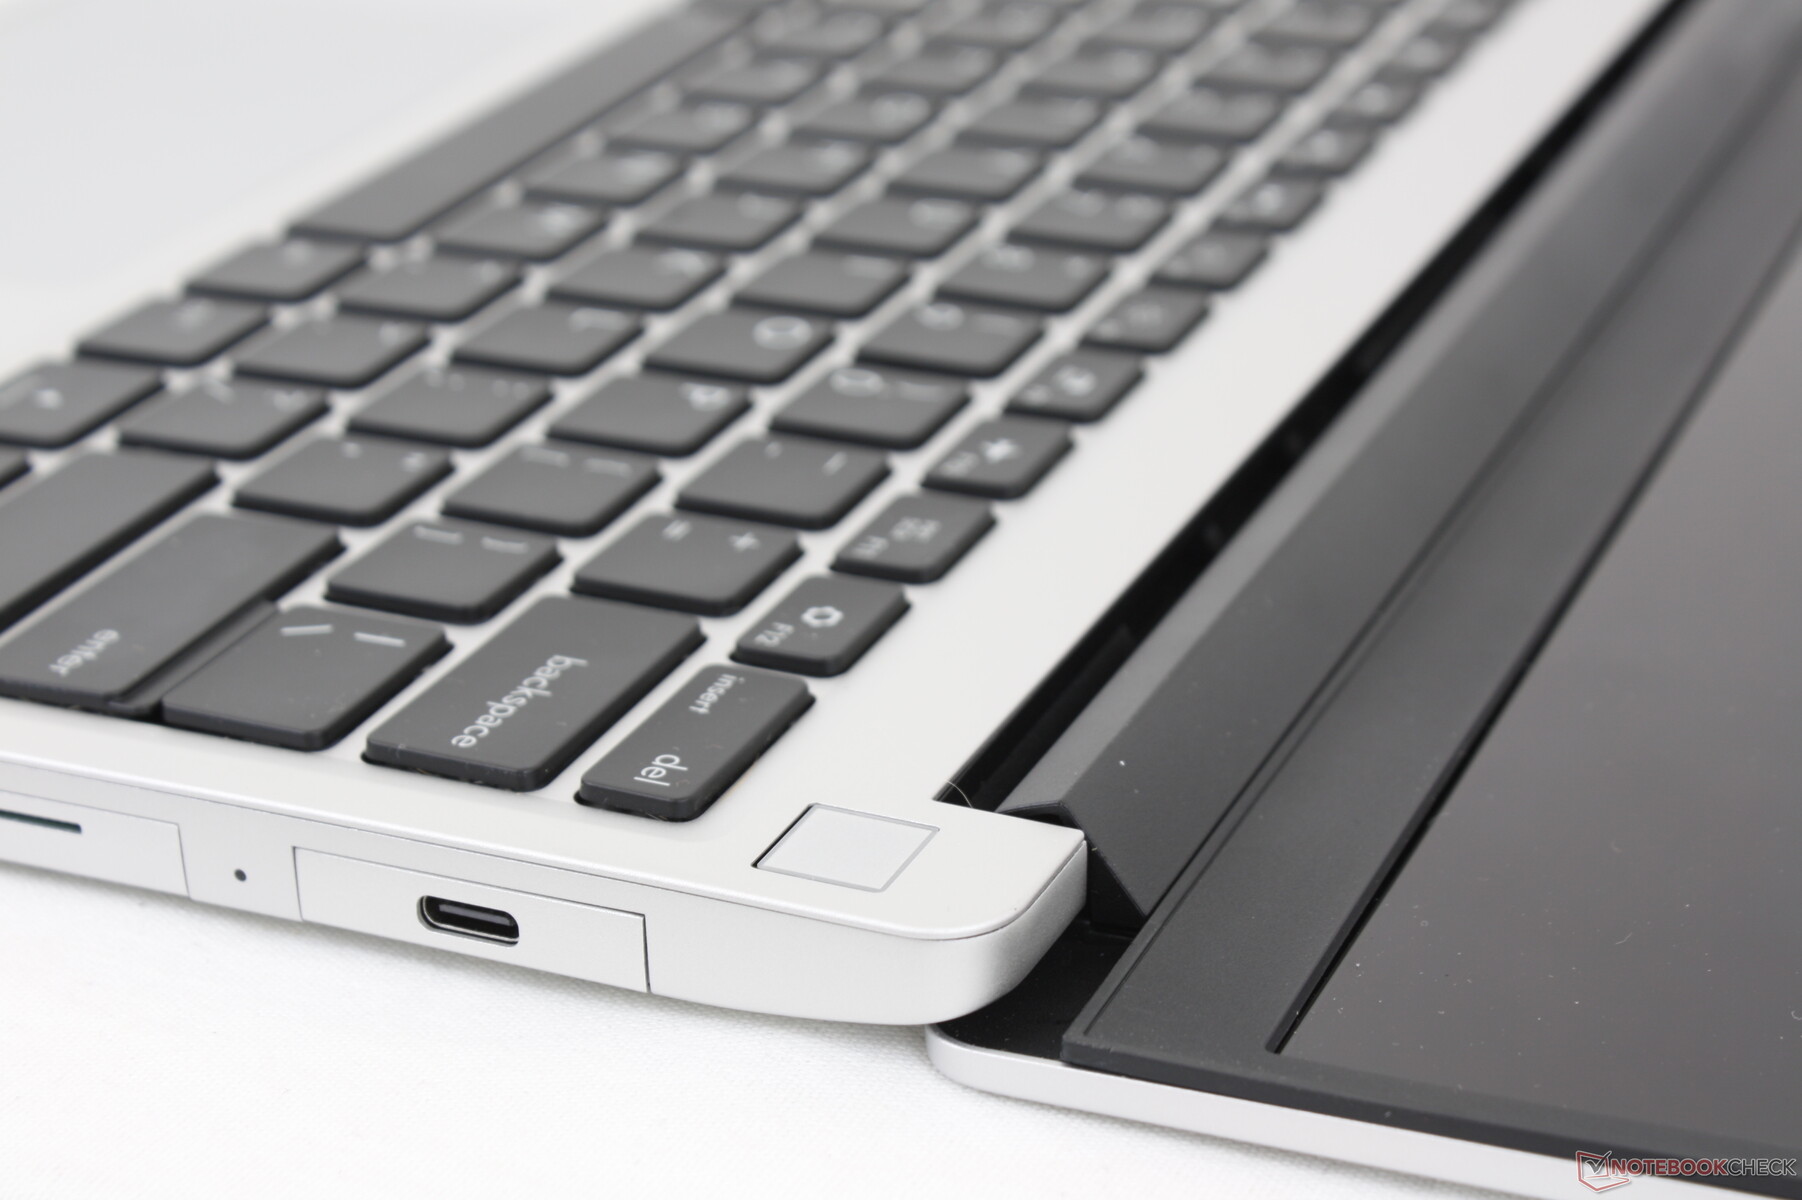
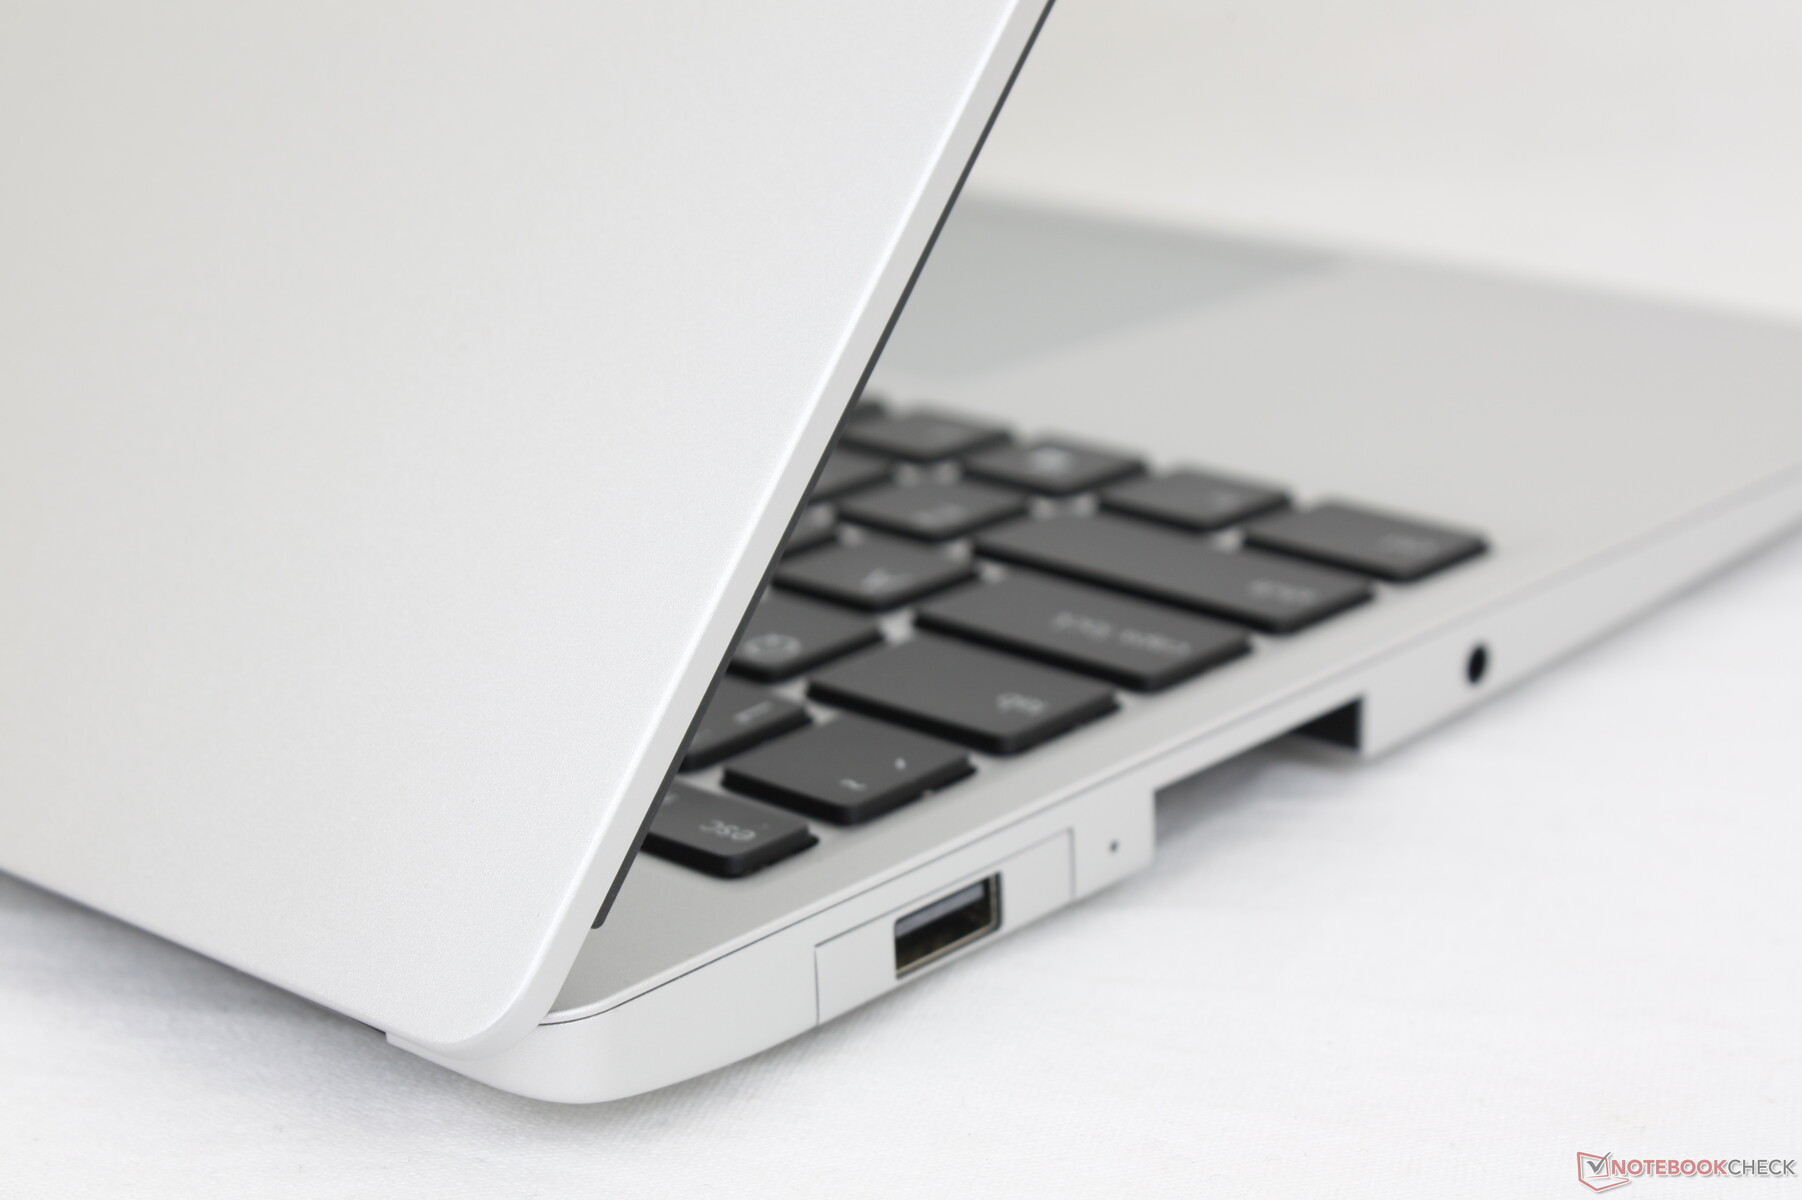
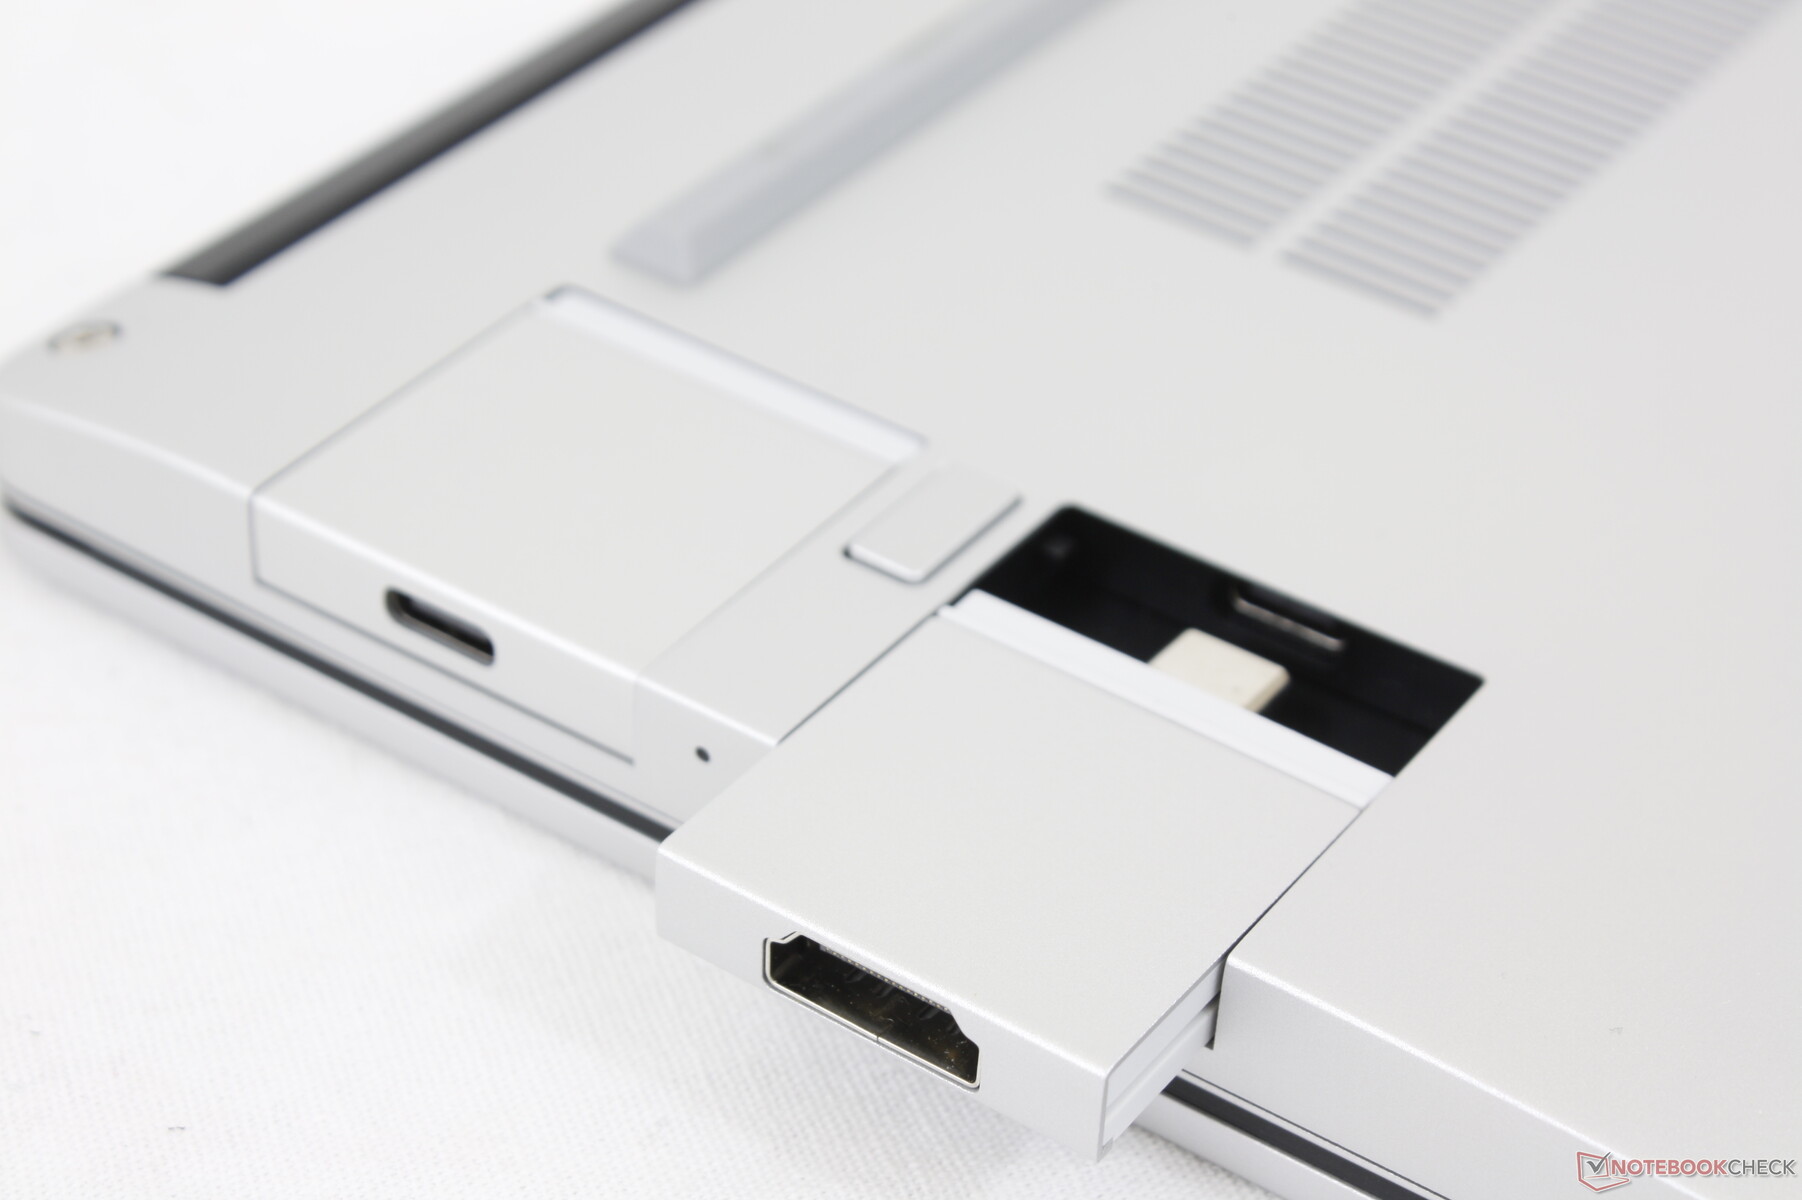
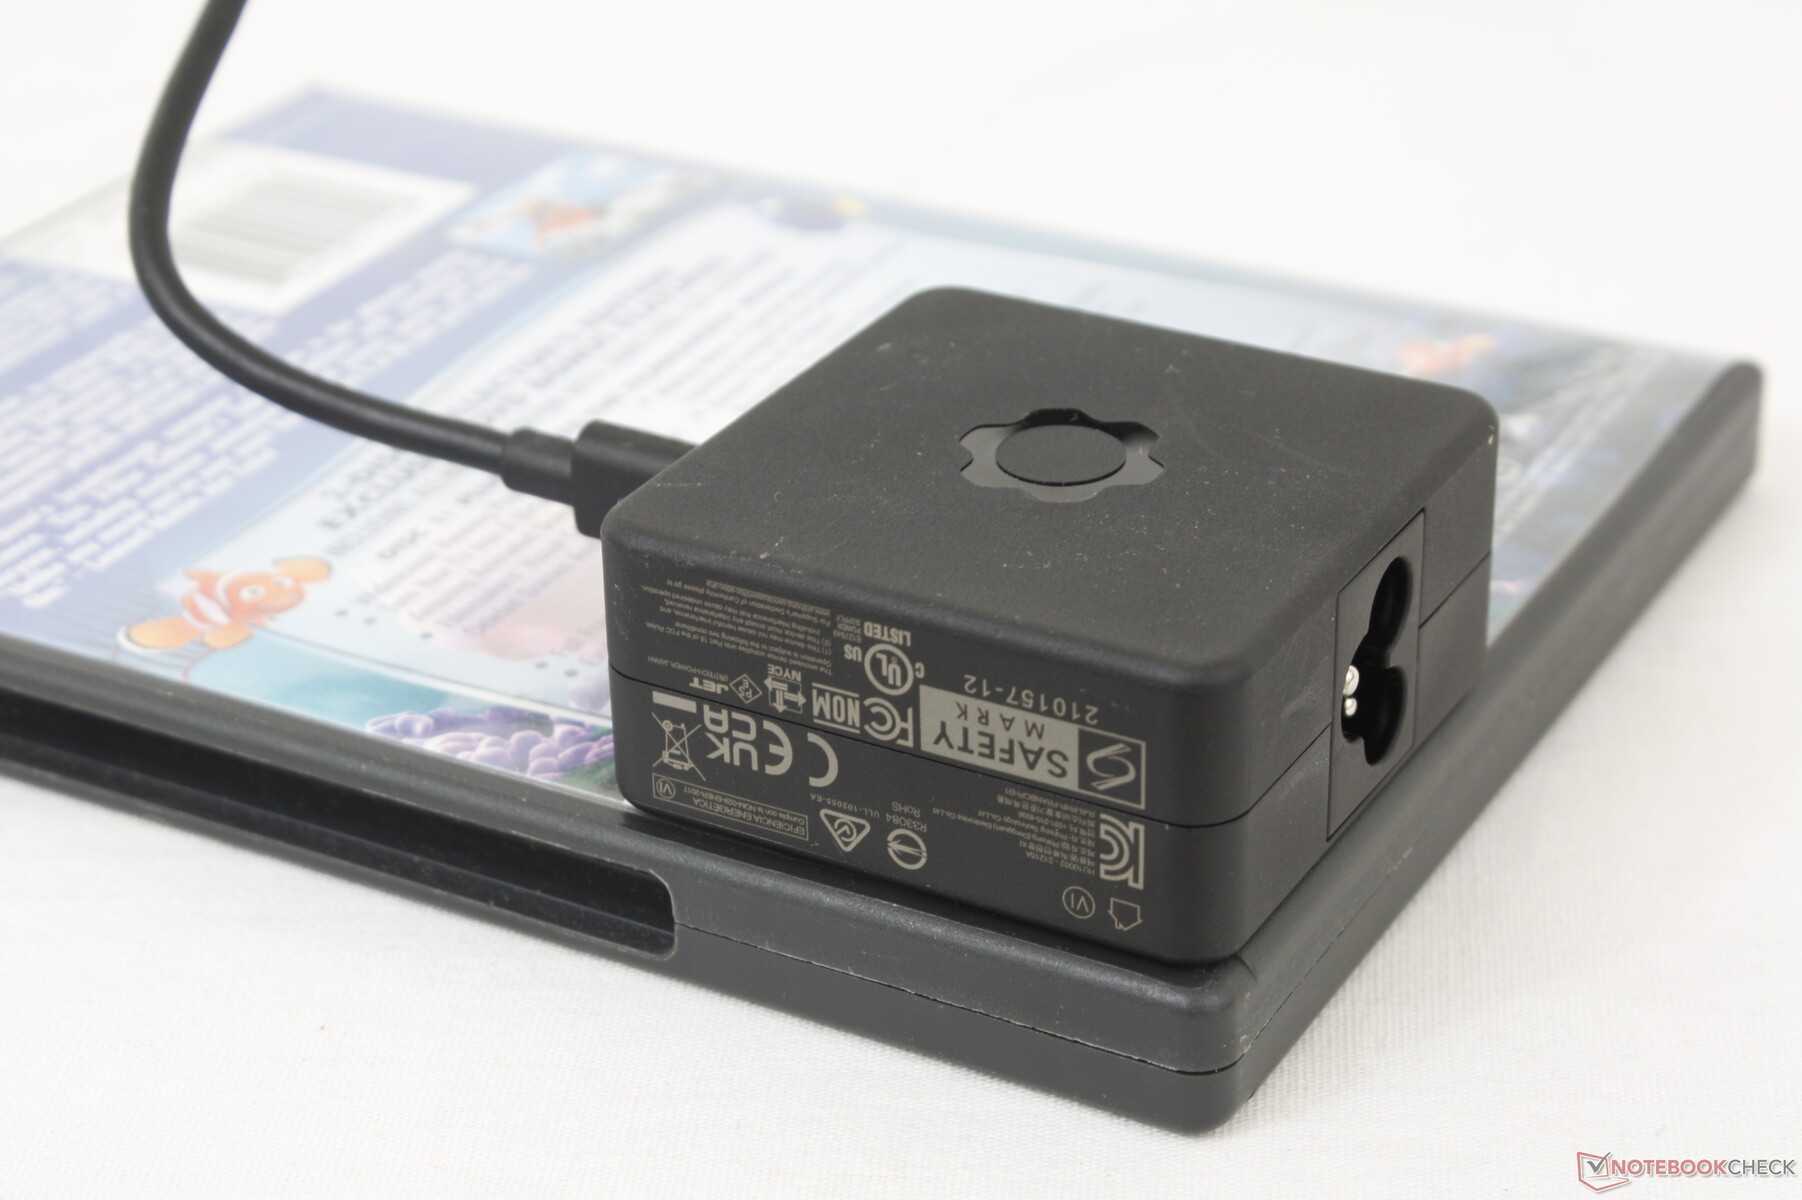
Het Framework-systeem is voorzien van vier identieke USB-C-poorten die gelijkmatig zijn verdeeld over de linker- en rechterrand. Alle poorten ondersteunen USB 4-snelheden en zijn technisch compatibel met Thunderbolt-apparaten, waaronder onze Aorus Gaming Box. Vanaf dit schrijven ondersteunt de fabrikant echter officieel alleen USB-apparaten
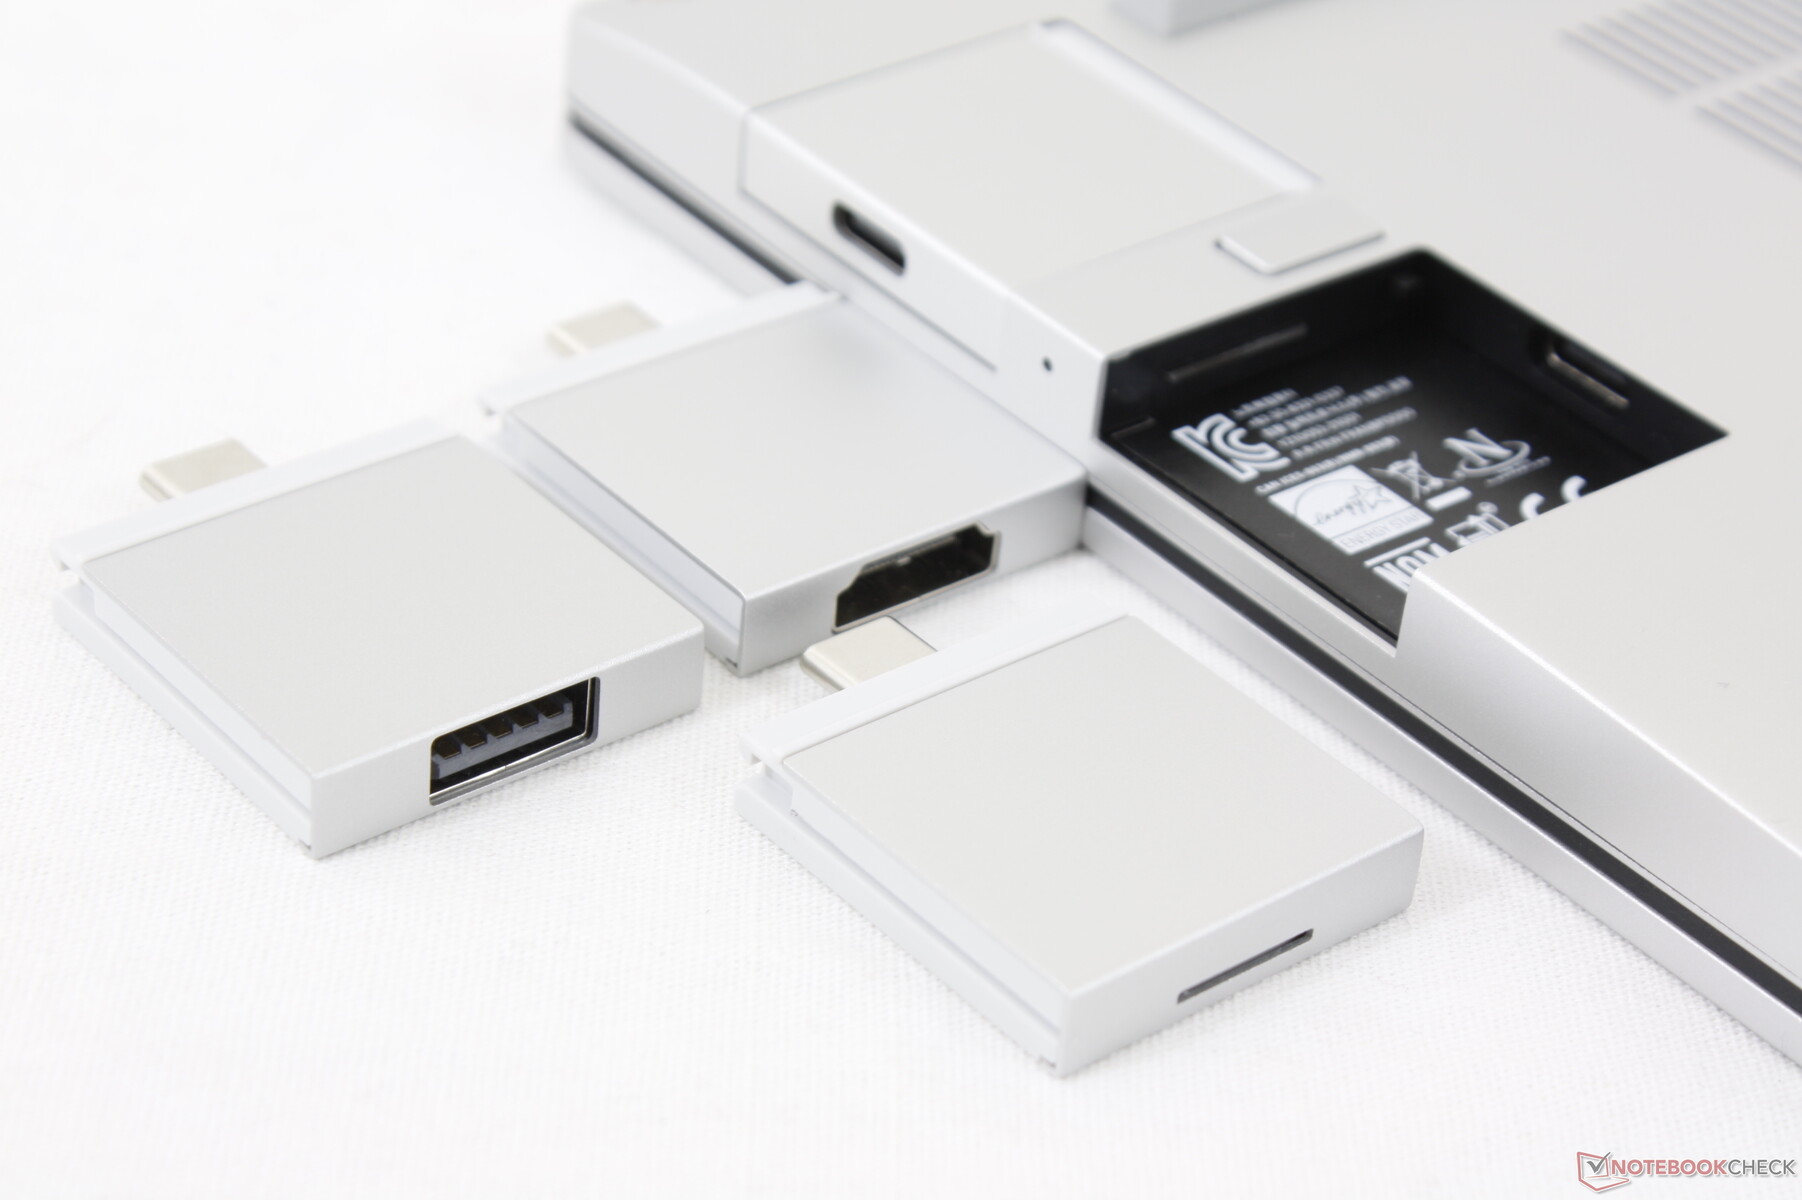
De vier USB-C-poorten zijn verzonken in het chassis om uitbreidingskaartadapters mogelijk te maken. De fysieke adapters zelf zijn gepatenteerd, maar de poorten en connectoren zijn dat niet. Gebruikers zijn dus vrij om verschillende uitbreidingskaartadapters te combineren om de 4x USB-C poorten om te zetten in MicroSD, USB-A, HDMI, DisplayPort, of een combinatie daarvan
De verzonken USB-C-poorten gedragen zich als elke USB-C-poort met zowel Power Delivery als DisplayPort als er helemaal geen adapters zijn aangesloten.
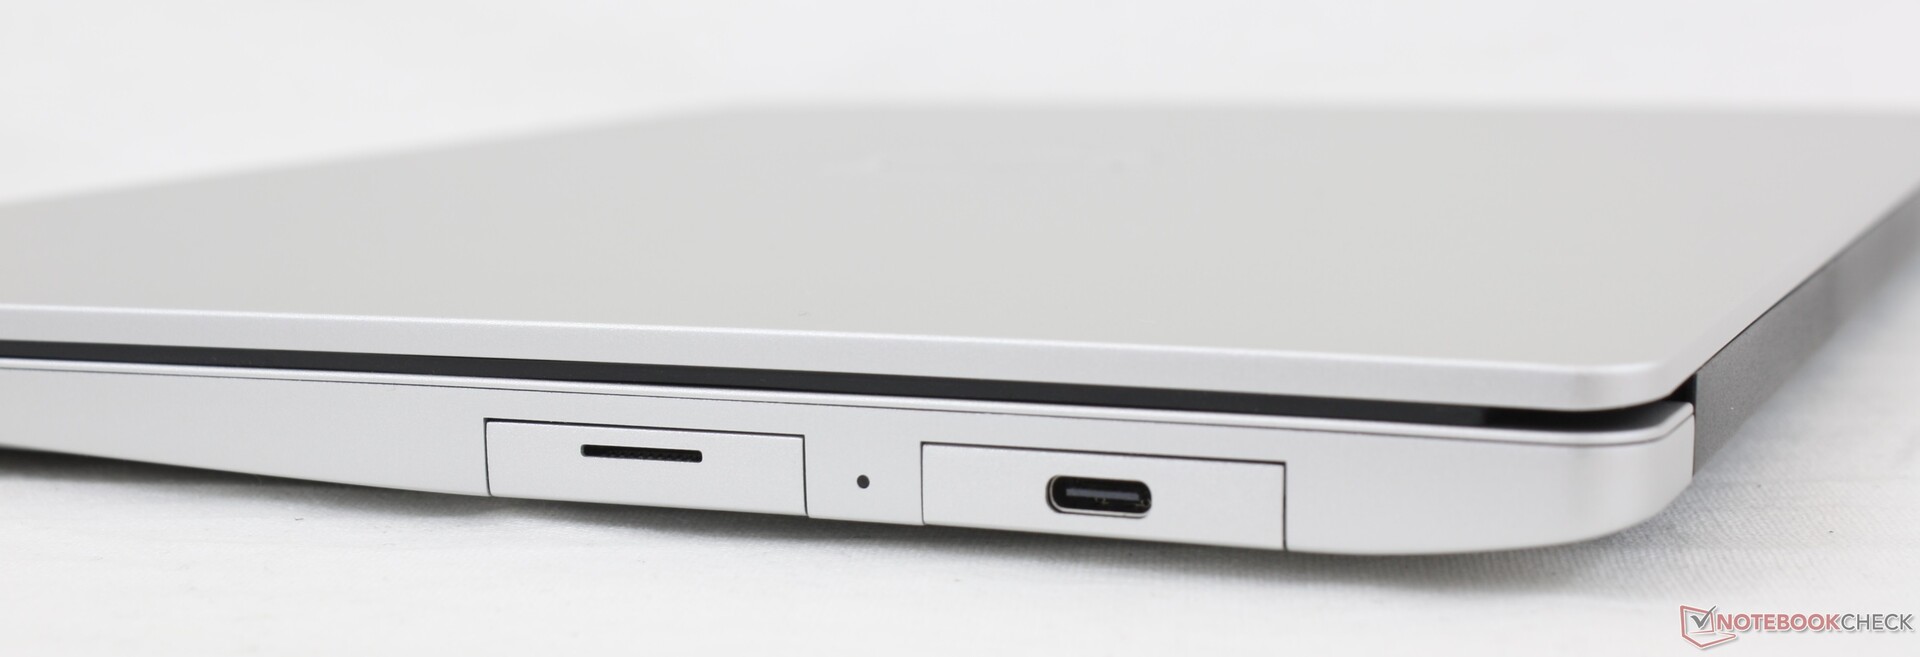
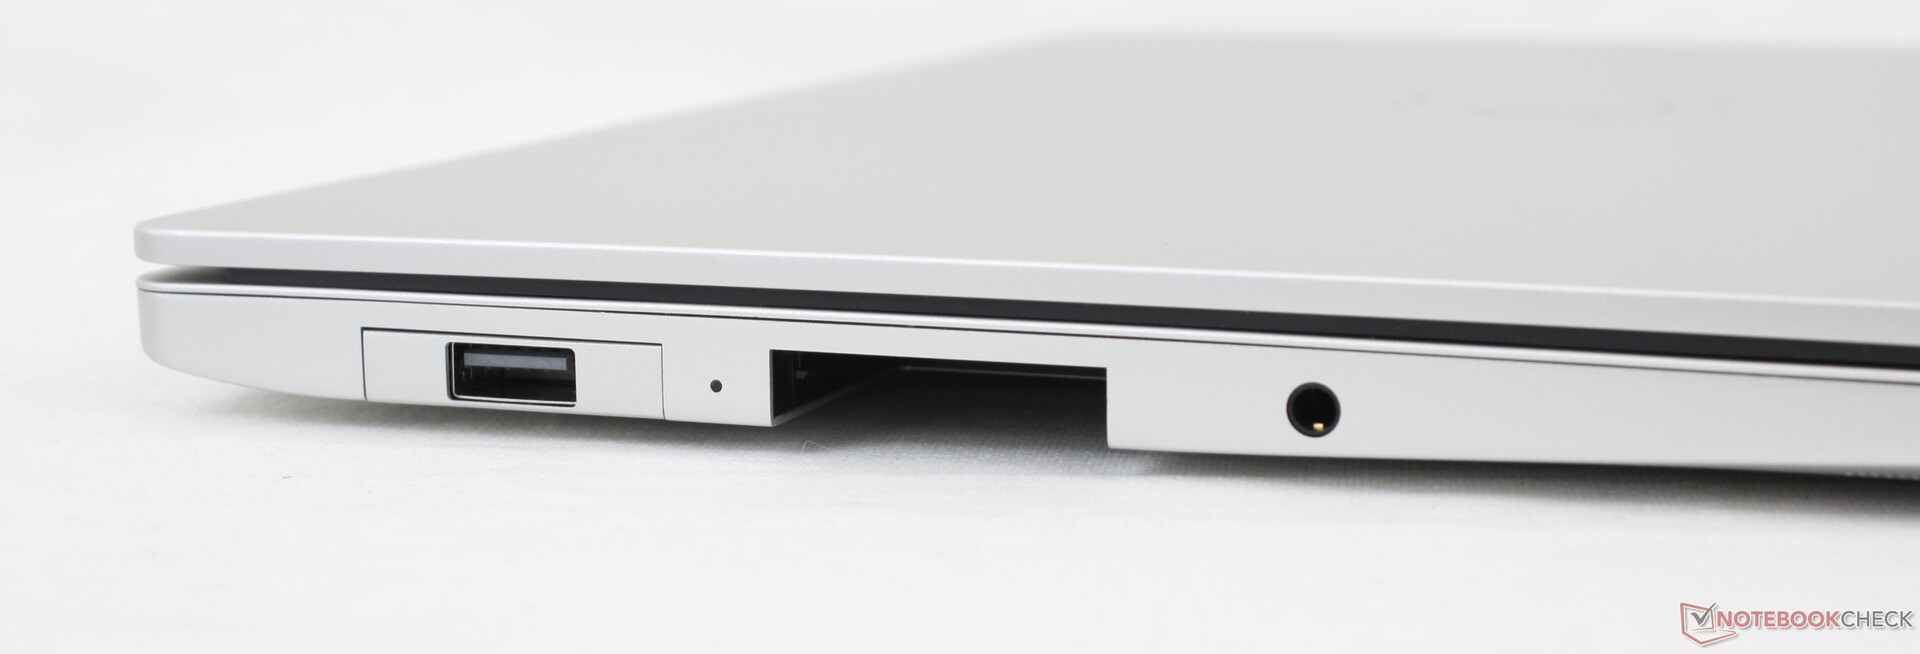
SD-kaartlezer
De uitbreidingskaart voor de MicroSD-lezer is lastig in het gebruik. De MicroSD-sleuf is niet veerbelast, waardoor kaarten er moeilijk in en uit te halen zijn. Het voelt alsof onze kaart op het punt staat te breken, elke keer als we hem hier gebruiken
De overdrachtssnelheden zijn behoorlijk, maar niet indrukwekkend. Het verplaatsen van 1 GB aan foto's van onze UHS-II testkaart duurt ongeveer 14 seconden, vergeleken met minder dan de helft daarvan op de Dell XPS 13.
| SD Card Reader | |
| average JPG Copy Test (av. of 3 runs) | |
| HP Spectre x360 14-ea0378ng (Toshiba Exceria Pro M501 microSDXC 64GB) | |
| Framework Laptop 13.5 (AV Pro UHS-II V60) | |
| HP ProBook x360 435 G8 R7-5800U (AV Pro UHS-II V60) | |
| maximum AS SSD Seq Read Test (1GB) | |
| HP Spectre x360 14-ea0378ng (Toshiba Exceria Pro M501 microSDXC 64GB) | |
| Framework Laptop 13.5 (AV Pro UHS-II V60) | |
| HP ProBook x360 435 G8 R7-5800U (AV Pro UHS-II V60) | |
Communicatie
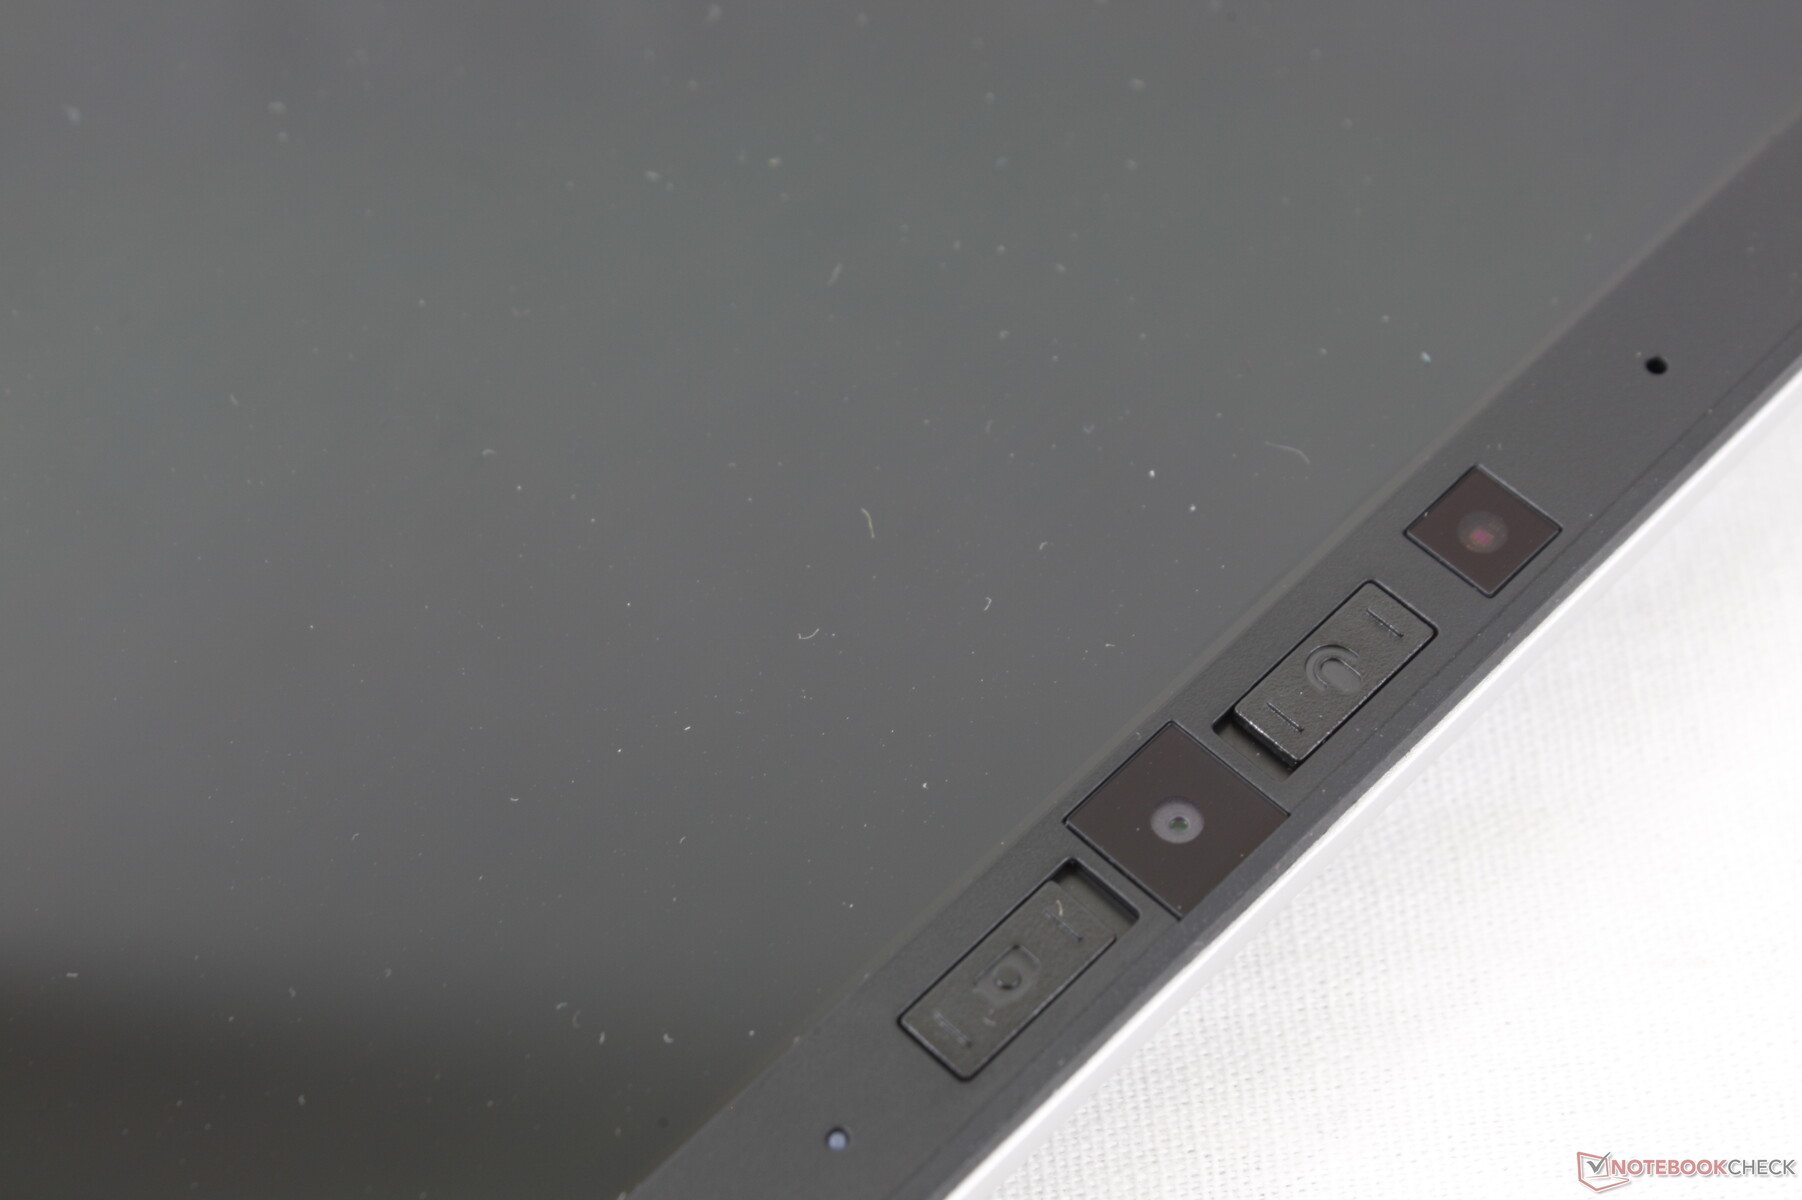
Webcam


Onderhoud
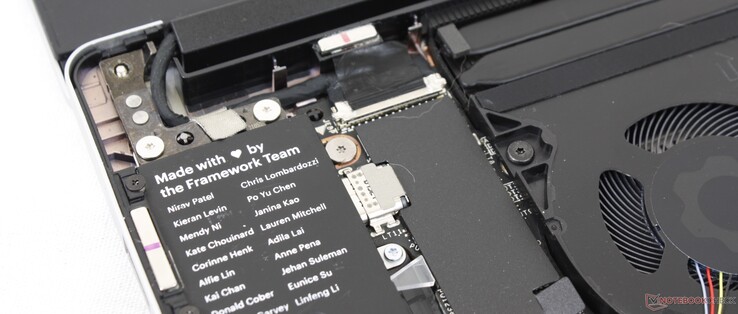
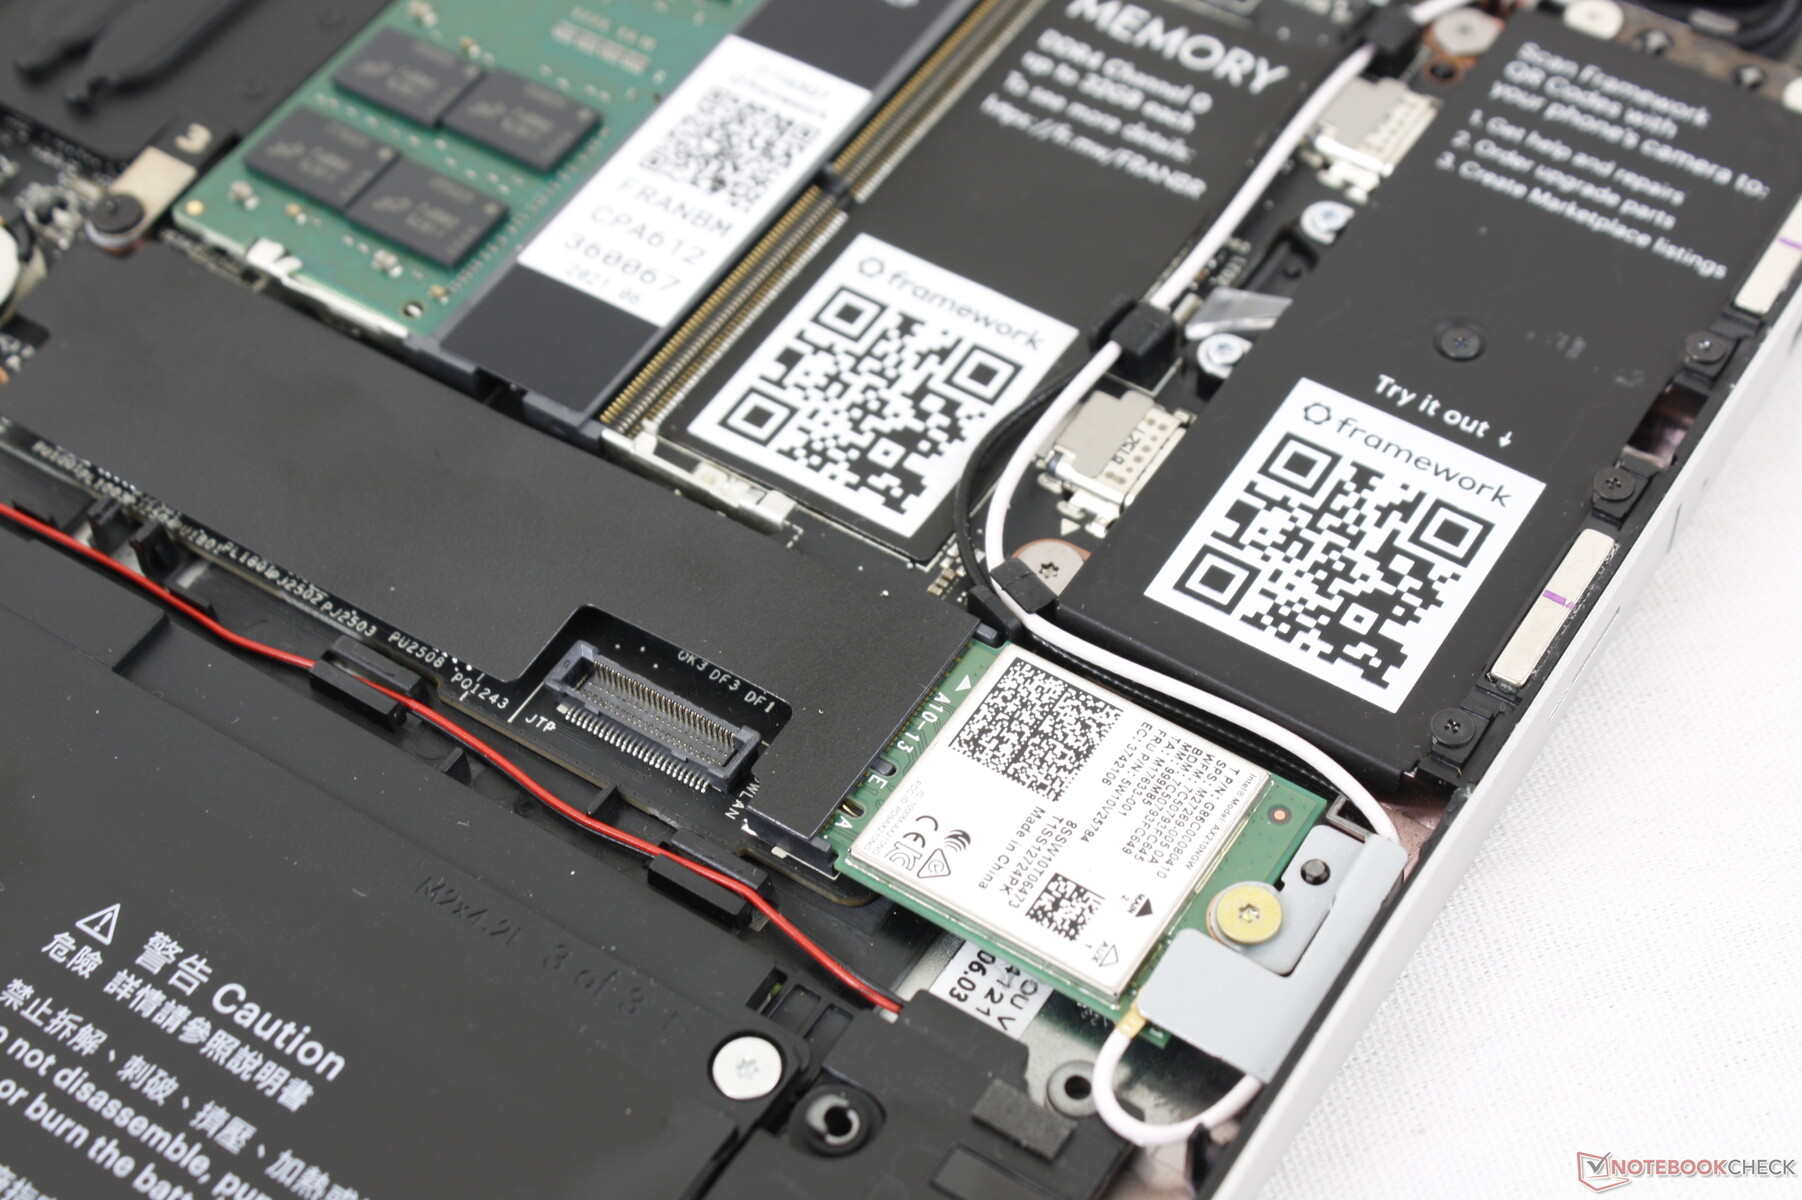
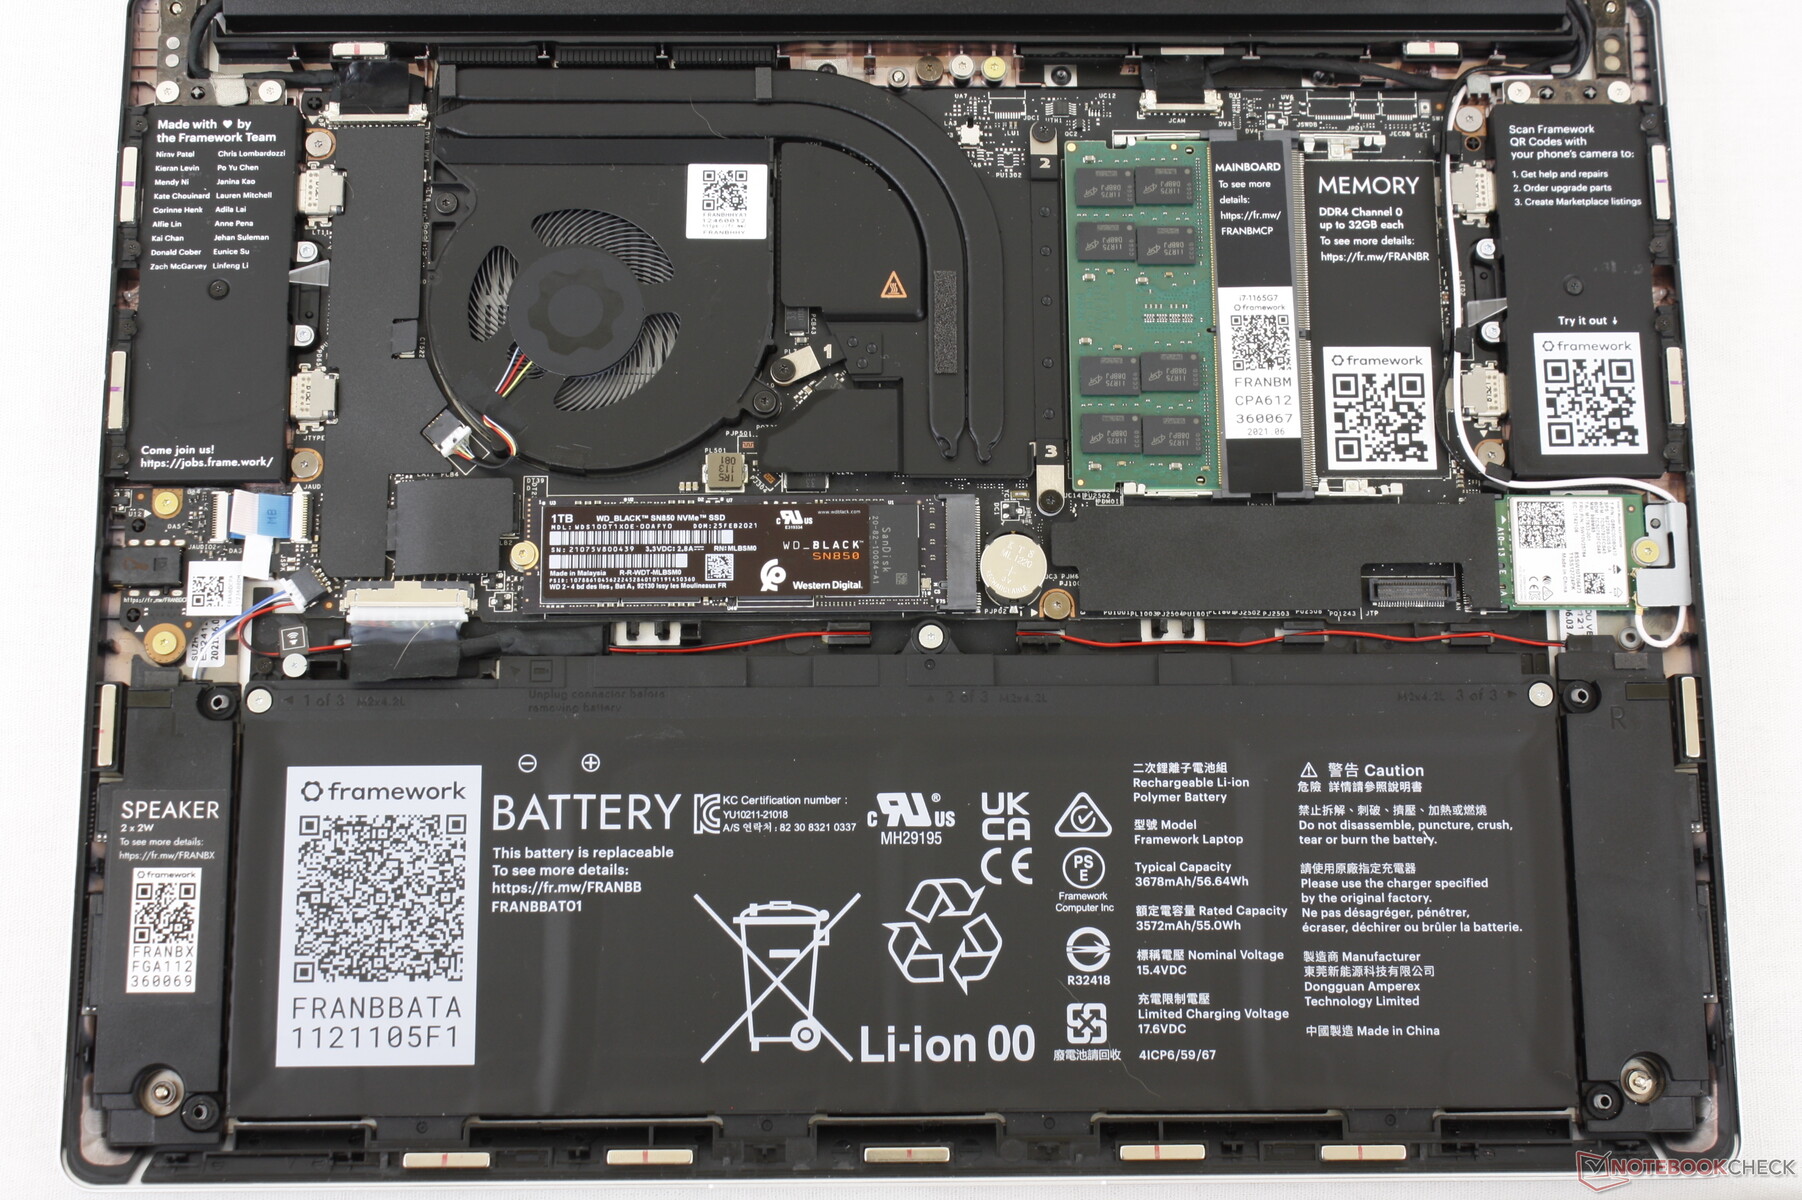
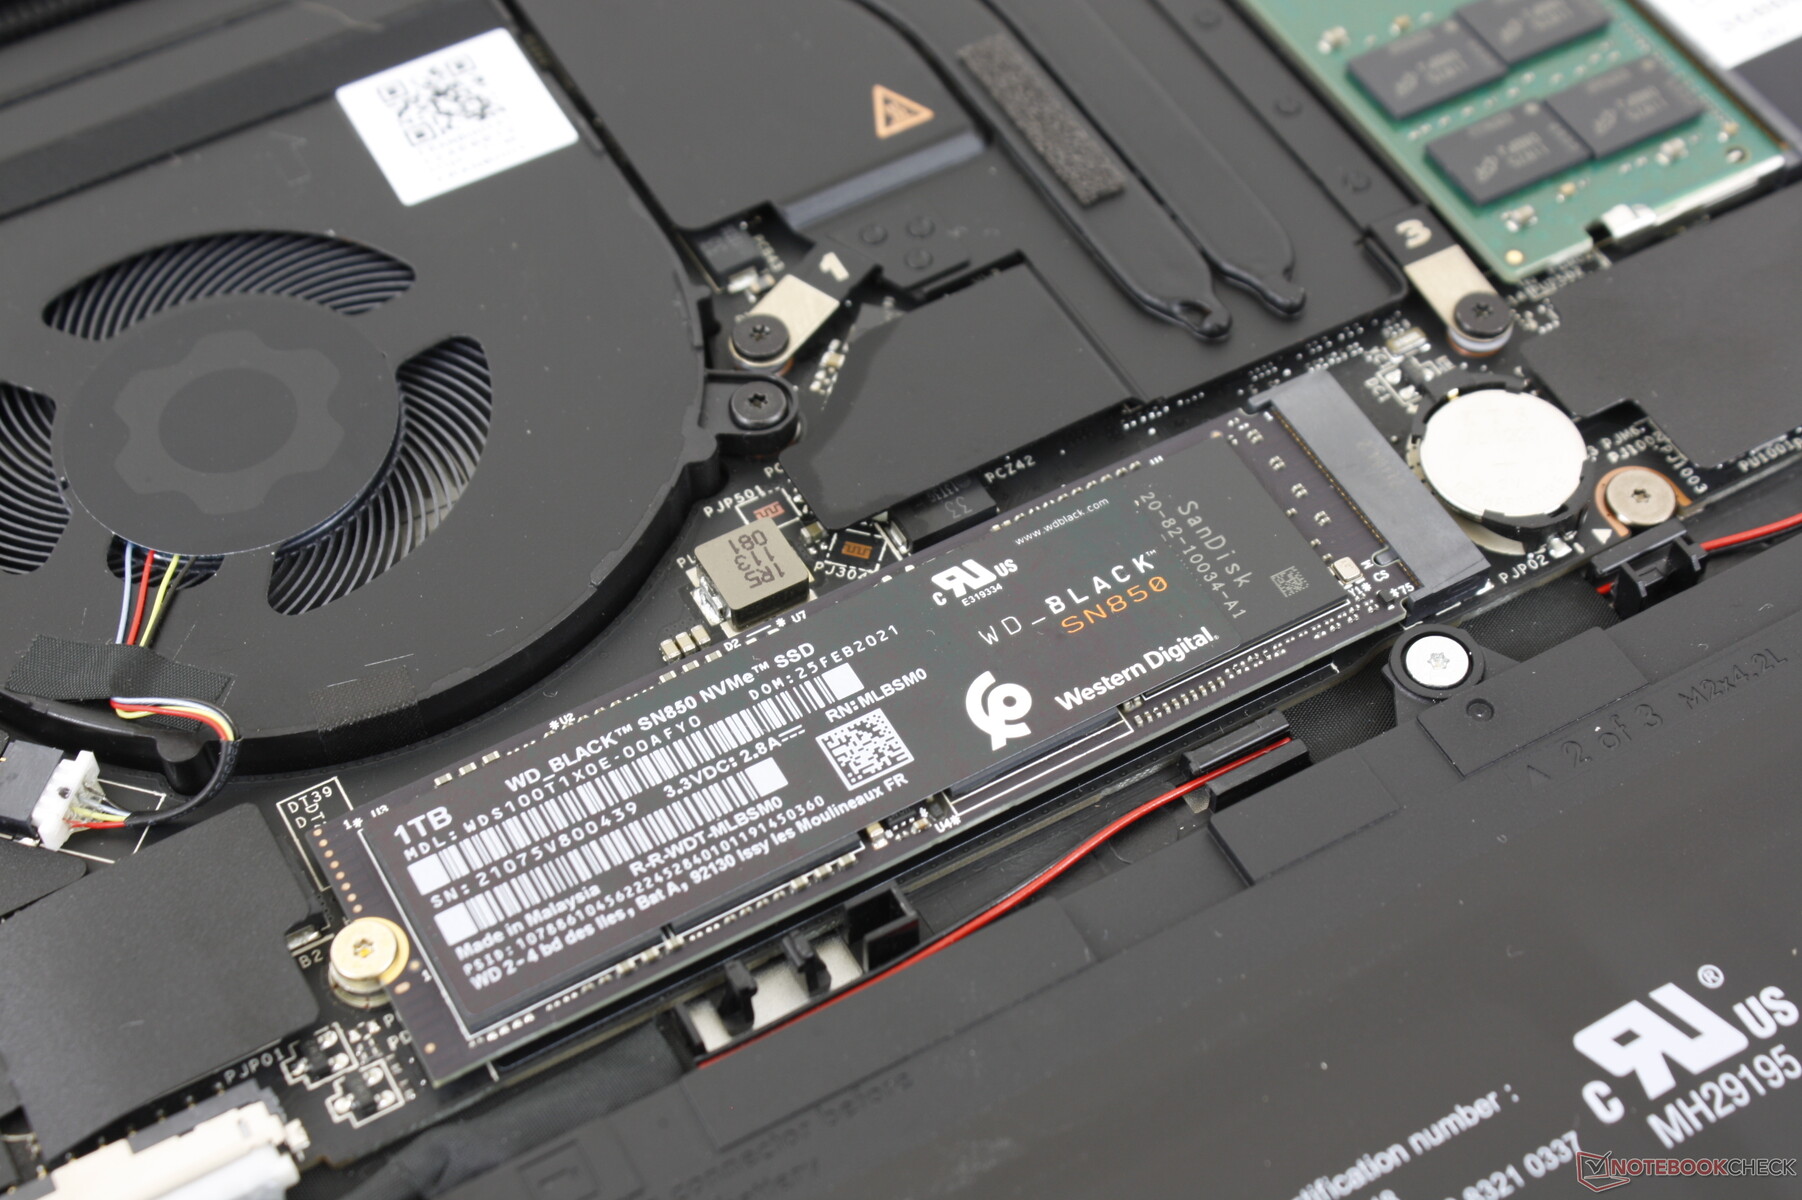
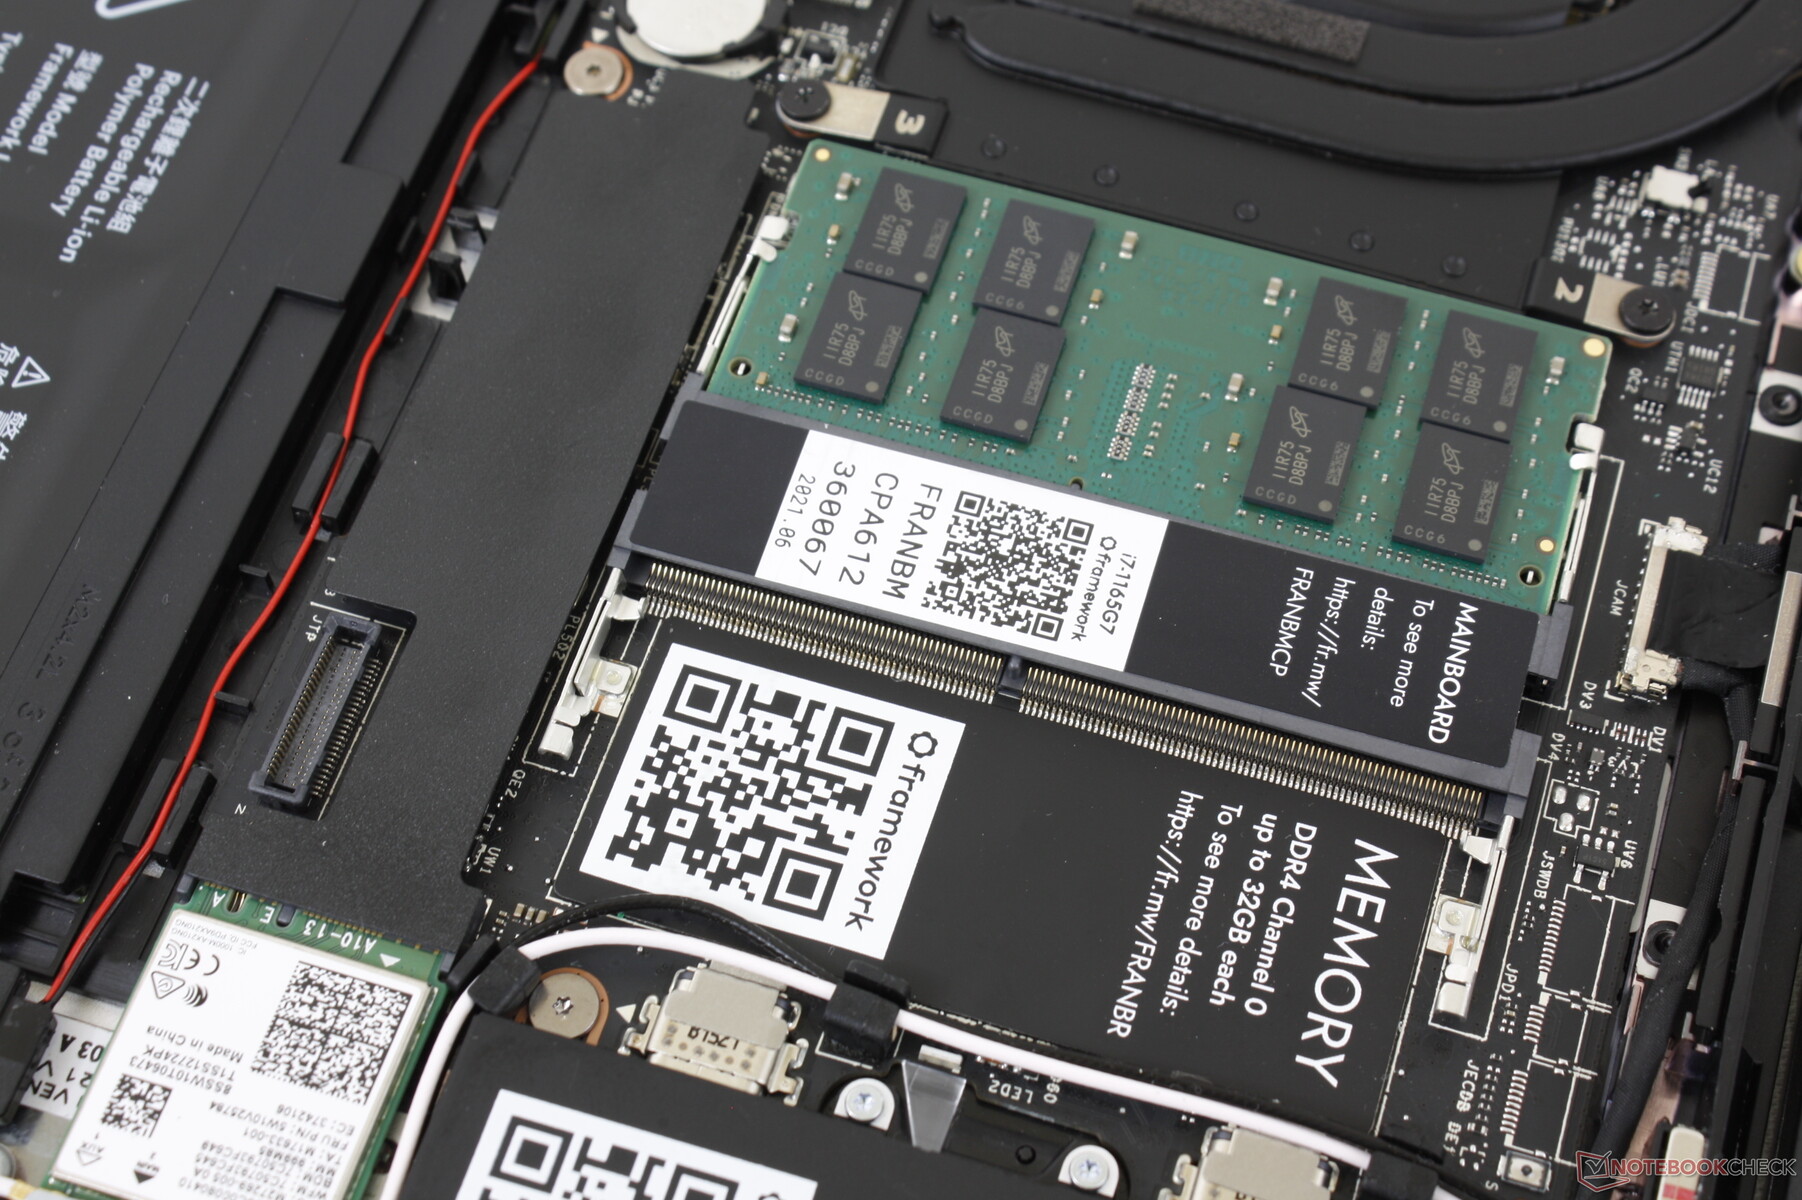
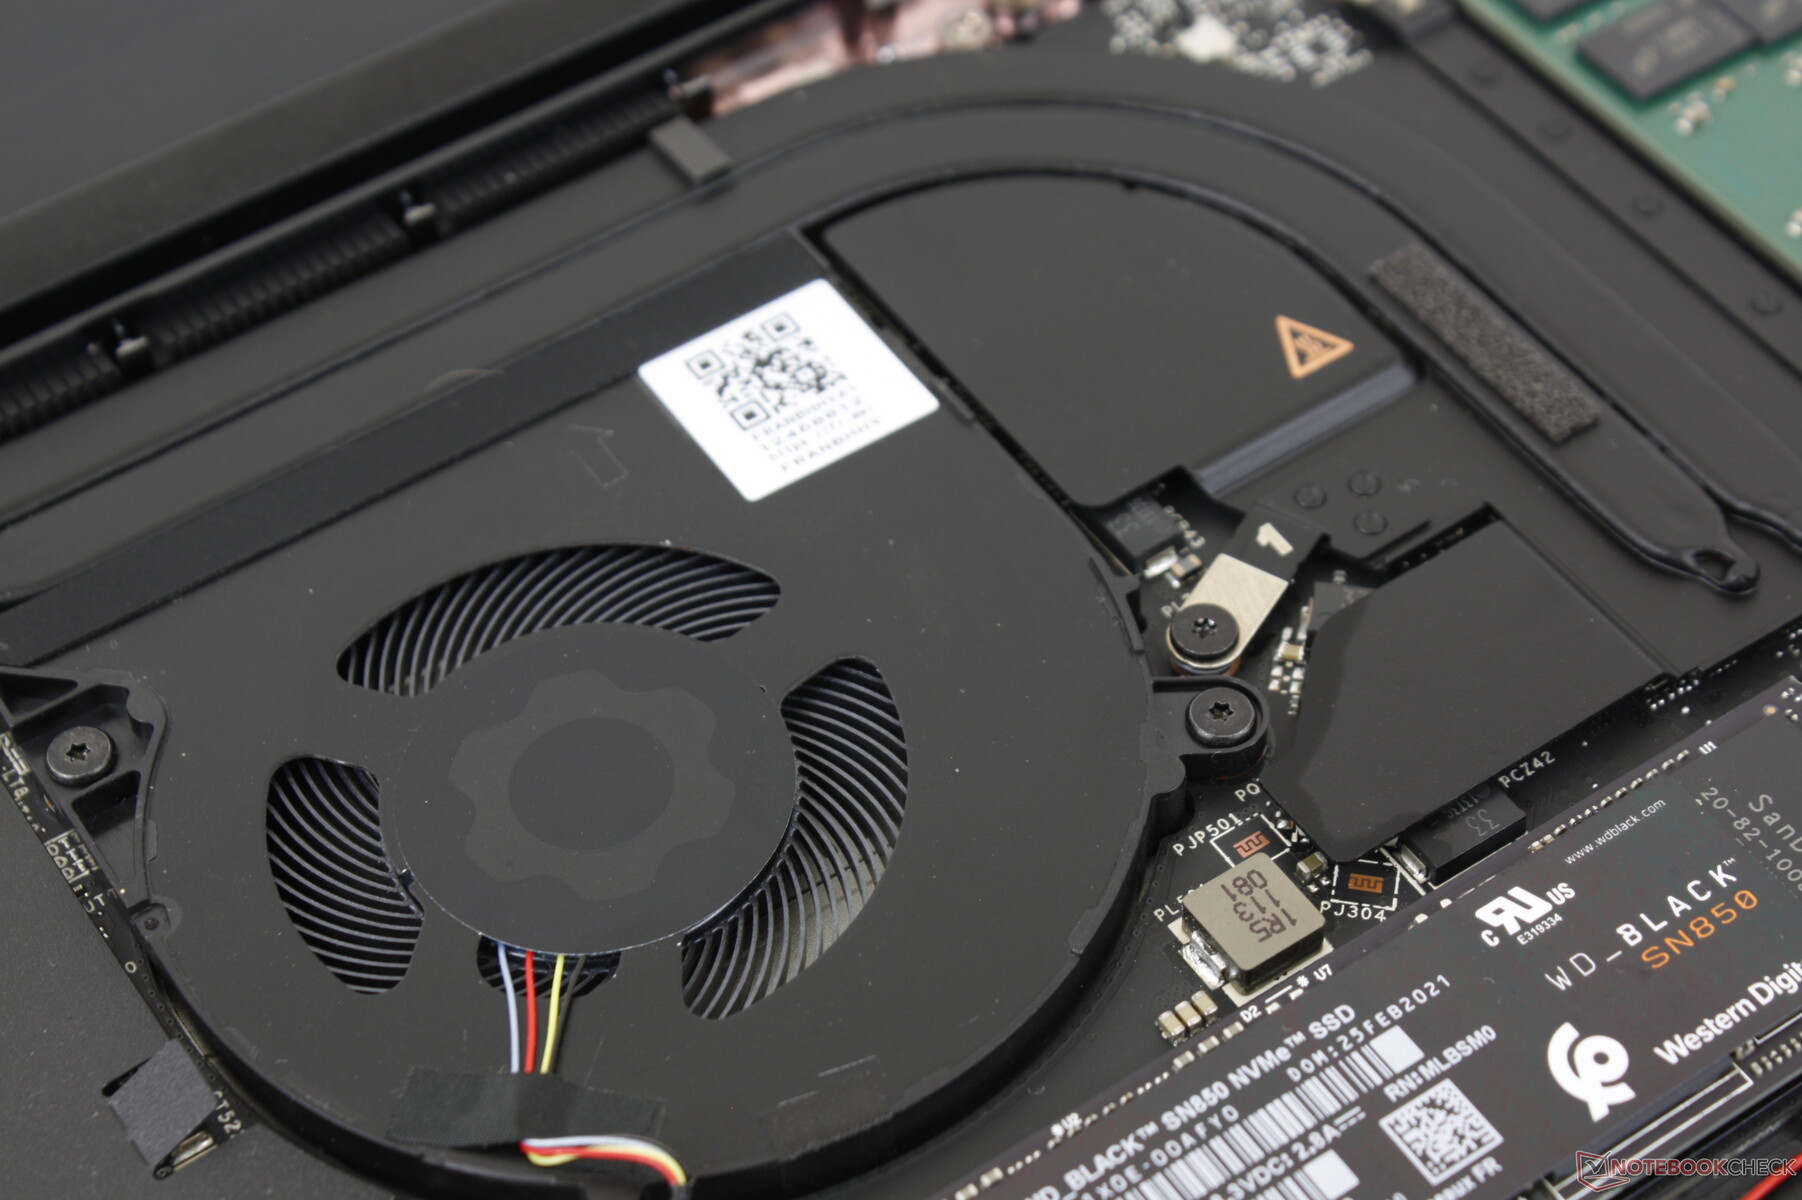
Het moederbord zit ondersteboven, in tegenstelling tot bij de meeste andere laptops. Bijgevolg moeten gebruikers het toetsenbord verwijderen in plaats van het bodempaneel voor eventuele upgrades. Het proces is gelukkig vrij eenvoudig zolang gebruikers een T5 Torx sleutel hebben.
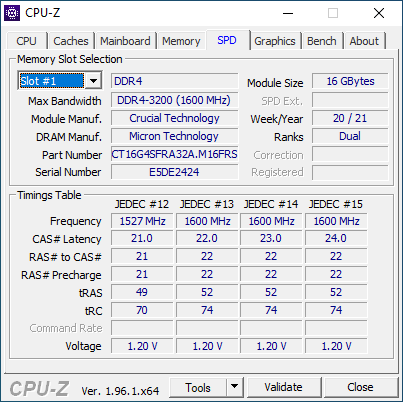
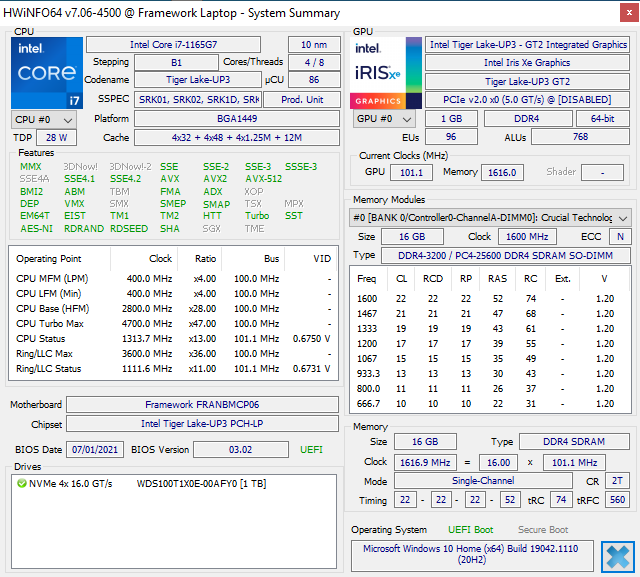
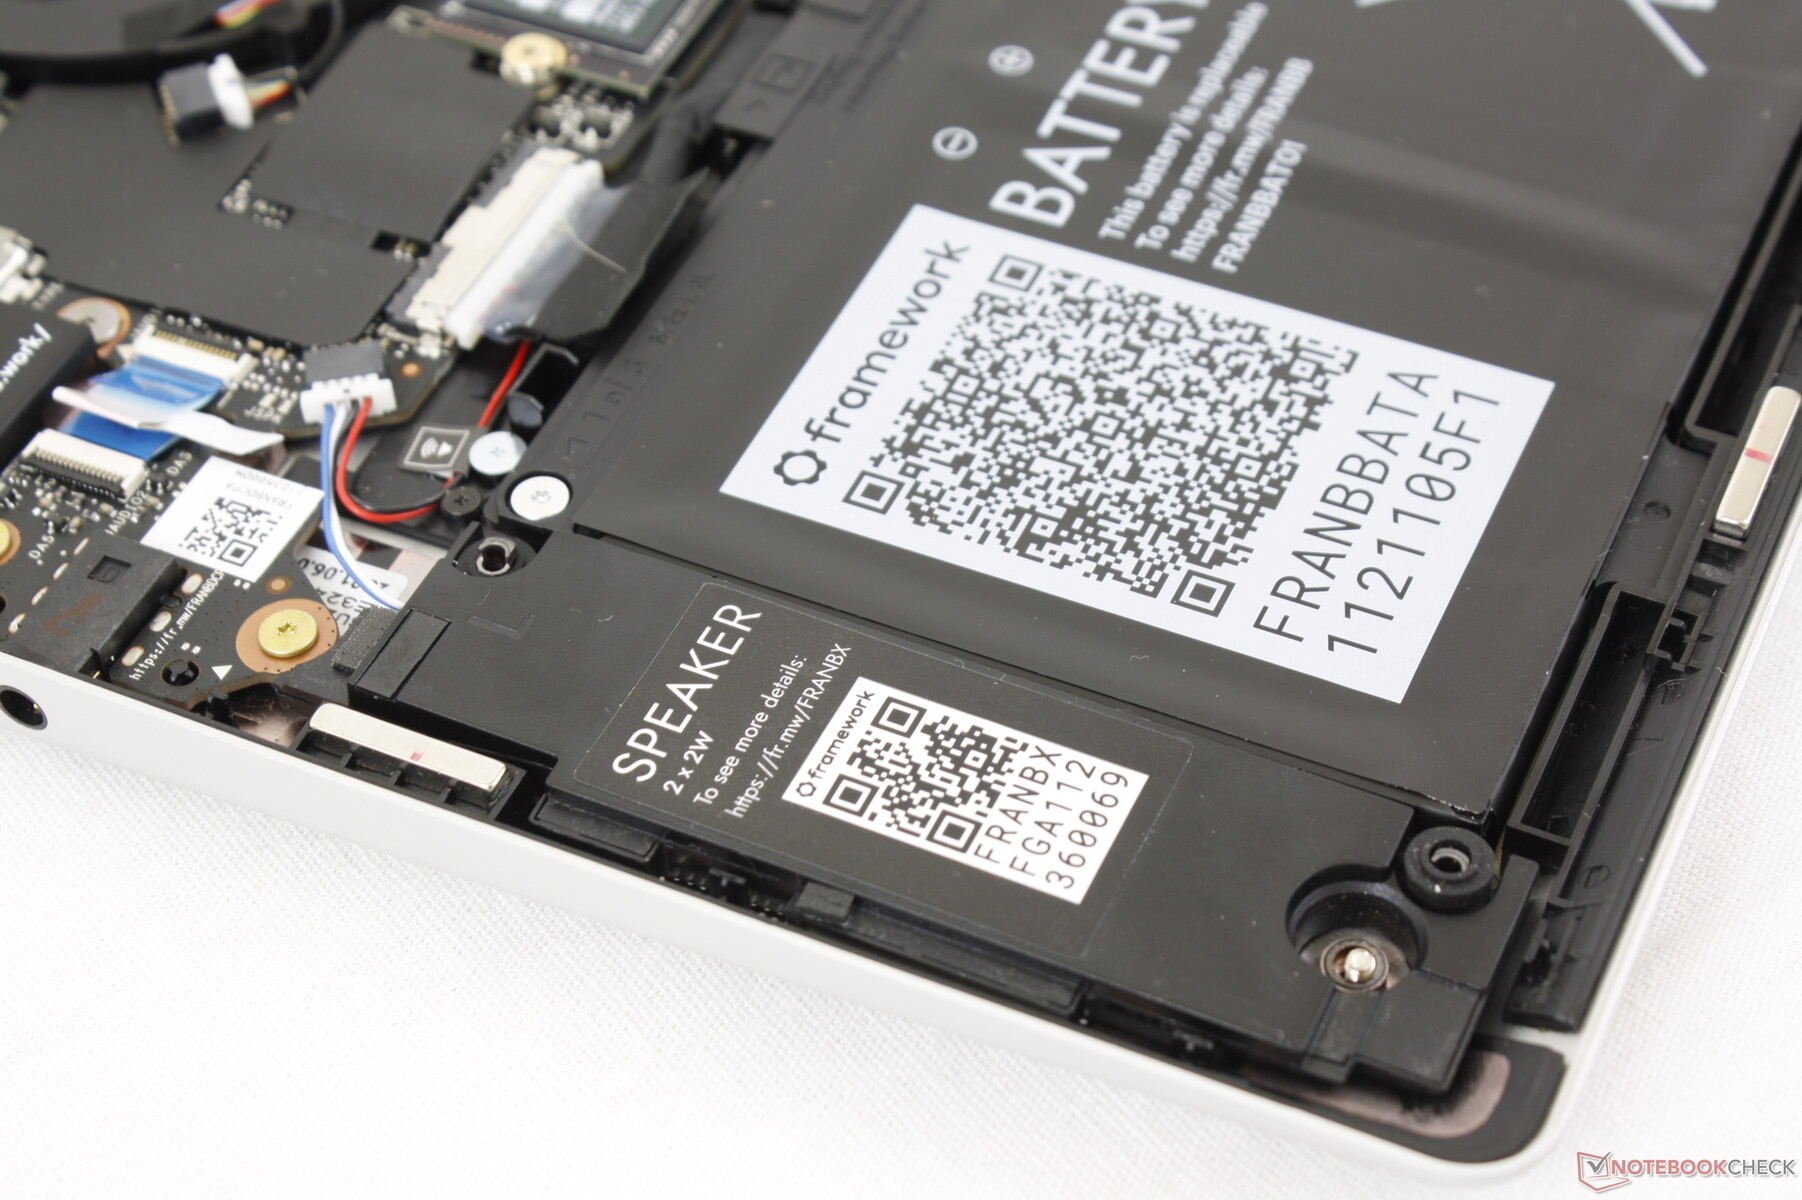
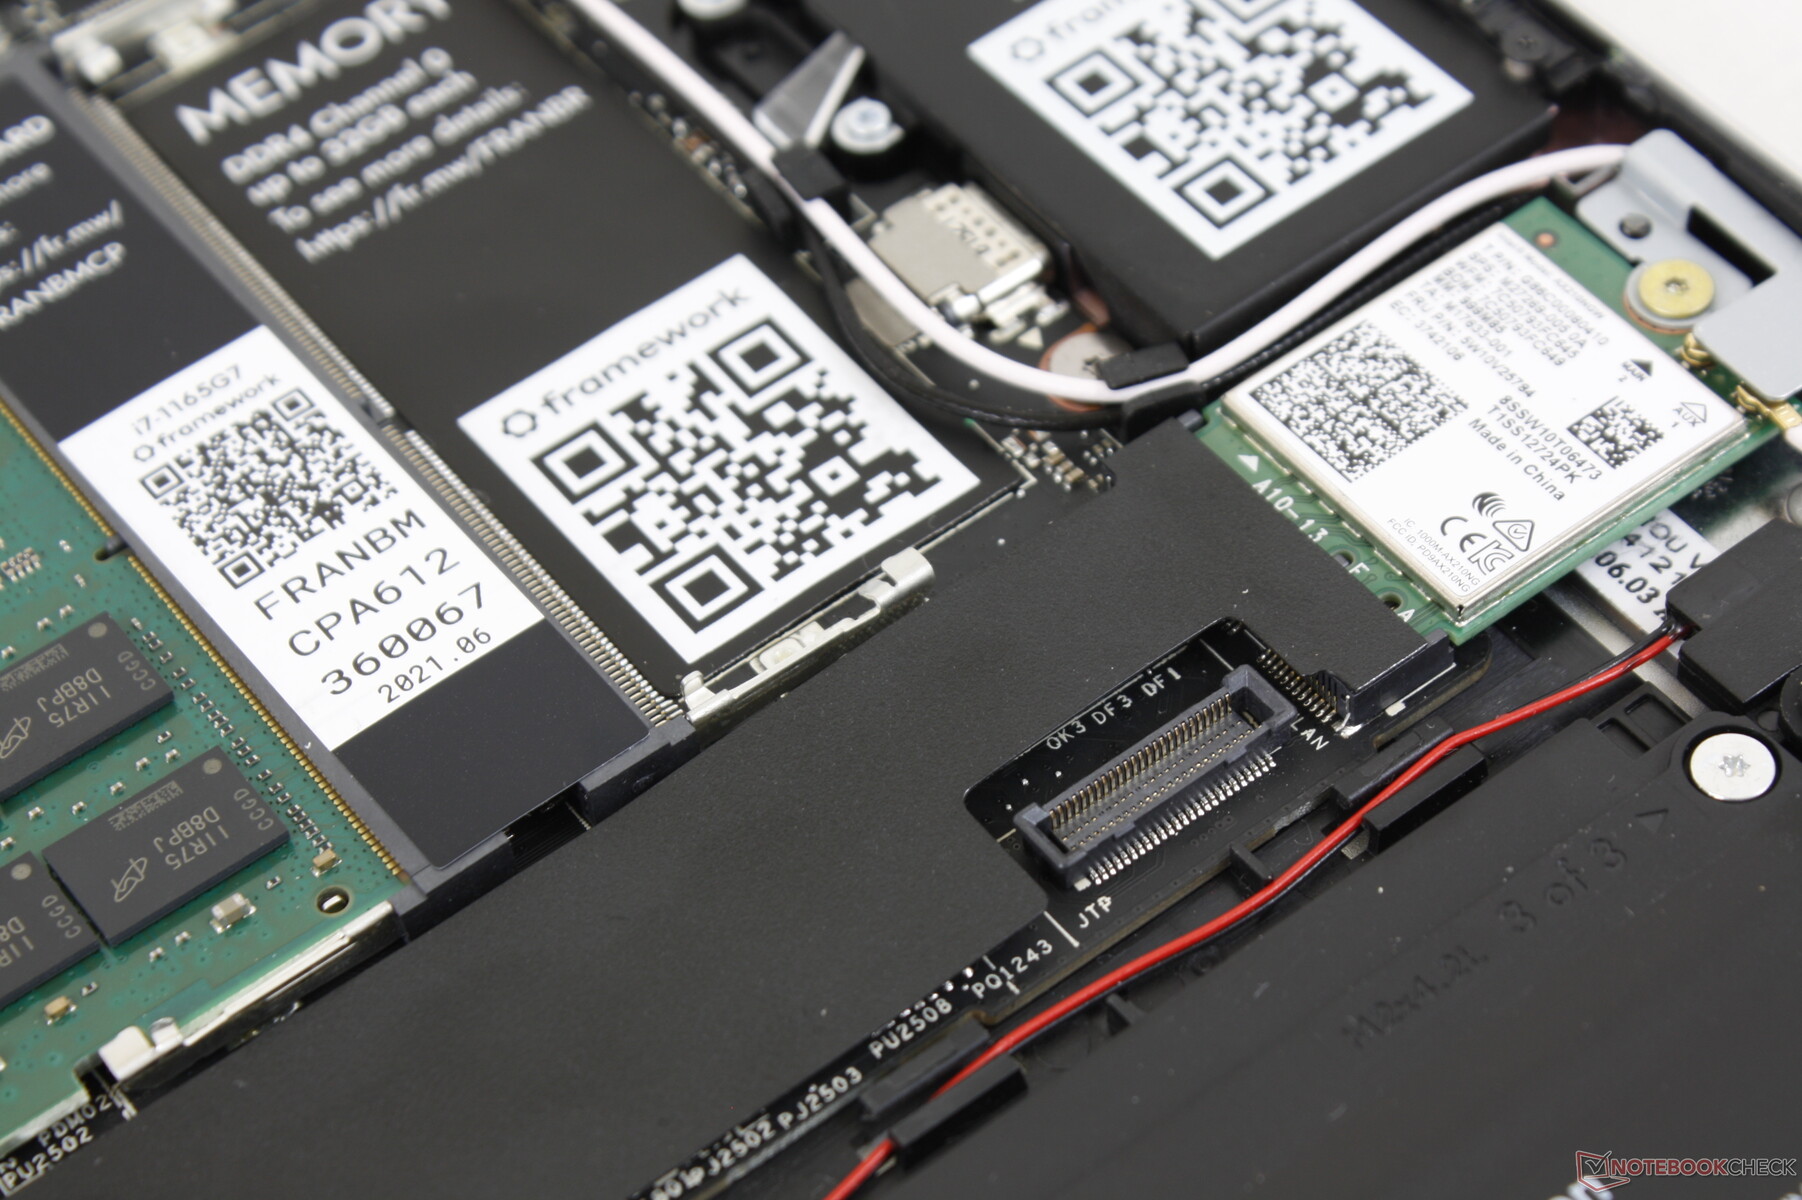
Gebruikers hebben directe toegang tot 2x SODIMM slots, 1x M.2 PCIe 4 2280 SSD slot, 1x WLAN slot, en de batterij.
Accessoires en garantie
De doe-het-zelfkit bevat een Torx-sleutel, USB-stick met Windows-stuurprogramma's en diverse uitbreidingskaartadapters voor HDMI, MicroSD, USB-C, USB-A en mini DisplayPort.
De standaard beperkte fabrieksgarantie van één jaar is van toepassing.
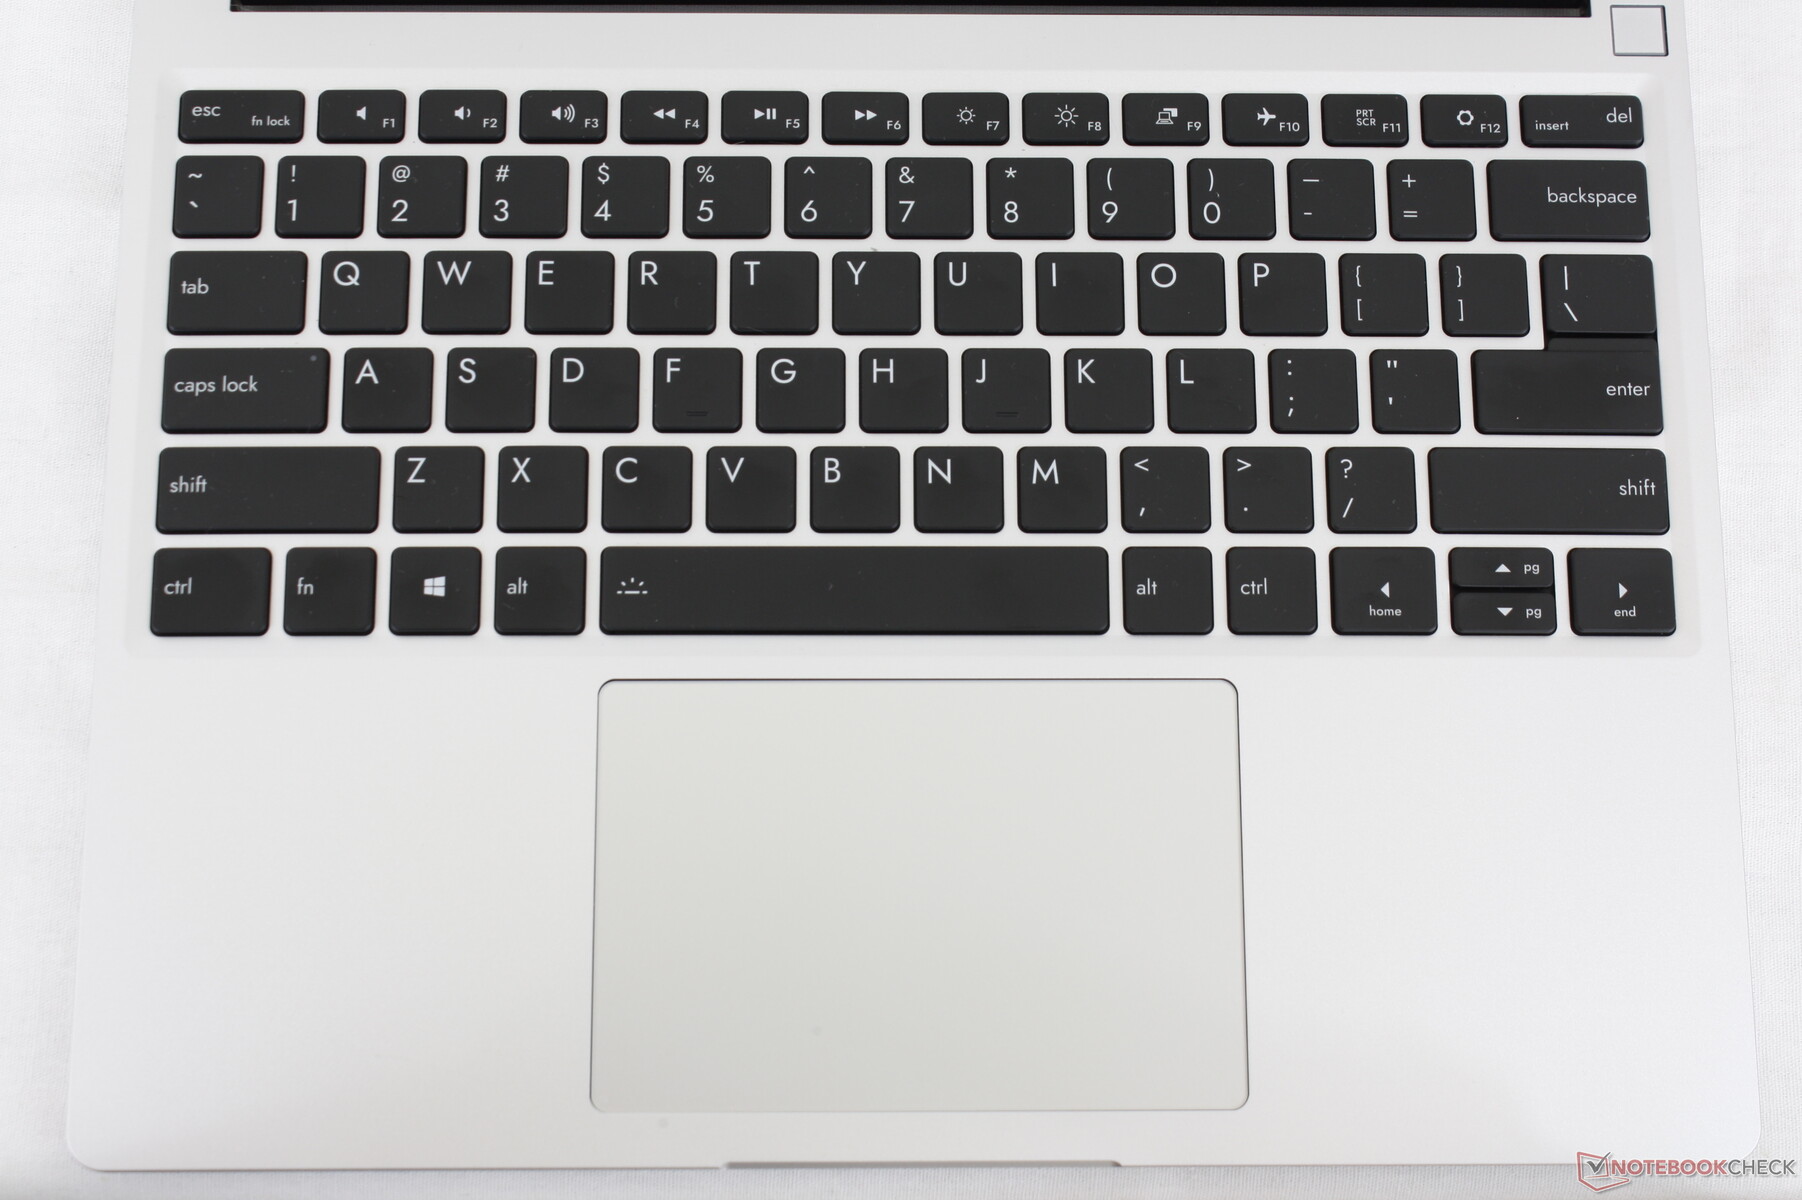
Invoerapparaten
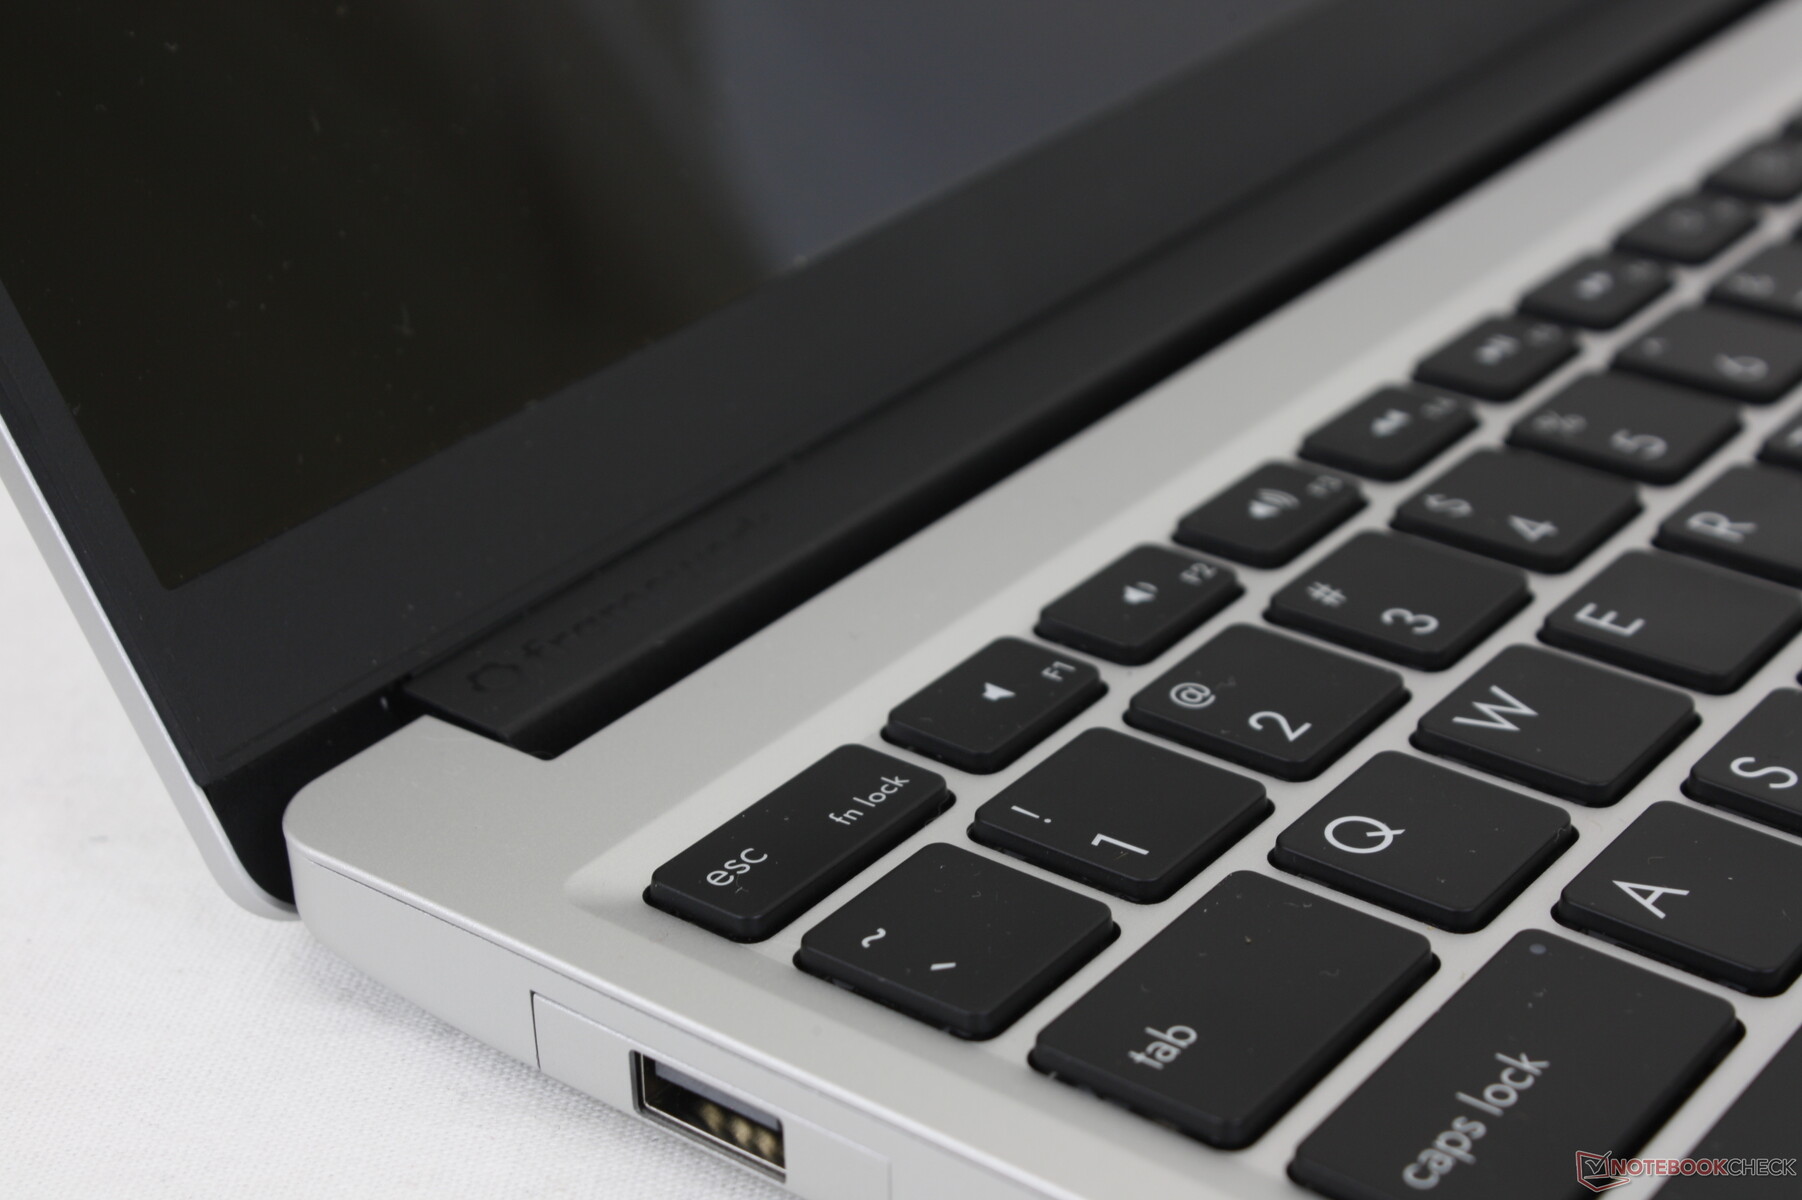
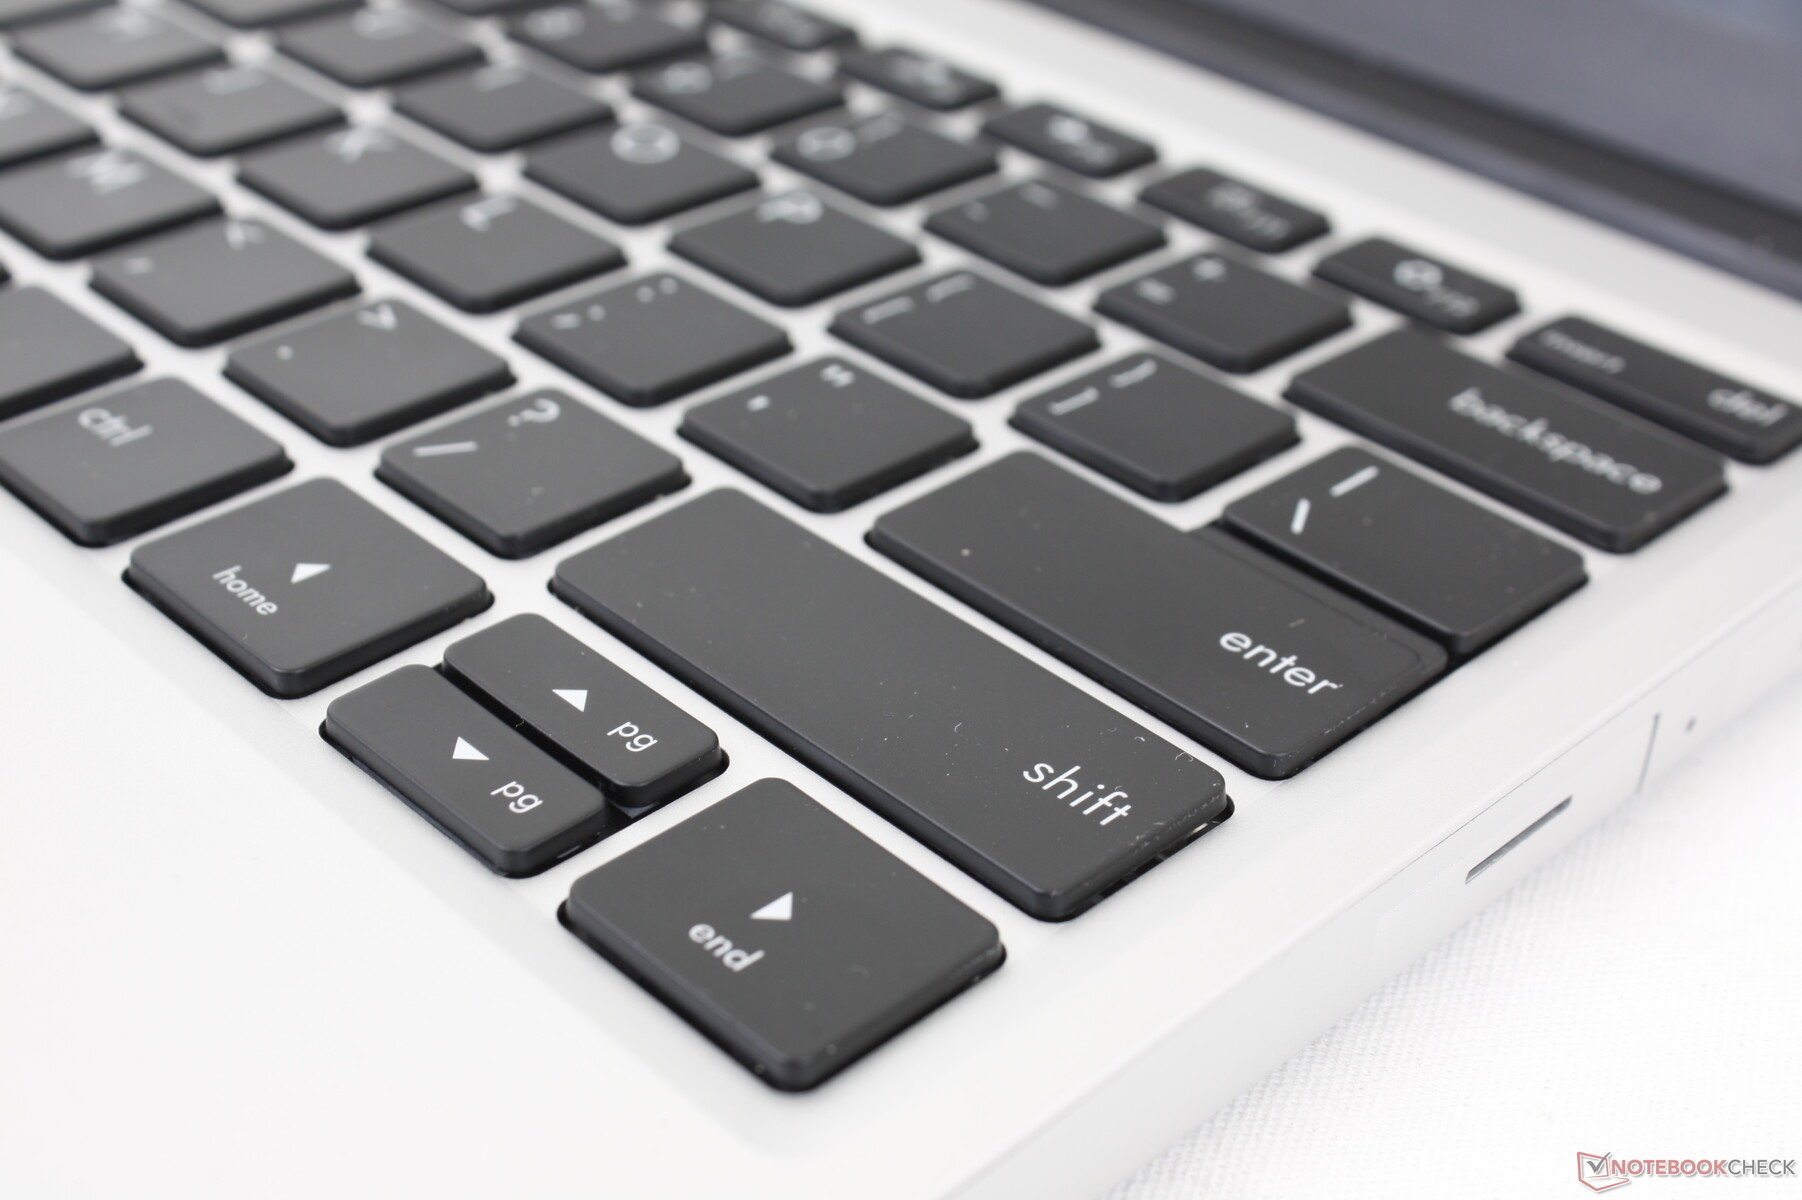
Toetsenbord
De toets feedback komt dicht in de buurt van wat HP biedt op zijn EliteBook of Spectre laptops, die toevallig een aantal van onze favoriete toetsenborden hebben. Zowel de feedback als de travel zijn respectievelijk steviger en dieper dan op de meeste andere Ultrabooks zoals de Asus ZenBook
We zouden graag speciale, door de gebruiker programmeerbare of aanpasbare toetsen zien, wat goed zou passen bij een laptop die zo gericht is op aanpassing door de gebruiker.
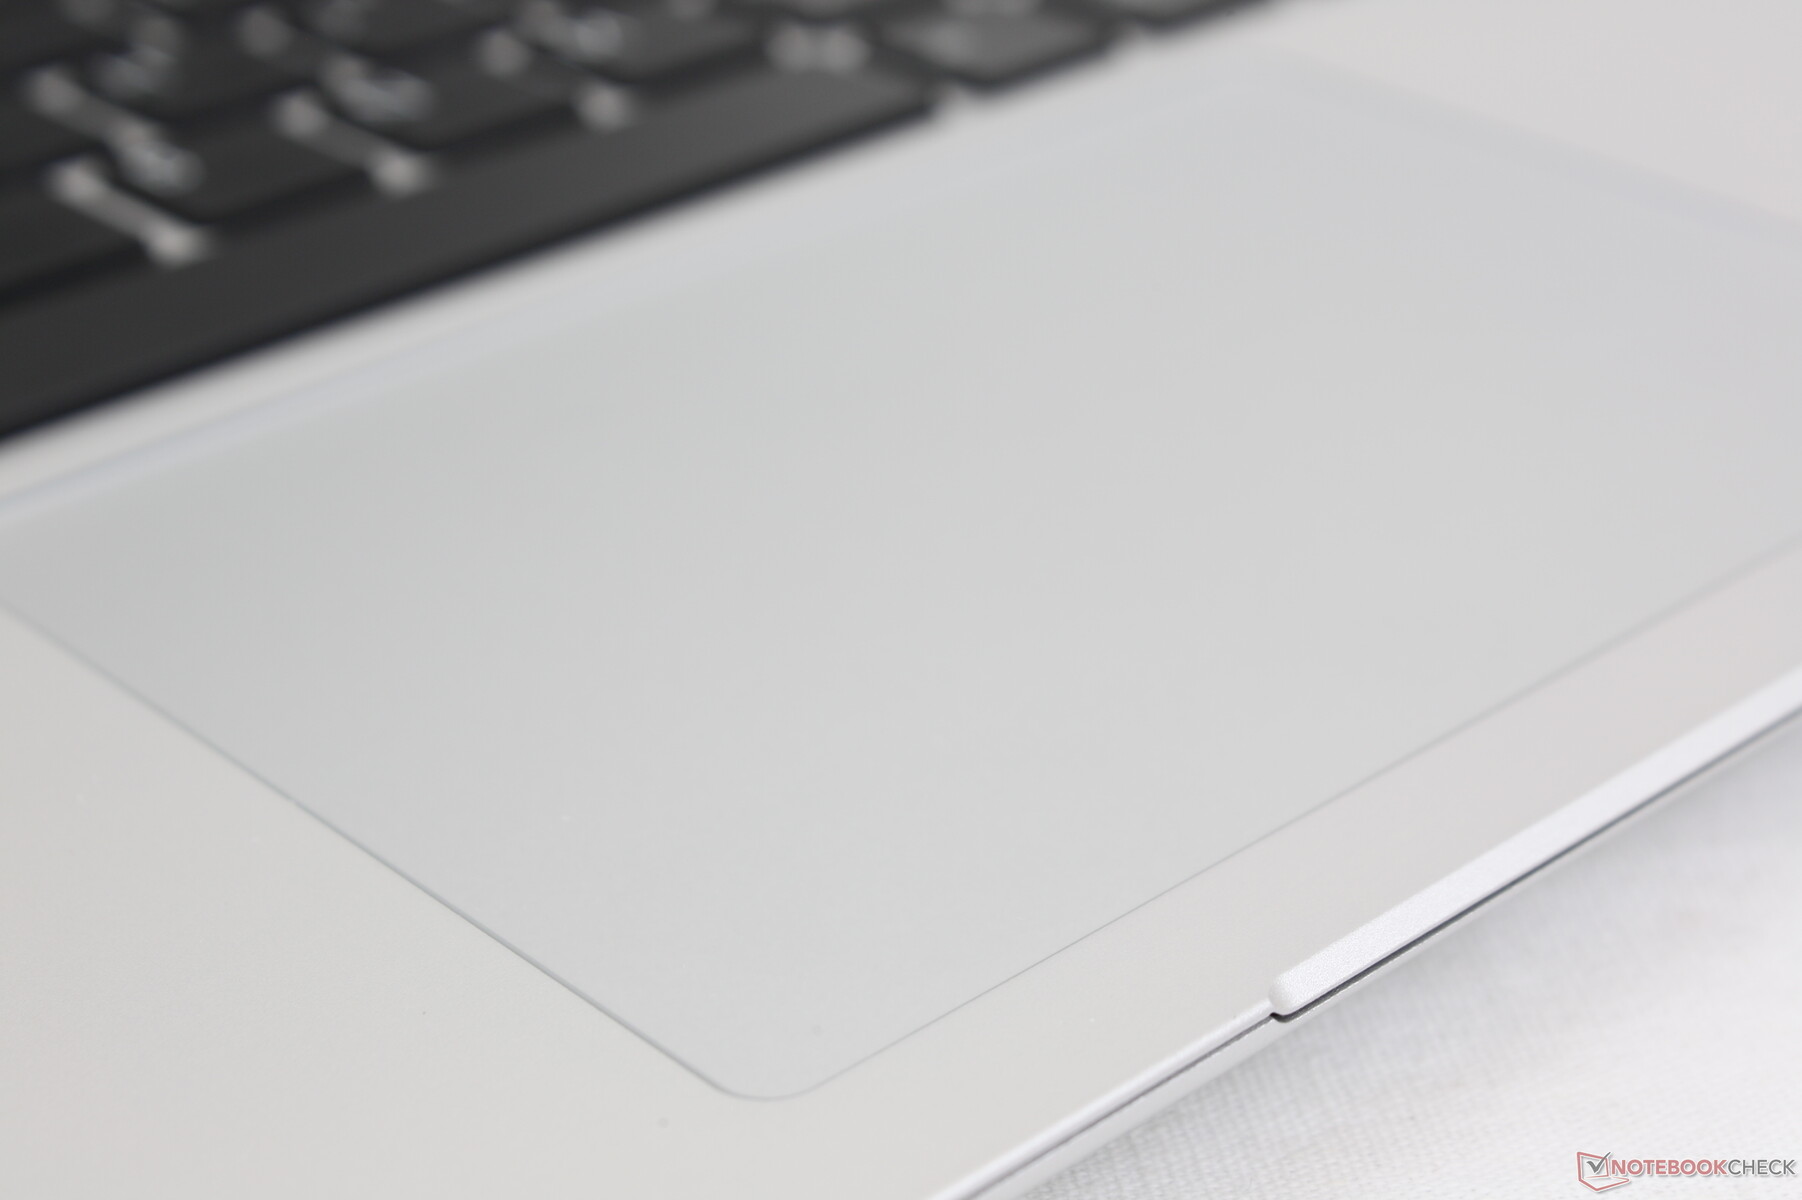
Touchpad
Het Precision-compatibele clickpad is even groot als het clickpad op de Surface Laptop 3 (11,5 x 7,6 cm). Anders dan op het Microsoft-model is het Framework clickpad echter luider wanneer het wordt ingedrukt en is de feedback iets zachter.

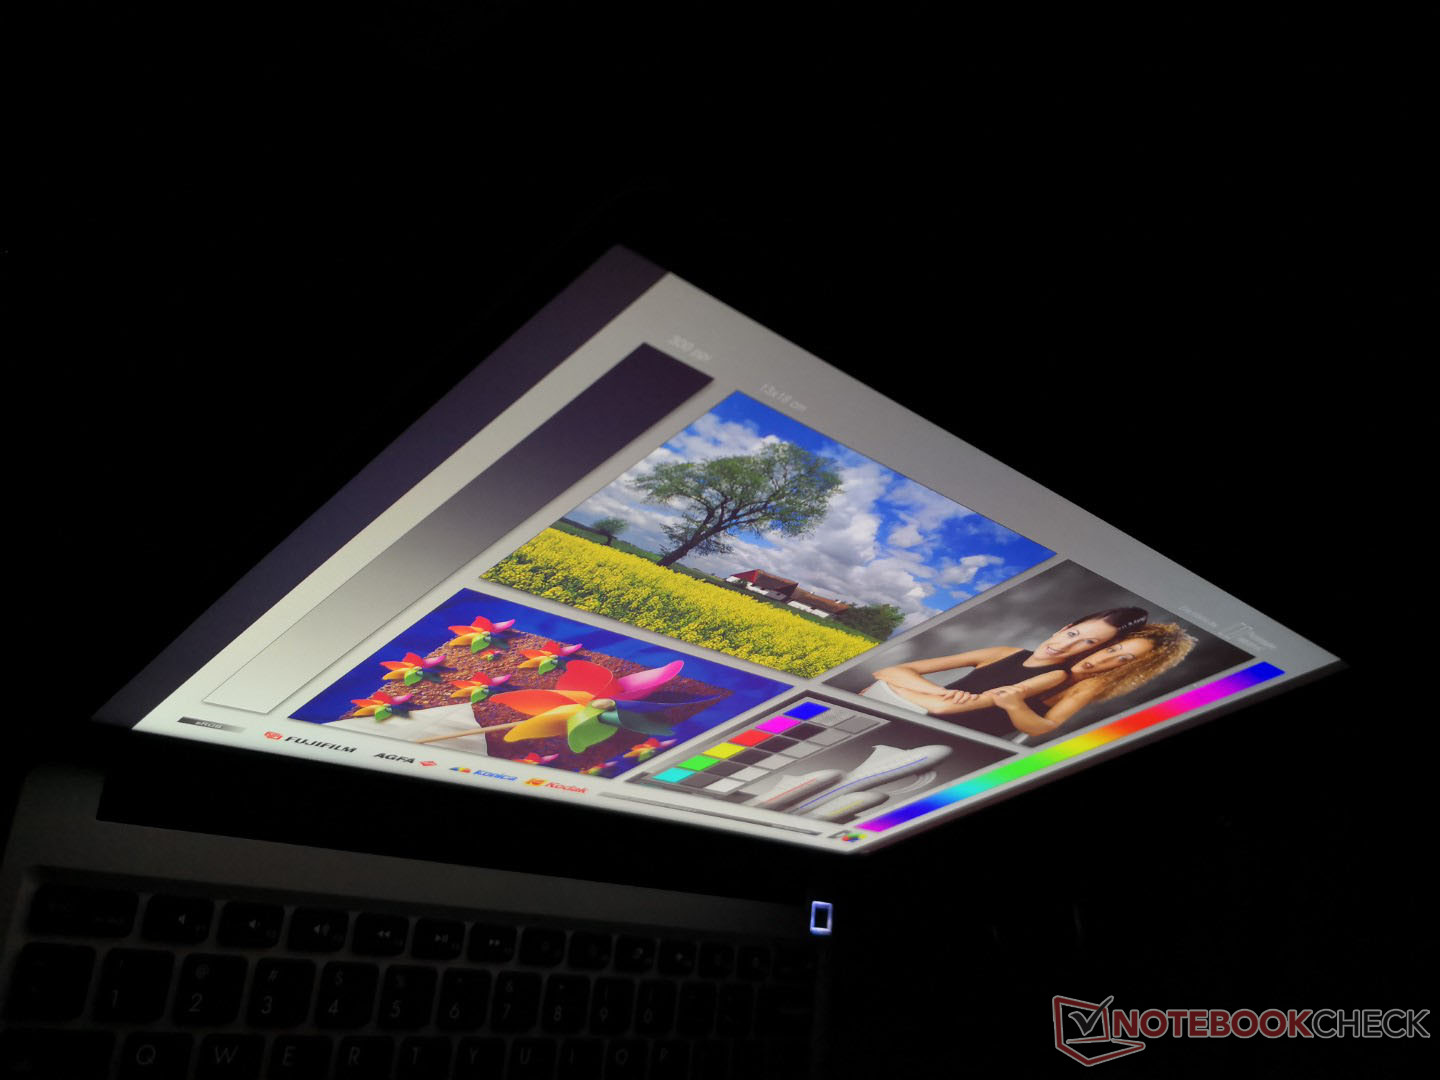
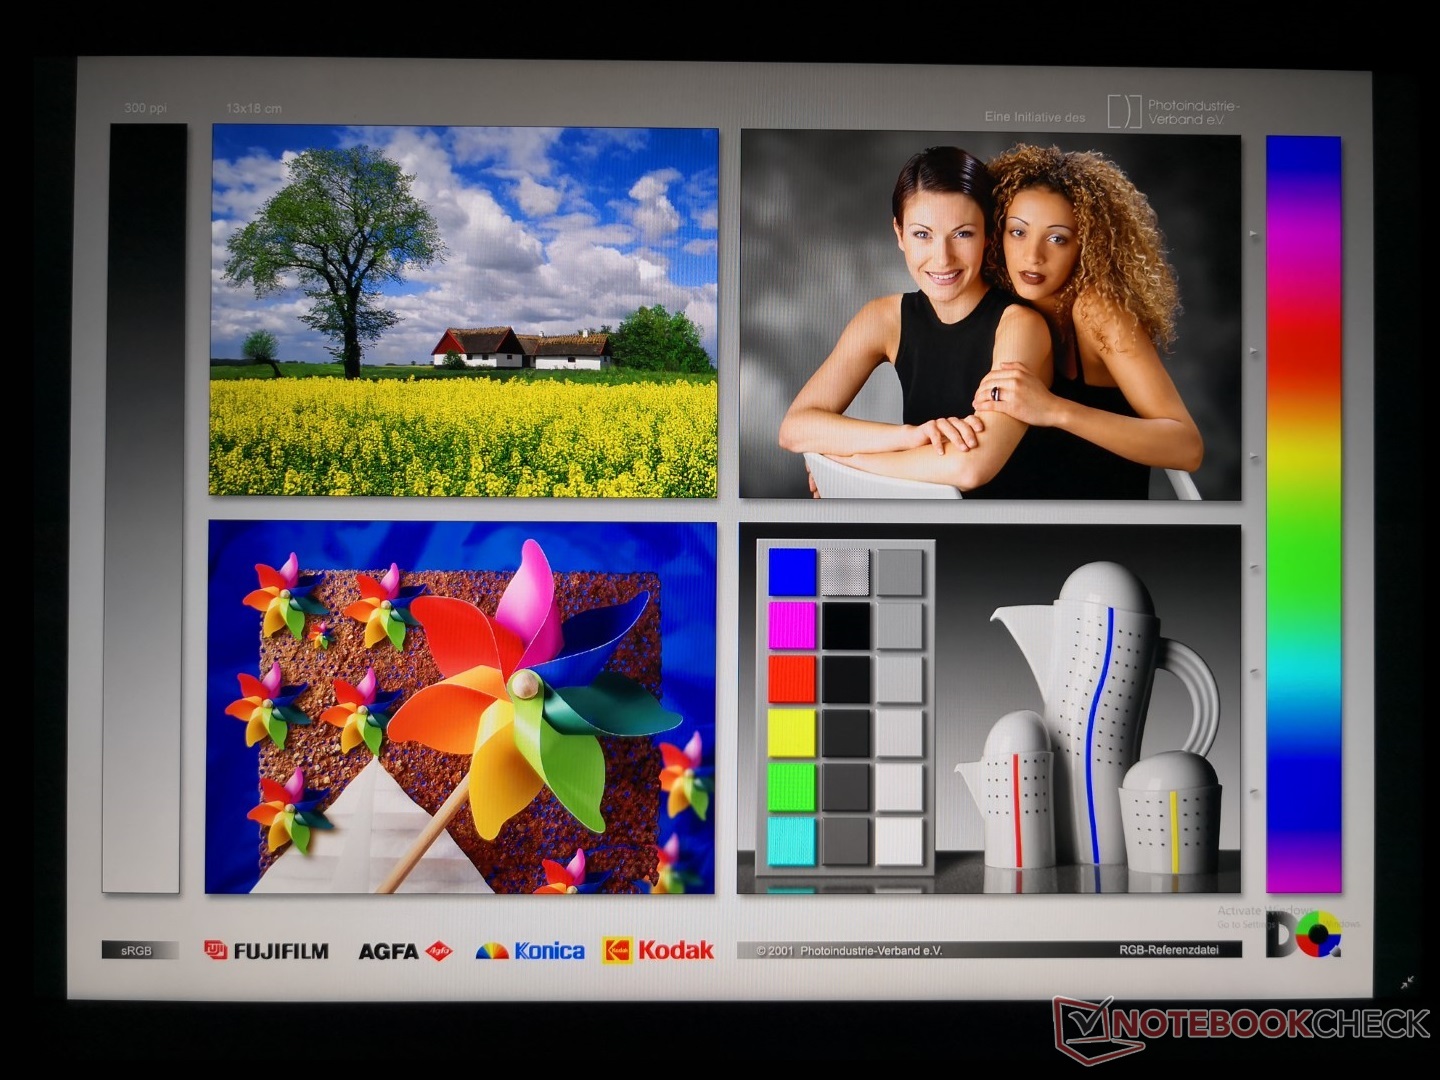
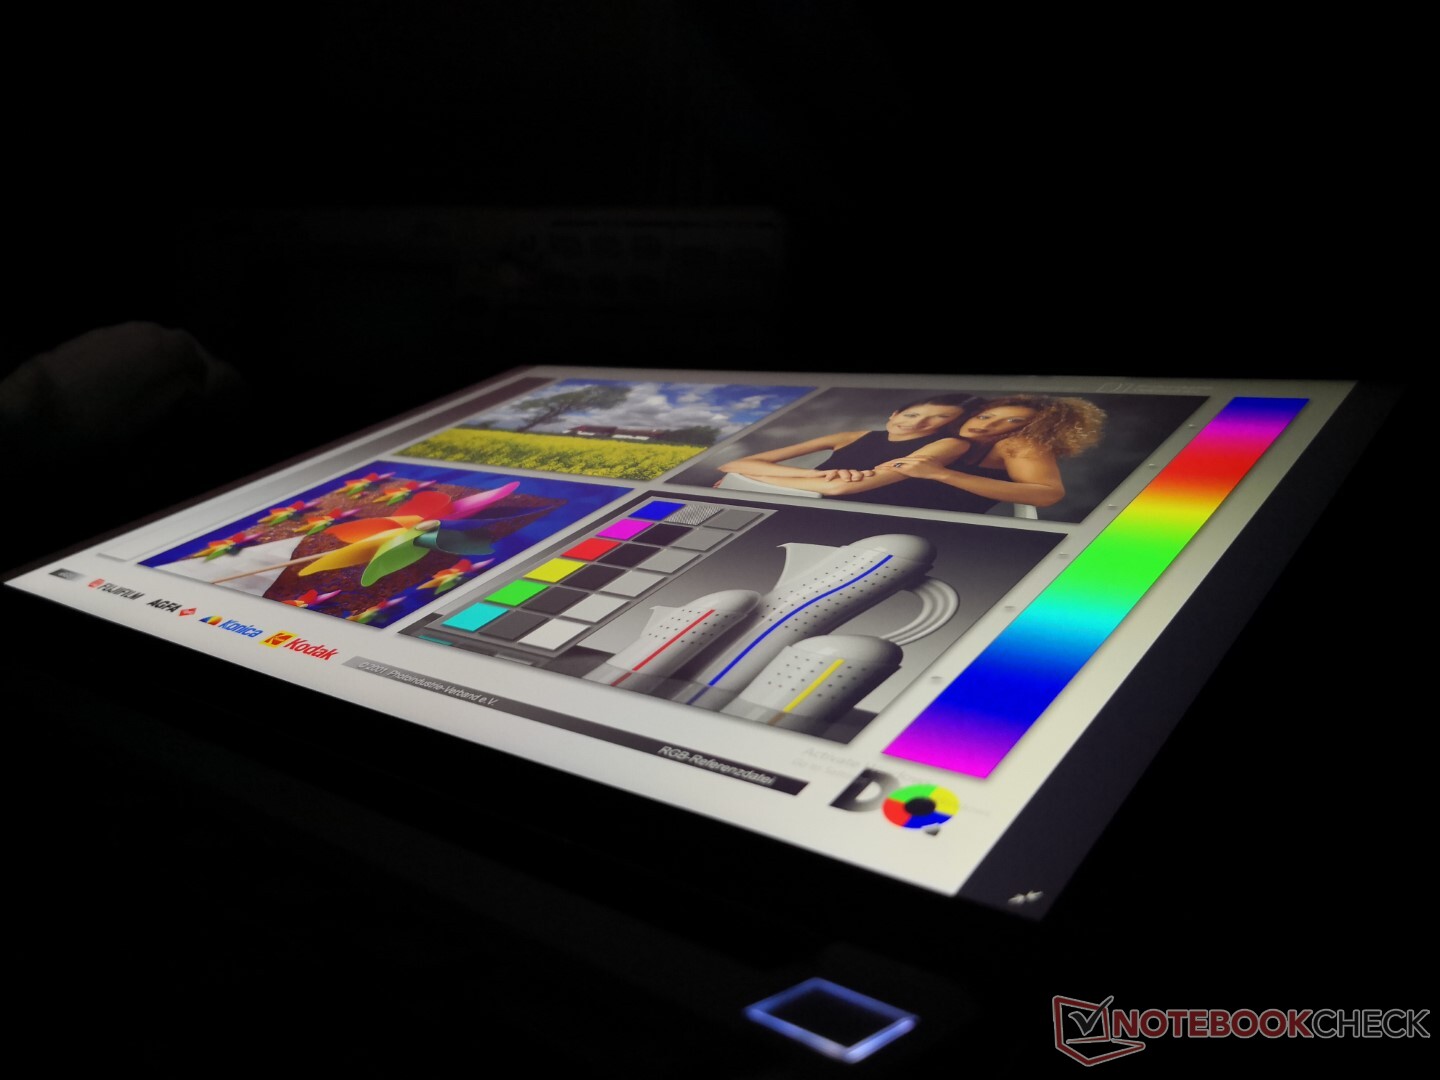
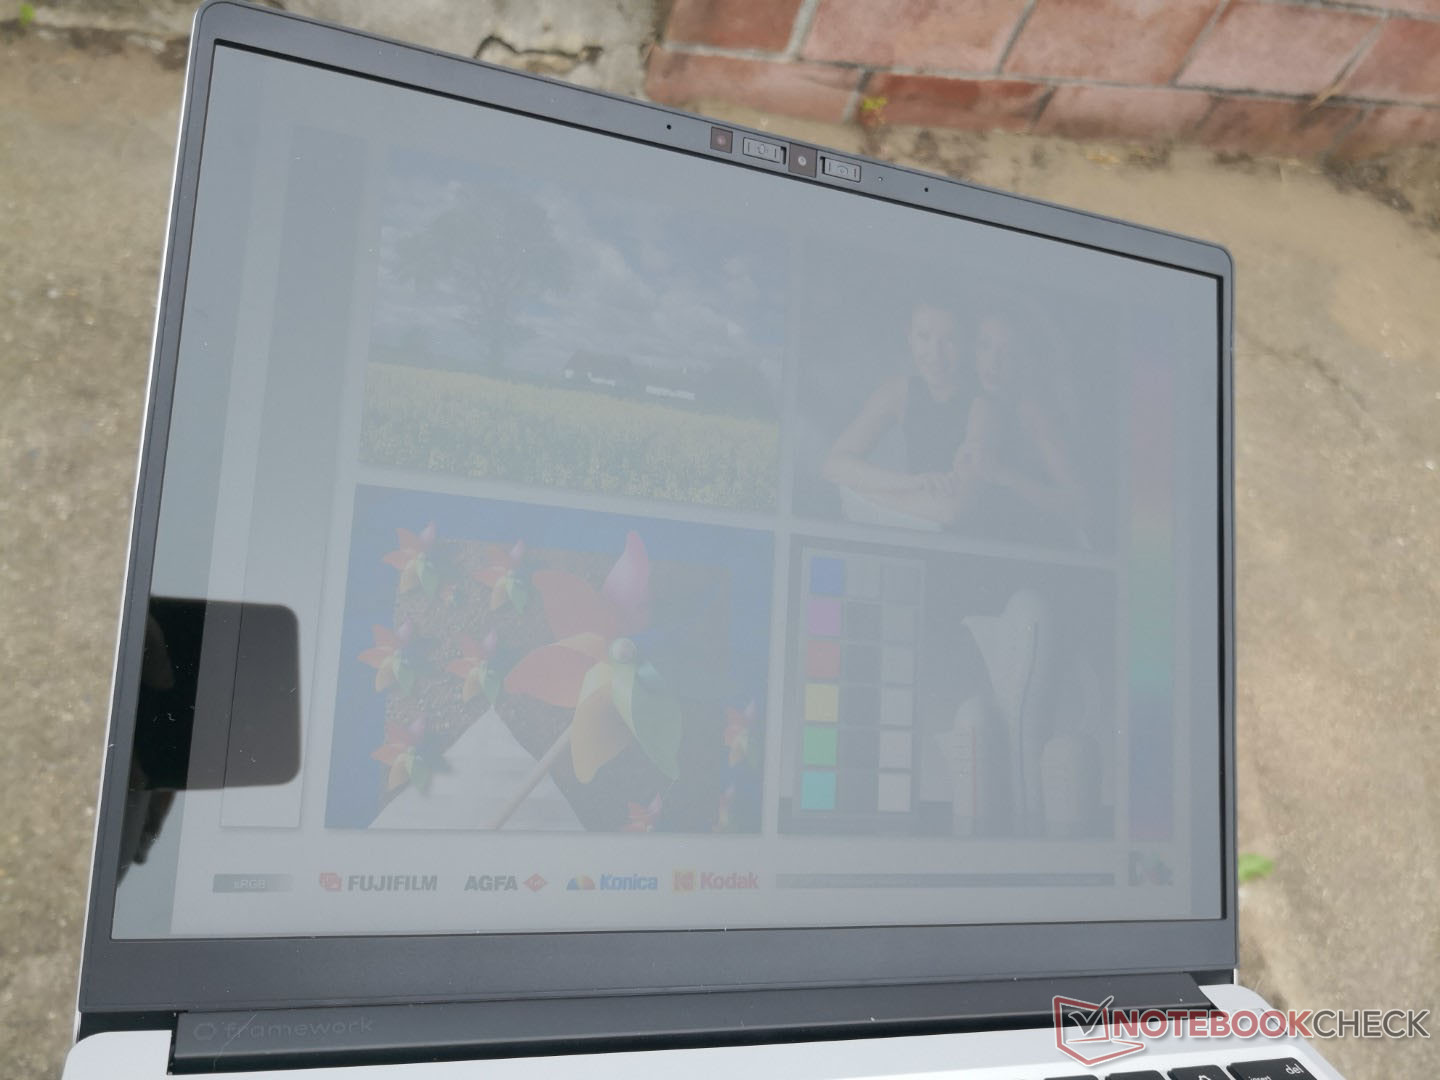
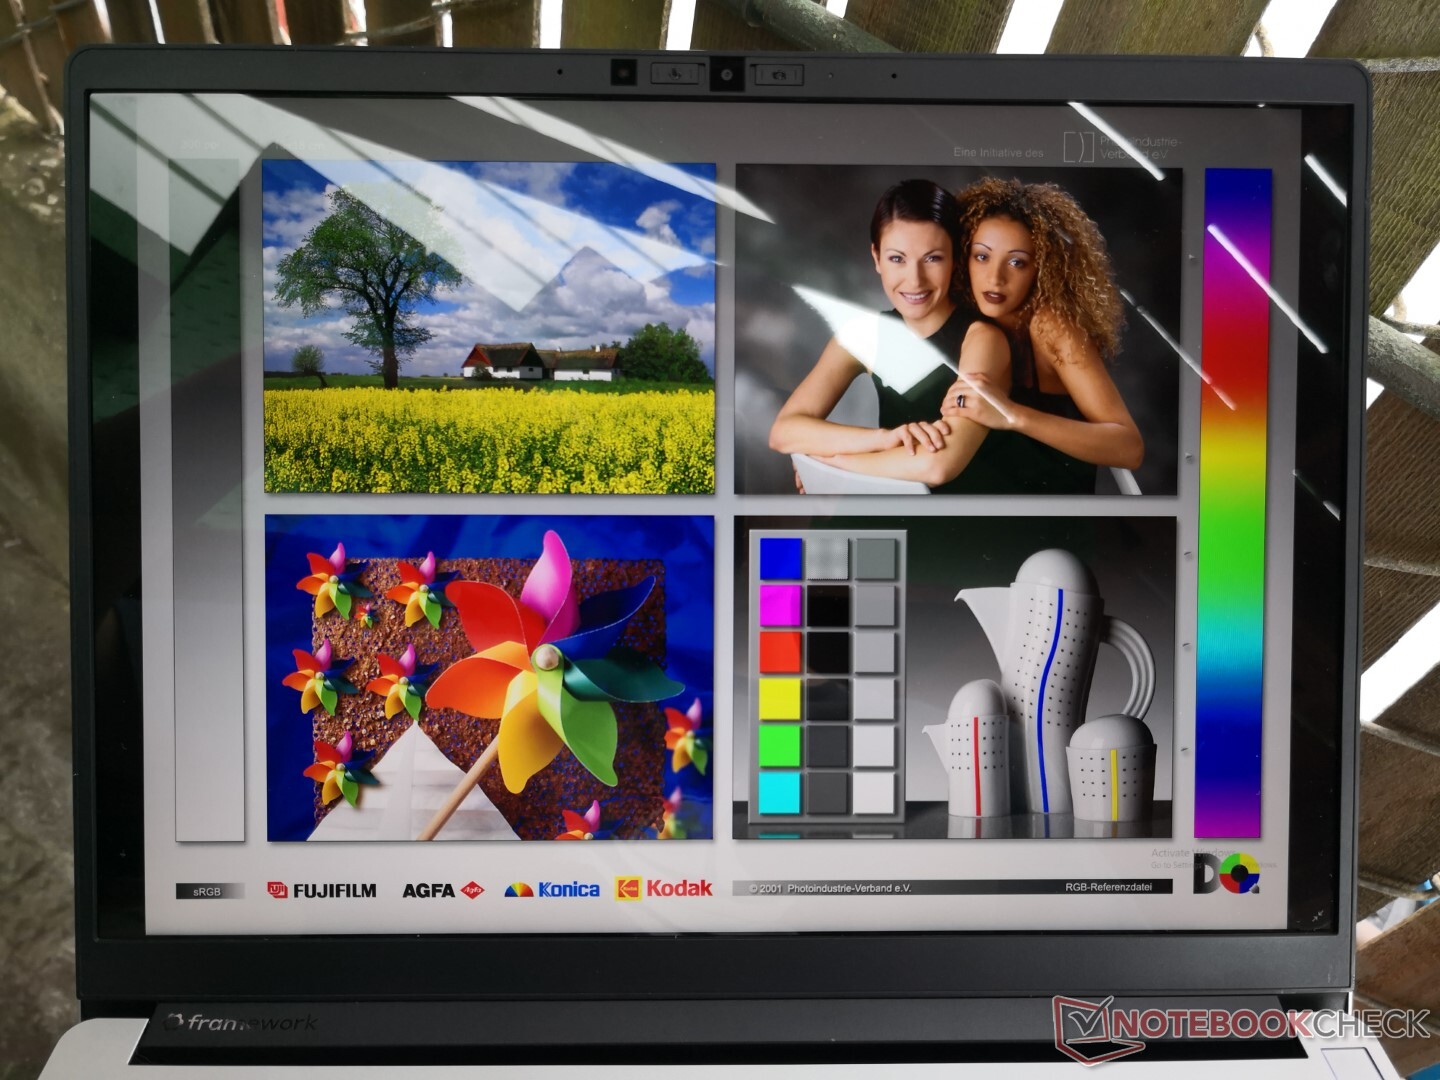
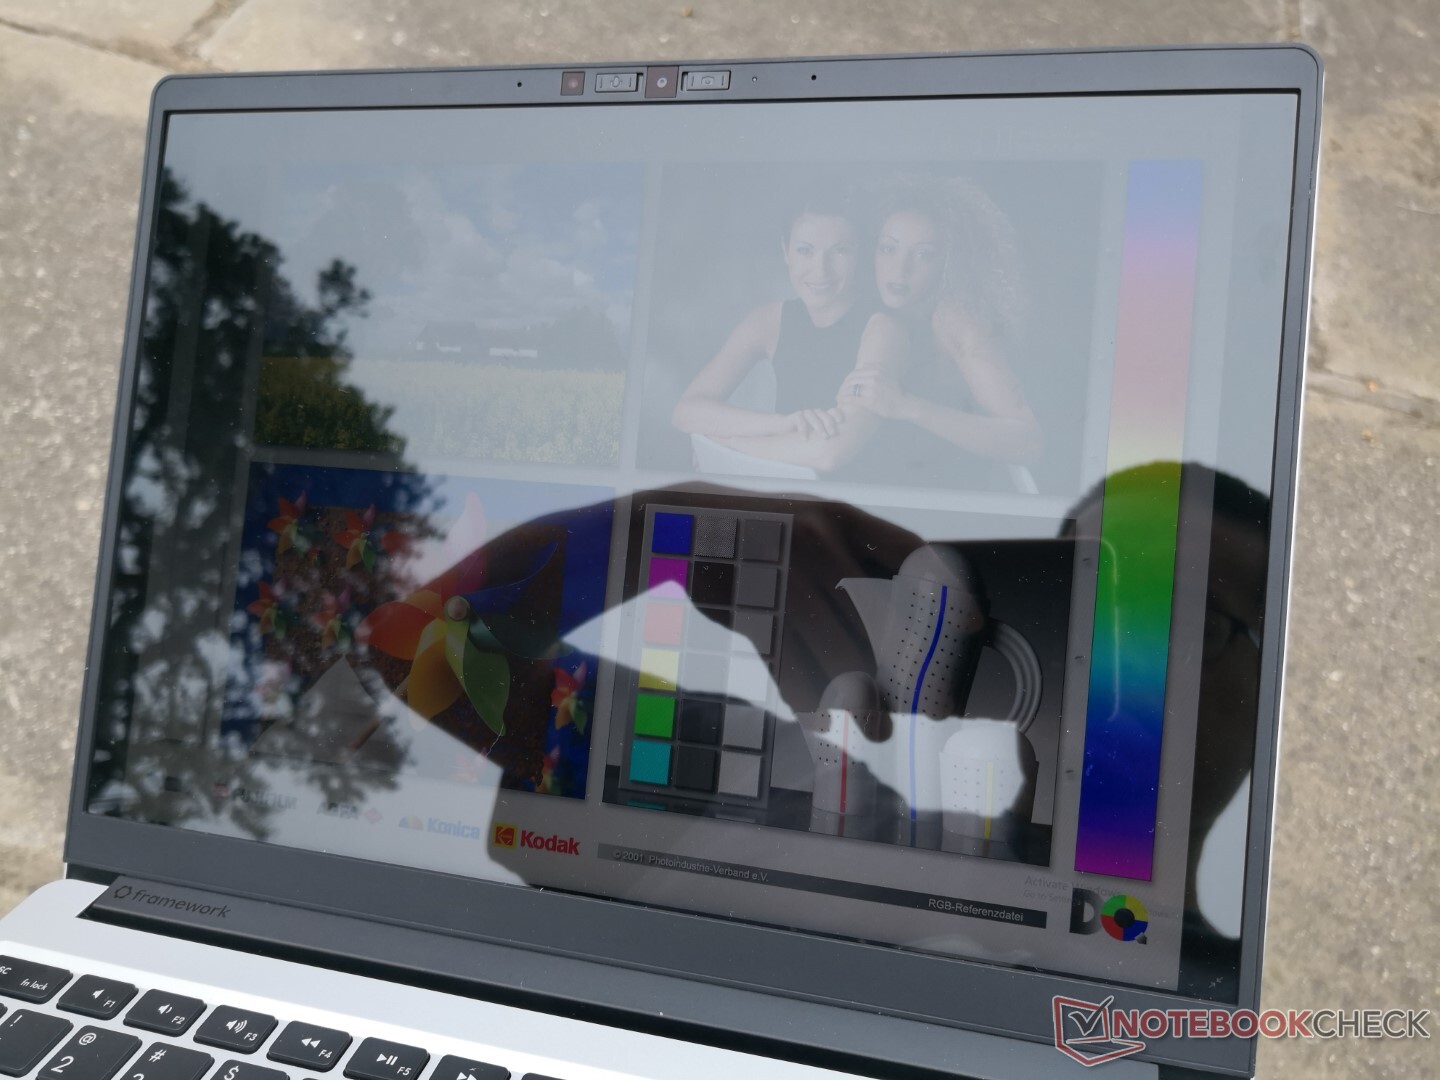
Weergave
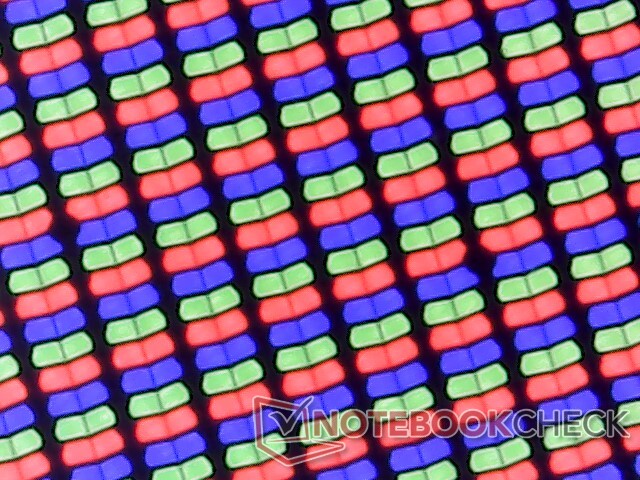
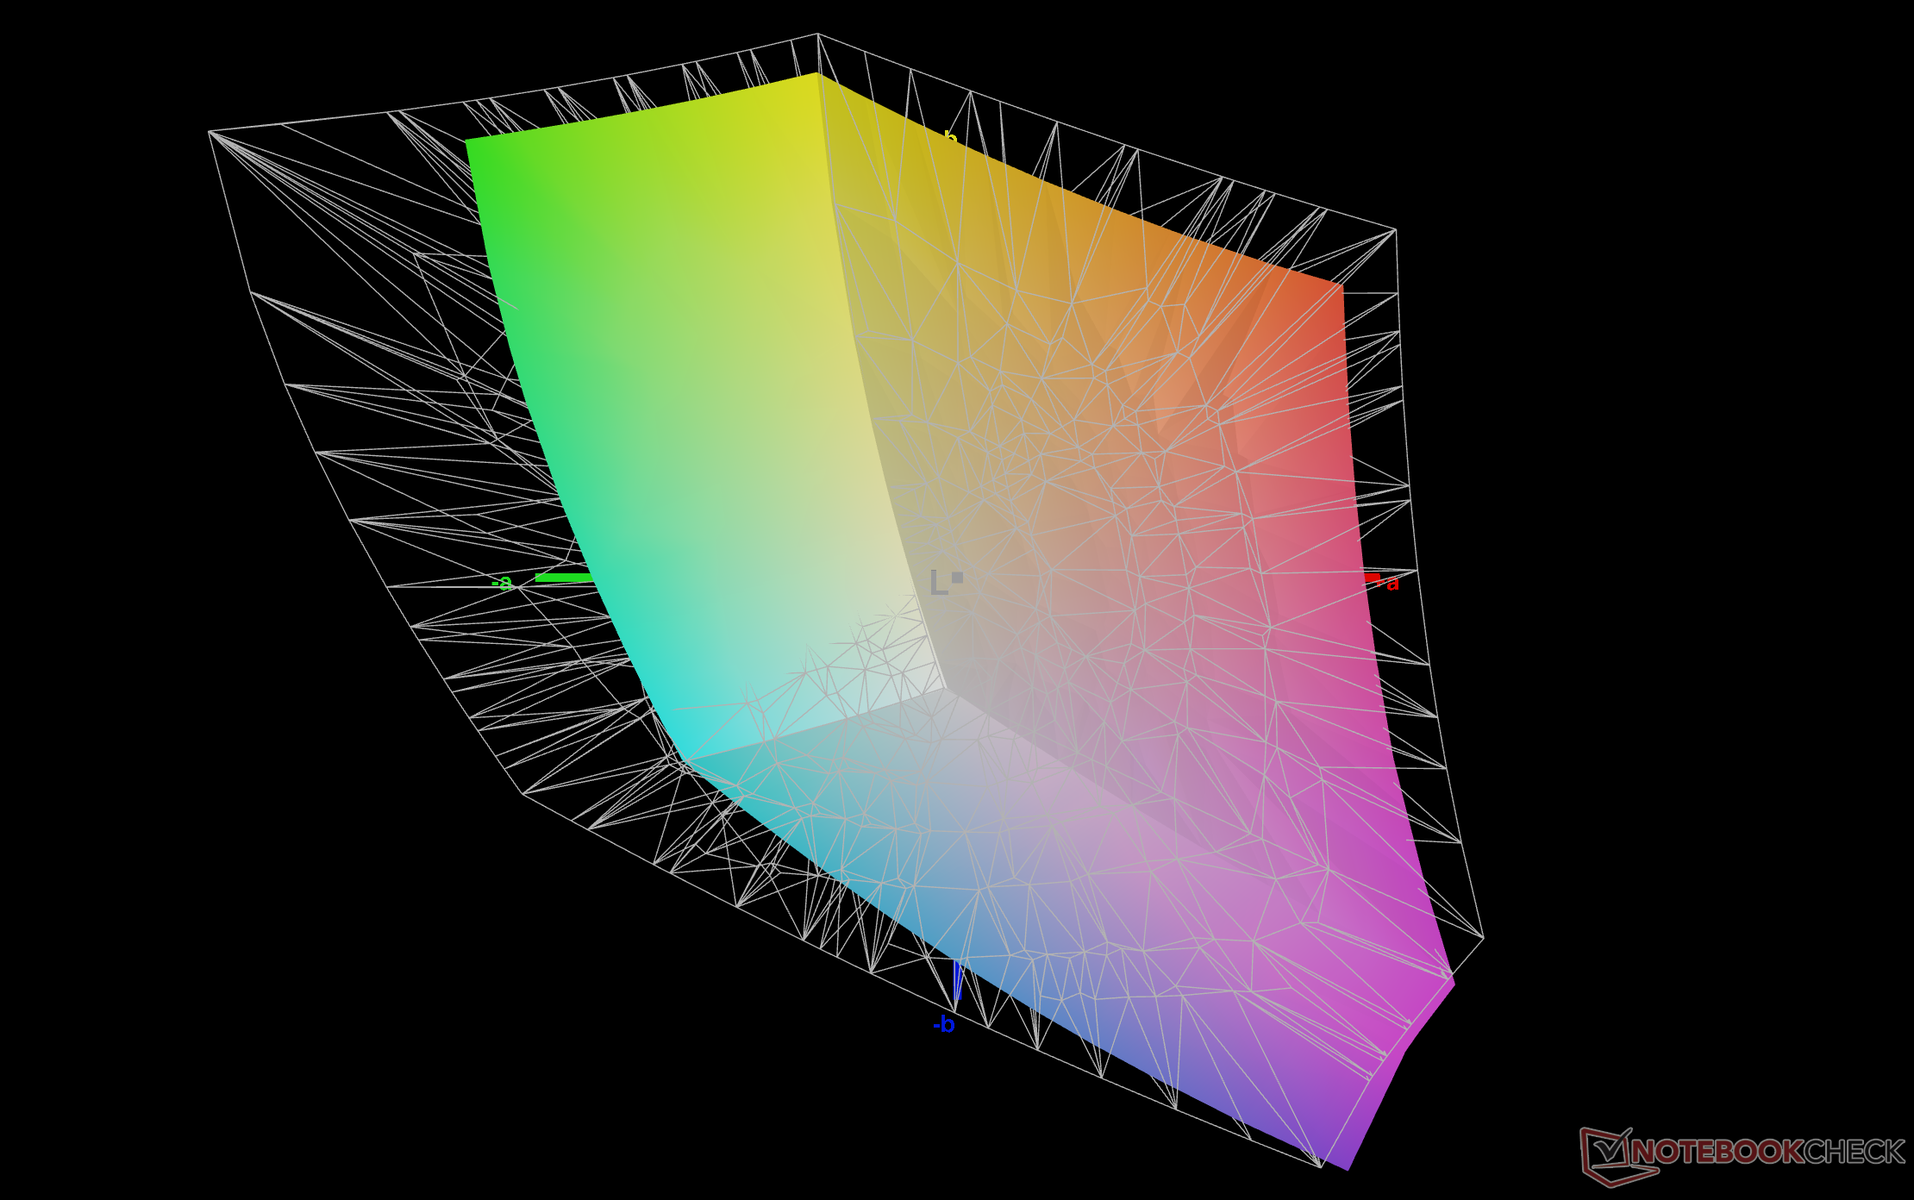
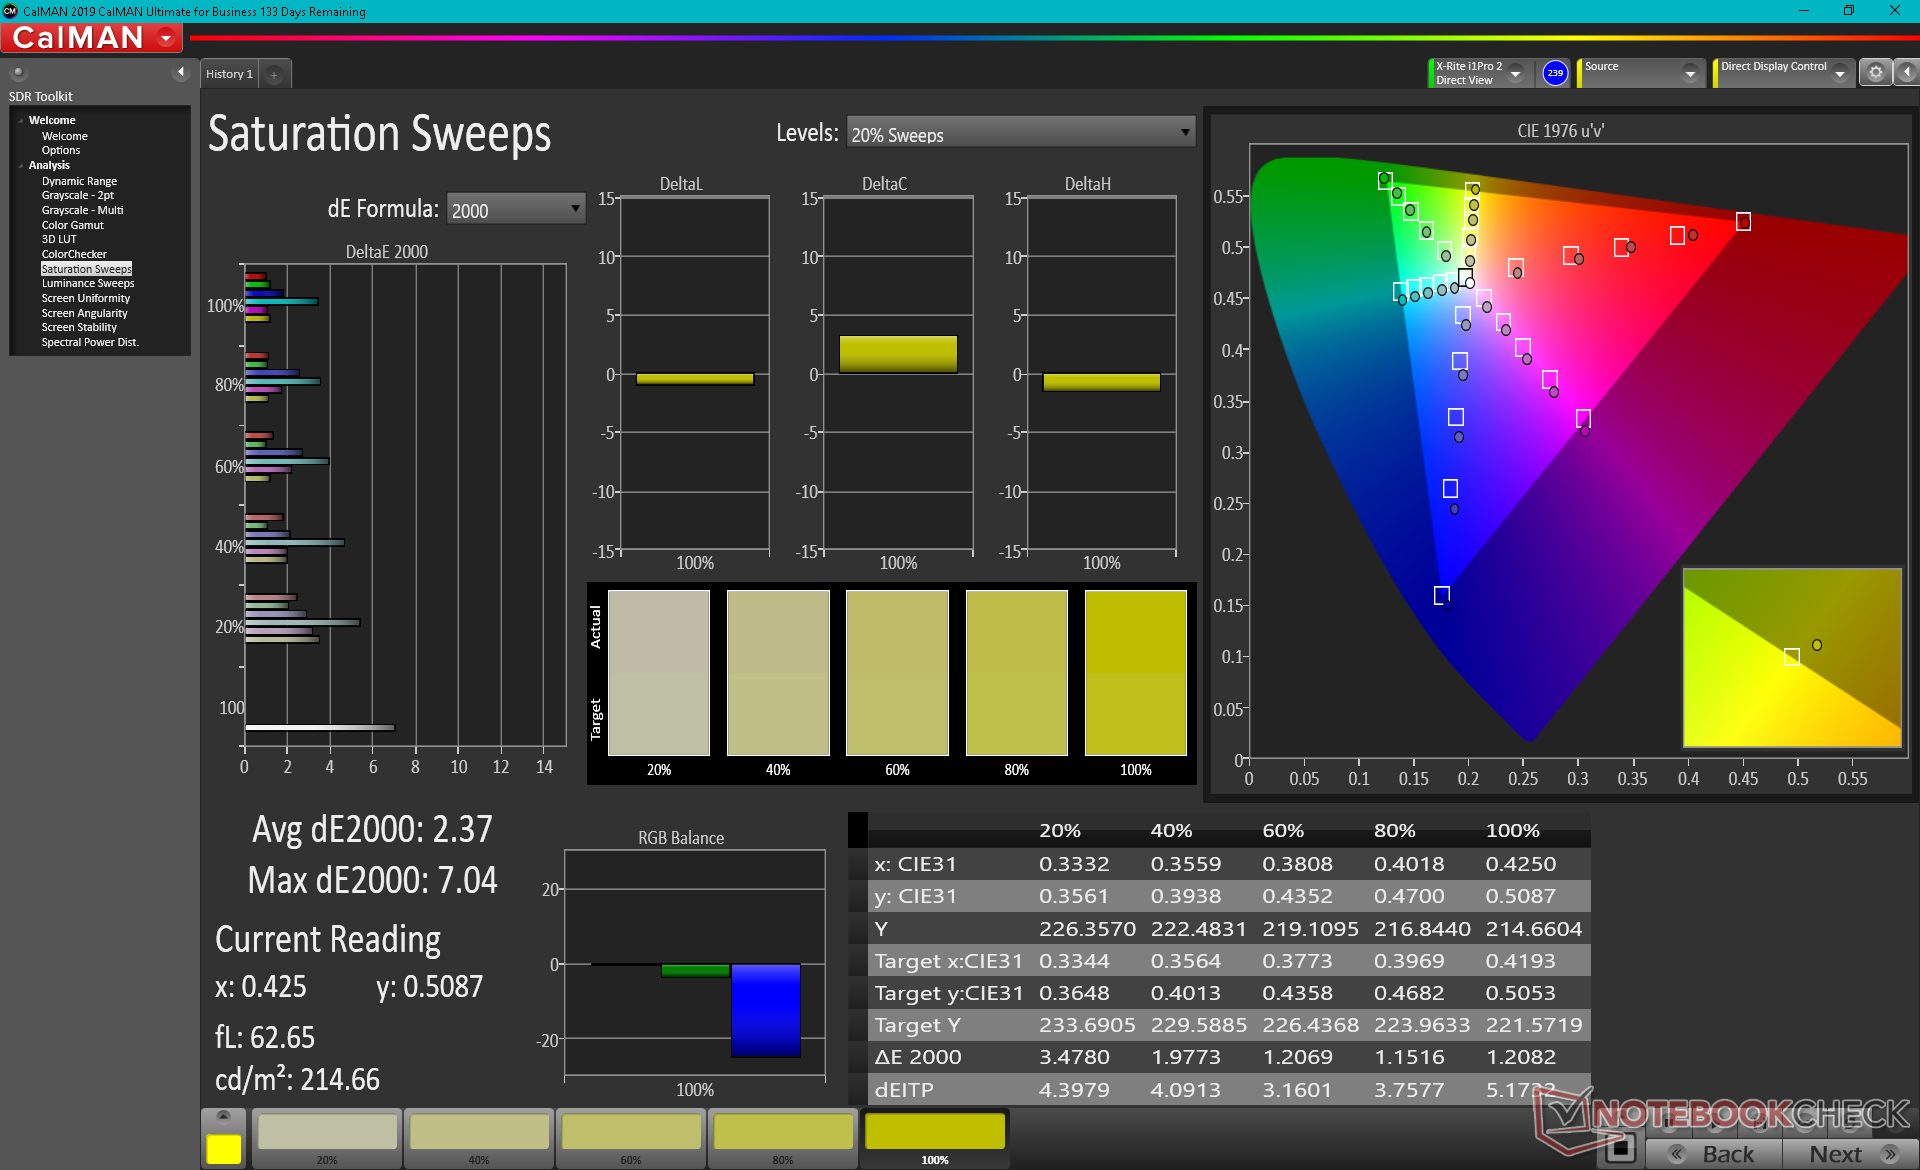
Framework gebruikt exact hetzelfde 13,5-inch BOE NE135FBM-N41 IPS-paneel voor zijn laptop als gevonden op de Acer Swift 3 SF313. Deze twee modellen delen dus vergelijkbare kenmerken, waaronder de brede kleurdekking en de relatief hoge contrast ratio. De responstijden zijn echter traag, wat betekent dat gebruikers veel last zullen hebben van ghosting en onscherpte tijdens het gamen. De trage responstijden zijn verder geen probleem voor kantoorwerk.
| |||||||||||||||||||||||||
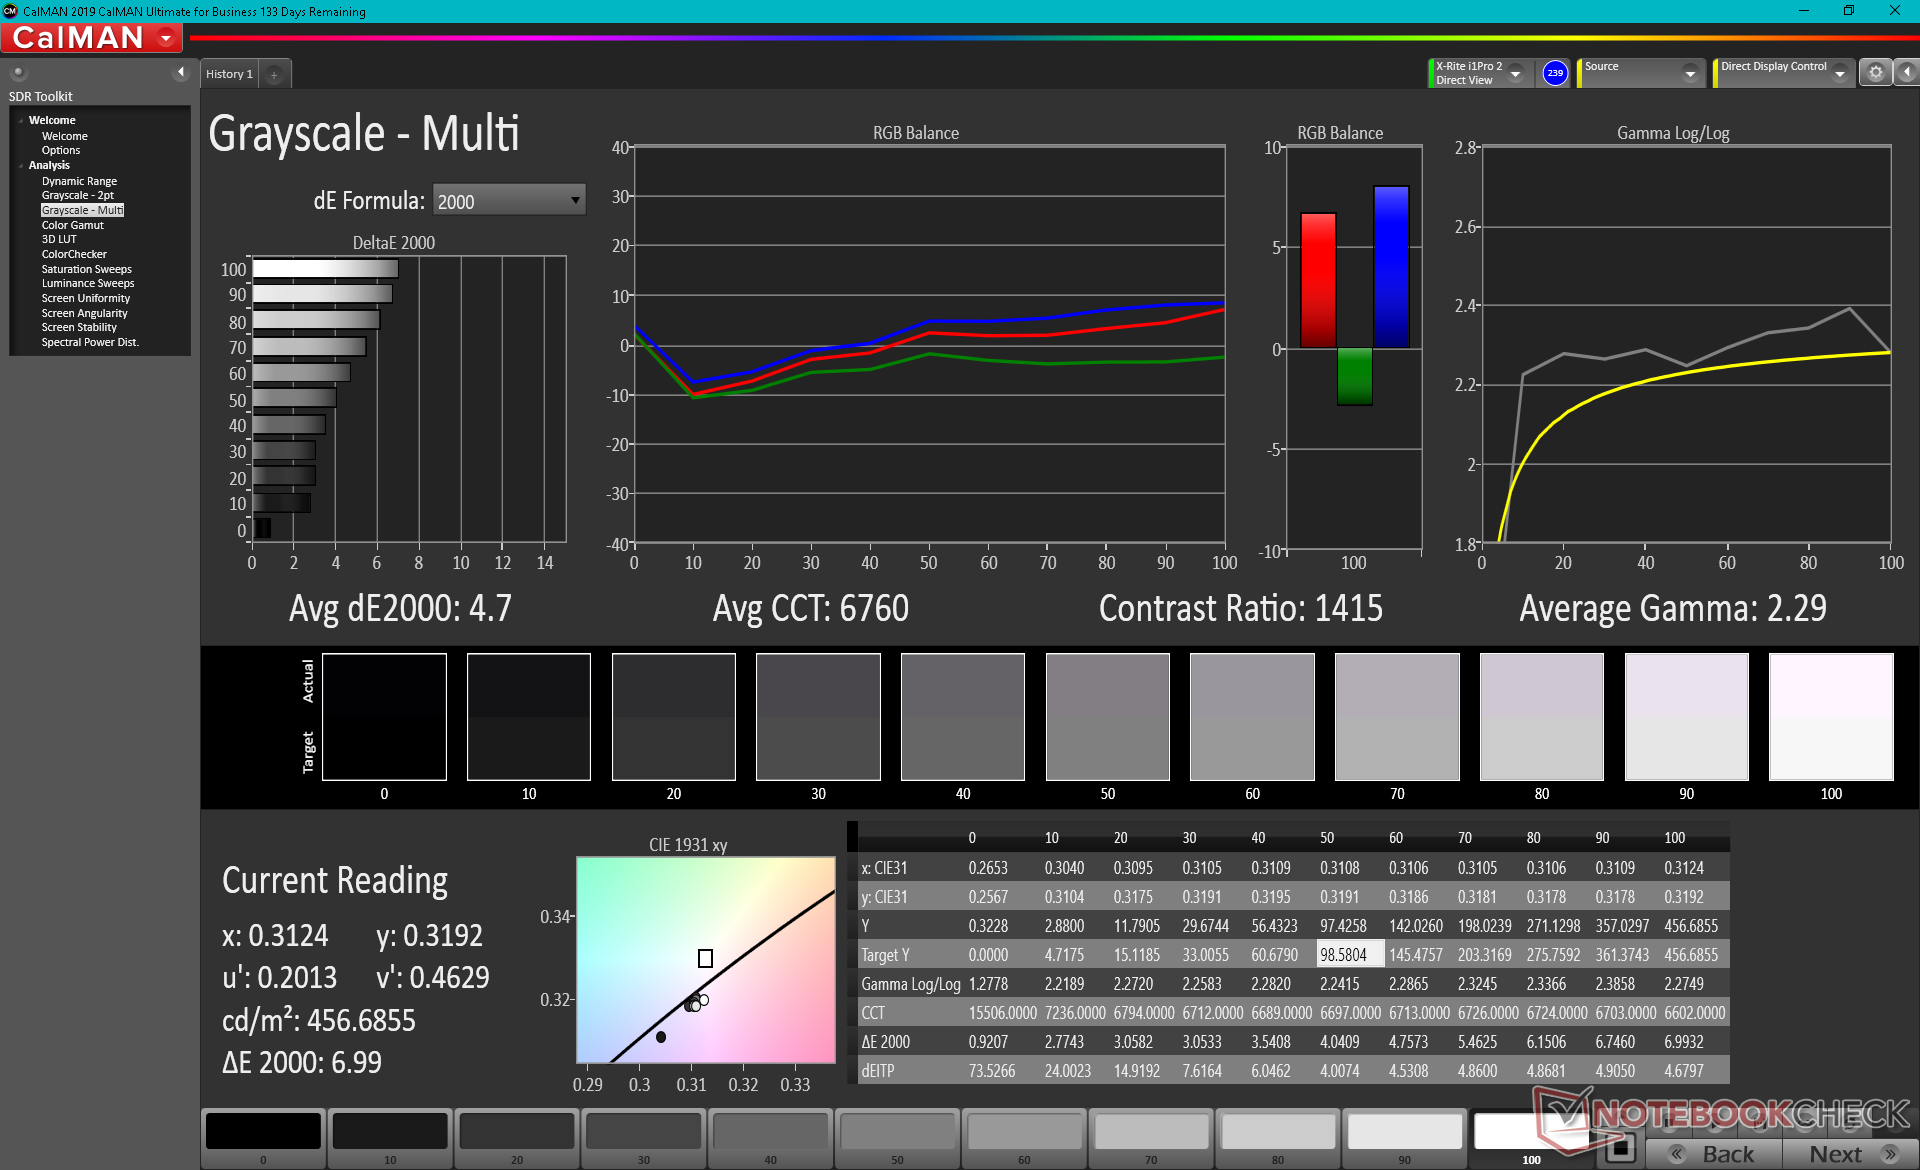
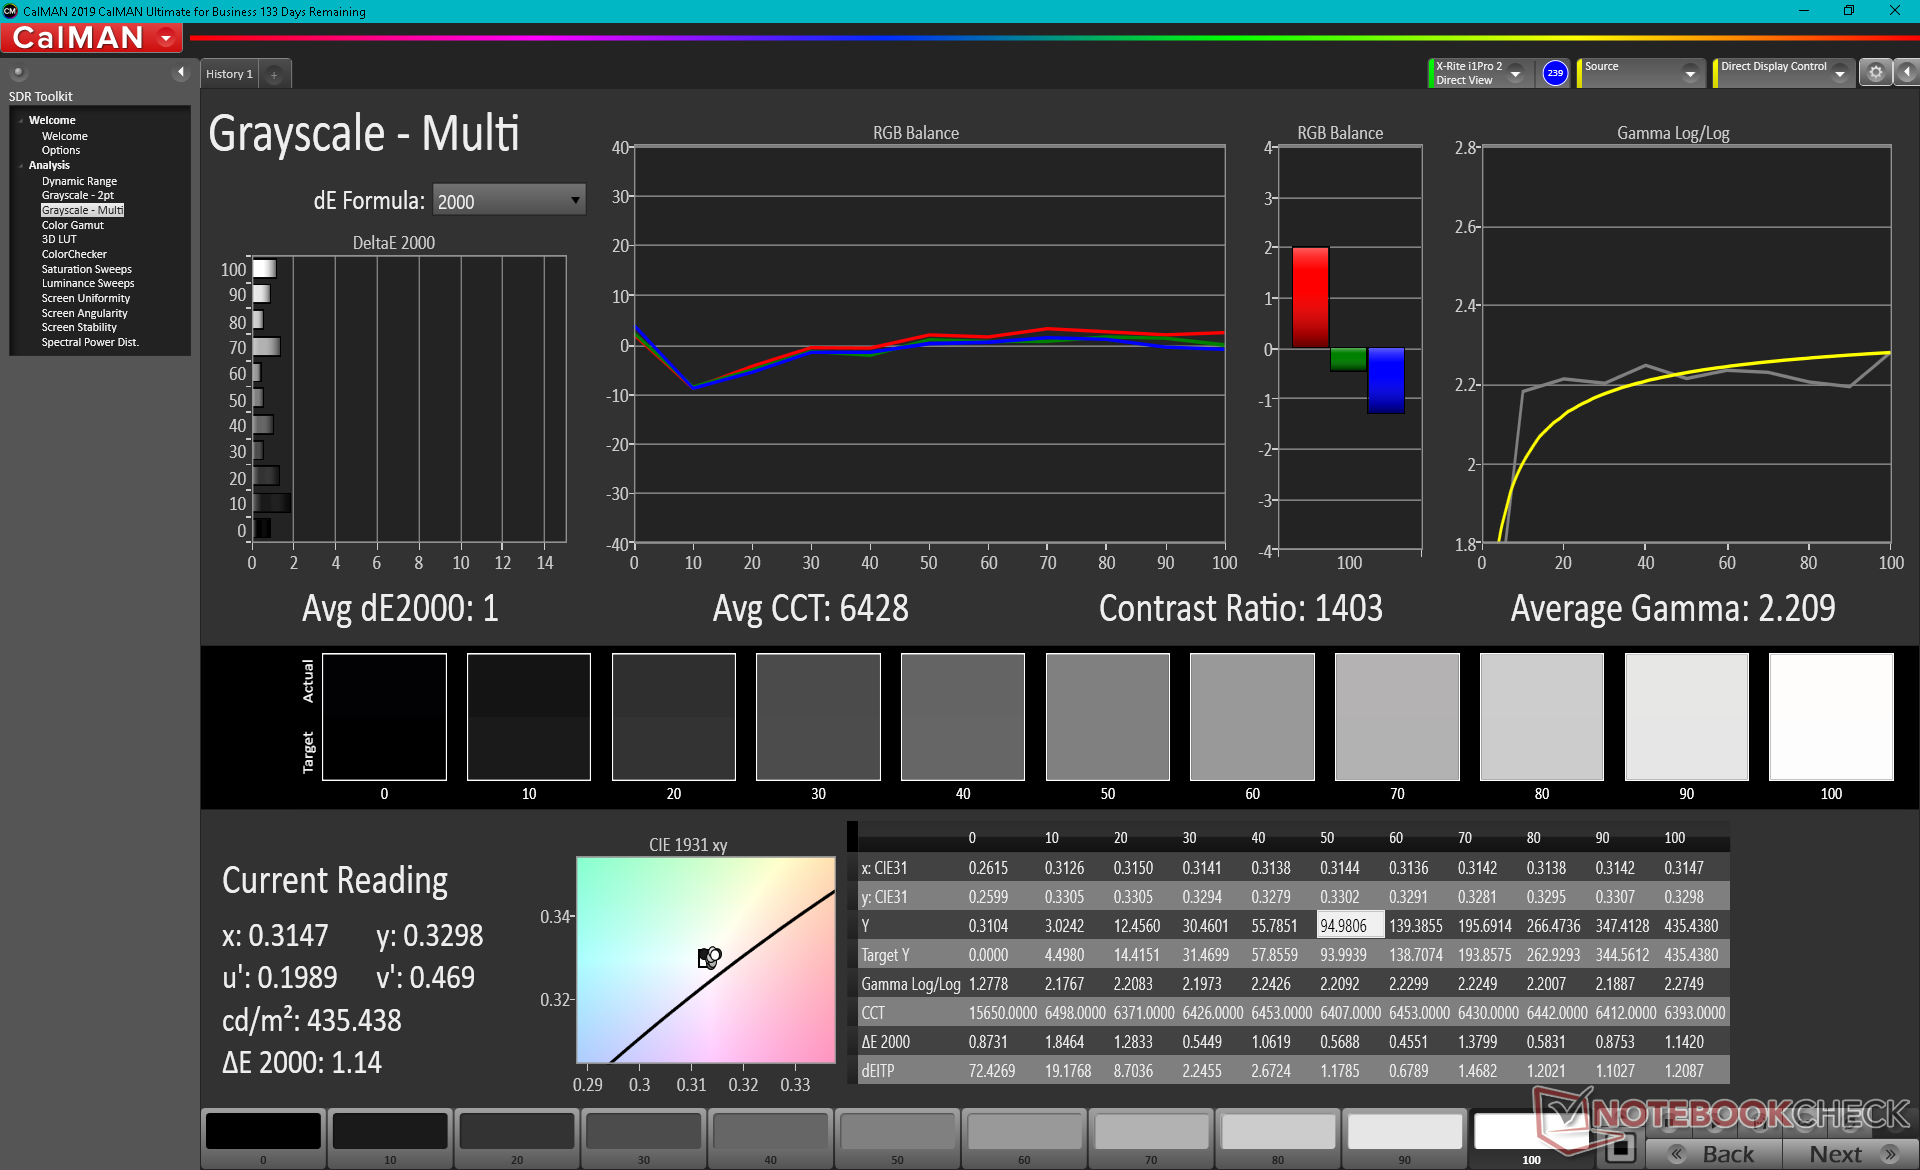
Helderheidsverdeling: 93 %
Helderheid in Batterij-modus: 449 cd/m²
Contrast: 1151:1 (Zwart: 0.39 cd/m²)
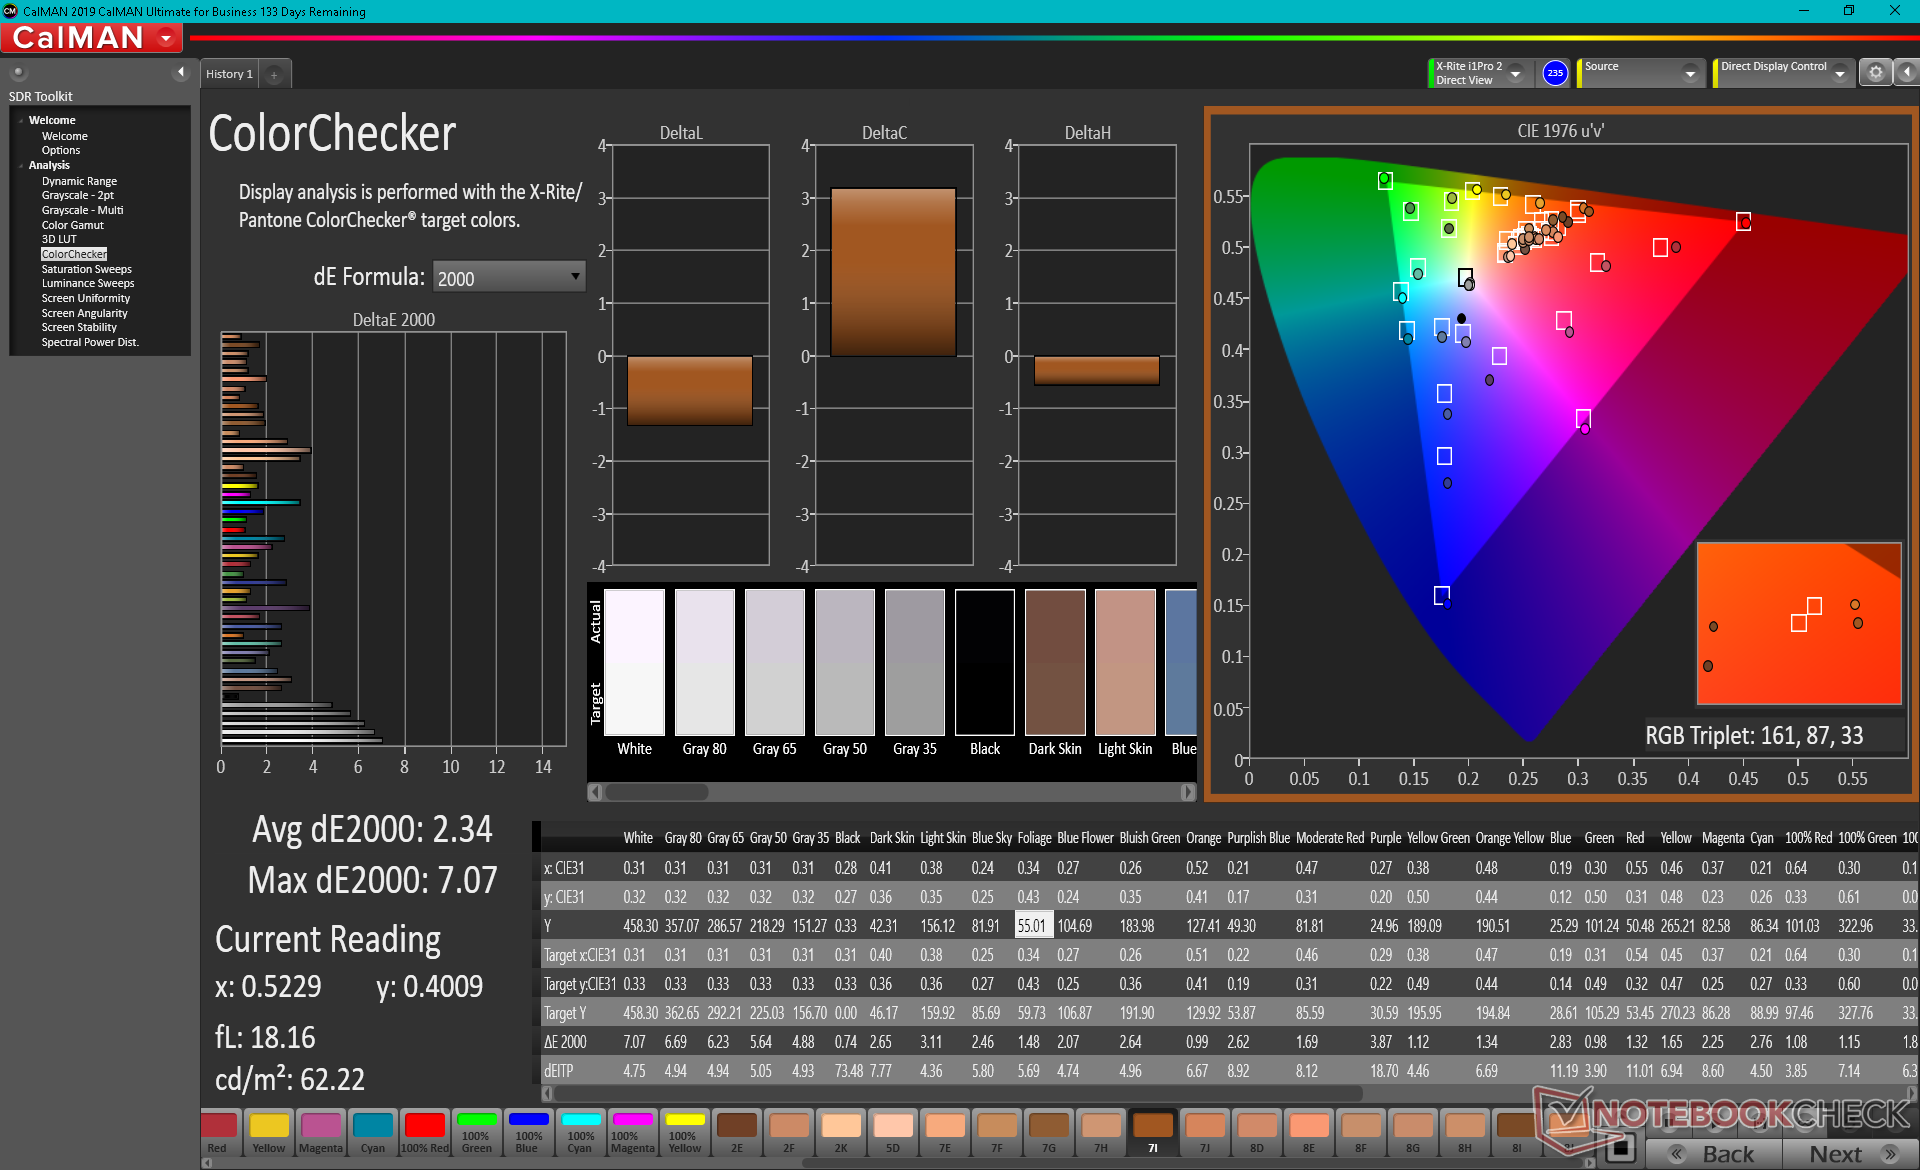
ΔE ColorChecker Calman: 2.34 | ∀{0.5-29.43 Ø4.71}
calibrated: 0.96
ΔE Greyscale Calman: 4.7 | ∀{0.09-98 Ø4.96}
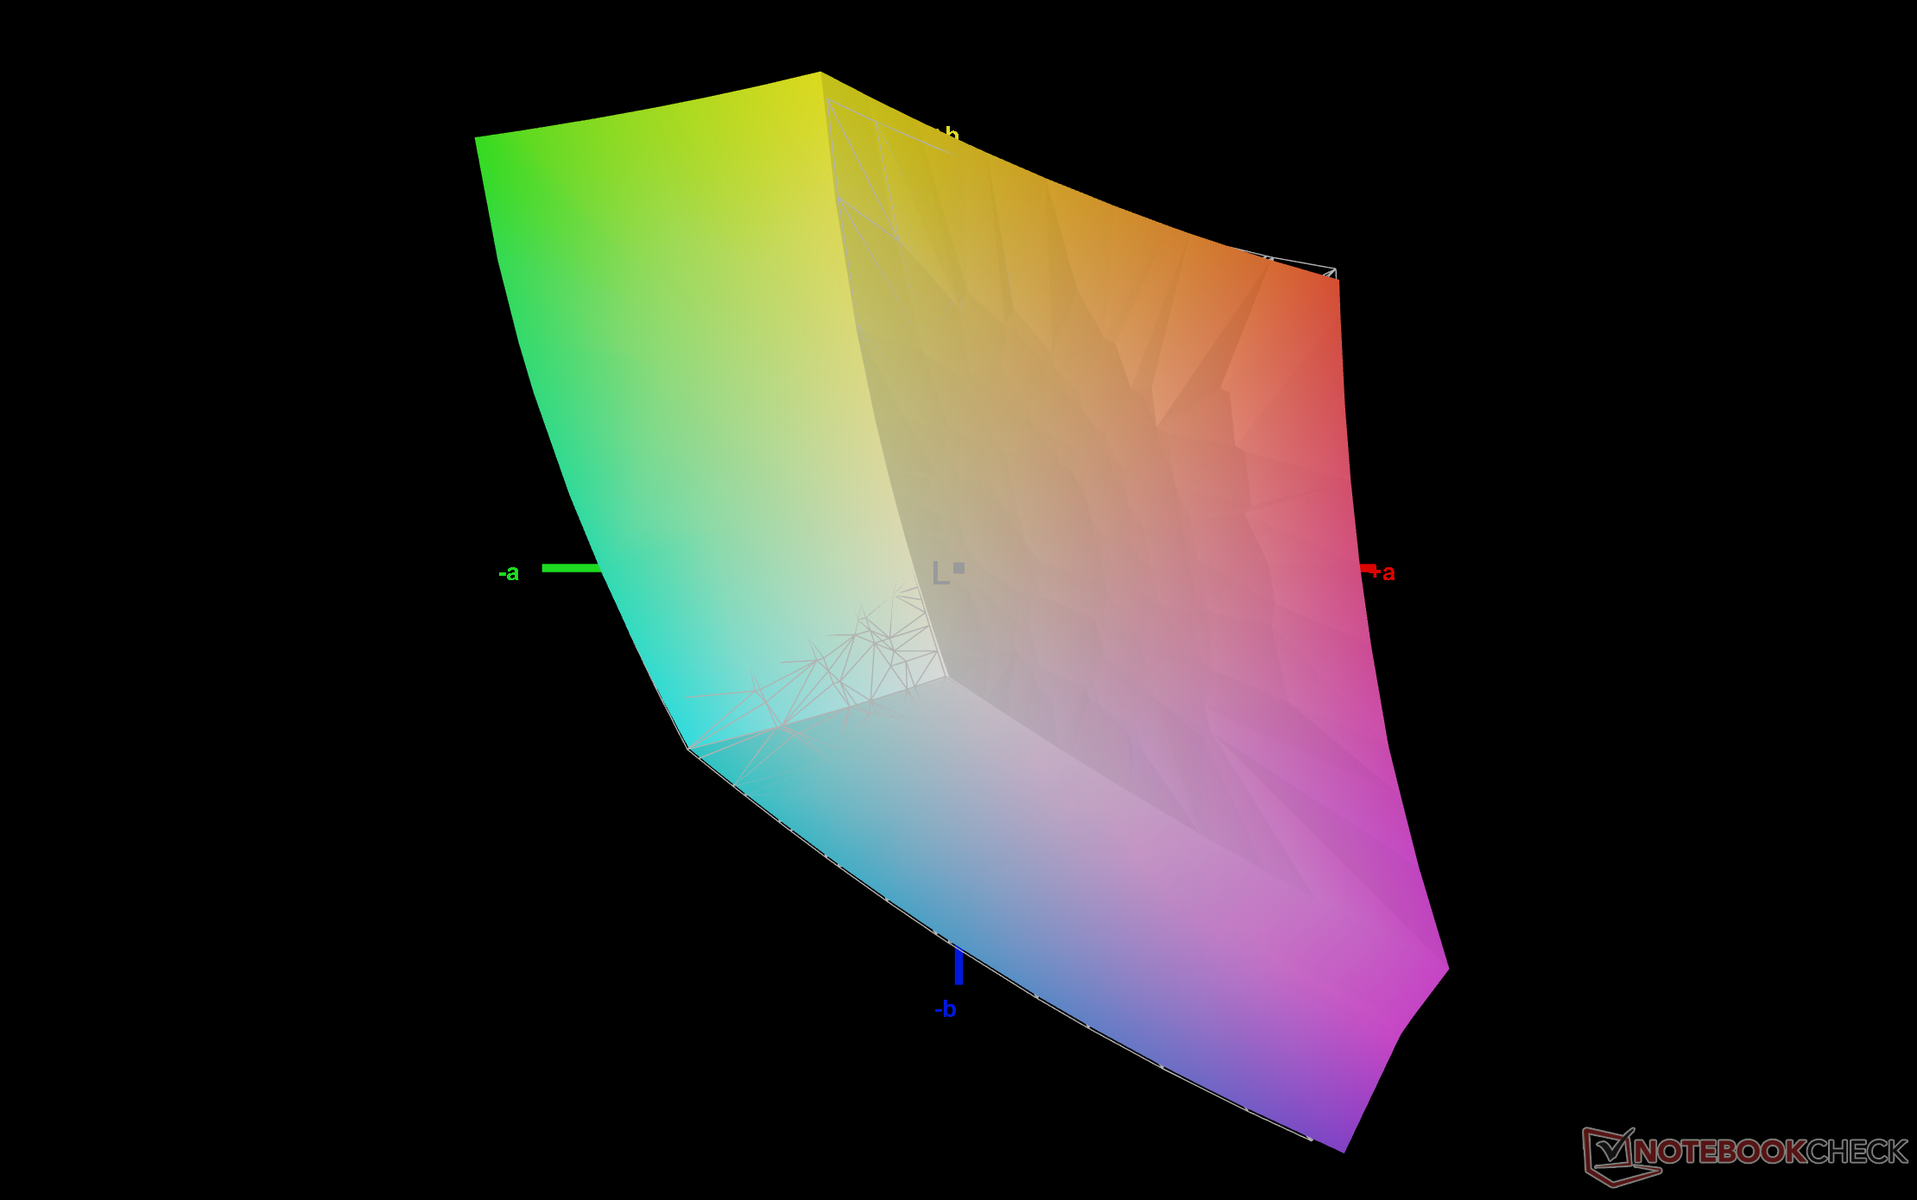
70.3% AdobeRGB 1998 (Argyll 3D)
99.3% sRGB (Argyll 3D)
69% Display P3 (Argyll 3D)
Gamma: 2.29
CCT: 6760 K
| Framework Laptop 13.5 BOE CQ NE135FBM-N41, IPS, 13.5", 2256x1504 | HP Spectre x360 14-ea0378ng Samsung SDC4148, OLED, 13.5", 3000x2000 | Microsoft Surface Laptop 4 13 i7 LQ135P1JX51, IPS, 13.5", 2256x1504 | Lenovo ThinkPad X1 Titanium Yoga G1 20QA001RGE LPM135M467, IPS, 13.5", 2256x1504 | HP ProBook x360 435 G8 R7-5800U AUO4B2D, IPS, 13.3", 1920x1080 | Lenovo Yoga 6 13 82ND0009US AU Optronics B133HAN05.F, IPS, 13.3", 1920x1080 | |
|---|---|---|---|---|---|---|
| Display | 28% | -4% | -41% | 1% | ||
| Display P3 Coverage (%) | 69 | 99.9 45% | 64.7 -6% | 40.1 -42% | 69.7 1% | |
| sRGB Coverage (%) | 99.3 | 100 1% | 97.2 -2% | 59.9 -40% | 99.2 0% | |
| AdobeRGB 1998 Coverage (%) | 70.3 | 96.1 37% | 66.9 -5% | 41.4 -41% | 71.4 2% | |
| Response Times | 95% | -12% | 19% | 17% | 18% | |
| Response Time Grey 50% / Grey 80% * (ms) | 55.6 ? | 2 ? 96% | 62.8 ? -13% | 53.6 ? 4% | 42.8 ? 23% | 46.8 ? 16% |
| Response Time Black / White * (ms) | 36 ? | 2 ? 94% | 39.8 ? -11% | 24 ? 33% | 32 ? 11% | 28.8 ? 20% |
| PWM Frequency (Hz) | 250 ? | 21930 ? | ||||
| Screen | 346% | 10% | 27% | -62% | -12% | |
| Brightness middle (cd/m²) | 449 | 370 -18% | 413 -8% | 466 4% | 304 -32% | 291.5 -35% |
| Brightness (cd/m²) | 435 | 374 -14% | 400 -8% | 454 4% | 292 -33% | 294 -32% |
| Brightness Distribution (%) | 93 | 90 -3% | 94 1% | 94 1% | 89 -4% | 93 0% |
| Black Level * (cd/m²) | 0.39 | 0.01 97% | 0.29 26% | 0.23 41% | 0.23 41% | 0.19 51% |
| Contrast (:1) | 1151 | 37000 3115% | 1424 24% | 2026 76% | 1322 15% | 1534 33% |
| Colorchecker dE 2000 * | 2.34 | 2.57 -10% | 2.8 -20% | 2.1 10% | 5 -114% | 3.83 -64% |
| Colorchecker dE 2000 max. * | 7.07 | 4.52 36% | 7.2 -2% | 4.5 36% | 17.7 -150% | 8.43 -19% |
| Colorchecker dE 2000 calibrated * | 0.96 | 2.31 -141% | 0.8 17% | 4.2 -338% | 1.07 -11% | |
| Greyscale dE 2000 * | 4.7 | 2.2 53% | 1.9 60% | 2.7 43% | 2.1 55% | 6.2 -32% |
| Gamma | 2.29 96% | 2.36 93% | 2.12 104% | 2.08 106% | 2.03 108% | 2.2 100% |
| CCT | 6760 96% | 6154 106% | 6510 100% | 6210 105% | 6443 101% | 6469 100% |
| Color Space (Percent of AdobeRGB 1998) (%) | 85.8 | 61.6 | 61.1 | |||
| Color Space (Percent of sRGB) (%) | 100 | 97.2 | 94.9 | |||
| Totaal Gemiddelde (Programma / Instellingen) | 156% /
242% | -2% /
4% | 23% /
25% | -29% /
-46% | 2% /
-5% |
* ... kleiner is beter
Het paneel dekt sRGB in zijn geheel, net als de meeste andere mid-range tot high-end Ultrabooks. Voor volledige P3-dekking zouden gebruikers andere modellen met bepaalde 4K- of OLED-panelen moeten overwegen.
De fabrikant kalibreert niet in de fabriek, zoals blijkt uit onze X-Rite colorimeter resultaten. Eenmaal gekalibreerd zouden de gemiddelde deltaE-waarden voor grijswaarden en kleuren drastisch verbeteren van 4,7 en 2,34 tot respectievelijk slechts 1,0 en 0,96. Wij raden een kalibratie door de eindgebruiker aan om het beste uit het scherm te halen. Als alternatief kunnen gebruikers ook ons gekalibreerde ICM-profiel hierboven toepassen.
Responstijd Scherm
| ↔ Responstijd Zwart naar Wit | ||
|---|---|---|
| 36 ms ... stijging ↗ en daling ↘ gecombineerd | ↗ 21.2 ms stijging | 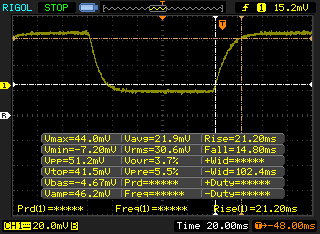 |
| ↘ 14.8 ms daling | ||
| Het scherm vertoonde trage responstijden in onze tests en is misschien te traag voor games. Ter vergelijking: alle testtoestellen variëren van 0.1 (minimum) tot 240 (maximum) ms. » 94 % van alle toestellen zijn beter. Dit betekent dat de gemeten responstijd slechter is dan het gemiddelde (19.8 ms) van alle geteste toestellen. | ||
| ↔ Responstijd 50% Grijs naar 80% Grijs | ||
| 55.6 ms ... stijging ↗ en daling ↘ gecombineerd | ↗ 27.2 ms stijging | 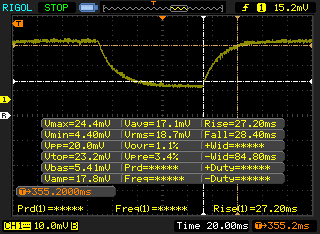 |
| ↘ 28.4 ms daling | ||
| Het scherm vertoonde trage responstijden in onze tests en is misschien te traag voor games. Ter vergelijking: alle testtoestellen variëren van 0.165 (minimum) tot 636 (maximum) ms. » 92 % van alle toestellen zijn beter. Dit betekent dat de gemeten responstijd slechter is dan het gemiddelde (30.9 ms) van alle geteste toestellen. | ||
Screen Flickering / PWM (Pulse-Width Modulation)
| Screen flickering / PWM niet waargenomen | 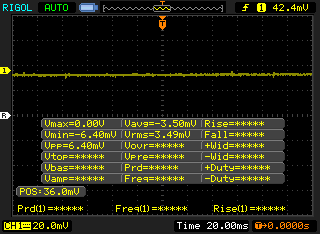 | ||
Ter vergelijking: 52 % van alle geteste toestellen maakten geen gebruik van PWM om de schermhelderheid te verlagen. Als het wel werd gebruikt, werd een gemiddelde van 7744 (minimum: 5 - maximum: 343500) Hz waargenomen. | |||
Prestaties
Processor
CPU-prestaties liggen binnen 5 procent van het gemiddelde Core i7-1165G7 laptop in onze database. De i7-1185G7 is iets langzamer vanwege de aangeboren ondersteuning voor vPro-beveiligingsfuncties. Bepaalde AMD CPU's zoals de Ryzen 5 5500U of Ryzen 7 5700U zijn in staat om nog snellere multi-thread prestaties te bieden ten koste van single-thread prestaties.
Downgraden naar de Core i5-1135G7 SKU levert gebruikers een verlies van 10 tot 15 procent in multi-thread prestaties op in vergelijking met onze i7-1165G7 SKU.
Cinebench R15 Multi Loop
Cinebench R23: Multi Core | Single Core
Cinebench R15: CPU Multi 64Bit | CPU Single 64Bit
Blender: v2.79 BMW27 CPU
7-Zip 18.03: 7z b 4 -mmt1 | 7z b 4
Geekbench 5.5: Single-Core | Multi-Core
HWBOT x265 Benchmark v2.2: 4k Preset
LibreOffice : 20 Documents To PDF
R Benchmark 2.5: Overall mean
| Cinebench R23 / Multi Core | |
| Asus ZenBook 13 OLED UM325UA | |
| VAIO Z VJZ141C11L | |
| Lenovo Yoga 6 13 82ND0009US | |
| Framework Laptop 13.5 | |
| Microsoft Surface Laptop 4 13 i7 | |
| Gemiddeld Intel Core i7-1165G7 (2525 - 6862, n=64) | |
| HP Spectre x360 13-aw2003dx | |
| Asus VivoBook S13 S333JA-DS51 | |
| Cinebench R23 / Single Core | |
| VAIO Z VJZ141C11L | |
| Microsoft Surface Laptop 4 13 i7 | |
| Framework Laptop 13.5 | |
| Gemiddeld Intel Core i7-1165G7 (1110 - 1539, n=59) | |
| HP Spectre x360 13-aw2003dx | |
| Asus ZenBook 13 OLED UM325UA | |
| Lenovo Yoga 6 13 82ND0009US | |
| Asus VivoBook S13 S333JA-DS51 | |
| Geekbench 5.5 / Single-Core | |
| VAIO Z VJZ141C11L | |
| Microsoft Surface Laptop 4 13 i7 | |
| Gemiddeld Intel Core i7-1165G7 (1302 - 1595, n=77) | |
| HP Spectre x360 13-aw2003dx | |
| Acer Spin 5 SP513-54N-79EY | |
| Asus ZenBook 13 OLED UM325UA | |
| Asus VivoBook S13 S333JA-DS51 | |
| HP Envy x360 13-ay0010nr | |
| Geekbench 5.5 / Multi-Core | |
| Asus ZenBook 13 OLED UM325UA | |
| VAIO Z VJZ141C11L | |
| Microsoft Surface Laptop 4 13 i7 | |
| HP Spectre x360 13-aw2003dx | |
| Gemiddeld Intel Core i7-1165G7 (3078 - 5926, n=77) | |
| HP Envy x360 13-ay0010nr | |
| Asus VivoBook S13 S333JA-DS51 | |
| Acer Spin 5 SP513-54N-79EY | |
| HWBOT x265 Benchmark v2.2 / 4k Preset | |
| Asus ZenBook 13 OLED UM325UA | |
| VAIO Z VJZ141C11L | |
| Lenovo Yoga 6 13 82ND0009US | |
| Framework Laptop 13.5 | |
| HP Envy x360 13-ay0010nr | |
| Gemiddeld Intel Core i7-1165G7 (1.39 - 8.47, n=80) | |
| HP Spectre x360 13-aw2003dx | |
| Microsoft Surface Laptop 4 13 i7 | |
| Asus VivoBook S13 S333JA-DS51 | |
| LibreOffice / 20 Documents To PDF | |
| Lenovo Yoga 6 13 82ND0009US | |
| HP Envy x360 13-ay0010nr | |
| Asus VivoBook S13 S333JA-DS51 | |
| Asus ZenBook 13 OLED UM325UA | |
| HP Spectre x360 13-aw2003dx | |
| Acer Spin 5 SP513-54N-79EY | |
| Microsoft Surface Laptop 4 13 i7 | |
| Gemiddeld Intel Core i7-1165G7 (21.5 - 88.1, n=78) | |
| VAIO Z VJZ141C11L | |
| Framework Laptop 13.5 | |
| R Benchmark 2.5 / Overall mean | |
| Asus VivoBook S13 S333JA-DS51 | |
| HP Spectre x360 13-aw2003dx | |
| Lenovo Yoga 6 13 82ND0009US | |
| HP Envy x360 13-ay0010nr | |
| Asus ZenBook 13 OLED UM325UA | |
| Gemiddeld Intel Core i7-1165G7 (0.552 - 1.002, n=80) | |
| Microsoft Surface Laptop 4 13 i7 | |
| Framework Laptop 13.5 | |
| VAIO Z VJZ141C11L | |
* ... kleiner is beter
Systeemprestaties
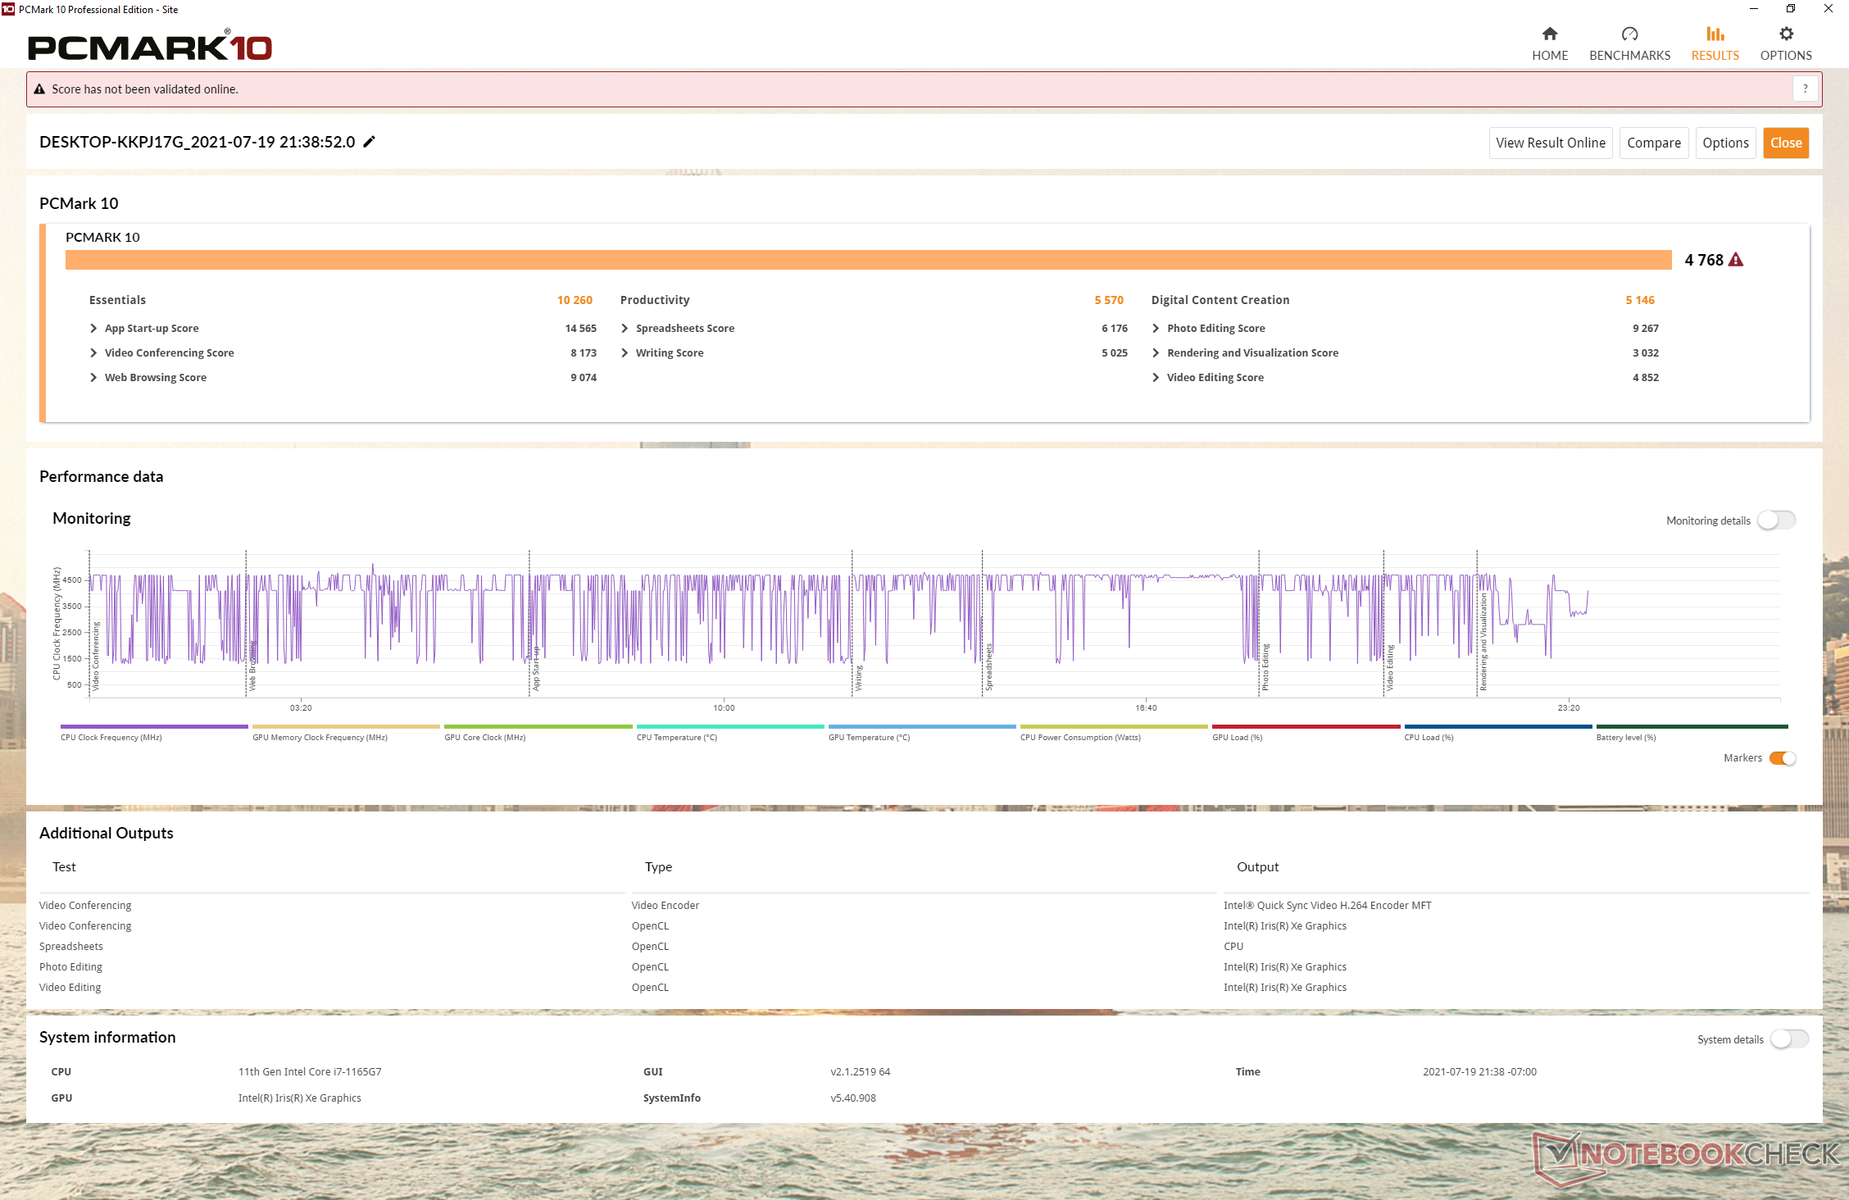
De gemiddelde PCMark 10 resultaten zijn waar we ze verwachten ten opzichte van andere laptops met dezelfde Core i7-1165G7 CPU. De Productiviteit benchmark score is echter een beetje lager verwacht.
| PCMark 10 / Score | |
| HP ProBook x360 435 G8 R7-5800U | |
| Lenovo Yoga 6 13 82ND0009US | |
| Gemiddeld Intel Core i7-1165G7, Intel Iris Xe Graphics G7 96EUs (4531 - 5454, n=50) | |
| Microsoft Surface Laptop 4 13 i7 | |
| Framework Laptop 13.5 | |
| Lenovo ThinkPad X1 Titanium Yoga G1 20QA001RGE | |
| HP Spectre x360 14-ea0378ng | |
| PCMark 10 / Essentials | |
| Lenovo ThinkPad X1 Titanium Yoga G1 20QA001RGE | |
| Framework Laptop 13.5 | |
| Gemiddeld Intel Core i7-1165G7, Intel Iris Xe Graphics G7 96EUs (8997 - 11505, n=50) | |
| Lenovo Yoga 6 13 82ND0009US | |
| HP ProBook x360 435 G8 R7-5800U | |
| HP Spectre x360 14-ea0378ng | |
| Microsoft Surface Laptop 4 13 i7 | |
| PCMark 10 / Productivity | |
| HP ProBook x360 435 G8 R7-5800U | |
| Lenovo Yoga 6 13 82ND0009US | |
| Gemiddeld Intel Core i7-1165G7, Intel Iris Xe Graphics G7 96EUs (5570 - 7136, n=50) | |
| Microsoft Surface Laptop 4 13 i7 | |
| Lenovo ThinkPad X1 Titanium Yoga G1 20QA001RGE | |
| HP Spectre x360 14-ea0378ng | |
| Framework Laptop 13.5 | |
| PCMark 10 / Digital Content Creation | |
| Lenovo Yoga 6 13 82ND0009US | |
| HP ProBook x360 435 G8 R7-5800U | |
| Framework Laptop 13.5 | |
| Gemiddeld Intel Core i7-1165G7, Intel Iris Xe Graphics G7 96EUs (4083 - 5550, n=50) | |
| Microsoft Surface Laptop 4 13 i7 | |
| HP Spectre x360 14-ea0378ng | |
| Lenovo ThinkPad X1 Titanium Yoga G1 20QA001RGE | |
| PCMark 10 Score | 4768 punten | |
Help | ||
DPC latentie
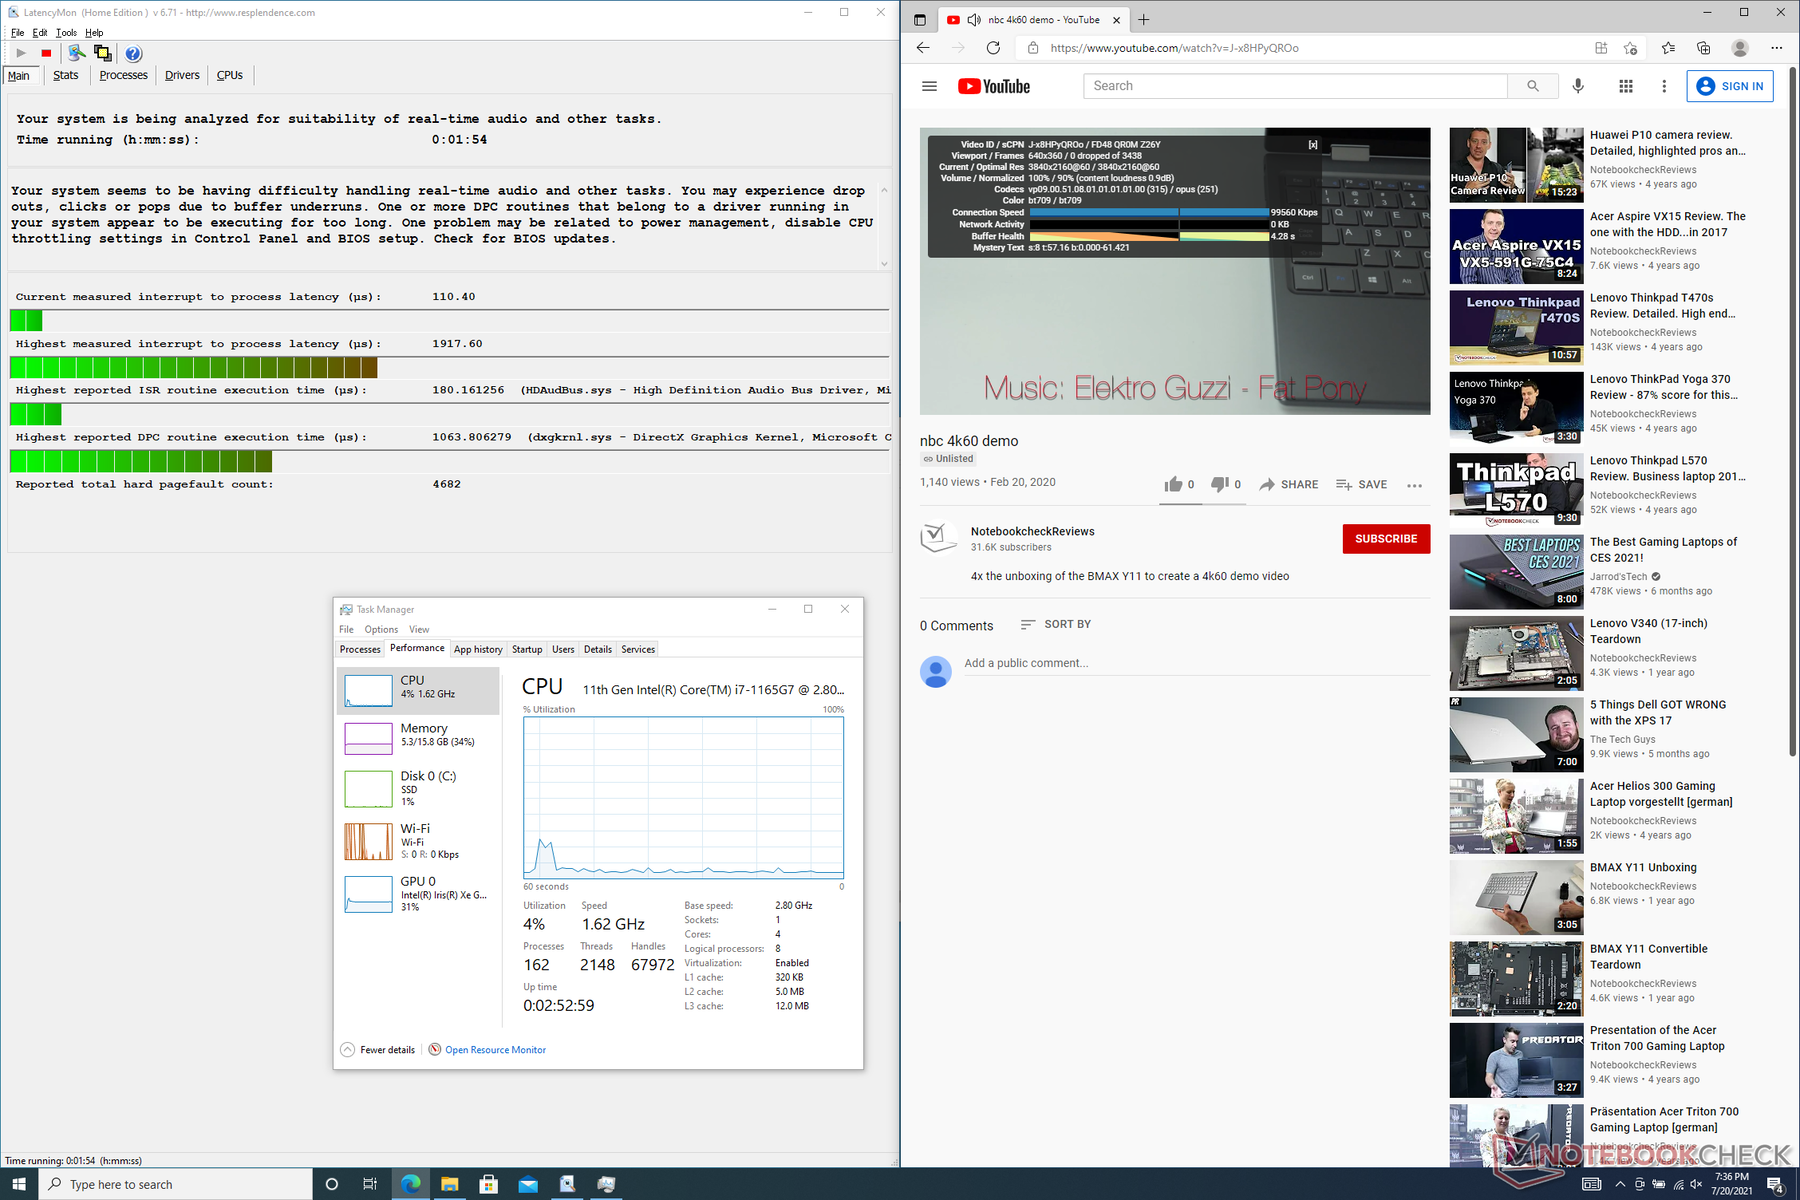
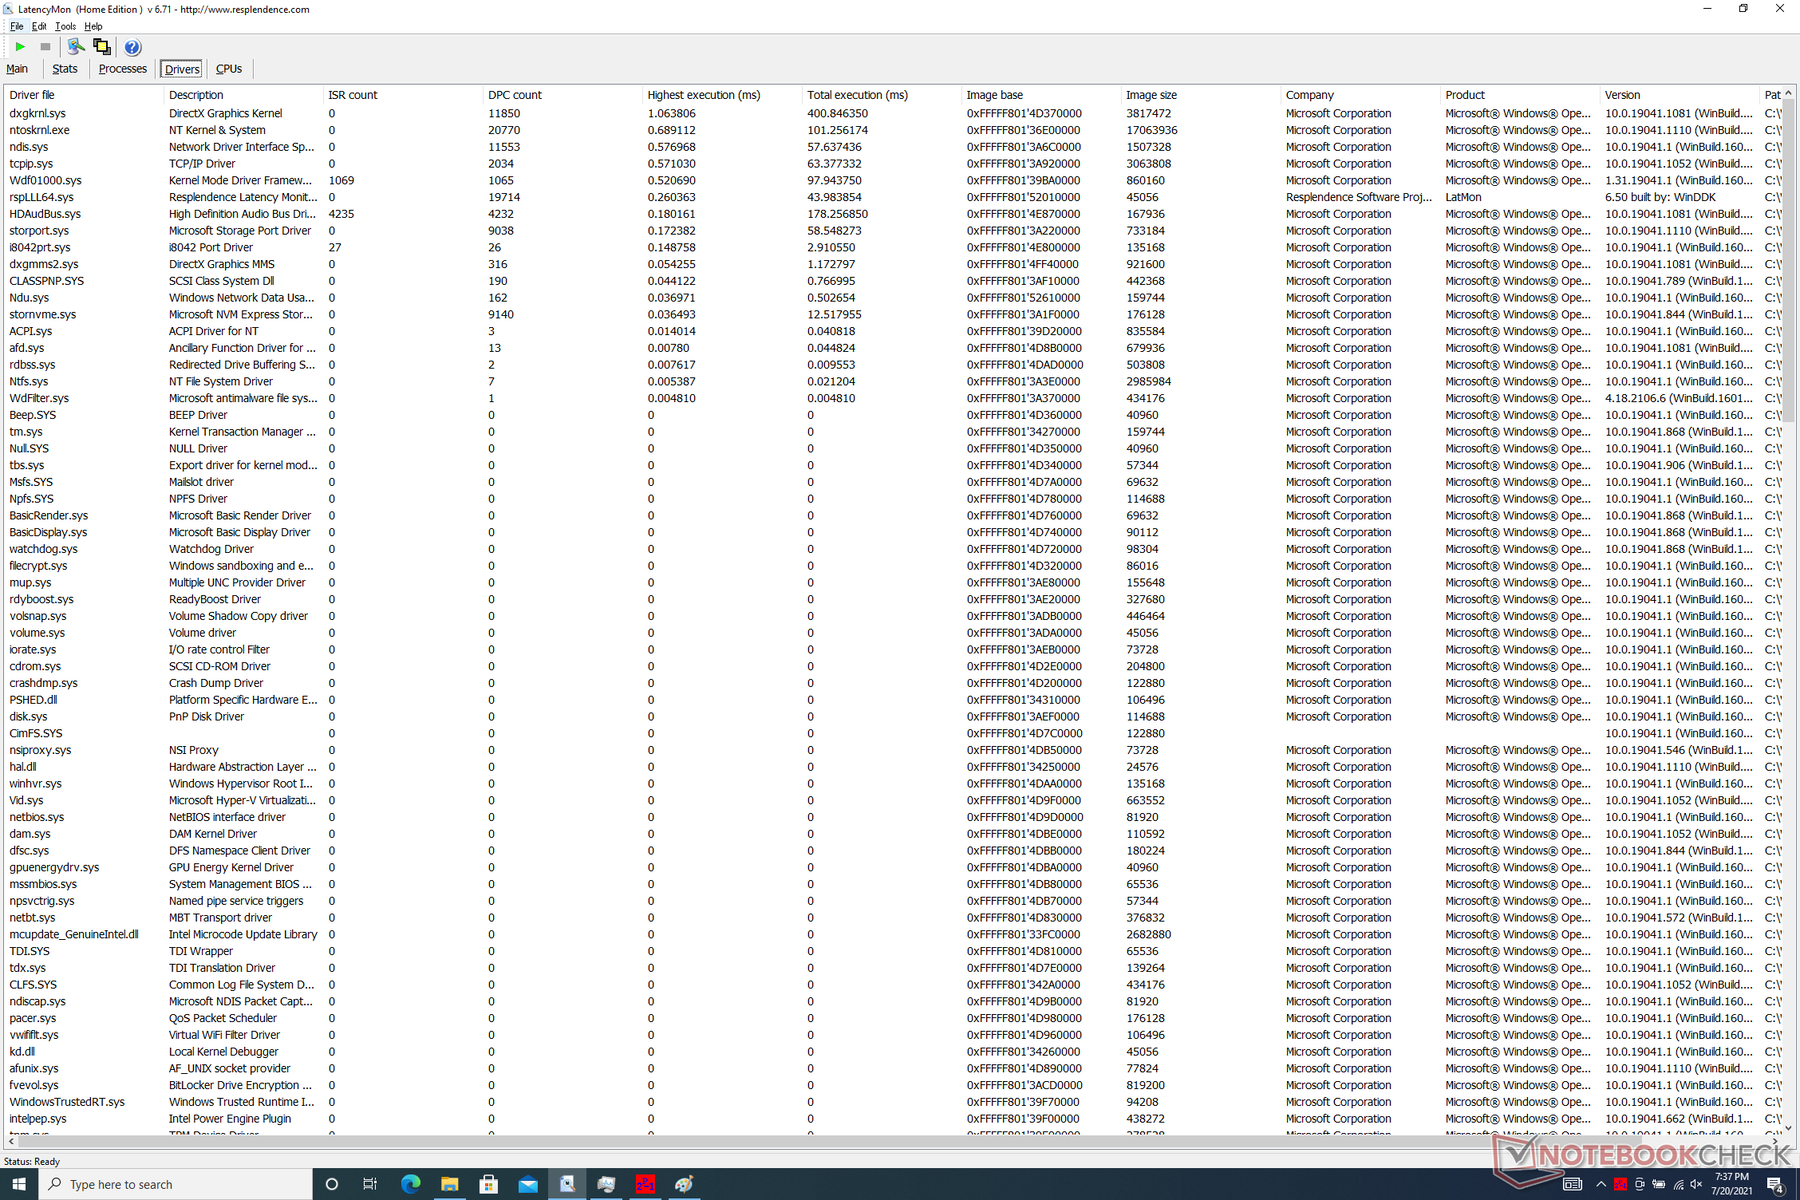
LatencyMon laat lichte DPC latency problemen zien bij het openen van meerdere browser tabs op onze homepage. Het afspelen van video's met 4K 60 FPS verloopt verder vloeiend en zonder dropped frames.
| DPC Latencies / LatencyMon - interrupt to process latency (max), Web, Youtube, Prime95 | |
| Framework Laptop 13.5 | |
| HP Spectre x360 14-ea0378ng | |
| Lenovo ThinkPad X1 Titanium Yoga G1 20QA001RGE | |
| Lenovo Yoga 6 13 82ND0009US | |
| Microsoft Surface Laptop 4 13 i7 | |
| HP ProBook x360 435 G8 R7-5800U | |
* ... kleiner is beter
Opslagapparaten
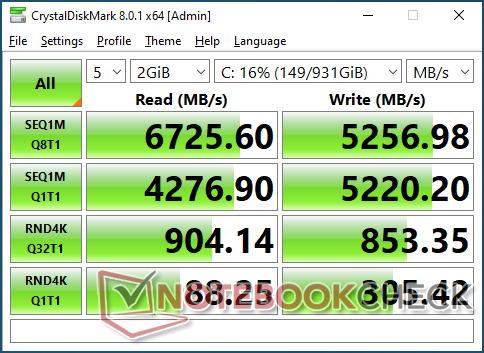
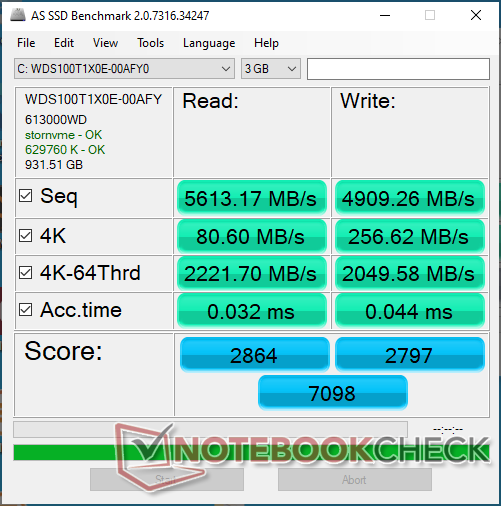
Gebruikers kunnen hun eigen M.2 NVMe SSD tot een PCIe 4 deel installeren. De SSD's die Framework zal leveren zijn allemaal Western Digital Black-schijven, variërend van de 250 GB SN750 tot de 2 TB SN850.
| Framework Laptop 13.5 Western Digital WD_BLACK SN850 WDS100T1X0E | HP Spectre x360 14-ea0378ng Intel Optane Memory H10 with Solid State Storage 32GB + 1TB HBRPEKNX0203AH(L/H) | Microsoft Surface Laptop 4 13 i7 Samsung PM991 MZ9LQ512HALU | Lenovo ThinkPad X1 Titanium Yoga G1 20QA001RGE Toshiba BG4 KBG40ZNT512G | HP ProBook x360 435 G8 R7-5800U Samsung PM991 MZVLQ512HALU | Lenovo Yoga 6 13 82ND0009US WDC PC SN530 SDBPMPZ-265G | |
|---|---|---|---|---|---|---|
| AS SSD | -76% | -81% | -69% | -76% | -101% | |
| Seq Read (MB/s) | 5613 | 1343 -76% | 1821 -68% | 1898 -66% | 1936 -66% | 1860 -67% |
| Seq Write (MB/s) | 4909 | 1222 -75% | 794 -84% | 1065 -78% | 1237 -75% | 500 -90% |
| 4K Read (MB/s) | 80.6 | 63.6 -21% | 47.54 -41% | 58 -28% | 40.35 -50% | 36.26 -55% |
| 4K Write (MB/s) | 256.6 | 107.8 -58% | 141.6 -45% | 200.7 -22% | 99.5 -61% | 118.6 -54% |
| 4K-64 Read (MB/s) | 2222 | 417.5 -81% | 782 -65% | 580 -74% | 645 -71% | 419 -81% |
| 4K-64 Write (MB/s) | 2050 | 496 -76% | 766 -63% | 779 -62% | 365.8 -82% | 219 -89% |
| Access Time Read * (ms) | 0.032 | 0.103 -222% | 0.191 -497% | 0.052 -63% | 0.104 -225% | 0.102 -219% |
| Access Time Write * (ms) | 0.044 | 0.043 2% | 0.027 39% | 0.16 -264% | 0.038 14% | 0.17 -286% |
| Score Read (Points) | 2864 | 615 -79% | 1012 -65% | 828 -71% | 879 -69% | 641 -78% |
| Score Write (Points) | 2797 | 726 -74% | 987 -65% | 1087 -61% | 589 -79% | 388 -86% |
| Score Total (Points) | 7098 | 1675 -76% | 2477 -65% | 2316 -67% | 1892 -73% | 1300 -82% |
| Copy ISO MB/s (MB/s) | 1926 | 334.9 -83% | 1243 -35% | 1659 -14% | 708 -63% | 880 -54% |
| Copy Program MB/s (MB/s) | 947 | 276.3 -71% | 628 -34% | 519 -45% | 132.1 -86% | 185.3 -80% |
| Copy Game MB/s (MB/s) | 1880 | 433.2 -77% | 976 -48% | 872 -54% | 326.7 -83% | 212.7 -89% |
| CrystalDiskMark 5.2 / 6 | -42% | -67% | -49% | -67% | -68% | |
| Write 4K (MB/s) | 299.4 | 128.9 -57% | 118.2 -61% | 226.6 -24% | 86.7 -71% | 89.2 -70% |
| Read 4K (MB/s) | 87.6 | 140 60% | 37.54 -57% | 62.8 -28% | 32.45 -63% | 33.09 -62% |
| Write Seq (MB/s) | 5205 | 1422 -73% | 1017 -80% | 1296 -75% | 1235 -76% | 988 -81% |
| Read Seq (MB/s) | 4276 | 1660 -61% | 926 -78% | 1445 -66% | 1417 -67% | 1322 -69% |
| Write 4K Q32T1 (MB/s) | 846 | 475.1 -44% | 354.2 -58% | 545 -36% | 390.8 -54% | 332.6 -61% |
| Read 4K Q32T1 (MB/s) | 905 | 581 -36% | 352.6 -61% | 687 -24% | 291 -68% | 389.3 -57% |
| Write Seq Q32T1 (MB/s) | 5189 | 1793 -65% | 1174 -77% | 1483 -71% | 1384 -73% | 984 -81% |
| Read Seq Q32T1 (MB/s) | 6921 | 2536 -63% | 2261 -67% | 2334 -66% | 2350 -66% | 2461 -64% |
| Totaal Gemiddelde (Programma / Instellingen) | -59% /
-64% | -74% /
-76% | -59% /
-62% | -72% /
-73% | -85% /
-89% |
* ... kleiner is beter

Disk Throttling: DiskSpd Read Loop, Queue Depth 8
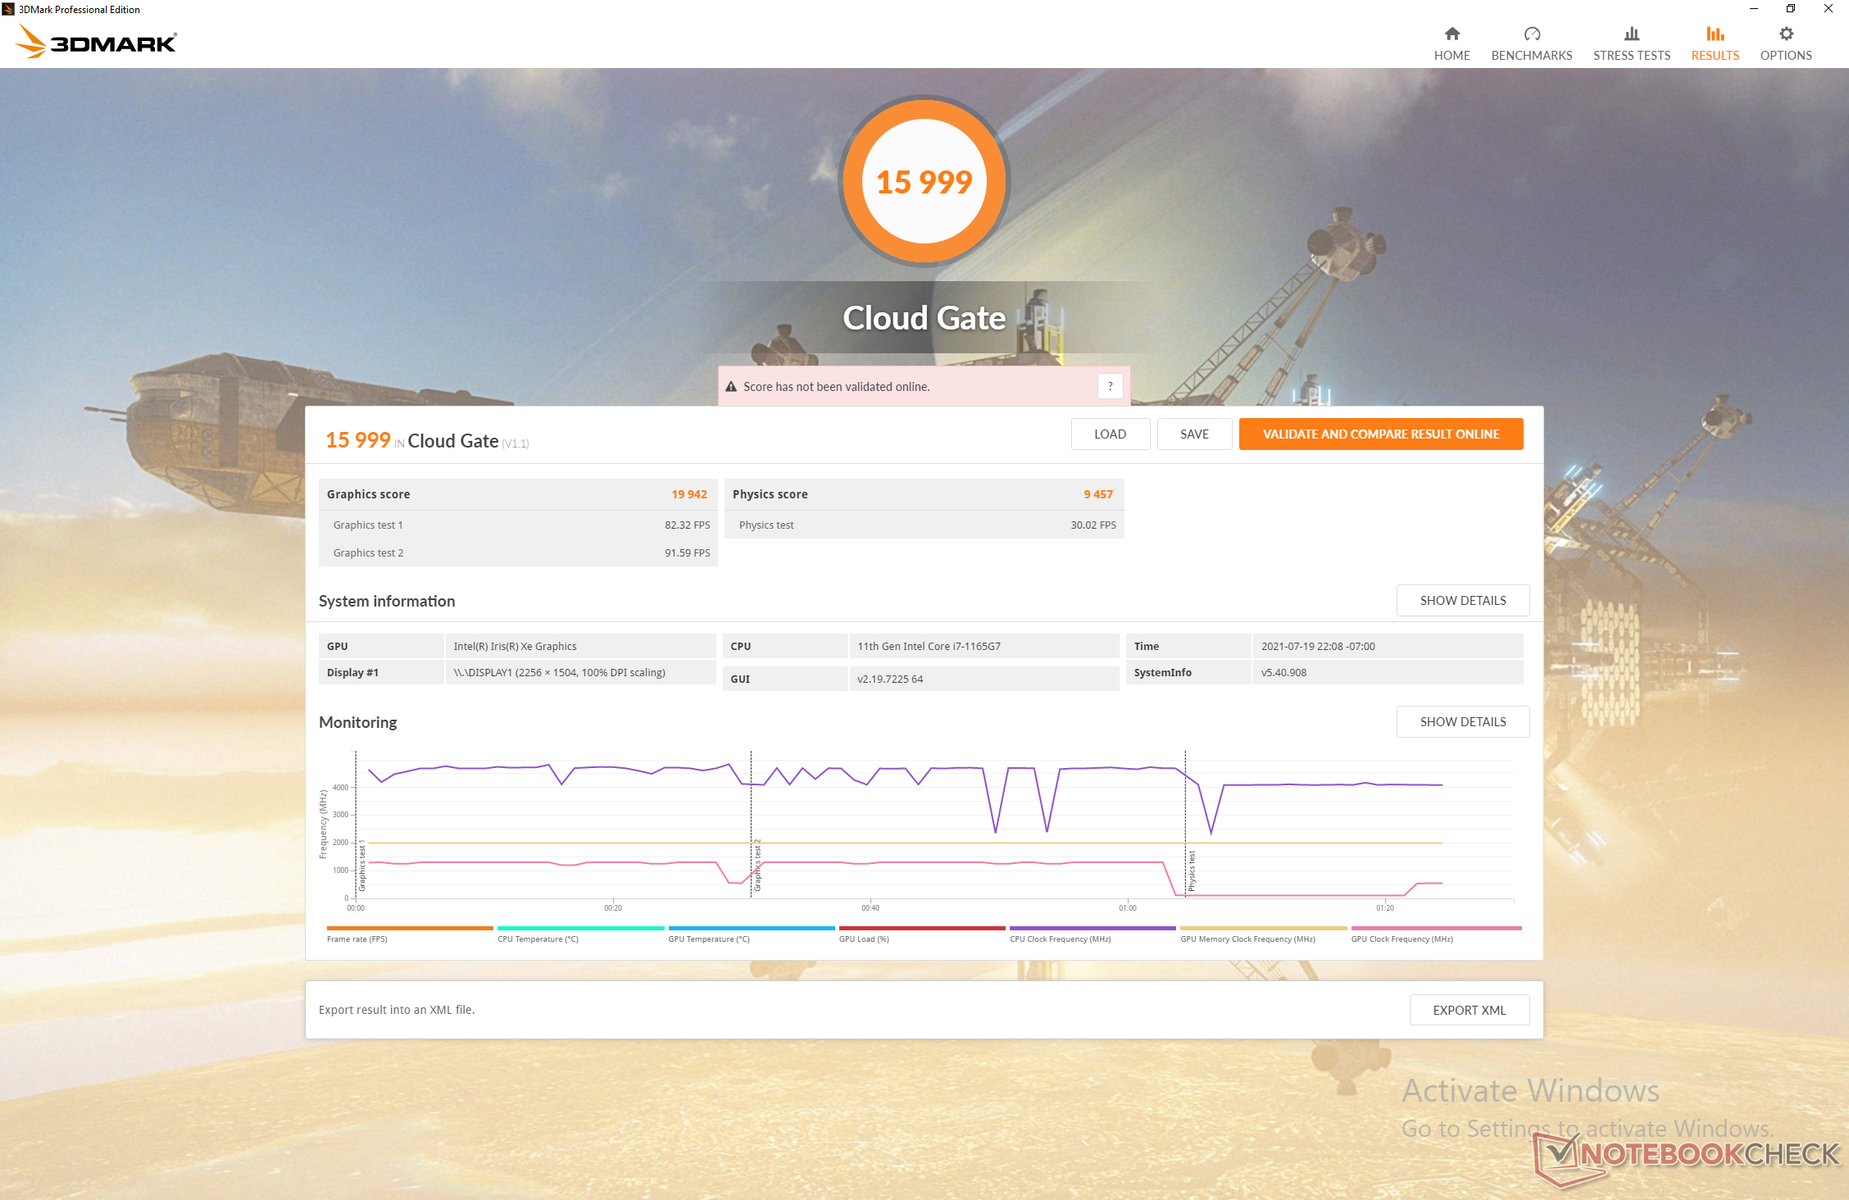
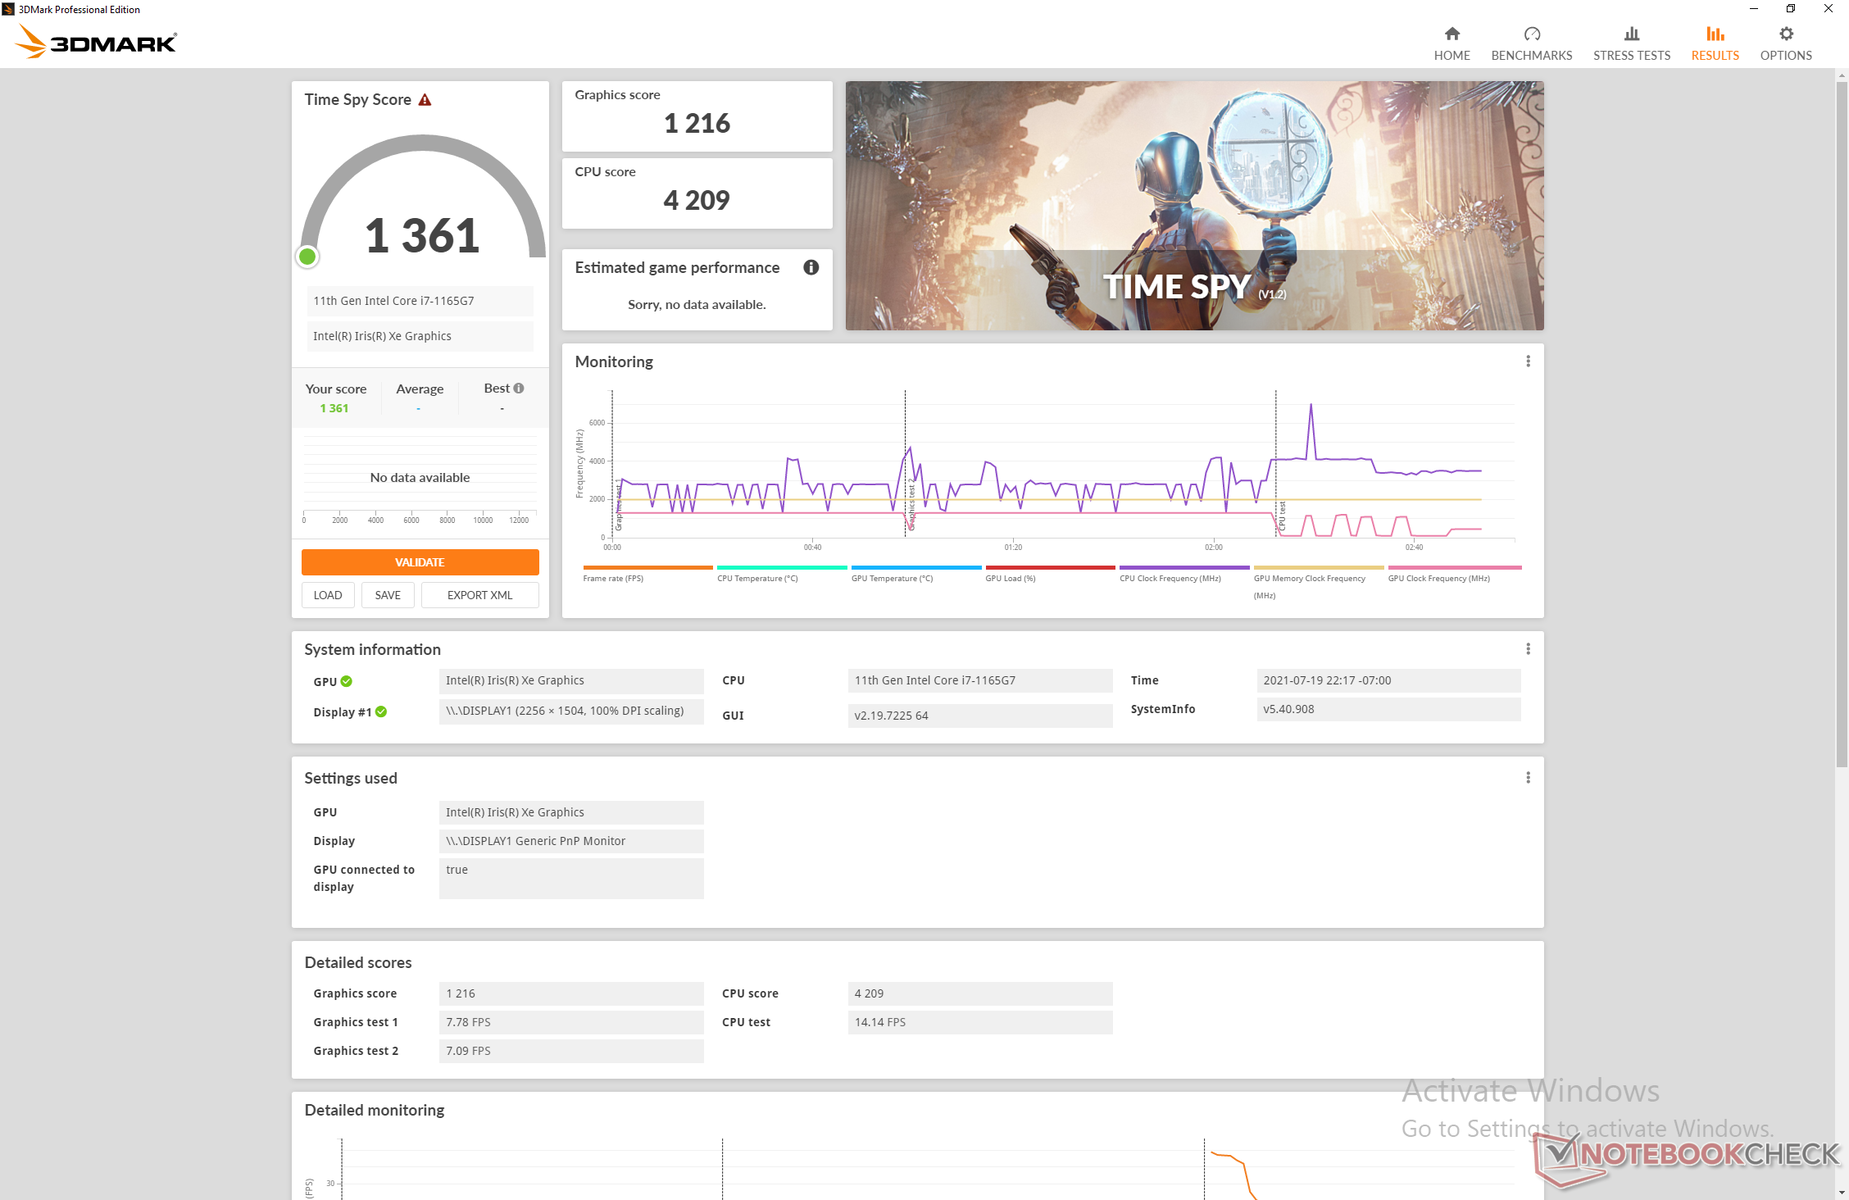
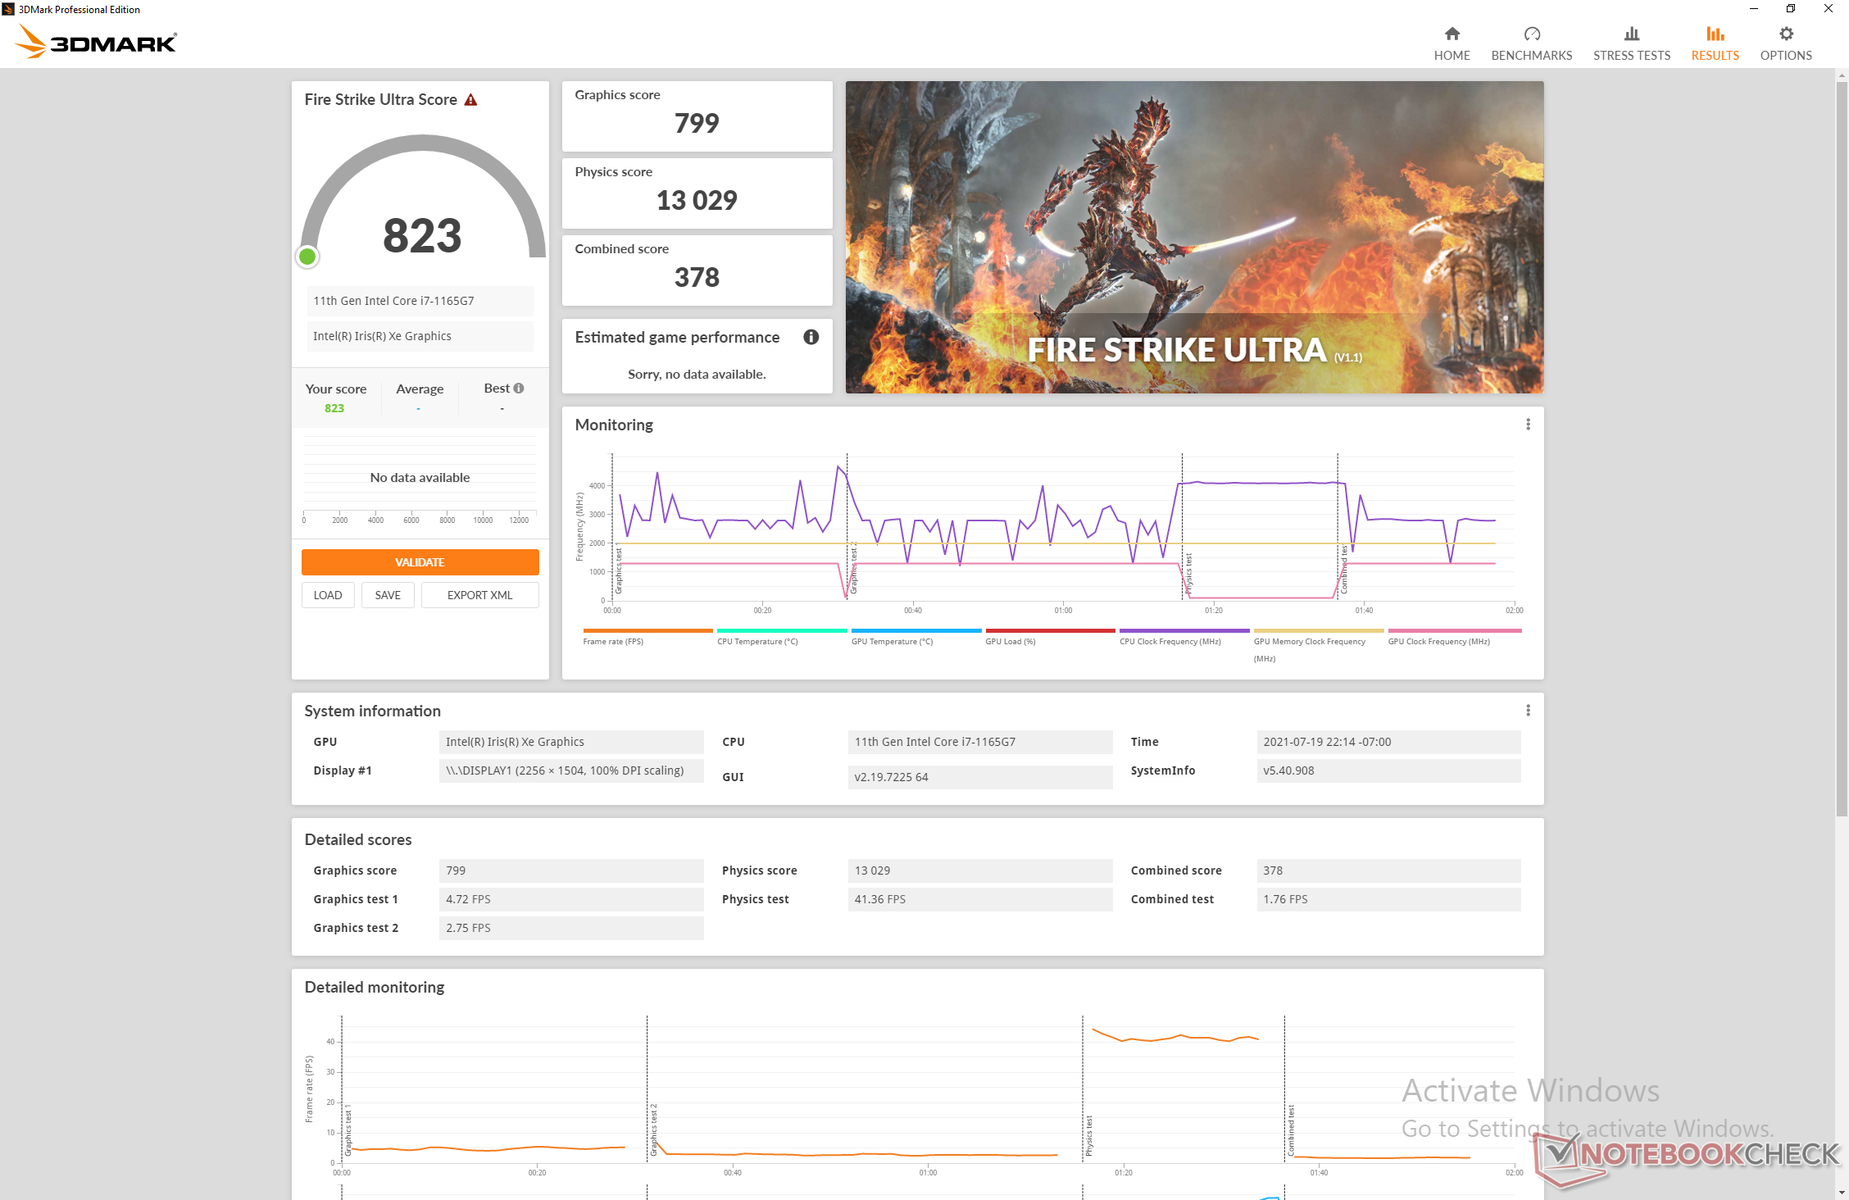
GPU prestatie
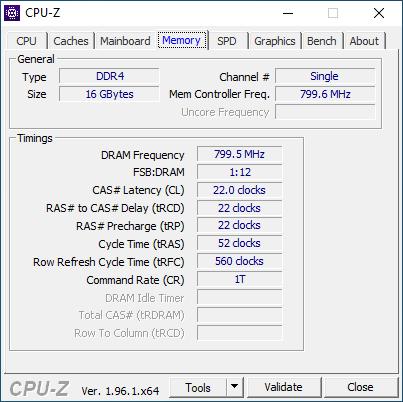
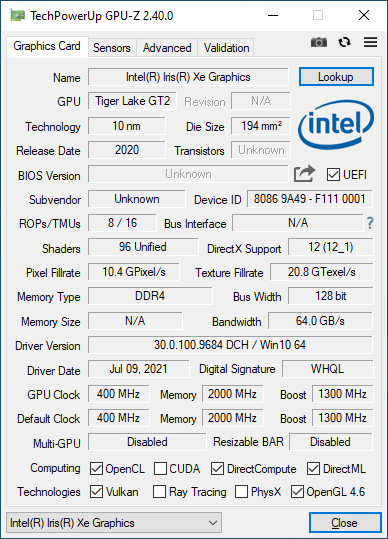
Grafische prestaties zijn 15 tot 25 procent langzamer dan de gemiddelde Iris Xe 96 EU's in onze database als gevolg van het enkelkanaals RAM op onze testeenheid. Gebruikers kunnen dit gat gemakkelijk dichten door dual-channel RAM te installeren.
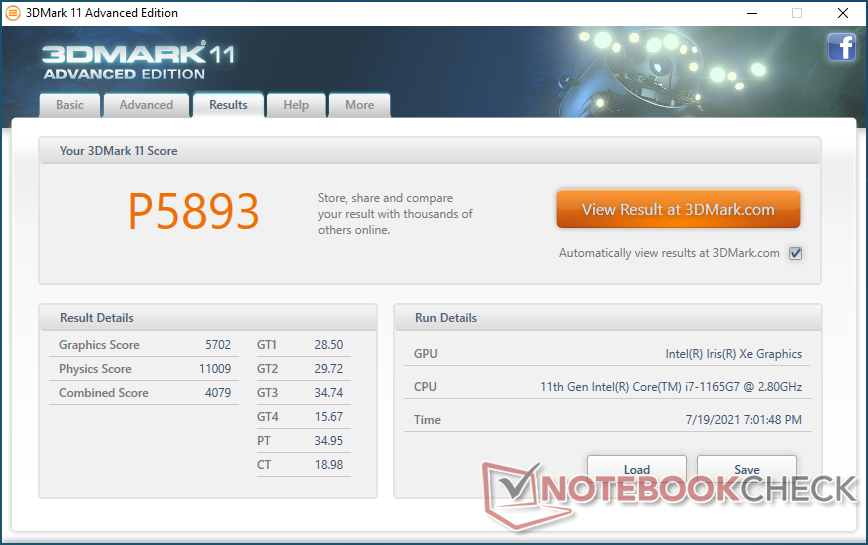
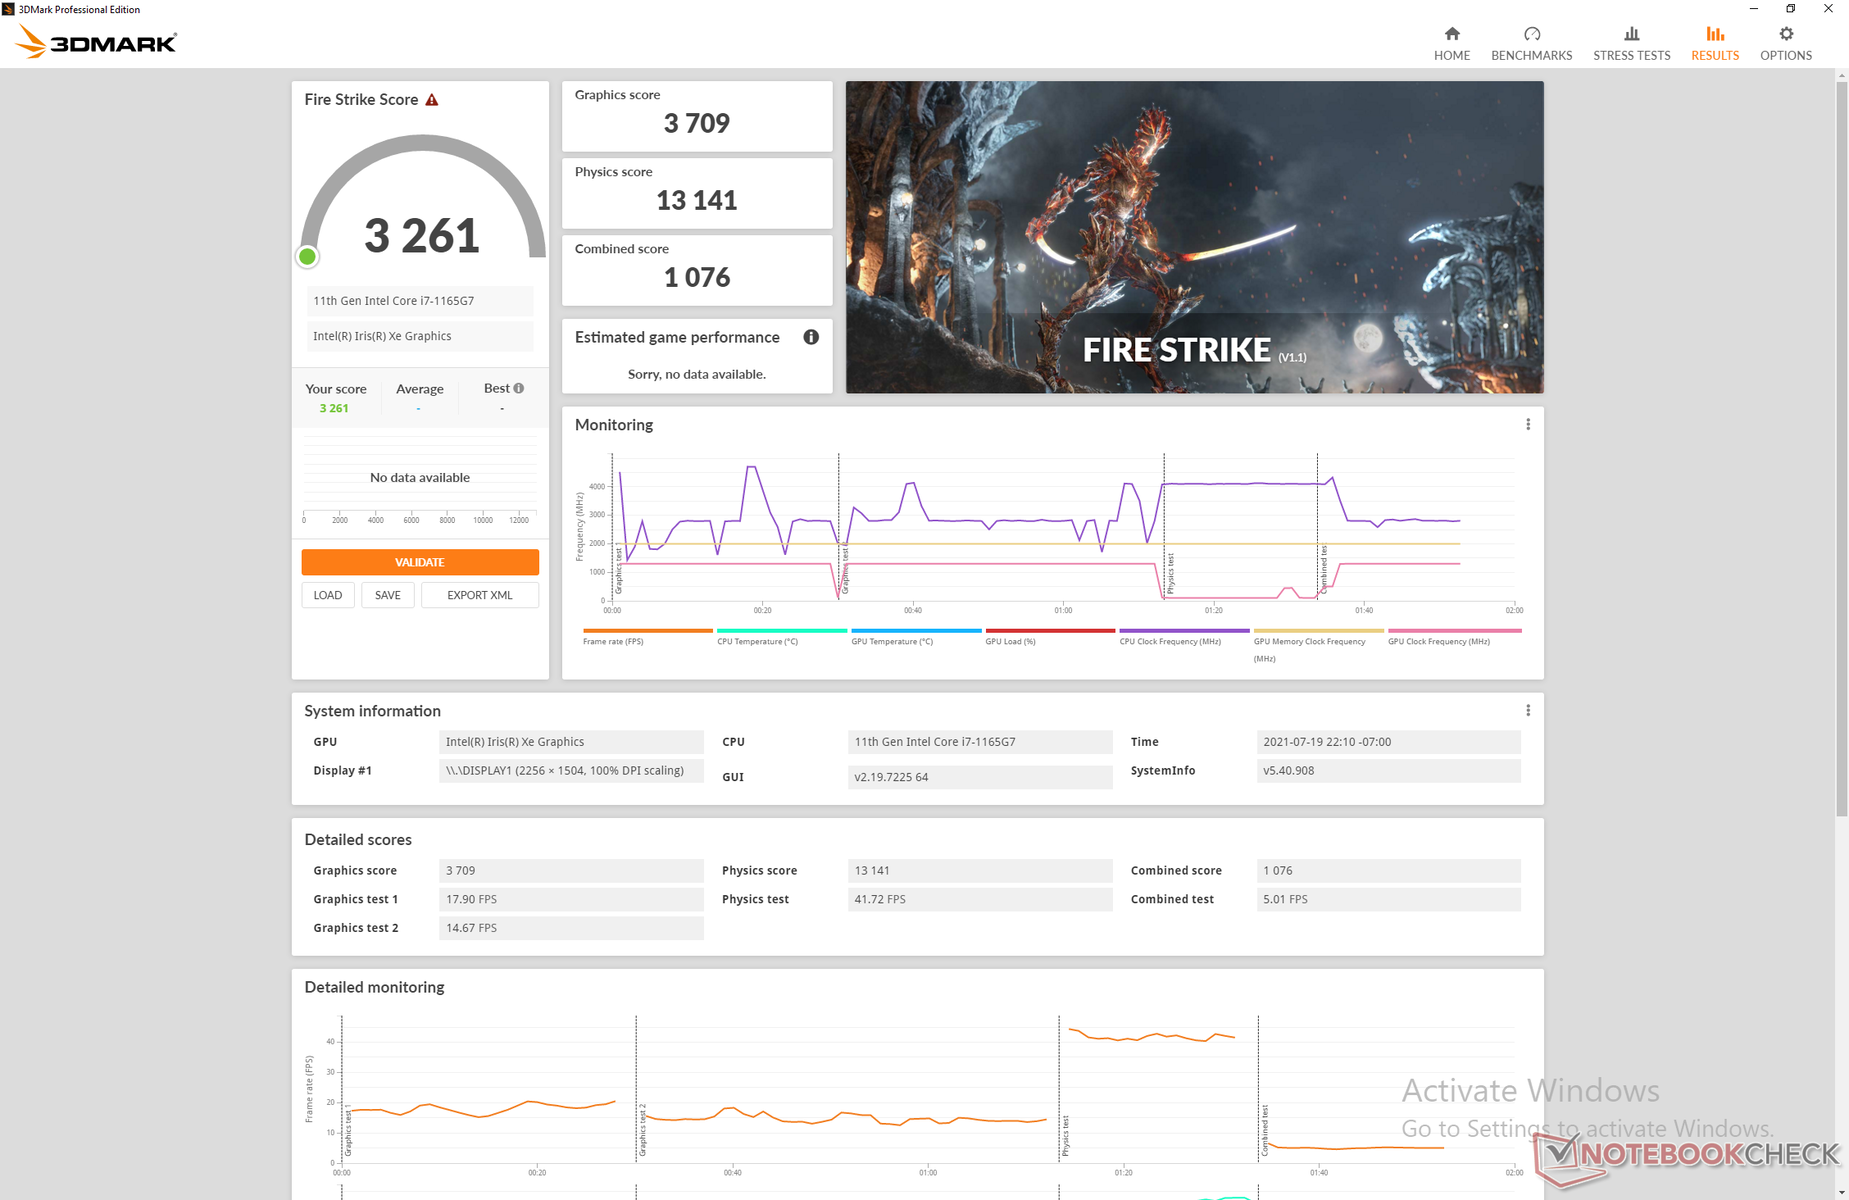
| 3DMark 11 Performance | 5893 punten | |
| 3DMark Cloud Gate Standard Score | 15999 punten | |
| 3DMark Fire Strike Score | 2361 punten | |
| 3DMark Time Spy Score | 1361 punten | |
Help | ||
Witcher 3 FPS Chart
| lage | gem. | hoge | ultra | |
|---|---|---|---|---|
| The Witcher 3 (2015) | 75.9 | 45.1 | 22.1 | 12 |
| Dota 2 Reborn (2015) | 109 | 66.1 | 41.2 | 38.2 |
| Final Fantasy XV Benchmark (2018) | 29.4 | 15.7 | 12.1 | |
| X-Plane 11.11 (2018) | 41.3 | 36.5 | 29.5 |
Emissions
Systeemgeluid
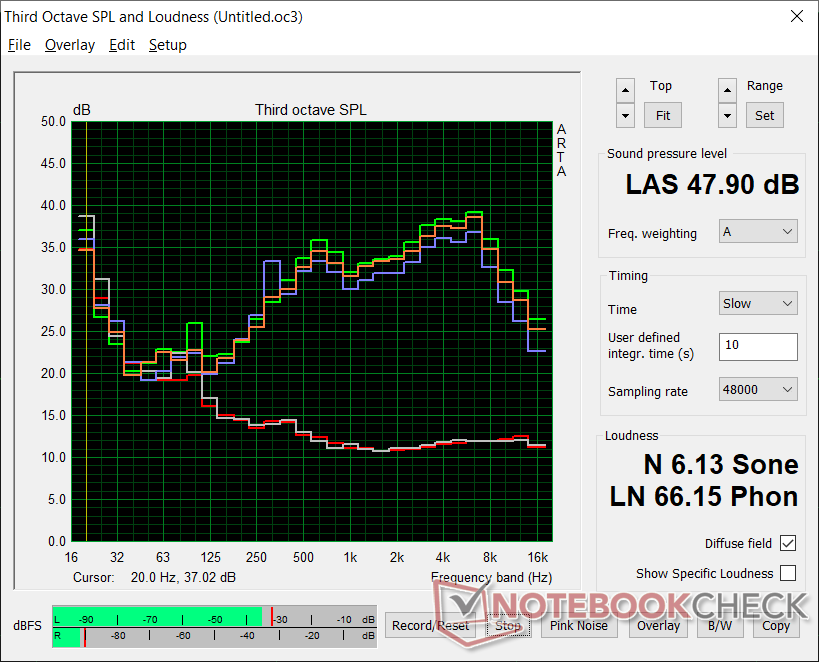
Hoewel het stil is bij gewoon browsen of tekstverwerken, kan de ventilator in de Framework sneller luider worden dan op de meeste andere Ultrabooks. Het uitvoeren van de eerste 90-seconden benchmarkscène van 3DMark 06 zou de ventilator doen stijgen tot 45,6 dB(A), vergeleken met slechts 37,5 dB(A) of 39,5 dB(A) op de HP Spectre x360 14 of Surface Laptop 4 13, respectievelijk. De ventilator zal nog luider zijn wanneer games worden uitgevoerd.
| Framework Laptop 13.5 Iris Xe G7 96EUs, i7-1165G7, Western Digital WD_BLACK SN850 WDS100T1X0E | HP Spectre x360 14-ea0378ng Iris Xe G7 96EUs, i7-1165G7, Intel Optane Memory H10 with Solid State Storage 32GB + 1TB HBRPEKNX0203AH(L/H) | Microsoft Surface Laptop 4 13 i7 Iris Xe G7 96EUs, i7-1185G7, Samsung PM991 MZ9LQ512HALU | Lenovo ThinkPad X1 Titanium Yoga G1 20QA001RGE Iris Xe G7 96EUs, i7-1160G7, Toshiba BG4 KBG40ZNT512G | Lenovo Yoga 6 13 82ND0009US Vega 7, R5 5500U, WDC PC SN530 SDBPMPZ-265G | Asus Zenbook 14 UX433FN-A6023T GeForce MX150, i7-8565U, Intel SSD 660p SSDPEKNW512G8 | |
|---|---|---|---|---|---|---|
| Noise | 1% | 5% | 8% | 4% | -13% | |
| uit / omgeving * (dB) | 23.9 | 26 -9% | 24.2 -1% | 25.1 -5% | 25.1 -5% | 30.7 -28% |
| Idle Minimum * (dB) | 23.9 | 26 -9% | 24.2 -1% | 25.1 -5% | 25.1 -5% | 30.7 -28% |
| Idle Average * (dB) | 23.9 | 26 -9% | 24.2 -1% | 25.1 -5% | 25.1 -5% | 30.7 -28% |
| Idle Maximum * (dB) | 23.9 | 26 -9% | 24.2 -1% | 27.1 -13% | 25.1 -5% | 30.7 -28% |
| Load Average * (dB) | 45.6 | 37.5 18% | 39.5 13% | 32.7 28% | 41 10% | 38.8 15% |
| Witcher 3 ultra * (dB) | 47.1 | 32.7 31% | 38.6 18% | |||
| Load Maximum * (dB) | 47.9 | 36.3 24% | 39.5 18% | 35.8 25% | 38.7 19% | 39.3 18% |
* ... kleiner is beter
Geluidsniveau
| Onbelast |
| 23.9 / 23.9 / 23.9 dB (A) |
| Belasting |
| 45.6 / 47.9 dB (A) |
 | ||
30 dB stil 40 dB(A) hoorbaar 50 dB(A) luid |
||
min: | ||
Temperatuur
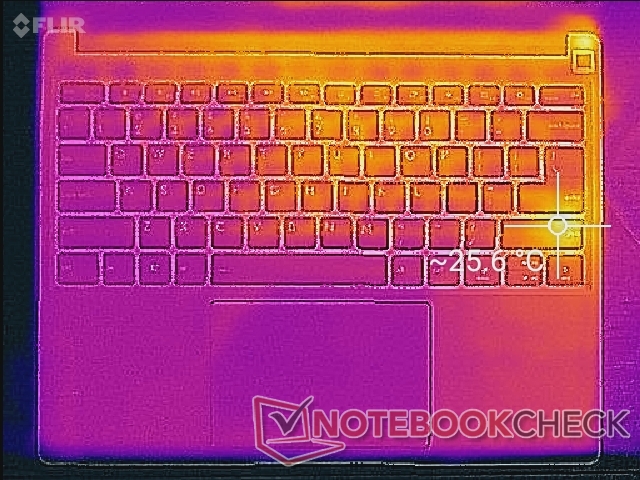
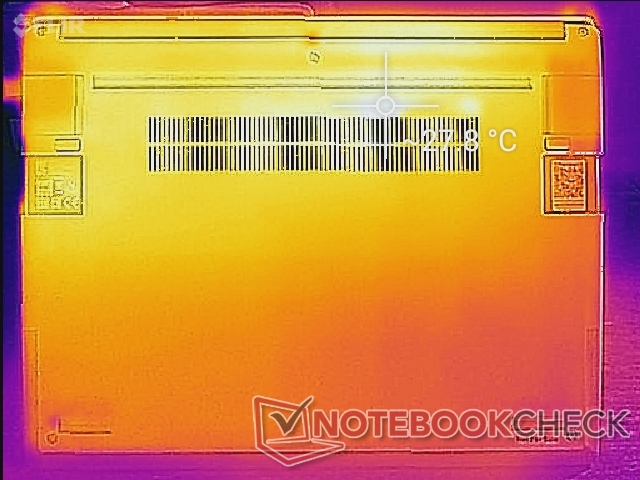
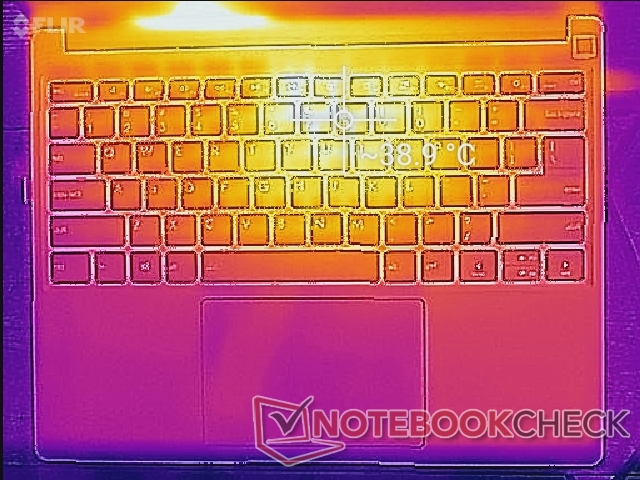
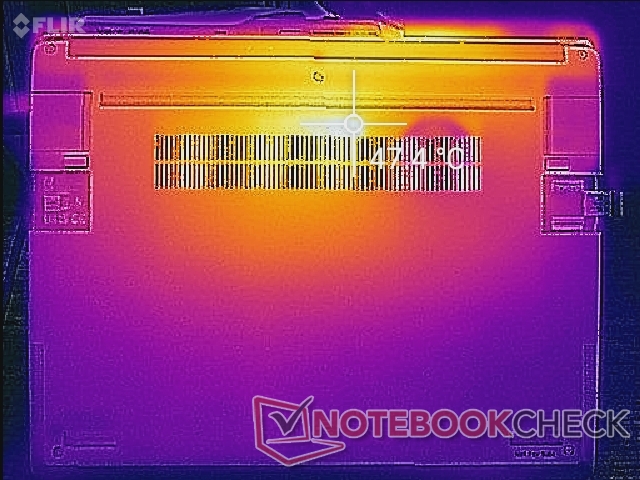
Hete plekken zijn het dichtst bij de middelste achterkant van het chassis, waar ze kunnen oplopen tot 39 C aan de bovenkant en 48 C aan de onderkant, zoals blijkt uit de temperatuurkaarten hieronder. De handpalmsteunen blijven koel voor comfortabel gebruik, ongeacht de belasting.
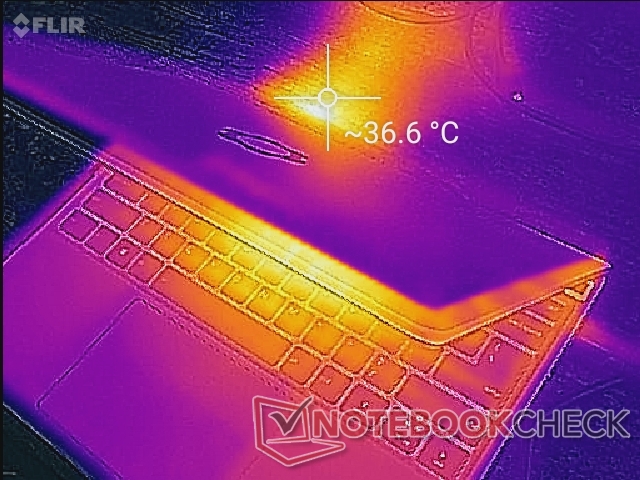
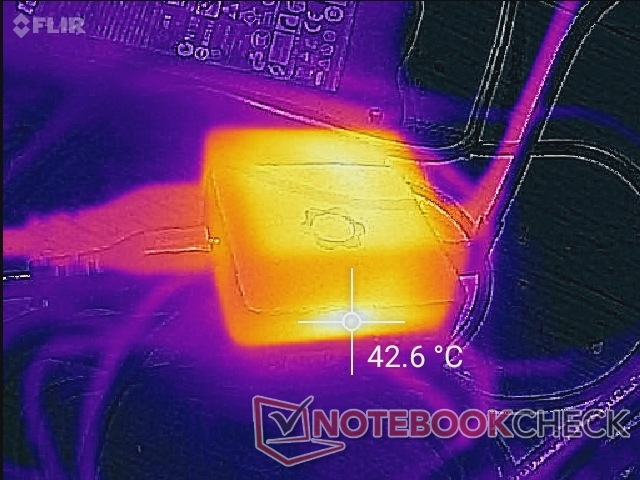
(-) De maximumtemperatuur aan de bovenzijde bedraagt 47.2 °C / 117 F, vergeleken met het gemiddelde van 34.3 °C / 94 F, variërend van 21.2 tot 62.5 °C voor de klasse Office.
(+) De bodem warmt op tot een maximum van 39.4 °C / 103 F, vergeleken met een gemiddelde van 36.8 °C / 98 F
(+) Bij onbelast gebruik bedraagt de gemiddelde temperatuur voor de bovenzijde 23.5 °C / 74 F, vergeleken met het apparaatgemiddelde van 29.5 °C / 85 F.
(+) De palmsteunen en het touchpad zijn met een maximum van ###max## °C / 82.8 F koeler dan de huidtemperatuur en voelen daarom koel aan.
(±) De gemiddelde temperatuur van de handpalmsteun van soortgelijke toestellen bedroeg 27.6 °C / 81.7 F (-0.6 °C / -1.1 F).
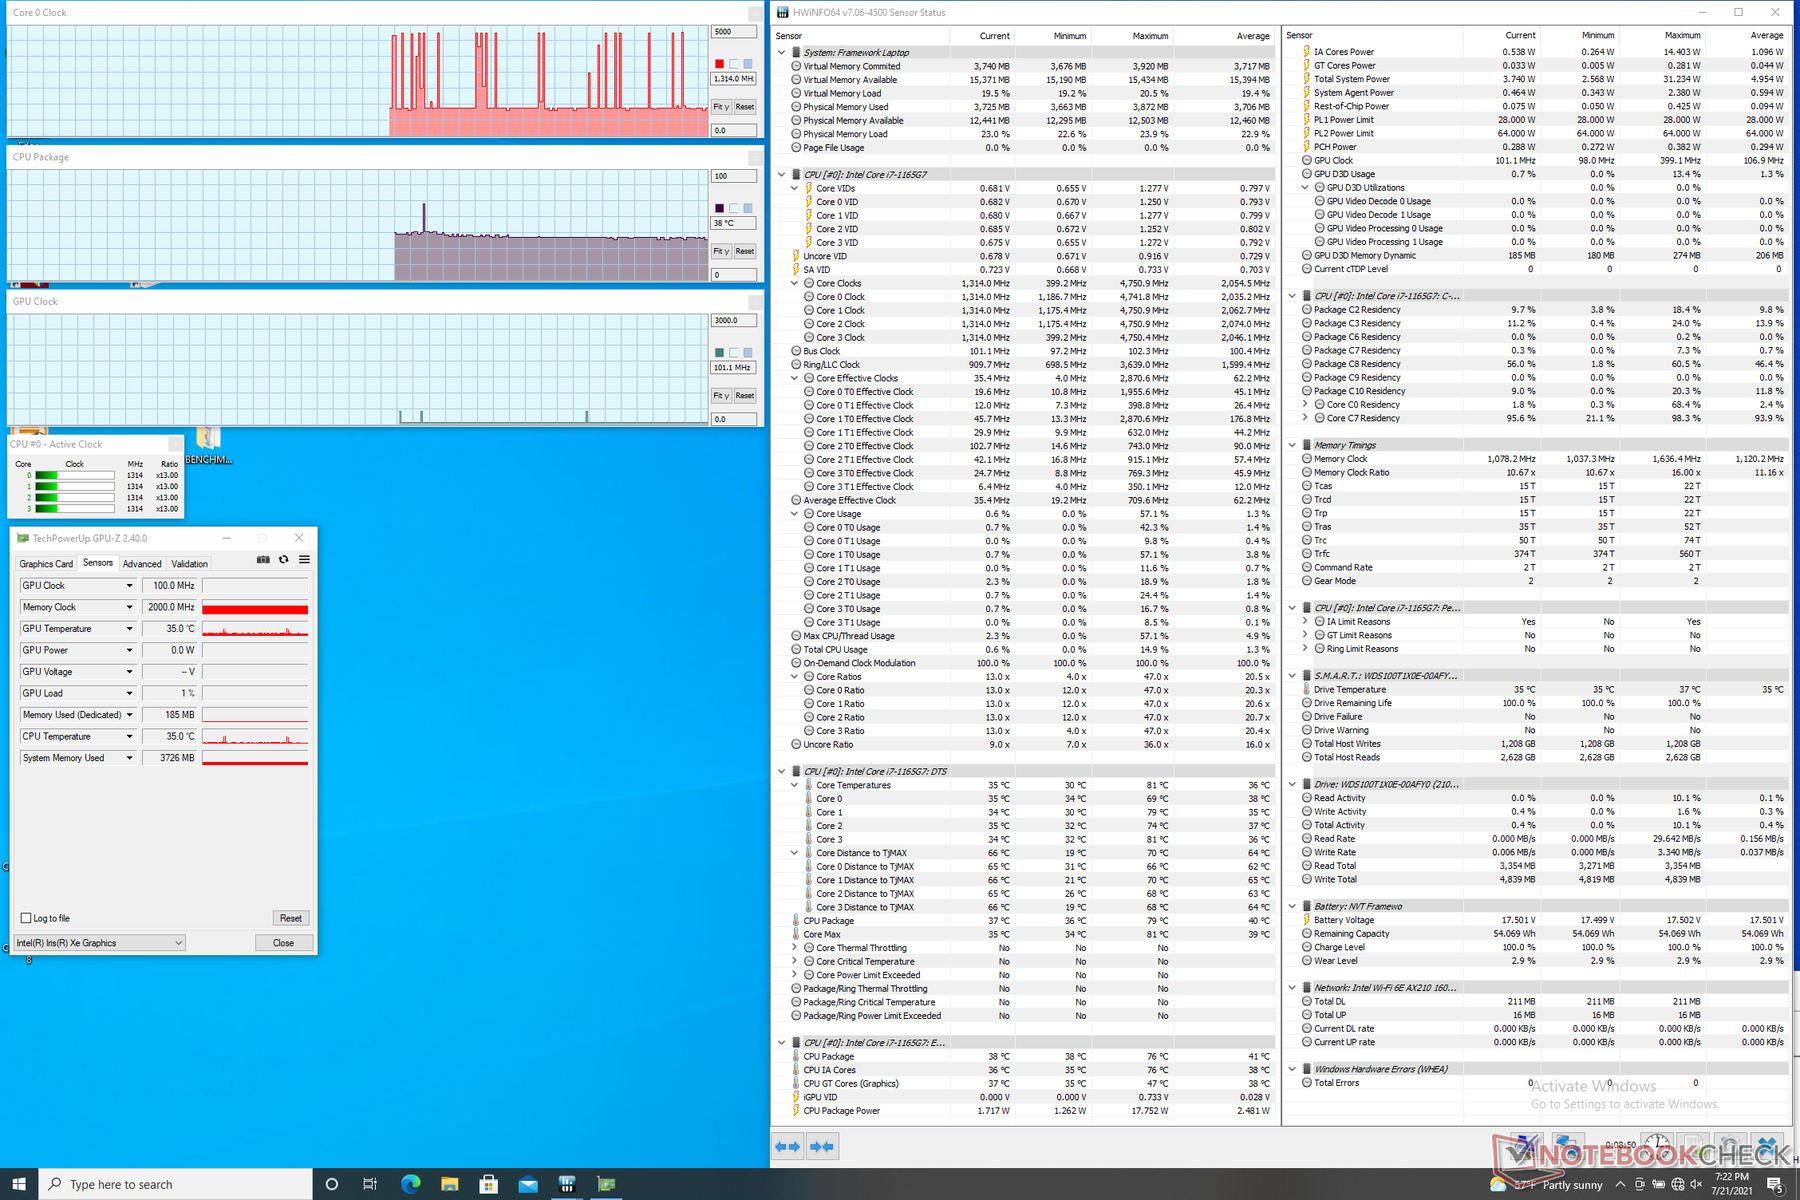
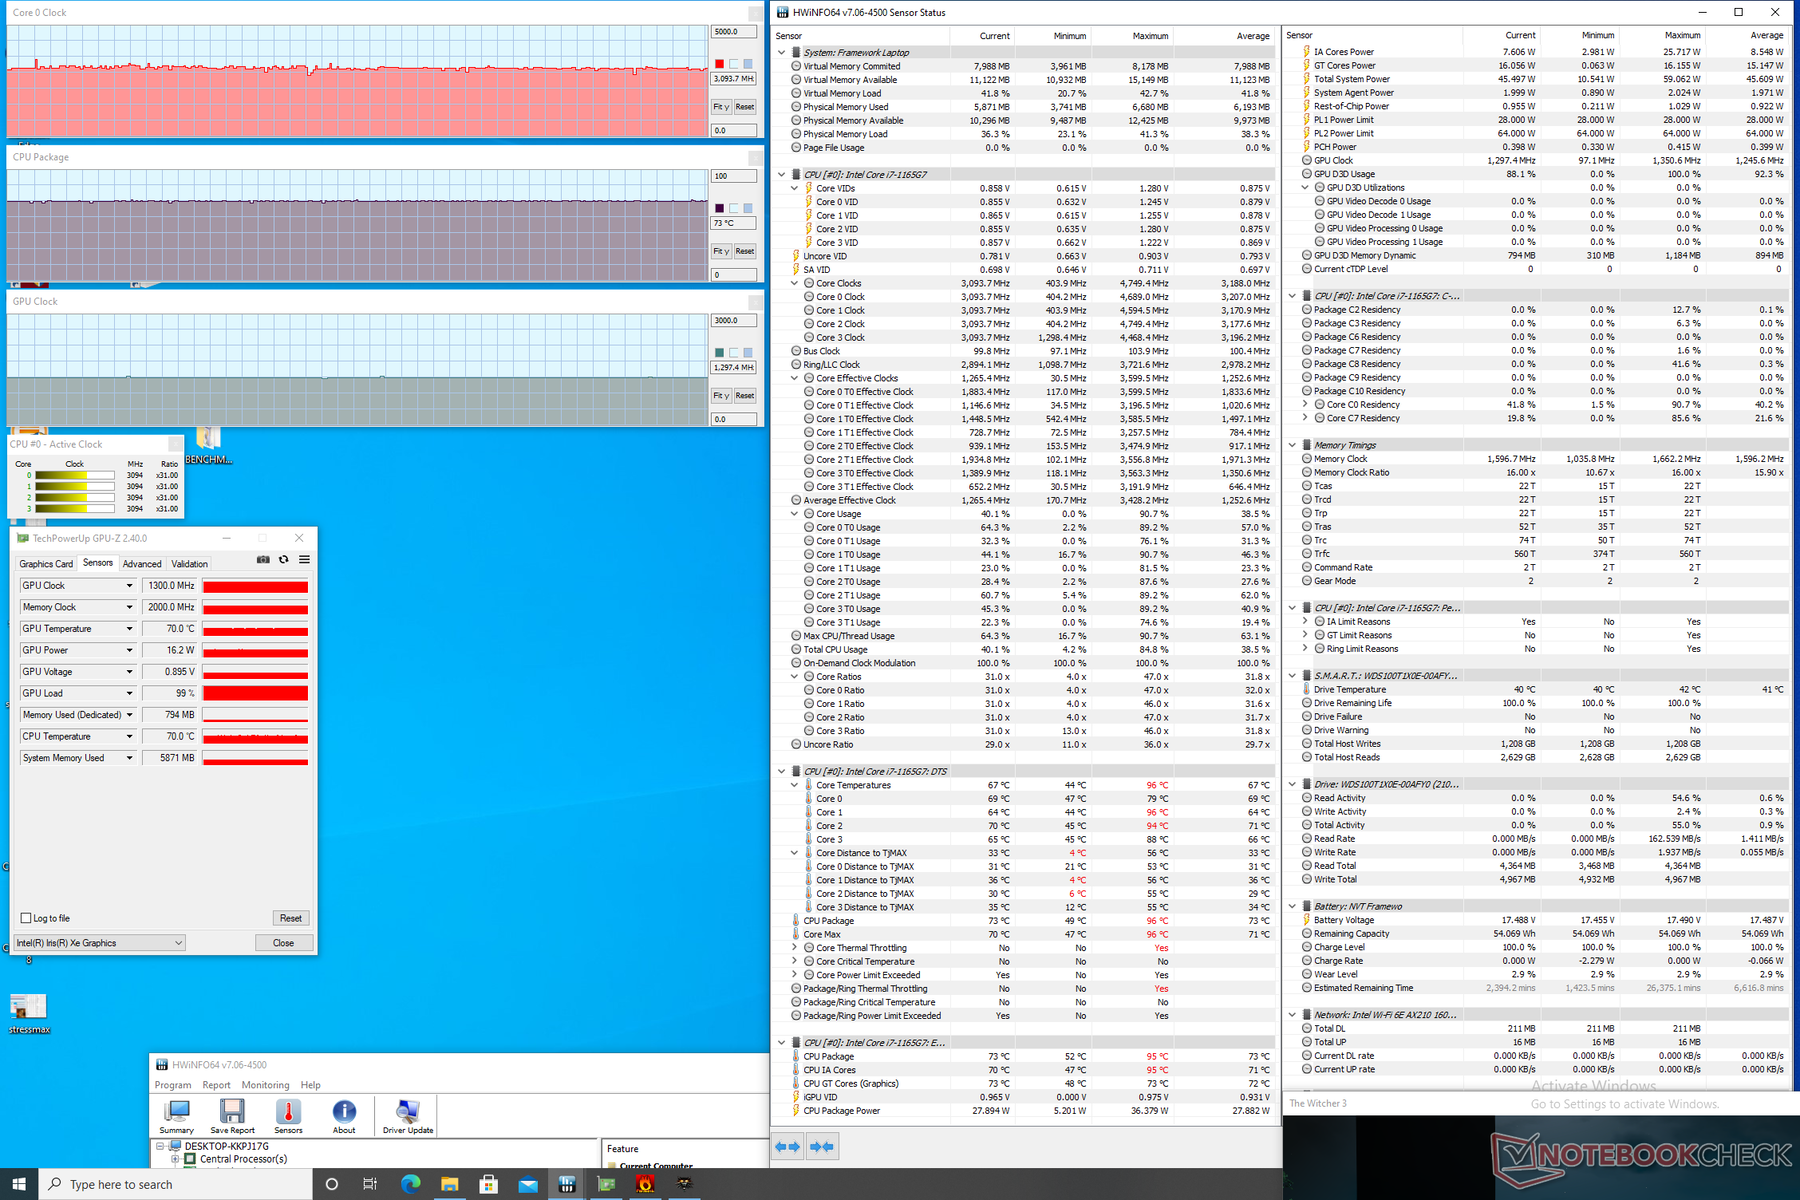
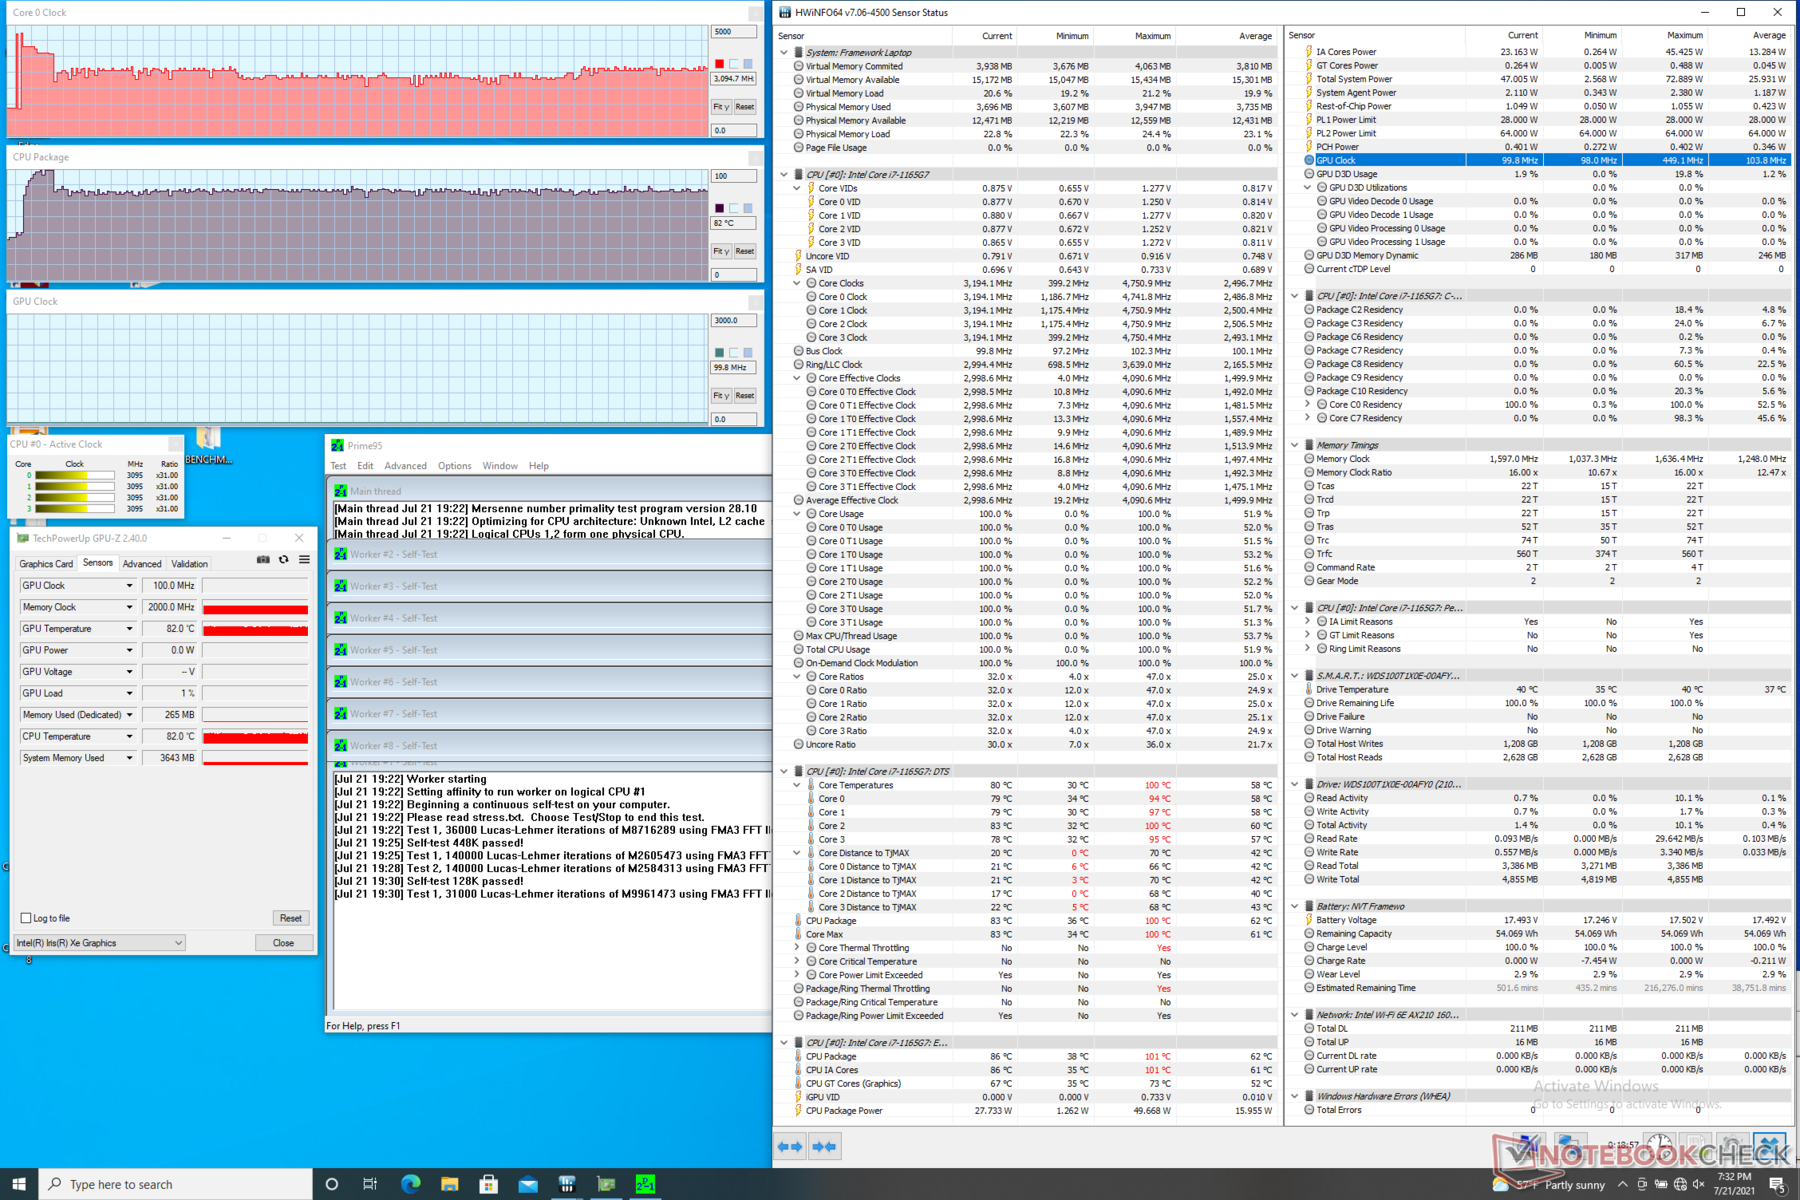
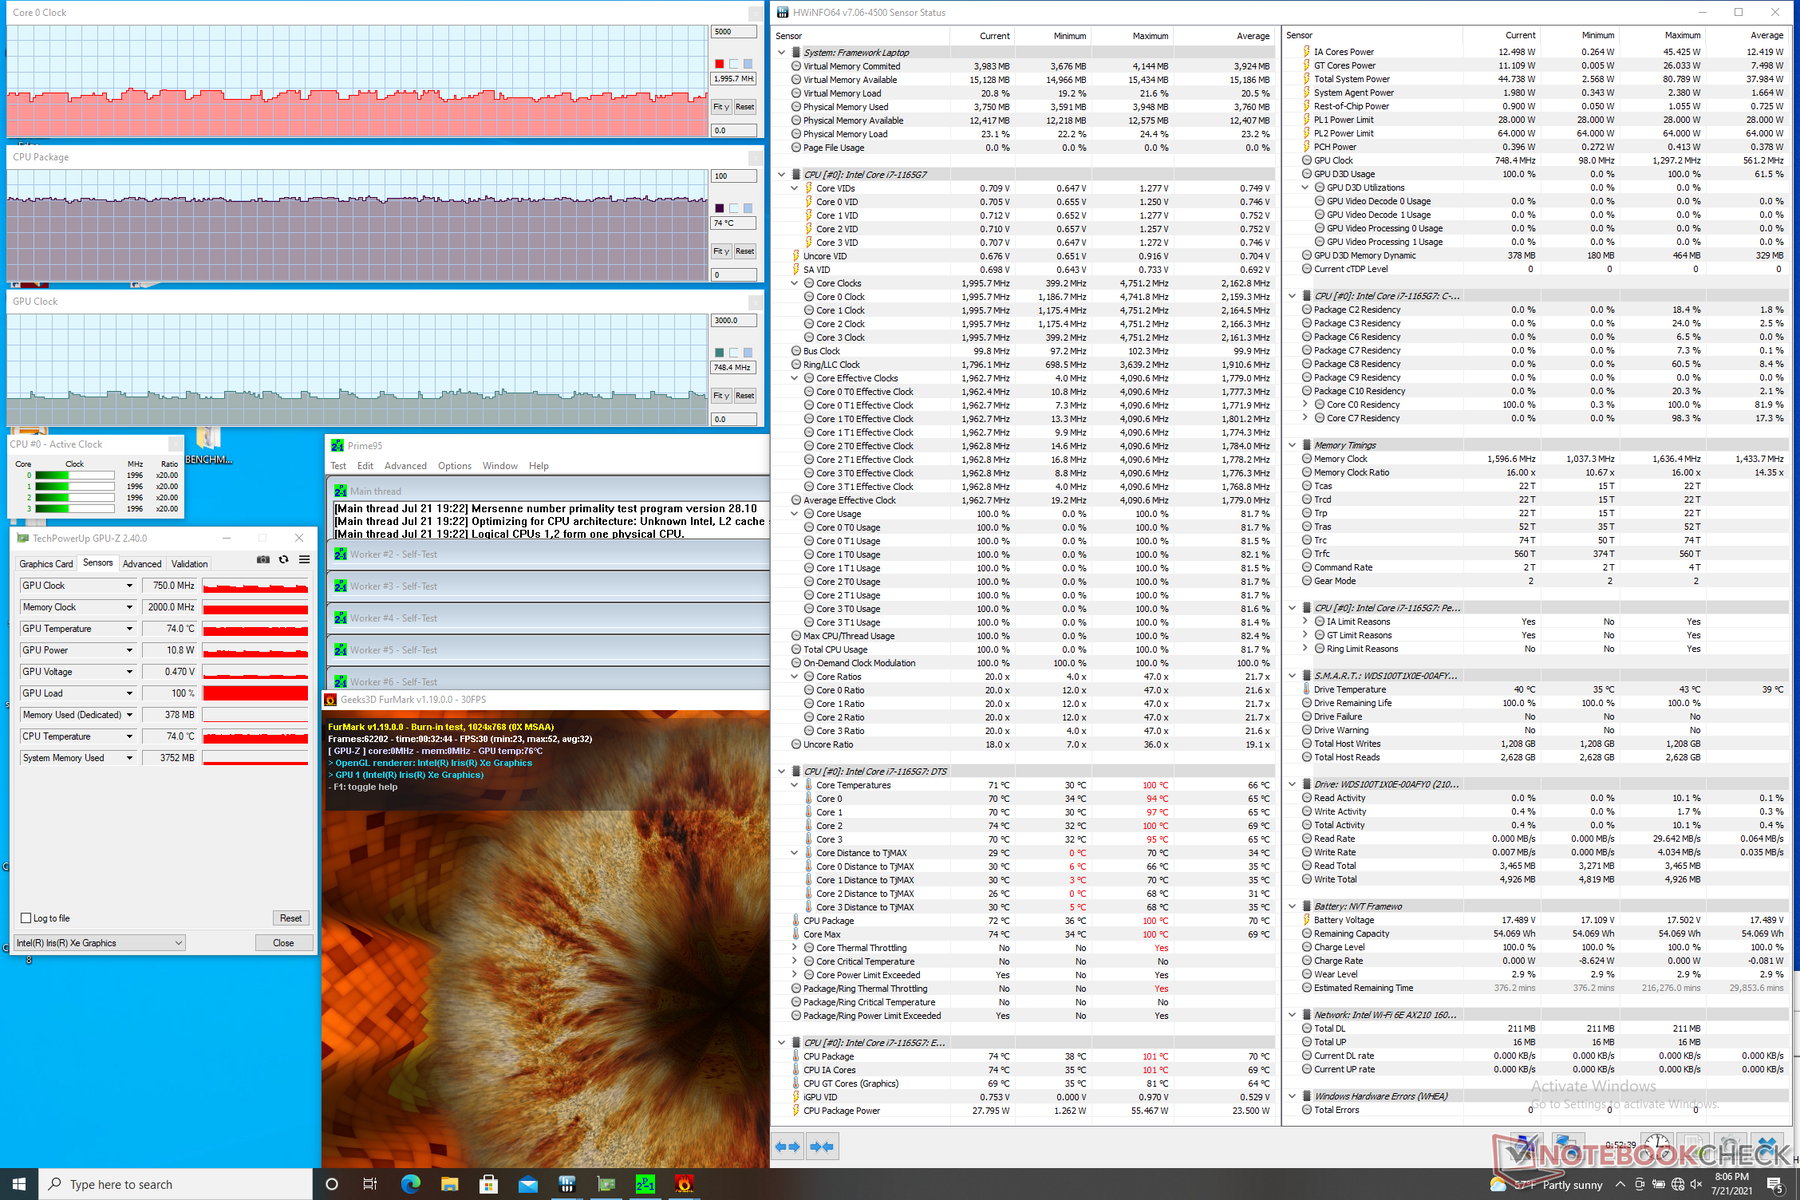
Stresstest
Het draaien van Prime95 zorgt ervoor dat de CPU een boost krijgt tot 4.1 GHz voor slechts een paar seconden tot het bereiken van een kerntemperatuur van 101 C. Kloksnelheden zouden dan dalen en stabiliseren rond 3.0 GHz om een koelere kerntemperatuur van 82 C te behouden ADATA XPG Xenia 14 met exact dezelfde Core i7 CPU resulteert in zowel hogere kernkloksnelheden als hogere temperaturen
Het draaien op batterijvoeding zal de prestaties enigszins beperken. Een 3DMark 11 test op batterijen zou een Physics en Graphics score opleveren van respectievelijk 10095 en 5563 punten, vergeleken met 11009 en 5702 punten op netstroom.
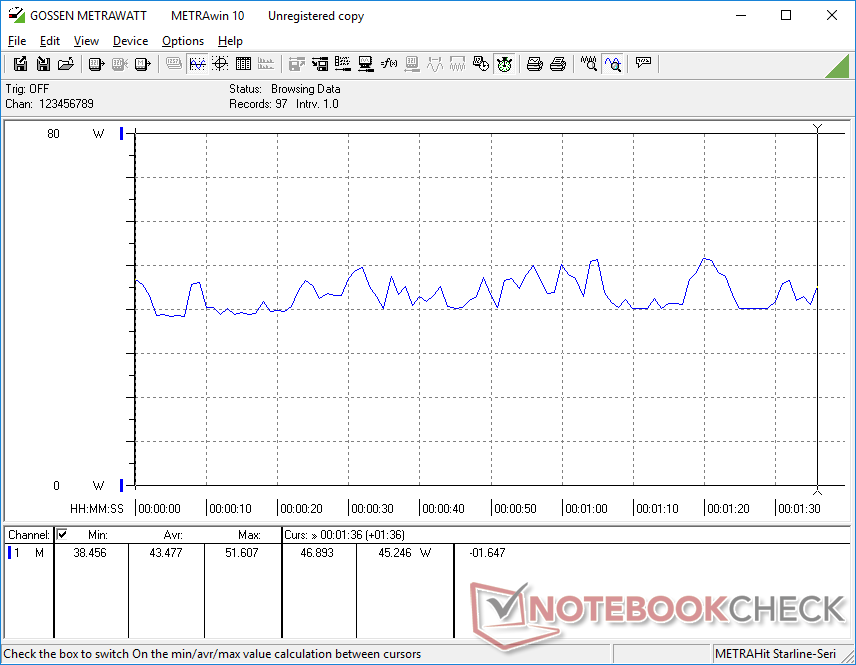
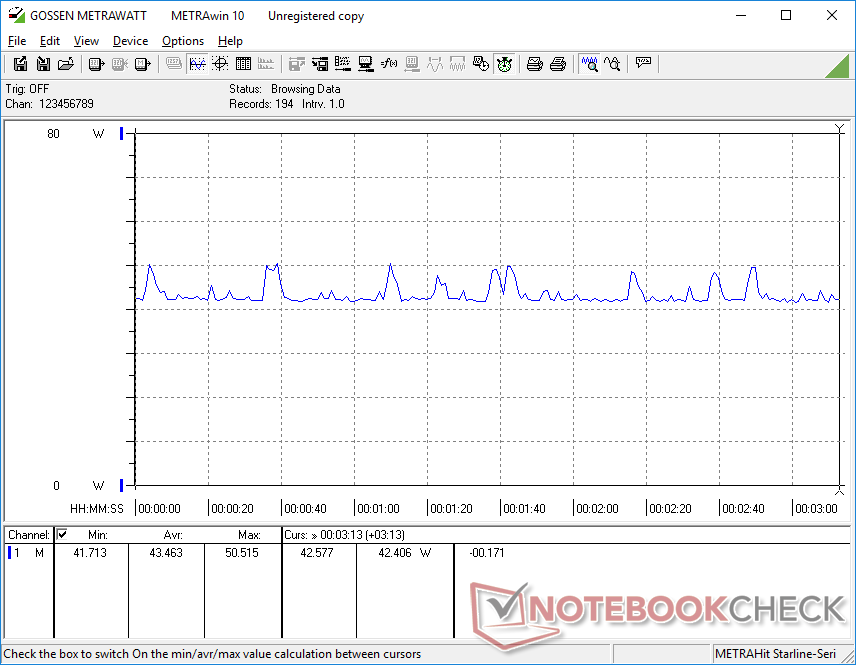
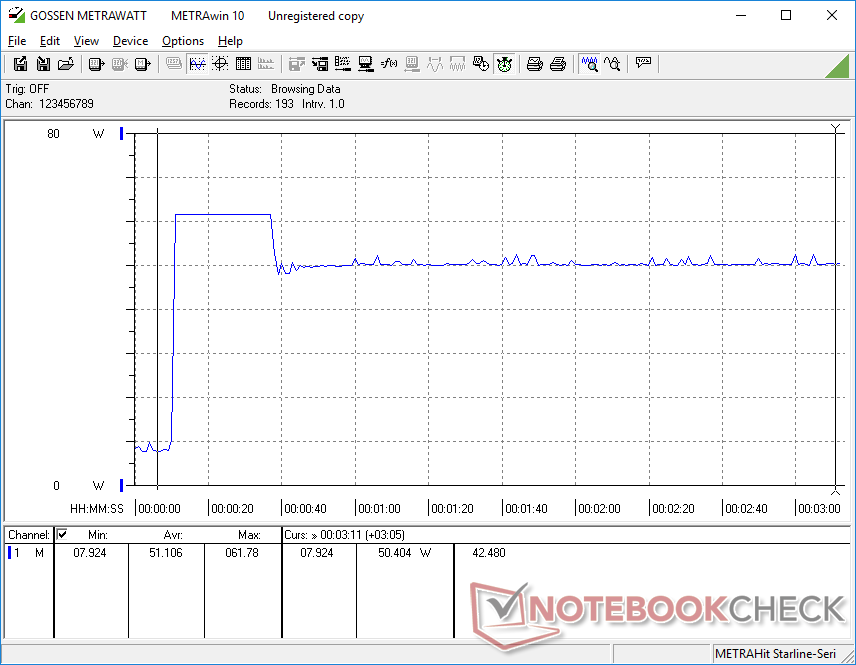
| CPU-klok (GHz)GPU-klok (MHz) GemiddeldeCPU-temperatuur (°C) |
| Systeem Idle |
| Prime95 Stress # 3.0 # 82 |
| Prime95 + FurMark Stress |
| Witcher 3 Stress |
Sprekers

Framework Laptop 13.5 audioanalyse
(±) | luidspreker luidheid is gemiddeld maar goed (78.2 dB)
Bas 100 - 315 Hz
(±) | verminderde zeebaars - gemiddeld 13.9% lager dan de mediaan
(±) | lineariteit van de lage tonen is gemiddeld (10.1% delta ten opzichte van de vorige frequentie)
Midden 400 - 2000 Hz
(+) | evenwichtige middens - slechts 4% verwijderd van de mediaan
(+) | de middentonen zijn lineair (6% delta ten opzichte van de vorige frequentie)
Hoog 2 - 16 kHz
(±) | higher highs - on average 5.2% higher than median
(+) | de hoge tonen zijn lineair (6.1% delta naar de vorige frequentie)
Algemeen 100 - 16.000 Hz
(±) | lineariteit van het totale geluid is gemiddeld (17.3% verschil met de mediaan)
Vergeleken met dezelfde klasse
» 26% van alle geteste apparaten in deze klasse waren beter, 7% vergelijkbaar, 67% slechter
» De beste had een delta van 7%, het gemiddelde was 21%, de slechtste was 53%
Vergeleken met alle geteste toestellen
» 33% van alle geteste apparaten waren beter, 8% gelijk, 59% slechter
» De beste had een delta van 4%, het gemiddelde was 23%, de slechtste was 134%
Apple MacBook 12 (Early 2016) 1.1 GHz audioanalyse
(+) | luidsprekers kunnen relatief luid spelen (83.6 dB)
Bas 100 - 315 Hz
(±) | verminderde zeebaars - gemiddeld 11.3% lager dan de mediaan
(±) | lineariteit van de lage tonen is gemiddeld (14.2% delta ten opzichte van de vorige frequentie)
Midden 400 - 2000 Hz
(+) | evenwichtige middens - slechts 2.4% verwijderd van de mediaan
(+) | de middentonen zijn lineair (5.5% delta ten opzichte van de vorige frequentie)
Hoog 2 - 16 kHz
(+) | evenwichtige hoogtepunten - slechts 2% verwijderd van de mediaan
(+) | de hoge tonen zijn lineair (4.5% delta naar de vorige frequentie)
Algemeen 100 - 16.000 Hz
(+) | het totale geluid is lineair (10.2% verschil met de mediaan)
Vergeleken met dezelfde klasse
» 7% van alle geteste apparaten in deze klasse waren beter, 2% vergelijkbaar, 90% slechter
» De beste had een delta van 5%, het gemiddelde was 18%, de slechtste was 53%
Vergeleken met alle geteste toestellen
» 5% van alle geteste apparaten waren beter, 1% gelijk, 94% slechter
» De beste had een delta van 4%, het gemiddelde was 23%, de slechtste was 134%
Energy Management
Stroomverbruik
Het stroomverbruik is zeer vergelijkbaar met de Surface Laptop 4 13 aangezien ze dezelfde processors en schermgrootte hebben.
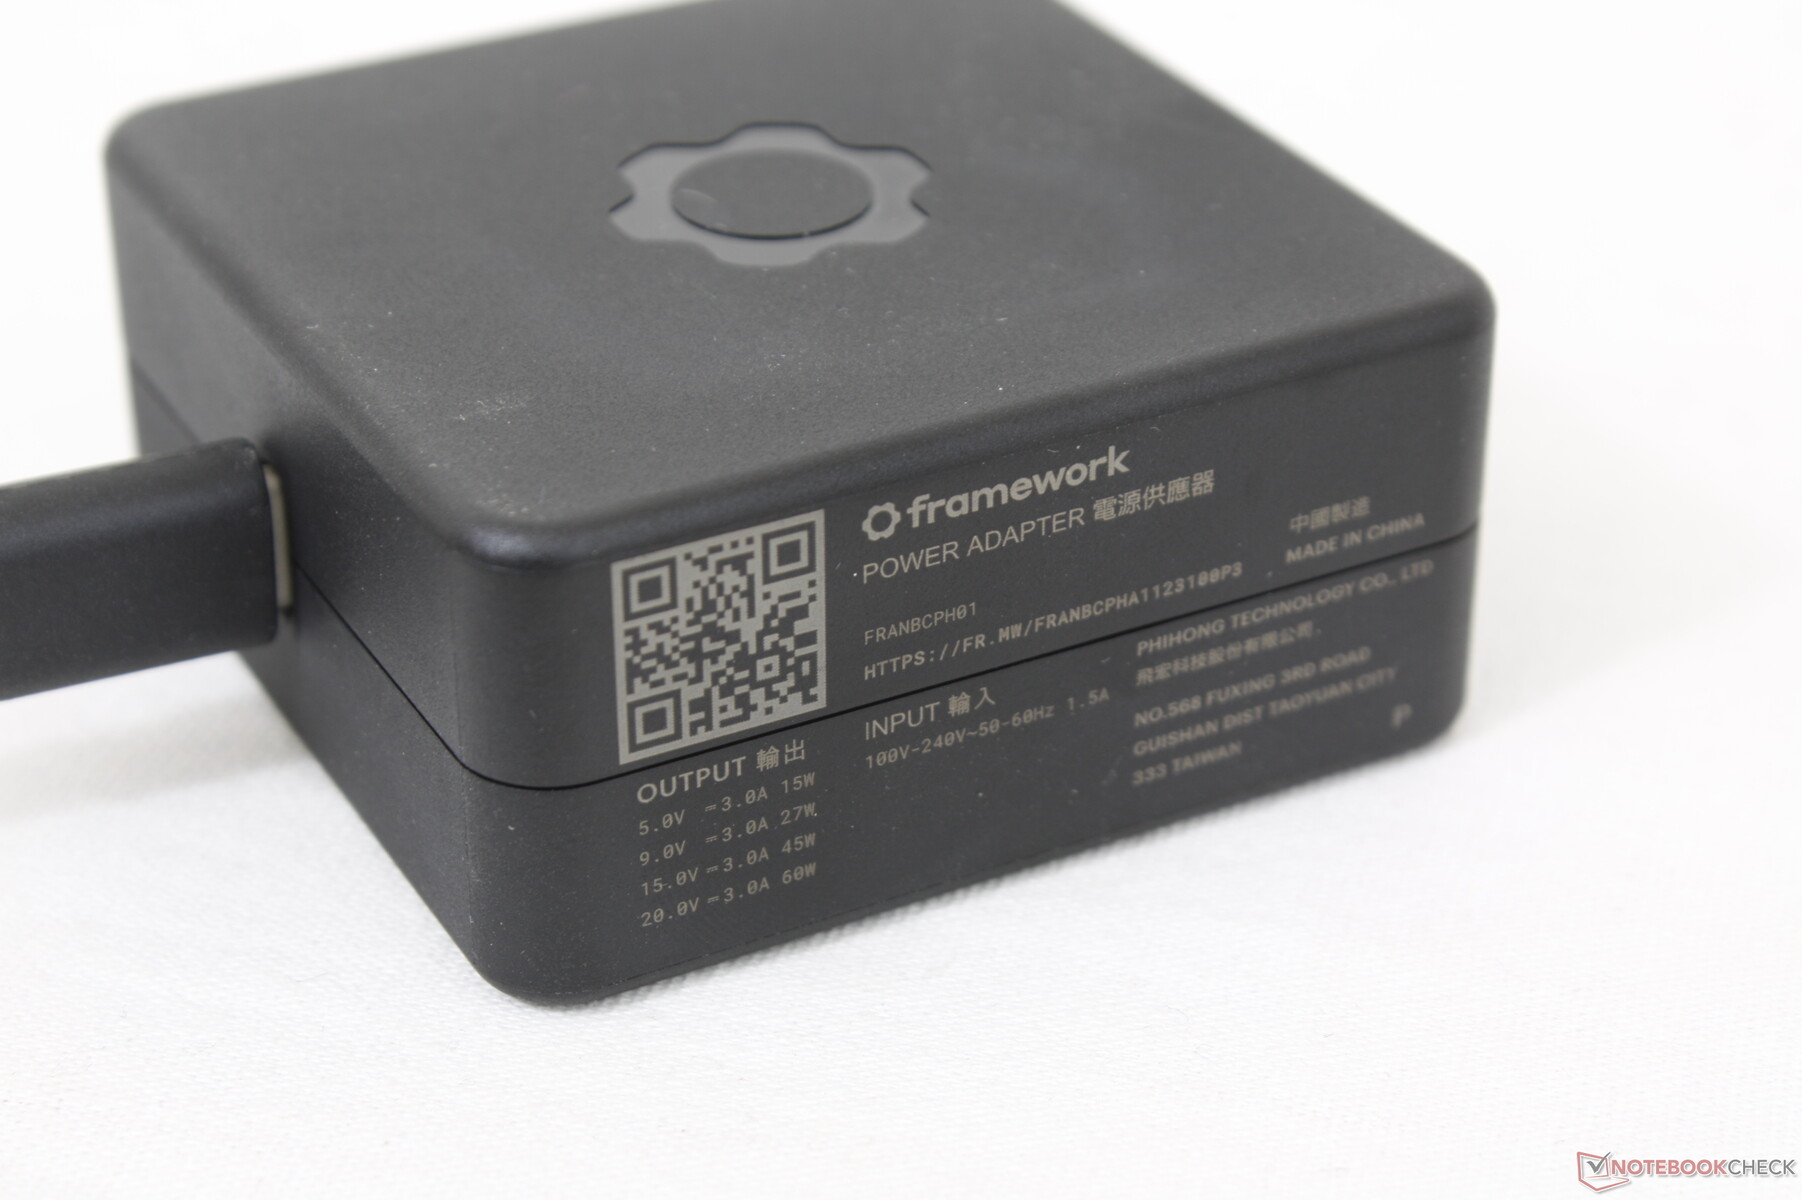
We zijn in staat om een maximaal verbruik van 61,8 W te meten van de kleine (~5,8 x 5,8 x 2,7 cm) 60 W AC-adapter. Dit tarief is slechts tijdelijk vanwege de beperkte Turbo Boost van het chassis.

| Uit / Standby | |
| Inactief | |
| Belasting |
|
Key:
min: | |
| Framework Laptop 13.5 i7-1165G7, Iris Xe G7 96EUs, Western Digital WD_BLACK SN850 WDS100T1X0E, IPS, 2256x1504, 13.5" | HP Spectre x360 14-ea0378ng i7-1165G7, Iris Xe G7 96EUs, Intel Optane Memory H10 with Solid State Storage 32GB + 1TB HBRPEKNX0203AH(L/H), OLED, 3000x2000, 13.5" | Microsoft Surface Laptop 4 13 i7 i7-1185G7, Iris Xe G7 96EUs, Samsung PM991 MZ9LQ512HALU, IPS, 2256x1504, 13.5" | Lenovo ThinkPad X1 Titanium Yoga G1 20QA001RGE i7-1160G7, Iris Xe G7 96EUs, Toshiba BG4 KBG40ZNT512G, IPS, 2256x1504, 13.5" | HP ProBook x360 435 G8 R7-5800U R7 5800U, Vega 8, Samsung PM991 MZVLQ512HALU, IPS, 1920x1080, 13.3" | Lenovo Yoga 6 13 82ND0009US R5 5500U, Vega 7, WDC PC SN530 SDBPMPZ-265G, IPS, 1920x1080, 13.3" | |
|---|---|---|---|---|---|---|
| Power Consumption | -14% | 15% | 14% | 24% | 14% | |
| Idle Minimum * (Watt) | 4.3 | 6.3 -47% | 2.6 40% | 3.9 9% | 3.2 26% | 5 -16% |
| Idle Average * (Watt) | 8.2 | 11.2 -37% | 6 27% | 7.3 11% | 5.5 33% | 6.3 23% |
| Idle Maximum * (Watt) | 8.7 | 13.3 -53% | 8.2 6% | 10.3 -18% | 6.4 26% | 6.9 21% |
| Load Average * (Watt) | 43.5 | 32 26% | 41.4 5% | 30.6 30% | 35.5 18% | 41.5 5% |
| Witcher 3 ultra * (Watt) | 43.5 | 25.5 41% | 36.4 16% | 33.2 24% | ||
| Load Maximum * (Watt) | 61.8 | 35.6 42% | 64.1 -4% | 57.1 8% | 47.5 23% | 46.5 25% |
* ... kleiner is beter
Power Consumption Witcher 3 / Stresstest
Levensduur batterij
De WLAN runtimes zijn vergelijkbaar met die van de Spectre x360 14 of Surface Laptop 4 13 met bijna 8 uur browsen in de echte wereld.
Opladen van leeg naar volledig duurt iets minder dan 2 uur. Het opladen gebeurt via USB-C, wat betekent dat het systeem niet opnieuw kan worden opgeladen als je besluit om alle vier de poorten in iets anders dan USB-C te veranderen.
| Framework Laptop 13.5 i7-1165G7, Iris Xe G7 96EUs, 55 Wh | HP Spectre x360 14-ea0378ng i7-1165G7, Iris Xe G7 96EUs, 66 Wh | Microsoft Surface Laptop 4 13 i7 i7-1185G7, Iris Xe G7 96EUs, 47.4 Wh | Lenovo ThinkPad X1 Titanium Yoga G1 20QA001RGE i7-1160G7, Iris Xe G7 96EUs, 44.5 Wh | HP ProBook x360 435 G8 R7-5800U R7 5800U, Vega 8, 45 Wh | Lenovo Yoga 6 13 82ND0009US R5 5500U, Vega 7, 60 Wh | |
|---|---|---|---|---|---|---|
| Batterijduur | -2% | -5% | 5% | 19% | 65% | |
| WiFi v1.3 (h) | 8 | 7.8 -2% | 7.6 -5% | 8.4 5% | 9.5 19% | 13.2 65% |
| Reader / Idle (h) | 13.4 | 17.5 | ||||
| Load (h) | 2.6 | 1.4 | 1.9 | 1.1 | 2 |
Pro
Contra
Uitspraak
Vaak ontwerpen fabrikanten dunne en aantrekkelijke laptops die vervelend moeilijk of zelfs onmogelijk te repareren zijn. Zelfs eenvoudige upgrades zoals RAM of opslag worden meestal ontmoedigd. De Framework-laptop bewijst dat dunne en lichte modellen niet per se ten koste hoeven te gaan van de bruikbaarheid voor de eindgebruiker of van unieke functies zoals verwisselbare poorten ten gunste van draagbaarheid of formaat.
De Framework Laptop verslaat de Surface Laptop in zijn eigen spel. Hij is kleiner, aanzienlijk eenvoudiger te onderhouden en heeft meer geïntegreerde poorten zonder dat dit ten koste gaat van de prestaties of draagbaarheid.
Een paar dingen aan de Framework Laptop zijn voor verbetering vatbaar. Het deksel en de scharnieren in het bijzonder zijn zwakker dan op concurrerende Dell XPS 13, HP Spectre x360 14, Microsoft Surface Laptopof Lenovo ThinkBook modellen. Bovendien is het geluid van de ventilator luider bij een hogere belasting. Het zijn geen spelbrekers, maar stijvere scharnieren, een grotere en stillere koeloplossing en rand-tot-rand glasversterking voor het beeldscherm zouden de Framework nog beter maken.
Prijs en beschikbaarheid
Framework verscheept nu zijn laptop aan consumenten vanaf 749 dollar voor de Core i5-configuratie.
Framework Laptop 13.5
- 26-07-2021 v7 (old)
Allen Ngo
Price comparison

