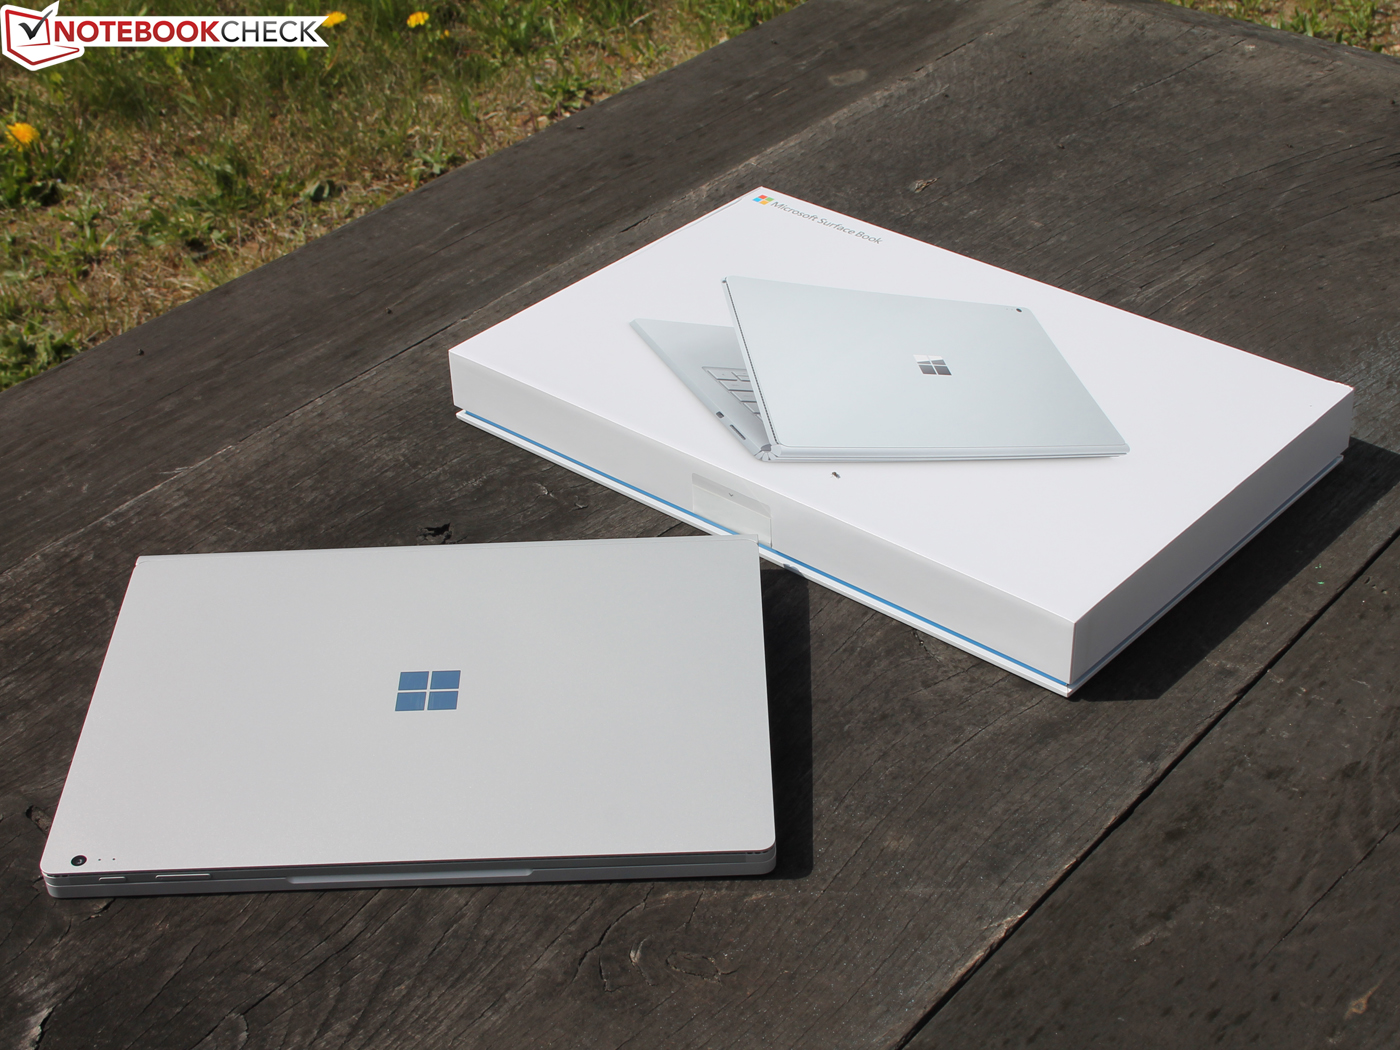
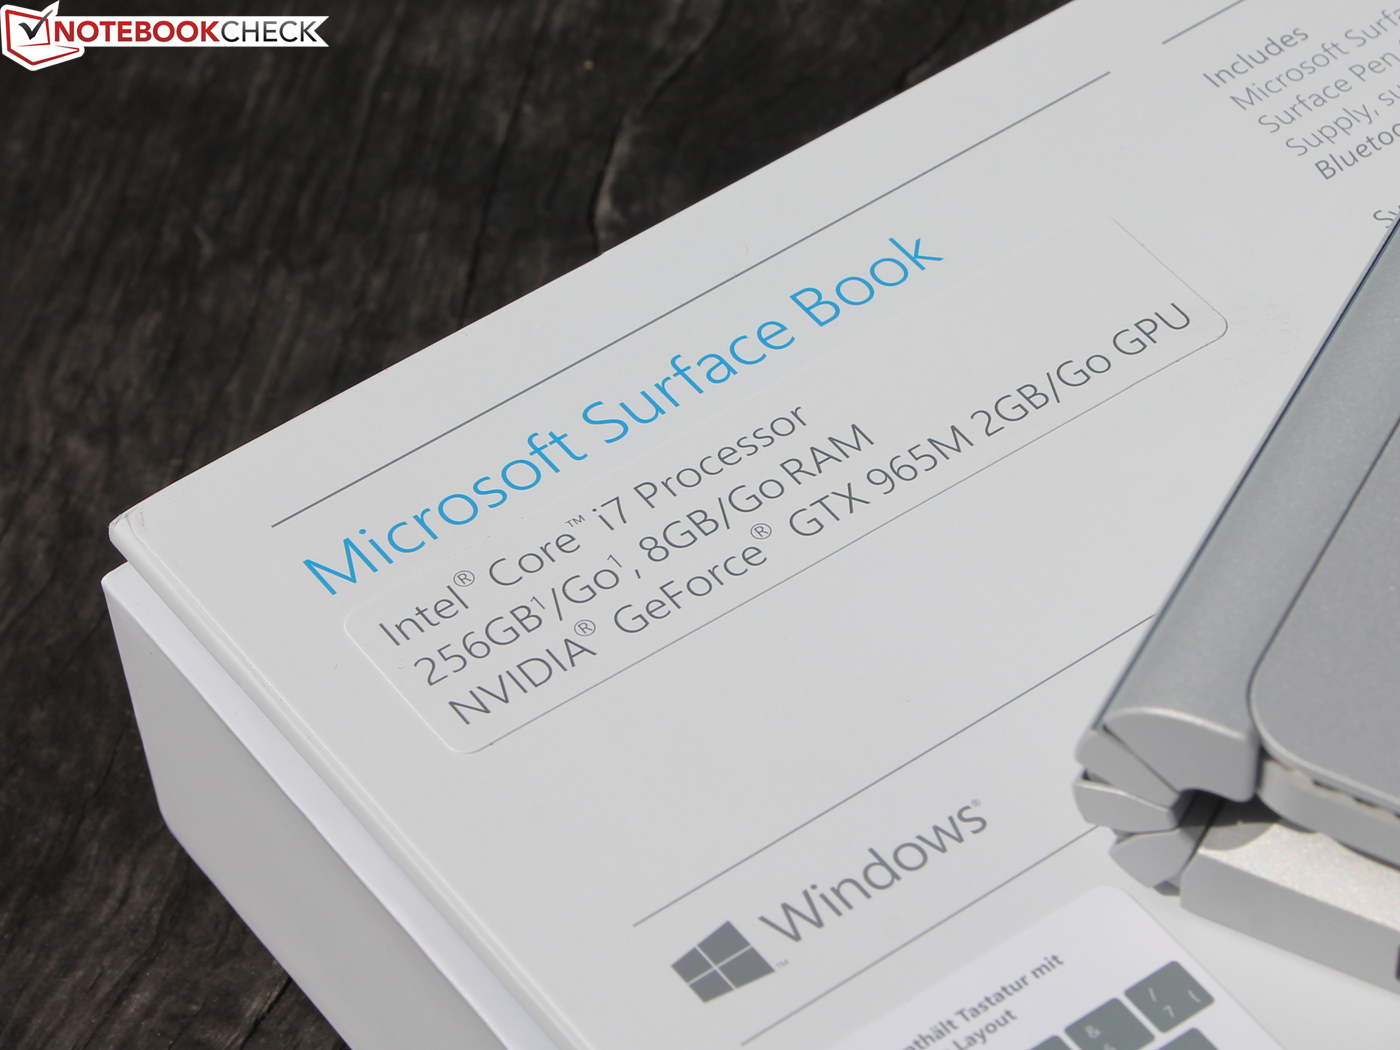
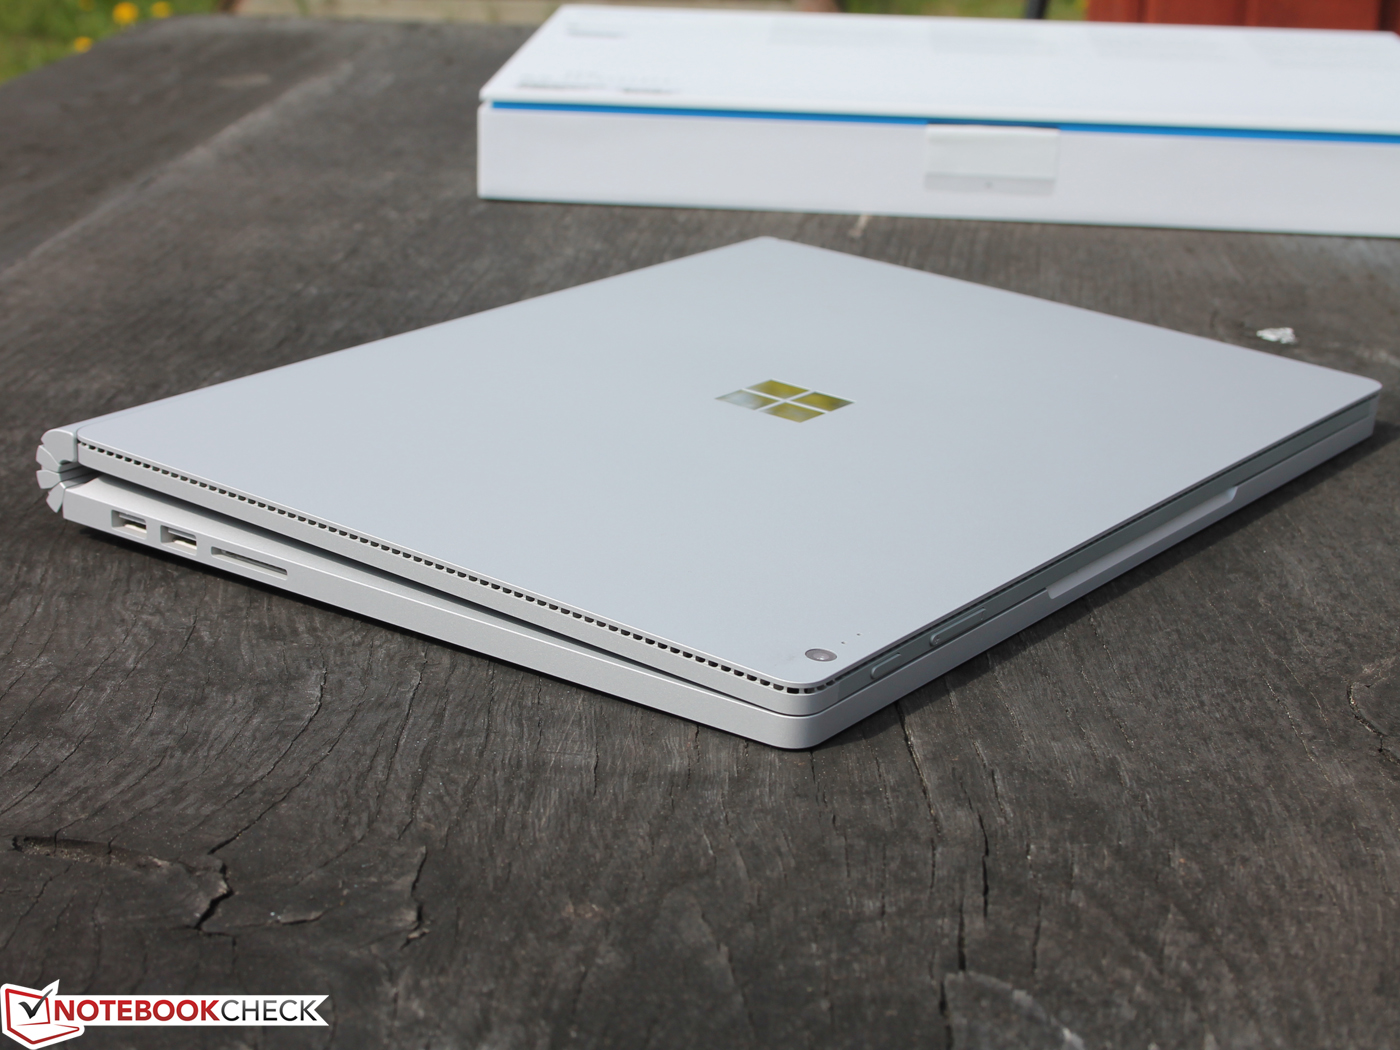
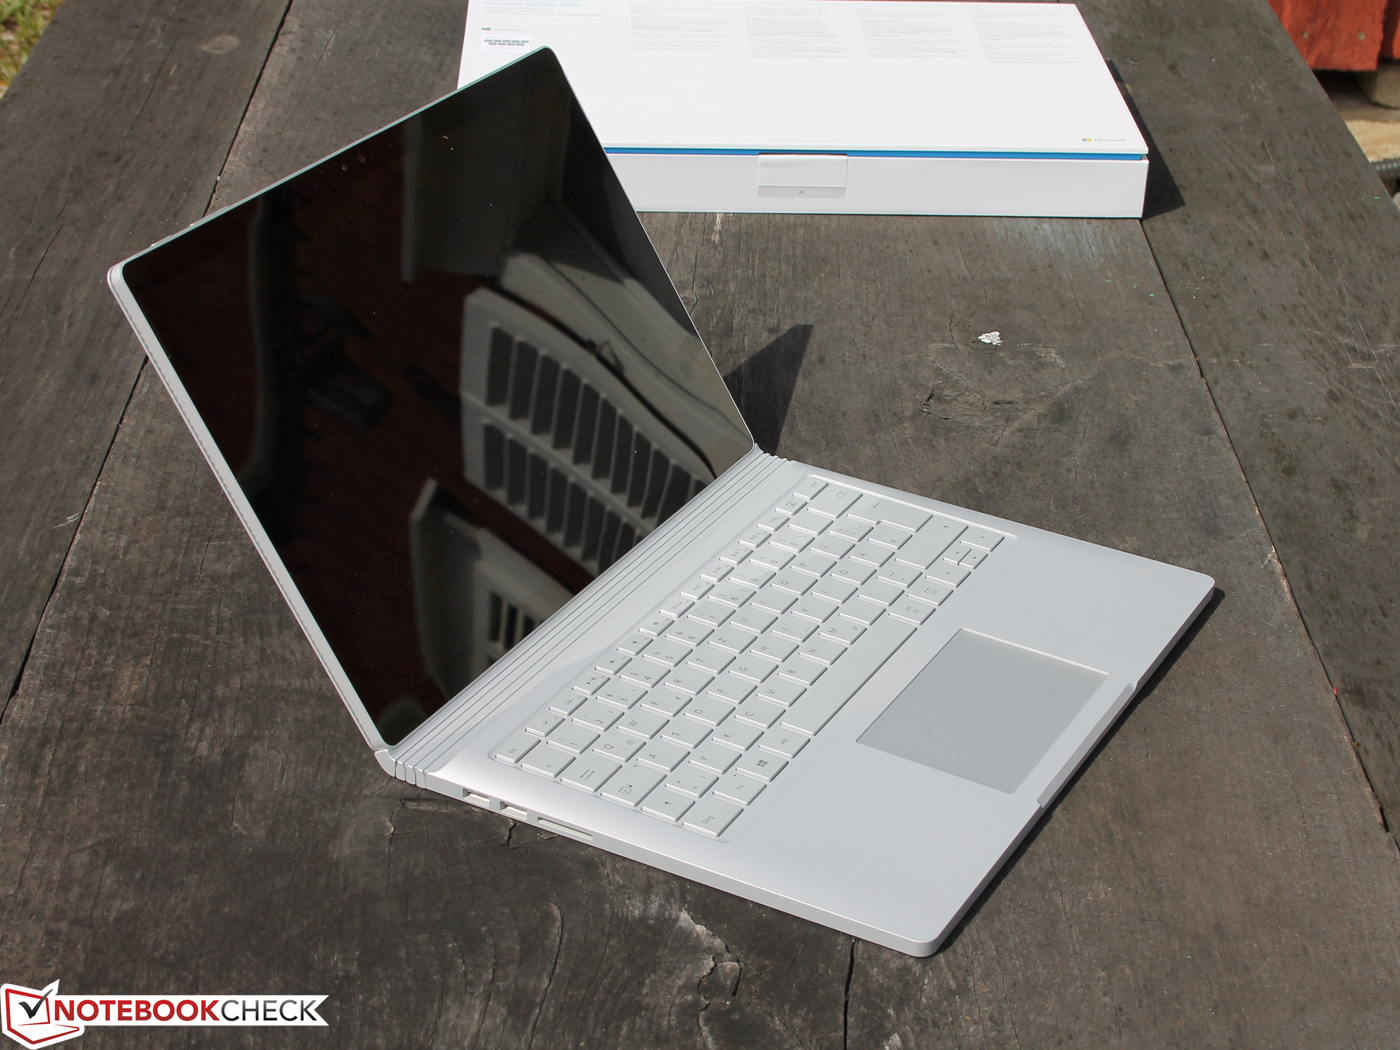
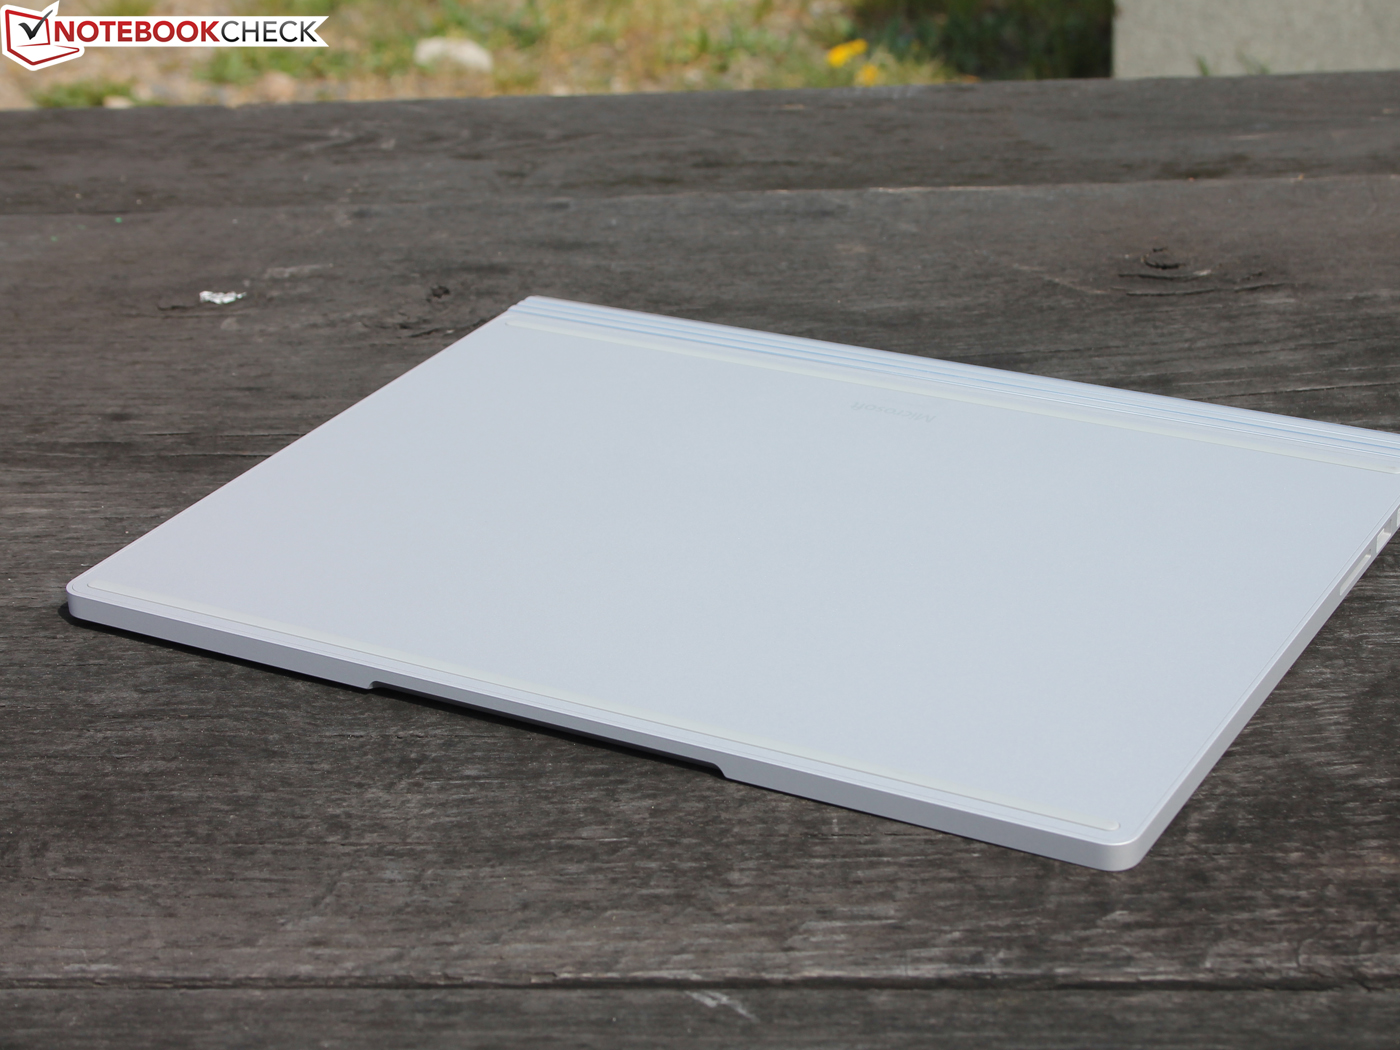
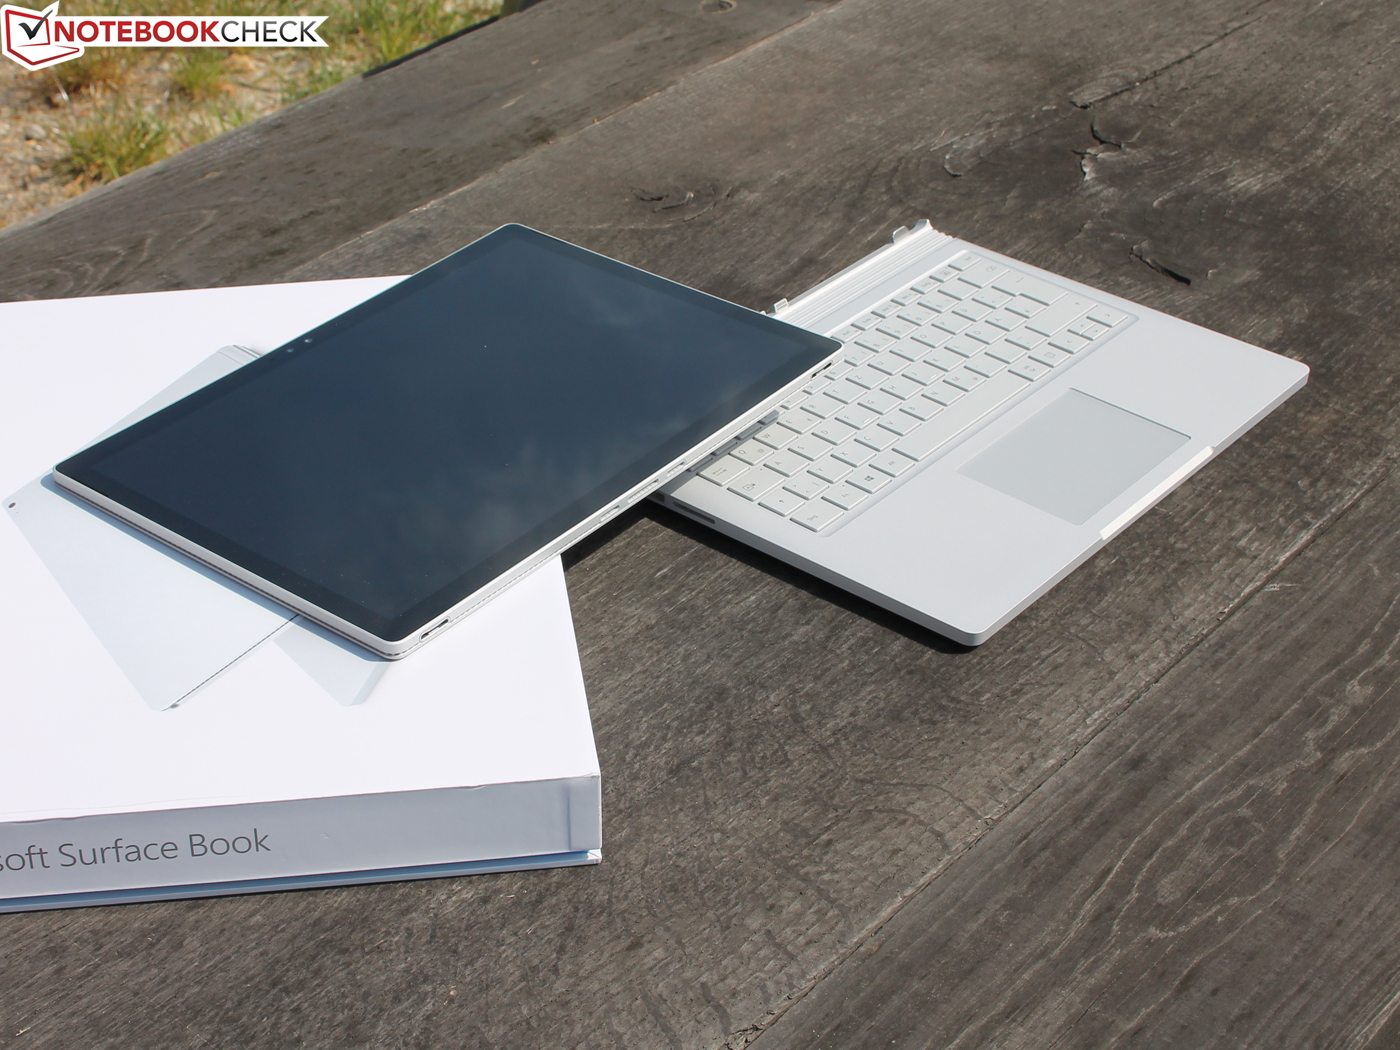
Kort testrapport Microsoft Surface Book met Performance Base (GTX 965M) Convertible
| |||||||||||||||||||||||||
Helderheidsverdeling: 86 %
Helderheid in Batterij-modus: 459 cd/m²
Contrast: 1241:1 (Zwart: 0.37 cd/m²)
ΔE ColorChecker Calman: 2.28 | ∀{0.5-29.43 Ø4.71}
ΔE Greyscale Calman: 2.48 | ∀{0.09-98 Ø4.96}
96% sRGB (Argyll 1.6.3 3D)
62% AdobeRGB 1998 (Argyll 1.6.3 3D)
67.6% AdobeRGB 1998 (Argyll 3D)
95.4% sRGB (Argyll 3D)
66.4% Display P3 (Argyll 3D)
Gamma: 2.5
CCT: 8602 K
| Microsoft Surface Book with Performance Base Panasonic MEI96A2, , 3000x2000, 13.5" | Microsoft Surface Book Core i5 3000x2000, 13.5" | Microsoft Surface Pro 4, Core i5, 128GB Samsung 123YL01-001 ID: SDC3853, , 2736x1824, 12.3" | HP Spectre x360 15-bl002xx UHD UWVA eDP BrightView WLED-backlit , , 3840x2160, 15.6" | Lenovo Yoga 710-14IKB 80V4002HGE AU Optronics B140HAN03.0, , 1920x1080, 14" | Asus UX310UQ-FC396T AU Optronics AUO272D, , 1920x1080, 13.3" | Apple MacBook Pro 13 2016 (2.9 GHz) APPA033, , 2560x1600, 13.3" | |
|---|---|---|---|---|---|---|---|
| Display | 1% | -1% | -4% | -6% | -3% | 28% | |
| Display P3 Coverage (%) | 66.4 | 67 1% | 65 -2% | 67.9 2% | 62 -7% | 64.1 -3% | 99.2 49% |
| sRGB Coverage (%) | 95.4 | 95.8 0% | 96.5 1% | 88.2 -8% | 89.5 -6% | 92.2 -3% | 99.9 5% |
| AdobeRGB 1998 Coverage (%) | 67.6 | 68.9 2% | 67 -1% | 64.4 -5% | 63.3 -6% | 65.3 -3% | 87.6 30% |
| Response Times | 16% | 21% | 12% | 12% | 46% | -10% | |
| Response Time Grey 50% / Grey 80% * (ms) | 61 ? | 48.4 ? 21% | 46 ? 25% | 44 ? 28% | 53 ? 13% | 31 ? 49% | 47.2 ? 23% |
| Response Time Black / White * (ms) | 37 ? | 32.8 ? 11% | 31.2 ? 16% | 38.8 ? -5% | 33 ? 11% | 21 ? 43% | 53 ? -43% |
| PWM Frequency (Hz) | 50 ? | 1000 ? | 50 ? | 192 ? | |||
| Screen | 10% | -13% | -12% | -76% | -43% | 10% | |
| Brightness middle (cd/m²) | 459 | 430.9 -6% | 413 -10% | 351.5 -23% | 340 -26% | 362 -21% | 569 24% |
| Brightness (cd/m²) | 423 | 410 -3% | 396 -6% | 336 -21% | 302 -29% | 343 -19% | 542 28% |
| Brightness Distribution (%) | 86 | 93 8% | 87 1% | 83 -3% | 77 -10% | 92 7% | 90 5% |
| Black Level * (cd/m²) | 0.37 | 0.254 31% | 0.36 3% | 0.24 35% | 0.31 16% | 0.28 24% | 0.56 -51% |
| Contrast (:1) | 1241 | 1696 37% | 1147 -8% | 1465 18% | 1097 -12% | 1293 4% | 1016 -18% |
| Colorchecker dE 2000 * | 2.28 | 2.06 10% | 3.09 -36% | 3.3 -45% | 6.75 -196% | 5.08 -123% | 1.4 39% |
| Colorchecker dE 2000 max. * | 3.61 | 7.3 -102% | 12.4 -243% | 8.95 -148% | 2.9 20% | ||
| Greyscale dE 2000 * | 2.48 | 2.22 10% | 3.92 -58% | 1.9 23% | 8.47 -242% | 6.21 -150% | 1.8 27% |
| Gamma | 2.5 88% | 2.13 103% | 2.3 96% | 2.09 105% | 2.22 99% | 2.4 92% | 2.16 102% |
| CCT | 8602 76% | 6520 100% | 7333 89% | 6784 96% | 6557 99% | 6817 95% | 6877 95% |
| Color Space (Percent of AdobeRGB 1998) (%) | 62 | 64 3% | 61 -2% | 64.4 4% | 58 -6% | 60 -3% | 78.4 26% |
| Color Space (Percent of sRGB) (%) | 96 | 96 0% | 97 1% | 88.2 -8% | 89 -7% | 92 -4% | 99.3 3% |
| Totaal Gemiddelde (Programma / Instellingen) | 9% /
9% | 2% /
-5% | -1% /
-7% | -23% /
-50% | 0% /
-23% | 9% /
11% |
* ... kleiner is beter
Responstijd Scherm
| ↔ Responstijd Zwart naar Wit | ||
|---|---|---|
| 37 ms ... stijging ↗ en daling ↘ gecombineerd | ↗ 21 ms stijging | 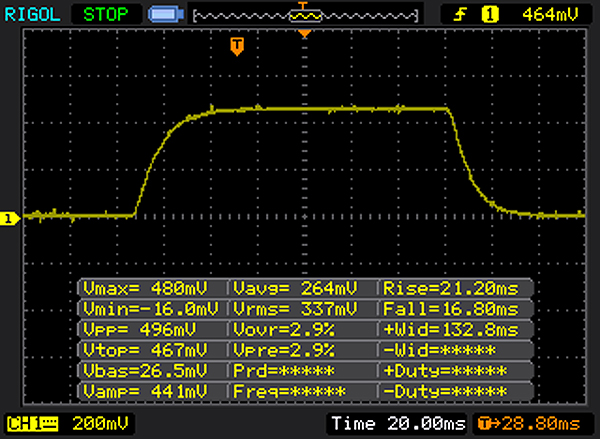 |
| ↘ 16 ms daling | ||
| Het scherm vertoonde trage responstijden in onze tests en is misschien te traag voor games. Ter vergelijking: alle testtoestellen variëren van 0.1 (minimum) tot 240 (maximum) ms. » 95 % van alle toestellen zijn beter. Dit betekent dat de gemeten responstijd slechter is dan het gemiddelde (19.8 ms) van alle geteste toestellen. | ||
| ↔ Responstijd 50% Grijs naar 80% Grijs | ||
| 61 ms ... stijging ↗ en daling ↘ gecombineerd | ↗ 28 ms stijging | 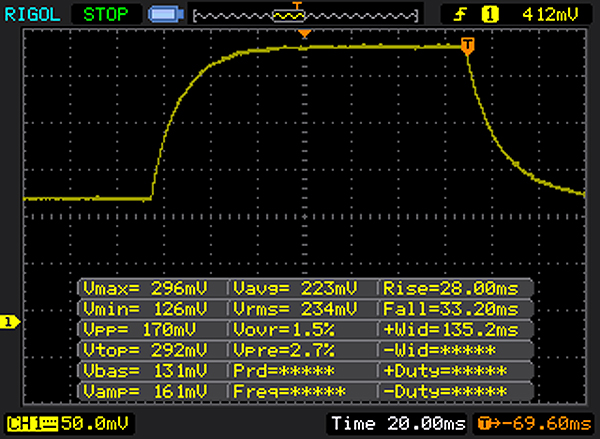 |
| ↘ 33 ms daling | ||
| Het scherm vertoonde trage responstijden in onze tests en is misschien te traag voor games. Ter vergelijking: alle testtoestellen variëren van 0.165 (minimum) tot 636 (maximum) ms. » 96 % van alle toestellen zijn beter. Dit betekent dat de gemeten responstijd slechter is dan het gemiddelde (31 ms) van alle geteste toestellen. | ||
Screen Flickering / PWM (Pulse-Width Modulation)
| Screen flickering / PWM niet waargenomen | ||
Ter vergelijking: 52 % van alle geteste toestellen maakten geen gebruik van PWM om de schermhelderheid te verlagen. Als het wel werd gebruikt, werd een gemiddelde van 7754 (minimum: 5 - maximum: 343500) Hz waargenomen. | ||
| PCMark 8 Home Score Accelerated v2 | 3040 punten | |
| PCMark 8 Creative Score Accelerated v2 | 4136 punten | |
| PCMark 8 Work Score Accelerated v2 | 3949 punten | |
Help | ||
| Microsoft Surface Book with Performance Base Toshiba NVMe THNSN5256GPU7 | Microsoft Surface Book Core i7 Samsung MZFLV512 NVMe | Lenovo Yoga 710-14IKB 80V4002HGE Samsung MZYTY256HDHP | HP Spectre x360 15-bl002xx Toshiba XG4 NVMe (THNSN5512GPUK) | Asus UX310UQ-FC396T SanDisk SD8SN8U512G1002 | Apple MacBook Pro 13 2016 (2.9 GHz) Apple SSD AP0256 | |
|---|---|---|---|---|---|---|
| CrystalDiskMark 3.0 | 11% | -35% | 21% | -37% | 36% | |
| Read Seq (MB/s) | 1017 | 953 -6% | 490.5 -52% | 1266 24% | 519 -49% | 1662 63% |
| Write Seq (MB/s) | 861 | 592 -31% | 452.3 -47% | 982 14% | 468 -46% | 1336 55% |
| Read 512 (MB/s) | 687 | 520 -24% | 386.2 -44% | 834 21% | 344.8 -50% | 1183 72% |
| Write 512 (MB/s) | 698 | 591 -15% | 219.9 -68% | 714 2% | 458 -34% | 1481 112% |
| Read 4k (MB/s) | 40.91 | 42.66 4% | 34.35 -16% | 40.72 0% | 28.45 -30% | 16.1 -61% |
| Write 4k (MB/s) | 108.6 | 136.3 26% | 91.2 -16% | 139.4 28% | 56.2 -48% | 23.5 -78% |
| Read 4k QD32 (MB/s) | 326.9 | 615 88% | 378.9 16% | 527 61% | 286 -13% | 657 101% |
| Write 4k QD32 (MB/s) | 347.1 | 517 49% | 152.2 -56% | 395.2 14% | 257.7 -26% | 419 21% |

| 3DMark 11 - 1280x720 Performance GPU | |
| Acer Aspire VN7-593G-73HP V15 Nitro BE | |
| HP Omen 15-ax007ng | |
| HP Omen 17-w010ng | |
| Asus G752VL-T7023T | |
| Microsoft Surface Book with Performance Base | |
| Acer TravelMate P658-M-59J7 Graphics Dock | |
| Asus Zenbook UX510UW-CN044T | |
| Acer Aspire V5-591G-50NC | |
| Asus F756UX-T7013T | |
| Apple MacBook Pro 13 2016 (2.9 GHz) | |
| HP Spectre x360 15-bl002xx | |
| Microsoft Surface Book Core i5 | |
| Asus UX310UQ-FC396T | |
| Lenovo Yoga 710-14IKB 80V4002HGE | |
| 3DMark | |
| 1280x720 Cloud Gate Standard Graphics | |
| Acer Aspire VN7-593G-73HP V15 Nitro BE | |
| HP Omen 15-ax007ng | |
| HP Omen 17-w010ng | |
| Dell XPS 15 9560 (i7-7700HQ, UHD) | |
| Dell XPS 15 9550 i7 FHD | |
| Acer TravelMate P658-M-59J7 Graphics Dock | |
| Asus Zenbook UX510UW-CN044T | |
| Acer Aspire V5-591G-50NC | |
| Asus F756UX-T7013T | |
| Asus G752VL-T7023T | |
| Microsoft Surface Book with Performance Base | |
| Apple MacBook Pro 13 2016 (2.9 GHz) | |
| HP Spectre x360 15-bl002xx | |
| Microsoft Surface Book Core i5 | |
| Asus UX310UQ-FC396T | |
| Lenovo Yoga 710-14IKB 80V4002HGE | |
| 1920x1080 Fire Strike Graphics | |
| Acer Aspire VN7-593G-73HP V15 Nitro BE | |
| Dell XPS 15 9560 (i7-7700HQ, UHD) | |
| HP Omen 15-ax007ng | |
| HP Omen 17-w010ng | |
| Asus G752VL-T7023T | |
| Microsoft Surface Book with Performance Base | |
| Dell XPS 15 9550 i7 FHD | |
| Asus Zenbook UX510UW-CN044T | |
| Acer TravelMate P658-M-59J7 Graphics Dock | |
| Acer Aspire V5-591G-50NC | |
| Asus F756UX-T7013T | |
| HP Spectre x360 15-bl002xx | |
| Microsoft Surface Book Core i5 | |
| Apple MacBook Pro 13 2016 (2.9 GHz) | |
| Asus UX310UQ-FC396T | |
| Lenovo Yoga 710-14IKB 80V4002HGE | |
| 3DMark 11 Performance | 5941 punten | |
| 3DMark Cloud Gate Standard Score | 8836 punten | |
| 3DMark Fire Strike Score | 4395 punten | |
Help | ||
| Rise of the Tomb Raider - 1920x1080 High Preset AA:FX AF:4x | |
| Acer Aspire VN7-593G-73HP V15 Nitro BE | |
| Dell XPS 15 9560 (i7-7700HQ, UHD) | |
| HP Omen 15-ax007ng | |
| Microsoft Surface Book with Performance Base | |
| Acer TravelMate P658-M-59J7 Graphics Dock | |
| Dell XPS 15 9550 i7 FHD | |
| HP Spectre x360 15-bl002xx | |
| Lenovo Yoga 710-14IKB 80V4002HGE | |
| Deus Ex Mankind Divided - 1920x1080 High Preset AF:4x | |
| Acer Aspire VN7-593G-73HP V15 Nitro BE | |
| Microsoft Surface Book with Performance Base | |
| Asus Zenbook UX510UW-CN044T | |
| The Witcher 3 - 1920x1080 Ultra Graphics & Postprocessing (HBAO+) | |
| Acer Aspire VN7-593G-73HP V15 Nitro BE | |
| Dell XPS 15 9560 (i7-7700HQ, UHD) | |
| Asus G752VL-T7023T | |
| Microsoft Surface Book with Performance Base | |
| Asus UX310UQ-FC396T | |
| lage | gem. | hoge | ultra | |
|---|---|---|---|---|
| BioShock Infinite (2013) | 128 | 118 | 49.9 | |
| The Witcher 3 (2015) | 31.3 | 17.4 | ||
| Rise of the Tomb Raider (2016) | 34.6 | 22.4 | ||
| Deus Ex Mankind Divided (2016) | 49 | 26.4 | 11.4 |
Geluidsniveau
| Onbelast |
| 29.4 / 29.4 / 29.7 dB (A) |
| Belasting |
| 39 / 40.2 dB (A) |
 | ||
30 dB stil 40 dB(A) hoorbaar 50 dB(A) luid |
||
min: | ||
(-) De maximumtemperatuur aan de bovenzijde bedraagt 47 °C / 117 F, vergeleken met het gemiddelde van 35.4 °C / 96 F, variërend van 19.6 tot 60 °C voor de klasse Convertible.
(-) De bodem warmt op tot een maximum van 47 °C / 117 F, vergeleken met een gemiddelde van 36.9 °C / 98 F
(+) Bij onbelast gebruik bedraagt de gemiddelde temperatuur voor de bovenzijde 28.1 °C / 83 F, vergeleken met het apparaatgemiddelde van 30.3 °C / 87 F.
(±) Bij het spelen van The Witcher 3 is de gemiddelde temperatuur voor de bovenzijde 33.7 °C / 93 F, vergeleken met het apparaatgemiddelde van 30.3 °C / 87 F.
(-) De palmsteunen en het touchpad kunnen zeer heet aanvoelen met een maximum van ###max## °C / 116.6 F.
(-) De gemiddelde temperatuur van de handpalmsteun van soortgelijke toestellen bedroeg 28 °C / 82.4 F (-19 °C / -34.2 F).
Microsoft Surface Book with Performance Base audioanalyse
(-) | niet erg luide luidsprekers (63 dB)
Bas 100 - 315 Hz
(±) | verminderde zeebaars - gemiddeld 5.9% lager dan de mediaan
(±) | lineariteit van de lage tonen is gemiddeld (7.1% delta ten opzichte van de vorige frequentie)
Midden 400 - 2000 Hz
(+) | evenwichtige middens - slechts 4.3% verwijderd van de mediaan
(±) | lineariteit van de middentonen is gemiddeld (8.1% delta ten opzichte van de vorige frequentie)
Hoog 2 - 16 kHz
(+) | evenwichtige hoogtepunten - slechts 4.7% verwijderd van de mediaan
(±) | lineariteit van de hoogtepunten is gemiddeld (8% delta ten opzichte van de vorige frequentie)
Algemeen 100 - 16.000 Hz
(±) | lineariteit van het totale geluid is gemiddeld (19% verschil met de mediaan)
Vergeleken met dezelfde klasse
» 45% van alle geteste apparaten in deze klasse waren beter, 7% vergelijkbaar, 48% slechter
» De beste had een delta van 6%, het gemiddelde was 20%, de slechtste was 57%
Vergeleken met alle geteste toestellen
» 45% van alle geteste apparaten waren beter, 7% gelijk, 47% slechter
» De beste had een delta van 4%, het gemiddelde was 23%, de slechtste was 134%
Apple MacBook Pro 13 2016 (2.9 GHz) audioanalyse
(+) | luidsprekers kunnen relatief luid spelen (86.9 dB)
Bas 100 - 315 Hz
(±) | verminderde zeebaars - gemiddeld 13.2% lager dan de mediaan
(±) | lineariteit van de lage tonen is gemiddeld (10.7% delta ten opzichte van de vorige frequentie)
Midden 400 - 2000 Hz
(+) | evenwichtige middens - slechts 4.1% verwijderd van de mediaan
(+) | de middentonen zijn lineair (6.3% delta ten opzichte van de vorige frequentie)
Hoog 2 - 16 kHz
(+) | evenwichtige hoogtepunten - slechts 2.9% verwijderd van de mediaan
(+) | de hoge tonen zijn lineair (4% delta naar de vorige frequentie)
Algemeen 100 - 16.000 Hz
(+) | het totale geluid is lineair (12.2% verschil met de mediaan)
Vergeleken met dezelfde klasse
» 15% van alle geteste apparaten in deze klasse waren beter, 5% vergelijkbaar, 80% slechter
» De beste had een delta van 5%, het gemiddelde was 18%, de slechtste was 53%
Vergeleken met alle geteste toestellen
» 10% van alle geteste apparaten waren beter, 2% gelijk, 88% slechter
» De beste had een delta van 4%, het gemiddelde was 23%, de slechtste was 134%
HP Spectre x360 15-bl002xx audioanalyse
(±) | luidspreker luidheid is gemiddeld maar goed (72.9 dB)
Bas 100 - 315 Hz
(±) | verminderde zeebaars - gemiddeld 14.8% lager dan de mediaan
(±) | lineariteit van de lage tonen is gemiddeld (14% delta ten opzichte van de vorige frequentie)
Midden 400 - 2000 Hz
(+) | evenwichtige middens - slechts 4.4% verwijderd van de mediaan
(±) | lineariteit van de middentonen is gemiddeld (10.1% delta ten opzichte van de vorige frequentie)
Hoog 2 - 16 kHz
(+) | evenwichtige hoogtepunten - slechts 1.2% verwijderd van de mediaan
(+) | de hoge tonen zijn lineair (4.9% delta naar de vorige frequentie)
Algemeen 100 - 16.000 Hz
(±) | lineariteit van het totale geluid is gemiddeld (20.3% verschil met de mediaan)
Vergeleken met dezelfde klasse
» 68% van alle geteste apparaten in deze klasse waren beter, 9% vergelijkbaar, 24% slechter
» De beste had een delta van 5%, het gemiddelde was 17%, de slechtste was 45%
Vergeleken met alle geteste toestellen
» 53% van alle geteste apparaten waren beter, 8% gelijk, 39% slechter
» De beste had een delta van 4%, het gemiddelde was 23%, de slechtste was 134%
| Uit / Standby | |
| Inactief | |
| Belasting |
|
Key:
min: | |
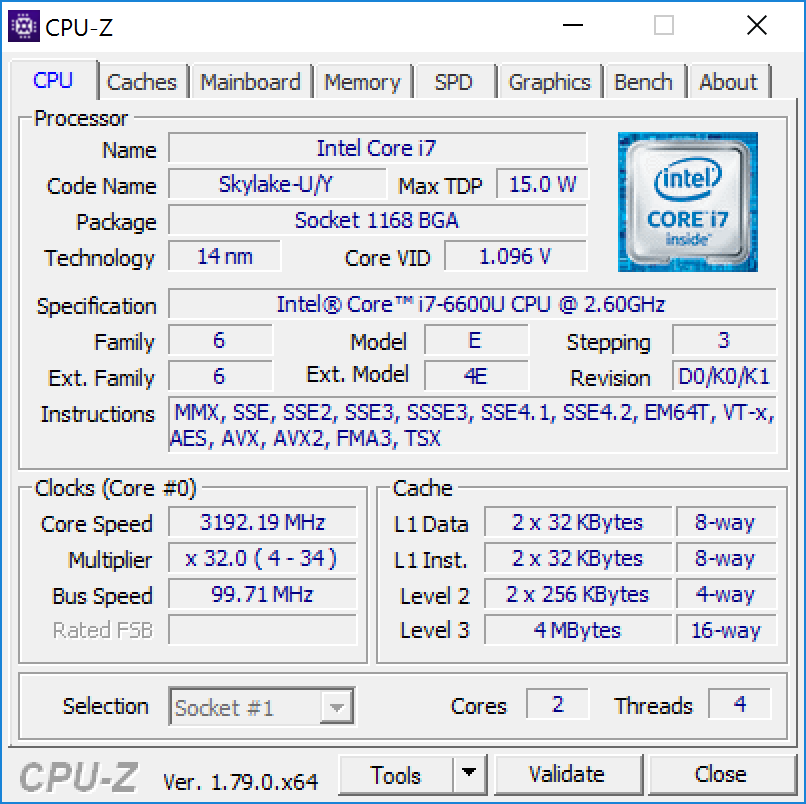
| Microsoft Surface Book with Performance Base 6600U, GeForce GTX 965M, Toshiba NVMe THNSN5256GPU7, IPS, 3000x2000, 13.5" | Microsoft Surface Book Core i7 6600U, Maxwell GPU (940M, GDDR5), Samsung MZFLV512 NVMe, IPS, 3000x2000, 13.5" | Microsoft Surface Pro 4, Core i5, 128GB 6300U, HD Graphics 520, Samsung MZFLV128 NVMe, IPS, 2736x1824, 12.3" | Lenovo Yoga 710-14IKB 80V4002HGE i5-7200U, HD Graphics 620, Samsung MZYTY256HDHP, a-Si WLED TFT, IPS, 1920x1080, 14" | Apple MacBook Pro 13 2016 (2.9 GHz) 6267U, Iris Graphics 550, Apple SSD AP0256, , 2560x1600, 13.3" | |
|---|---|---|---|---|---|
| Power Consumption | 5% | 27% | 33% | 24% | |
| Idle Minimum * (Watt) | 4.15 | 4.5 -8% | 4.4 -6% | 3.7 11% | 2.1 49% |
| Idle Average * (Watt) | 8 | 9.8 -23% | 9 -13% | 7.16 10% | 7.6 5% |
| Idle Maximum * (Watt) | 11.9 | 12.2 -3% | 10.7 10% | 8.3 30% | 8.2 31% |
| Load Average * (Watt) | 67 | 46 31% | 19.6 71% | 30.4 55% | 56.4 16% |
| Witcher 3 ultra * (Watt) | 58 | ||||
| Load Maximum * (Watt) | 76 | 56 26% | 19.9 74% | 30.3 60% | 59.8 21% |
* ... kleiner is beter
| Microsoft Surface Book with Performance Base 6600U, GeForce GTX 965M, 78 Wh | Microsoft Surface Book Core i5 6300U, Maxwell GPU (940M, GDDR5), 78 Wh | Microsoft Surface Book Core i7 6600U, Maxwell GPU (940M, GDDR5), 78 Wh | Microsoft Surface Pro 4, Core i5, 128GB 6300U, HD Graphics 520, 38 Wh | Lenovo Yoga 710-14IKB 80V4002HGE i5-7200U, HD Graphics 620, 53 Wh | HP Spectre x360 15-bl002xx i7-7500U, GeForce 940MX, 79.2 Wh | Apple MacBook Pro 13 2016 (2.9 GHz) 6267U, Iris Graphics 550, 49.2 Wh | |
|---|---|---|---|---|---|---|---|
| Batterijduur | 4% | 13% | -13% | 0% | 5% | -15% | |
| Reader / Idle (h) | 25.5 | 17.8 -30% | 15 -41% | 16 -37% | 14.4 -44% | ||
| WiFi v1.3 (h) | 9.6 | 6.7 -30% | 10.8 13% | 7.1 -26% | 9.4 -2% | 8.9 -7% | 9.4 -2% |
| Load (h) | 1.5 | 2.6 73% | 1.9 27% | 2.1 40% | 2.5 67% | 1.1 -27% | |
| H.264 (h) | 10.1 | 8.7 | 8.1 |
Pro
Contra
Voor het volledige, Engelse testrapport, klik hier.
De Geforce chip in het toetsenbord kan zelden gebruik maken van Turbo Boost en blijft op de standaard 950 MHz frequentie tijdens het spelen van The Witcher 3. Hoewel de invloed op praktisch gebruik nauwelijks merkbaar zal zijn, zeggen de synthetische benchmarks wat anders: dit is de reden waarom het apparaat schijnbaar trager is dan andere apparaten uitgerust met een GTX 965M.
De meeste moderne games zijn onspeelbaar op FHD resolutie en hoge details. Hoewel de grafische prestaties niet uitmuntend zijn, biedt de Surface Book degelijke rekenkracht voor de mobiliteit. Verwacht echter niet dezelfde prestaties als een 45 Watt multimedia notebook – daarvoor had Microsoft de GPU door een Pascal chip moeten vervangen.
Voor gamers is dit apparaat maar tot op zekere hoogte geschikt. Ons testmodel kost ongeveer €2600 in Europa en ongeveer $2400 plus belasting in de Verenigde Staten. Ter vergelijking; voor dit geld kun je ook twee Acer V15 notebooks met GTX 1060 GPU aanschaffen. Het is duidelijk dat Microsoft zich niet direct richt op gamers en meer waarde hecht aan ontwerp, architectuur, CAD, video en andere professionals met een behoefte aan veel rekenkracht.
Geen Werkstation
De Surface Book is niet bepaald een werkstation. Het ontbreekt het apparaat niet alleen aan de nodige CAD/CAM certificaties, maar bevat ook een 15 Watt CPU, welke in deze markt niet geaccepteerd wordt. HP, Dell en Lenovo hebben dus weinig te vrezen van de Surface Book.
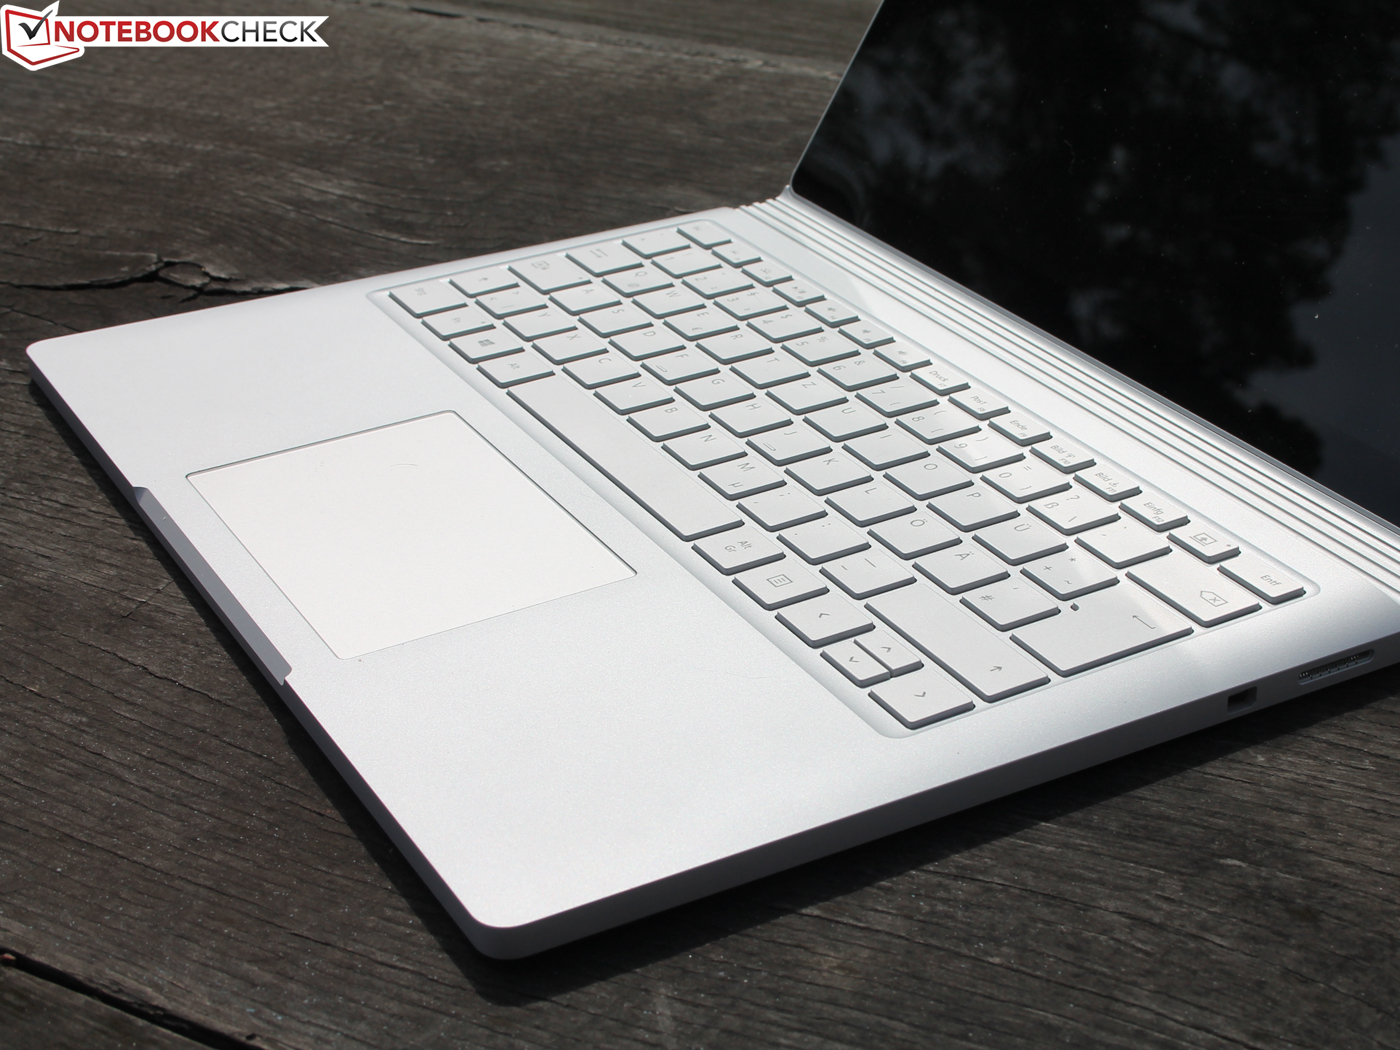
De grote kracht ligt in mobiliteit: het loshalen van de 13 inch tablet en stylus. Dit is letterlijk en figuurlijk waar de Surface Book schittert dankzij het zeel heldere IPS beeldscherm (bijna 100% sRGB-dekking), uitstekende invoerapparaten, hoogwaardige behuizing, zeer goede camera’s plus microfoon en indrukwekkende batterijlevensduur. Het los- en vastmaken van de tablet werkt foutloos.
Enkele zwakke punten zijn het beperkte aanbod van poorten, ontbrekende LTE en de zeer hoge prijs, waarmee het apparaat al snel boven elk denkbare budget van consumenten uitkomt. Een model met FHD beeldscherm, geïntegreerde GPU en 256 GB SSD voor $1000 zou de potentie hebben een revolutie te ontketenen. Helaas begint de meest betaalbare Surface Book met Core i5-6300U en 128 GB SSD al op $1499 plus belasting.
Externe Thunderbolt 3 GPU
In theorie kan elke notebook/tablet/2-in-1 convertible met Thunderbolt 3 uitgerust worden met een externe grafische kaart van fabrikanten zoals Razer, Acer en Asus. Daarmee kunnen ultradraagbare apparaten zoals de Dell XPS 13 2-in-1 of de reguliere XPS 13 getransformeerd worden in een gamemonster. Als je hier meer over wilt weten, lees dan ons testrapport over Razer. Helaas is Acer gestopt met het verkopen van hun eGPU apparaten en vragen Asus en Razer respectievelijk $500 en $600 voor hun modellen ($450 voor het model van Razer indien gecombineerd met een notebook). Maar let op, dit is nog zonder grafische kaart!
- Razer Core (GPU replaceable)
- Acer Graphics Dock (GTX 960M, not replaceable)
- Asus ROG XG Station 2 (GPU replaceable)
De volgende alternatieven zijn gebaseerd op de nieuwere T13-Controller, die helaas nog wel geplaagd wordt door diverse bugs en comptabiliteitsproblemen (zie hier voor meer details):
- Manitz Venus
- AKiTiO Node
- PowerColor Devil Box
Alternatieve 2-in-1 modellen met aparte grafische kaart?
Op dit moment bestaan er geen 2-in-1 modellen met aparte GPU in het toetsenbord dock. De vaak genoemde Lenovo Yoga 710-14 lijkt een betaalbaar alternatief, maar volgens de Lenovo Fora zijn gebruikers niet te spreken over de vervelende ventilator. De 15 inch HP Spectre x360 is verre van mobiel.
Microsoft Surface Book with Performance Base
- 03-05-2017 v6 (old)
Sebastian Jentsch
Price comparison
