Kort testrapport Lenovo IdeaPad S340-15 Laptop: Goedkope Core i7 Ice Lake Presteert Niet Optimaal
Evaluatie | Datum | Model | Gewicht | Hoogte | Formaat | Resolutie | Beste prijs |
|---|---|---|---|---|---|---|---|
| 79.4 % v7 (old) | 03-2020 | Lenovo Ideapad S340-15IIL i7-1065G7, Iris Plus Graphics G7 (Ice Lake 64 EU) | 1.8 kg | 17.9 mm | 15.60" | 1920x1080 | |
| 86.3 % v7 (old) | 09-2019 | Dell XPS 15 7590 i5 iGPU FHD i5-9300H, UHD Graphics 630 | 1.9 kg | 17 mm | 15.60" | 1920x1080 | |
| 83 % v6 (old) | 05-2020 | HP Pavilion 15-cs2019ng i5-8265U, GeForce MX250 | 1.9 kg | 18 mm | 15.60" | 1920x1080 | |
| 80.7 % v6 (old) | Asus VivoBook 15 X542UF-DM143T i5-8250U, GeForce MX130 | 2.3 kg | 23 mm | 15.60" | 1920x1080 | ||
| 84.1 % v6 (old) | 09-2023 | Lenovo Yoga 530-14ARR-81H9000VGE R7 2700U, Vega 10 | 1.7 kg | 17.6 mm | 14.00" | 1920x1080 |
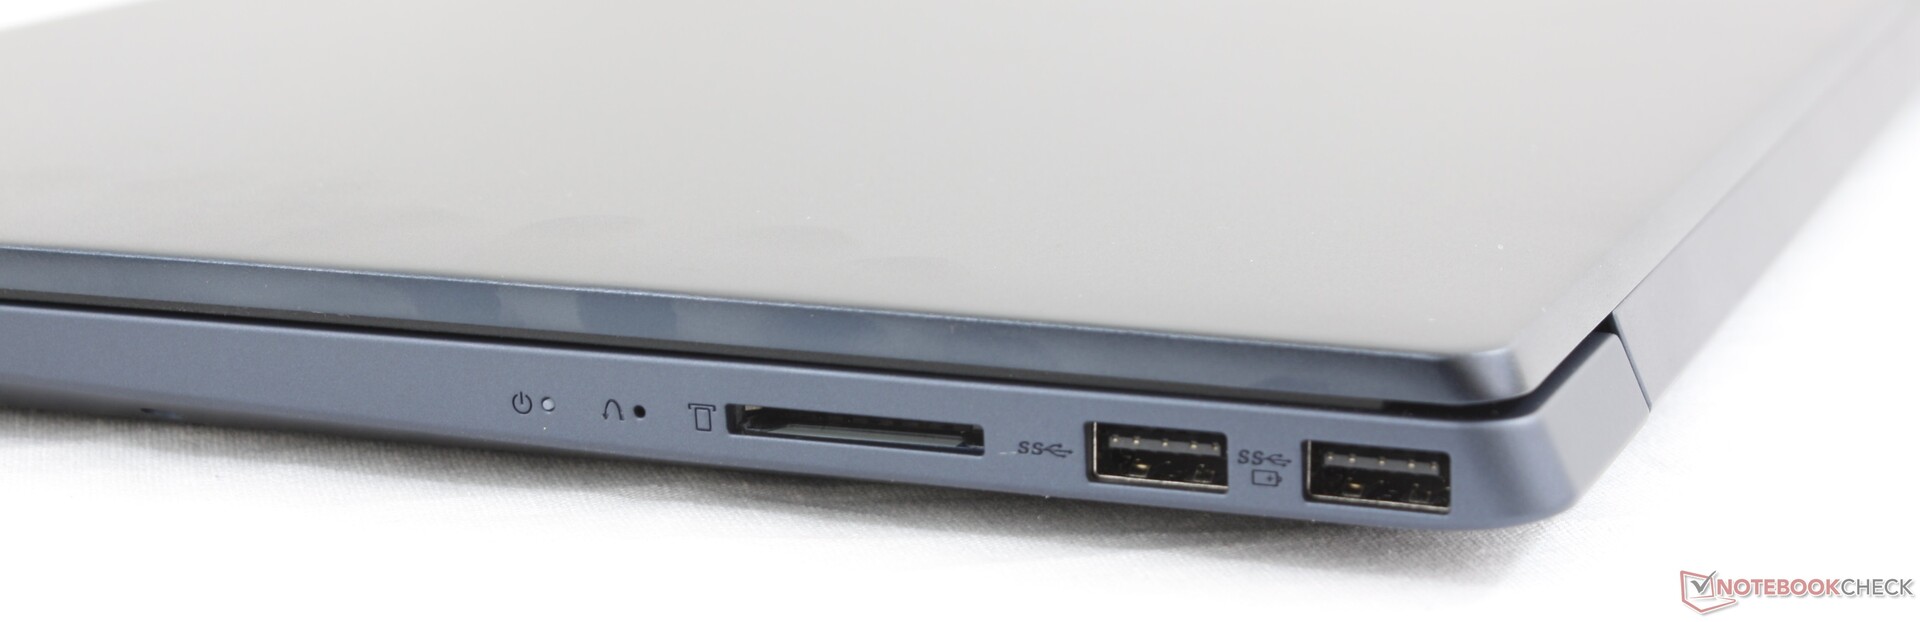
| SD Card Reader | |
| average JPG Copy Test (av. of 3 runs) | |
| Dell XPS 15 7590 i5 iGPU FHD (Toshiba Exceria Pro SDXC 64 GB UHS-II) | |
| Lenovo Ideapad S540-15IML (Toshiba Exceria Pro SDXC 64 GB UHS-II) | |
| Lenovo Ideapad S340-15IIL (Toshiba Exceria Pro SDXC 64 GB UHS-II) | |
| Dell Inspiron 15 5000 5585 (Toshiba Exceria Pro SDXC 64 GB UHS-II) | |
| maximum AS SSD Seq Read Test (1GB) | |
| Dell XPS 15 7590 i5 iGPU FHD (Toshiba Exceria Pro SDXC 64 GB UHS-II) | |
| Lenovo Ideapad S340-15IIL (Toshiba Exceria Pro SDXC 64 GB UHS-II) | |
| Lenovo Ideapad S540-15IML (Toshiba Exceria Pro SDXC 64 GB UHS-II) | |
| Dell Inspiron 15 5000 5585 (Toshiba Exceria Pro SDXC 64 GB UHS-II) | |
| Networking | |
| iperf3 transmit AX12 | |
| Lenovo ThinkPad T490 20RY0002US | |
| Lenovo Yoga C740-14IML | |
| Lenovo Ideapad S340-15IIL | |
| Alienware m17 R2 P41E | |
| iperf3 receive AX12 | |
| Lenovo ThinkPad T490 20RY0002US | |
| Lenovo Ideapad S340-15IIL | |
| Lenovo Yoga C740-14IML | |
| Alienware m17 R2 P41E | |

| |||||||||||||||||||||||||
Helderheidsverdeling: 87 %
Helderheid in Batterij-modus: 320.8 cd/m²
Contrast: 1188:1 (Zwart: 0.27 cd/m²)
ΔE ColorChecker Calman: 7.68 | ∀{0.5-29.43 Ø4.71}
calibrated: 4.65
ΔE Greyscale Calman: 7.3 | ∀{0.09-98 Ø4.96}
58.3% sRGB (Argyll 1.6.3 3D)
37.8% AdobeRGB 1998 (Argyll 1.6.3 3D)
41.77% AdobeRGB 1998 (Argyll 3D)
58.8% sRGB (Argyll 3D)
40.43% Display P3 (Argyll 3D)
Gamma: 2.12
CCT: 6213 K
| Lenovo Ideapad S340-15IIL BOE CQ NV156FHM-T03, IPS, 15.6", 1920x1080 | Dell XPS 15 7590 i5 iGPU FHD LQ156M1, IPS, 15.6", 1920x1080 | Dell Inspiron 15 5000 5585 LG Philips 156WFC, IPS, 15.6", 1920x1080 | Lenovo Ideapad S540-15IML BOEhydis NV156FHM-N61 (BOE06FB), IPS, 15.6", 1920x1080 | HP Pavilion 15-cs2019ng BOE080D, IPS, 15.6", 1920x1080 | Asus VivoBook 15 X542UF-DM143T BOE CQ NT156FHM-N41, TN LED, 15.6", 1920x1080 | |
|---|---|---|---|---|---|---|
| Display | 65% | -7% | 54% | 57% | -6% | |
| Display P3 Coverage (%) | 40.43 | 66.5 64% | 37.31 -8% | 66.8 65% | 67.2 66% | 37.47 -7% |
| sRGB Coverage (%) | 58.8 | 98 67% | 56.2 -4% | 86.5 47% | 88.1 50% | 56.4 -4% |
| AdobeRGB 1998 Coverage (%) | 41.77 | 68.4 64% | 38.55 -8% | 63.2 51% | 64.4 54% | 38.71 -7% |
| Response Times | -3% | 31% | -3% | 13% | 29% | |
| Response Time Grey 50% / Grey 80% * (ms) | 46.4 ? | 52.8 ? -14% | 28.4 ? 39% | 49.6 ? -7% | 43 ? 7% | 41 ? 12% |
| Response Time Black / White * (ms) | 35.2 ? | 32 ? 9% | 27.2 ? 23% | 34.8 ? 1% | 29 ? 18% | 19 ? 46% |
| PWM Frequency (Hz) | 1020 ? | 202 ? | 208 ? | 7000 ? | ||
| Screen | 49% | 2% | 25% | 24% | 0% | |
| Brightness middle (cd/m²) | 320.8 | 588 83% | 253.6 -21% | 299 -7% | 320 0% | 230 -28% |
| Brightness (cd/m²) | 309 | 555 80% | 227 -27% | 278 -10% | 293 -5% | 221 -28% |
| Brightness Distribution (%) | 87 | 89 2% | 84 -3% | 87 0% | 86 -1% | 91 5% |
| Black Level * (cd/m²) | 0.27 | 0.4 -48% | 0.27 -0% | 0.25 7% | 0.26 4% | 0.45 -67% |
| Contrast (:1) | 1188 | 1470 24% | 939 -21% | 1196 1% | 1231 4% | 511 -57% |
| Colorchecker dE 2000 * | 7.68 | 2.5 67% | 6.05 21% | 4.32 44% | 4.5 41% | 3.6 53% |
| Colorchecker dE 2000 max. * | 21.97 | 6.3 71% | 14.03 36% | 9.3 58% | 8.81 60% | 5.59 75% |
| Colorchecker dE 2000 calibrated * | 4.65 | 0.6 87% | 4.97 -7% | 2.58 45% | ||
| Greyscale dE 2000 * | 7.3 | 4.5 38% | 3.2 56% | 4.21 42% | 4.71 35% | 3.13 57% |
| Gamma | 2.12 104% | 2.2 100% | 2 110% | 2.39 92% | 2.45 90% | 2.45 90% |
| CCT | 6213 105% | 6836 95% | 6820 95% | 6799 96% | 7085 92% | 7244 90% |
| Color Space (Percent of AdobeRGB 1998) (%) | 37.8 | 63.2 67% | 35.5 -6% | 57 51% | 58 53% | 36 -5% |
| Color Space (Percent of sRGB) (%) | 58.3 | 98 68% | 55.6 -5% | 86 48% | 88 51% | 56 -4% |
| Totaal Gemiddelde (Programma / Instellingen) | 37% /
46% | 9% /
4% | 25% /
27% | 31% /
29% | 8% /
3% |
* ... kleiner is beter
Responstijd Scherm
| ↔ Responstijd Zwart naar Wit | ||
|---|---|---|
| 35.2 ms ... stijging ↗ en daling ↘ gecombineerd | ↗ 20.4 ms stijging | 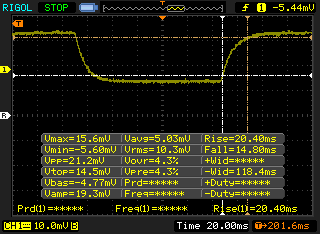 |
| ↘ 14.8 ms daling | ||
| Het scherm vertoonde trage responstijden in onze tests en is misschien te traag voor games. Ter vergelijking: alle testtoestellen variëren van 0.1 (minimum) tot 240 (maximum) ms. » 93 % van alle toestellen zijn beter. Dit betekent dat de gemeten responstijd slechter is dan het gemiddelde (19.8 ms) van alle geteste toestellen. | ||
| ↔ Responstijd 50% Grijs naar 80% Grijs | ||
| 46.4 ms ... stijging ↗ en daling ↘ gecombineerd | ↗ 26 ms stijging | 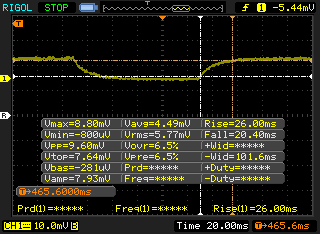 |
| ↘ 20.4 ms daling | ||
| Het scherm vertoonde trage responstijden in onze tests en is misschien te traag voor games. Ter vergelijking: alle testtoestellen variëren van 0.165 (minimum) tot 636 (maximum) ms. » 80 % van alle toestellen zijn beter. Dit betekent dat de gemeten responstijd slechter is dan het gemiddelde (31 ms) van alle geteste toestellen. | ||
Screen Flickering / PWM (Pulse-Width Modulation)
| Screen flickering / PWM niet waargenomen | 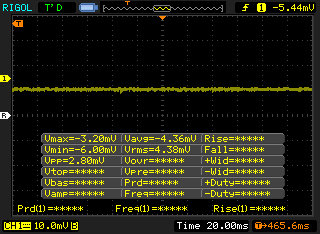 | ||
Ter vergelijking: 52 % van alle geteste toestellen maakten geen gebruik van PWM om de schermhelderheid te verlagen. Als het wel werd gebruikt, werd een gemiddelde van 7754 (minimum: 5 - maximum: 343500) Hz waargenomen. | |||
| Cinebench R10 | |
| Rendering Multiple CPUs 32Bit | |
| Microsoft Surface Laptop 3 13 Core i5-1035G7 | |
| Gemiddeld Intel Core i7-1065G7 (16551 - 26481, n=4) | |
| Lenovo Yoga 530-14ARR-81H9000VGE | |
| Dynabook Portege A30-E-174 | |
| Rendering Single 32Bit | |
| Gemiddeld Intel Core i7-1065G7 (7083 - 7390, n=4) | |
| Microsoft Surface Laptop 3 13 Core i5-1035G7 | |
| Dynabook Portege A30-E-174 | |
| Lenovo Yoga 530-14ARR-81H9000VGE | |
| wPrime 2.10 - 1024m | |
| Gemiddeld Intel Core i7-1065G7 (233 - 354, n=3) | |
| Microsoft Surface Laptop 3 13 Core i5-1035G7 | |
* ... kleiner is beter
| PCMark 8 | |
| Home Score Accelerated v2 | |
| Dell XPS 15 7590 i5 iGPU FHD | |
| Asus VivoBook 15 X512FL-EJ205T | |
| Lenovo Ideapad S340-15IIL | |
| Gemiddeld Intel Core i7-1065G7, Intel Iris Plus Graphics G7 (Ice Lake 64 EU) (3305 - 4275, n=17) | |
| Dell Inspiron 15 5000 5585 | |
| HP Pavilion 15-cw1212ng | |
| Work Score Accelerated v2 | |
| Lenovo Ideapad S340-15IIL | |
| Dell XPS 15 7590 i5 iGPU FHD | |
| Asus VivoBook 15 X512FL-EJ205T | |
| HP Pavilion 15-cw1212ng | |
| Dell Inspiron 15 5000 5585 | |
| Gemiddeld Intel Core i7-1065G7, Intel Iris Plus Graphics G7 (Ice Lake 64 EU) (2460 - 5291, n=17) | |
| PCMark 8 Home Score Accelerated v2 | 3791 punten | |
| PCMark 8 Work Score Accelerated v2 | 5291 punten | |
| PCMark 10 Score | 4679 punten | |
Help | ||
| Lenovo Ideapad S340-15IIL Intel SSD 660p SSDPEKNW512G8 | Dell XPS 15 7590 i5 iGPU FHD Toshiba XG6 KXG60ZNV512G | Dell Inspiron 15 5000 5585 WDC PC SN520 SDAPNUW-512G | Asus VivoBook 15 X512FL-EJ205T Kingston RBUSNS8154P3512GJ | Lenovo Ideapad S540-15IML Samsung SSD PM981a MZVLB512HBJQ | |
|---|---|---|---|---|---|
| AS SSD | 71% | 9% | -31% | 128% | |
| Seq Read (MB/s) | 1447 | 2357 63% | 398.9 -72% | 1348 -7% | 2642 83% |
| Seq Write (MB/s) | 926 | 1235 33% | 884 -5% | 685 -26% | 2433 163% |
| 4K Read (MB/s) | 40.06 | 43.29 8% | 34.54 -14% | 29.15 -27% | 58 45% |
| 4K Write (MB/s) | 97.9 | 99.7 2% | 82.1 -16% | 90.3 -8% | 145.3 48% |
| 4K-64 Read (MB/s) | 323.7 | 1020 215% | 647 100% | 650 101% | 1431 342% |
| 4K-64 Write (MB/s) | 791 | 1502 90% | 985 25% | 514 -35% | 1753 122% |
| Access Time Read * (ms) | 0.06 | 0.07 -17% | 0.072 -20% | 0.31 -417% | 0.072 -20% |
| Access Time Write * (ms) | 0.144 | 0.039 73% | 0.047 67% | 0.044 69% | 0.027 81% |
| Score Read (Points) | 508 | 1299 156% | 721 42% | 814 60% | 1753 245% |
| Score Write (Points) | 982 | 1726 76% | 1155 18% | 673 -31% | 2142 118% |
| Score Total (Points) | 1738 | 3640 109% | 2279 31% | 1876 8% | 4790 176% |
| Copy ISO MB/s (MB/s) | 943 | 2145 127% | 862 -9% | 763 -19% | |
| Copy Program MB/s (MB/s) | 612 | 565 -8% | 457 -25% | 350.3 -43% | |
| Copy Game MB/s (MB/s) | 826 | 1320 60% | 902 9% | 310 -62% | |
| CrystalDiskMark 5.2 / 6 | 35% | -24% | -34% | 44% | |
| Write 4K (MB/s) | 130.8 | 93.6 -28% | 105.9 -19% | 63.6 -51% | 170.7 31% |
| Read 4K (MB/s) | 54.8 | 41.87 -24% | 36.56 -33% | 28.58 -48% | 49.51 -10% |
| Write Seq (MB/s) | 978 | 1698 74% | 1165 19% | 688 -30% | 1156 18% |
| Read Seq (MB/s) | 1627 | 1978 22% | 423.2 -74% | 1032 -37% | 1136 -30% |
| Write 4K Q32T1 (MB/s) | 450.1 | 383.1 -15% | 332.1 -26% | 266.7 -41% | 420.5 -7% |
| Read 4K Q32T1 (MB/s) | 345.9 | 326.9 -5% | 229.3 -34% | 321.5 -7% | 527 52% |
| Write Seq Q32T1 (MB/s) | 982 | 2778 183% | 1460 49% | 606 -38% | 2984 204% |
| Read Seq Q32T1 (MB/s) | 1842 | 3119 69% | 472.5 -74% | 1508 -18% | 3550 93% |
| Write 4K Q8T8 (MB/s) | 410.8 | ||||
| Read 4K Q8T8 (MB/s) | 331.4 | ||||
| Totaal Gemiddelde (Programma / Instellingen) | 53% /
57% | -8% /
-3% | -33% /
-32% | 86% /
92% |
* ... kleiner is beter

| 3DMark 11 Performance | 3762 punten | |
| 3DMark Ice Storm Standard Score | 65852 punten | |
| 3DMark Cloud Gate Standard Score | 9962 punten | |
| 3DMark Fire Strike Score | 2171 punten | |
| 3DMark Time Spy Score | 701 punten | |
Help | ||
| The Witcher 3 - 1024x768 Low Graphics & Postprocessing | |
| Huawei MateBook 13 i7 | |
| MSI Modern 15 A10RB | |
| Dell Inspiron 15 5000 5585 | |
| Microsoft Surface Laptop 3 13 Core i5-1035G7 | |
| Gemiddeld Intel Iris Plus Graphics G7 (Ice Lake 64 EU) (28.2 - 58, n=20) | |
| Lenovo Ideapad S340-15IIL | |
| lage | gem. | hoge | ultra | |
|---|---|---|---|---|
| BioShock Infinite (2013) | 81.9 | 48.9 | 39.9 | 13.5 |
| The Witcher 3 (2015) | 29.9 | 20.8 | 10.9 | 5.9 |
| Rocket League (2017) | 45.5 | 30 | 21.1 | |
| Shadow of the Tomb Raider (2018) | 19 |
| Lenovo Ideapad S340-15IIL Iris Plus Graphics G7 (Ice Lake 64 EU), i7-1065G7, Intel SSD 660p SSDPEKNW512G8 | Dell XPS 15 7590 i5 iGPU FHD UHD Graphics 630, i5-9300H, Toshiba XG6 KXG60ZNV512G | Dell Inspiron 15 5000 5585 Vega 10, R7 3700U, WDC PC SN520 SDAPNUW-512G | Lenovo Ideapad S540-15IML GeForce MX250, i5-10210U, Samsung SSD PM981a MZVLB512HBJQ | HP Pavilion 15-cs2019ng GeForce MX250, i5-8265U, Toshiba KBG30ZMV256G | Asus VivoBook 15 X542UF-DM143T GeForce MX130, i5-8250U, Micron 1100 MTFDDAV256TBN | |
|---|---|---|---|---|---|---|
| Noise | -4% | -3% | -18% | -17% | -11% | |
| uit / omgeving * (dB) | 28.5 | 29.3 -3% | 28.3 1% | 30 -5% | 30.5 -7% | 30 -5% |
| Idle Minimum * (dB) | 28.5 | 29.3 -3% | 28.3 1% | 30 -5% | 31.5 -11% | 30.9 -8% |
| Idle Average * (dB) | 28.5 | 29.3 -3% | 28.3 1% | 32 -12% | 31.5 -11% | 30.9 -8% |
| Idle Maximum * (dB) | 28.5 | 29.8 -5% | 28.3 1% | 37 -30% | 31.5 -11% | 30.9 -8% |
| Load Average * (dB) | 30.3 | 32.4 -7% | 31.4 -4% | 41 -35% | 42.5 -40% | 39 -29% |
| Load Maximum * (dB) | 35.5 | 37.2 -5% | 41.4 -17% | 42 -18% | 42.5 -20% | 38 -7% |
| Witcher 3 ultra * (dB) | 41.4 | 39 |
* ... kleiner is beter
Geluidsniveau
| Onbelast |
| 28.5 / 28.5 / 28.5 dB (A) |
| Belasting |
| 30.3 / 35.5 dB (A) |
 | ||
30 dB stil 40 dB(A) hoorbaar 50 dB(A) luid |
||
min: | ||
(+) De maximumtemperatuur aan de bovenzijde bedraagt 35 °C / 95 F, vergeleken met het gemiddelde van 36.8 °C / 98 F, variërend van 21 tot 71 °C voor de klasse Multimedia.
(±) De bodem warmt op tot een maximum van 44 °C / 111 F, vergeleken met een gemiddelde van 39.1 °C / 102 F
(+) Bij onbelast gebruik bedraagt de gemiddelde temperatuur voor de bovenzijde 24.3 °C / 76 F, vergeleken met het apparaatgemiddelde van 31.3 °C / 88 F.
(+) De palmsteunen en het touchpad zijn met een maximum van ###max## °C / 77 F koeler dan de huidtemperatuur en voelen daarom koel aan.
(+) De gemiddelde temperatuur van de handpalmsteun van soortgelijke toestellen bedroeg 28.7 °C / 83.7 F (+3.7 °C / 6.7 F).
Lenovo Ideapad S340-15IIL audioanalyse
(+) | luidsprekers kunnen relatief luid spelen (83.4 dB)
Bas 100 - 315 Hz
(-) | bijna geen lage tonen - gemiddeld 21.2% lager dan de mediaan
(±) | lineariteit van de lage tonen is gemiddeld (11.4% delta ten opzichte van de vorige frequentie)
Midden 400 - 2000 Hz
(+) | evenwichtige middens - slechts 4.8% verwijderd van de mediaan
(±) | lineariteit van de middentonen is gemiddeld (7% delta ten opzichte van de vorige frequentie)
Hoog 2 - 16 kHz
(+) | evenwichtige hoogtepunten - slechts 2.5% verwijderd van de mediaan
(+) | de hoge tonen zijn lineair (4% delta naar de vorige frequentie)
Algemeen 100 - 16.000 Hz
(±) | lineariteit van het totale geluid is gemiddeld (22% verschil met de mediaan)
Vergeleken met dezelfde klasse
» 78% van alle geteste apparaten in deze klasse waren beter, 4% vergelijkbaar, 17% slechter
» De beste had een delta van 5%, het gemiddelde was 17%, de slechtste was 45%
Vergeleken met alle geteste toestellen
» 64% van alle geteste apparaten waren beter, 6% gelijk, 30% slechter
» De beste had een delta van 4%, het gemiddelde was 23%, de slechtste was 134%
Apple MacBook 12 (Early 2016) 1.1 GHz audioanalyse
(+) | luidsprekers kunnen relatief luid spelen (83.6 dB)
Bas 100 - 315 Hz
(±) | verminderde zeebaars - gemiddeld 11.3% lager dan de mediaan
(±) | lineariteit van de lage tonen is gemiddeld (14.2% delta ten opzichte van de vorige frequentie)
Midden 400 - 2000 Hz
(+) | evenwichtige middens - slechts 2.4% verwijderd van de mediaan
(+) | de middentonen zijn lineair (5.5% delta ten opzichte van de vorige frequentie)
Hoog 2 - 16 kHz
(+) | evenwichtige hoogtepunten - slechts 2% verwijderd van de mediaan
(+) | de hoge tonen zijn lineair (4.5% delta naar de vorige frequentie)
Algemeen 100 - 16.000 Hz
(+) | het totale geluid is lineair (10.2% verschil met de mediaan)
Vergeleken met dezelfde klasse
» 7% van alle geteste apparaten in deze klasse waren beter, 2% vergelijkbaar, 90% slechter
» De beste had een delta van 5%, het gemiddelde was 18%, de slechtste was 53%
Vergeleken met alle geteste toestellen
» 5% van alle geteste apparaten waren beter, 1% gelijk, 94% slechter
» De beste had een delta van 4%, het gemiddelde was 23%, de slechtste was 134%
| Uit / Standby | |
| Inactief | |
| Belasting |
|
Key:
min: | |
| Lenovo Ideapad S340-15IIL i7-1065G7, Iris Plus Graphics G7 (Ice Lake 64 EU), Intel SSD 660p SSDPEKNW512G8, IPS, 1920x1080, 15.6" | Dell XPS 15 7590 i5 iGPU FHD i5-9300H, UHD Graphics 630, Toshiba XG6 KXG60ZNV512G, IPS, 1920x1080, 15.6" | Dell Inspiron 15 5000 5585 R7 3700U, Vega 10, WDC PC SN520 SDAPNUW-512G, IPS, 1920x1080, 15.6" | Lenovo Ideapad S540-15IML i5-10210U, GeForce MX250, Samsung SSD PM981a MZVLB512HBJQ, IPS, 1920x1080, 15.6" | HP Pavilion 15-cs2019ng i5-8265U, GeForce MX250, Toshiba KBG30ZMV256G, IPS, 1920x1080, 15.6" | Asus VivoBook 15 X542UF-DM143T i5-8250U, GeForce MX130, Micron 1100 MTFDDAV256TBN, TN LED, 1920x1080, 15.6" | |
|---|---|---|---|---|---|---|
| Power Consumption | -38% | 5% | -27% | -19% | -15% | |
| Idle Minimum * (Watt) | 3.8 | 3.79 -0% | 4.2 -11% | 5 -32% | 4.9 -29% | 4.75 -25% |
| Idle Average * (Watt) | 6.9 | 6.9 -0% | 6.8 1% | 7 -1% | 7.9 -14% | 6.9 -0% |
| Idle Maximum * (Watt) | 7.7 | 9.2 -19% | 7 9% | 10 -30% | 10.1 -31% | 7 9% |
| Load Average * (Watt) | 43.3 | 62 -43% | 36.5 16% | 64 -48% | 60 -39% | 53 -22% |
| Witcher 3 ultra * (Watt) | 40.4 | 37.9 6% | 44 -9% | |||
| Load Maximum * (Watt) | 47.5 | 108 -127% | 44 7% | 67 -41% | 38 20% | 65.3 -37% |
* ... kleiner is beter
| Lenovo Ideapad S340-15IIL i7-1065G7, Iris Plus Graphics G7 (Ice Lake 64 EU), 36 Wh | Dell XPS 15 7590 i5 iGPU FHD i5-9300H, UHD Graphics 630, 97 Wh | Dell Inspiron 15 5000 5585 R7 3700U, Vega 10, 42 Wh | Lenovo Ideapad S540-15IML i5-10210U, GeForce MX250, 70 Wh | HP Pavilion 15-cs2019ng i5-8265U, GeForce MX250, 41 Wh | Asus VivoBook 15 X542UF-DM143T i5-8250U, GeForce MX130, 38 Wh | |
|---|---|---|---|---|---|---|
| Batterijduur | 142% | 44% | 137% | 5% | 58% | |
| Reader / Idle (h) | 10 | 14.3 43% | 30.2 202% | 8 -20% | ||
| WiFi v1.3 (h) | 4.3 | 14.1 228% | 7 63% | 12.1 181% | 5 16% | 6.8 58% |
| Load (h) | 1.1 | 1.7 55% | 1.4 27% | 1.4 27% | 1.3 18% |
Pro
Contra
Voor het volledige, Engelse testrapport, klik hier.
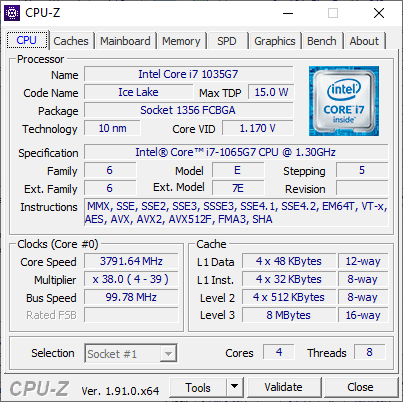
Een paar weken geleden schreven we over de Lenovo IdeaPad S340-15 als een van de goedkoopste laptops op de markt met Intel's nieuwste 10e generatie Core i7-1065G7 CPU. Dit is dezelfde processor als bij veel duurdere alternatieven, zoals de Dell XPS 13 2-in-1 of de Razer Blade Stealth, die al snel twee keer zo veel kosten als onze Lenovo. Hoewel dit er op papier goed uitziet voor Lenovo, is de realiteit dat de IdeaPad S340-15 ondermaatse CPU-prestaties vertoont vergeleken met de bovengenoemde alternatieven, vooral bij gamen of het uitvoeren van andere veeleisende toepassingen. Als je het beste wilt dat Ice Lake te bieden heeft, moet je verder kijken dan de IdeaPad-serie.
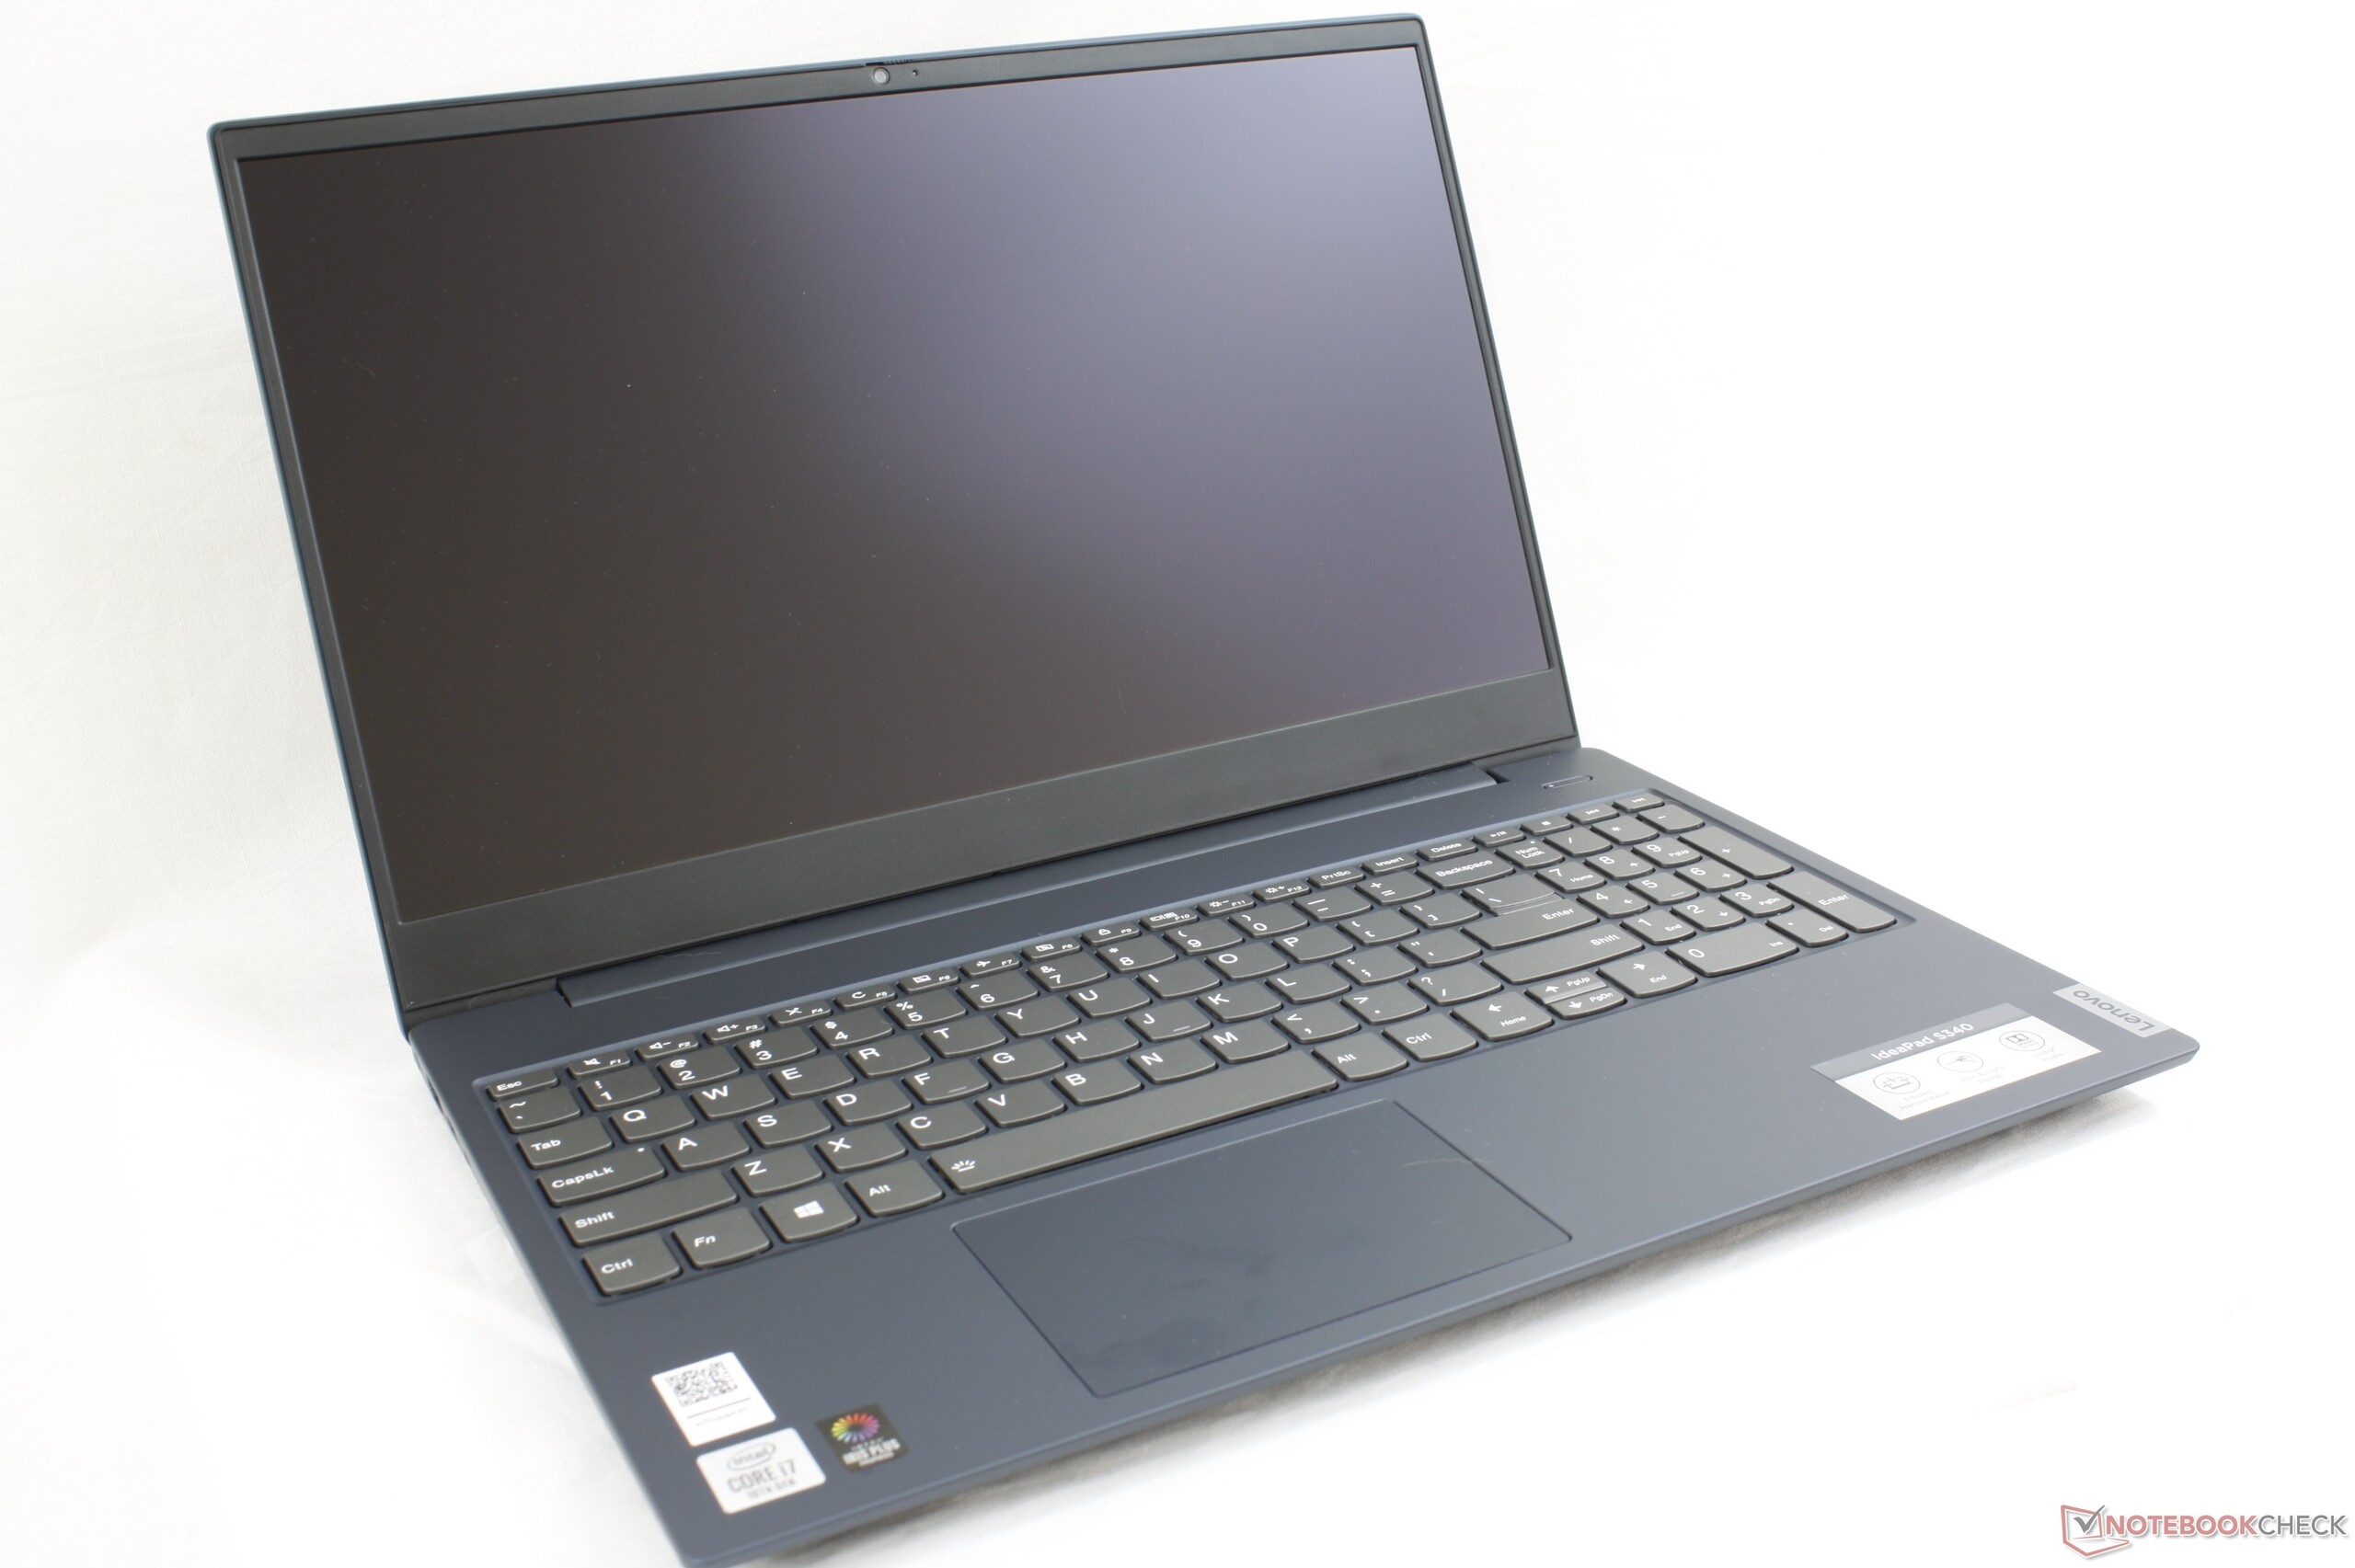
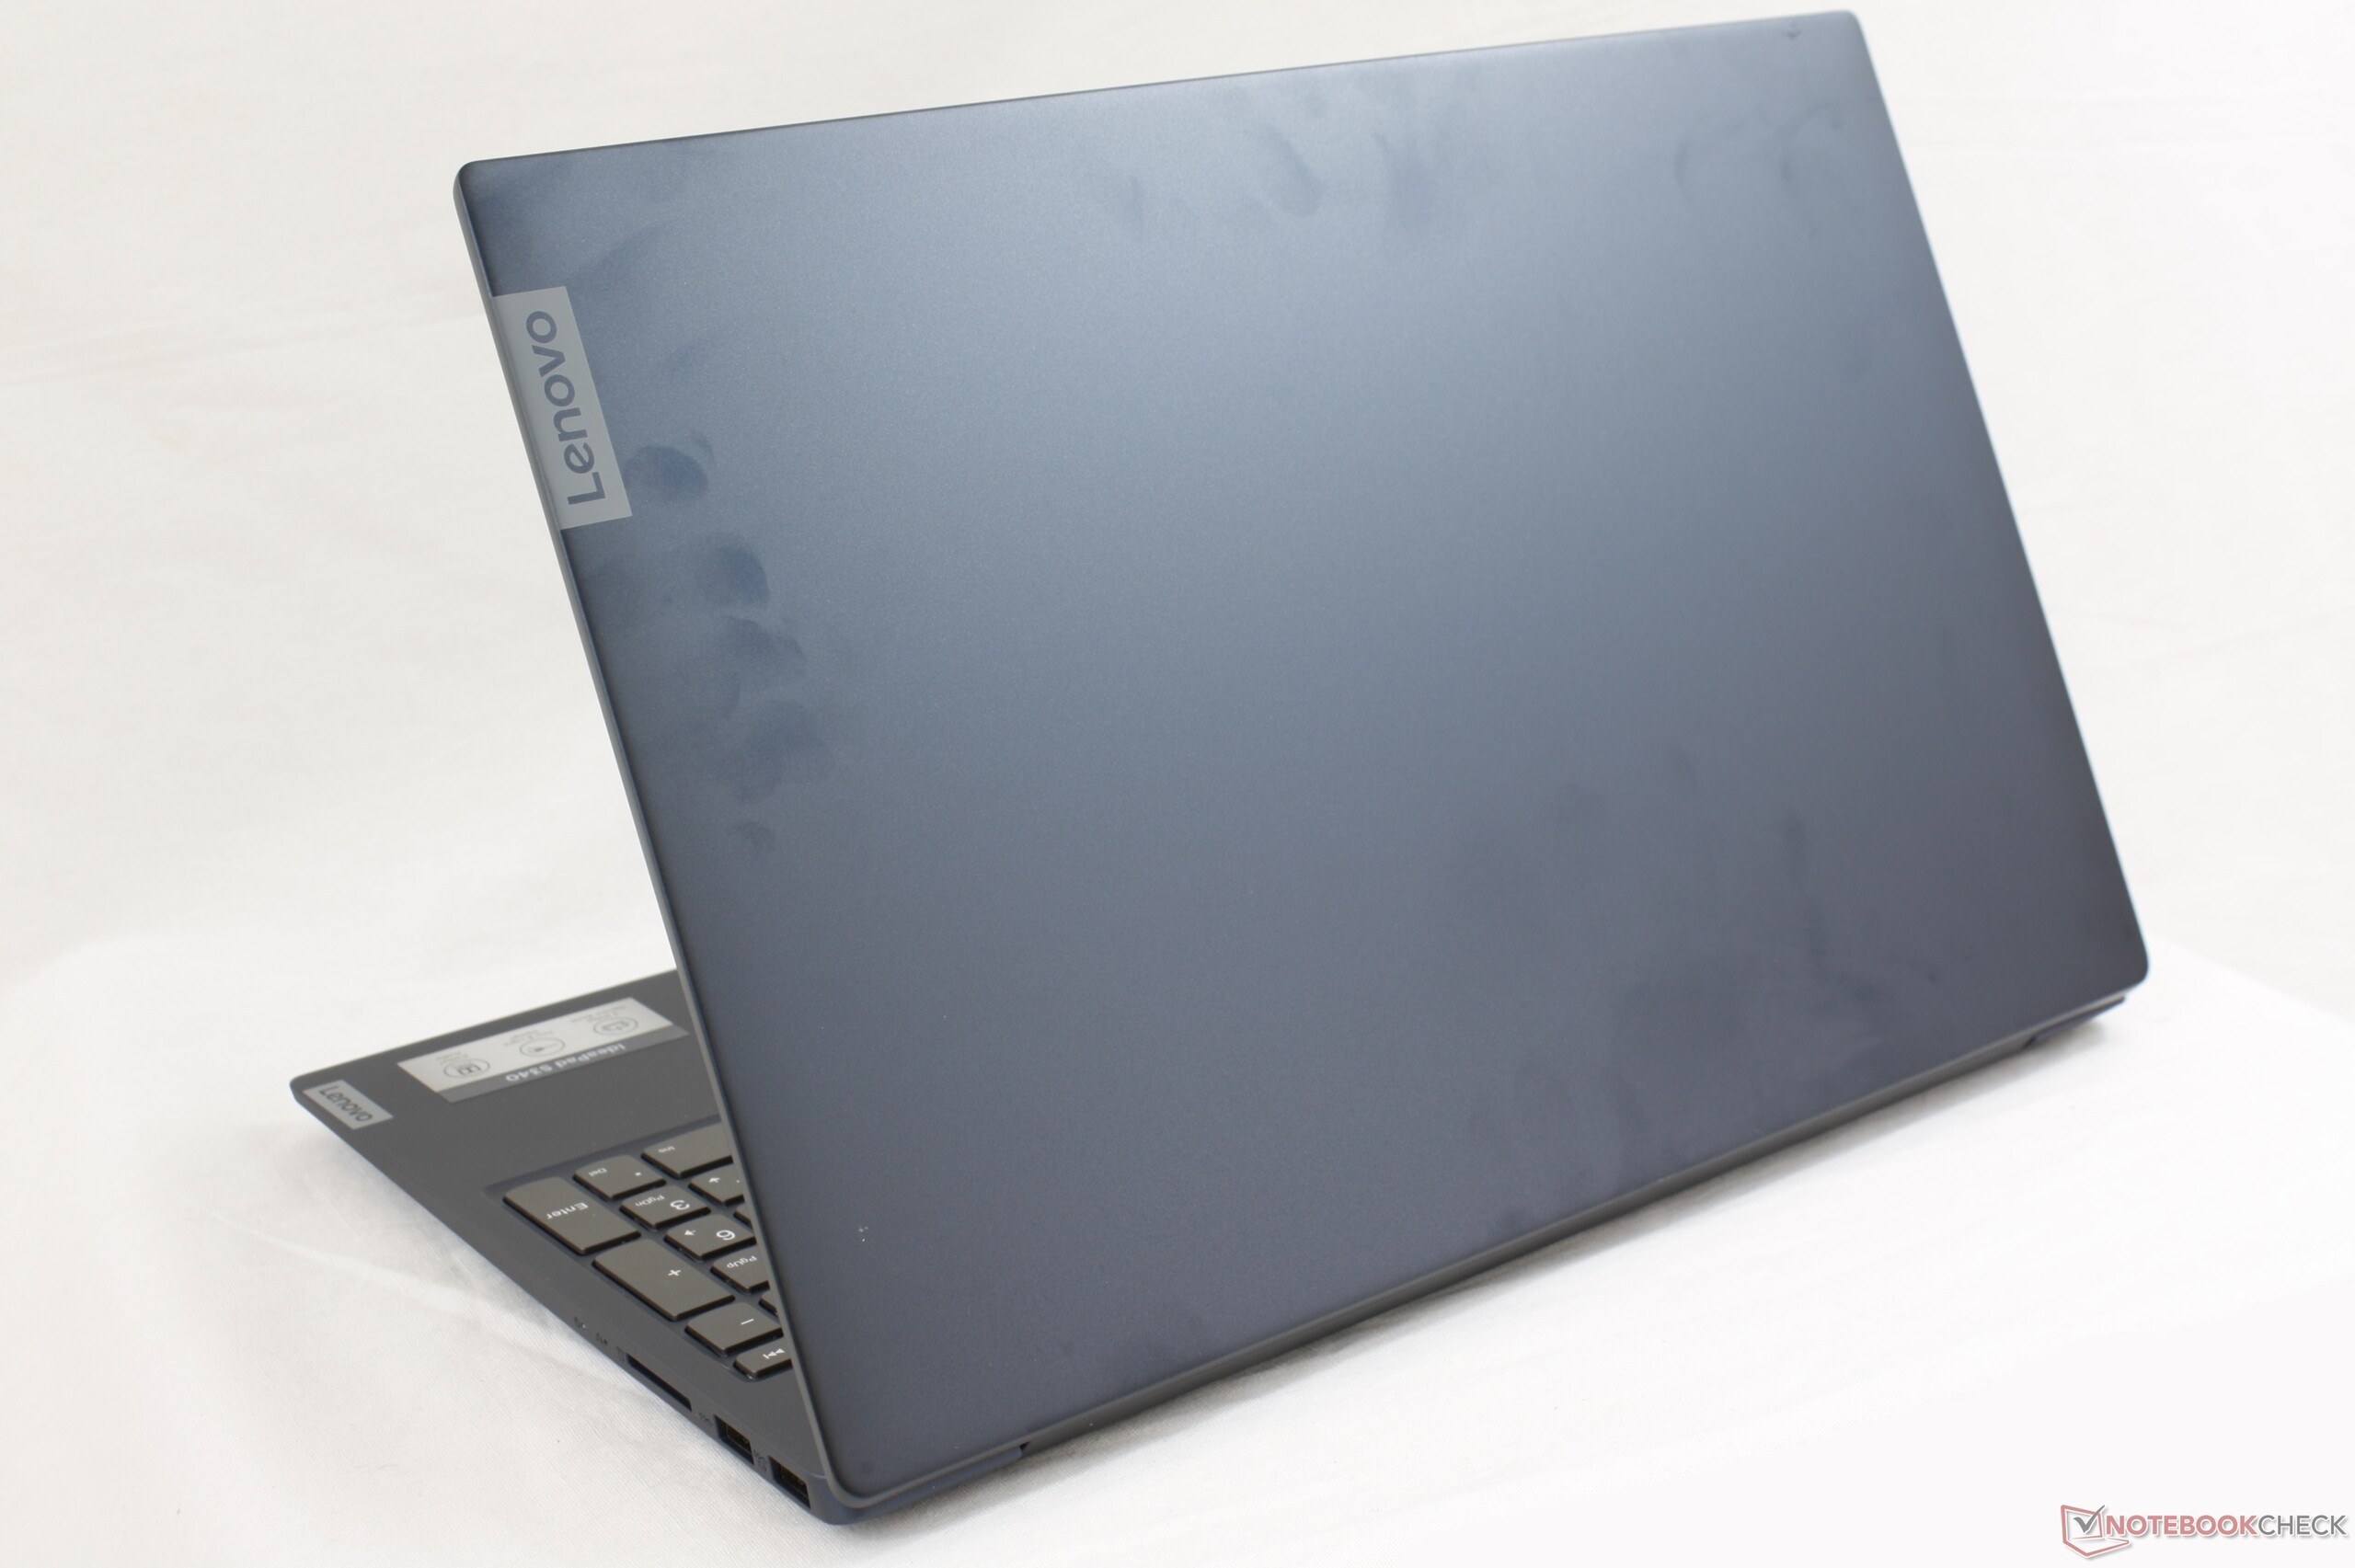
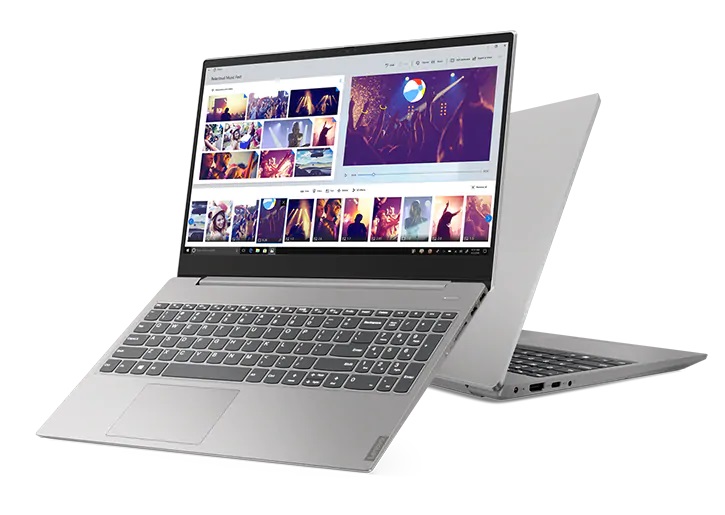
De laptop zelf is moderner en visueel aantrekkelijker dan de concurrerende Dell Inspiron-, Asus VivoBook- of HP Pavilion-serie. Het matte touchscreen en toegankelijke dubbele opslagcompartimenten zijn ook een leuke verrassing, aangezien deze functies ongebruikelijk zijn op budgetlaptops. Anders is bijna al het andere van het systeem voldoende, zo niet middelmatig. De beperkte kleurdekking, onduidelijke feedback van het toetsenbord en middelmatige batterijduur zijn allemaal gebruikelijk in deze prijsklasse. We raden aan te kiezen voor de goedkopere Core i5 of Core i7 Whiskey Lake-U SKU's, aangezien Ice Lake weinig extra's biedt voor de IdeaPad S340.
De Lenovo IdeaPad S340-15 is op zijn best voor multimedia-gebruik thuis en onderweg vanwege het lichte gewicht. Verwacht geen goede Core i7 Ice Lake-prestaties bij het uitvoeren van veeleisende toepassingen zoals gamen.
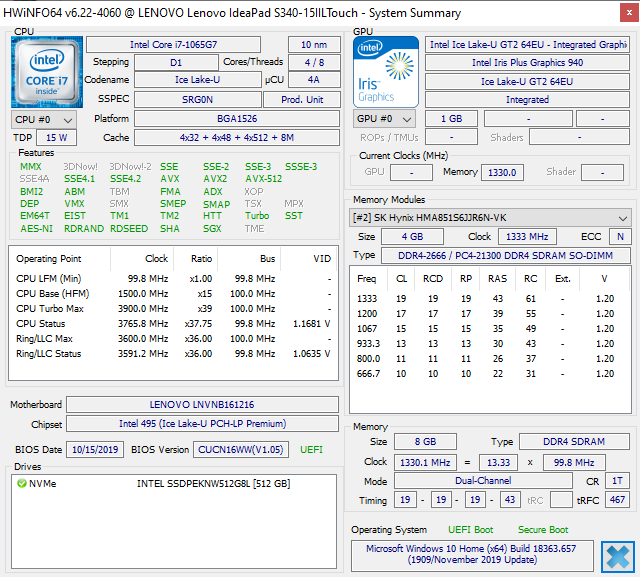
Lenovo Ideapad S340-15IIL
- 14-03-2020 v7 (old)
Allen Ngo
Price comparison
