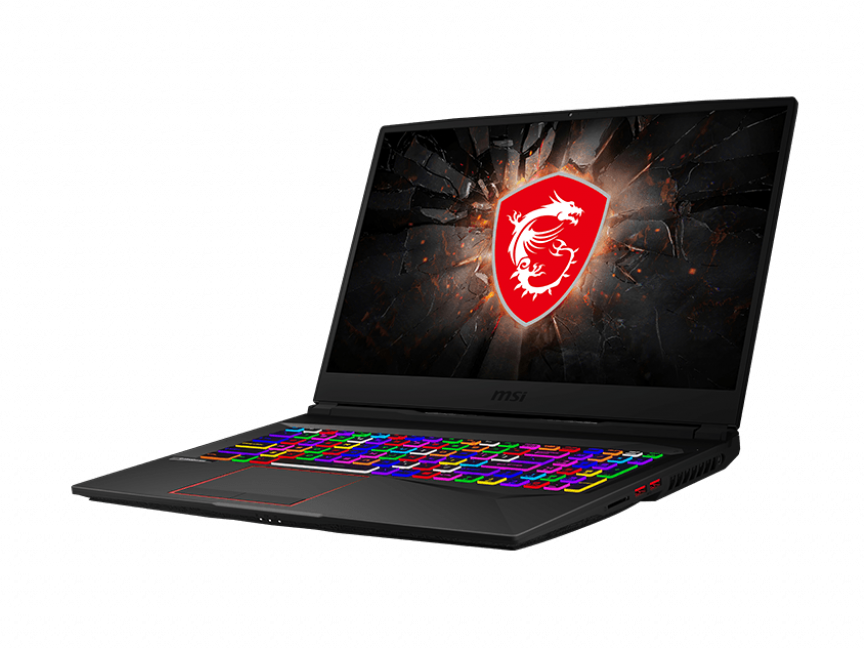
Kort testrapport MSI GE75 Raider 10SE Laptop: 10e Gen Core i7 en GeForce RTX Combo
Evaluatie | Datum | Model | Gewicht | Hoogte | Formaat | Resolutie | Beste prijs |
|---|---|---|---|---|---|---|---|
| 85.1 % v7 (old) | 07-2020 | MSI GE75 Raider 10SE-008US i7-10750H, GeForce RTX 2060 Mobile | 2.6 kg | 27.5 mm | 17.30" | 1920x1080 | |
| 82.9 % v7 (old) | 06-2019 | MSI GS75 Stealth 9SG i7-9750H, GeForce RTX 2080 Max-Q | 2.3 kg | 18.9 mm | 17.30" | 1920x1080 | |
| 86 % v7 (old) | 09-2019 | Asus Strix Hero III G731GV i7-9750H, GeForce RTX 2060 Mobile | 2.9 kg | 26.2 mm | 17.30" | 1920x1080 | |
| 83.2 % v7 (old) | 10-2019 | Lenovo Legion Y740-17IRH i7-9750H, GeForce RTX 2060 Mobile | 3 kg | 23 mm | 17.30" | 1920x1080 | |
| 89.4 % v6 (old) | 08-2019 | Razer Blade Pro 17 RTX 2060 i7-9750H, GeForce RTX 2060 Mobile | 2.8 kg | 19.9 mm | 17.30" | 1920x1080 | |
| 86.5 % v7 (old) | 05-2020 | Aorus 17G XB i7-10875H, GeForce RTX 2070 Super Max-Q | 2.7 kg | 26 mm | 17.30" | 1920x1080 |
| SD Card Reader | |
| average JPG Copy Test (av. of 3 runs) | |
| Aorus 17G XB (Toshiba Exceria Pro SDXC 64 GB UHS-II) | |
| Gigabyte Aero 17 HDR XB (Toshiba Exceria Pro SDXC 64 GB UHS-II) | |
| Dell XPS 15 9500 Core i7 4K UHD (Toshiba Exceria Pro SDXC 64 GB UHS-II) | |
| Razer Blade Pro 17 RTX 2060 (Toshiba Exceria Pro SDXC 64 GB UHS-II) | |
| MSI GT73VR 7RF-296 (Toshiba Exceria Pro SDXC 64 GB UHS-II) | |
| MSI GE75 Raider 10SE-008US (Toshiba Exceria Pro SDXC 64 GB UHS-II) | |
| maximum AS SSD Seq Read Test (1GB) | |
| Aorus 17G XB (Toshiba Exceria Pro SDXC 64 GB UHS-II) | |
| Gigabyte Aero 17 HDR XB (Toshiba Exceria Pro SDXC 64 GB UHS-II) | |
| MSI GT73VR 7RF-296 (Toshiba Exceria Pro SDXC 64 GB UHS-II) | |
| Razer Blade Pro 17 RTX 2060 (Toshiba Exceria Pro SDXC 64 GB UHS-II) | |
| Dell XPS 15 9500 Core i7 4K UHD (Toshiba Exceria Pro SDXC 64 GB UHS-II) | |
| MSI GE75 Raider 10SE-008US (Toshiba Exceria Pro SDXC 64 GB UHS-II) | |


| |||||||||||||||||||||||||
Helderheidsverdeling: 81 %
Helderheid in Batterij-modus: 337.9 cd/m²
Contrast: 1165:1 (Zwart: 0.29 cd/m²)
ΔE ColorChecker Calman: 2.18 | ∀{0.5-29.43 Ø4.72}
calibrated: 0.69
ΔE Greyscale Calman: 3.1 | ∀{0.09-98 Ø4.97}
98.2% sRGB (Argyll 1.6.3 3D)
62% AdobeRGB 1998 (Argyll 1.6.3 3D)
67.8% AdobeRGB 1998 (Argyll 3D)
98.1% sRGB (Argyll 3D)
65.6% Display P3 (Argyll 3D)
Gamma: 2.07
CCT: 6882 K
| MSI GE75 Raider 10SE-008US Chi Mei N173HCE-G33, IPS, 17.3", 1920x1080 | MSI GS75 Stealth 9SG Chi Mei N173HCE-G33 (CMN175C), IPS, 17.3", 1920x1080 | Asus Strix Hero III G731GV AU Optronics AUO B173HAN04.0, IPS, 17.3", 1920x1080 | Lenovo Legion Y740-17IRH LG Philips LP173WFG-SPD2 (LGD05E0), IPS, 17.3", 1920x1080 | Razer Blade Pro 17 RTX 2060 AU Optronics B173HAN04.0, IPS, 17.3", 1920x1080 | Aorus 17G XB AU Optronics B173HAN05.0 (AUO509D), IPS, 17.3", 1920x1080 | |
|---|---|---|---|---|---|---|
| Display | -5% | -7% | -2% | -8% | 5% | |
| Display P3 Coverage (%) | 65.6 | 62.6 -5% | 62.9 -4% | 64.8 -1% | 61.1 -7% | 70.6 8% |
| sRGB Coverage (%) | 98.1 | 93.5 -5% | 87.2 -11% | 96 -2% | 89.4 -9% | 97.2 -1% |
| AdobeRGB 1998 Coverage (%) | 67.8 | 64.7 -5% | 63.8 -6% | 65.8 -3% | 62.5 -8% | 72.8 7% |
| Response Times | -10% | -18% | -73% | 0% | -86% | |
| Response Time Grey 50% / Grey 80% * (ms) | 6.8 ? | 7.2 ? -6% | 6.8 ? -0% | 14.8 ? -118% | 6.8 ? -0% | 16 ? -135% |
| Response Time Black / White * (ms) | 8.8 ? | 10 ? -14% | 12 ? -36% | 11.2 ? -27% | 8.8 ? -0% | 12 ? -36% |
| PWM Frequency (Hz) | 25000 ? | 25510 ? | ||||
| Screen | 11% | -52% | -24% | -30% | 11% | |
| Brightness middle (cd/m²) | 337.9 | 366 8% | 312.3 -8% | 282 -17% | 300.4 -11% | 293 -13% |
| Brightness (cd/m²) | 305 | 343 12% | 297 -3% | 261 -14% | 289 -5% | 285 -7% |
| Brightness Distribution (%) | 81 | 91 12% | 91 12% | 87 7% | 93 15% | 95 17% |
| Black Level * (cd/m²) | 0.29 | 0.29 -0% | 0.21 28% | 0.27 7% | 0.32 -10% | 0.24 17% |
| Contrast (:1) | 1165 | 1262 8% | 1487 28% | 1044 -10% | 939 -19% | 1221 5% |
| Colorchecker dE 2000 * | 2.18 | 1.51 31% | 3.6 -65% | 3.18 -46% | 2.32 -6% | 1.27 42% |
| Colorchecker dE 2000 max. * | 3.9 | 3.22 17% | 6.74 -73% | 8.39 -115% | 3.81 2% | 2.24 43% |
| Colorchecker dE 2000 calibrated * | 0.69 | 0.71 -3% | 3.95 -472% | 0.95 -38% | 2.95 -328% | 1.06 -54% |
| Greyscale dE 2000 * | 3.1 | 1.93 38% | 3.1 -0% | 4.1 -32% | 1.5 52% | 1.34 57% |
| Gamma | 2.07 106% | 2.38 92% | 2.26 97% | 2.55 86% | 2.3 96% | 2.38 92% |
| CCT | 6882 94% | 6881 94% | 7002 93% | 7260 90% | 6764 96% | 6542 99% |
| Color Space (Percent of AdobeRGB 1998) (%) | 62 | 60 -3% | 56.6 -9% | 61 -2% | 57.4 -7% | 73 18% |
| Color Space (Percent of sRGB) (%) | 98.2 | 94 -4% | 86.6 -12% | 96 -2% | 89 -9% | 94 -4% |
| Totaal Gemiddelde (Programma / Instellingen) | -1% /
5% | -26% /
-39% | -33% /
-26% | -13% /
-22% | -23% /
-2% |
* ... kleiner is beter
Responstijd Scherm
| ↔ Responstijd Zwart naar Wit | ||
|---|---|---|
| 8.8 ms ... stijging ↗ en daling ↘ gecombineerd | ↗ 4.4 ms stijging | 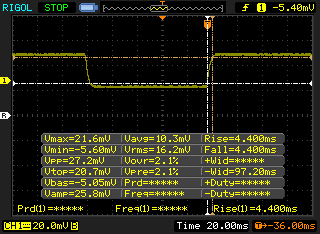 |
| ↘ 4.4 ms daling | ||
| Het scherm vertoonde snelle responstijden in onze tests en zou geschikt moeten zijn voor games. Ter vergelijking: alle testtoestellen variëren van 0.1 (minimum) tot 240 (maximum) ms. » 24 % van alle toestellen zijn beter. Dit betekent dat de gemeten responstijd beter is dan het gemiddelde (19.9 ms) van alle geteste toestellen. | ||
| ↔ Responstijd 50% Grijs naar 80% Grijs | ||
| 6.8 ms ... stijging ↗ en daling ↘ gecombineerd | ↗ 3.4 ms stijging | 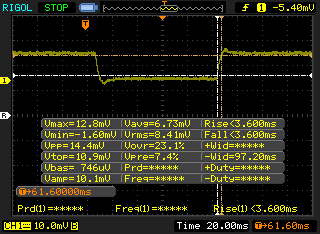 |
| ↘ 3.4 ms daling | ||
| Het scherm vertoonde erg snelle responstijden in onze tests en zou zeer geschikt moeten zijn voor snelle games. Ter vergelijking: alle testtoestellen variëren van 0.165 (minimum) tot 636 (maximum) ms. » 19 % van alle toestellen zijn beter. Dit betekent dat de gemeten responstijd beter is dan het gemiddelde (31.1 ms) van alle geteste toestellen. | ||
Screen Flickering / PWM (Pulse-Width Modulation)
| Screen flickering / PWM waargenomen | 25000 Hz | ≤ 18 % helderheid instelling | 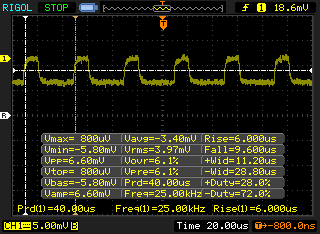 |
De achtergrondverlichting van het scherm flikkert op 25000 Hz (in het slechtste geval, bijvoorbeeld bij gebruik van PWM) aan een helderheid van 18 % en lager. Boven deze helderheid zou er geen flickering / PWM mogen optreden. De frequentie van 25000 Hz is redelijk hoog en de meeste mensen die gevoelig zijn aan flickering zouden dit dus niet mogen waarnemen of geïrriteerde ogen krijgen. Ter vergelijking: 52 % van alle geteste toestellen maakten geen gebruik van PWM om de schermhelderheid te verlagen. Als het wel werd gebruikt, werd een gemiddelde van 7784 (minimum: 5 - maximum: 343500) Hz waargenomen. | |||
Cinebench R15: CPU Multi 64Bit | CPU Single 64Bit
Blender: v2.79 BMW27 CPU
7-Zip 18.03: 7z b 4 -mmt1 | 7z b 4
Geekbench 5.5: Single-Core | Multi-Core
HWBOT x265 Benchmark v2.2: 4k Preset
LibreOffice : 20 Documents To PDF
R Benchmark 2.5: Overall mean
| Geekbench 5.5 / Single-Core | |
| MSI GE66 Raider 10SFS | |
| Razer Blade Pro 17 RTX 2070 Max-Q 300 Hz | |
| Gemiddeld Intel Core i7-10750H (1114 - 1333, n=43) | |
| MSI GE75 Raider 10SE-008US | |
| MSI Bravo 17 A4DDR | |
| MSI GF75 Thin 10SCXR | |
| Lenovo Legion Y740-17IRHg-81UJ001VGE | |
| Acer Nitro 5 AN515-44-R5FT | |
| Geekbench 5.5 / Multi-Core | |
| MSI GE66 Raider 10SFS | |
| MSI Bravo 17 A4DDR | |
| Razer Blade Pro 17 RTX 2070 Max-Q 300 Hz | |
| MSI GE75 Raider 10SE-008US | |
| Gemiddeld Intel Core i7-10750H (4443 - 6674, n=43) | |
| Lenovo Legion Y740-17IRHg-81UJ001VGE | |
| Acer Nitro 5 AN515-44-R5FT | |
| MSI GF75 Thin 10SCXR | |
| HWBOT x265 Benchmark v2.2 / 4k Preset | |
| MSI Bravo 17 A4DDR | |
| MSI GE66 Raider 10SFS | |
| MSI GE75 9SG | |
| MSI GE75 Raider 10SE-008US | |
| Gemiddeld Intel Core i7-10750H (5.54 - 11.6, n=43) | |
| Lenovo Legion Y740-17IRHg-81UJ001VGE | |
| Acer Nitro 5 AN515-44-R5FT | |
| MSI GF75 Thin 10SCXR | |
| Asus ROG Zephyrus G15 GA502DU | |
| LibreOffice / 20 Documents To PDF | |
| MSI Bravo 17 A4DDR | |
| Acer Nitro 5 AN515-44-R5FT | |
| MSI GF75 Thin 10SCXR | |
| Razer Blade Pro 17 RTX 2070 Max-Q 300 Hz | |
| MSI GE75 Raider 10SE-008US | |
| MSI GE66 Raider 10SFS | |
| Gemiddeld Intel Core i7-10750H (43.1 - 99.2, n=43) | |
| R Benchmark 2.5 / Overall mean | |
| Lenovo Legion Y740-17IRHg-81UJ001VGE | |
| MSI GF75 Thin 10SCXR | |
| Acer Nitro 5 AN515-44-R5FT | |
| MSI GE75 Raider 10SE-008US | |
| Gemiddeld Intel Core i7-10750H (0.578 - 0.708, n=42) | |
| MSI Bravo 17 A4DDR | |
| MSI GE66 Raider 10SFS | |
* ... kleiner is beter
| PCMark 8 Home Score Accelerated v2 | 4515 punten | |
| PCMark 8 Work Score Accelerated v2 | 5928 punten | |
| PCMark 10 Score | 6268 punten | |
Help | ||
| DPC Latencies / LatencyMon - interrupt to process latency (max), Web, Youtube, Prime95 | |
| Dell XPS 15 9500 Core i7 4K UHD | |
| Asus Zephyrus G14 GA401IV | |
| MSI GE75 Raider 10SE-008US | |
| Razer Blade Pro 17 RTX 2070 Max-Q 300 Hz | |
* ... kleiner is beter
| MSI GE75 Raider 10SE-008US Samsung SSD PM981 MZVLB512HAJQ | MSI GS75 Stealth 9SG 2x Samsung SSD PM981 MZVLB1T0HALR (RAID 0) | Asus Strix Hero III G731GV Intel SSD 660p SSDPEKNW512G8 | Lenovo Legion Y740-17IRH WDC PC SN520 SDAPMUW-128G | Razer Blade Pro 17 RTX 2060 Samsung SSD PM981 MZVLB512HAJQ | Aorus 17G XB Samsung SSD PM981a MZVLB512HBJQ | |
|---|---|---|---|---|---|---|
| AS SSD | 6% | -27% | -60% | 5% | 2% | |
| Seq Read (MB/s) | 2036 | 2855 40% | 940 -54% | 1339 -34% | 1810 -11% | 1791 -12% |
| Seq Write (MB/s) | 1835 | 2687 46% | 921 -50% | 688 -63% | 1797 -2% | 2193 20% |
| 4K Read (MB/s) | 60.6 | 30.31 -50% | 48.05 -21% | 23.23 -62% | 48.43 -20% | 50.7 -16% |
| 4K Write (MB/s) | 127.2 | 96.3 -24% | 104.3 -18% | 98.8 -22% | 106 -17% | 116.8 -8% |
| 4K-64 Read (MB/s) | 1601 | 1460 -9% | 320.1 -80% | 300.9 -81% | 1156 -28% | 1525 -5% |
| 4K-64 Write (MB/s) | 1734 | 1224 -29% | 703 -59% | 204.6 -88% | 1748 1% | 1958 13% |
| Access Time Read * (ms) | 0.049 | 0.054 -10% | 0.079 -61% | 0.184 -276% | 0.057 -16% | 0.07 -43% |
| Access Time Write * (ms) | 0.09 | 0.038 58% | 0.046 49% | 0.037 59% | 0.035 61% | 0.032 64% |
| Score Read (Points) | 1865 | 1776 -5% | 462 -75% | 458 -75% | 1385 -26% | 1755 -6% |
| Score Write (Points) | 2045 | 1589 -22% | 900 -56% | 372 -82% | 2033 -1% | 2294 12% |
| Score Total (Points) | 4863 | 4259 -12% | 1616 -67% | 1038 -79% | 4135 -15% | 4972 2% |
| Copy ISO MB/s (MB/s) | 1900 | 2226 17% | 1416 -25% | 988 -48% | 1984 4% | |
| Copy Program MB/s (MB/s) | 205.5 | 426.4 107% | 569 177% | 327.2 59% | 588 186% | |
| Copy Game MB/s (MB/s) | 1419 | 1152 -19% | 971 -32% | 758 -47% | 835 -41% | |
| CrystalDiskMark 5.2 / 6 | 8% | -27% | -49% | -10% | 9% | |
| Write 4K (MB/s) | 139.2 | 95.5 -31% | 129.3 -7% | 102.7 -26% | 124.1 -11% | 123.4 -11% |
| Read 4K (MB/s) | 53 | 42.59 -20% | 54.4 3% | 29.12 -45% | 44.75 -16% | 45.02 -15% |
| Write Seq (MB/s) | 1950 | 2851 46% | 978 -50% | 362.2 -81% | 1292 -34% | 2526 30% |
| Read Seq (MB/s) | 2328 | 2696 16% | 1447 -38% | 1010 -57% | 1272 -45% | 2062 -11% |
| Write 4K Q32T1 (MB/s) | 408.9 | 402.6 -2% | 476.8 17% | 298.1 -27% | 514 26% | 497.9 22% |
| Read 4K Q32T1 (MB/s) | 551 | 443.9 -19% | 338.1 -39% | 349.6 -37% | 596 8% | 579 5% |
| Write Seq Q32T1 (MB/s) | 1938 | 3420 76% | 982 -49% | 788 -59% | 1892 -2% | 2982 54% |
| Read Seq Q32T1 (MB/s) | 3467 | 3514 1% | 1622 -53% | 1490 -57% | 3209 -7% | 3440 -1% |
| Totaal Gemiddelde (Programma / Instellingen) | 7% /
7% | -27% /
-27% | -55% /
-56% | -3% /
-0% | 6% /
5% |
* ... kleiner is beter

Disk Throttling: DiskSpd Read Loop, Queue Depth 8
| 3DMark 11 Performance | 20404 punten | |
| 3DMark Cloud Gate Standard Score | 39384 punten | |
| 3DMark Fire Strike Score | 16312 punten | |
| 3DMark Time Spy Score | 6788 punten | |
Help | ||
| The Witcher 3 - 1920x1080 Ultra Graphics & Postprocessing (HBAO+) | |
| MSI GE75 9SG | |
| KFA2 GeForce RTX 2060 Super | |
| Aorus 17G XB | |
| MSI GE75 Raider 10SE-008US | |
| Schenker XMG Ultra 17 Coffee Lake Refresh | |
| Gemiddeld NVIDIA GeForce RTX 2060 Mobile (50.6 - 74, n=40) | |
| Asus Zephyrus G14 GA401IV | |
| Asus TUF A17 FA706IU-AS76 | |
| HP Omen 15-dc0015ng | |
| MSI GF75 Thin 10SCXR | |
| lage | gem. | hoge | ultra | |
|---|---|---|---|---|
| The Witcher 3 (2015) | 293.5 | 214.9 | 123.9 | 65.9 |
| Dota 2 Reborn (2015) | 149 | 135 | 125 | 118 |
| X-Plane 11.11 (2018) | 103 | 90.6 | 77.2 | |
| Shadow of the Tomb Raider (2018) | 132 | 102 | 97 | 86 |
| MSI GE75 Raider 10SE-008US GeForce RTX 2060 Mobile, i7-10750H, Samsung SSD PM981 MZVLB512HAJQ | MSI GS75 Stealth 9SG GeForce RTX 2080 Max-Q, i7-9750H, 2x Samsung SSD PM981 MZVLB1T0HALR (RAID 0) | Asus Strix Hero III G731GV GeForce RTX 2060 Mobile, i7-9750H, Intel SSD 660p SSDPEKNW512G8 | Lenovo Legion Y740-17IRH GeForce RTX 2060 Mobile, i7-9750H, WDC PC SN520 SDAPMUW-128G | Razer Blade Pro 17 RTX 2060 GeForce RTX 2060 Mobile, i7-9750H, Samsung SSD PM981 MZVLB512HAJQ | Aorus 17G XB GeForce RTX 2070 Super Max-Q, i7-10875H, Samsung SSD PM981a MZVLB512HBJQ | |
|---|---|---|---|---|---|---|
| Noise | -7% | -4% | -8% | 2% | -12% | |
| uit / omgeving * (dB) | 28.4 | 30 -6% | 28.2 1% | 30 -6% | 28.2 1% | 30 -6% |
| Idle Minimum * (dB) | 30.2 | 31 -3% | 29.5 2% | 33 -9% | 28.2 7% | 35 -16% |
| Idle Average * (dB) | 30.2 | 32 -6% | 30.3 -0% | 34 -13% | 28.2 7% | 36 -19% |
| Idle Maximum * (dB) | 32 | 38 -19% | 31.9 -0% | 35 -9% | 28.2 12% | 41 -28% |
| Load Average * (dB) | 33.2 | 47 -42% | 50.4 -52% | 48 -45% | 43 -30% | 47 -42% |
| Witcher 3 ultra * (dB) | 55 | 48 13% | 50.1 9% | 46 16% | 48.4 12% | 48 13% |
| Load Maximum * (dB) | 55 | 49 11% | 50.1 9% | 49 11% | 53.4 3% | 49 11% |
* ... kleiner is beter
Geluidsniveau
| Onbelast |
| 30.2 / 30.2 / 32 dB (A) |
| Belasting |
| 33.2 / 55 dB (A) |
 | ||
30 dB stil 40 dB(A) hoorbaar 50 dB(A) luid |
||
min: | ||
(±) De maximumtemperatuur aan de bovenzijde bedraagt 44.2 °C / 112 F, vergeleken met het gemiddelde van 40.4 °C / 105 F, variërend van 21.2 tot 68.8 °C voor de klasse Gaming.
(-) De bodem warmt op tot een maximum van 49 °C / 120 F, vergeleken met een gemiddelde van 43.2 °C / 110 F
(+) Bij onbelast gebruik bedraagt de gemiddelde temperatuur voor de bovenzijde 31.2 °C / 88 F, vergeleken met het apparaatgemiddelde van 33.9 °C / 93 F.
(±) Bij het spelen van The Witcher 3 is de gemiddelde temperatuur voor de bovenzijde 33.6 °C / 92 F, vergeleken met het apparaatgemiddelde van 33.9 °C / 93 F.
(+) De palmsteunen en het touchpad zijn met een maximum van ###max## °C / 84.6 F koeler dan de huidtemperatuur en voelen daarom koel aan.
(±) De gemiddelde temperatuur van de handpalmsteun van soortgelijke toestellen bedroeg 28.8 °C / 83.8 F (-0.4 °C / -0.8 F).
MSI GE75 Raider 10SE-008US audioanalyse
(+) | luidsprekers kunnen relatief luid spelen (95.5 dB)
Bas 100 - 315 Hz
(-) | bijna geen lage tonen - gemiddeld 20.2% lager dan de mediaan
(+) | de lage tonen zijn lineair (2.2% delta naar de vorige frequentie)
Midden 400 - 2000 Hz
(±) | lagere middens - gemiddeld 5.7% lager dan de mediaan
(+) | de middentonen zijn lineair (5.9% delta ten opzichte van de vorige frequentie)
Hoog 2 - 16 kHz
(+) | evenwichtige hoogtepunten - slechts 2.8% verwijderd van de mediaan
(+) | de hoge tonen zijn lineair (5% delta naar de vorige frequentie)
Algemeen 100 - 16.000 Hz
(±) | lineariteit van het totale geluid is gemiddeld (15.2% verschil met de mediaan)
Vergeleken met dezelfde klasse
» 33% van alle geteste apparaten in deze klasse waren beter, 6% vergelijkbaar, 61% slechter
» De beste had een delta van 6%, het gemiddelde was 18%, de slechtste was 132%
Vergeleken met alle geteste toestellen
» 21% van alle geteste apparaten waren beter, 4% gelijk, 74% slechter
» De beste had een delta van 4%, het gemiddelde was 24%, de slechtste was 134%
Apple MacBook 12 (Early 2016) 1.1 GHz audioanalyse
(+) | luidsprekers kunnen relatief luid spelen (83.6 dB)
Bas 100 - 315 Hz
(±) | verminderde zeebaars - gemiddeld 11.3% lager dan de mediaan
(±) | lineariteit van de lage tonen is gemiddeld (14.2% delta ten opzichte van de vorige frequentie)
Midden 400 - 2000 Hz
(+) | evenwichtige middens - slechts 2.4% verwijderd van de mediaan
(+) | de middentonen zijn lineair (5.5% delta ten opzichte van de vorige frequentie)
Hoog 2 - 16 kHz
(+) | evenwichtige hoogtepunten - slechts 2% verwijderd van de mediaan
(+) | de hoge tonen zijn lineair (4.5% delta naar de vorige frequentie)
Algemeen 100 - 16.000 Hz
(+) | het totale geluid is lineair (10.2% verschil met de mediaan)
Vergeleken met dezelfde klasse
» 7% van alle geteste apparaten in deze klasse waren beter, 2% vergelijkbaar, 91% slechter
» De beste had een delta van 5%, het gemiddelde was 18%, de slechtste was 53%
Vergeleken met alle geteste toestellen
» 5% van alle geteste apparaten waren beter, 1% gelijk, 94% slechter
» De beste had een delta van 4%, het gemiddelde was 24%, de slechtste was 134%
| Uit / Standby | |
| Inactief | |
| Belasting |
|
Key:
min: | |
| MSI GE75 Raider 10SE-008US i7-10750H, GeForce RTX 2060 Mobile, Samsung SSD PM981 MZVLB512HAJQ, IPS, 1920x1080, 17.3" | MSI GS75 Stealth 9SG i7-9750H, GeForce RTX 2080 Max-Q, 2x Samsung SSD PM981 MZVLB1T0HALR (RAID 0), IPS, 1920x1080, 17.3" | Asus Strix Hero III G731GV i7-9750H, GeForce RTX 2060 Mobile, Intel SSD 660p SSDPEKNW512G8, IPS, 1920x1080, 17.3" | Lenovo Legion Y740-17IRH i7-9750H, GeForce RTX 2060 Mobile, WDC PC SN520 SDAPMUW-128G, IPS, 1920x1080, 17.3" | Razer Blade Pro 17 RTX 2060 i7-9750H, GeForce RTX 2060 Mobile, Samsung SSD PM981 MZVLB512HAJQ, IPS, 1920x1080, 17.3" | Aorus 17G XB i7-10875H, GeForce RTX 2070 Super Max-Q, Samsung SSD PM981a MZVLB512HBJQ, IPS, 1920x1080, 17.3" | |
|---|---|---|---|---|---|---|
| Power Consumption | 8% | -7% | 2% | -1% | -15% | |
| Idle Minimum * (Watt) | 14.7 | 13 12% | 16.2 -10% | 20 -36% | 16 -9% | 20 -36% |
| Idle Average * (Watt) | 20.4 | 17 17% | 24.8 -22% | 21 -3% | 21.7 -6% | 23 -13% |
| Idle Maximum * (Watt) | 26.9 | 25 7% | 28.6 -6% | 26 3% | 26.1 3% | 38 -41% |
| Load Average * (Watt) | 93.2 | 96 -3% | 127.6 -37% | 97 -4% | 105.6 -13% | 105 -13% |
| Witcher 3 ultra * (Watt) | 185.4 | 156 16% | 147.1 21% | 139 25% | 161.8 13% | 158 15% |
| Load Maximum * (Watt) | 237.8 | 239 -1% | 212.7 11% | 168 29% | 225.3 5% | 243 -2% |
* ... kleiner is beter
| MSI GE75 Raider 10SE-008US i7-10750H, GeForce RTX 2060 Mobile, 65 Wh | MSI GS75 Stealth 9SG i7-9750H, GeForce RTX 2080 Max-Q, 80.25 Wh | Asus Strix Hero III G731GV i7-9750H, GeForce RTX 2060 Mobile, 66 Wh | Lenovo Legion Y740-17IRH i7-9750H, GeForce RTX 2060 Mobile, 76 Wh | Razer Blade Pro 17 RTX 2060 i7-9750H, GeForce RTX 2060 Mobile, 70 Wh | Aorus 17G XB i7-10875H, GeForce RTX 2070 Super Max-Q, 94 Wh | |
|---|---|---|---|---|---|---|
| Batterijduur | 62% | 22% | 16% | 22% | 103% | |
| WiFi v1.3 (h) | 3.7 | 6 62% | 4.5 22% | 4.3 16% | 4.5 22% | 7.5 103% |
| Reader / Idle (h) | 7.7 | 6.9 | 10 | |||
| Load (h) | 1.2 | 1.1 | 2.2 |
Pro
Contra
Dit is de verkorte versie van het originele artikel. Het volledige, Engelse testrapport vind je hier.
De GE75 10SE heeft dezelfde voor- en nadelen als de oudere 2018- en 2019-modellen. Ventilatorgeluid in het bijzonder is niet stiller tijdens het gamen, maar de interne temperaturen zijn over het algemeen lager met als resultaat hogere prestaties dan andere gaming-laptops die zijn uitgerust met dezelfde CPU of GPU. Als je het meeste uit de Core i7-10875H of GeForce RTX 2060 wilt halen, dan helpt het om voor een omvangrijker toestel zoals de GE75 te gaan in plaats van een dunner alternatief.
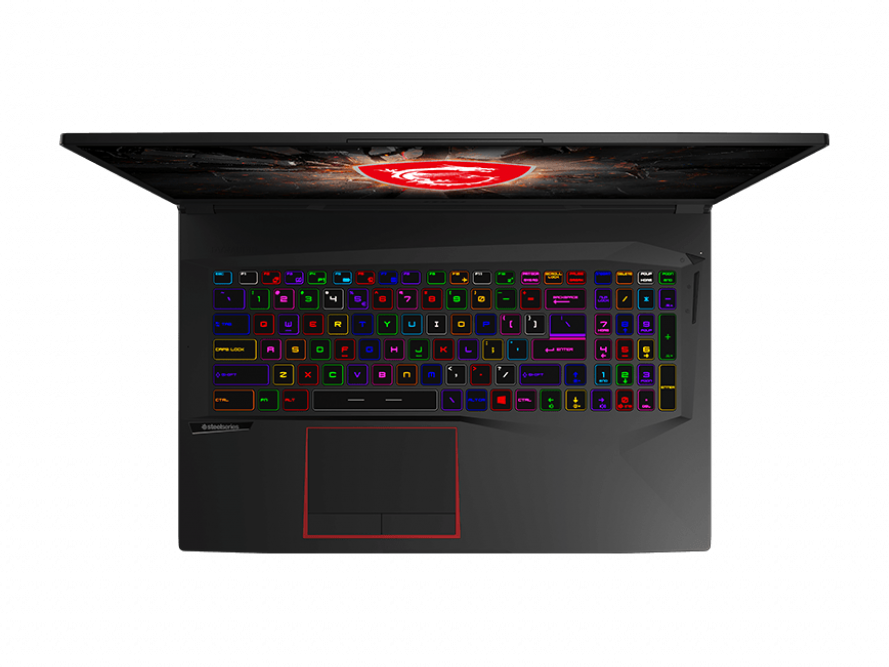
Na drie jaar met hetzelfde ontwerp beginnen sommige aspecten echter hun leeftijd te tonen. De onderste schermrand is relatief dik, er is geen webcam-sluiter of Thunderbolt 3-ondersteuning en de ongelijke schermverlichting is een enorme teleurstelling. In plaats de onvermijdelijke redesign dunner te maken, zouden we graag een afname van het ventilatorgeluid zien met behoud van hetzelfde bovengemiddelde prestatieniveau. Gebruikers met een kleiner budget kunnen nog steeds de 2019 GE75-serie met Coffee Lake-H kopen voor bijna dezelfde gaming-prestaties als onze GE75 met Comet Lake-H.
De MSI GE75-serie heeft zijn veelzijdigheid bewezen met drie generaties Intel H-serie CPU's. De prestaties blijven top dankzij de performante koeloplossing, maar andere aspecten zoals ventilatorgeluid en andere fysieke kenmerken zouden beter mogen.
MSI GE75 Raider 10SE-008US
- 02-07-2020 v7 (old)
Allen Ngo
Price comparison
