Kort testrapport MSI GE75 8SG Raider (i7-8750H, RTX 2080) Laptop

| SD Card Reader | |
| average JPG Copy Test (av. of 3 runs) | |
| MSI GS73 Stealth 8RF-011 (Toshiba Exceria Pro SDXC 64 GB UHS-II) | |
| Gemiddelde van klas Gaming (20.9 - 210, n=54, laatste 2 jaar) | |
| Asus ROG Strix Scar II GL704GW (Toshiba Exceria Pro SDXC 64 GB UHS-II) | |
| MSI GE75 8SG Raider (Toshiba Exceria Pro SDXC 64 GB UHS-II) | |
| maximum AS SSD Seq Read Test (1GB) | |
| MSI GS73 Stealth 8RF-011 (Toshiba Exceria Pro SDXC 64 GB UHS-II) | |
| Gemiddelde van klas Gaming (25.5 - 261, n=51, laatste 2 jaar) | |
| Asus ROG Strix Scar II GL704GW (Toshiba Exceria Pro SDXC 64 GB UHS-II) | |
| MSI GE75 8SG Raider (Toshiba Exceria Pro SDXC 64 GB UHS-II) | |
| |||||||||||||||||||||||||
Helderheidsverdeling: 86 %
Helderheid in Batterij-modus: 363 cd/m²
Contrast: 1344:1 (Zwart: 0.27 cd/m²)
ΔE ColorChecker Calman: 2.29 | ∀{0.5-29.43 Ø4.72}
calibrated: 2.45
ΔE Greyscale Calman: 3.02 | ∀{0.09-98 Ø4.97}
91% sRGB (Argyll 1.6.3 3D)
58% AdobeRGB 1998 (Argyll 1.6.3 3D)
62.6% AdobeRGB 1998 (Argyll 3D)
91.2% sRGB (Argyll 3D)
60.6% Display P3 (Argyll 3D)
Gamma: 2.38
CCT: 7048 K
| MSI GE75 8SG Raider CMN N173HCE-G33 (CMN175C), , 1920x1080, 17.3" | Asus Zephyrus S GX701GX B173HAN04.0 (AUO409D), , 1920x1080, 17.3" | Lenovo Legion Y740-17ICH AU Optronics B173HAN03.2, , 1920x1080, 17.3" | Asus ROG Strix Scar II GL704GW B173HAN04.0 (AUO409D), , 1920x1080, 17.3" | MSI GS73 Stealth 8RF-011 CMN N173HHE-G32 (CMN1747), , 1920x1080, 17.3" | MSI GE75 8SF Chi Mei N173HCE-G33, , 1920x1080, 17.3" | |
|---|---|---|---|---|---|---|
| Display | 1% | 3% | 1% | 32% | 4% | |
| Display P3 Coverage (%) | 60.6 | 62.9 4% | 64 6% | 62.9 4% | 90.8 50% | 63.1 4% |
| sRGB Coverage (%) | 91.2 | 87.8 -4% | 90.4 -1% | 87.1 -4% | 99.9 10% | 94.4 4% |
| AdobeRGB 1998 Coverage (%) | 62.6 | 63.9 2% | 64.8 4% | 63.7 2% | 85.8 37% | 65.2 4% |
| Response Times | 3% | -67% | -71% | 18% | -17% | |
| Response Time Grey 50% / Grey 80% * (ms) | 8 ? | 7.2 ? 10% | 15.6 ? -95% | 17.6 ? -120% | 7.8 ? 2% | 9.6 ? -20% |
| Response Time Black / White * (ms) | 9.2 ? | 9.6 ? -4% | 12.8 ? -39% | 11.2 ? -22% | 6.2 ? 33% | 10.4 ? -13% |
| PWM Frequency (Hz) | 26040 ? | 25510 ? | 25770 ? | |||
| Screen | 3% | -43% | -8% | -9% | 17% | |
| Brightness middle (cd/m²) | 363 | 288 -21% | 299.1 -18% | 295 -19% | 262 -28% | 370.4 2% |
| Brightness (cd/m²) | 342 | 287 -16% | 273 -20% | 291 -15% | 261 -24% | 348 2% |
| Brightness Distribution (%) | 86 | 91 6% | 81 -6% | 96 12% | 94 9% | 89 3% |
| Black Level * (cd/m²) | 0.27 | 0.2 26% | 0.27 -0% | 0.24 11% | 0.2 26% | 0.29 -7% |
| Contrast (:1) | 1344 | 1440 7% | 1108 -18% | 1229 -9% | 1310 -3% | 1277 -5% |
| Colorchecker dE 2000 * | 2.29 | 2.33 -2% | 5.07 -121% | 3.2 -40% | 3.96 -73% | 1.26 45% |
| Colorchecker dE 2000 max. * | 4.54 | 5.34 -18% | 10.55 -132% | 6.64 -46% | 7.29 -61% | 3.02 33% |
| Colorchecker dE 2000 calibrated * | 2.45 | 2.47 -1% | 3.31 -35% | 2.52 -3% | 2.18 11% | 1.21 51% |
| Greyscale dE 2000 * | 3.02 | 1.19 61% | 6.8 -125% | 2.16 28% | 3.09 -2% | 1.4 54% |
| Gamma | 2.38 92% | 2.41 91% | 2.46 89% | 2.46 89% | 2.48 89% | 2.2 100% |
| CCT | 7048 92% | 6710 97% | 7805 83% | 6872 95% | 6977 93% | 6747 96% |
| Color Space (Percent of AdobeRGB 1998) (%) | 58 | 57 -2% | 58.5 1% | 57 -2% | 76 31% | 59.7 3% |
| Color Space (Percent of sRGB) (%) | 91 | 88 -3% | 89.9 -1% | 87 -4% | 100 10% | 94.4 4% |
| Totaal Gemiddelde (Programma / Instellingen) | 2% /
3% | -36% /
-38% | -26% /
-14% | 14% /
2% | 1% /
10% |
* ... kleiner is beter
Responstijd Scherm
| ↔ Responstijd Zwart naar Wit | ||
|---|---|---|
| 9.2 ms ... stijging ↗ en daling ↘ gecombineerd | ↗ 4.8 ms stijging | 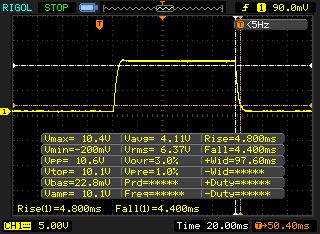 |
| ↘ 4.4 ms daling | ||
| Het scherm vertoonde snelle responstijden in onze tests en zou geschikt moeten zijn voor games. Ter vergelijking: alle testtoestellen variëren van 0.1 (minimum) tot 240 (maximum) ms. » 26 % van alle toestellen zijn beter. Dit betekent dat de gemeten responstijd beter is dan het gemiddelde (19.8 ms) van alle geteste toestellen. | ||
| ↔ Responstijd 50% Grijs naar 80% Grijs | ||
| 8 ms ... stijging ↗ en daling ↘ gecombineerd | ↗ 4 ms stijging | 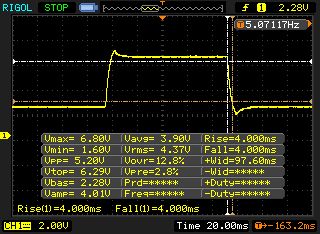 |
| ↘ 4 ms daling | ||
| Het scherm vertoonde snelle responstijden in onze tests en zou geschikt moeten zijn voor games. Ter vergelijking: alle testtoestellen variëren van 0.165 (minimum) tot 636 (maximum) ms. » 21 % van alle toestellen zijn beter. Dit betekent dat de gemeten responstijd beter is dan het gemiddelde (31 ms) van alle geteste toestellen. | ||
Screen Flickering / PWM (Pulse-Width Modulation)
| Screen flickering / PWM waargenomen | 26040 Hz | ≤ 17 % helderheid instelling | 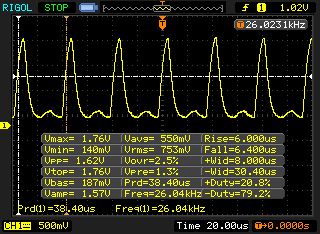 |
De achtergrondverlichting van het scherm flikkert op 26040 Hz (in het slechtste geval, bijvoorbeeld bij gebruik van PWM) aan een helderheid van 17 % en lager. Boven deze helderheid zou er geen flickering / PWM mogen optreden. De frequentie van 26040 Hz is redelijk hoog en de meeste mensen die gevoelig zijn aan flickering zouden dit dus niet mogen waarnemen of geïrriteerde ogen krijgen. Ter vergelijking: 52 % van alle geteste toestellen maakten geen gebruik van PWM om de schermhelderheid te verlagen. Als het wel werd gebruikt, werd een gemiddelde van 7763 (minimum: 5 - maximum: 343500) Hz waargenomen. | |||
| PCMark 8 Home Score Accelerated v2 | 4918 punten | |
| PCMark 8 Creative Score Accelerated v2 | 8493 punten | |
| PCMark 8 Work Score Accelerated v2 | 5574 punten | |
| PCMark 10 Score | 5816 punten | |
Help | ||
| MSI GE75 8SG Raider Kingston RBUSNS8154P3512GJ | Asus Zephyrus S GX701GX Samsung SSD PM981 MZVLB1T0HALR | Lenovo Legion Y740-17ICH Samsung SSD PM981 MZVLB256HAHQ | Asus ROG Strix Scar II GL704GW Intel SSD 660p SSDPEKNW512G8 | MSI GS73 Stealth 8RF-011 Samsung PM961 MZVLW256HEHP | MSI GE75 8SF Kingston RBUSNS8154P3256GJ1 | Gemiddeld Kingston RBUSNS8154P3512GJ | |
|---|---|---|---|---|---|---|---|
| AS SSD | 88% | 31% | 11% | 38% | -12% | 1% | |
| Seq Read (MB/s) | 888 | 911 3% | 1153 30% | 1315 48% | 1749 97% | 949 7% | 1215 ? 37% |
| Seq Write (MB/s) | 906 | 2347 159% | 1328 47% | 927 2% | 1173 29% | 823 -9% | 897 ? -1% |
| 4K Read (MB/s) | 22.26 | 53 138% | 35.05 57% | 52.4 135% | 42.81 92% | 25.36 14% | 32.4 ? 46% |
| 4K Write (MB/s) | 83 | 122.5 48% | 96 16% | 122.8 48% | 98.4 19% | 67.1 -19% | 87.7 ? 6% |
| 4K-64 Read (MB/s) | 861 | 1577 83% | 727 -16% | 326.5 -62% | 1238 44% | 748 -13% | 796 ? -8% |
| 4K-64 Write (MB/s) | 697 | 1734 149% | 1212 74% | 727 4% | 691 -1% | 650 -7% | 672 ? -4% |
| Access Time Read * (ms) | 0.117 | 0.08 32% | 0.063 46% | 0.11 6% | 0.077 34% | 0.173 -48% | 0.115 ? 2% |
| Access Time Write * (ms) | 0.046 | 0.031 33% | 0.04 13% | 0.045 2% | 0.038 17% | 0.059 -28% | 0.07544 ? -64% |
| Score Read (Points) | 972 | 1721 77% | 878 -10% | 510 -48% | 1456 50% | 869 -11% | 950 ? -2% |
| Score Write (Points) | 870 | 2091 140% | 1441 66% | 942 8% | 906 4% | 799 -8% | 849 ? -2% |
| Score Total (Points) | 2340 | 4771 104% | 2784 19% | 1715 -27% | 3083 32% | 2109 -10% | 2274 ? -3% |
* ... kleiner is beter

| 3DMark 11 Performance | 22658 punten | |
| 3DMark Cloud Gate Standard Score | 35054 punten | |
| 3DMark Fire Strike Score | 19661 punten | |
| 3DMark Time Spy Score | 9018 punten | |
Help | ||
| lage | gem. | hoge | ultra | |
|---|---|---|---|---|
| The Witcher 3 (2015) | 276 | 230 | 162 | 92.1 |
| Dota 2 Reborn (2015) | 134.8 | 125.5 | 109 | 103.9 |
| Rise of the Tomb Raider (2016) | 236 | 174 | 155 | 145 |
| X-Plane 11.11 (2018) | 102 | 89 | 75 | |
| Shadow of the Tomb Raider (2018) | 126 | 111 | 106 | 99 |
| Assassin´s Creed Odyssey (2018) | 86 | 75 | 73 | 65 |
| Battlefield V (2018) | 144 | 132 | 117 | 111 |
| Darksiders III (2018) | 195 | 129 | 126 | 121 |
| Just Cause 4 (2018) | 181 | 161 | 118 | 116 |
| Far Cry New Dawn (2019) | 109 | 94 | 90 | 82 |
| Dirt Rally 2.0 (2019) | 216 | 159 | 144 | 96 |
Geluidsniveau
| Onbelast |
| 30 / 34 / 37 dB (A) |
| HDD |
| 33 dB (A) |
| Belasting |
| 52 / 54 dB (A) |
 | ||
30 dB stil 40 dB(A) hoorbaar 50 dB(A) luid |
||
min: | ||
| MSI GE75 8SG Raider GeForce RTX 2080 Mobile, i7-8750H, Kingston RBUSNS8154P3512GJ | Asus Zephyrus S GX701GX GeForce RTX 2080 Max-Q, i7-8750H, Samsung SSD PM981 MZVLB1T0HALR | Lenovo Legion Y740-17ICH GeForce RTX 2080 Max-Q, i7-8750H, Samsung SSD PM981 MZVLB256HAHQ | Asus ROG Strix Scar II GL704GW GeForce RTX 2070 Mobile, i7-8750H, Intel SSD 660p SSDPEKNW512G8 | MSI GS73 Stealth 8RF-011 GeForce GTX 1070 Max-Q, i7-8750H, Samsung PM961 MZVLW256HEHP | MSI GE75 8SF GeForce RTX 2070 Mobile, i7-8750H, Kingston RBUSNS8154P3256GJ1 | |
|---|---|---|---|---|---|---|
| Noise | 7% | 14% | 3% | 7% | 4% | |
| uit / omgeving * (dB) | 30 | 29 3% | 28.3 6% | 29 3% | 30 -0% | 28.3 6% |
| Idle Minimum * (dB) | 30 | 29 3% | 31.5 -5% | 29 3% | 30 -0% | 33.5 -12% |
| Idle Average * (dB) | 34 | 32 6% | 31.6 7% | 32 6% | 34 -0% | 33.6 1% |
| Idle Maximum * (dB) | 37 | 33 11% | 31.6 15% | 40 -8% | 36 3% | 35 5% |
| Load Average * (dB) | 52 | 47 10% | 32.3 38% | 46 12% | 43 17% | 38 27% |
| Witcher 3 ultra * (dB) | 53 | 49 8% | 43 19% | 51 4% | 45 15% | 50 6% |
| Load Maximum * (dB) | 54 | 51 6% | 45.5 16% | 52 4% | 45 17% | 56.9 -5% |
* ... kleiner is beter
(-) De maximumtemperatuur aan de bovenzijde bedraagt 46 °C / 115 F, vergeleken met het gemiddelde van 40.4 °C / 105 F, variërend van 21.2 tot 68.8 °C voor de klasse Gaming.
(±) De bodem warmt op tot een maximum van 45 °C / 113 F, vergeleken met een gemiddelde van 43.2 °C / 110 F
(+) Bij onbelast gebruik bedraagt de gemiddelde temperatuur voor de bovenzijde 25.8 °C / 78 F, vergeleken met het apparaatgemiddelde van 33.9 °C / 93 F.
(-) Bij het spelen van The Witcher 3 is de gemiddelde temperatuur voor de bovenzijde 42 °C / 108 F, vergeleken met het apparaatgemiddelde van 33.9 °C / 93 F.
(-) De palmsteunen en het touchpad kunnen zeer heet aanvoelen met een maximum van ###max## °C / 104 F.
(-) De gemiddelde temperatuur van de handpalmsteun van soortgelijke toestellen bedroeg 28.8 °C / 83.8 F (-11.2 °C / -20.2 F).
MSI GE75 8SG Raider audioanalyse
(+) | luidsprekers kunnen relatief luid spelen (91 dB)
Bas 100 - 315 Hz
(-) | bijna geen lage tonen - gemiddeld 15.7% lager dan de mediaan
(±) | lineariteit van de lage tonen is gemiddeld (12.1% delta ten opzichte van de vorige frequentie)
Midden 400 - 2000 Hz
(±) | lagere middens - gemiddeld 5.1% lager dan de mediaan
(+) | de middentonen zijn lineair (5.8% delta ten opzichte van de vorige frequentie)
Hoog 2 - 16 kHz
(+) | evenwichtige hoogtepunten - slechts 2.7% verwijderd van de mediaan
(+) | de hoge tonen zijn lineair (3.2% delta naar de vorige frequentie)
Algemeen 100 - 16.000 Hz
(+) | het totale geluid is lineair (12.8% verschil met de mediaan)
Vergeleken met dezelfde klasse
» 16% van alle geteste apparaten in deze klasse waren beter, 4% vergelijkbaar, 80% slechter
» De beste had een delta van 6%, het gemiddelde was 18%, de slechtste was 132%
Vergeleken met alle geteste toestellen
» 12% van alle geteste apparaten waren beter, 3% gelijk, 85% slechter
» De beste had een delta van 4%, het gemiddelde was 24%, de slechtste was 134%
MSI GS73 Stealth 8RF-011 audioanalyse
(+) | luidsprekers kunnen relatief luid spelen (89 dB)
Bas 100 - 315 Hz
(-) | bijna geen lage tonen - gemiddeld 21.6% lager dan de mediaan
(±) | lineariteit van de lage tonen is gemiddeld (9% delta ten opzichte van de vorige frequentie)
Midden 400 - 2000 Hz
(±) | hogere middens - gemiddeld 6.4% hoger dan de mediaan
(+) | de middentonen zijn lineair (6.7% delta ten opzichte van de vorige frequentie)
Hoog 2 - 16 kHz
(±) | lagere maxima - gemiddeld 5% lager dan de mediaan
(±) | lineariteit van de hoogtepunten is gemiddeld (8.1% delta ten opzichte van de vorige frequentie)
Algemeen 100 - 16.000 Hz
(±) | lineariteit van het totale geluid is gemiddeld (19.3% verschil met de mediaan)
Vergeleken met dezelfde klasse
» 65% van alle geteste apparaten in deze klasse waren beter, 8% vergelijkbaar, 27% slechter
» De beste had een delta van 6%, het gemiddelde was 18%, de slechtste was 132%
Vergeleken met alle geteste toestellen
» 47% van alle geteste apparaten waren beter, 8% gelijk, 46% slechter
» De beste had een delta van 4%, het gemiddelde was 24%, de slechtste was 134%
| Uit / Standby | |
| Inactief | |
| Belasting |
|
Key:
min: | |
| MSI GE75 8SG Raider i7-8750H, GeForce RTX 2080 Mobile, Kingston RBUSNS8154P3512GJ, AHVA, 1920x1080, 17.3" | Asus Zephyrus S GX701GX i7-8750H, GeForce RTX 2080 Max-Q, Samsung SSD PM981 MZVLB1T0HALR, IPS, 1920x1080, 17.3" | Lenovo Legion Y740-17ICH i7-8750H, GeForce RTX 2080 Max-Q, Samsung SSD PM981 MZVLB256HAHQ, IPS, 1920x1080, 17.3" | Asus ROG Strix Scar II GL704GW i7-8750H, GeForce RTX 2070 Mobile, Intel SSD 660p SSDPEKNW512G8, AHVA, 1920x1080, 17.3" | MSI GS73 Stealth 8RF-011 i7-8750H, GeForce GTX 1070 Max-Q, Samsung PM961 MZVLW256HEHP, TN, 1920x1080, 17.3" | MSI GE75 8SF i7-8750H, GeForce RTX 2070 Mobile, Kingston RBUSNS8154P3256GJ1, IPS, 1920x1080, 17.3" | Gemiddeld NVIDIA GeForce RTX 2080 Mobile | Gemiddelde van klas Gaming | |
|---|---|---|---|---|---|---|---|---|
| Power Consumption | -38% | -40% | -41% | 6% | -30% | -101% | -28% | |
| Idle Minimum * (Watt) | 7 | 19 -171% | 20.2 -189% | 19 -171% | 8 -14% | 16.4 -134% | 24.6 ? -251% | 13 ? -86% |
| Idle Average * (Watt) | 15 | 22 -47% | 27.2 -81% | 22 -47% | 14 7% | 21.9 -46% | 31.4 ? -109% | 18.7 ? -25% |
| Idle Maximum * (Watt) | 22 | 30 -36% | 28.7 -30% | 29 -32% | 22 -0% | 25.4 -15% | 41.8 ? -90% | 24.3 ? -10% |
| Load Average * (Watt) | 92 | 104 -13% | 90.8 1% | 102 -11% | 92 -0% | 90.7 1% | 112 ? -22% | 108.2 ? -18% |
| Witcher 3 ultra * (Watt) | 207 | 167 19% | 152.1 27% | 190 8% | 154 26% | 203.3 2% | ||
| Load Maximum * (Watt) | 254 | 203 20% | 165.4 35% | 231 9% | 207 19% | 222.9 12% | 344 ? -35% | 254 ? -0% |
* ... kleiner is beter
| MSI GE75 8SG Raider i7-8750H, GeForce RTX 2080 Mobile, 65 Wh | Asus Zephyrus S GX701GX i7-8750H, GeForce RTX 2080 Max-Q, 76 Wh | Lenovo Legion Y740-17ICH i7-8750H, GeForce RTX 2080 Max-Q, 76 Wh | Asus ROG Strix Scar II GL704GW i7-8750H, GeForce RTX 2070 Mobile, 66 Wh | MSI GS73 Stealth 8RF-011 i7-8750H, GeForce GTX 1070 Max-Q, 51 Wh | MSI GE75 8SF i7-8750H, GeForce RTX 2070 Mobile, 65 Wh | Gemiddelde van klas Gaming | |
|---|---|---|---|---|---|---|---|
| Batterijduur | -18% | -32% | -1% | -15% | -26% | 43% | |
| Reader / Idle (h) | 7.8 | 5 -36% | 6.2 -21% | 5.8 -26% | 8.71 ? 12% | ||
| WiFi v1.3 (h) | 4.7 | 3.8 -19% | 3.2 -32% | 3.9 -17% | 3.3 -30% | 3.5 -26% | 7 ? 49% |
| Witcher 3 ultra (h) | 0.8 | 0.9 13% | |||||
| Load (h) | 0.9 | 0.9 0% | 1.1 22% | 1 11% | 1.51 ? 68% |
Pro
Contra
Besluit – De upgrade is een goede investering
Dit is de verkorte versie van het originele artikel. Het volledige, Engelse testrapport vind je hier.
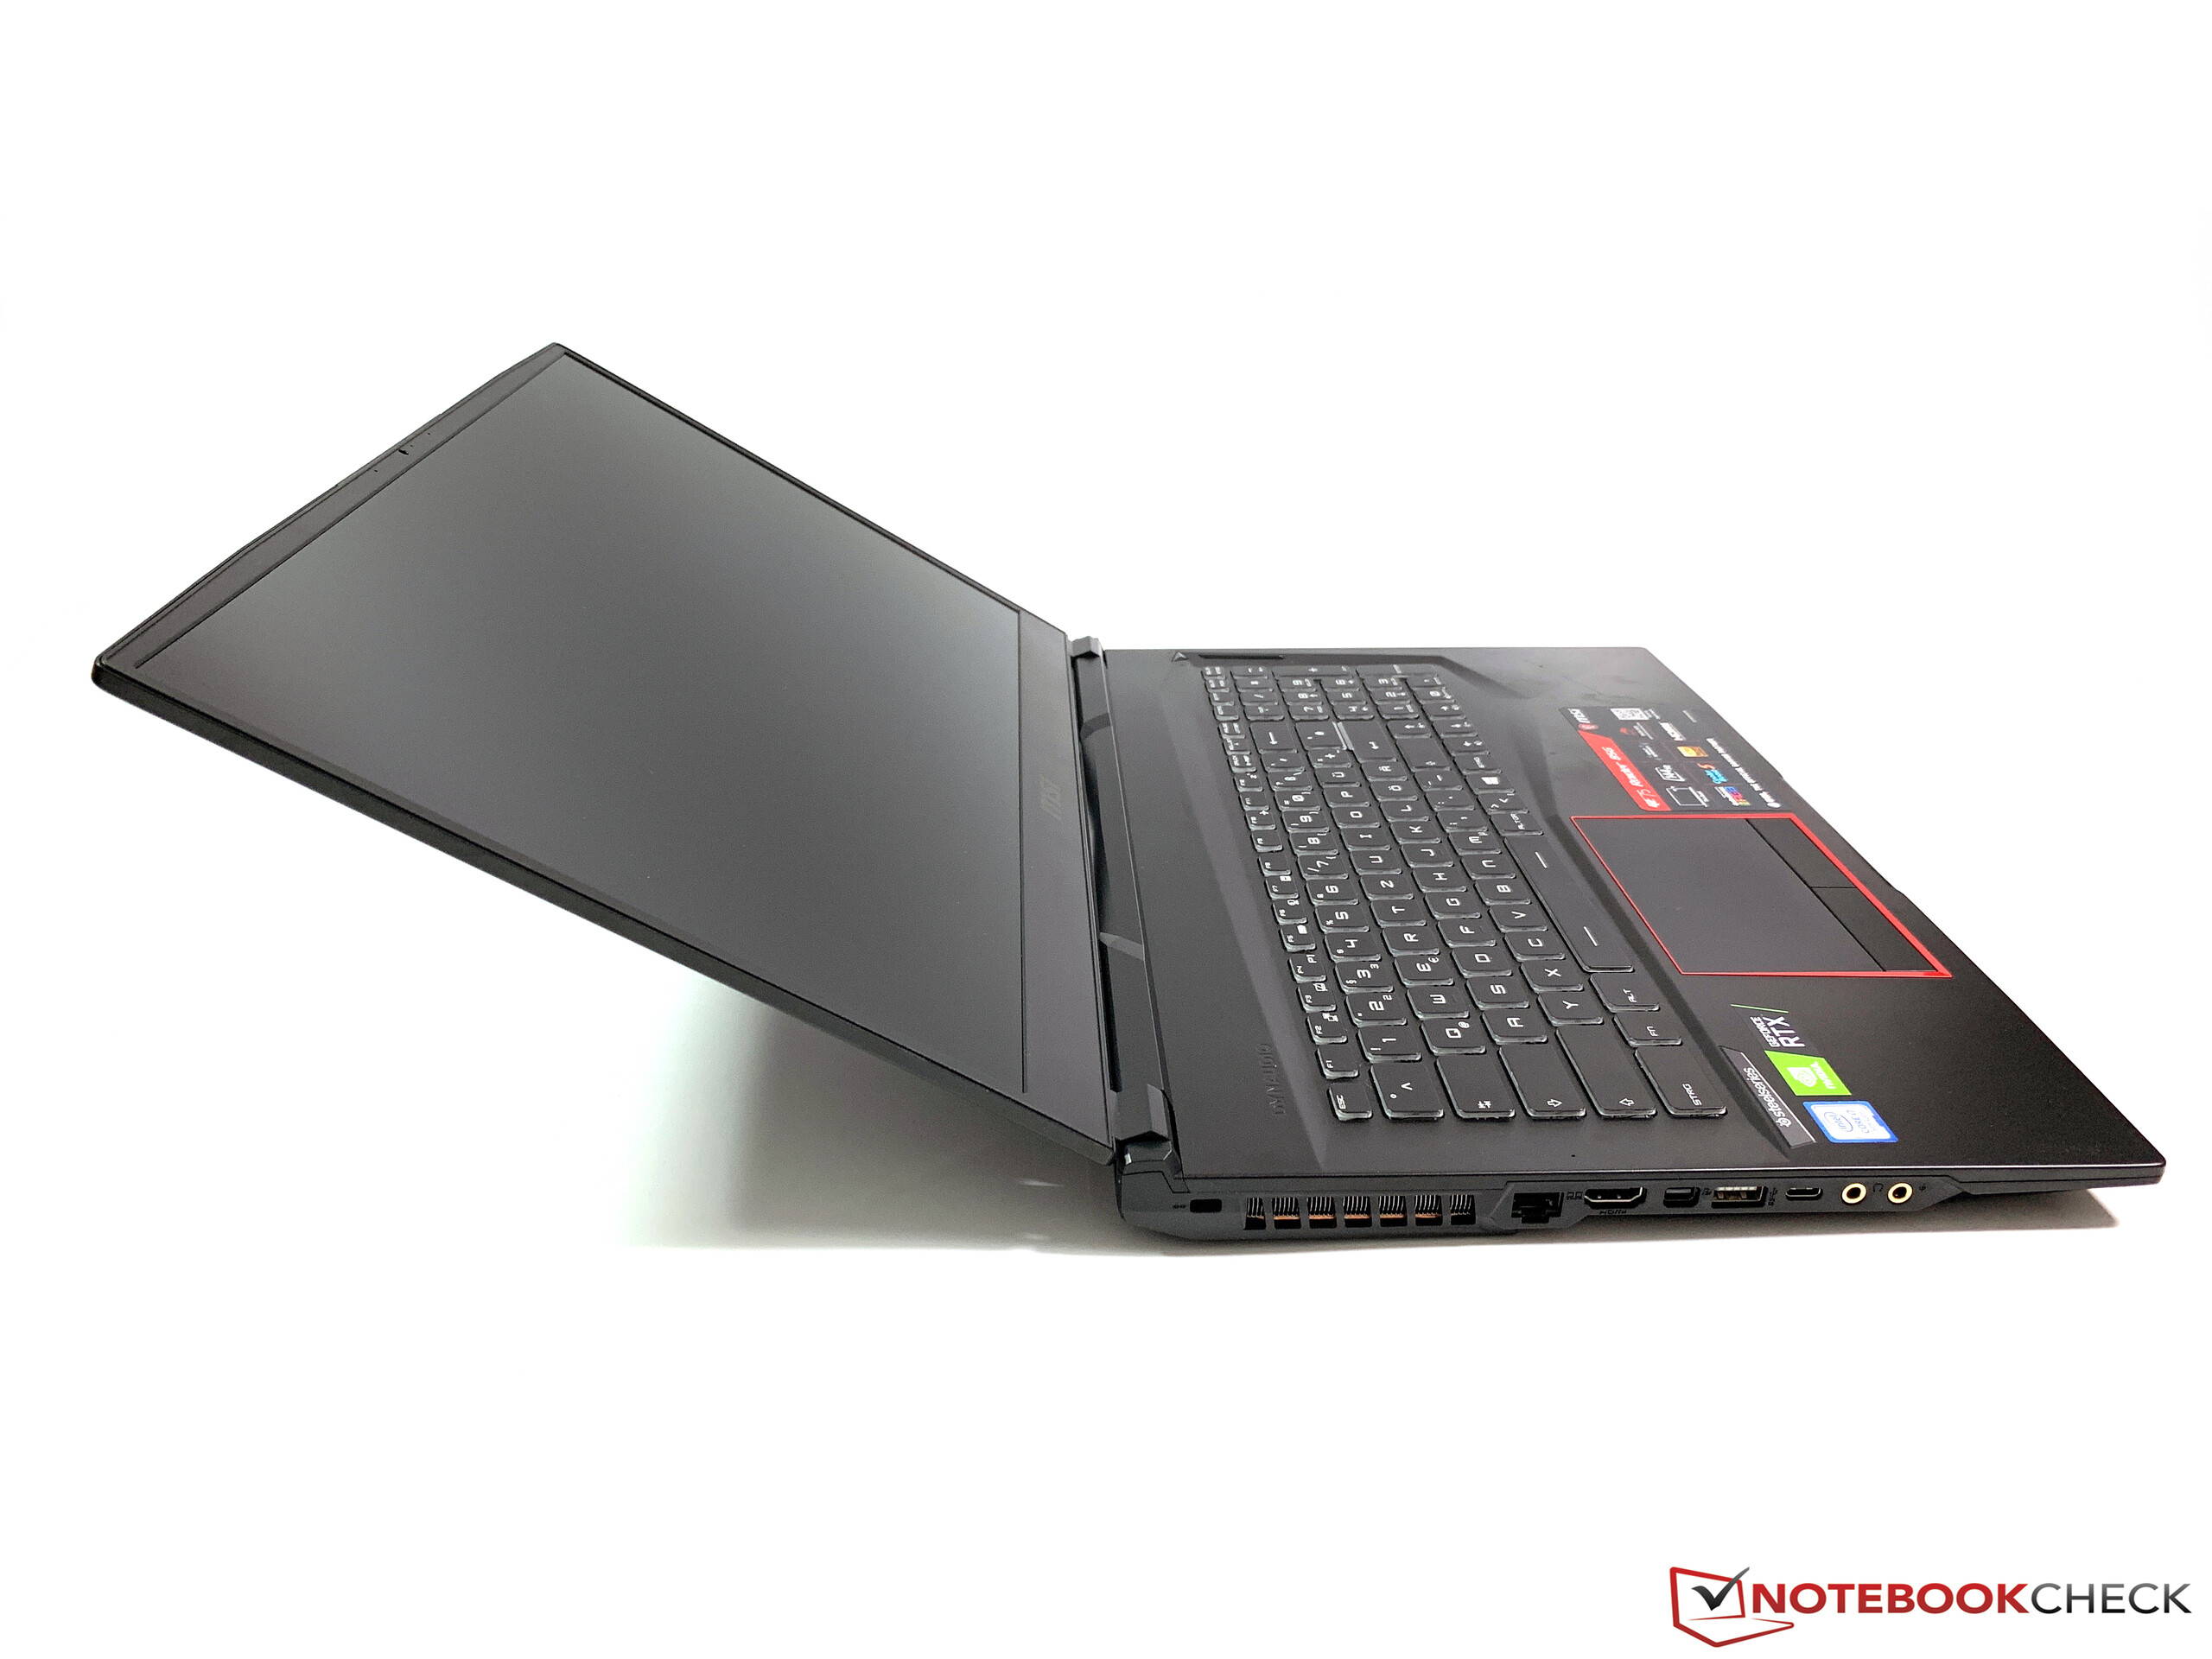
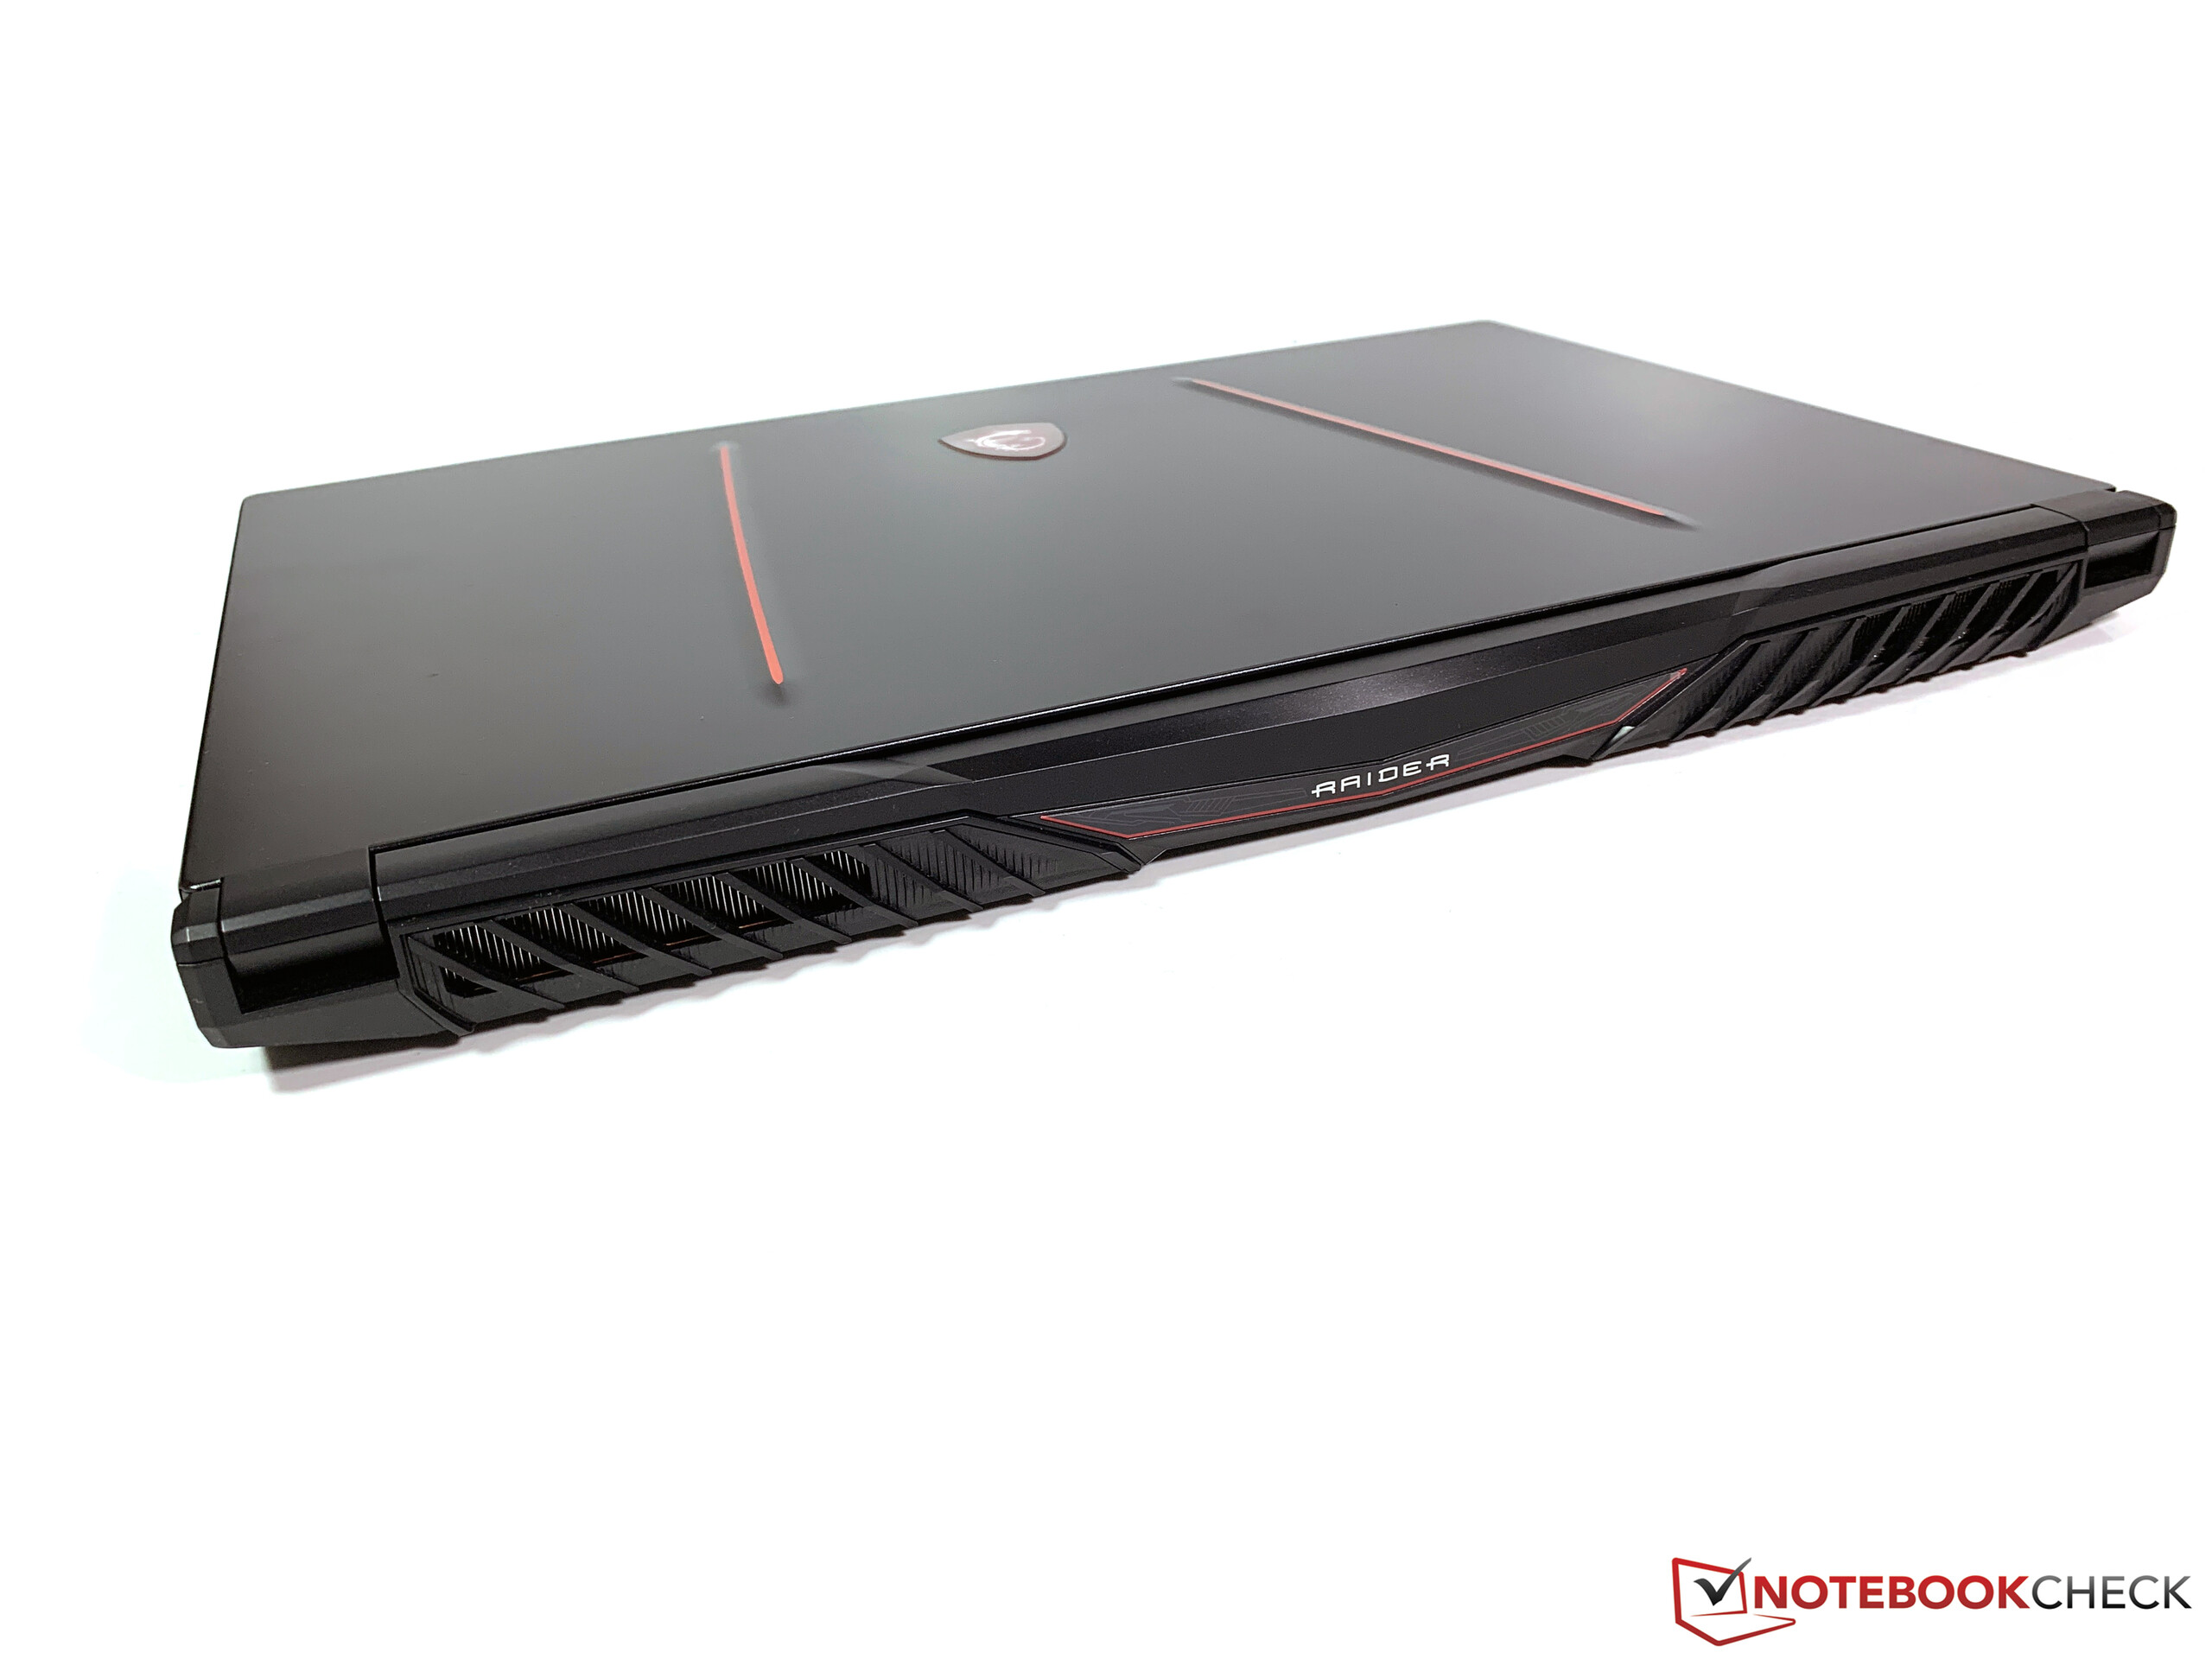
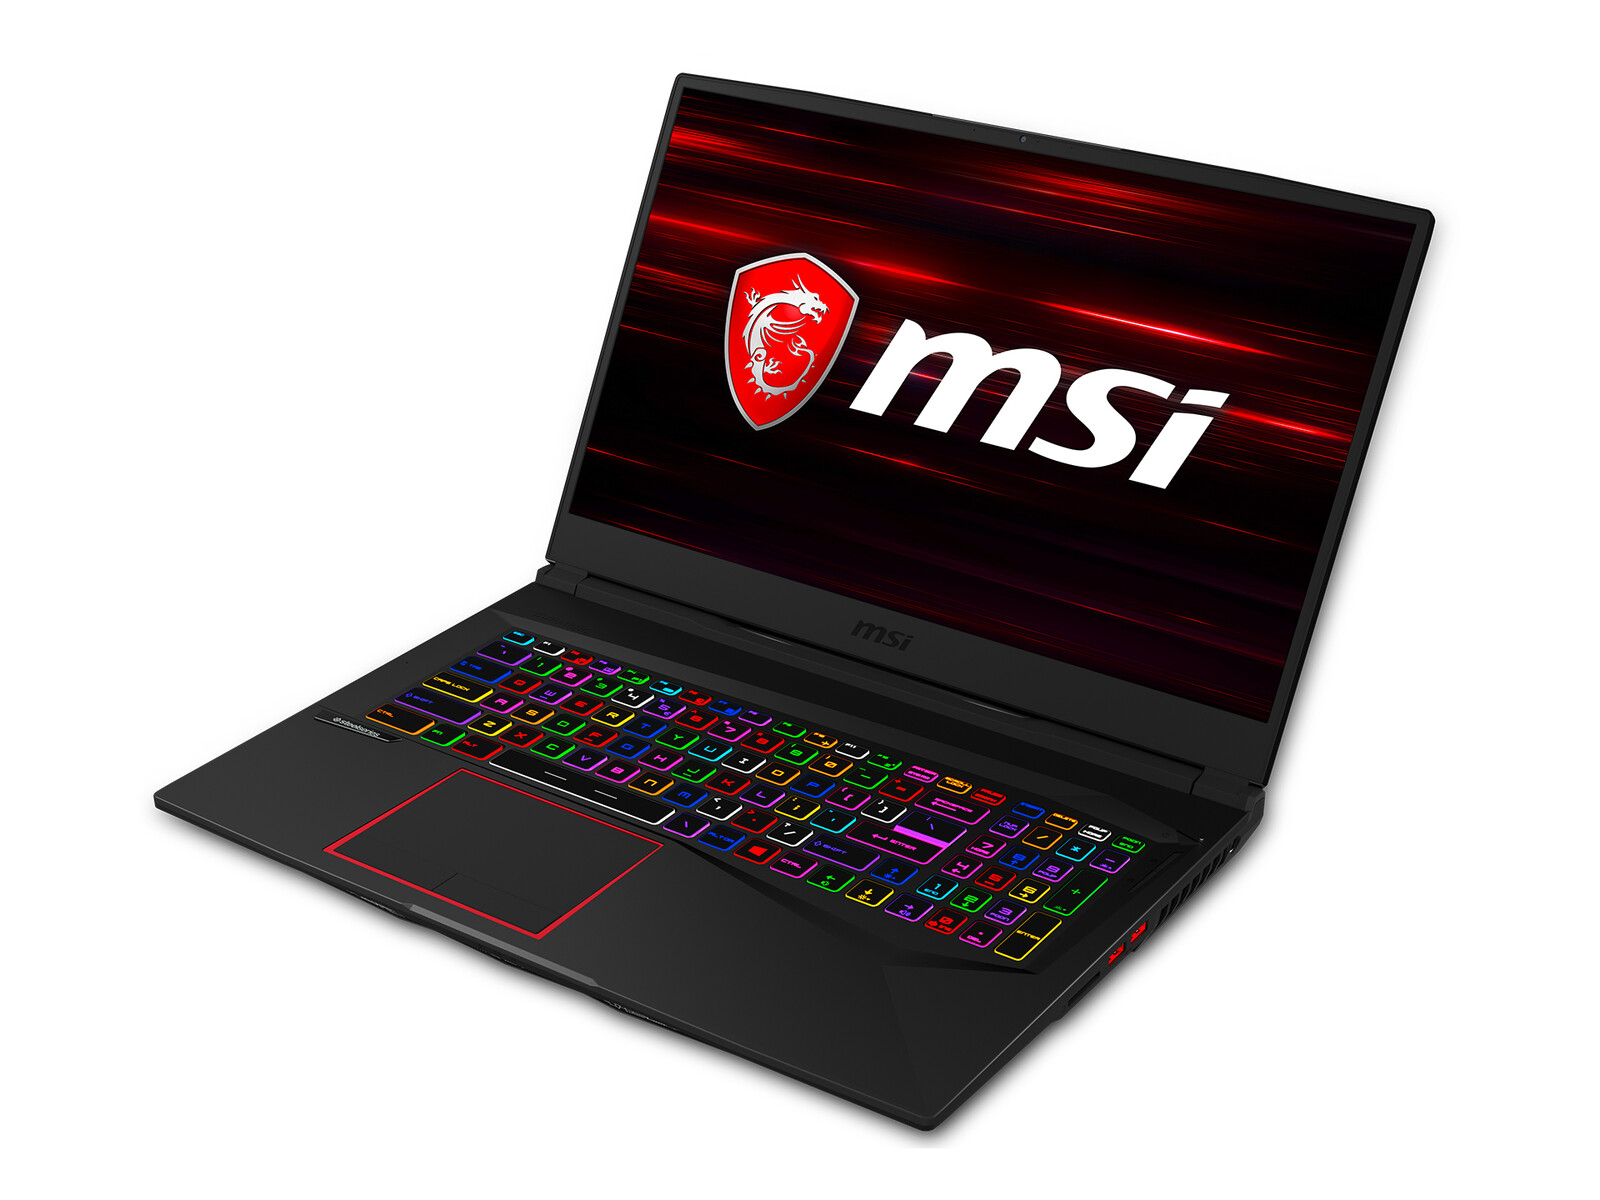
De nieuwe MSI GE75 Raider is merkbaar compacter dan zijn voorganger, maar beschikt over een veel krachtigere GPU. Als je bereid bent om de meerprijs te betalen voor de RTX 2080, zal je zeker niet bedrogen uitkomen, aangezien de prestaties een stuk hoger liggen dan bij de goedkopere versies met de RTX 2070 of RTX 2060. De CPU-prestaties zouden zeker wat beter mogen zijn, maar vormen geen beperking voor het spelen van games.
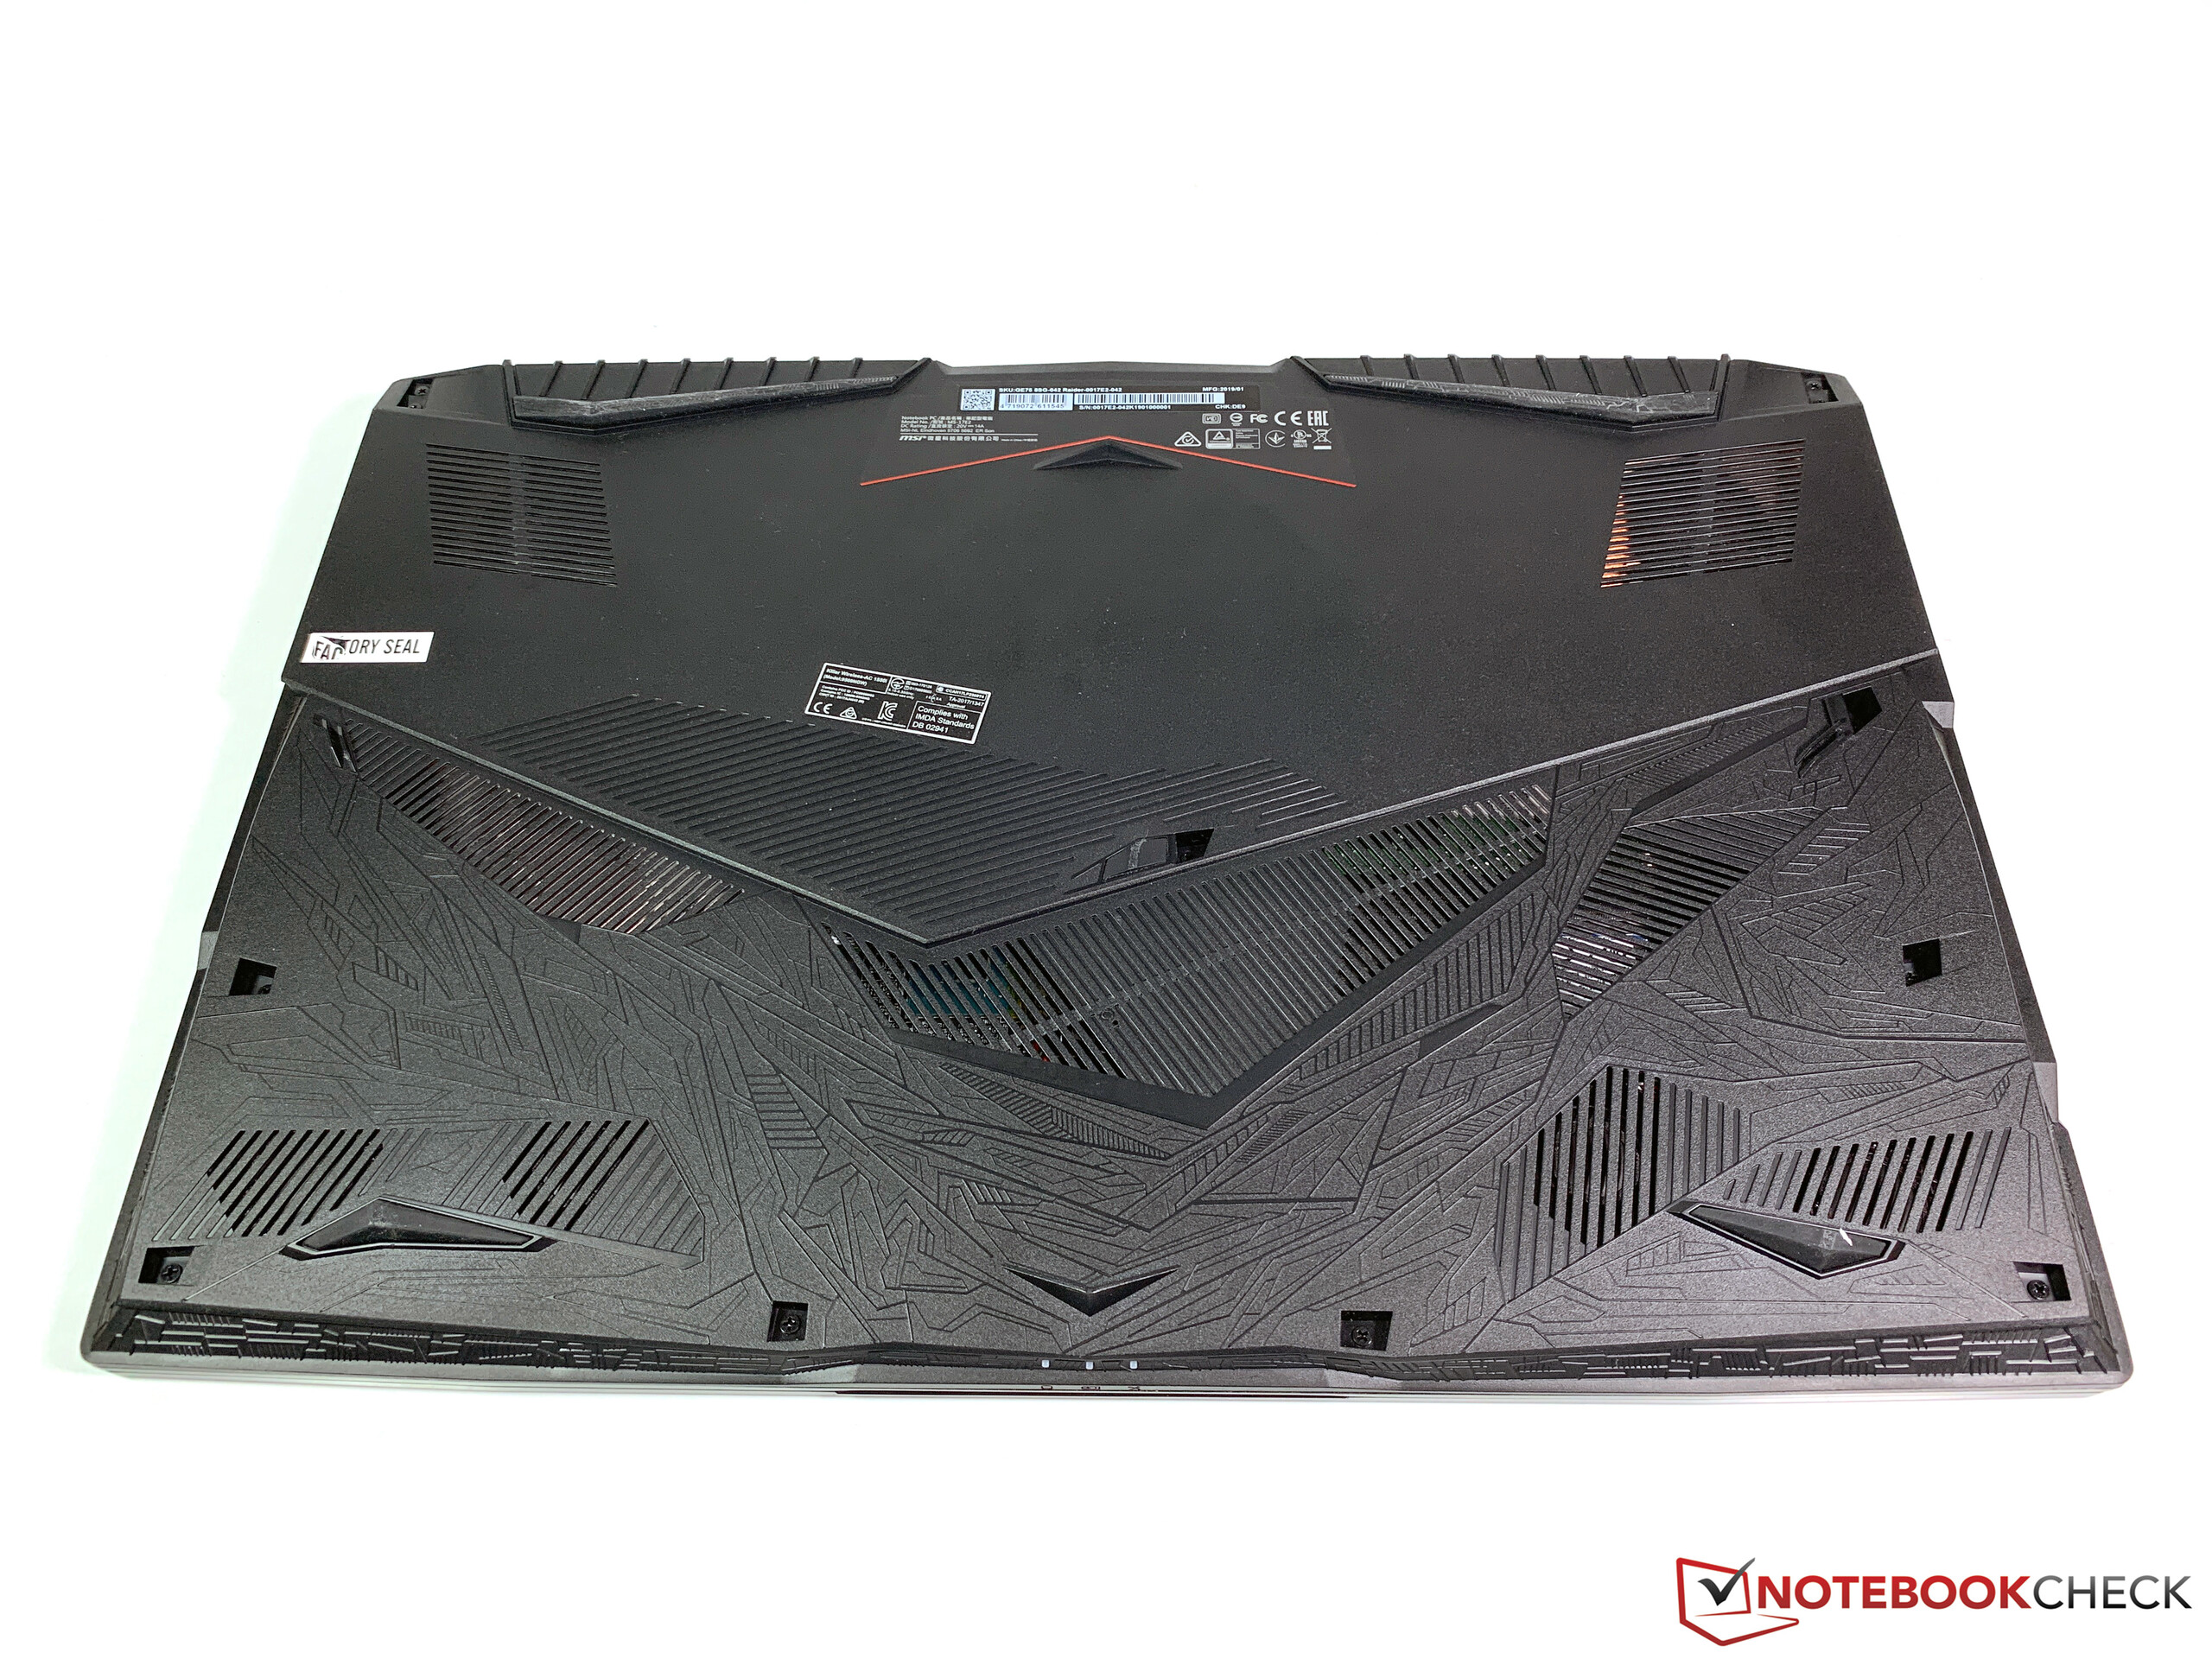
Kleiner, dunner, sneller - dit is een grote uitdaging voor de koeling. MSI slaagt erin om de warmte efficiënt af te voeren zonder grote (negatieve) impact op de prestaties. Het nadeel is het luide geluid van de ventilatoren - en het geruis van de snelle 7200-RPM-HDD is ook hoorbaar in inactieve toestand.
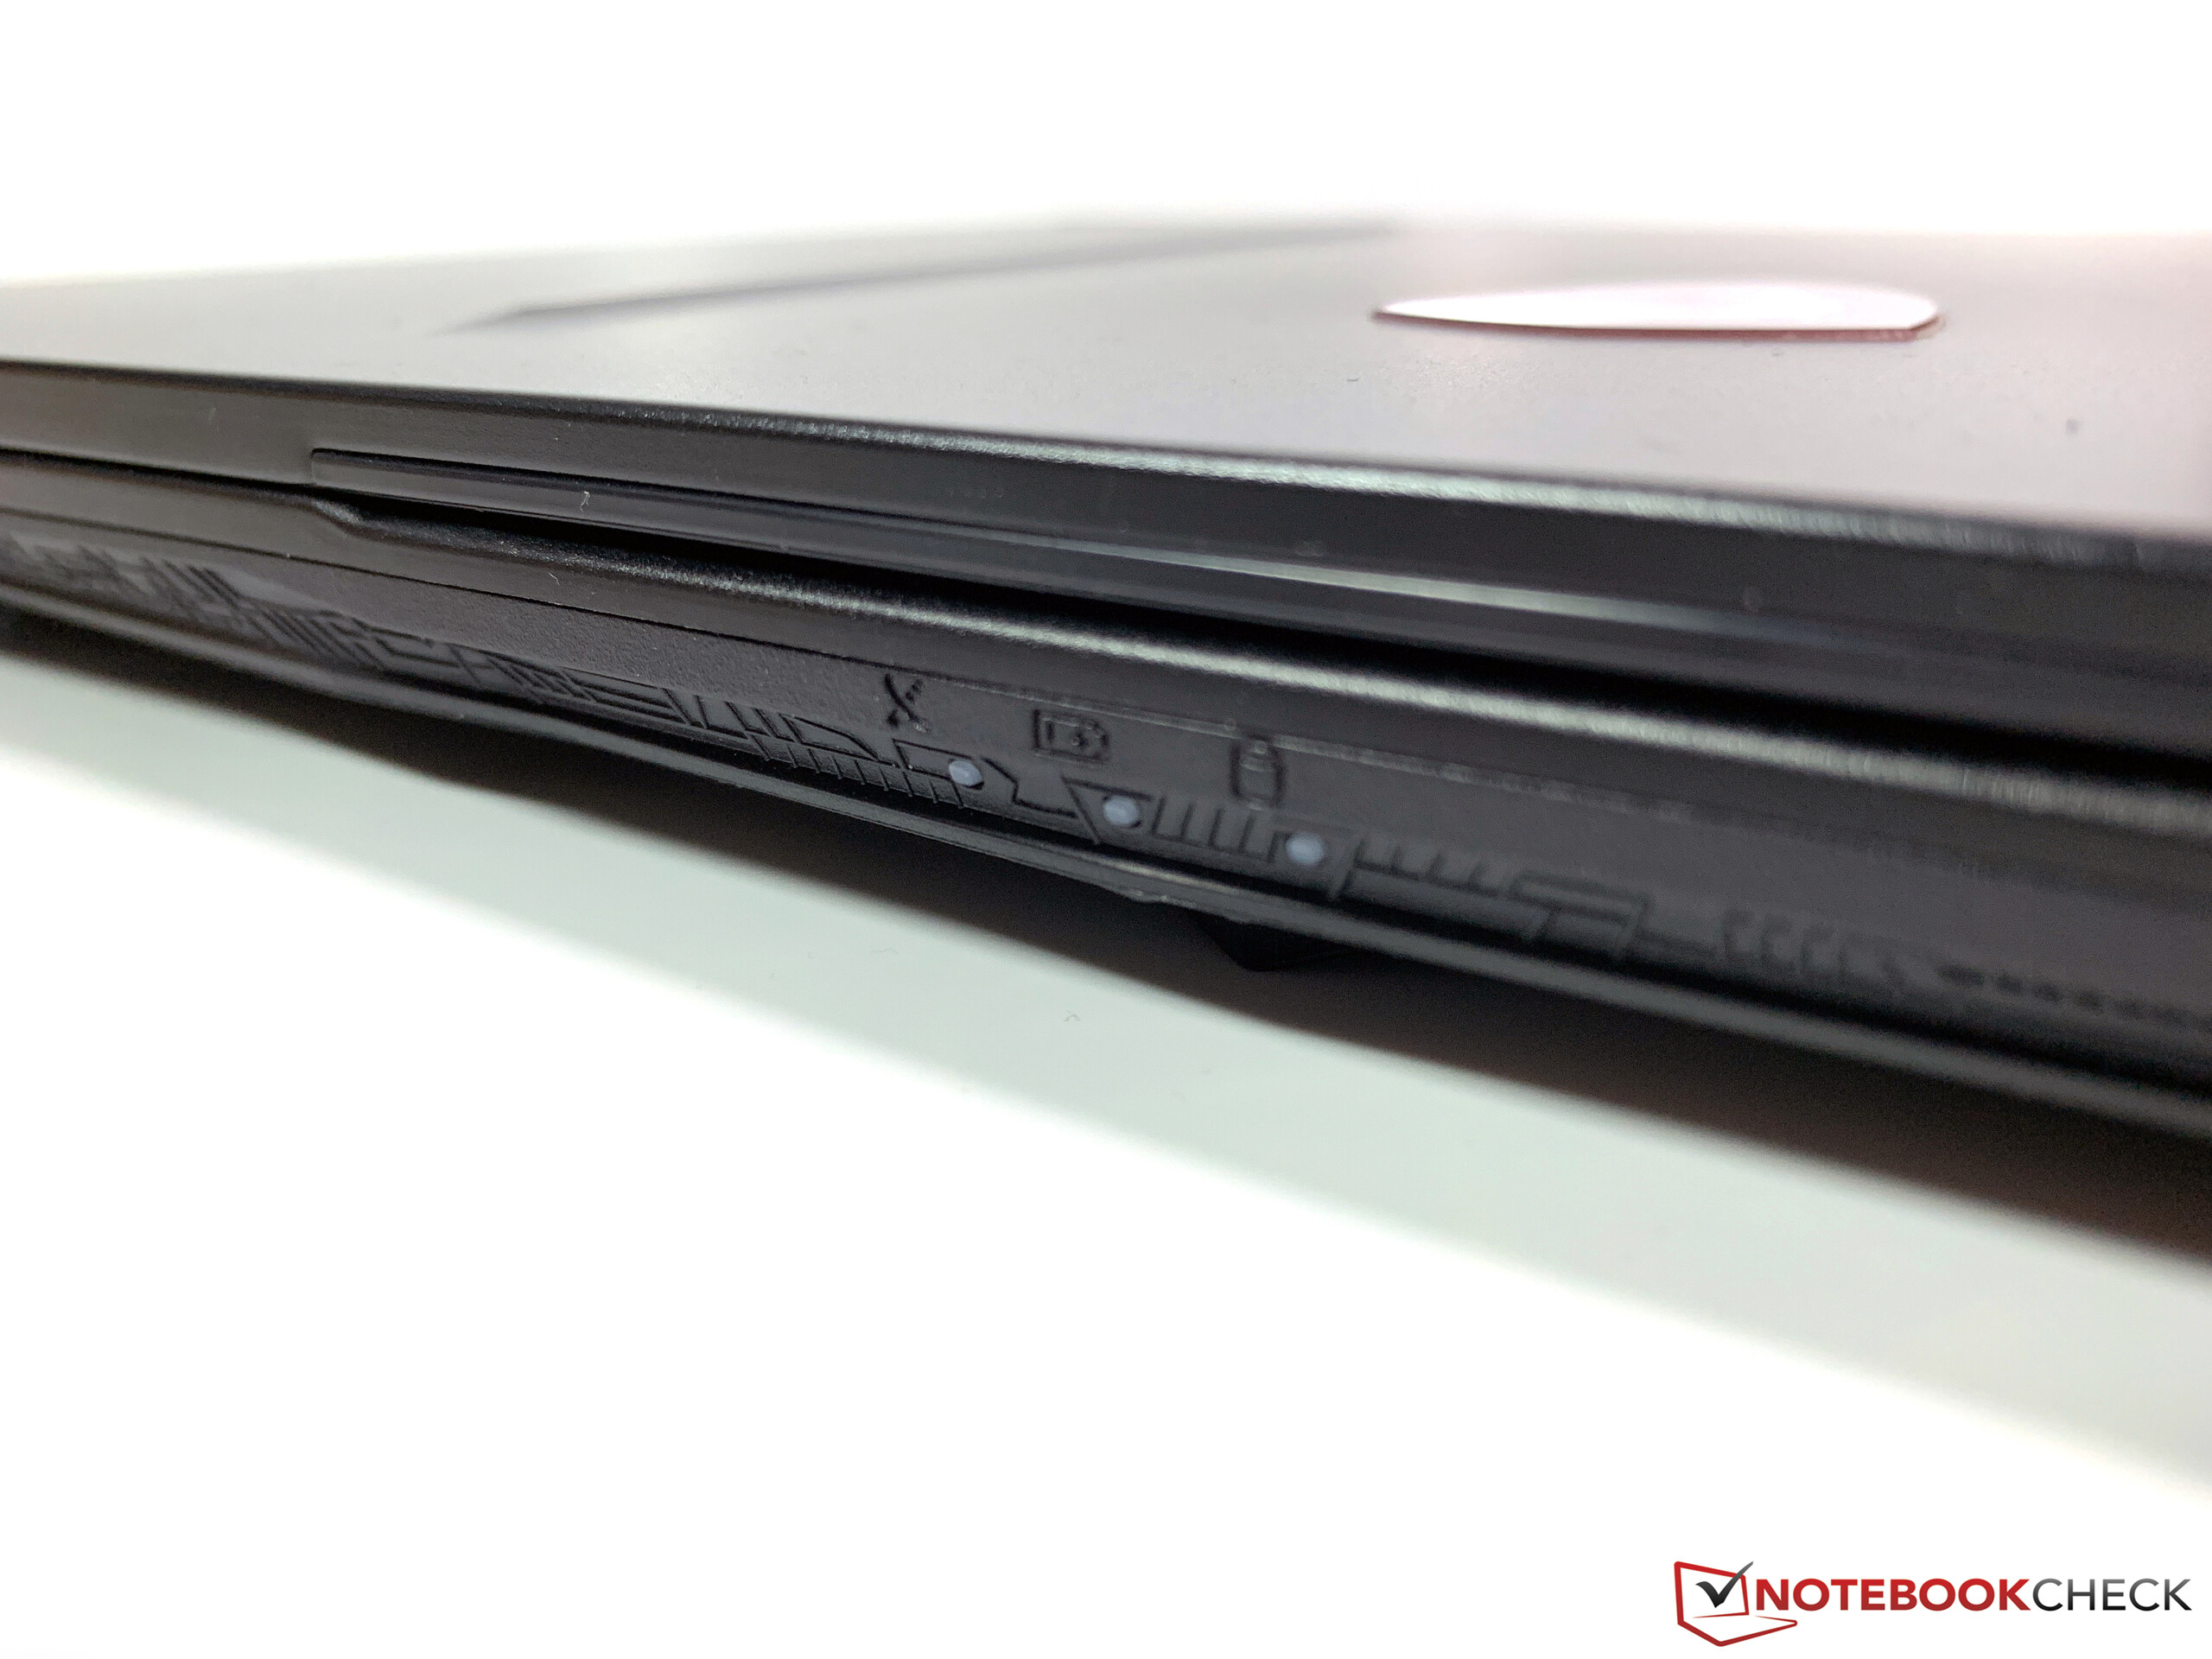
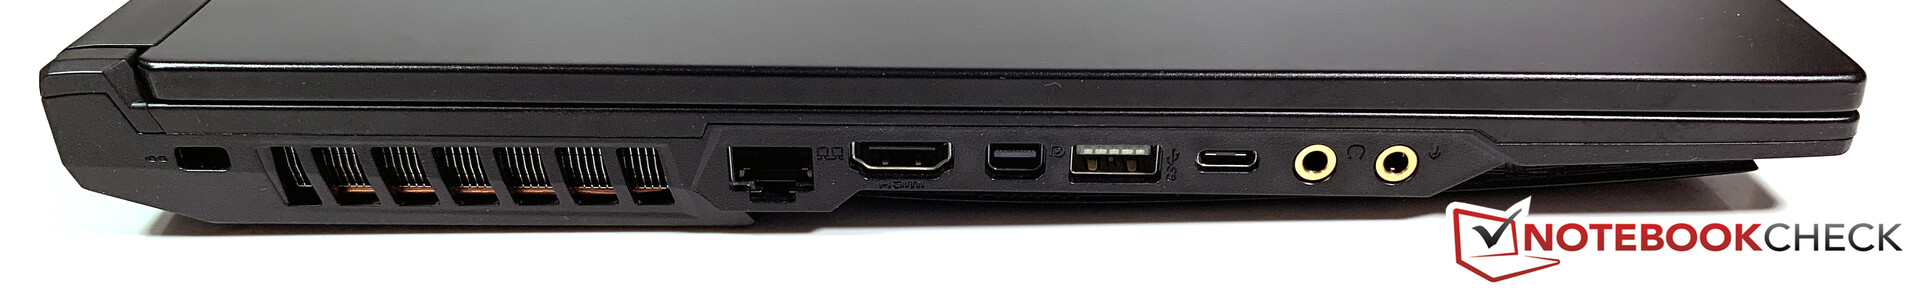
Een ander nadeel is het materiaalgebruik: de laptop trekt snel vuil en vingerafdrukken aan en moet regelmatig schoongemaakt worden. Een laptop voor 3000 euro zou ook over Thunderbolt 3 mogen beschikken. We zijn niet zeker waar het ontbreken van G-Sync aan te wijten is. De notebook is relatief compact voor een 17-inch-toestel, maar mobiliteit mag zeker geen prioriteit zijn voor potentiële kopers.
De GPU-upgrade voor de MSI GE75 Raider is een goede investering, aangezien de extra prestaties ook effectief benut kunnen worden, ondanks de slanke behuizing. Er zijn een aantal tekortkomingen op het vlak van connectiviteit, maar we ondervinden geen grote problemen die de gaming-prestaties zouden kunnen beïnvloeden.
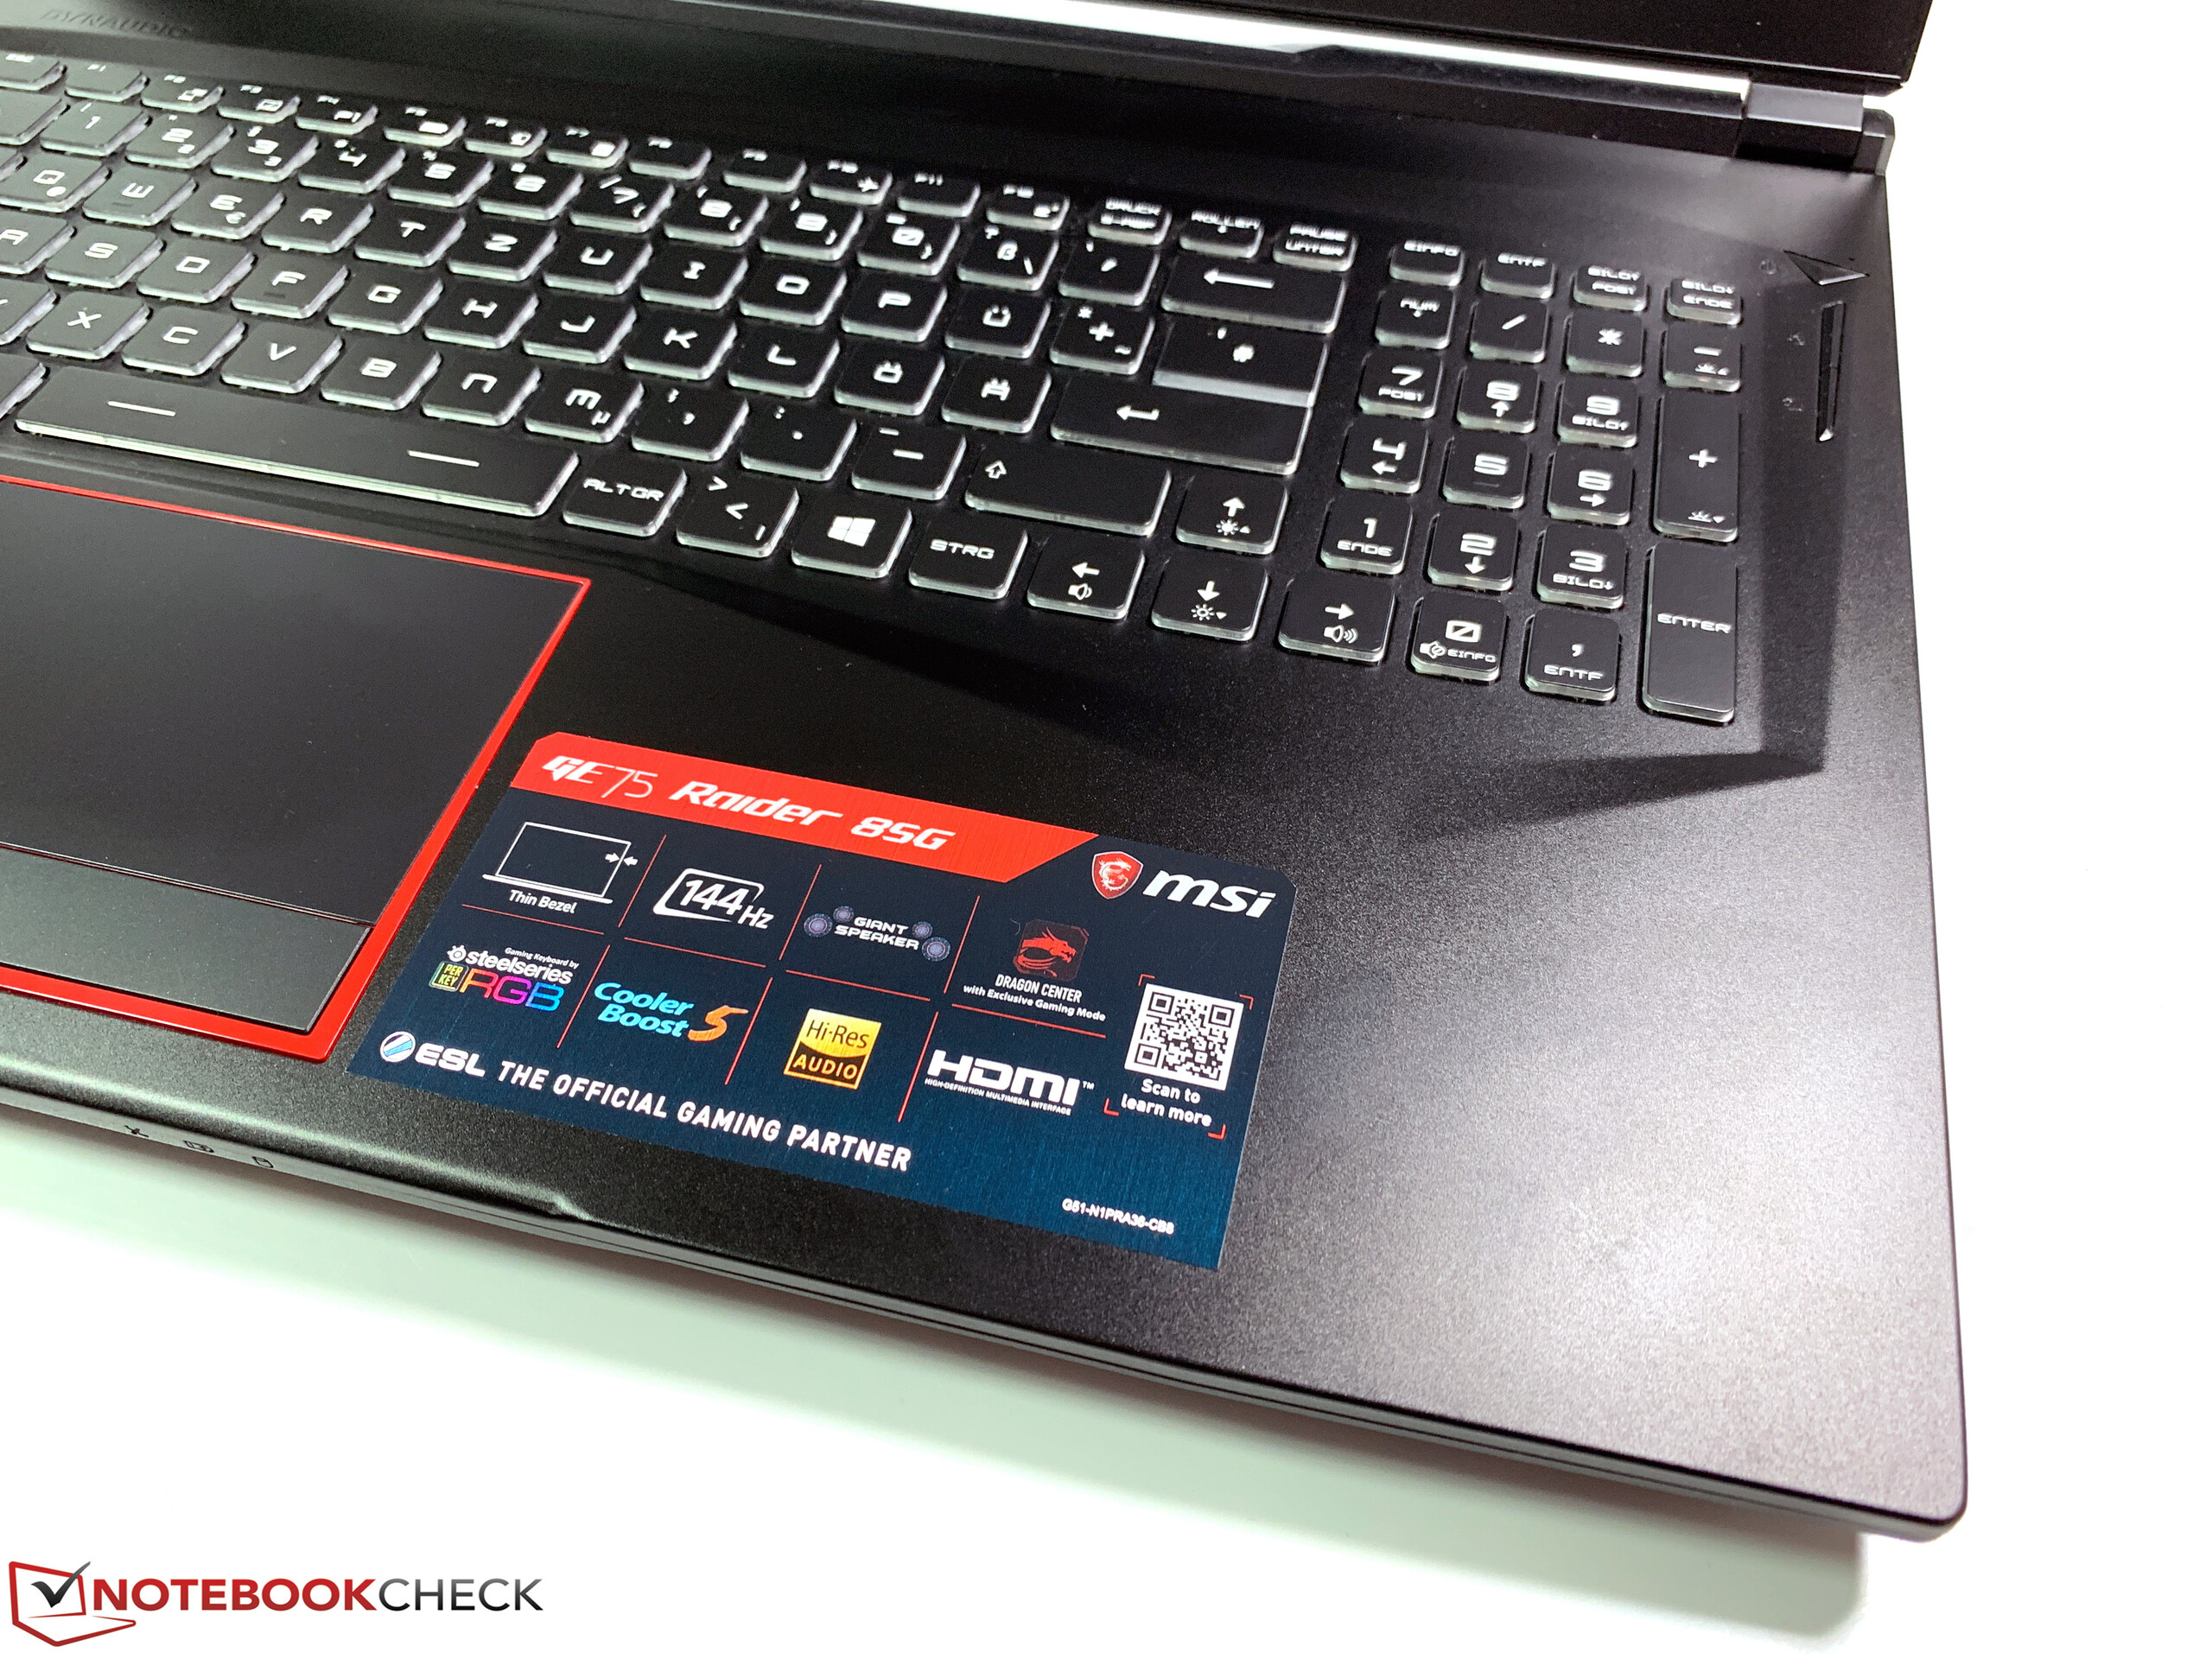
MSI GE75 8SG Raider
- 25-03-2019 v6 (old)
Andreas Osthoff
Price comparison
