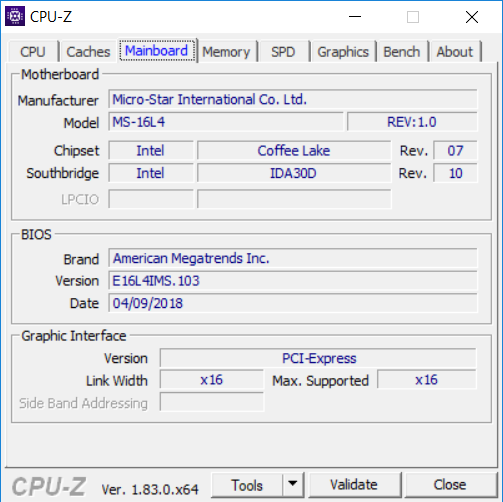
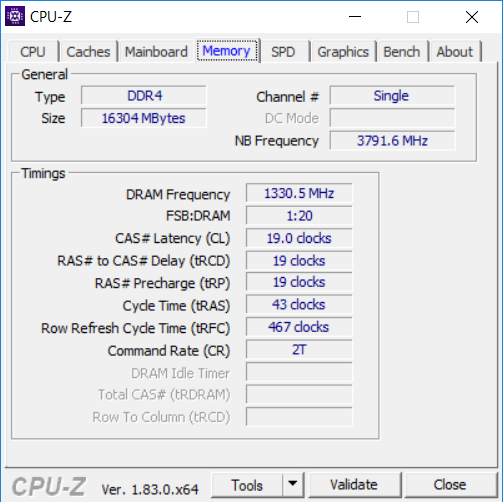
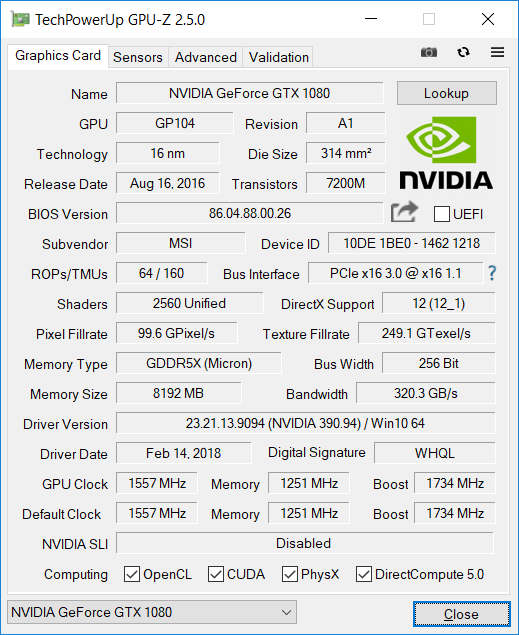
Kort testrapport MSI GT63 Titan 8RG-046 (i7-8750H, GTX 1080, FHD) Laptop


| SD Card Reader | |
| average JPG Copy Test (av. of 3 runs) | |
| Asus Chimera G703GI (Toshiba Exceria Pro SDXC 64 GB UHS-II) | |
| Gemiddelde van klas Gaming (20.9 - 210, n=54, laatste 2 jaar) | |
| Lenovo Legion Y520-15IKBA-80WY001VGE (Toshiba Exceria Pro SDXC 64 GB UHS-II) | |
| Dell G5 15 5587 (Toshiba Exceria Pro SDXC 64 GB UHS-II) | |
| MSI GT63 Titan 8RG-046 (Toshiba Exceria Pro SDXC 64 GB UHS-II) | |
| maximum AS SSD Seq Read Test (1GB) | |
| Asus Chimera G703GI (Toshiba Exceria Pro SDXC 64 GB UHS-II) | |
| Gemiddelde van klas Gaming (25.5 - 261, n=51, laatste 2 jaar) | |
| Lenovo Legion Y520-15IKBA-80WY001VGE (Toshiba Exceria Pro SDXC 64 GB UHS-II) | |
| Dell G5 15 5587 (Toshiba Exceria Pro SDXC 64 GB UHS-II) | |
| MSI GT63 Titan 8RG-046 (Toshiba Exceria Pro SDXC 64 GB UHS-II) | |
| |||||||||||||||||||||||||
Helderheidsverdeling: 80 %
Helderheid in Batterij-modus: 307.1 cd/m²
Contrast: 830:1 (Zwart: 0.37 cd/m²)
ΔE ColorChecker Calman: 2.53 | ∀{0.5-29.43 Ø4.73}
calibrated: 2.82
ΔE Greyscale Calman: 1.7 | ∀{0.09-98 Ø4.97}
100% sRGB (Argyll 1.6.3 3D)
76% AdobeRGB 1998 (Argyll 1.6.3 3D)
85.7% AdobeRGB 1998 (Argyll 3D)
99.9% sRGB (Argyll 3D)
91.3% Display P3 (Argyll 3D)
Gamma: 2.194
CCT: 6893 K
| MSI GT63 Titan 8RG-046 N156HHE-GA1, TN, 15.6", 1920x1080 | Asus ROG GU501GM-BI7N8 AU Optronics AUO45ED, IPS, 15.6", 1920x1080 | Razer Blade 15 2018 LGD05C0, IPS, 15.6", 1920x1080 | Lenovo Legion Y520-15IKBA-80WY001VGE LG Philips LGD0533, IPS, 15.6", 1920x1080 | Alienware 15 R3 Max-Q LG Philips LP156WF6 (LGD049B), IPS, 15.6", 1920x1080 | Dell G5 15 5587 LGD053F, 156WF6, IPS, 15.6", 1920x1080 | Asus Chimera G703GI B173HAN03.2 (AUO329D), IPS, 17.3", 1920x1080 | Acer Predator Helios 500 PH517-51-79BY AUO_B173HAN03, IPS, 17.3", 1920x1080 | |
|---|---|---|---|---|---|---|---|---|
| Display | -22% | -20% | -50% | -25% | -52% | -19% | -20% | |
| Display P3 Coverage (%) | 91.3 | 63.4 -31% | 64.3 -30% | 39.53 -57% | 64.3 -30% | 38.13 -58% | 65.8 -28% | 64.4 -29% |
| sRGB Coverage (%) | 99.9 | 87.7 -12% | 93.7 -6% | 59.2 -41% | 82.9 -17% | 56.8 -43% | 92.6 -7% | 91.3 -9% |
| AdobeRGB 1998 Coverage (%) | 85.7 | 65.5 -24% | 40.86 -52% | 60.6 -29% | 39.47 -54% | 67 -22% | 65.6 -23% | |
| Response Times | -322% | -106% | -383% | -380% | -304% | -31% | -61% | |
| Response Time Grey 50% / Grey 80% * (ms) | 8.4 ? | 30.8 ? -267% | 17.2 ? -105% | 42 ? -400% | 40 ? -376% | 33 ? -293% | 6.4 ? 24% | 14 ? -67% |
| Response Time Black / White * (ms) | 5.8 ? | 27.6 ? -376% | 12 ? -107% | 27 ? -366% | 28 ? -383% | 24 ? -314% | 10.8 ? -86% | 9 ? -55% |
| PWM Frequency (Hz) | 25510 ? | 24900 ? | 21100 ? | |||||
| Screen | -21% | -3% | -68% | -38% | -69% | -2% | -47% | |
| Brightness middle (cd/m²) | 307.1 | 286.7 -7% | 290 -6% | 243 -21% | 306 0% | 229 -25% | 285 -7% | 335 9% |
| Brightness (cd/m²) | 276 | 281 2% | 281 2% | 231 -16% | 297 8% | 224 -19% | 275 0% | 300 9% |
| Brightness Distribution (%) | 80 | 92 15% | 82 2% | 87 9% | 89 11% | 87 9% | 82 2% | 82 2% |
| Black Level * (cd/m²) | 0.37 | 0.39 -5% | 0.3 19% | 0.24 35% | 0.28 24% | 0.28 24% | 0.22 41% | 0.7 -89% |
| Contrast (:1) | 830 | 735 -11% | 967 17% | 1013 22% | 1093 32% | 818 -1% | 1295 56% | 479 -42% |
| Colorchecker dE 2000 * | 2.53 | 4.17 -65% | 2.85 -13% | 6.36 -151% | 5.45 -115% | 6.1 -141% | 3.18 -26% | 4.99 -97% |
| Colorchecker dE 2000 max. * | 4.66 | 7.22 -55% | 6.27 -35% | 12.76 -174% | 9.45 -103% | 12.2 -162% | 5.99 -29% | 9.32 -100% |
| Colorchecker dE 2000 calibrated * | 2.82 | 1.39 51% | 6.51 -131% | 6.12 -117% | 1.73 39% | 1.93 32% | ||
| Greyscale dE 2000 * | 1.7 | 2.5 -47% | 2.4 -41% | 5.63 -231% | 4.9 -188% | 5.68 -234% | 2.93 -72% | 5.2 -206% |
| Gamma | 2.194 100% | 2.274 97% | 2.34 94% | 2.47 89% | 2.49 88% | 2.4 92% | 2.45 90% | 2.49 88% |
| CCT | 6893 94% | 6885 94% | 6718 97% | 7411 88% | 7062 92% | 6989 93% | 7165 91% | 7719 84% |
| Color Space (Percent of AdobeRGB 1998) (%) | 76 | 57 -25% | 60 -21% | 38 -50% | 54 -29% | 36 -53% | 60 -21% | 59 -22% |
| Color Space (Percent of sRGB) (%) | 100 | 87 -13% | 94 -6% | 59 -41% | 83 -17% | 57 -43% | 93 -7% | 91 -9% |
| Totaal Gemiddelde (Programma / Instellingen) | -122% /
-64% | -43% /
-19% | -167% /
-104% | -148% /
-81% | -142% /
-95% | -17% /
-9% | -43% /
-44% |
* ... kleiner is beter
Responstijd Scherm
| ↔ Responstijd Zwart naar Wit | ||
|---|---|---|
| 5.8 ms ... stijging ↗ en daling ↘ gecombineerd | ↗ 4.4 ms stijging | 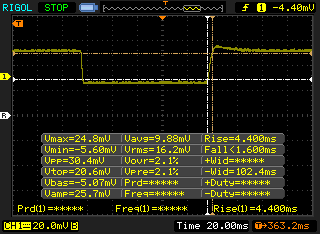 |
| ↘ 1.4 ms daling | ||
| Het scherm vertoonde erg snelle responstijden in onze tests en zou zeer geschikt moeten zijn voor snelle games. Ter vergelijking: alle testtoestellen variëren van 0.1 (minimum) tot 240 (maximum) ms. » 18 % van alle toestellen zijn beter. Dit betekent dat de gemeten responstijd beter is dan het gemiddelde (19.9 ms) van alle geteste toestellen. | ||
| ↔ Responstijd 50% Grijs naar 80% Grijs | ||
| 8.4 ms ... stijging ↗ en daling ↘ gecombineerd | ↗ 4.4 ms stijging | 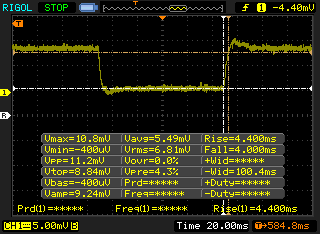 |
| ↘ 4 ms daling | ||
| Het scherm vertoonde snelle responstijden in onze tests en zou geschikt moeten zijn voor games. Ter vergelijking: alle testtoestellen variëren van 0.165 (minimum) tot 636 (maximum) ms. » 22 % van alle toestellen zijn beter. Dit betekent dat de gemeten responstijd beter is dan het gemiddelde (31.1 ms) van alle geteste toestellen. | ||
Screen Flickering / PWM (Pulse-Width Modulation)
| Screen flickering / PWM waargenomen | 25510 Hz | ≤ 34 % helderheid instelling | 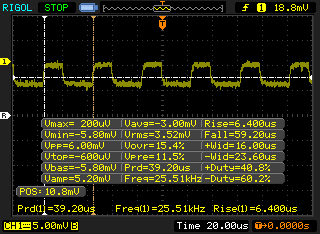 |
De achtergrondverlichting van het scherm flikkert op 25510 Hz (in het slechtste geval, bijvoorbeeld bij gebruik van PWM) aan een helderheid van 34 % en lager. Boven deze helderheid zou er geen flickering / PWM mogen optreden. De frequentie van 25510 Hz is redelijk hoog en de meeste mensen die gevoelig zijn aan flickering zouden dit dus niet mogen waarnemen of geïrriteerde ogen krijgen. Ter vergelijking: 52 % van alle geteste toestellen maakten geen gebruik van PWM om de schermhelderheid te verlagen. Als het wel werd gebruikt, werd een gemiddelde van 7791 (minimum: 5 - maximum: 343500) Hz waargenomen. | |||
| PCMark 8 Home Score Accelerated v2 | 5445 punten | |
| PCMark 8 Work Score Accelerated v2 | 5574 punten | |
| PCMark 10 Score | 5961 punten | |
Help | ||
| MSI GT63 Titan 8RG-046 CUK Cyclone 500GB M.2 NVMe | Asus ROG GU501GM-BI7N8 Kingston RBUSNS8154P3128GJ | Razer Blade 15 2018 Samsung PM961 NVMe MZVLW512HMJP | Alienware 15 R3 Max-Q LiteOn CX2-8B256 | Asus Chimera G703GI 2x Intel 760p 512 GB + 1x Samsung SM961 512 GB (RAID) | Acer Predator Helios 500 PH517-51-79BY SK hynix SSD Canvas SC300 HFS256GD9MNE-6200A | |
|---|---|---|---|---|---|---|
| AS SSD | -96% | 18% | -12% | 67% | -28% | |
| Copy Game MB/s (MB/s) | 419.3 | 572 | 590 | |||
| Copy Program MB/s (MB/s) | 269.2 | 332 | 337 | |||
| Copy ISO MB/s (MB/s) | 773 | 1266 | 868 | |||
| Score Total (Points) | 3040 | 900 -70% | 3806 25% | 2328 -23% | 4843 59% | |
| Score Write (Points) | 902 | 345 -62% | 1450 61% | 894 -1% | 1855 106% | 812 -10% |
| Score Read (Points) | 1433 | 377 -74% | 1584 11% | 989 -31% | 1999 39% | 859 -40% |
| Access Time Write * (ms) | 0.042 | 0.058 -38% | 0.038 10% | 0.032 24% | 0.026 38% | 0.054 -29% |
| Access Time Read * (ms) | 0.05 | 0.278 -456% | 0.051 -2% | 0.063 -26% | 0.03 40% | |
| 4K-64 Write (MB/s) | 648 | 237 -63% | 1204 86% | 710 10% | 1303 101% | 647 0% |
| 4K-64 Read (MB/s) | 1144 | 270.3 -76% | 1300 14% | 741 -35% | 1453 27% | 723 -37% |
| 4K Write (MB/s) | 87.7 | 67.1 -23% | 93.6 7% | 119.3 36% | 141.3 61% | 80.7 -8% |
| 4K Read (MB/s) | 49.17 | 22.62 -54% | 46.45 -6% | 42.73 -13% | 57.4 17% | 38.57 -22% |
| Seq Write (MB/s) | 1665 | 404.7 -76% | 1521 -9% | 645 -61% | 4110 147% | 838 -50% |
| Seq Read (MB/s) | 2399 | 841 -65% | 2376 -1% | 2058 -14% | 4886 104% | 972 -59% |
* ... kleiner is beter

| 3DMark 11 Performance | 19463 punten | |
| 3DMark Cloud Gate Standard Score | 35776 punten | |
| 3DMark Fire Strike Score | 17582 punten | |
Help | ||
| Metro: Last Light | |
| 1024x768 Low (DX10) AF:4x (sorteer op waarde) | |
| MSI GT63 Titan 8RG-046 | |
| Gemiddeld NVIDIA GeForce GTX 1080 Mobile (n=1) | |
| 1366x768 Medium (DX10) AF:4x (sorteer op waarde) | |
| MSI GT63 Titan 8RG-046 | |
| Gemiddeld NVIDIA GeForce GTX 1080 Mobile (n=1) | |
| 1366x768 High (DX11) AF:16x (sorteer op waarde) | |
| MSI GT63 Titan 8RG-046 | |
| Gemiddeld NVIDIA GeForce GTX 1080 Mobile (n=1) | |
| 1920x1080 Very High (DX11) AF:16x (sorteer op waarde) | |
| MSI GT63 Titan 8RG-046 | |
| Dell Inspiron 15 7000 7577 4K | |
| Gemiddeld NVIDIA GeForce GTX 1080 Mobile (110.2 - 141.1, n=7) | |
| lage | gem. | hoge | ultra | |
|---|---|---|---|---|
| BioShock Infinite (2013) | 309 | 270 | 259 | 169 |
| Metro: Last Light (2013) | 128 | 131 | 129 | 117 |
| The Witcher 3 (2015) | 72 | |||
| Rise of the Tomb Raider (2016) | 210 | 166 | 131 | 120 |
Geluidsniveau
| Onbelast |
| 31.4 / 31.4 / 32.2 dB (A) |
| Belasting |
| 35.5 / 50.8 dB (A) |
 | ||
30 dB stil 40 dB(A) hoorbaar 50 dB(A) luid |
||
min: | ||
| MSI GT63 Titan 8RG-046 GeForce GTX 1080 Mobile, i7-8750H, CUK Cyclone 500GB M.2 NVMe | Asus ROG GU501GM-BI7N8 GeForce GTX 1060 Mobile, i7-8750H, Kingston RBUSNS8154P3128GJ | Razer Blade 15 2018 GeForce GTX 1070 Max-Q, i7-8750H, Samsung PM961 NVMe MZVLW512HMJP | Alienware 15 R3 Max-Q GeForce GTX 1080 Max-Q, i7-7820HK, LiteOn CX2-8B256 | Dell G5 15 5587 GeForce GTX 1060 Max-Q, i5-8300H, SK hynix SC311 M.2 | Asus Chimera G703GI GeForce GTX 1080 Mobile, i9-8950HK, 2x Intel 760p 512 GB + 1x Samsung SM961 512 GB (RAID) | Acer Predator Helios 500 PH517-51-79BY GeForce GTX 1070 Mobile, i7-8750H, SK hynix SSD Canvas SC300 HFS256GD9MNE-6200A | |
|---|---|---|---|---|---|---|---|
| Noise | -5% | -5% | -7% | 2% | -14% | -4% | |
| uit / omgeving * (dB) | 28 | 28.6 -2% | 29 -4% | 29 -4% | 30.3 -8% | 29 -4% | 30.4 -9% |
| Idle Minimum * (dB) | 31.4 | 31.4 -0% | 29 8% | 32 -2% | 31.1 1% | 30 4% | 31.2 1% |
| Idle Average * (dB) | 31.4 | 31.4 -0% | 30 4% | 33 -5% | 31.1 1% | 34 -8% | 35.3 -12% |
| Idle Maximum * (dB) | 32.2 | 34.2 -6% | 38 -18% | 35 -9% | 34.2 -6% | 42 -30% | 35.3 -10% |
| Load Average * (dB) | 35.5 | 42.8 -21% | 46 -30% | 46 -30% | 34.9 2% | 53 -49% | 44.4 -25% |
| Witcher 3 ultra * (dB) | 47.6 | 50.9 -7% | 49 -3% | 48 -1% | 42.7 10% | 51 -7% | 41 14% |
| Load Maximum * (dB) | 50.8 | 50.9 -0% | 46 9% | 50 2% | 44 13% | 53 -4% | 45.2 11% |
* ... kleiner is beter
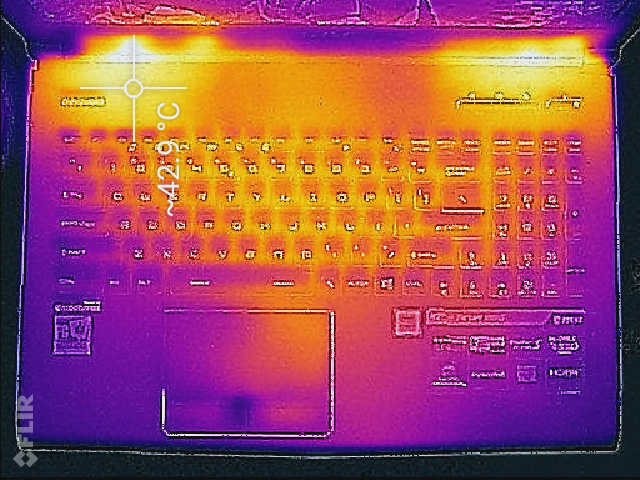
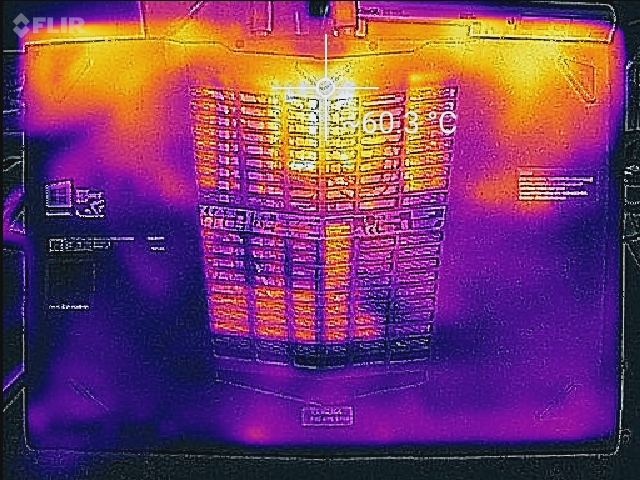
(±) De maximumtemperatuur aan de bovenzijde bedraagt 41.6 °C / 107 F, vergeleken met het gemiddelde van 40.4 °C / 105 F, variërend van 21.2 tot 68.8 °C voor de klasse Gaming.
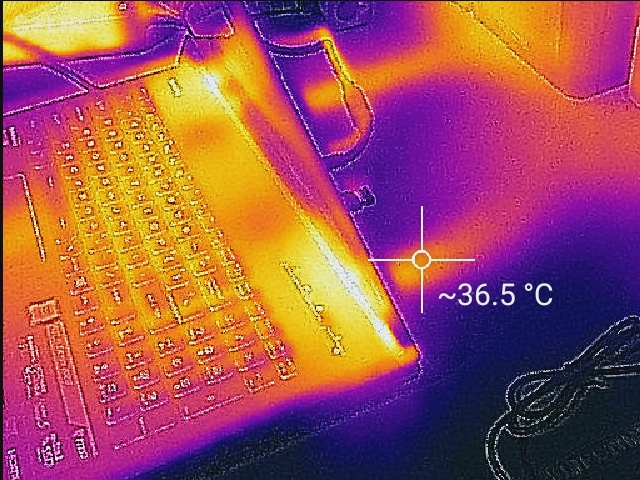
(-) De bodem warmt op tot een maximum van 54.8 °C / 131 F, vergeleken met een gemiddelde van 43.2 °C / 110 F
(±) De palmsteunen en het touchpad kunnen zeer heet aanvoelen met een maximum van ###max## °C / 98.6 F.
(-) De gemiddelde temperatuur van de handpalmsteun van soortgelijke toestellen bedroeg 28.8 °C / 83.8 F (-8.2 °C / -14.8 F).
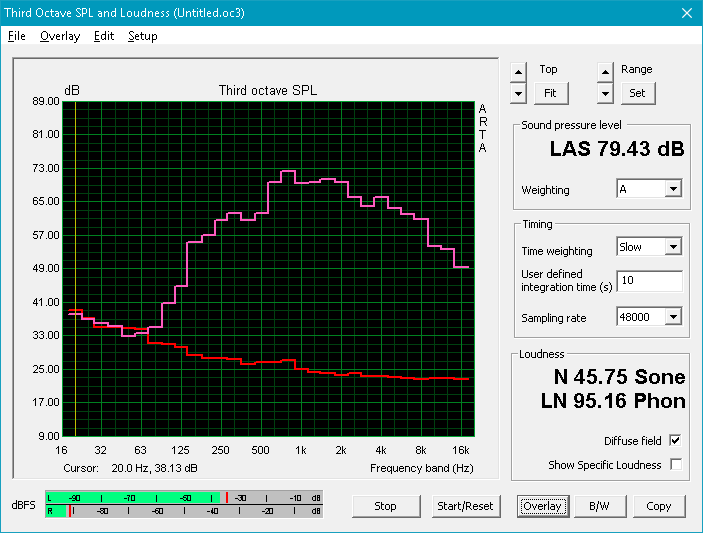
MSI GT63 Titan 8RG-046 audioanalyse
(±) | luidspreker luidheid is gemiddeld maar goed (79.4 dB)
Bas 100 - 315 Hz
(±) | verminderde zeebaars - gemiddeld 8.7% lager dan de mediaan
(±) | lineariteit van de lage tonen is gemiddeld (12.1% delta ten opzichte van de vorige frequentie)
Midden 400 - 2000 Hz
(±) | hogere middens - gemiddeld 6.2% hoger dan de mediaan
(+) | de middentonen zijn lineair (6% delta ten opzichte van de vorige frequentie)
Hoog 2 - 16 kHz
(+) | evenwichtige hoogtepunten - slechts 2.9% verwijderd van de mediaan
(±) | lineariteit van de hoogtepunten is gemiddeld (7.3% delta ten opzichte van de vorige frequentie)
Algemeen 100 - 16.000 Hz
(±) | lineariteit van het totale geluid is gemiddeld (18.7% verschil met de mediaan)
Vergeleken met dezelfde klasse
» 61% van alle geteste apparaten in deze klasse waren beter, 8% vergelijkbaar, 31% slechter
» De beste had een delta van 6%, het gemiddelde was 18%, de slechtste was 132%
Vergeleken met alle geteste toestellen
» 43% van alle geteste apparaten waren beter, 8% gelijk, 50% slechter
» De beste had een delta van 4%, het gemiddelde was 24%, de slechtste was 134%
Asus Chimera G703GI audioanalyse
(+) | luidsprekers kunnen relatief luid spelen (89 dB)
Bas 100 - 315 Hz
(±) | verminderde zeebaars - gemiddeld 8.9% lager dan de mediaan
(+) | de lage tonen zijn lineair (6.4% delta naar de vorige frequentie)
Midden 400 - 2000 Hz
(+) | evenwichtige middens - slechts 3.1% verwijderd van de mediaan
(+) | de middentonen zijn lineair (2.4% delta ten opzichte van de vorige frequentie)
Hoog 2 - 16 kHz
(+) | evenwichtige hoogtepunten - slechts 4.4% verwijderd van de mediaan
(+) | de hoge tonen zijn lineair (3.2% delta naar de vorige frequentie)
Algemeen 100 - 16.000 Hz
(+) | het totale geluid is lineair (11.8% verschil met de mediaan)
Vergeleken met dezelfde klasse
» 11% van alle geteste apparaten in deze klasse waren beter, 4% vergelijkbaar, 85% slechter
» De beste had een delta van 6%, het gemiddelde was 18%, de slechtste was 132%
Vergeleken met alle geteste toestellen
» 8% van alle geteste apparaten waren beter, 3% gelijk, 89% slechter
» De beste had een delta van 4%, het gemiddelde was 24%, de slechtste was 134%
| Uit / Standby | |
| Inactief | |
| Belasting |
|
Key:
min: | |
| MSI GT63 Titan 8RG-046 i7-8750H, GeForce GTX 1080 Mobile, CUK Cyclone 500GB M.2 NVMe, TN, 1920x1080, 15.6" | Asus ROG GU501GM-BI7N8 i7-8750H, GeForce GTX 1060 Mobile, Kingston RBUSNS8154P3128GJ, IPS, 1920x1080, 15.6" | Razer Blade 15 2018 i7-8750H, GeForce GTX 1070 Max-Q, Samsung PM961 NVMe MZVLW512HMJP, IPS, 1920x1080, 15.6" | Alienware 15 R3 Max-Q i7-7820HK, GeForce GTX 1080 Max-Q, LiteOn CX2-8B256, IPS, 1920x1080, 15.6" | Dell G5 15 5587 i5-8300H, GeForce GTX 1060 Max-Q, SK hynix SC311 M.2, IPS, 1920x1080, 15.6" | Asus Chimera G703GI i9-8950HK, GeForce GTX 1080 Mobile, 2x Intel 760p 512 GB + 1x Samsung SM961 512 GB (RAID), IPS, 1920x1080, 17.3" | Acer Predator Helios 500 PH517-51-79BY i7-8750H, GeForce GTX 1070 Mobile, SK hynix SSD Canvas SC300 HFS256GD9MNE-6200A, IPS, 1920x1080, 17.3" | |
|---|---|---|---|---|---|---|---|
| Power Consumption | 31% | 30% | 12% | 53% | -33% | 0% | |
| Idle Minimum * (Watt) | 26.4 | 12.35 53% | 14 47% | 22 17% | 4.9 81% | 29 -10% | 20.4 23% |
| Idle Average * (Watt) | 30 | 19.98 33% | 17 43% | 26 13% | 8.5 72% | 37 -23% | 26.5 12% |
| Idle Maximum * (Watt) | 30.6 | 25.44 17% | 21 31% | 33 -8% | 9.1 70% | 46 -50% | 37 -21% |
| Load Average * (Watt) | 90.4 | 94.28 -4% | 95 -5% | 86 5% | 90.7 -0% | 156 -73% | 129 -43% |
| Witcher 3 ultra * (Watt) | 255.6 | 132.9 48% | 141 45% | 159 38% | 110 57% | 252 1% | 186 27% |
| Load Maximum * (Watt) | 224.4 | 140.63 37% | 179 20% | 215 4% | 144 36% | 314 -40% | 216 4% |
* ... kleiner is beter
| MSI GT63 Titan 8RG-046 i7-8750H, GeForce GTX 1080 Mobile, 75.24 Wh | Asus ROG GU501GM-BI7N8 i7-8750H, GeForce GTX 1060 Mobile, 55 Wh | Razer Blade 15 2018 i7-8750H, GeForce GTX 1070 Max-Q, 80 Wh | Alienware 15 R3 Max-Q i7-7820HK, GeForce GTX 1080 Max-Q, 99 Wh | Dell G5 15 5587 i5-8300H, GeForce GTX 1060 Max-Q, 56 Wh | Asus Chimera G703GI i9-8950HK, GeForce GTX 1080 Mobile, 71 Wh | Acer Predator Helios 500 PH517-51-79BY i7-8750H, GeForce GTX 1070 Mobile, 72 Wh | |
|---|---|---|---|---|---|---|---|
| Batterijduur | 25% | 69% | 69% | 103% | -31% | -9% | |
| WiFi v1.3 (h) | 3.2 | 4 25% | 5.4 69% | 5.4 69% | 6.5 103% | 2.2 -31% | 2.9 -9% |
| Reader / Idle (h) | 4.5 | 6.4 | 7.1 | 11.8 | 2.8 | 4.2 | |
| Load (h) | 0.8 | 1.2 | 1.9 | 2.2 | 0.9 | 1.5 | |
| Witcher 3 ultra (h) | 1.1 |
Pro
Contra


Dit is de verkorte versie van het originele artikel. Het volledige, Engelse testrapport vind je hier.
Wanneer het aankomt op rauwe game prestaties staat de MSI GT63 Titan 8RG zijn mannetje. Het ontwerp mag dan niet veranderd zijn, maar de algehele snelheid is enkel verbeterd sinds we de GT62VR een paar jaar geleden testten. Het koelsysteem werkt merkbaar beter dan zijn voorganger en de grafische prestaties zijn zeer goed. Ja, het notebook is groot, het is zwaar en ietwat luidruchtig - maar het is in alle opzichten een klassieke desktopvervanger.
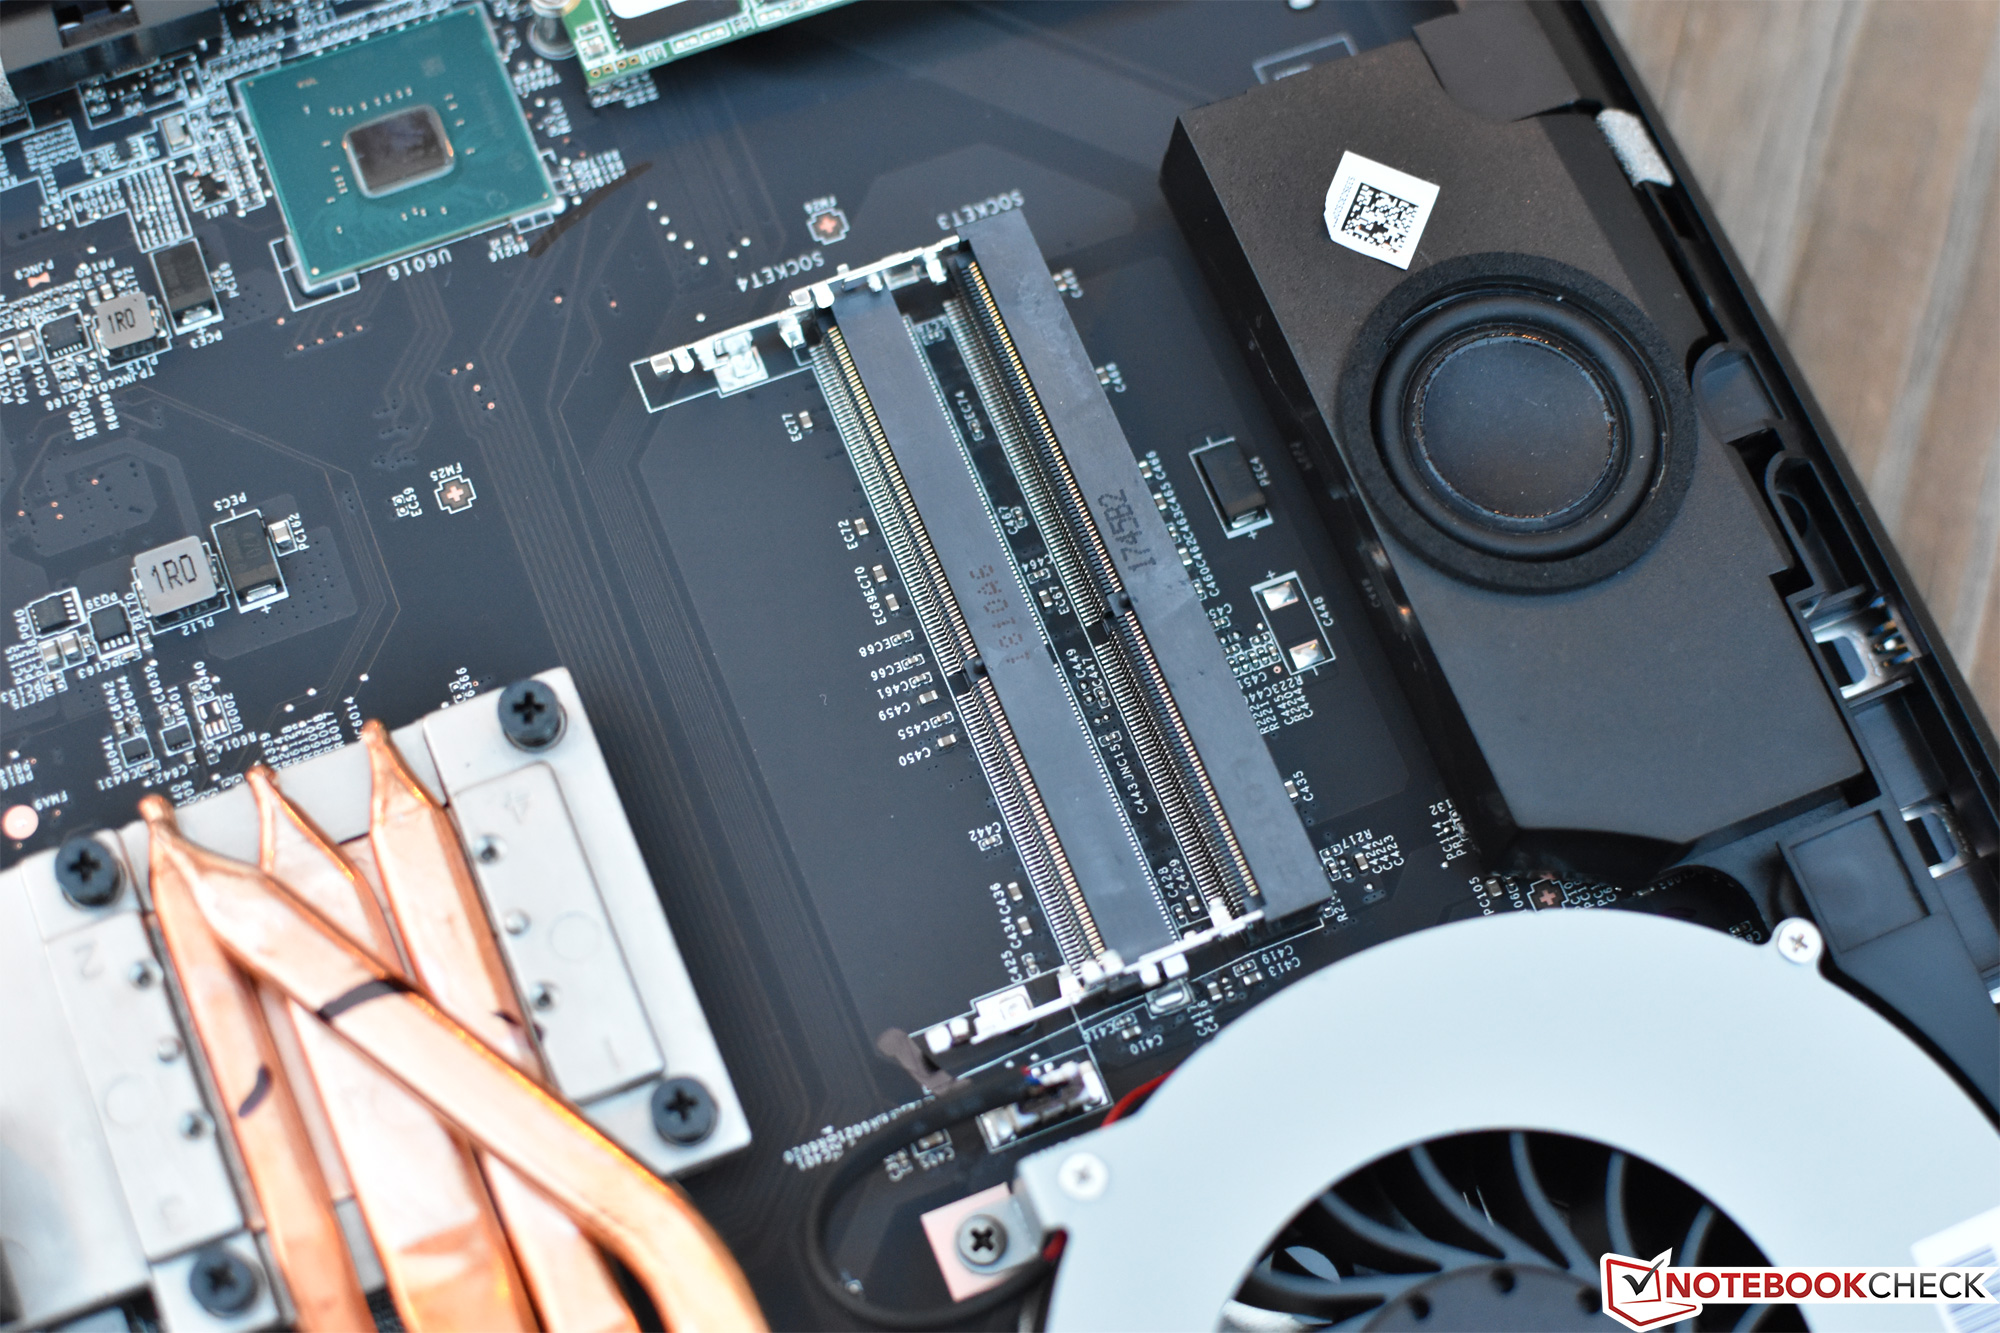
Daarnaast hebben we slechts weinig andere echte kritiek. We hadden in een notebook van deze omvang en klasse liever meer dan een M.2-slot gezien, voor bijvoorbeeld RAID-opstellingen of simpelweg meerdere opslagapparaten. De touchpad-knoppen zijn luid en irritant (met name de linker knop van ons testmodel). En, hoewel het een klein punt is, zijn er door de positionering van enkele poorten aan de achterzijde bijna acrobatische toeren nodig om randapparatuur aan te sluiten.
Ja, het notebook is groot, het is zwaar en ietwat luidruchtig - maar het is in alle opzichten een klassieke desktopvervanger.
Maar is het notebook de $2639 waard? Ter vergelijking - terwijl we de nieuwe Alienware 15 R4 nog niet hebben kunnen testen - de R3 biedt niet een maar drie M.2 SSD sloten (twee waarvan volwaardige 2280-sloten), en hoewel de oppervlakte temperatuur rond het toetsenbord hoger is, is het over het algemeen een goed uitgebalanceerde notebook. De Asus ROG Chimera en Acer Predator Helios 500 bieden ook een tweede M.2-slot en goede prestaties, maar hebben het moeilijk om de prijs/prestatie-verhouding van de GT63 te evenaren. Voor diegenen die prestaties willen inleveren ten behoeve van de draagbaarheid, in de trendy lichtgewicht game categorie zijn opties zoals de MSI GS65, Asus ROG GU501GM en Razer Blade 15 te vinden, met allen hun eigen voor- en nadelen. Tot slot zijn er voor diegenen met een krapper budget nog de Dell Inspiron 15 7000 (en de nieuwere Dell G5 15) en de Lenovo Y500-serie notebooks.
MSI GT63 Titan 8RG-046
- 02-07-2018 v6 (old)
Steve Schardein
Price comparison
