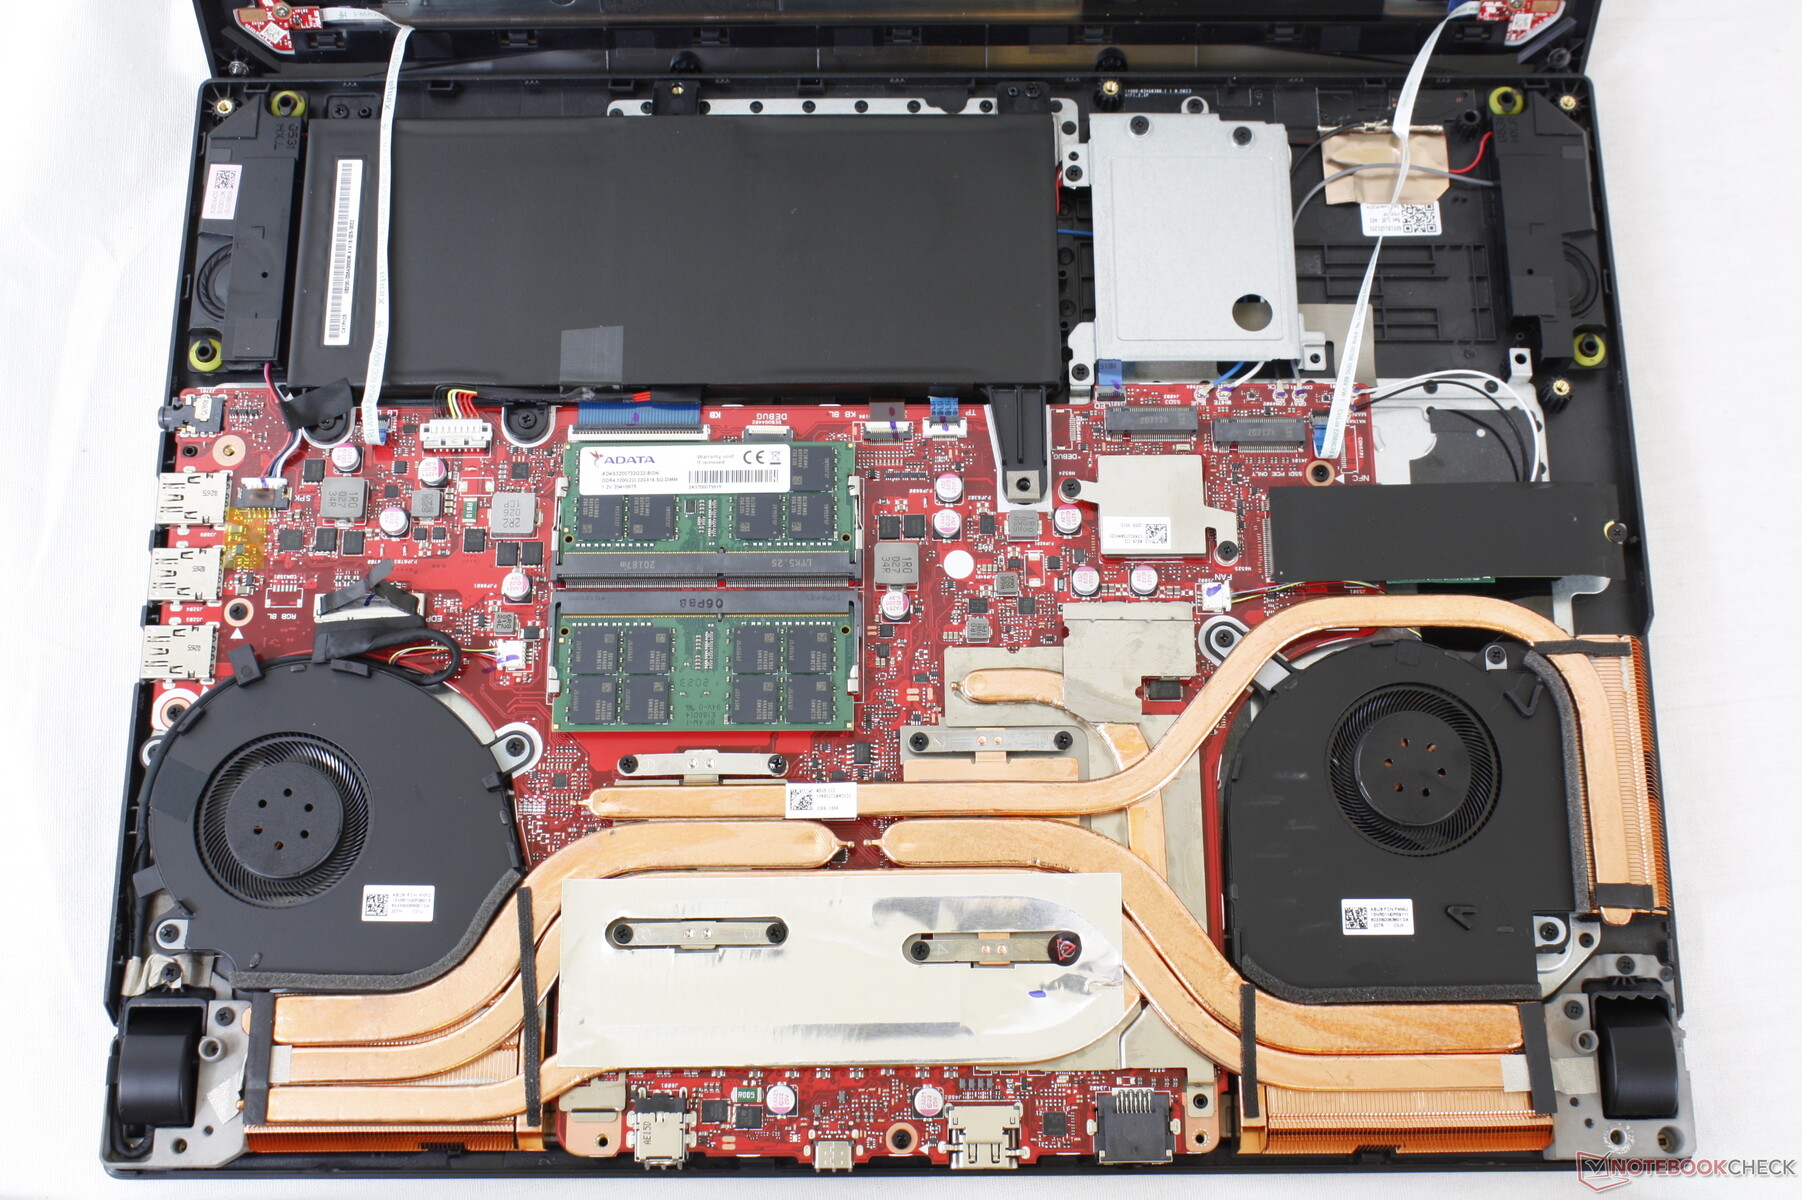
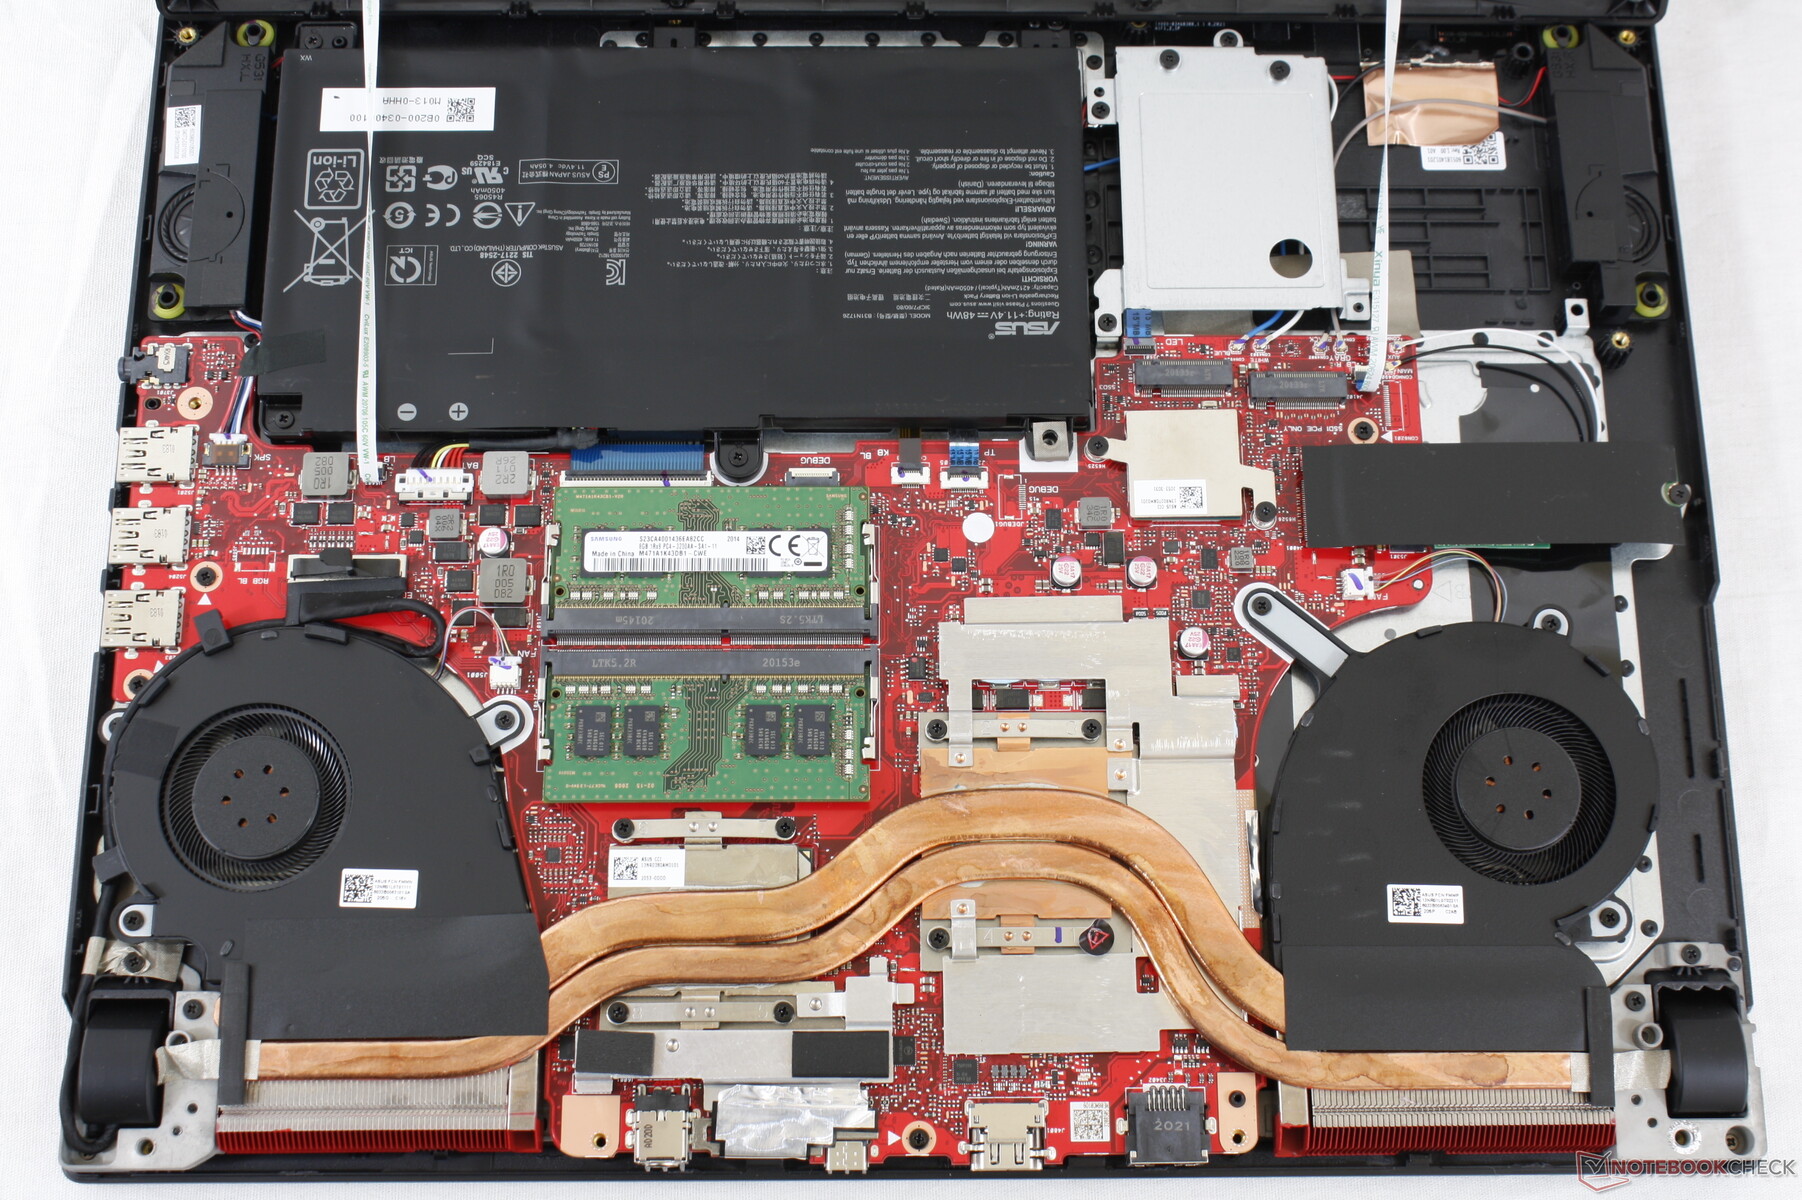
Asus ROG Strix G15 G512LW Laptop Review: Veel beter dan de G512LI
Terwijl de Asus ROG Strix G15 G512LI wordt geleverd met de GeForce GTX 1650 Ti en 144 Hz display, wordt de Asus ROG Strix G15 G512LW geleverd met de veel krachtigere GeForce RTX 2070 en een nog sneller 240 Hz display. Beide modellen hebben verder hetzelfde chassis, maar met een paar belangrijke verschillen die we in deze review zullen opmerken.
We raden aan onze review over de G512LI te bekijken om meer te weten te komen over de fysieke kenmerken van de G512LW, aangezien bijna al onze bestaande commentaren nog steeds van toepassing zijn. Deze pagina zal de prestaties verkennen en de verschillen weergeven tussen de G512LW en G512LI en andere 15.6-inch gaming laptops zoals de MSI GP65 of Alienware m15 R3. Onze configuratie is te vinden op Computer Upgrade King voor ongeveer $1500 USD en hoger, afhankelijk van RAM en opslag
Meer Asus beoordelingen:
Evaluatie | Datum | Model | Gewicht | Hoogte | Formaat | Resolutie | Beste prijs |
|---|---|---|---|---|---|---|---|
| 83.4 % v7 (old) | 11-2020 | Asus ROG Strix G15 G512LW i7-10750H, GeForce RTX 2070 Mobile | 2.3 kg | 25.8 mm | 15.60" | 1920x1080 | |
| 80.8 % v7 (old) | 07-2020 | Asus ROG Strix G15 G512LI i7-10750H, GeForce GTX 1650 Ti Mobile | 2.3 kg | 25.8 mm | 15.60" | 1920x1080 | |
| 86.9 % v7 (old) | 08-2020 | Razer Blade 15 RTX 2070 Super Max-Q i7-10875H, GeForce RTX 2070 Super Max-Q | 2.1 kg | 17.8 mm | 15.60" | 1920x1080 | |
| 83.2 % v7 (old) | 06-2020 | MSI GP65 10SFK-047US i7-10750H, GeForce RTX 2070 Mobile | 2.3 kg | 27.5 mm | 15.60" | 1920x1080 | |
| 84.4 % v7 (old) | 07-2020 | Asus ROG Strix Scar 15 G532LWS i9-10980HK, GeForce RTX 2070 Super Mobile | 2.4 kg | 24.9 mm | 15.60" | 1920x1080 | |
| 84.8 % v7 (old) | 08-2020 | Alienware m15 R3 P87F i7-10750H, GeForce RTX 2070 Mobile | 2.3 kg | 19.9 mm | 15.60" | 1920x1080 |
Zaak
Communicatie
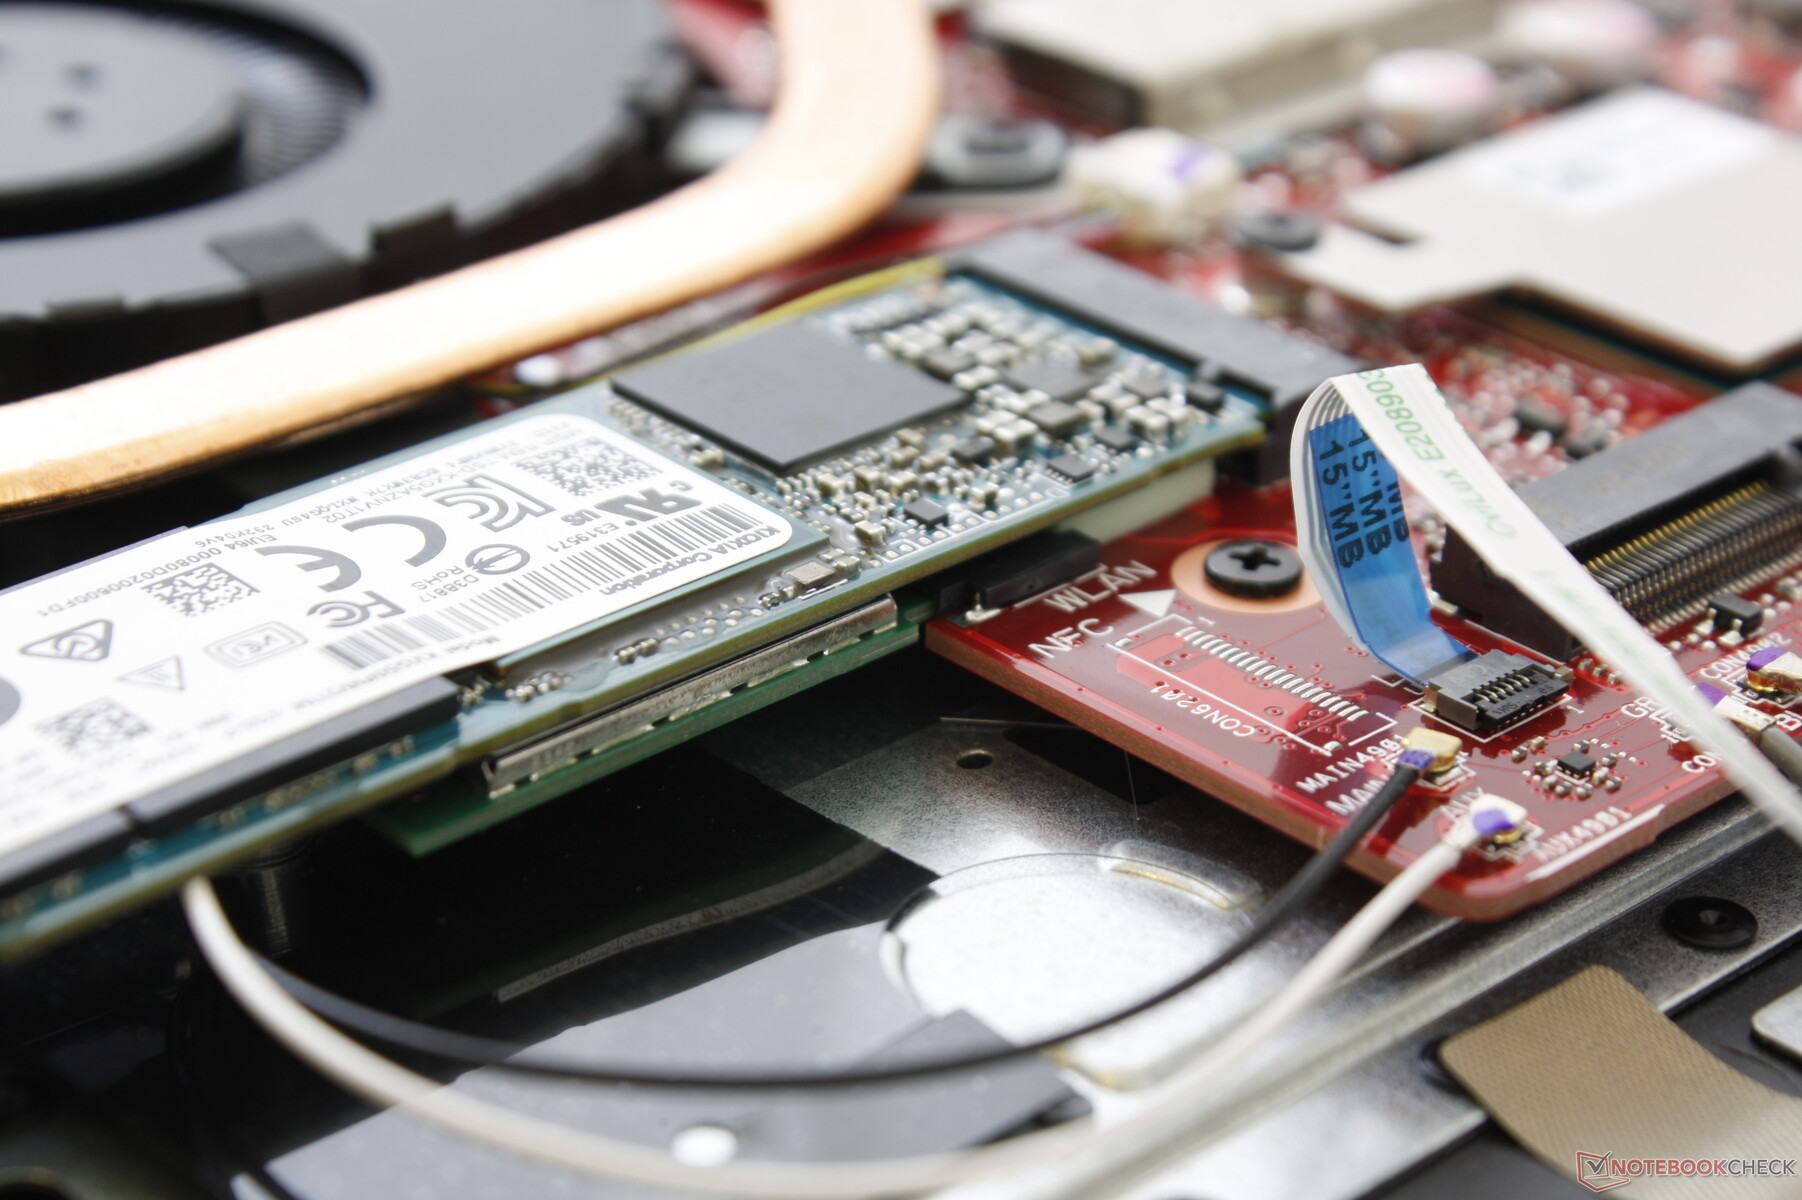
De Intel AX201 wordt standaard geleverd voor Wi-Fi 6-connectiviteit en Bluetooth 5.1. De gemiddelde overdrachtssnelheden zijn dit keer vreemd genoeg langzamer bij 790 Mbps wanneer ze verbonden zijn met onze Netgear RAX200-router. De resultaten zouden niet verbeteren, zelfs niet na het resetten van onze router en laptop.
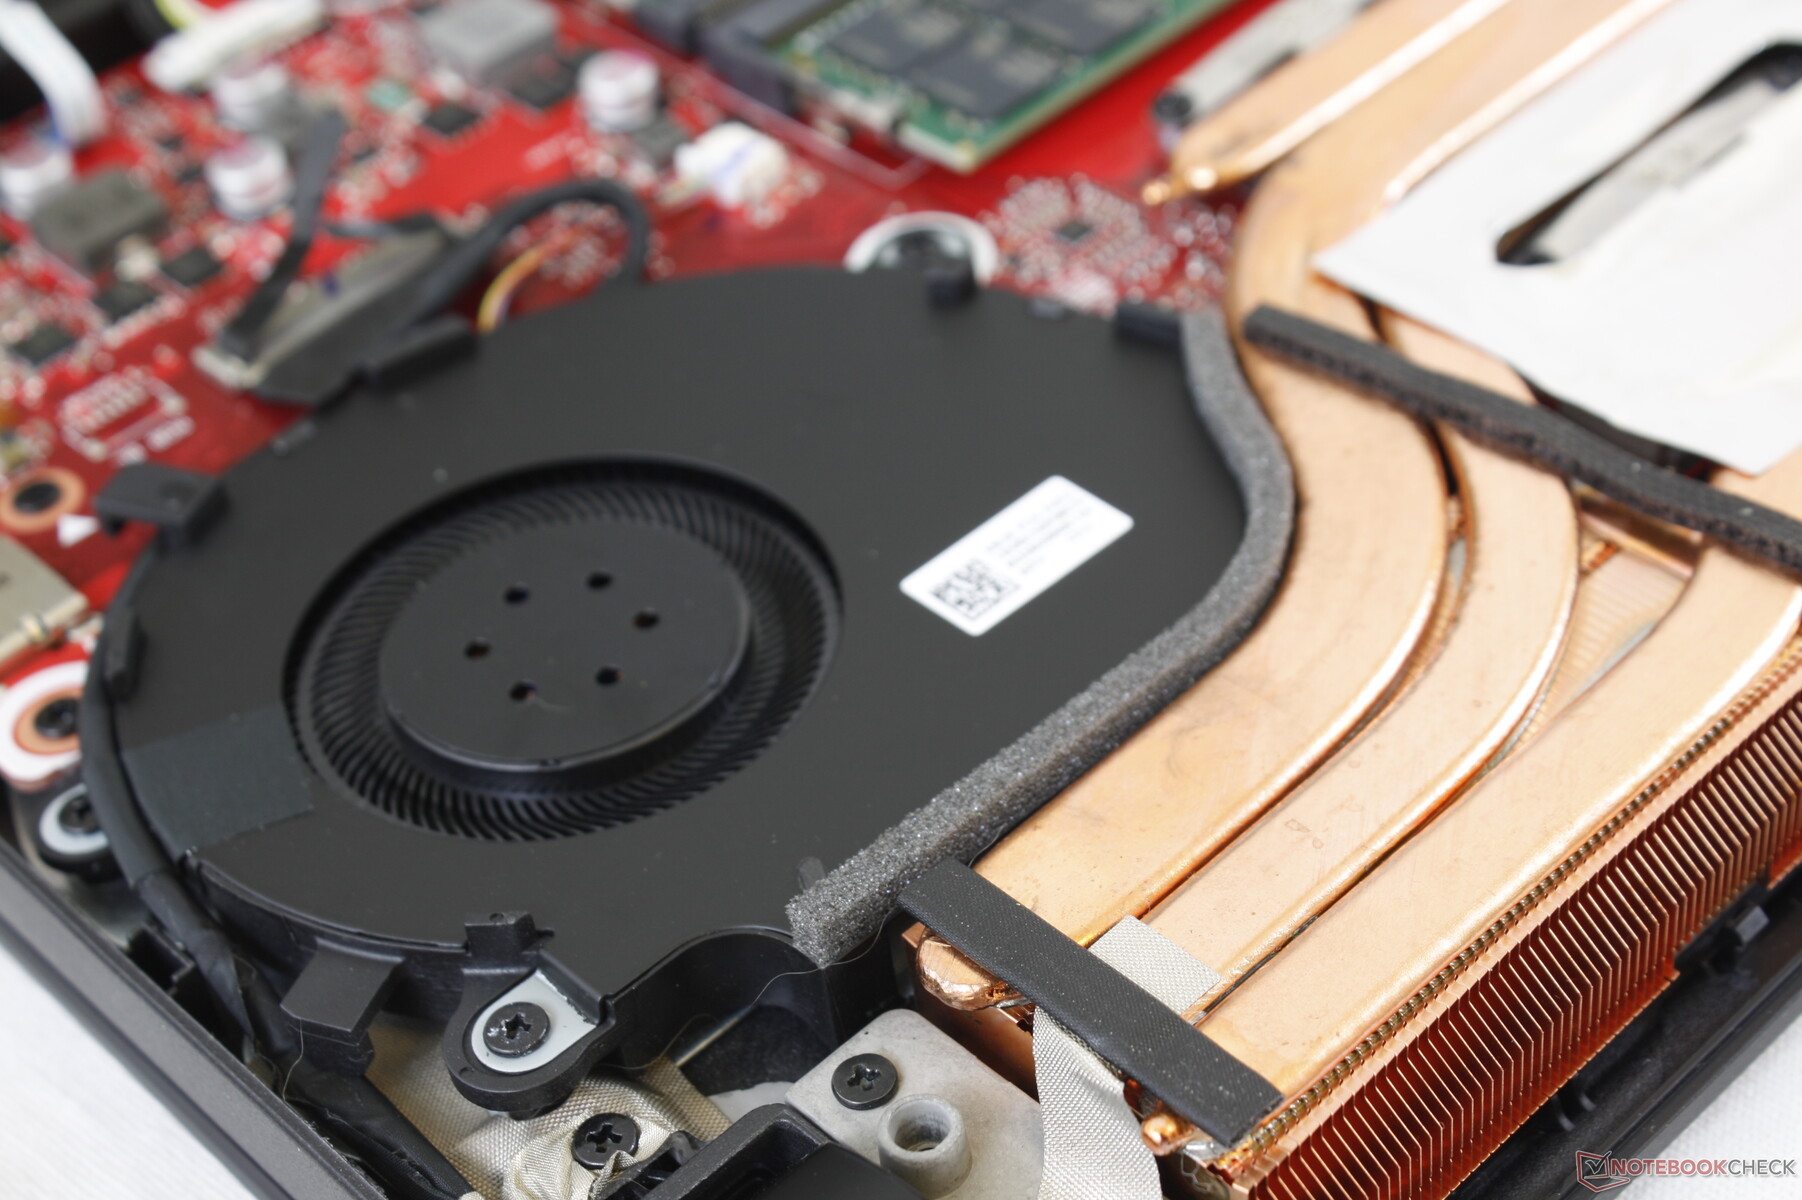
Onderhoud
Toon
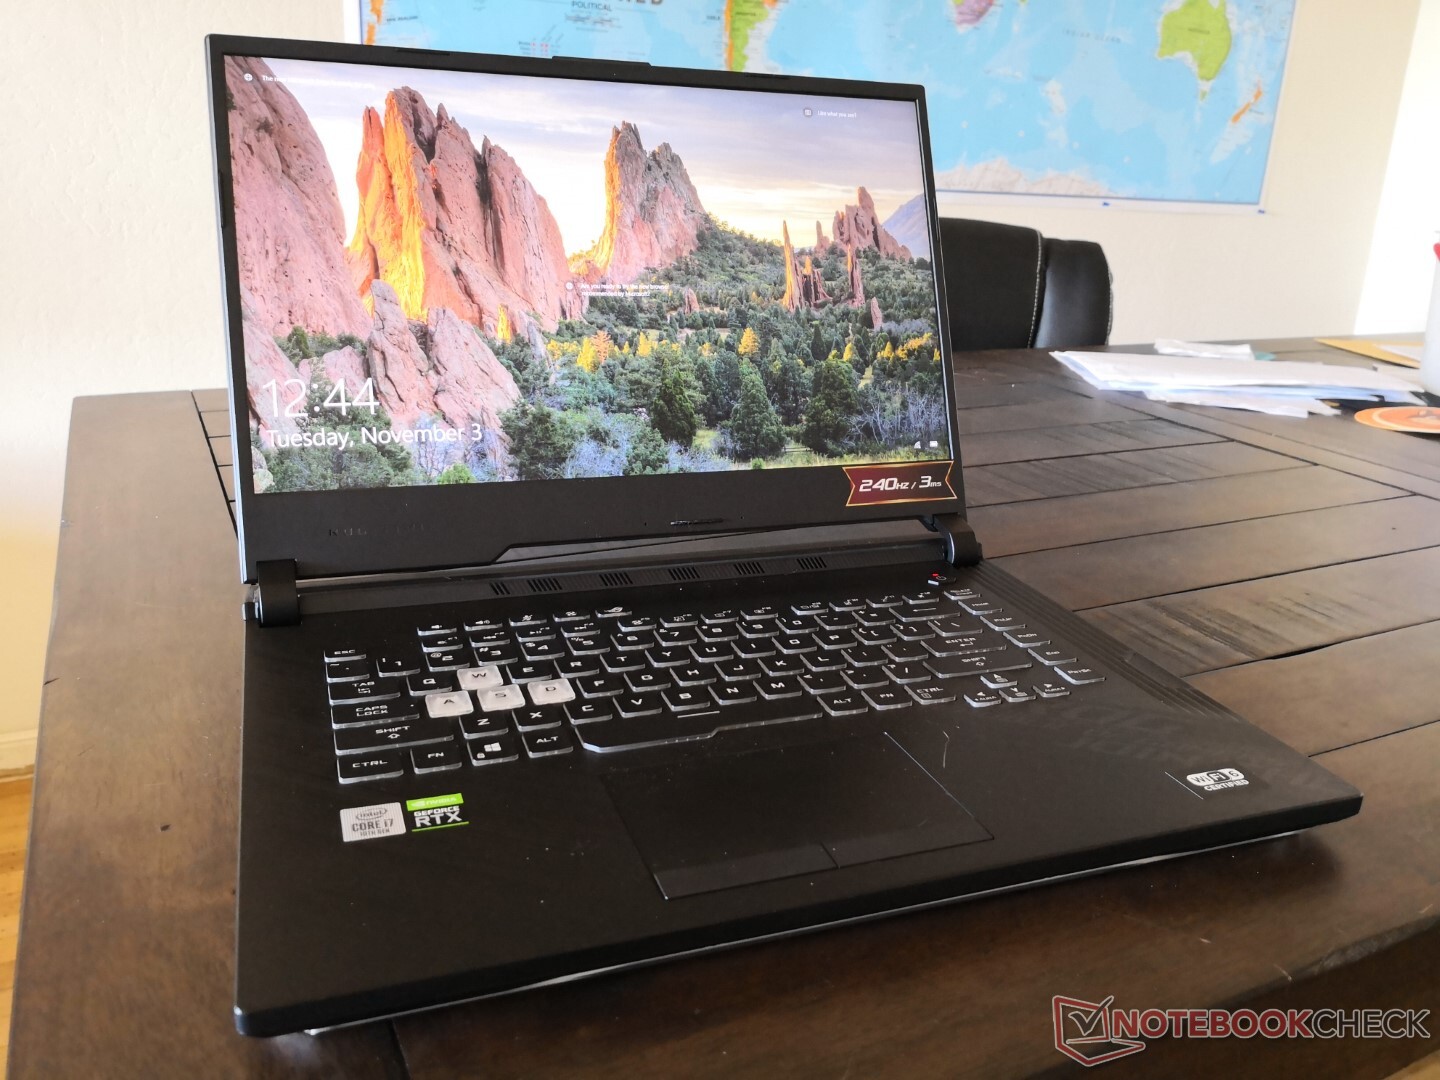
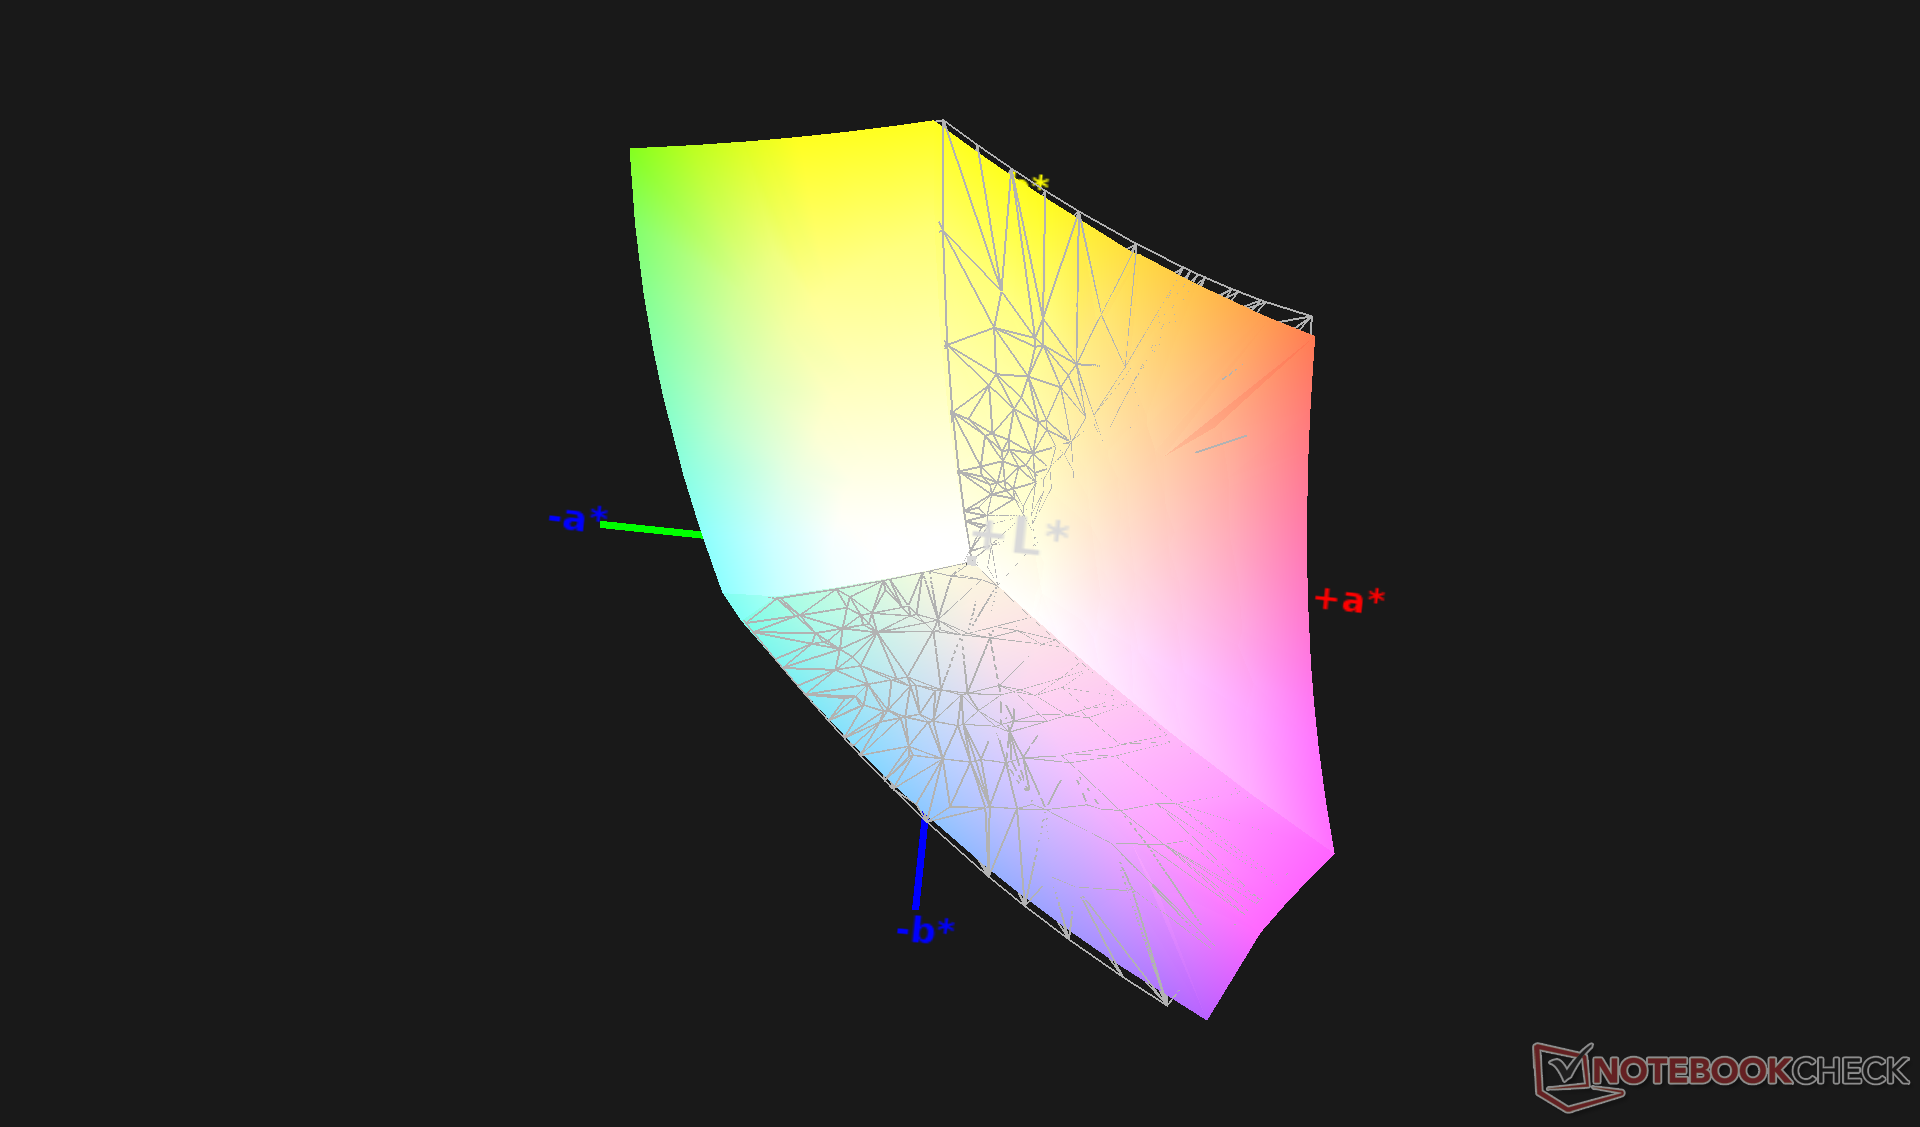
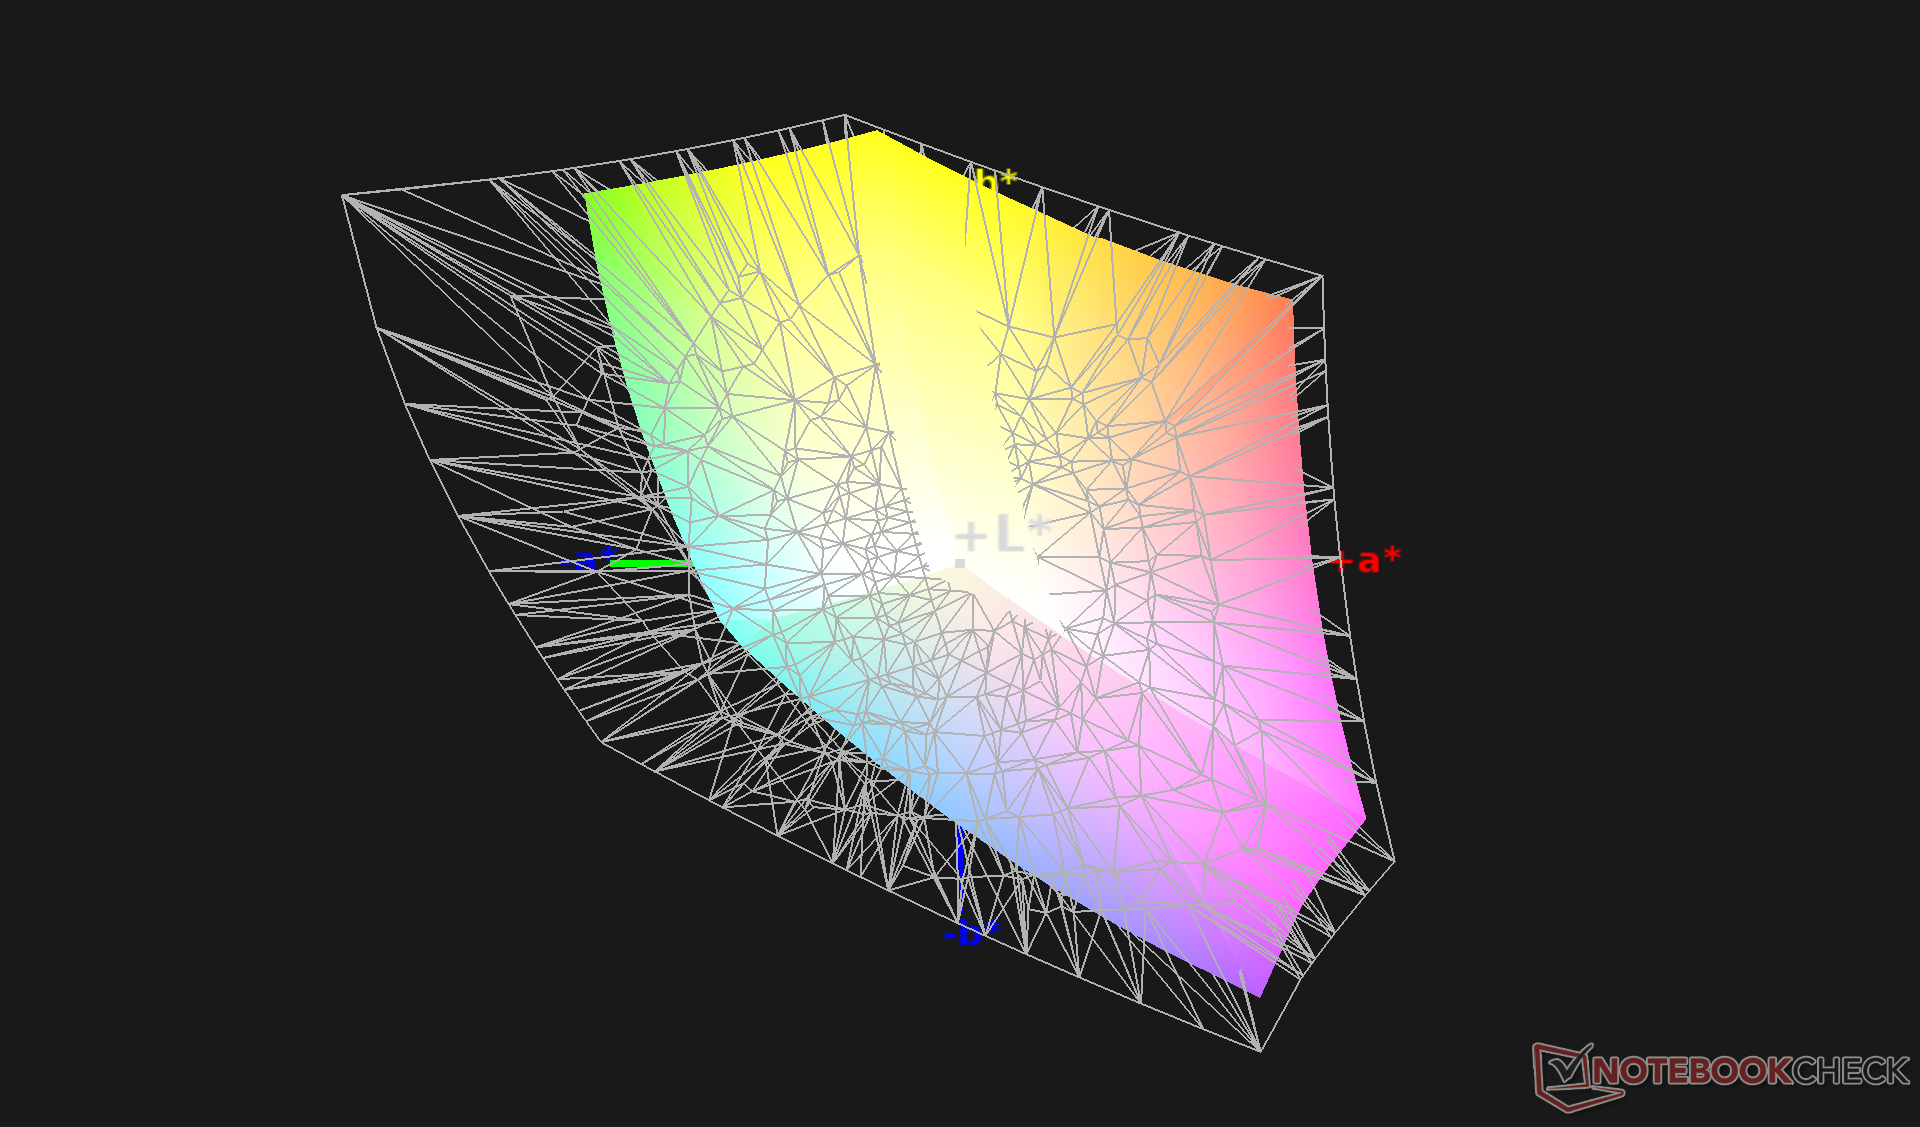
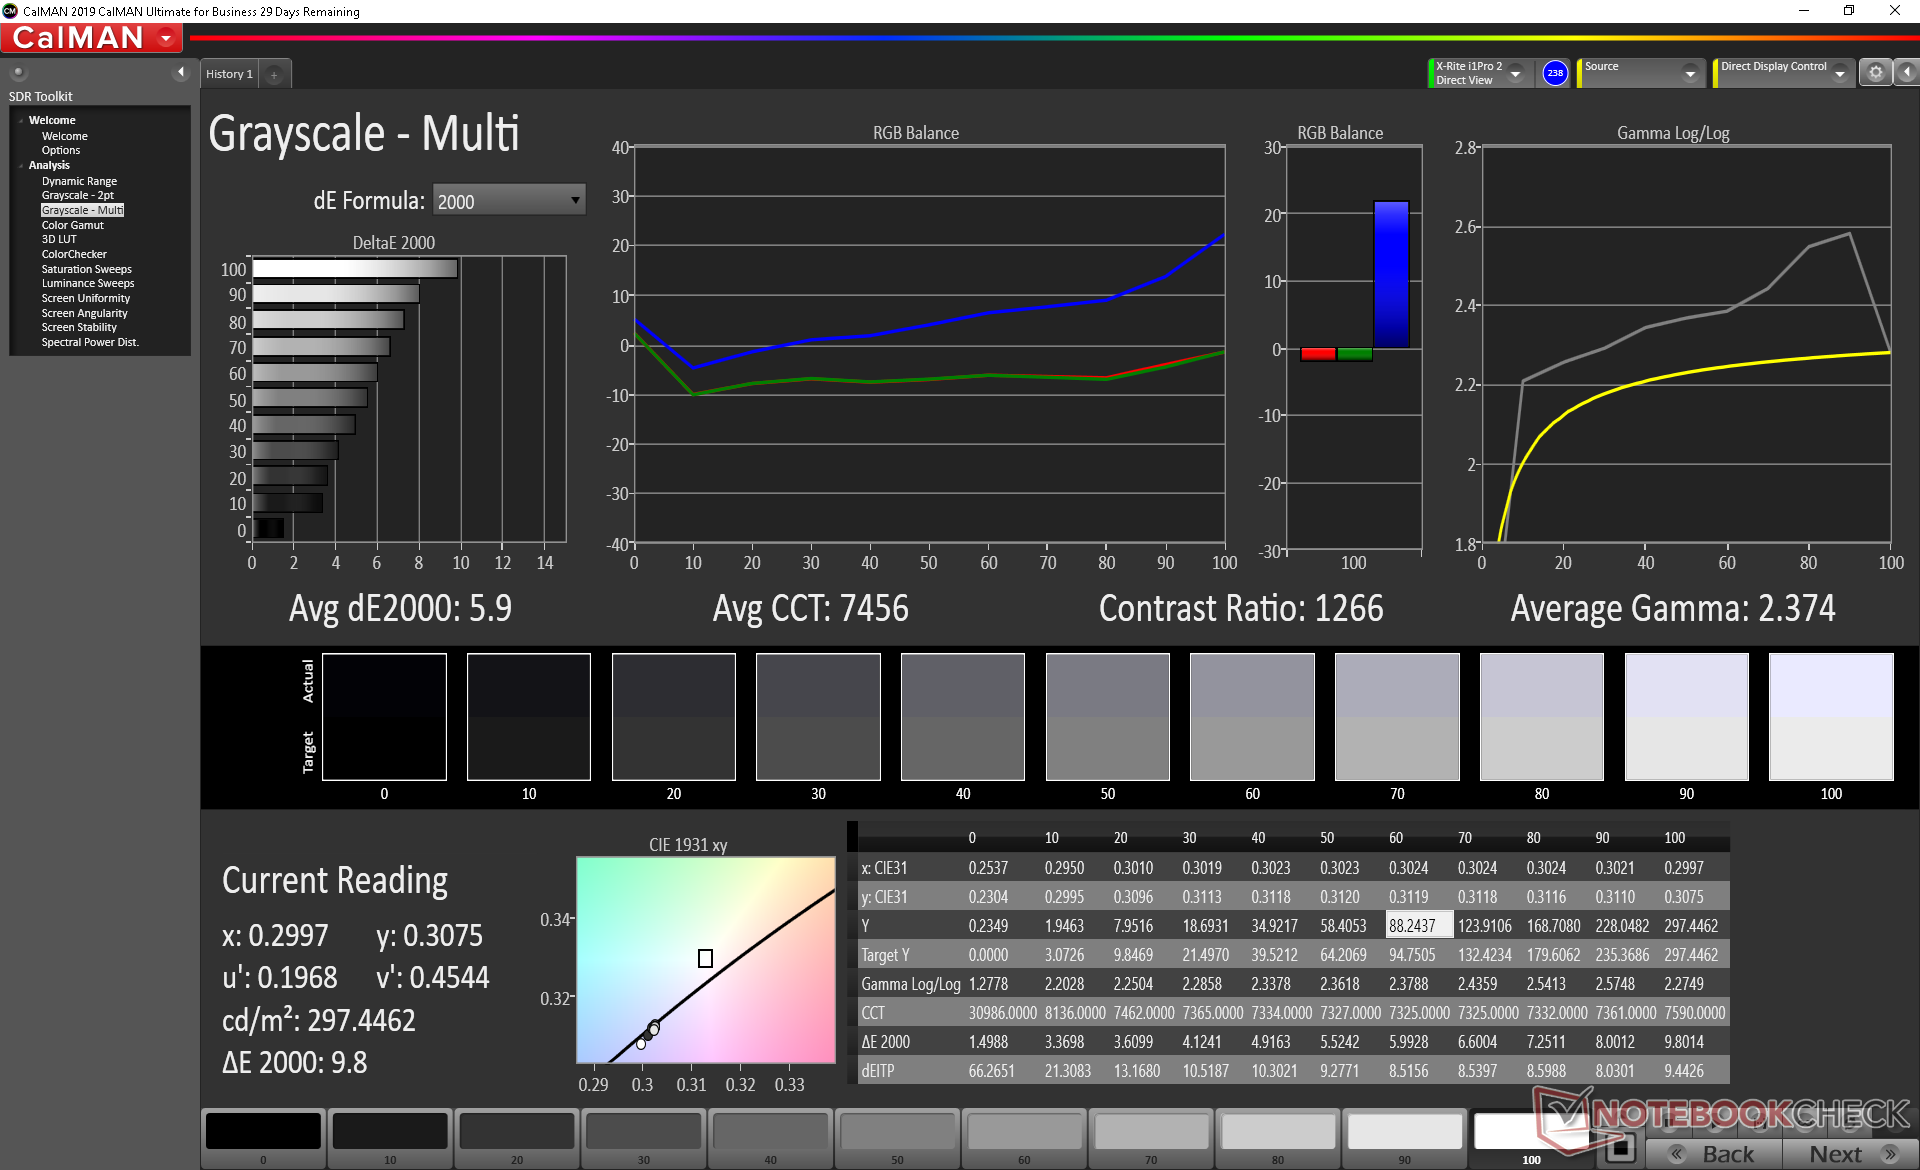
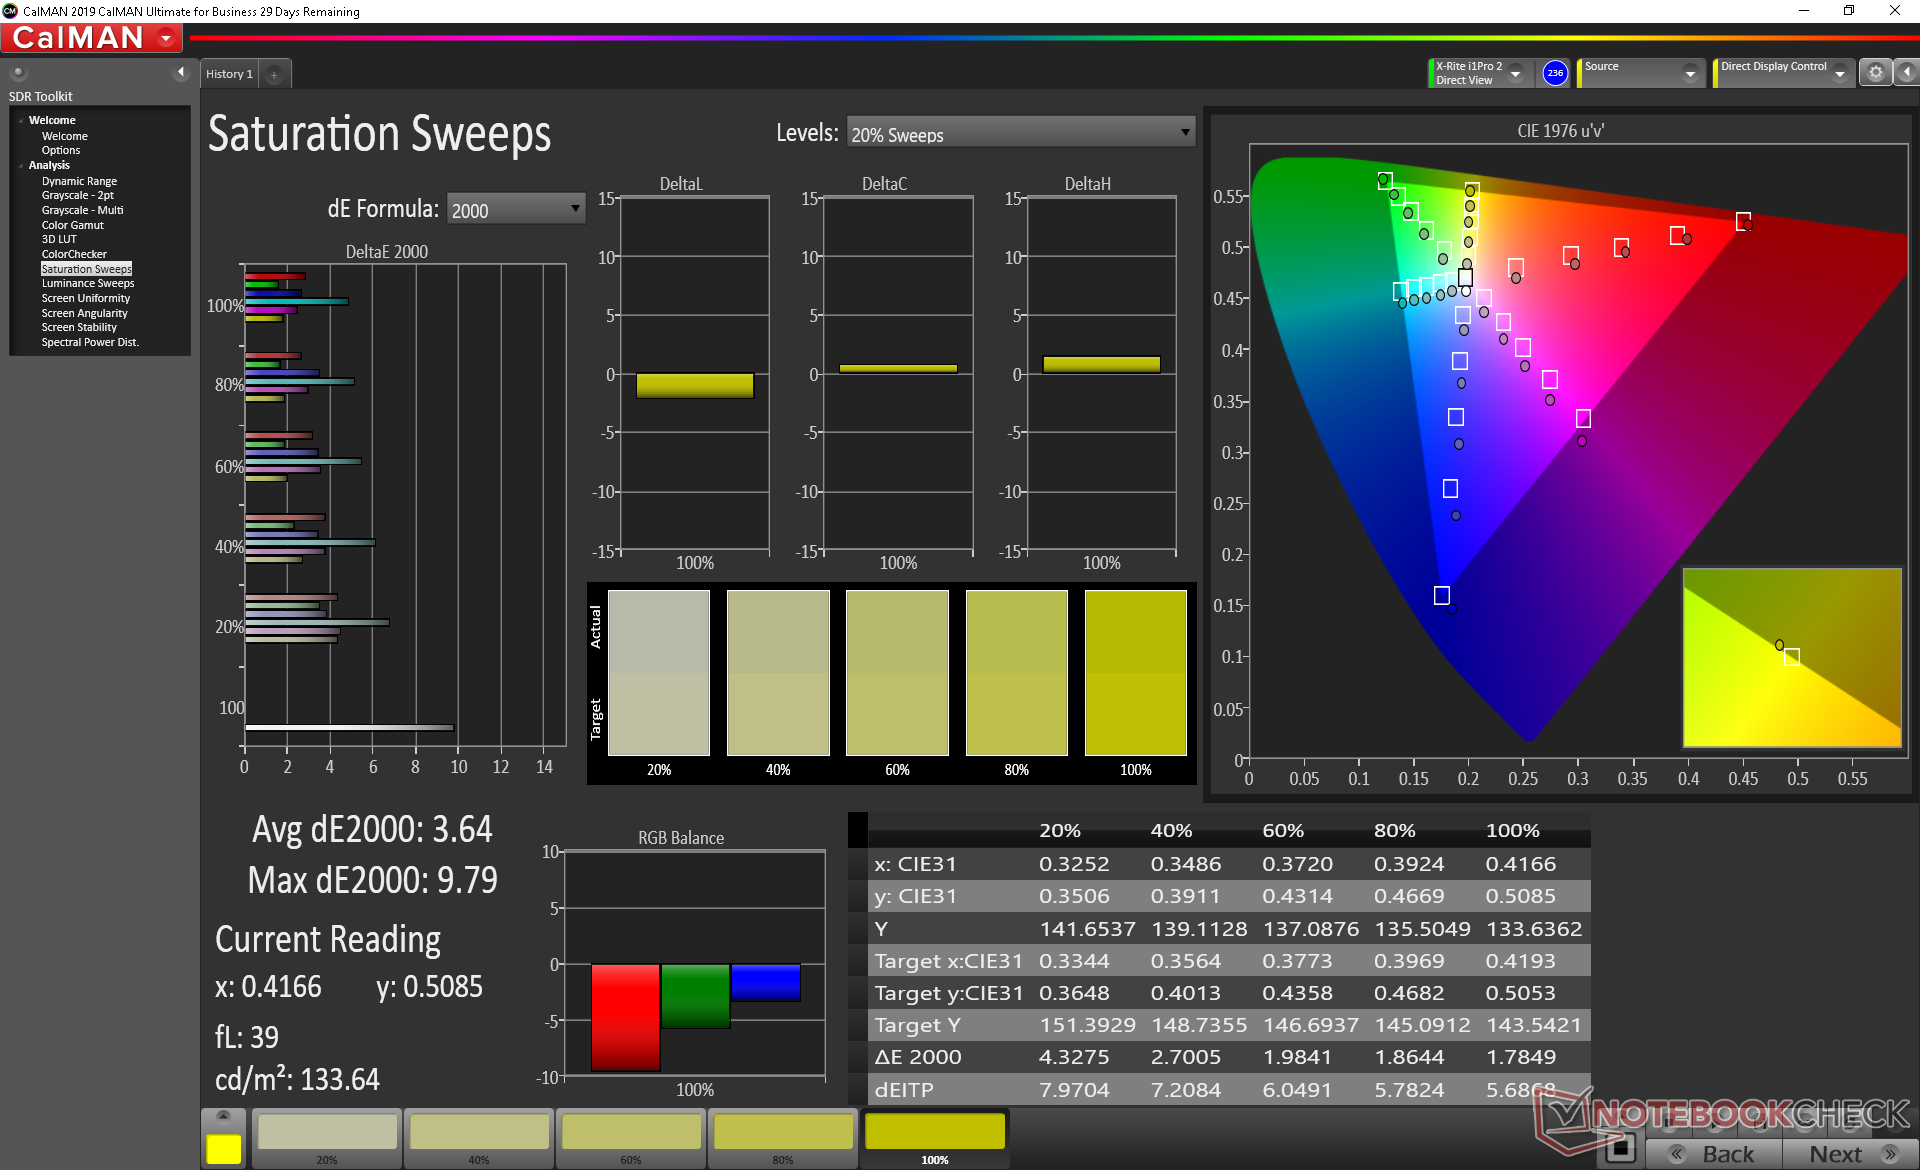
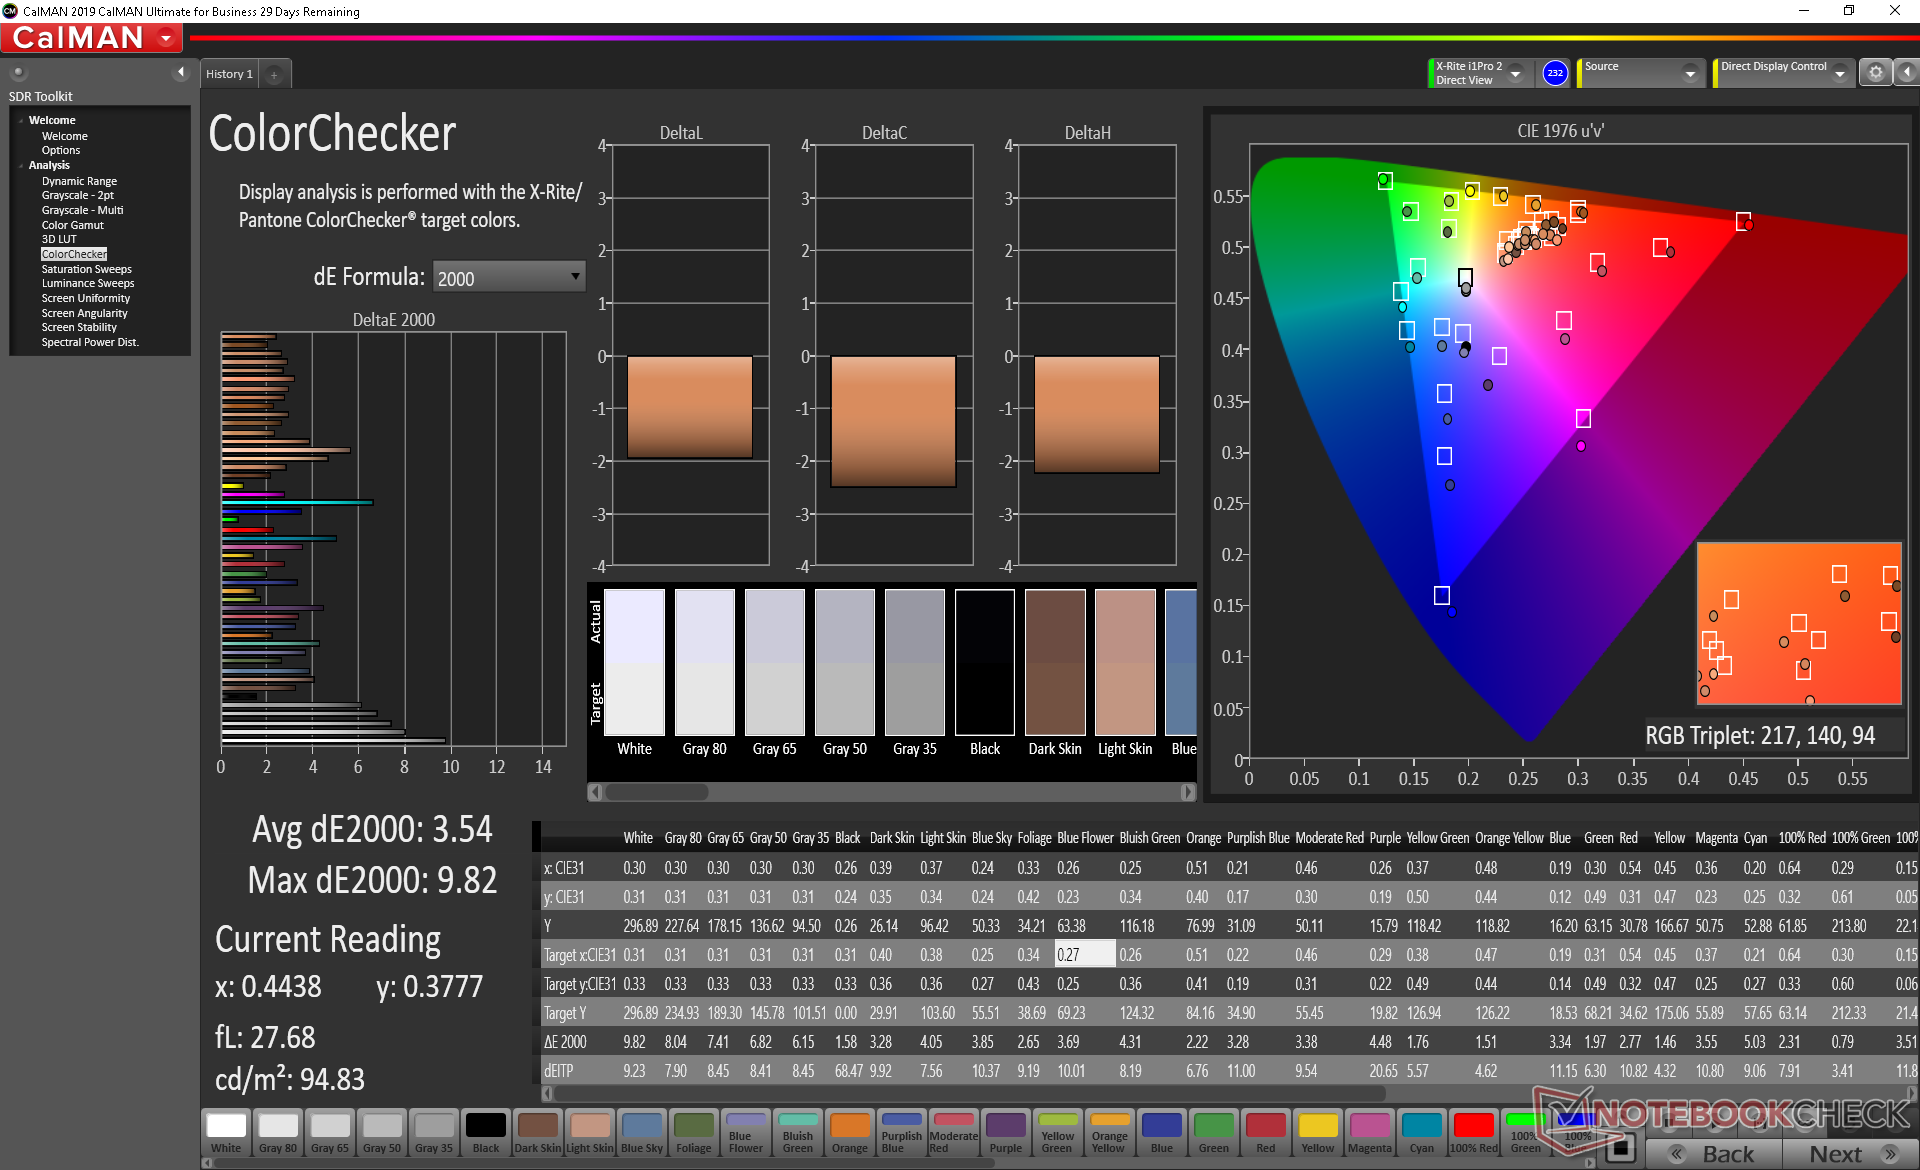
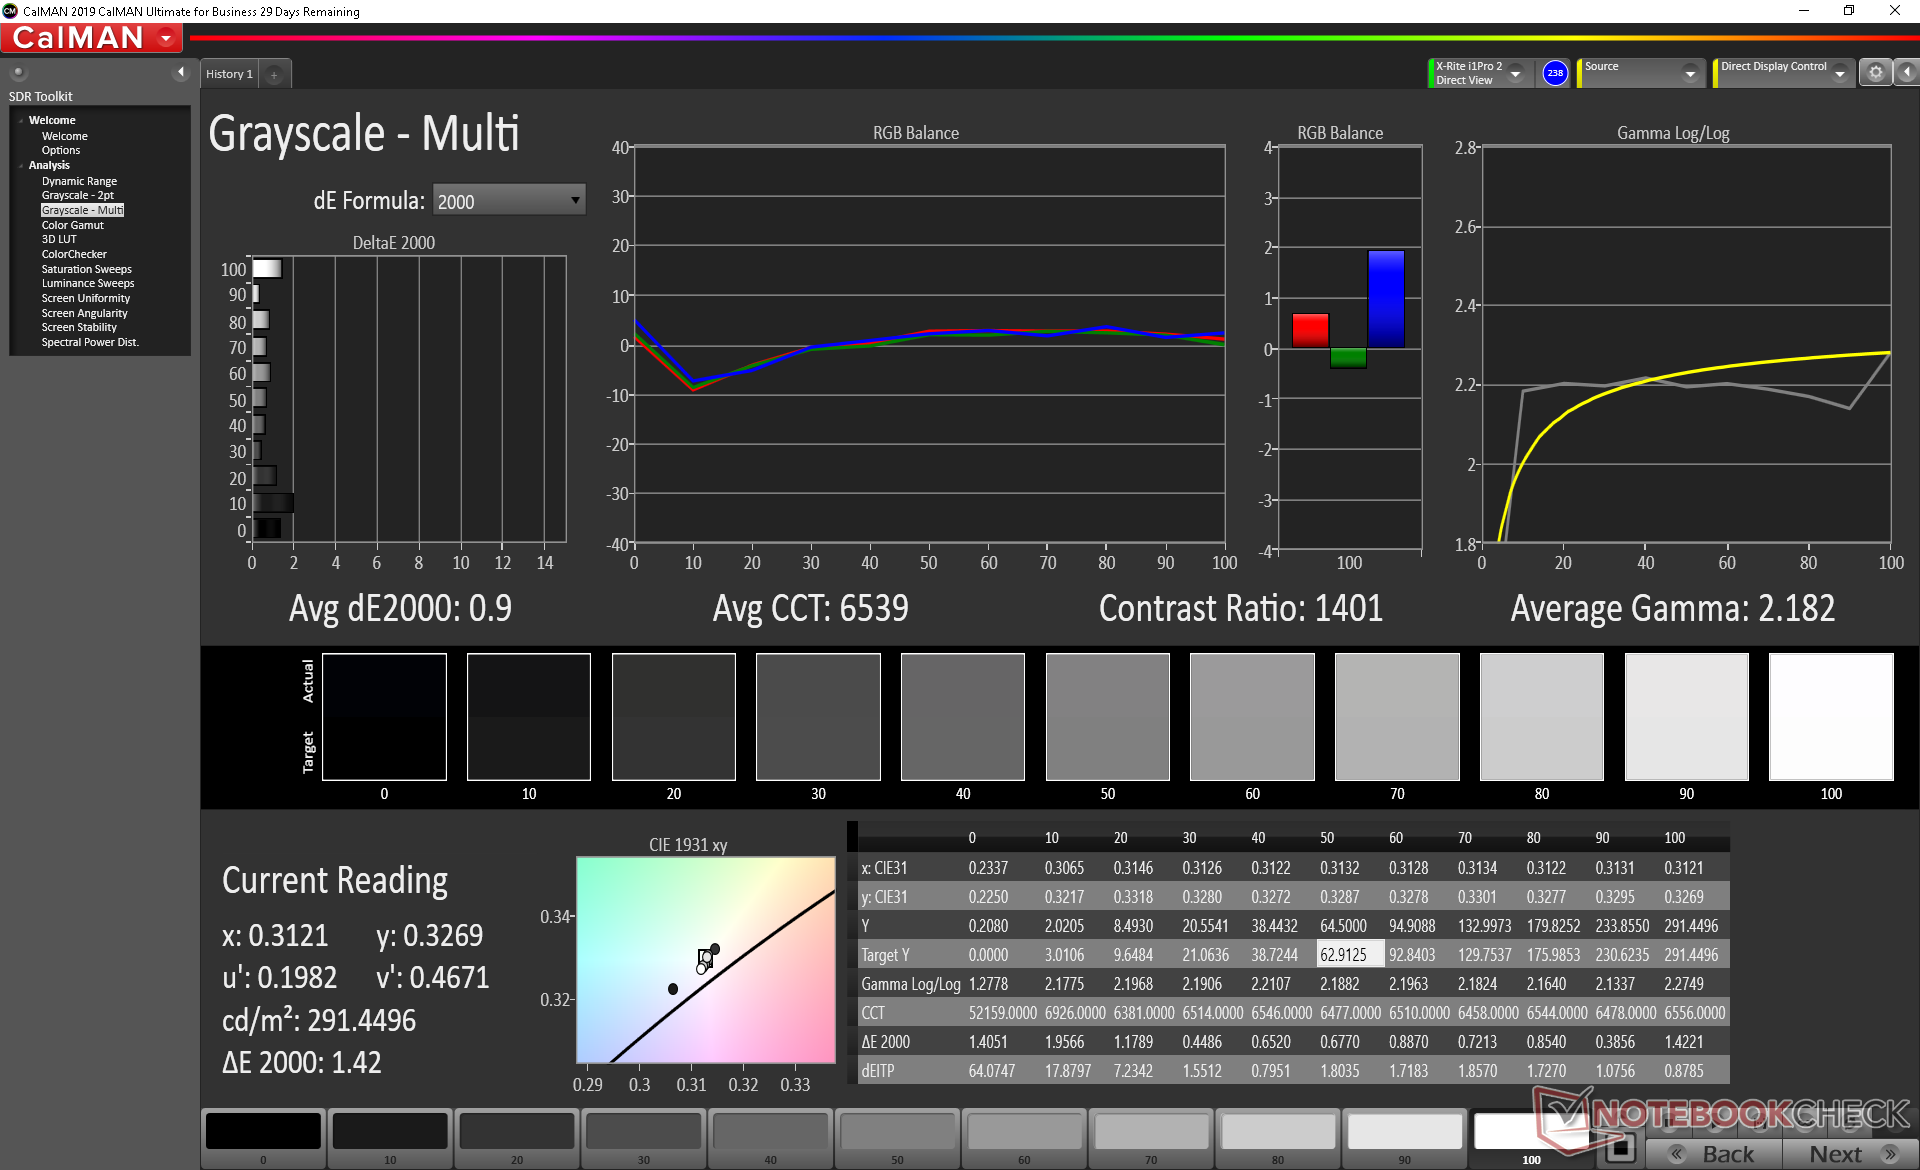
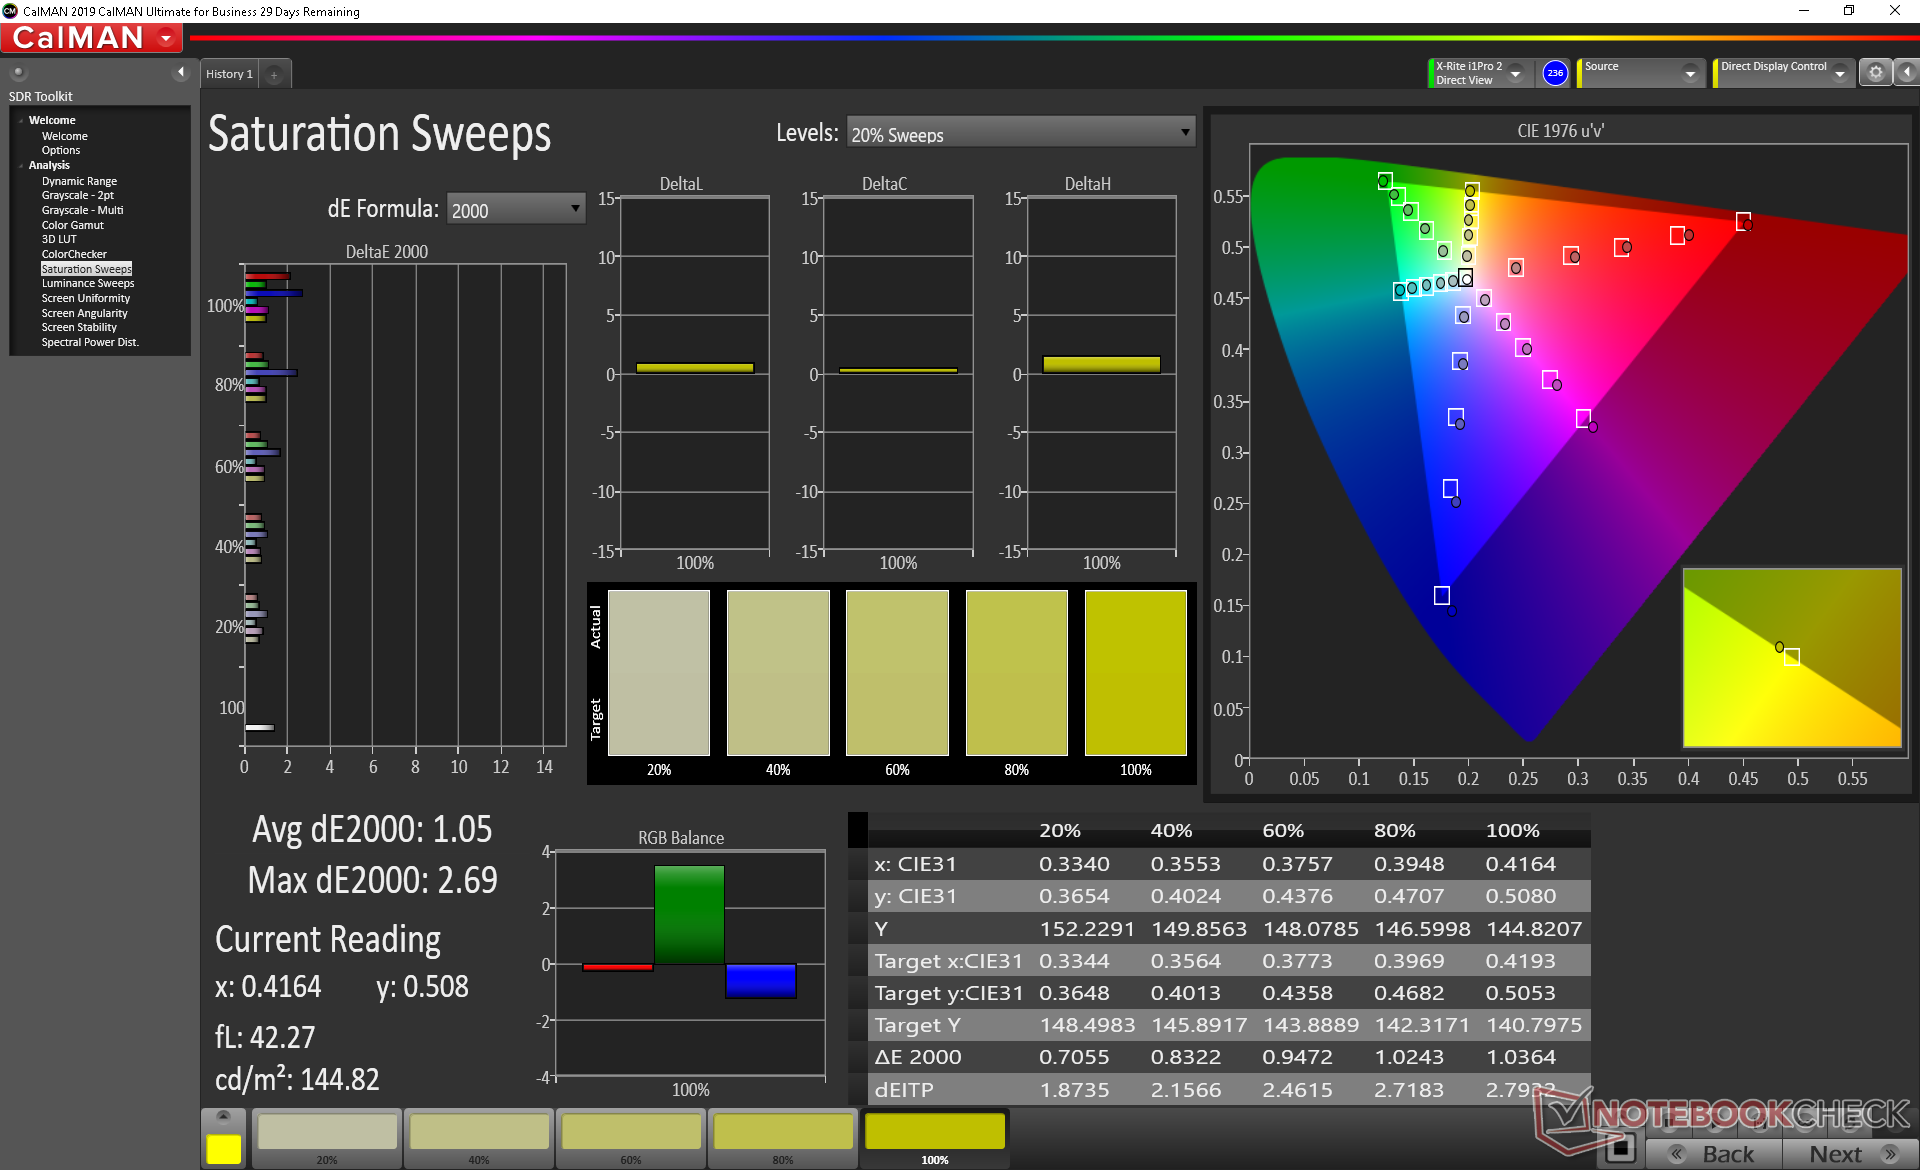
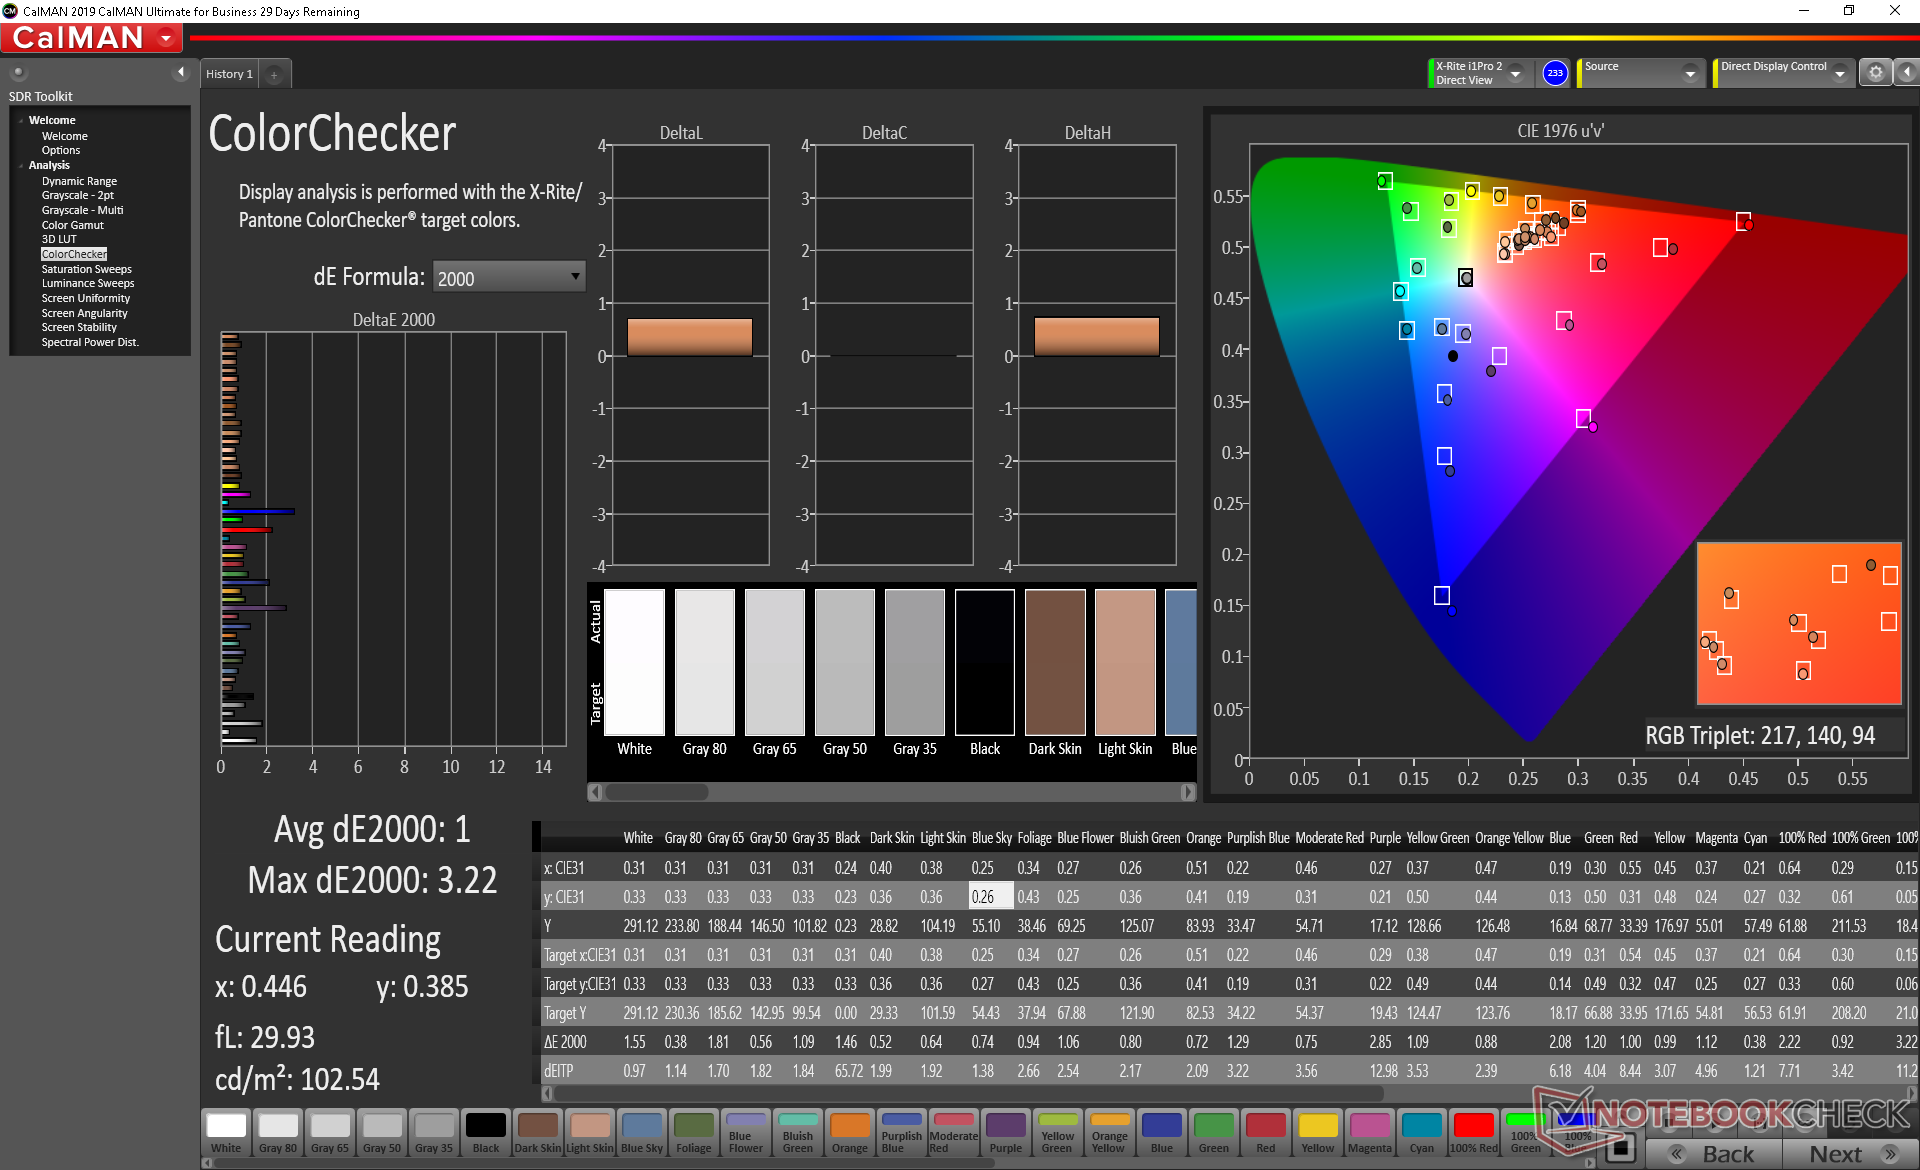
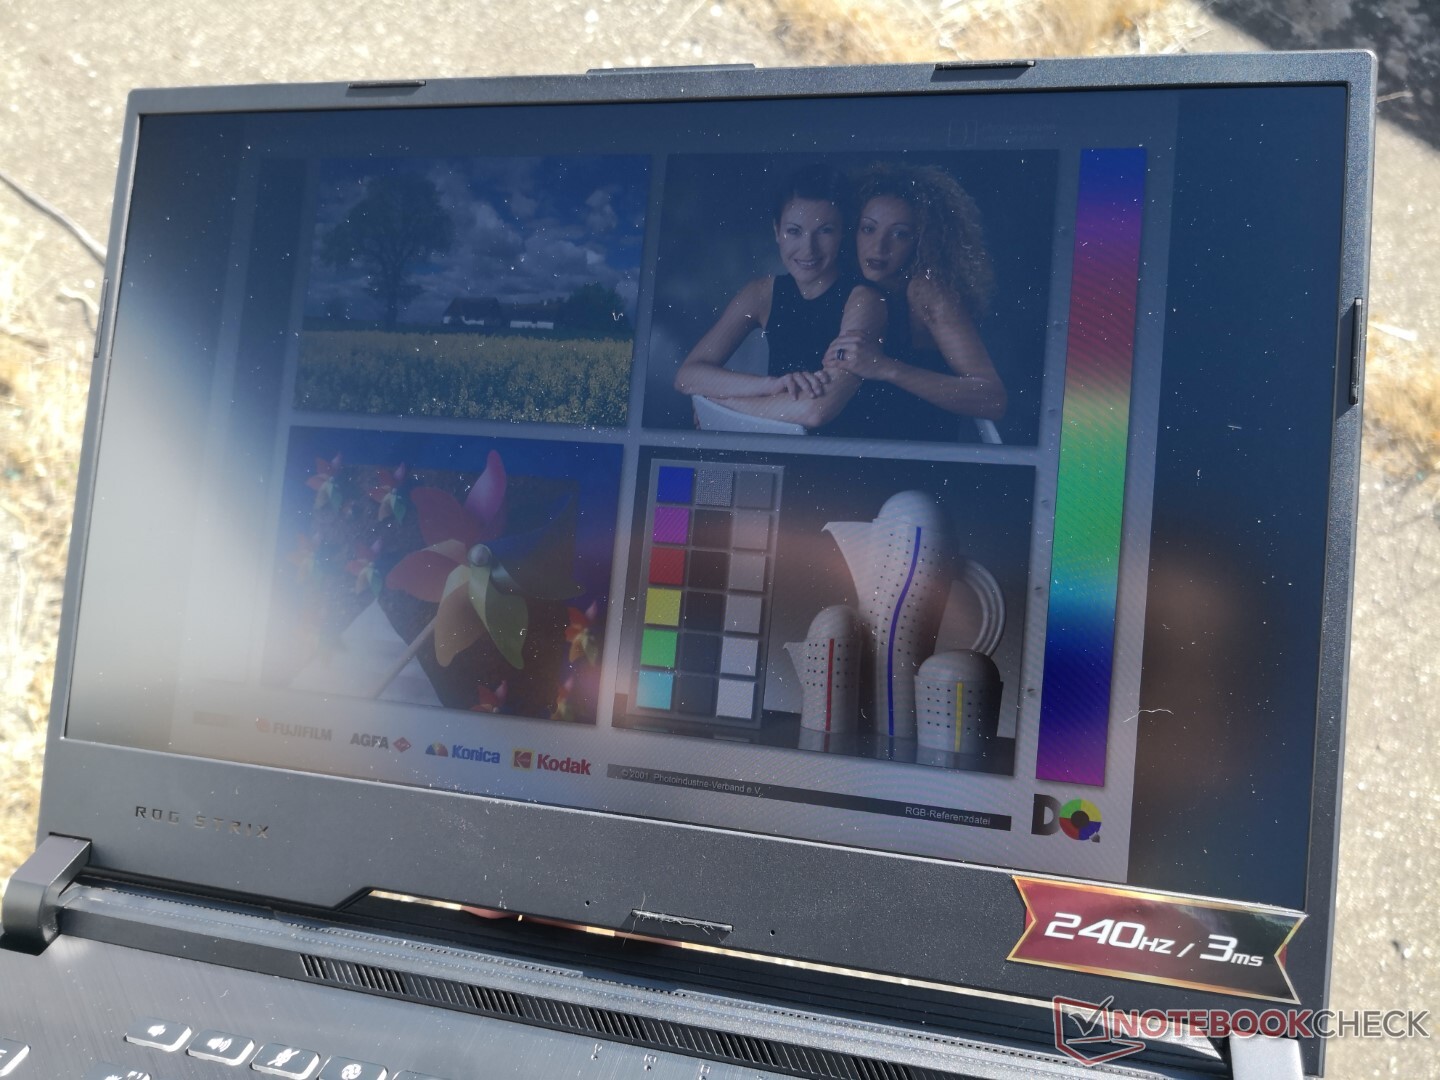
Het 240 Hz Sharp paneel op onze G512LW is in alle opzichten superieur aan het 144 Hz Panda paneel op de goedkopere G512LI. Het belangrijkste is dat het contrast, de kleurruimte en de zwart-witte reactietijden aanzienlijk beter zijn voor een visuele ervaring die het viercijferige prijskaartje weerspiegelt. We hebben in het verleden geklaagd over Panda panelen en dus is het een opluchting om er geen te zien op de G512LW.

| |||||||||||||||||||||||||
Helderheidsverdeling: 92 %
Helderheid in Batterij-modus: 300.9 cd/m²
Contrast: 971:1 (Zwart: 0.31 cd/m²)
ΔE ColorChecker Calman: 3.54 | ∀{0.5-29.43 Ø4.72}
calibrated: 1
ΔE Greyscale Calman: 5.9 | ∀{0.09-98 Ø4.97}
98.3% sRGB (Argyll 1.6.3 3D)
63.3% AdobeRGB 1998 (Argyll 1.6.3 3D)
68.5% AdobeRGB 1998 (Argyll 3D)
98.3% sRGB (Argyll 3D)
67.8% Display P3 (Argyll 3D)
Gamma: 2.37
CCT: 7456 K
| Asus ROG Strix G15 G512LW Sharp LQ156M1JW09, IPS, 15.6", 1920x1080 | Asus ROG Strix G15 G512LI Panda LM156LF-2F01, IPS, 15.6", 1920x1080 | Razer Blade 15 RTX 2070 Super Max-Q AU Optronics B156HAN12.0, IPS, 15.6", 1920x1080 | MSI GP65 10SFK-047US LG Philips LP156WFG-SPB3, IPS, 15.6", 1920x1080 | Asus ROG Strix Scar 15 G532LWS AU Optronics B156HAN12.0, IPS, 15.6", 1920x1080 | Alienware m15 R3 P87F AU Optronics B156HAN, IPS, 15.6", 1920x1080 | |
|---|---|---|---|---|---|---|
| Display | -40% | 2% | -5% | 3% | 1% | |
| Display P3 Coverage (%) | 67.8 | 39.73 -41% | 69.4 2% | 63.5 -6% | 69.9 3% | 68.6 1% |
| sRGB Coverage (%) | 98.3 | 59.8 -39% | 98.8 1% | 94.4 -4% | 99.6 1% | 98.9 1% |
| AdobeRGB 1998 Coverage (%) | 68.5 | 41.06 -40% | 70.5 3% | 65.1 -5% | 71.4 4% | 69.8 2% |
| Response Times | -138% | 52% | 10% | 11% | 36% | |
| Response Time Grey 50% / Grey 80% * (ms) | 16 ? | 33.6 ? -110% | 3.2 ? 80% | 10.4 ? 35% | 14.4 ? 10% | 4 ? 75% |
| Response Time Black / White * (ms) | 10.4 ? | 27.6 ? -165% | 8 ? 23% | 12 ? -15% | 9.2 ? 12% | 10.8 ? -4% |
| PWM Frequency (Hz) | 23580 ? | |||||
| Screen | -57% | 3% | -8% | 22% | 7% | |
| Brightness middle (cd/m²) | 300.9 | 271.2 -10% | 345.4 15% | 384.9 28% | 307.2 2% | 326.7 9% |
| Brightness (cd/m²) | 289 | 252 -13% | 342 18% | 358 24% | 301 4% | 316 9% |
| Brightness Distribution (%) | 92 | 79 -14% | 90 -2% | 87 -5% | 91 -1% | 87 -5% |
| Black Level * (cd/m²) | 0.31 | 0.53 -71% | 0.34 -10% | 0.67 -116% | 0.21 32% | 0.33 -6% |
| Contrast (:1) | 971 | 512 -47% | 1016 5% | 574 -41% | 1463 51% | 990 2% |
| Colorchecker dE 2000 * | 3.54 | 5.04 -42% | 3.18 10% | 2.43 31% | 1.85 48% | 2.4 32% |
| Colorchecker dE 2000 max. * | 9.82 | 16.07 -64% | 6.57 33% | 4.58 53% | 3.92 60% | 6.06 38% |
| Colorchecker dE 2000 calibrated * | 1 | 4.26 -326% | 1.77 -77% | 2.03 -103% | 1.26 -26% | 1.51 -51% |
| Greyscale dE 2000 * | 5.9 | 3.4 42% | 3.8 36% | 2.6 56% | 2 66% | 3.2 46% |
| Gamma | 2.37 93% | 2.09 105% | 2.15 102% | 2.2 100% | 2.15 102% | 2.13 103% |
| CCT | 7456 87% | 7079 92% | 7109 91% | 6981 93% | 6479 100% | 7129 91% |
| Color Space (Percent of AdobeRGB 1998) (%) | 63.3 | 37.8 -40% | 64.3 2% | 59.7 -6% | 65 3% | 63.7 1% |
| Color Space (Percent of sRGB) (%) | 98.3 | 59.5 -39% | 99 1% | 93.9 -4% | 99.7 1% | 99.2 1% |
| Totaal Gemiddelde (Programma / Instellingen) | -78% /
-64% | 19% /
9% | -1% /
-5% | 12% /
17% | 15% /
9% |
* ... kleiner is beter
Het display had beter gekalibreerd kunnen worden gezien de prijsklasse. De kleurtemperatuur is te warm uit de doos, wat een impact heeft op de gemiddelde grijstint en de kleurnauwkeurigheid. Nadat we het paneel zelf hebben gekalibreerd, zou de nauwkeurigheid over de hele linie merkbaar verbeteren. Wij raden een eindgebruikerskalibratie aan indien mogelijk of in ieder geval handmatige aanpassingen aan de grijstinten voor een beter beeld.
Responstijd Scherm
| ↔ Responstijd Zwart naar Wit | ||
|---|---|---|
| 10.4 ms ... stijging ↗ en daling ↘ gecombineerd | ↗ 5.2 ms stijging | 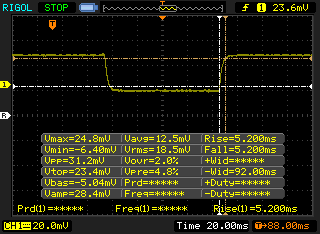 |
| ↘ 5.2 ms daling | ||
| Het scherm vertoonde prima responstijden in onze tests maar is misschien wat te traag voor competitieve games. Ter vergelijking: alle testtoestellen variëren van 0.1 (minimum) tot 240 (maximum) ms. » 28 % van alle toestellen zijn beter. Dit betekent dat de gemeten responstijd beter is dan het gemiddelde (19.9 ms) van alle geteste toestellen. | ||
| ↔ Responstijd 50% Grijs naar 80% Grijs | ||
| 16 ms ... stijging ↗ en daling ↘ gecombineerd | ↗ 8.4 ms stijging | 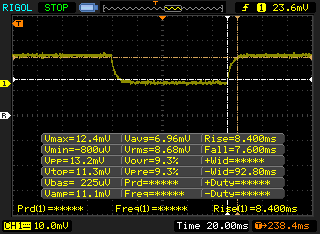 |
| ↘ 7.6 ms daling | ||
| Het scherm vertoonde prima responstijden in onze tests maar is misschien wat te traag voor competitieve games. Ter vergelijking: alle testtoestellen variëren van 0.165 (minimum) tot 636 (maximum) ms. » 30 % van alle toestellen zijn beter. Dit betekent dat de gemeten responstijd beter is dan het gemiddelde (31.1 ms) van alle geteste toestellen. | ||
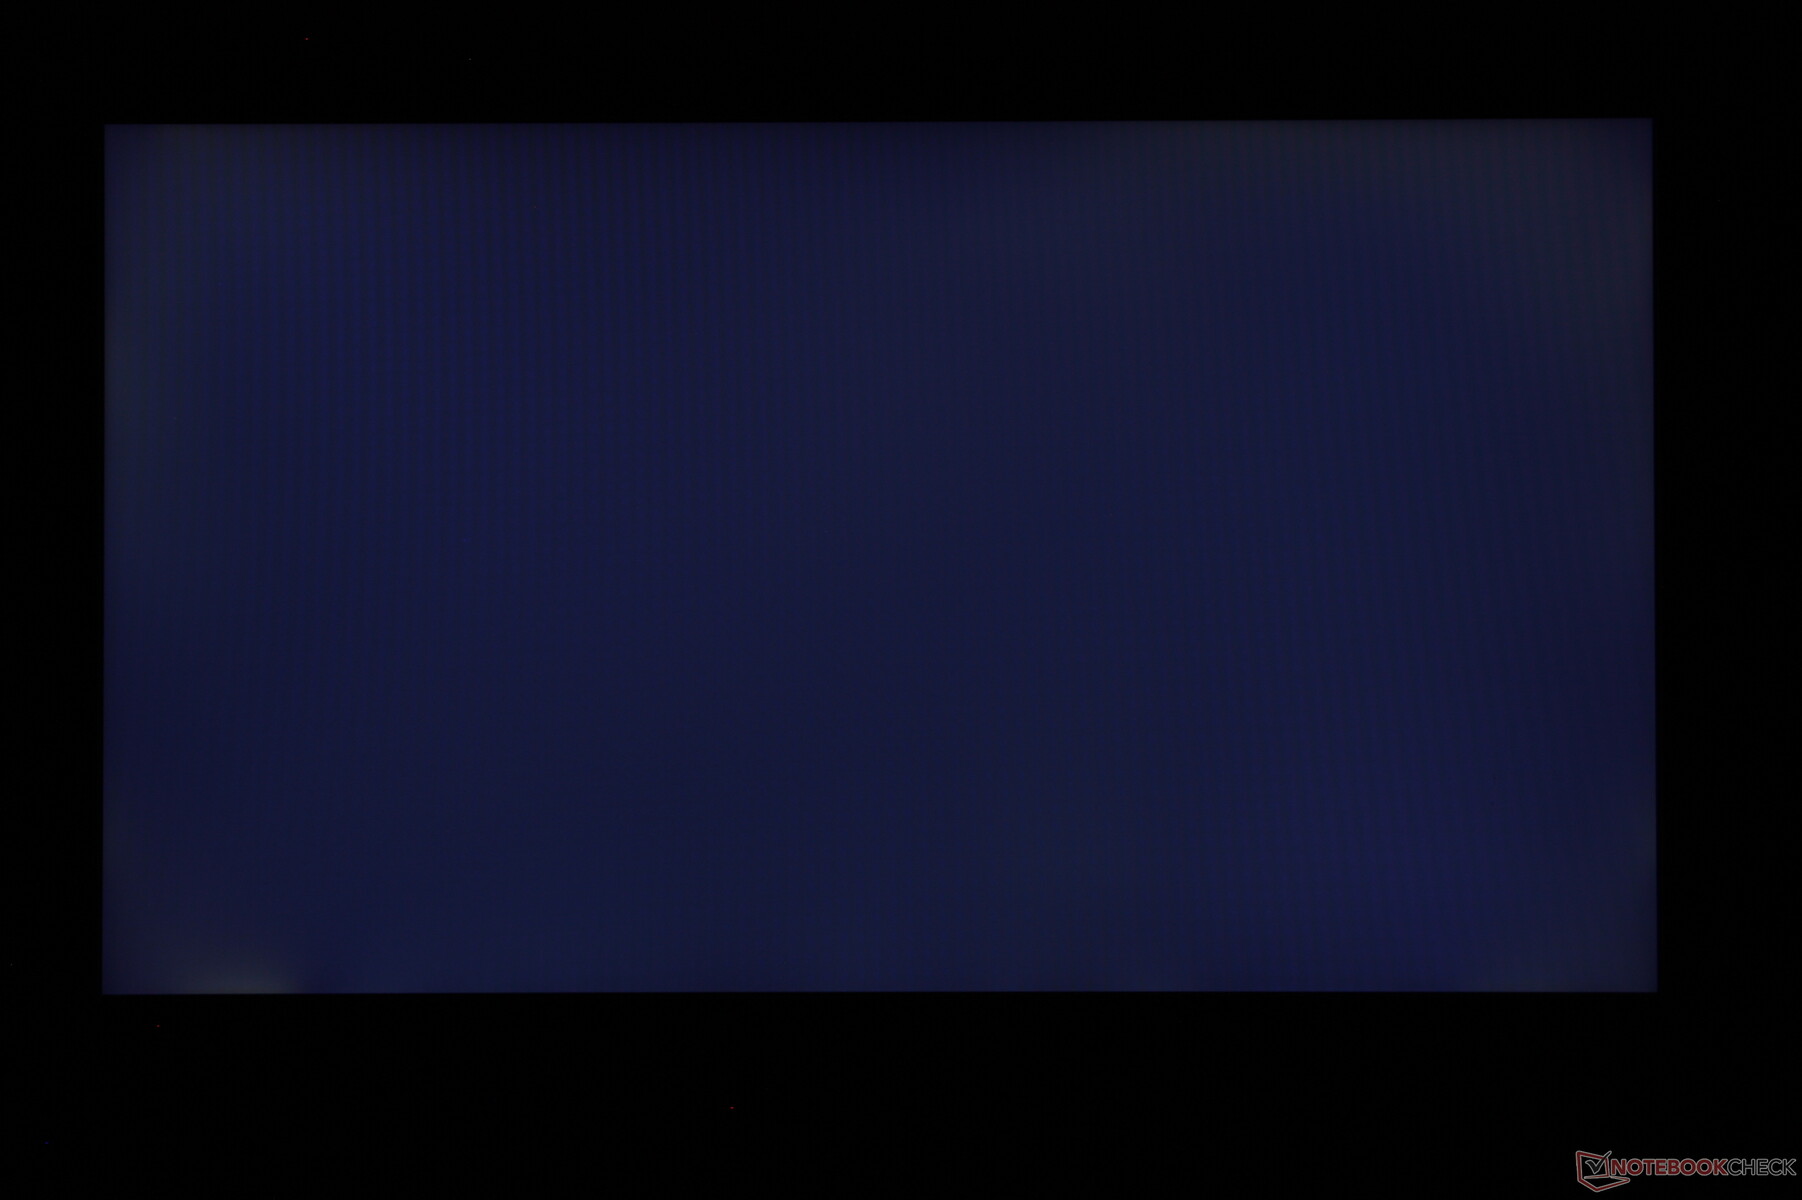
Screen Flickering / PWM (Pulse-Width Modulation)
| Screen flickering / PWM waargenomen | 23580 Hz | ≤ 29 % helderheid instelling | 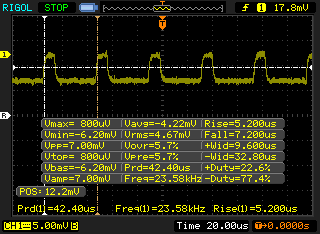 |
De achtergrondverlichting van het scherm flikkert op 23580 Hz (in het slechtste geval, bijvoorbeeld bij gebruik van PWM) aan een helderheid van 29 % en lager. Boven deze helderheid zou er geen flickering / PWM mogen optreden. De frequentie van 23580 Hz is redelijk hoog en de meeste mensen die gevoelig zijn aan flickering zouden dit dus niet mogen waarnemen of geïrriteerde ogen krijgen. Ter vergelijking: 52 % van alle geteste toestellen maakten geen gebruik van PWM om de schermhelderheid te verlagen. Als het wel werd gebruikt, werd een gemiddelde van 7784 (minimum: 5 - maximum: 343500) Hz waargenomen. | |||
Prestaties
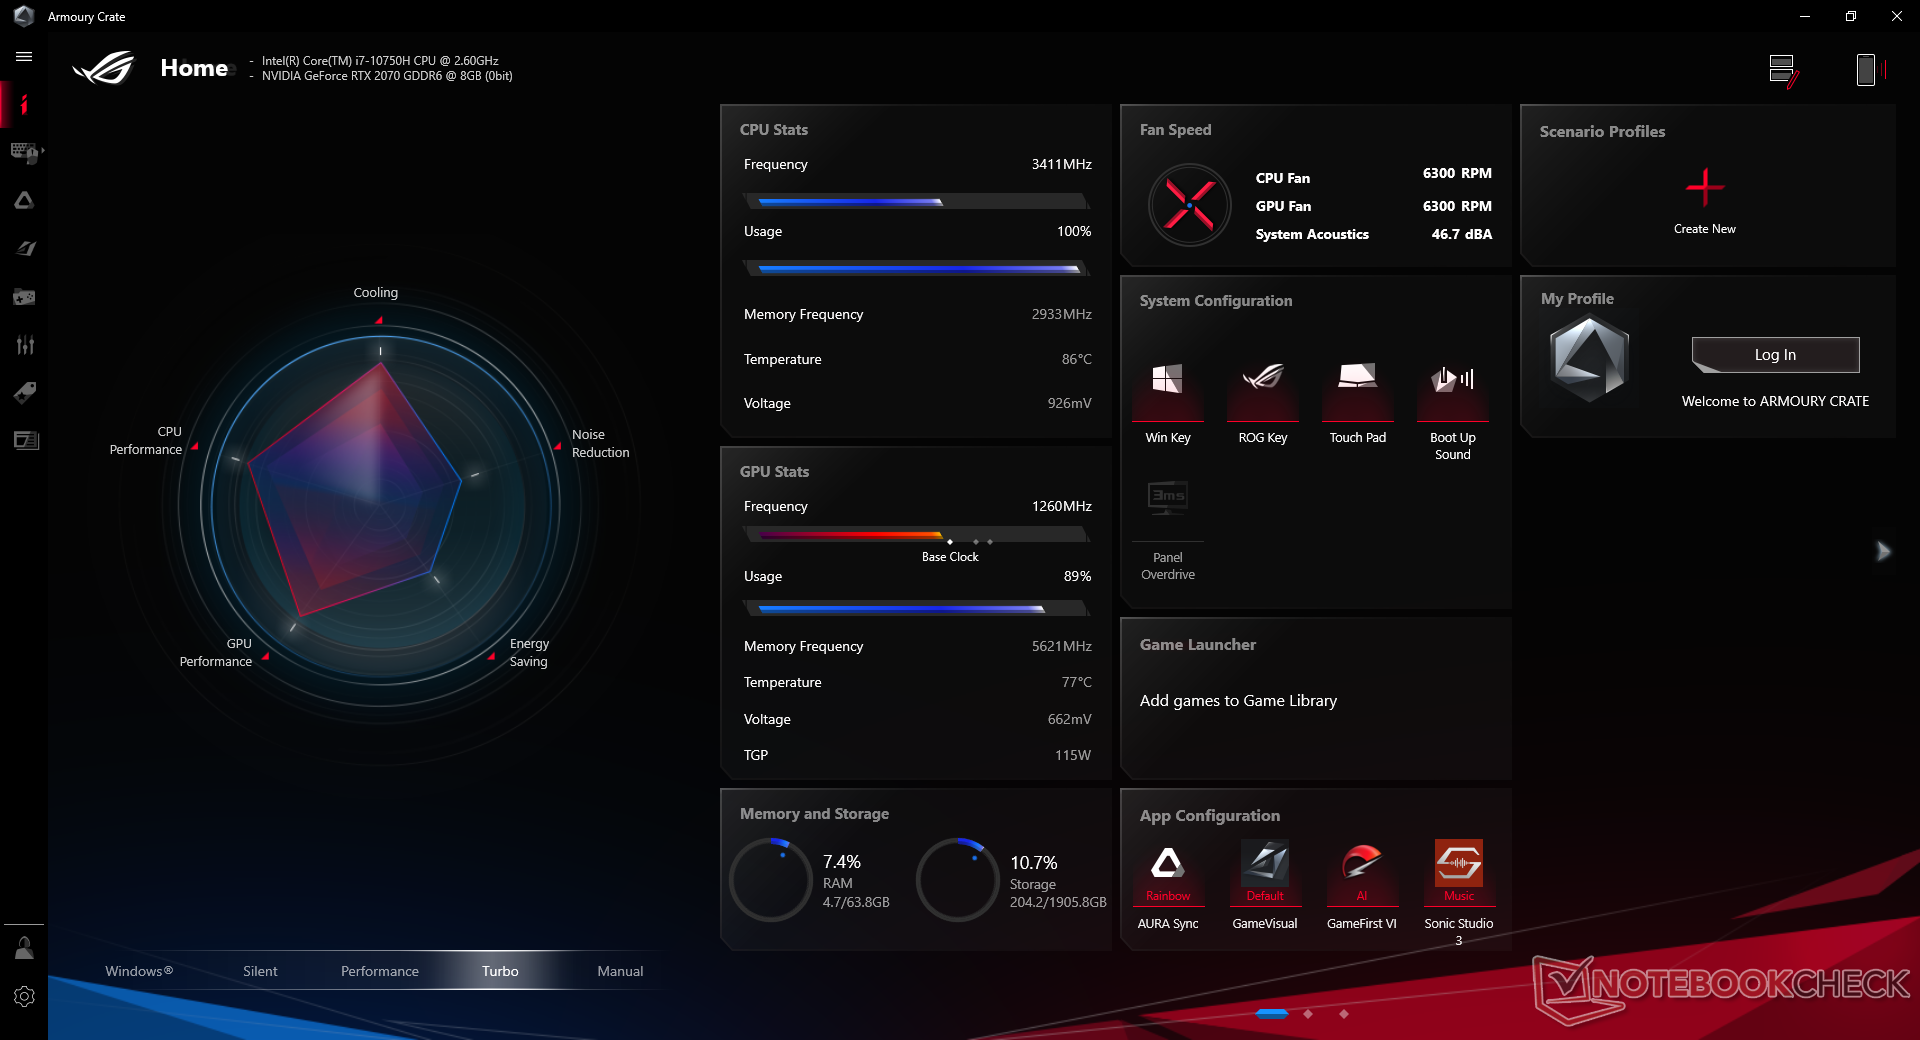
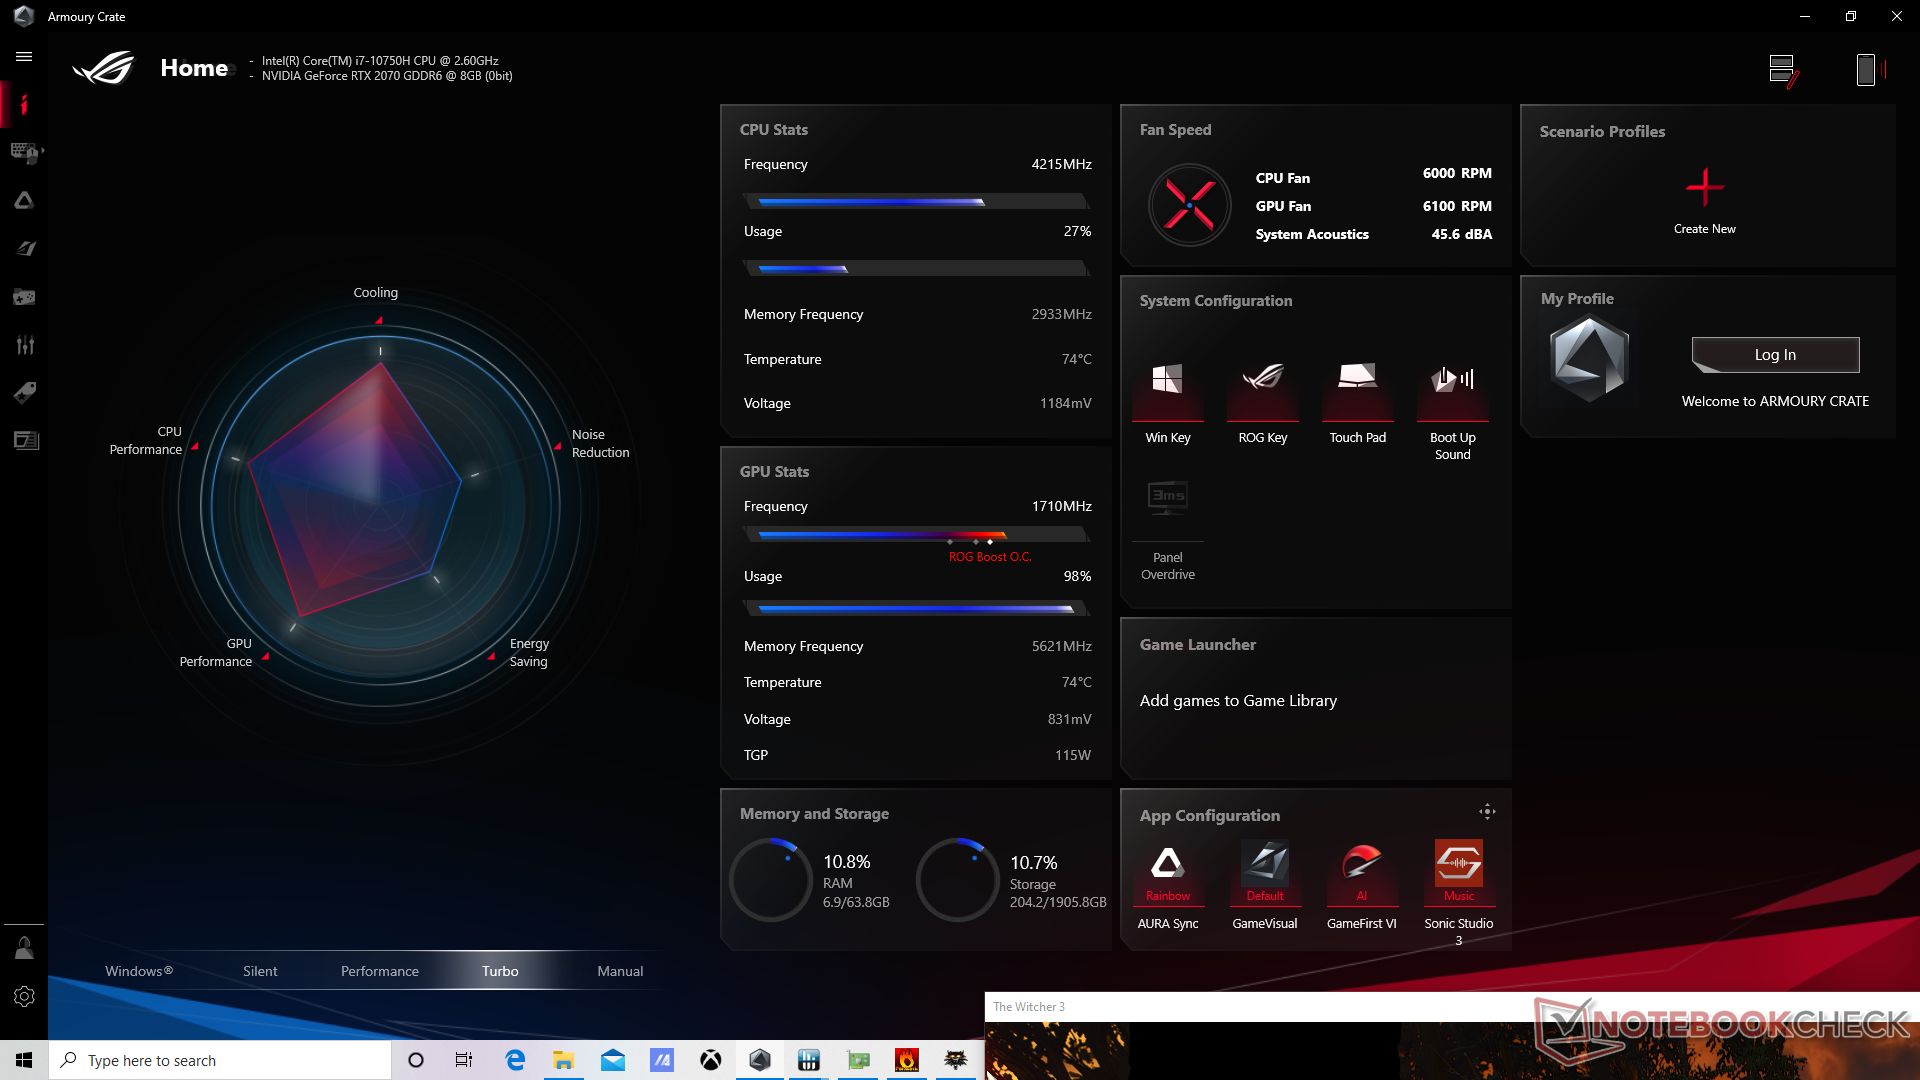
Alle onderstaande benchmarks zijn uitgevoerd op Asus Turbo mode. Wij raden eigenaren aan om vertrouwd te raken met Armoury Crate, omdat de vermogensprofielen direct aan deze software zijn gekoppeld.
Verwerker
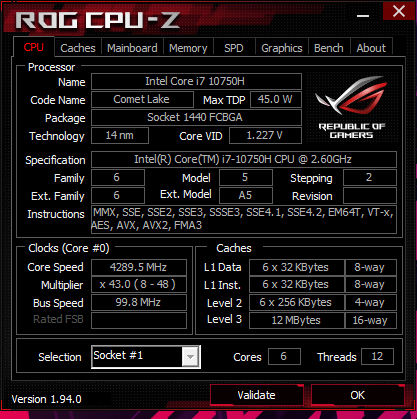
Multi-thread CPU prestaties zijn ongeveer 5 tot 10 procent sneller dan de gemiddelde laptop in onze database die is uitgerust met dezelfde Core i7-10750H CPU. De duurzaamheid van de prestaties is uitstekend en zelfs iets beter dan de G512LI, zoals blijkt uit onze CineBench R15 xT-lus test hieronder.
Cinebench R15: CPU Multi 64Bit | CPU Single 64Bit
Blender: v2.79 BMW27 CPU
7-Zip 18.03: 7z b 4 -mmt1 | 7z b 4
Geekbench 5.5: Single-Core | Multi-Core
HWBOT x265 Benchmark v2.2: 4k Preset
LibreOffice : 20 Documents To PDF
R Benchmark 2.5: Overall mean
| Cinebench R20 / CPU (Multi Core) | |
| MSI Bravo 15 A4DCR | |
| Asus Zephyrus S15 GX502L | |
| Asus ROG Strix Scar 15 G532LWS | |
| Asus ROG Zephyrus G15 GA502IU-ES76 | |
| Eurocom Nightsky RX15 | |
| MSI GE65 Raider 9SF-049US | |
| Asus ROG Strix G15 G512LW | |
| Acer Nitro 5 AN515-44-R5FT | |
| Asus ROG Strix G15 G512LI | |
| Gemiddeld Intel Core i7-10750H (1749 - 3325, n=43) | |
| Maingear Vector 15 | |
| MSI GE63 Raider 8SG | |
| Gateway Creator Series 15.6 GWTN156-3BK | |
| Cinebench R20 / CPU (Single Core) | |
| Asus ROG Strix Scar 15 G532LWS | |
| Asus ROG Zephyrus G15 GA502IU-ES76 | |
| Asus ROG Strix G15 G512LW | |
| Eurocom Nightsky RX15 | |
| MSI Bravo 15 A4DCR | |
| MSI GE65 Raider 9SF-049US | |
| Gemiddeld Intel Core i7-10750H (431 - 504, n=43) | |
| Asus Zephyrus S15 GX502L | |
| Asus ROG Strix G15 G512LI | |
| Gateway Creator Series 15.6 GWTN156-3BK | |
| Maingear Vector 15 | |
| Acer Nitro 5 AN515-44-R5FT | |
| MSI GE63 Raider 8SG | |
| Cinebench R15 / CPU Multi 64Bit | |
| Eurocom Nightsky RX15 | |
| MSI Bravo 15 A4DCR | |
| Asus ROG Strix Scar 15 G532LWS | |
| Asus Zephyrus S15 GX502L | |
| Asus ROG Zephyrus G15 GA502IU-ES76 | |
| MSI GE65 Raider 9SF-049US | |
| Acer Nitro 5 AN515-44-R5FT | |
| Asus ROG Strix G15 G512LW | |
| Asus ROG Strix G15 G512LI | |
| Maingear Vector 15 | |
| Gemiddeld Intel Core i7-10750H (804 - 1418, n=50) | |
| MSI GE63 Raider 8SG | |
| Gateway Creator Series 15.6 GWTN156-3BK | |
| Cinebench R15 / CPU Single 64Bit | |
| Asus ROG Strix Scar 15 G532LWS | |
| Asus ROG Strix G15 G512LW | |
| Eurocom Nightsky RX15 | |
| MSI GE65 Raider 9SF-049US | |
| Gemiddeld Intel Core i7-10750H (184 - 213, n=45) | |
| Asus ROG Strix G15 G512LI | |
| Asus Zephyrus S15 GX502L | |
| Maingear Vector 15 | |
| MSI Bravo 15 A4DCR | |
| Asus ROG Zephyrus G15 GA502IU-ES76 | |
| Acer Nitro 5 AN515-44-R5FT | |
| Gateway Creator Series 15.6 GWTN156-3BK | |
| MSI GE63 Raider 8SG | |
| Blender / v2.79 BMW27 CPU | |
| Eurocom Nightsky RX15 | |
| Gateway Creator Series 15.6 GWTN156-3BK | |
| Gemiddeld Intel Core i7-10750H (322 - 587, n=43) | |
| Asus ROG Strix G15 G512LI | |
| Acer Nitro 5 AN515-44-R5FT | |
| Asus ROG Strix G15 G512LW | |
| MSI Bravo 15 A4DCR | |
| Asus ROG Zephyrus G15 GA502IU-ES76 | |
| Asus ROG Strix Scar 15 G532LWS | |
| Asus Zephyrus S15 GX502L | |
| 7-Zip 18.03 / 7z b 4 -mmt1 | |
| Asus ROG Strix Scar 15 G532LWS | |
| Eurocom Nightsky RX15 | |
| Asus ROG Strix G15 G512LW | |
| Asus Zephyrus S15 GX502L | |
| Gemiddeld Intel Core i7-10750H (4504 - 5470, n=43) | |
| Asus ROG Strix G15 G512LI | |
| Asus ROG Zephyrus G15 GA502IU-ES76 | |
| MSI Bravo 15 A4DCR | |
| Gateway Creator Series 15.6 GWTN156-3BK | |
| Acer Nitro 5 AN515-44-R5FT | |
| 7-Zip 18.03 / 7z b 4 | |
| Asus ROG Zephyrus G15 GA502IU-ES76 | |
| Asus Zephyrus S15 GX502L | |
| Asus ROG Strix Scar 15 G532LWS | |
| MSI Bravo 15 A4DCR | |
| Eurocom Nightsky RX15 | |
| Asus ROG Strix G15 G512LW | |
| Acer Nitro 5 AN515-44-R5FT | |
| Asus ROG Strix G15 G512LI | |
| Gemiddeld Intel Core i7-10750H (26040 - 37345, n=43) | |
| Gateway Creator Series 15.6 GWTN156-3BK | |
| Geekbench 5.5 / Single-Core | |
| Asus ROG Strix Scar 15 G532LWS | |
| Asus ROG Strix G15 G512LW | |
| Gemiddeld Intel Core i7-10750H (1114 - 1333, n=43) | |
| Asus Zephyrus S15 GX502L | |
| Asus ROG Zephyrus G15 GA502IU-ES76 | |
| MSI Bravo 15 A4DCR | |
| Asus ROG Strix G15 G512LI | |
| Acer Nitro 5 AN515-44-R5FT | |
| Gateway Creator Series 15.6 GWTN156-3BK | |
| Geekbench 5.5 / Multi-Core | |
| Asus ROG Strix Scar 15 G532LWS | |
| Asus ROG Zephyrus G15 GA502IU-ES76 | |
| Asus Zephyrus S15 GX502L | |
| MSI Bravo 15 A4DCR | |
| Asus ROG Strix G15 G512LW | |
| Asus ROG Strix G15 G512LI | |
| Gemiddeld Intel Core i7-10750H (4443 - 6674, n=43) | |
| Acer Nitro 5 AN515-44-R5FT | |
| Gateway Creator Series 15.6 GWTN156-3BK | |
| HWBOT x265 Benchmark v2.2 / 4k Preset | |
| Asus Zephyrus S15 GX502L | |
| Asus ROG Strix Scar 15 G532LWS | |
| Eurocom Nightsky RX15 | |
| Asus ROG Zephyrus G15 GA502IU-ES76 | |
| MSI Bravo 15 A4DCR | |
| Asus ROG Strix G15 G512LW | |
| Asus ROG Strix G15 G512LI | |
| Gemiddeld Intel Core i7-10750H (5.54 - 11.6, n=43) | |
| Acer Nitro 5 AN515-44-R5FT | |
| Gateway Creator Series 15.6 GWTN156-3BK | |
| LibreOffice / 20 Documents To PDF | |
| MSI Bravo 15 A4DCR | |
| Acer Nitro 5 AN515-44-R5FT | |
| Asus ROG Zephyrus G15 GA502IU-ES76 | |
| Gateway Creator Series 15.6 GWTN156-3BK | |
| Gemiddeld Intel Core i7-10750H (43.1 - 99.2, n=43) | |
| Asus ROG Strix G15 G512LI | |
| Asus ROG Strix Scar 15 G532LWS | |
| Asus Zephyrus S15 GX502L | |
| Asus ROG Strix G15 G512LW | |
| R Benchmark 2.5 / Overall mean | |
| Gateway Creator Series 15.6 GWTN156-3BK | |
| Acer Nitro 5 AN515-44-R5FT | |
| Asus ROG Strix G15 G512LI | |
| Gemiddeld Intel Core i7-10750H (0.578 - 0.708, n=42) | |
| Asus ROG Strix G15 G512LW | |
| MSI Bravo 15 A4DCR | |
| Asus Zephyrus S15 GX502L | |
| Asus ROG Zephyrus G15 GA502IU-ES76 | |
| Asus ROG Strix Scar 15 G532LWS | |
Cinebench R15: CPU Multi 64Bit | CPU Single 64Bit
Blender: v2.79 BMW27 CPU
7-Zip 18.03: 7z b 4 -mmt1 | 7z b 4
Geekbench 5.5: Single-Core | Multi-Core
HWBOT x265 Benchmark v2.2: 4k Preset
LibreOffice : 20 Documents To PDF
R Benchmark 2.5: Overall mean
* ... kleiner is beter
Prestaties van het systeem
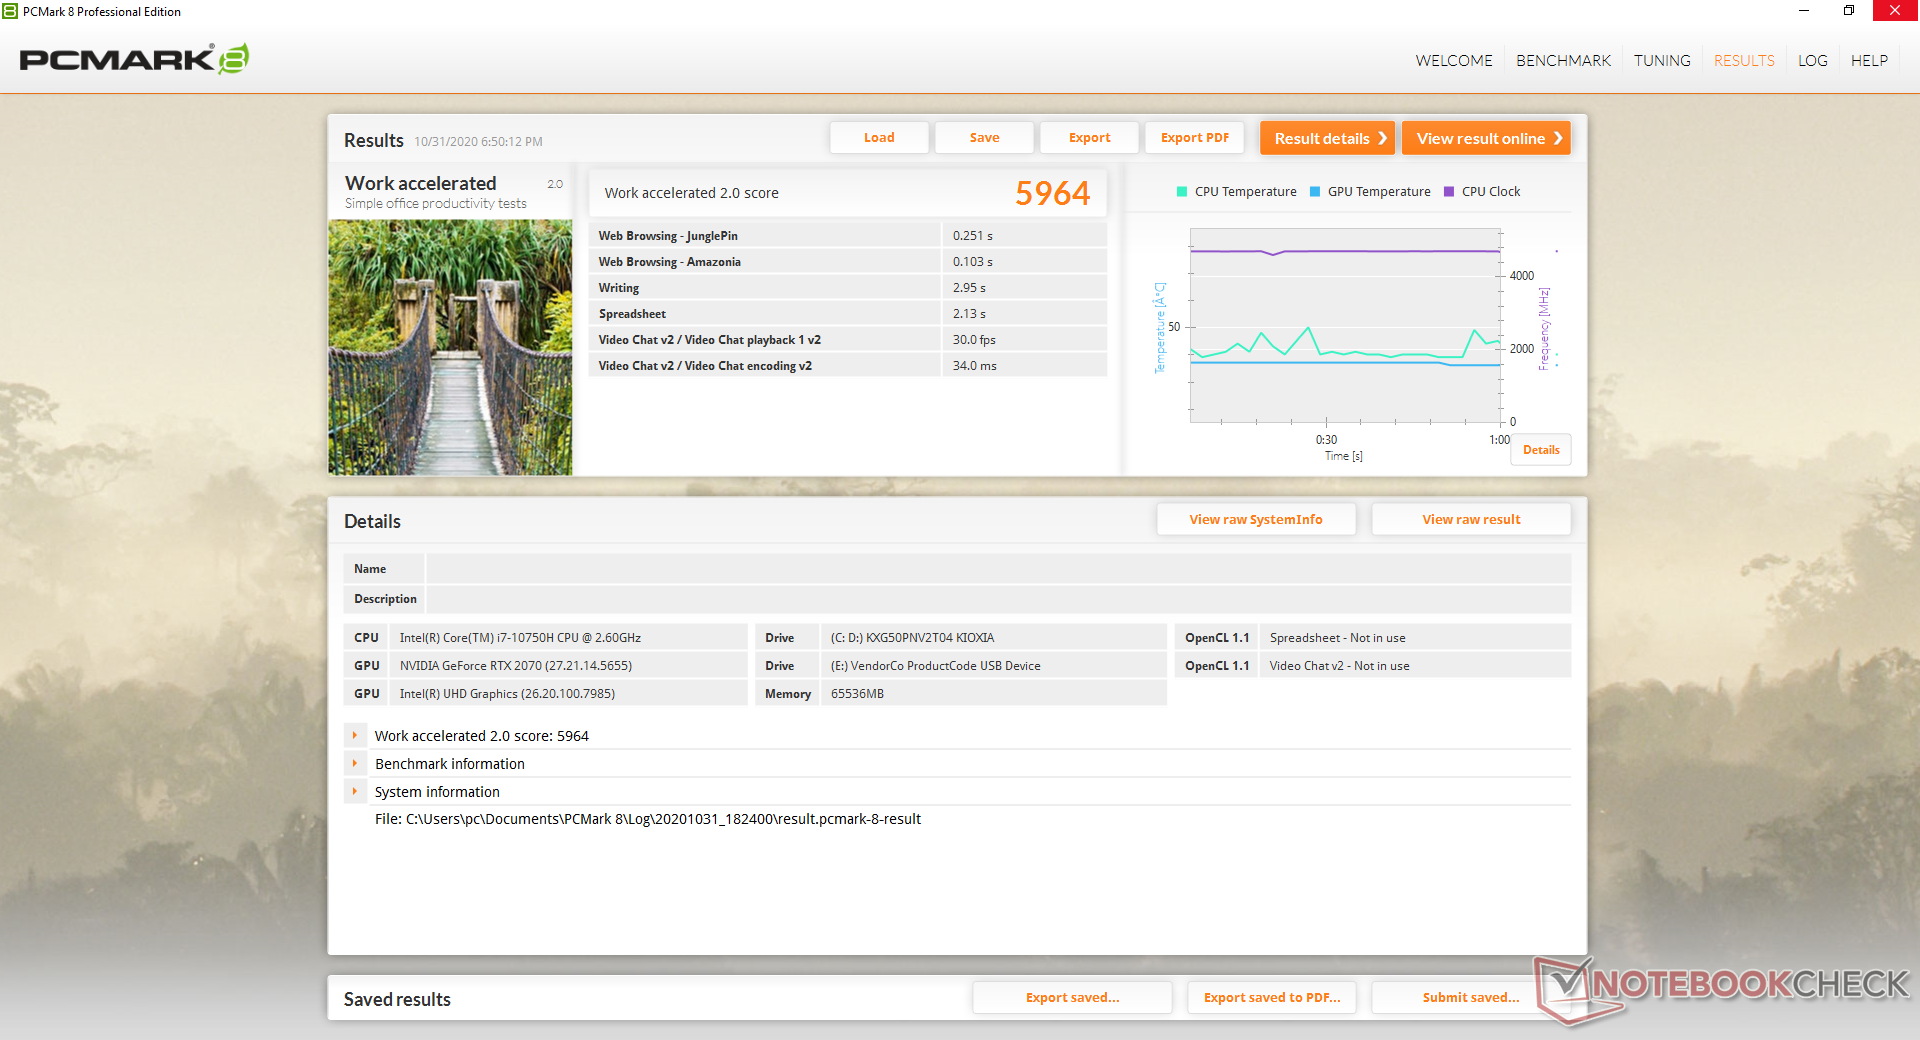
PCMark 10 scores zijn waar we ze verwachten, behalve voor Digital Content Creation waar ons systeem lager scoort dan de G512LI. We vermoeden dat de trage schrijfsnelheid van onze Toshiba M.2 SSD de boosdoener is, aangezien de meeste andere laptops in deze categorie de neiging hebben om met veel snellere opslagschijven te komen. De Samsung PM981a bijvoorbeeld is in dit opzicht bijna drie keer zo snel.
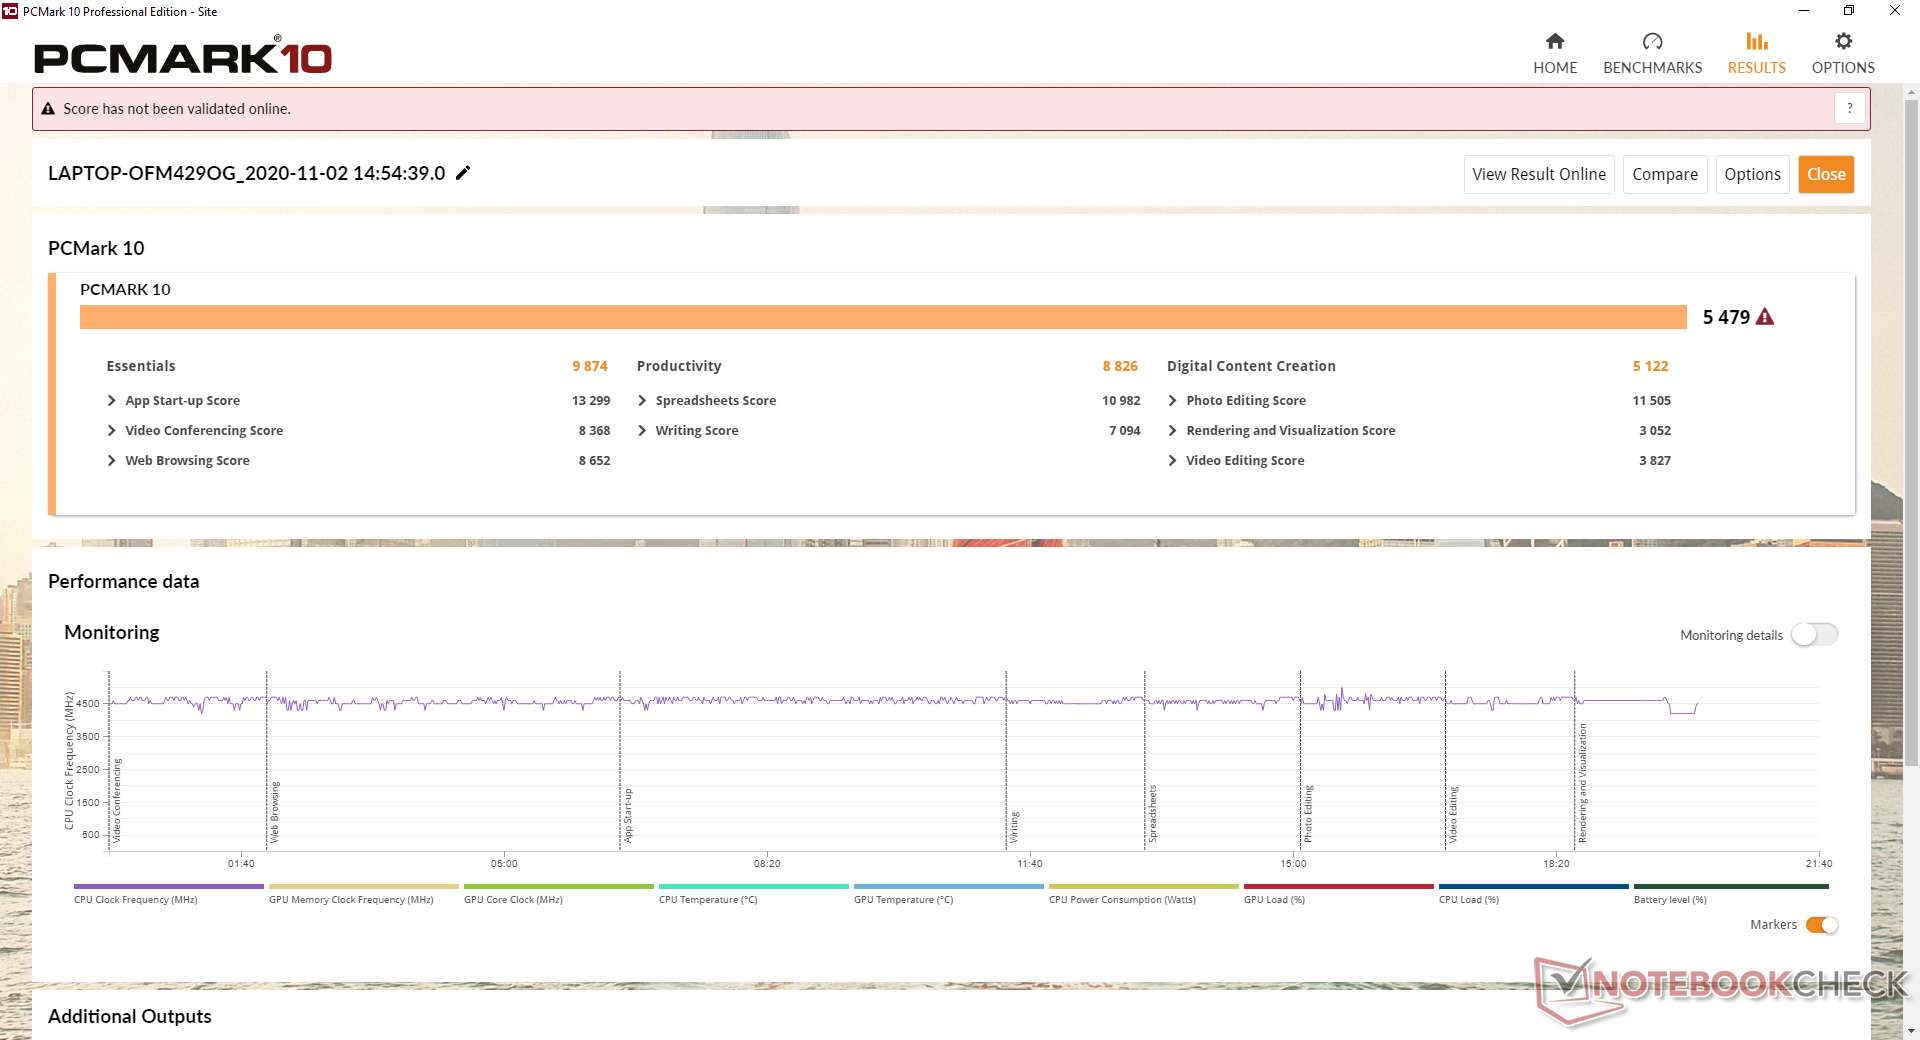
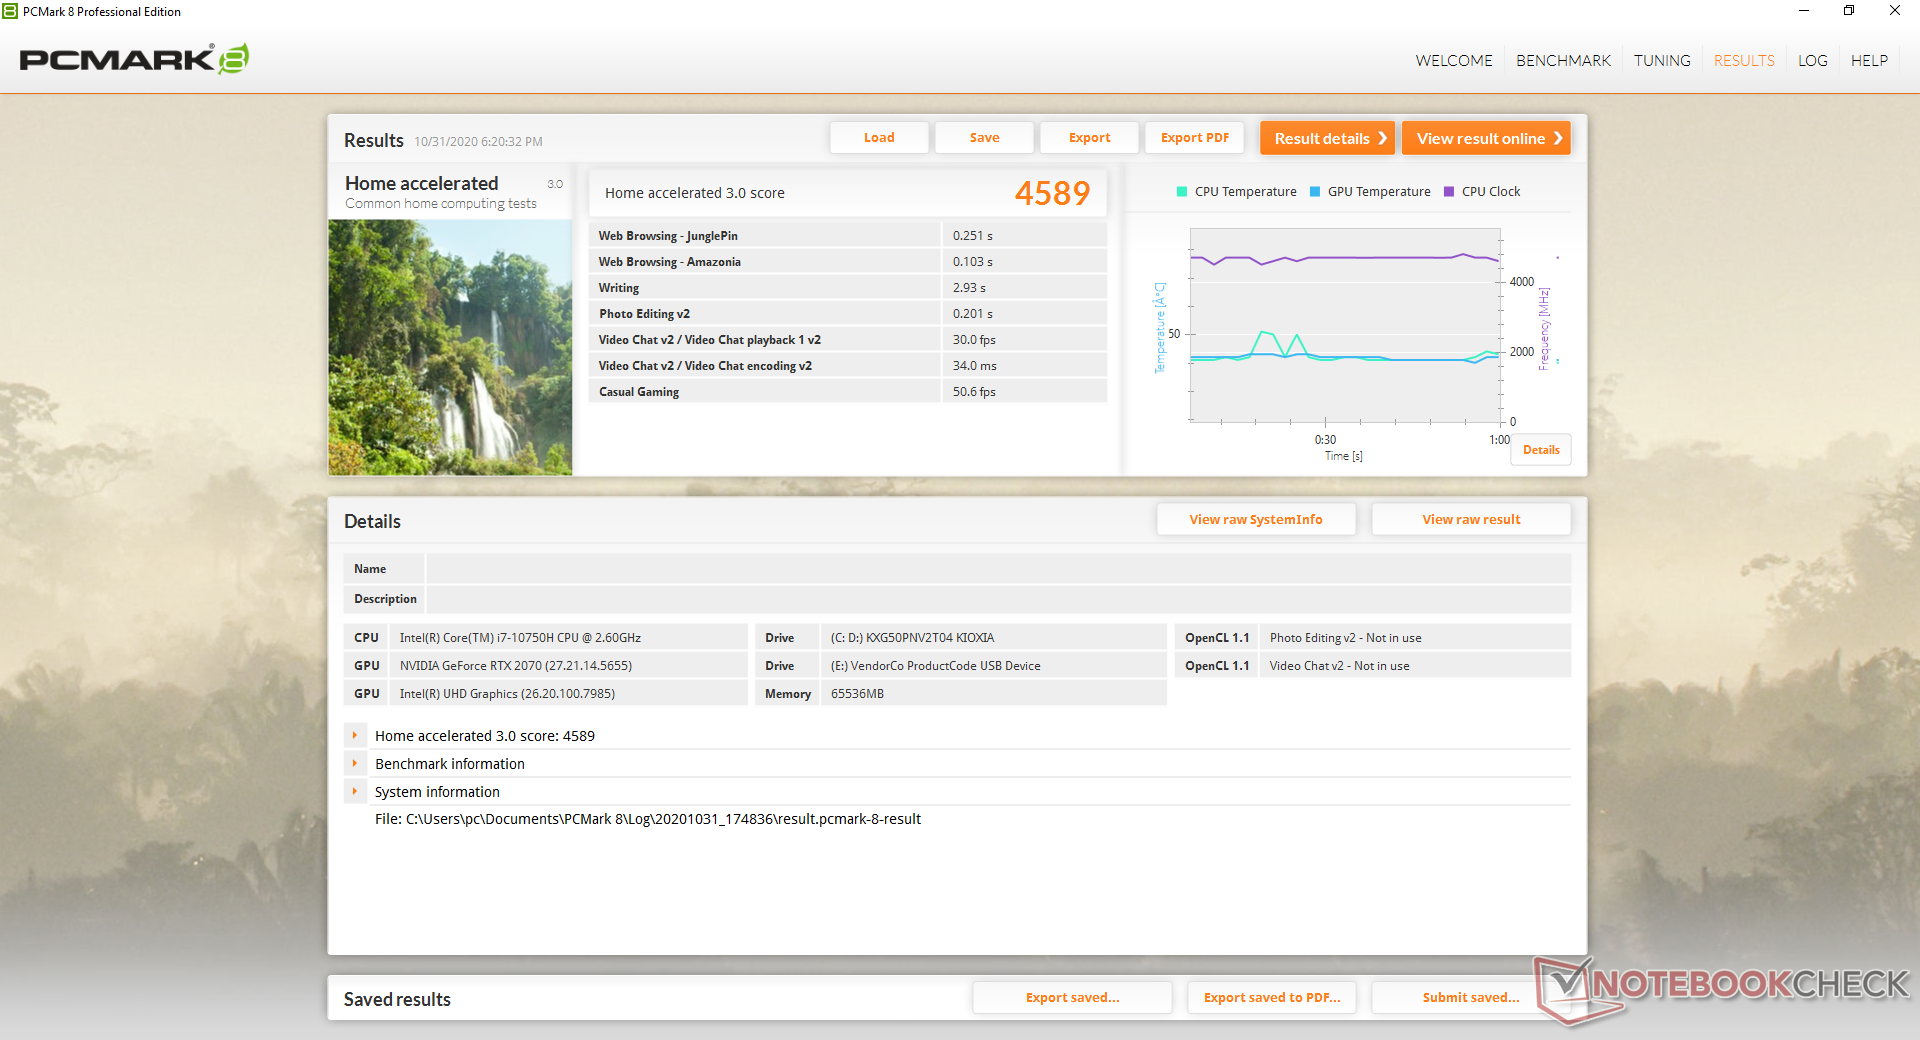
| PCMark 8 Home Score Accelerated v2 | 4589 punten | |
| PCMark 8 Work Score Accelerated v2 | 5964 punten | |
| PCMark 10 Score | 5479 punten | |
Help | ||
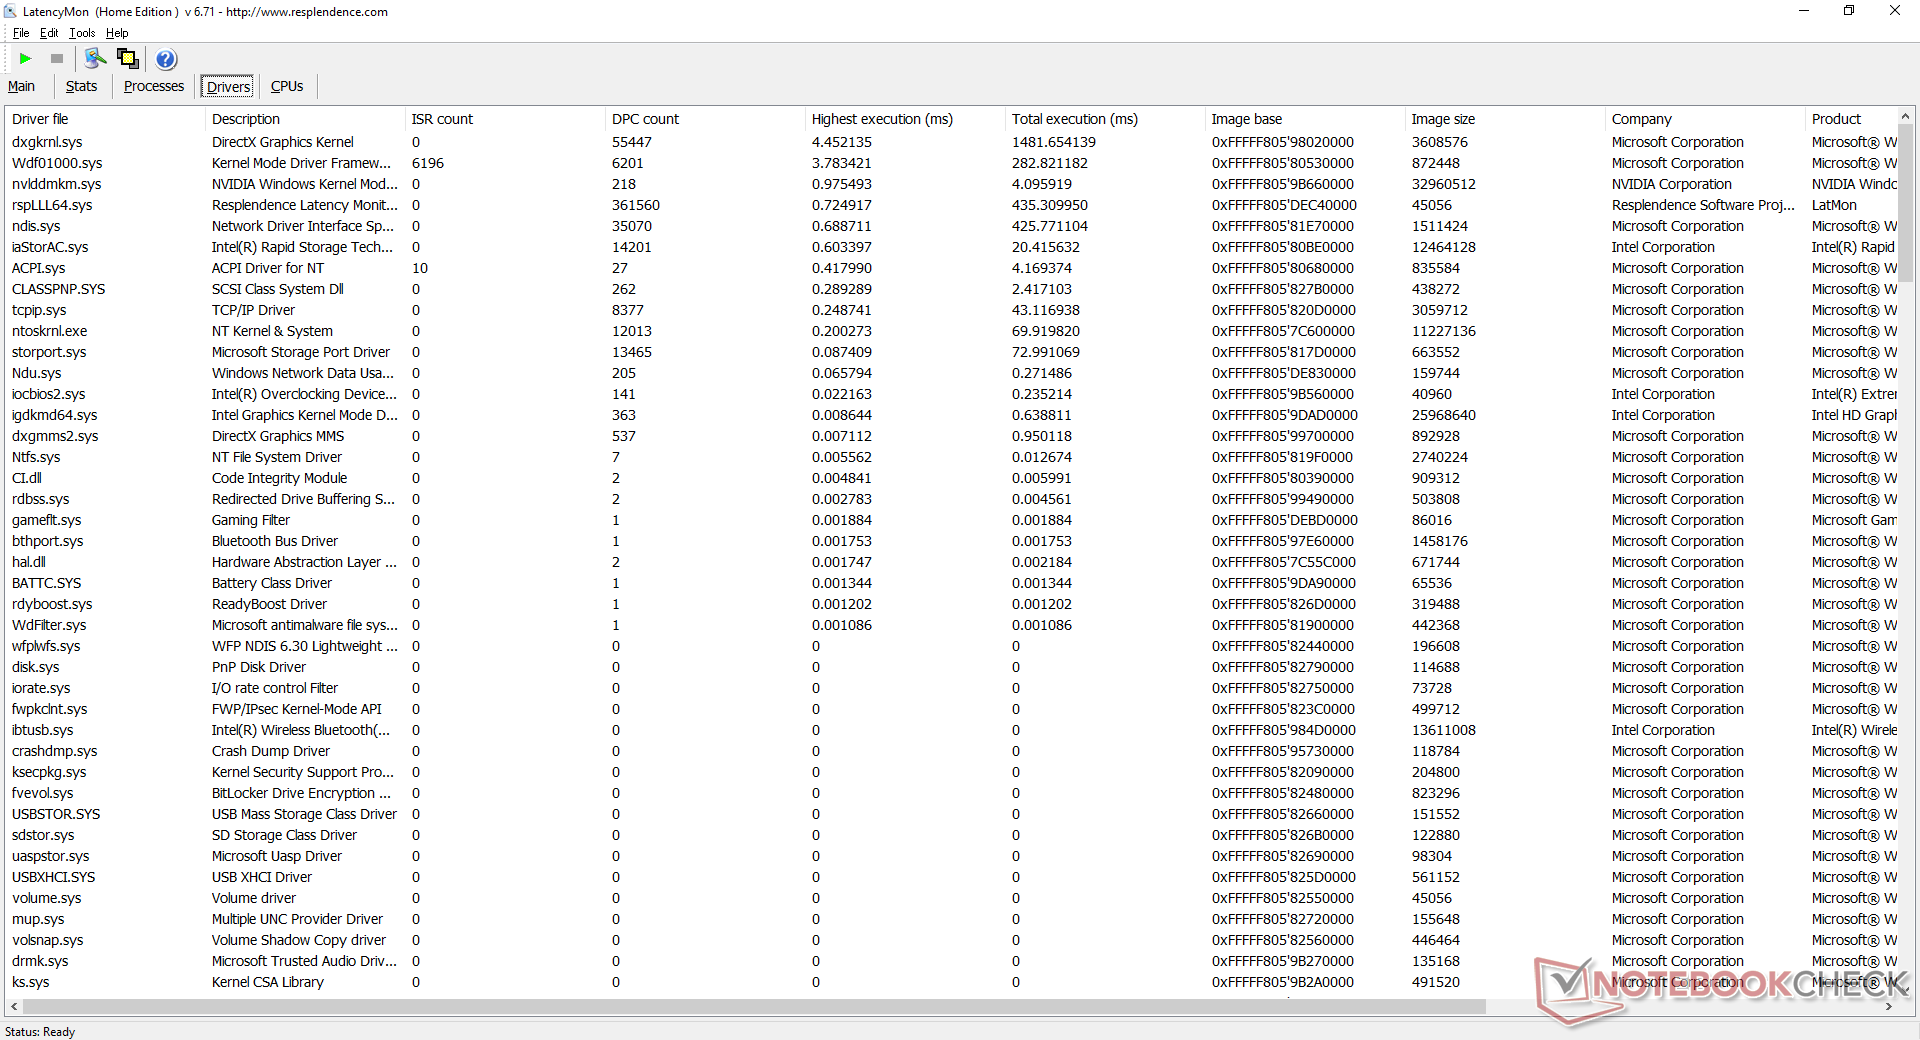
DPC vertraging
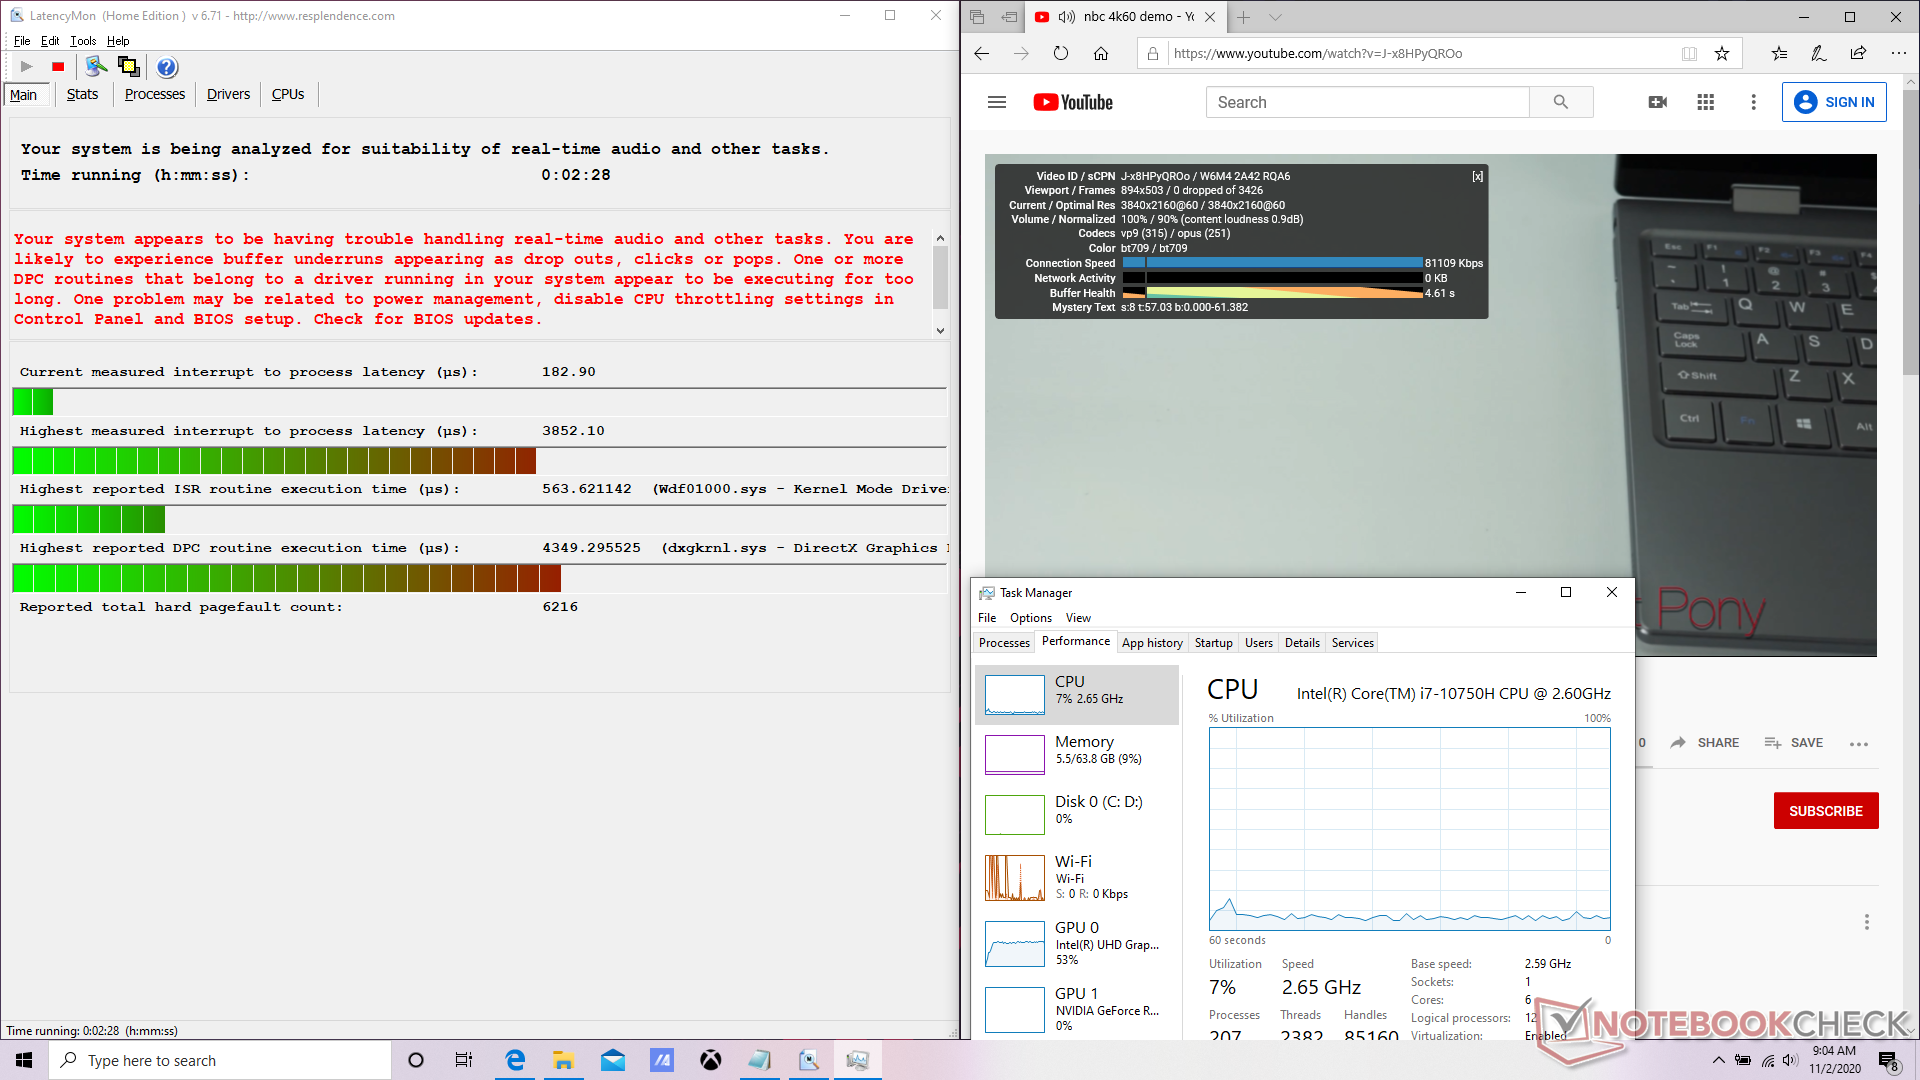
| DPC Latencies / LatencyMon - interrupt to process latency (max), Web, Youtube, Prime95 | |
| Asus ROG Strix G15 G512LW | |
| Razer Blade 15 RTX 2070 Super Max-Q | |
| Asus ROG Strix Scar 15 G532LWS | |
| Asus ROG Strix G15 G512LI | |
| Alienware m15 R3 P87F | |
| MSI GP65 10SFK-047US | |
* ... kleiner is beter
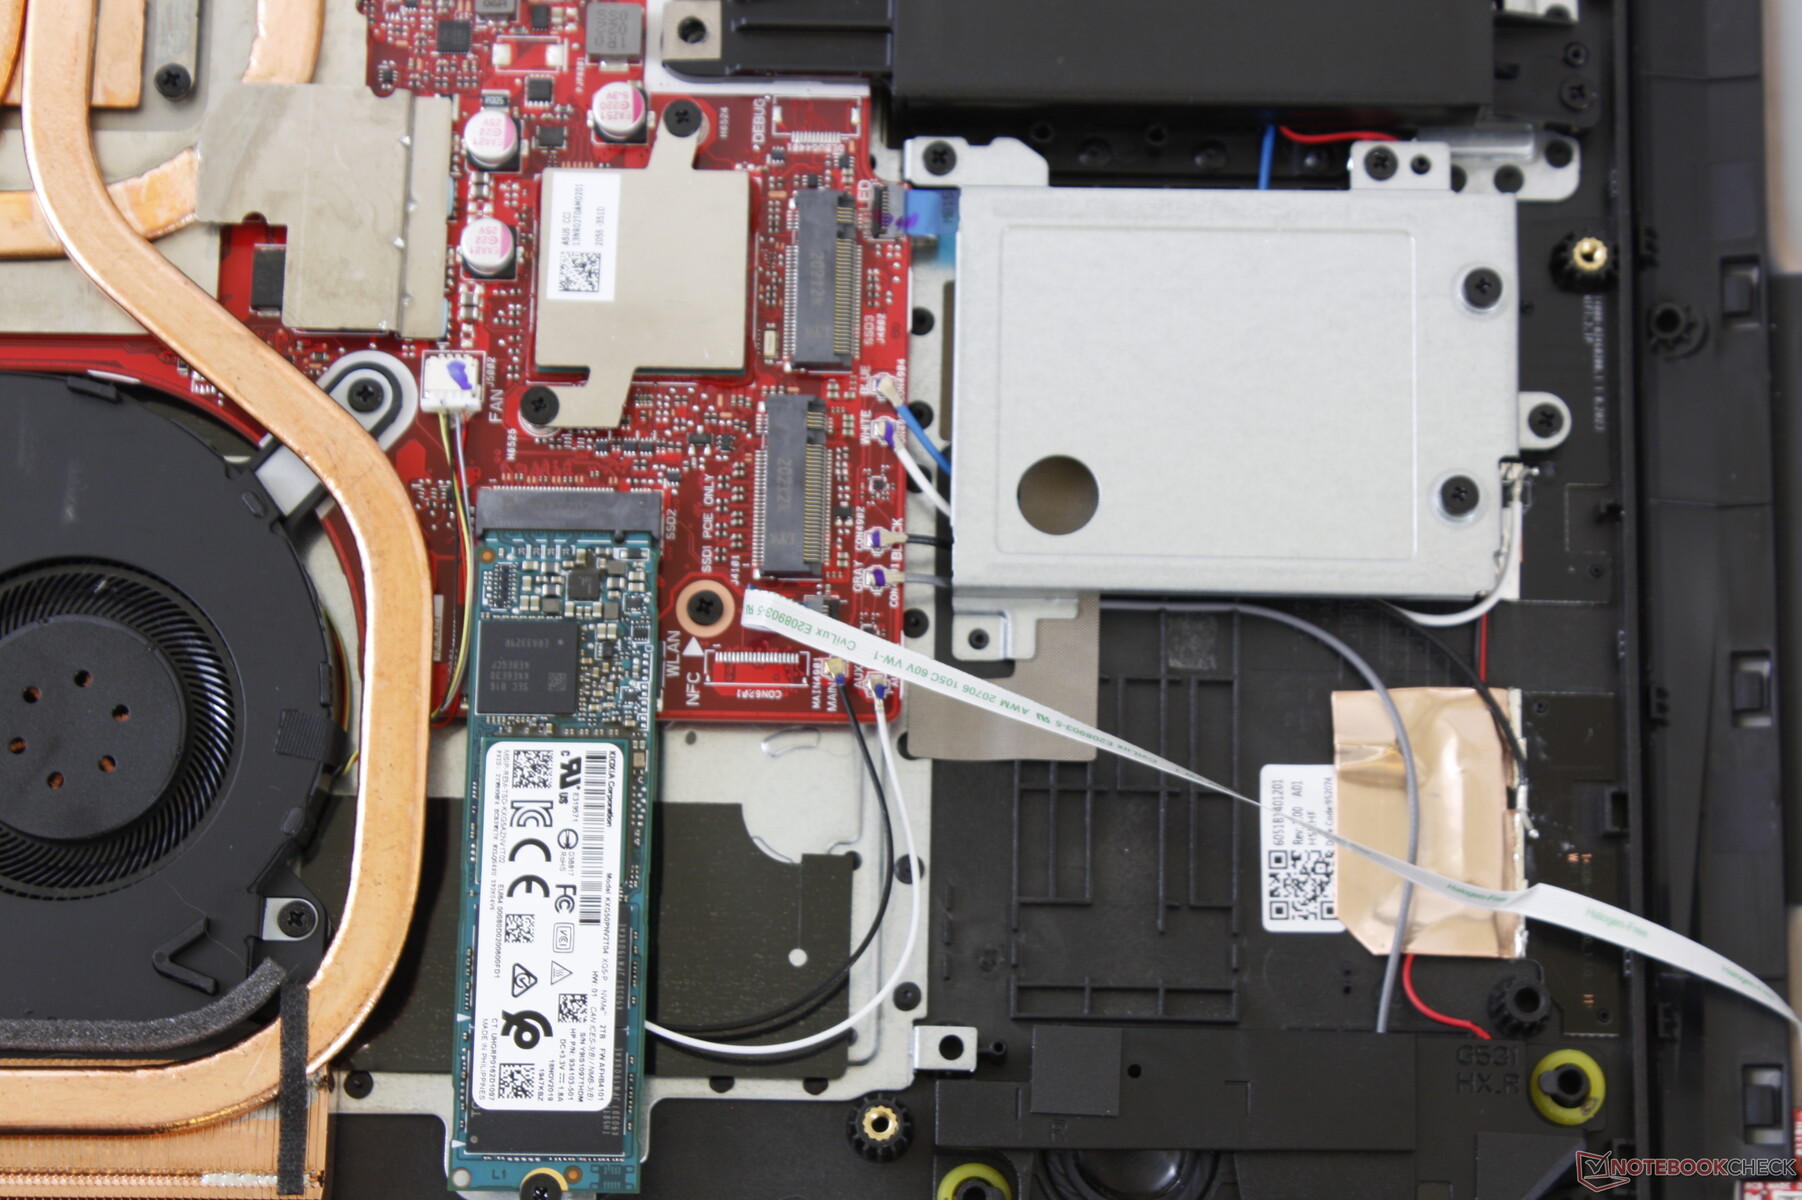
Opslagapparaten
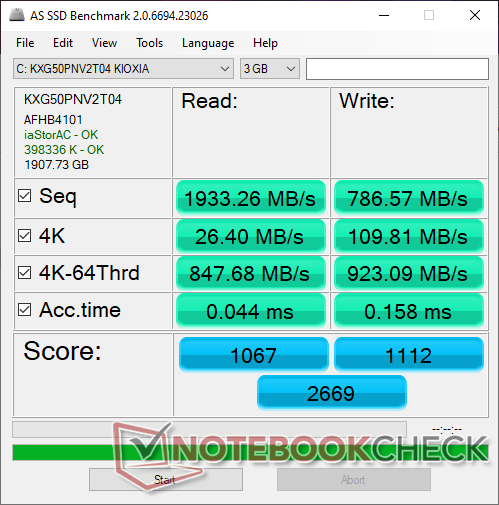
CUKUSA heeft onze unit geconfigureerd met een 2 TB Toshiba XG5-P M.2 NVMe SSD. Hoewel de sequentiële leessnelheden snel zijn, zijn de schrijfsnelheden traag voor een PCIe SSD met slechts ongeveer 790 MB/s volgens AS SSD.
| Asus ROG Strix G15 G512LW Toshiba XG5-P KXG50PNV2T04 | Asus ROG Strix G15 G512LI Intel SSD 660p SSDPEKNW512G8 | Razer Blade 15 RTX 2070 Super Max-Q Samsung SSD PM981a MZVLB512HBJQ | Asus ROG Strix Scar 15 G532LWS 2x Intel SSD 660p 1TB SSDPEKNW010T8 (RAID 0) | Alienware m15 R3 P87F 2x Micron 2200S 512 GB (RAID 0) | |
|---|---|---|---|---|---|
| AS SSD | -24% | 46% | 29% | 14% | |
| Seq Read (MB/s) | 1933 | 1157 -40% | 1957 1% | 1982 3% | 2058 6% |
| Seq Write (MB/s) | 787 | 675 -14% | 2092 166% | 1444 83% | 2316 194% |
| 4K Read (MB/s) | 26.4 | 49.99 89% | 50.2 90% | 50.3 91% | 39.72 50% |
| 4K Write (MB/s) | 109.8 | 114 4% | 96.5 -12% | 120.1 9% | 62.9 -43% |
| 4K-64 Read (MB/s) | 848 | 322.2 -62% | 1594 88% | 1016 20% | 1334 57% |
| 4K-64 Write (MB/s) | 923 | 759 -18% | 2005 117% | 1351 46% | 1271 38% |
| Access Time Read * (ms) | 0.044 | 0.07 -59% | 0.057 -30% | 0.044 -0% | 0.062 -41% |
| Access Time Write * (ms) | 0.158 | 0.137 13% | 0.112 29% | 0.109 31% | 0.388 -146% |
| Score Read (Points) | 1067 | 488 -54% | 1840 72% | 1264 18% | 1580 48% |
| Score Write (Points) | 1112 | 940 -15% | 2310 108% | 1615 45% | 1565 41% |
| Score Total (Points) | 2669 | 1673 -37% | 5103 91% | 3510 32% | 3968 49% |
| Copy ISO MB/s (MB/s) | 3210 | 939 -71% | 1793 -44% | 3474 8% | 1685 -48% |
| Copy Program MB/s (MB/s) | 728 | 489.9 -33% | 573 -21% | 751 3% | 669 -8% |
| Copy Game MB/s (MB/s) | 1499 | 895 -40% | 1418 -5% | 1684 12% | 1493 0% |
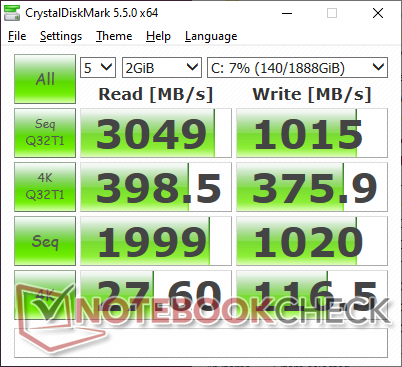
| CrystalDiskMark 5.2 / 6 | 1% | 62% | 51% | 46% | |
| Write 4K (MB/s) | 116.5 | 125.4 8% | 139.8 20% | 128.4 10% | 67.3 -42% |
| Read 4K (MB/s) | 27.6 | 52.7 91% | 48.62 76% | 53.7 95% | 41.47 50% |
| Write Seq (MB/s) | 1020 | 943 -8% | 2260 122% | 1875 84% | 2239 120% |
| Read Seq (MB/s) | 1999 | 1383 -31% | 2135 7% | 2315 16% | 2112 6% |
| Write 4K Q32T1 (MB/s) | 375.9 | 437.9 16% | 499.3 33% | 427.2 14% | 488.9 30% |
| Read 4K Q32T1 (MB/s) | 398.5 | 334.9 -16% | 552 39% | 440.7 11% | 557 40% |
| Write Seq Q32T1 (MB/s) | 1015 | 960 -5% | 2960 192% | 2793 175% | 2654 161% |
| Read Seq Q32T1 (MB/s) | 3049 | 1530 -50% | 3269 7% | 3101 2% | 3137 3% |
| Totaal Gemiddelde (Programma / Instellingen) | -12% /
-15% | 54% /
52% | 40% /
37% | 30% /
26% |
* ... kleiner is beter

Disk Throttling: DiskSpd Read Loop, Queue Depth 8
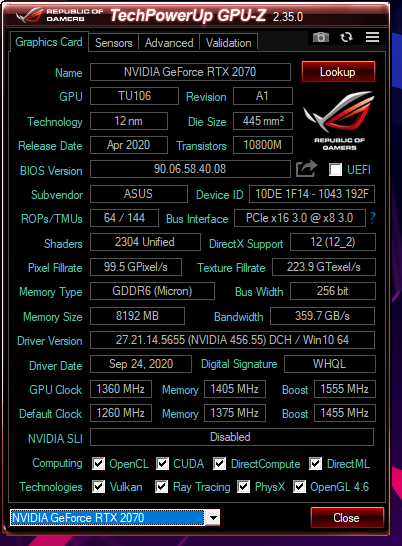
GPU-prestaties
De grafische prestaties liggen binnen enkele procentpunten van de gemiddelde mobiele GeForce RTX 2070 in onze database. Een volwaardige desktop GeForce RTX 2070 is volgens 3DMark benchmarks ongeveer 10 tot 20 procent sneller. Door de G512LW te kiezen boven de GTX 1650 Ti-aangedreven G512LI zullen de gebruikers ongeveer twee keer zoveel grafische paardenkracht hebben.
Merk op dat de grafische prestaties iets sneller zijn in de modus Turbo (7826 punten in de modus Time Spy graphics) versus de modus Performance (7543 punten).
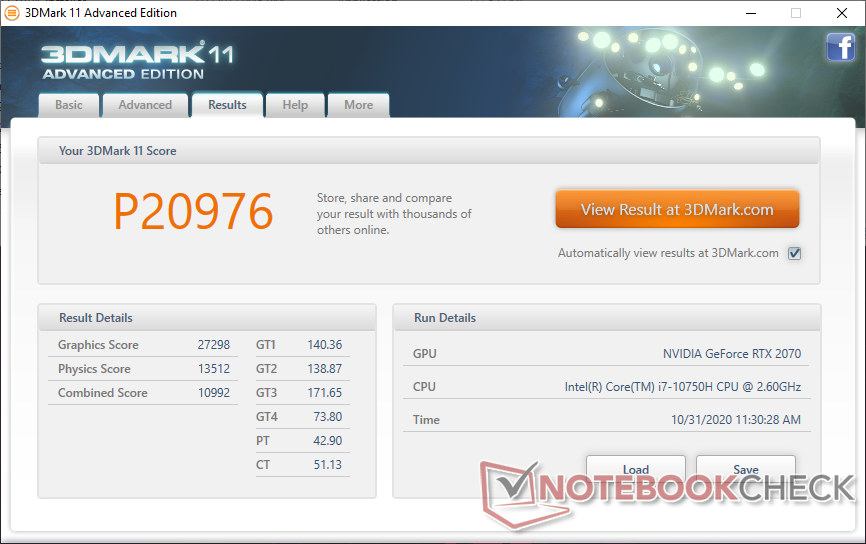
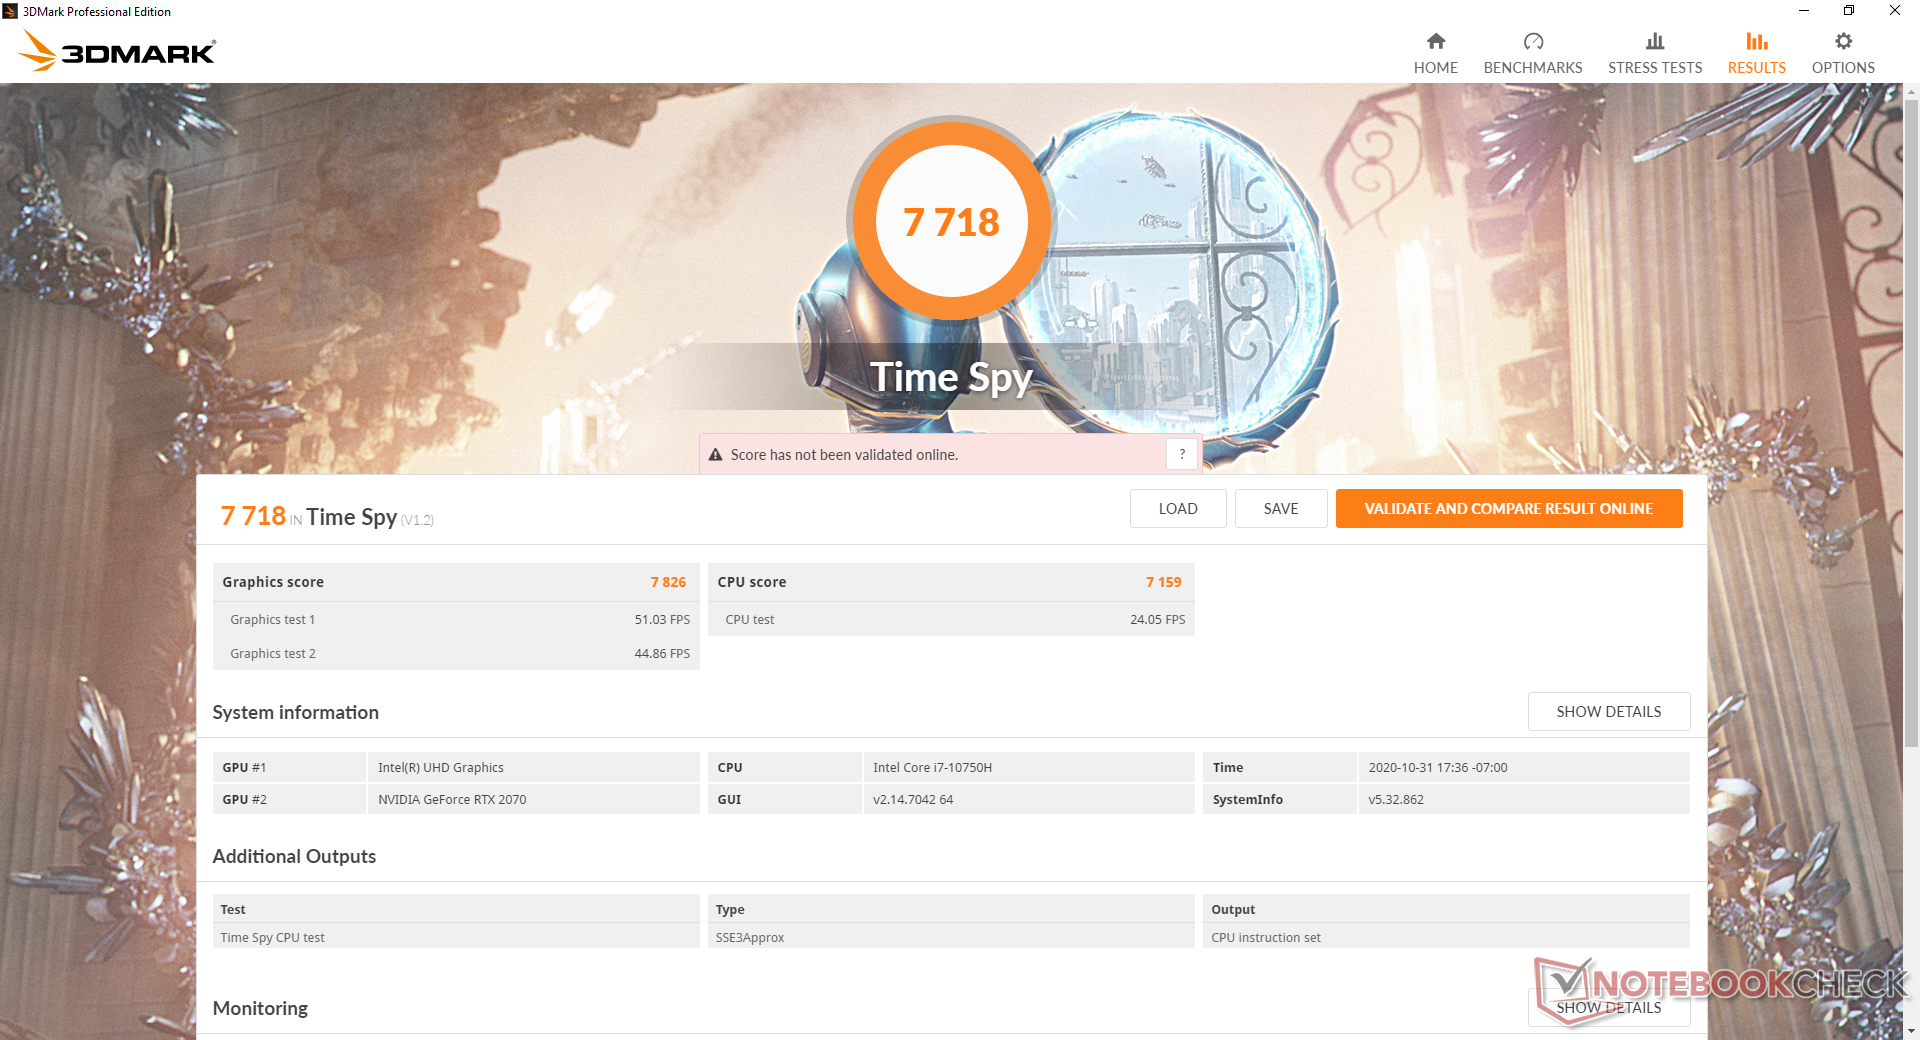

| 3DMark 11 Performance | 20976 punten | |
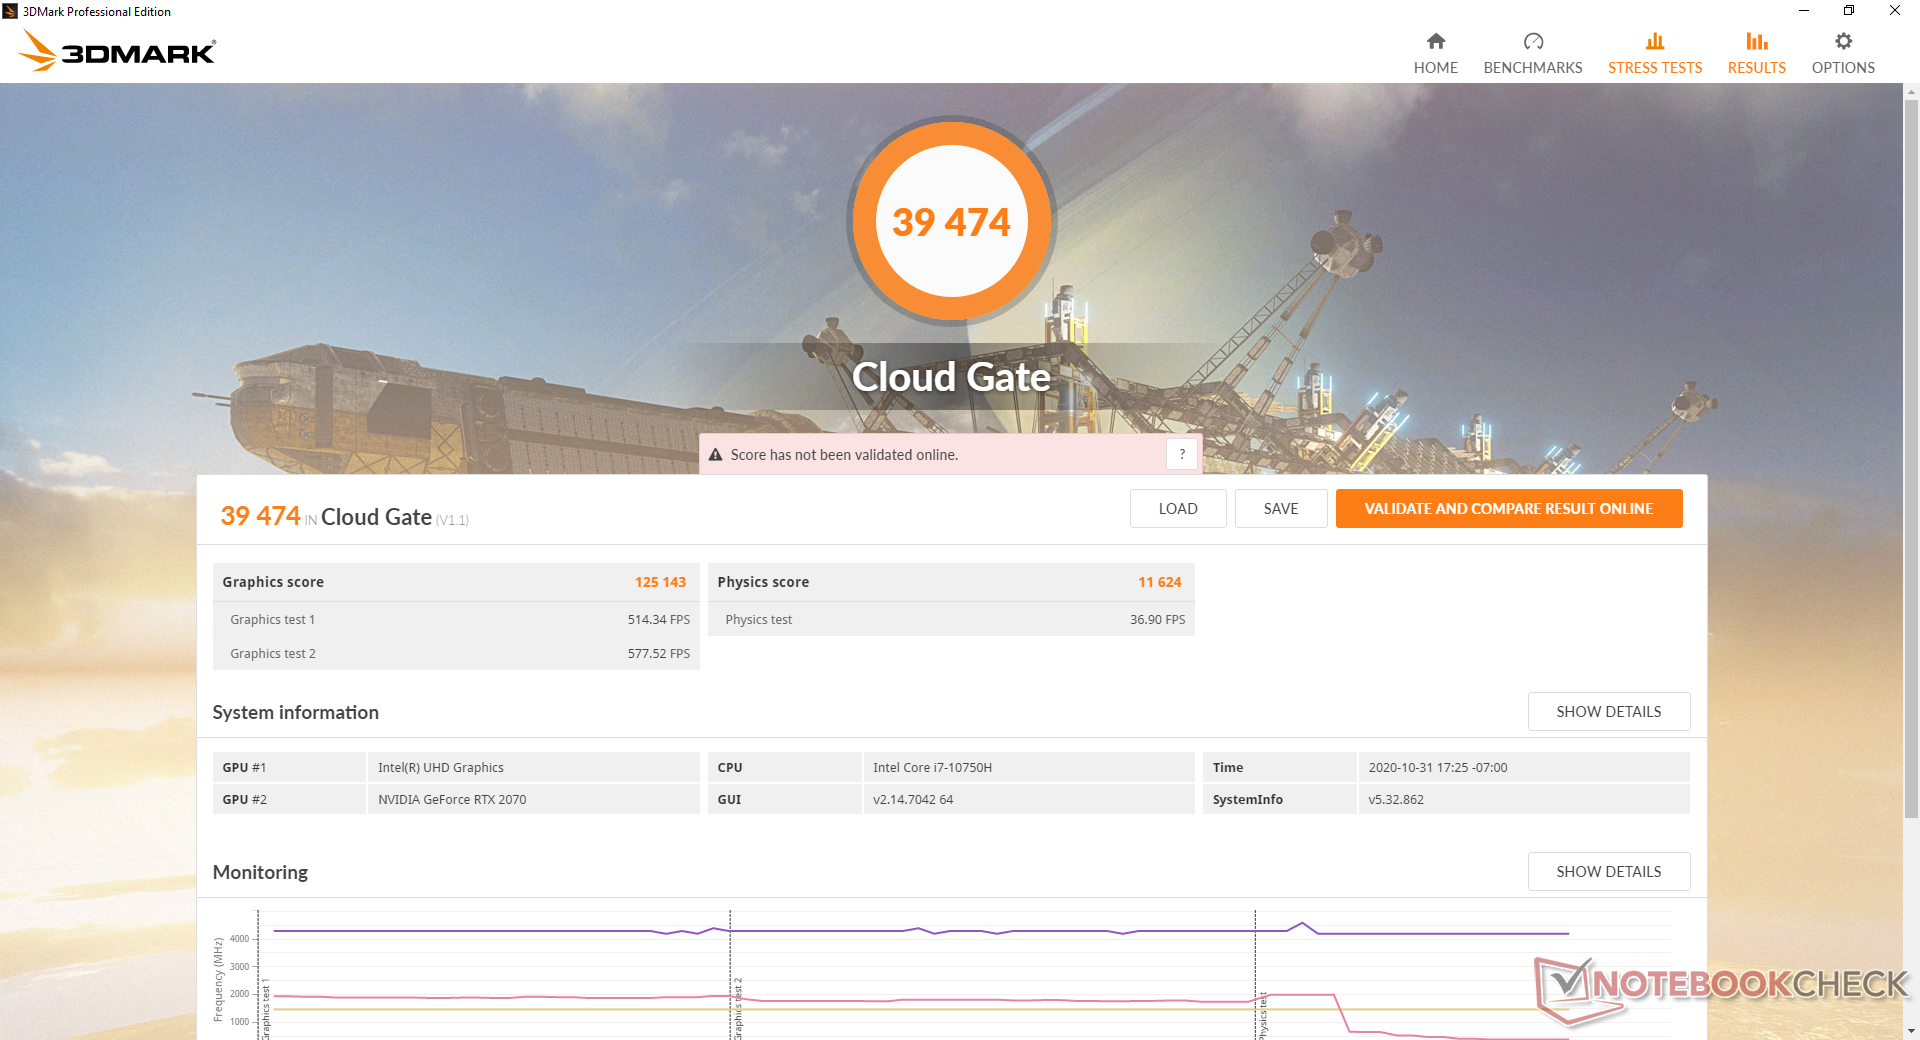
| 3DMark Cloud Gate Standard Score | 39474 punten | |
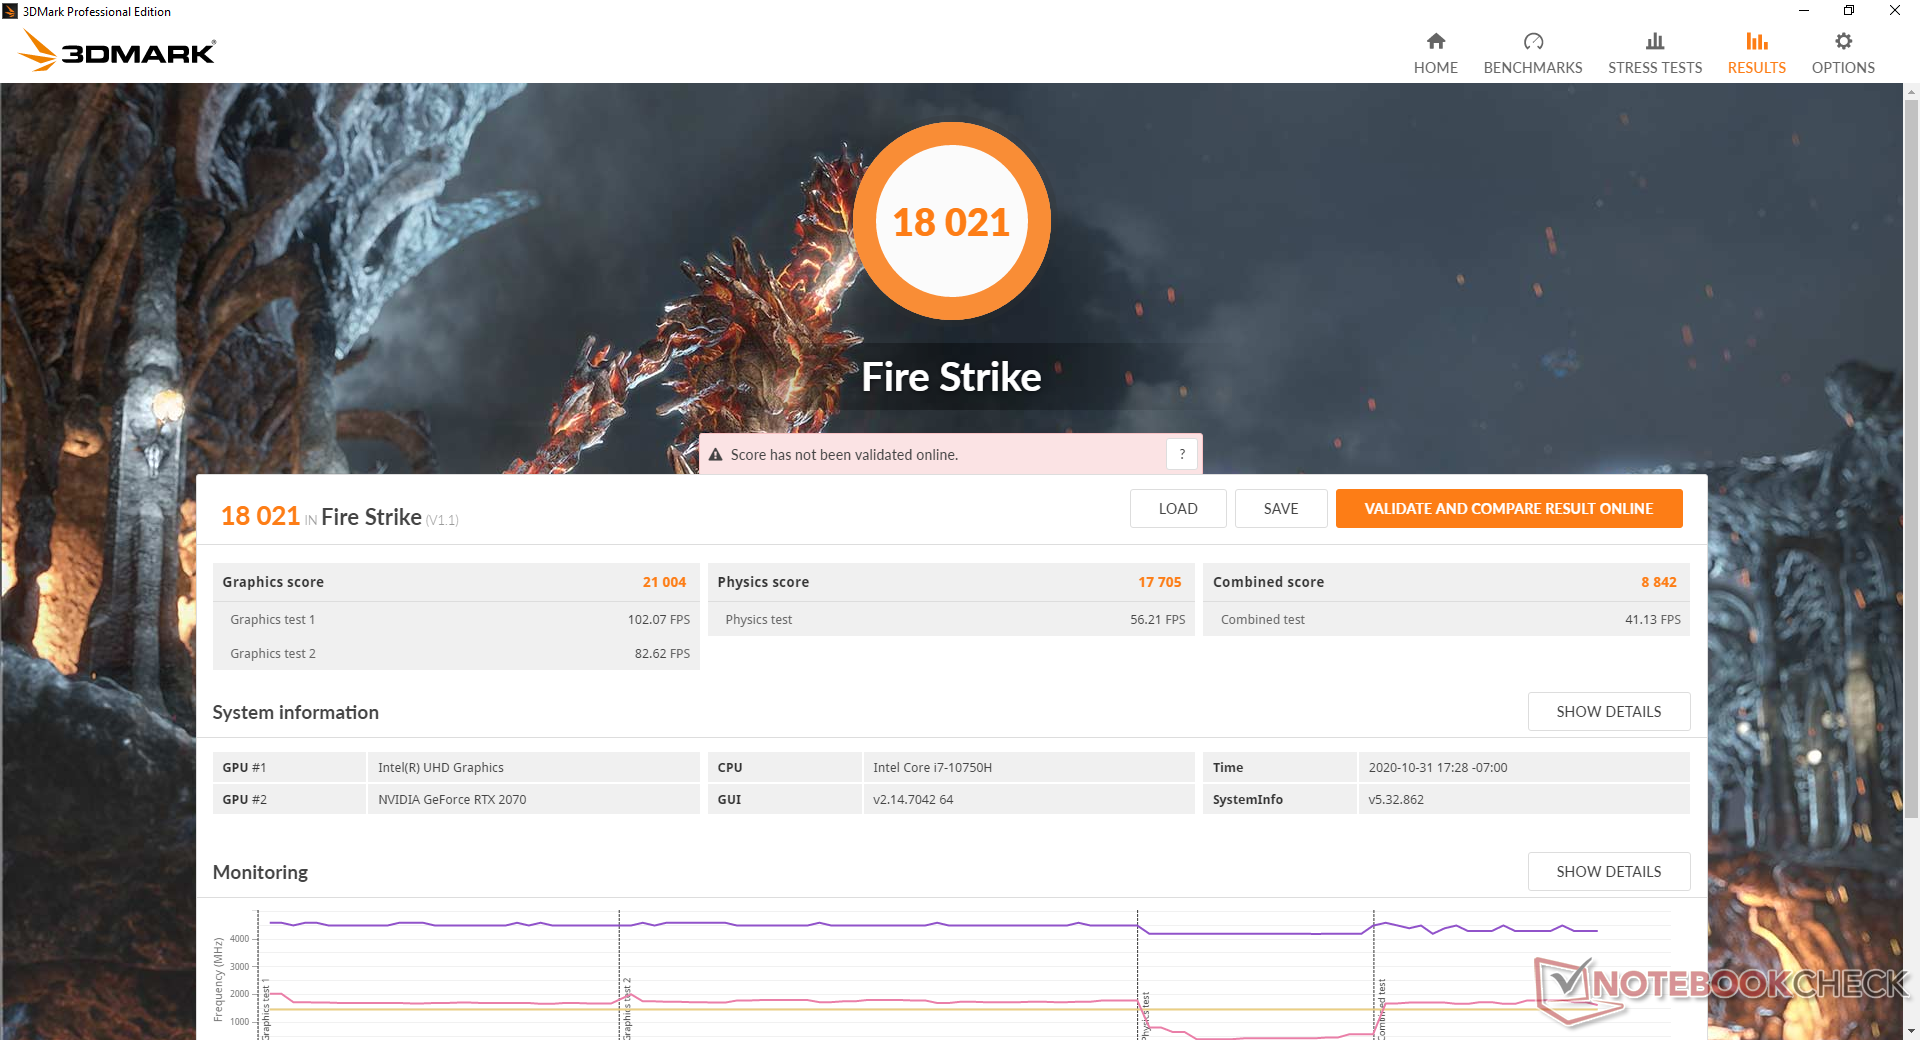
| 3DMark Fire Strike Score | 18021 punten | |
| 3DMark Time Spy Score | 7718 punten | |
Help | ||
| lage | gem. | hoge | ultra | |
|---|---|---|---|---|
| GTA V (2015) | 178 | 170 | 148 | 82 |
| The Witcher 3 (2015) | 303.3 | 227.2 | 144.5 | 78.2 |
| Dota 2 Reborn (2015) | 149 | 130 | 124 | 117 |
| Final Fantasy XV Benchmark (2018) | 151 | 106 | 80.6 | |
| X-Plane 11.11 (2018) | 105 | 90.5 | 77.5 | |
| Strange Brigade (2018) | 313 | 183 | 149 | 125 |
Emissions
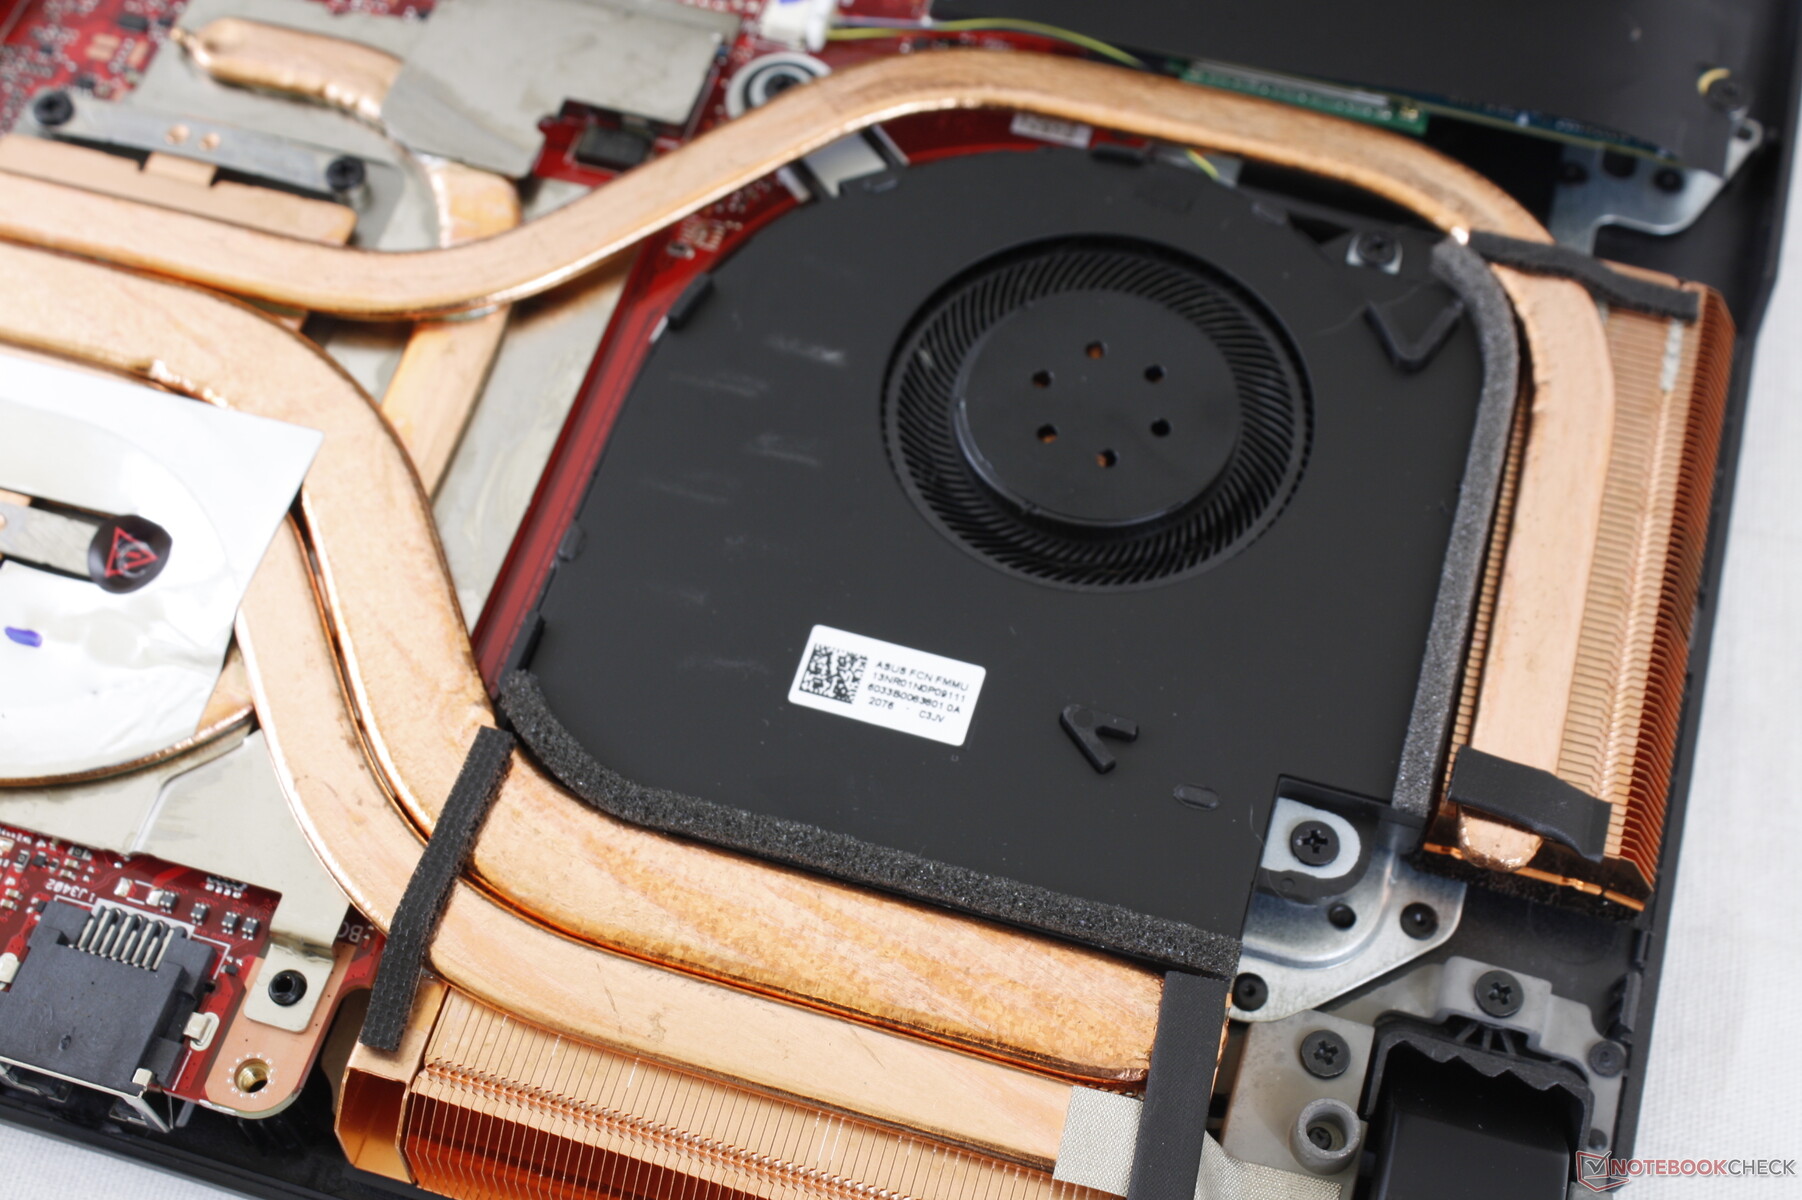
Systeemgeluid
Het geluid van de ventilator is luider dan wat we op de G512LI hebben geregistreerd, ondanks de opgevoerde koeloplossing. Het draaien van Witcher 3 op de performance mode en Turbo mode zou een ventilatorgeluid van respectievelijk 52,6 dB(A) en 54,1 dB(A) veroorzaken, vergeleken met slechts 47,9 dB(A) tot 49,3 dB(A) op de G512LI. Dit is even luid of luider dan de Razer Blade 15 of MSI GP65 die beide kleiner zijn dan de Asus.
Voor een lage belasting, zoals videostreaming of surfen op het web, is het systeem nooit echt stil, zelfs niet wanneer het op de "Stille" modus staat. Ventilatorruis heeft de neiging om rond de 30 tot 34 dB(A) te zweven, wat weliswaar niet bijzonder storend is, maar zeker merkbaar is. We raden aan om in de stille modus te draaien om het pulseren van de ventilator te verminderen.
| Asus ROG Strix G15 G512LW GeForce RTX 2070 Mobile, i7-10750H, Toshiba XG5-P KXG50PNV2T04 | Asus ROG Strix G15 G512LI GeForce GTX 1650 Ti Mobile, i7-10750H, Intel SSD 660p SSDPEKNW512G8 | Razer Blade 15 RTX 2070 Super Max-Q GeForce RTX 2070 Super Max-Q, i7-10875H, Samsung SSD PM981a MZVLB512HBJQ | MSI GP65 10SFK-047US GeForce RTX 2070 Mobile, i7-10750H, Samsung SSD PM981 MZVLB1T0HALR | Asus ROG Strix Scar 15 G532LWS GeForce RTX 2070 Super Mobile, i9-10980HK, 2x Intel SSD 660p 1TB SSDPEKNW010T8 (RAID 0) | Alienware m15 R3 P87F GeForce RTX 2070 Mobile, i7-10750H, 2x Micron 2200S 512 GB (RAID 0) | |
|---|---|---|---|---|---|---|
| Noise | -8% | 2% | -9% | -8% | 2% | |
| uit / omgeving * (dB) | 25.7 | 27.7 -8% | 27 -5% | 29.3 -14% | 26.5 -3% | 26.3 -2% |
| Idle Minimum * (dB) | 25.7 | 34.2 -33% | 27 -5% | 31.9 -24% | 27.1 -5% | 26.7 -4% |
| Idle Average * (dB) | 29.7 | 36 -21% | 27 9% | 31.9 -7% | 32.2 -8% | 26.7 10% |
| Idle Maximum * (dB) | 34 | 36.6 -8% | 27 21% | 33.5 1% | 34 -0% | 30.7 10% |
| Load Average * (dB) | 38.9 | 44.3 -14% | 44.7 -15% | 47 -21% | 52.4 -35% | 40.2 -3% |
| Witcher 3 ultra * (dB) | 54.1 | 47.9 11% | 51.2 5% | 53.8 1% | 57.5 -6% | 51 6% |
| Load Maximum * (dB) | 57.4 | 49.3 14% | 54 6% | 56.7 1% | 57.5 -0% | 59.7 -4% |
* ... kleiner is beter
Geluidsniveau
| Onbelast |
| 25.7 / 29.7 / 34 dB (A) |
| Belasting |
| 38.9 / 57.4 dB (A) |
 | ||
30 dB stil 40 dB(A) hoorbaar 50 dB(A) luid |
||
min: | ||
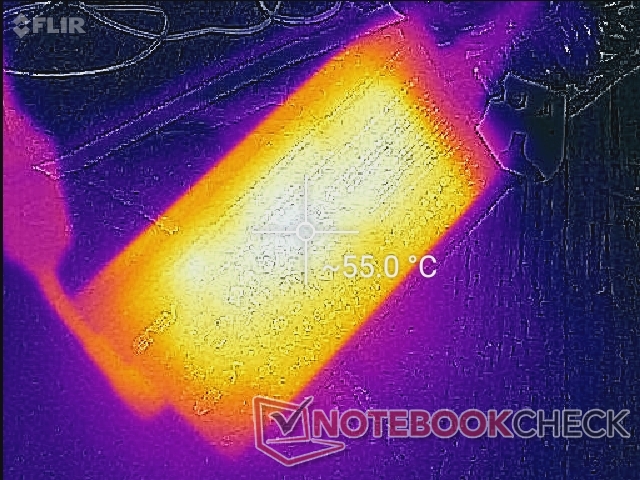
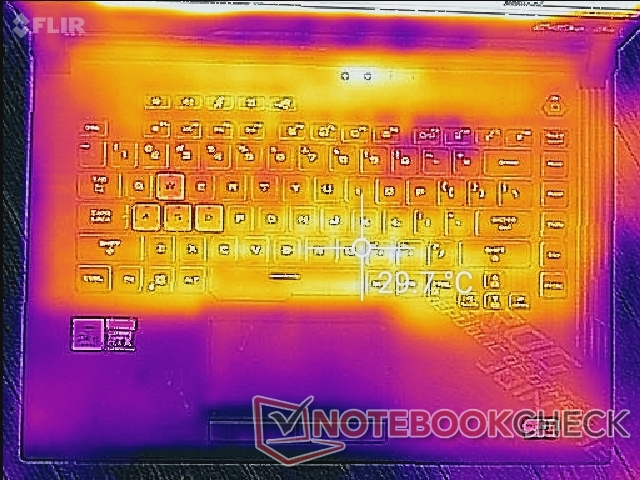
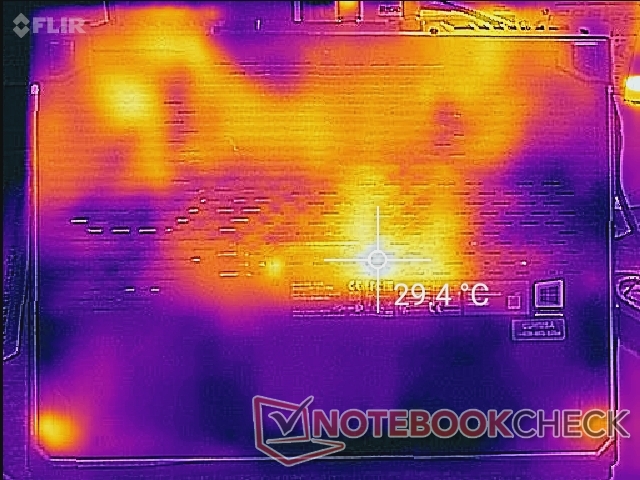
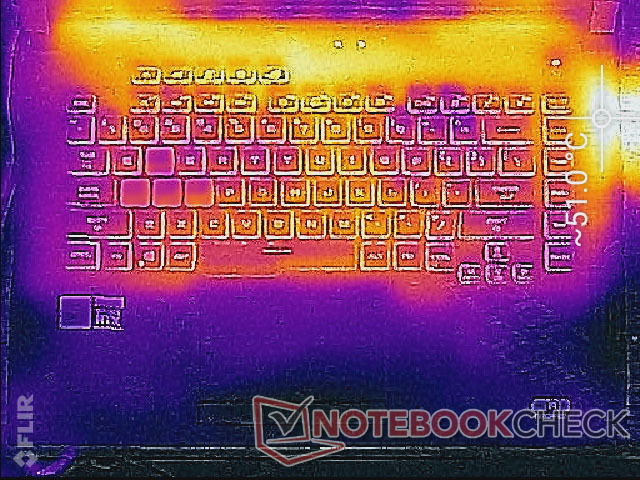
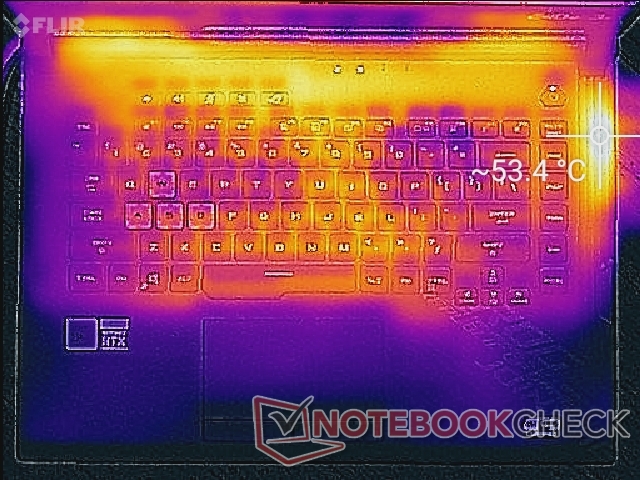
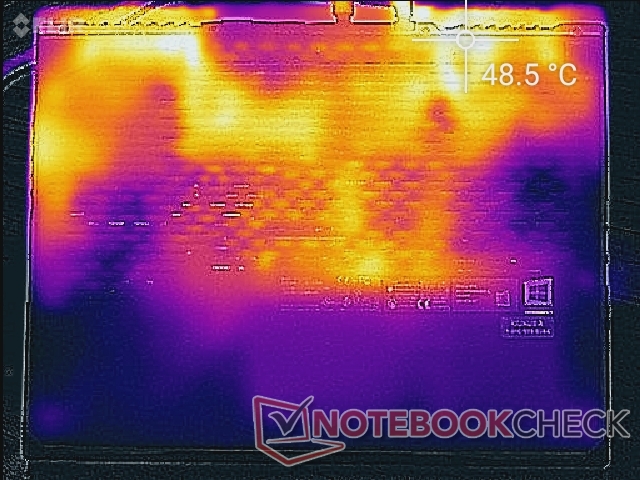
Temperatuur
De oppervlaktetemperaturen zijn iets anders dan bij de G512LI omdat de G512LW extra ventilatie langs de rechterrand van het chassis bevat. Hierdoor zal de rechterrand van de laptop veel warmer zijn dan deze zelfde plek op de G512LI. De palmsteunen en de meeste toetsen van het toetsenbord blijven koeler aanvoelen, vooral in vergelijking met ultradunne unibody gaming laptops zoals de Razer Blade 15.
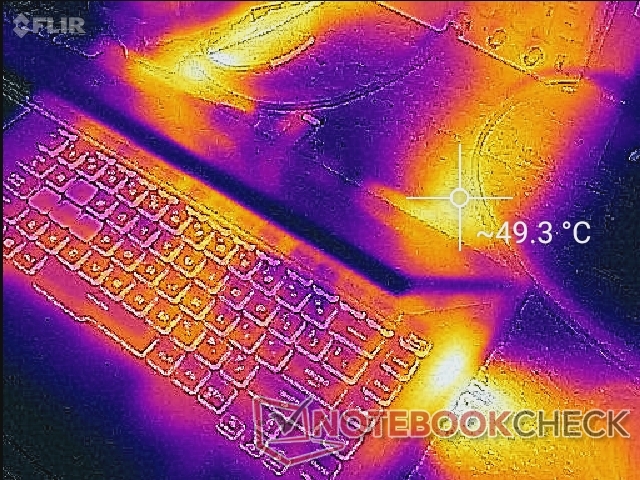
(-) De maximumtemperatuur aan de bovenzijde bedraagt 53.4 °C / 128 F, vergeleken met het gemiddelde van 40.4 °C / 105 F, variërend van 21.2 tot 68.8 °C voor de klasse Gaming.
(-) De bodem warmt op tot een maximum van 49 °C / 120 F, vergeleken met een gemiddelde van 43.2 °C / 110 F
(+) Bij onbelast gebruik bedraagt de gemiddelde temperatuur voor de bovenzijde 28.4 °C / 83 F, vergeleken met het apparaatgemiddelde van 33.9 °C / 93 F.
(±) Bij het spelen van The Witcher 3 is de gemiddelde temperatuur voor de bovenzijde 34.1 °C / 93 F, vergeleken met het apparaatgemiddelde van 33.9 °C / 93 F.
(+) De palmsteunen en het touchpad zijn met een maximum van ###max## °C / 81.7 F koeler dan de huidtemperatuur en voelen daarom koel aan.
(±) De gemiddelde temperatuur van de handpalmsteun van soortgelijke toestellen bedroeg 28.8 °C / 83.8 F (+1.2 °C / 2.1 F).
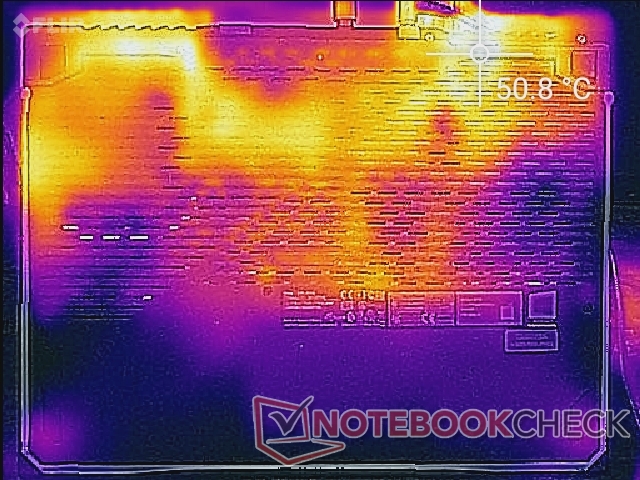
Stresstest
Bij stress met Prime95 zou de CPU een boost geven tot 4,2 GHz zonder daarna te vallen om onze CineBench R15 xT-lus testresultaten hierboven te spiegelen. De laptop is in staat om hoge Turbo Boost kloksnelheden voor onbepaalde tijd te behouden
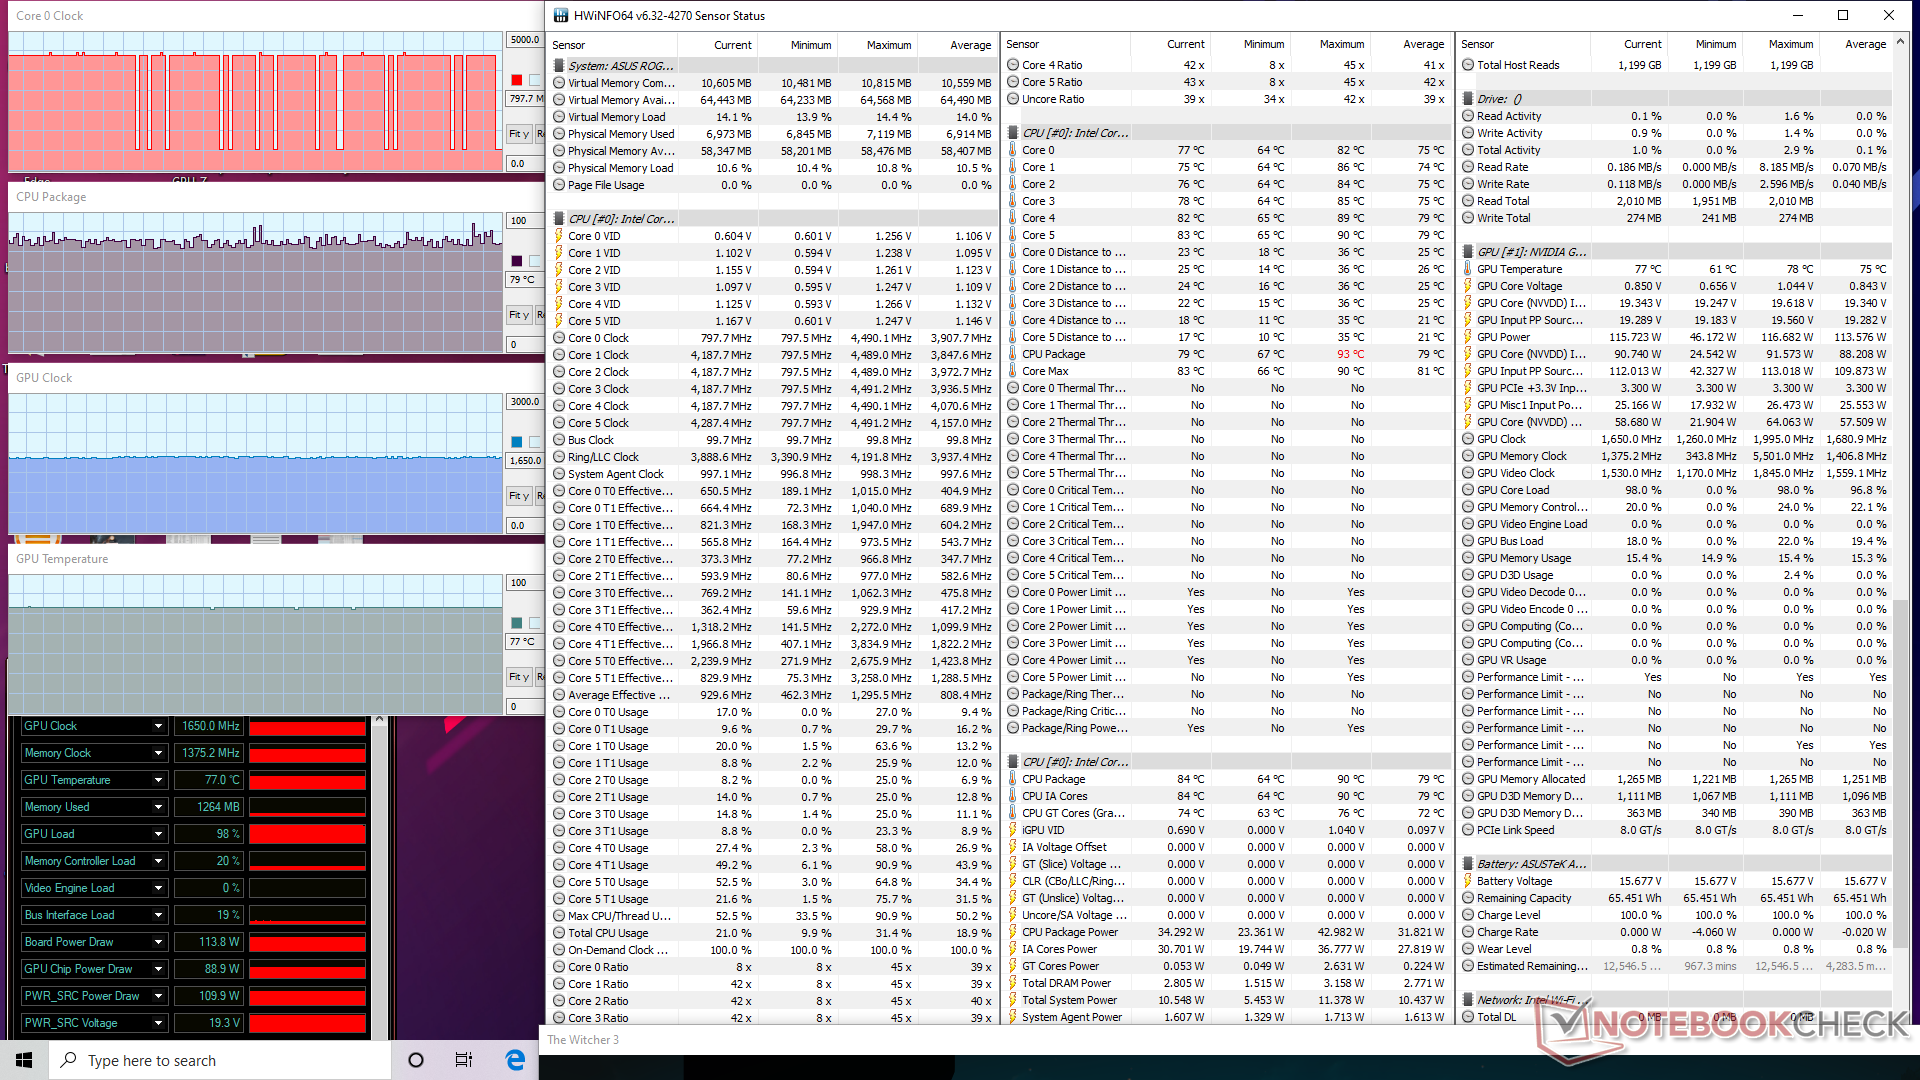
Lopend Witcher 3 in de turbomodus zou dit resulteren in iets snellere kloksnelheden (1725 MHz vs. 1650 MHz) en geheugensnelheden (1405,2 MHz vs. 1375,2 MHz) dan in de prestatiemodus zonder dat dit van invloed is op de kerntemperaturen, aangezien het toerental van de ventilator ook iets zou stijgen. CPU- en GPU-temperaturen zouden respectievelijk bij ongeveer 80 C en 74 C op een plateau komen, vergeleken met slechts 60 C elk op de langzamere G512LI bij vergelijkbare spelcondities
Het lopen op batterijvermogen zal de prestaties beïnvloeden. Een 3DMark 11-test op batterijen zou een score van respectievelijk 9811 en 10435 punten opleveren, vergeleken met 13512 en 27298 punten op het lichtnet.
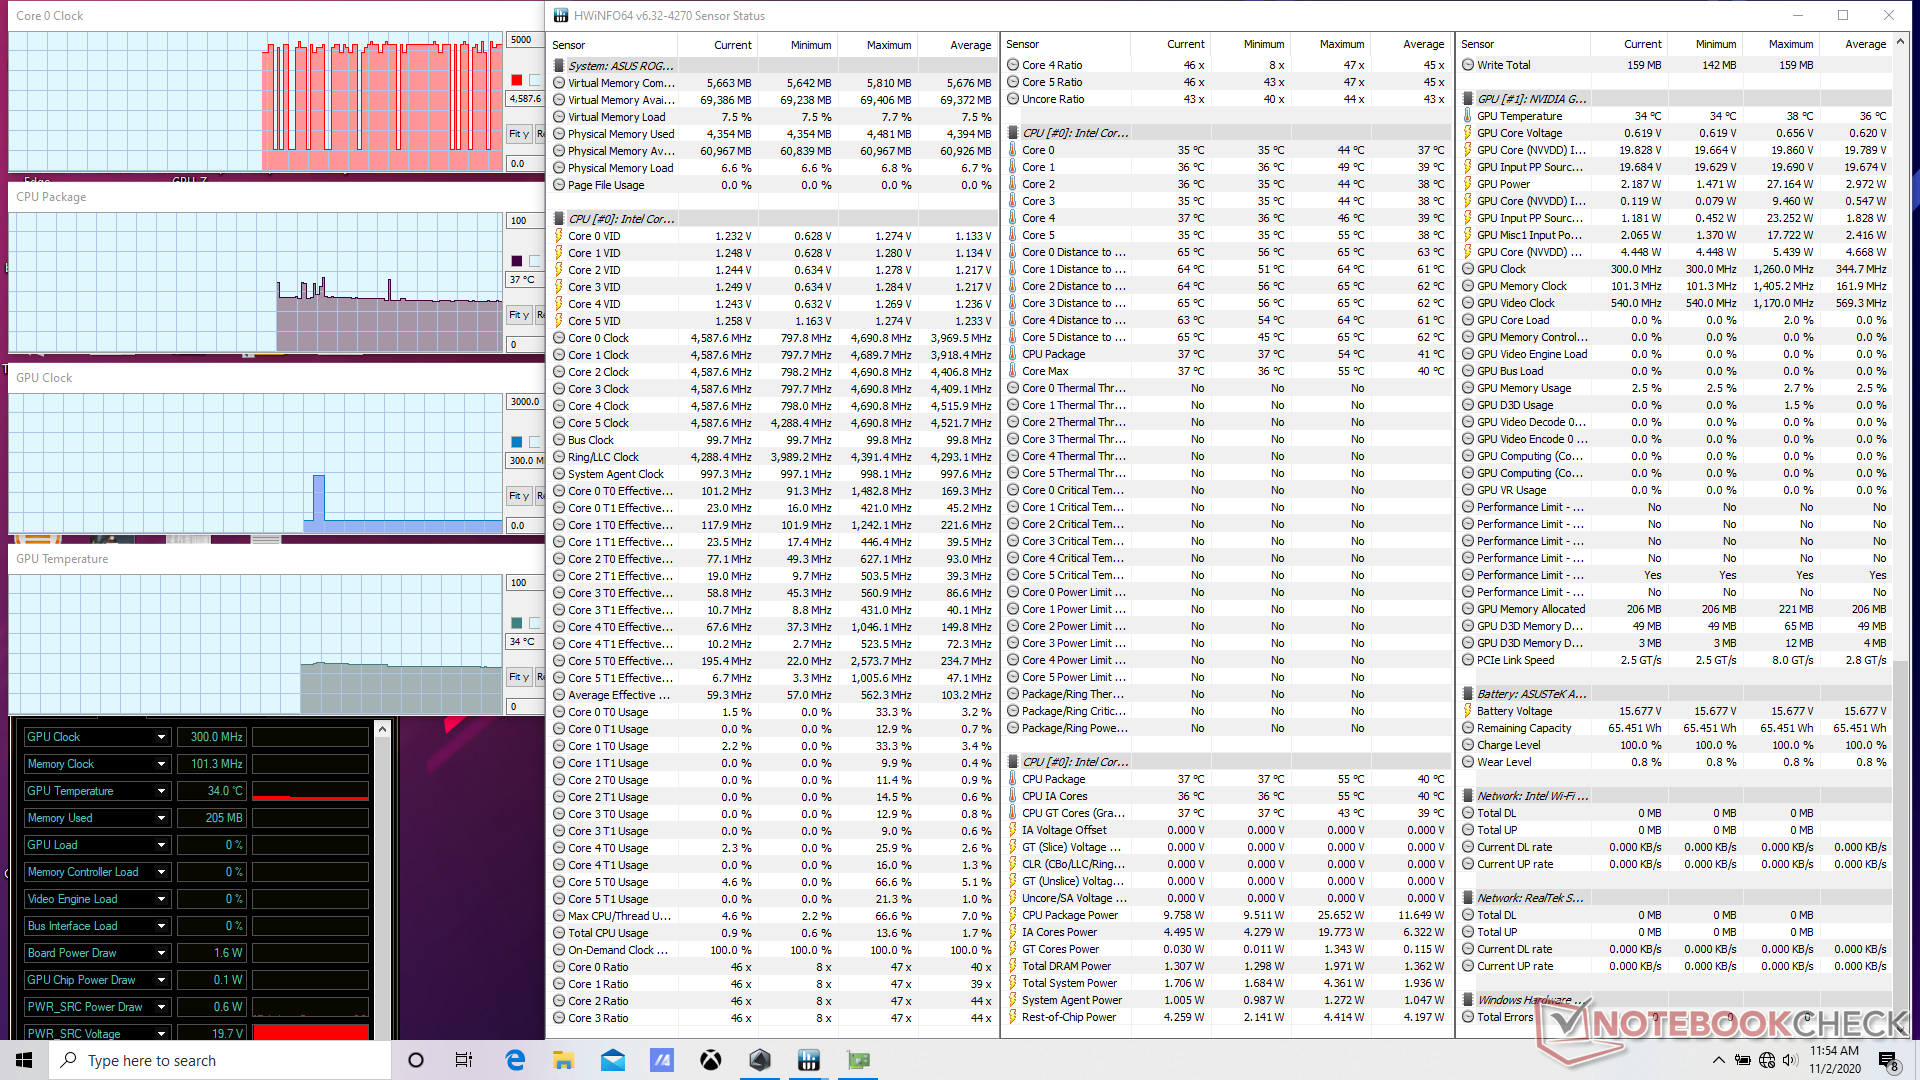
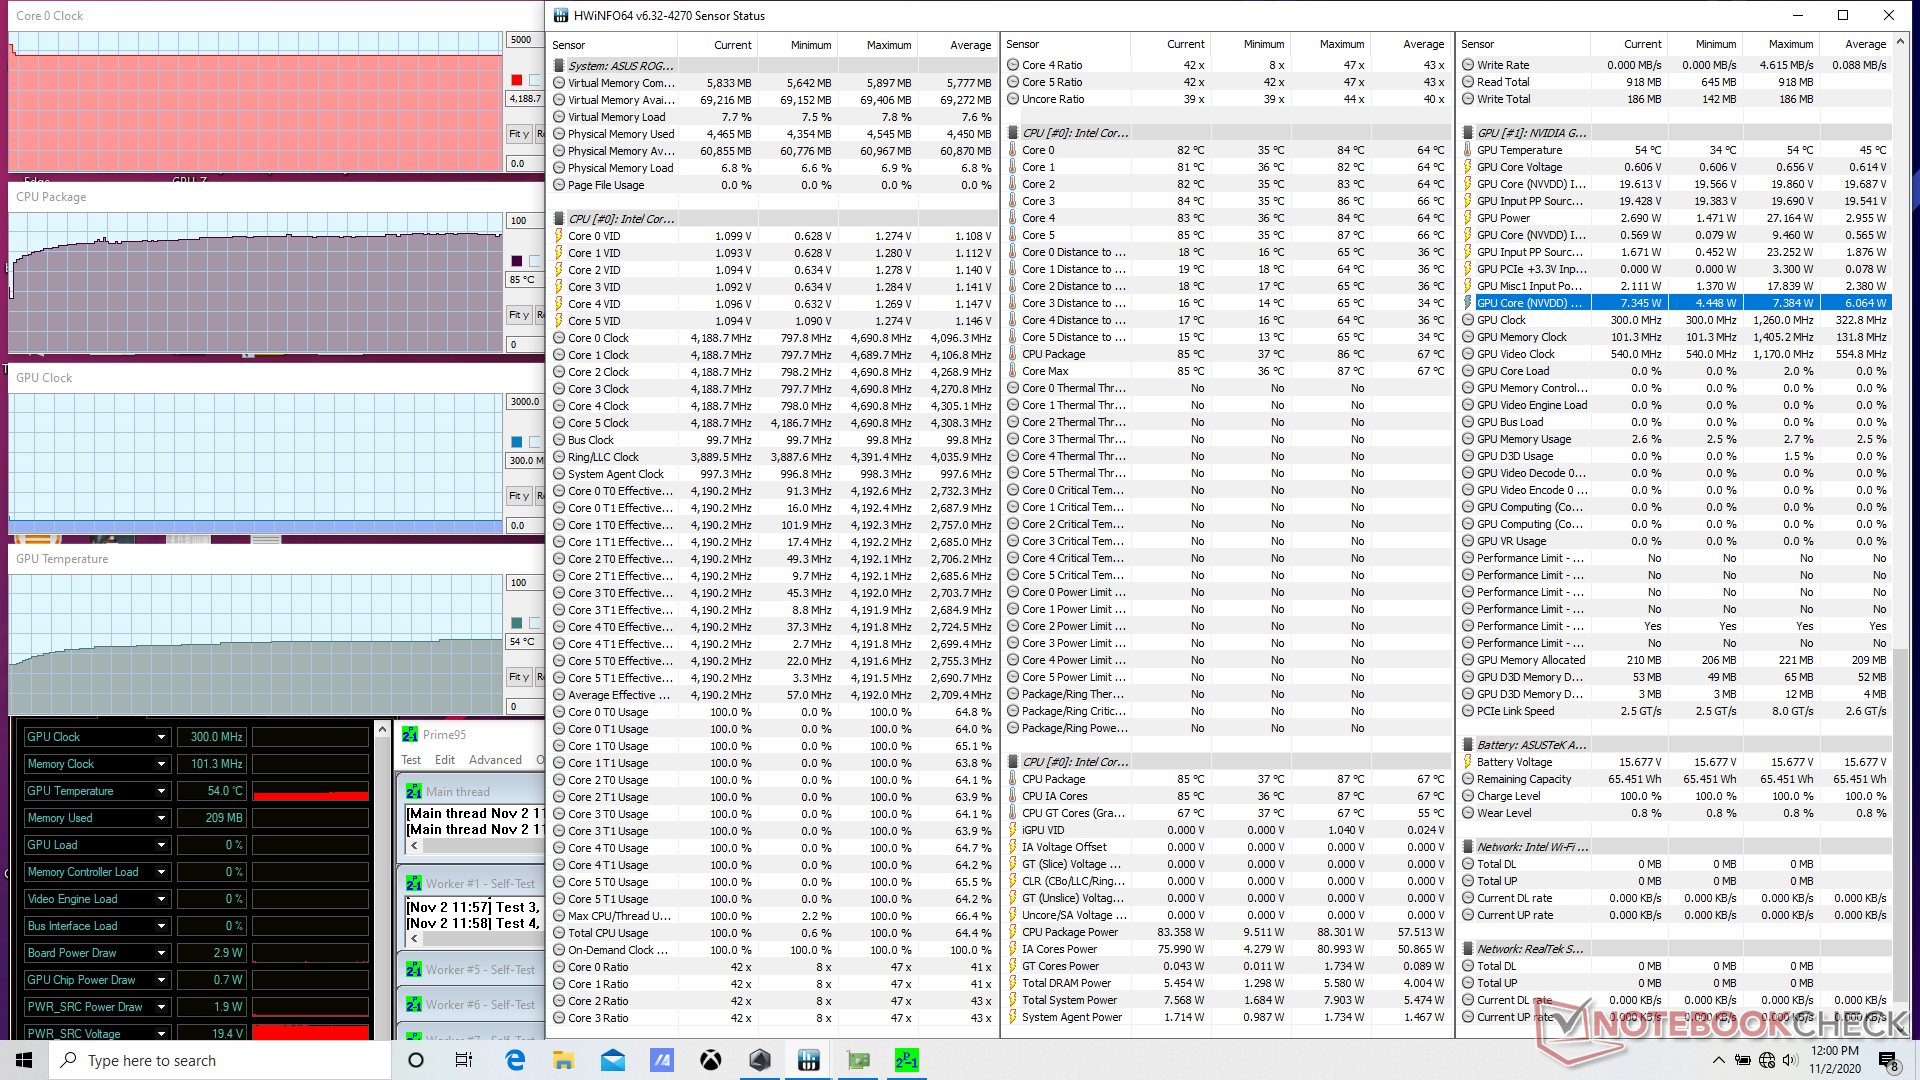
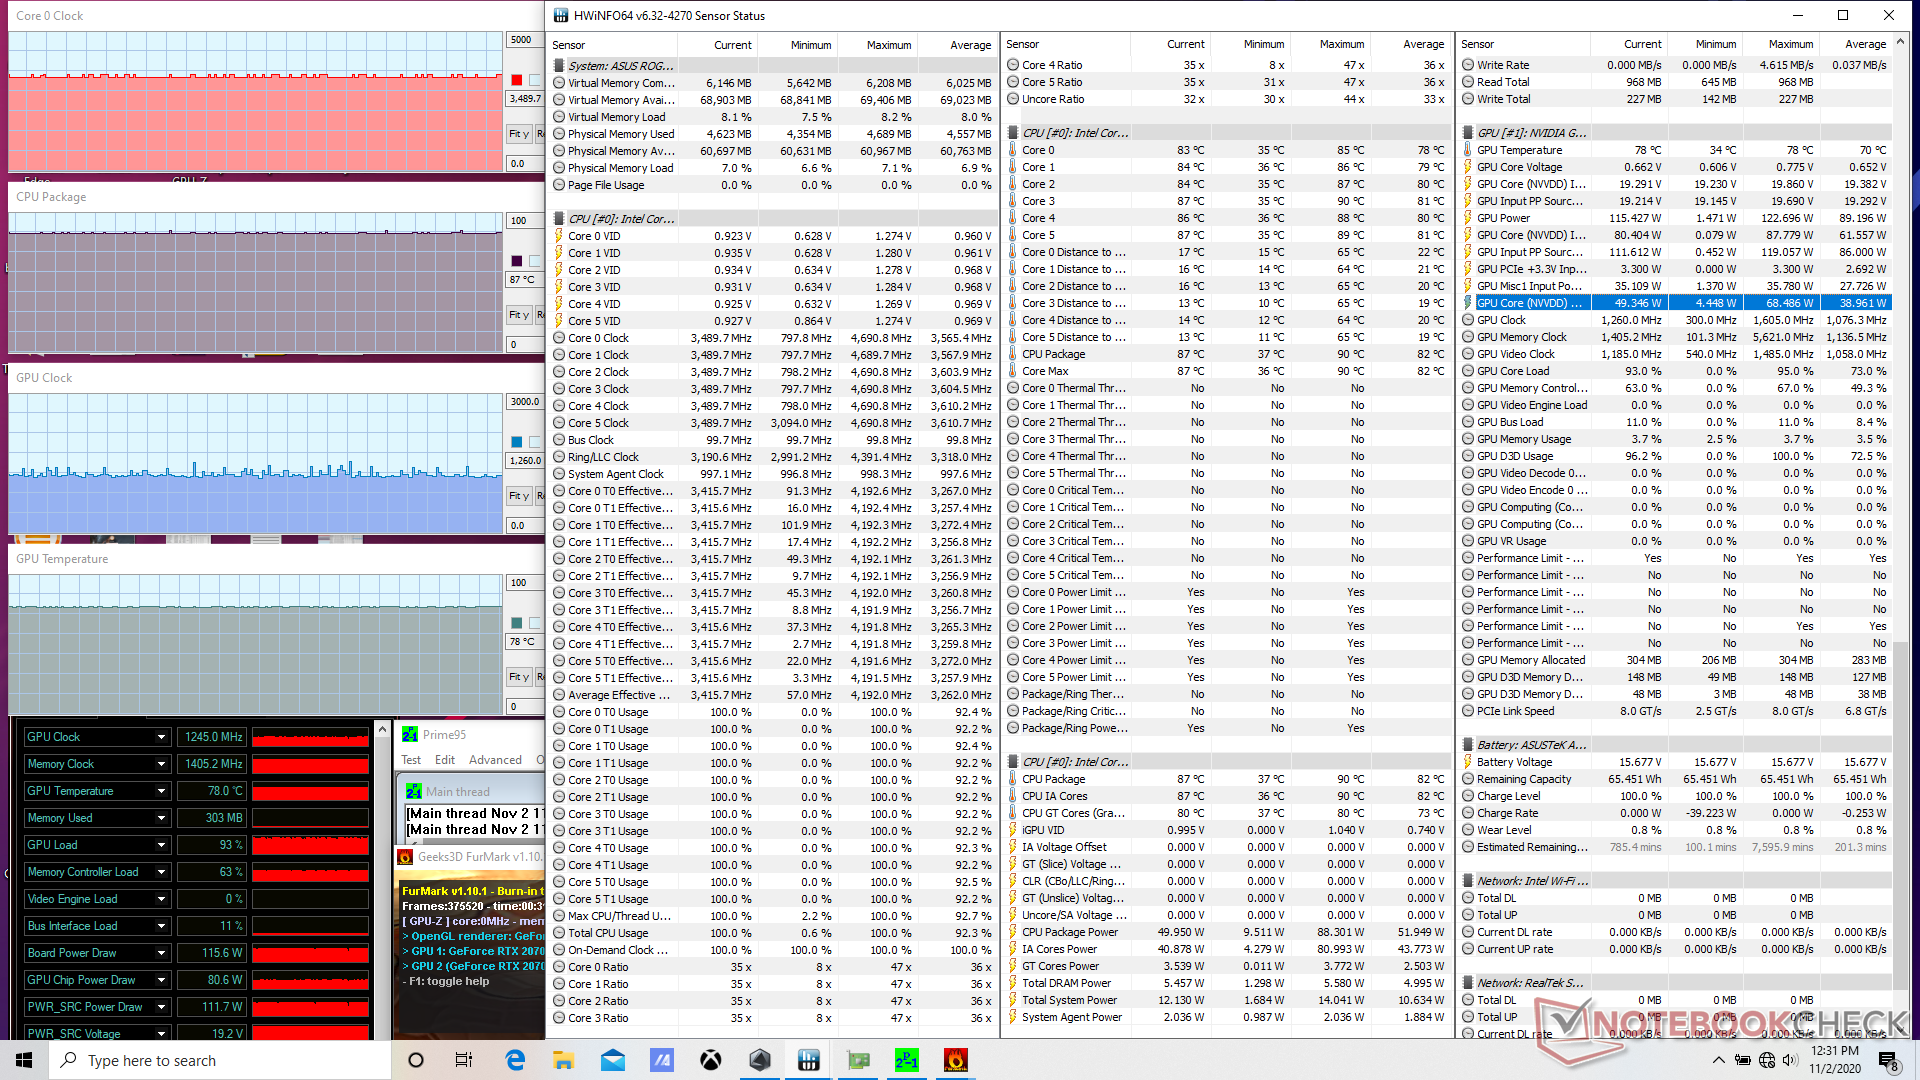
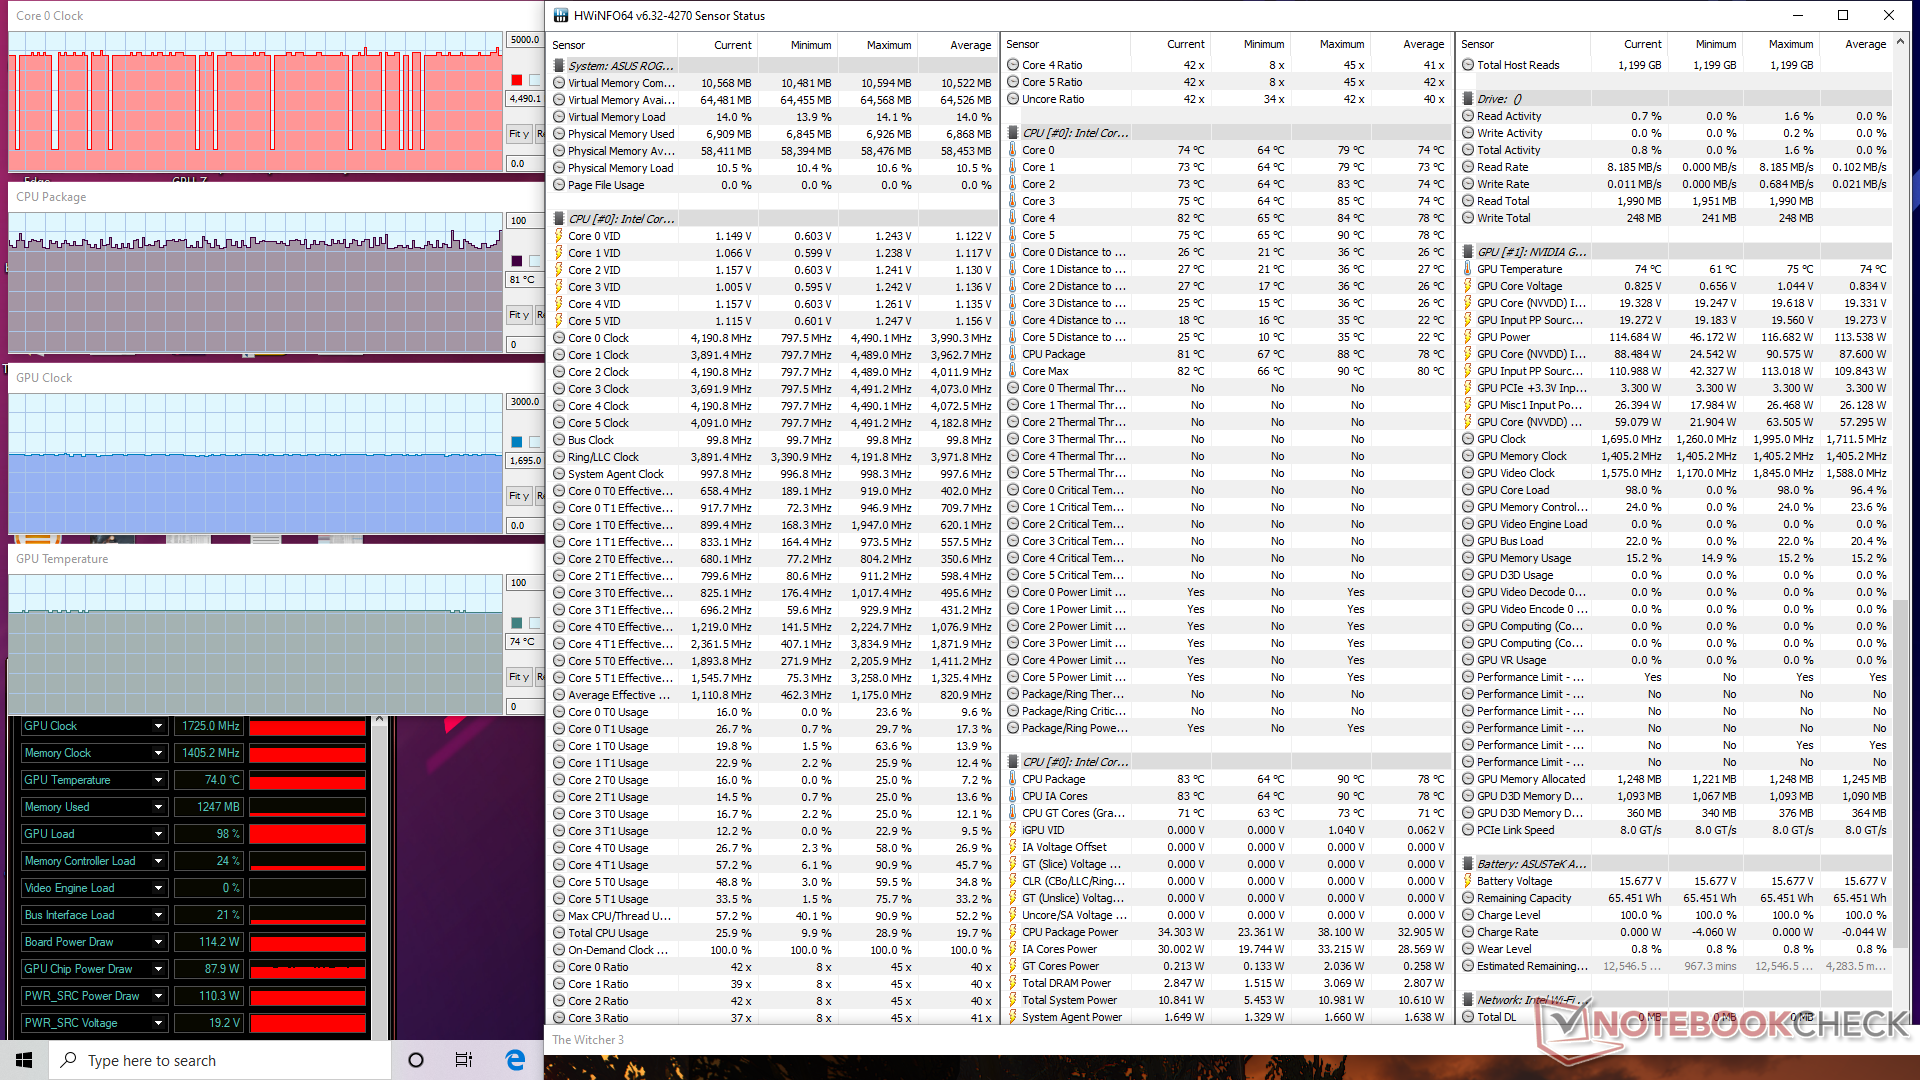
| CPUKlok (GHz) | GPUKlok (MHz) | GemiddeldeCPU Temperatuur (°C) | GemiddeldeGPU Temperatuur (°C) | |
| System Idle | -- | 37 | 34 | |
| Prime95 Stress4.2 | --85 | 54 | ||
| Prime95 + FurMark Stress (Turbomodus) | 3,4 - 3,5 | 1245 | 87 | 78 |
| Witcher 3 Stress (modus Prestaties) | 0,8 - 4,2 | 1650 | ~79 | 77 |
| Witcher 3 Stress (Turbomodus | 0,8 - 4,2 | 1725 | ~80 | 74 |
Luidsprekers


Asus ROG Strix G15 G512LW audioanalyse
(+) | luidsprekers kunnen relatief luid spelen (83.8 dB)
Bas 100 - 315 Hz
(±) | verminderde zeebaars - gemiddeld 8.8% lager dan de mediaan
(±) | lineariteit van de lage tonen is gemiddeld (7.8% delta ten opzichte van de vorige frequentie)
Midden 400 - 2000 Hz
(±) | hogere middens - gemiddeld 7.5% hoger dan de mediaan
(+) | de middentonen zijn lineair (6.2% delta ten opzichte van de vorige frequentie)
Hoog 2 - 16 kHz
(+) | evenwichtige hoogtepunten - slechts 2.4% verwijderd van de mediaan
(+) | de hoge tonen zijn lineair (6% delta naar de vorige frequentie)
Algemeen 100 - 16.000 Hz
(±) | lineariteit van het totale geluid is gemiddeld (16.4% verschil met de mediaan)
Vergeleken met dezelfde klasse
» 42% van alle geteste apparaten in deze klasse waren beter, 6% vergelijkbaar, 52% slechter
» De beste had een delta van 6%, het gemiddelde was 18%, de slechtste was 132%
Vergeleken met alle geteste toestellen
» 27% van alle geteste apparaten waren beter, 6% gelijk, 67% slechter
» De beste had een delta van 4%, het gemiddelde was 24%, de slechtste was 134%
Apple MacBook 12 (Early 2016) 1.1 GHz audioanalyse
(+) | luidsprekers kunnen relatief luid spelen (83.6 dB)
Bas 100 - 315 Hz
(±) | verminderde zeebaars - gemiddeld 11.3% lager dan de mediaan
(±) | lineariteit van de lage tonen is gemiddeld (14.2% delta ten opzichte van de vorige frequentie)
Midden 400 - 2000 Hz
(+) | evenwichtige middens - slechts 2.4% verwijderd van de mediaan
(+) | de middentonen zijn lineair (5.5% delta ten opzichte van de vorige frequentie)
Hoog 2 - 16 kHz
(+) | evenwichtige hoogtepunten - slechts 2% verwijderd van de mediaan
(+) | de hoge tonen zijn lineair (4.5% delta naar de vorige frequentie)
Algemeen 100 - 16.000 Hz
(+) | het totale geluid is lineair (10.2% verschil met de mediaan)
Vergeleken met dezelfde klasse
» 7% van alle geteste apparaten in deze klasse waren beter, 2% vergelijkbaar, 91% slechter
» De beste had een delta van 5%, het gemiddelde was 18%, de slechtste was 53%
Vergeleken met alle geteste toestellen
» 5% van alle geteste apparaten waren beter, 1% gelijk, 94% slechter
» De beste had een delta van 4%, het gemiddelde was 24%, de slechtste was 134%
Energy Management
Stroomverbruik
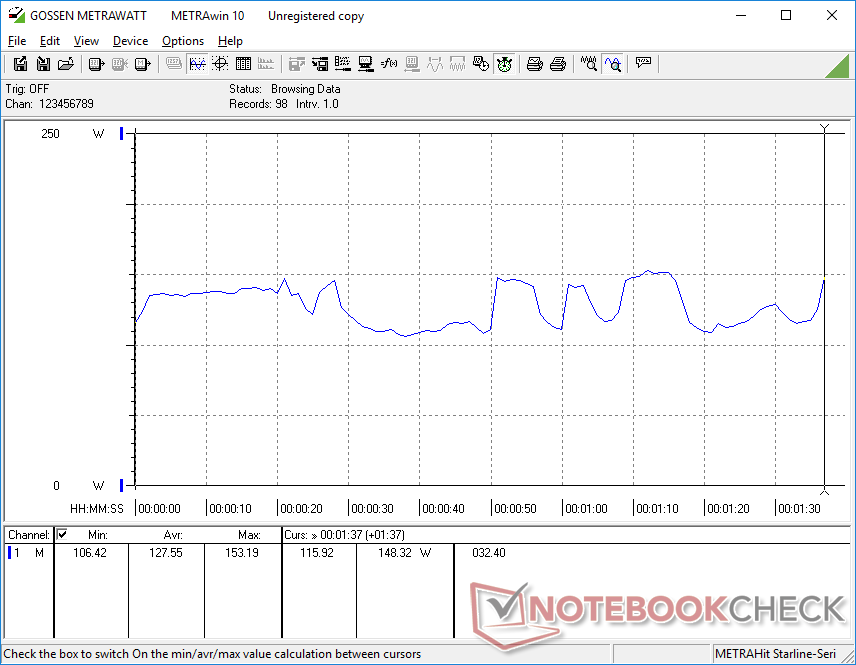
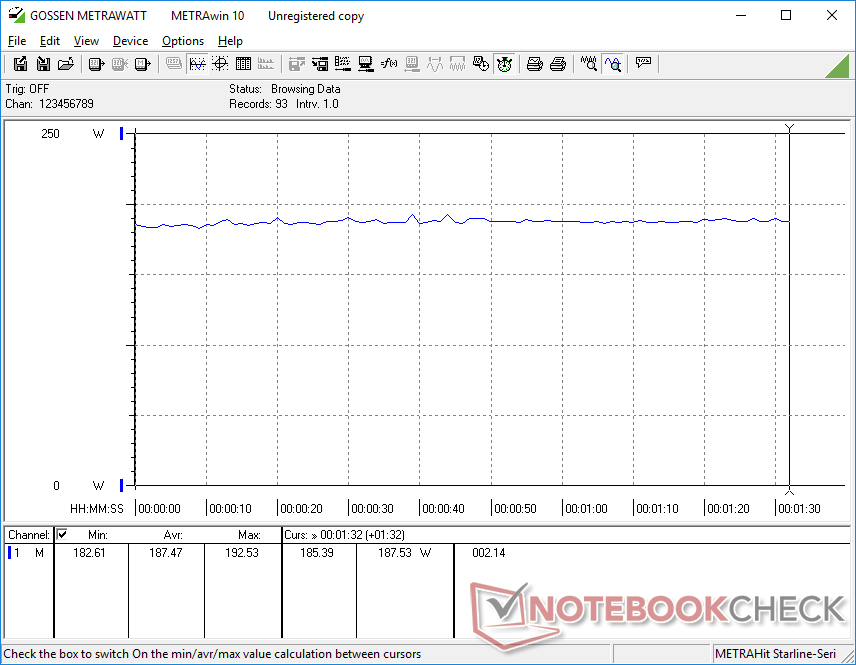
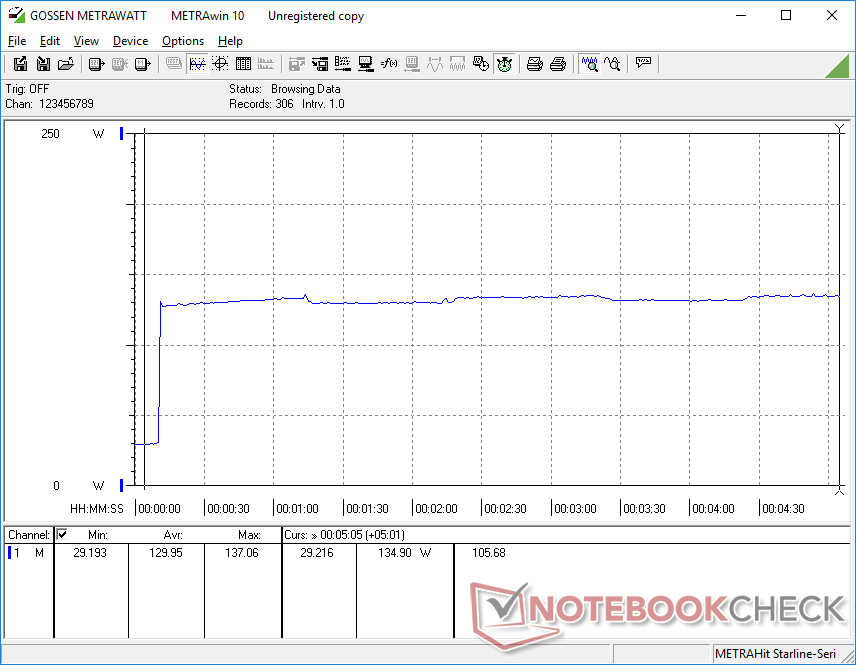
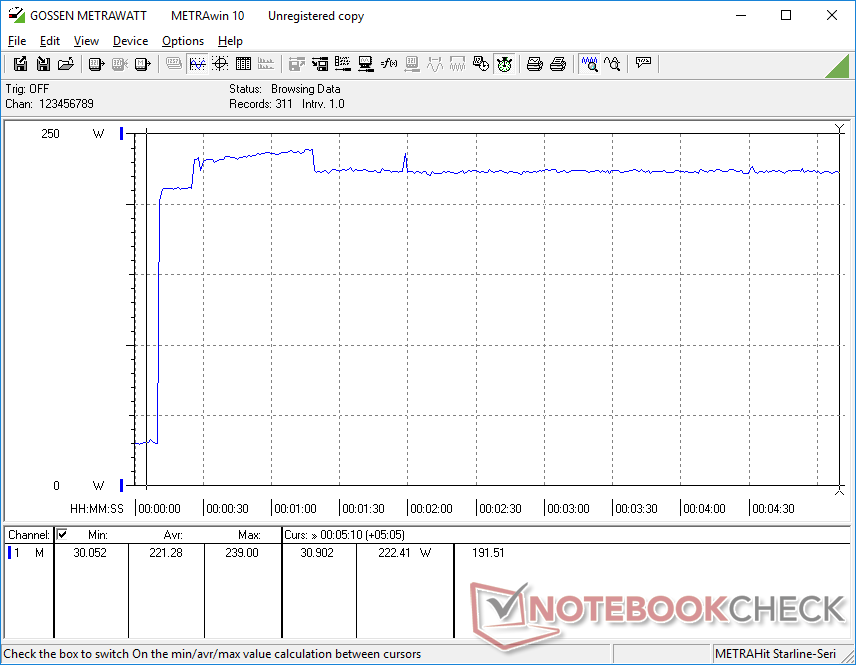
Het gebruik op het bureaublad vereist tussen 16 W en 31 W, afhankelijk van de helderheid en het vermogensprofiel. Anders, zal gaming eisen ongeveer 187 W te zijn vergelijkbaar met wat we opgenomen op de MSI GP65 10SFK uitgerust met dezelfde CPU en GPU. Het verbruik is ongeveer 2x groter dan de G512LI, die zich aanpast aan de 2x grotere grafische prestaties die hierboven zijn genoemd.
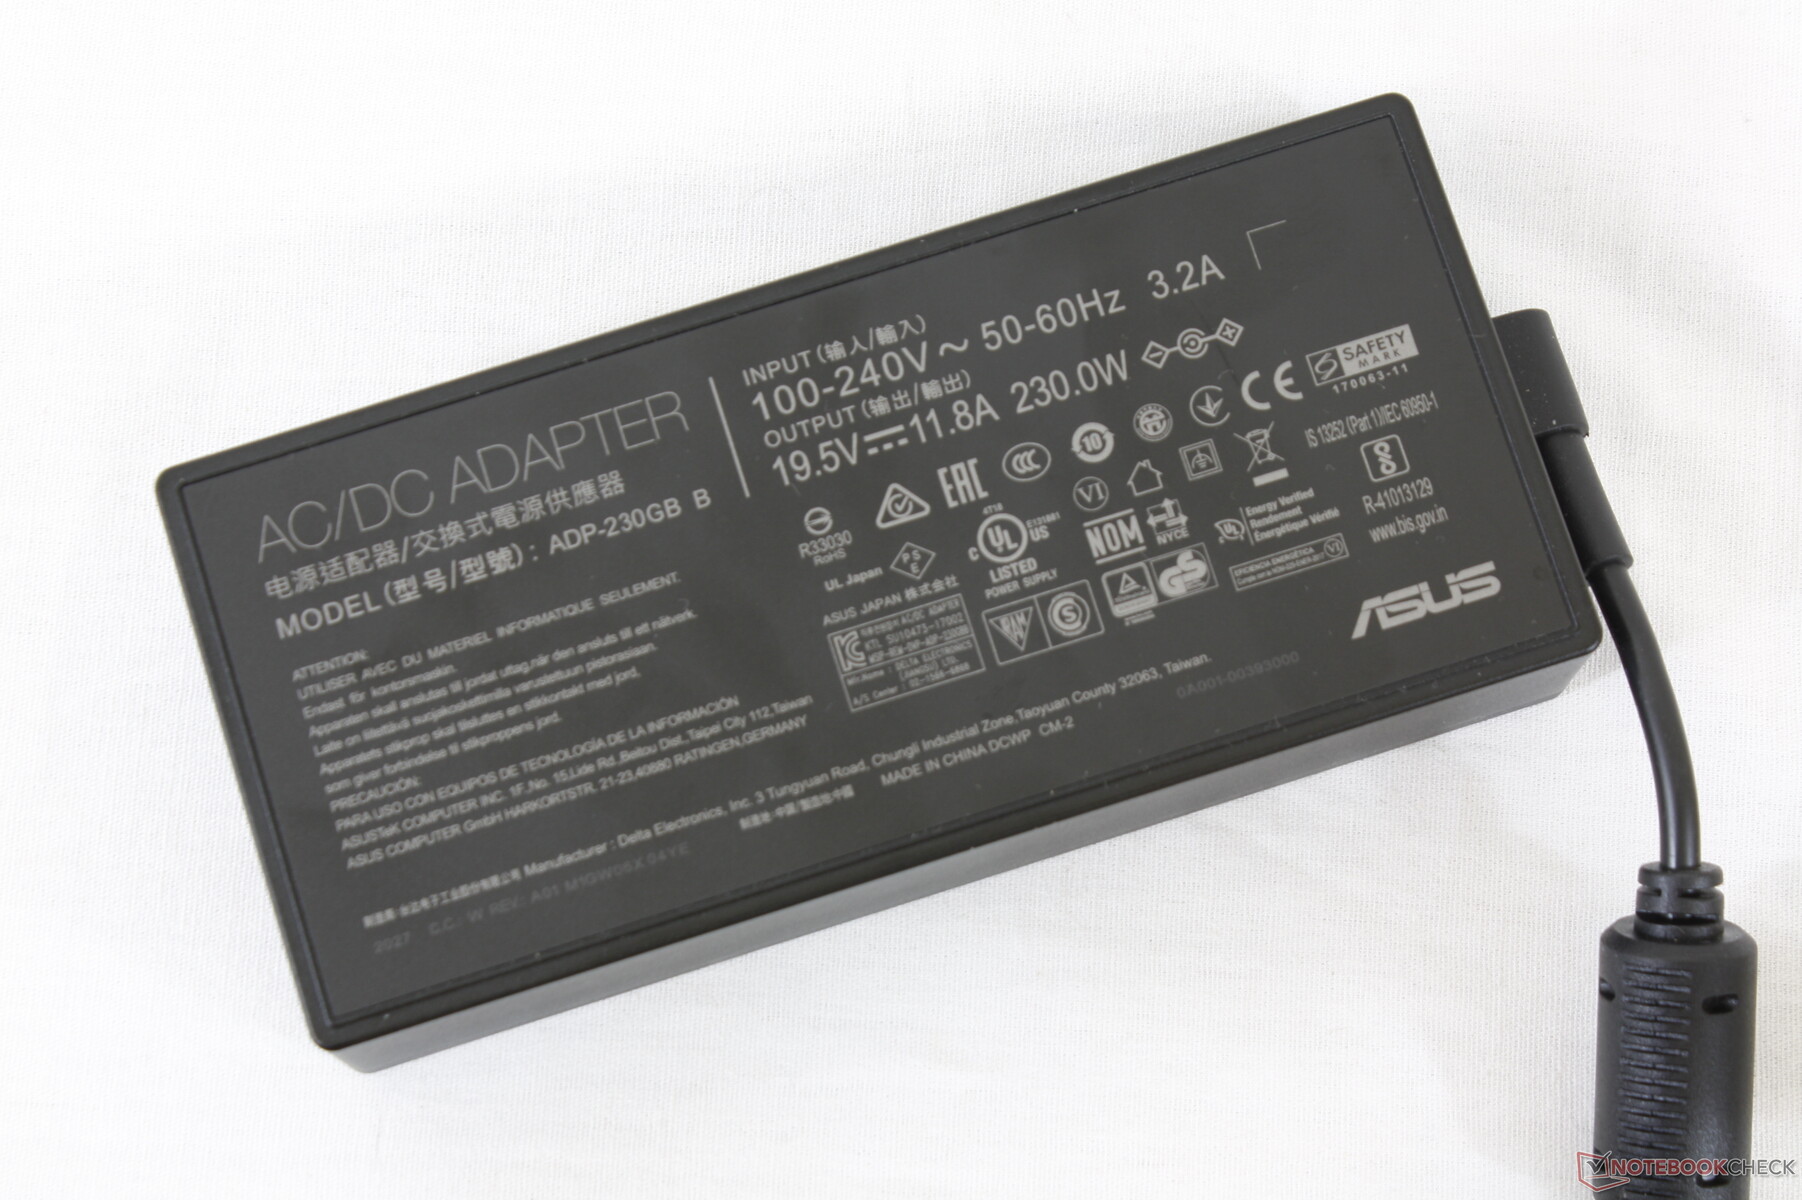
Merk op dat de G512LW wordt geleverd met een grotere 240 W AC adapter (~16,5 x 7,5 x 3,2 cm) in vergelijking met de 150 W AC adapter voor de G512LI als gevolg van de meer veeleisende RTX 2070 GPU.
| Uit / Standby | |
| Inactief | |
| Belasting |
|
Key:
min: | |
| Asus ROG Strix G15 G512LW i7-10750H, GeForce RTX 2070 Mobile, Toshiba XG5-P KXG50PNV2T04, IPS, 1920x1080, 15.6" | Asus ROG Strix G15 G512LI i7-10750H, GeForce GTX 1650 Ti Mobile, Intel SSD 660p SSDPEKNW512G8, IPS, 1920x1080, 15.6" | Razer Blade 15 RTX 2070 Super Max-Q i7-10875H, GeForce RTX 2070 Super Max-Q, Samsung SSD PM981a MZVLB512HBJQ, IPS, 1920x1080, 15.6" | MSI GP65 10SFK-047US i7-10750H, GeForce RTX 2070 Mobile, Samsung SSD PM981 MZVLB1T0HALR, IPS, 1920x1080, 15.6" | Asus ROG Strix Scar 15 G532LWS i9-10980HK, GeForce RTX 2070 Super Mobile, 2x Intel SSD 660p 1TB SSDPEKNW010T8 (RAID 0), IPS, 1920x1080, 15.6" | |
|---|---|---|---|---|---|
| Power Consumption | 43% | 5% | 14% | 12% | |
| Idle Minimum * (Watt) | 16.2 | 5.7 65% | 14.3 12% | 14.2 12% | 8 51% |
| Idle Average * (Watt) | 24.1 | 9.3 61% | 22.3 7% | 18.8 22% | 9.8 59% |
| Idle Maximum * (Watt) | 30.8 | 20.9 32% | 36.9 -20% | 23.9 22% | 25.8 16% |
| Load Average * (Watt) | 127.6 | 105.1 18% | 118.4 7% | 96.9 24% | 169 -32% |
| Witcher 3 ultra * (Watt) | 187.5 | 94.5 50% | 153.7 18% | 185 1% | 201 -7% |
| Load Maximum * (Watt) | 239 | 160.8 33% | 220.8 8% | 233.4 2% | 271.6 -14% |
* ... kleiner is beter
Levensduur van de batterij
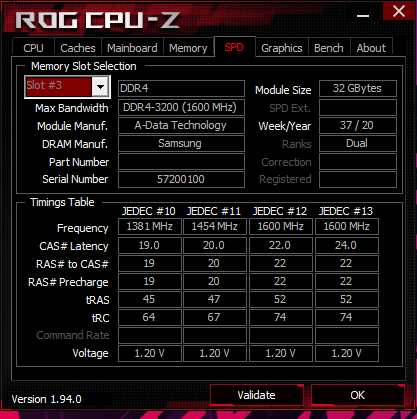
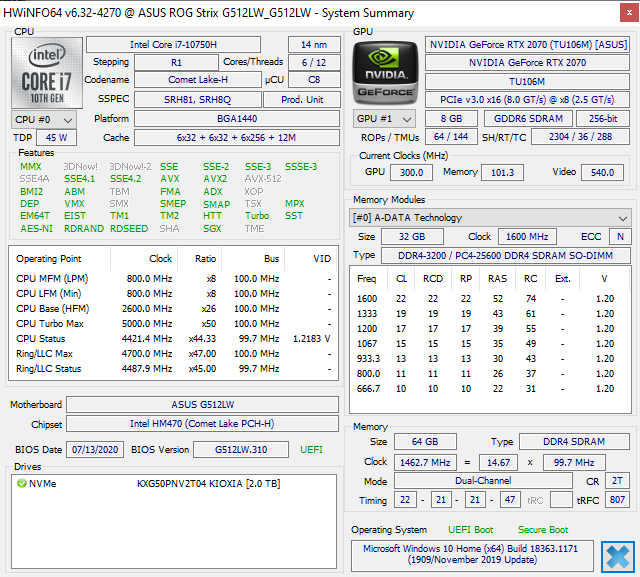
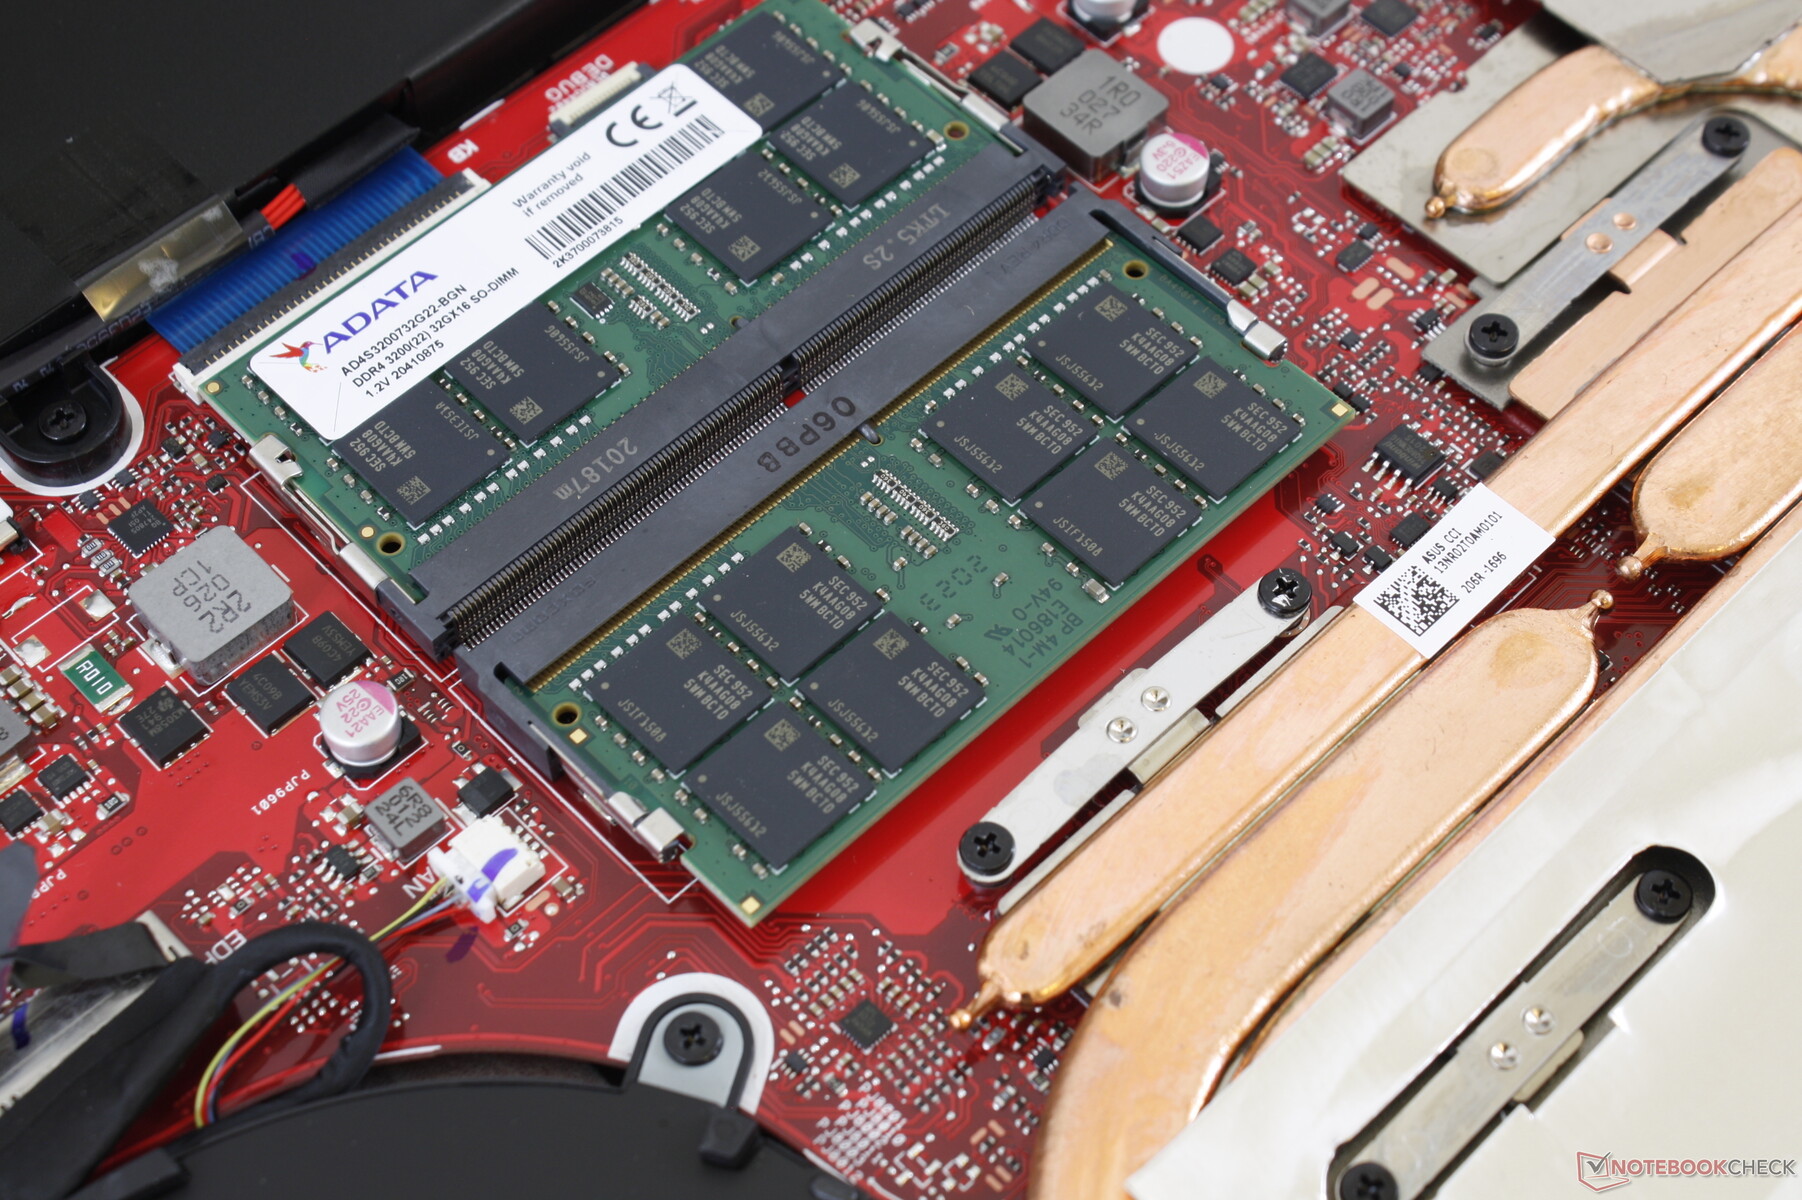
Asus heeft de accucapaciteit verhoogd van 48 Wh op de G512LI naar 66 Wh op onze G512LW. Vervolgens zijn de WLAN-runtimes bijna twee uur langer, bij een kleine 6,5 uur echt WLAN-gebruik. Het opladen van lege naar volle capaciteit duurt nog steeds minder dan 1,5 uur.
| Asus ROG Strix G15 G512LW i7-10750H, GeForce RTX 2070 Mobile, 66 Wh | Asus ROG Strix G15 G512LI i7-10750H, GeForce GTX 1650 Ti Mobile, 48 Wh | Razer Blade 15 RTX 2070 Super Max-Q i7-10875H, GeForce RTX 2070 Super Max-Q, 80 Wh | MSI GP65 10SFK-047US i7-10750H, GeForce RTX 2070 Mobile, 51 Wh | Asus ROG Strix Scar 15 G532LWS i9-10980HK, GeForce RTX 2070 Super Mobile, 66 Wh | Alienware m15 R3 P87F i7-10750H, GeForce RTX 2070 Mobile, 86 Wh | |
|---|---|---|---|---|---|---|
| Batterijduur | -30% | -2% | -42% | -23% | -56% | |
| WiFi v1.3 (h) | 6.4 | 4.5 -30% | 6.3 -2% | 3.7 -42% | 4.9 -23% | 2.8 -56% |
| Reader / Idle (h) | 13.3 | 8.1 | 5 | |||
| Load (h) | 1.4 | 1.5 | 0.7 |
Pro
Contra
Uitspraak

Een slecht beeldscherm kan een verder goede gaminglaptop verpesten. Terwijl de minder dure ROG Strix G15 G512LI goed presteert, zouden de trage reactietijden van het scherm en de beperkte kleurweergave de game-ervaring subtiel doen voelen. Gelukkig maakt de G512LW gebruik van een heel ander paneel dat beter geschikt is voor de doelgroep van hardcore of competitieve gamers.
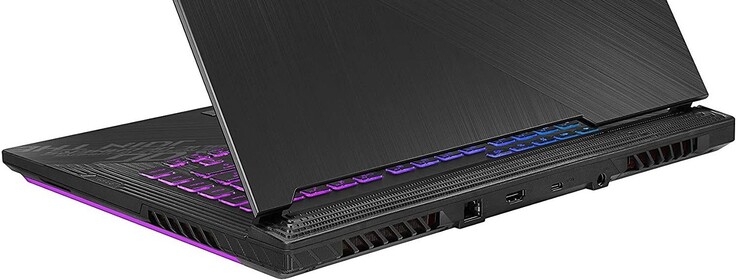
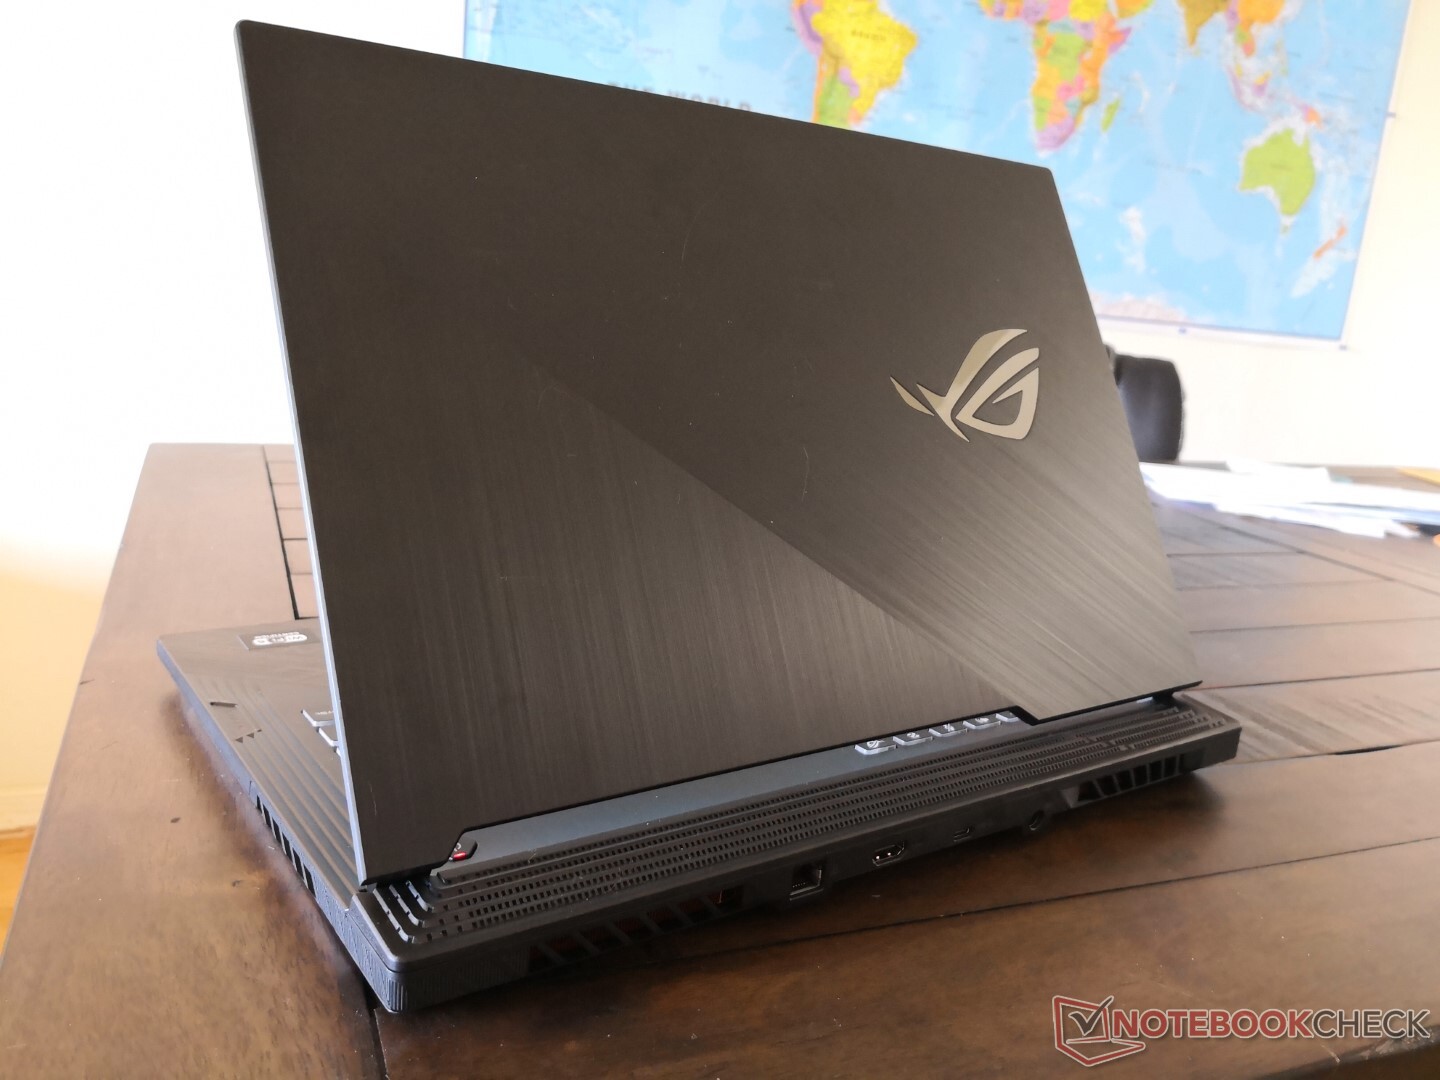
De belangrijkste nadelen blijven allemaal aanwezig op de G512-serie. De Armoury Crate powerprofielen blijven botsen met de Windows powerprofielen. Met name de turbomodus is nodig om de meeste prestaties uit de G512 te halen, wat betekent dat maximale ventilatorruis voor veel gamers onvermijdelijk is. Ondertussen zijn de afmetingen groot, vooral in de lengte, door de uitstekende achterkant. Thunderbolt 3, webcam, SD-kaartlezer en zelfs Asus Keystone zijn allemaal afwezig, wat gebruikers die op deze functies vertrouwen kan irken. Er is veel kracht en uitbreidbaarheid onder de motorkap als je kunt omgaan met de grote voetafdruk, kleine pijltjestoetsen en luide ventilatoren.
Uitstekende prestaties bij behoorlijke temperaturen, vooral gezien het volle vermogen van de GeForce RTX 2070 binnenin. Eigenaren zullen het 240 Hz display en de uitbreidbare RAM en opslagruimte leuk vinden, maar de luide ventilatoren kunnen lastig zijn zonder een koptelefoon.
Asus ROG Strix G15 G512LW
- 04-11-2020 v7 (old)
Allen Ngo
Price comparison

