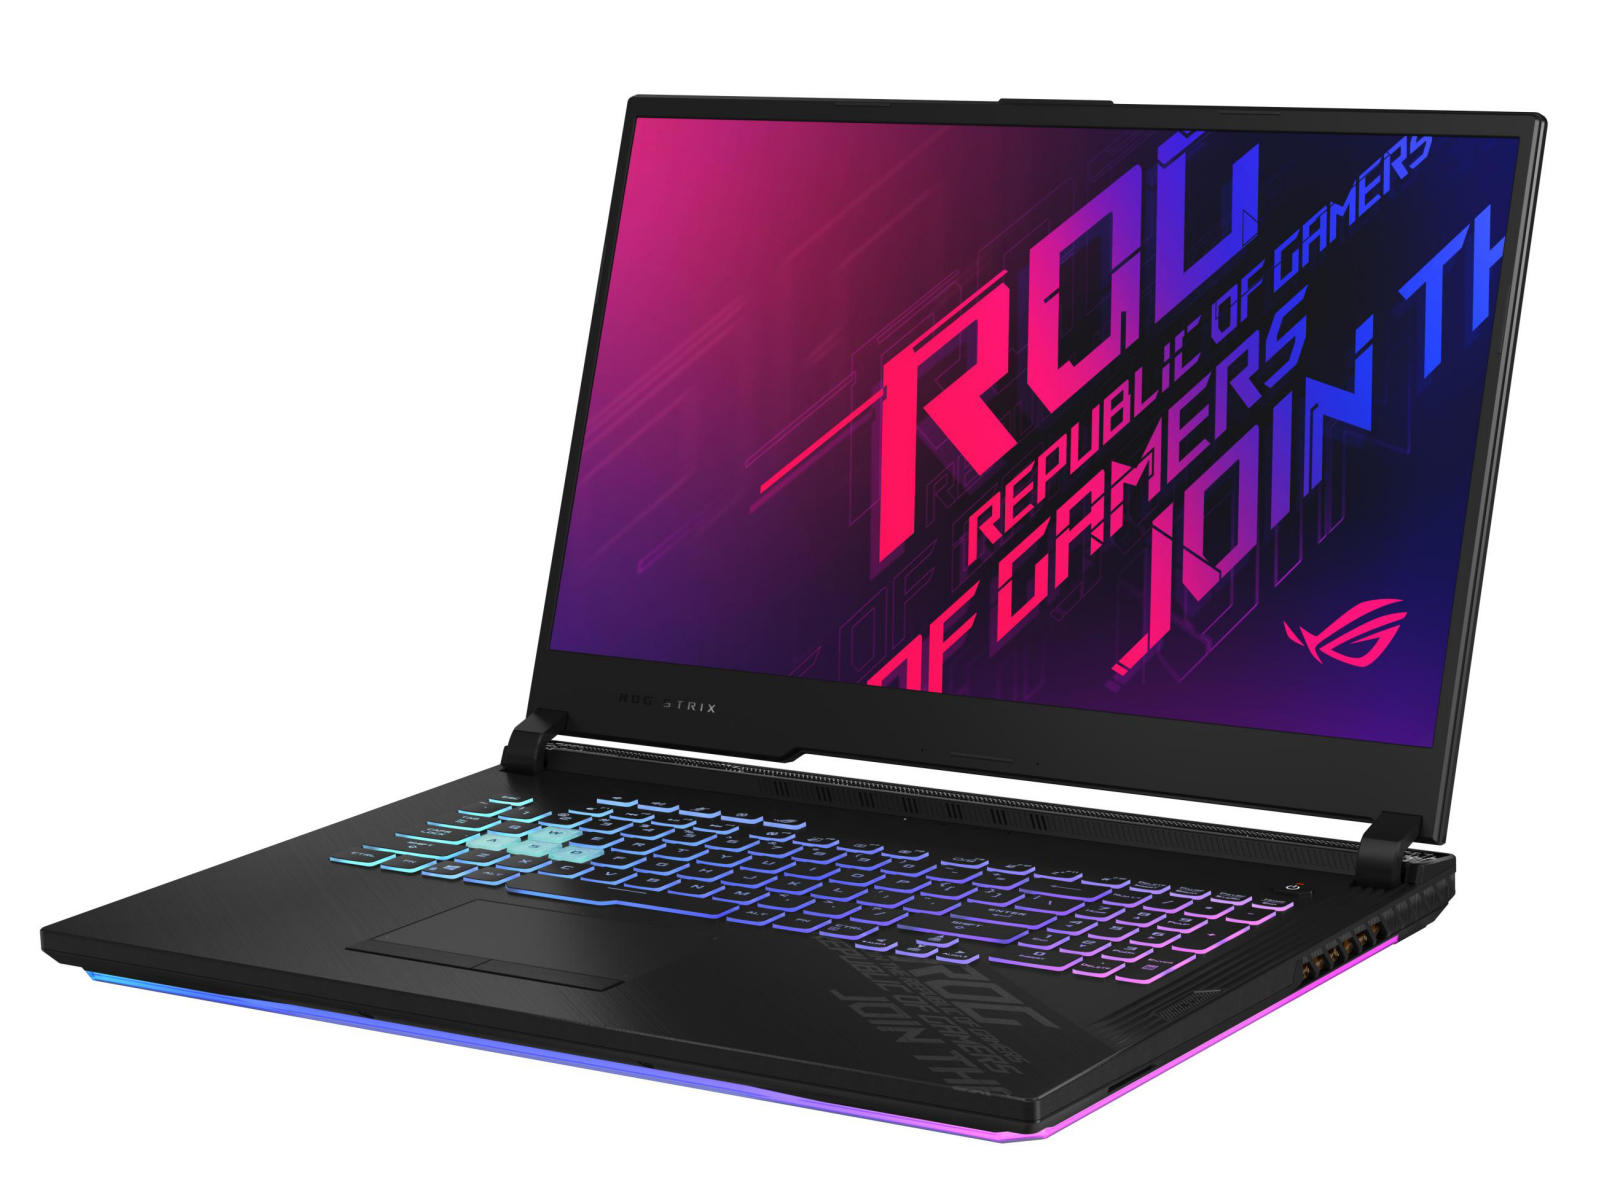
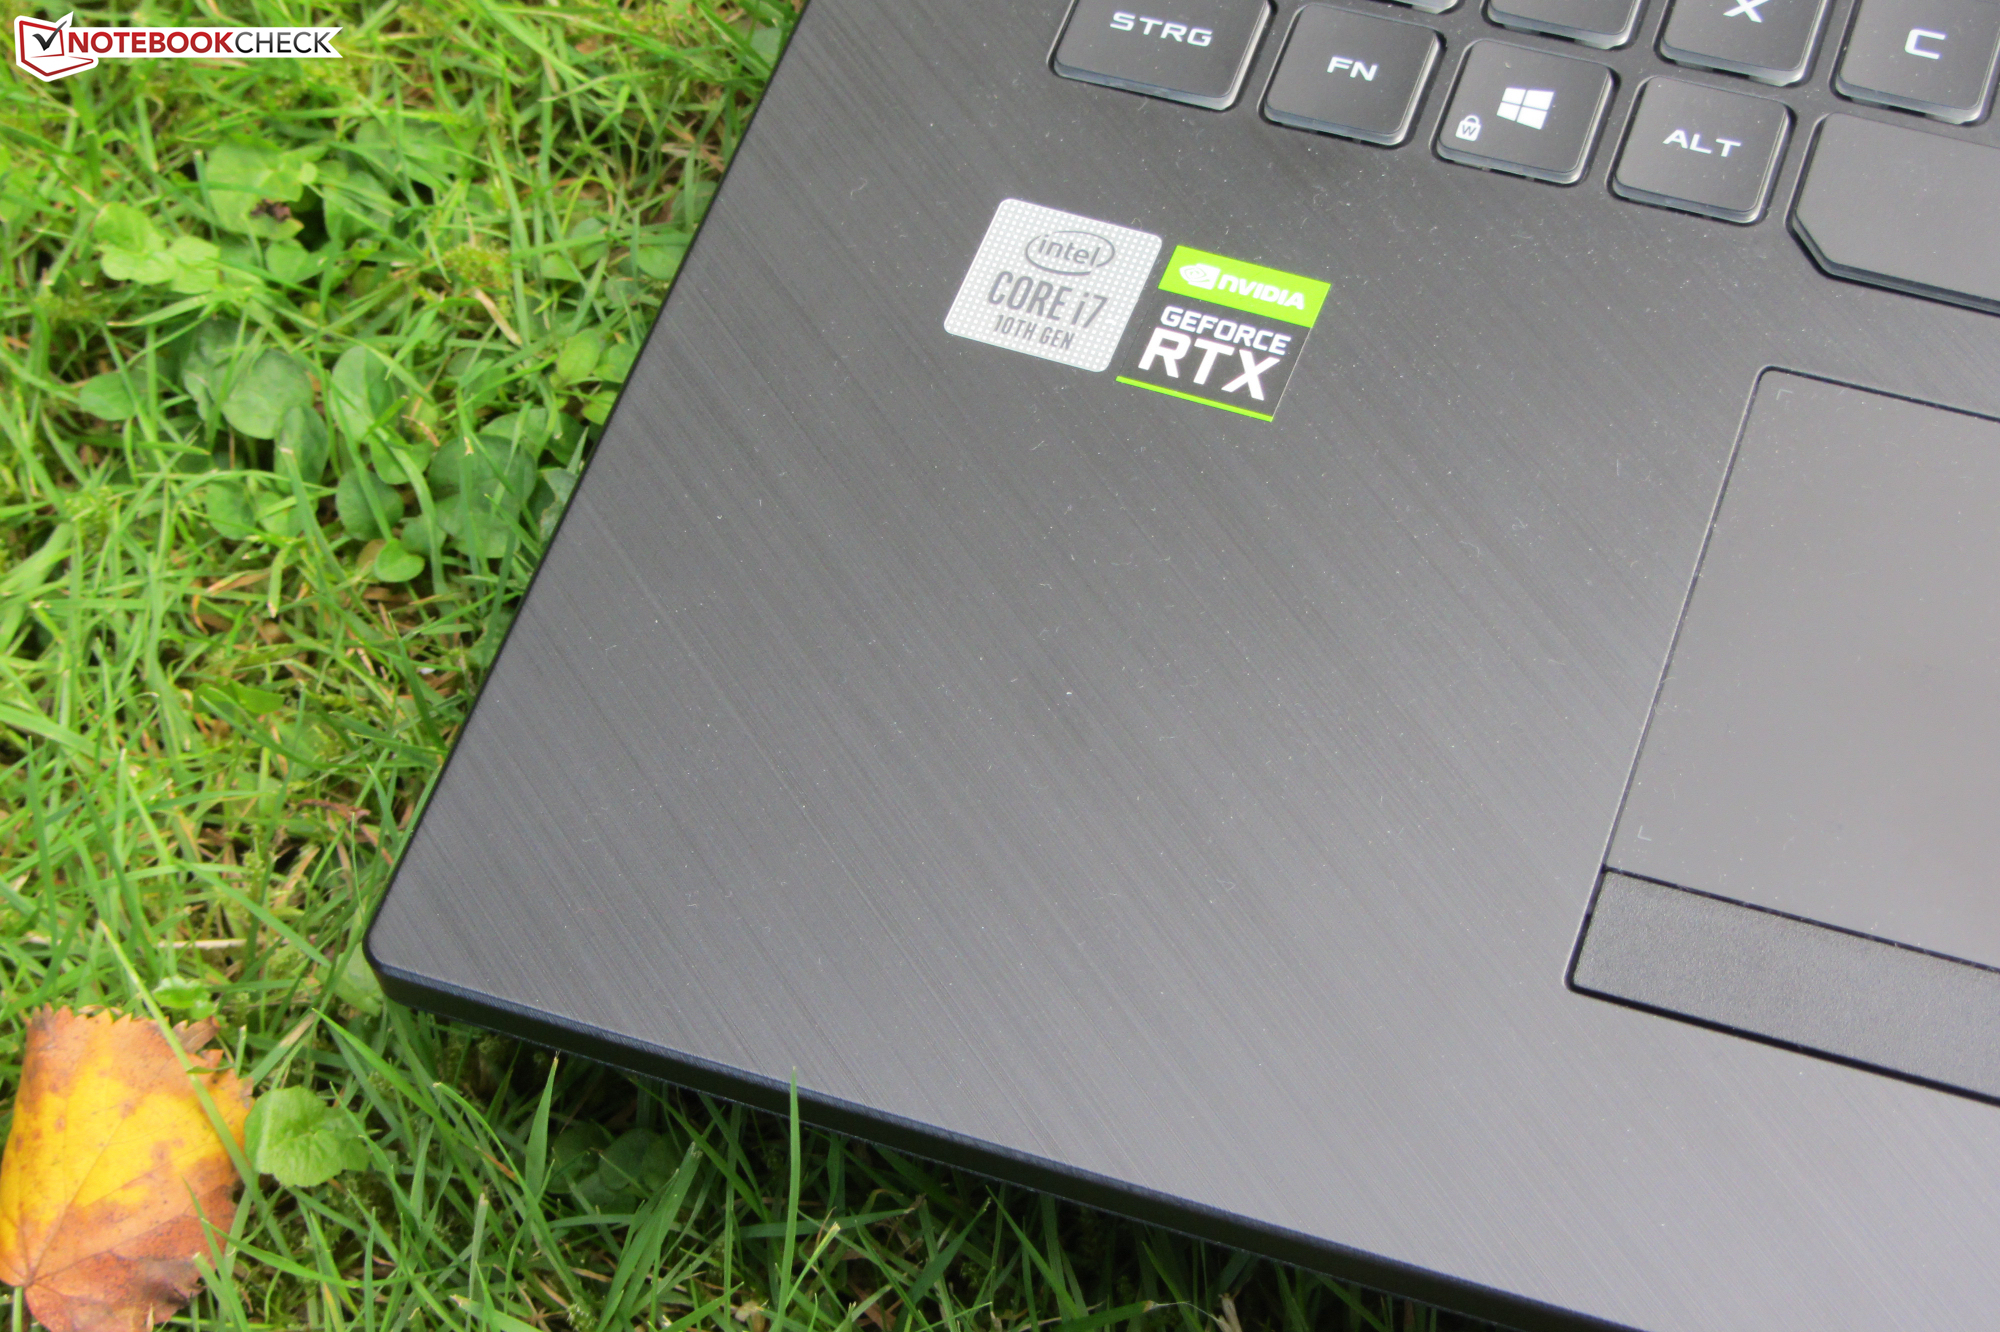
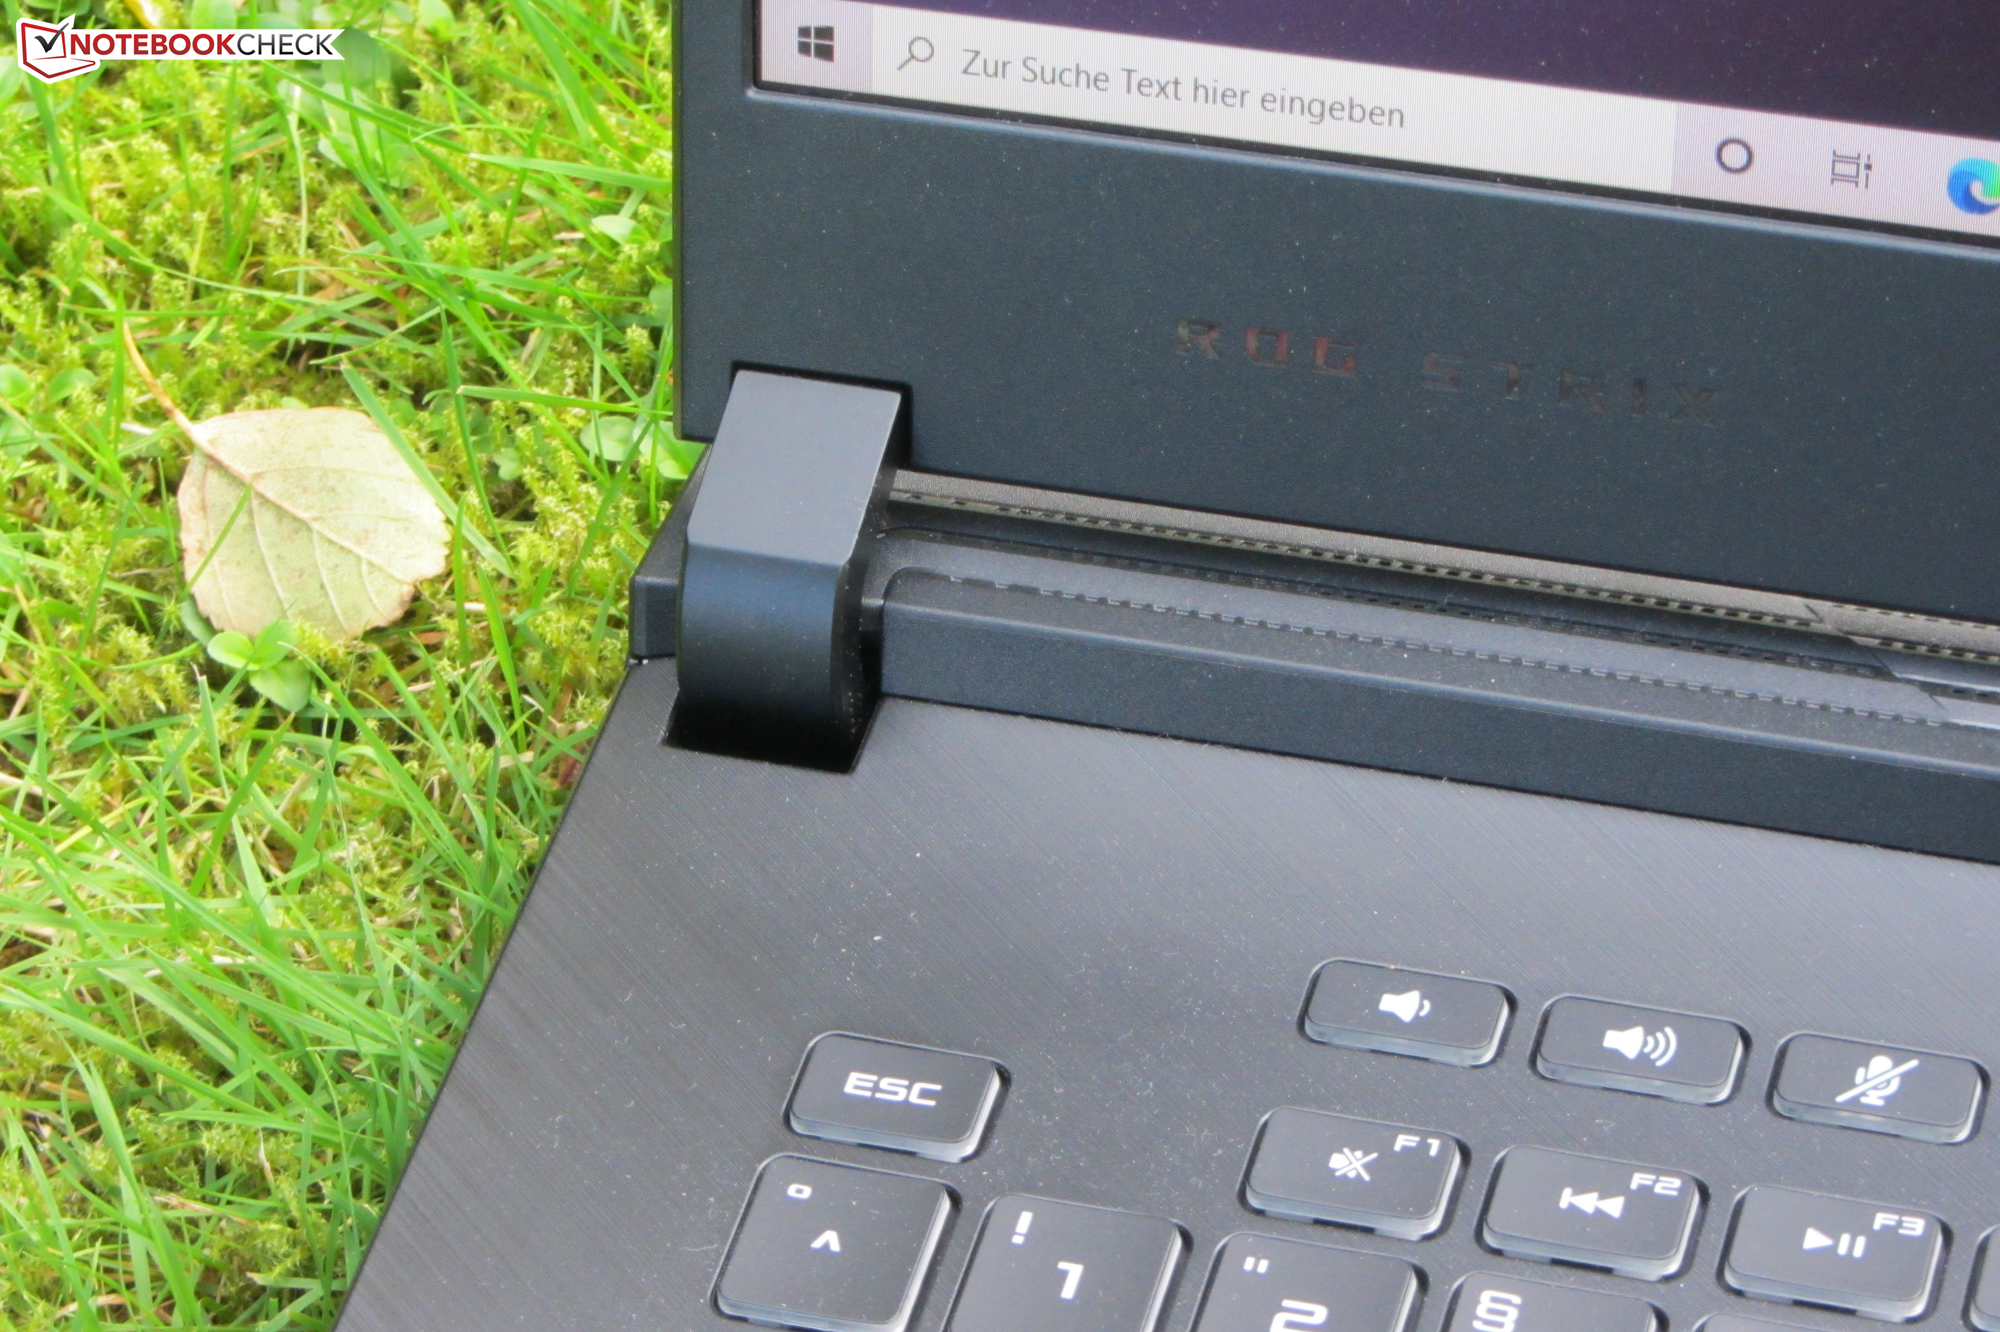
Kort testrapport Asus ROG Strix G17 G712LWS: Krachtige gaming notebook met geïntegreerde lichtshow
Evaluatie | Datum | Model | Gewicht | Hoogte | Formaat | Resolutie | Beste prijs |
|---|---|---|---|---|---|---|---|
| 83.1 % v7 (old) | 10-2020 | Asus Strix G17 G712LWS i7-10750H, GeForce RTX 2070 Super Mobile | 2.8 kg | 26.5 mm | 17.30" | 1920x1080 | |
| 83.2 % v7 (old) | 02-2020 | Schenker XMG Pro 17 PB71RD-G i7-9750H, GeForce RTX 2060 Mobile | 2.8 kg | 30 mm | 17.30" | 1920x1080 | |
| 83.5 % v7 (old) | 08-2020 | MSI GL75 10SFR i7-10750H, GeForce RTX 2070 Mobile | 2.6 kg | 28 mm | 17.30" | 1920x1080 | |
| 84 % v7 (old) | 05-2020 | Lenovo Legion Y740-17IRHg-81UJ001VGE i7-9750H, GeForce RTX 2080 Max-Q | 3 kg | 25.5 mm | 17.30" | 1920x1080 | |
| 83.6 % v7 (old) | 10-2020 | Acer Predator Helios 300 PH317-54-75G8 i7-10750H, GeForce RTX 2060 Mobile | 2.8 kg | 25 mm | 17.30" | 1920x1080 |

| |||||||||||||||||||||||||
Helderheidsverdeling: 89 %
Helderheid in Batterij-modus: 323 cd/m²
Contrast: 1042:1 (Zwart: 0.31 cd/m²)
ΔE ColorChecker Calman: 3.01 | ∀{0.5-29.43 Ø4.71}
calibrated: 1
ΔE Greyscale Calman: 3.8 | ∀{0.09-98 Ø4.96}
90% sRGB (Argyll 1.6.3 3D)
66% AdobeRGB 1998 (Argyll 1.6.3 3D)
66.4% AdobeRGB 1998 (Argyll 3D)
96.8% sRGB (Argyll 3D)
65.2% Display P3 (Argyll 3D)
Gamma: 2.154
CCT: 7507 K
| Asus Strix G17 G712LWS LG Philips LP173WFG-SPB3, IPS, 1920x1080, 17.3" | Asus ROG Strix G GL731GU-RB74 AU Optronics B173HAN04.0, IPS, 1920x1080, 17.3" | Acer Predator Helios 300 PH317-54-75G8 Chi Mei N173HCE-G33, IPS, 1920x1080, 17.3" | Schenker XMG Pro 17 PB71RD-G AU Optronics B173HAN04.0 (AUO409D), IPS, 1920x1080, 17.3" | MSI GL75 10SFR Chi Mei N173HCE-G33, IPS, 1920x1080, 17.3" | Lenovo Legion Y740-17IRHg-81UJ001VGE AUO_B173HAN03, IPS, 1920x1080, 17.3" | |
|---|---|---|---|---|---|---|
| Display | -6% | -3% | -5% | -1% | -3% | |
| Display P3 Coverage (%) | 65.2 | 61.9 -5% | 62.6 -4% | 62.8 -4% | 63.9 -2% | 63.8 -2% |
| sRGB Coverage (%) | 96.8 | 89.4 -8% | 94.3 -3% | 89.8 -7% | 96.2 -1% | 92.7 -4% |
| AdobeRGB 1998 Coverage (%) | 66.4 | 63.3 -5% | 64.7 -3% | 64.2 -3% | 66 -1% | 65.3 -2% |
| Response Times | 24% | -9% | -16% | 15% | -9% | |
| Response Time Grey 50% / Grey 80% * (ms) | 14.4 ? | 6.4 ? 56% | 16.4 ? -14% | 16.8 ? -17% | 12 ? 17% | 16 ? -11% |
| Response Time Black / White * (ms) | 10.4 ? | 11.2 ? -8% | 10.8 ? -4% | 12 ? -15% | 9 ? 13% | 11 ? -6% |
| PWM Frequency (Hz) | 24510 ? | 208 ? | ||||
| Screen | -23% | 27% | -18% | 7% | -7% | |
| Brightness middle (cd/m²) | 323 | 294.3 -9% | 322 0% | 274 -15% | 333 3% | 310 -4% |
| Brightness (cd/m²) | 300 | 289 -4% | 308 3% | 273 -9% | 309 3% | 281 -6% |
| Brightness Distribution (%) | 89 | 89 0% | 92 3% | 95 7% | 86 -3% | 85 -4% |
| Black Level * (cd/m²) | 0.31 | 0.3 3% | 0.18 42% | 0.26 16% | 0.215 31% | 0.31 -0% |
| Contrast (:1) | 1042 | 981 -6% | 1789 72% | 1054 1% | 1549 49% | 1000 -4% |
| Colorchecker dE 2000 * | 3.01 | 3.95 -31% | 1.53 49% | 4.62 -53% | 1.98 34% | 3.86 -28% |
| Colorchecker dE 2000 max. * | 7.65 | 6.49 15% | 3.14 59% | 7.66 -0% | 4.34 43% | 7.8 -2% |
| Colorchecker dE 2000 calibrated * | 1 | 3.08 -208% | 0.74 26% | 1.93 -93% | 2.01 -101% | |
| Greyscale dE 2000 * | 3.8 | 3.7 3% | 1.9 50% | 5.3 -39% | 2.97 22% | 4.48 -18% |
| Gamma | 2.154 102% | 2.07 106% | 2.144 103% | 2.34 94% | 2.41 91% | 2.5 88% |
| CCT | 7507 87% | 7155 91% | 6809 95% | 7619 85% | 6750 96% | 7542 86% |
| Color Space (Percent of AdobeRGB 1998) (%) | 66 | 57.7 -13% | 65 -2% | 58 -12% | 61 -8% | 60 -9% |
| Color Space (Percent of sRGB) (%) | 90 | 89 -1% | 87 -3% | 90 0% | 96 7% | 93 3% |
| Totaal Gemiddelde (Programma / Instellingen) | -2% /
-14% | 5% /
17% | -13% /
-15% | 7% /
7% | -6% /
-6% |
* ... kleiner is beter
Responstijd Scherm
| ↔ Responstijd Zwart naar Wit | ||
|---|---|---|
| 10.4 ms ... stijging ↗ en daling ↘ gecombineerd | ↗ 5.2 ms stijging | 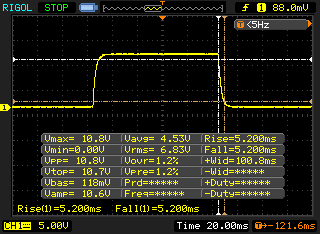 |
| ↘ 5.2 ms daling | ||
| Het scherm vertoonde prima responstijden in onze tests maar is misschien wat te traag voor competitieve games. Ter vergelijking: alle testtoestellen variëren van 0.1 (minimum) tot 240 (maximum) ms. » 28 % van alle toestellen zijn beter. Dit betekent dat de gemeten responstijd beter is dan het gemiddelde (19.8 ms) van alle geteste toestellen. | ||
| ↔ Responstijd 50% Grijs naar 80% Grijs | ||
| 14.4 ms ... stijging ↗ en daling ↘ gecombineerd | ↗ 6.8 ms stijging | 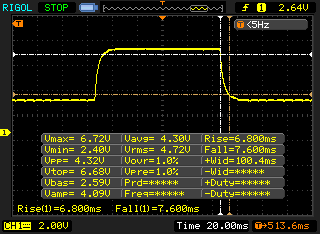 |
| ↘ 7.6 ms daling | ||
| Het scherm vertoonde prima responstijden in onze tests maar is misschien wat te traag voor competitieve games. Ter vergelijking: alle testtoestellen variëren van 0.165 (minimum) tot 636 (maximum) ms. » 29 % van alle toestellen zijn beter. Dit betekent dat de gemeten responstijd beter is dan het gemiddelde (30.9 ms) van alle geteste toestellen. | ||
Screen Flickering / PWM (Pulse-Width Modulation)
| Screen flickering / PWM niet waargenomen | 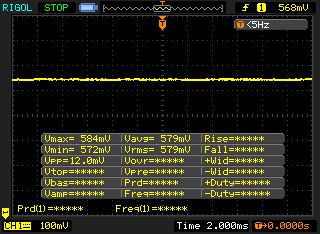 | ||
Ter vergelijking: 52 % van alle geteste toestellen maakten geen gebruik van PWM om de schermhelderheid te verlagen. Als het wel werd gebruikt, werd een gemiddelde van 7744 (minimum: 5 - maximum: 343500) Hz waargenomen. | |||
* ... kleiner is beter
| PCMark 8 Home Score Accelerated v2 | 4412 punten | |
| PCMark 8 Creative Score Accelerated v2 | 4201 punten | |
| PCMark 8 Work Score Accelerated v2 | 5832 punten | |
| PCMark 10 Score | 5262 punten | |
Help | ||
| DPC Latencies / LatencyMon - interrupt to process latency (max), Web, Youtube, Prime95 | |
| Asus Strix G17 G712LWS | |
| MSI GL75 10SFR | |
| Acer Predator Helios 300 PH317-54-75G8 | |
* ... kleiner is beter

| Asus Strix G17 G712LWS Intel SSD 660p 1TB SSDPEKNW010T8 | Asus ROG Strix G GL731GU-RB74 Intel SSD 660p SSDPEKNW512G8 | Acer Predator Helios 300 PH317-54-75G8 WDC PC SN730 SDBQNTY-1T00 | Schenker XMG Pro 17 PB71RD-G Samsung SSD 970 EVO Plus 500GB | MSI GL75 10SFR Lite-On CL1-8D512 | Lenovo Legion Y740-17IRHg-81UJ001VGE Samsung SSD PM981 MZVLB1T0HALR | |
|---|---|---|---|---|---|---|
| CrystalDiskMark 5.2 / 6 | -16% | 27% | 20% | -4% | 16% | |
| Write 4K (MB/s) | 141.1 | 127.6 -10% | 141.9 1% | 117.5 -17% | 132.2 -6% | 101.2 -28% |
| Read 4K (MB/s) | 60.9 | 56 -8% | 48.75 -20% | 46.47 -24% | 45.62 -25% | 44.61 -27% |
| Write Seq (MB/s) | 1681 | 986 -41% | 2734 63% | 1345 -20% | 1511 -10% | 2295 37% |
| Read Seq (MB/s) | 1602 | 1605 0% | 1921 20% | 2804 75% | 1890 18% | 2174 36% |
| Write 4K Q32T1 (MB/s) | 406.6 | 451.5 11% | 422.6 4% | 368.2 -9% | 375.9 -8% | 401.2 -1% |
| Read 4K Q32T1 (MB/s) | 470.2 | 343.3 -27% | 509 8% | 412.9 -12% | 525 12% | 475.5 1% |
| Write Seq Q32T1 (MB/s) | 1759 | 983 -44% | 3055 74% | 3248 85% | 1505 -14% | 2397 36% |
| Read Seq Q32T1 (MB/s) | 1932 | 1810 -6% | 3257 69% | 3559 84% | 2008 4% | 3337 73% |
| AS SSD | -38% | 73% | 83% | -35% | 59% | |
| Seq Read (MB/s) | 1778 | 1319 -26% | 2828 59% | 2946 66% | 1923 8% | 2800 57% |
| Seq Write (MB/s) | 1478 | 930 -37% | 2677 81% | 2627 78% | 1065 -28% | 2424 64% |
| 4K Read (MB/s) | 49.76 | 49.43 -1% | 39.94 -20% | 56.9 14% | 25.43 -49% | 42.77 -14% |
| 4K Write (MB/s) | 117.9 | 104.3 -12% | 100.9 -14% | 151.7 29% | 101.9 -14% | 94.8 -20% |
| 4K-64 Read (MB/s) | 591 | 321.9 -46% | 1562 164% | 1222 107% | 477.9 -19% | 1406 138% |
| 4K-64 Write (MB/s) | 875 | 774 -12% | 1867 113% | 2444 179% | 563 -36% | 1697 94% |
| Access Time Read * (ms) | 0.082 | 0.055 33% | 0.051 38% | 0.053 35% | 0.05 39% | |
| Access Time Write * (ms) | 0.041 | 0.138 -237% | 0.037 10% | 0.025 39% | 0.126 -207% | 0.039 5% |
| Score Read (Points) | 818 | 503 -39% | 1885 130% | 1574 92% | 696 -15% | 1729 111% |
| Score Write (Points) | 1140 | 971 -15% | 2236 96% | 2859 151% | 771 -32% | 2034 78% |
| Score Total (Points) | 2377 | 1731 -27% | 5076 114% | 5232 120% | 1785 -25% | 4630 95% |
| Totaal Gemiddelde (Programma / Instellingen) | -27% /
-29% | 50% /
53% | 52% /
57% | -20% /
-22% | 38% /
41% |
* ... kleiner is beter
Continuous load read: DiskSpd Read Loop, Queue Depth 8
| 3DMark 11 Performance | 20961 punten | |
| 3DMark Cloud Gate Standard Score | 39220 punten | |
| 3DMark Fire Strike Score | 18270 punten | |
| 3DMark Time Spy Score | 8100 punten | |
Help | ||
| The Witcher 3 - 1920x1080 Ultra Graphics & Postprocessing (HBAO+) | |
| Gemiddelde van klas Gaming (104.7 - 240, n=7, laatste 2 jaar) | |
| Asus Strix G17 G712LWS (Turbo) | |
| Asus Strix G17 G712LWS | |
| Gemiddeld NVIDIA GeForce RTX 2070 Super Mobile (76.3 - 94.6, n=8) | |
| Lenovo Legion Y740-17IRHg-81UJ001VGE | |
| MSI GL75 10SFR | |
| Acer Predator Helios 300 PH317-54-75G8 | |
| Schenker XMG Pro 17 PB71RD-G | |
| Asus ROG Strix G GL731GU-RB74 | |
| Horizon Zero Dawn - 1920x1080 Ultimate Quality | |
| Gemiddeld NVIDIA GeForce RTX 2070 Super Mobile (77 - 98, n=3) | |
| Asus Strix G17 G712LWS (Turbo) | |
| Asus Strix G17 G712LWS | |
| Acer Predator Helios 300 PH317-54-75G8 | |
| Doom Eternal - 1920x1080 Ultra Preset | |
| Gemiddeld NVIDIA GeForce RTX 2070 Super Mobile (151 - 190.4, n=5) | |
| Asus Strix G17 G712LWS (Turbo) | |
| Asus Strix G17 G712LWS | |
| MSI GL75 10SFR | |
| Acer Predator Helios 300 PH317-54-75G8 | |
| F1 2020 - 1920x1080 Ultra High Preset AA:T AF:16x | |
| Asus Strix G17 G712LWS (Turbo) | |
| Gemiddeld NVIDIA GeForce RTX 2070 Super Mobile (118 - 124, n=2) | |
| Asus Strix G17 G712LWS | |
| MSI GL75 10SFR | |
| Acer Predator Helios 300 PH317-54-75G8 | |
| Death Stranding - 1920x1080 Very High Preset | |
| Asus Strix G17 G712LWS (Turbo) | |
| Gemiddeld NVIDIA GeForce RTX 2070 Super Mobile (116.2 - 123.8, n=4) | |
| Asus Strix G17 G712LWS | |
| MSI GL75 10SFR | |
| Flight Simulator 2020 - 1920x1080 High-End AA:TAA AF:8x | |
| Gemiddeld NVIDIA GeForce RTX 2070 Super Mobile (48.8 - 53.3, n=2) | |
| Asus Strix G17 G712LWS | |
| Acer Predator Helios 300 PH317-54-75G8 | |
| Serious Sam 4 - 1920x1080 Ultra (DX12) AA:2xMS | |
| Gemiddeld NVIDIA GeForce RTX 2070 Super Mobile (71.1 - 82.1, n=4) | |
| Asus Strix G17 G712LWS | |
| Acer Predator Helios 300 PH317-54-75G8 | |
| Mafia Definitive Edition - 1920x1080 High Preset | |
| Gemiddeld NVIDIA GeForce RTX 2070 Super Mobile (92 - 96.6, n=2) | |
| Asus Strix G17 G712LWS | |
| Acer Predator Helios 300 PH317-54-75G8 | |
| lage | gem. | hoge | ultra | |
|---|---|---|---|---|
| BioShock Infinite (2013) | 371.8 | 308.3 | 299 | 173.4 |
| The Witcher 3 (2015) | 296.3 | 236.7 | 154.3 | 87.8 |
| Shadow of the Tomb Raider (2018) | 121 | 110 | 107 | 100 |
| Doom Eternal (2020) | 219.1 | 165.7 | 158.5 | 155.4 |
| Gears Tactics (2020) | 249.1 | 172.4 | 122.2 | 90 |
| F1 2020 (2020) | 227 | 168 | 147 | 118 |
| Death Stranding (2020) | 145 | 128.2 | 117.8 | 116.2 |
| Horizon Zero Dawn (2020) | 139 | 107 | 94 | 77 |
| Flight Simulator 2020 (2020) | 66.6 | 58 | 48.8 | 37.8 |
| Serious Sam 4 (2020) | 124 | 94 | 81.6 | 71.1 |
| Mafia Definitive Edition (2020) | 123.7 | 95.2 | 92 | |
| Star Wars Squadrons (2020) | 263.1 | 224.6 | 211.5 | 202.4 |
Geluidsniveau
| Onbelast |
| 32 / 34 / 37 dB (A) |
| Belasting |
| 51 / 53 dB (A) |
 | ||
30 dB stil 40 dB(A) hoorbaar 50 dB(A) luid |
||
min: | ||
| Asus Strix G17 G712LWS i7-10750H, GeForce RTX 2070 Super Mobile | Asus ROG Strix G GL731GU-RB74 i7-9750H, GeForce GTX 1660 Ti Mobile | Schenker XMG Pro 17 PB71RD-G i7-9750H, GeForce RTX 2060 Mobile | MSI GL75 10SFR i7-10750H, GeForce RTX 2070 Mobile | Lenovo Legion Y740-17IRHg-81UJ001VGE i7-9750H, GeForce RTX 2080 Max-Q | Acer Predator Helios 300 PH317-54-75G8 i7-10750H, GeForce RTX 2060 Mobile | |
|---|---|---|---|---|---|---|
| Noise | -0% | -3% | -2% | 11% | 7% | |
| uit / omgeving * (dB) | 25 | 28.2 -13% | 30 -20% | 30.1 -20% | 30.3 -21% | 24 4% |
| Idle Minimum * (dB) | 32 | 31.8 1% | 30 6% | 32.2 -1% | 30.3 5% | 25 22% |
| Idle Average * (dB) | 34 | 32 6% | 32 6% | 32.2 5% | 30.3 11% | 30 12% |
| Idle Maximum * (dB) | 37 | 40.6 -10% | 39 -5% | 32.2 13% | 30.5 18% | 37 -0% |
| Load Average * (dB) | 51 | 48 6% | 51 -0% | 52.8 -4% | 40.8 20% | 48 6% |
| Witcher 3 ultra * (dB) | 50 | 48 4% | 54 -8% | 53.8 -8% | 40.5 19% | 50 -0% |
| Load Maximum * (dB) | 53 | 51.5 3% | 54 -2% | 53.2 -0% | 40.8 23% | 52 2% |
* ... kleiner is beter
(-) De maximumtemperatuur aan de bovenzijde bedraagt 53 °C / 127 F, vergeleken met het gemiddelde van 40.4 °C / 105 F, variërend van 21.2 tot 68.8 °C voor de klasse Gaming.
(-) De bodem warmt op tot een maximum van 56 °C / 133 F, vergeleken met een gemiddelde van 43.2 °C / 110 F
(+) Bij onbelast gebruik bedraagt de gemiddelde temperatuur voor de bovenzijde 27.7 °C / 82 F, vergeleken met het apparaatgemiddelde van 33.9 °C / 93 F.
(-) Bij het spelen van The Witcher 3 is de gemiddelde temperatuur voor de bovenzijde 39.6 °C / 103 F, vergeleken met het apparaatgemiddelde van 33.9 °C / 93 F.
(+) De palmsteunen en het touchpad zijn met een maximum van ###max## °C / 82.4 F koeler dan de huidtemperatuur en voelen daarom koel aan.
(±) De gemiddelde temperatuur van de handpalmsteun van soortgelijke toestellen bedroeg 28.8 °C / 83.8 F (+0.8 °C / 1.4 F).
| Asus Strix G17 G712LWS i7-10750H, GeForce RTX 2070 Super Mobile | Asus ROG Strix G GL731GU-RB74 i7-9750H, GeForce GTX 1660 Ti Mobile | Schenker XMG Pro 17 PB71RD-G i7-9750H, GeForce RTX 2060 Mobile | MSI GL75 10SFR i7-10750H, GeForce RTX 2070 Mobile | Lenovo Legion Y740-17IRHg-81UJ001VGE i7-9750H, GeForce RTX 2080 Max-Q | Acer Predator Helios 300 PH317-54-75G8 i7-10750H, GeForce RTX 2060 Mobile | |
|---|---|---|---|---|---|---|
| Heat | 4% | 3% | 12% | 7% | -2% | |
| Maximum Upper Side * (°C) | 53 | 44.6 16% | 47 11% | 44 17% | 40.7 23% | 53 -0% |
| Maximum Bottom * (°C) | 56 | 51.6 8% | 48 14% | 42.5 24% | 42.2 25% | 59 -5% |
| Idle Upper Side * (°C) | 29 | 31.6 -9% | 30 -3% | 29.1 -0% | 31.9 -10% | 29 -0% |
| Idle Bottom * (°C) | 31 | 31.4 -1% | 34 -10% | 29.5 5% | 33.9 -9% | 32 -3% |
* ... kleiner is beter
Asus Strix G17 G712LWS audioanalyse
(±) | luidspreker luidheid is gemiddeld maar goed (81 dB)
Bas 100 - 315 Hz
(±) | verminderde zeebaars - gemiddeld 9.8% lager dan de mediaan
(±) | lineariteit van de lage tonen is gemiddeld (8.3% delta ten opzichte van de vorige frequentie)
Midden 400 - 2000 Hz
(±) | hogere middens - gemiddeld 5.5% hoger dan de mediaan
(+) | de middentonen zijn lineair (5.8% delta ten opzichte van de vorige frequentie)
Hoog 2 - 16 kHz
(+) | evenwichtige hoogtepunten - slechts 2.4% verwijderd van de mediaan
(+) | de hoge tonen zijn lineair (3.4% delta naar de vorige frequentie)
Algemeen 100 - 16.000 Hz
(+) | het totale geluid is lineair (12.9% verschil met de mediaan)
Vergeleken met dezelfde klasse
» 17% van alle geteste apparaten in deze klasse waren beter, 4% vergelijkbaar, 79% slechter
» De beste had een delta van 6%, het gemiddelde was 18%, de slechtste was 132%
Vergeleken met alle geteste toestellen
» 12% van alle geteste apparaten waren beter, 3% gelijk, 85% slechter
» De beste had een delta van 4%, het gemiddelde was 23%, de slechtste was 134%
| Uit / Standby | |
| Inactief | |
| Belasting |
|
Key:
min: | |
| Asus Strix G17 G712LWS i7-10750H, GeForce RTX 2070 Super Mobile | Asus ROG Strix G GL731GU-RB74 i7-9750H, GeForce GTX 1660 Ti Mobile | Schenker XMG Pro 17 PB71RD-G i7-9750H, GeForce RTX 2060 Mobile | MSI GL75 10SFR i7-10750H, GeForce RTX 2070 Mobile | Lenovo Legion Y740-17IRHg-81UJ001VGE i7-9750H, GeForce RTX 2080 Max-Q | Acer Predator Helios 300 PH317-54-75G8 i7-10750H, GeForce RTX 2060 Mobile | |
|---|---|---|---|---|---|---|
| Power Consumption | -18% | 1% | -2% | -20% | 25% | |
| Idle Minimum * (Watt) | 10 | 13.6 -36% | 11 -10% | 12 -20% | 15.7 -57% | 6 40% |
| Idle Average * (Watt) | 14 | 26.2 -87% | 18 -29% | 16.6 -19% | 26.3 -88% | 11 21% |
| Idle Maximum * (Watt) | 25 | 35 -40% | 28 -12% | 18 28% | 28 -12% | 19 24% |
| Load Average * (Watt) | 134 | 113.6 15% | 99 26% | 130 3% | 136 -1% | 96 28% |
| Witcher 3 ultra * (Watt) | 186 | 134.1 28% | 146 22% | 203 -9% | 160 14% | 144 23% |
| Load Maximum * (Watt) | 230 | 200.2 13% | 210 9% | 224 3% | 177 23% | 197 14% |
* ... kleiner is beter
| Asus Strix G17 G712LWS i7-10750H, GeForce RTX 2070 Super Mobile, 66 Wh | Asus ROG Strix G GL731GU-RB74 i7-9750H, GeForce GTX 1660 Ti Mobile, 66 Wh | Schenker XMG Pro 17 PB71RD-G i7-9750H, GeForce RTX 2060 Mobile, 62 Wh | MSI GL75 10SFR i7-10750H, GeForce RTX 2070 Mobile, 51 Wh | Lenovo Legion Y740-17IRHg-81UJ001VGE i7-9750H, GeForce RTX 2080 Max-Q, 76 Wh | Acer Predator Helios 300 PH317-54-75G8 i7-10750H, GeForce RTX 2060 Mobile, 59 Wh | |
|---|---|---|---|---|---|---|
| Batterijduur | -5% | -29% | -34% | -47% | 1% | |
| Reader / Idle (h) | 9.1 | 8.6 -5% | 5.2 -43% | 6.4 -30% | 3.8 -58% | 8.2 -10% |
| H.264 (h) | 7.1 | 5.2 -27% | 2.8 -61% | 5.9 -17% | ||
| WiFi v1.3 (h) | 5.5 | 4.9 -11% | 4.1 -25% | 3.9 -29% | 3 -45% | 5.1 -7% |
| Load (h) | 1.6 | 1.6 0% | 1.3 -19% | 0.8 -50% | 1.2 -25% | 2.2 38% |
Pro
Contra
Voor het volledige, Engelse testrapport, klik hier.
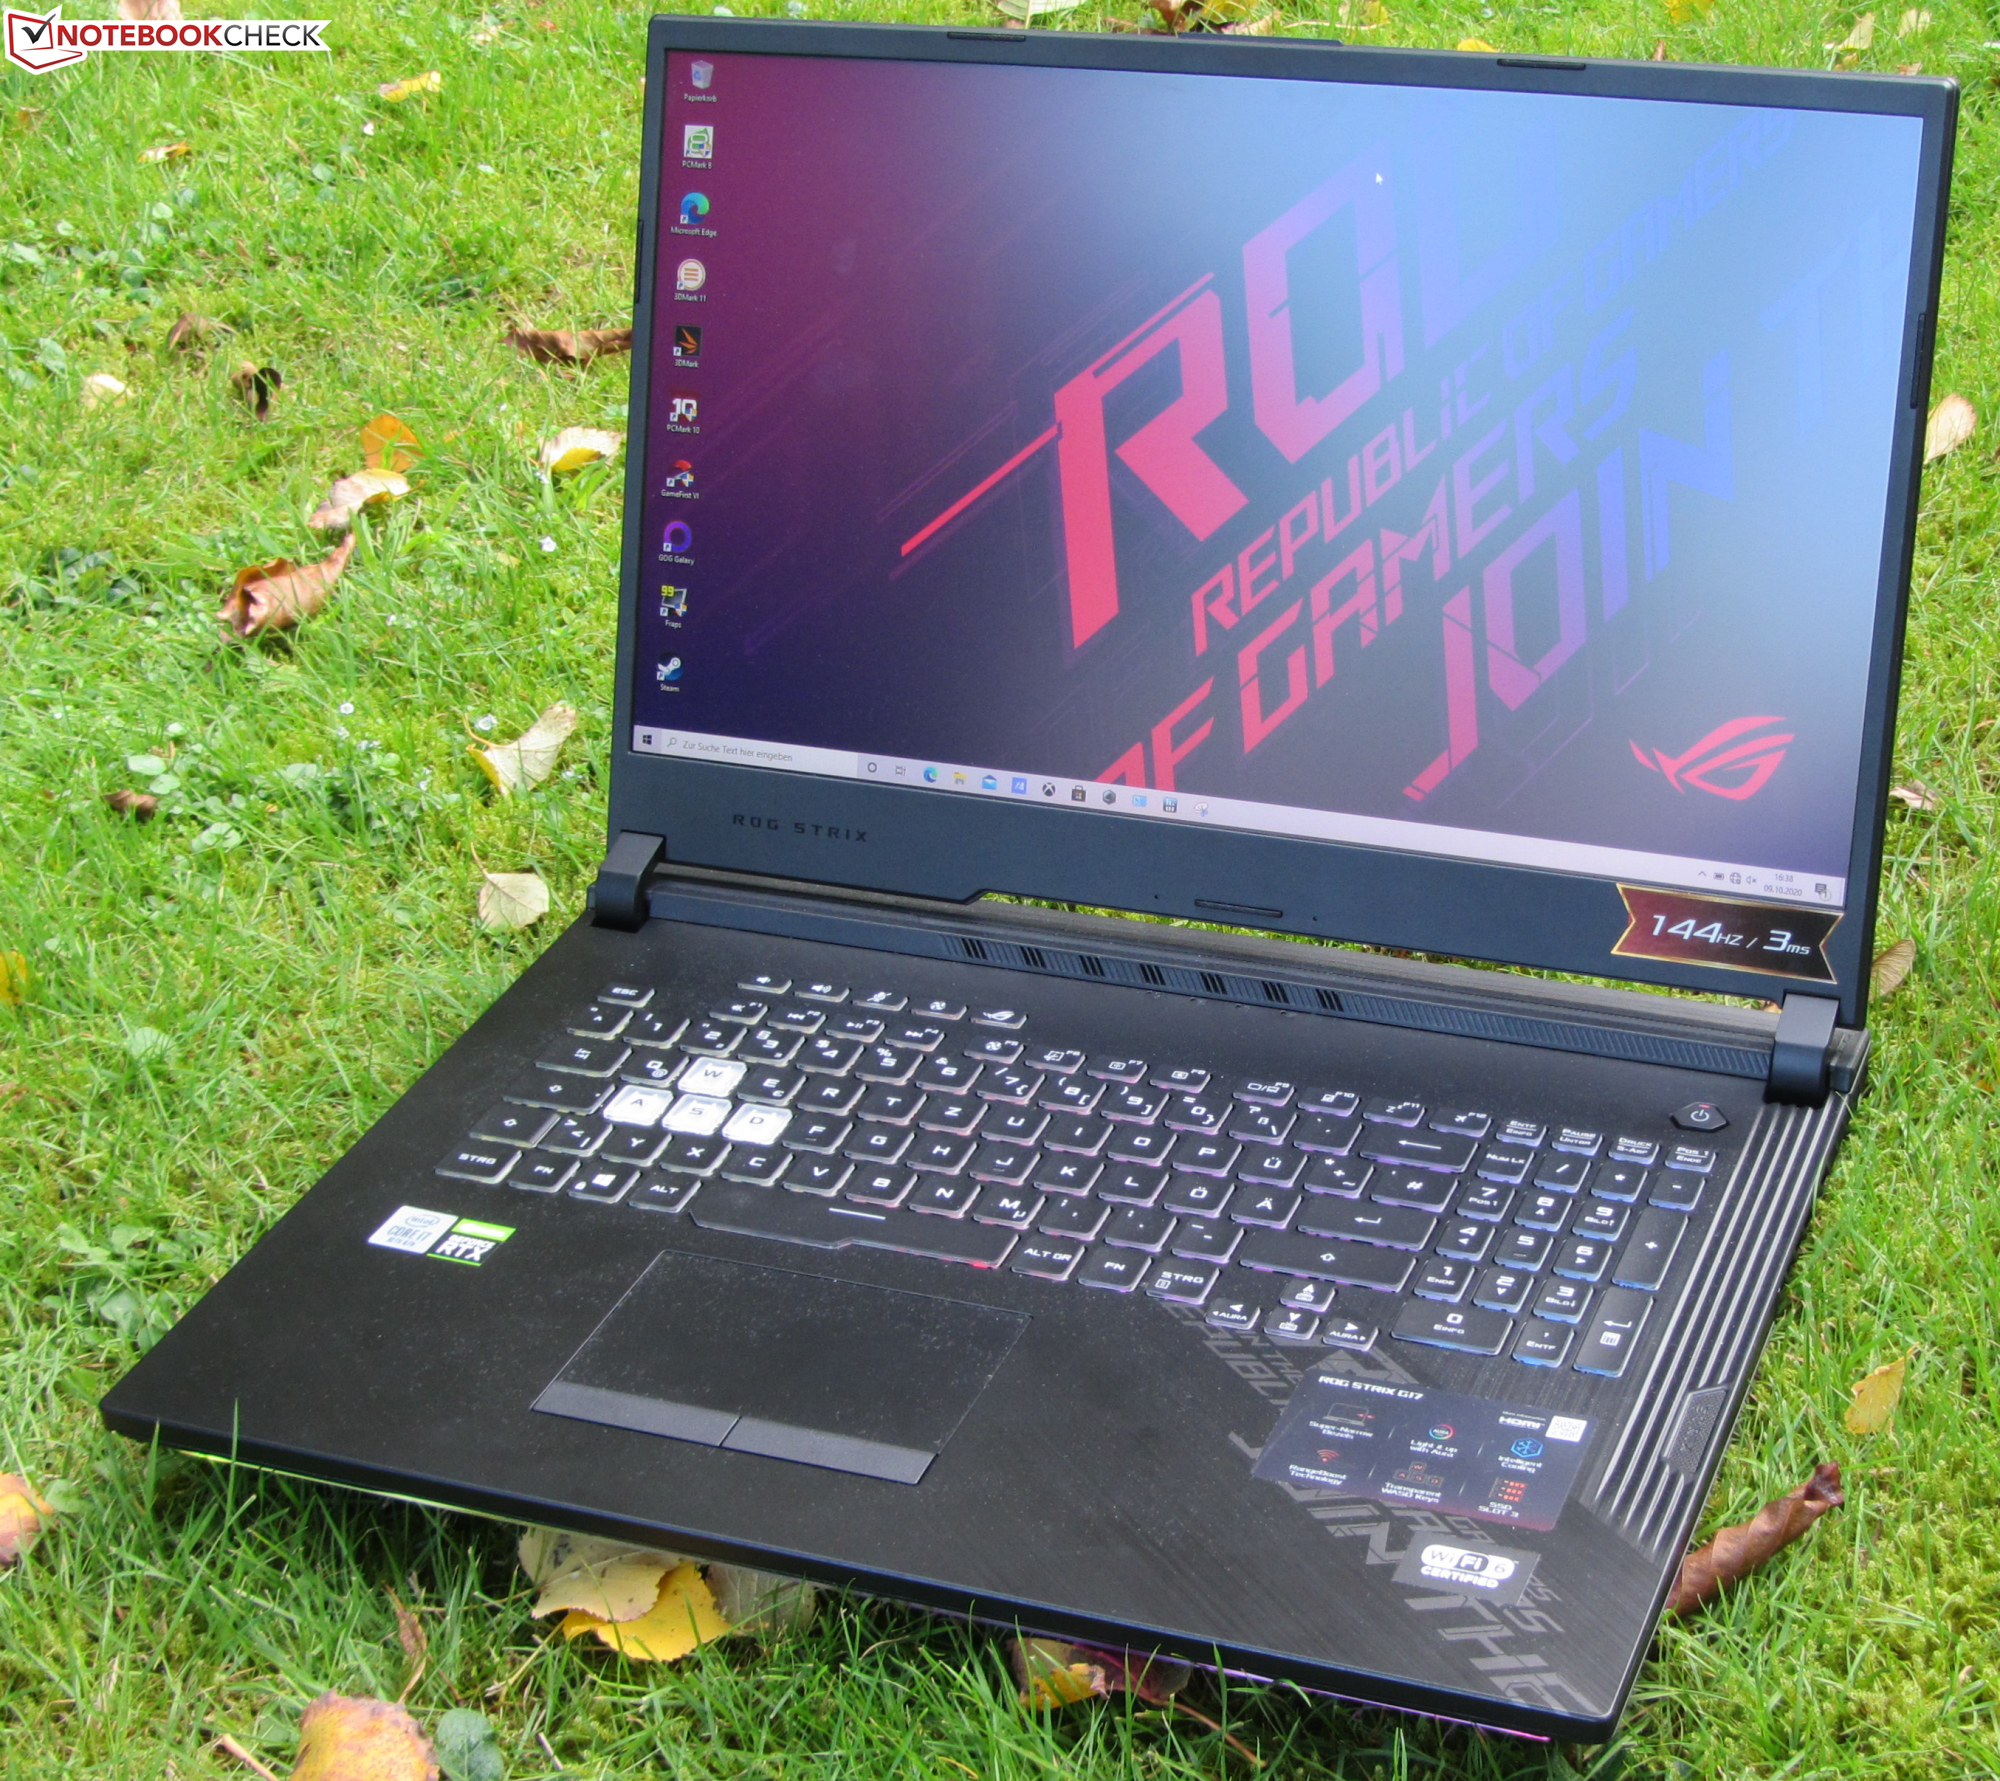
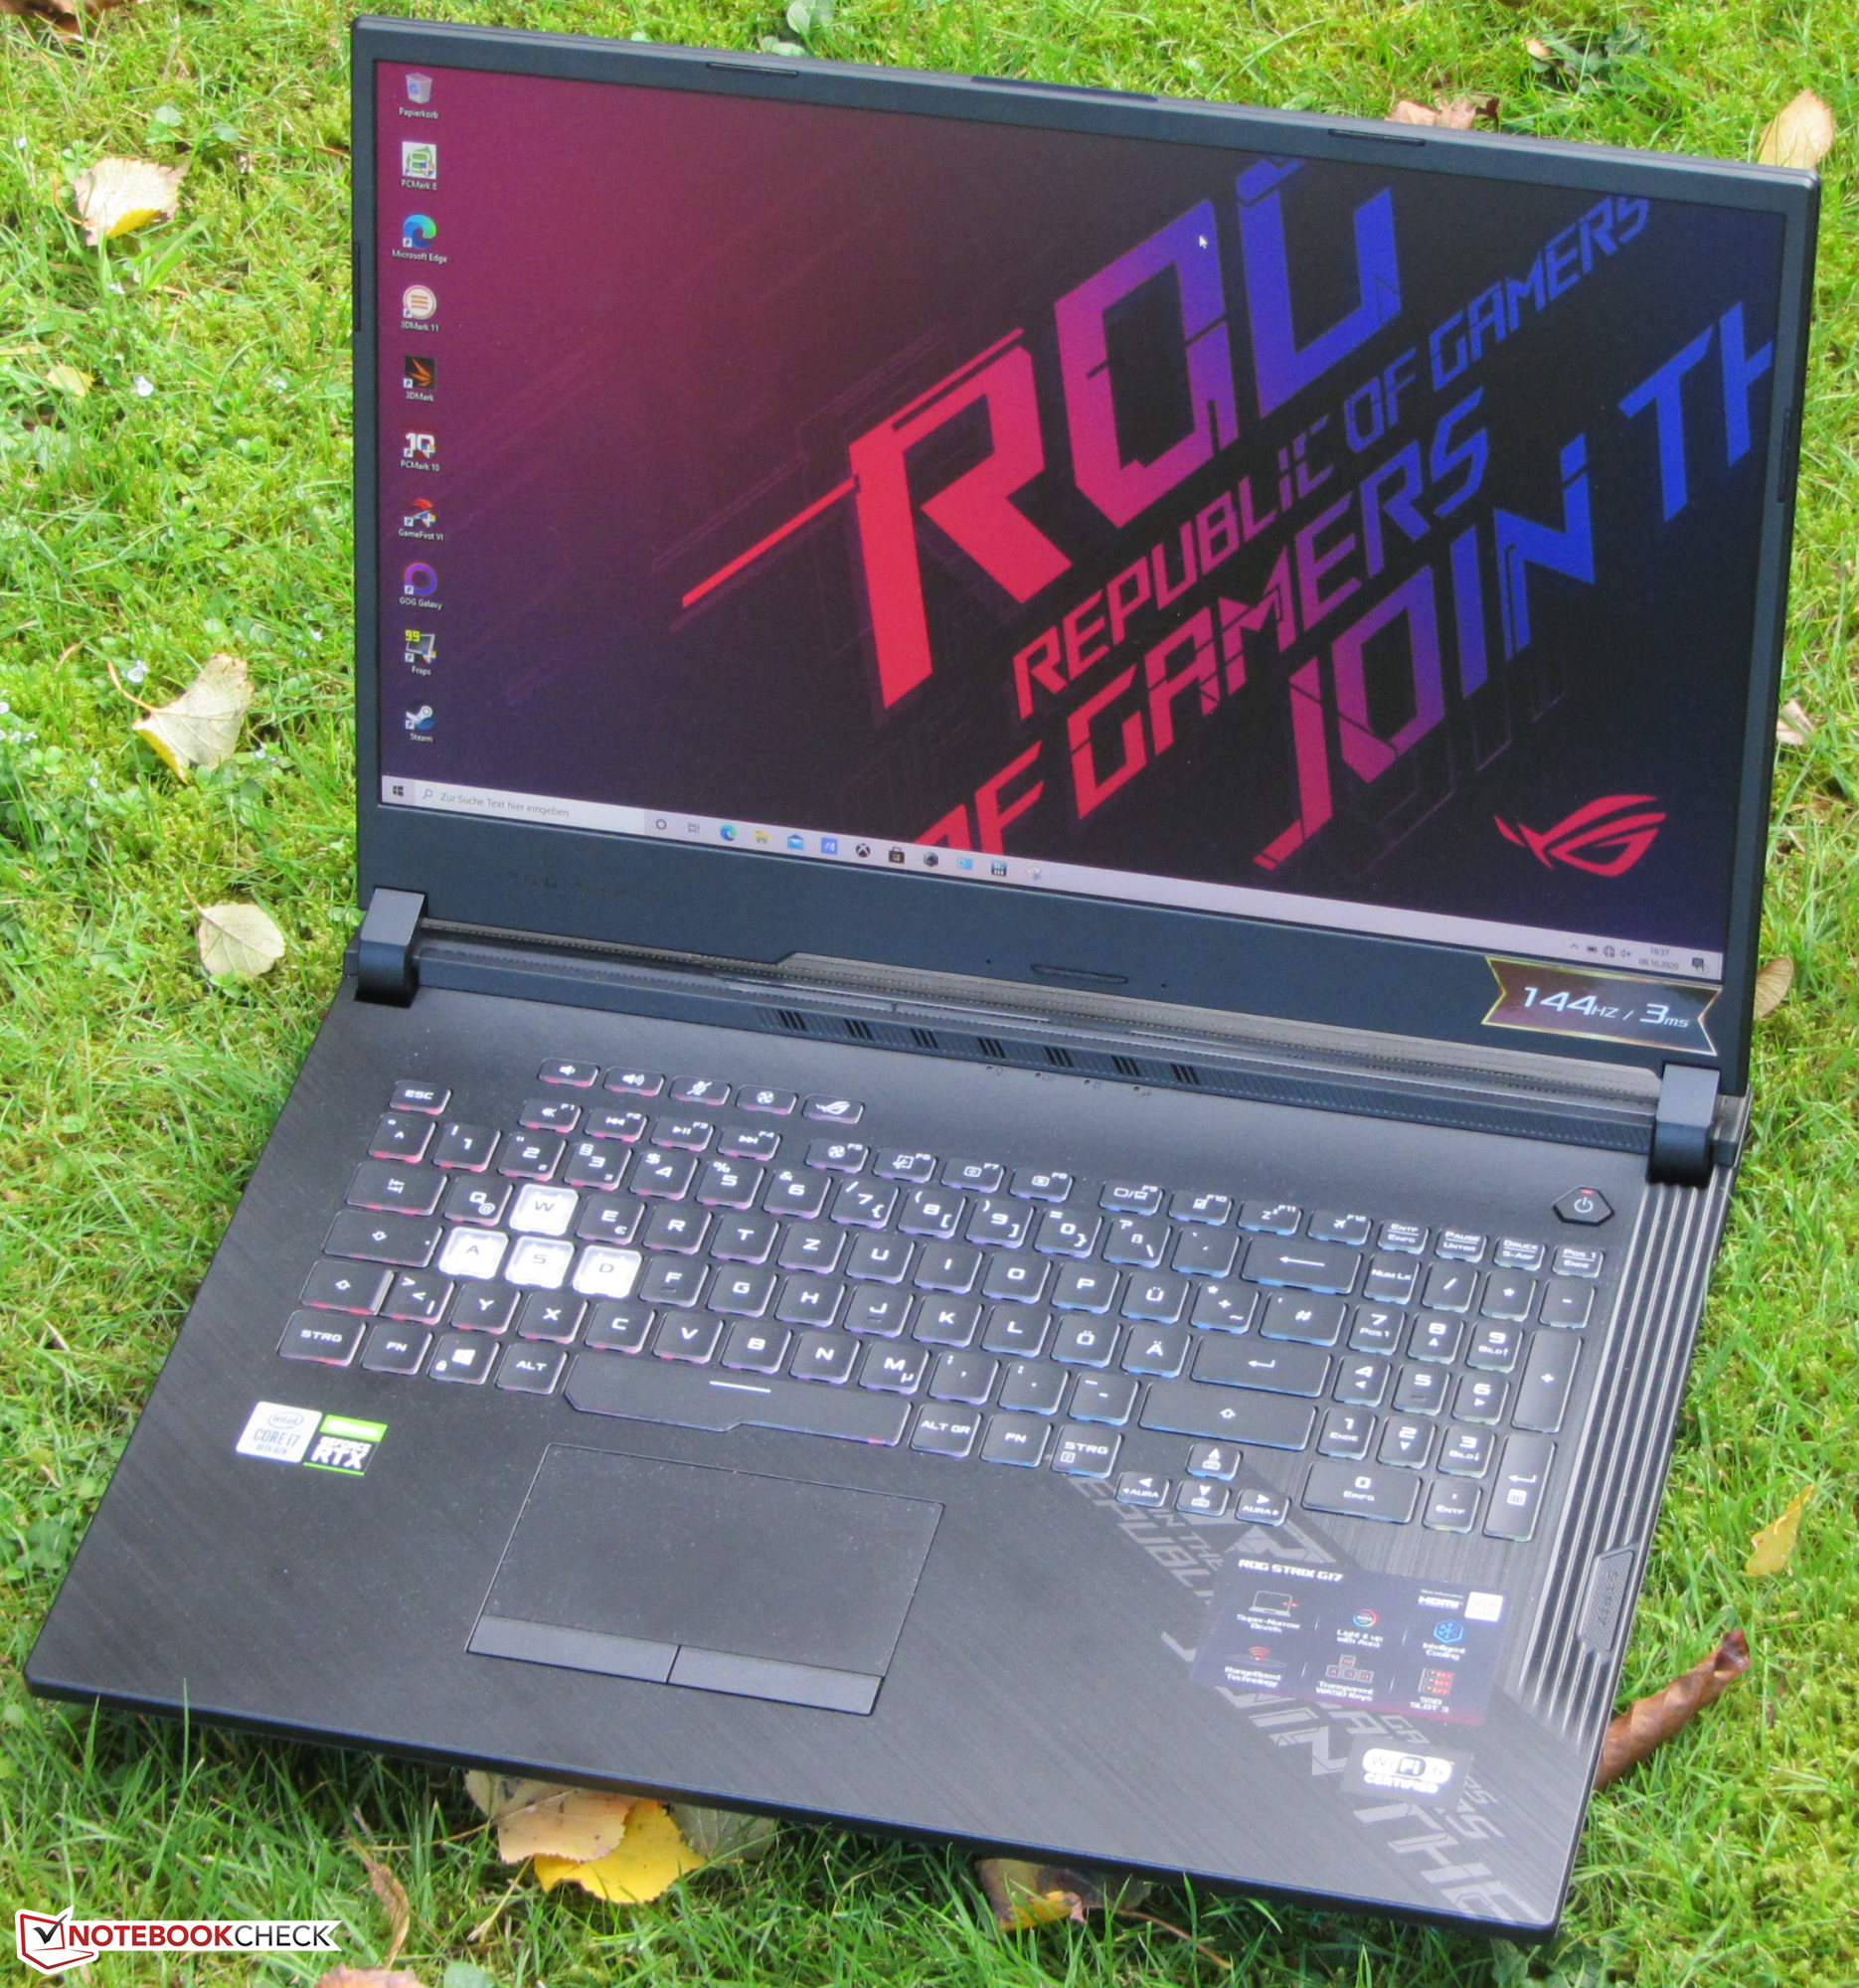
De krachtige hardware van de Strix G17 draait de nieuwste computerspellen vloeiend op het scherm. Je hoeft geen compromissen te sluiten als het gaat om resolutie en kwaliteitsniveau.
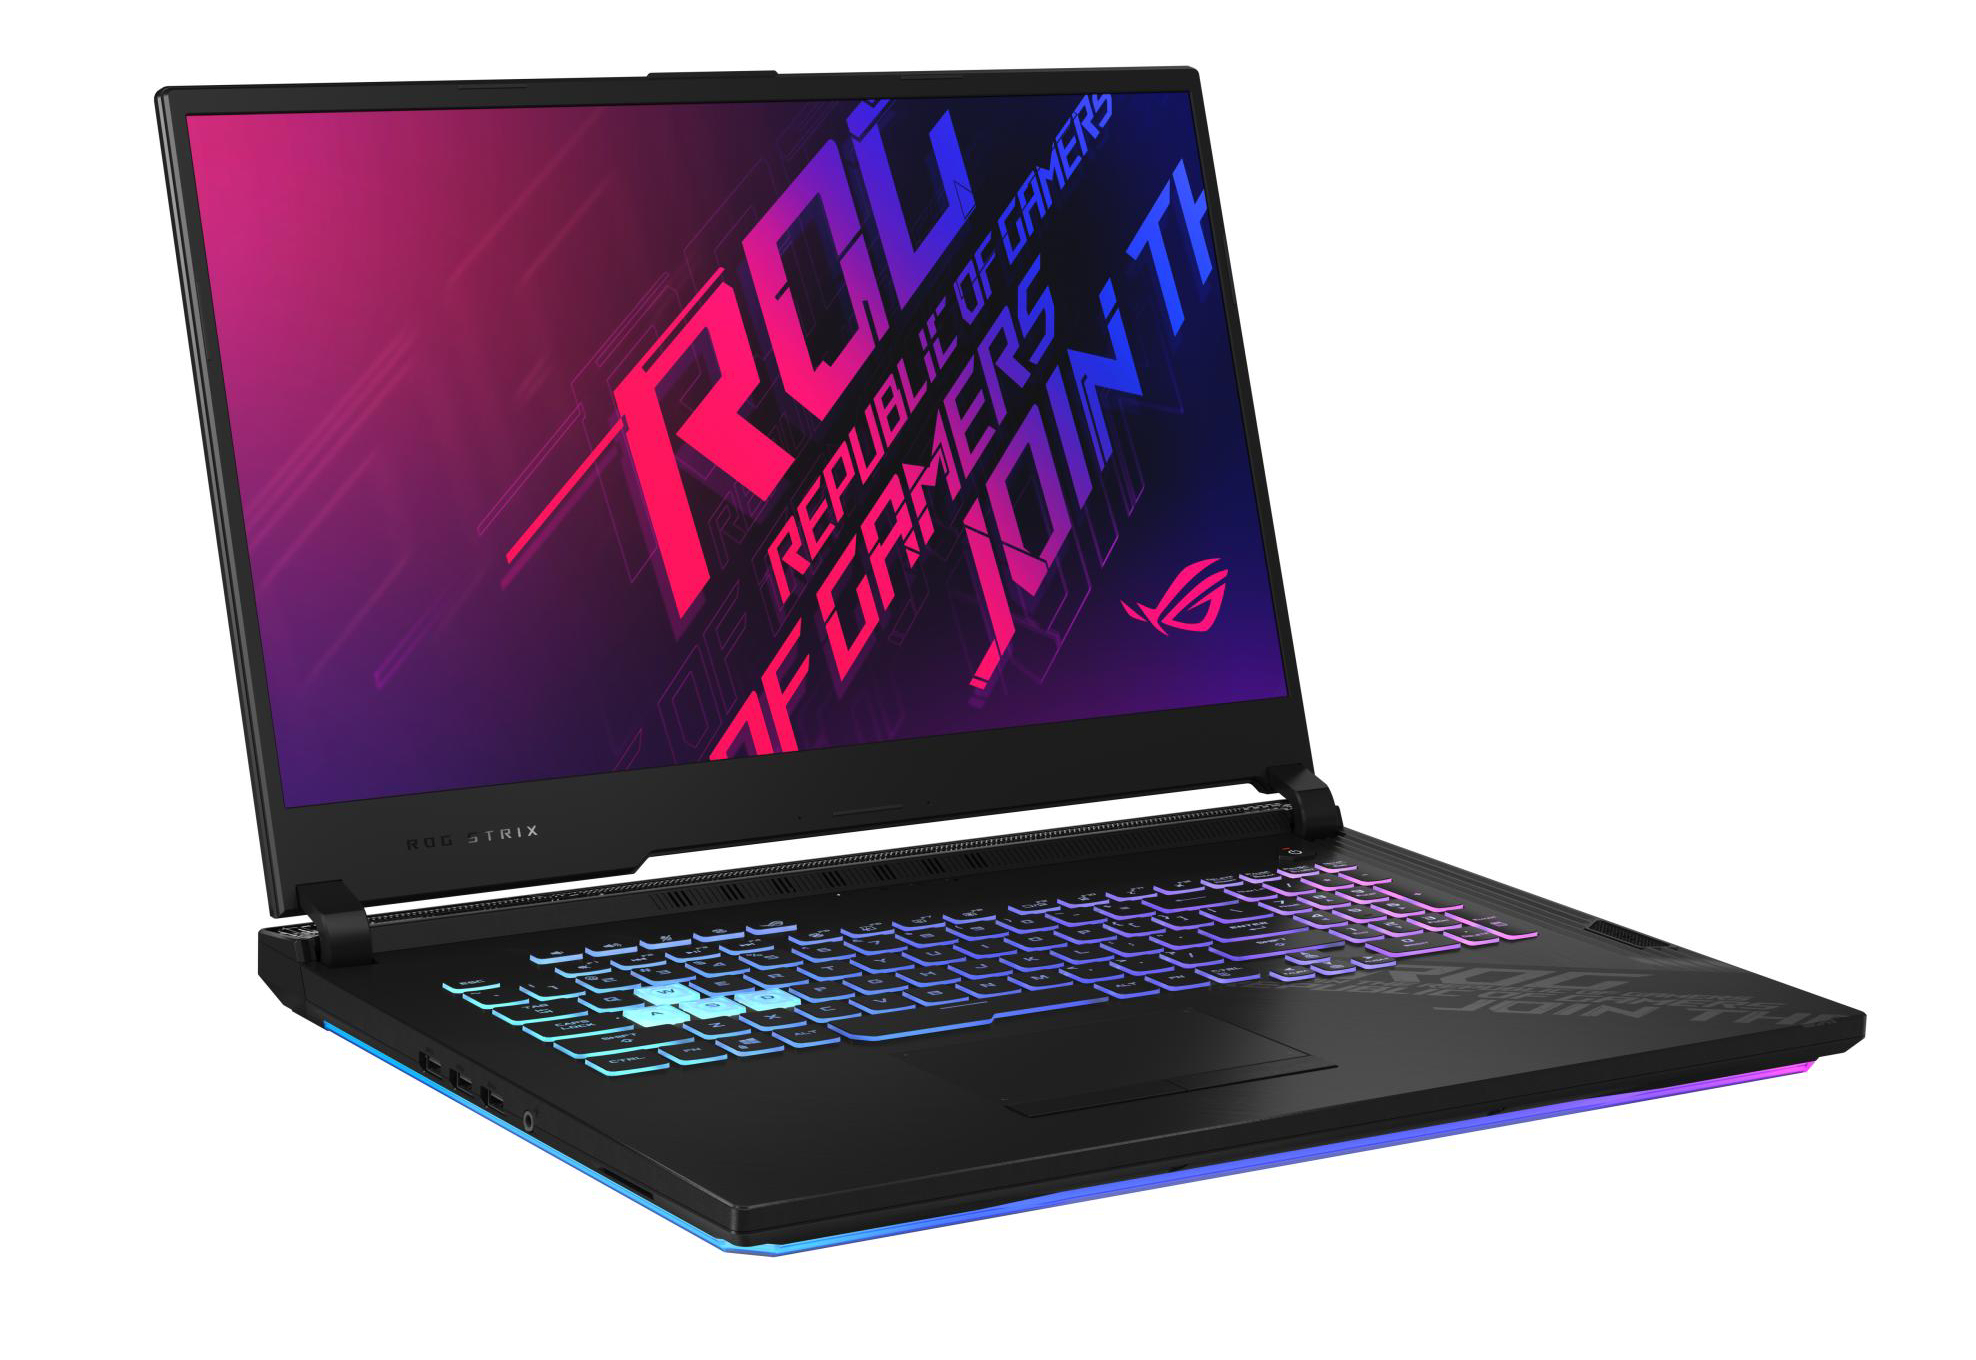
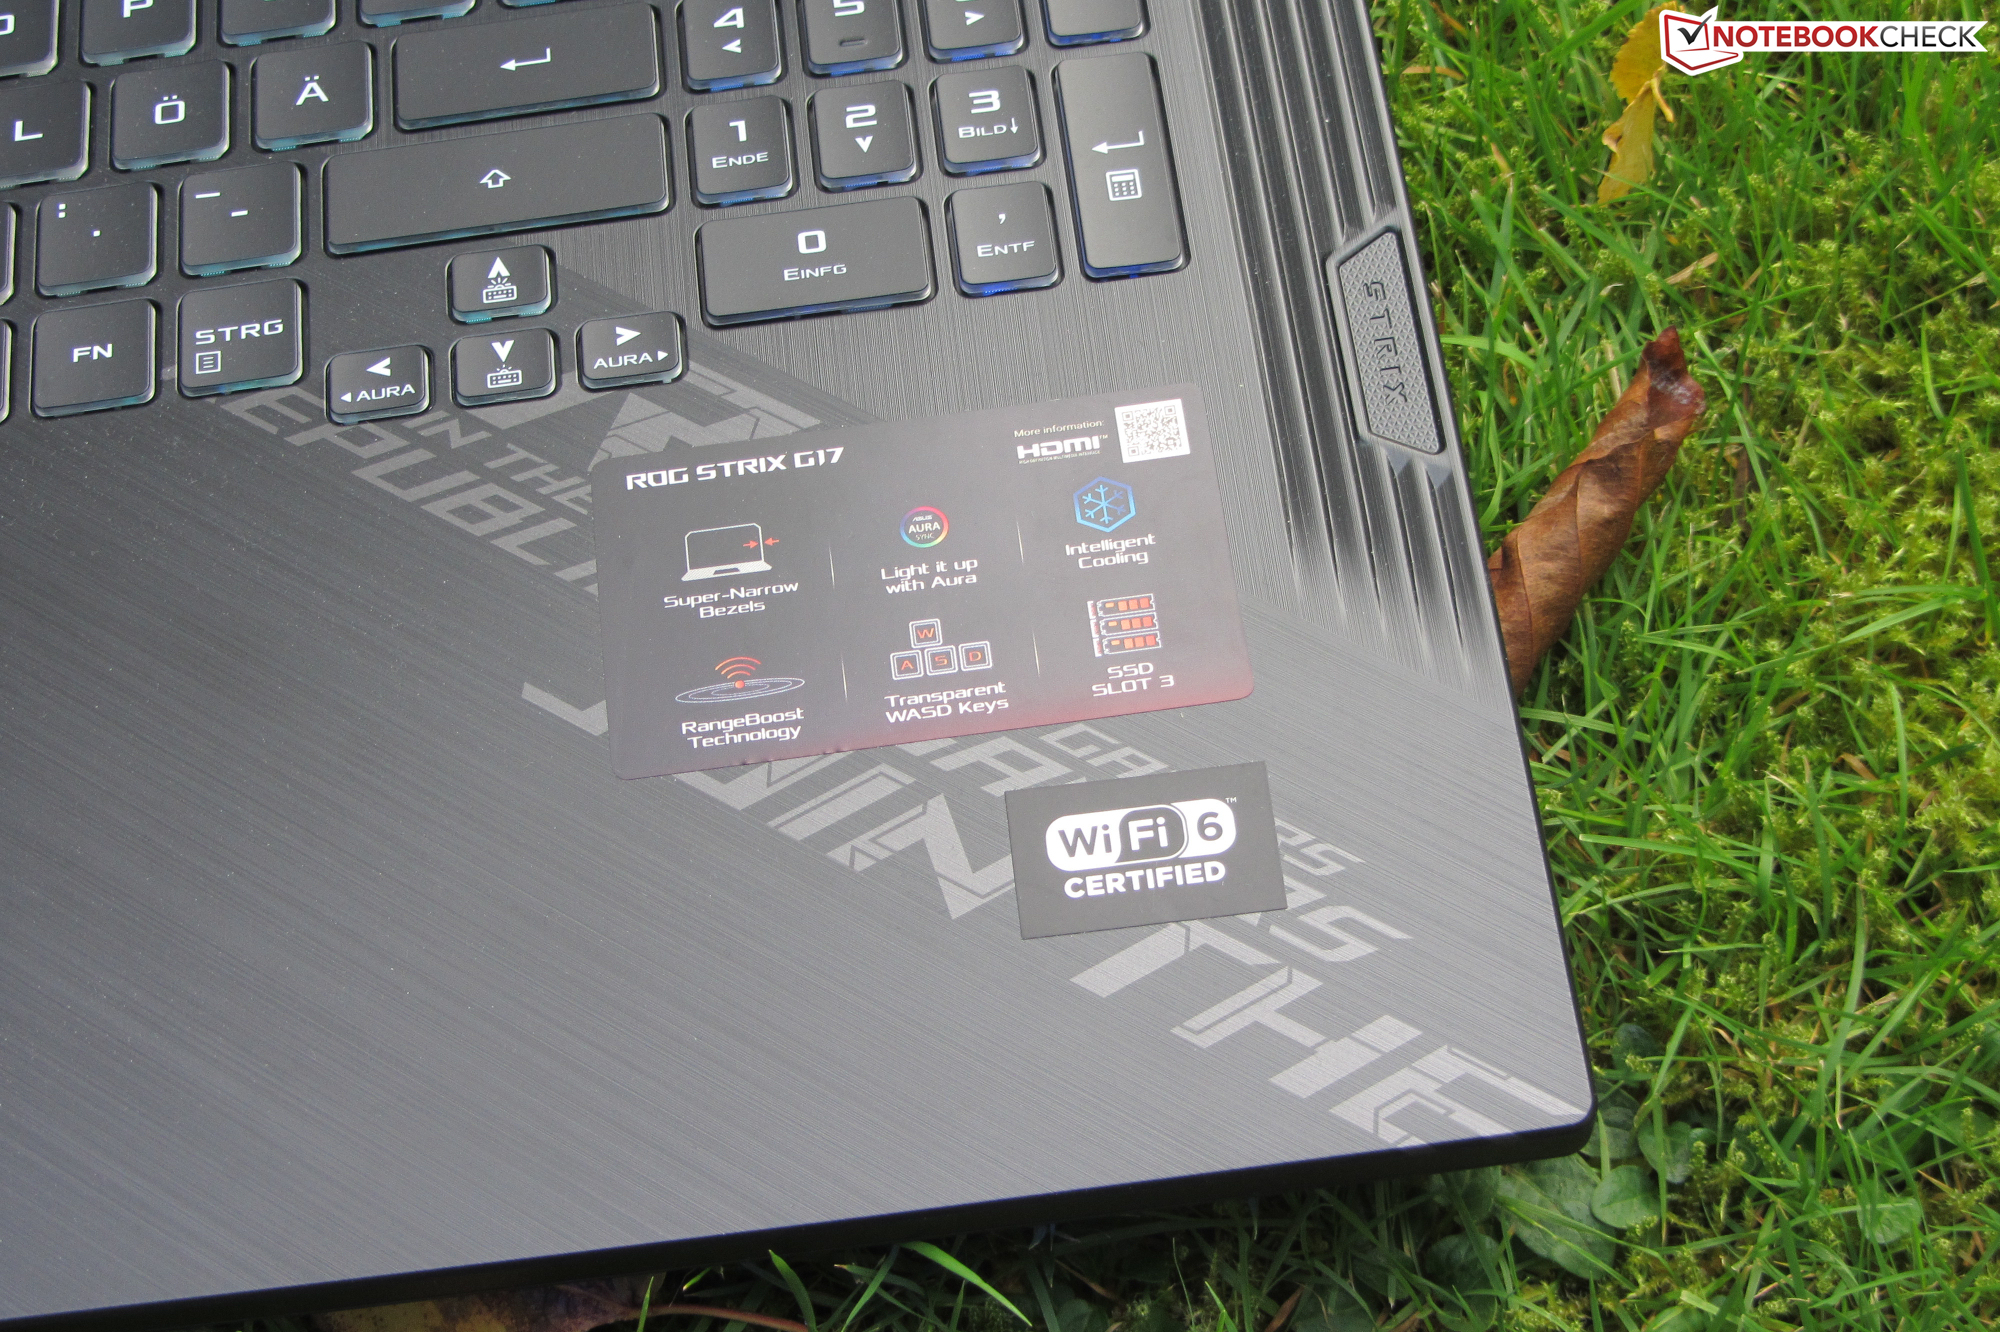
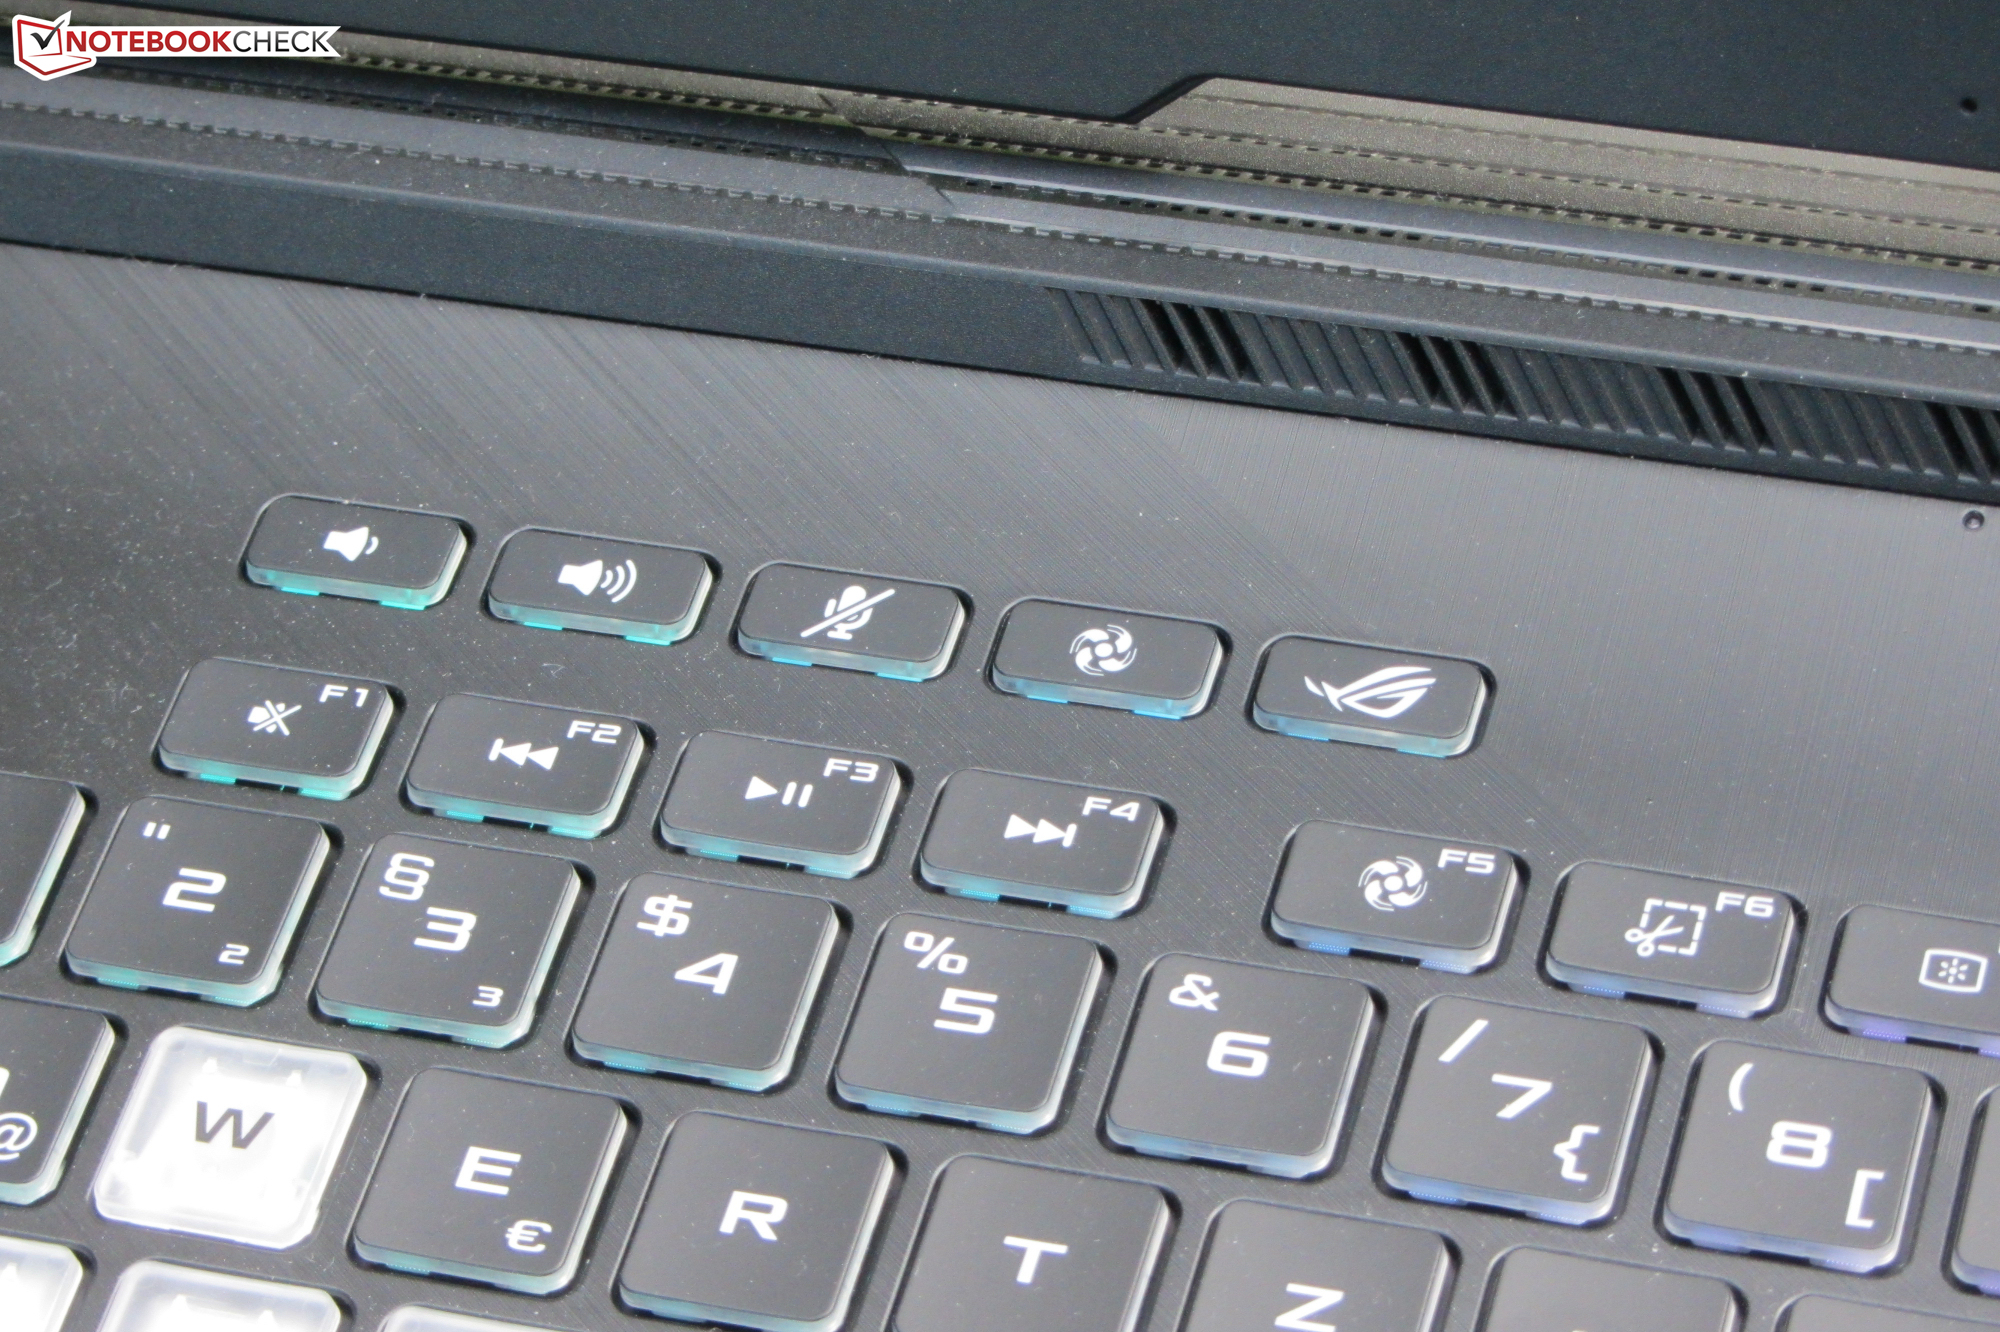
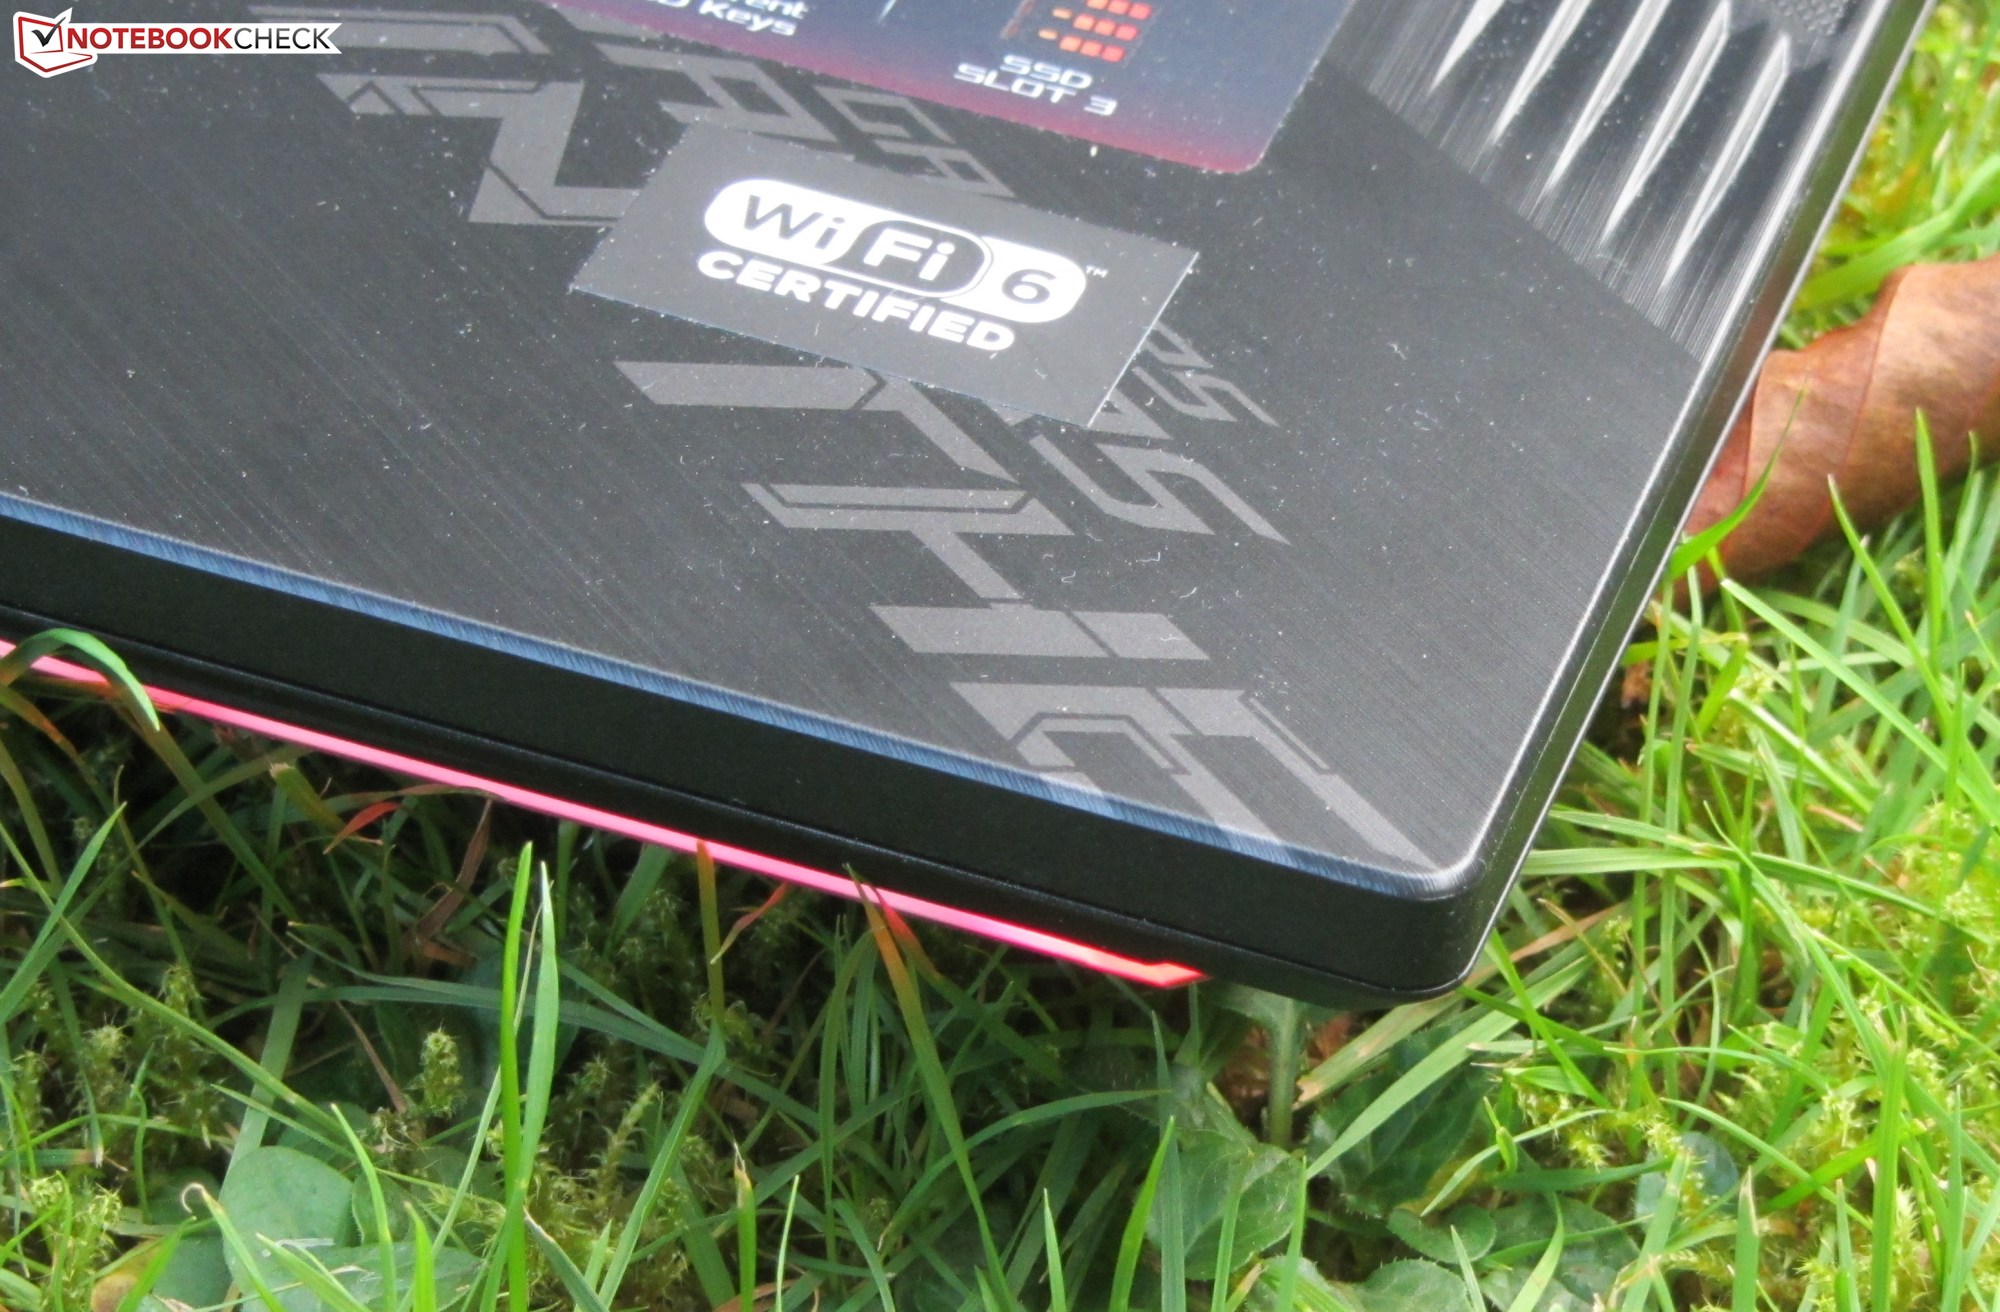
Blikvanger van de laptop is de LED-balk die zich langs drie zijden van de onderkant uitstrekt. Het kleurenschema kan individueel naar eigen wens worden aangepast.
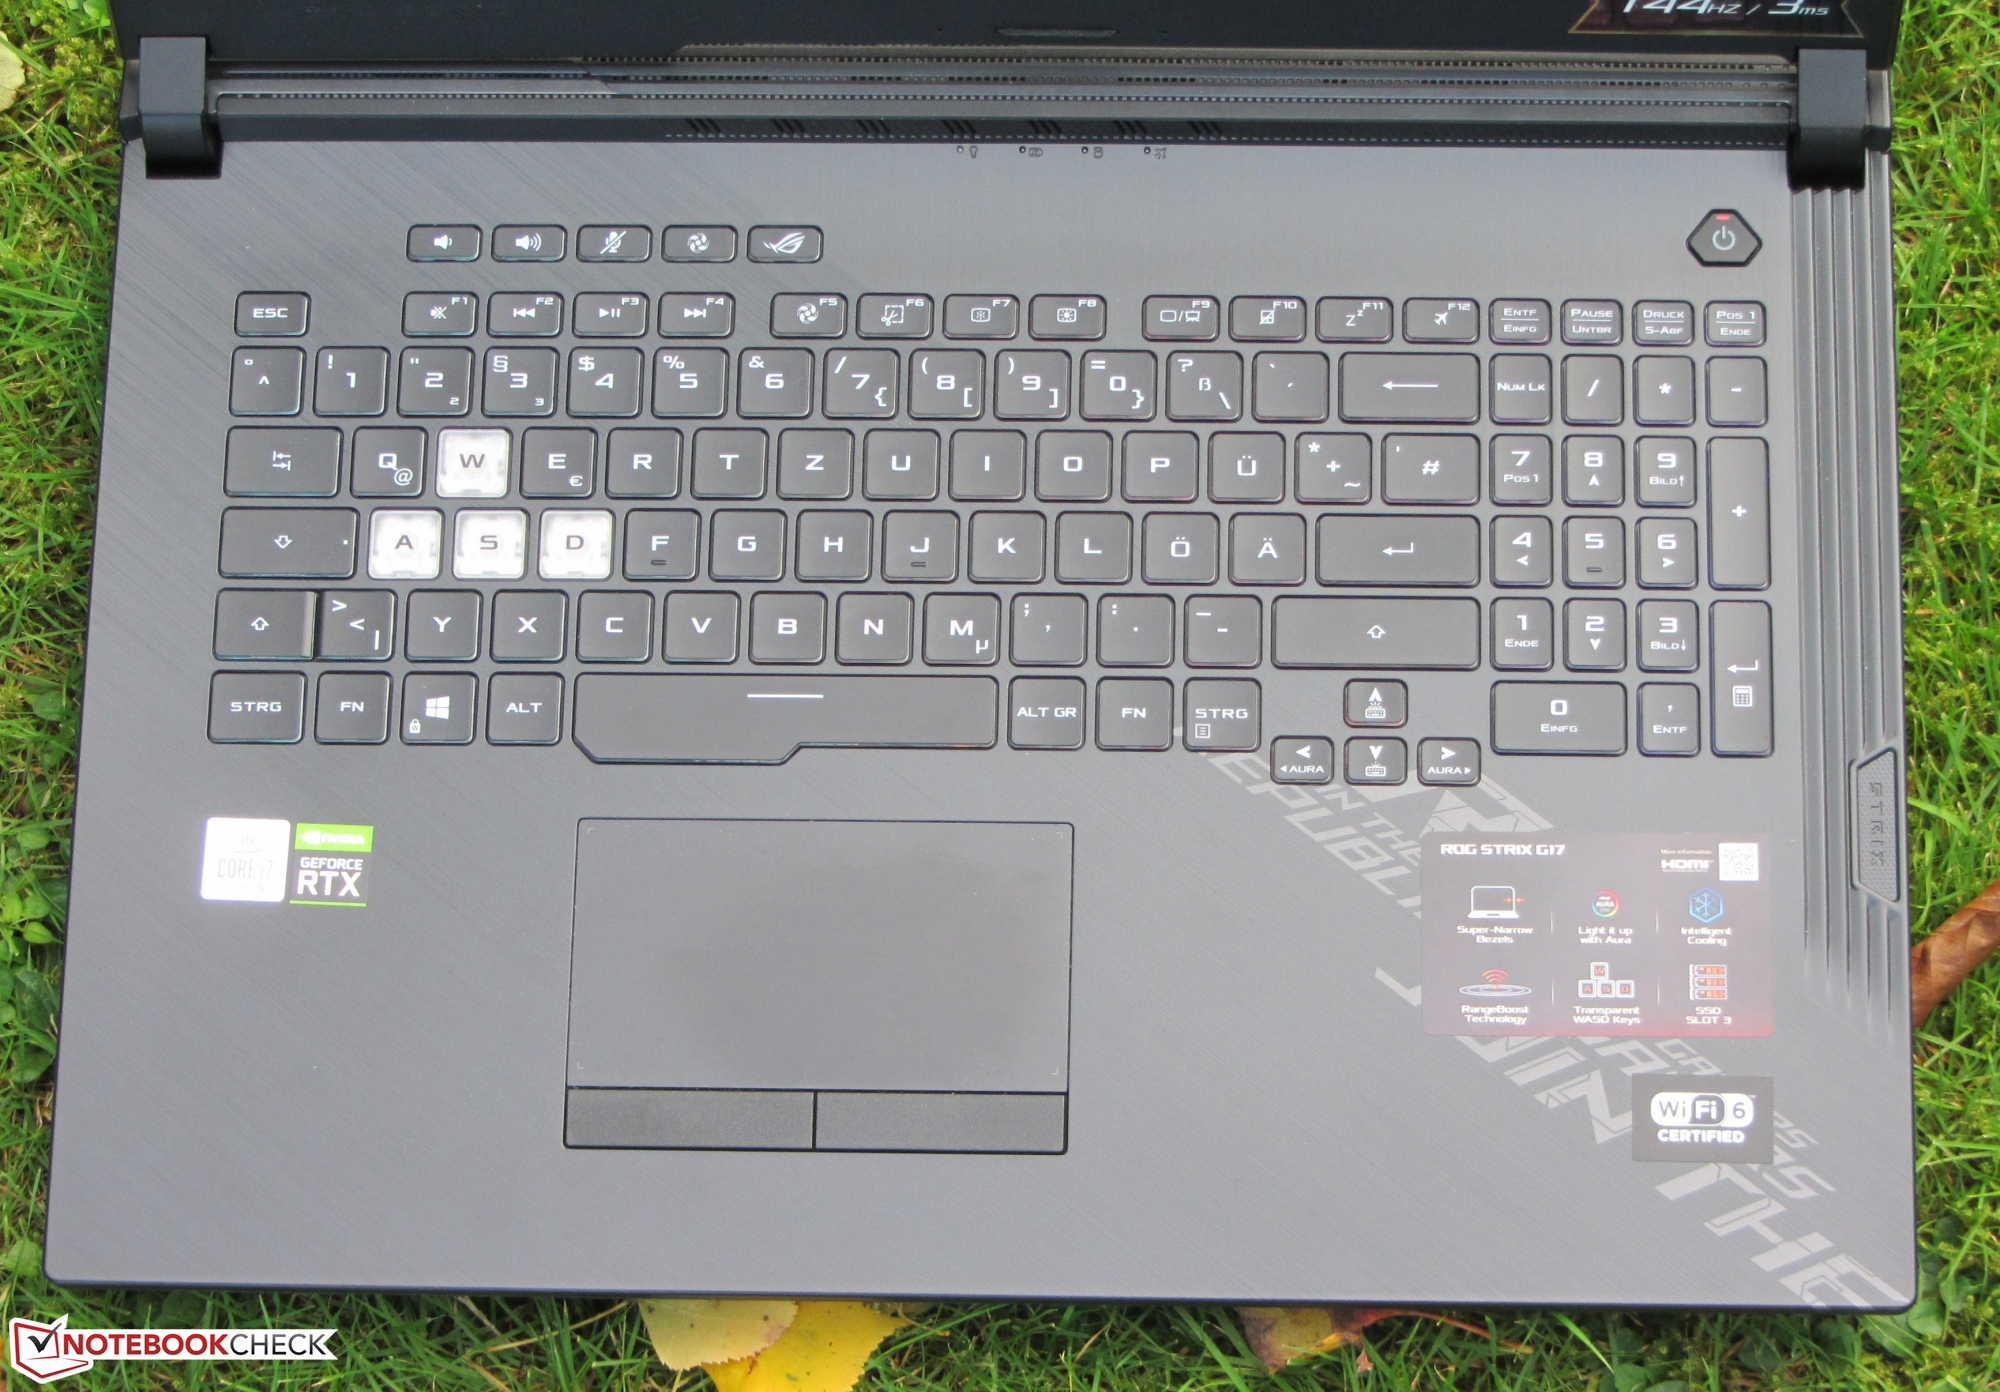
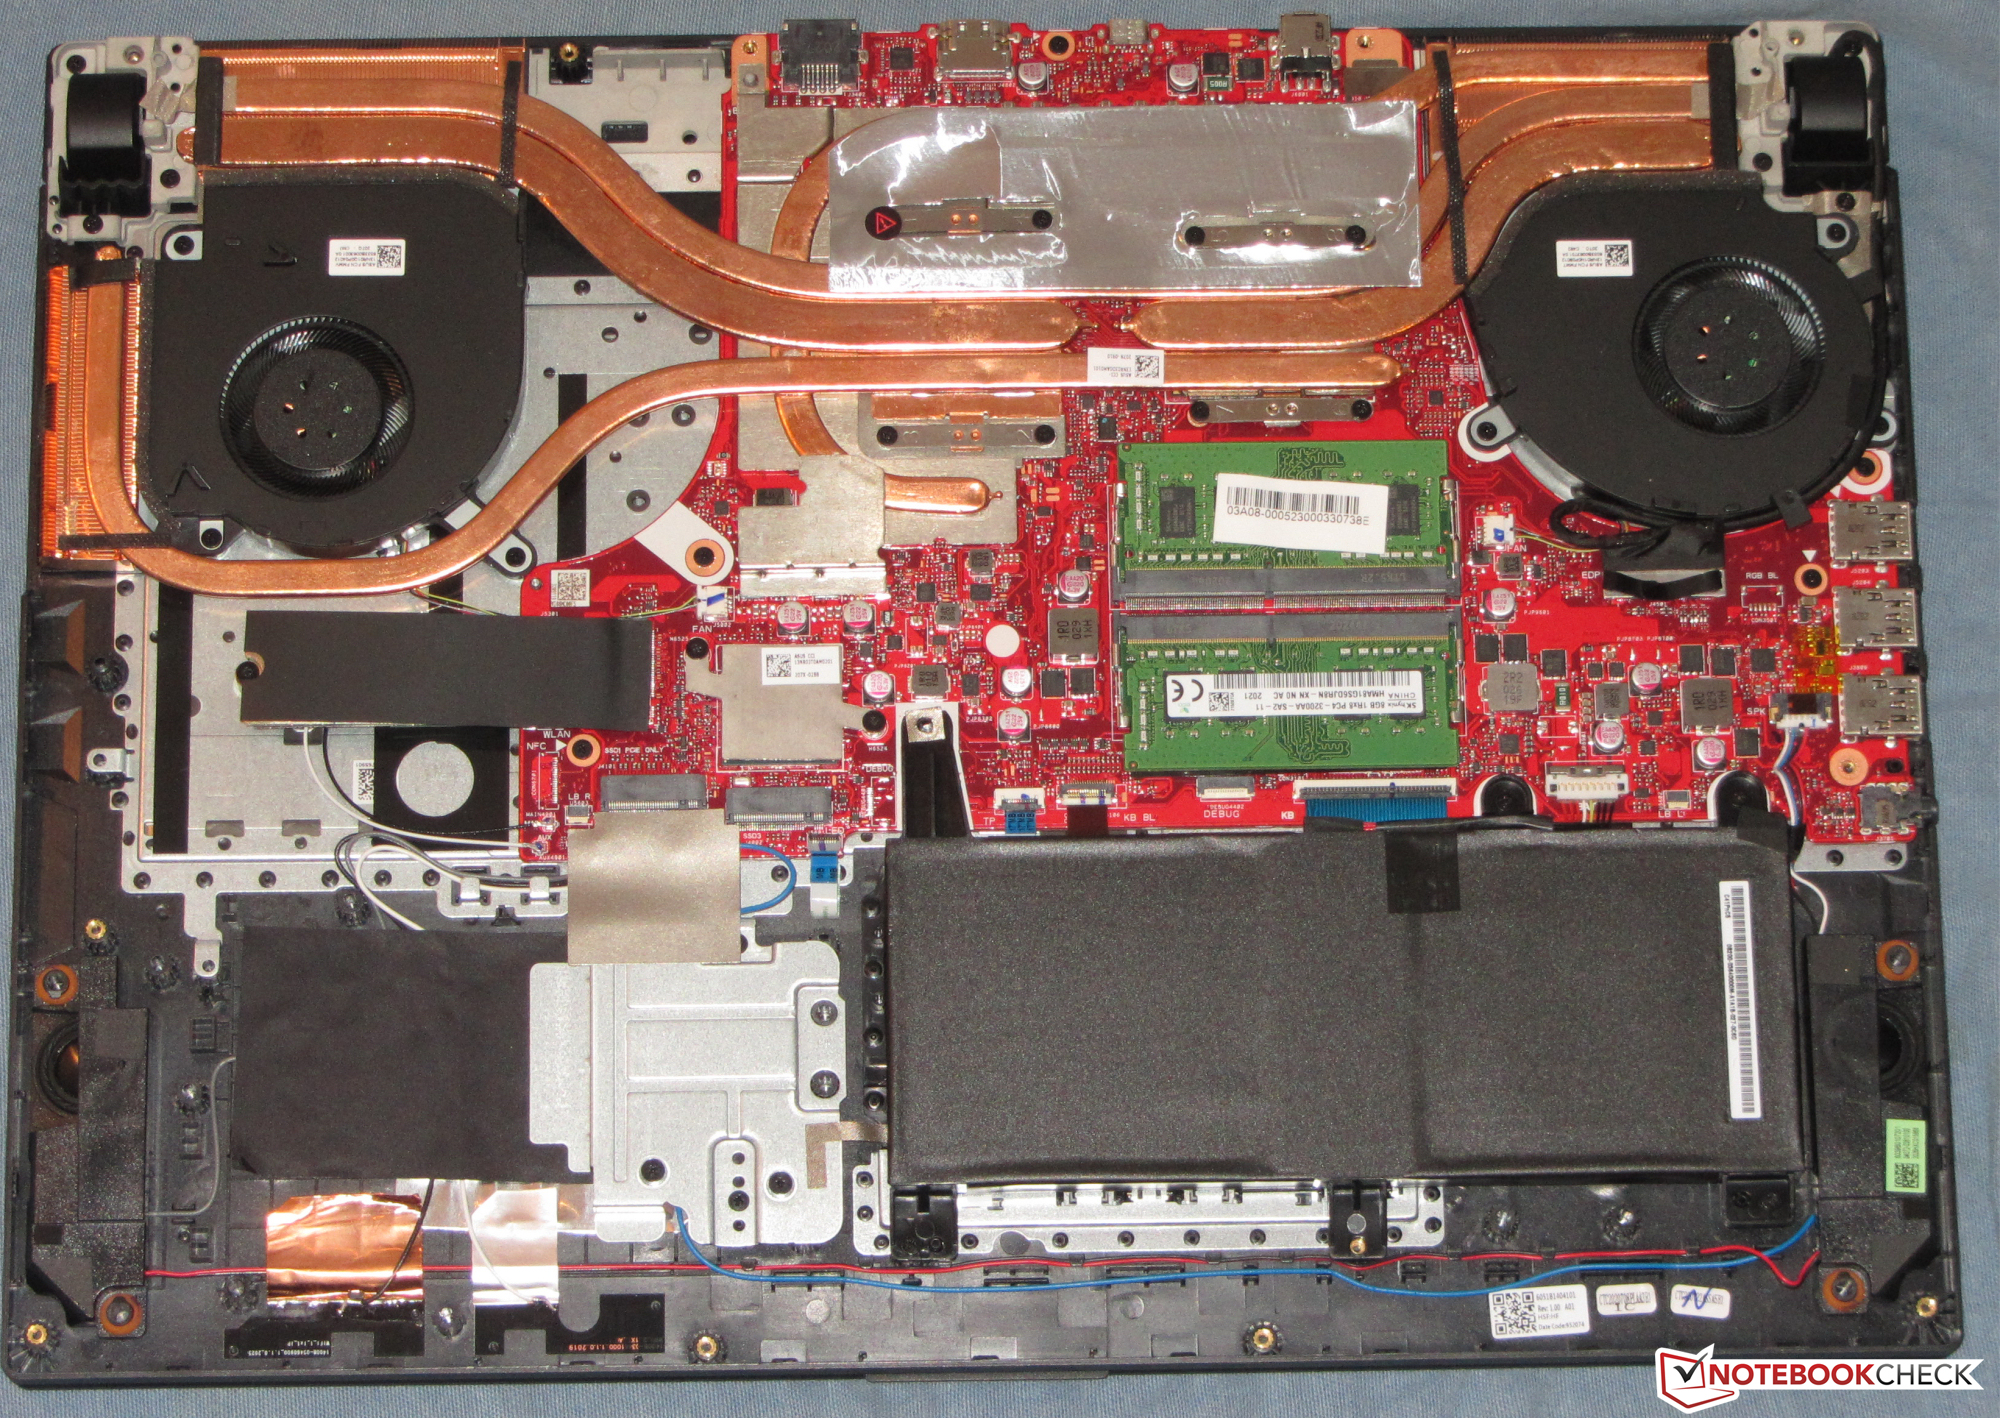
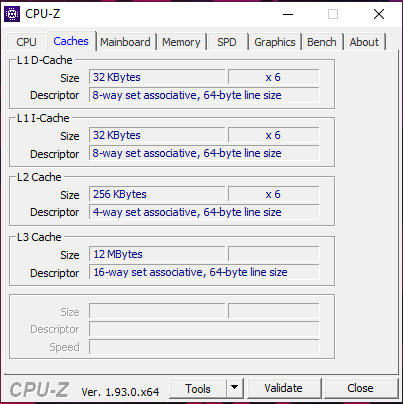
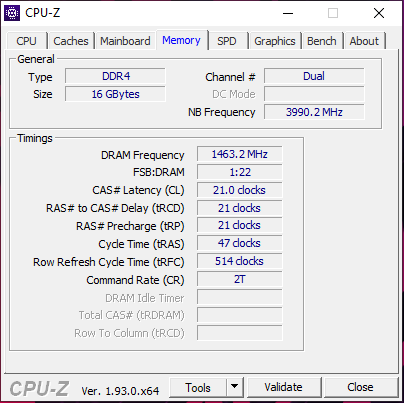
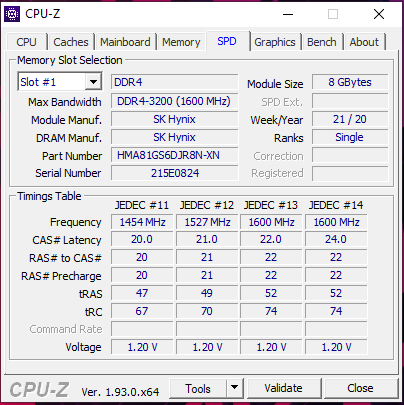
De opslagcapaciteit (1 TB) is uitbreidbaar. Naast de bestaande NVMe SSD is er ruimte voor nog twee M.2-modellen. RAID 0 wordt ondersteund. Geheugen (2x 8 GB, tweekanaalsmodus) kan ook worden uitgebreid. Volgens de Asus website is 32 GB echter de limiet. Veel concurrenten ondersteunen tot 64 GB.
Onderhouds- en upgradeprocedures vereisen het verwijderen van de bodemplaat. Dit is in principe te doen. De onderkant is echter met twee lintkabels op het moederbord aangesloten, dus je moet voorzichtig te werk gaan. De kabels kunnen met een beetje vaardigheid worden losgemaakt en opnieuw worden bevestigd.
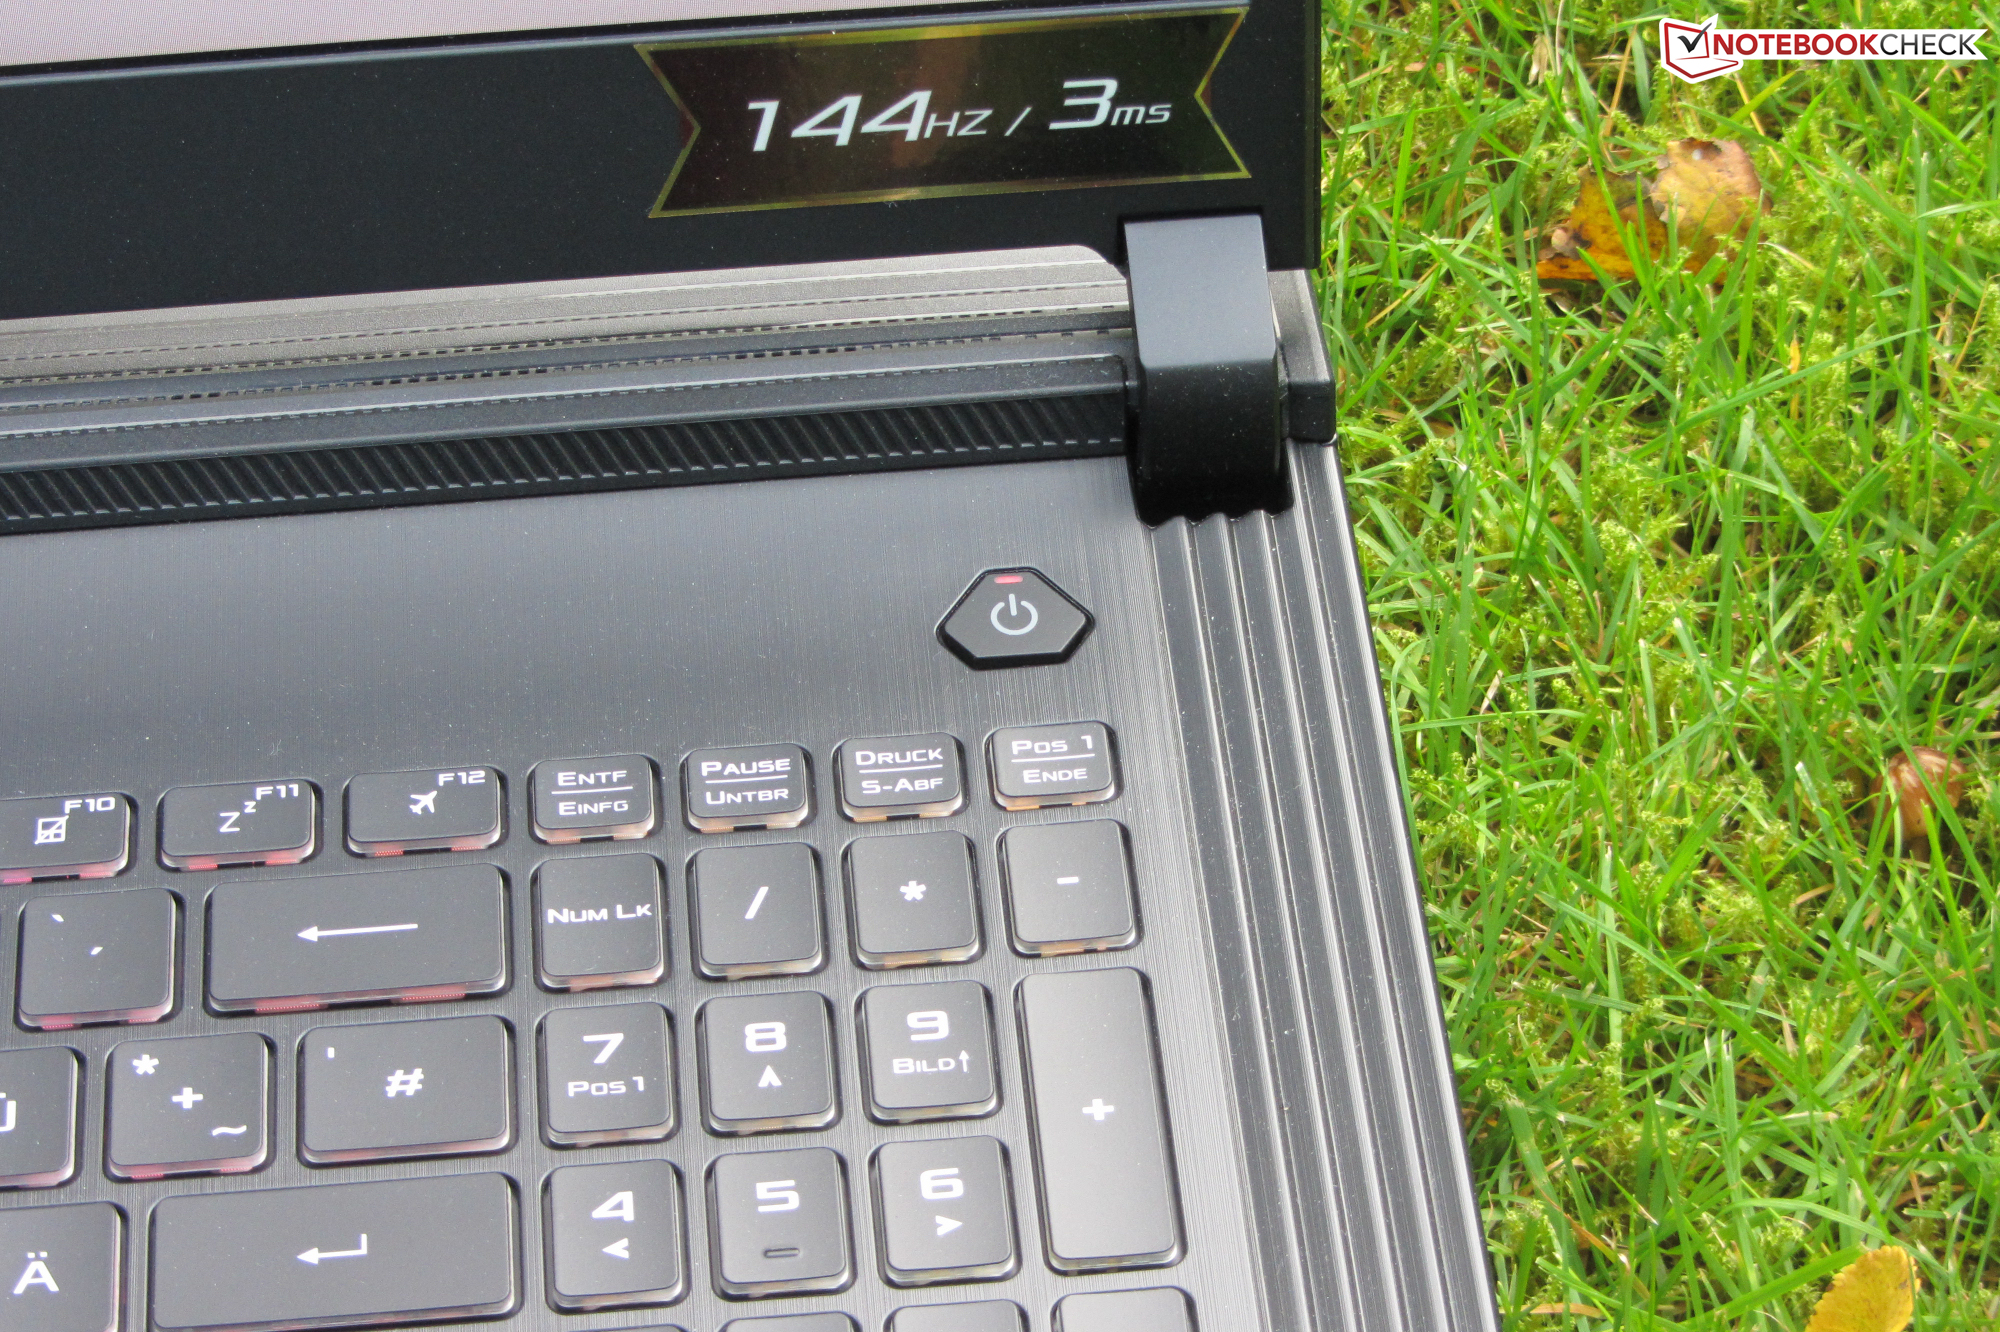
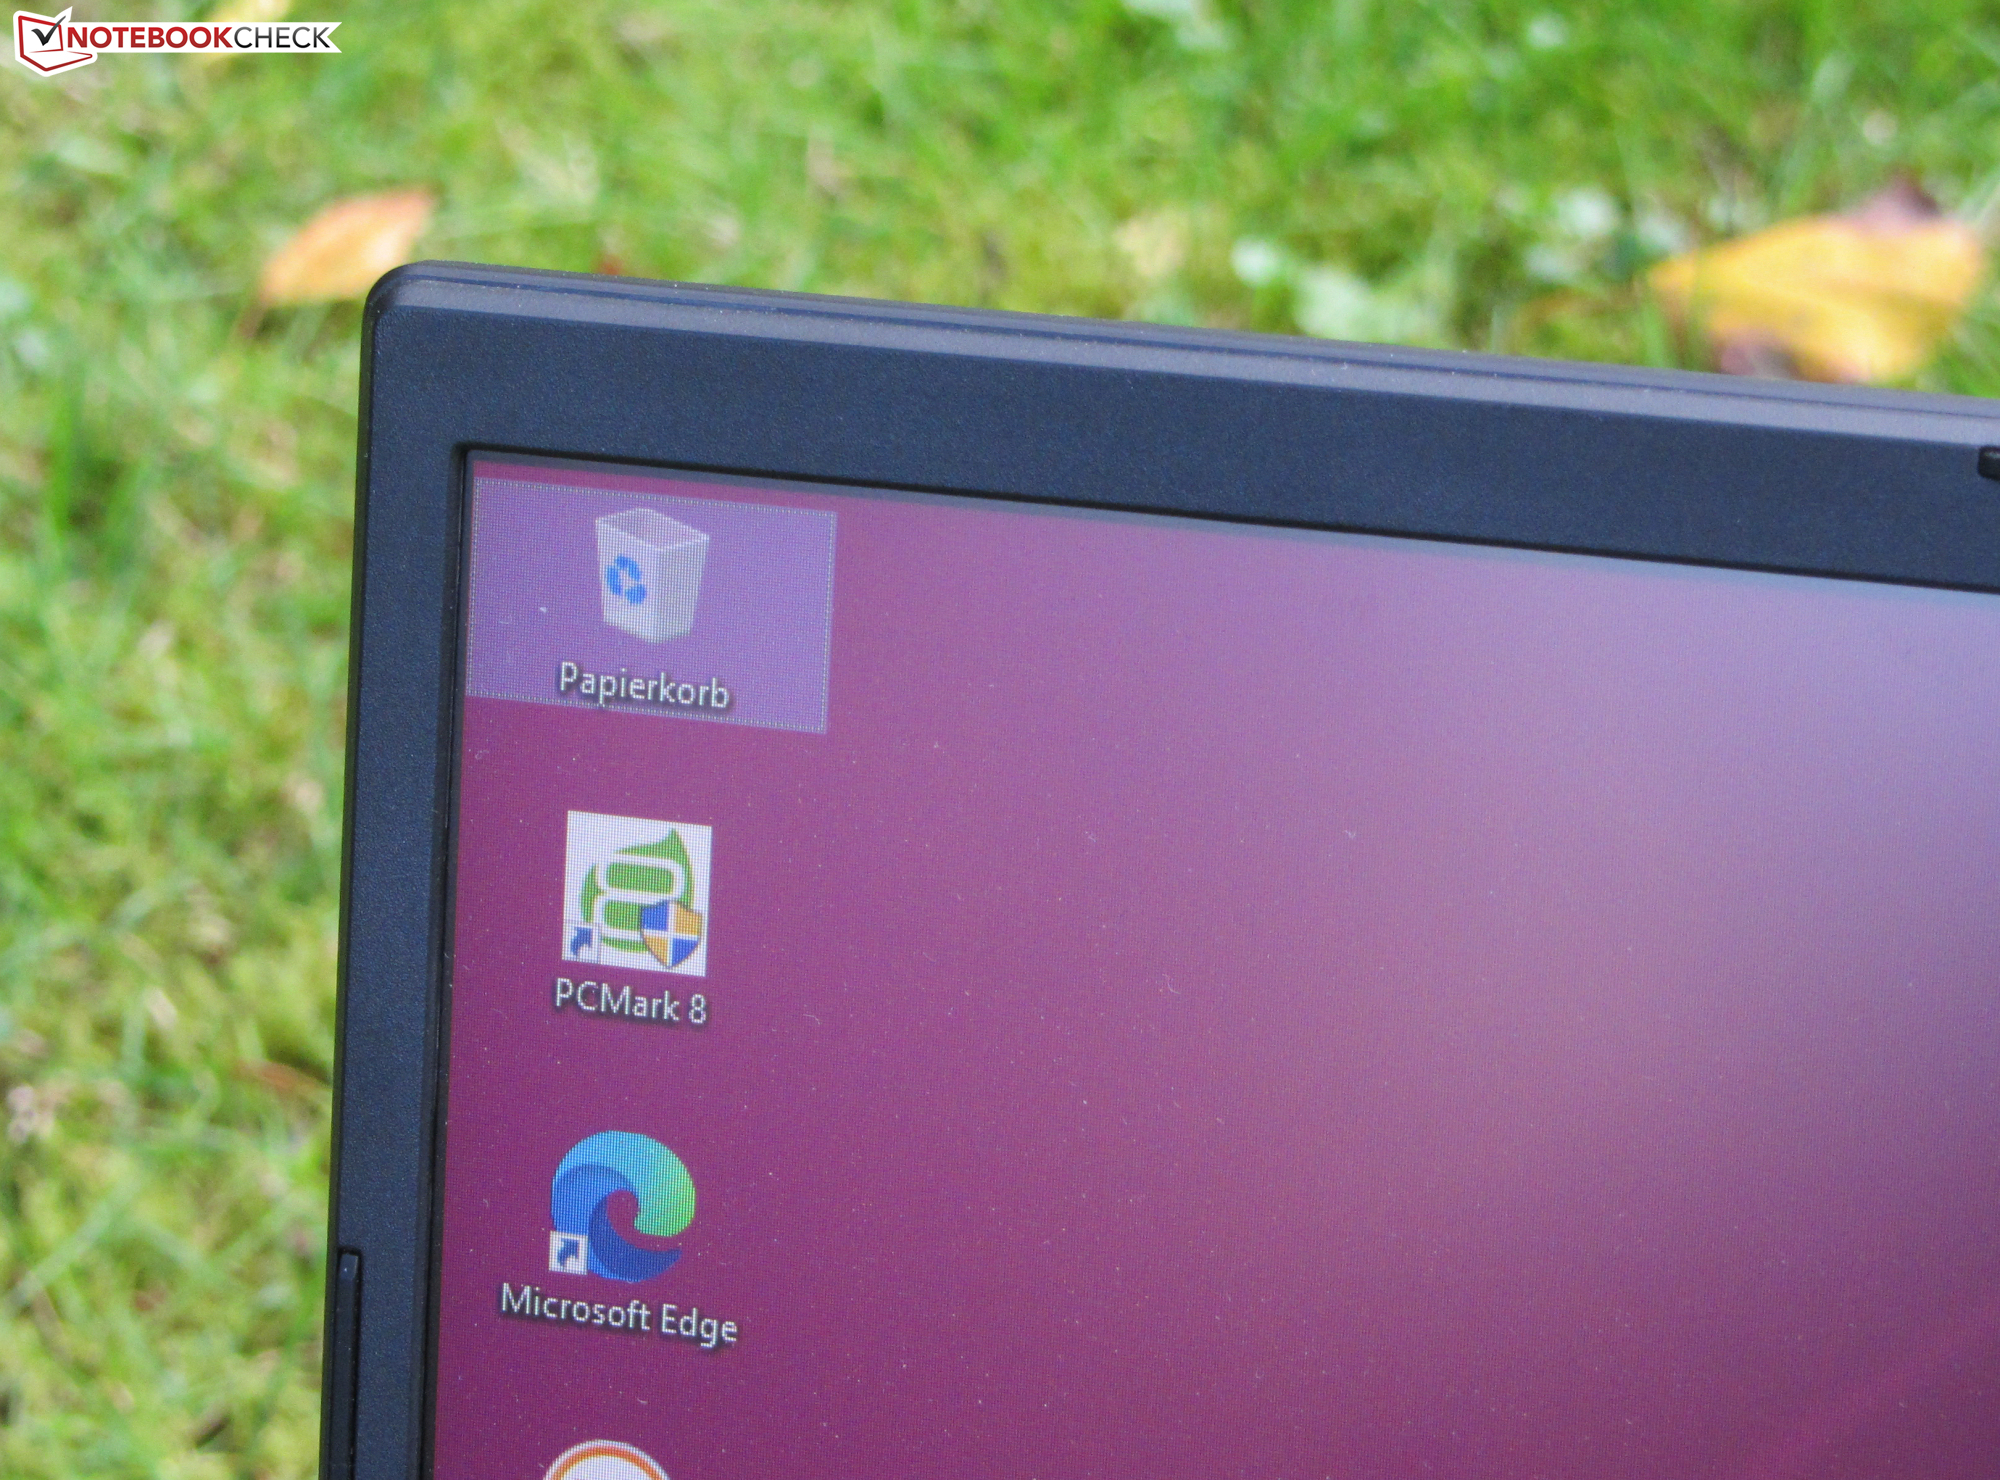
Het Full HD beeldscherm (IPS, 144 Hz) scoort punten met een mat oppervlak, stabiele kijkhoeken, voldoende helderheid, goed contrast, snelle reactietijden en een zeer nette kleurweergave.
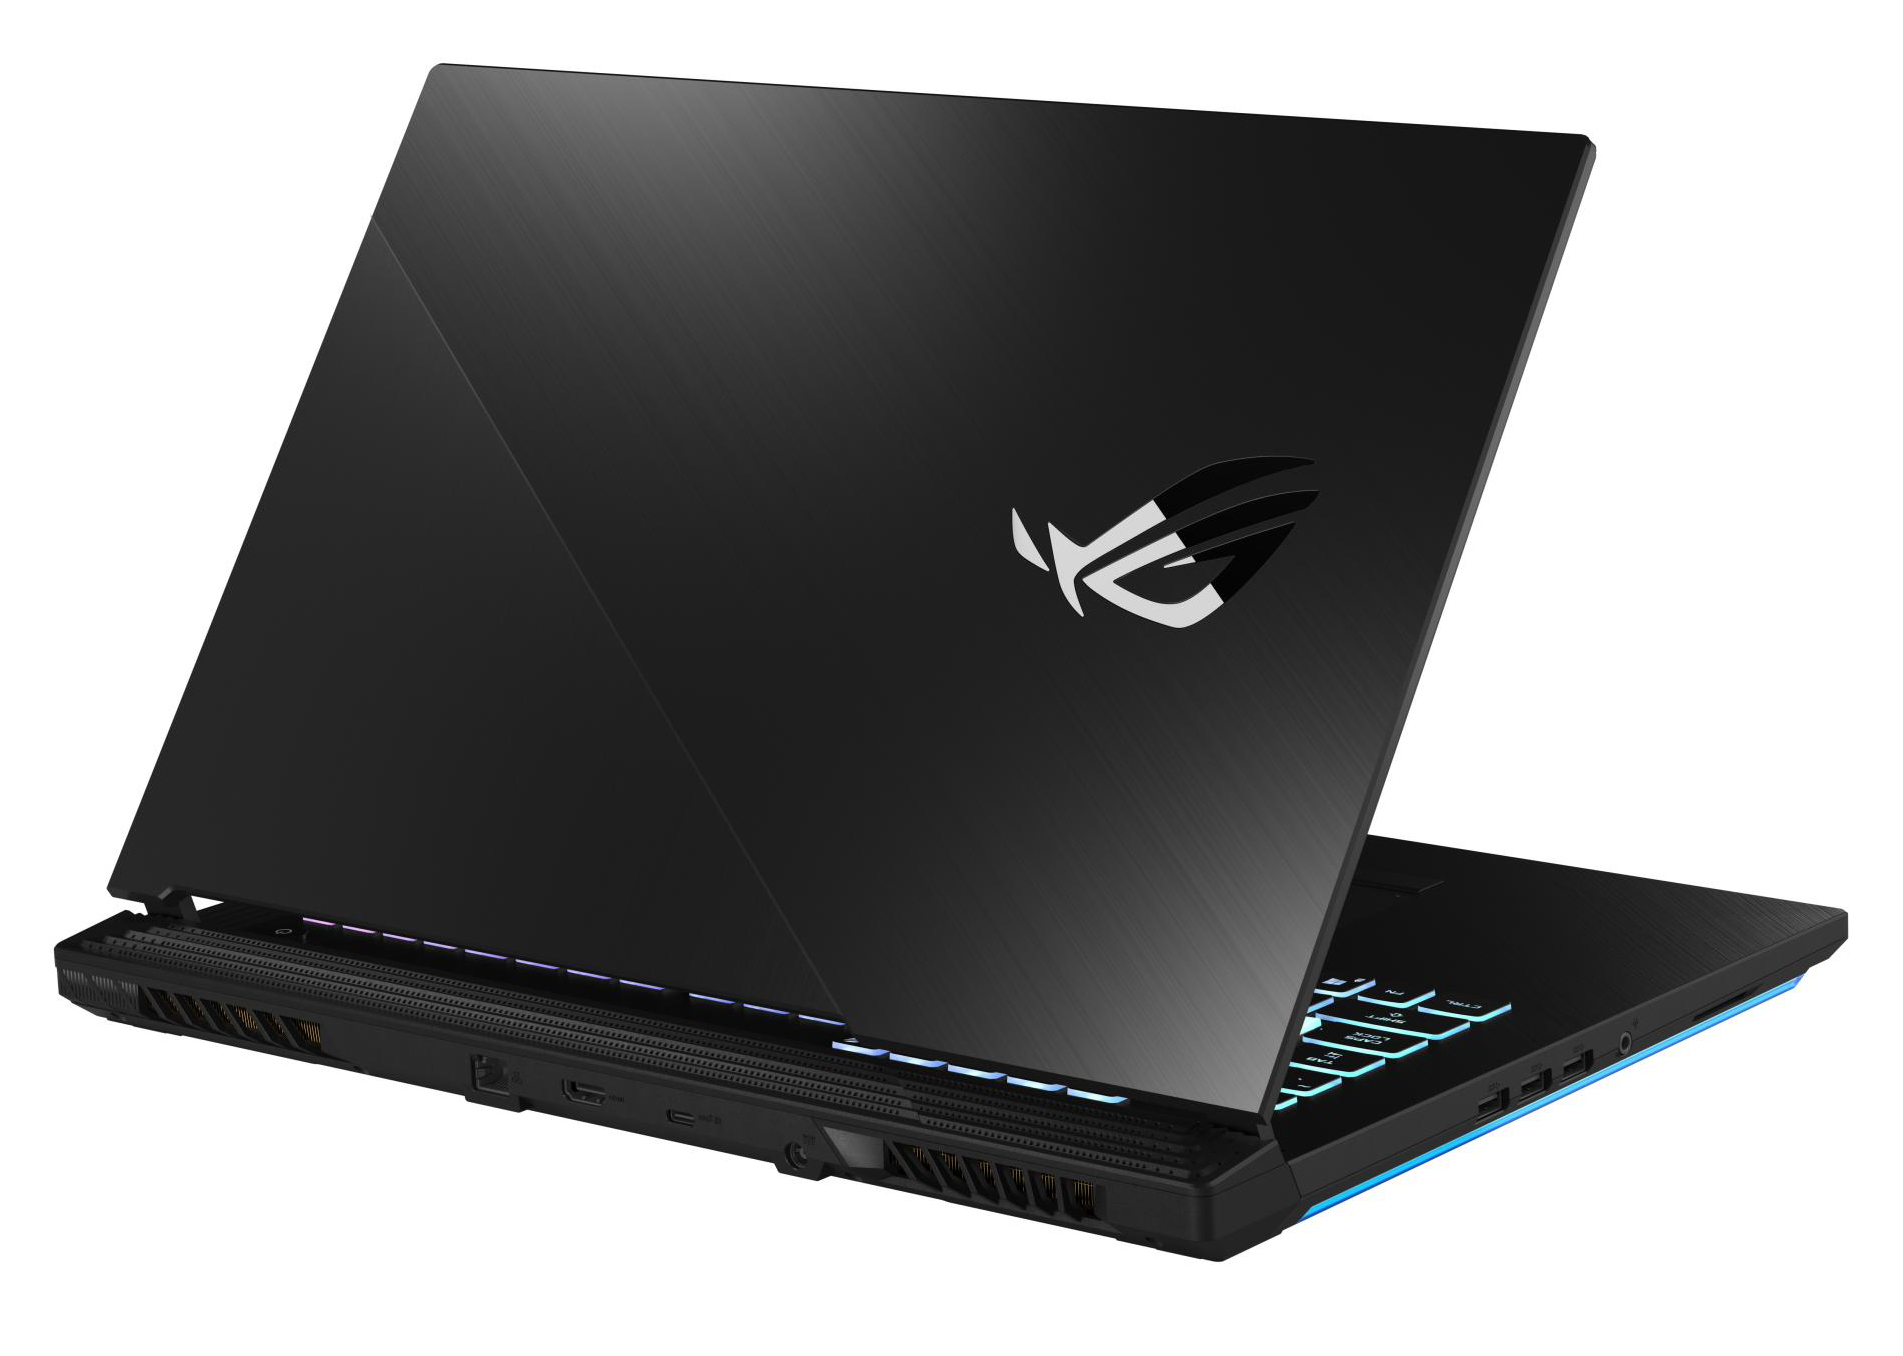
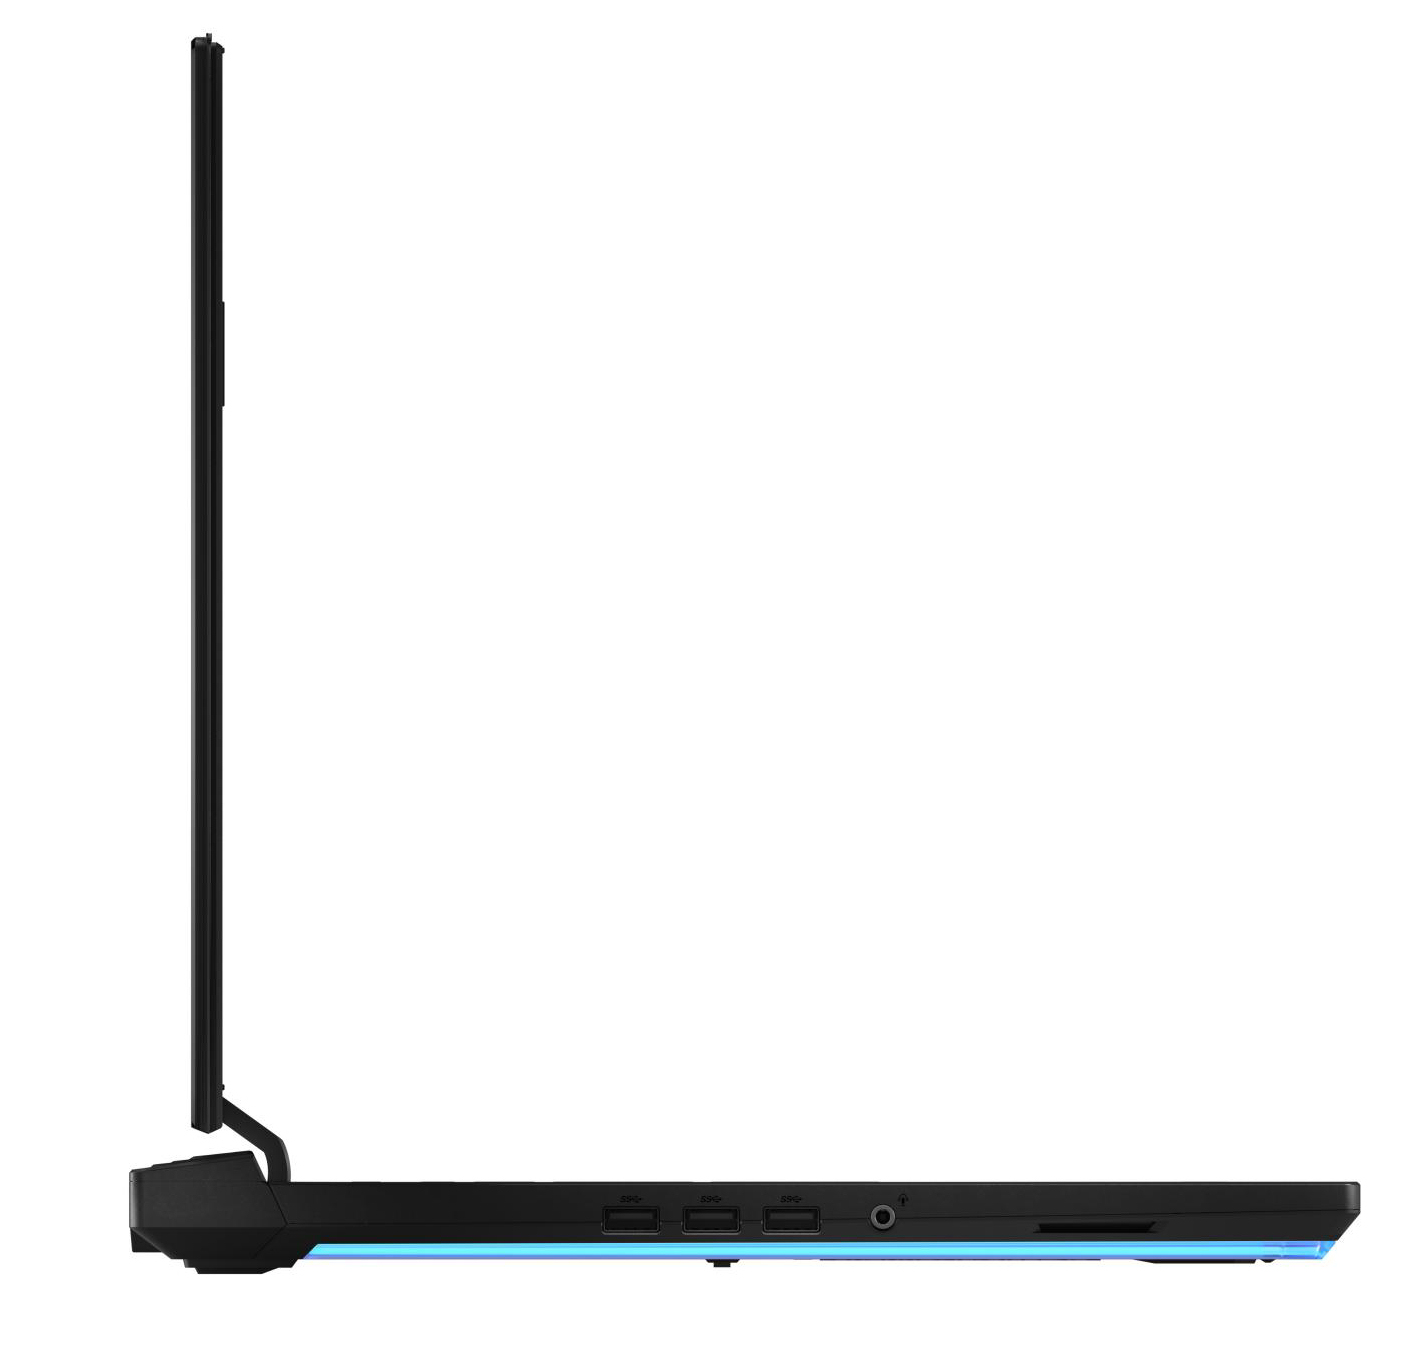
De goed afgeronde poortselectie omvat drie USB Type-A 3.2 Gen 1-poorten, die zich allemaal aan de linkerkant van de behuizing bevinden. Asus had minstens één poort aan de rechterkant moeten installeren. Een Thunderbolt 3-poort behoort niet tot de aansluitingen. Er is maar één USB Type-C 3.2 Gen 2-poort die DisplayPort via USB-C ondersteunt.
Asus Strix G17 G712LWS
- 11-10-2020 v7 (old)
Sascha Mölck
Price comparison
