XMG SECTOR high-end desktop PC met Intel Core i9-13900K en Nvidia GeForce RTX 4090 beoordeeld

Veel mensen associëren Schenker met krachtige laptops. De toegevoegde "XMG" branding duidt op high-end gaming apparaten, waartoe ondertussen ook desktop PC's behoren. In deze review richten we ons op de Intel-gebaseerde XMG SECTOR. De basisconfiguratie kost € 1.239 (US$ 1.306) en wordt geleverd met een Intel Core i5-12400F, 16 GB RAM en een Nvidia GeForce RTX 3060. Onze evaluatie-eenheid is een high-end model met een Core i9-13900K en een GeForce RTX 4090maar het draagt ook een zeer fors prijskaartje van ongeveer €4.700 (US$4.956). Dankzij de vele opties die de XMG shop biedt, kun je de pc echter uitrusten met verschillende optieskunt u de pc uitrusten met verschillende hardwarecomponenten en een systeem samenstellen dat specifiek op uw behoeften is afgestemd.
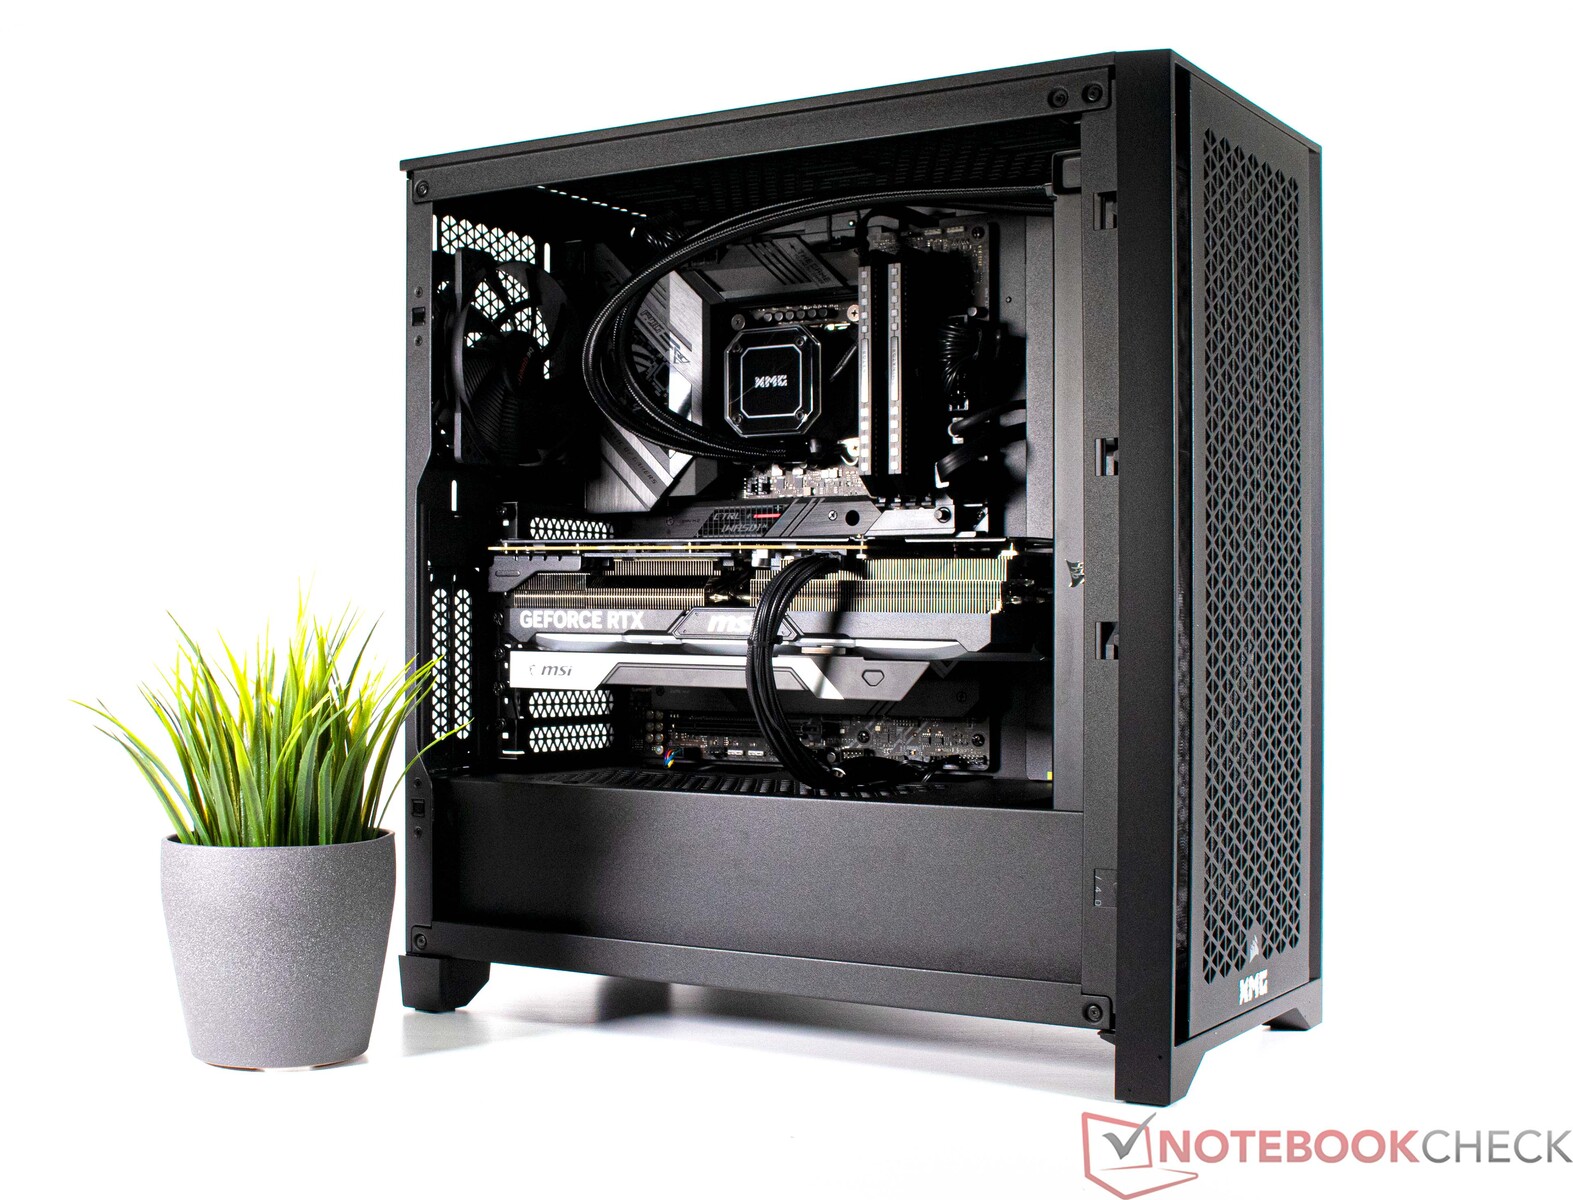
Een gedetailleerde blik op de XMG SECTOR Intel
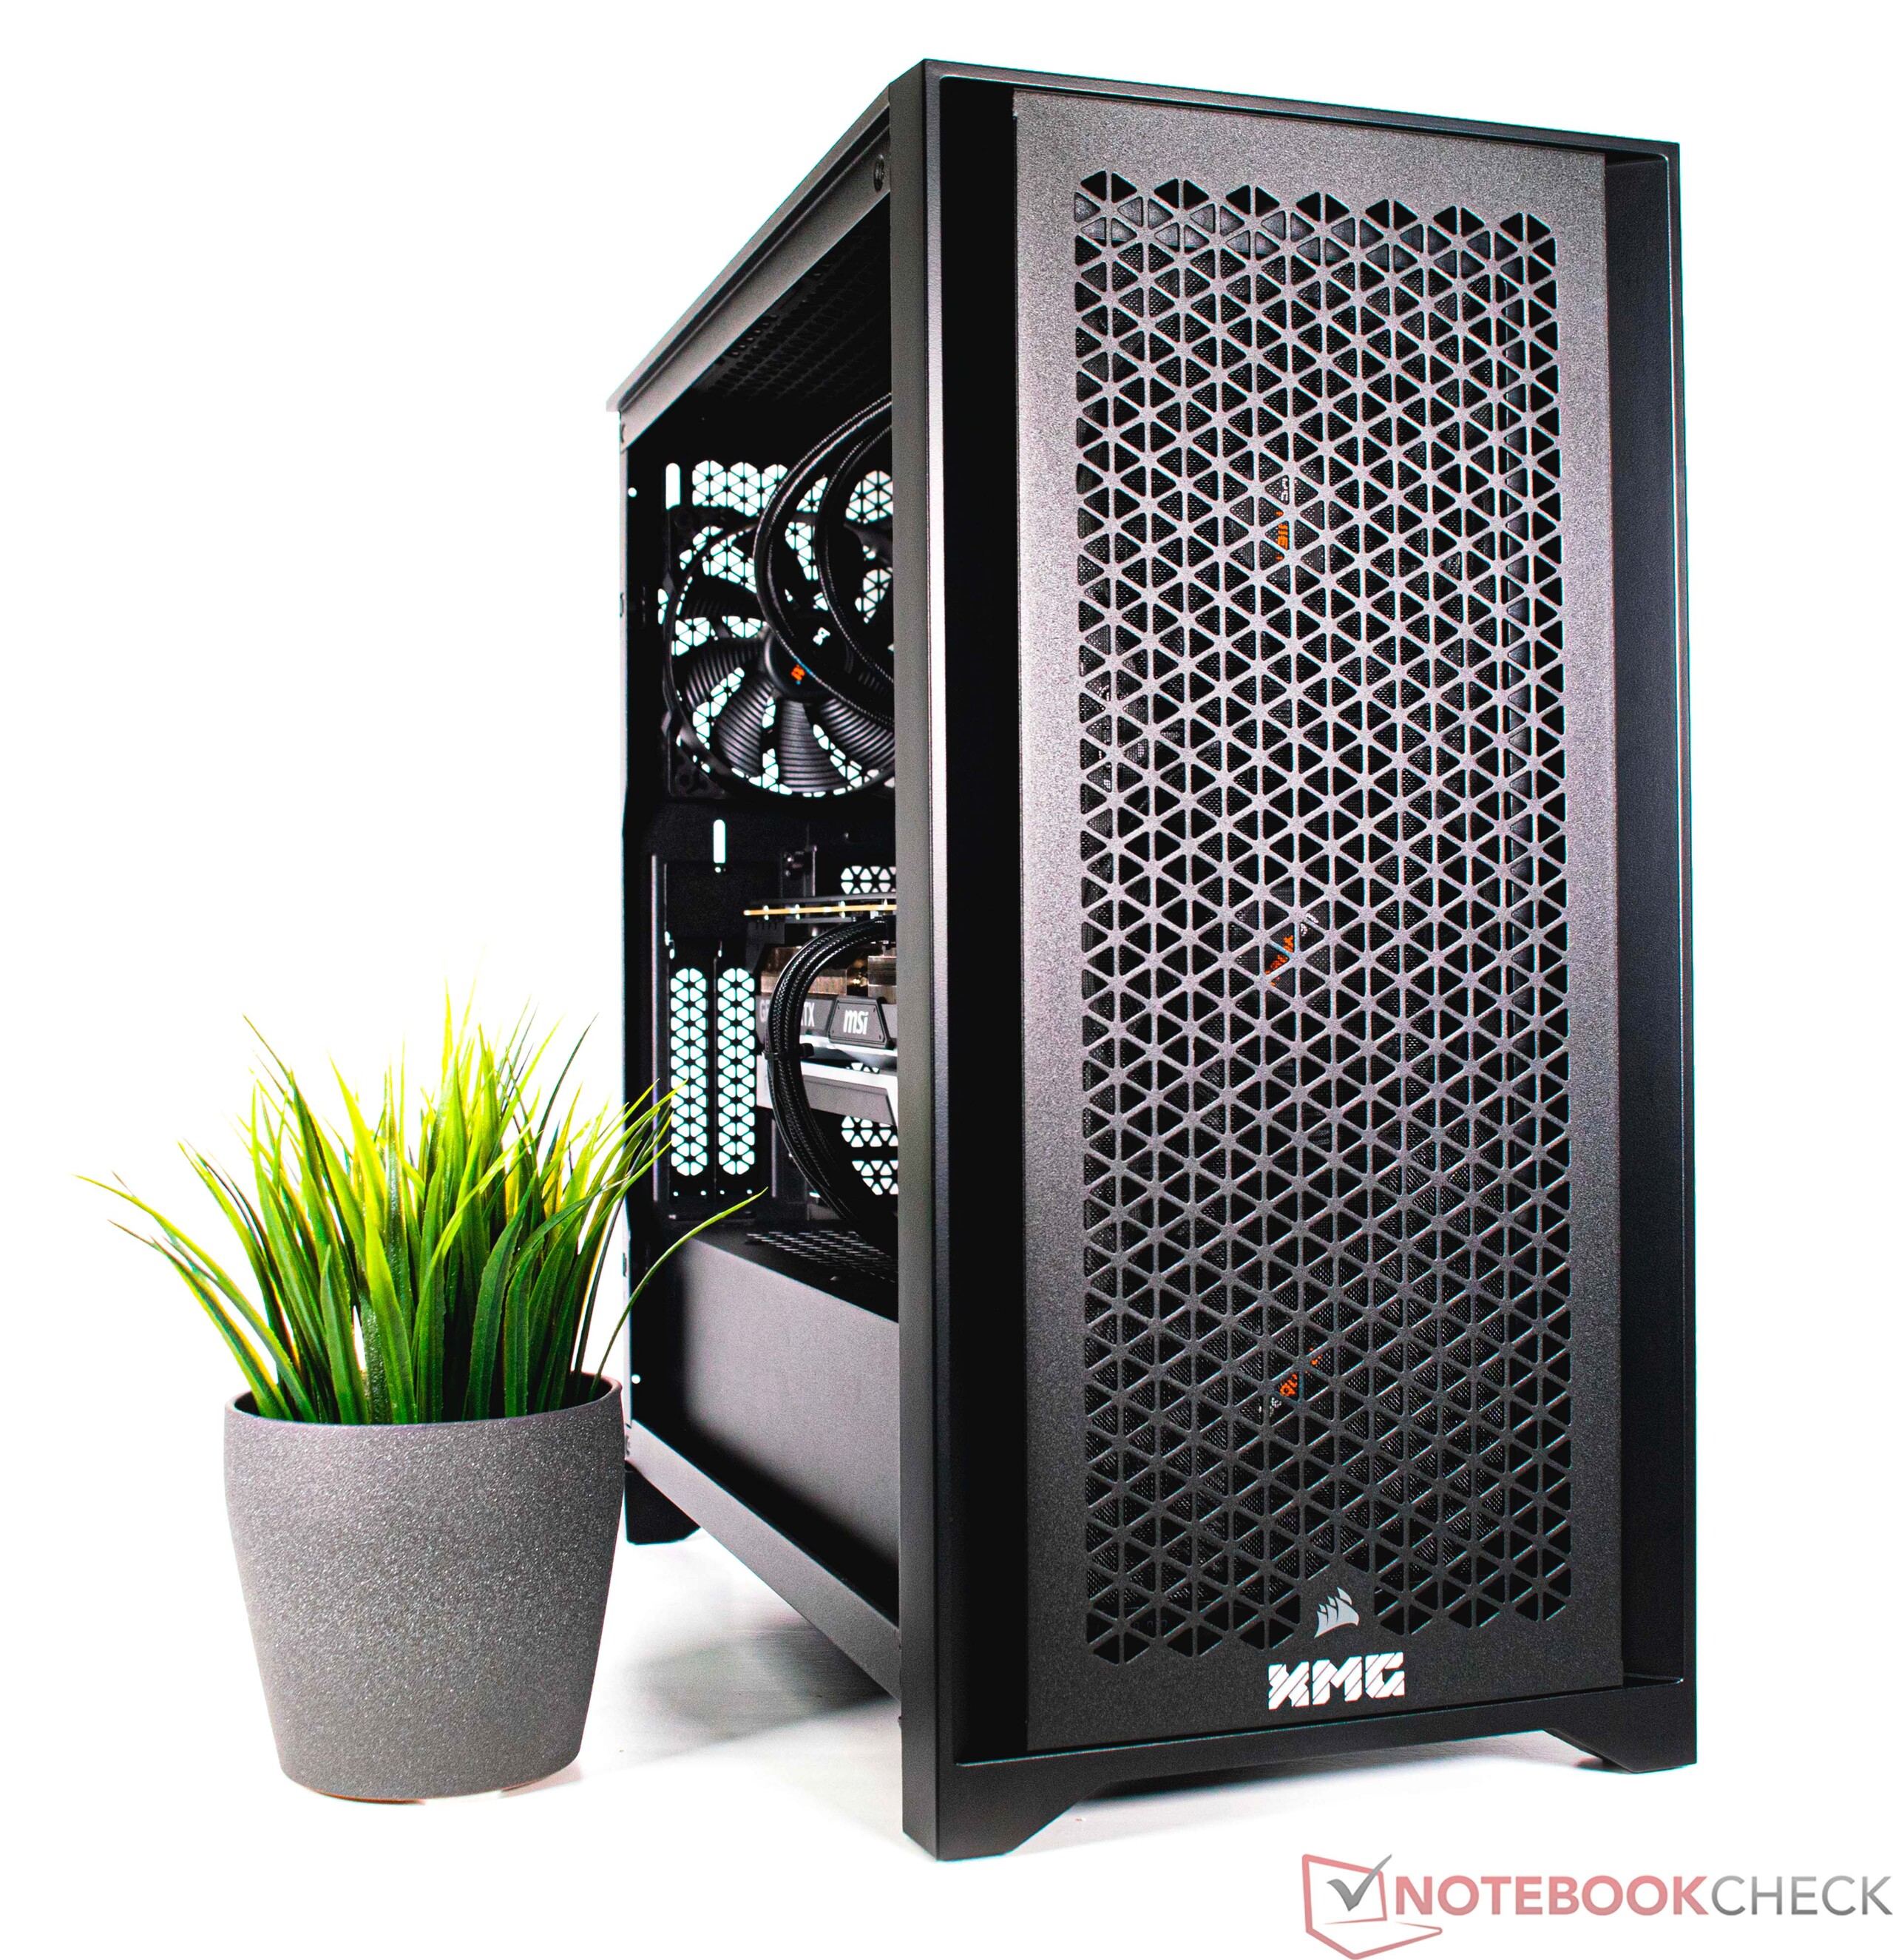

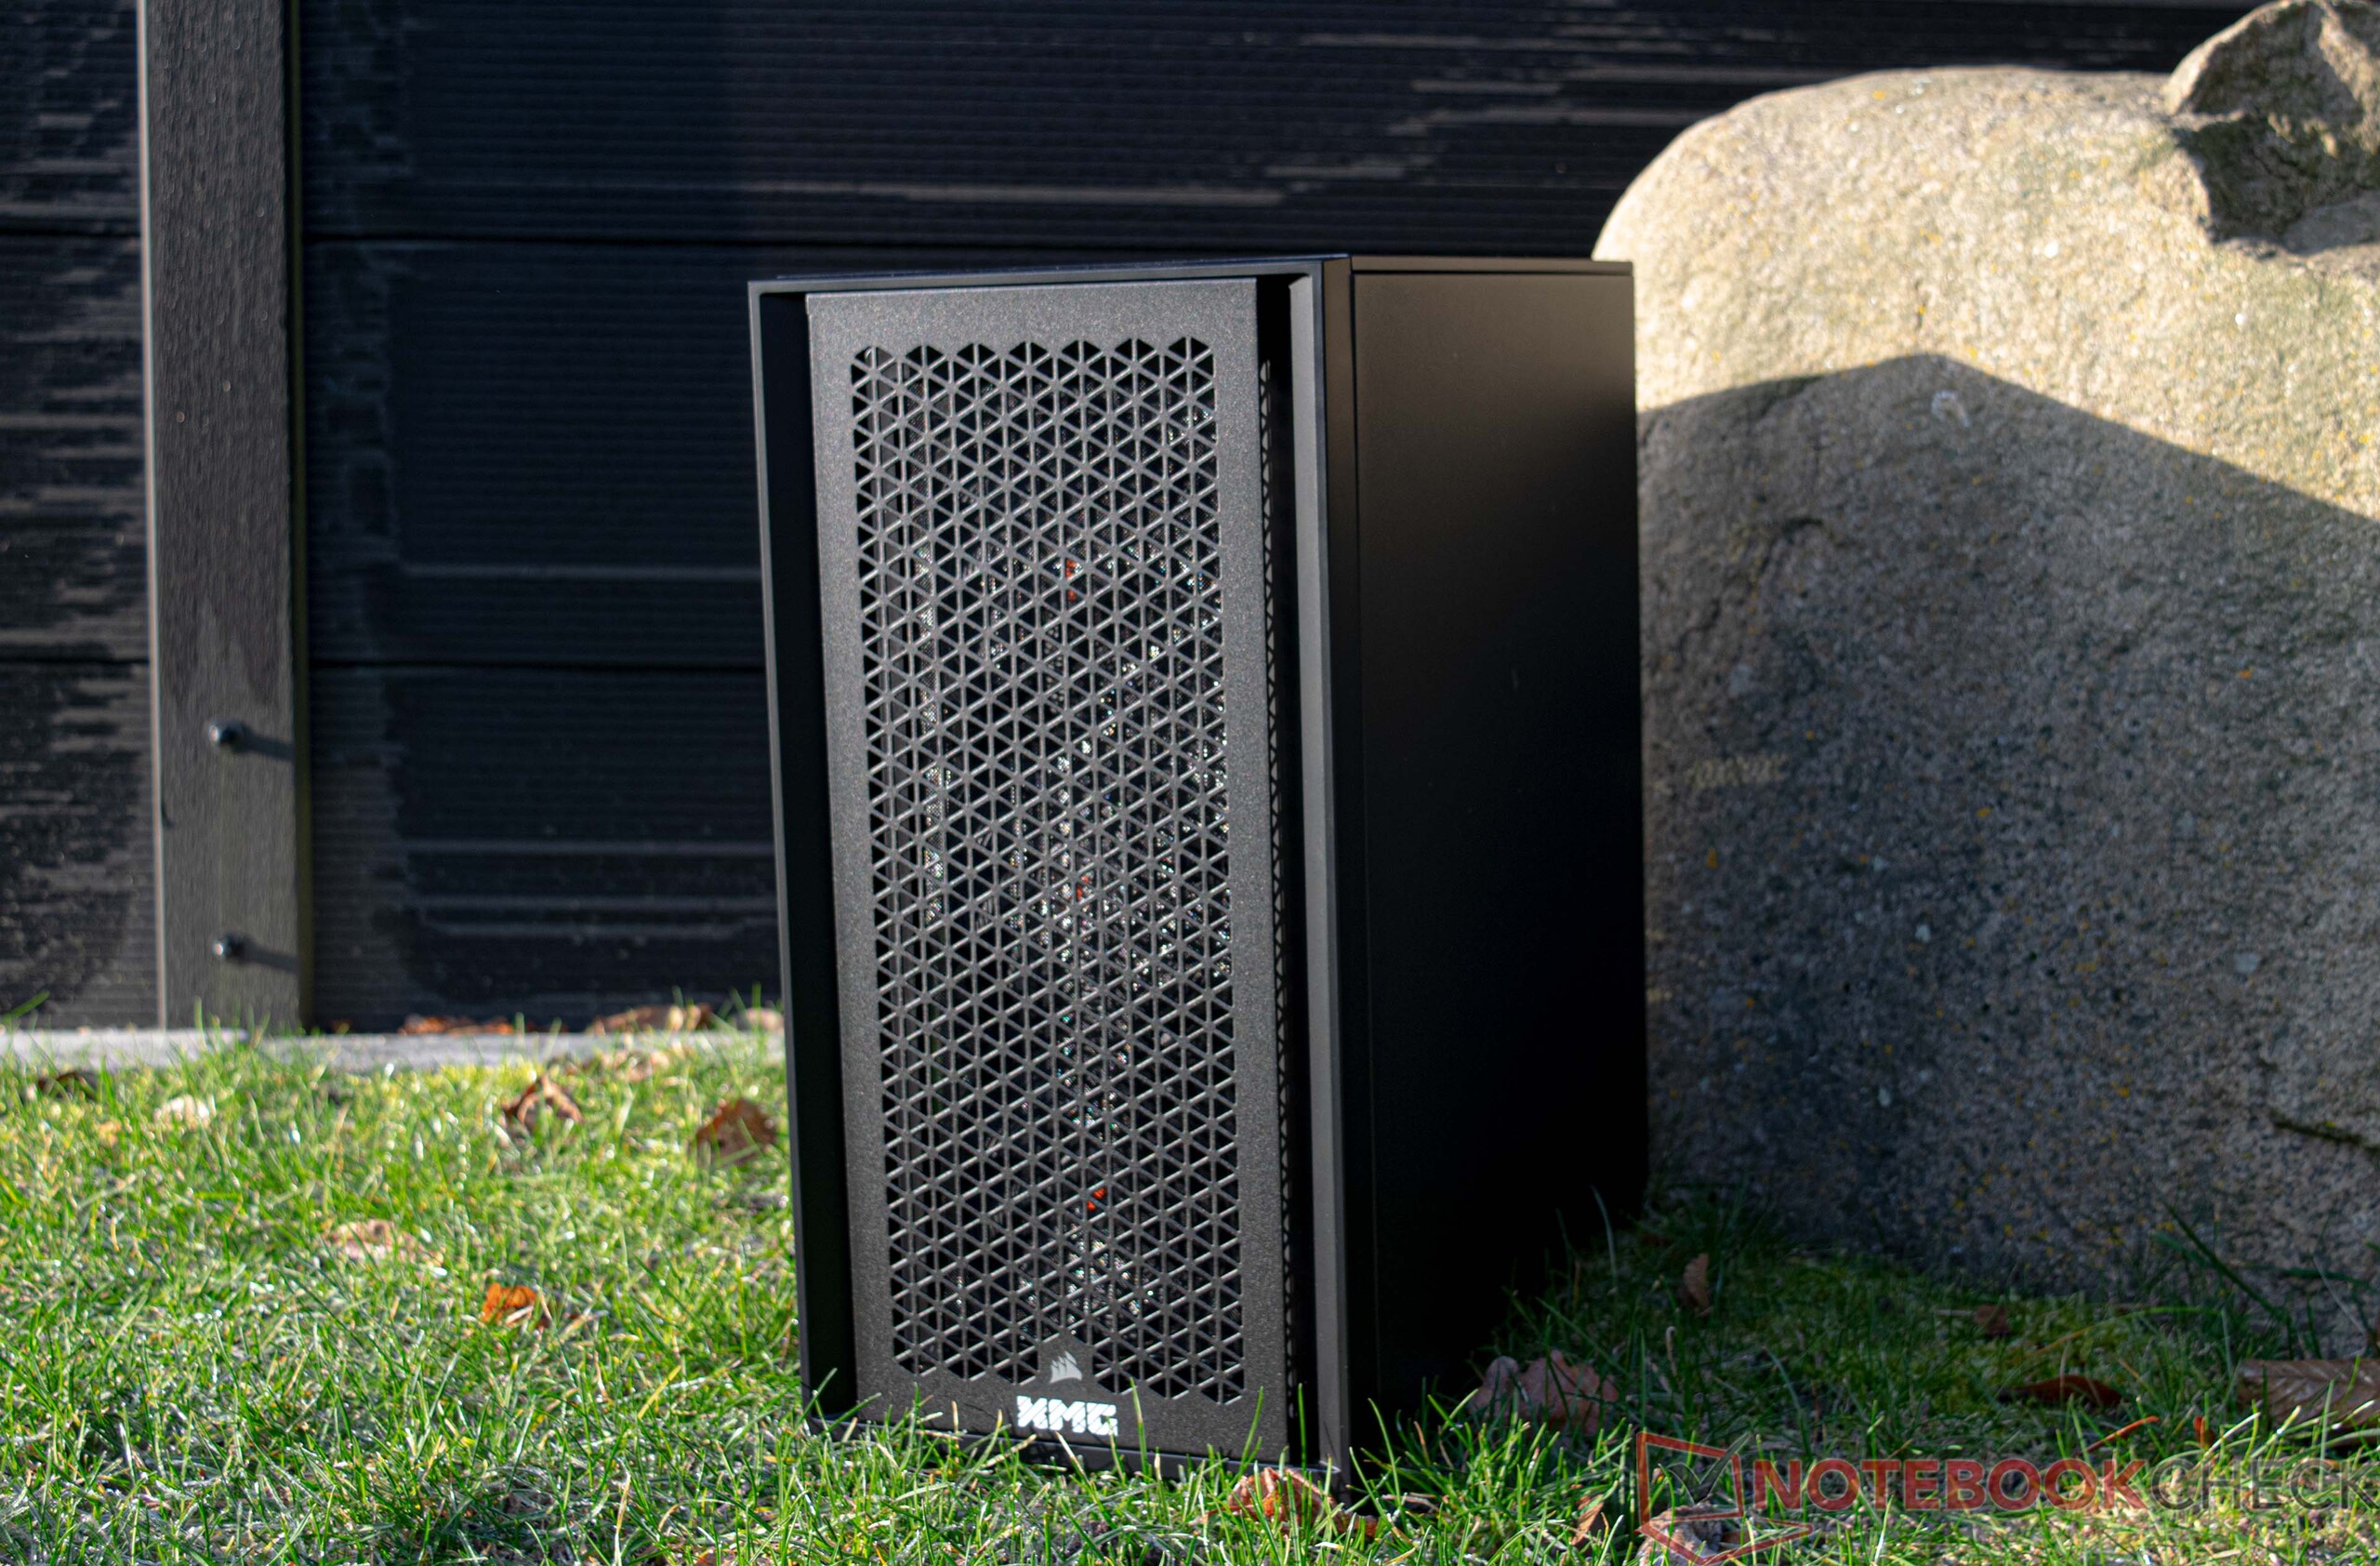
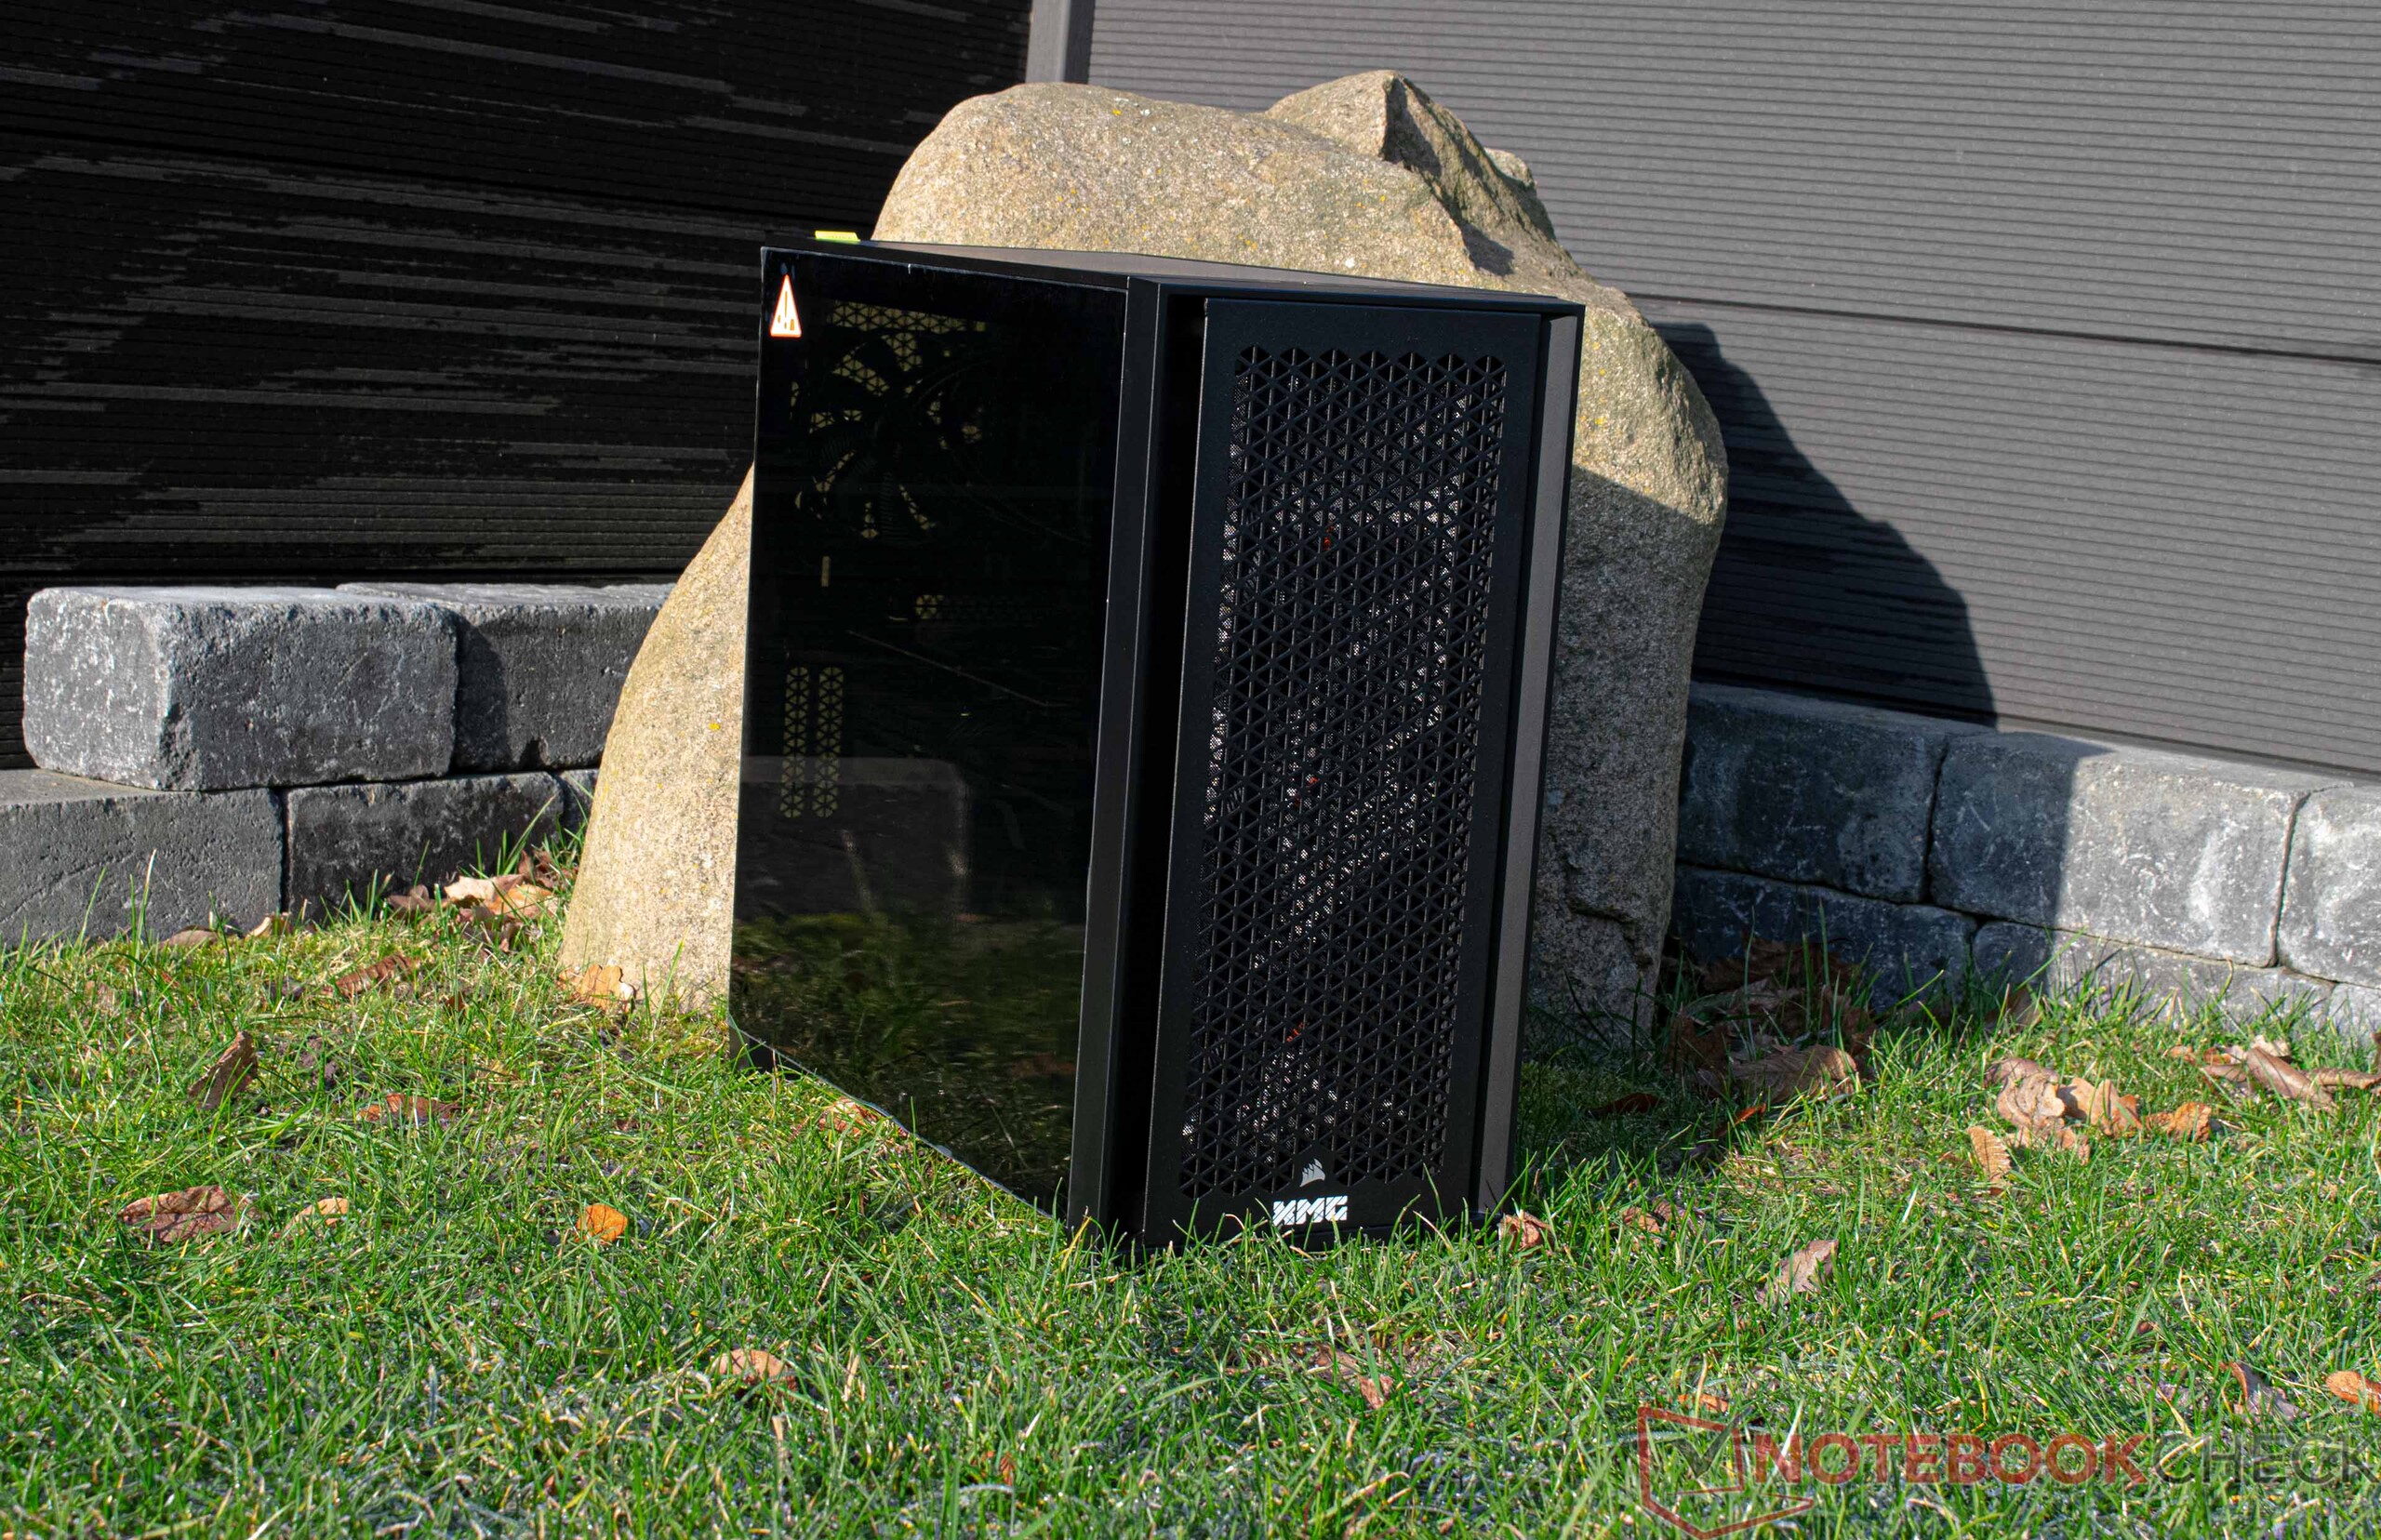
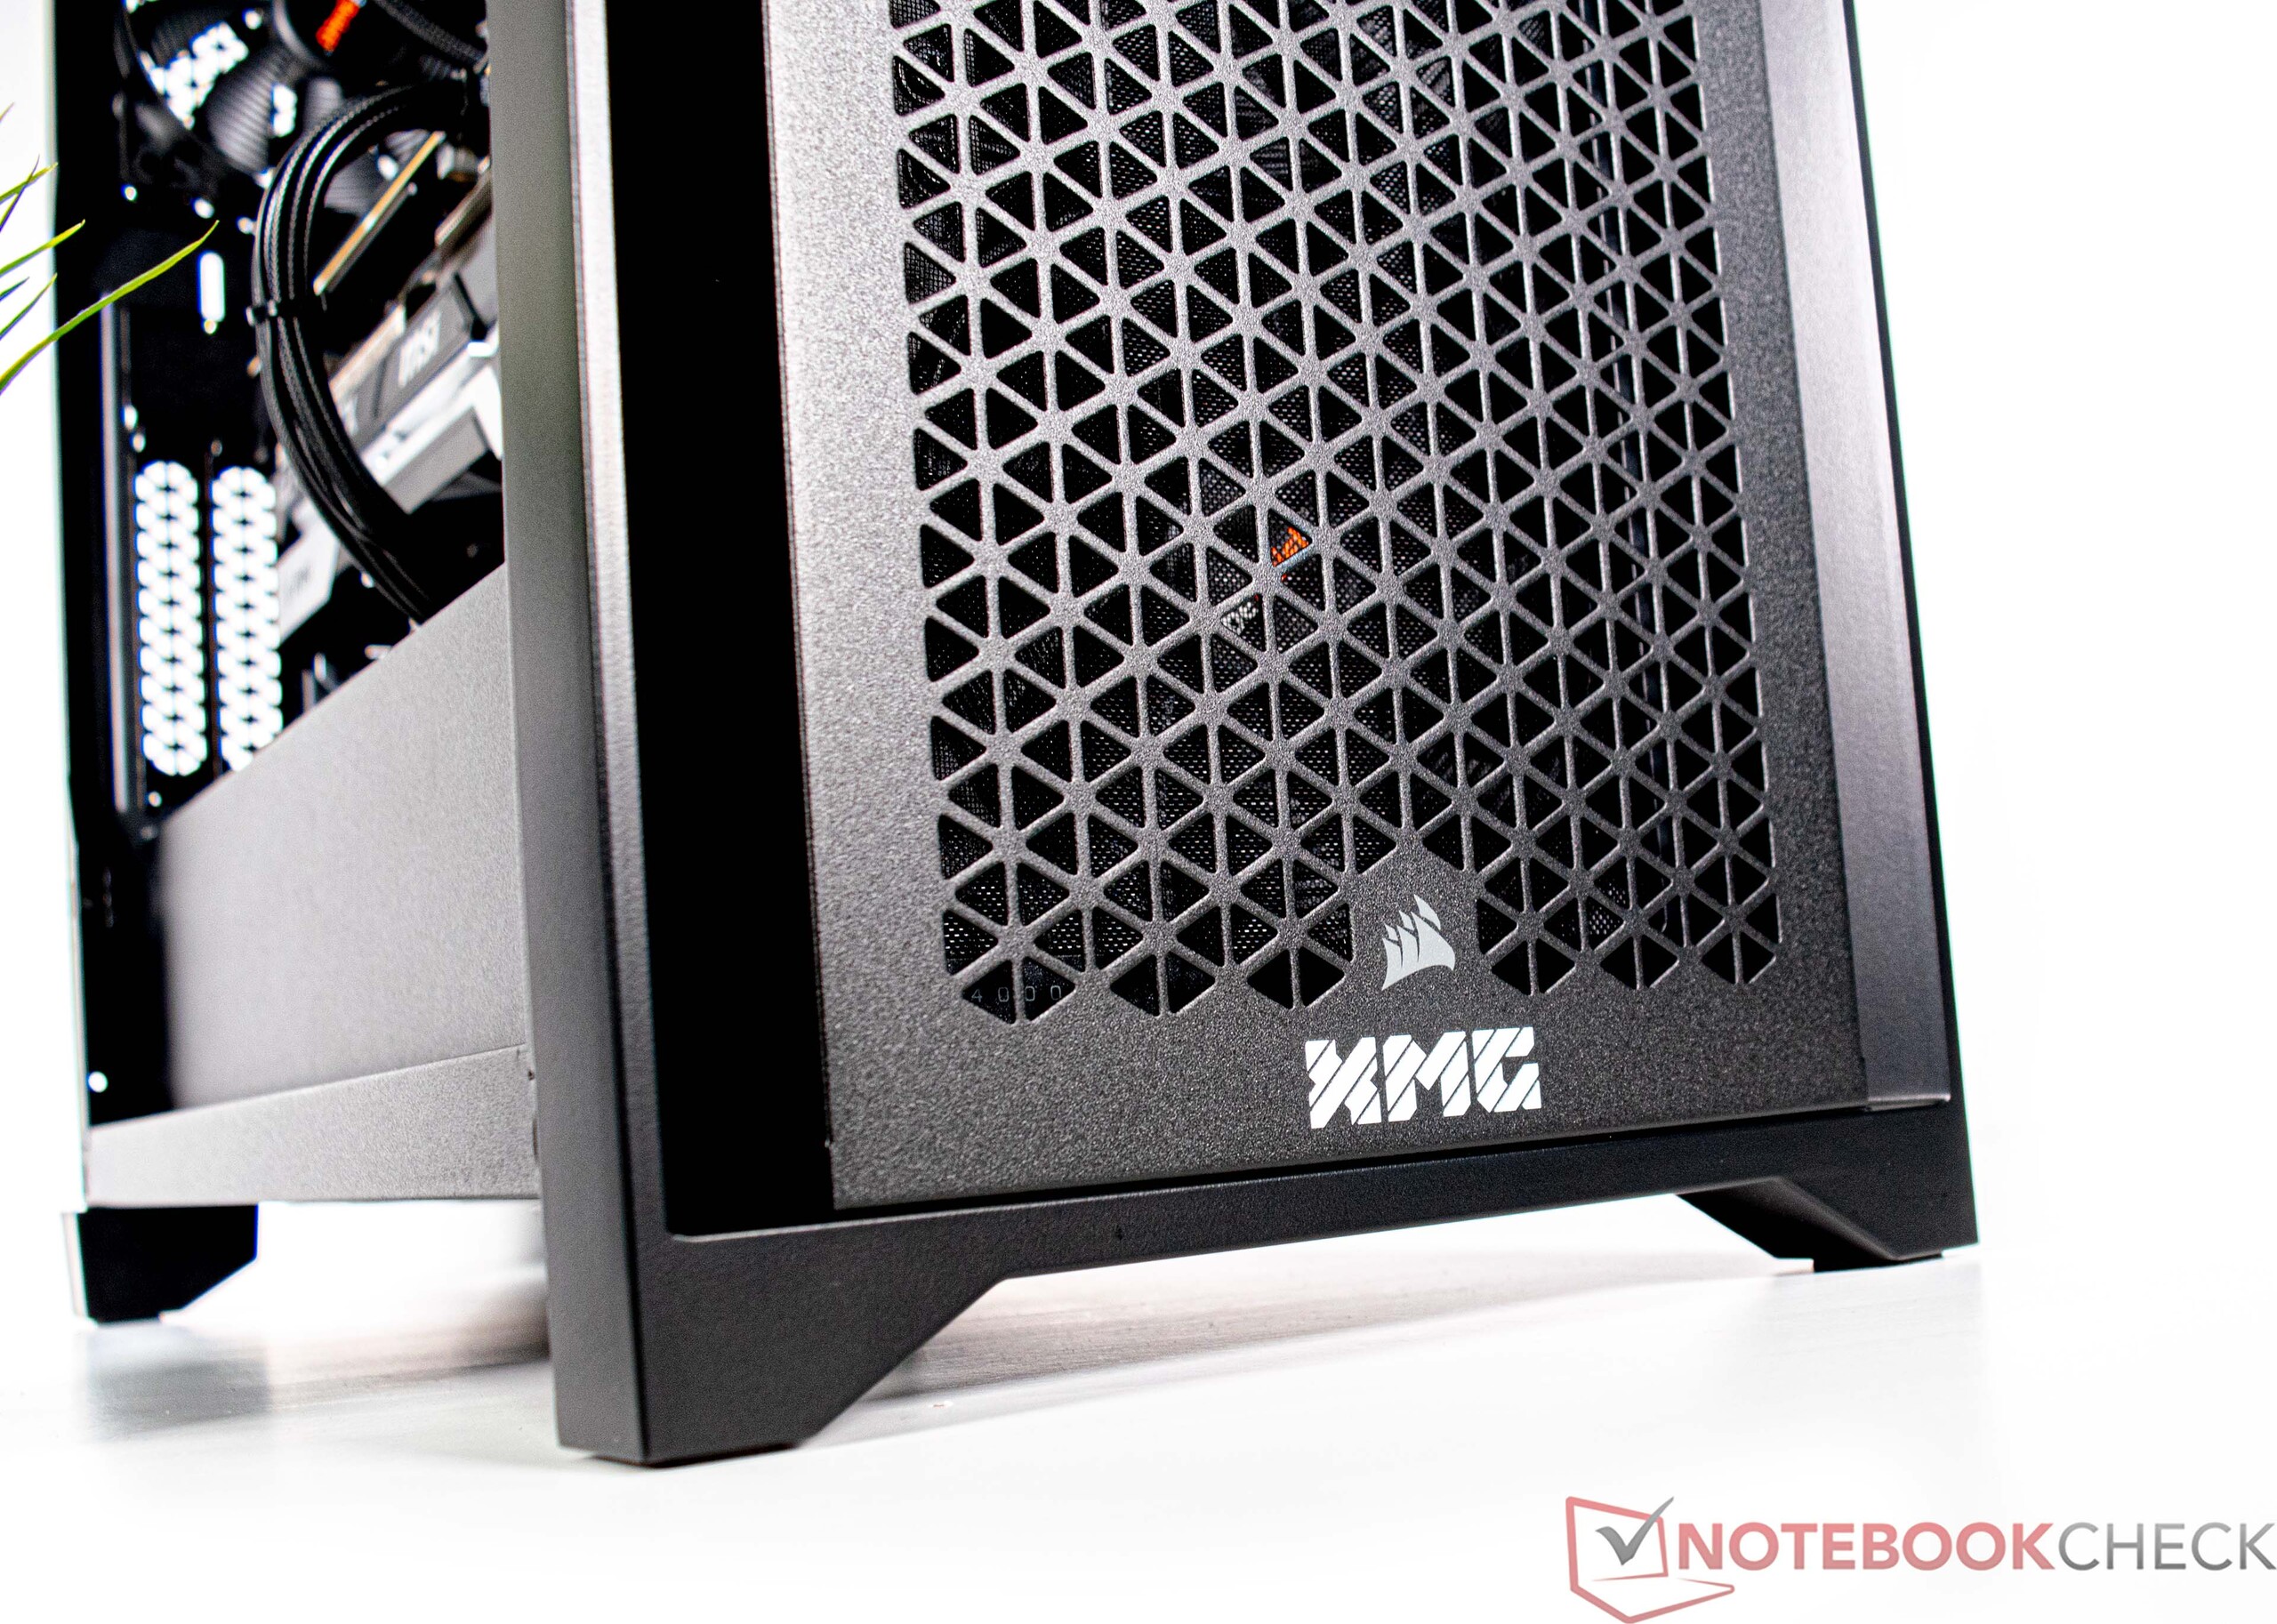
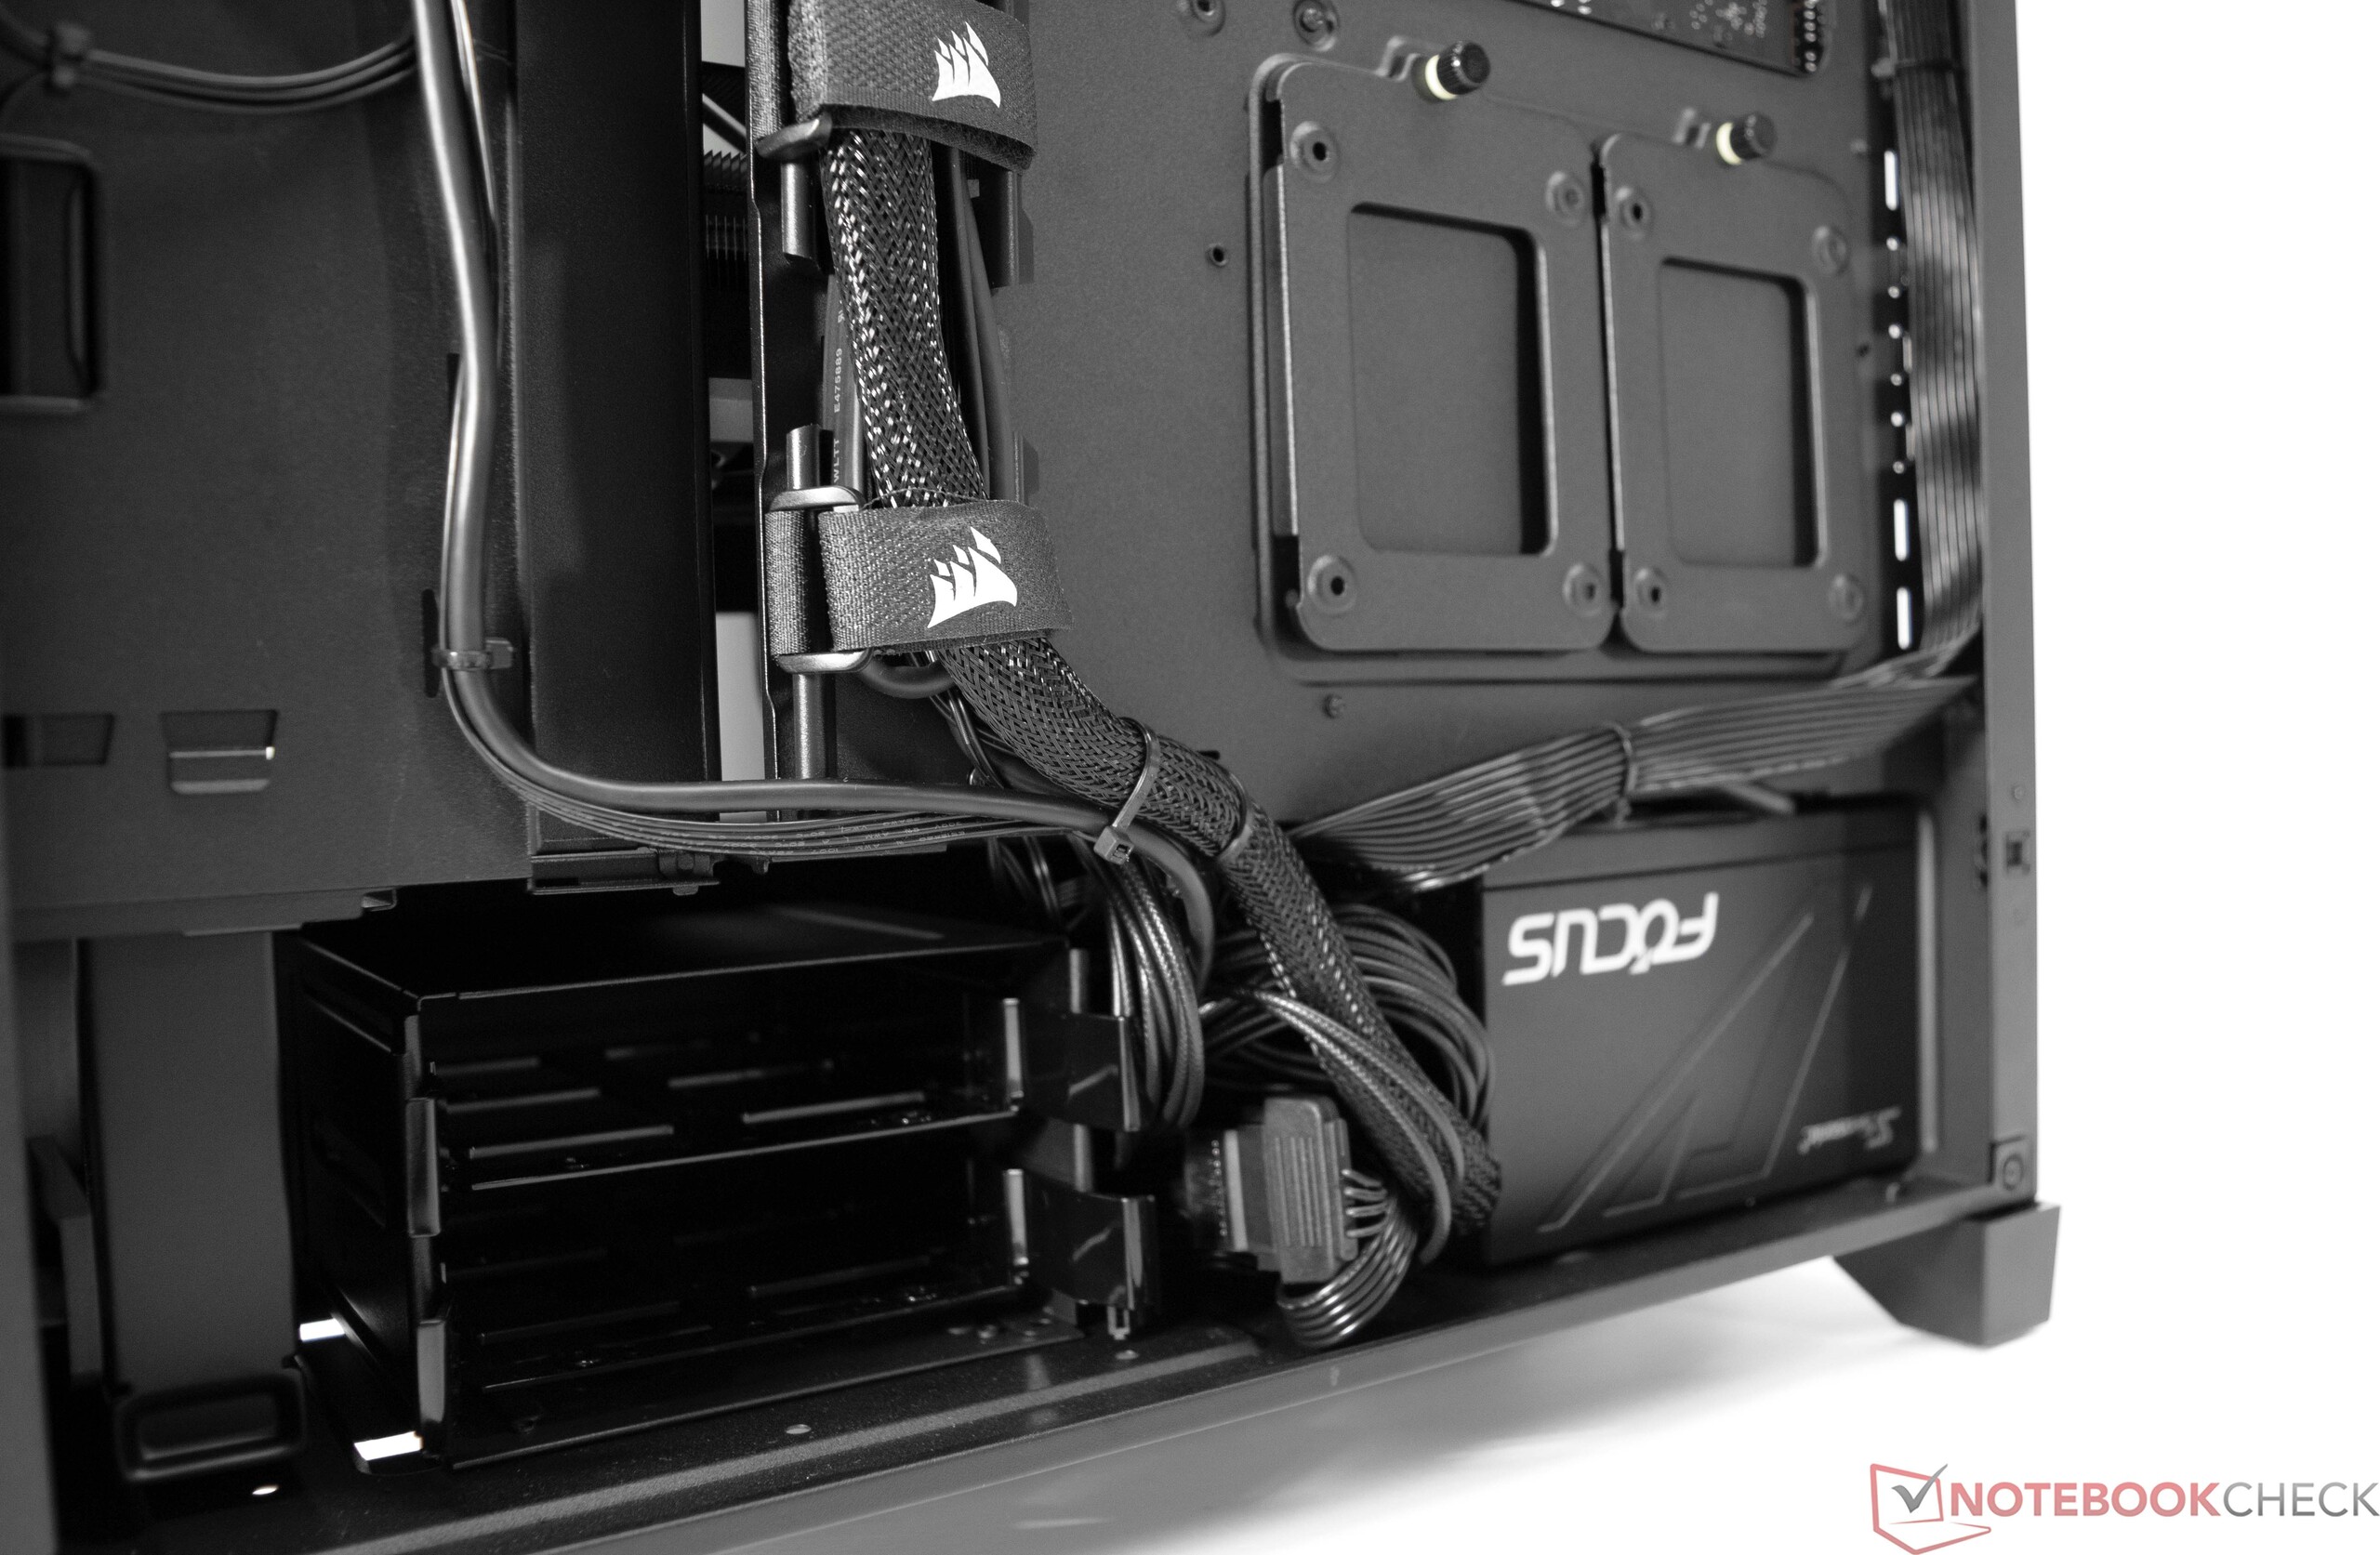
Kast - Corsair 4000D Airflow
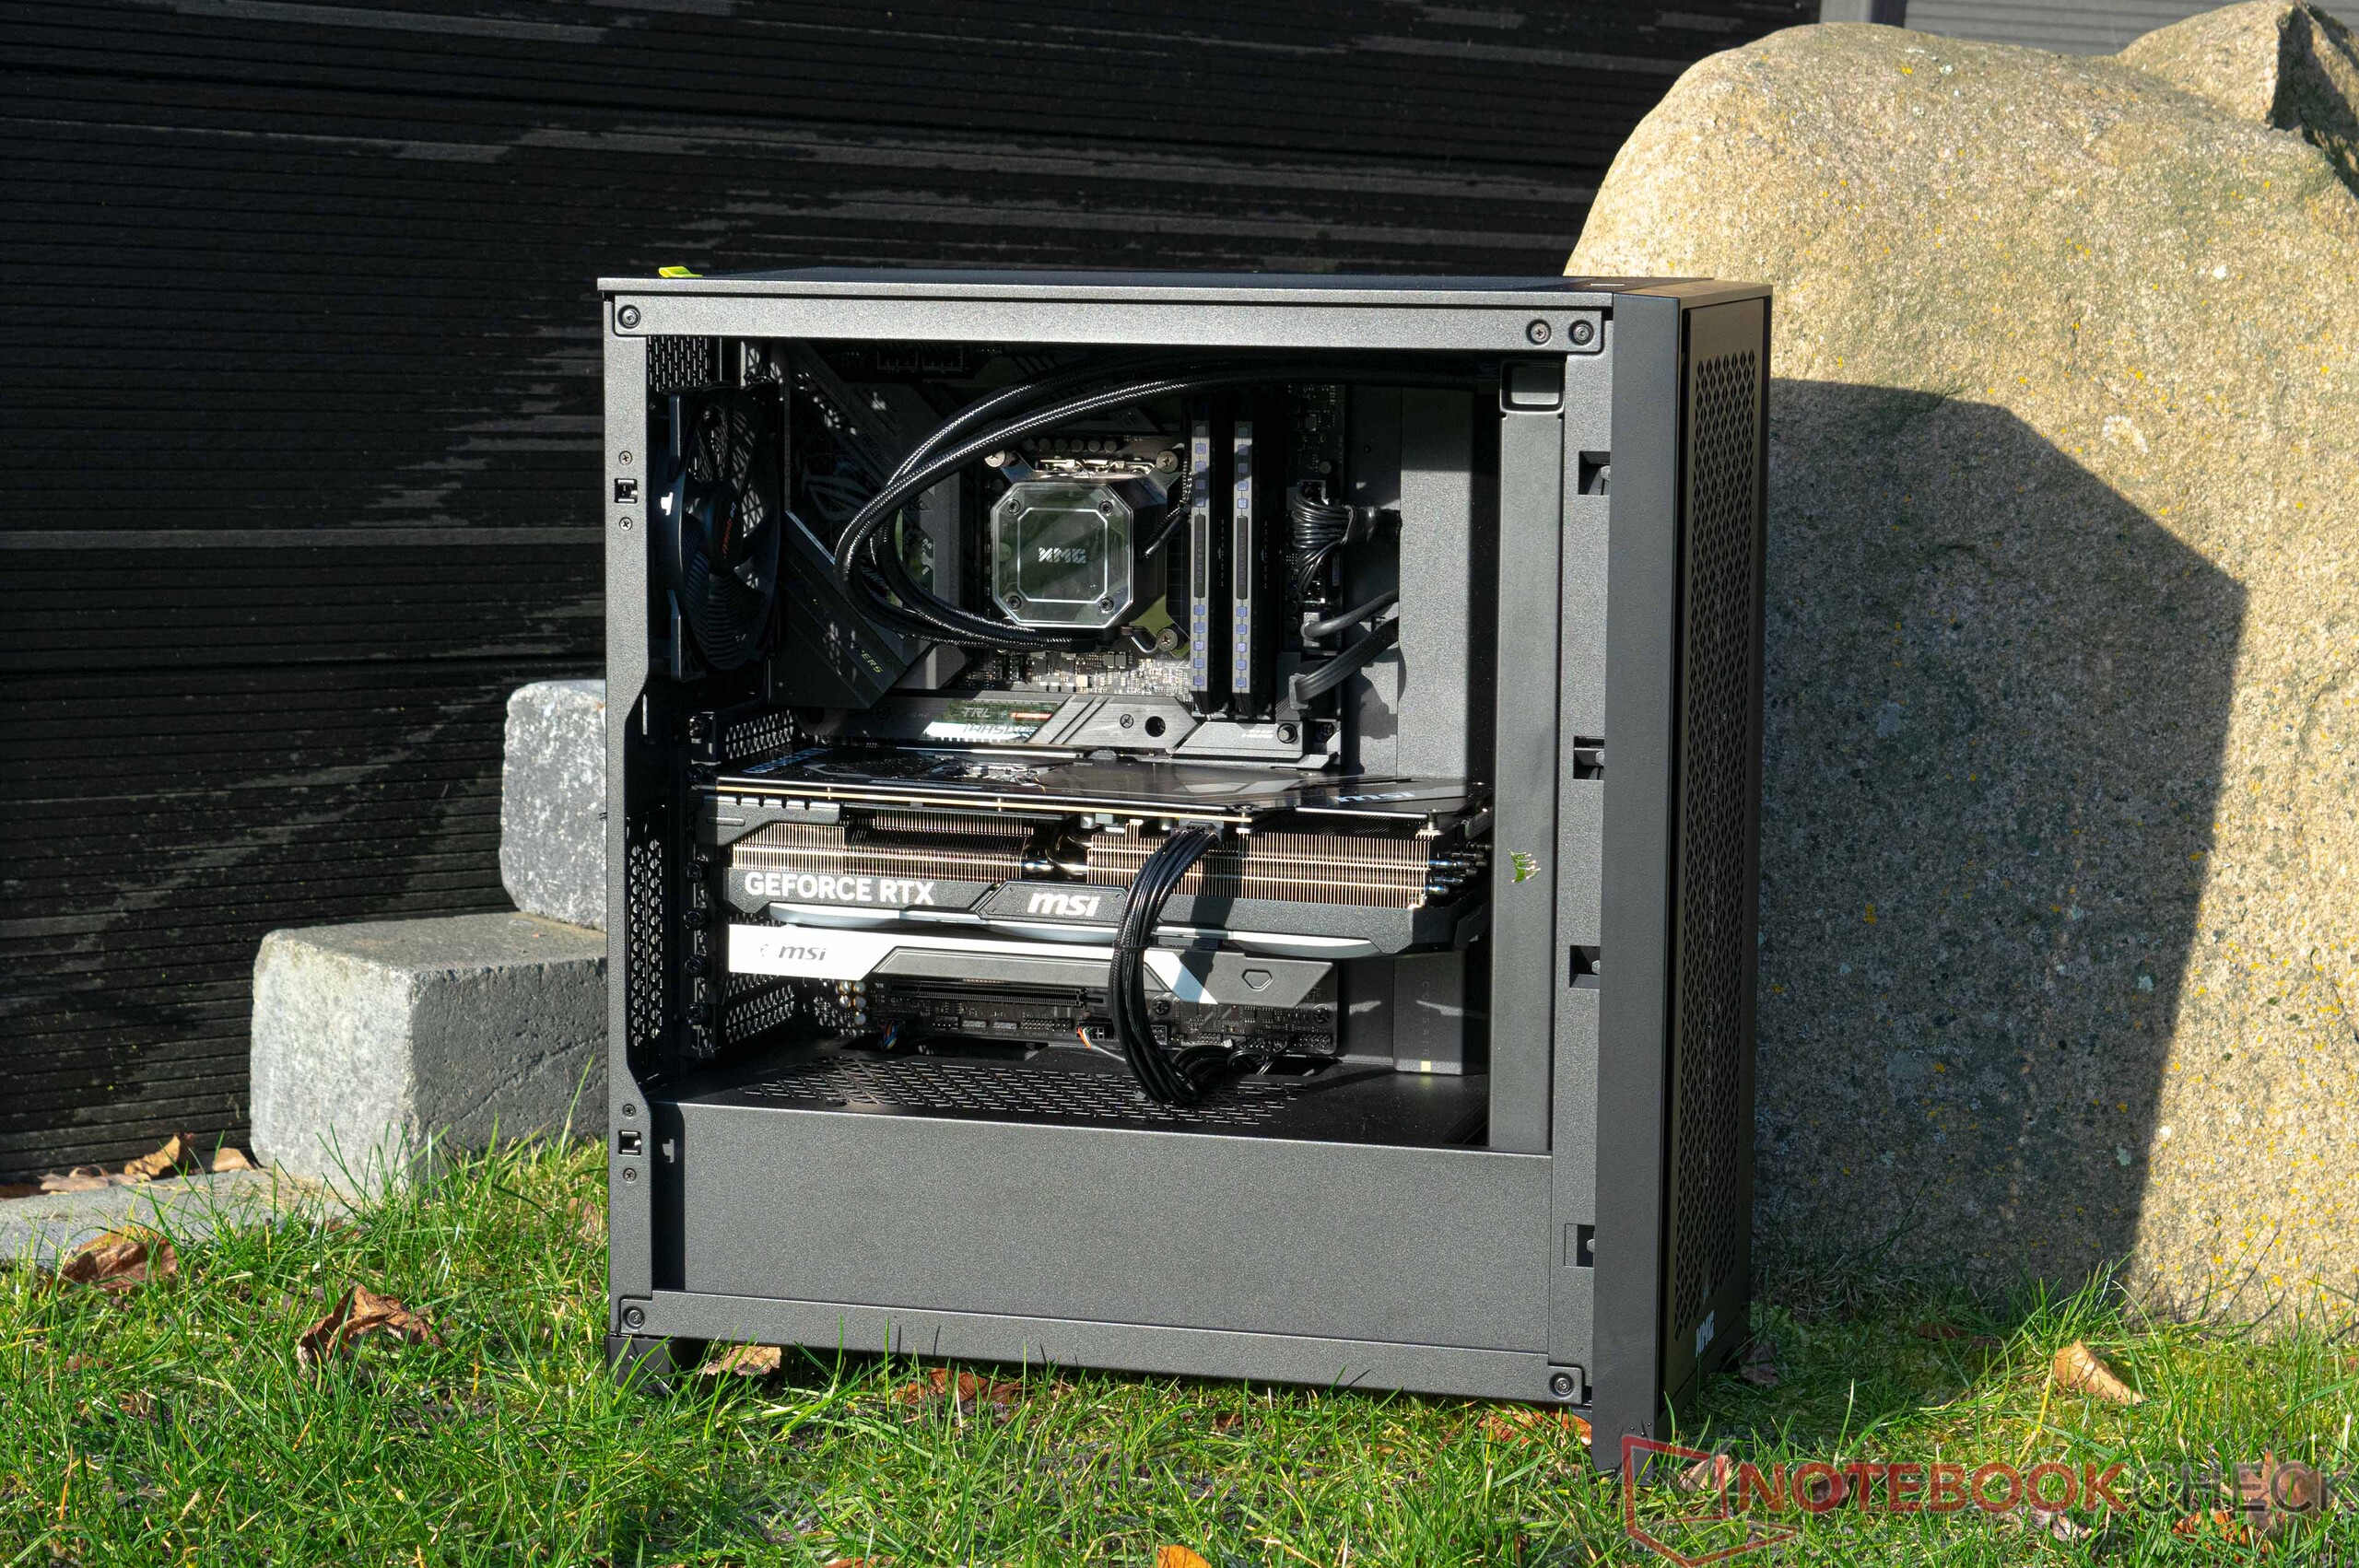
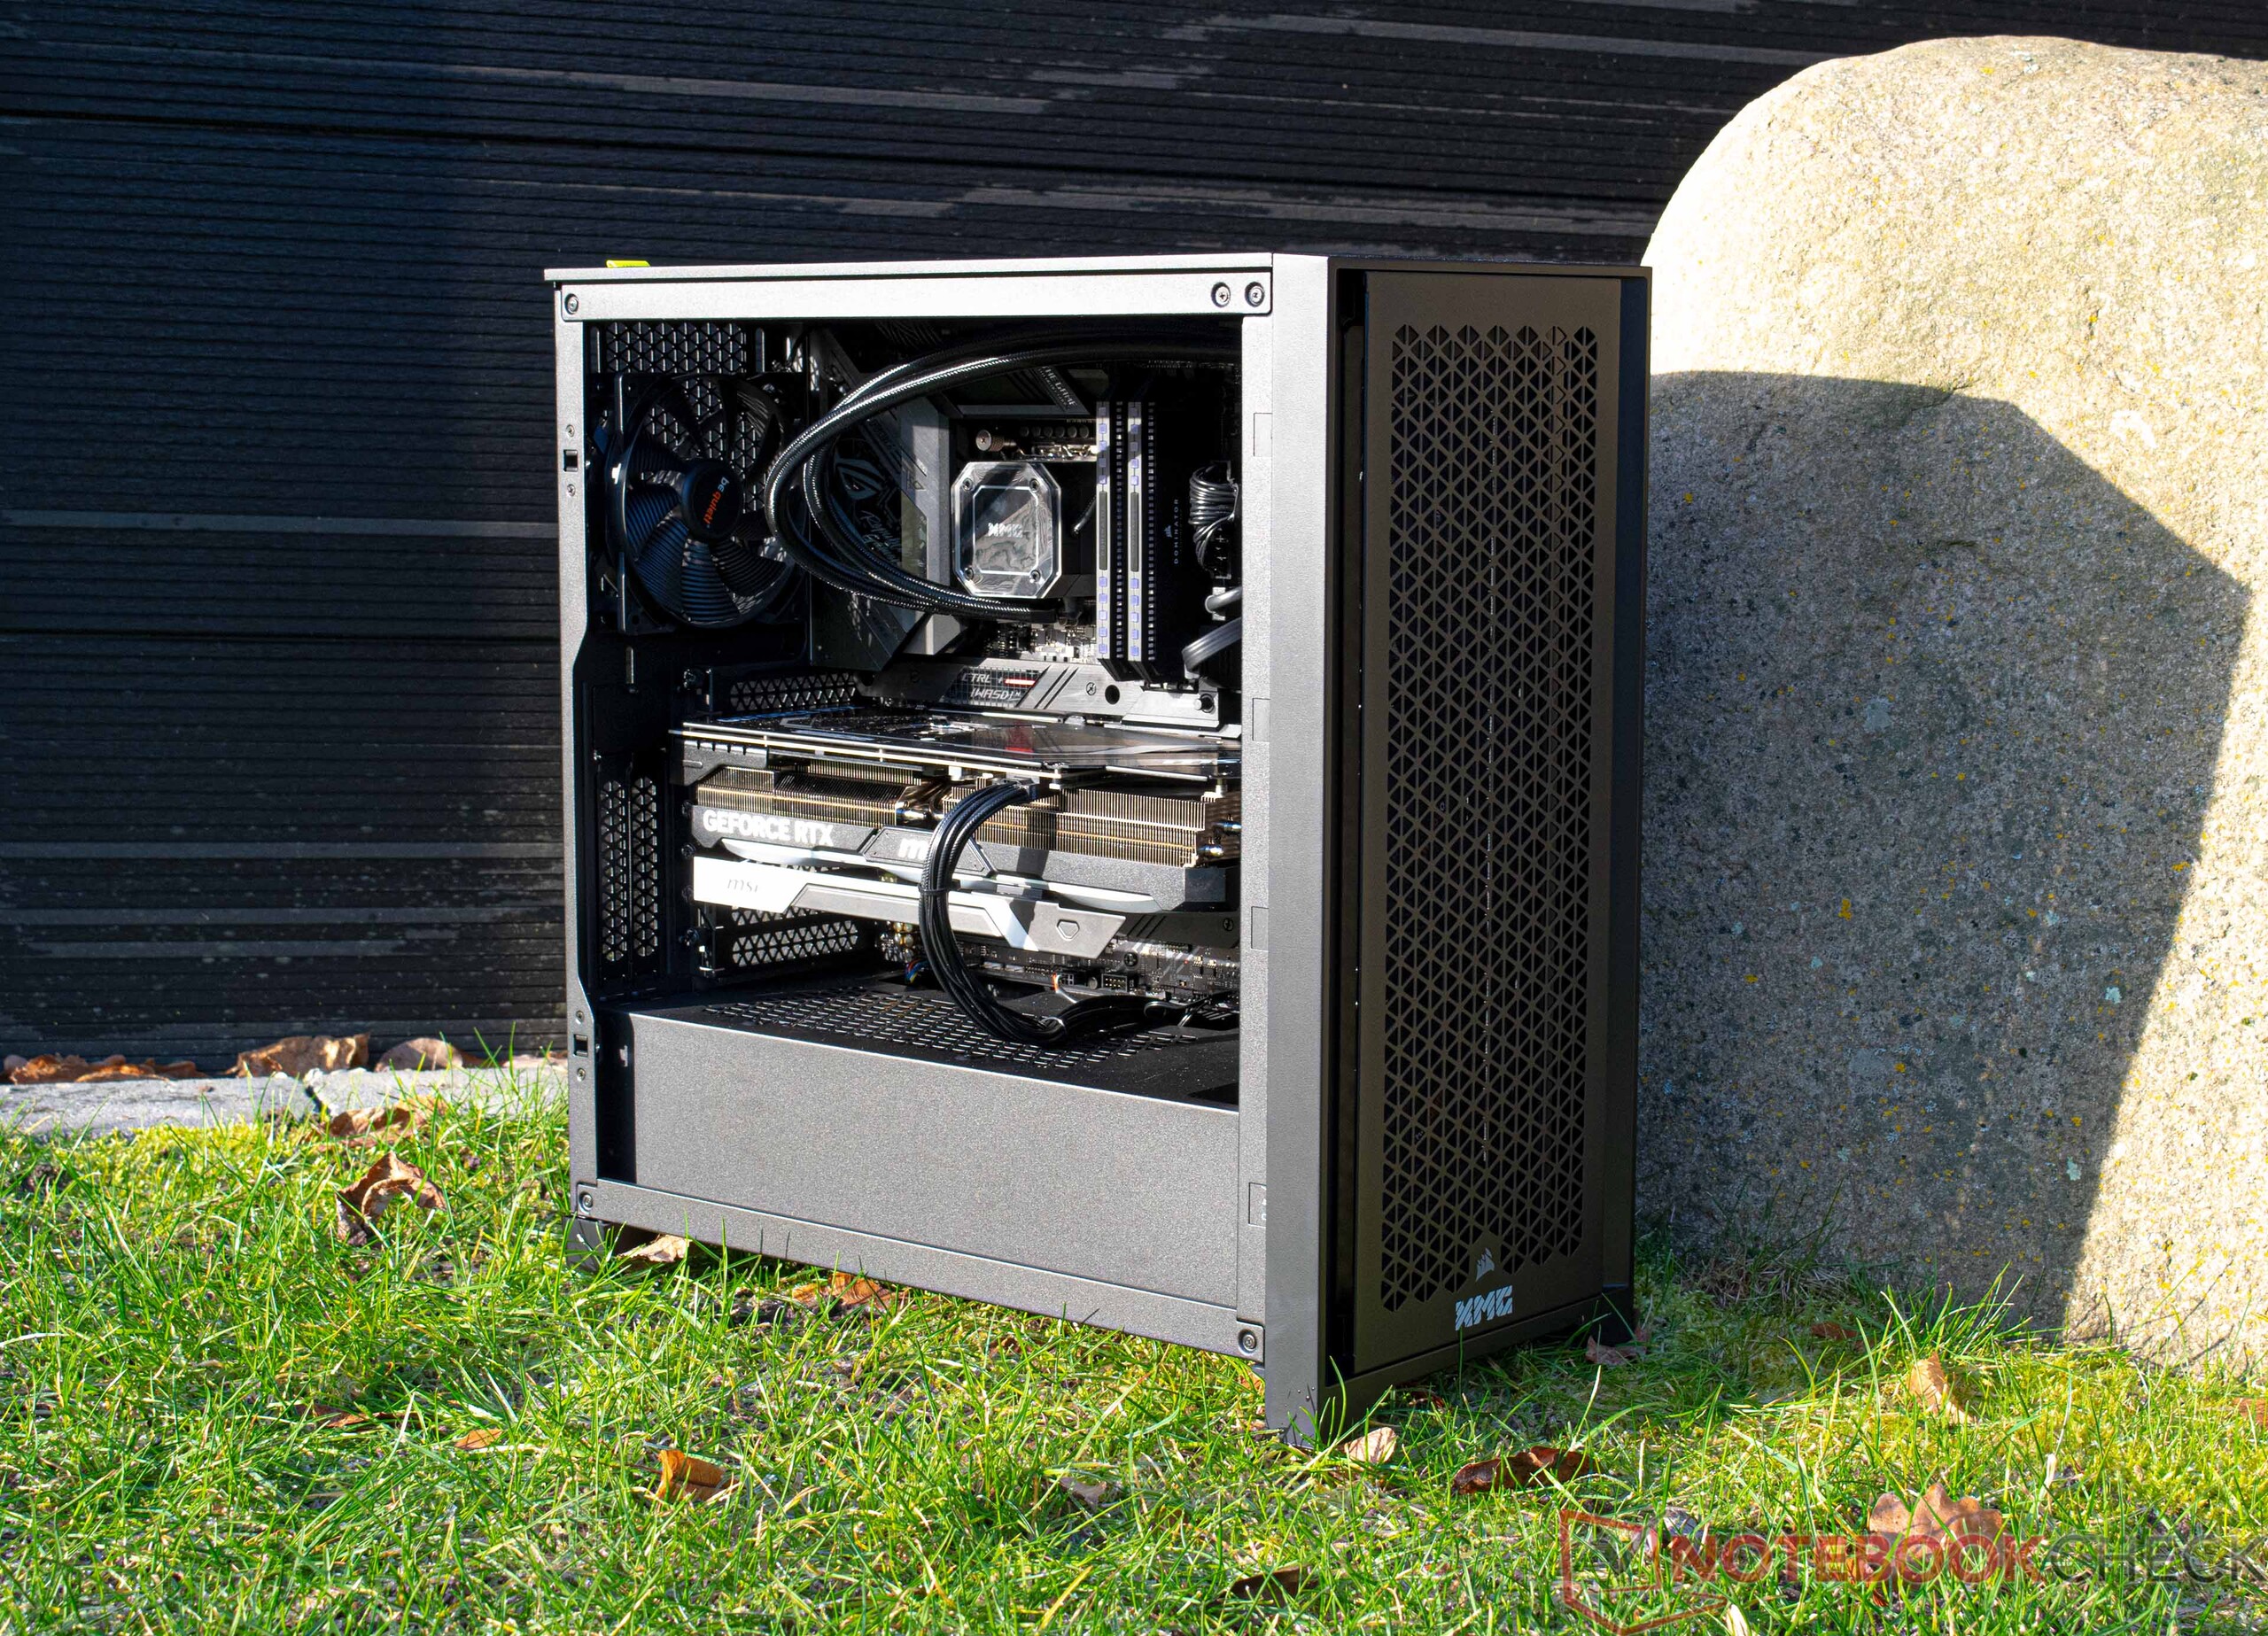
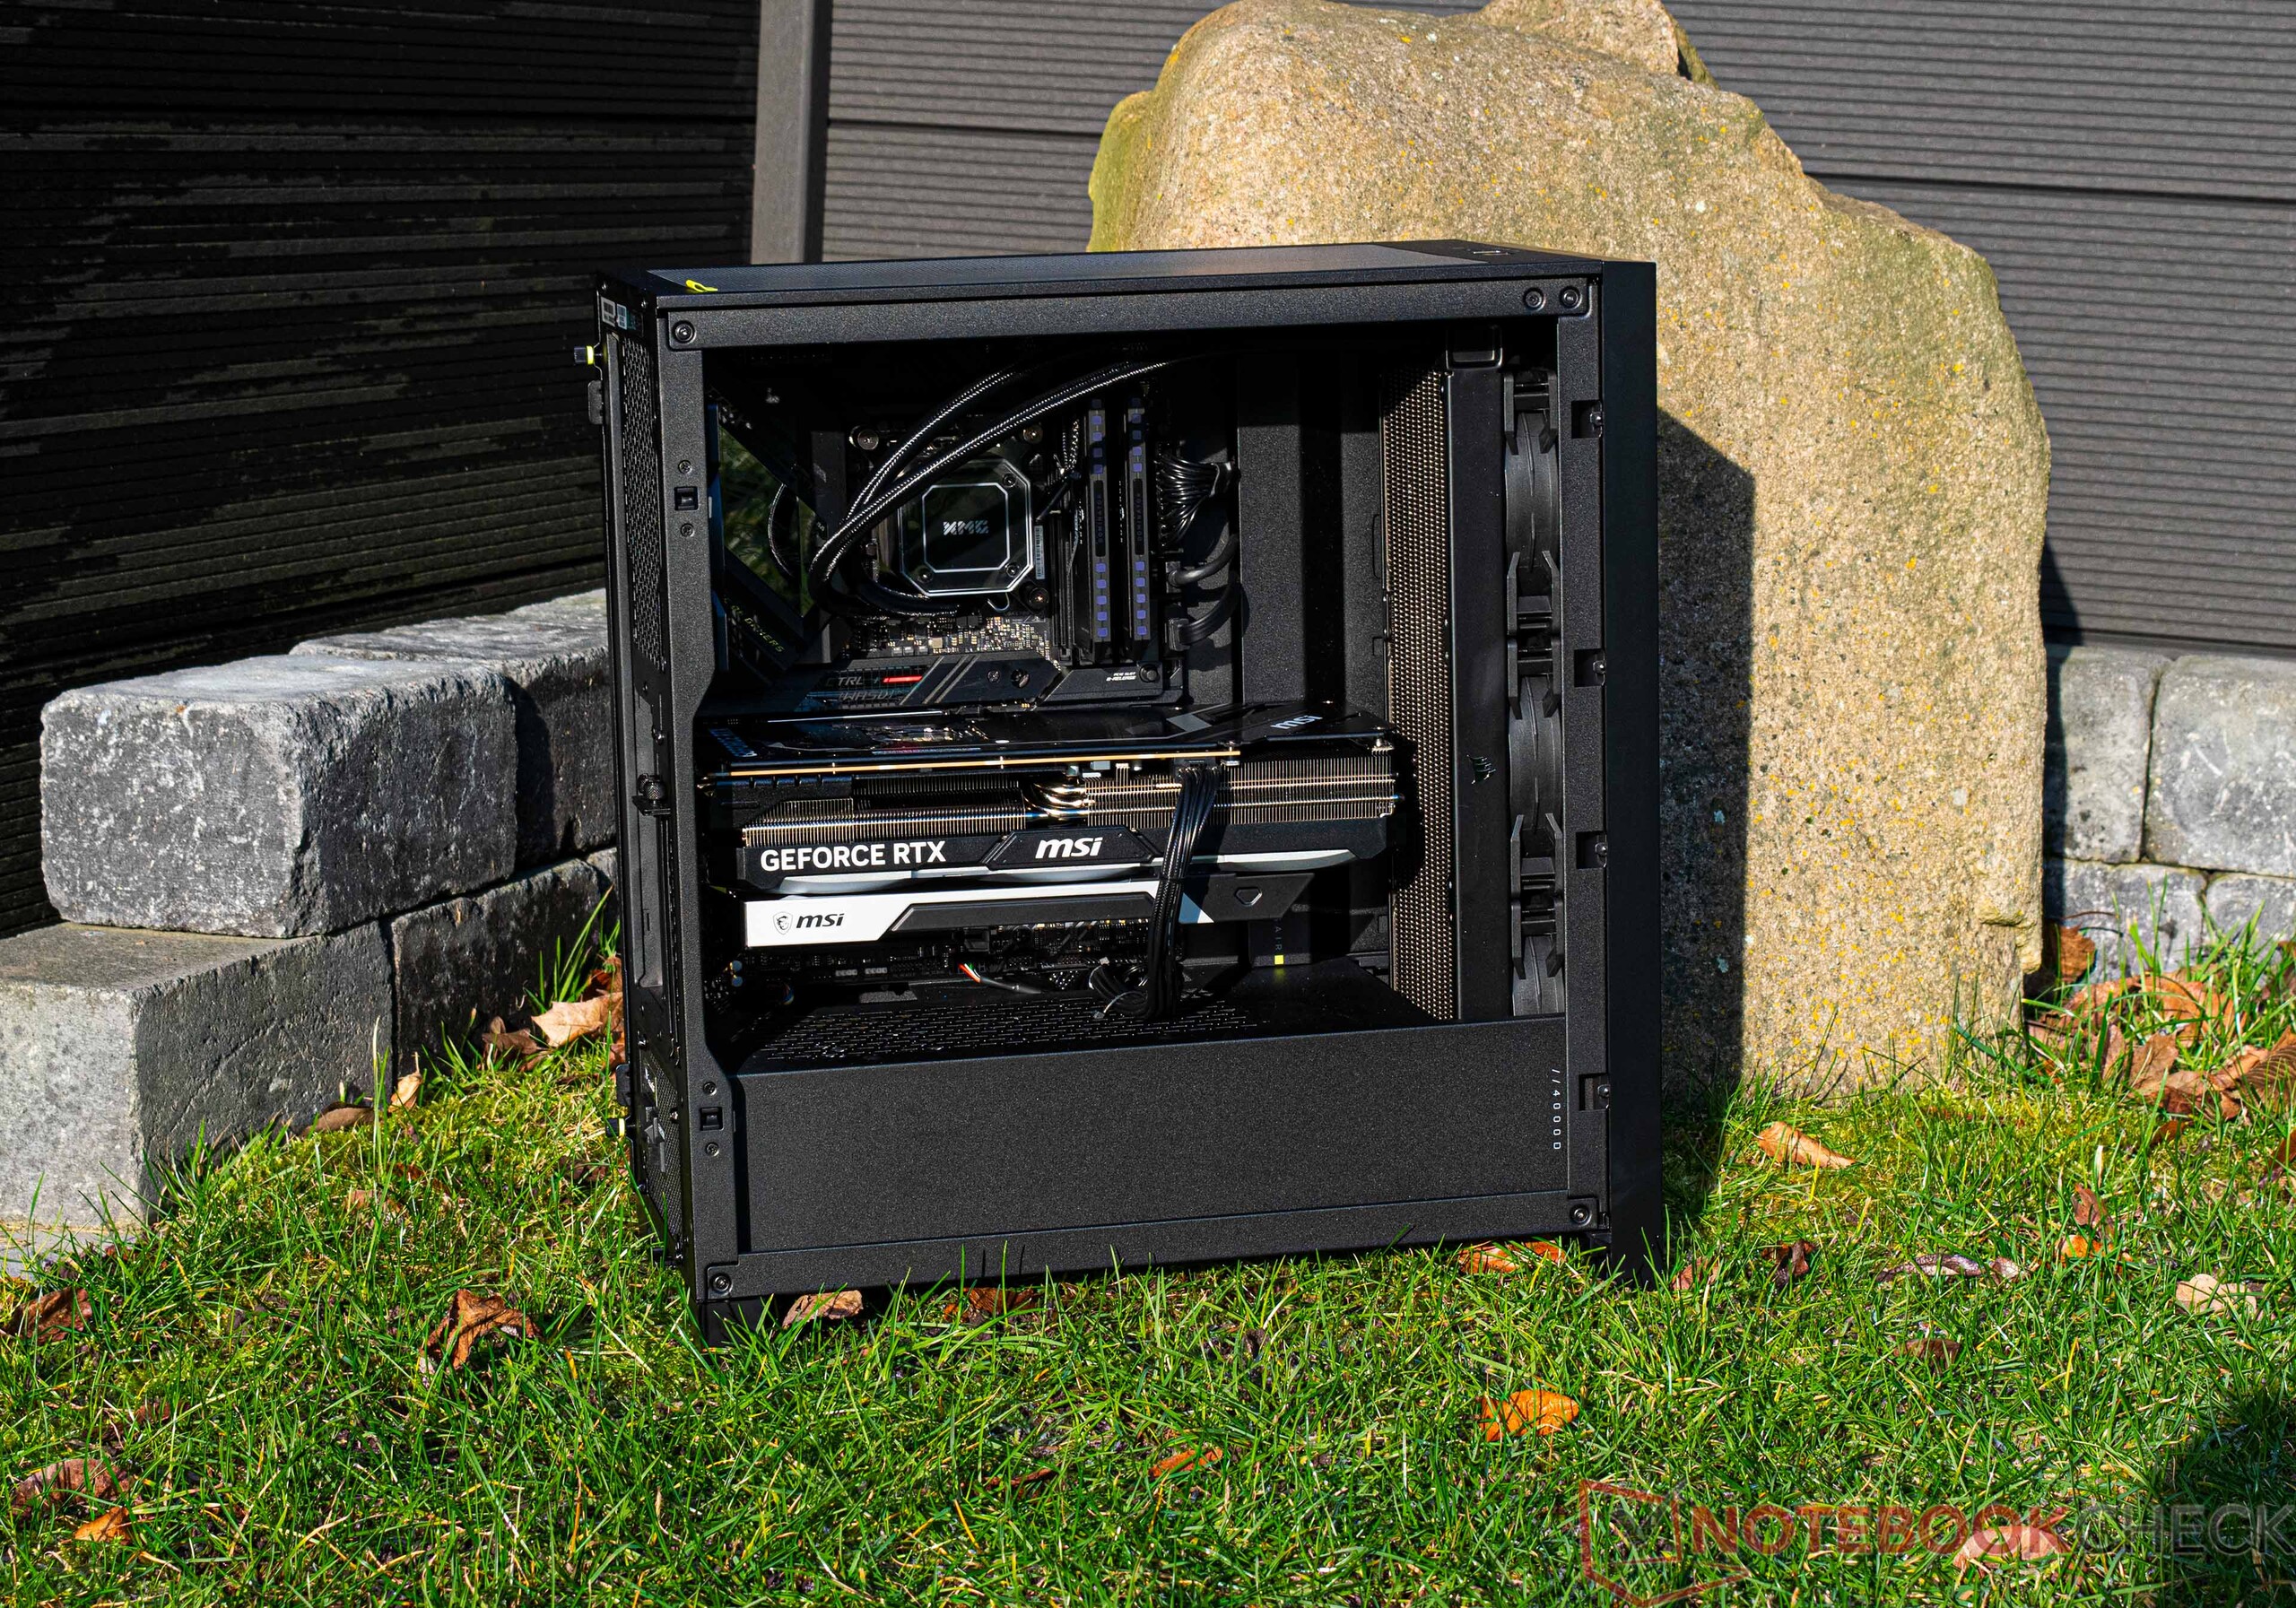
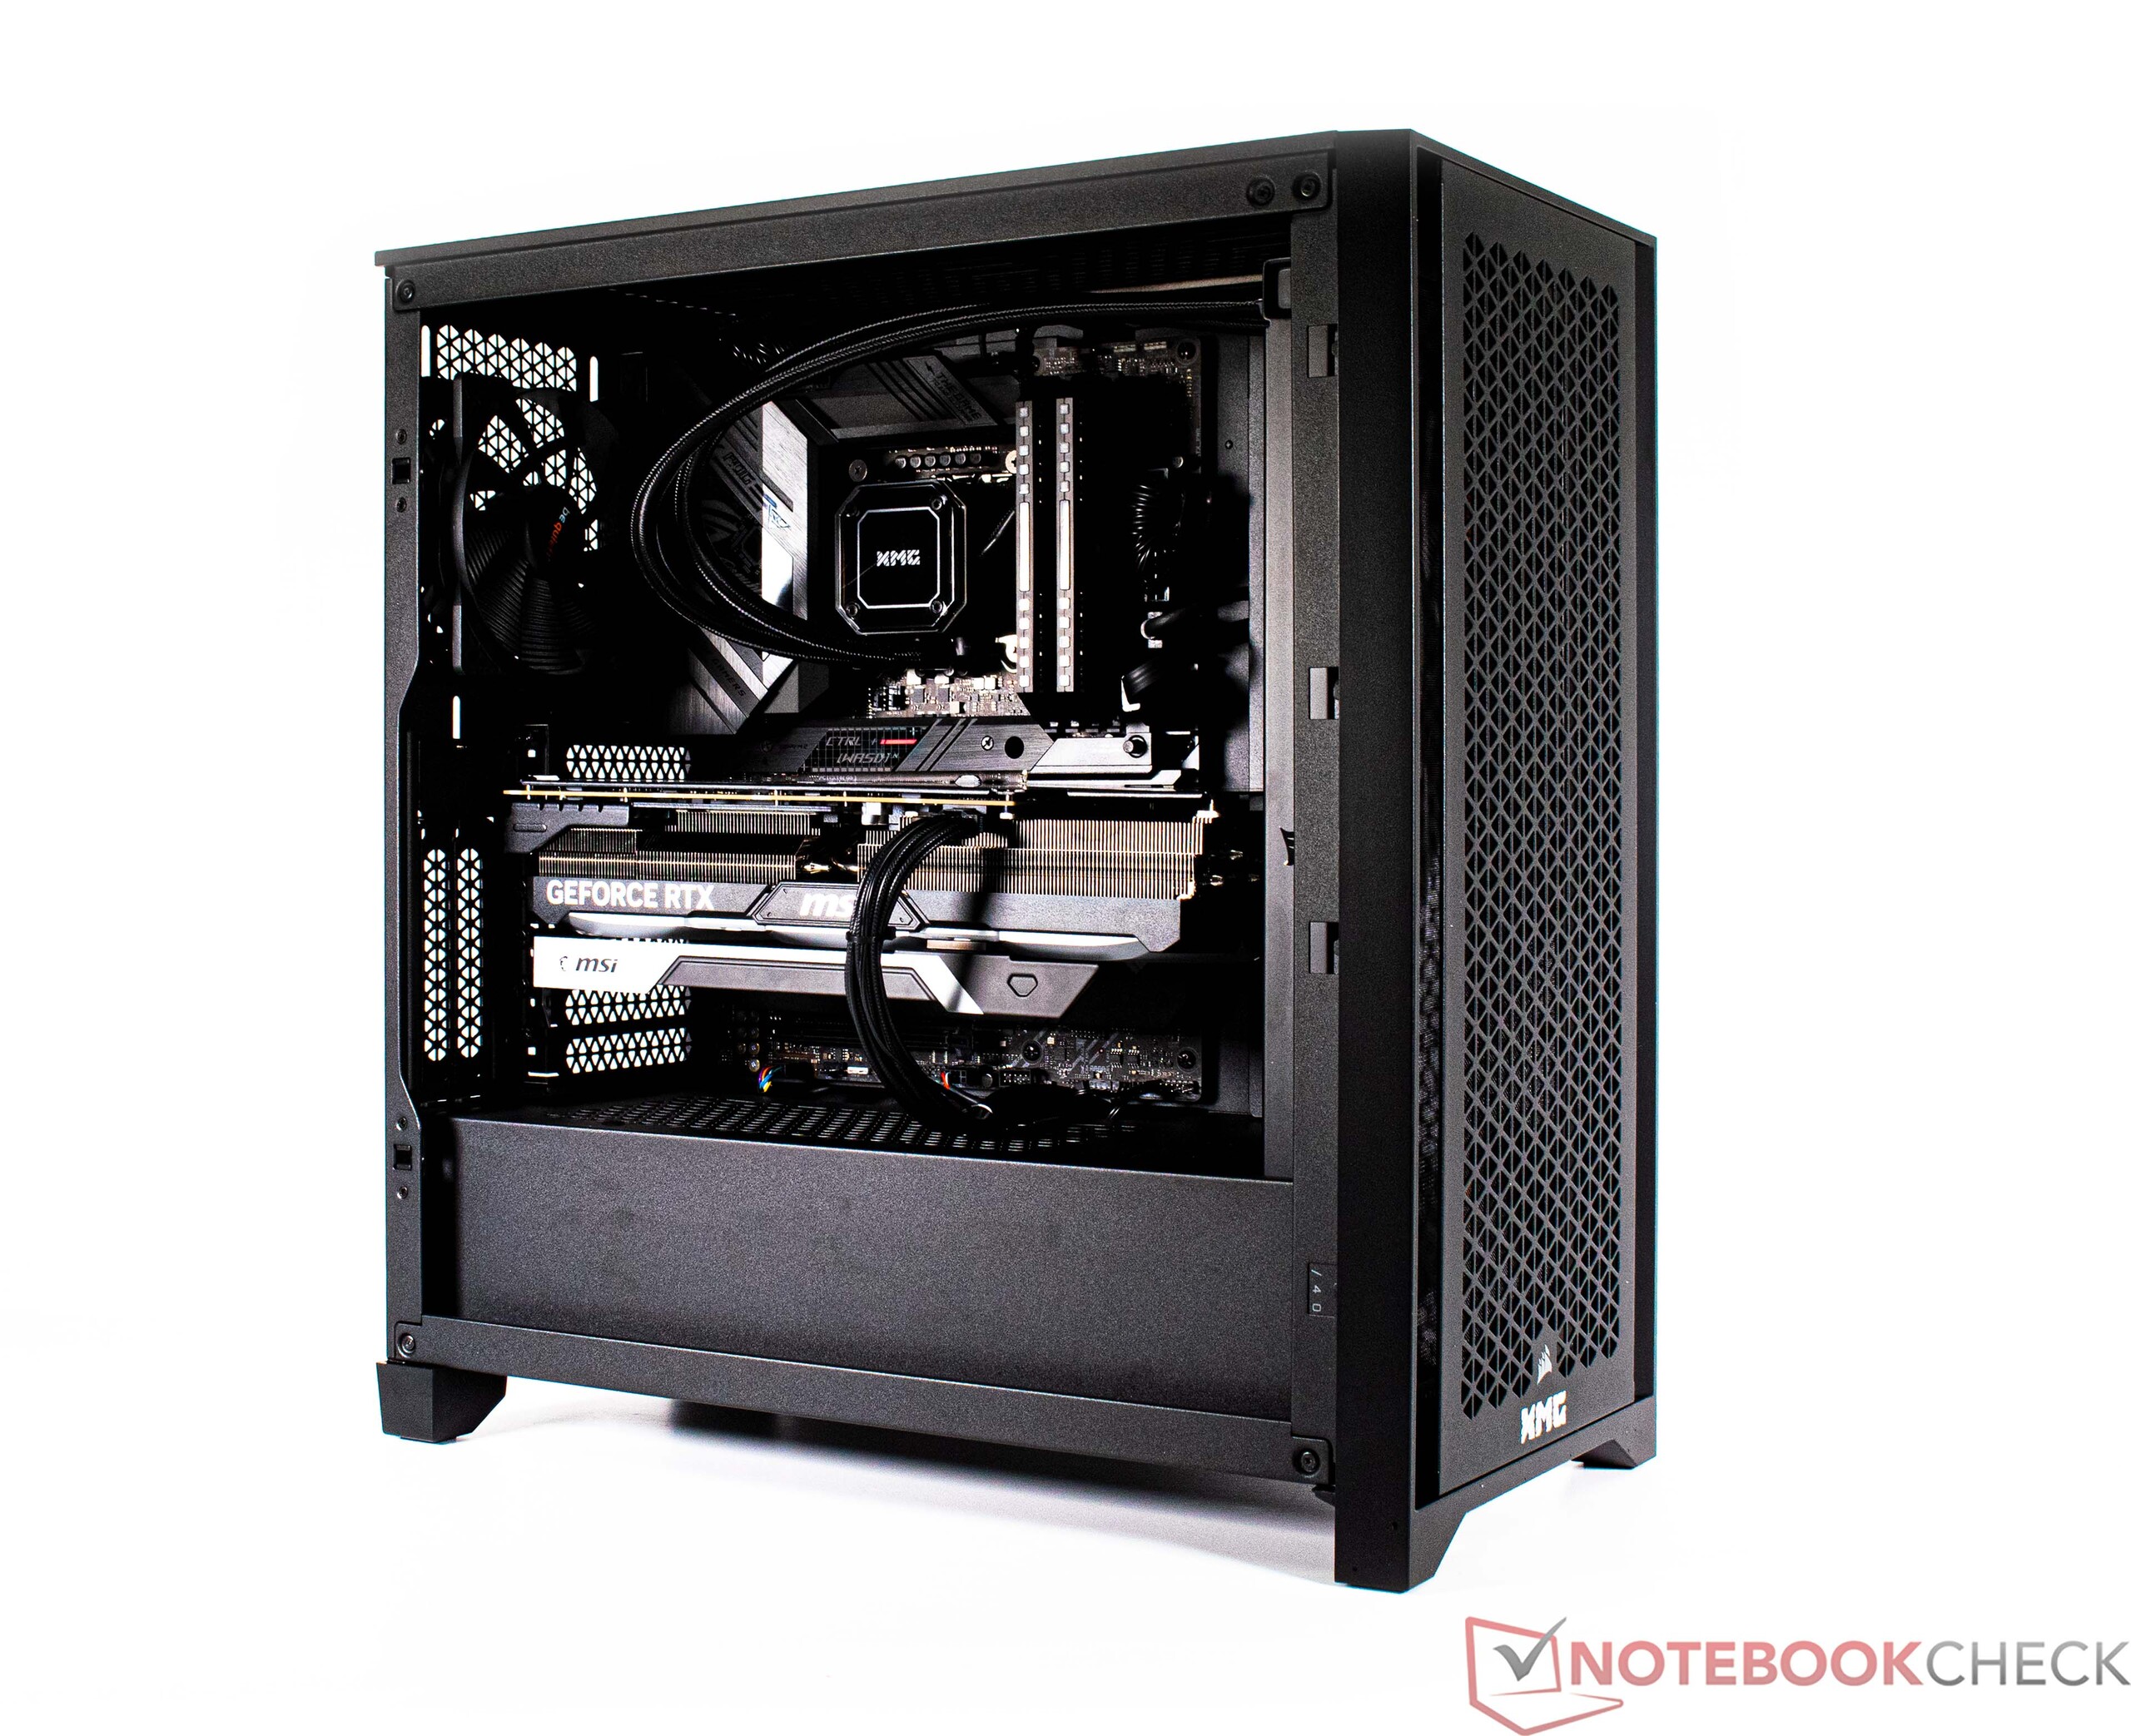
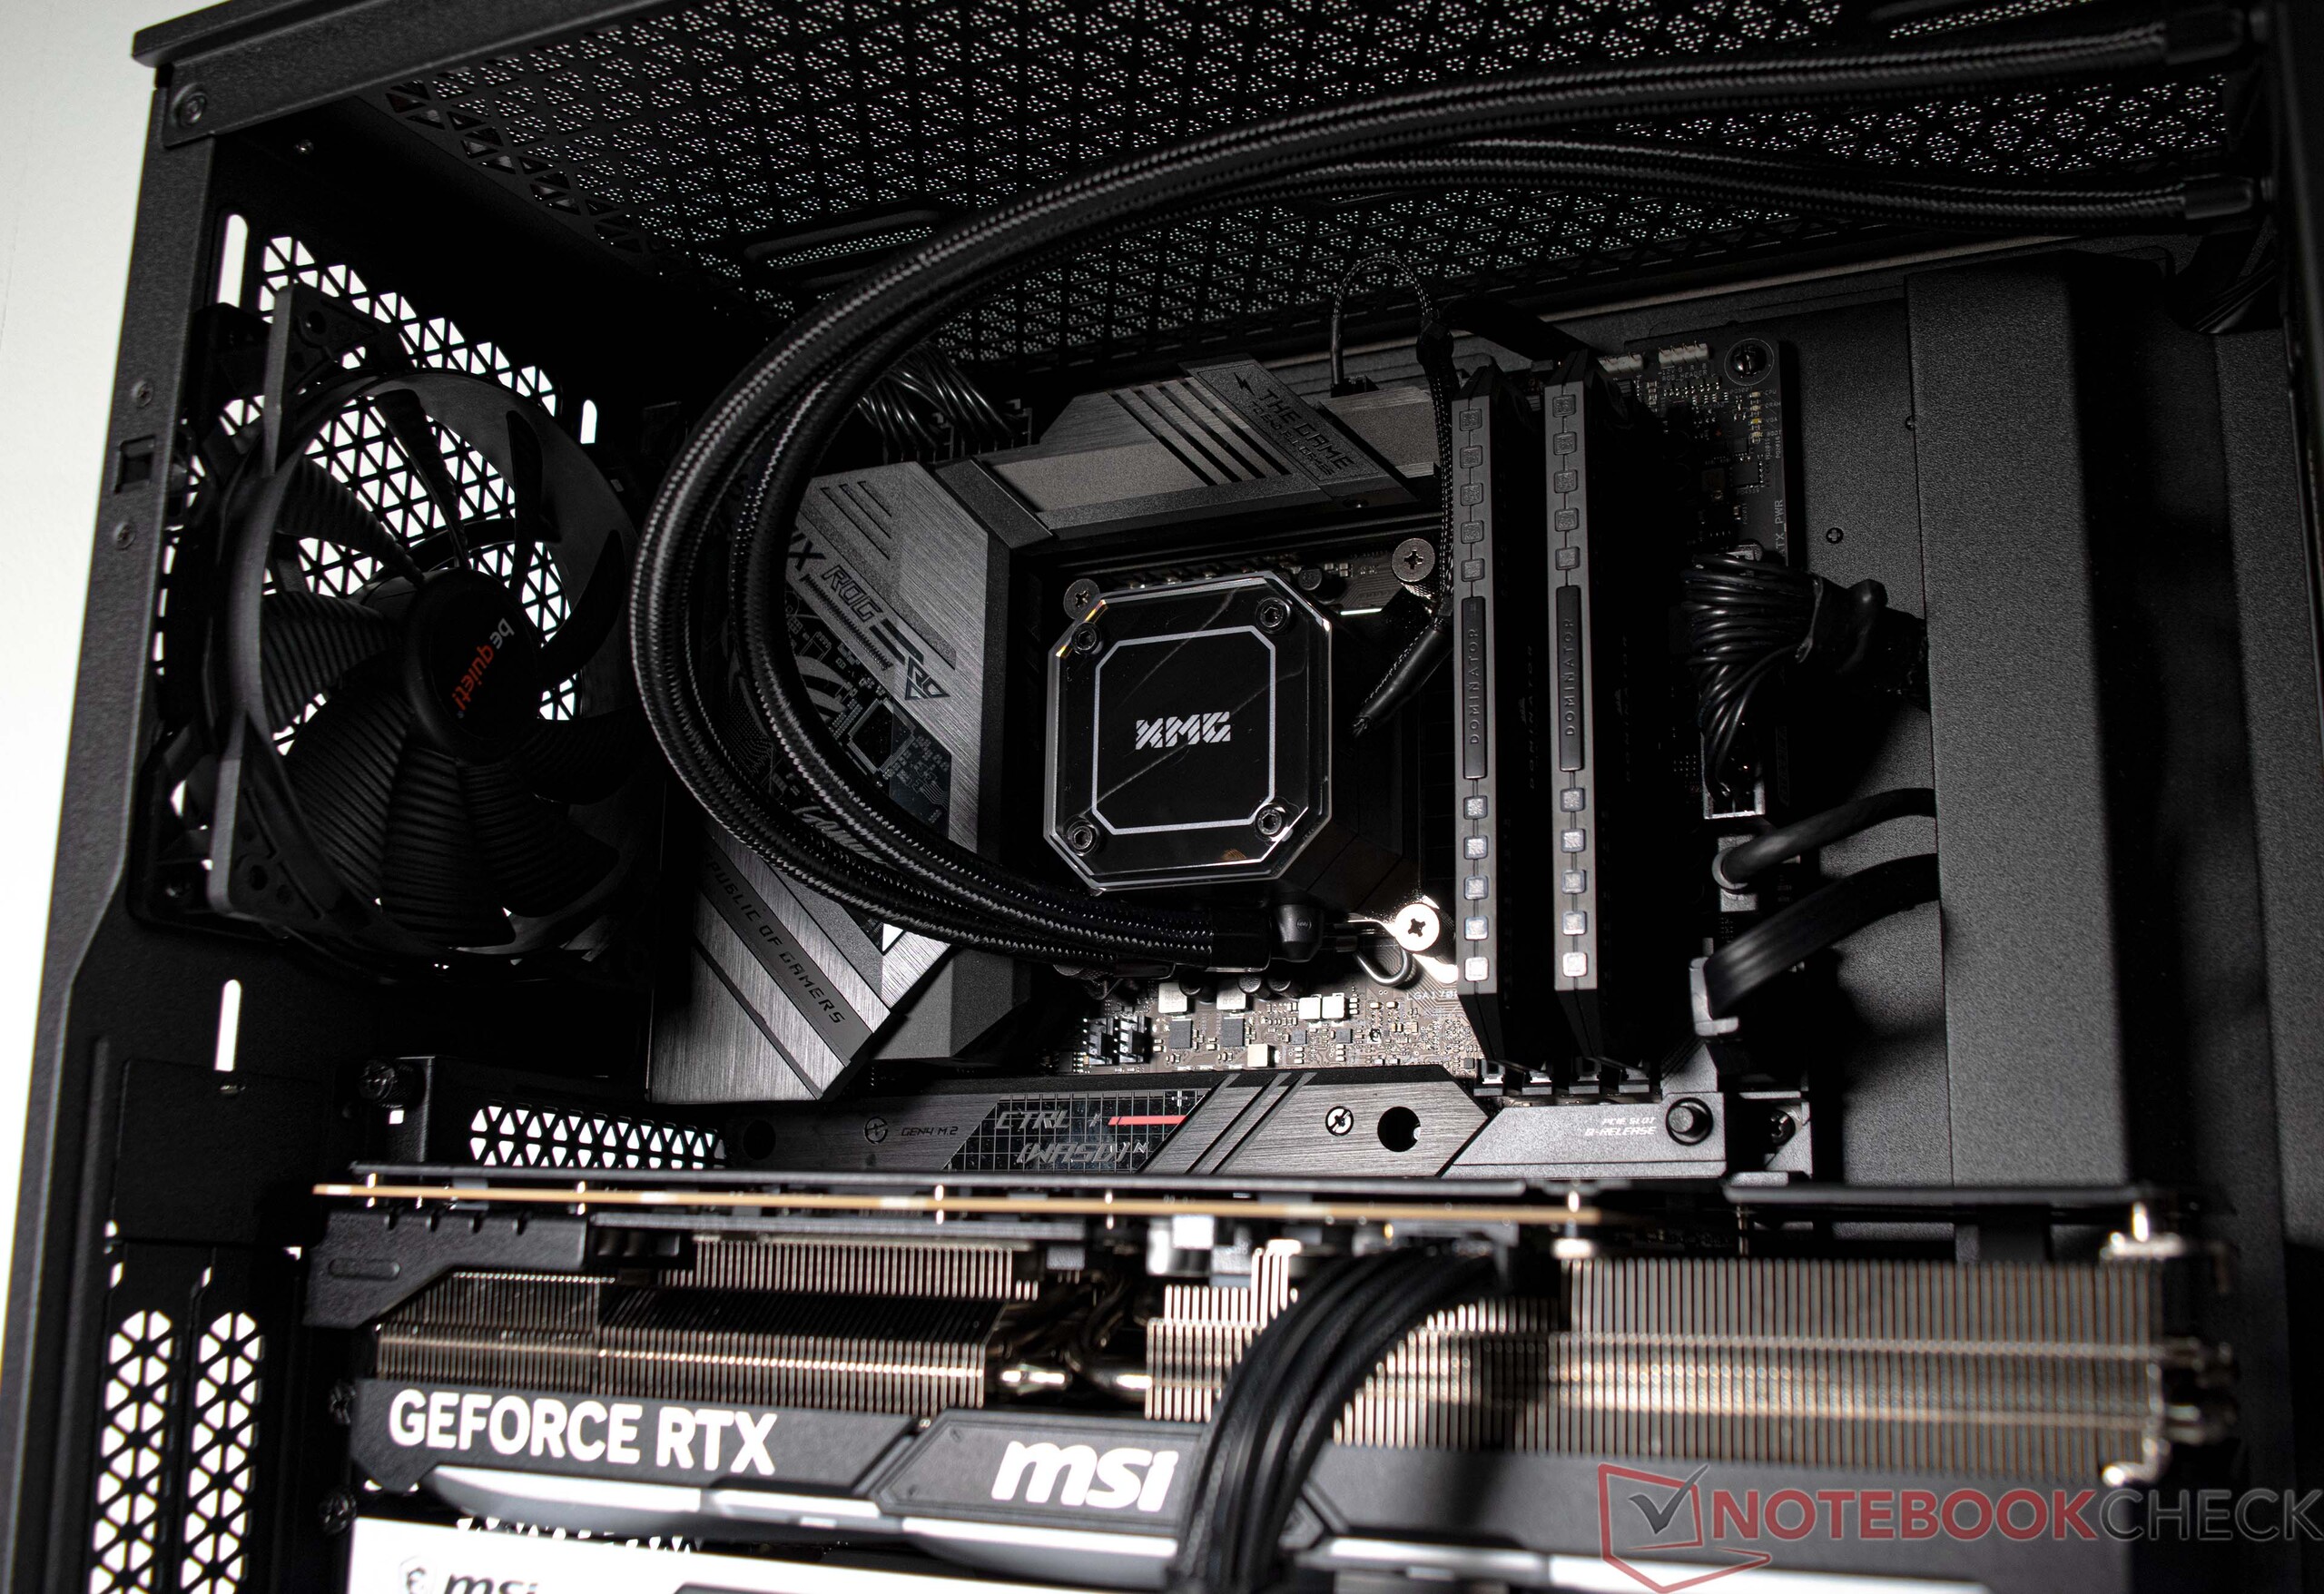
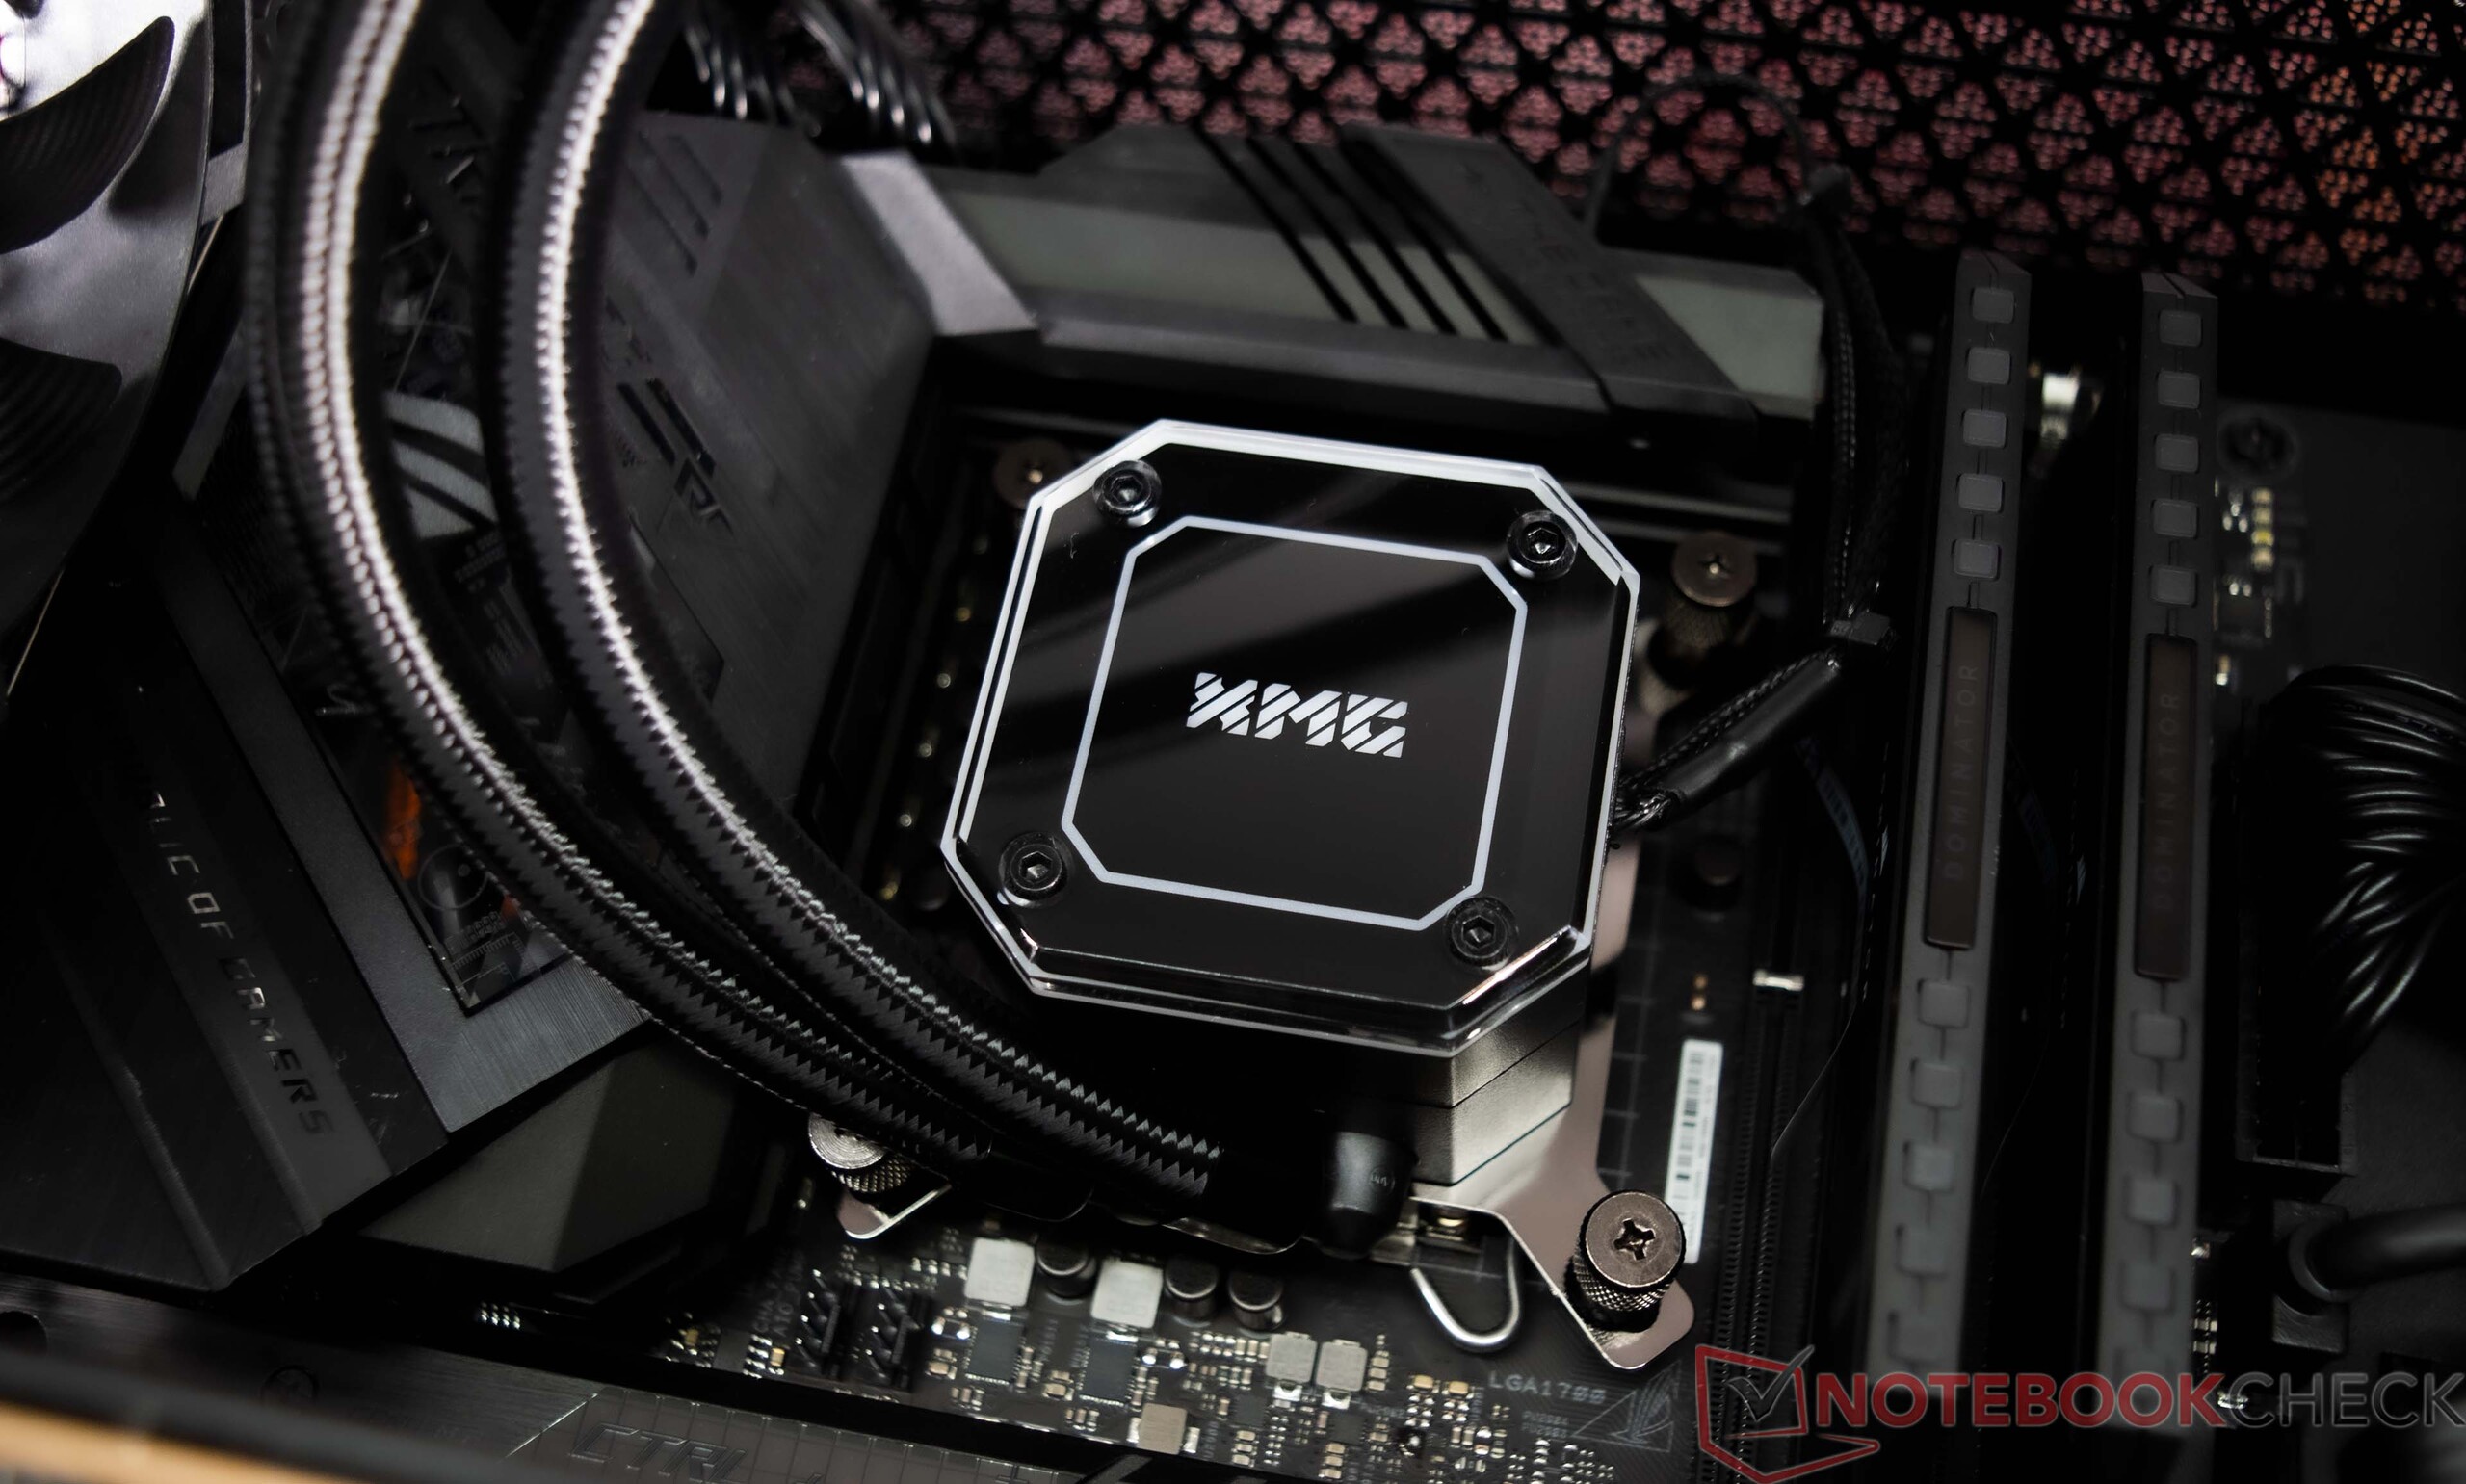
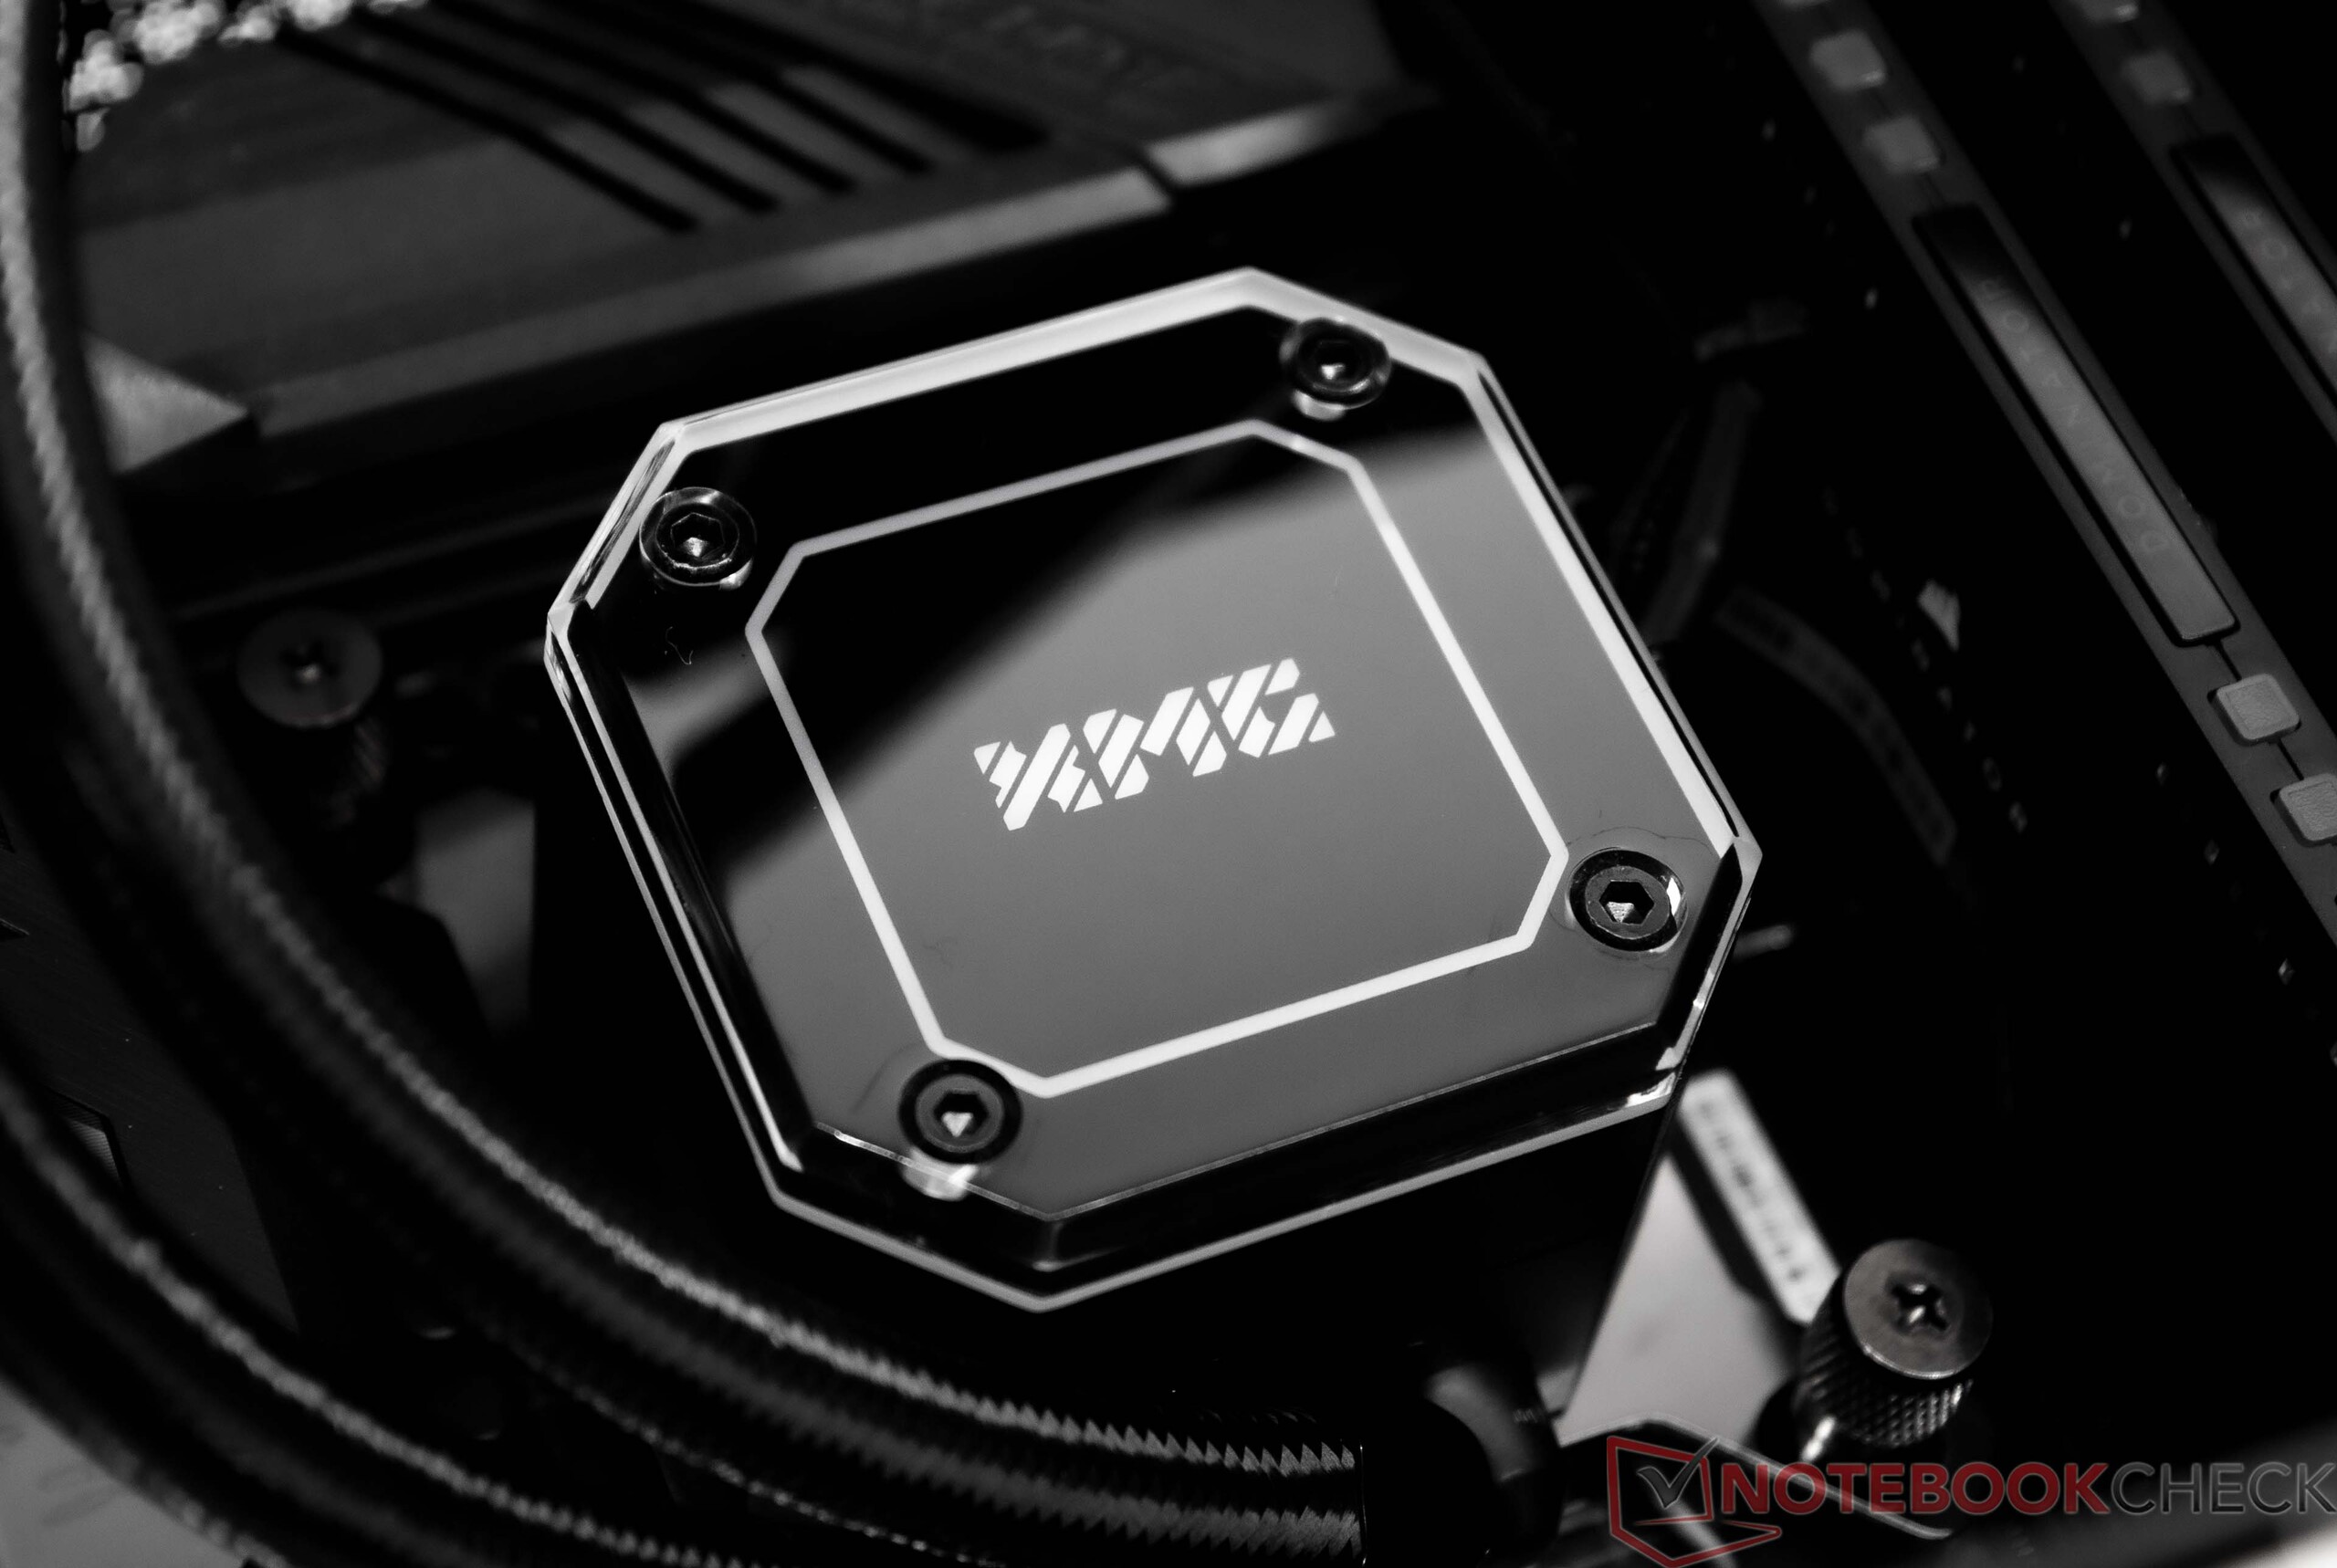
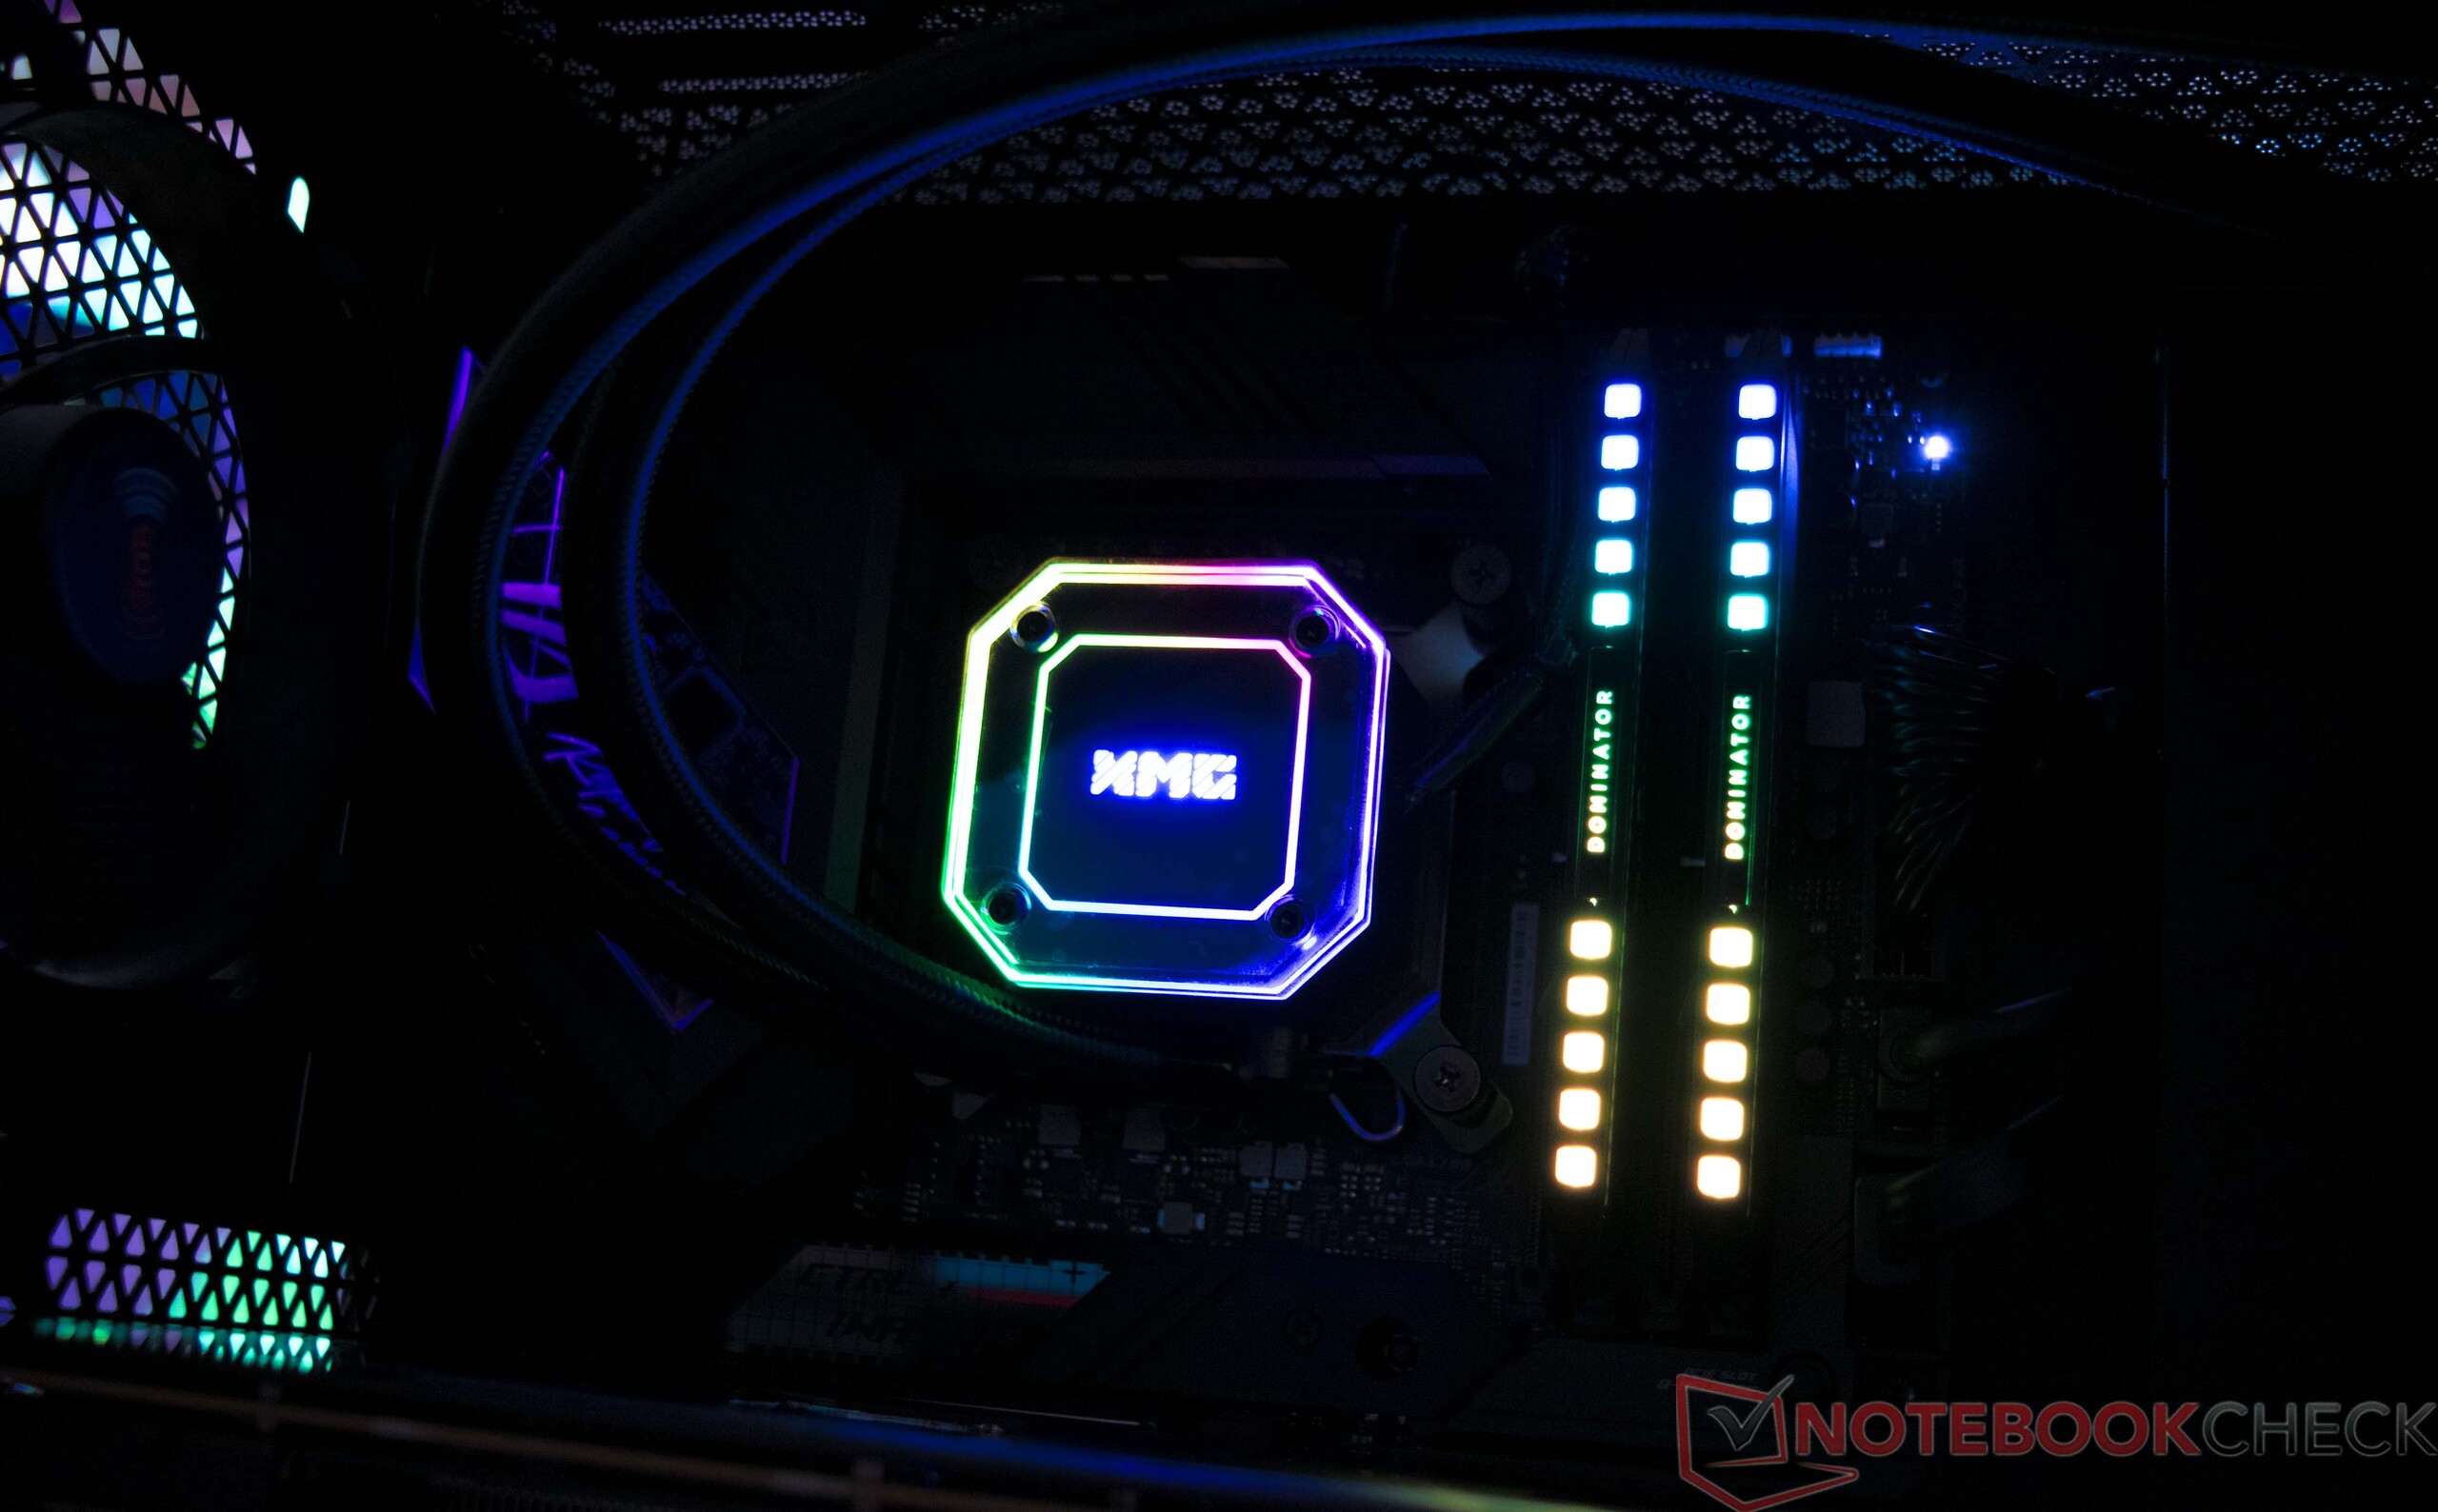
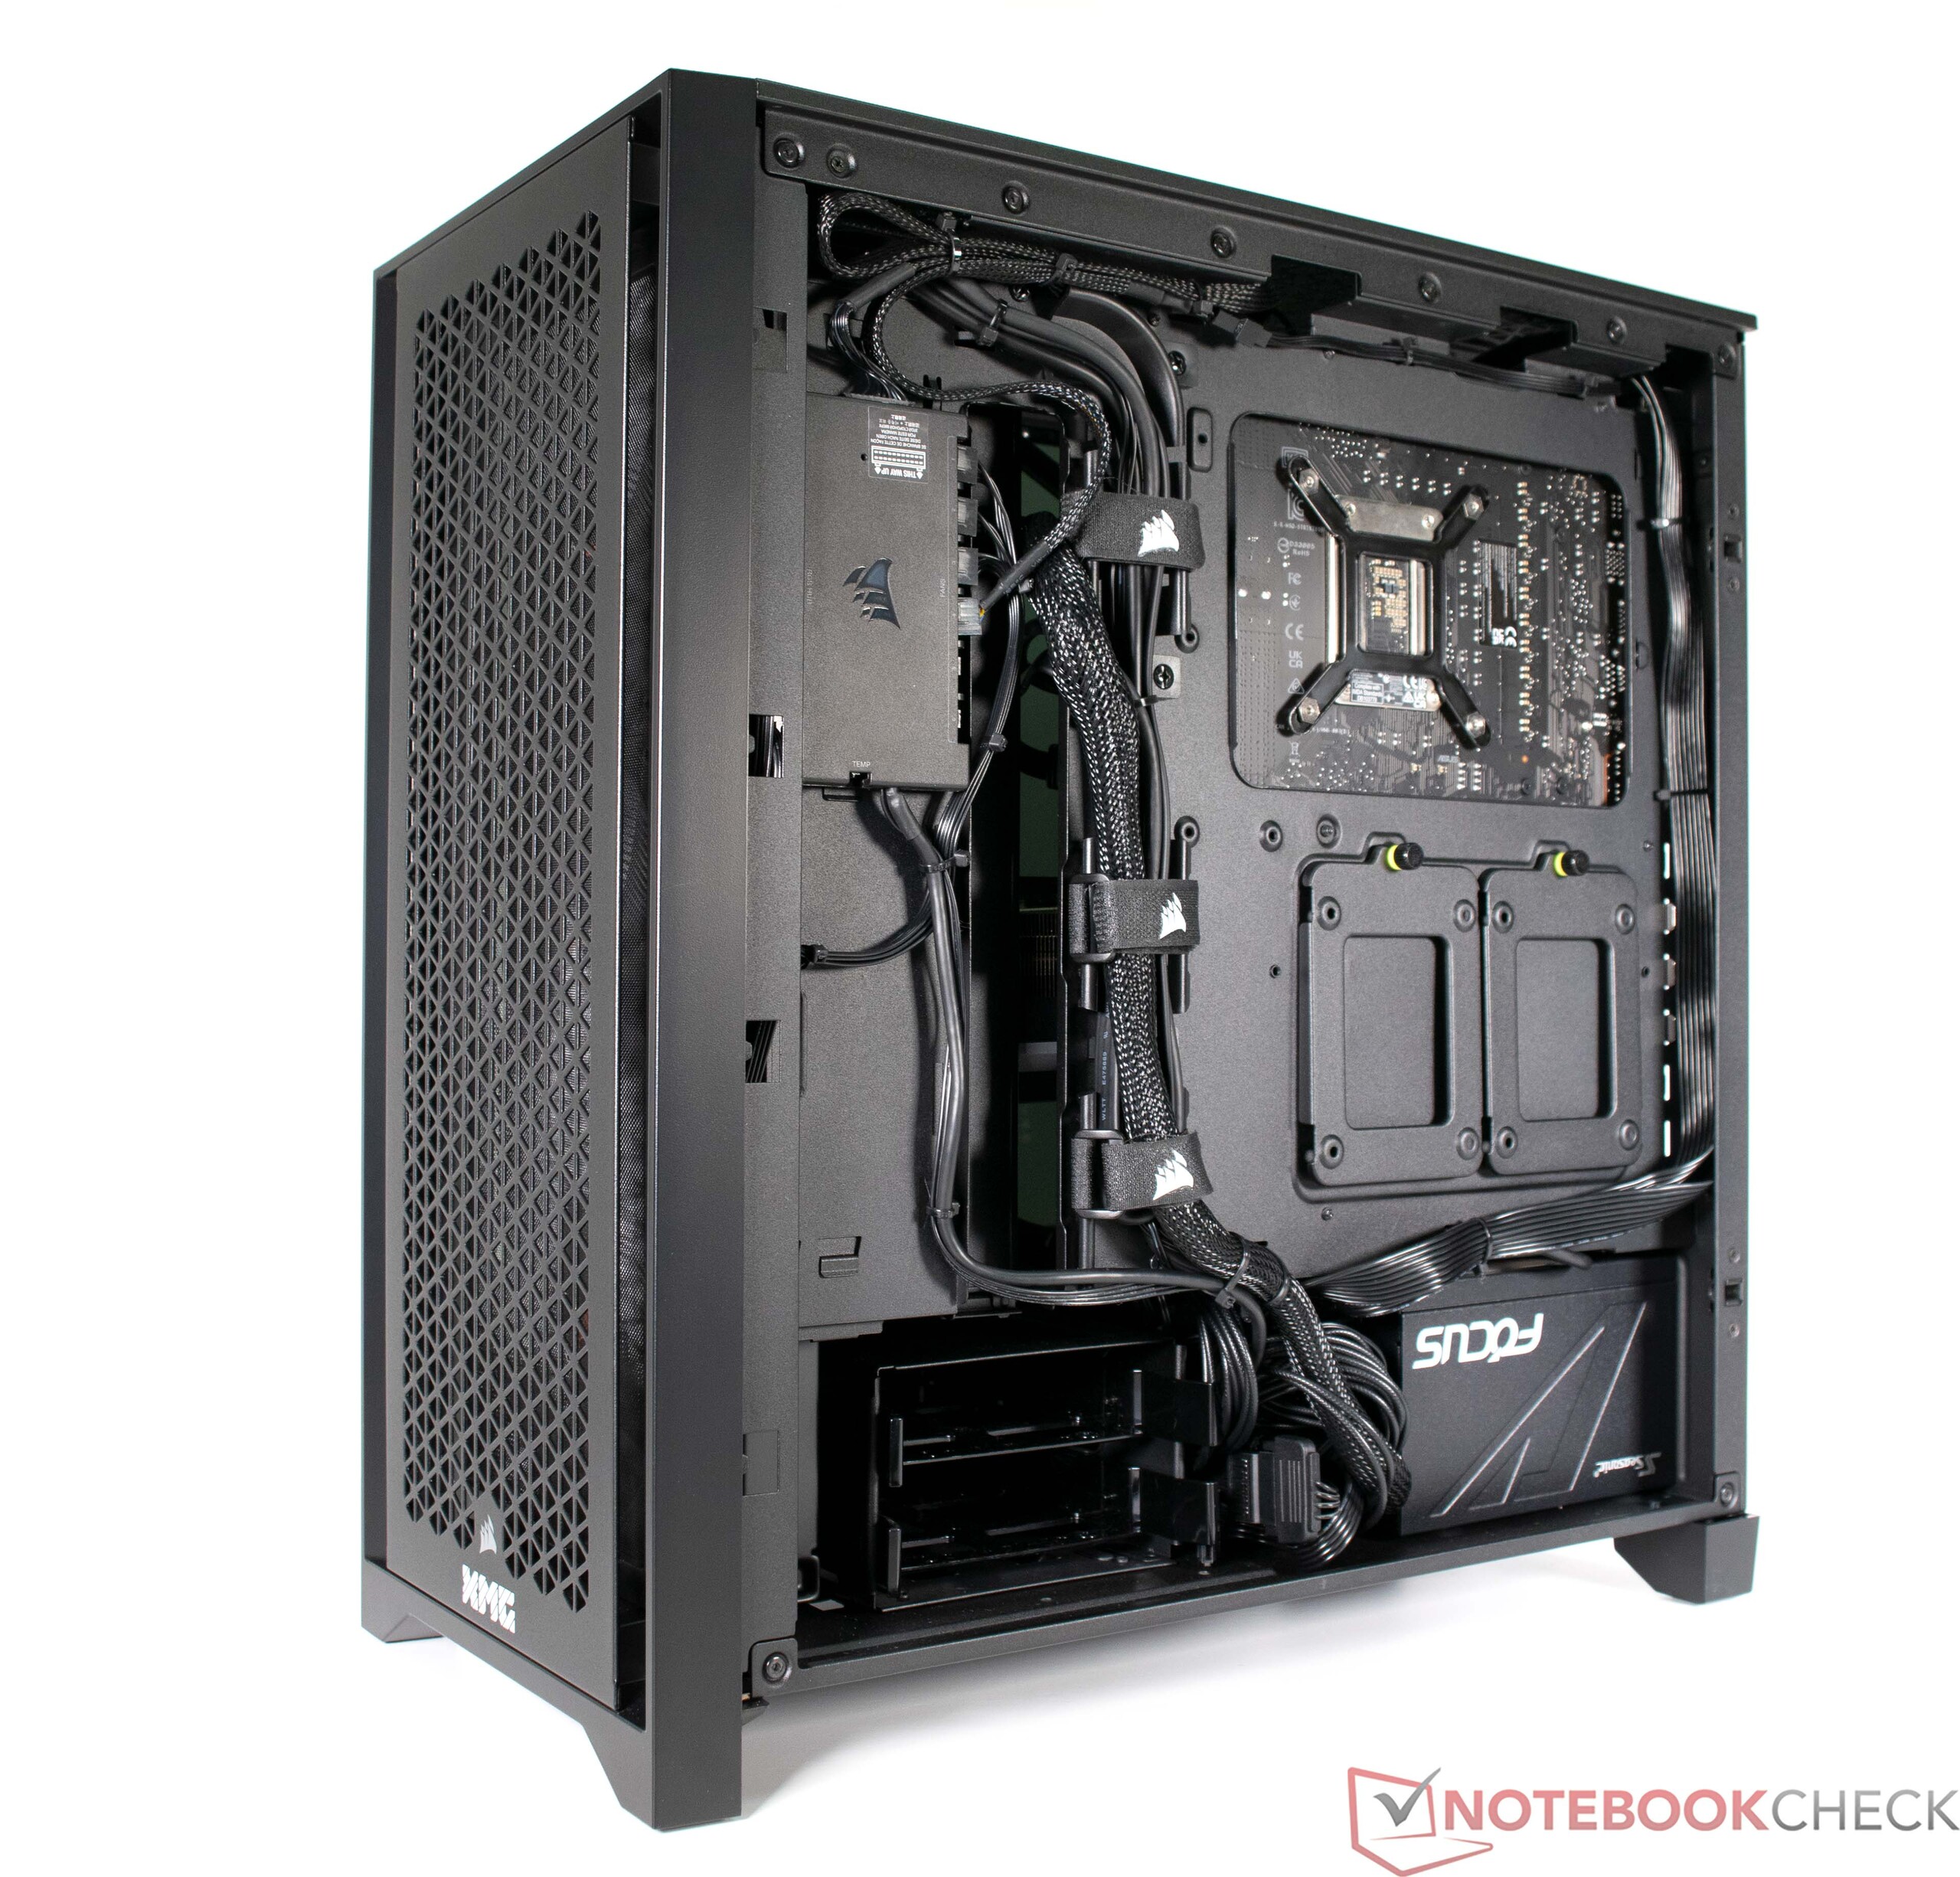
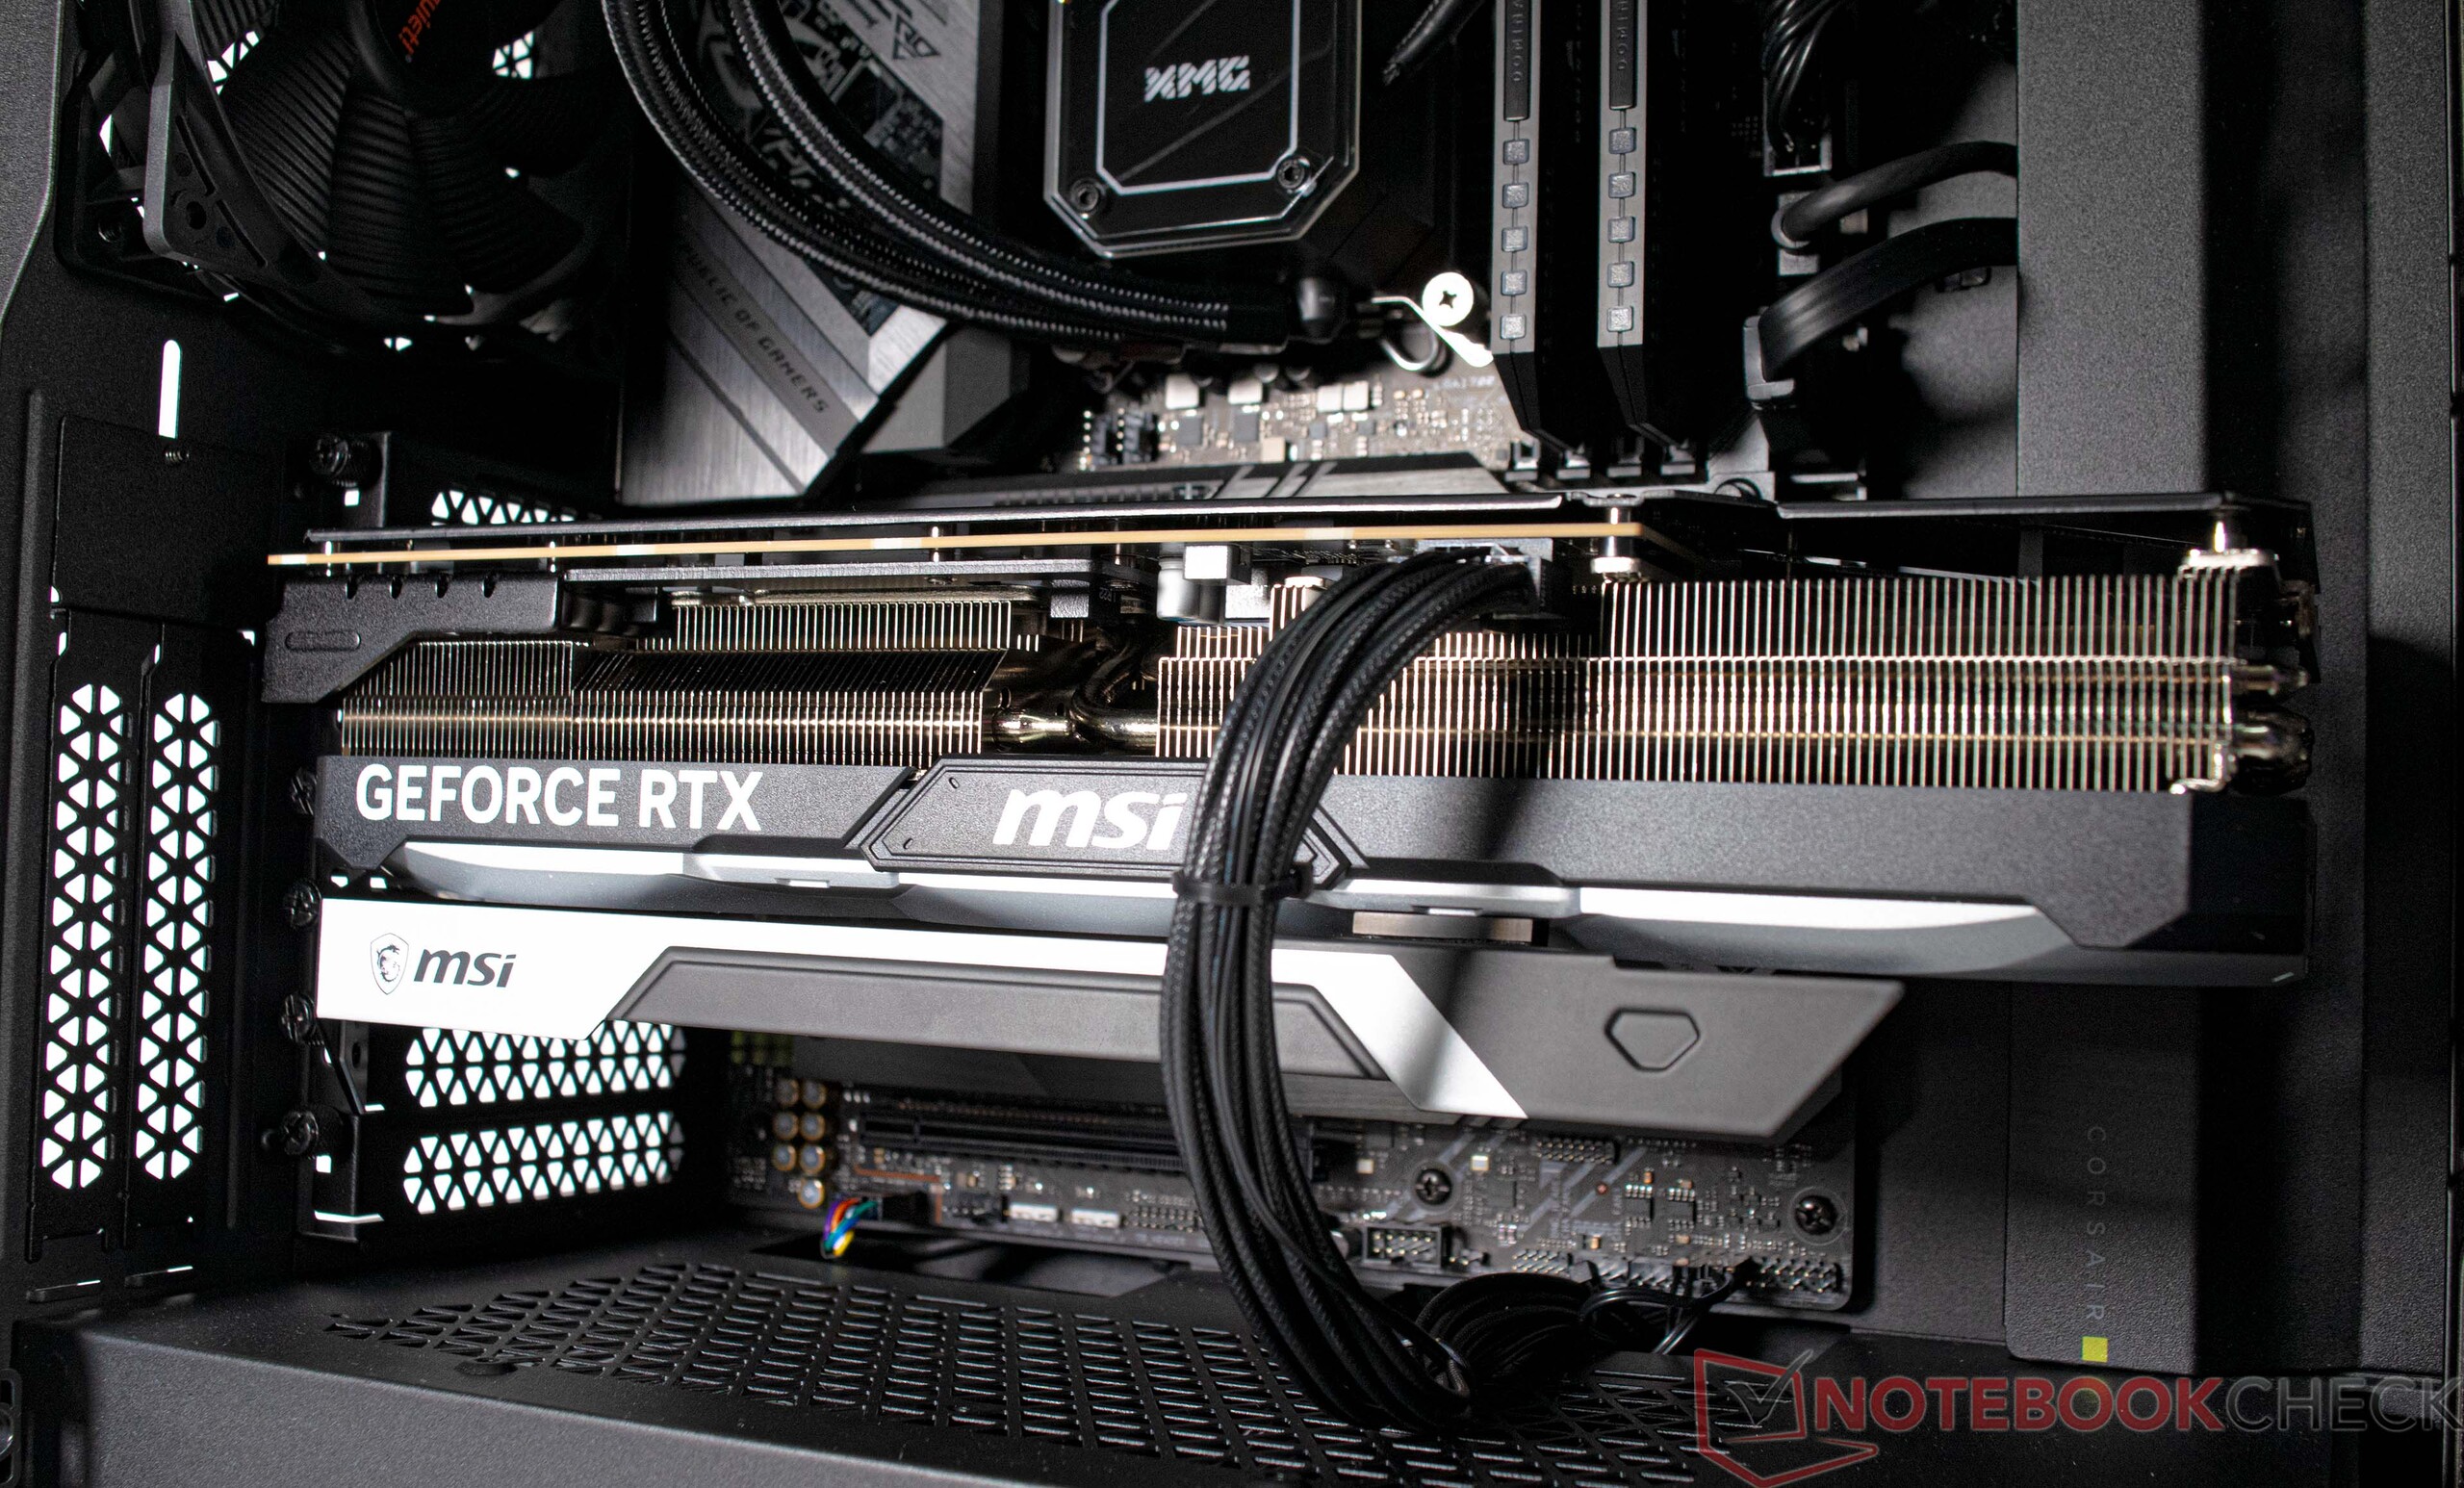
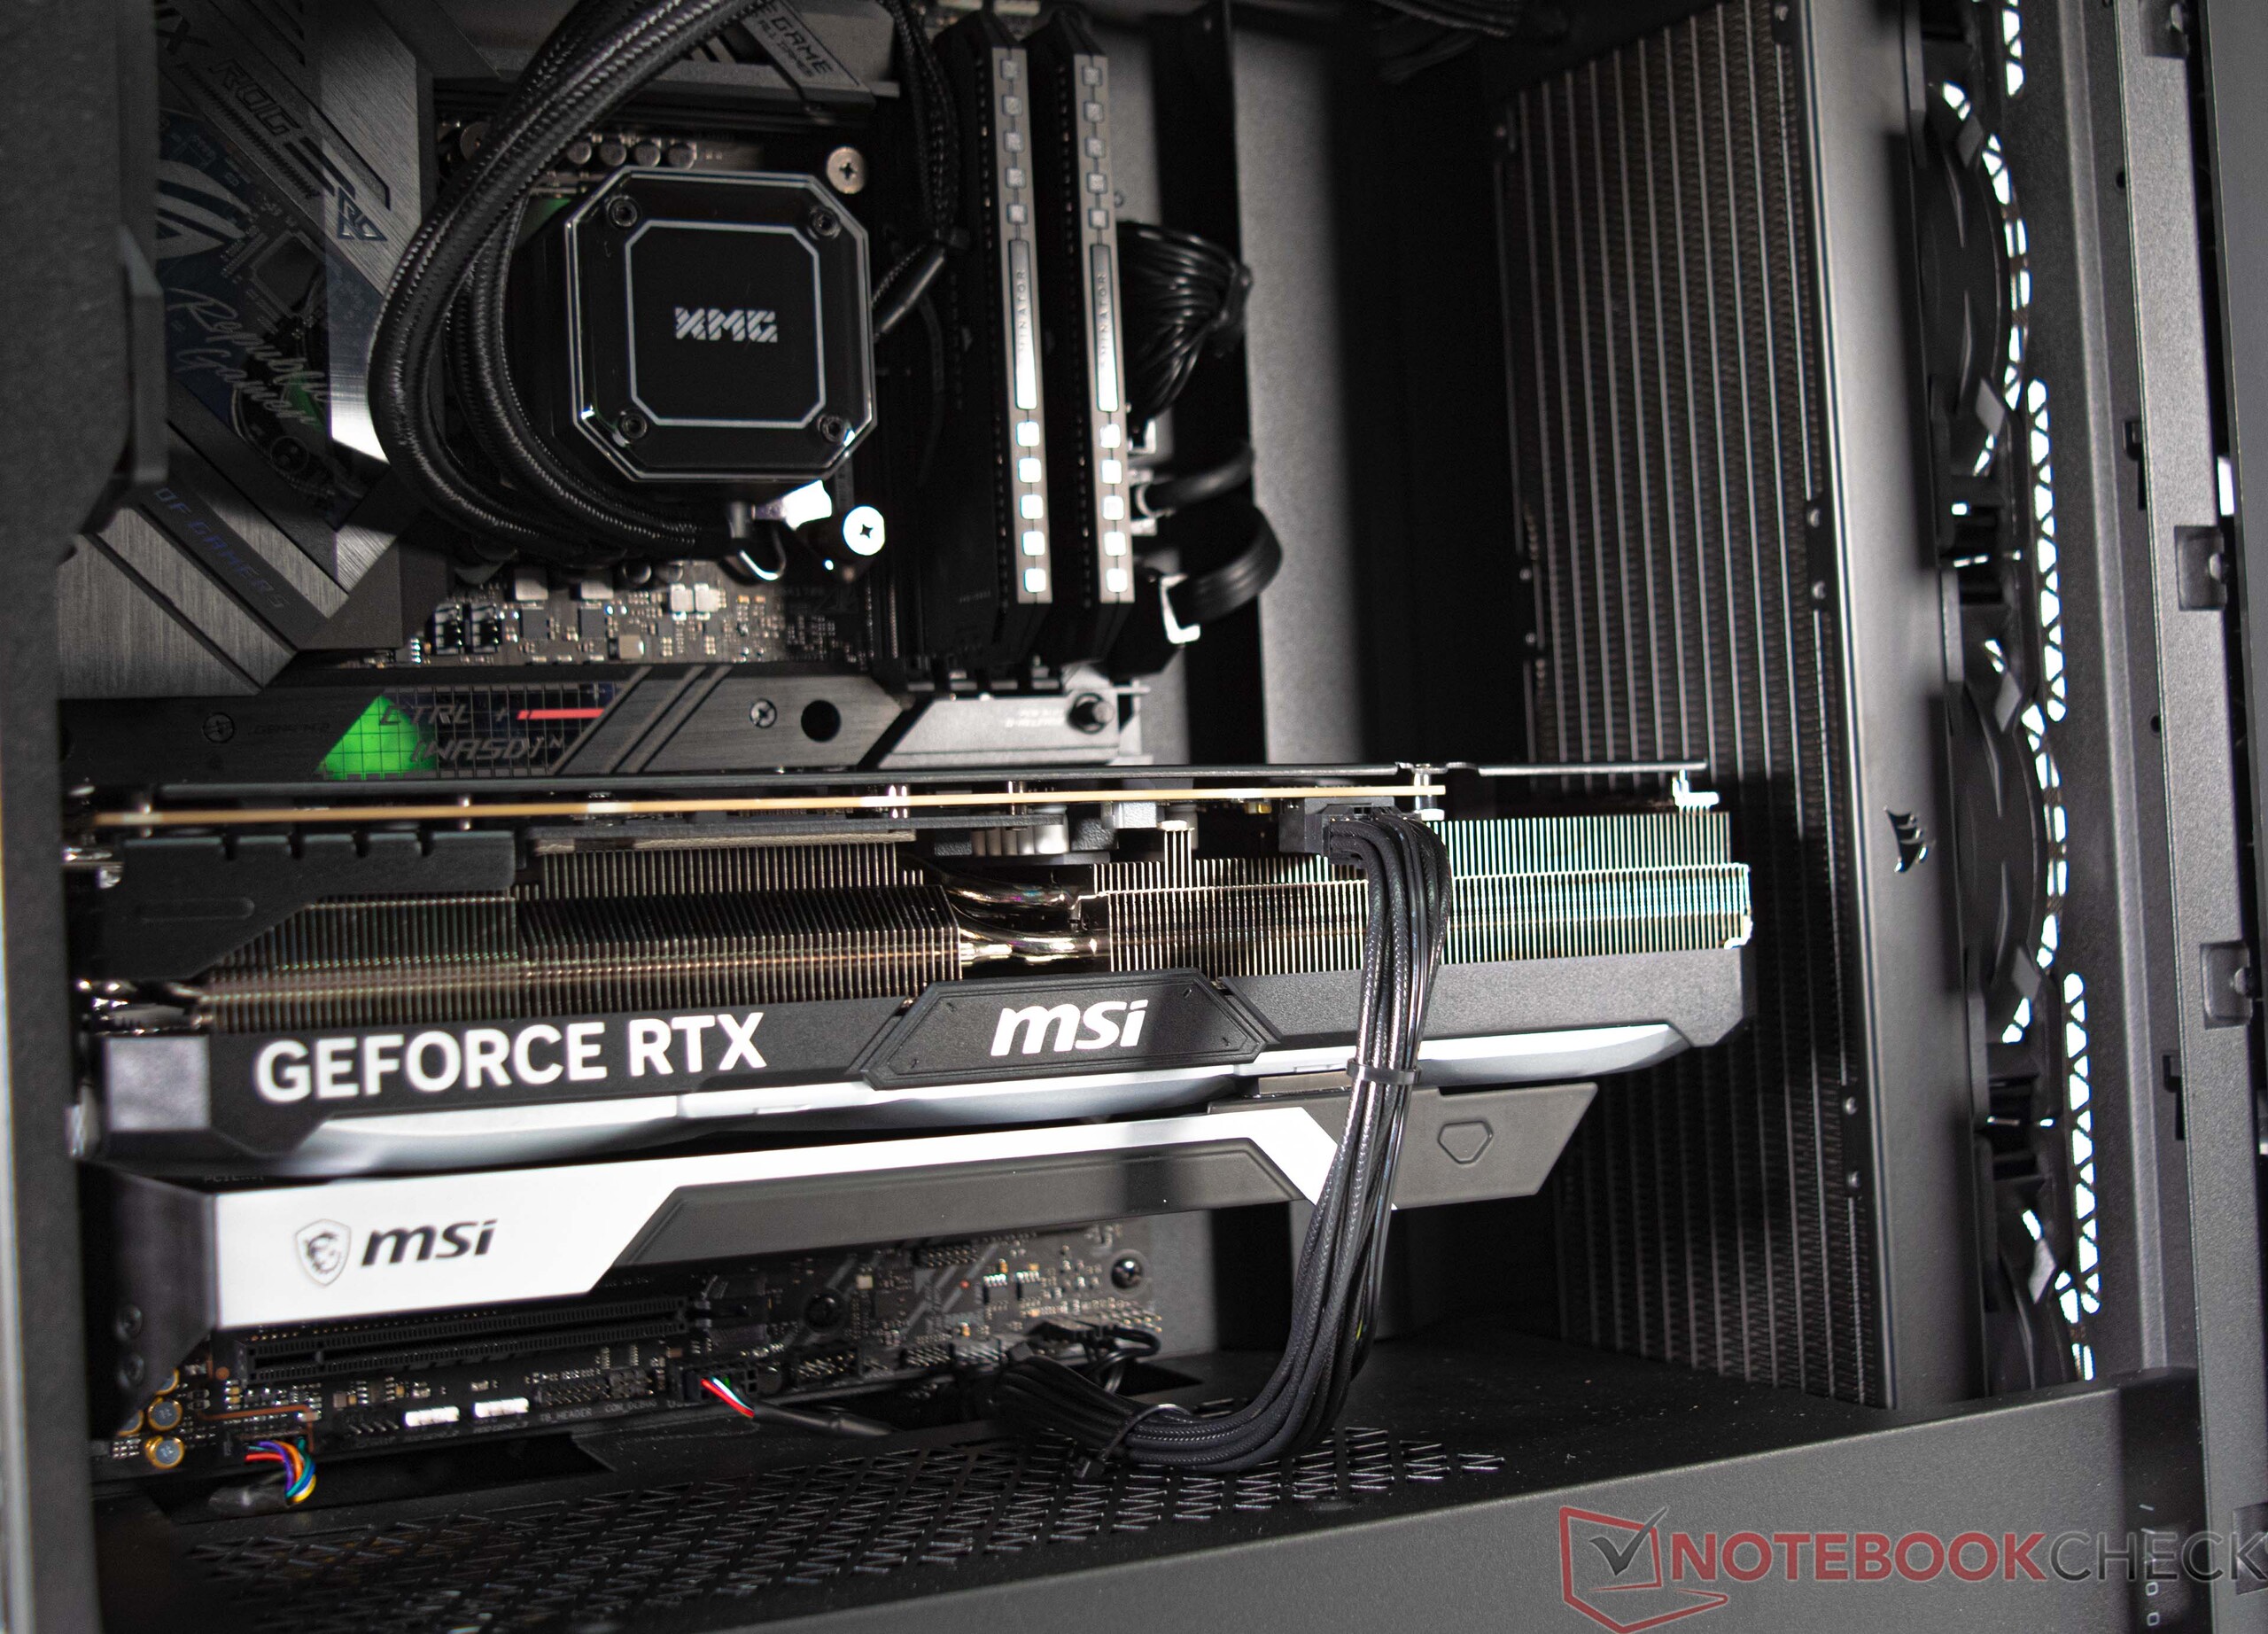
Schenker heeft de hardware van de XMG SECTOR Intel geïnstalleerd in een zwarte Corsair 4000D Airflow. De kast heeft een donker glazen venster om de componenten binnenin met lichteffecten te laten zien. De meegeleverde AIO-koeler en de Corsair Dominator RGB-geheugenmodules zijn echter de enige bronnen van verlichting in onze reviewconfiguratie.
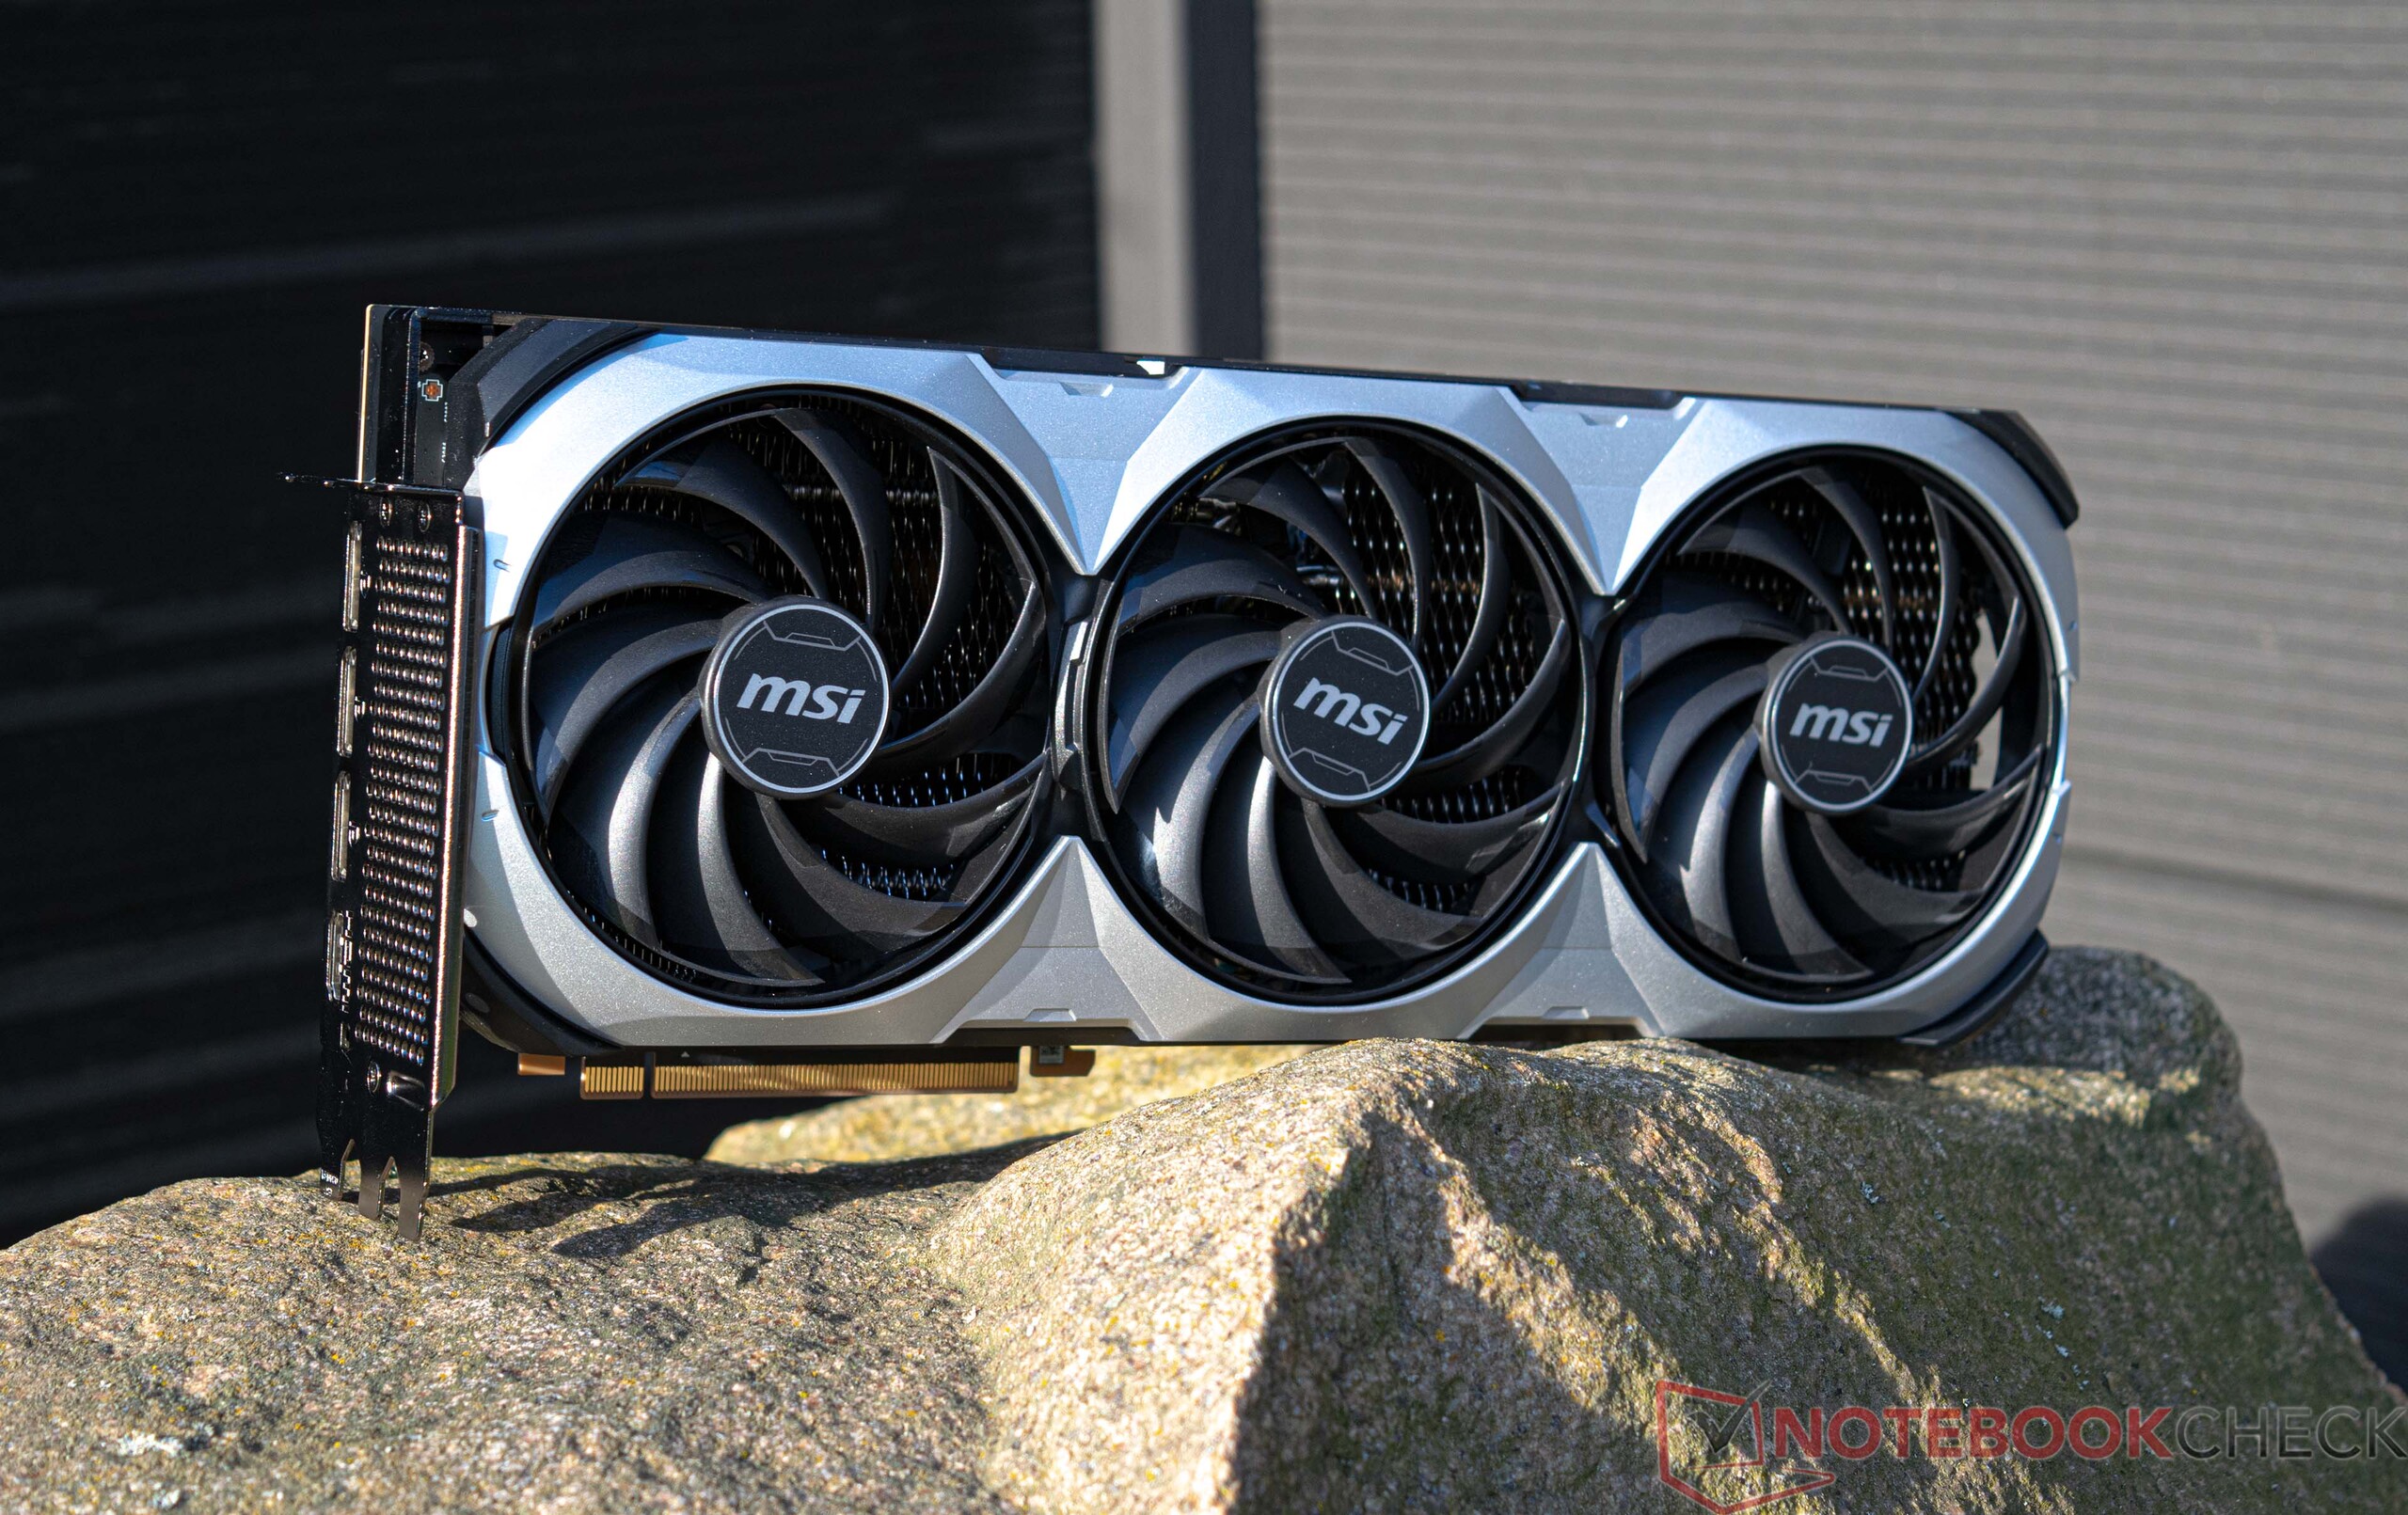
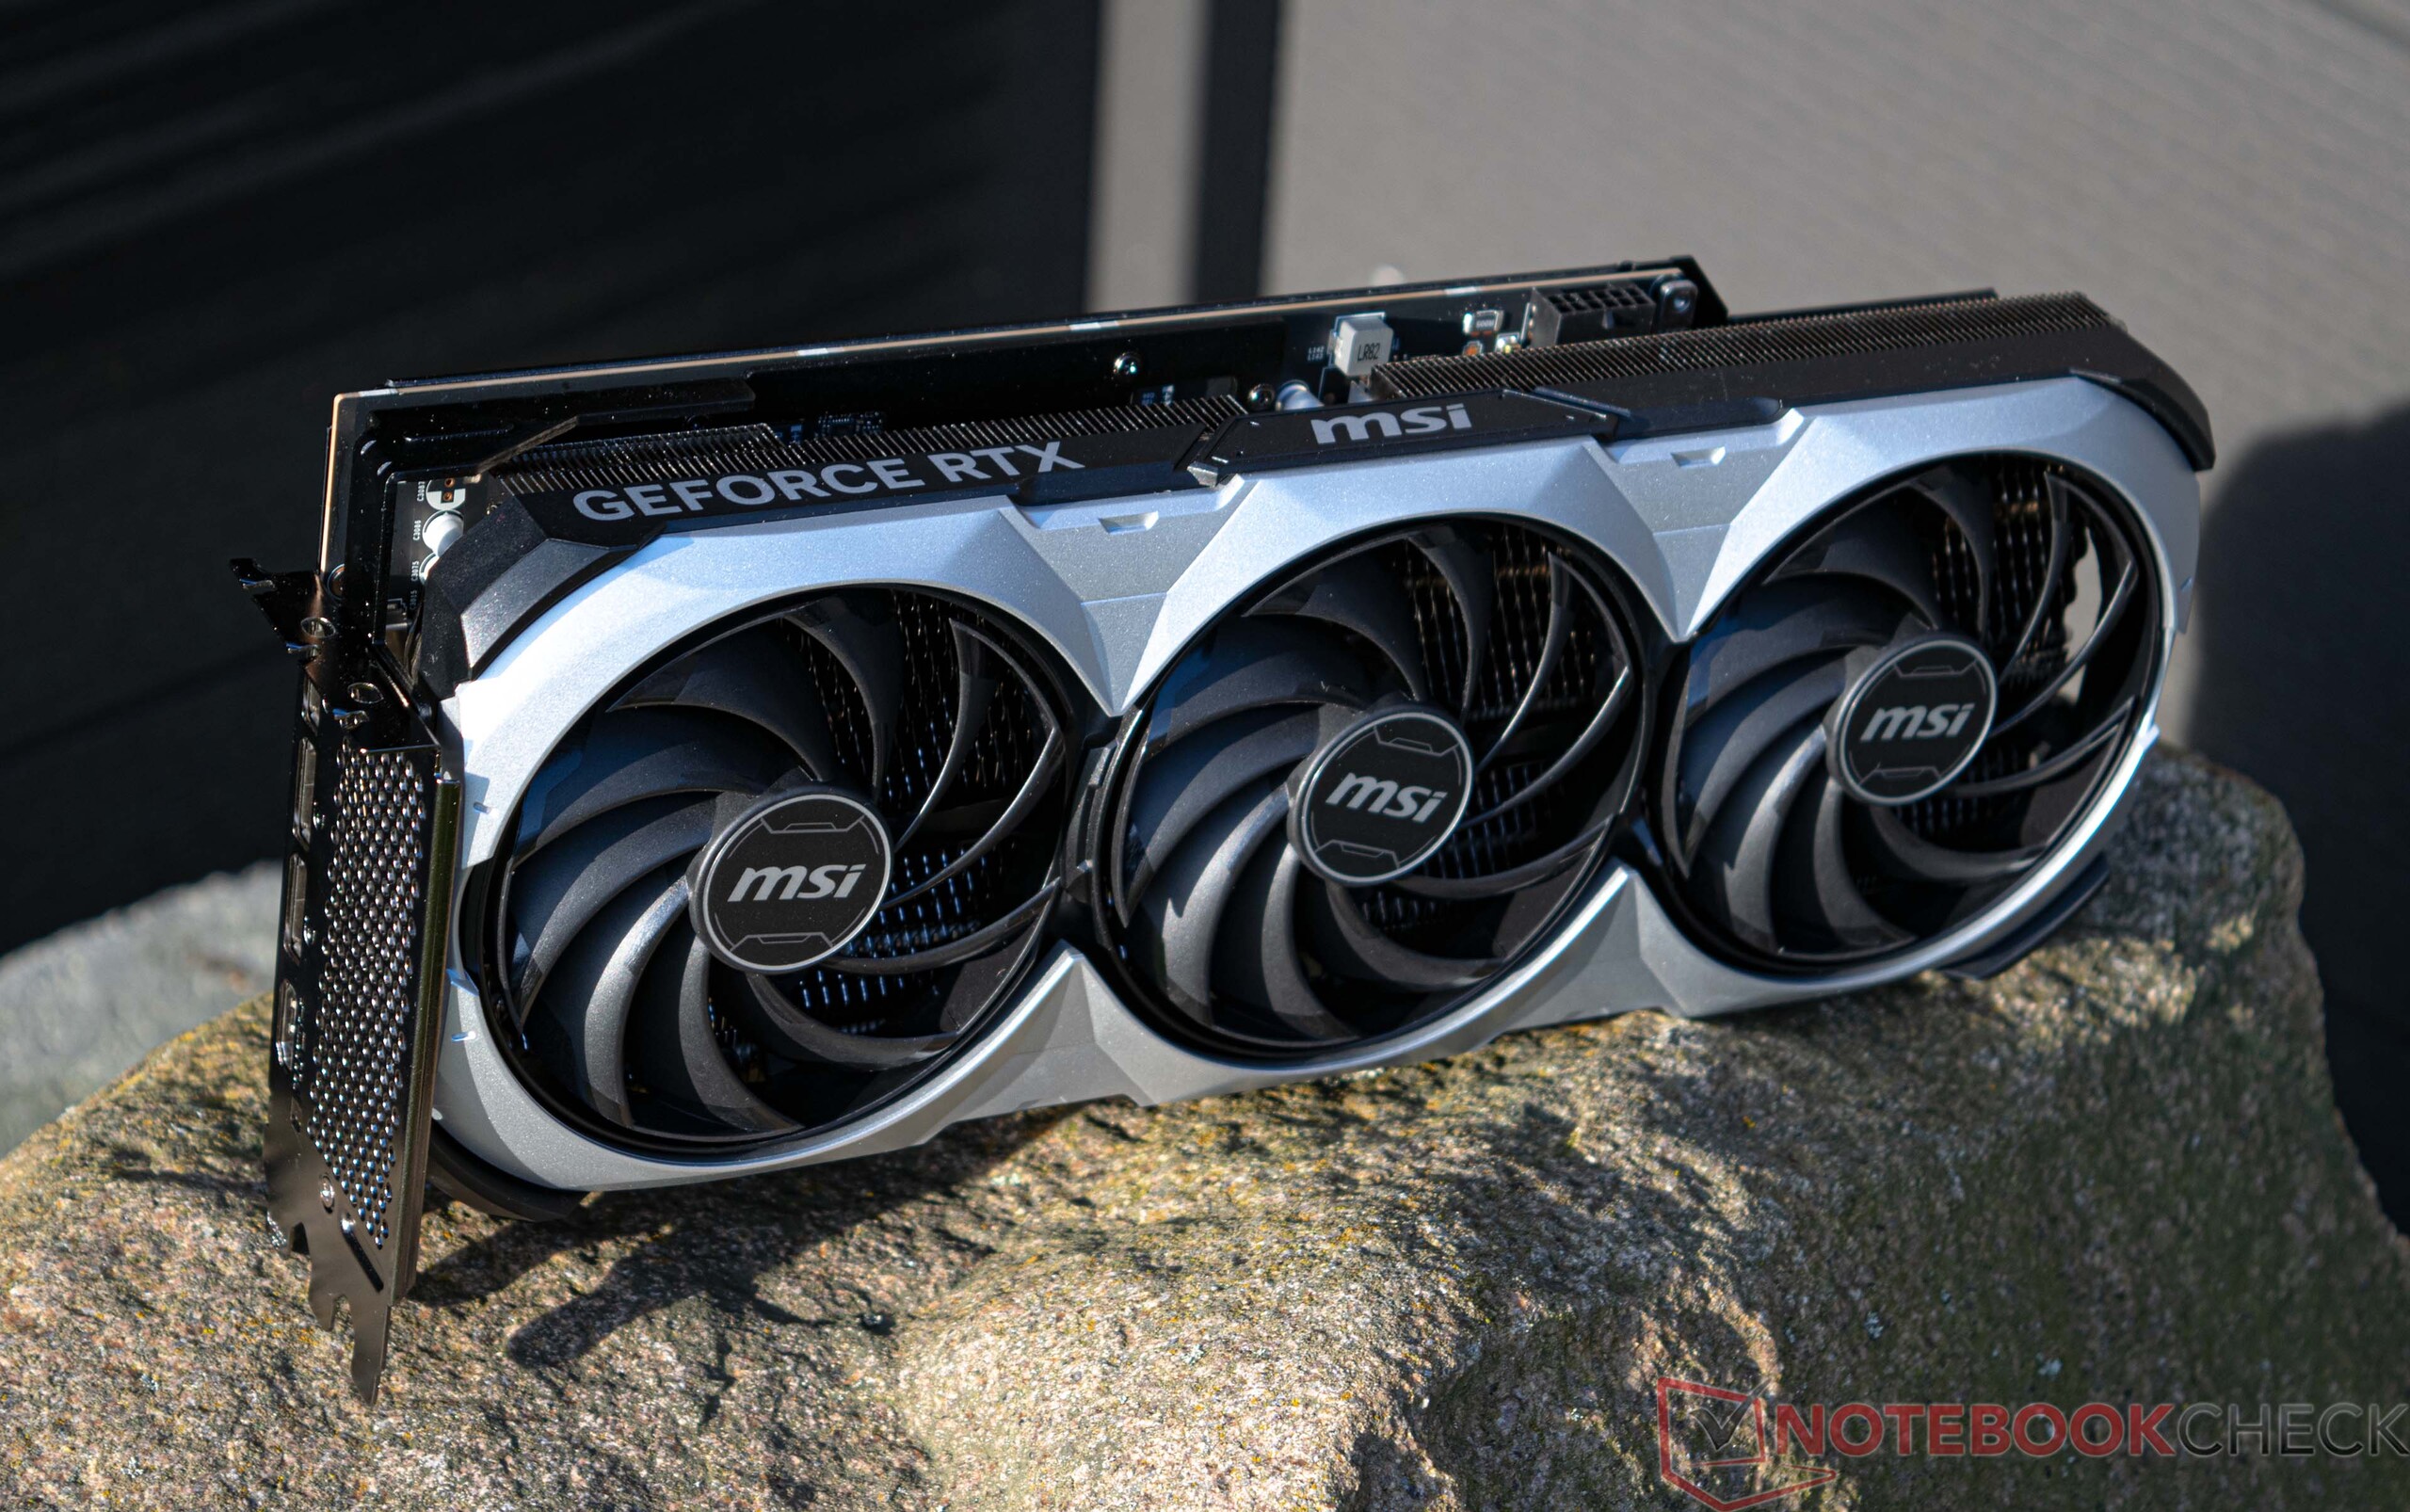
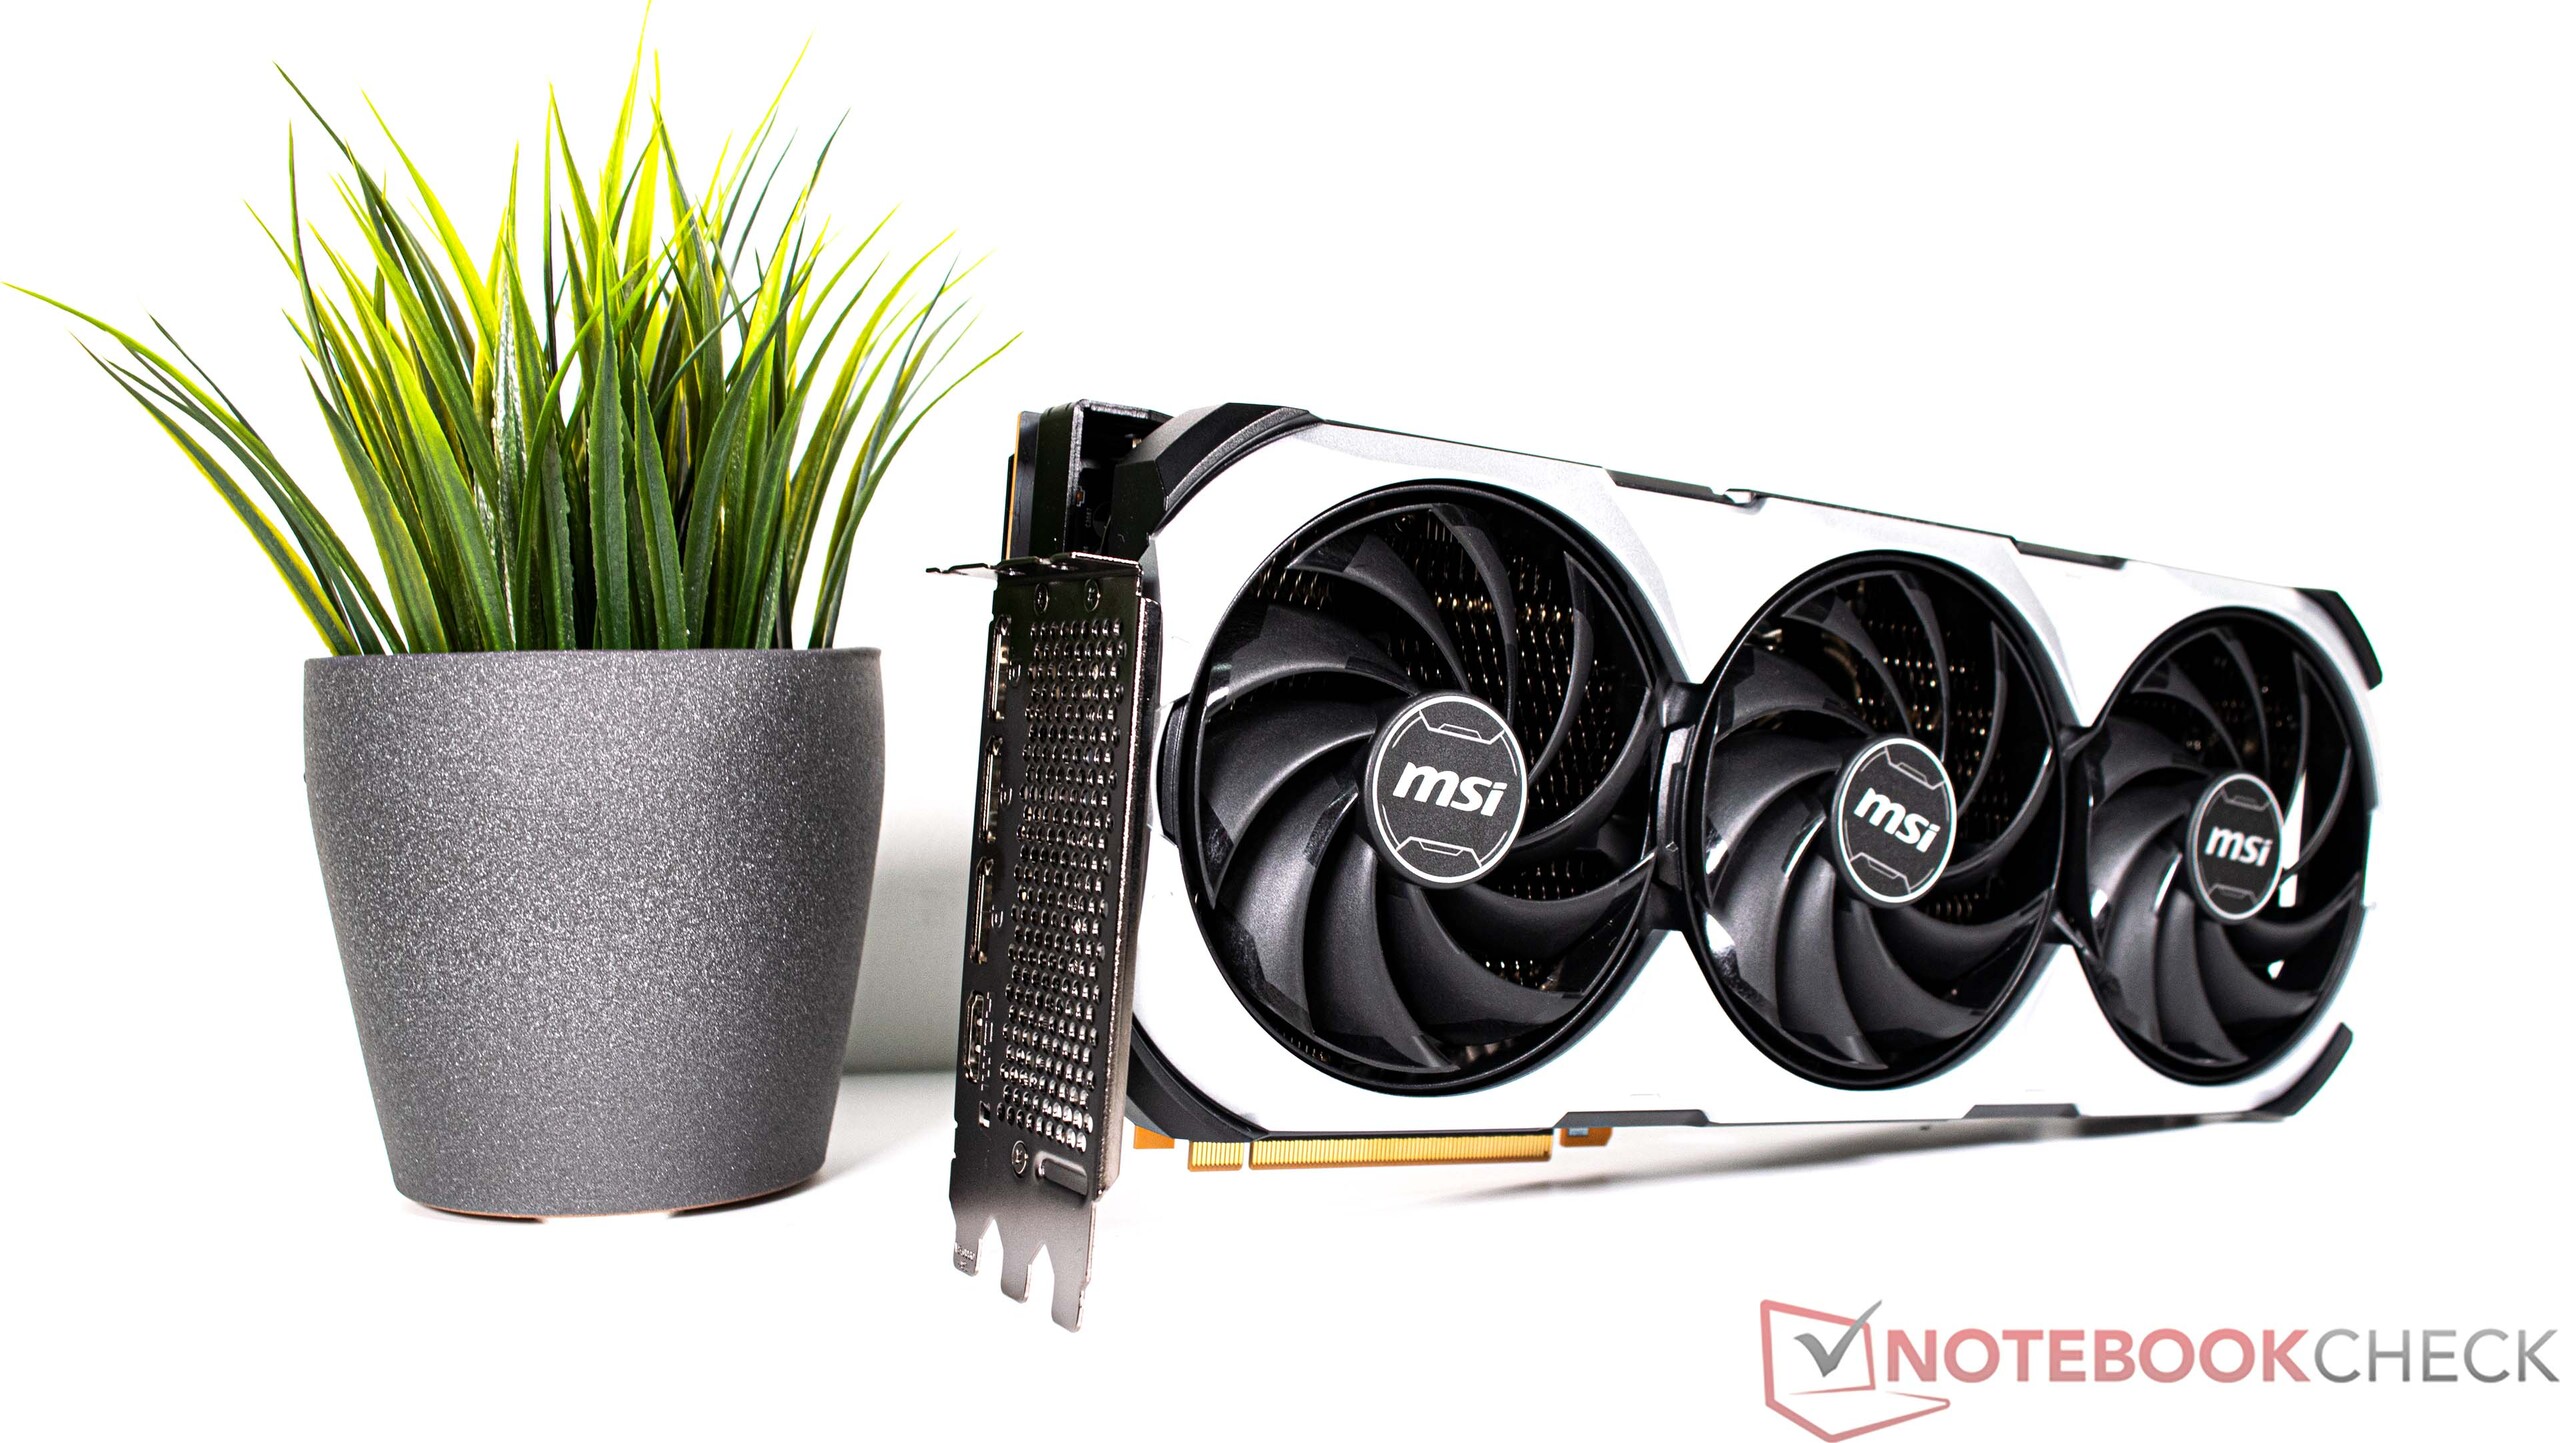
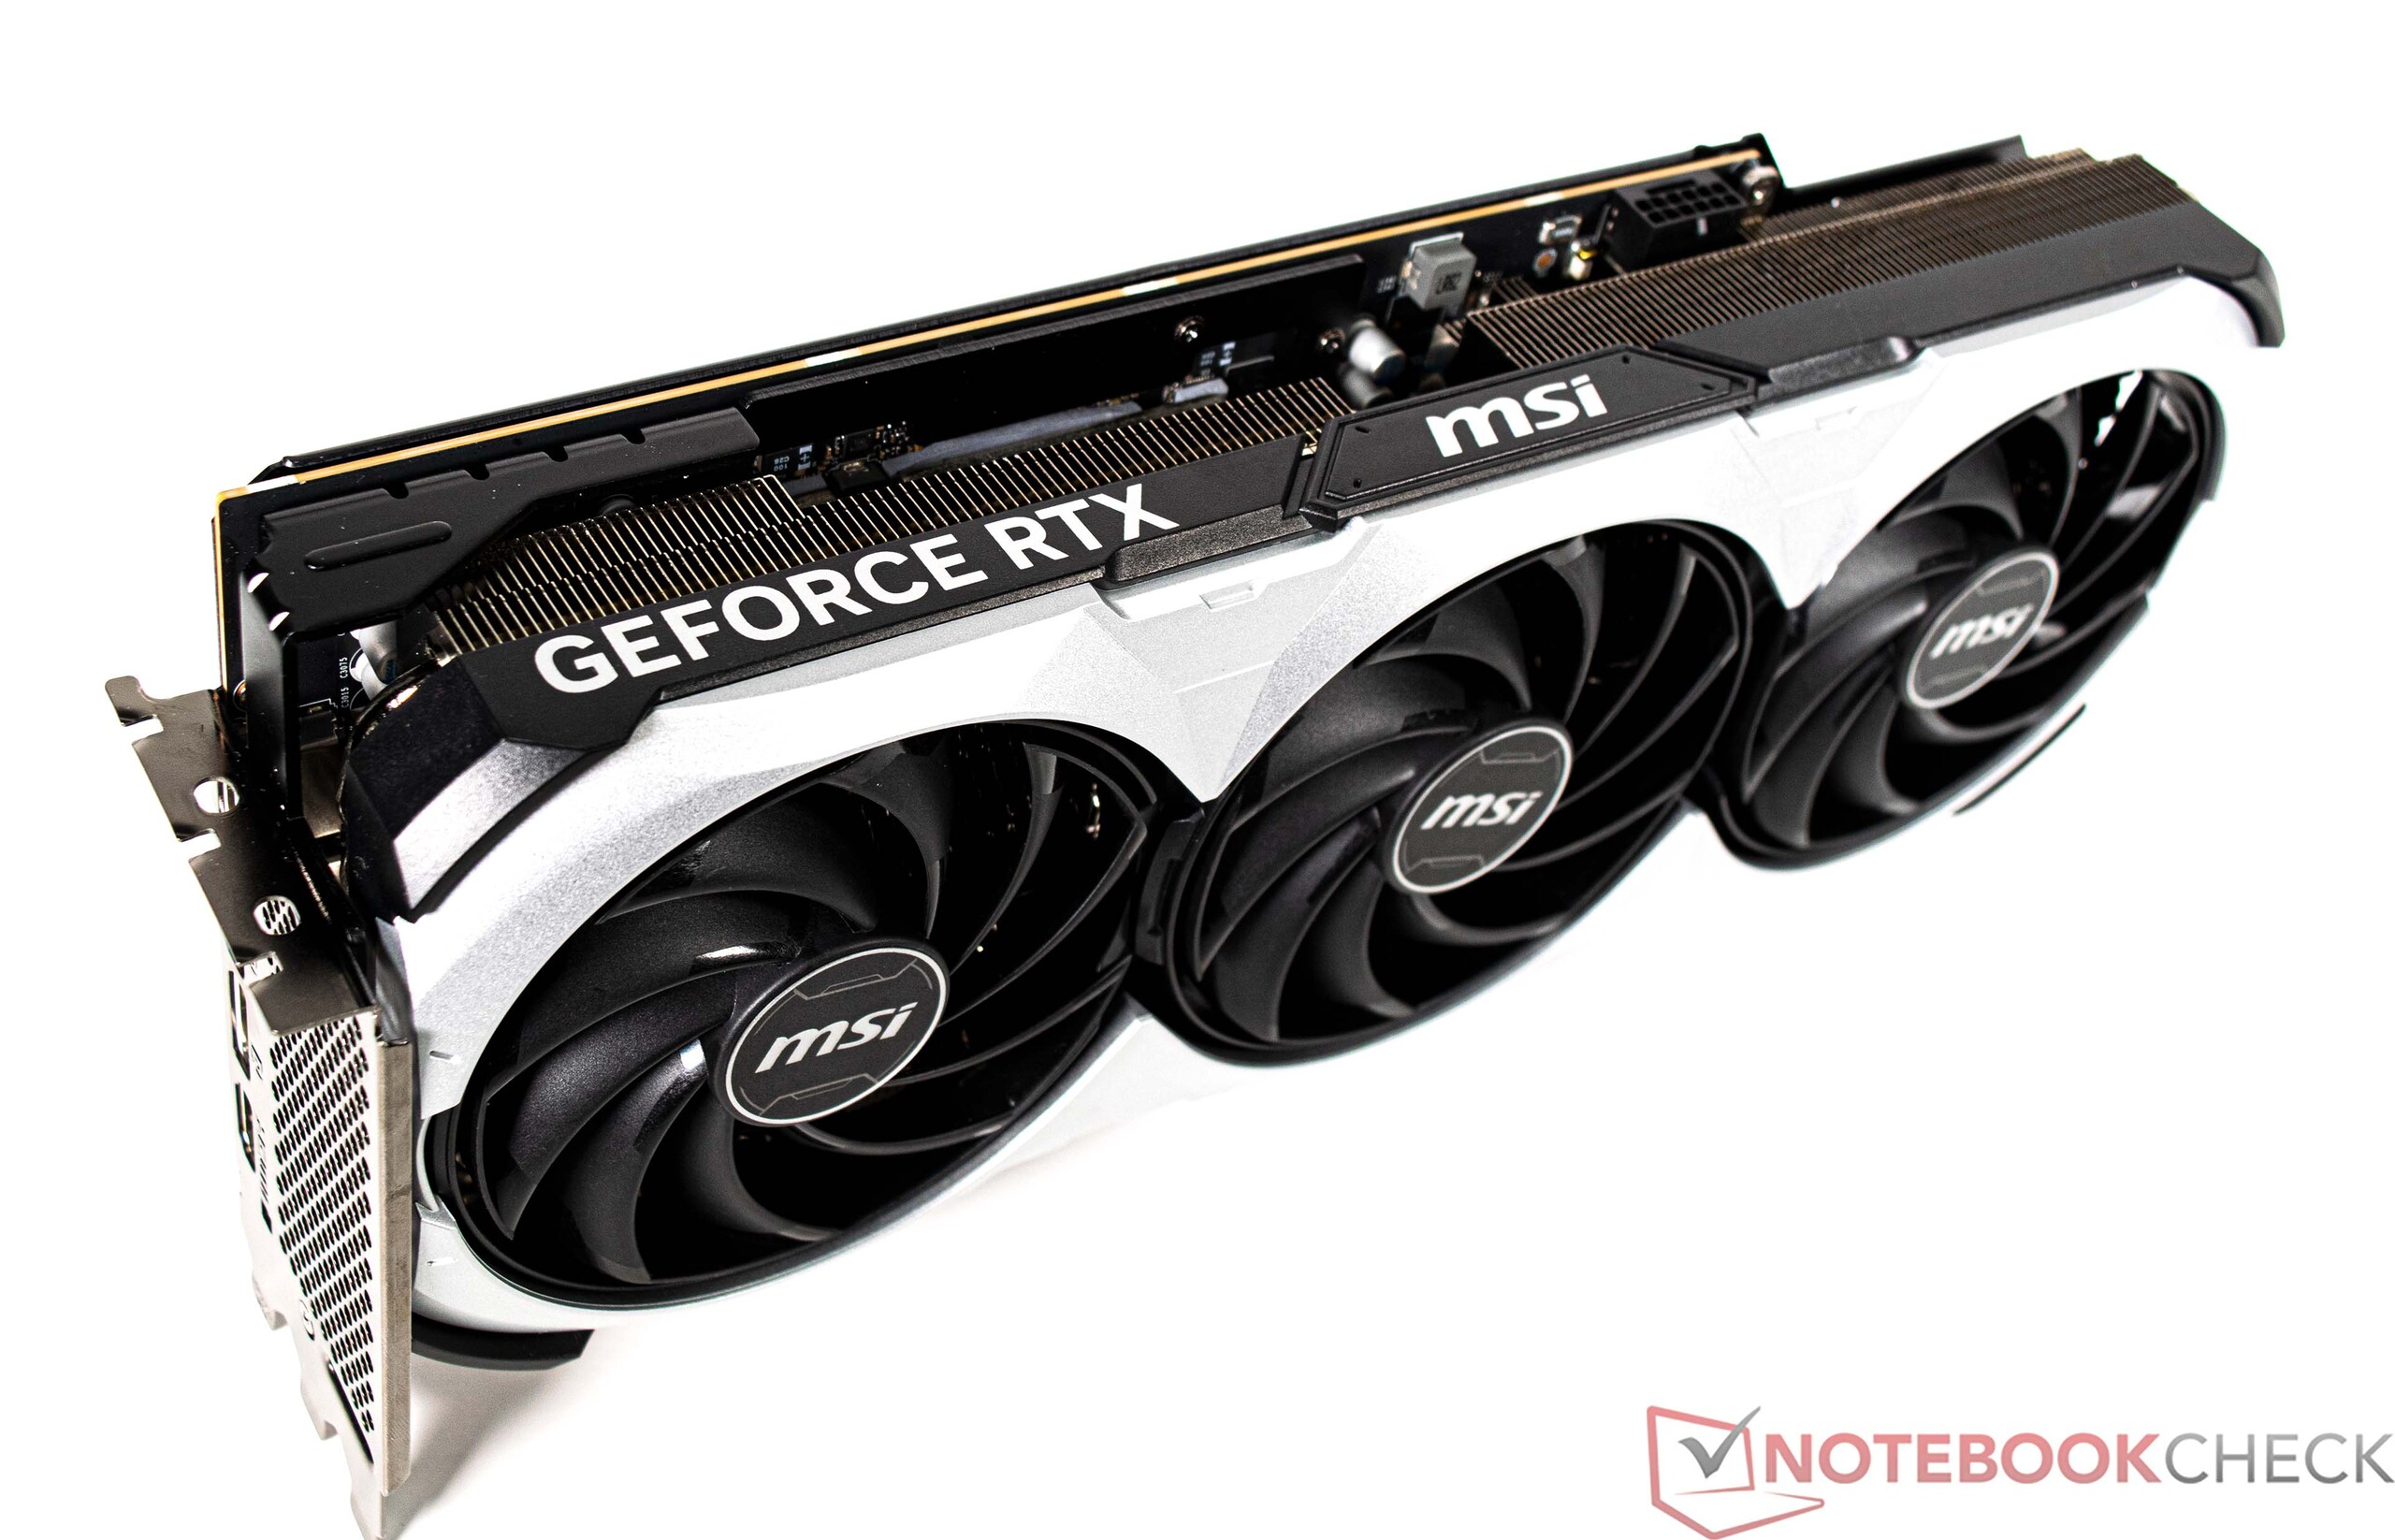
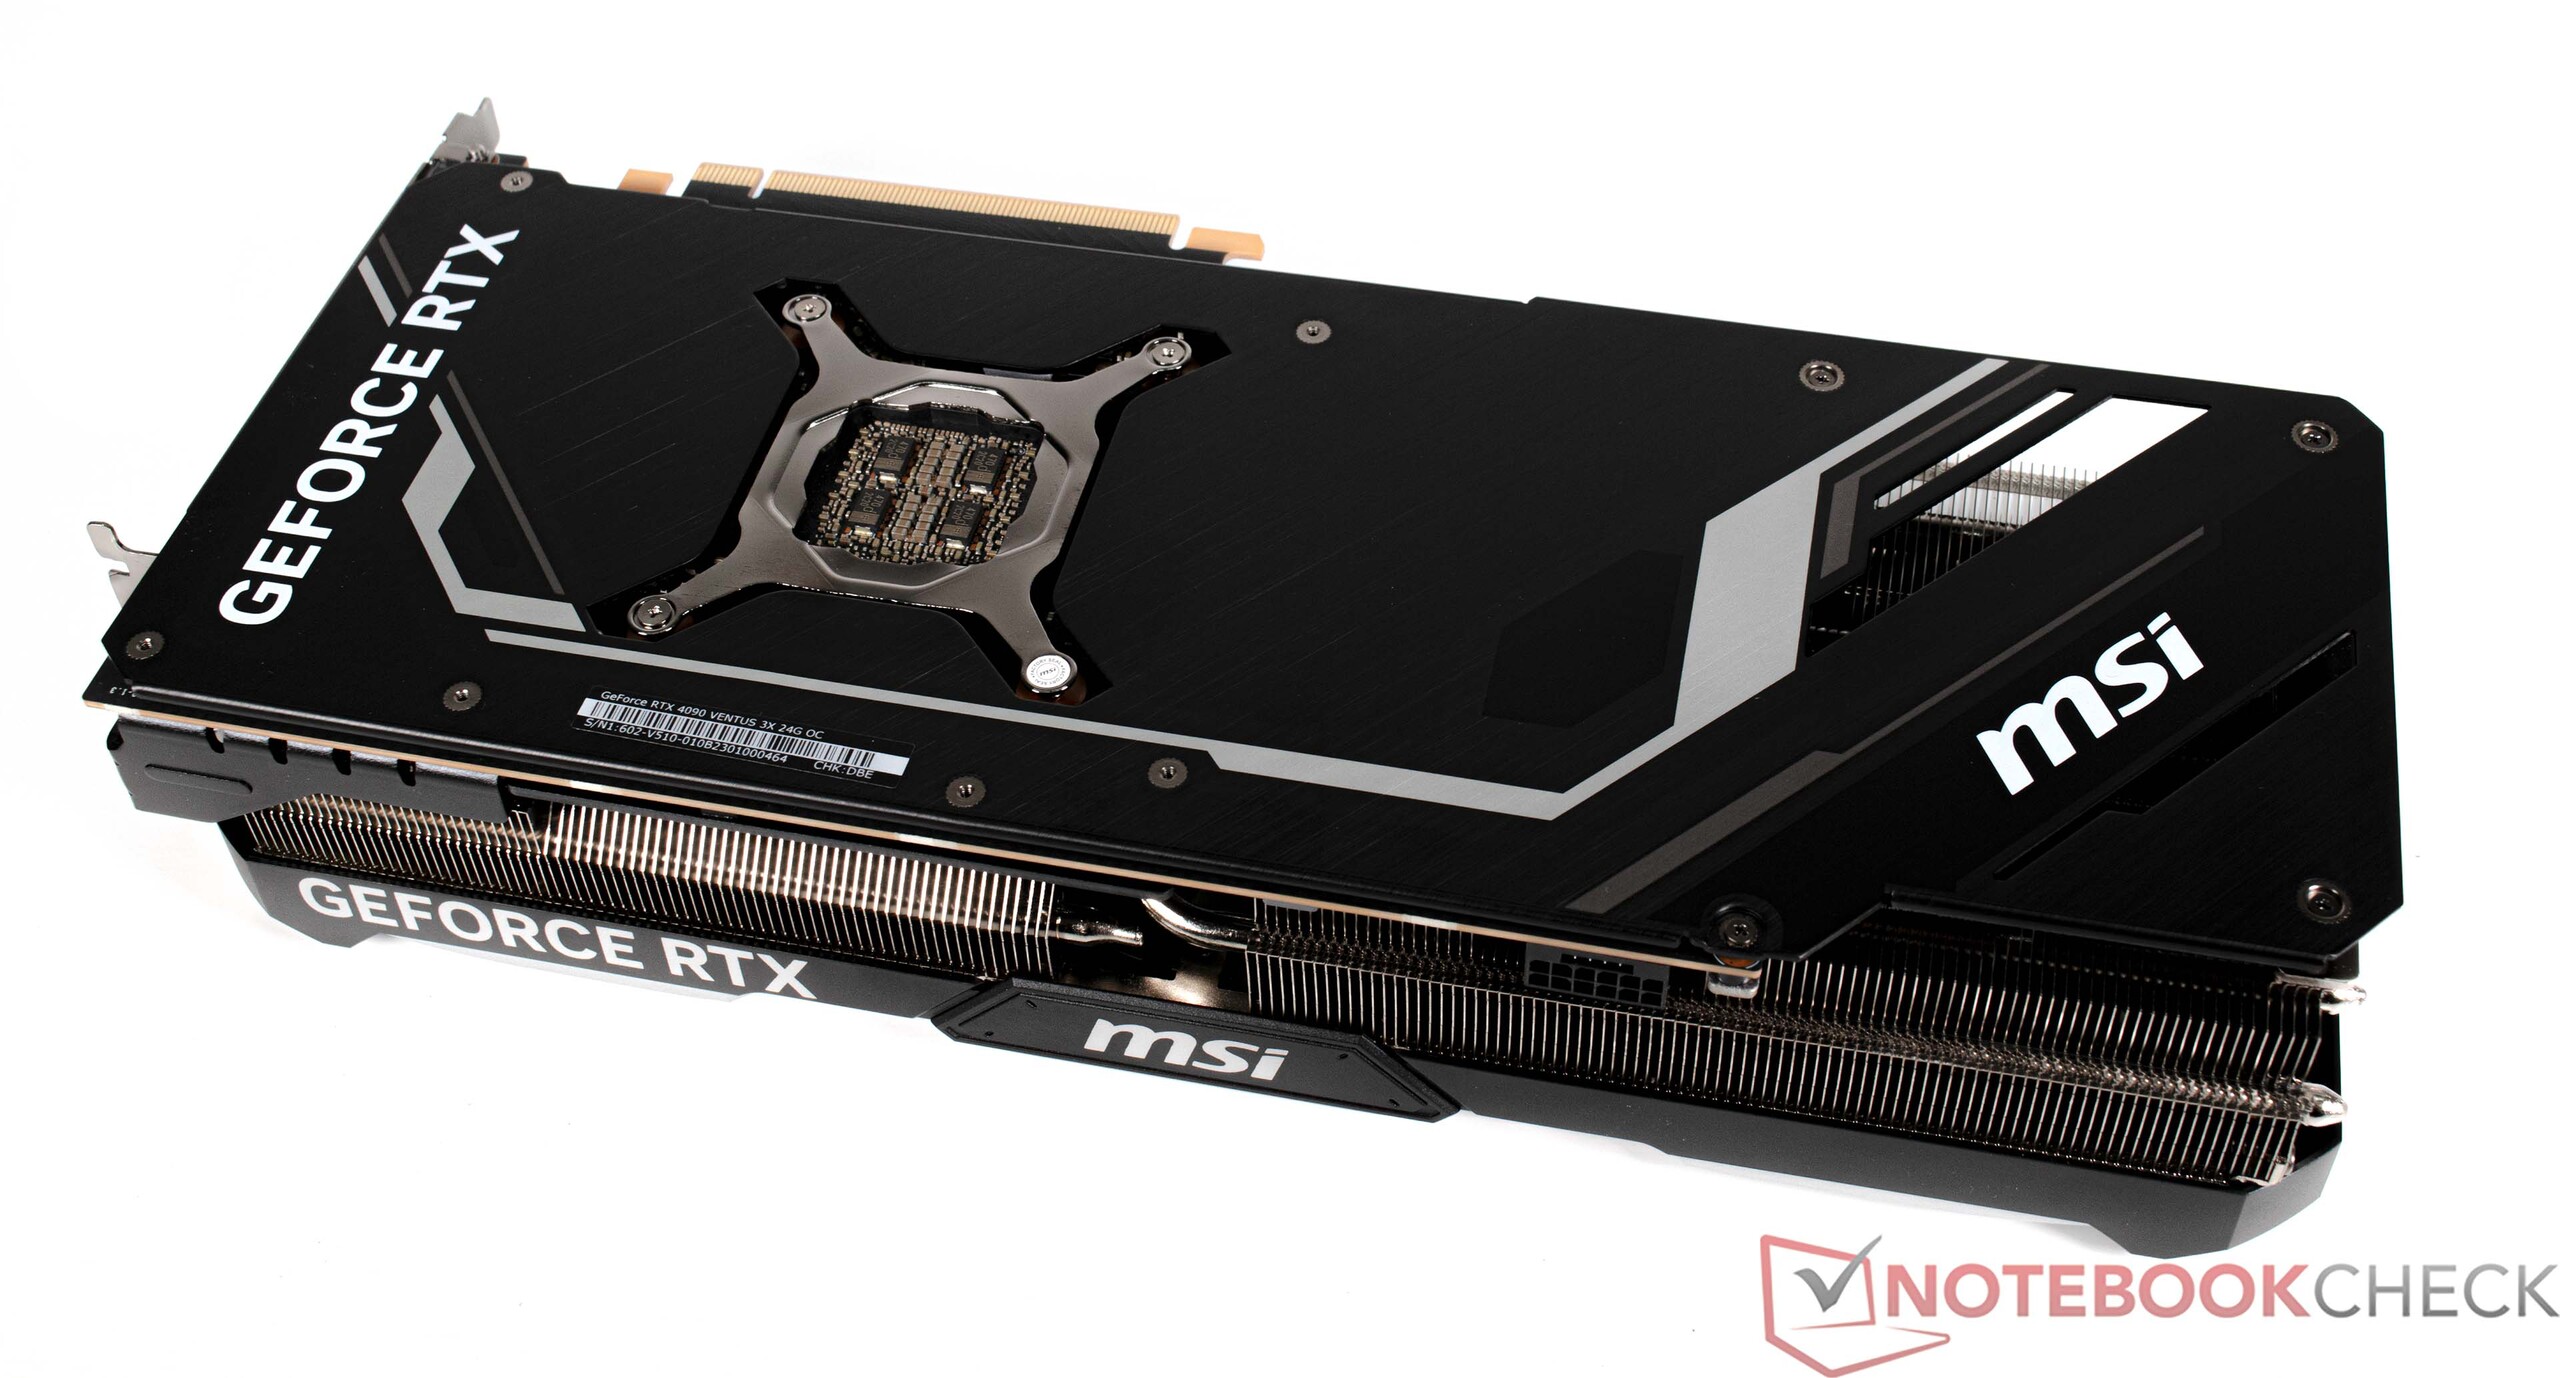
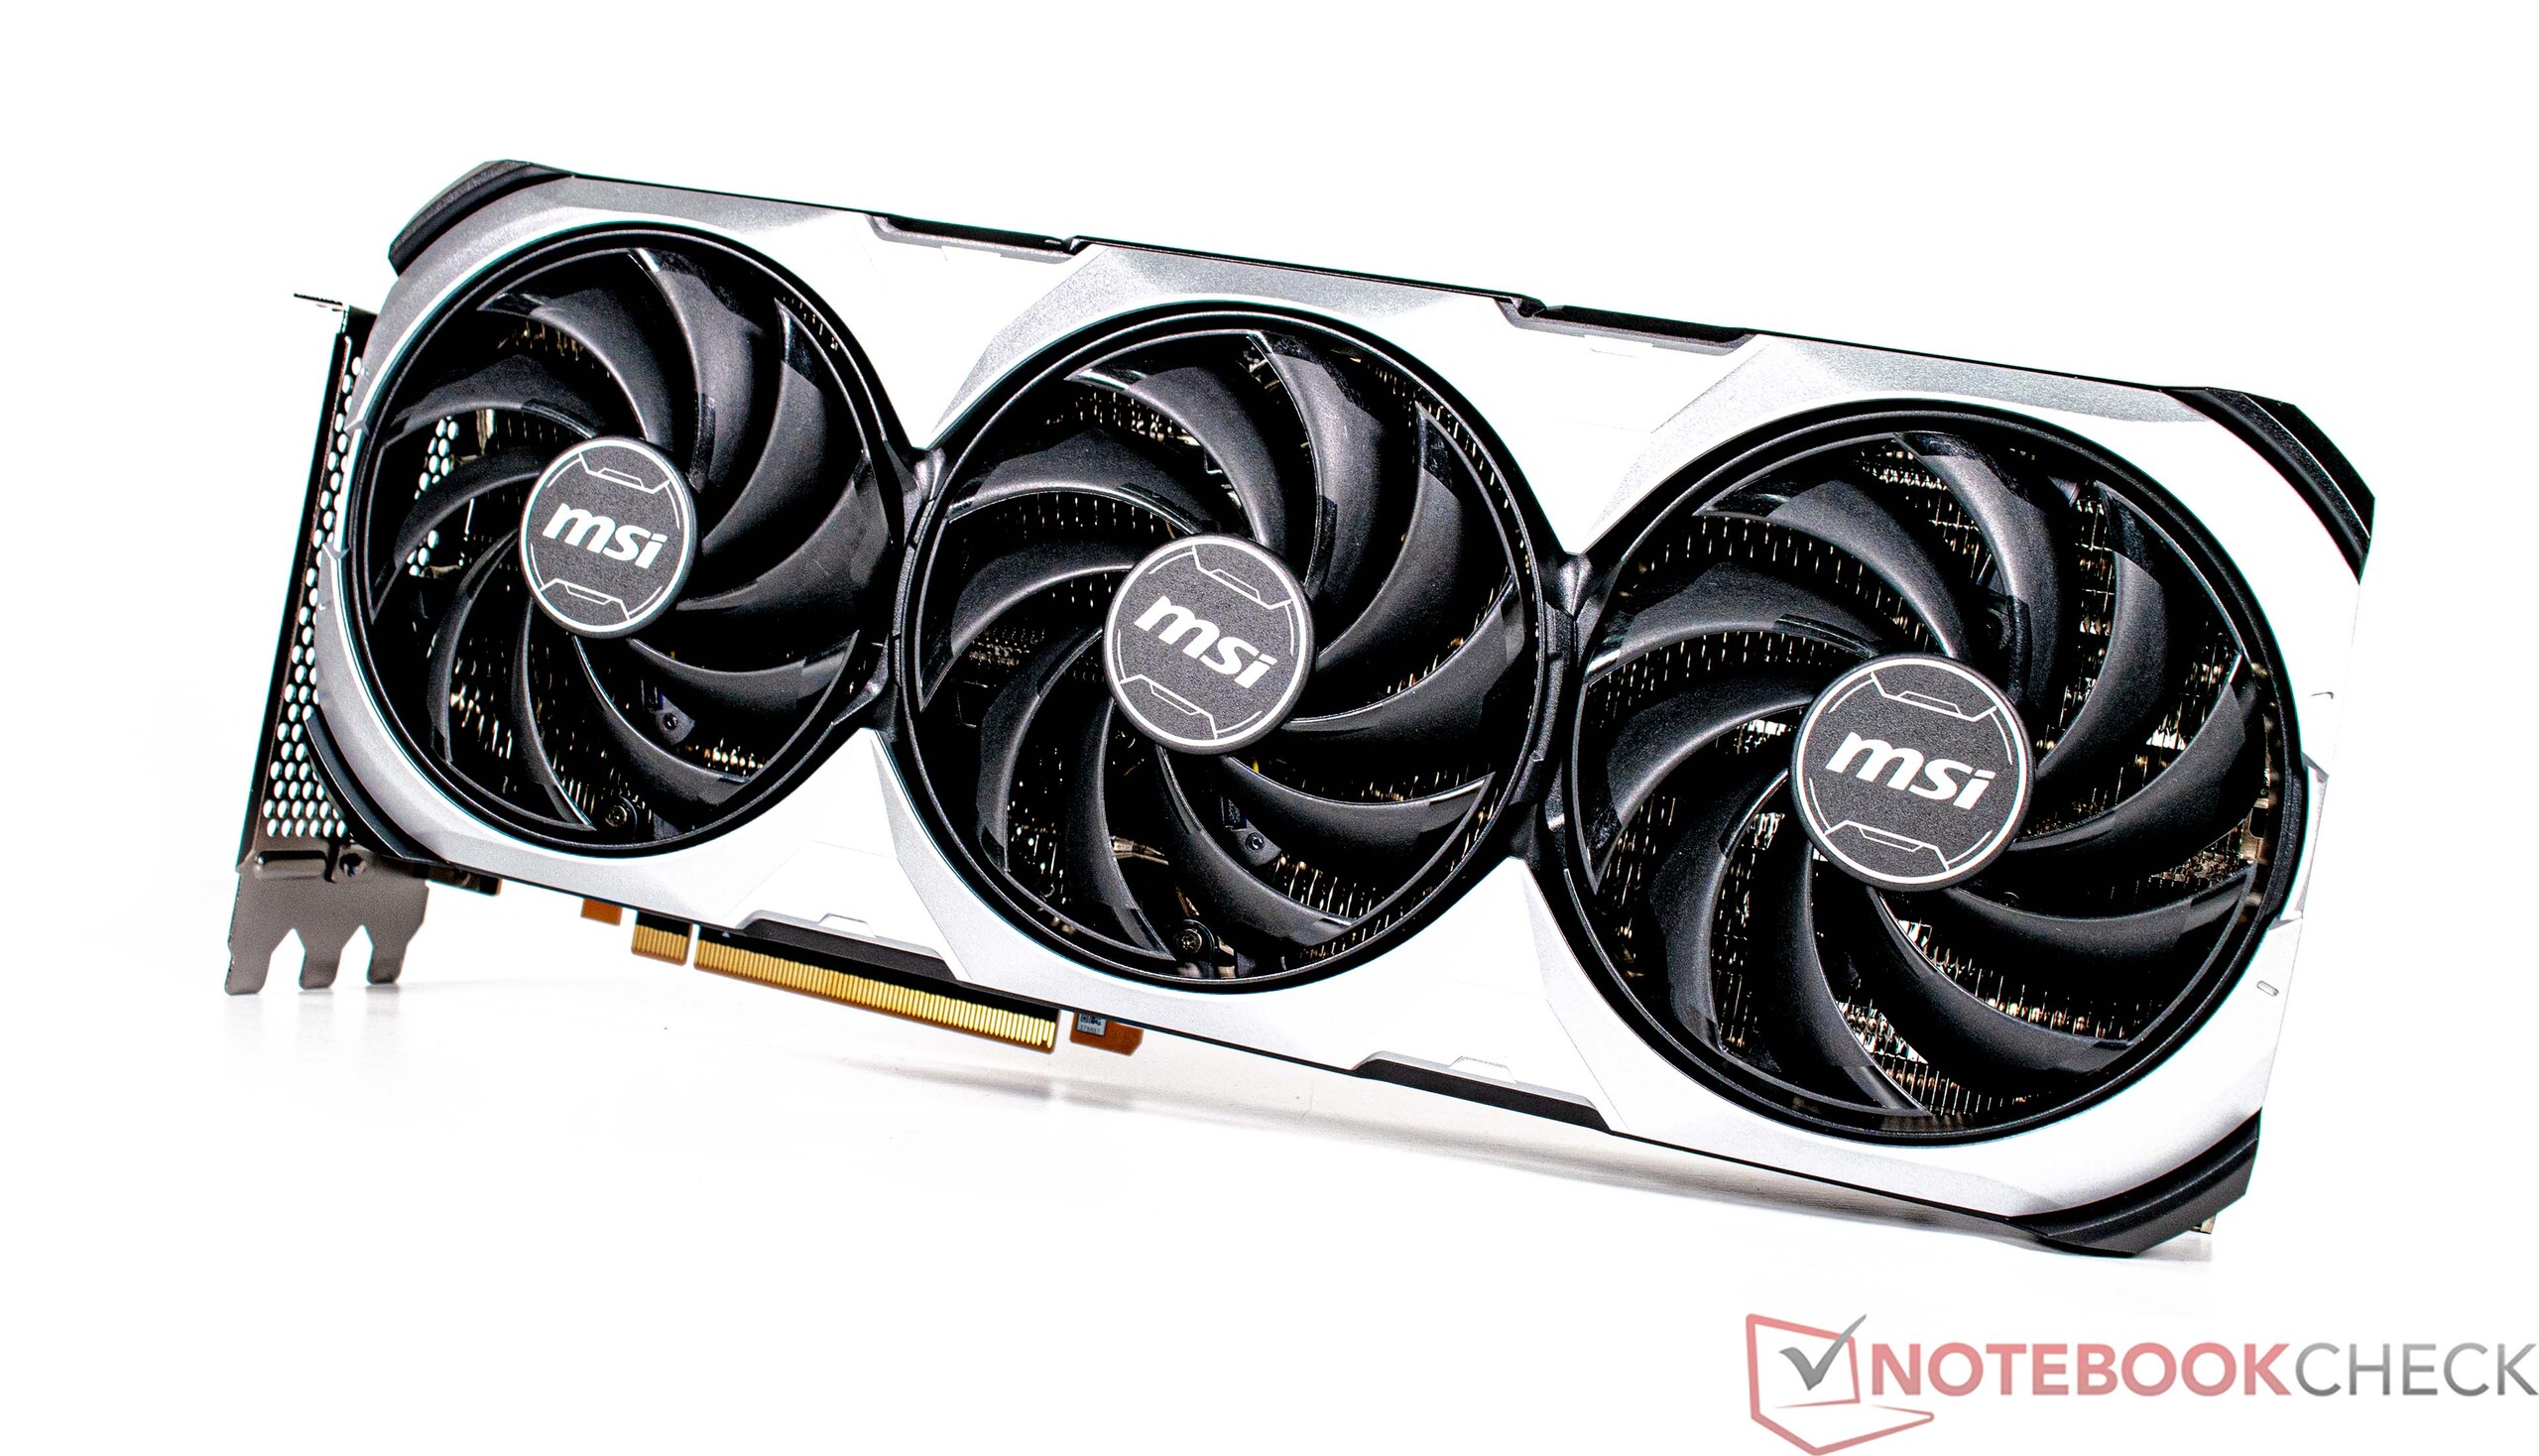
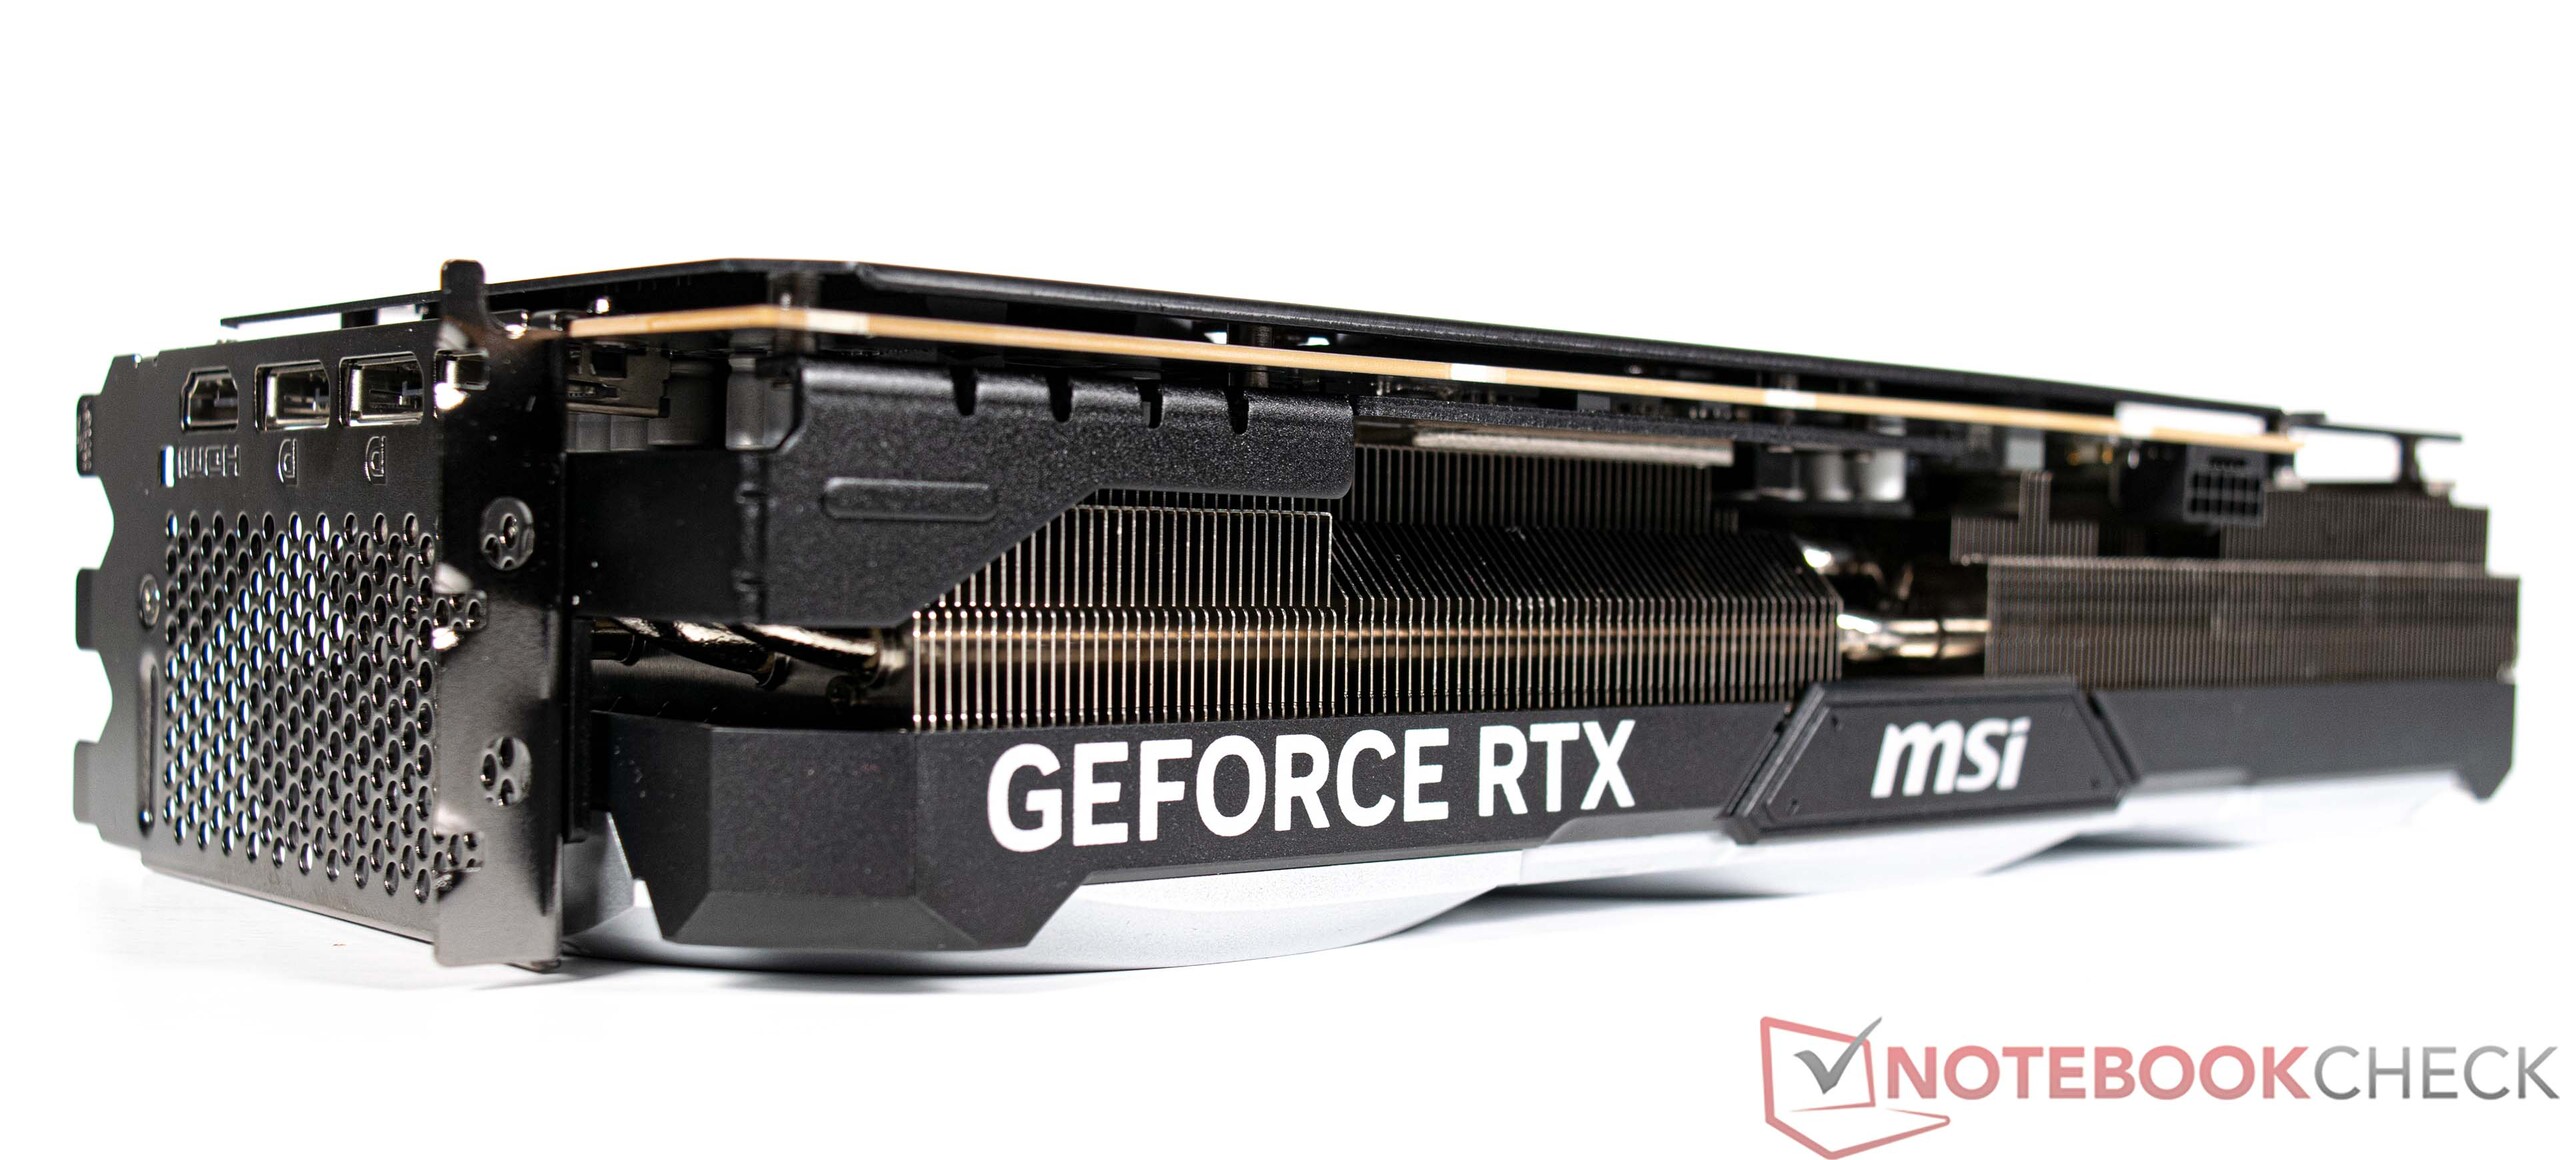
De Corsair 4000D Airflow is in principe een zeer hoogwaardige behuizing met voldoende ruimte om tal van componenten in onder te brengen. Zelfs de enorme MSI GeForce RTX 4090 VENTUS 3X past gemakkelijk in de case.
Specificaties
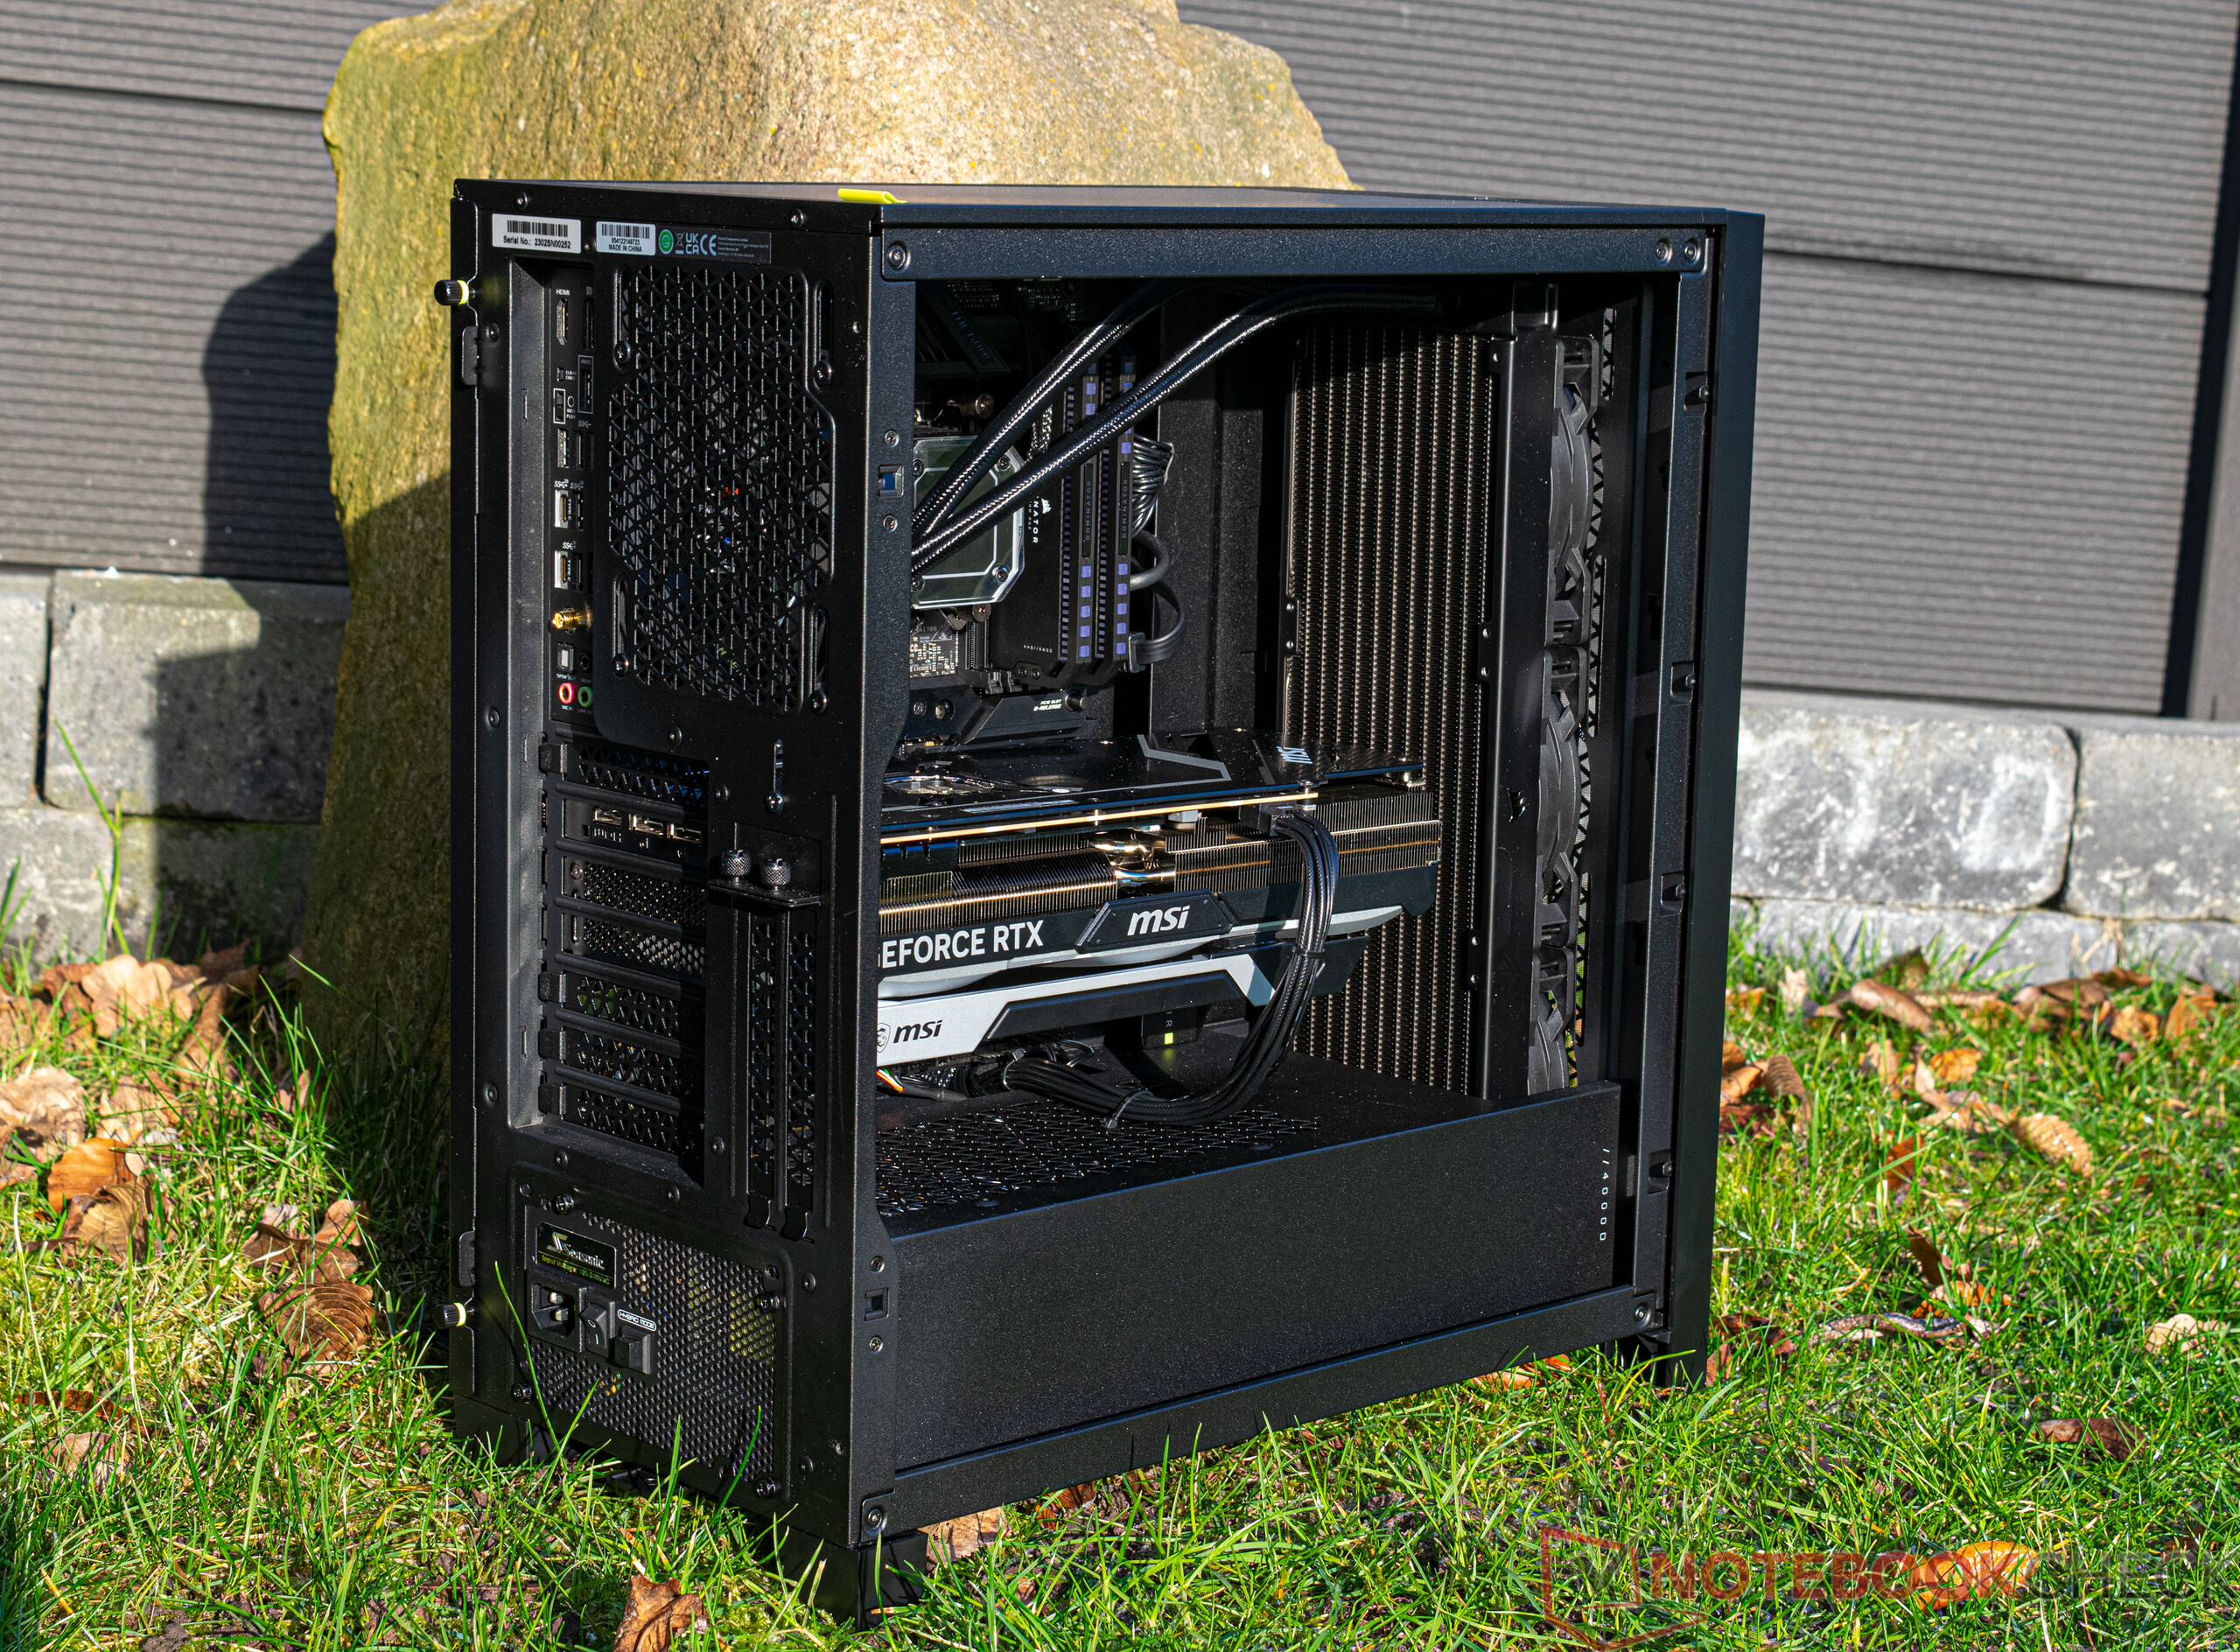
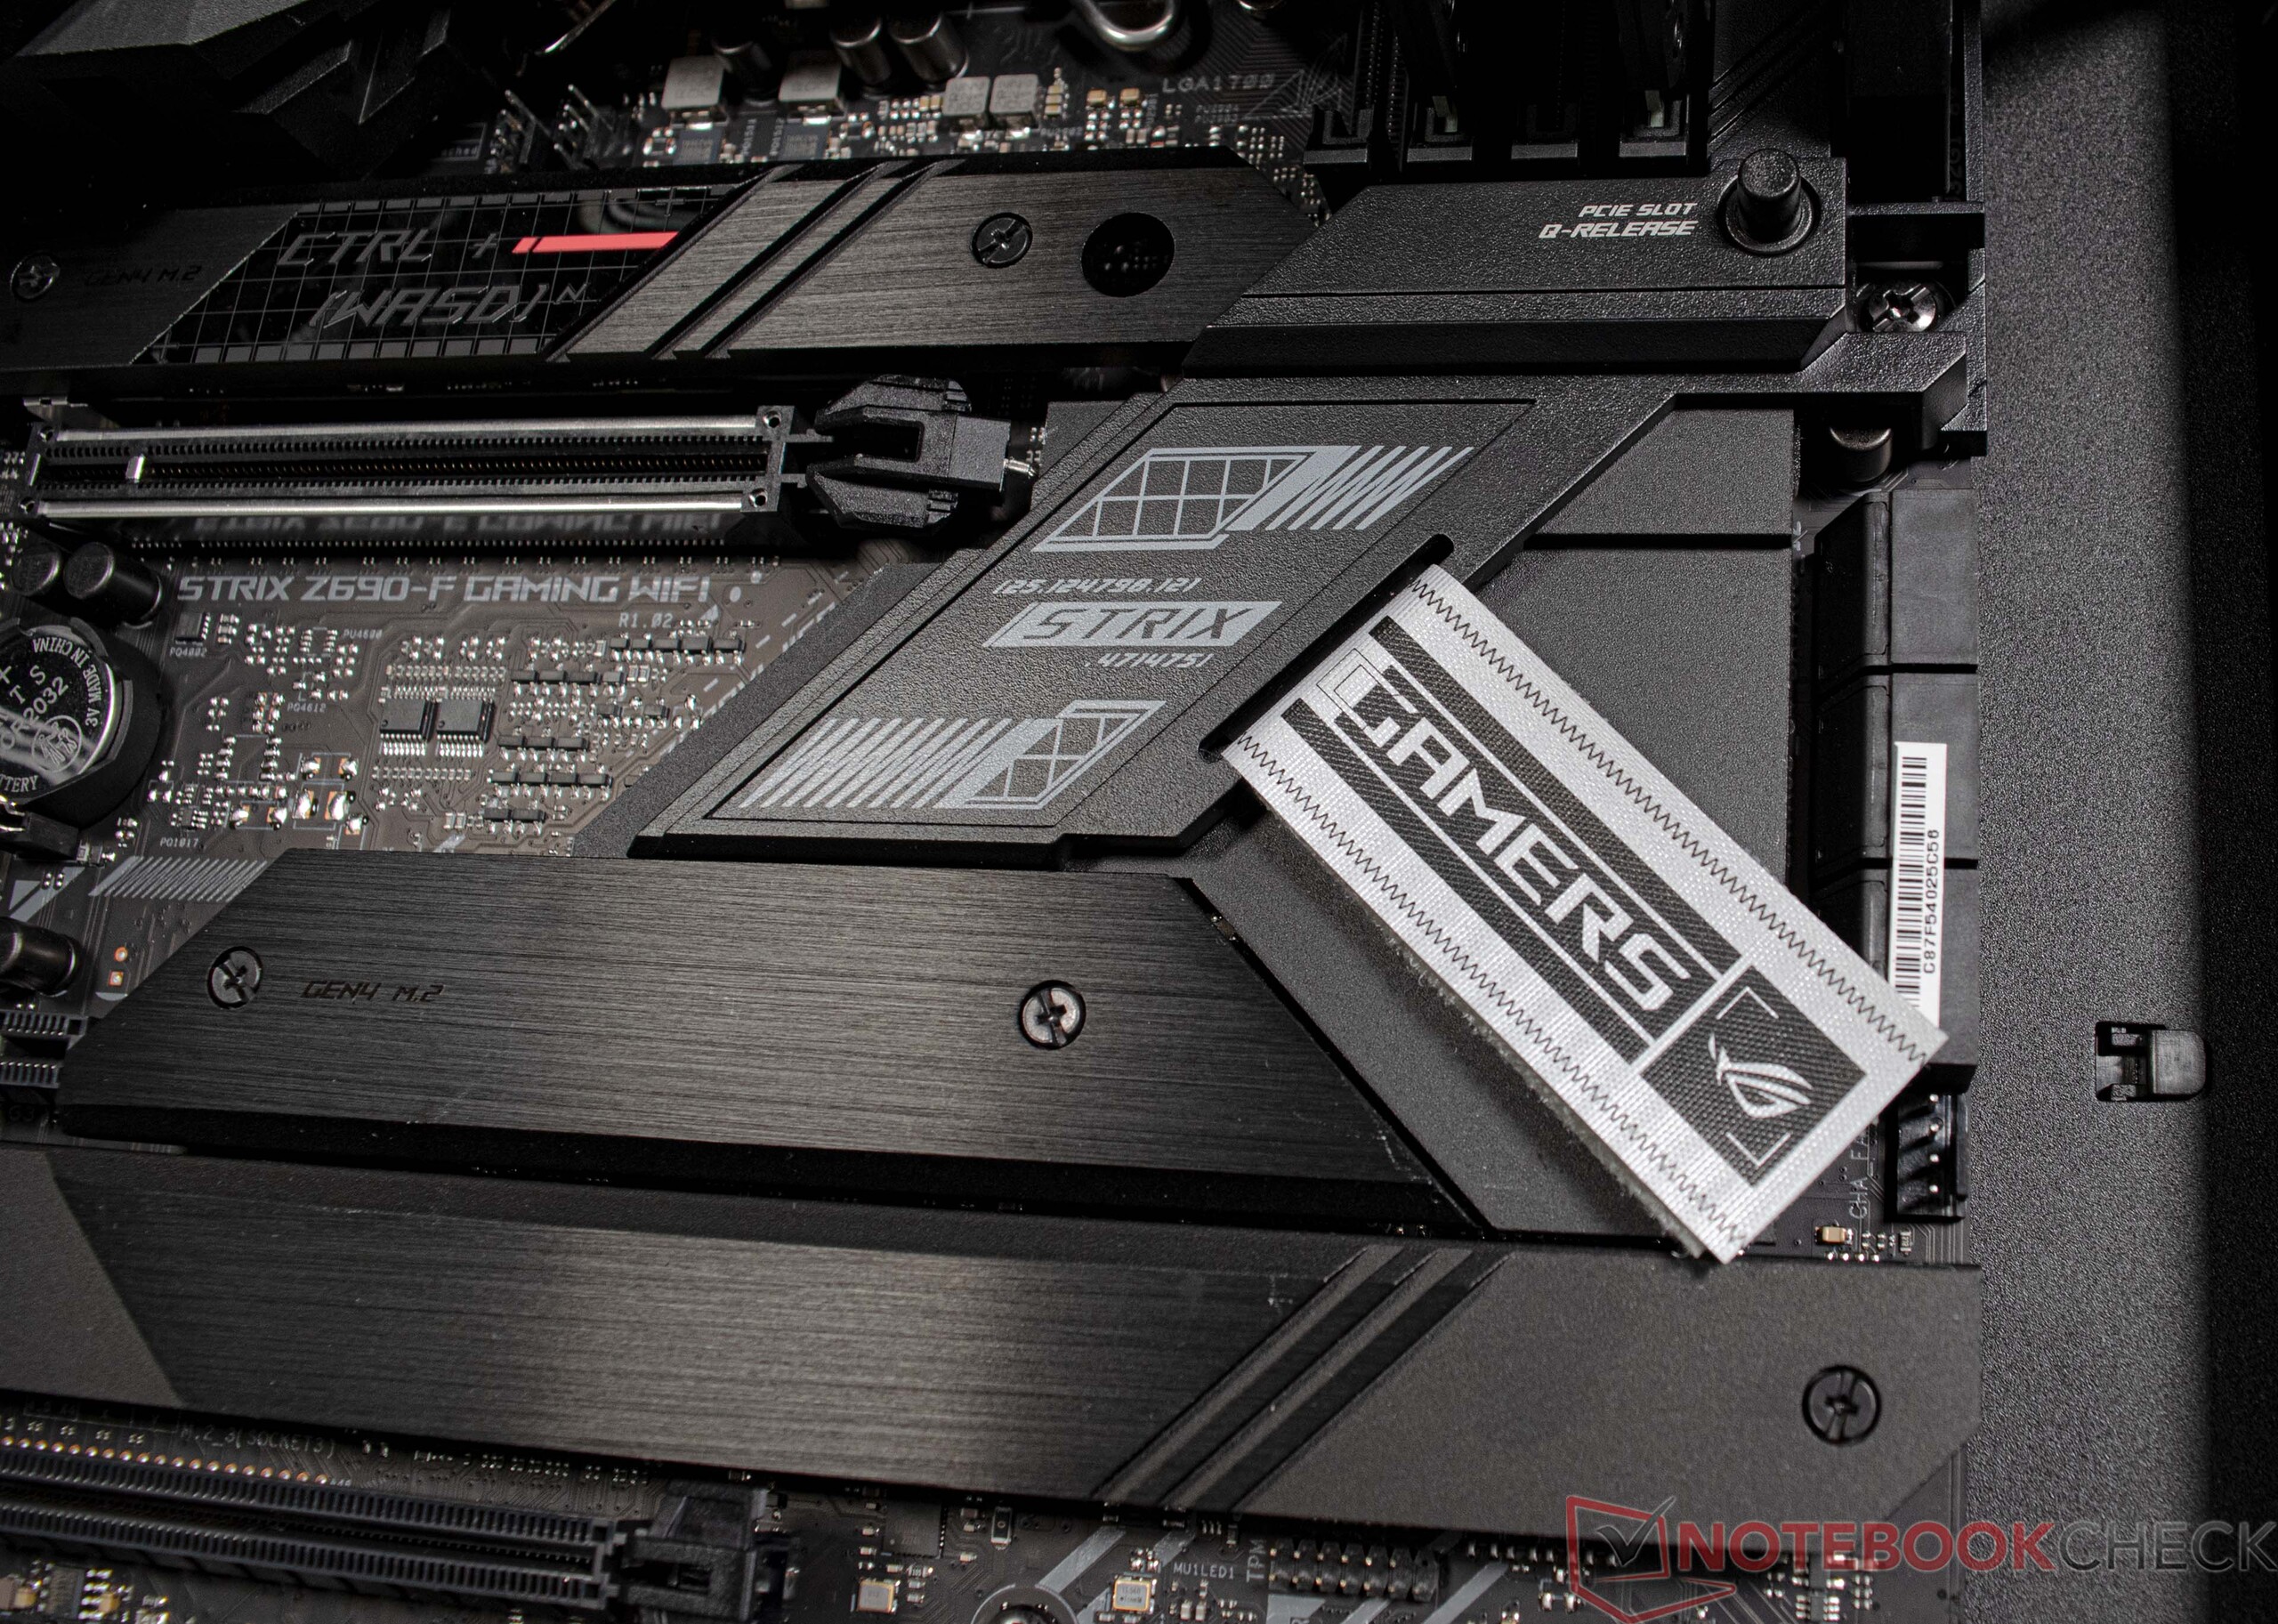
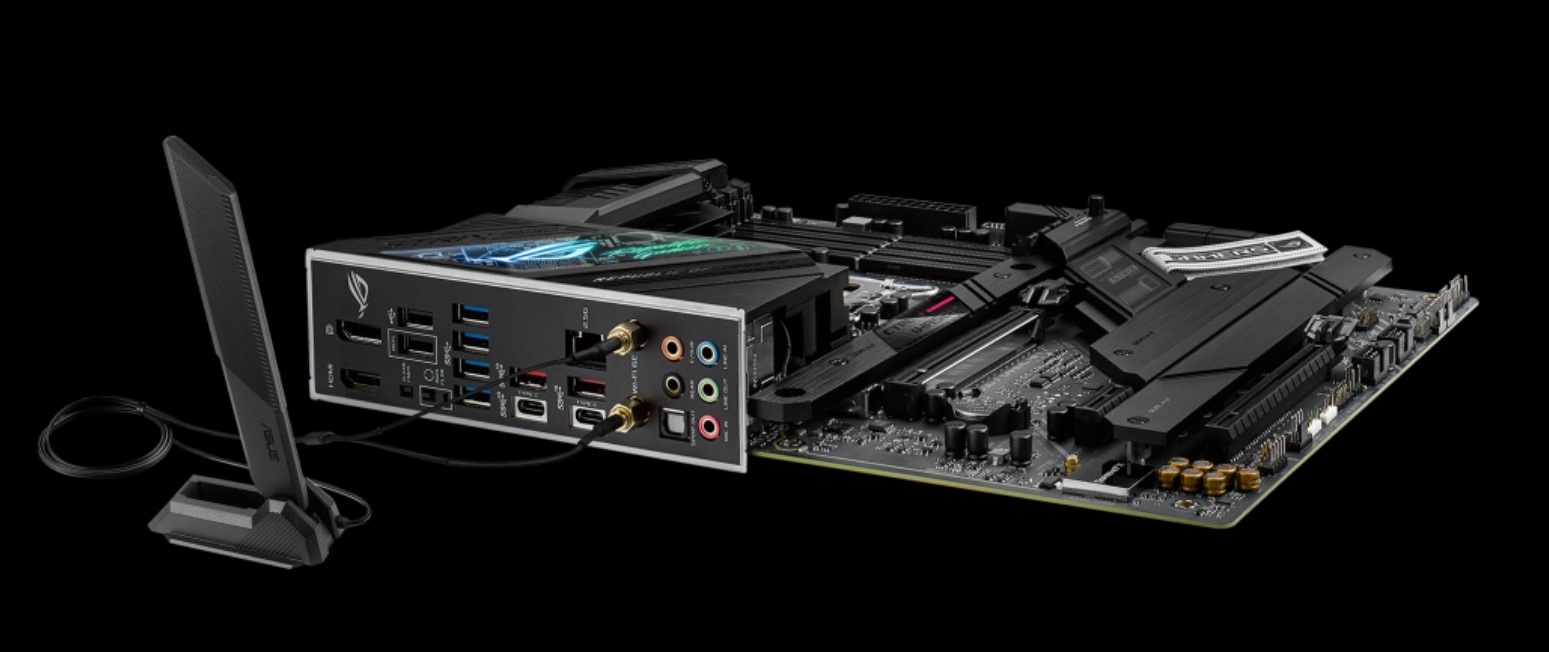
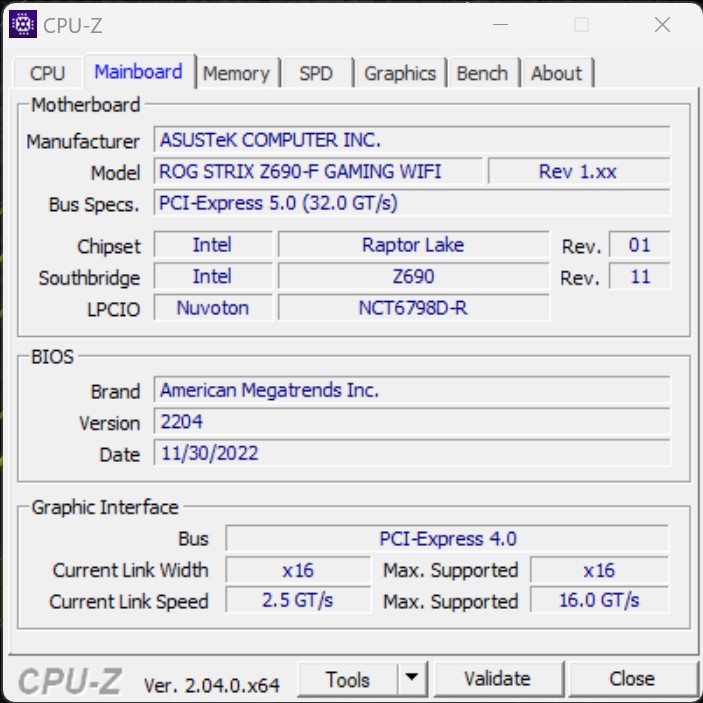
Er zijn vrijwel geen compromissen gesloten op het gebied van I/O-poorten. Zo biedt het meegeleverde moederbord (Asus ROG Strix Z690-F Gaming) een groot aantal USB-interfaces en moderne poorten voor netwerken. Verder biedt het plaats aan maximaal vier M.2 SSD's en 128 GB DDR5 RAM en wordt het geleverd met 6x SATA 6Gb/s aansluitingen. Gebruikers hebben directe toegang tot één USB-A en één USB-C poort op het frontpaneel van de Corsair 4000D Airflow. De beschikbare display-uitgangen zijn afhankelijk van de grafische kaart in het systeem. Onze recensie-eenheid heeft drie DisplayPorts en één HDMI-uitgang. Als uw systeem niet is uitgerust met een non-F CPU, kunt u de geïntegreerde GPU van de processor gebruiken voor video-uitvoer als alternatief voor de speciale grafische kaart. Er zijn ook verschillende manieren om beeldschermen aan te sturen vanaf het moederbord.
Connectiviteit
Een Intel Wi-Fi 6E AX211 draadloze module is geïnstalleerd op de Asus ROG Strix Z690-F Gaming. We waren niet volledig onder de indruk van de prestaties van de module toen we deze testten met onze referentie router, de Asus ROG Rapture GT-AXE11000. De geregistreerde overdrachtssnelheden lagen onder onze verwachtingen toen het systeem was aangesloten op het 5G-netwerk. Na het overschakelen naar een 6G-verbinding verbeterden de overdrachtssnelheden aanzienlijk. Als alternatief heeft het moederbord in onze review unit ook een RJ45 interface die snelheden tot 2,5 Gbit/s ondersteunt.
Accessoires
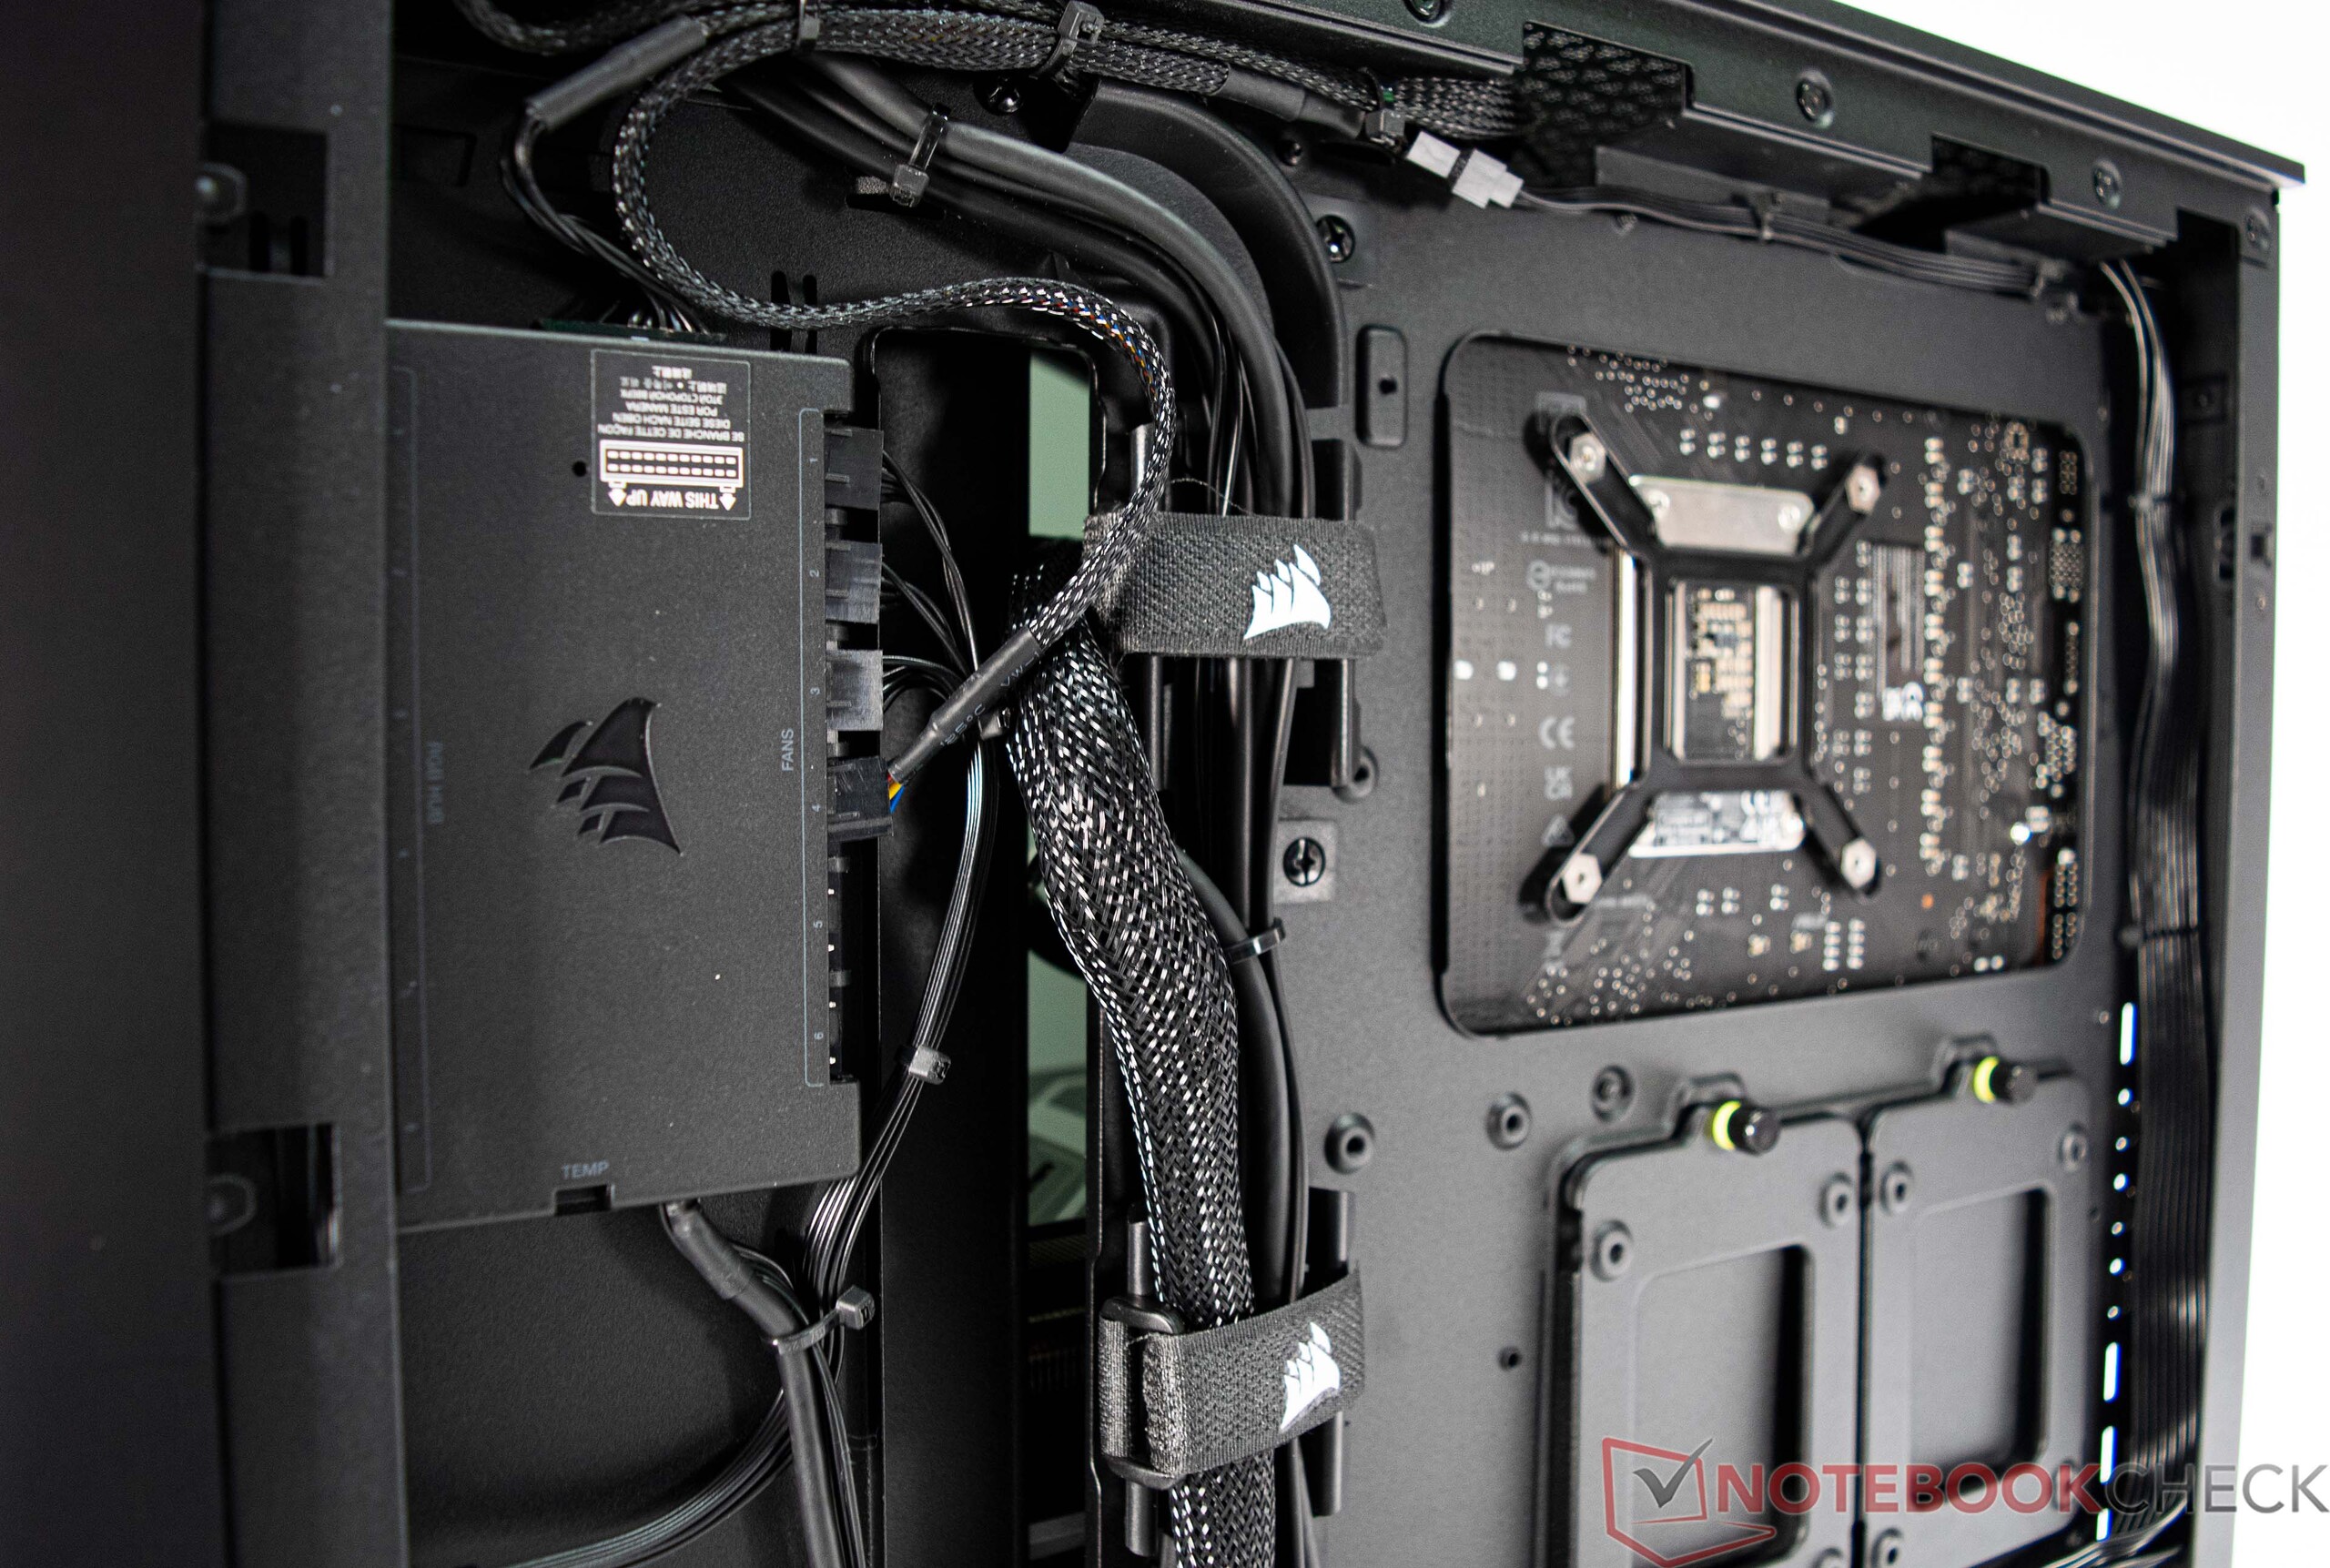
In de doos vindt u, naast de computer zelf, diverse moederbordaccessoires zoals kabels en Wi-Fi-antennes, alsmede ongebruikte kabels die horen bij de voeding, die volledig modulair is.
Onderhoud
Het onderhoud van de XMG SECTOR Intel is een koud kunstje. De zijpanelen van de Corsair 4000D Airflow kunnen eenvoudig worden verwijderd, zodat je snel en gemakkelijk stof van de ventilatoren kunt verwijderen. De meegeleverde Corsair iCUE H150i Elite Capellix is een hoogwaardige AIO-koeling die niet veel onderhoud vergt.
Garantie
Schenker biedt een basisgarantie van 36 maanden met pick-up & return service op elke XMG SECTOR Intel. Er is echter geen optie om de garantieperiode te verlengen tijdens het bestelproces.
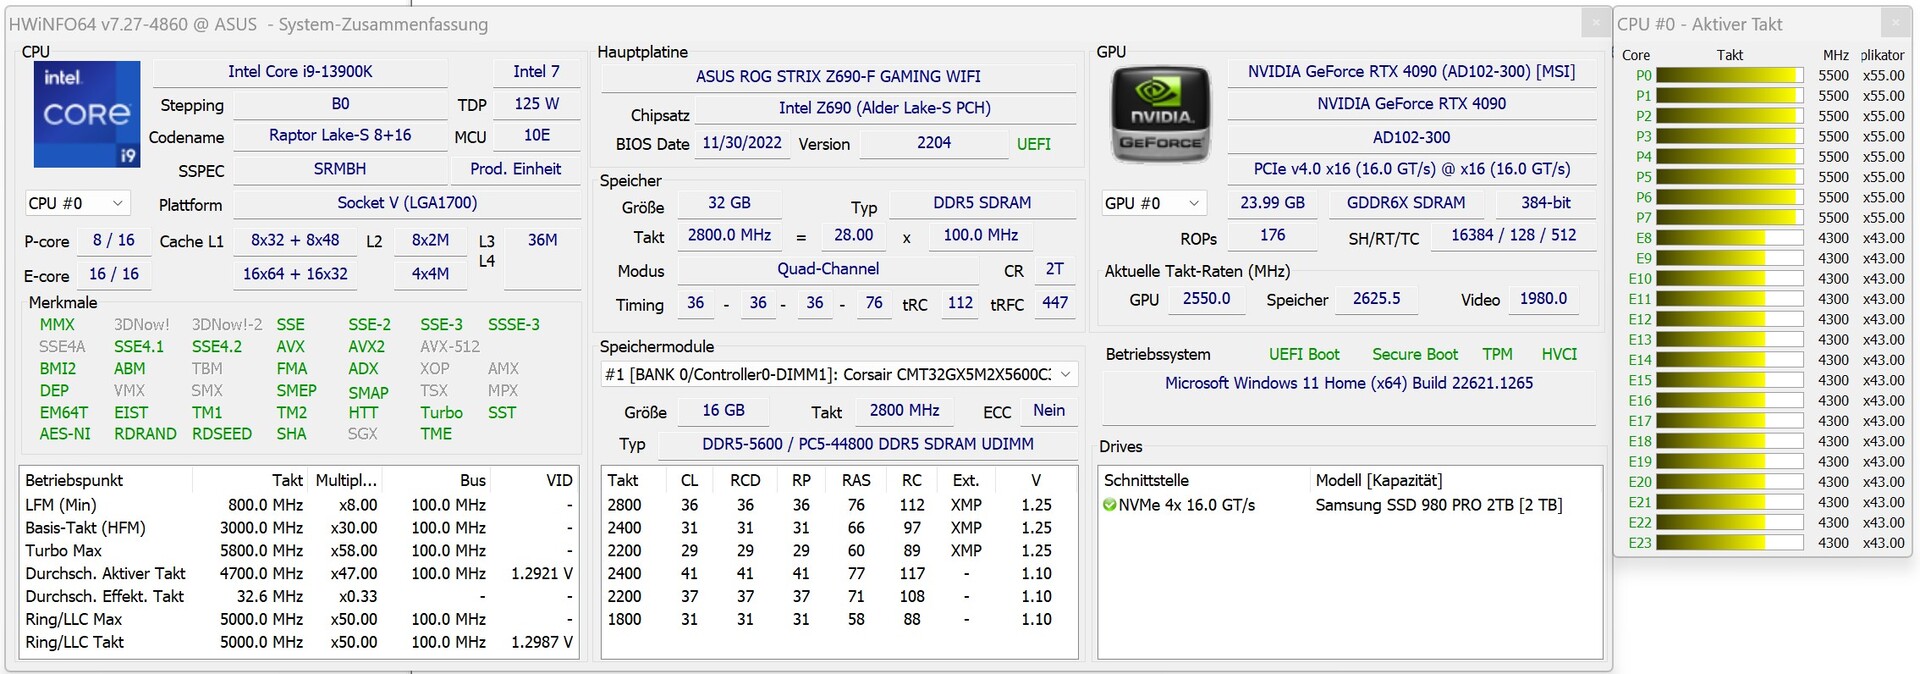
Prestaties - tweede snelste Intel CPU ontmoet snelste GPU
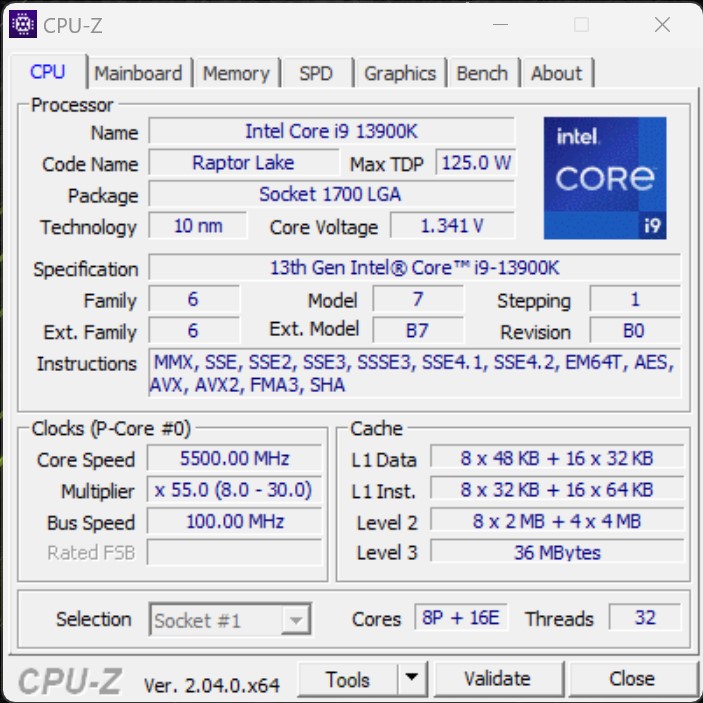
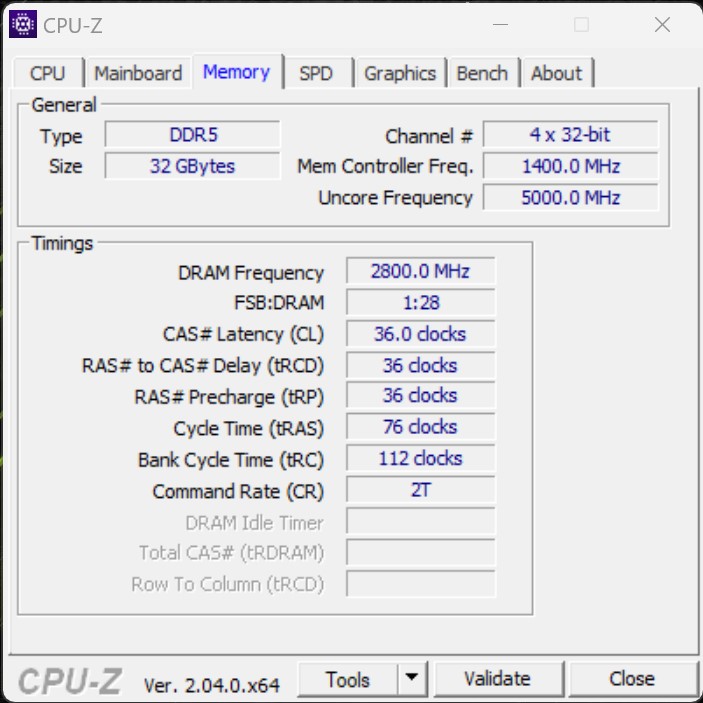
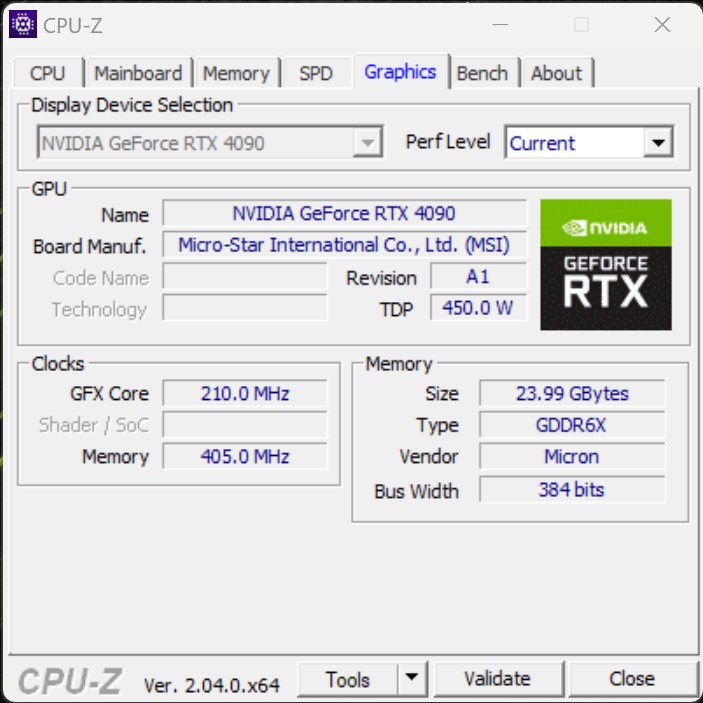
De XMG SECTOR Intel in deze review is uitgerust met de op één na snelste Intel gaming CPU - de Core i9-13900K. De processor wordt geflankeerd door 32 GB geheugen en een SSD met maar liefst 2 TB capaciteit, wat betekent dat het systeem genoeg opslagruimte heeft om pc-games met grote installatiegrootte te huisvesten. De meegeleverde grafische kaart is een MSI GeForce RTX 4090 VENTUS 3X, dat is de snelste GPU voor de consumentenmarkt op dit moment.
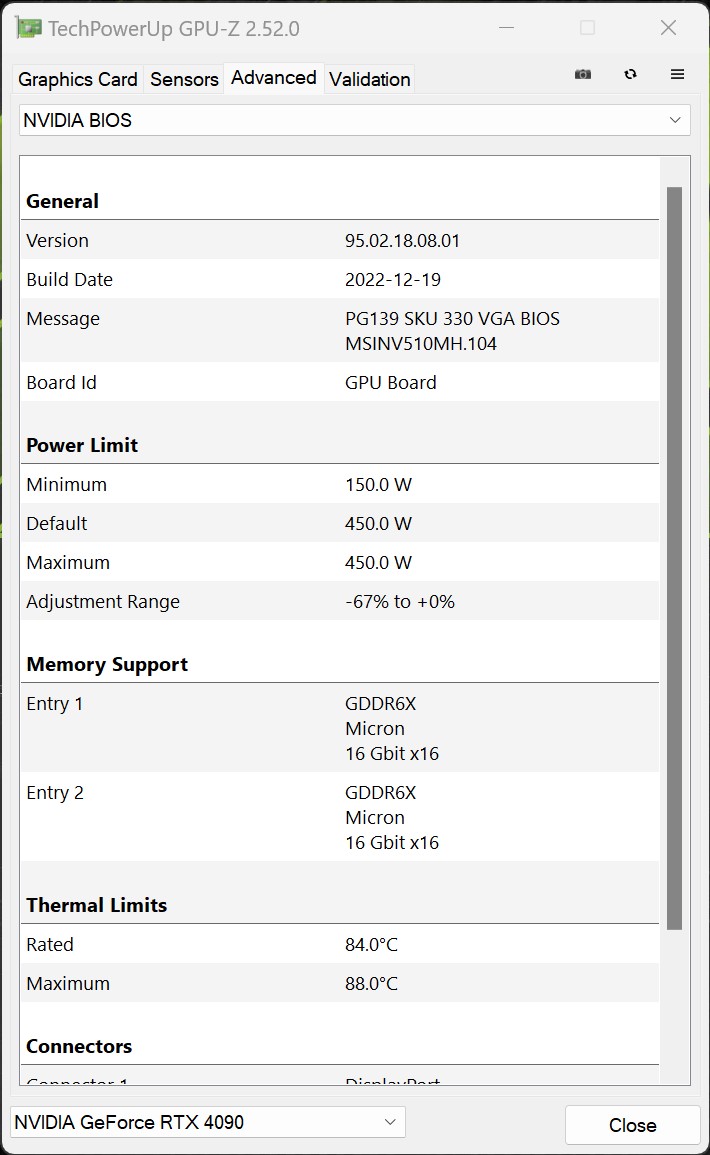
Testvoorwaarden
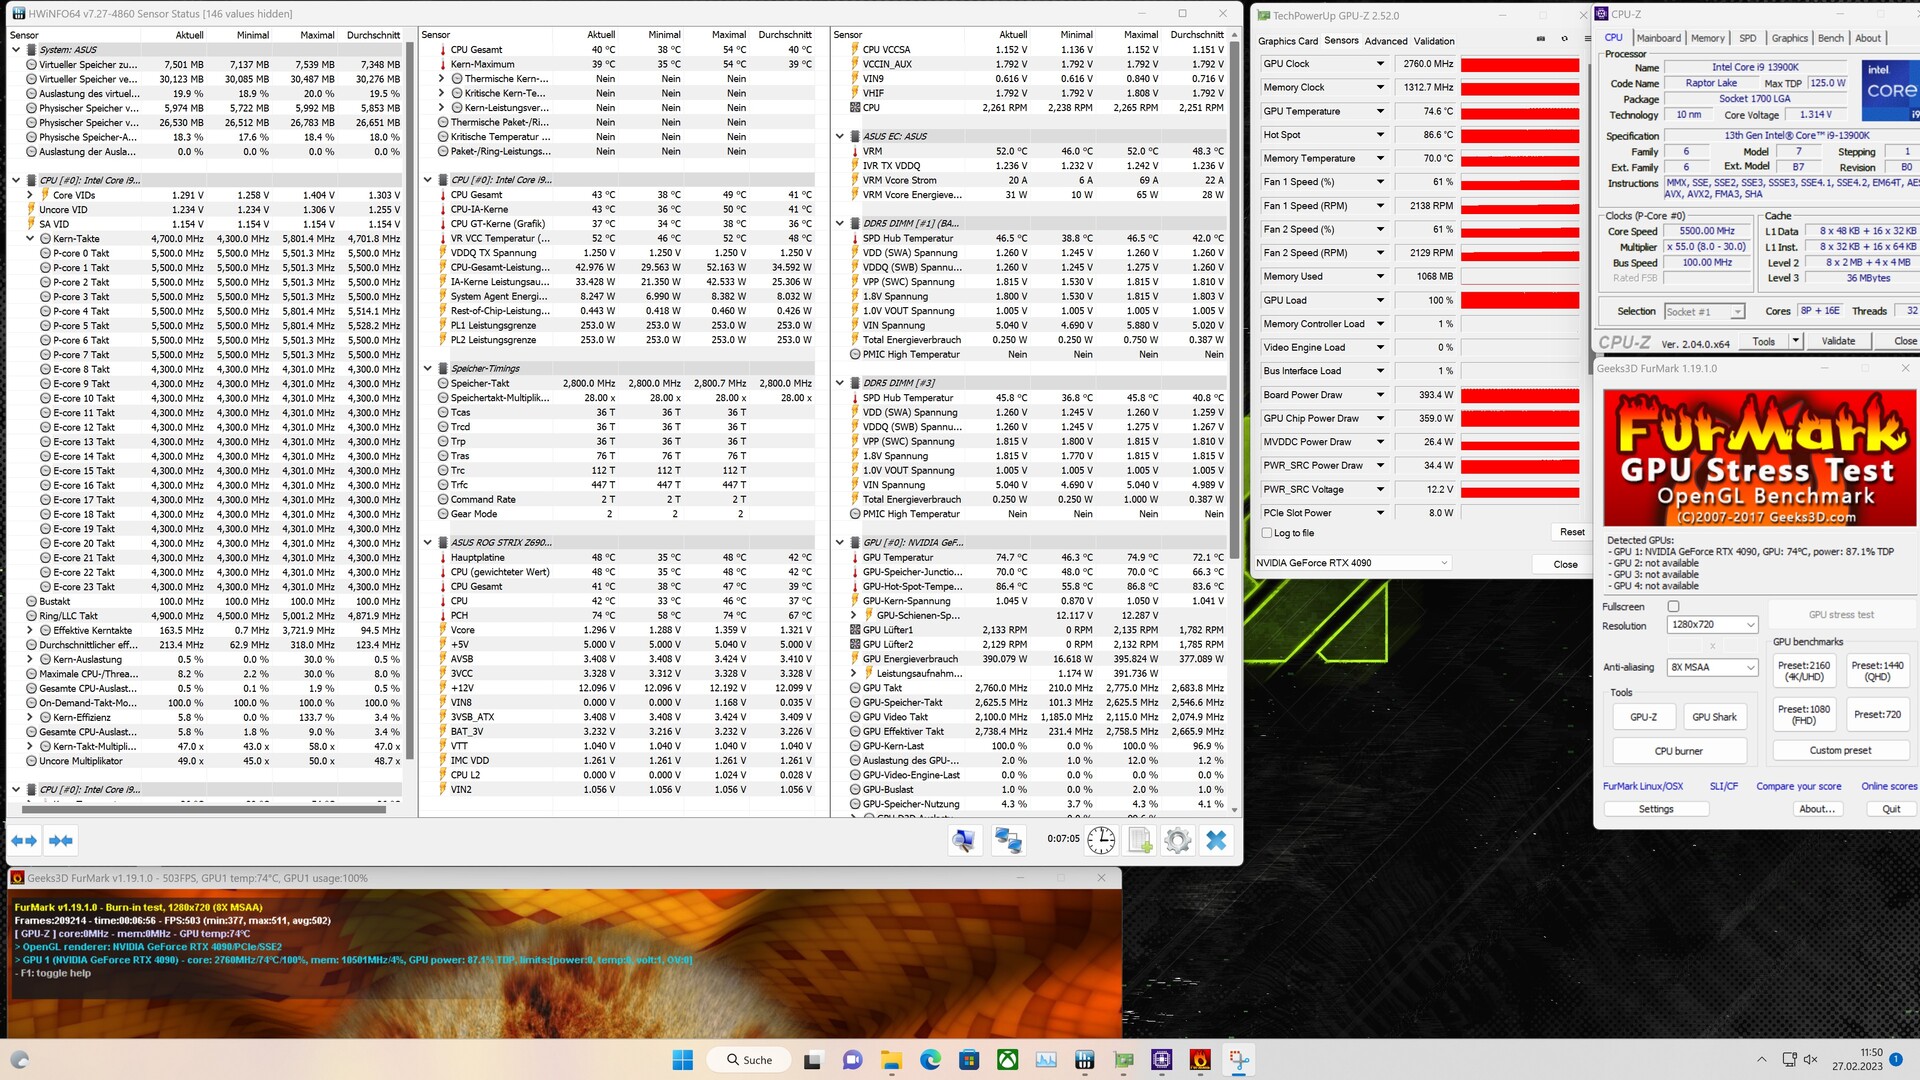
Alle prestatie-gerelateerde tests werden uitgevoerd met het stroomprofiel ingesteld op "High performance", zodat we de best mogelijke resultaten krijgen. Bovendien heeft de fabrikant in het BIOS alle beperkingen van het CPU-verbruik uitgeschakeld. Het resultaat is dat de Core i9-13900K niet beperkt tot een maximaal opgenomen vermogen van 253 watt (de PL2 van de CPU). We schakelden alleen over op een ander stroomplan bij het meten van het stroomverbruik en de geluidsniveaus. Zie deze pagina voor meer informatie over onze testcriteria.
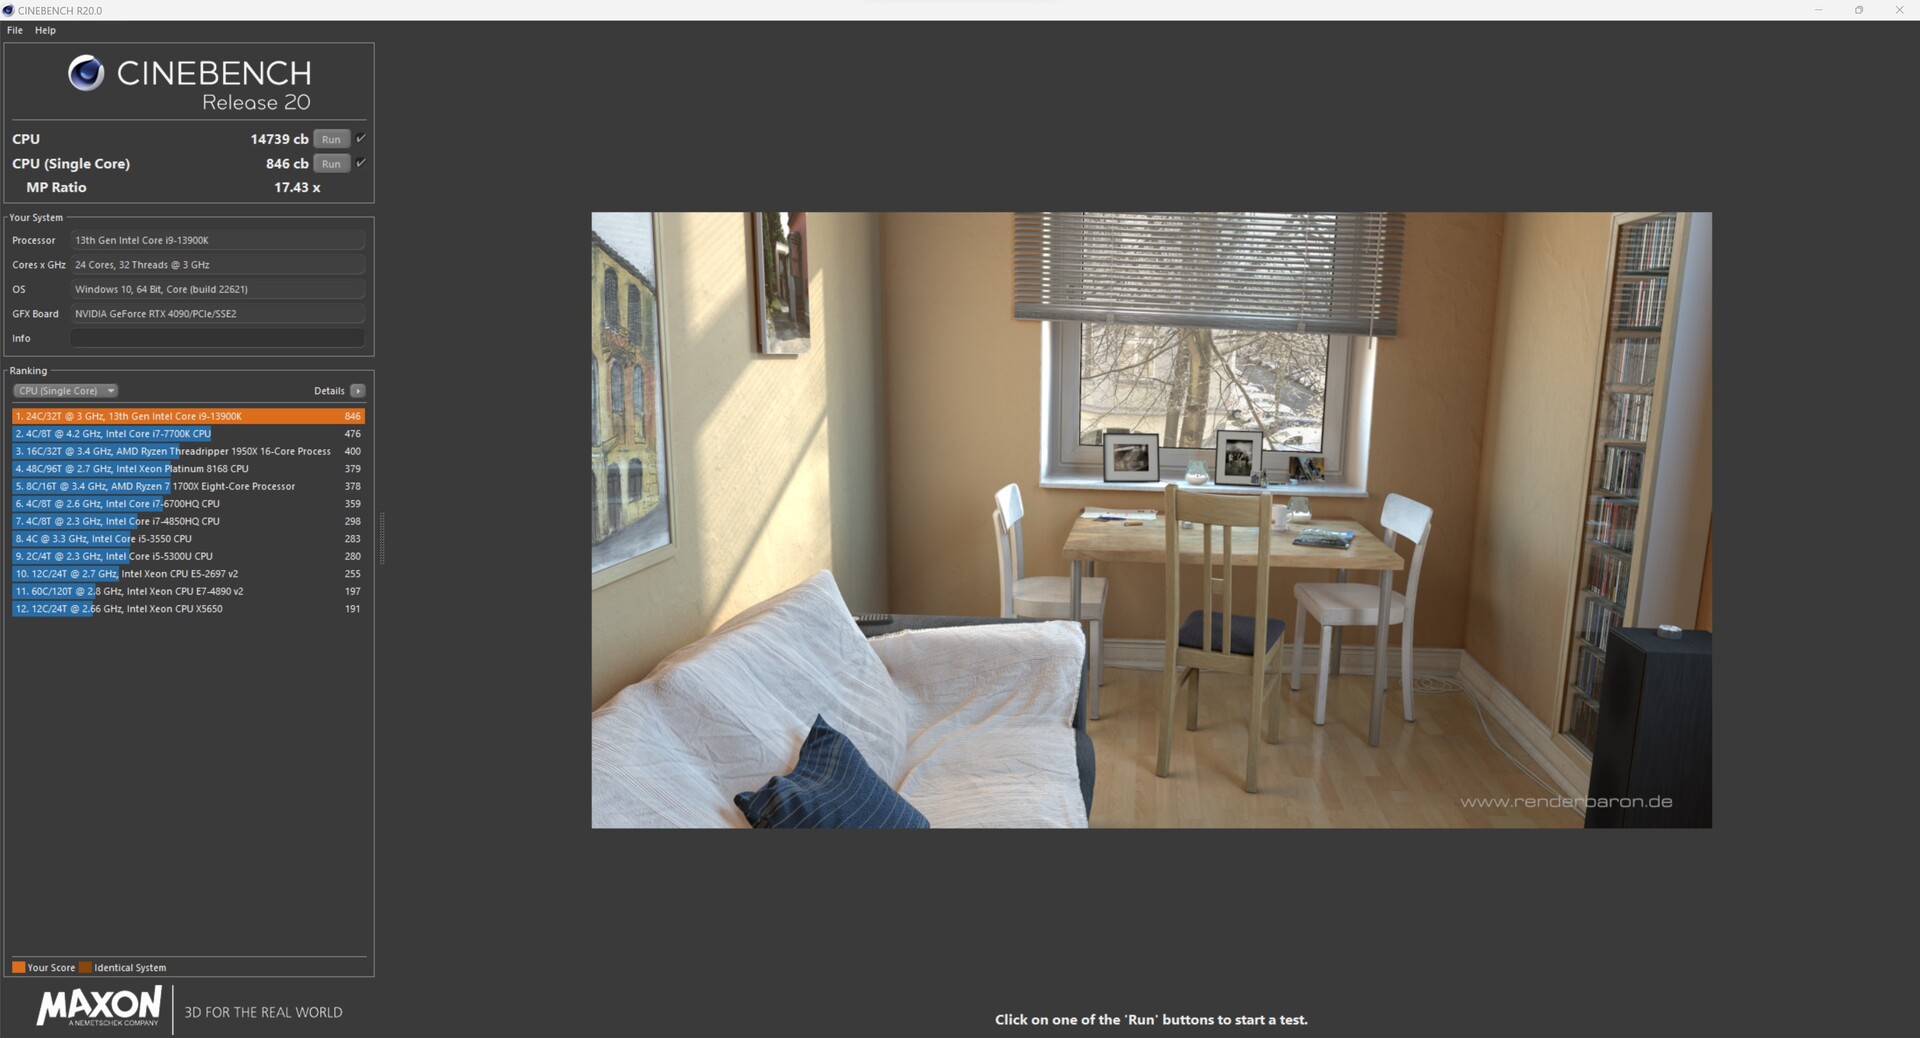
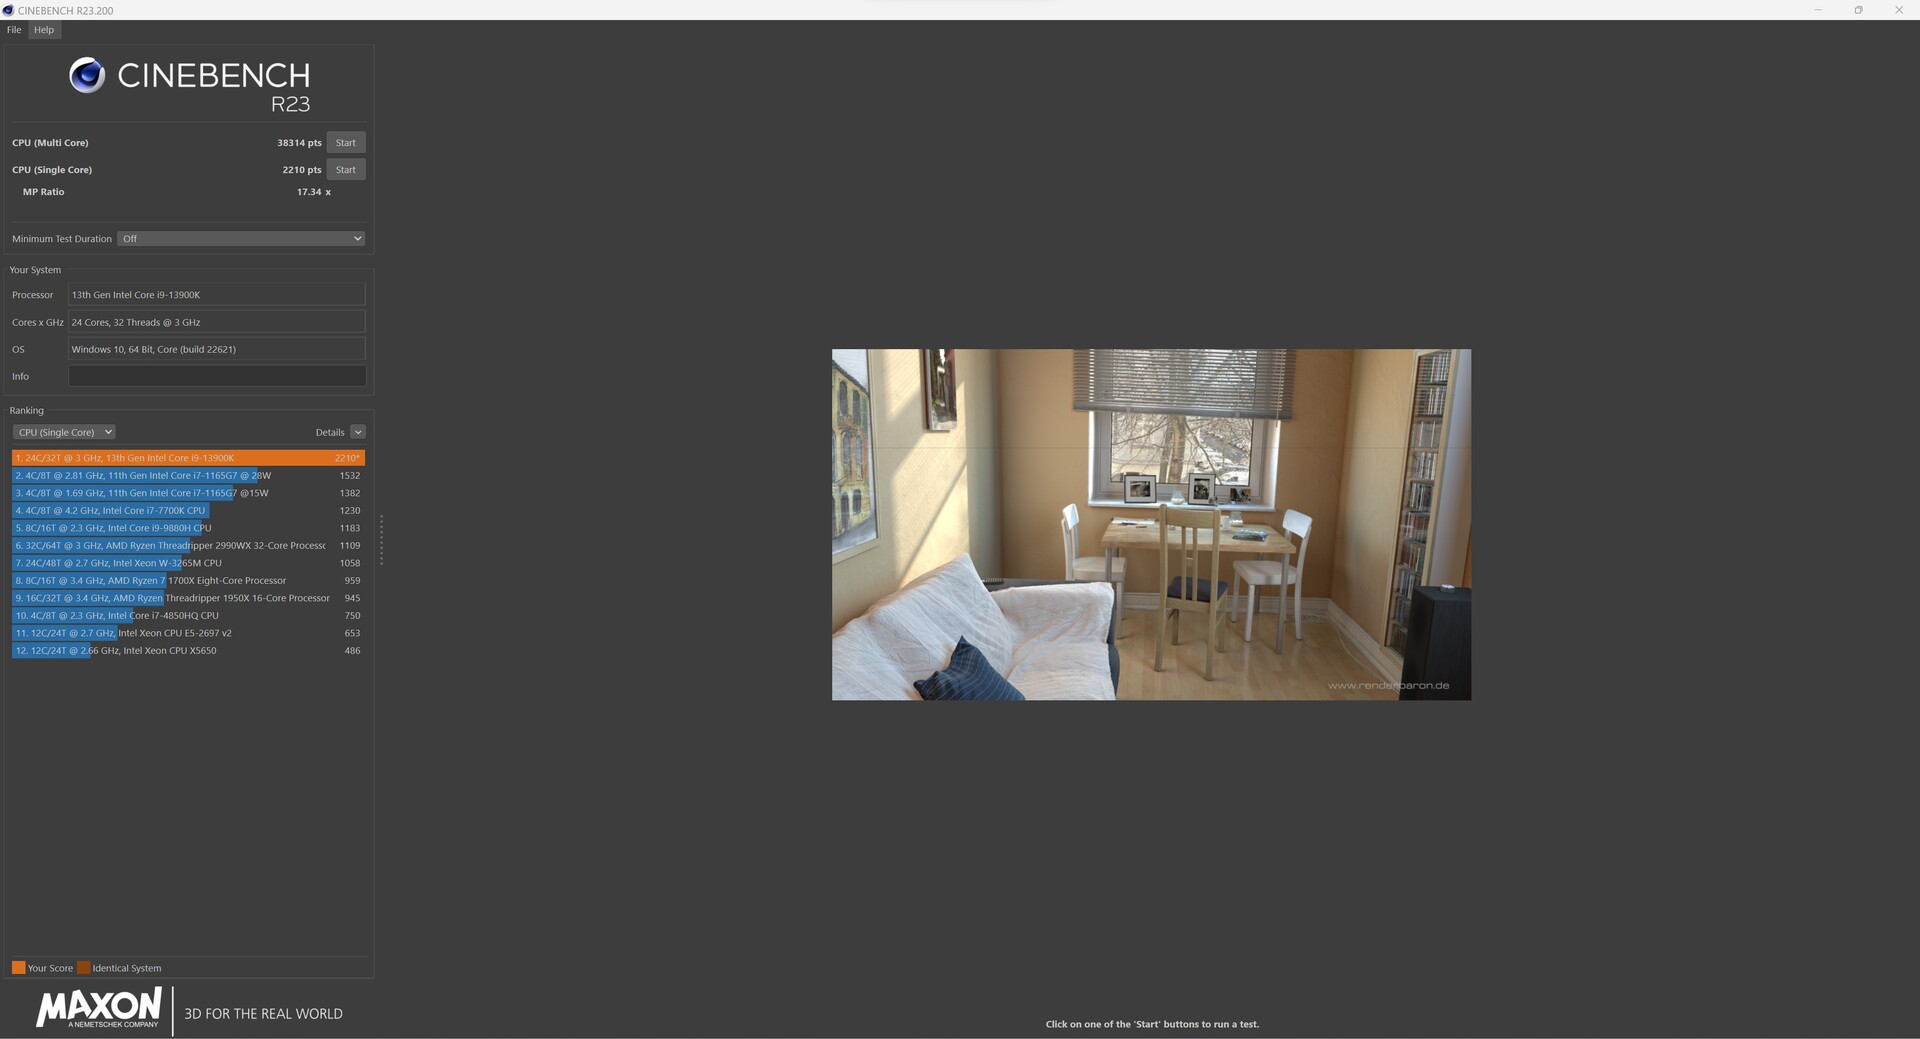
Processor
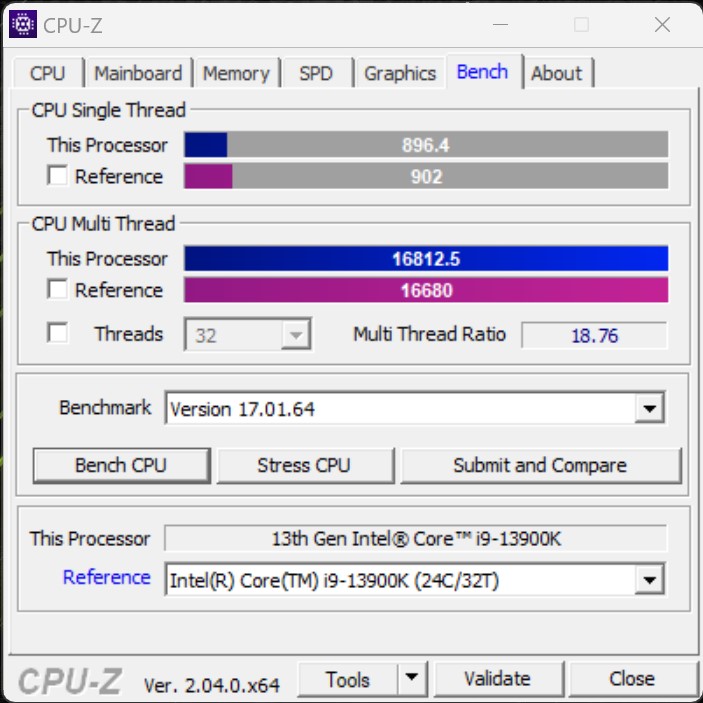
Onze XMG SECTOR Intel wordt aangedreven door een Core i9-13900K, wat Intel's op één na snelste gaming CPU van dit moment is. De resultaten van de review unit zijn zo goed als je zou verwachten. Het is nek aan nek met de andere apparaten in onze vergelijking. Als het aankomt op prestatiebeoordeling, is het verschil tussen de XMG SECTOR en het vergelijkbaar gespecificeerde testsysteem extreem klein met slechts 2% en kan bijna worden toegeschreven aan meettoleranties.
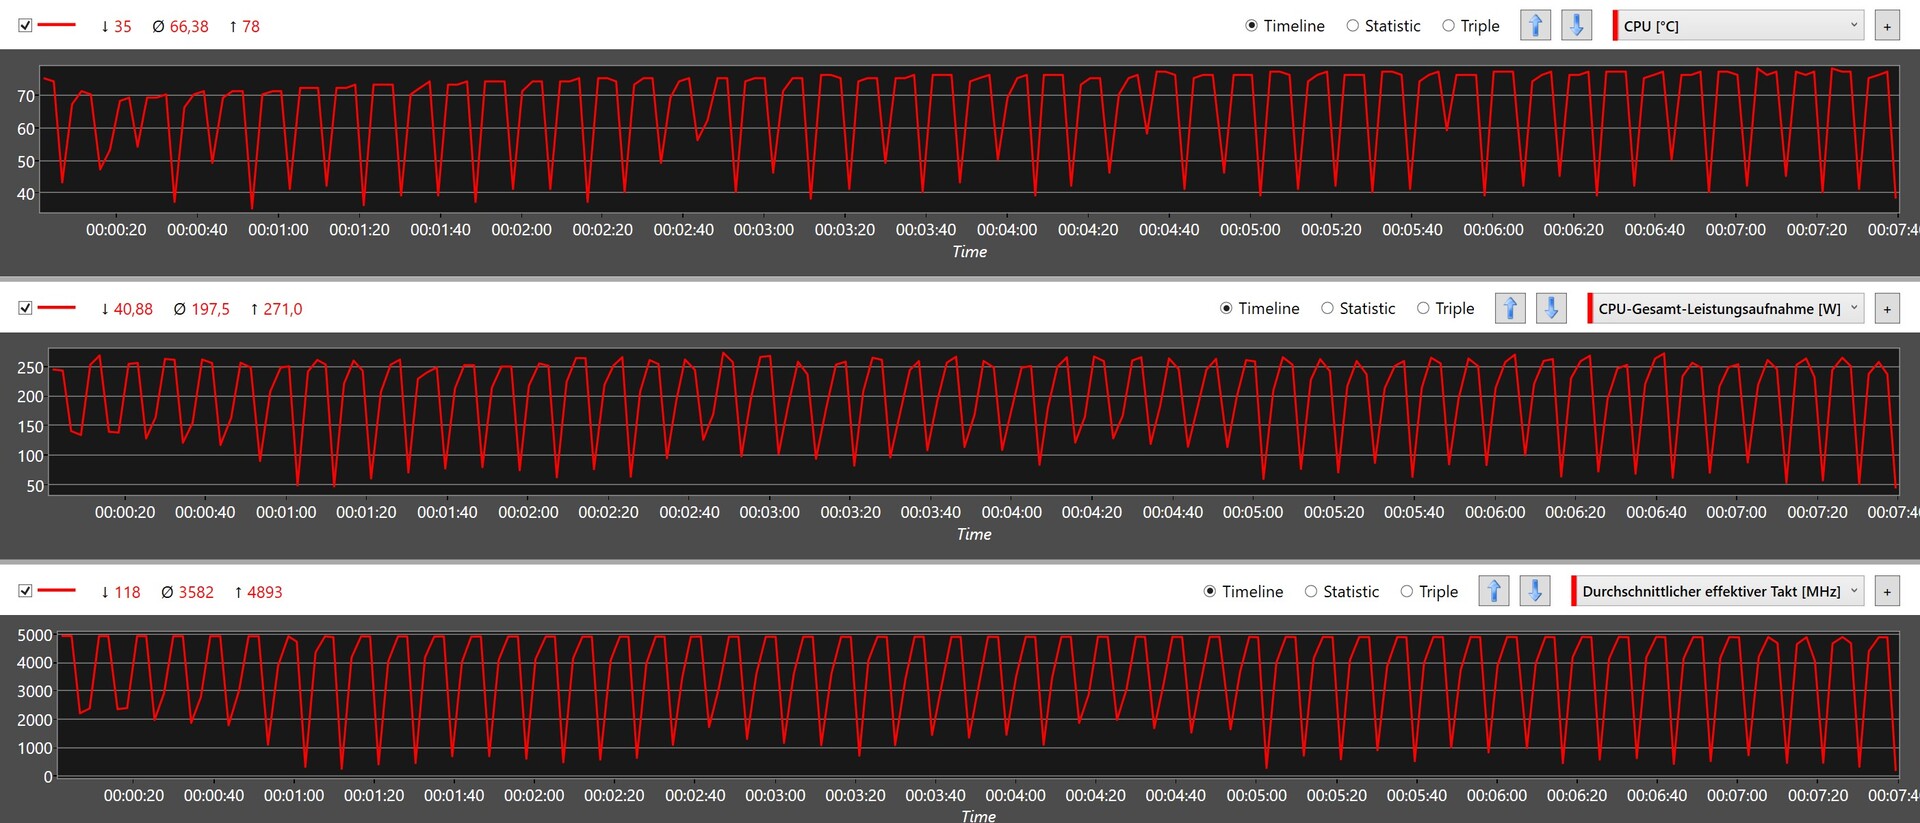
De processor is niet gebonden aan vermogensgrenzen omdat alle beperkingen zijn opgeheven. Bijgevolg worden de prestaties van de CPU beperkt door de temperatuur, die hand in hand gaat met de geïnstalleerde AIO-koeler.
U kunt meer processorbenchmarks vinden op deze pagina.
* ... kleiner is beter
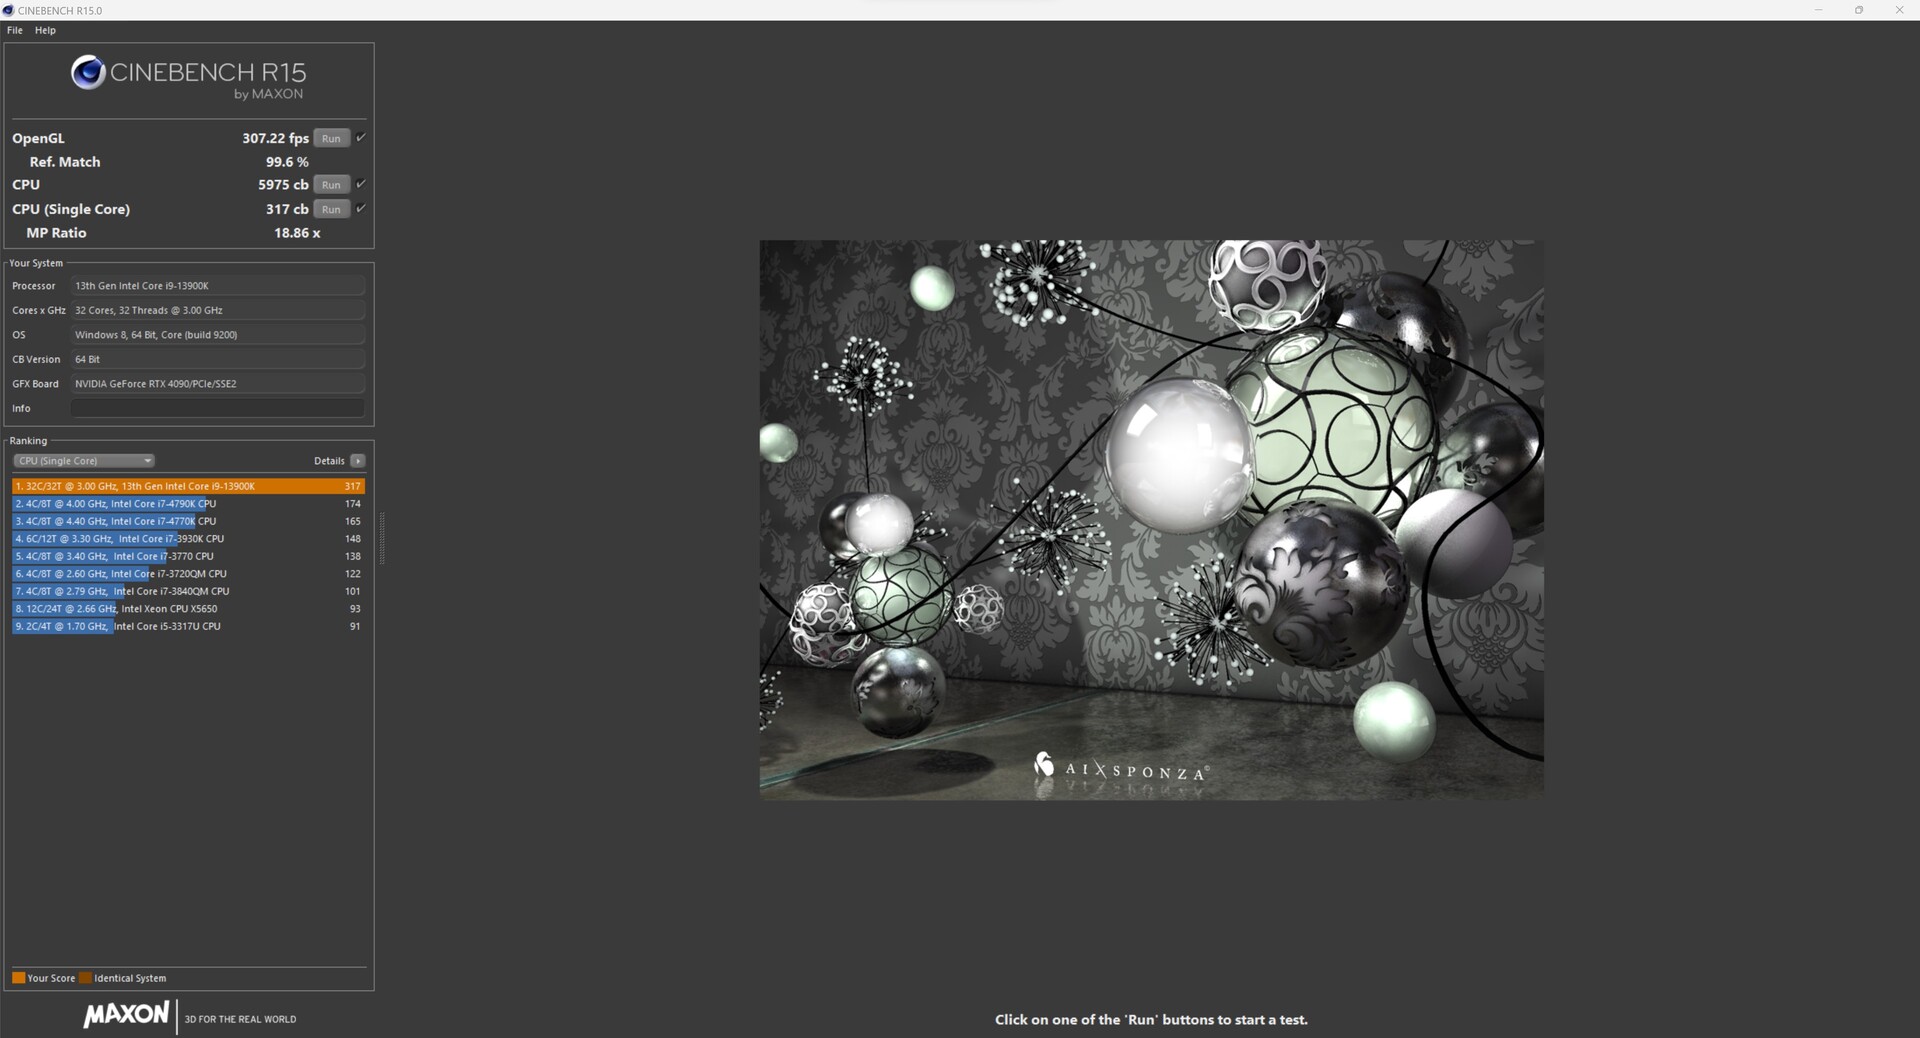
XMG SECTOR Intel in Cinebench R15 Multi loop
Het draaien van Cinebench R15 in een loop gaf ons een eerste blik op hoe efficiënt de koeloplossing in de PC is. Er was geen merkbare prestatiedaling na de eerste paar runs. De XMG SECTOR Intel presteerde erg goed en kreeg een gemiddelde score van 5.917.
Systeemprestaties
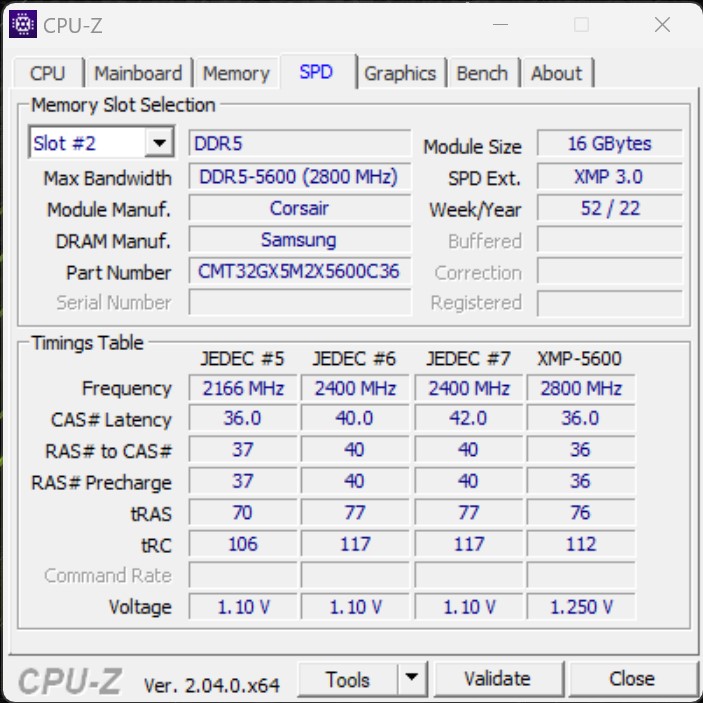
De XMG SECTOR Intel was extreem snel in synthetische benchmarks, en deed daarmee niet onder voor de concurrenten. Bovendien leverde onze review unit uitstekende prestaties in AIDA64 geheugentests en wist hij de toppositie te bemachtigen dankzij zijn snelle geheugen (DDR5-5600) en lage latenties. Gedurende onze tijd met de XMG SECTOR Intel, draaide het consequent zeer snel zonder enige significante latentie.
| Performance rating - Percent | |
| AMD Ryzen 9 7900X | |
| NVIDIA GeForce RTX 3090 Founders Edition | |
| Intel Core i9-13900K | |
| Schenker XMG SECTOR, i9 13900K, RTX 4090 | |
| Intel Core i5-13600K | |
| Intel NUC13 Raptor Canyon | |
| Corsair One i300 | |
| Intel Core i9-12900K | |
| Intel Dragon Canyon NUC - RTX 3060 | |
| Minisforum Neptune Series NAD9 | |
| AIDA64 / Memory Copy | |
| Schenker XMG SECTOR, i9 13900K, RTX 4090 | |
| Intel Core i9-13900K | |
| Gemiddeld Intel Core i9-13900K (68722 - 80203, n=4) | |
| Corsair One i300 | |
| Intel Core i9-12900K | |
| NVIDIA GeForce RTX 3090 Founders Edition | |
| Intel Core i5-13600K | |
| Gemiddelde van klas Desktop (54743 - 98416, n=21, laatste 2 jaar) | |
| AMD Ryzen 9 7900X | |
| Intel NUC13 Raptor Canyon | |
| Minisforum Neptune Series NAD9 | |
| Intel Dragon Canyon NUC - RTX 3060 | |
| AIDA64 / Memory Read | |
| Schenker XMG SECTOR, i9 13900K, RTX 4090 | |
| Intel Core i9-13900K | |
| Gemiddeld Intel Core i9-13900K (73392 - 88780, n=4) | |
| Intel Core i9-12900K | |
| NVIDIA GeForce RTX 3090 Founders Edition | |
| Intel Core i5-13600K | |
| Gemiddelde van klas Desktop (58375 - 110448, n=21, laatste 2 jaar) | |
| AMD Ryzen 9 7900X | |
| Corsair One i300 | |
| Intel NUC13 Raptor Canyon | |
| Intel Dragon Canyon NUC - RTX 3060 | |
| Minisforum Neptune Series NAD9 | |
| AIDA64 / Memory Write | |
| NVIDIA GeForce RTX 3090 Founders Edition | |
| Gemiddelde van klas Desktop (60635 - 93889, n=21, laatste 2 jaar) | |
| Schenker XMG SECTOR, i9 13900K, RTX 4090 | |
| AMD Ryzen 9 7900X | |
| Intel Core i9-13900K | |
| Gemiddeld Intel Core i9-13900K (68948 - 78678, n=4) | |
| Intel Core i9-12900K | |
| Intel Core i5-13600K | |
| Corsair One i300 | |
| Intel NUC13 Raptor Canyon | |
| Minisforum Neptune Series NAD9 | |
| Intel Dragon Canyon NUC - RTX 3060 | |
| AIDA64 / Memory Latency | |
| Minisforum Neptune Series NAD9 | |
| Intel NUC13 Raptor Canyon | |
| Gemiddelde van klas Desktop (68.5 - 168, n=21, laatste 2 jaar) | |
| Intel Dragon Canyon NUC - RTX 3060 | |
| Corsair One i300 | |
| Intel Core i5-13600K | |
| Gemiddeld Intel Core i9-13900K (72.6 - 93.4, n=4) | |
| Intel Core i9-13900K | |
| Schenker XMG SECTOR, i9 13900K, RTX 4090 | |
| AMD Ryzen 9 7900X | |
| NVIDIA GeForce RTX 3090 Founders Edition | |
* ... kleiner is beter
Massa-opslag
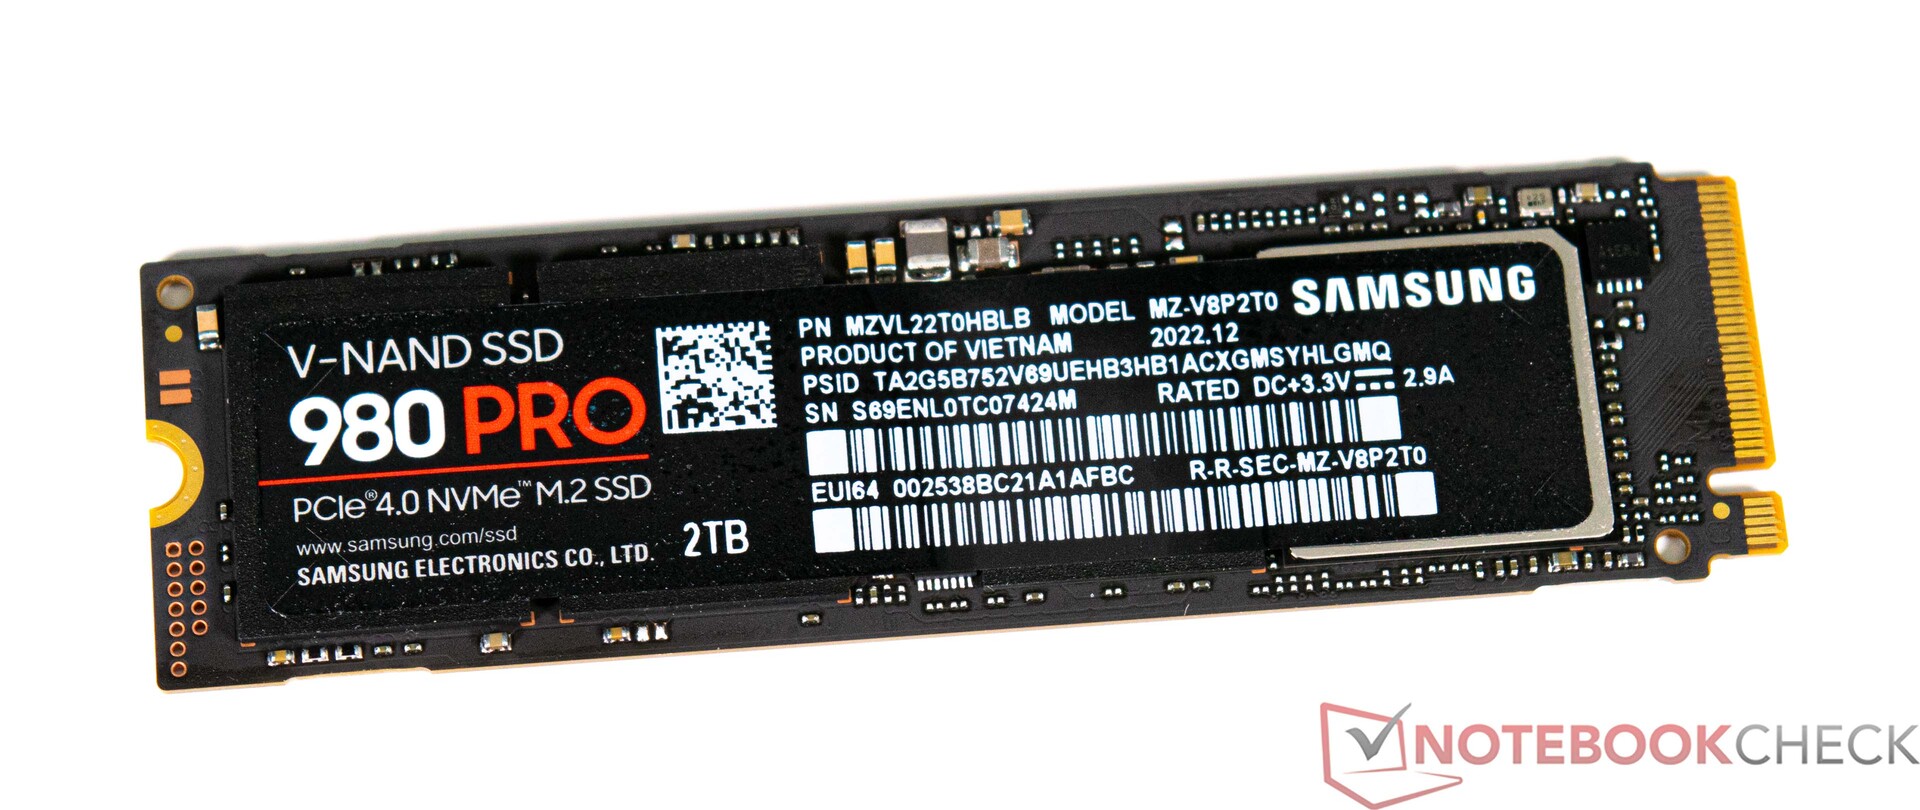
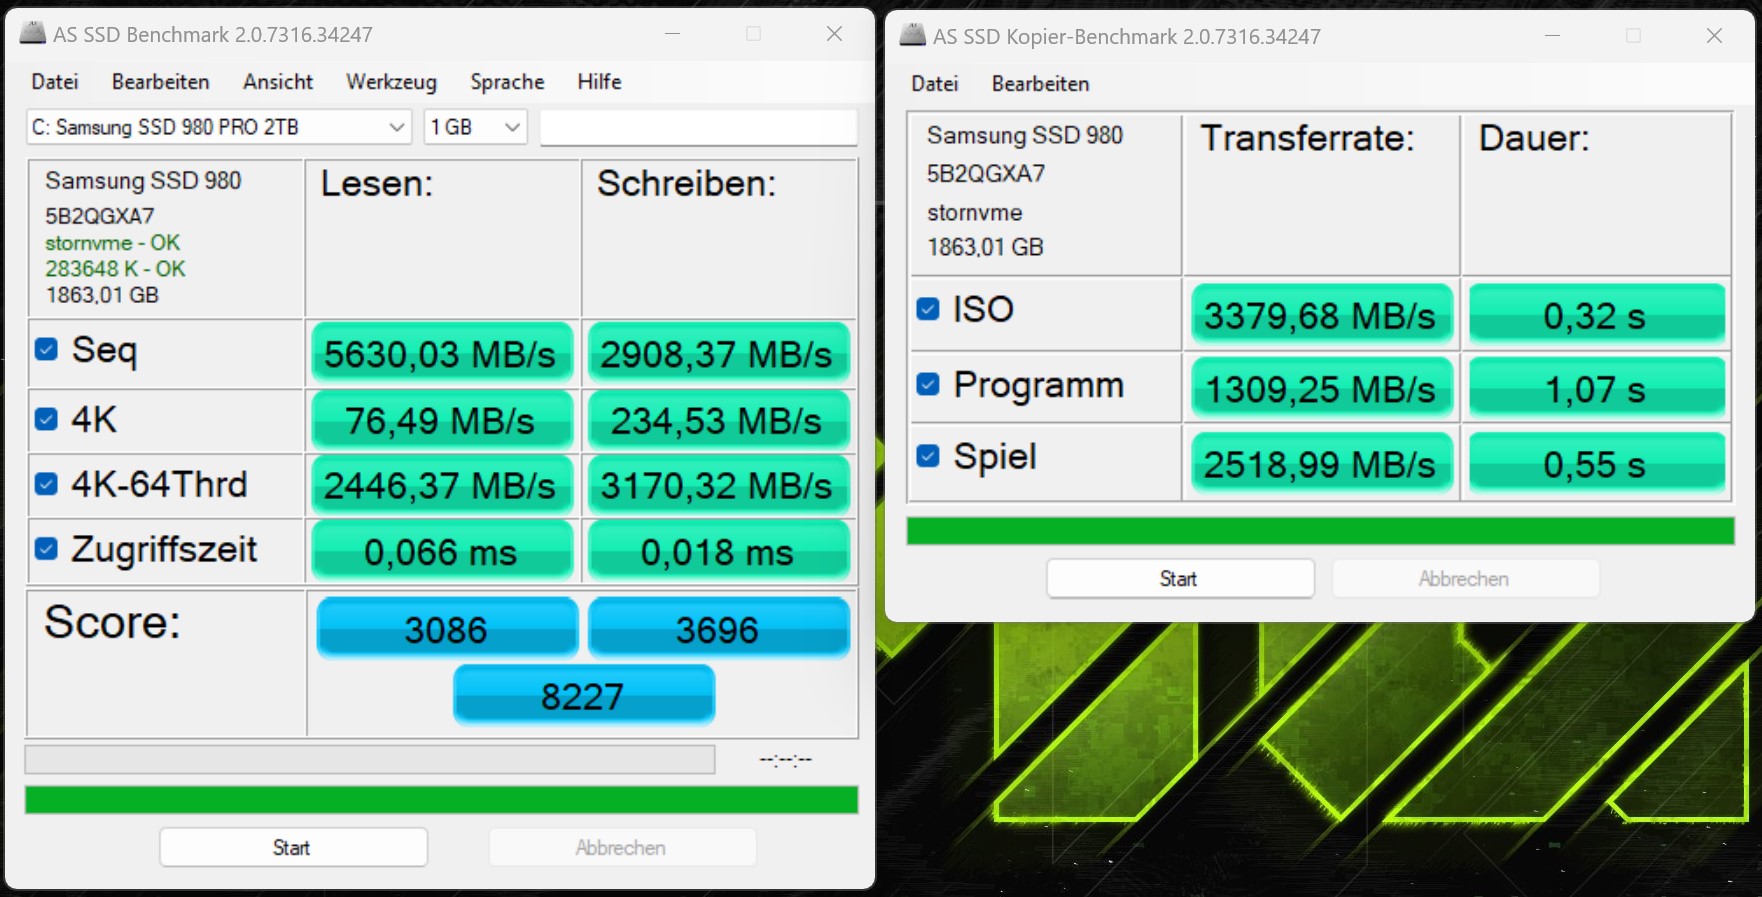
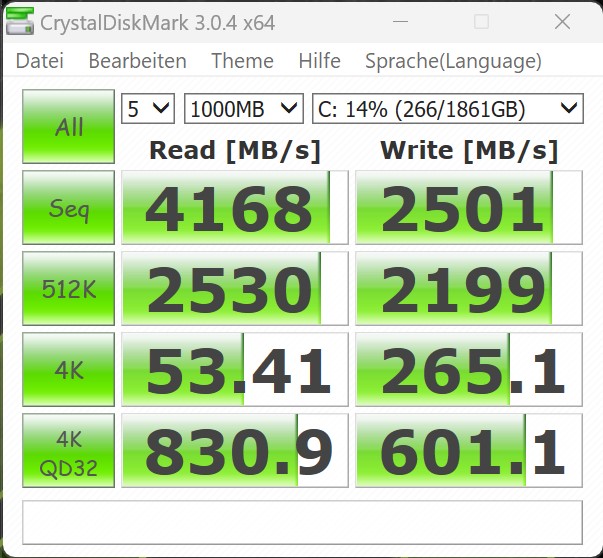
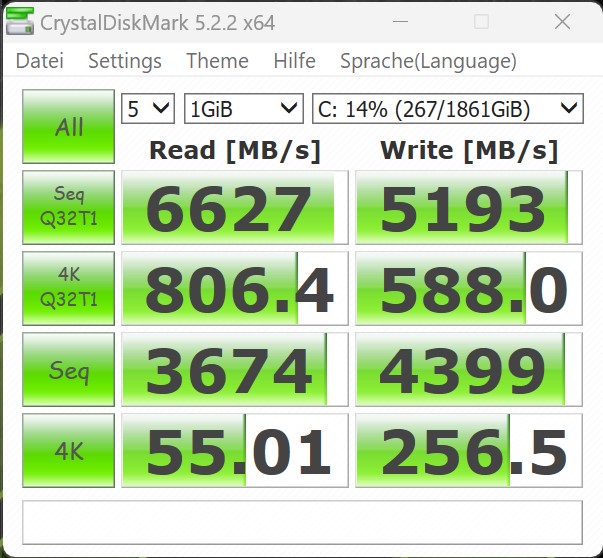
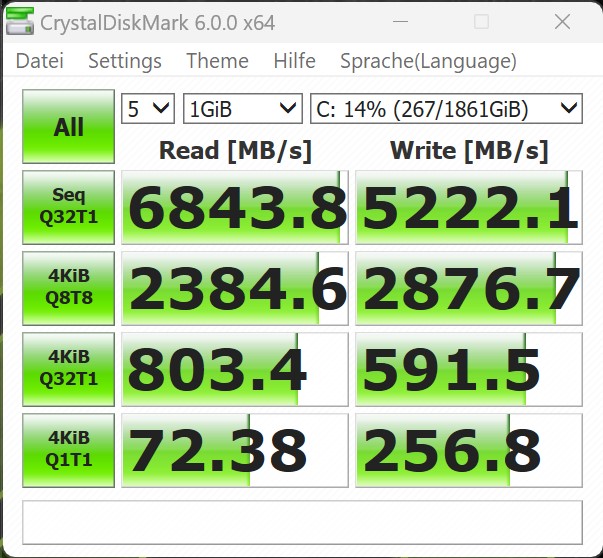
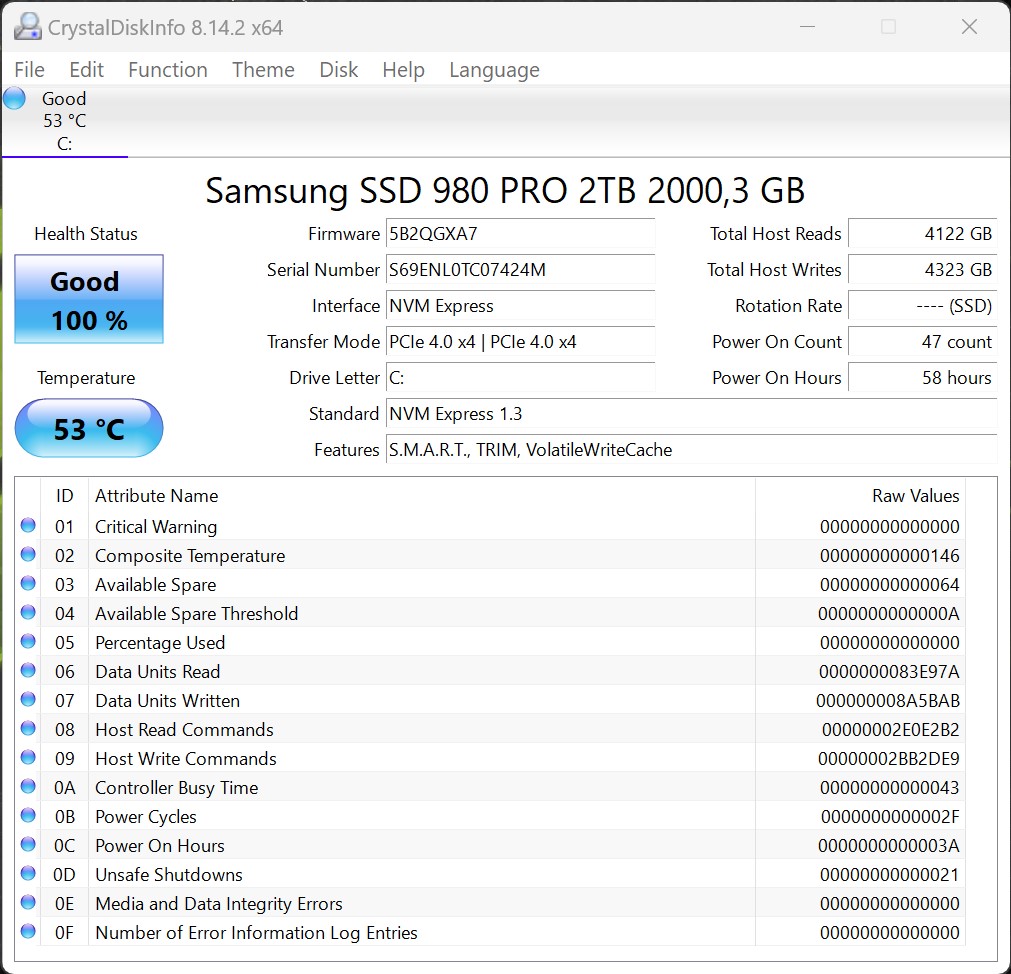
Onze review unit is uitgerust met een supersnelle Samsung NVMe SSD. De Samsung 980 Pro is een van de snelste consumenten SSD's. Dat zien we ook terug in benchmarks: de schijf presteerde bijna consequent beter dan de opslagoplossingen in concurrerende apparaten. Alleen de Kingston Fury Renegade in de Intel NUC13 Raptor Canyon kon de prestaties van de Samsung 980 Pro in de AS-SSD Benchmark overtreffen. Dat gezegd zijnde, is dit genoeg voor de Samsung SSD om als eerste binnen te komen in de algemene beoordeling. Zelfs tijdens de stresstest wist de schijf gedurende een langere periode een hoge leessnelheid te handhaven, wat aangeeft dat de koeling van de SSD zeer effectief is.
Op de Asus ROG Strix Z690-F Gaming kun je tot drie extra M.2 SSD's installeren. Ook is er de mogelijkheid om nog meer opslagschijven aan te sluiten via SATA.
Raadpleeg onze opslagapparaat vergelijkingstabel voor meer informatie en benchmarks.

| Drive Performance rating - Percent | |
| Gemiddelde van klas Desktop | |
| Schenker XMG SECTOR, i9 13900K, RTX 4090 | |
| Corsair One i300 | |
| NVIDIA GeForce RTX 3090 Founders Edition | |
| Intel NUC13 Raptor Canyon | |
| Intel Core i5-13600K | |
| Intel Core i9-13900K | |
| Minisforum Neptune Series NAD9 | |
| Intel Core i9-12900K -11! | |
| Intel Dragon Canyon NUC - RTX 3060 -11! | |
* ... kleiner is beter
Sustained Read: DiskSpd Read Loop, Queue Depth 8
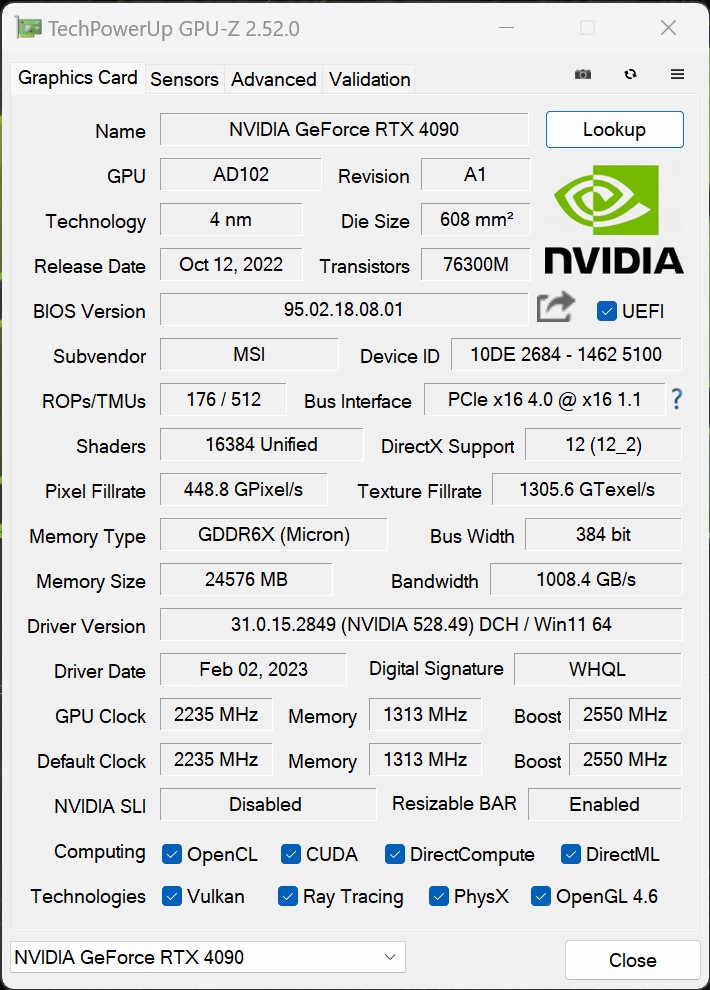
Grafische kaart - Geen compromis met de GeForce RTX 4090
Synthetische benchmarks
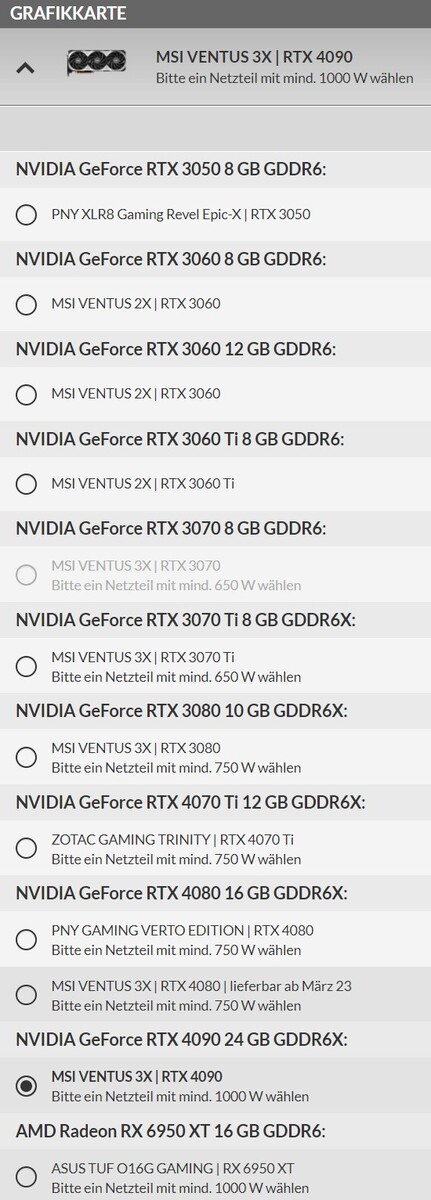
Ons voorbeeld is uitgerust met de snelste grafische kaart voor consumenten van dit moment - de Nvidia GeForce RTX 4090. De GPU leverde immens hoge prestaties in al onze synthetische tests, wat zeer in lijn is met onze verwachtingen. In combinatie met de Core i9-13900Klandde de review unit op de tweede plaats in de 3DMark rating. De eerste plaats werd opgeëist door een andereGeForce RTX 4090, dit keer een model van KFA2. Niettemin kan de MSI GeForce RTX 4090 VENTUS 3X zich goed staande houden tegenover de KFA2-kaart. Het MSI model neemt een grote hoeveelheid ruimte in beslag in de XMG SECTOR Intel. MSI heeft echter besloten de kaart geen fancy verlichtingseffecten mee te geven. Het vlaggenschip Nvidia GPU heeft een aanzienlijke voorsprong op high-end AMD grafische kaarten. De configurator laat je kiezen uit een breed scala aan Nvidia 30 en 40 Series grafische kaarten. Als je absoluut een AMD-kaart in je systeem wilt, is je enige optie hier een Radeon RX 6950 XT. AMD's 7000 Series kaarten zijn momenteel niet beschikbaar voor selectie.
Ga naar deze pagina voor meer technische informatie over de Nvidia GeForce RTX 4090.
Bezoek onze GPU vergelijkingstabel voor meer informatie en benchmarkresultaten.
Compute benchmarks and professional applications
| 3DMark 05 Standard | 68661 punten | |
| 3DMark 06 Standard Score | 70557 punten | |
| 3DMark Vantage P Result | 133759 punten | |
| 3DMark 11 Performance | 62922 punten | |
| 3DMark Ice Storm Standard Score | 257615 punten | |
| 3DMark Cloud Gate Standard Score | 85474 punten | |
| 3DMark Fire Strike Score | 45450 punten | |
| 3DMark Fire Strike Extreme Score | 37831 punten | |
| 3DMark Time Spy Score | 32024 punten | |
Help | ||
Spelprestaties
De geweldige resultaten in de synthetische benchmarks worden versterkt door de uitstekende gaming prestaties van de XMG SECTOR Intel. Onnodig te zeggen dat de GeForce RTX 4090 hierin een cruciale rol speelt. Maar je hebt ook een extreem snelle CPU nodig om de kracht van de snelste Nvidia GPU effectief aan te boren. Ook raden we aan om games meestal op 2160p en maximale instellingen te spelen, zodat je in de eerste plaats kunt profiteren van de prestaties van de grafische kaart. Wie alleen op 1080p gamen kan gewoon voor een RTX 4070 Ti gaan en zichzelf een flink bedrag besparen.
Speciale RTX-functies zoals DLSS 3.0 en frame generation (FG) zijn momenteel exclusief voor de RTX 40-serie kaarten. Dit betekent dat als je van deze nieuwe functies wilt genieten, je geen andere keuze hebt dan een RTX 40 Series GPU te halen. De XMG SECTOR Intel is in staat om alle geteste games soepel te draaien op 2160p en maximale instellingen. Bovendien kunnen degenen die ray tracing willen inschakelen de functie meestal zonder beperkingen gebruiken. Maar sommige games, zoals Cyberpunk 2077, kunnen zelfs een high-end rig als de XMG SECTOR op de knieën krijgen. Het inschakelen van DLSS zal de PC helpen deze games weer soepel te draaien op 2160p. AMD van zijn kant biedt een soortgelijke functie in de vorm van FSR. Uiteindelijk is het aan de spelontwikkelaars om deze functies te implementeren. U kunt deze pagina bezoeken voor een lijst van games die DLSS 3.0 al ondersteunen of dat in de toekomst zullen doen.
| Metro Exodus - 1920x1080 Ultra Quality DXR AF:16x | |
| NVIDIA GeForce RTX 4090 | |
| AMD Radeon RX 7900 XTX | |
| NVIDIA GeForce RTX 4080 | |
| NVIDIA GeForce RTX 4090 | |
| AMD Radeon RX 7900 XT | |
| NVIDIA GeForce RTX 3080 Ti | |
| NVIDIA GeForce RTX 3090 | |
| Far Cry 6 - 1920x1080 Ultra Graphics Quality + HD Textures + DXR AA:T | |
| NVIDIA GeForce RTX 4080 | |
| AMD Radeon RX 7900 XTX | |
| AMD Radeon RX 7900 XT | |
| NVIDIA GeForce RTX 4090 | |
| NVIDIA GeForce RTX 4090 | |
| NVIDIA GeForce RTX 3080 Ti | |
| NVIDIA GeForce RTX 3090 | |
| AMD Radeon RX 6800 | |
| AMD Radeon RX 6950 XT | |
| Cyberpunk 2077 1.6 | |
| 3840x2160 Ray Tracing Ultra Preset (DLSS off) | |
| NVIDIA GeForce RTX 4090 | |
| NVIDIA GeForce RTX 4090 (1.6) | |
| NVIDIA GeForce RTX 4080 (1.6) | |
| NVIDIA GeForce RTX 3090 (1.6) | |
| AMD Radeon RX 7900 XTX (1.61) | |
| NVIDIA GeForce RTX 3080 Ti (1.61) | |
| AMD Radeon RX 7900 XT (1.61) | |
| AMD Radeon RX 6800 (1.61) | |
| 1920x1080 Ray Tracing Ultra Preset (DLSS off) | |
| NVIDIA GeForce RTX 4090 | |
| NVIDIA GeForce RTX 4090 (1.6) | |
| NVIDIA GeForce RTX 4080 (1.6) | |
| NVIDIA GeForce RTX 3080 Ti (1.61) | |
| NVIDIA GeForce RTX 3090 (1.6) | |
| AMD Radeon RX 7900 XTX (1.61) | |
| AMD Radeon RX 7900 XT (1.61) | |
| AMD Radeon RX 6800 (1.61) | |
| Control - 1920x1080 High Quality Preset & High Ray Tracing Preset (DX12) | |
| NVIDIA GeForce RTX 4090 | |
| NVIDIA GeForce RTX 4080 | |
| NVIDIA GeForce RTX 4090 | |
| AMD Radeon RX 7900 XTX | |
| NVIDIA GeForce RTX 3080 Ti | |
| AMD Radeon RX 7900 XT | |
| AMD Radeon RX 6950 XT | |
| Ghostwire Tokyo - 1920x1080 Highest Settings + Maximum Ray Tracing | |
| NVIDIA GeForce RTX 4090 | |
| NVIDIA GeForce RTX 4090 | |
| NVIDIA GeForce RTX 4080 | |
| AMD Radeon RX 7900 XTX | |
| NVIDIA GeForce RTX 3080 Ti | |
| AMD Radeon RX 7900 XT | |
| Guardians of the Galaxy - 1920x1080 Ultra Preset + Ultra Ray-Tracing | |
| NVIDIA GeForce RTX 4090 | |
| AMD Radeon RX 7900 XTX | |
| AMD Radeon RX 7900 XT | |
| The Callisto Protocol - 1920x1080 Ultra Preset (without FSR Upscaling) + Full Ray-Tracing | |
| AMD Radeon RX 7900 XTX | |
| NVIDIA GeForce RTX 4090 | |
| NVIDIA GeForce RTX 4090 | |
| AMD Radeon RX 7900 XT | |
| NVIDIA GeForce RTX 3080 Ti | |
| AMD Radeon RX 6800 | |
| lage | gem. | hoge | ultra | QHD | 4K DLSS | 4K | |
|---|---|---|---|---|---|---|---|
| GTA V (2015) | 187.6 | 187.6 | 187 | 165.9 | 166.3 | 187.5 | |
| The Witcher 3 (2015) | 731.4 | 664.6 | 613.4 | 314.1 | 282 | ||
| Dota 2 Reborn (2015) | 287.9 | 258.5 | 256.3 | 219.7 | 226.8 | ||
| Final Fantasy XV Benchmark (2018) | 234 | 232 | 227 | 224 | 155.7 | ||
| X-Plane 11.11 (2018) | 237 | 209 | 160.6 | 139.3 | |||
| Far Cry 5 (2018) | 240 | 208 | 201 | 187 | 187 | 173 | |
| Strange Brigade (2018) | 627 | 506 | 506 | 506 | 488 | 281 | |
| Shadow of the Tomb Raider (2018) | 300 | 288 | 285 | 282 | 269 | 186 | |
| Far Cry New Dawn (2019) | 206 | 188 | 180 | 161 | 164 | 152 | |
| Metro Exodus (2019) | 260 | 235 | 191.9 | 177.3 | 165 | 136.3 | |
| Control (2019) | 233 | 233 | 233 | 232 | 114.4 | ||
| Borderlands 3 (2019) | 243 | 213 | 197.3 | 182.9 | 182.5 | 132.9 | |
| F1 2020 (2020) | 521 | 445 | 431 | 395 | 386 | 282 | |
| F1 2021 (2021) | 632 | 585 | 501 | 277 | 267 | 196.6 | |
| Far Cry 6 (2021) | 213 | 187.4 | 168.7 | 166.8 | 163.8 | 133.4 | |
| Guardians of the Galaxy (2021) | 220 | 220 | 219 | 216 | 215 | 214 | |
| Forza Horizon 5 (2021) | 285 | 245 | 244 | 187 | 178 | 148 | |
| God of War (2022) | 263 | 263 | 255 | 203 | 173.4 | 125.1 | |
| GRID Legends (2022) | 311 | 286 | 258 | 248 | 242 | 191.4 | |
| Cyberpunk 2077 1.6 (2022) | 195 | 185 | 182 | 181 | 167 | 80 | |
| Ghostwire Tokyo (2022) | 278 | 275 | 273 | 272 | 266 | 174.7 | |
| Tiny Tina's Wonderlands (2022) | 413 | 355 | 309 | 280 | 224 | 128.4 | |
| F1 22 (2022) | 415 | 377 | 364 | 195.4 | 149.7 | 81.1 | |
| A Plague Tale Requiem (2022) | 188.6 | 175.4 | 158.5 | 147.8 | 104.6 | 193.6 | 74.7 |
| Uncharted Legacy of Thieves Collection (2022) | 139.5 | 138.1 | 137.1 | 136.6 | 134.9 | 99.1 | |
| Call of Duty Modern Warfare 2 2022 (2022) | 248 | 247 | 232 | 230 | 187 | 215 | 128 |
| Spider-Man Miles Morales (2022) | 169.9 | 163.3 | 150.9 | 149.3 | 127.4 | 126.8 | |
| The Callisto Protocol (2022) | 234.8 | 224 | 204.9 | 203.8 | 184.8 | 124.9 | |
| The Witcher 3 v4 (2023) | 304 | 271 | 218 | 198.8 | 154.1 | 199.7 |
Emissies
Geluidsemissies
Volgens onze metingen is het systeem relatief stil in ruststand en produceert het slechts 32 dB(A) geluid. Onder een gemiddelde belasting is de computer hoorbaar maar nog steeds stil omdat de grafische kaart nog steeds passief gekoeld kan worden. De kastventilatoren en de drie GPU-ventilatoren draaien alleen als het systeem zwaar wordt belast. Onze geluidsmeter mat een piekgeluidsniveau van 40,6 dB(A) tijdens de stresstest.
Geluidsniveau
| Onbelast |
| 32 / 32.1 / 32.3 dB (A) |
| Belasting |
| 32.4 / 40.6 dB (A) |
 | ||
30 dB stil 40 dB(A) hoorbaar 50 dB(A) luid |
||
min: | ||
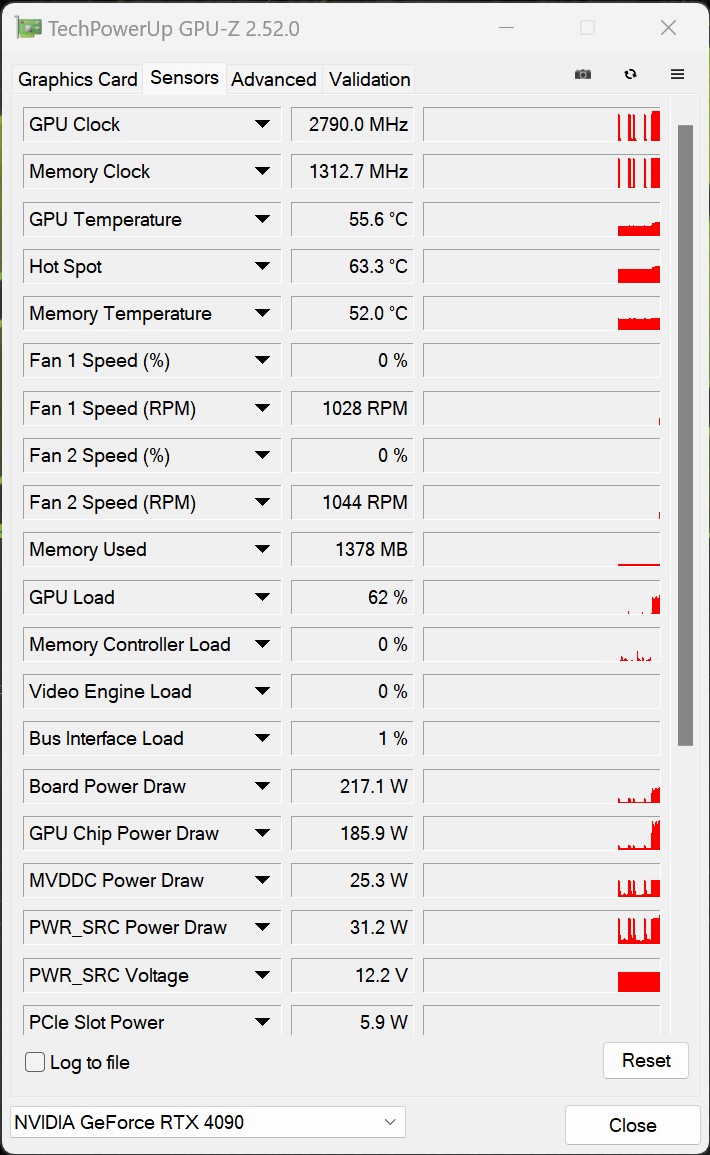
Temperatuur
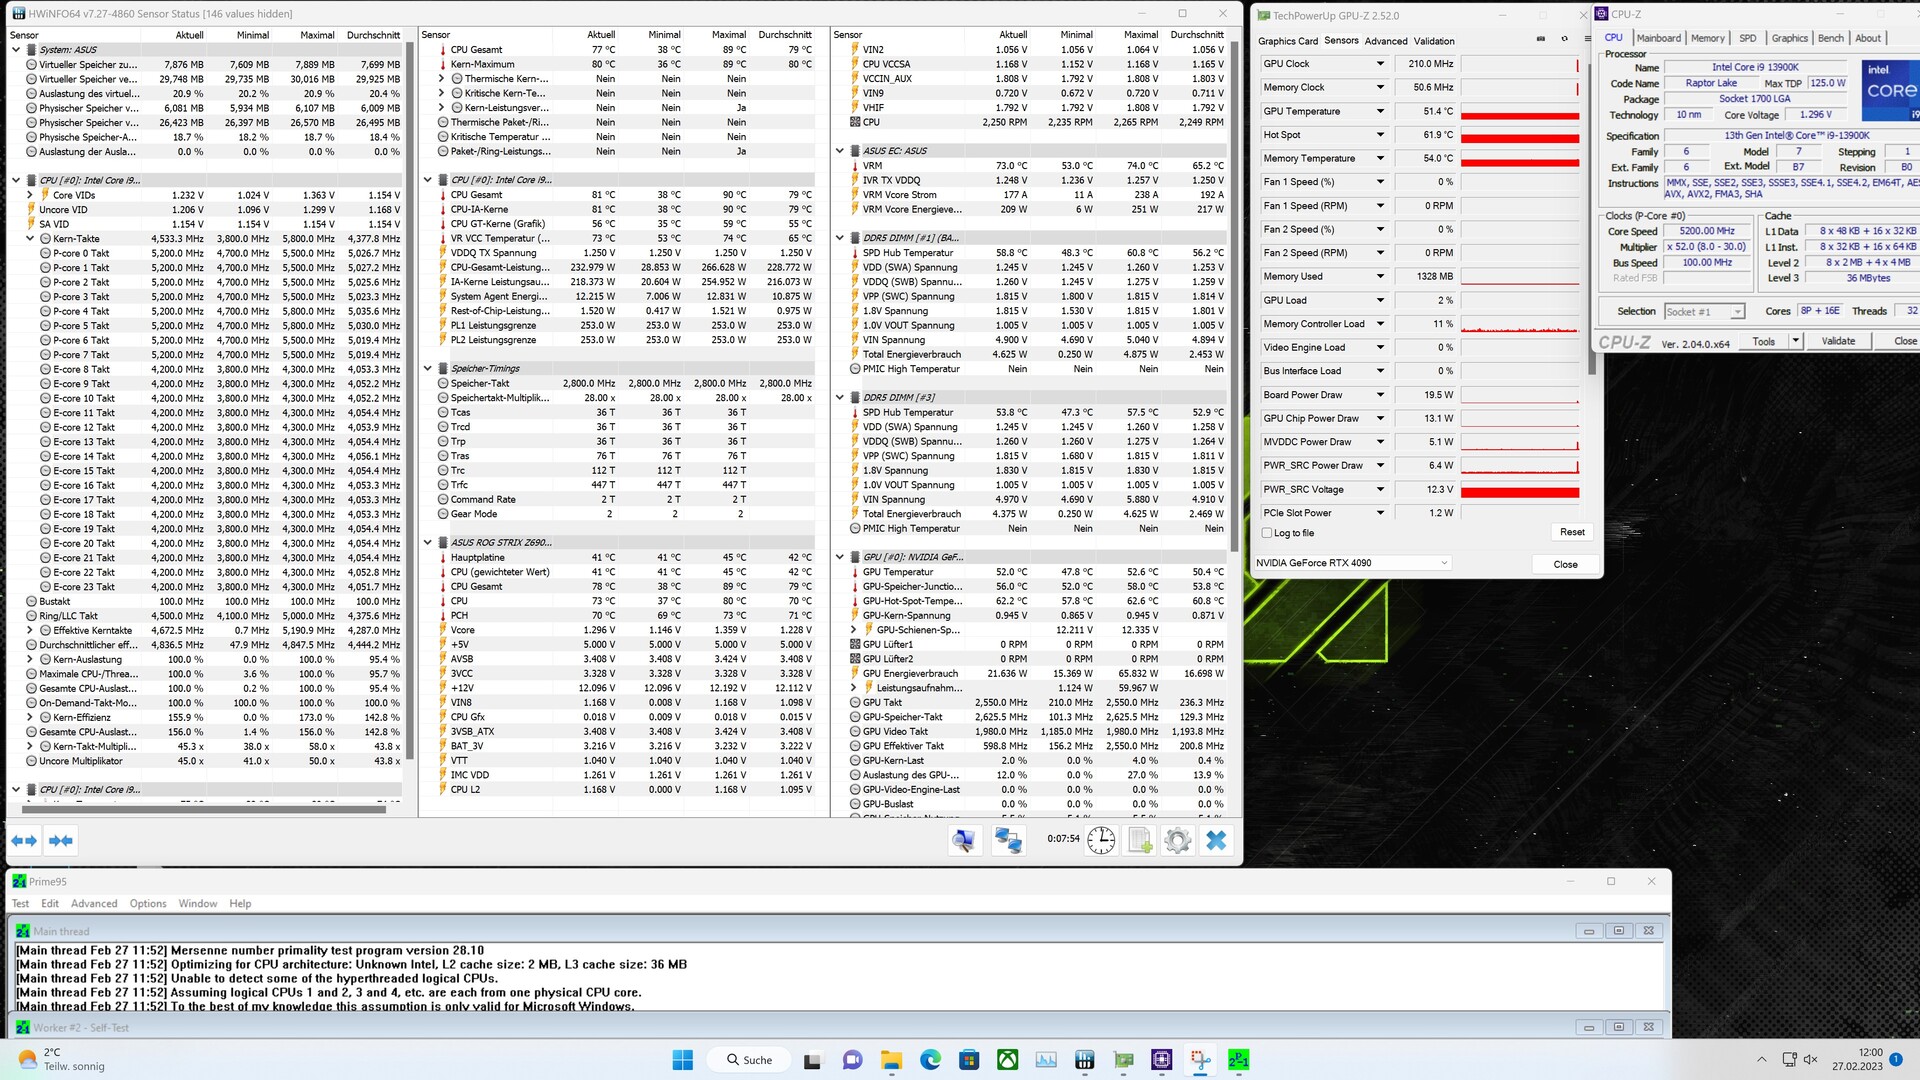
De XMG SECTOR Intel is ontworpen om koele lucht aan de voorkant aan te zuigen en warme lucht aan de bovenkant en achterkant uit de kast te leiden. Maar het systeem gebruikt slechts één ventilator om warme lucht uit de kast te verwijderen. Er zijn geen ventilatoren geïnstalleerd aan de bovenkant. Toch maakt de Corsair 4000D Airflow gebruik van drie inlaatventilatoren om een positieve druk te creëren zodat warme lucht uit de kast kan worden geduwd. De 360 mm radiator van de AIO-koeler is vlak achter het frontpaneel gemonteerd om de processor optimaal te koelen. In de stresstest zagen we de CPU oplopen tot 90°C (195°F) met een gemiddeld stroomverbruik van 228 watt, terwijl de GPU-temperaturen bijna 75°C (167°F) bereikten, wat volledig veilig is.
Stroomverbruik
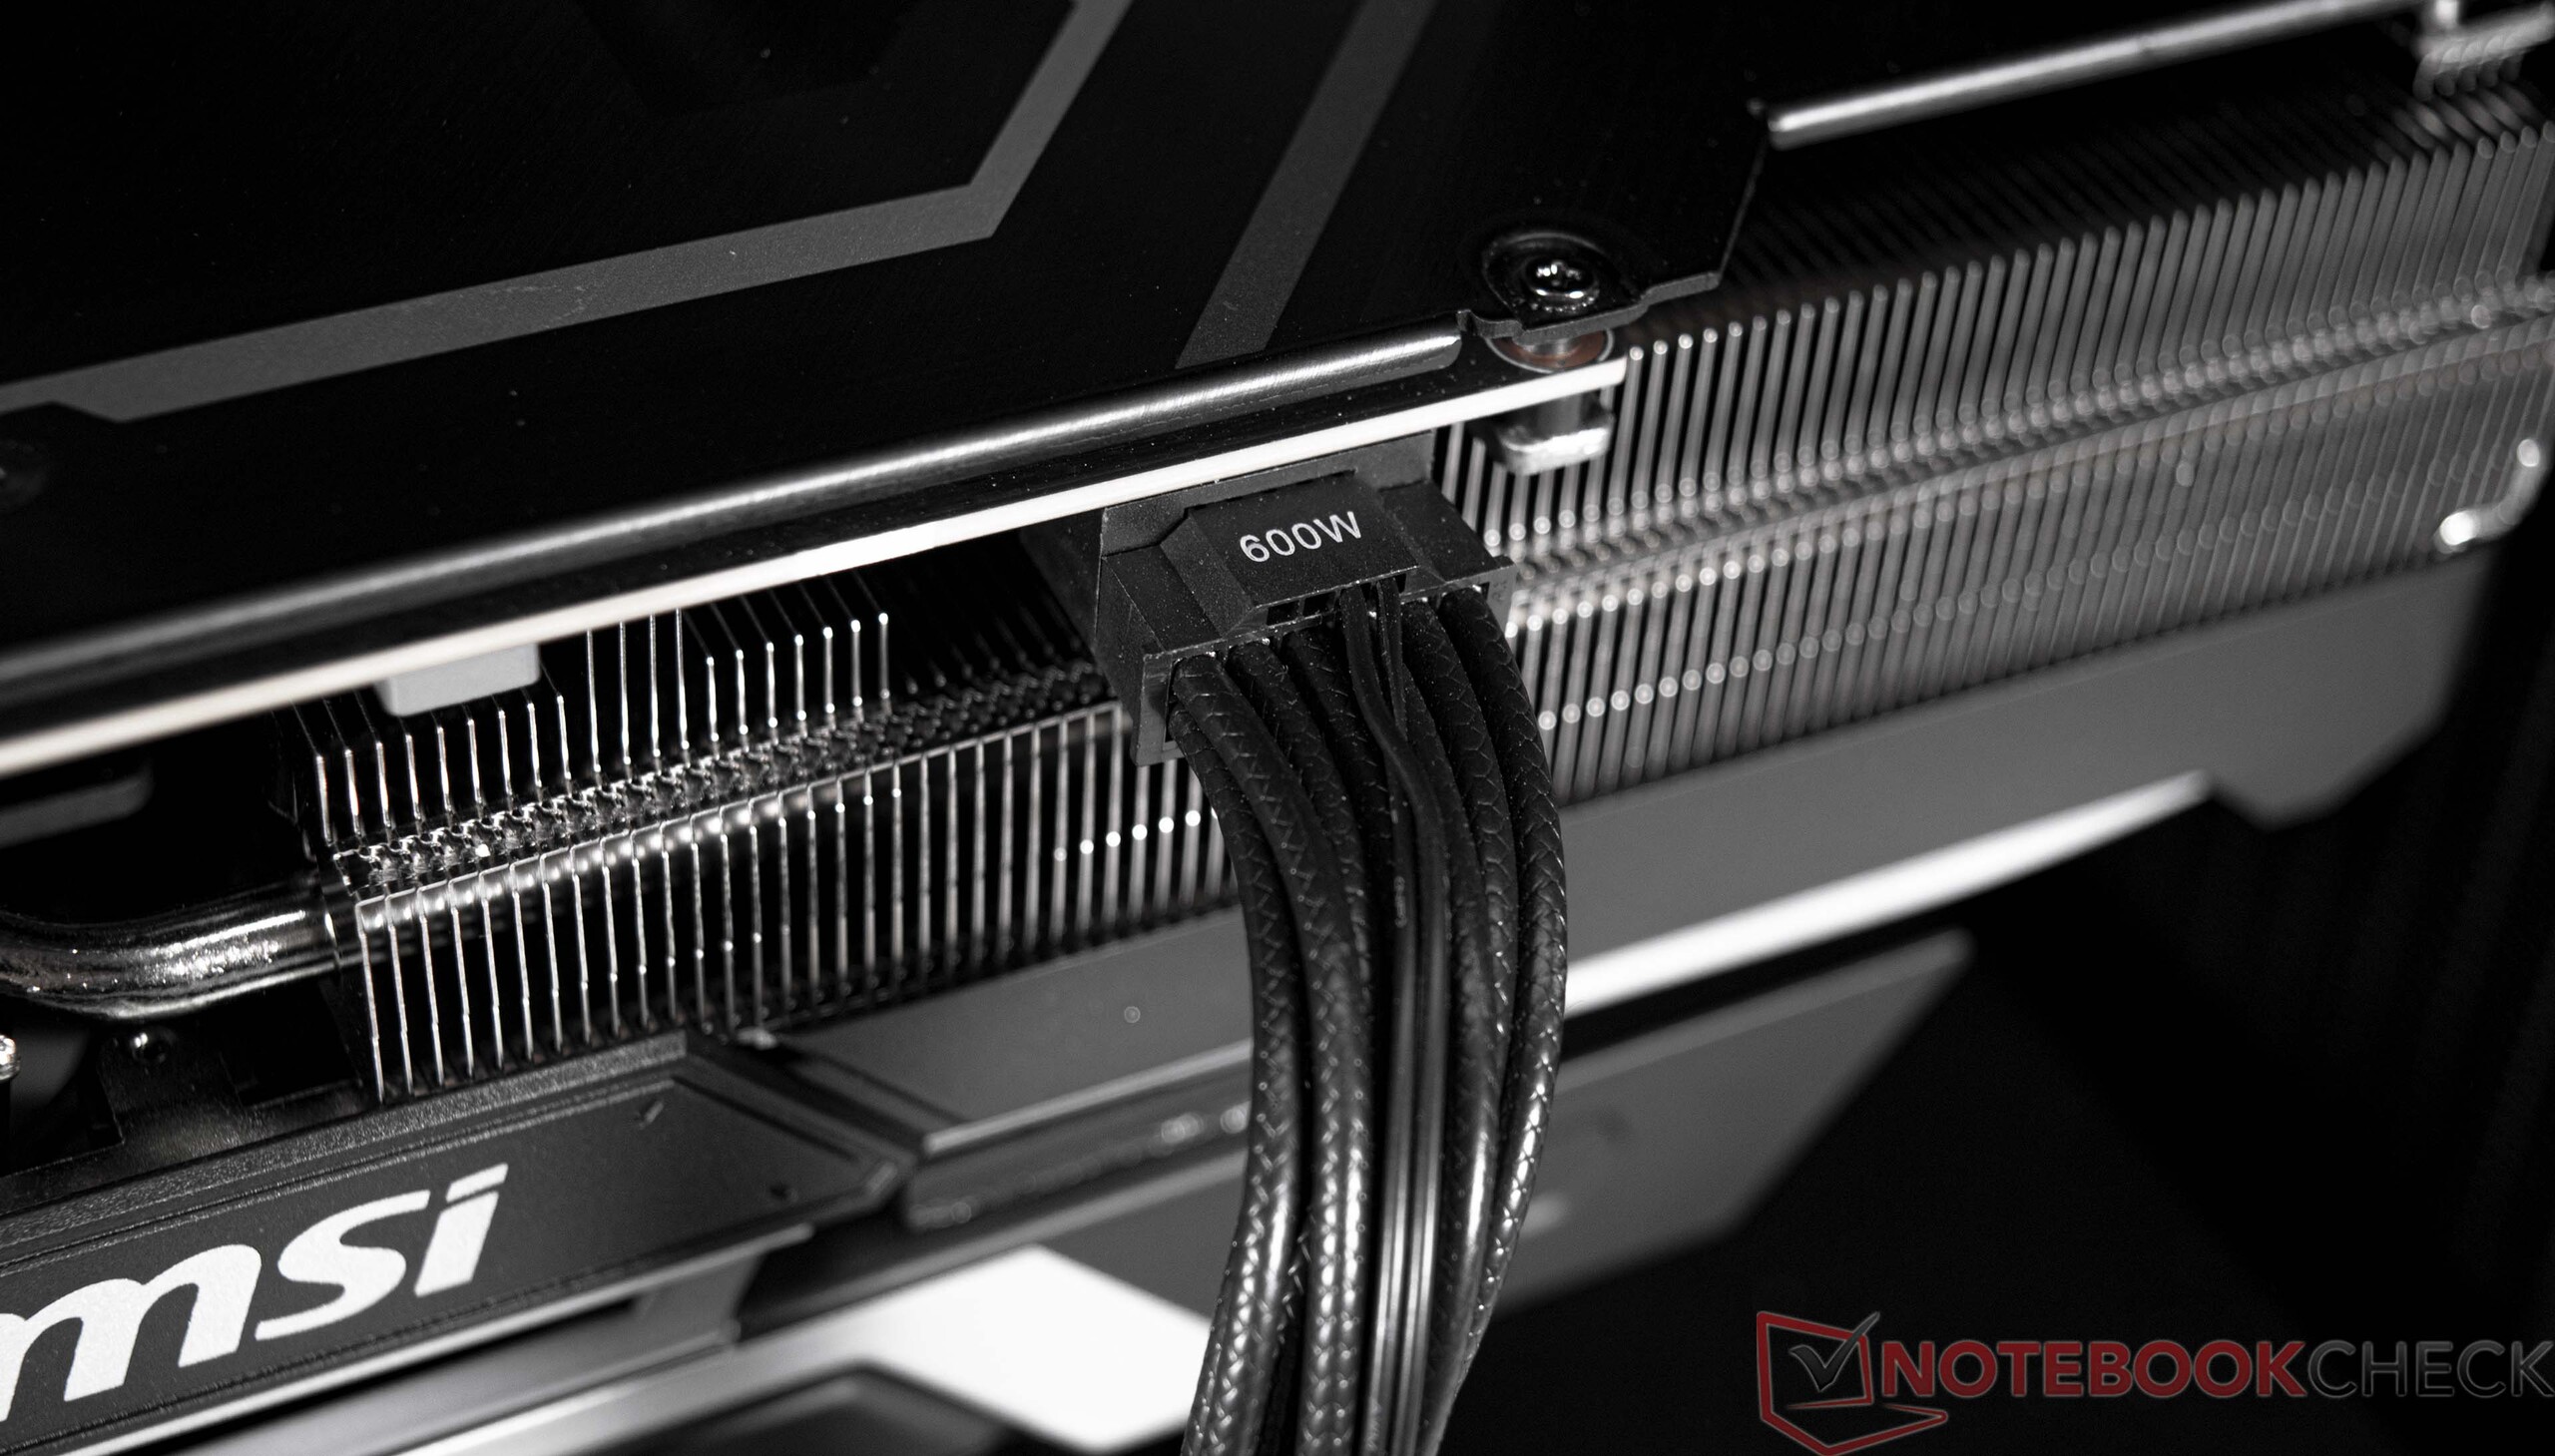
Het hele systeem wordt gevoed door een Seasonic PSU van 1000 watt. Tijdens onze tests had de voeding geen enkel probleem om de componenten van voldoende energie te voorzien, zelfs niet bij volle belasting. Gezien alle high-end componenten binnenin, is het duidelijk dat het systeem niet licht zal zijn in het stroomverbruik. Het stroomverbruik was ongeveer 78 tot 96 watt in ruststand, wat nog steeds acceptabel is. Daarentegen moest de 1000-watt voeding gemiddeld 511 watt leveren tijdens het gamen. We zagen af en toe grote pieken in het stroomverbruik, maar zelfs de gebruikspieken tot 778 watt dreven de PSU niet tot het uiterste. In de vergelijking loopt de review unit net iets achter op ons GPU testsysteem met een vergelijkbare grafische kaart.
| Power Consumption / The Witcher 3 ultra (external Monitor) | |
| AMD Radeon RX 6950 XT | |
| NVIDIA GeForce RTX 3090 Ti (Idle: 102 W) | |
| NVIDIA GeForce RTX 3090 | |
| NVIDIA GeForce RTX 4090 | |
| NVIDIA GeForce RTX 3080 12 GB | |
| NVIDIA GeForce RTX 4090 | |
| AMD Radeon RX 6900 XT (Idle: 99.15 W) | |
| Power Consumption / FurMark 1.19 GPU Stress Test (external Monitor) | |
| NVIDIA GeForce RTX 4090 | |
| AMD Radeon RX 6950 XT | |
| NVIDIA GeForce RTX 3090 | |
| NVIDIA GeForce RTX 3080 12 GB | |
| AMD Radeon RX 6900 XT (Idle: 99.15 W) | |
| NVIDIA GeForce RTX 4090 | |
* ... kleiner is beter
| Uit / Standby | |
| Inactief | |
| Belasting |
|
Key:
min: | |
Power consumption with external monitor
Pro
Contra
Verdict - Razendsnelle gaming PC
Met een Intel Core i9-13900K en een Nvidia GeForce RTX 4090, is onze reviewconfiguratie van de XMG SECTOR Intel een van de snelste gaming-pc's die je op dit moment kunt samenstellen. Het systeem zit ook op een vrij moderne basis, ook al heeft het moederbord "slechts" de Z690-chipset. Desondanks gebruikt het systeem DDR5 geheugen. Wat meer is, zijn opslagschijf levert solide prestaties en biedt, met een capaciteit van 2 TB, zelfs genoeg ruimte voor veel games.
Op basis van een Intel Core i9-13900K biedt de XMG SECTOR Intel uitstekende prestaties voor een hele reeks gebruikssituaties. In combinatie met de GeForce RTX 4090 is het systeem momenteel een van de snelste gaming pc's op de markt.
Onze review unit beschikt over zulke immens hoge prestaties dat het alle moderne games soepel kan draaien op 2160p. Het systeem is zeker geen koopje voor ongeveer €4.600 (US$4.851). Toch is de configuratie zinvol als je zonder enig compromis de nieuwste games wilt spelen. Een vergelijkbaar AMD-systeem met een Ryzen 9 7950X (ook verkrijgbaar in de winkel als XMG SECTOR AMD) kost ruwweg € 300 (US$ 316) meer
.Prijs en beschikbaarheid
De XMG SECTOR Intel is verkrijgbaar via Schenker's online shop bestware.com en kost ongeveer € 4.600 (US$ 4.851). U kunt ook componenten selecteren op basis van uw specifieke behoeften met behulp van de uitgebreide configurator.
Schenker XMG SECTOR, i9 13900K, RTX 4090
- 04-03-2023 v7 (old)
Sebastian Bade
Transparantie
De selectie van te beoordelen apparaten wordt gemaakt door onze redactie. Het testexemplaar werd ten behoeve van deze beoordeling door de fabrikant of detailhandelaar in bruikleen aan de auteur verstrekt. De kredietverstrekker had geen invloed op deze recensie, noch ontving de fabrikant vóór publicatie een exemplaar van deze recensie. Er bestond geen verplichting om deze recensie te publiceren. Als onafhankelijk mediabedrijf is Notebookcheck niet onderworpen aan het gezag van fabrikanten, detailhandelaren of uitgevers.
[transparency_disclaimer]Dit is hoe Notebookcheck test
Elk jaar beoordeelt Notebookcheck onafhankelijk honderden laptops en smartphones met behulp van gestandaardiseerde procedures om ervoor te zorgen dat alle resultaten vergelijkbaar zijn. We hebben onze testmethoden al zo'n 20 jaar voortdurend ontwikkeld en daarbij de industriestandaard bepaald. In onze testlaboratoria wordt gebruik gemaakt van hoogwaardige meetapparatuur door ervaren technici en redacteuren. Deze tests omvatten een validatieproces in meerdere fasen. Ons complexe beoordelingssysteem is gebaseerd op honderden goed onderbouwde metingen en benchmarks, waardoor de objectiviteit behouden blijft. Meer informatie over onze testmethoden kunt u hier vinden.

