Notebookcheck Logo

KFA2 GeForce RTX 4080 SG desktop GPU review: Geweldige prestaties ontmoet twijfelachtige prijsstelling

FPS en RGB-verlichting in overvloed! Naast de GeForce RTX 4090 heeft Nvidia de GeForce RTX 4080 uitgebracht, een iets minder duur model op basis van de nieuwste Ada Lovelace-architectuur van het bedrijf. Niettemin vragen fabrikanten meer dan € 1.000 (US$ 1.070) voor de op één na snelste grafische kaart van team groen. We hebben nu een RTX 4080-model van KFA2 onder de loep genomen. In deze review kom je te weten waar deze kaart staat qua prestaties.
KFA2 GeForce RTX 4080 Serious Gaming
Externe aansluitingen op de KFA2 GeForce RTX 4080 SG

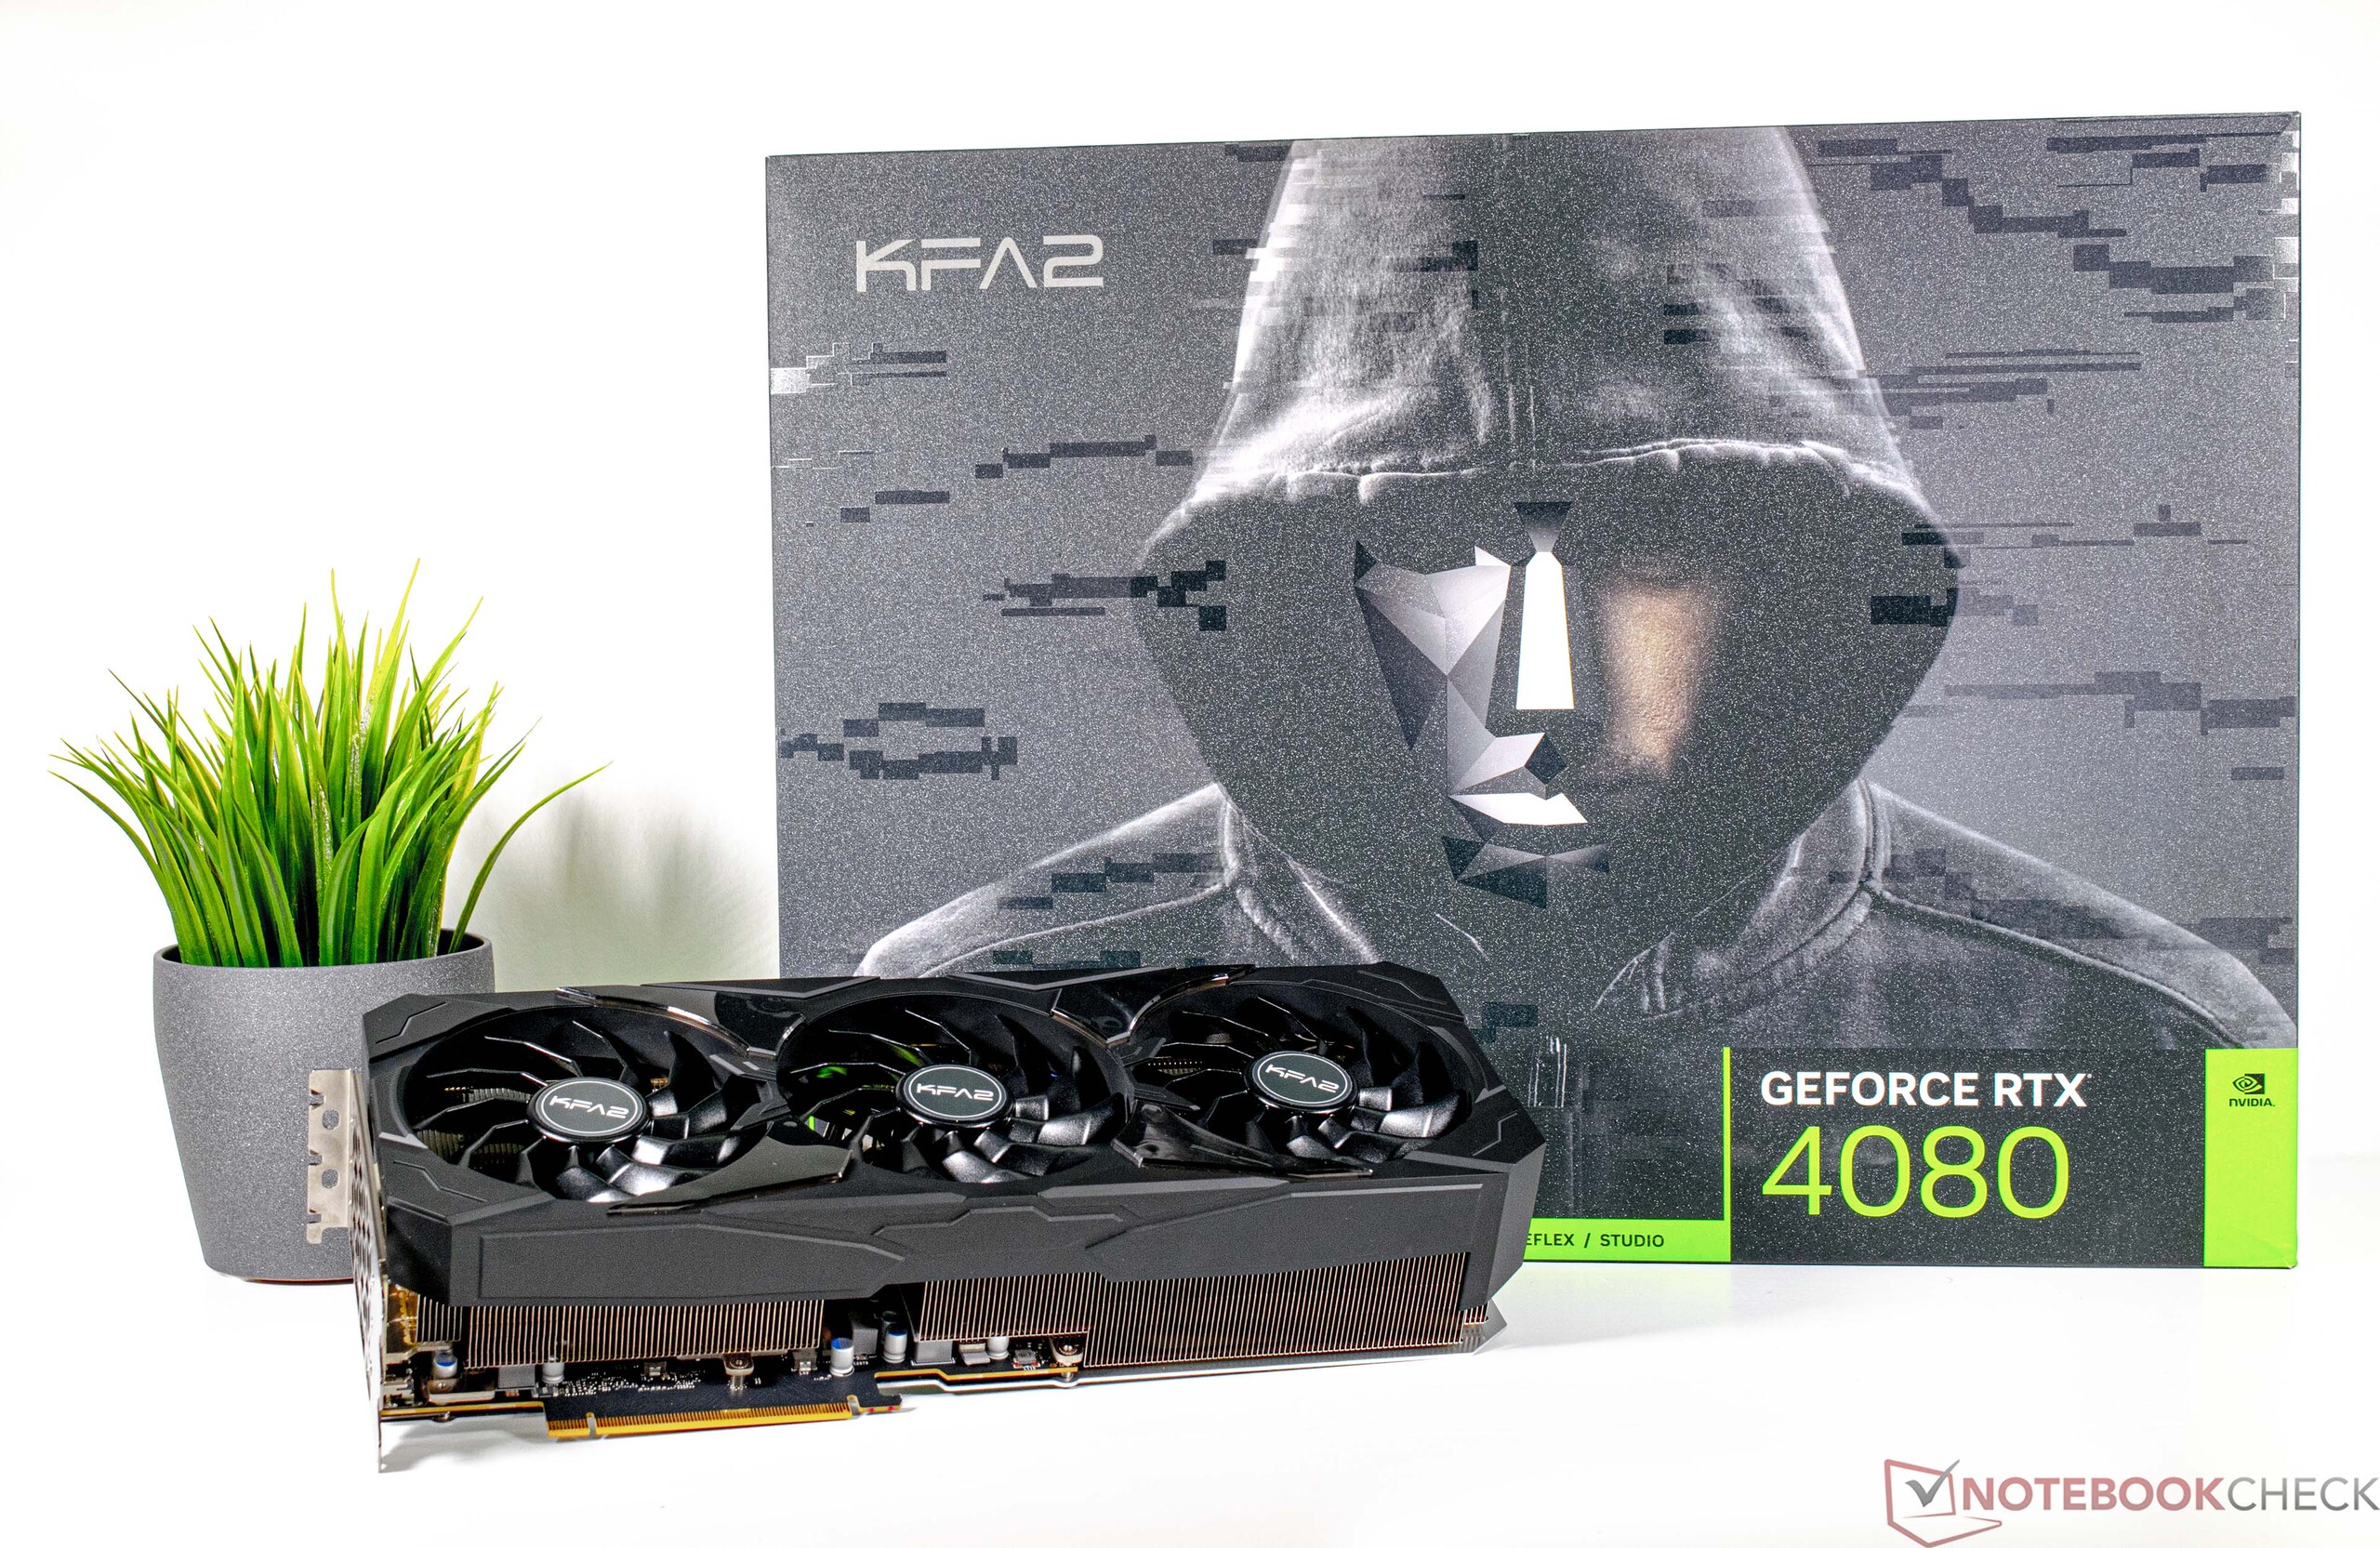
Nadat we onlangs de KFA2 GeForce RTX 4090 SG, is het nu tijd voor de kleinere KFA2 GeForce RTX 4080 SG om te laten zien wat hij onder de motorkap heeft. Over onder de motorkap gesproken, in tegenstelling tot de Ampere line-up is het tweede snelste model van de huidige generatie gebaseerd op een andere grafische chip dan die van het topmodel. Hij gebruikt de AD103 GPU, die aanzienlijk kleiner en dus goedkoper te produceren is dan de AD102. De lagere productiekosten komen echter niet volledig tot uiting in de huidige prijsstelling. Dit is een veelbesproken kwestie, en ook wij vinden dat de prijzen aanzienlijk moeten worden verlaagd, zodat de nieuwste grafische kaarten niet verworden tot plankverwarmers. De RRP van de GeForce RTX 4080 is meer dan verdubbeld ten opzichte van zijn voorganger (GeForce RTX 3080). Onze kritiek op de prijsstelling laten we hier voorlopig rusten. Vanaf nu willen we ons in plaats daarvan richten op de prestaties en functies van de KFA2 GeForce RTX 4080 SG en bespreken hoe goed dit model zich verhoudt tot met name AMD's RDNA3 GPU's.

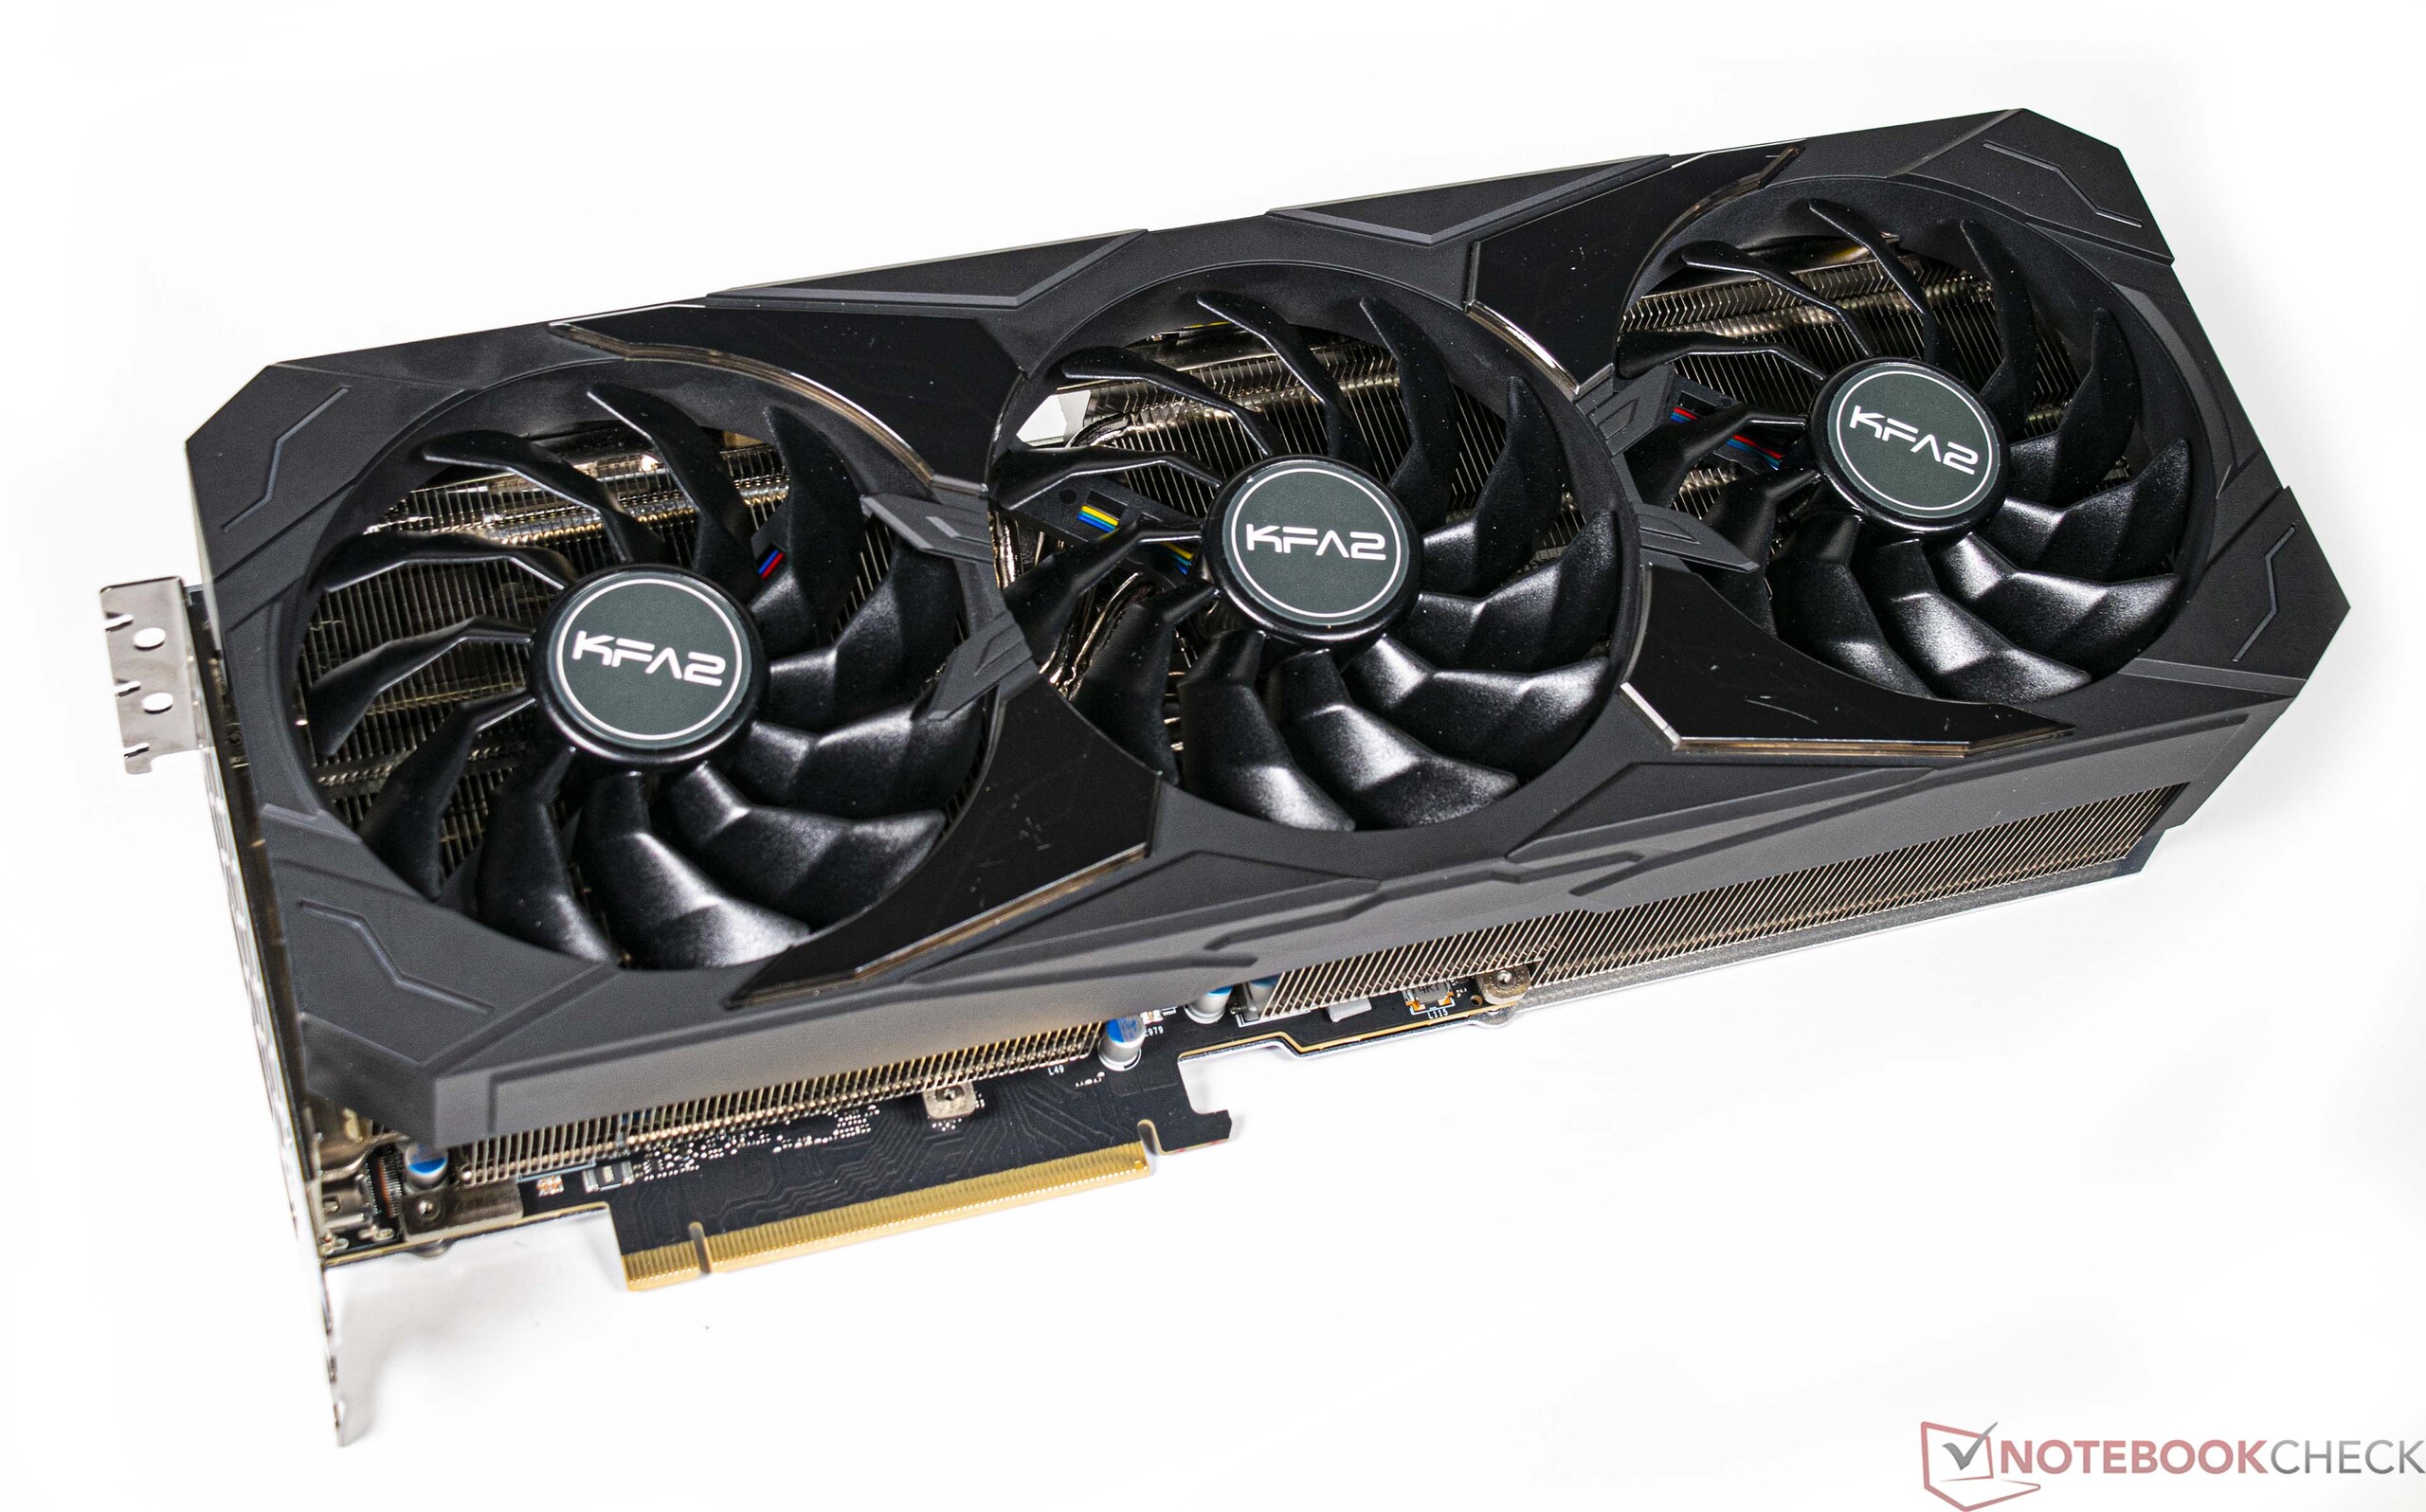
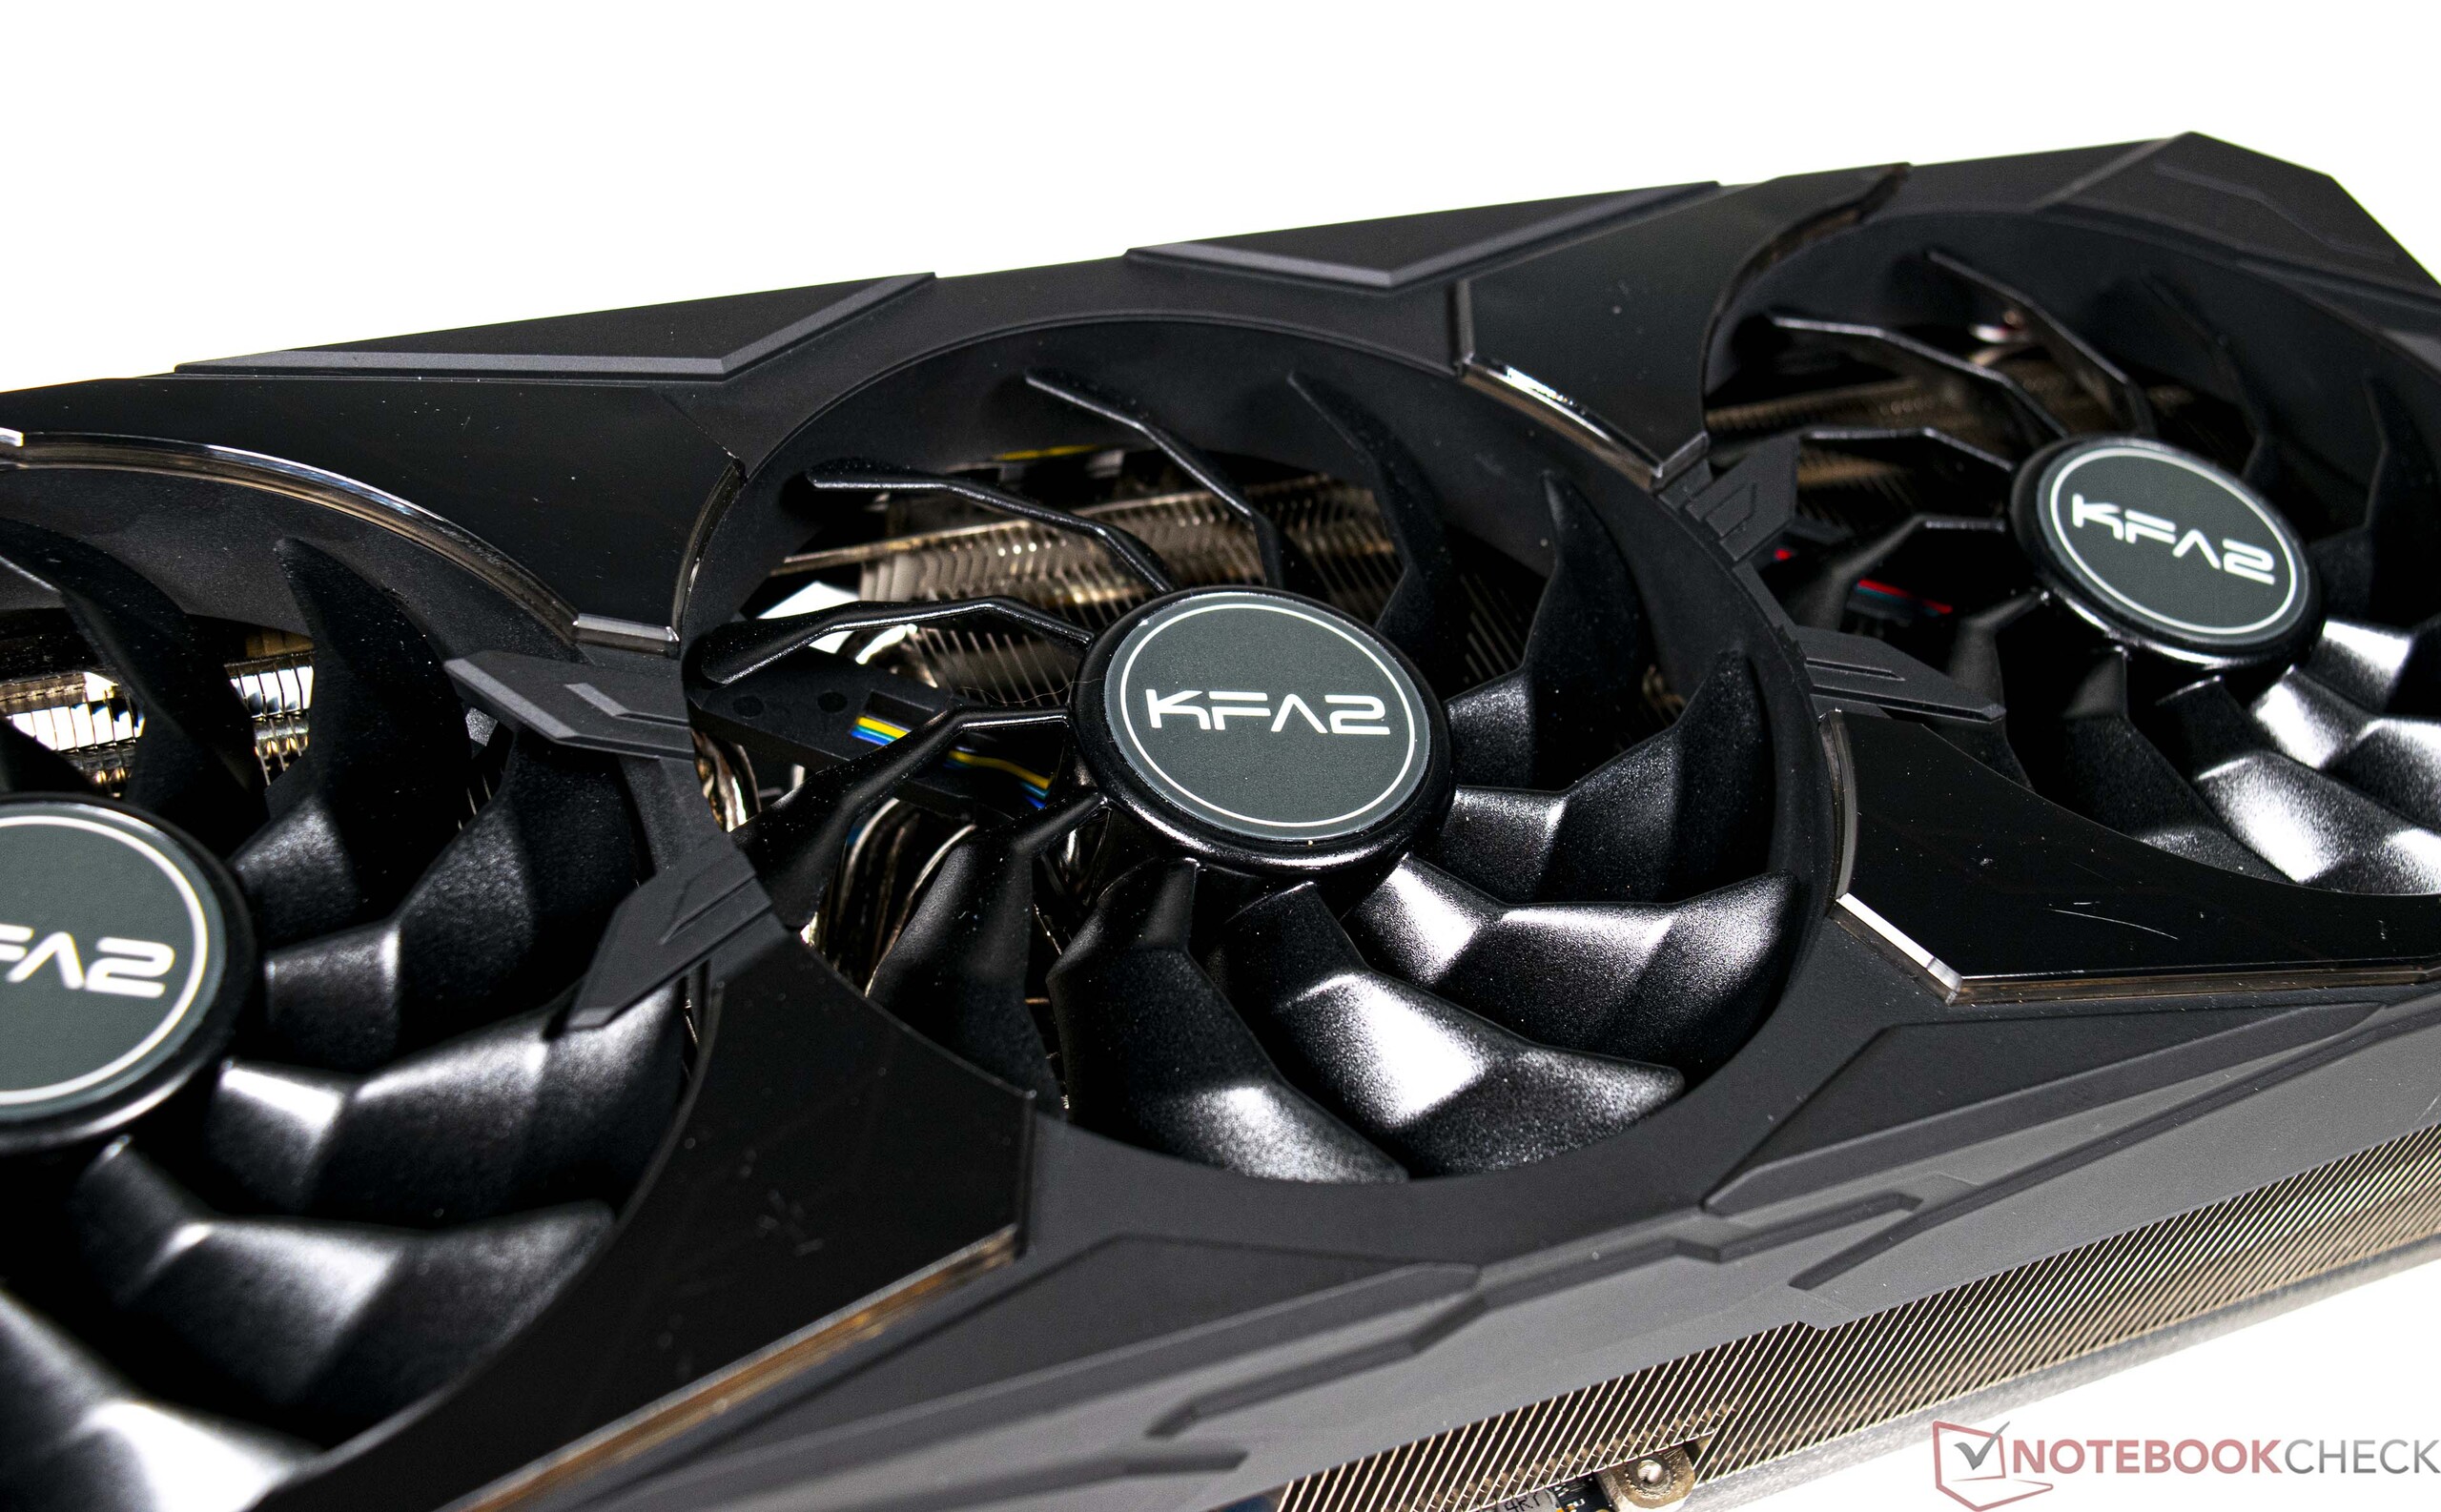
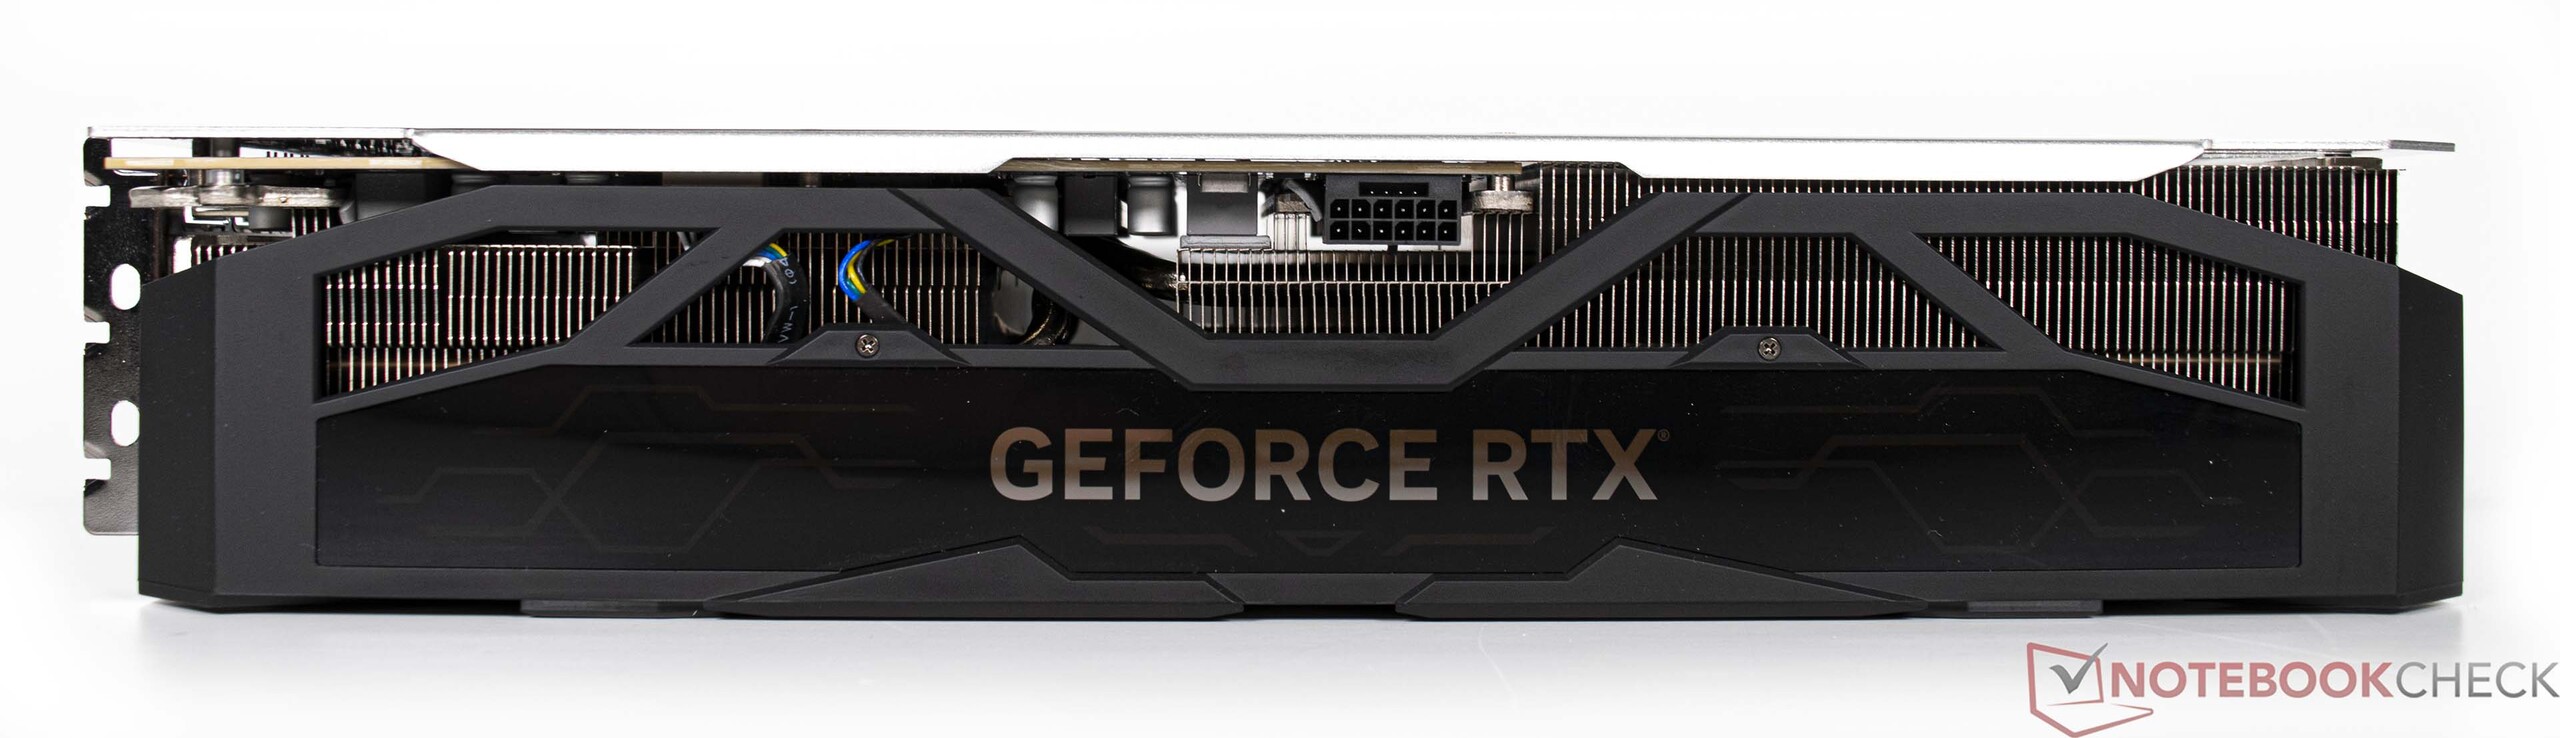
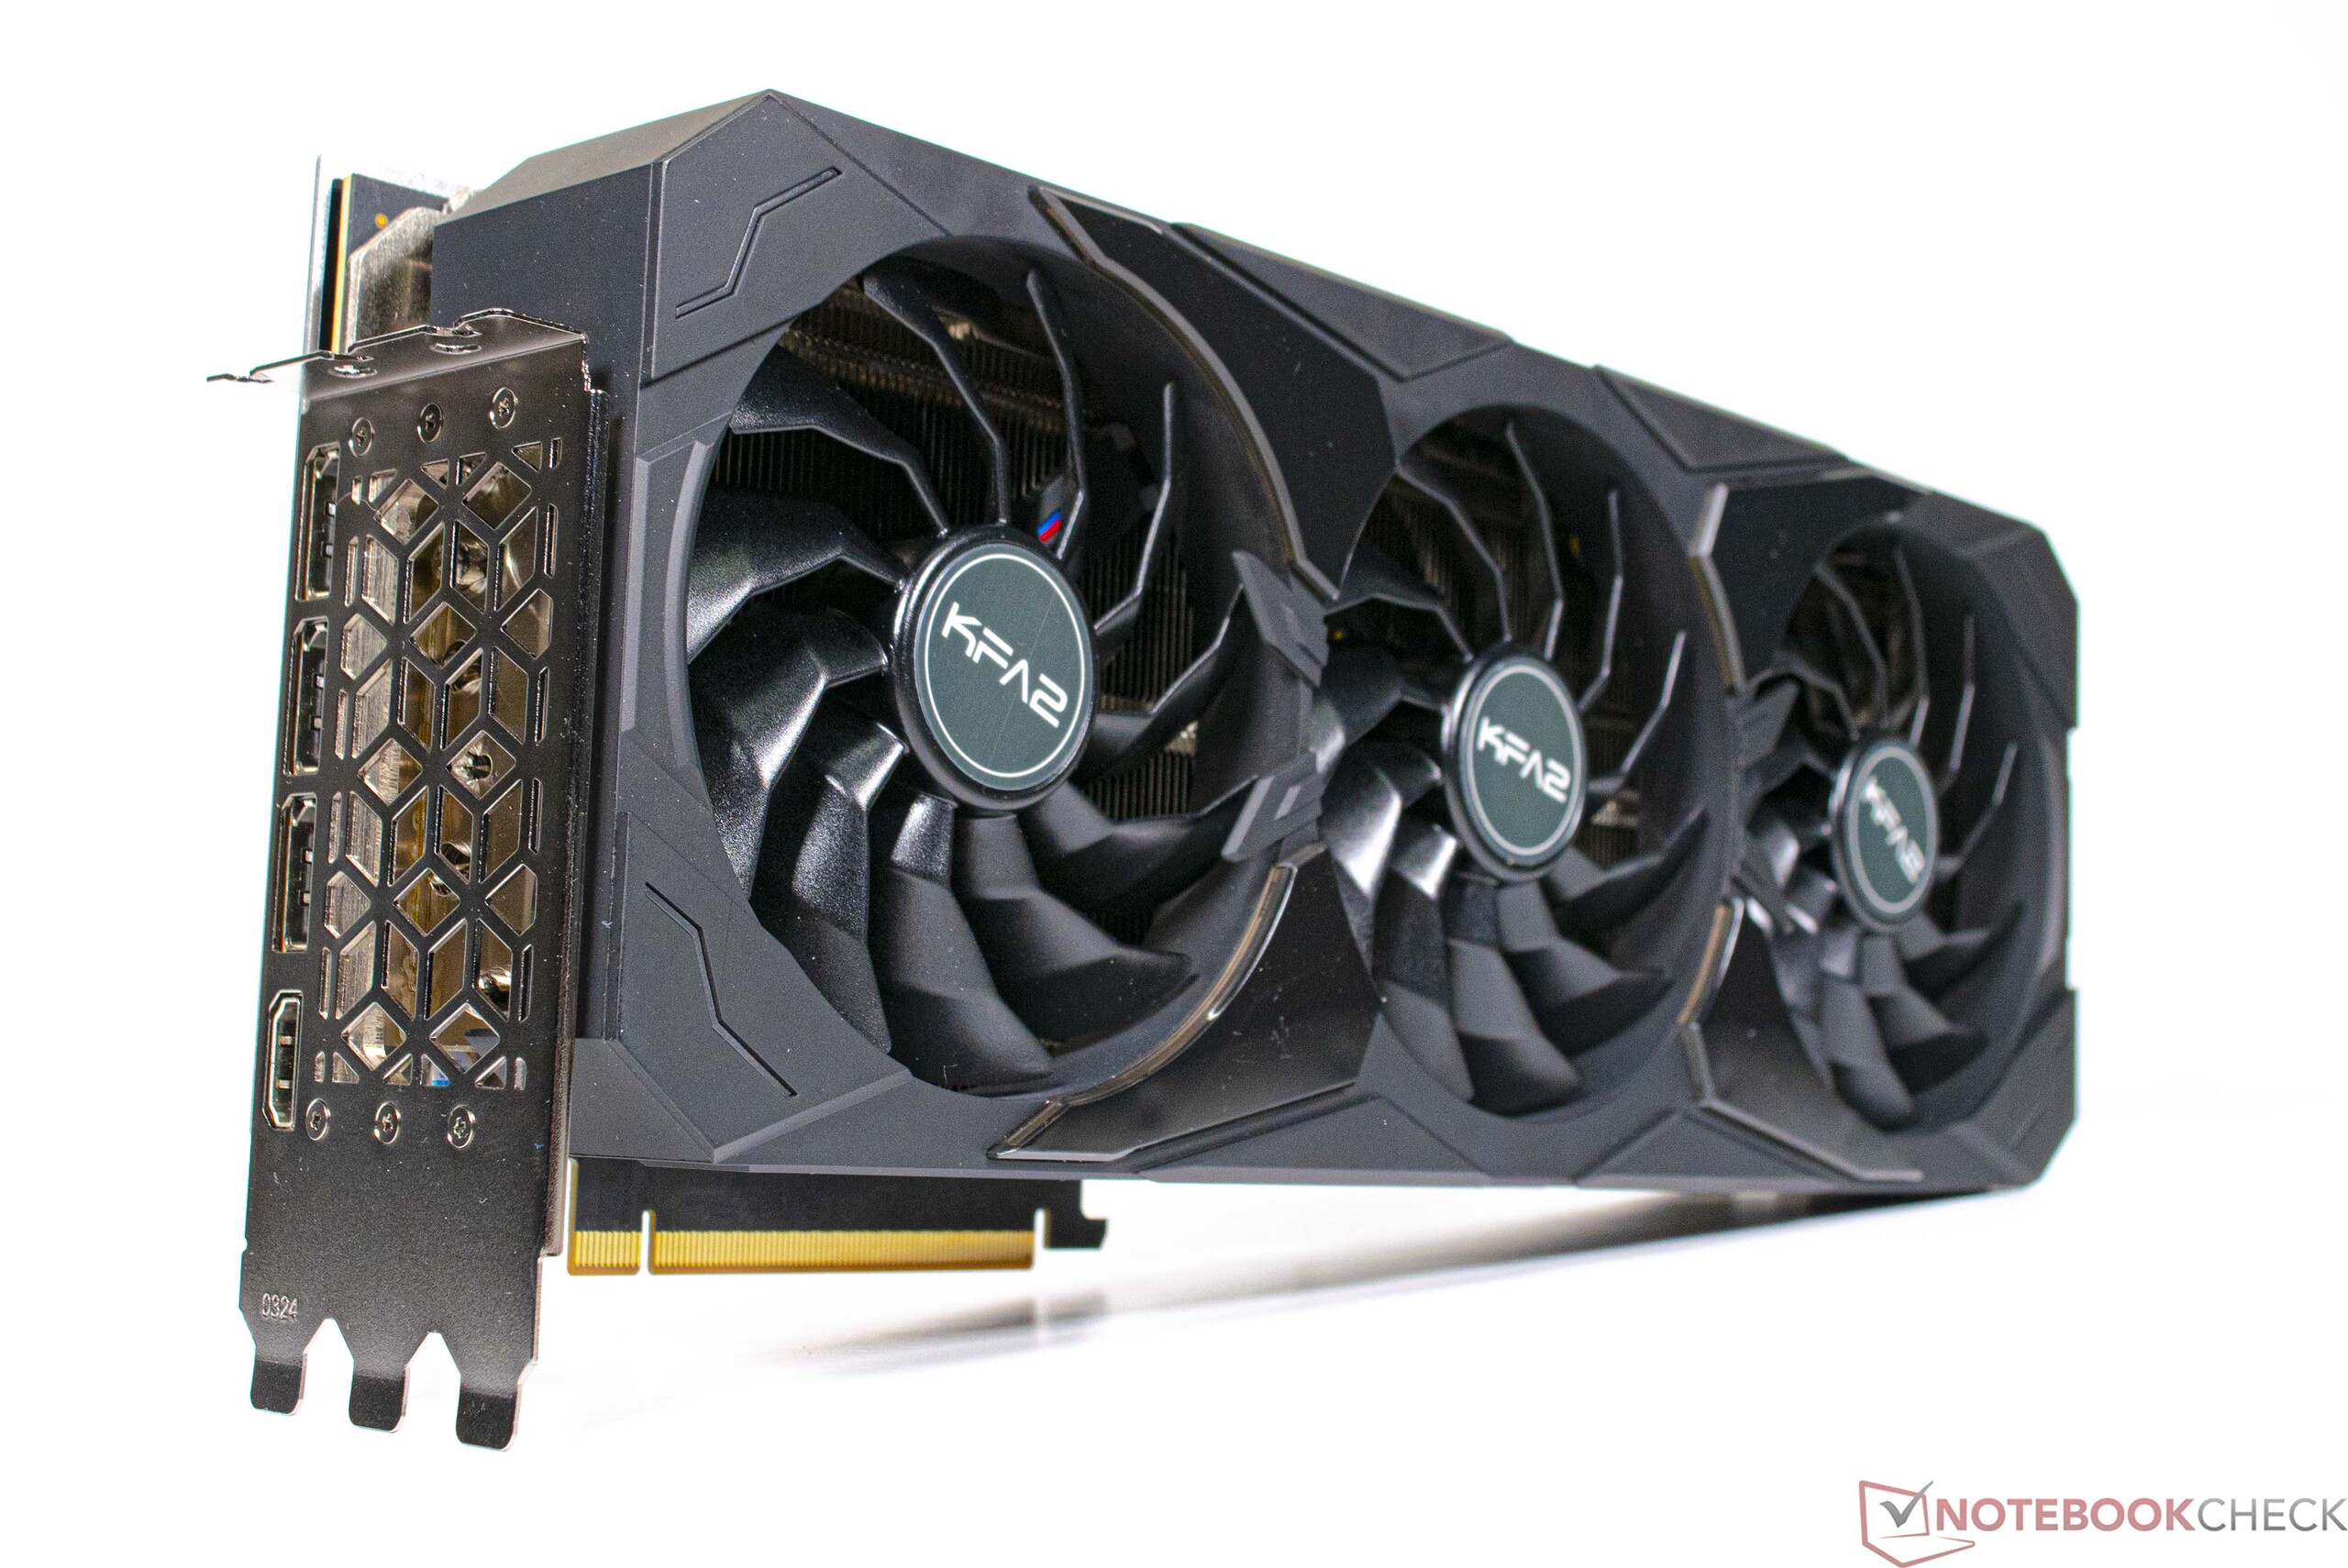
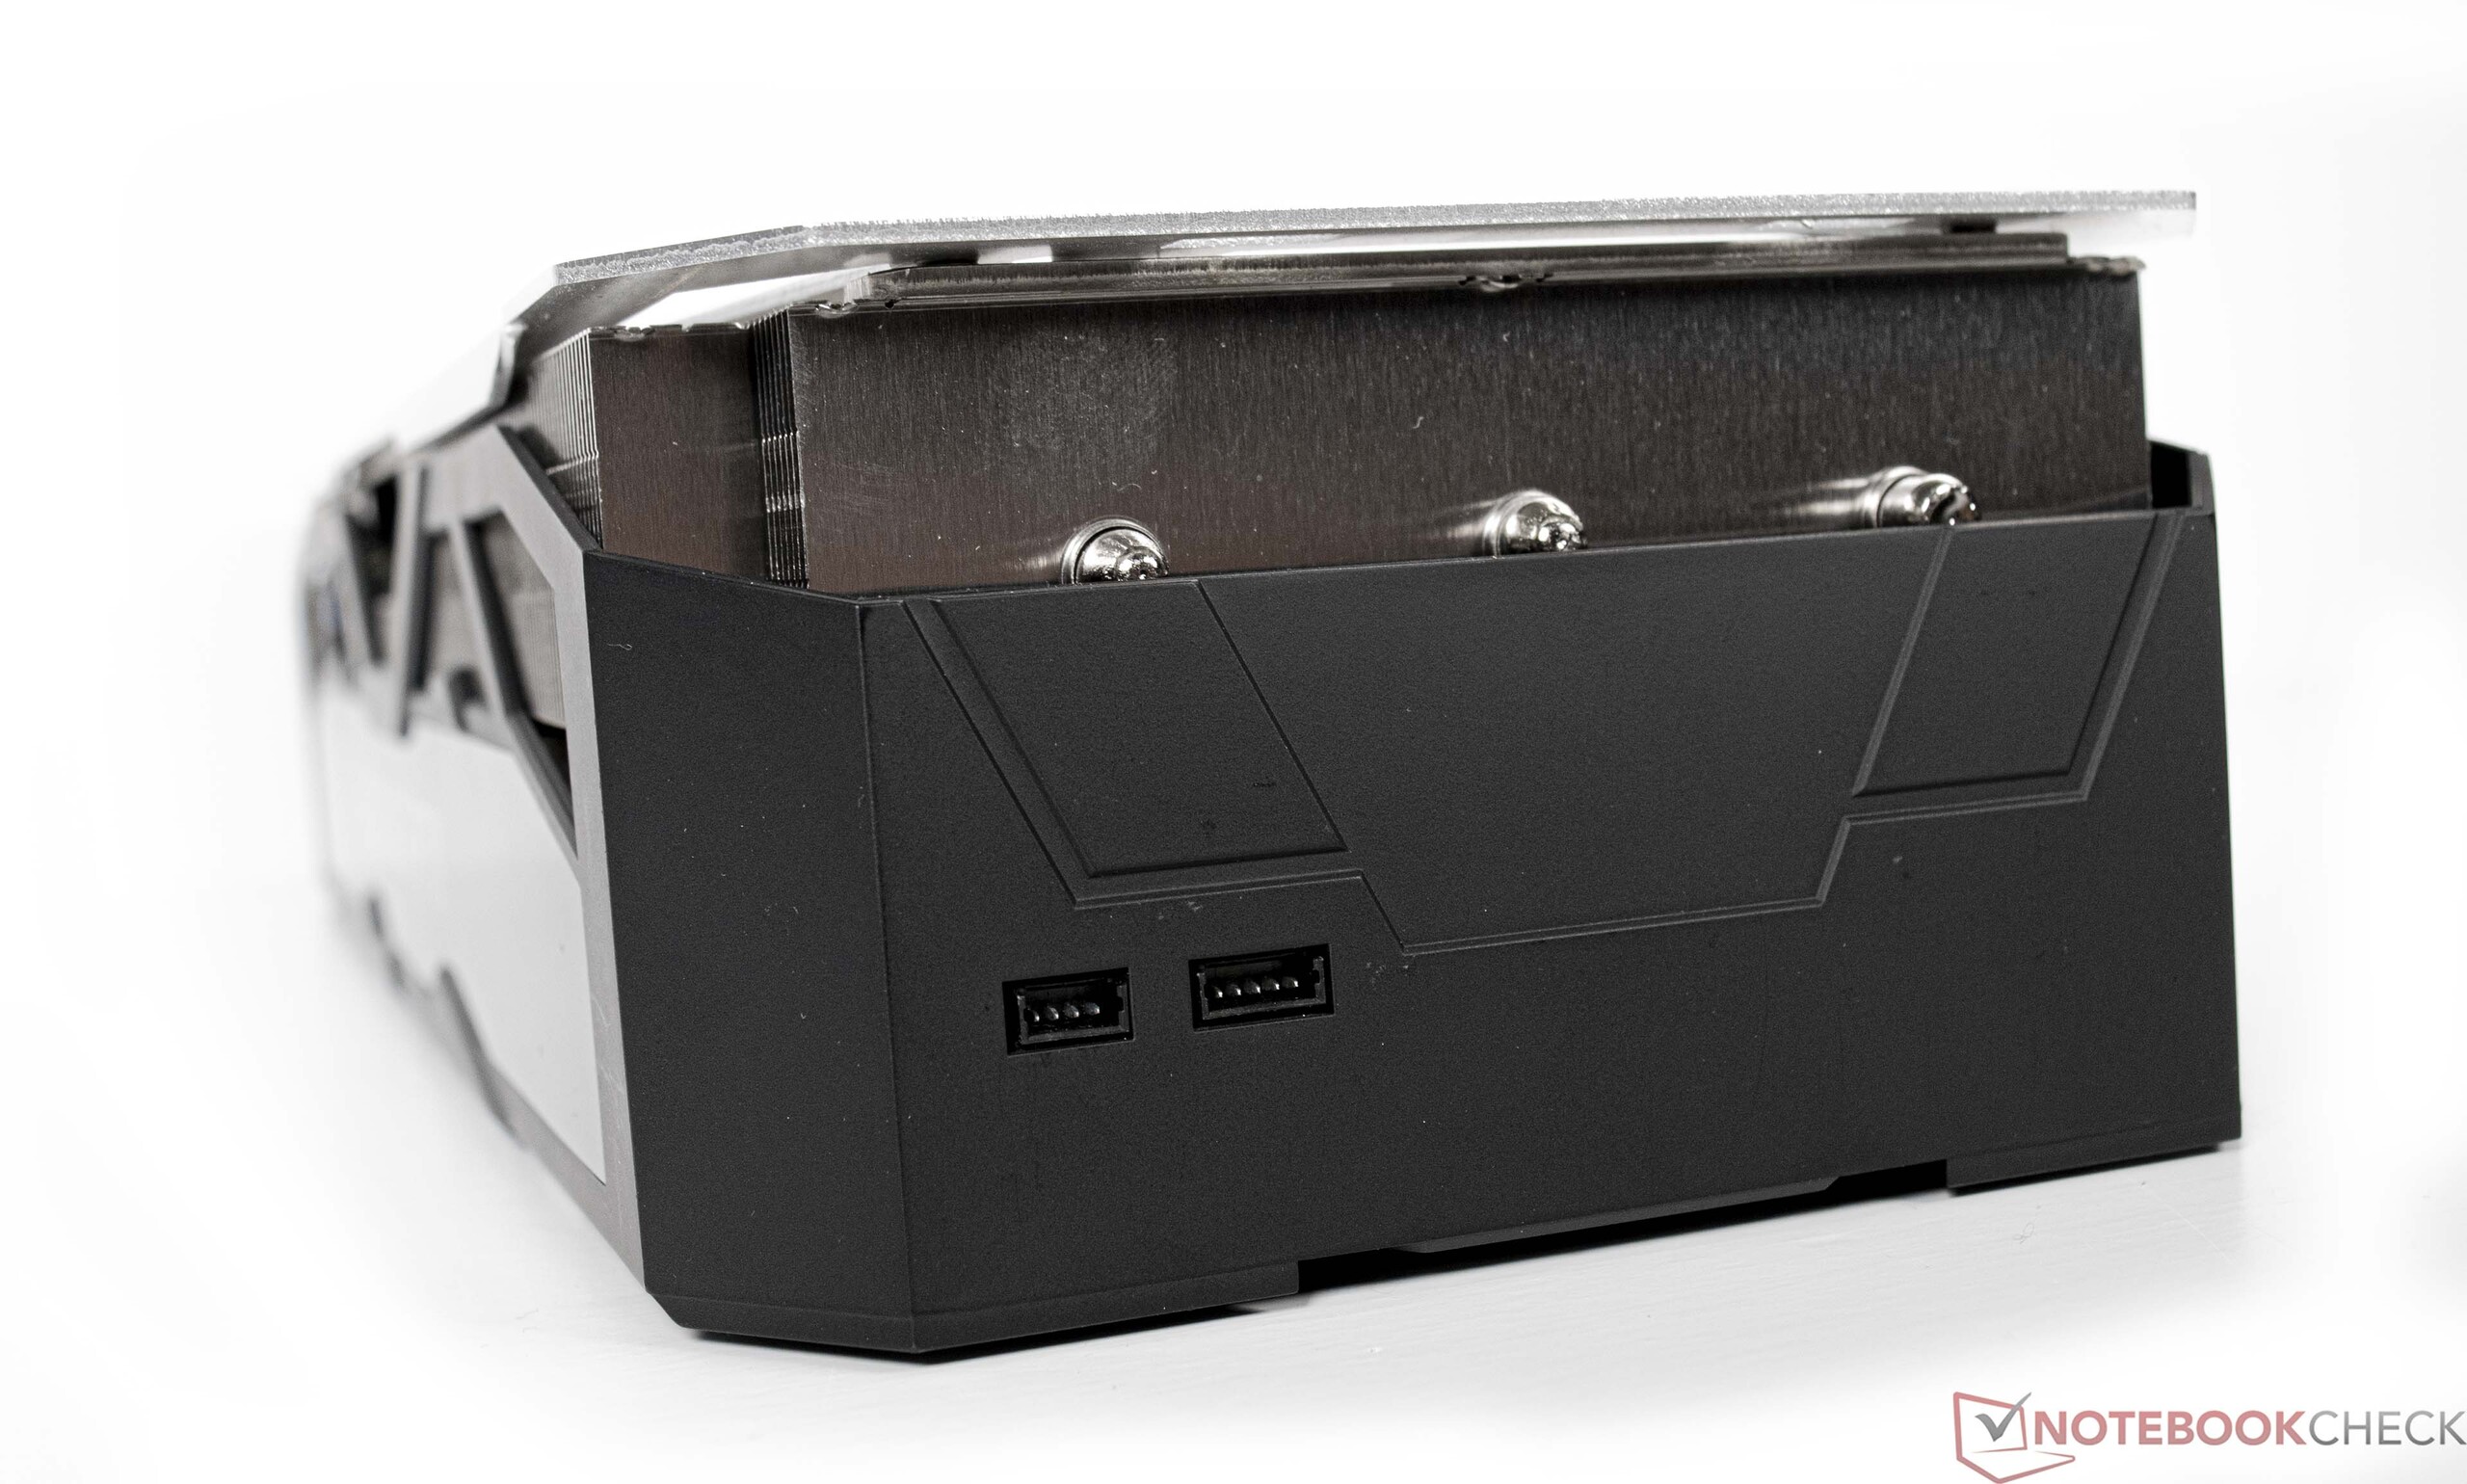
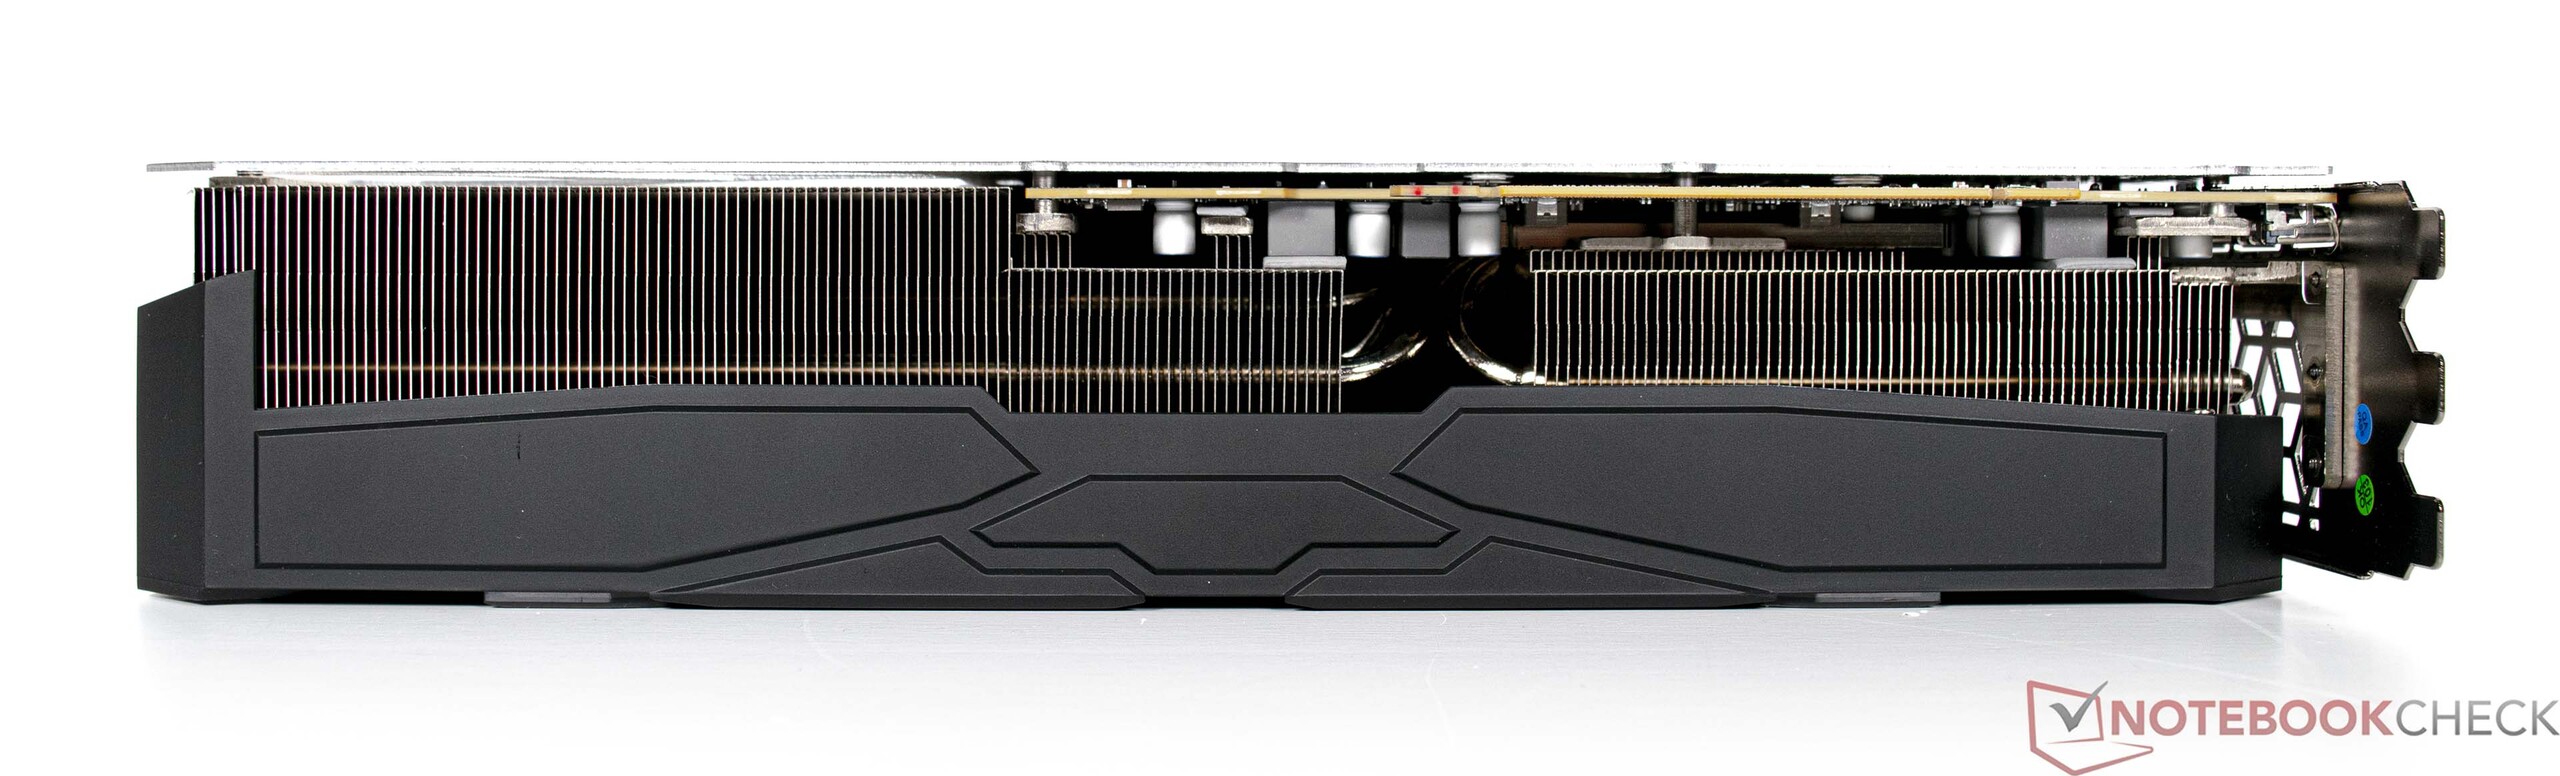
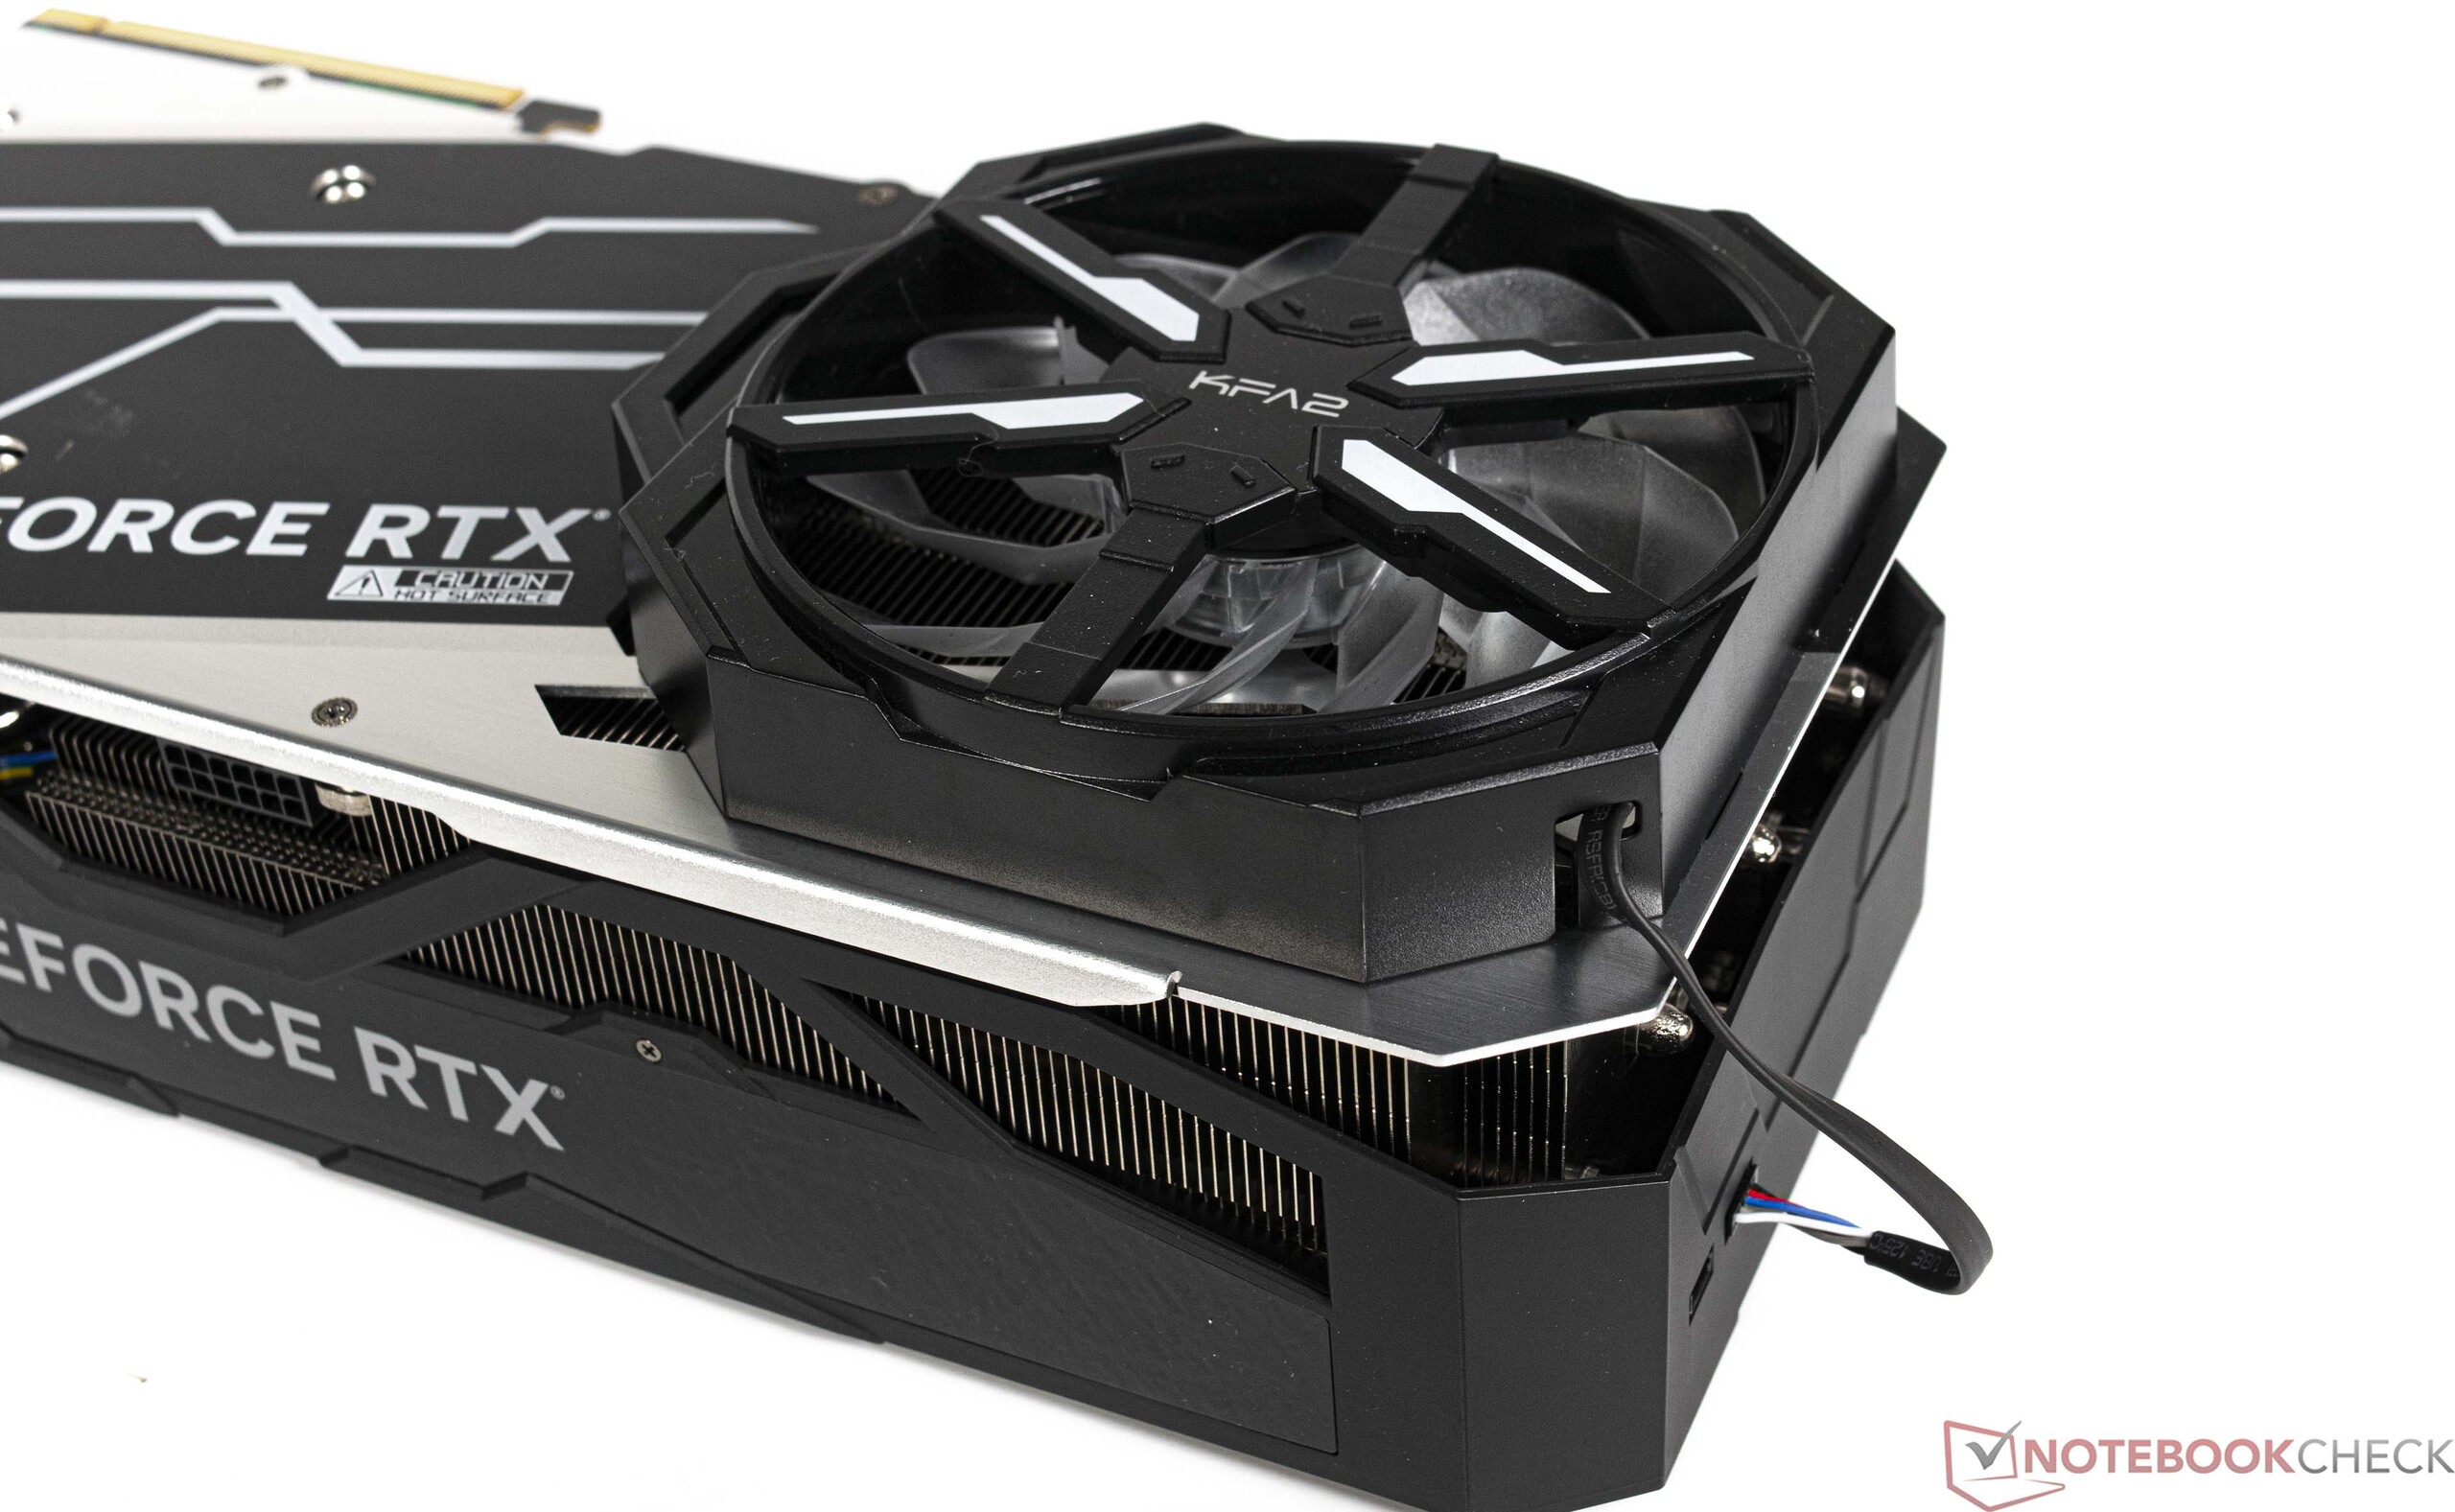
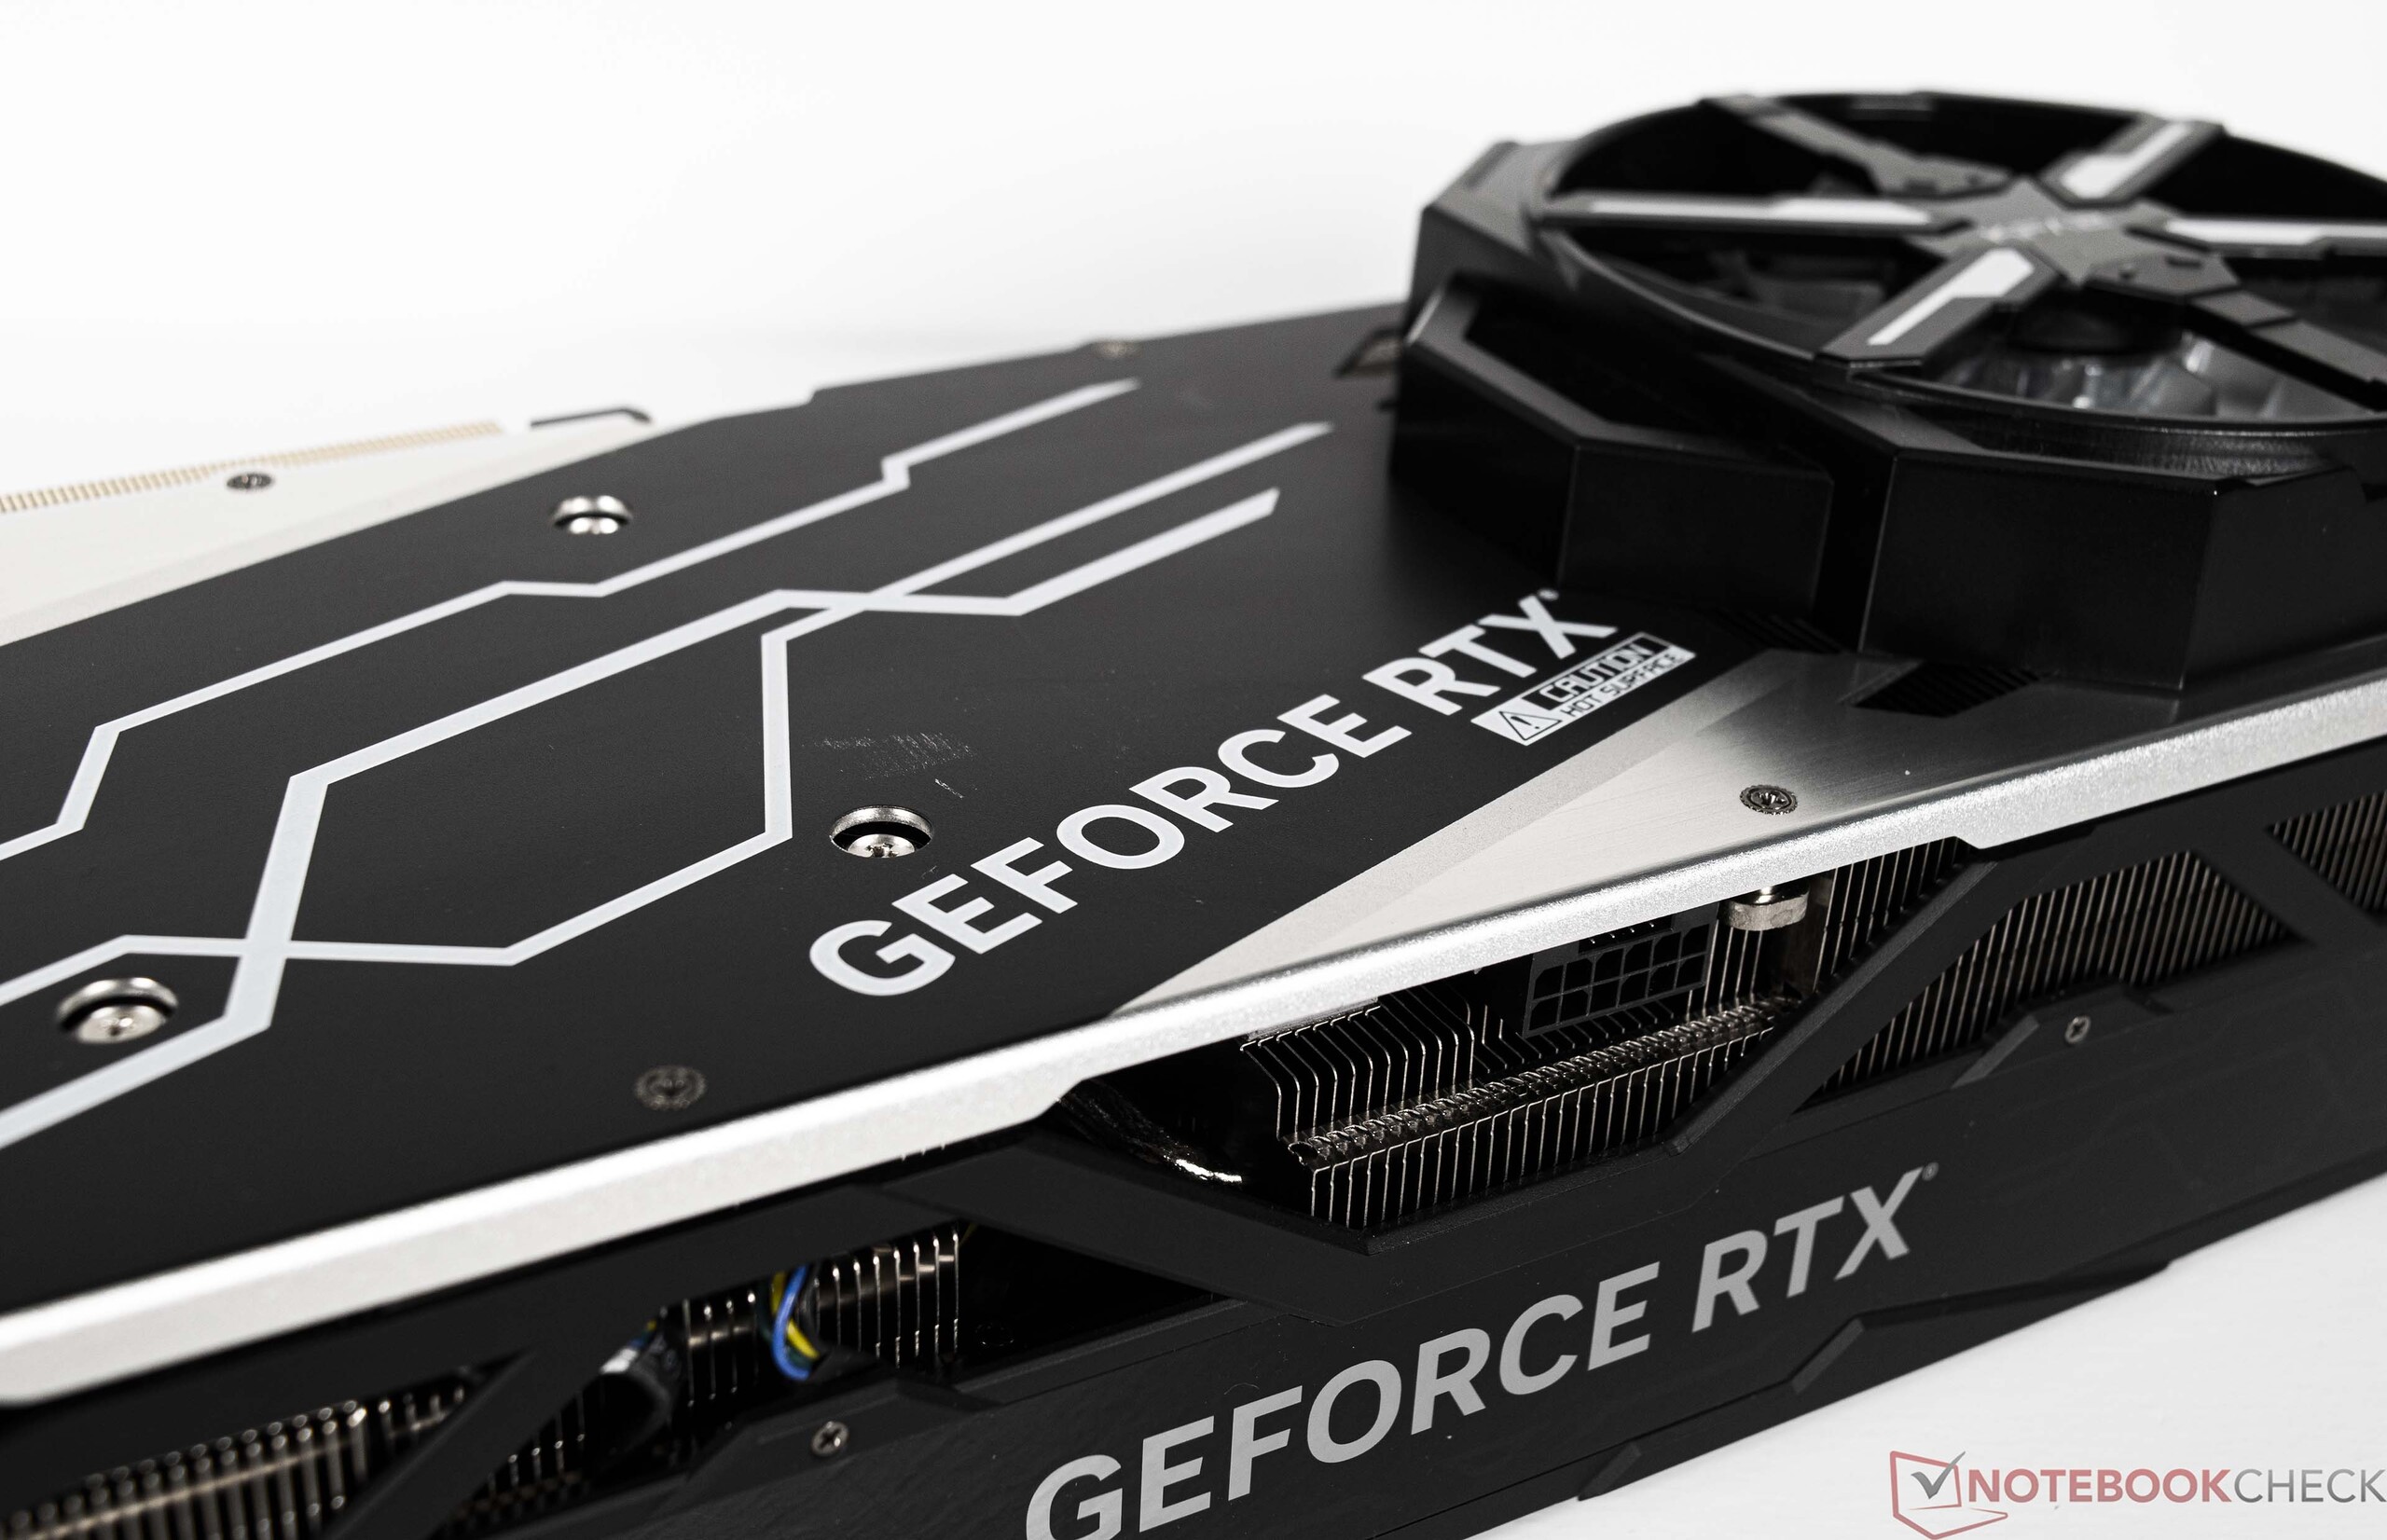
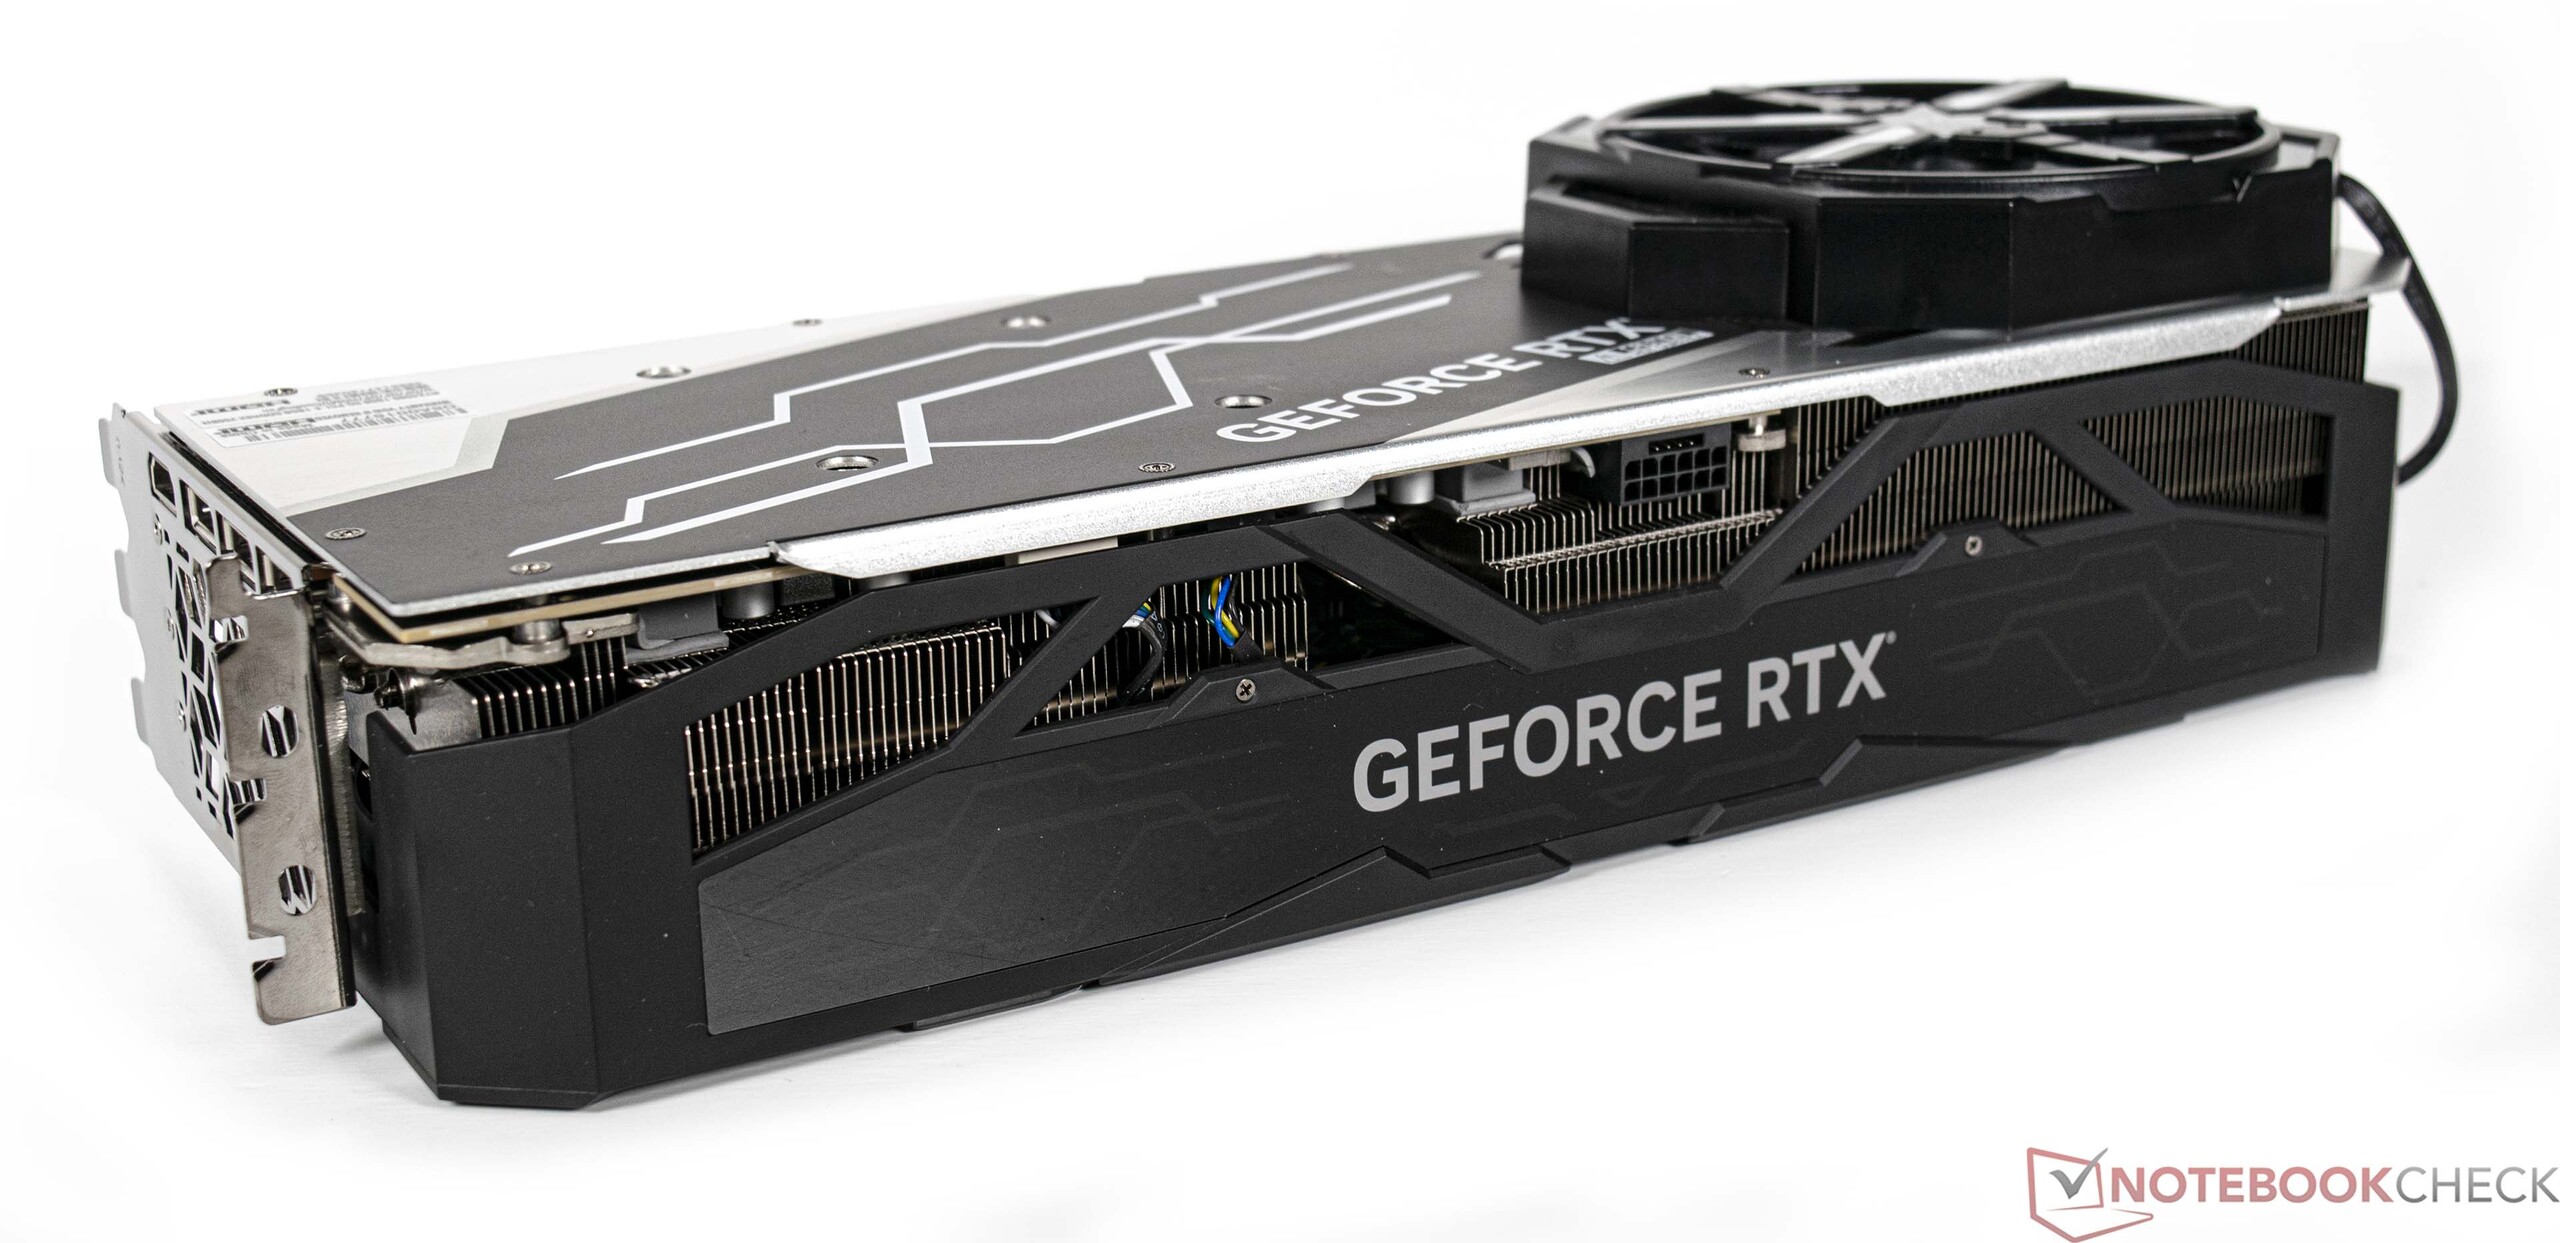
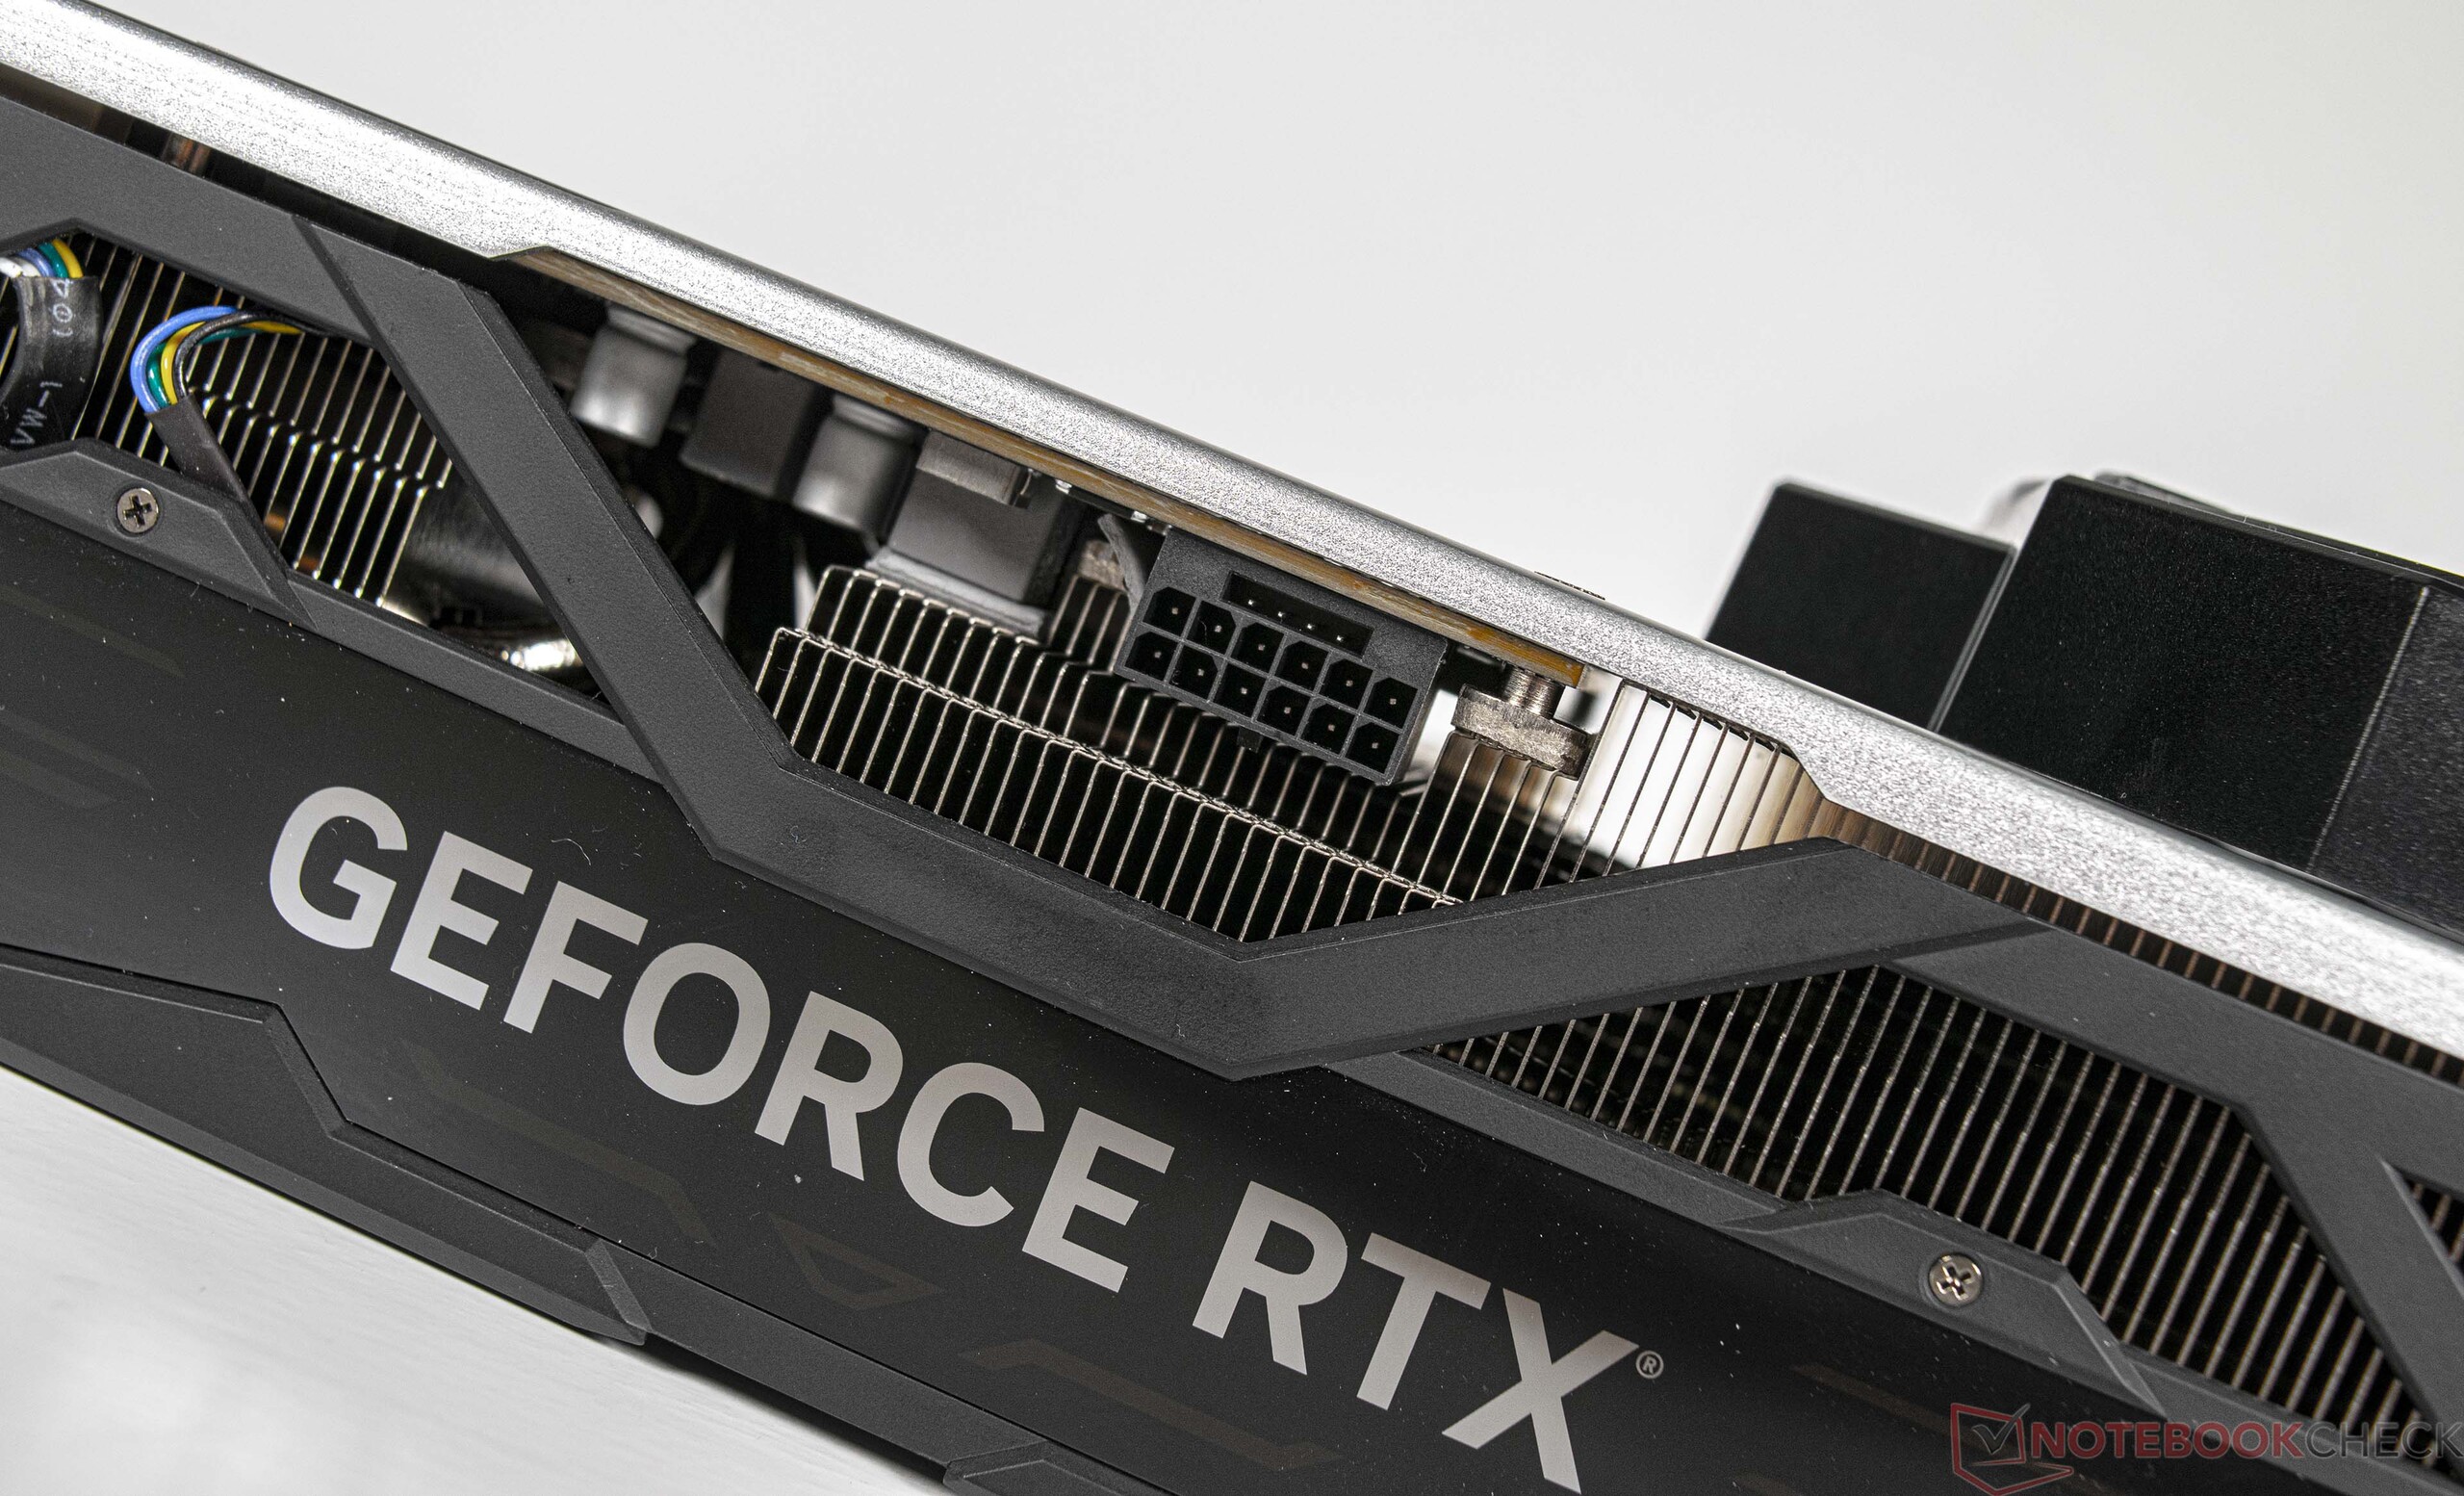
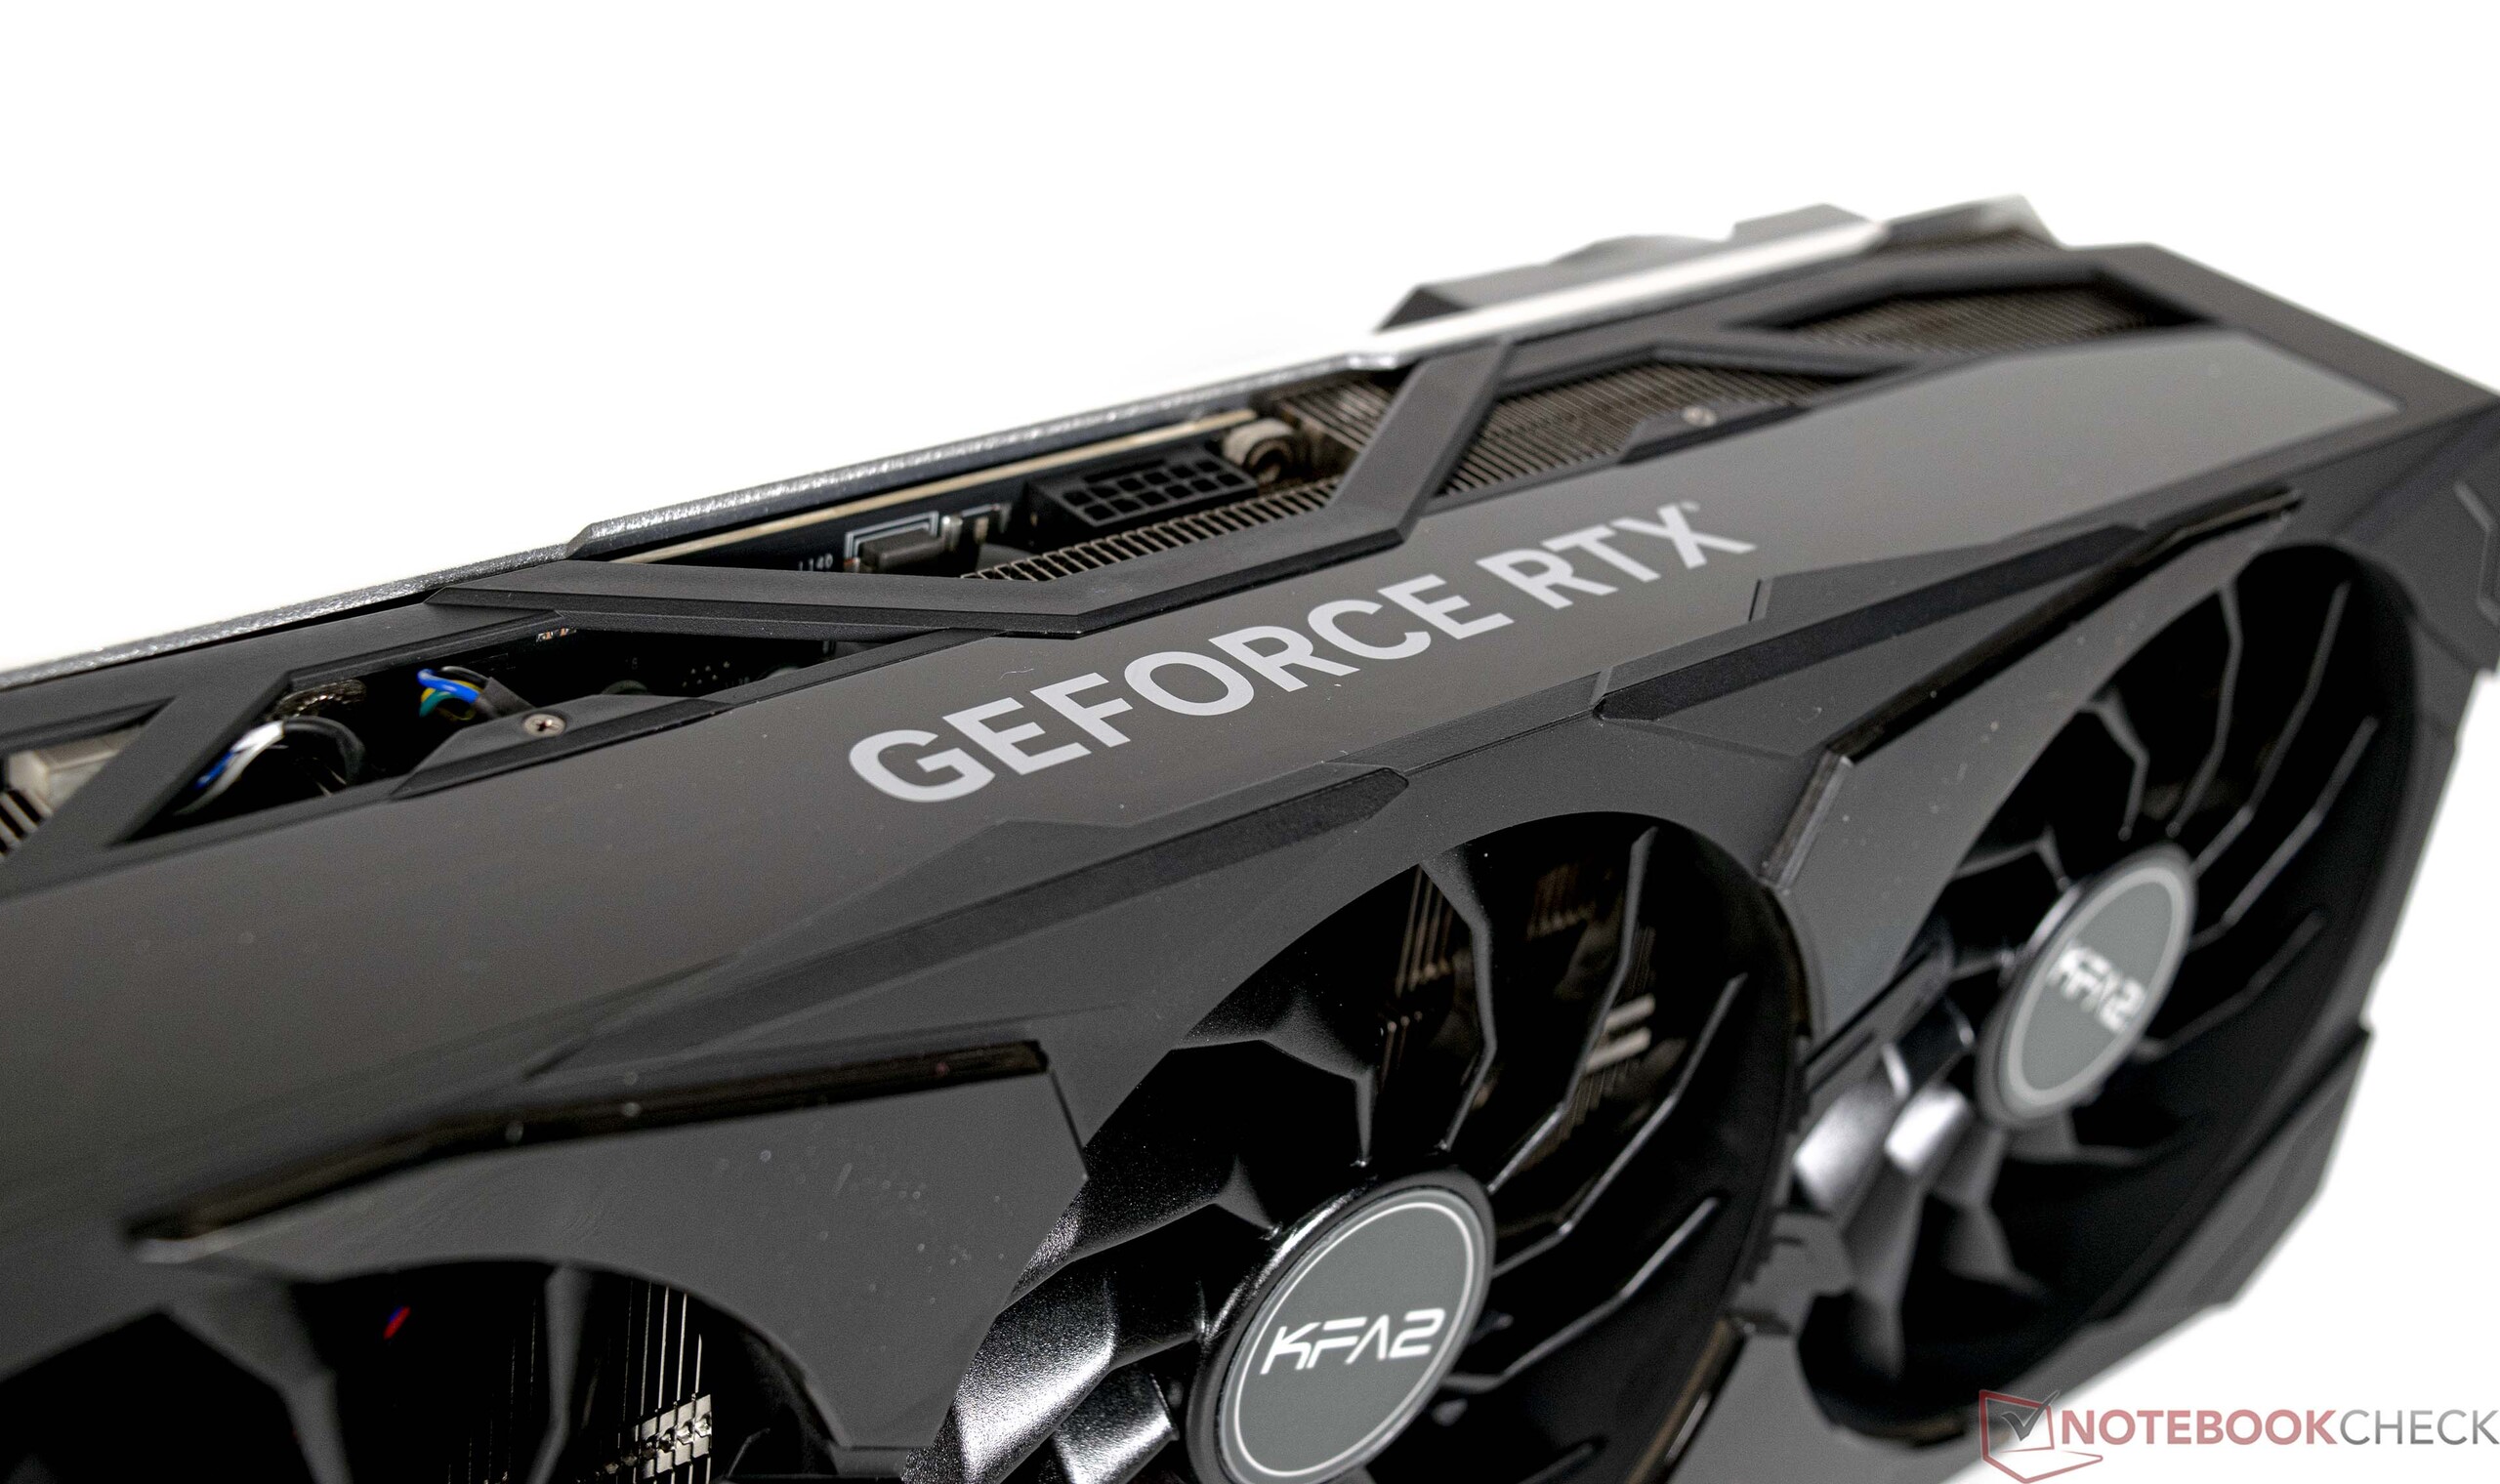
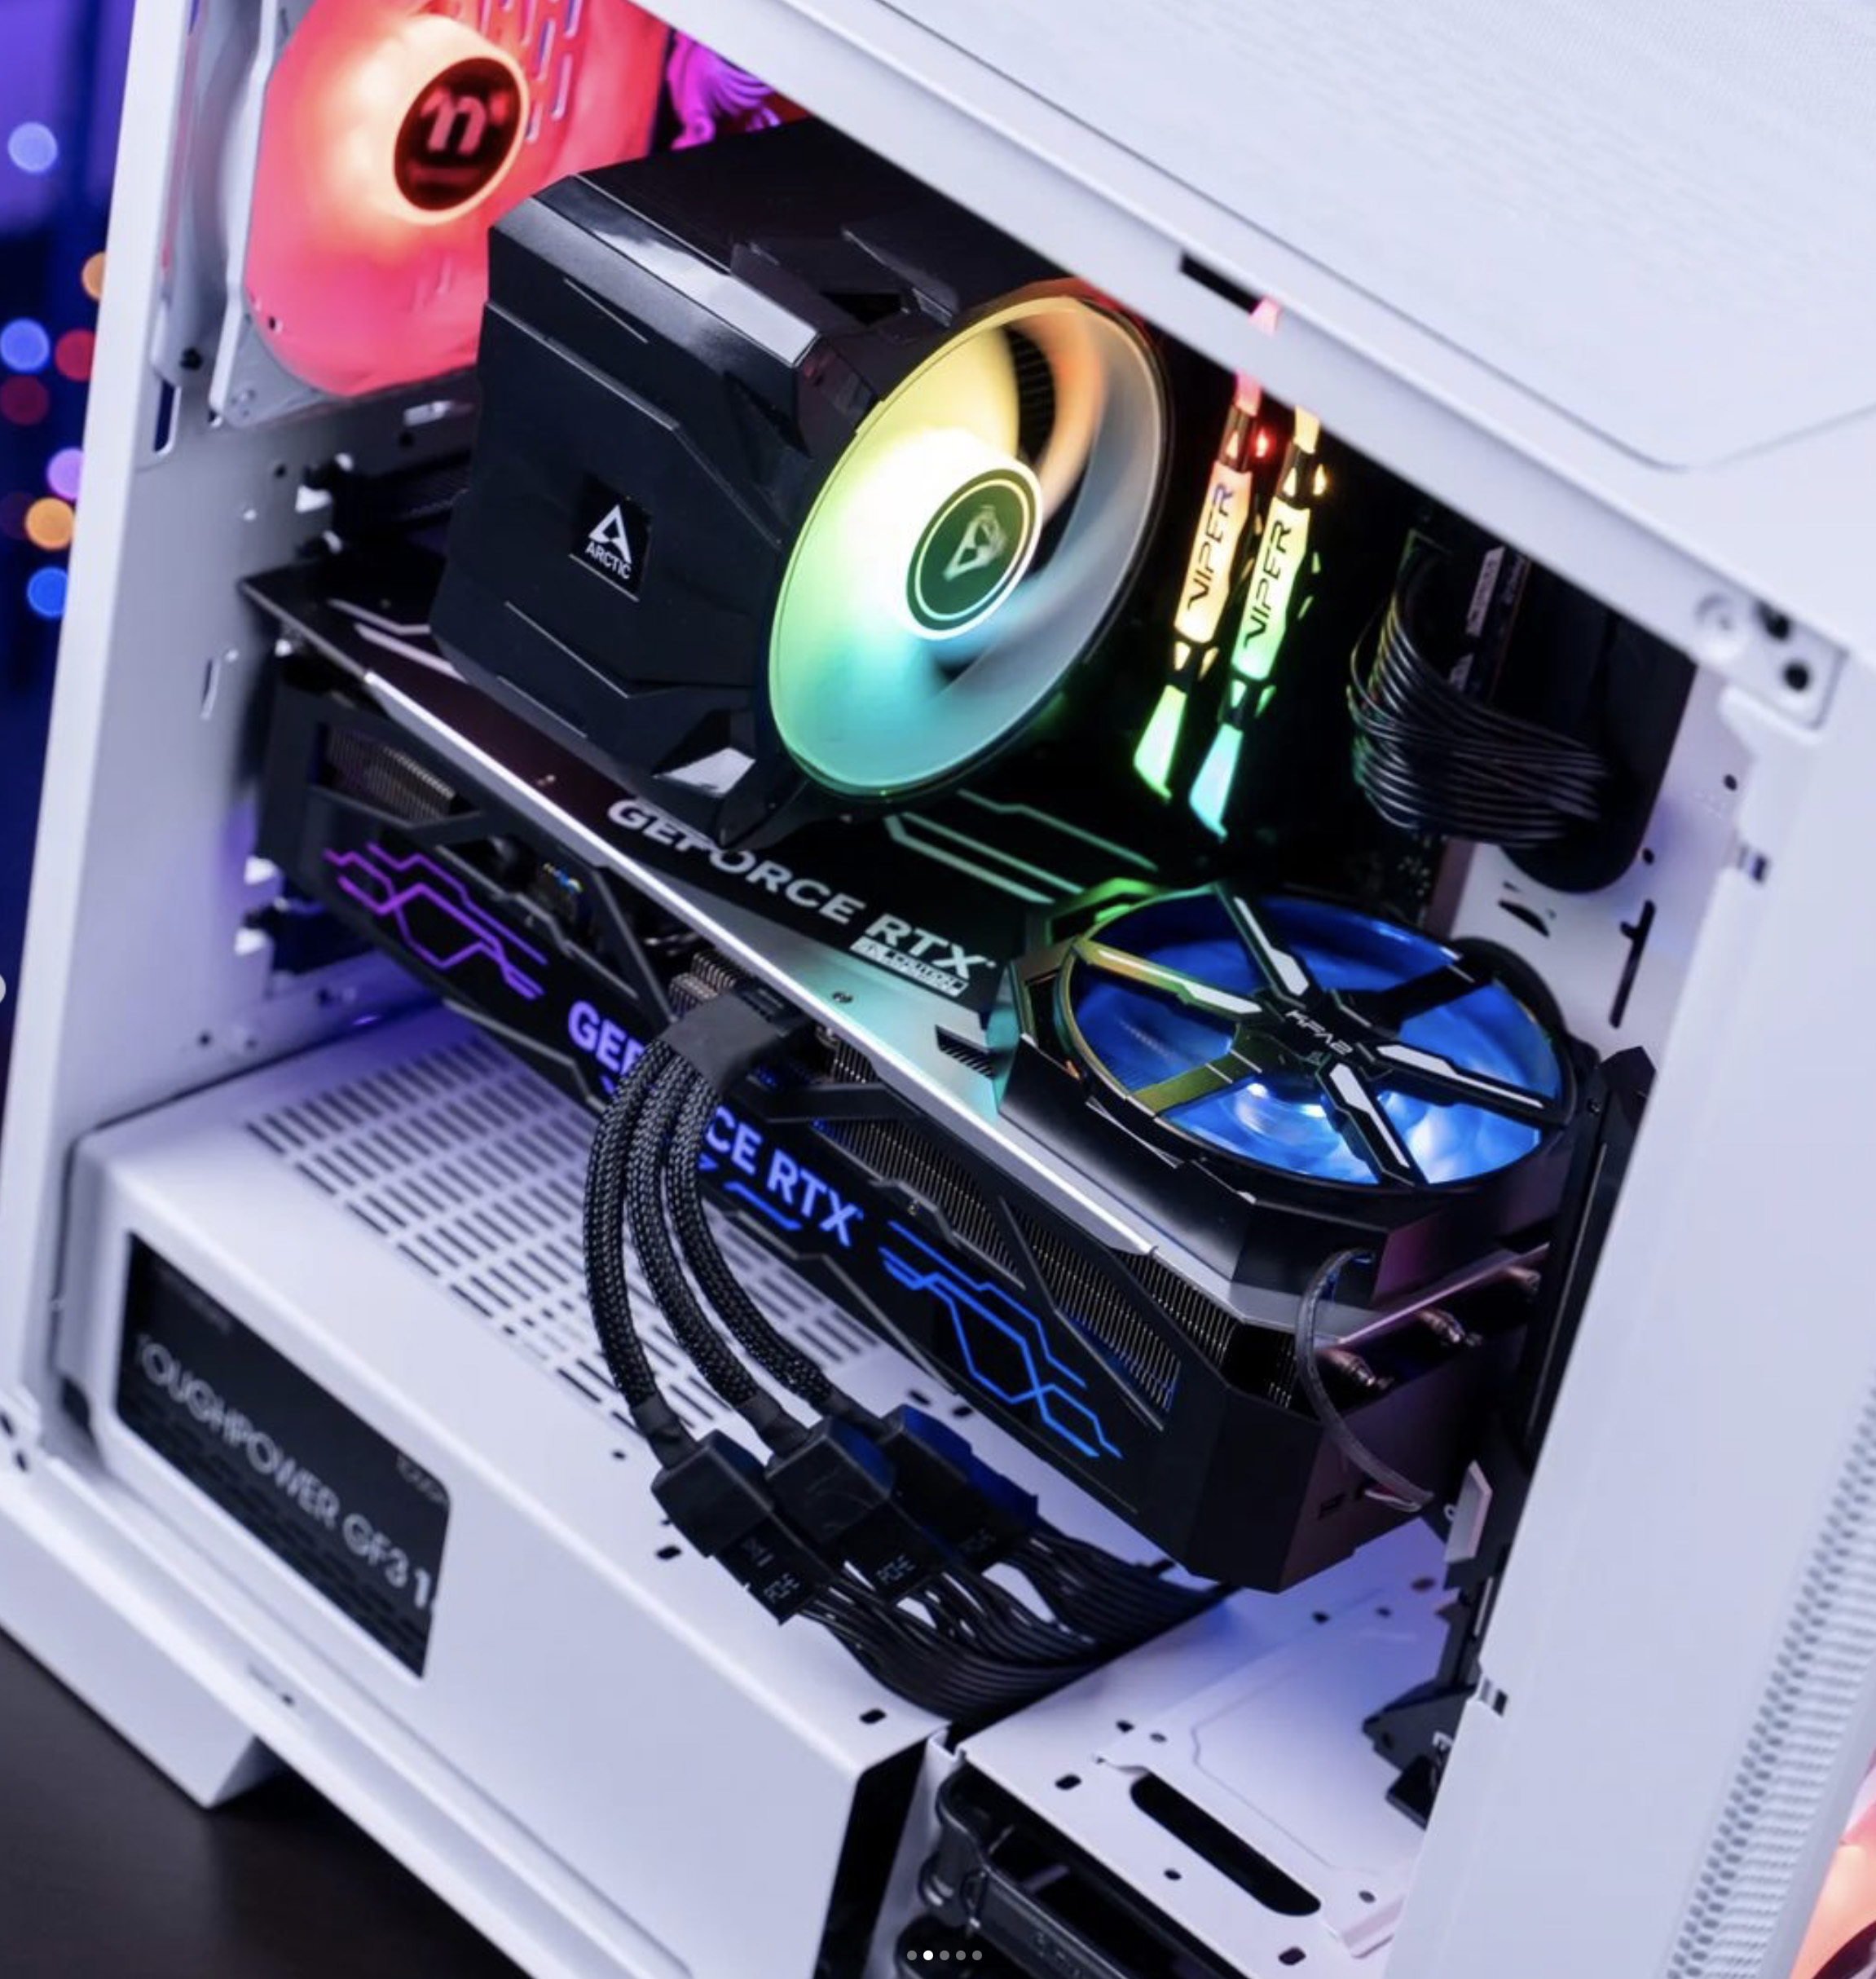
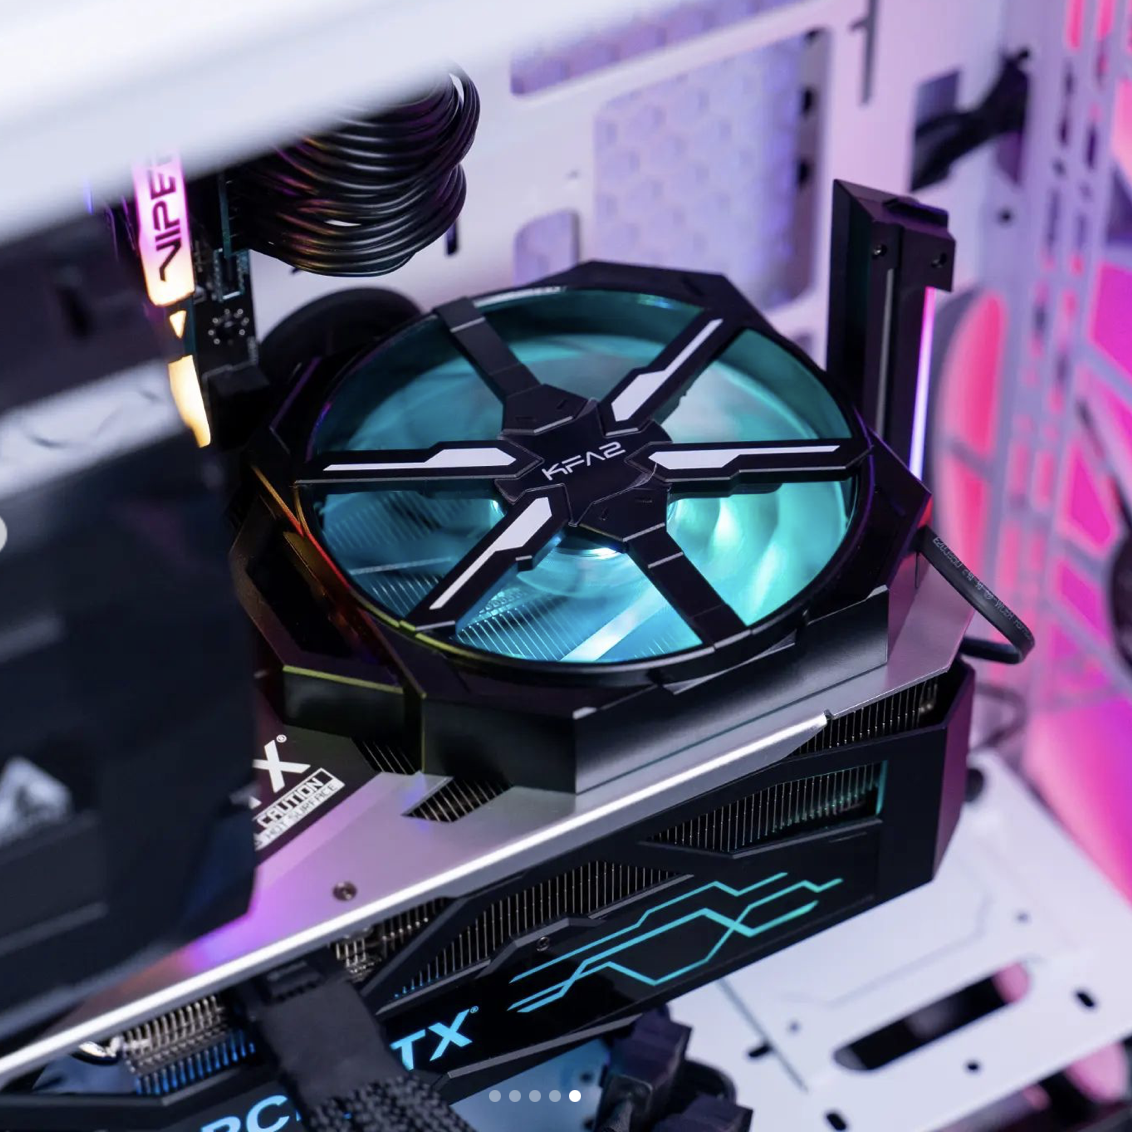
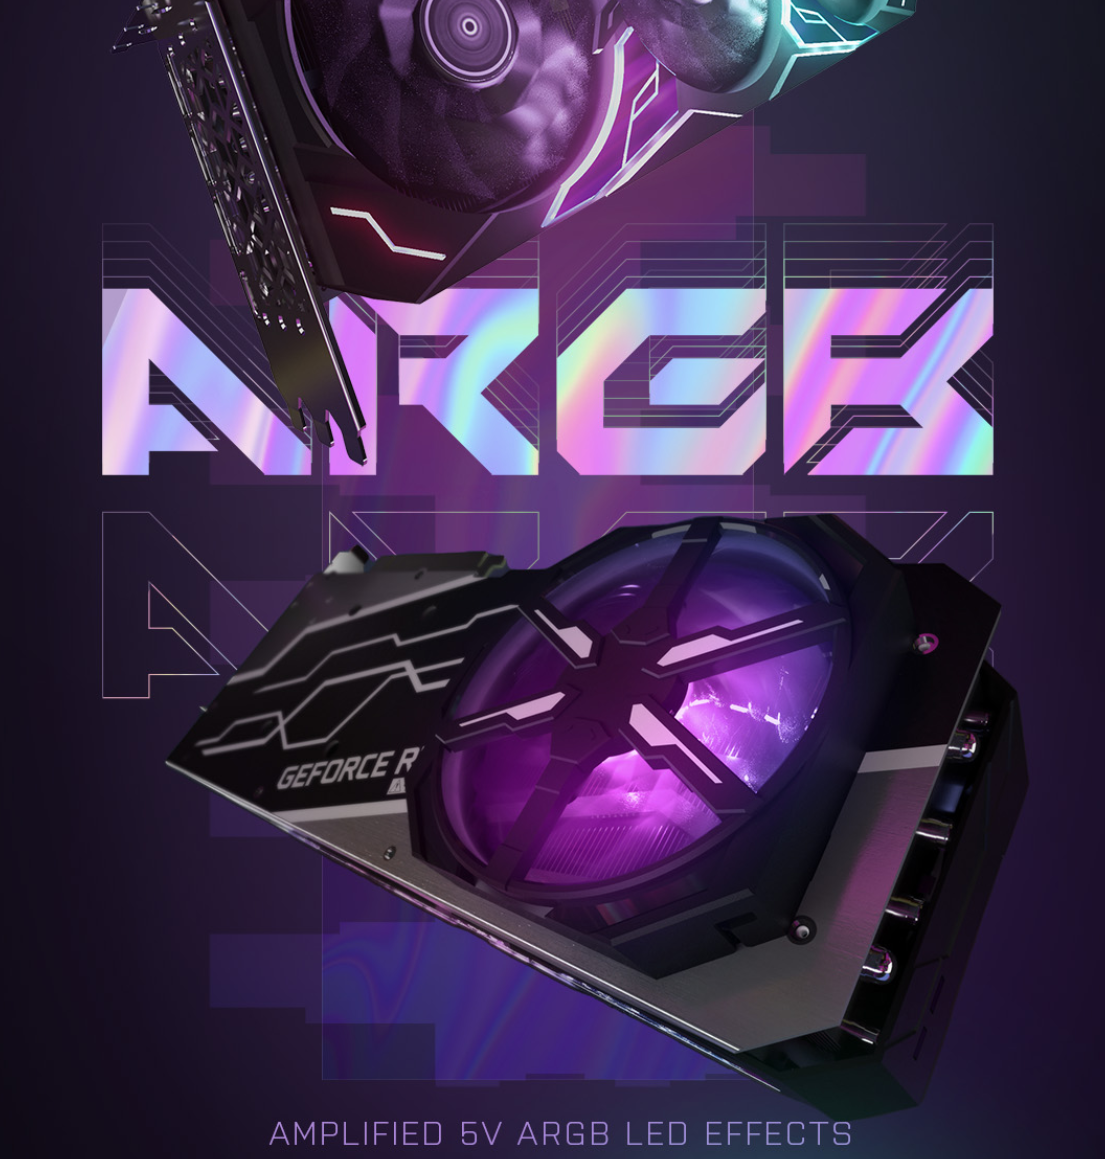
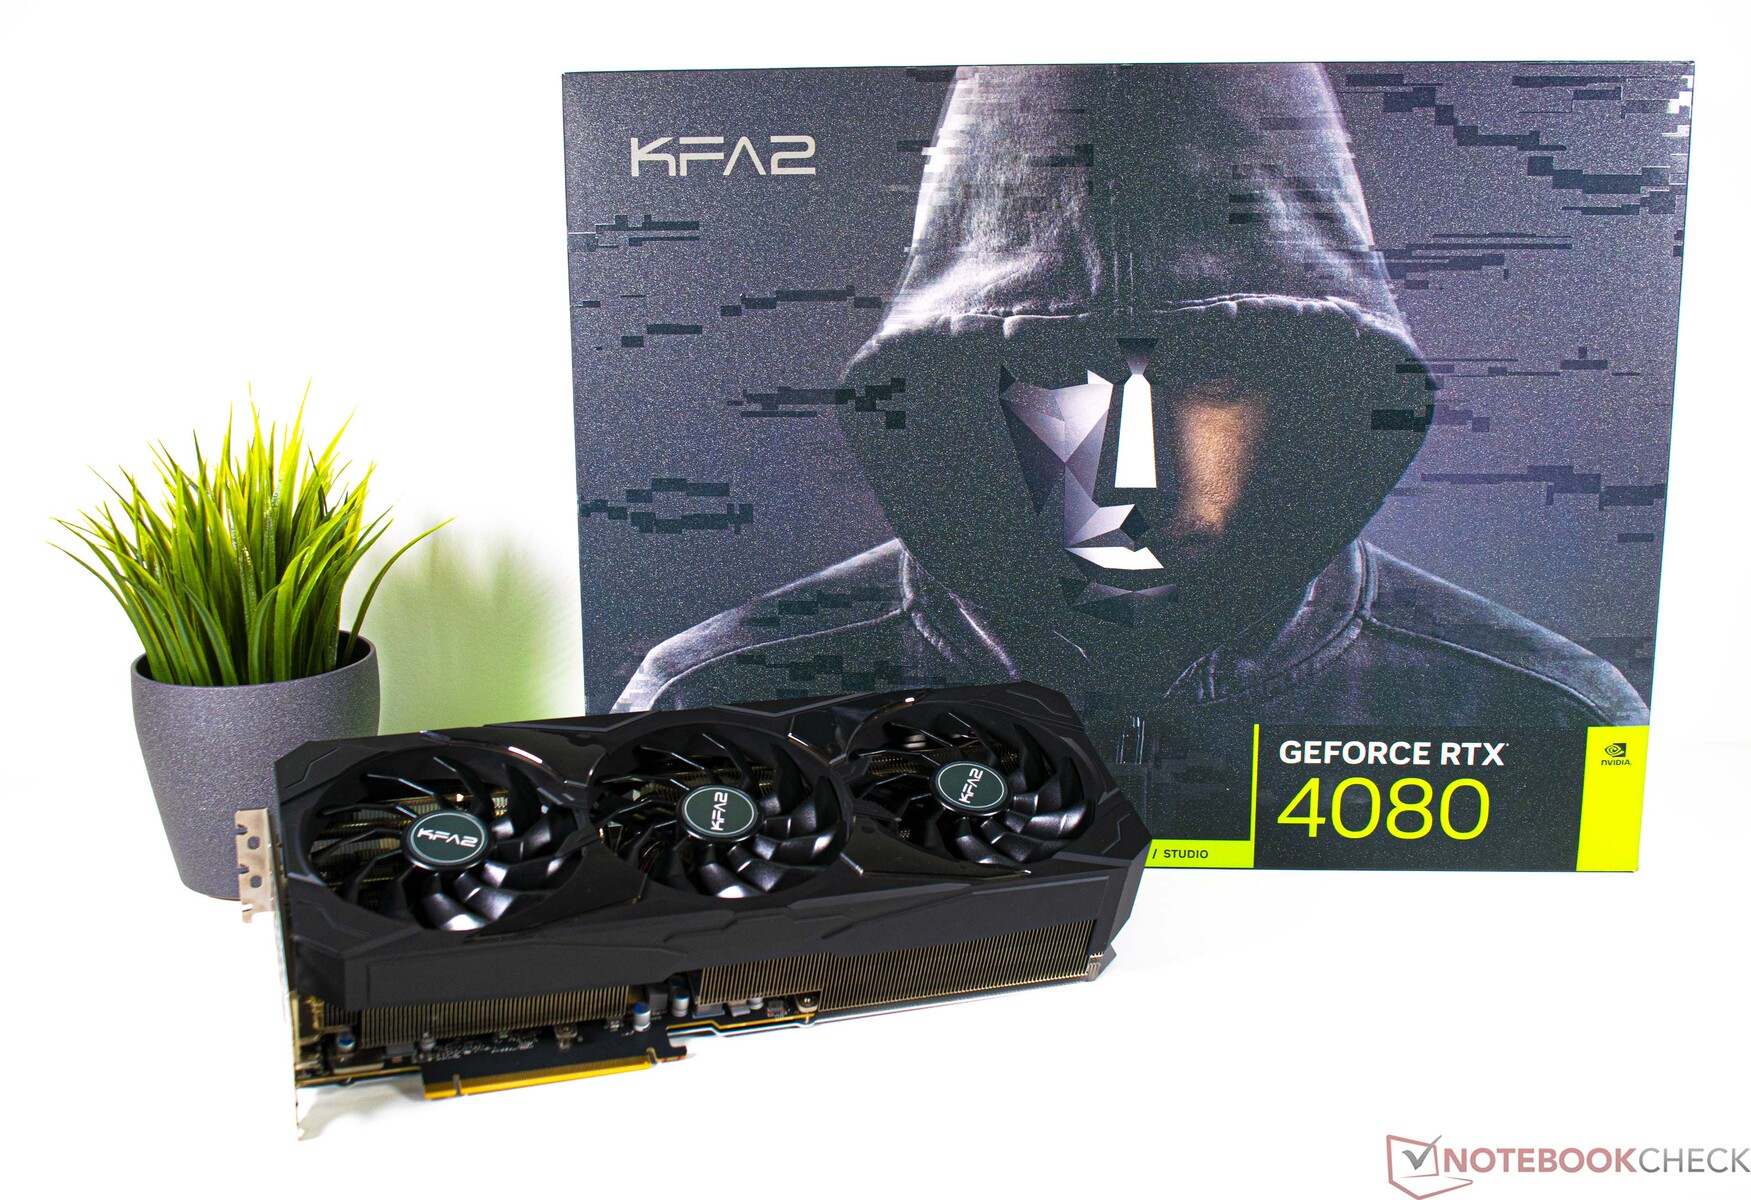
Hoewel KFA2 vaak een van de fabrikanten is met de laagste prijzen, beschouwt het bedrijf zichzelf als een concurrent van andere fabrikanten die duurdere kaarten aanbieden, zoals Asus met zijn Strix-serie en MSI met zijn Suprim-X-modellen. Helaas konden we de verschillende kaarten niet head-to-head vergelijken, omdat we nog geen Asus- of MSI-modellen in handen hebben gekregen. Toch kunnen we zeggen dat de KFA2 GeForce RTX 4080 SG hetzelfde afwerkingsniveau heeft als de KFA2 GeForce RTX 4090 SG. Ondanks een veel lager nominaal stroomverbruik dan het topmodel, is de KFA2 GeForce RTX 4080 SG uitgerust met een enorme quad-slot koeler. Er is ook een ton aan RGB-verlichting die de aandacht op de kaart vestigt. Zoals bij alle huidige RTX 40-serie modellen, wordt de RTX 4080 gevoed via de nieuwe 12VHPWR connector. KFA2 heeft hier niets anders gedaan en heeft een passende 3x6+2 pin PCIe naar 12VHPWR adapter meegeleverd.

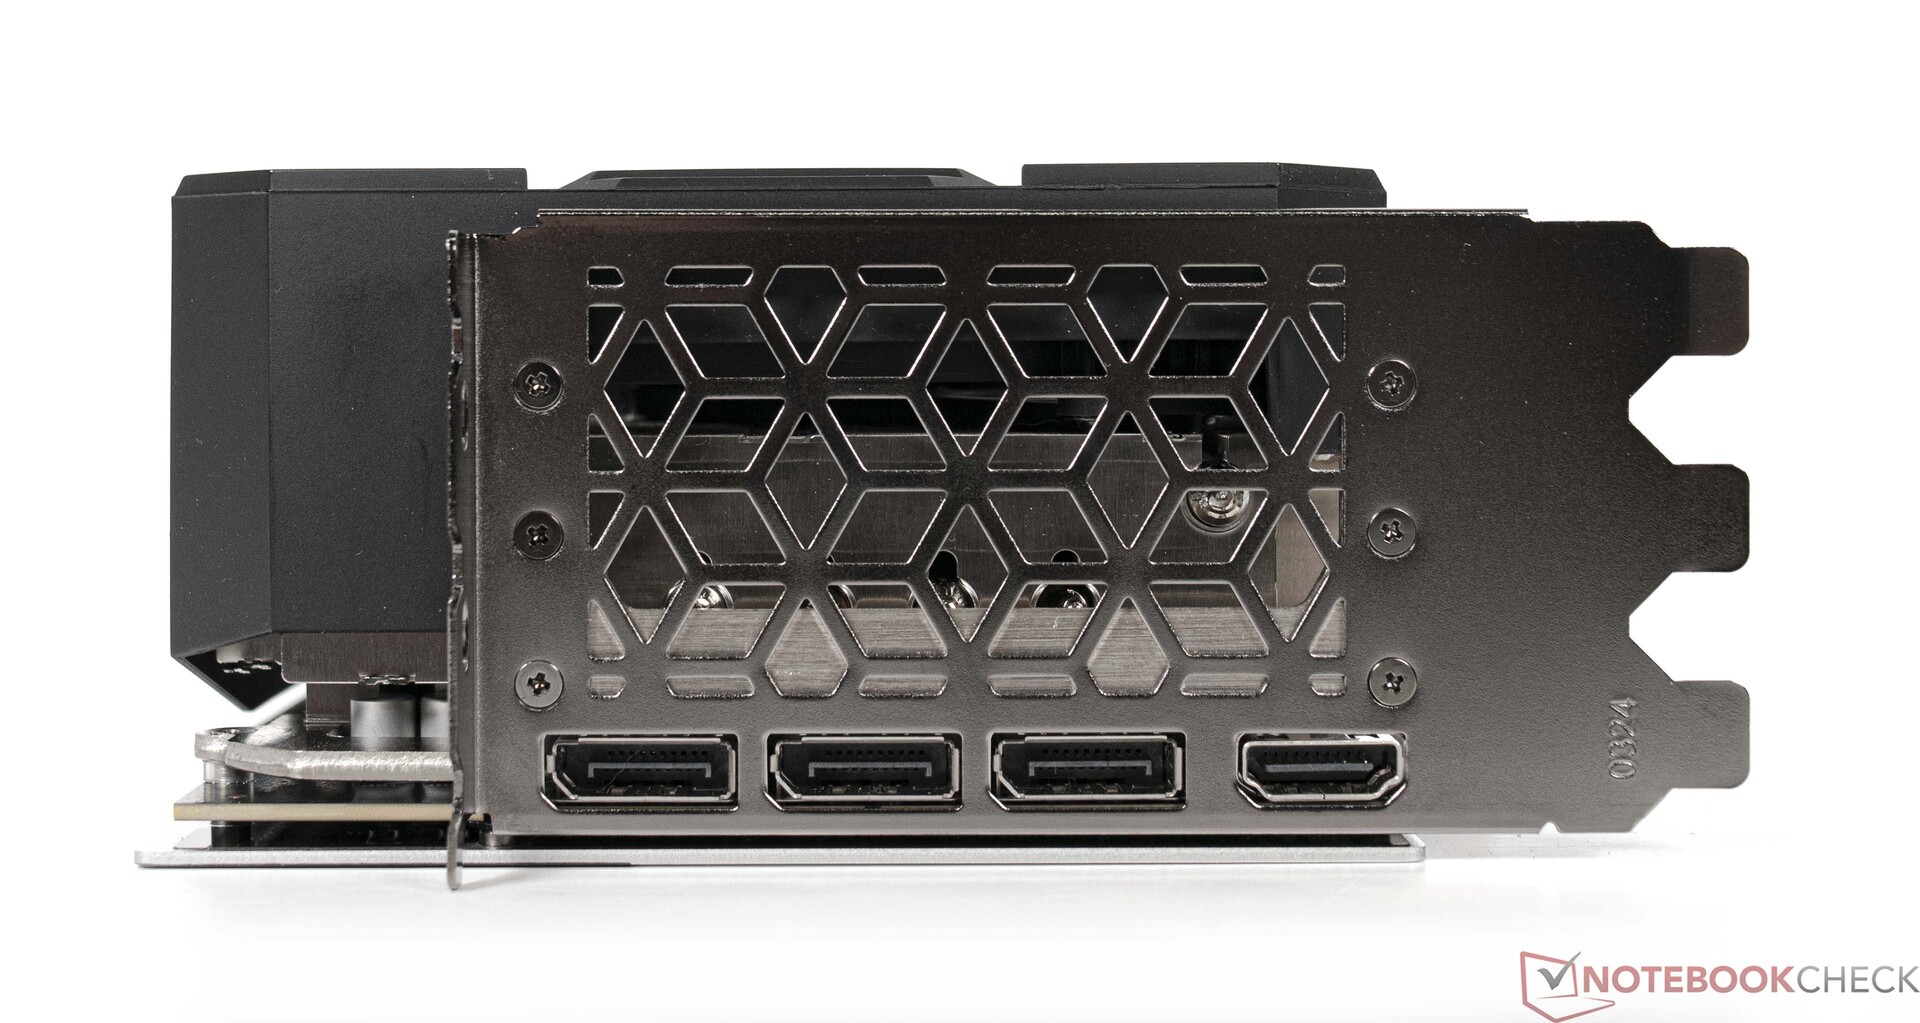
Aan de buitenkant is de KFA2 GeForce RTX 4080 SG voorzien van 1x HDMI 2.1a poort en 3x DisplayPort 1.4a.

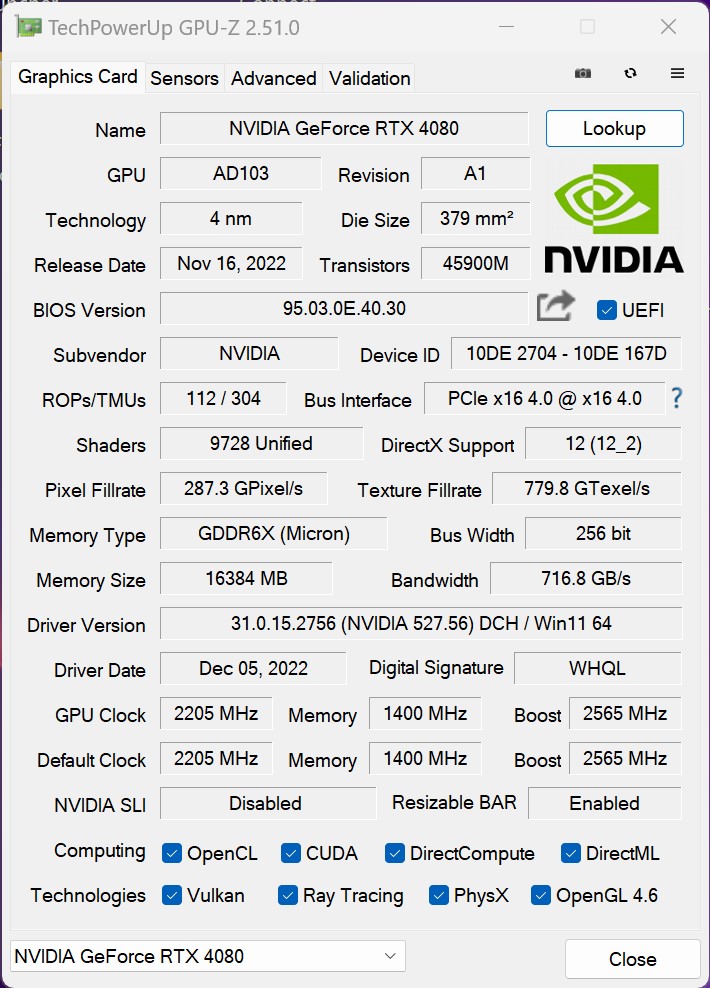
GPU specs vergelijking

Specificatie RTX 4090 (FE) RTX 4080 KFA2 RTX 4080 RTX 3090 Ti RTX 3090 (FE) RTX 3080 Ti (FE) RTX 3080 (FE) Titan RTX
Chip AD102 AD103 AD103 GA102 GA102 GA102 GA102 TU102
FinFET-proces 4 nm 4 nm 4 nm 8 nm 8 nm 8 nm 8 nm 12 nm
CUDA cores 16.384 9.728 9.728 10.752 10.496 10.240 8.704 4.608
Textuureenheden 512 304 304 336 328 320 272 288
Tensor cores 512 4. Gen. 304 4. Gen. Gen. 304 4. Gen.Gen. 336 3. Gen. 328 3. Gen. Gen. 320 3. Gen. Gen. 272 3. Gen. Gen. 576 2. Gen.
RT-kernen 128 76 76 84 82 80 68 72
GPU basisklok 2.235 MHz 2.205 MHz 2.205 MHz 1.560 MHz 1.395 MHz 1.365 MHz 1.440 MHz 1.350 MHz
GPU boost clock 2.520 MHz 2.505 MHz 2.565 MHz 1.860 MHz 1.695 MHz 1.665 MHz 1.710 MHz 1.770 MHz
Geheugenbus 384 bit 256 bit 256 bit 384 bit 384 bit 384 bit 320 bit 384 bit
Geheugenbandbreedte 1.008 GB/s 716,8 GB/s 716,8 GB/s 1.008 GB/s 936 GB/s 912,4 GB/s 760 GB/s 672 GB/s
Videogeheugen 24 GB GDDR6X 16 GB GDDR6X 16 GB GDDR6X 24 GB GDDR6X 24 GB GDDR6X 12 GB GDDR6X 10 GB GDDR6X 24 GB GDDR6
Stroomverbruik 450 W 320 W 320 W 450 W 350 W 350 W 320 W 280 W

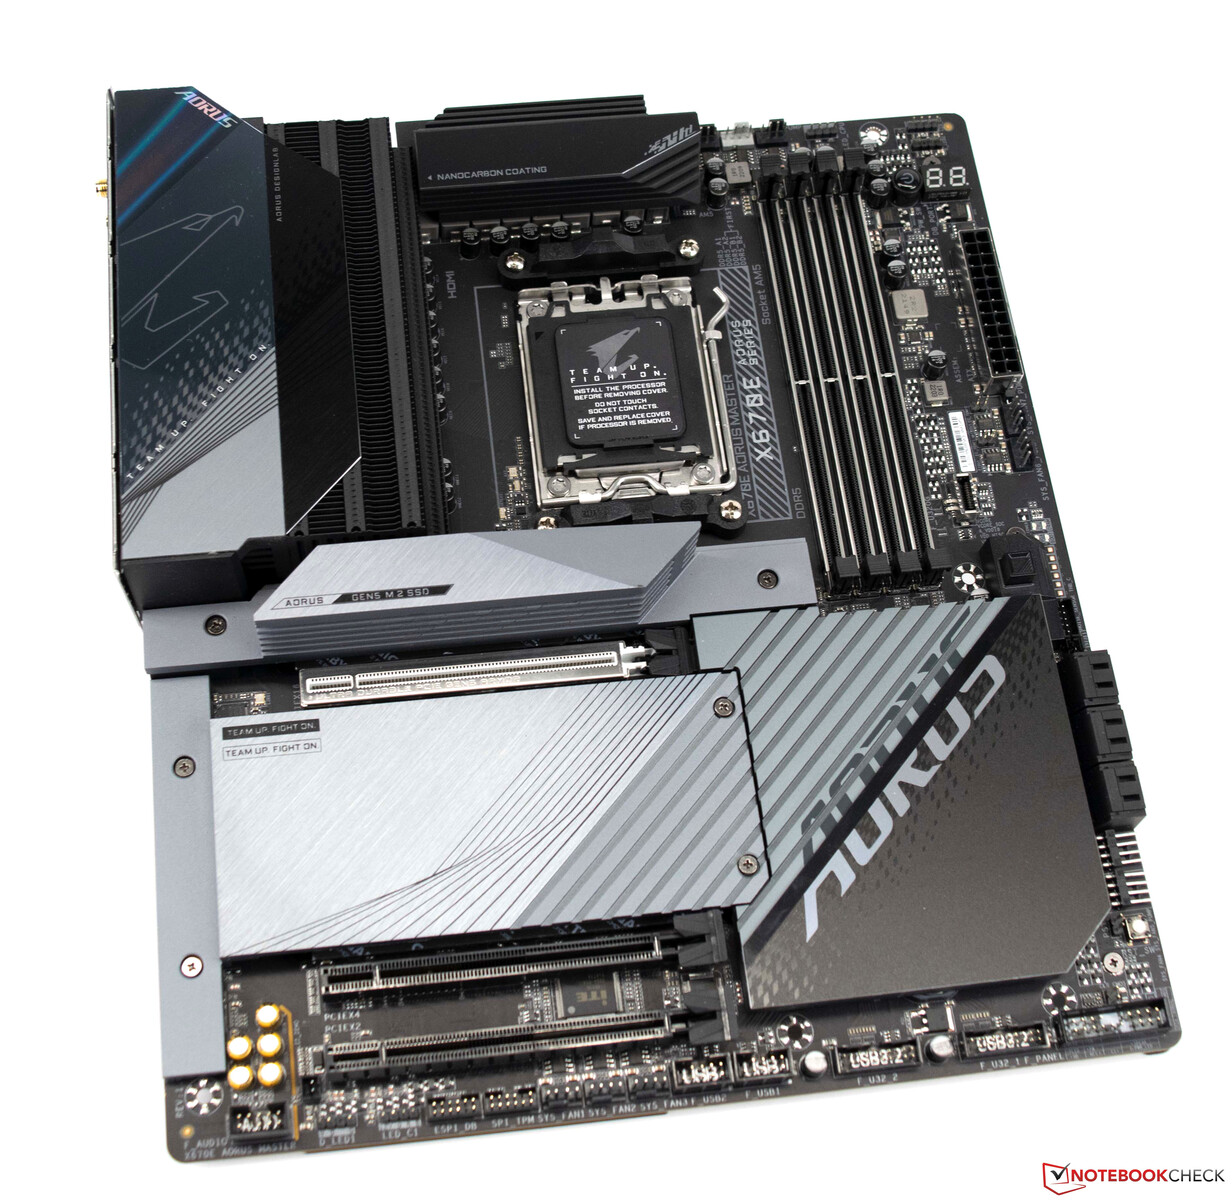
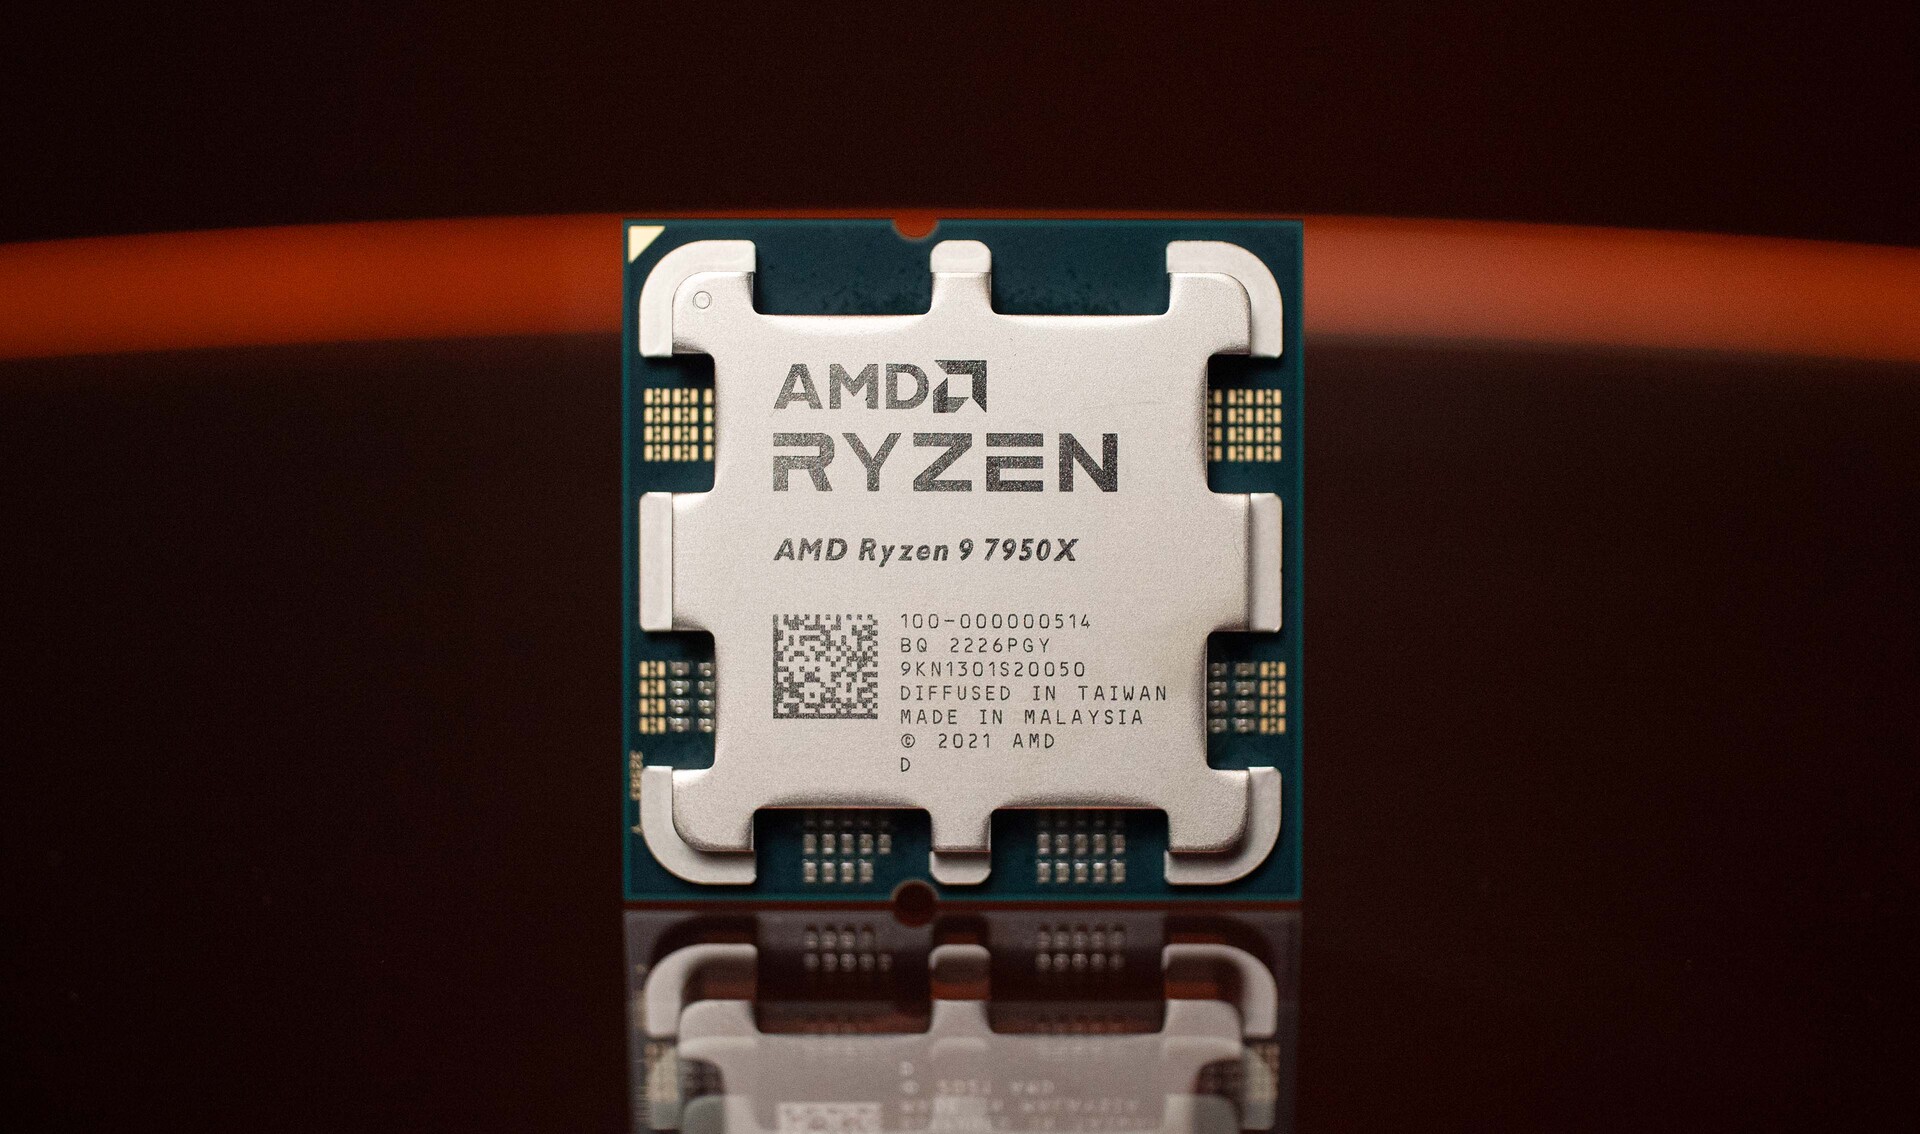
Ons testsysteem is gebaseerd op AMD Ryzen 9 7950X

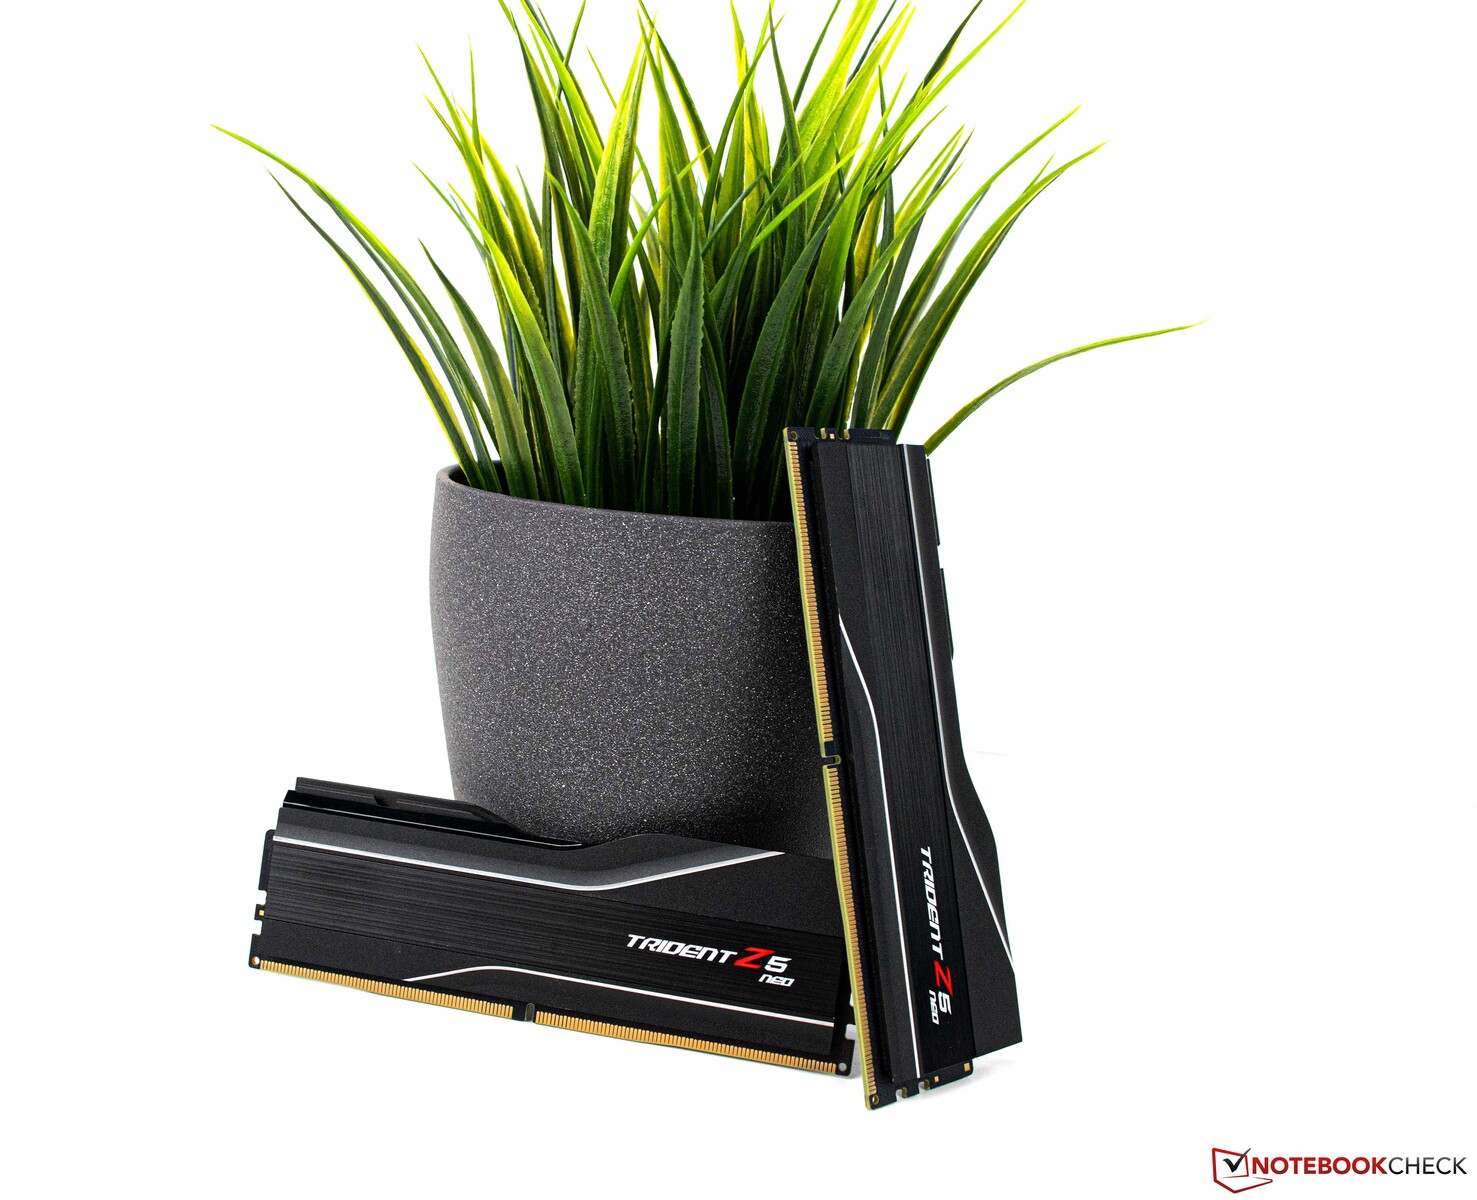
Ons testsysteem heeft een Gigabyte X670E Aorus Master-moederbord in combinatie met een krachtige AMD CPU (Ryzen 9 7950X), die wordt gekoeld door een Alphacool AIO-oplossing (Alphacool Eisbaer Aurora 360 mm). Het systeem heeft 32 GB G.Skill geheugen dat draait op een passend EXPO profiel en is aangesloten op een Gigabyte M32U monitor.

Gigabyte X670E Aorus Master
AMD Ryzen 9 7950X
AMD Ryzen 9 7950X
G.Skill Trident Z5 Neo

Gedetailleerde specificaties van het testsysteem

We hebben het volgende systeem gebruikt voor de benchmarks en tests in deze review:

  • Lian-Li O11 Dynamic
  • AMD Ryzen 9 7950X
  • Gigabyte X670E Aorus Master, BIOS: F8a
  • Alphacool Eisbear 360 AIO
  • Corsair RM 1000x voeding
  • G.Skill Trident Z5 Neo DDR5-6000 2x 16 GB, EXPO (DDR5-6000 CL30-38-38-96)
  • Corsair MP600 2 TB
  • Crucial MX500 2 TB
  • Microsoft Windows 11 Professional 64-Bit (versie 22H2)

Details over de KFA2 GeForce RTX 4080 SG

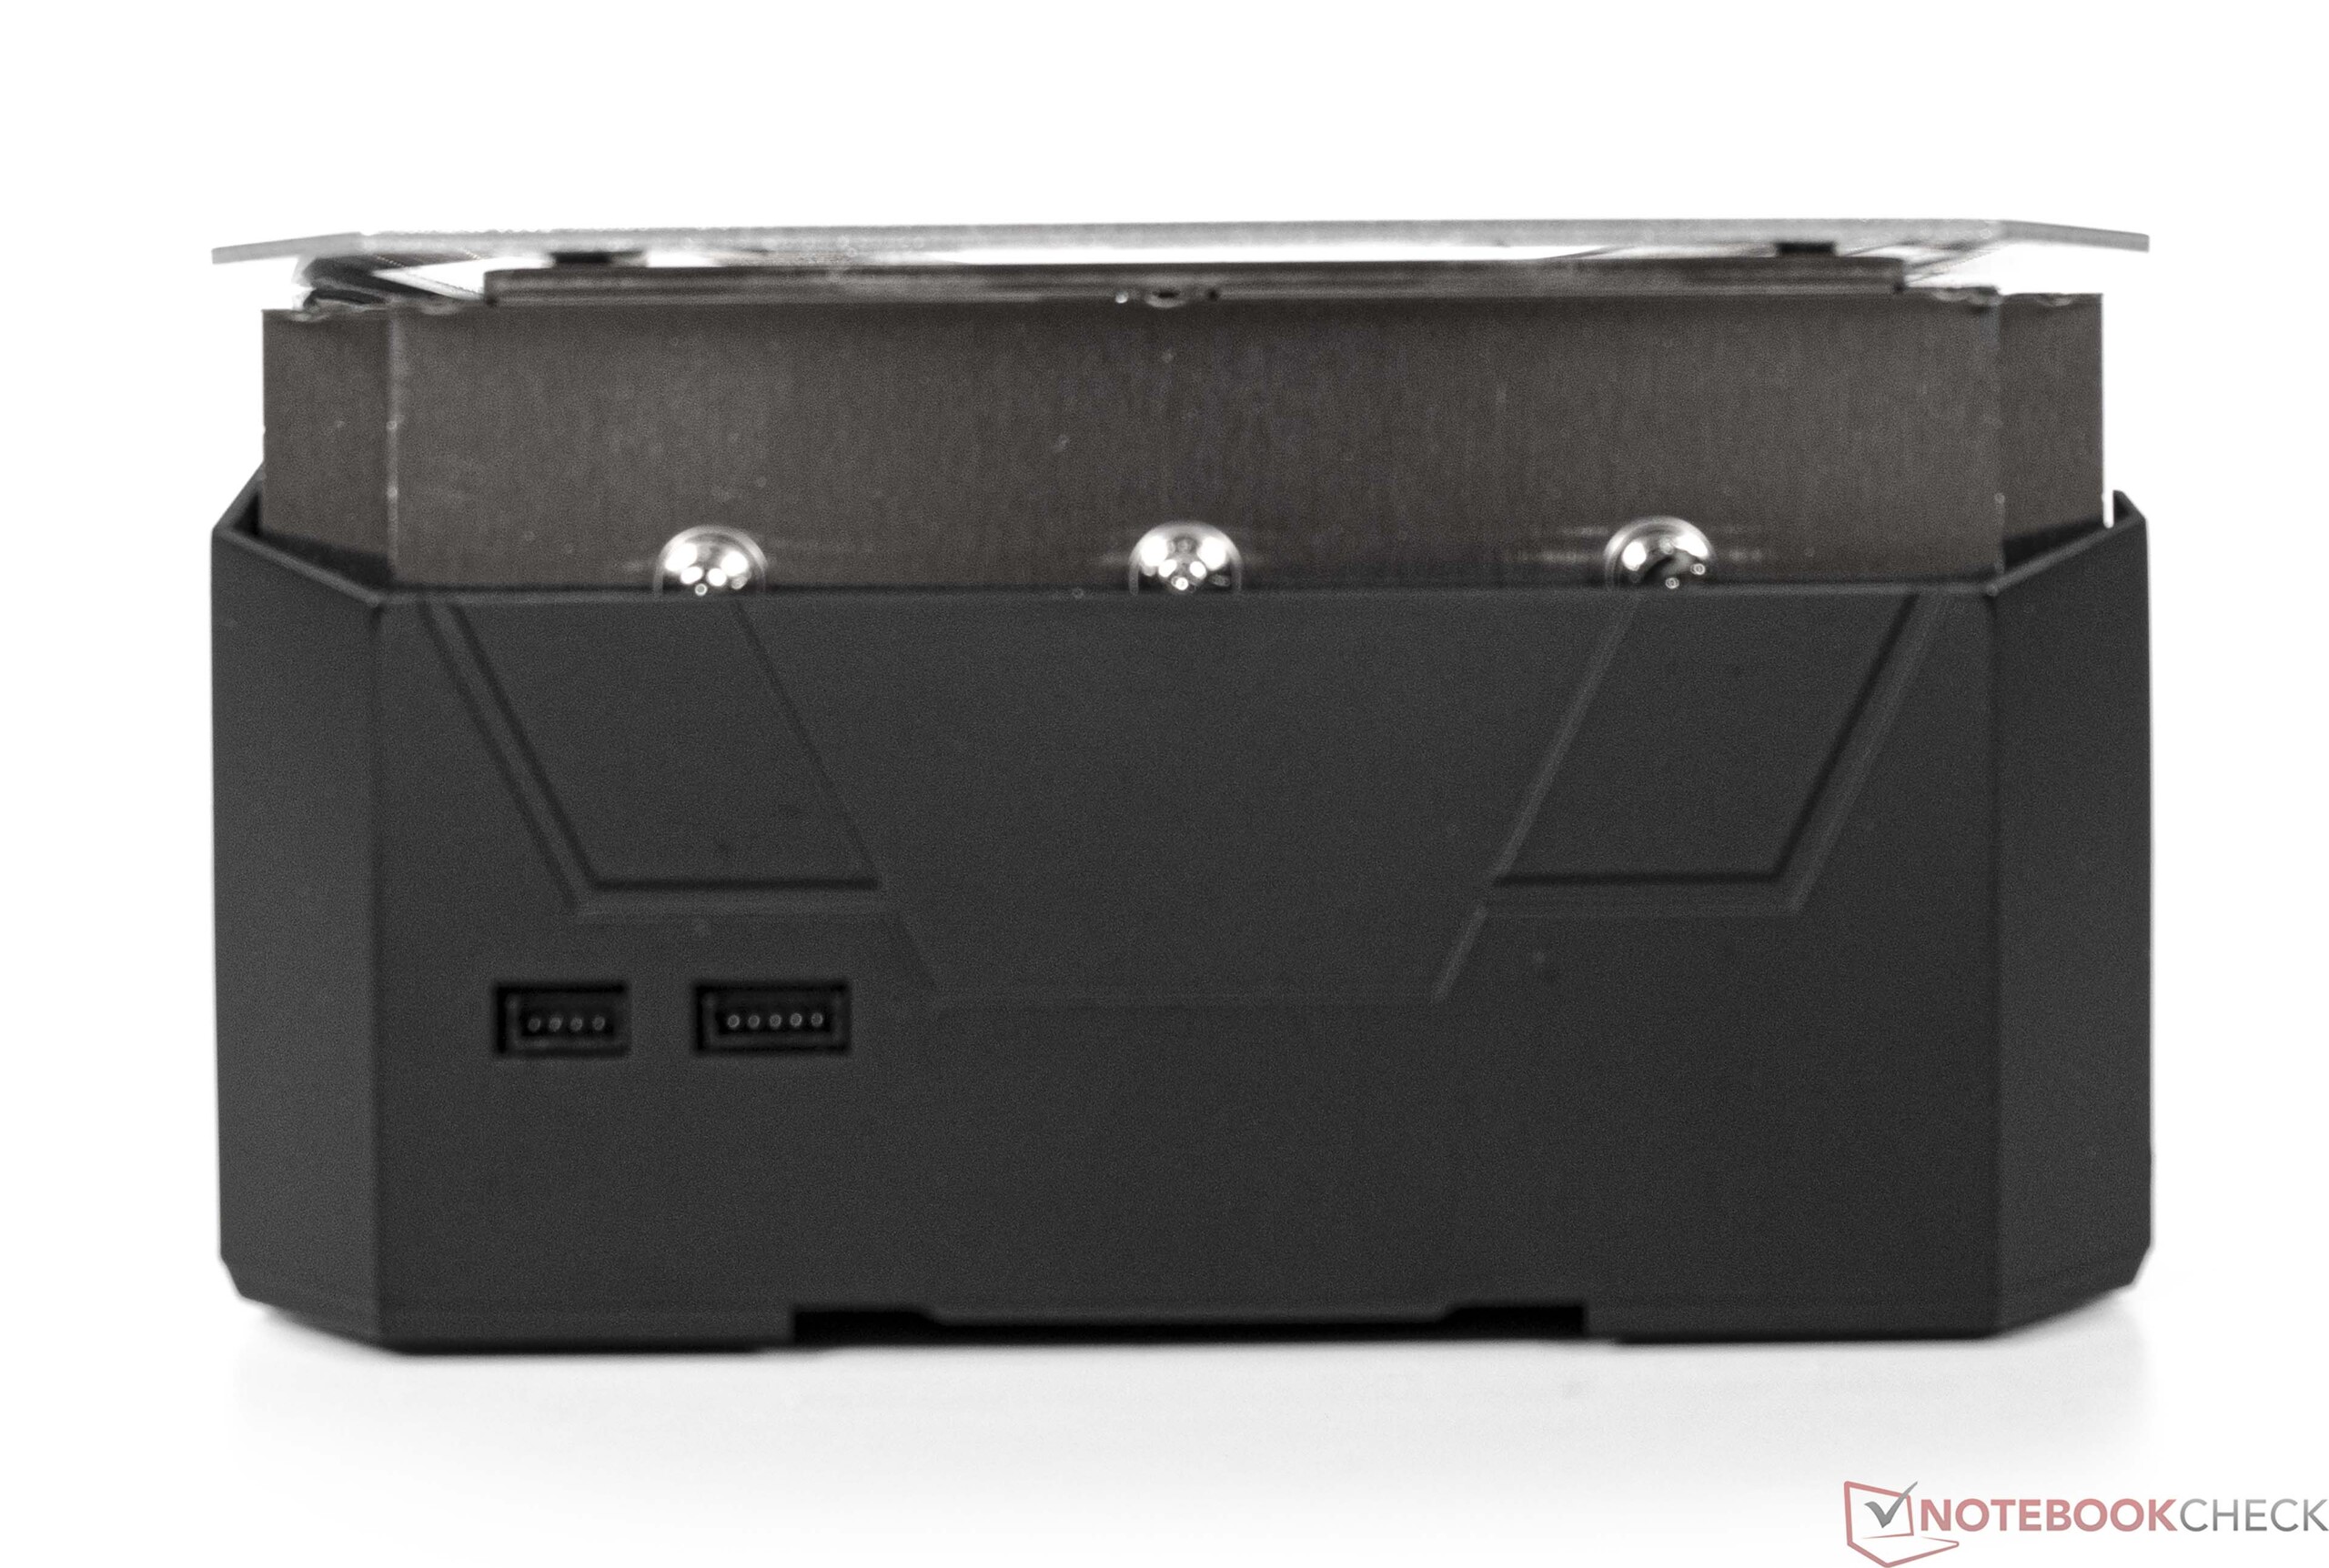
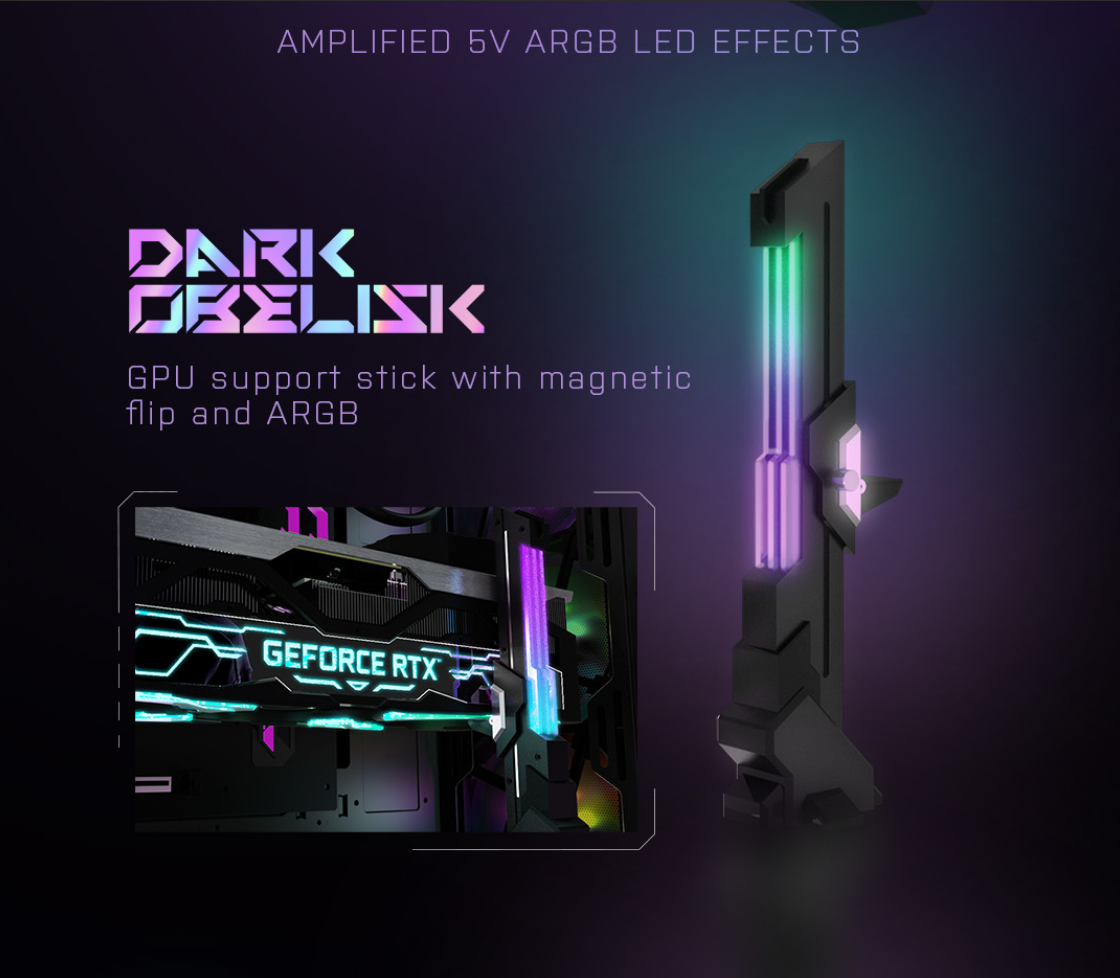
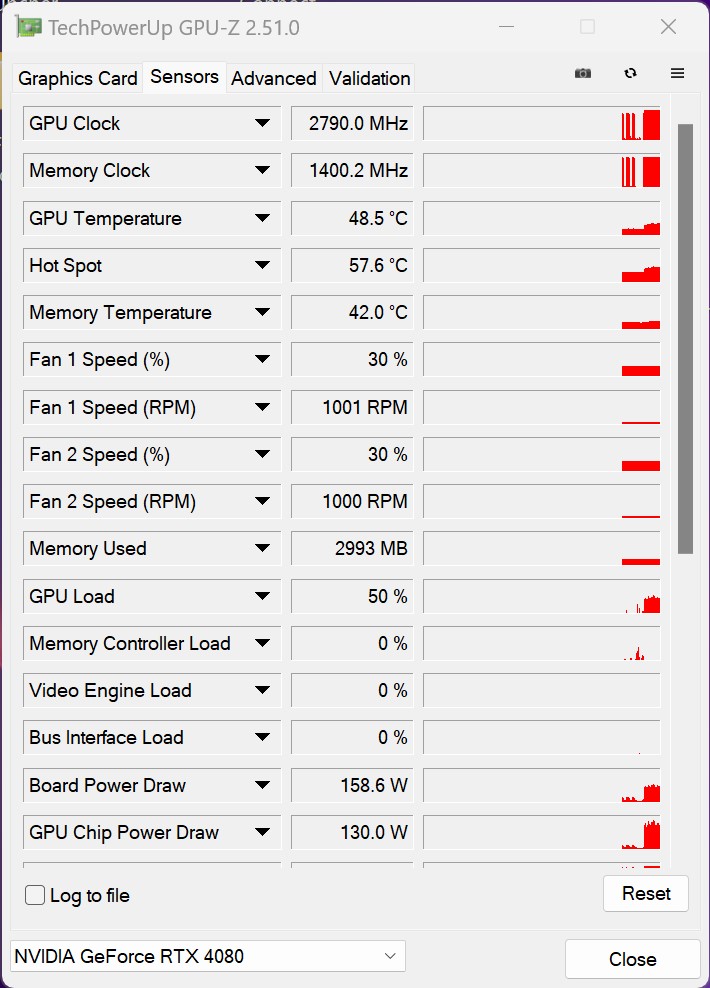
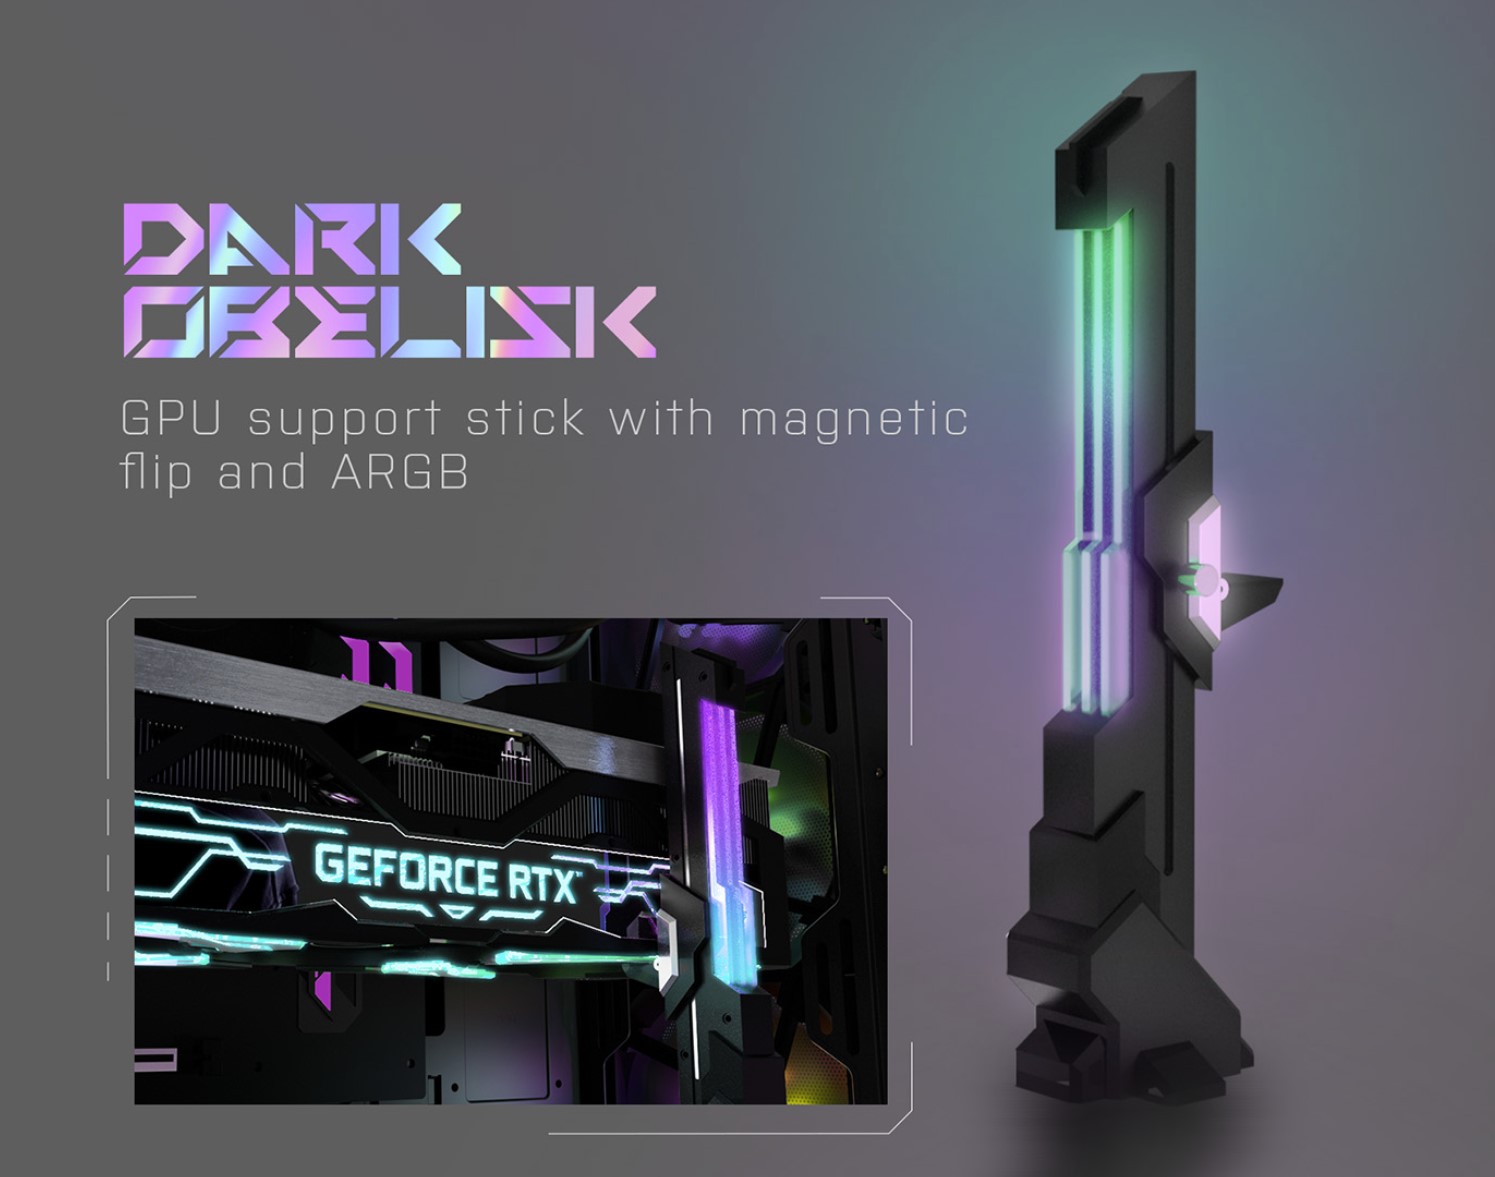
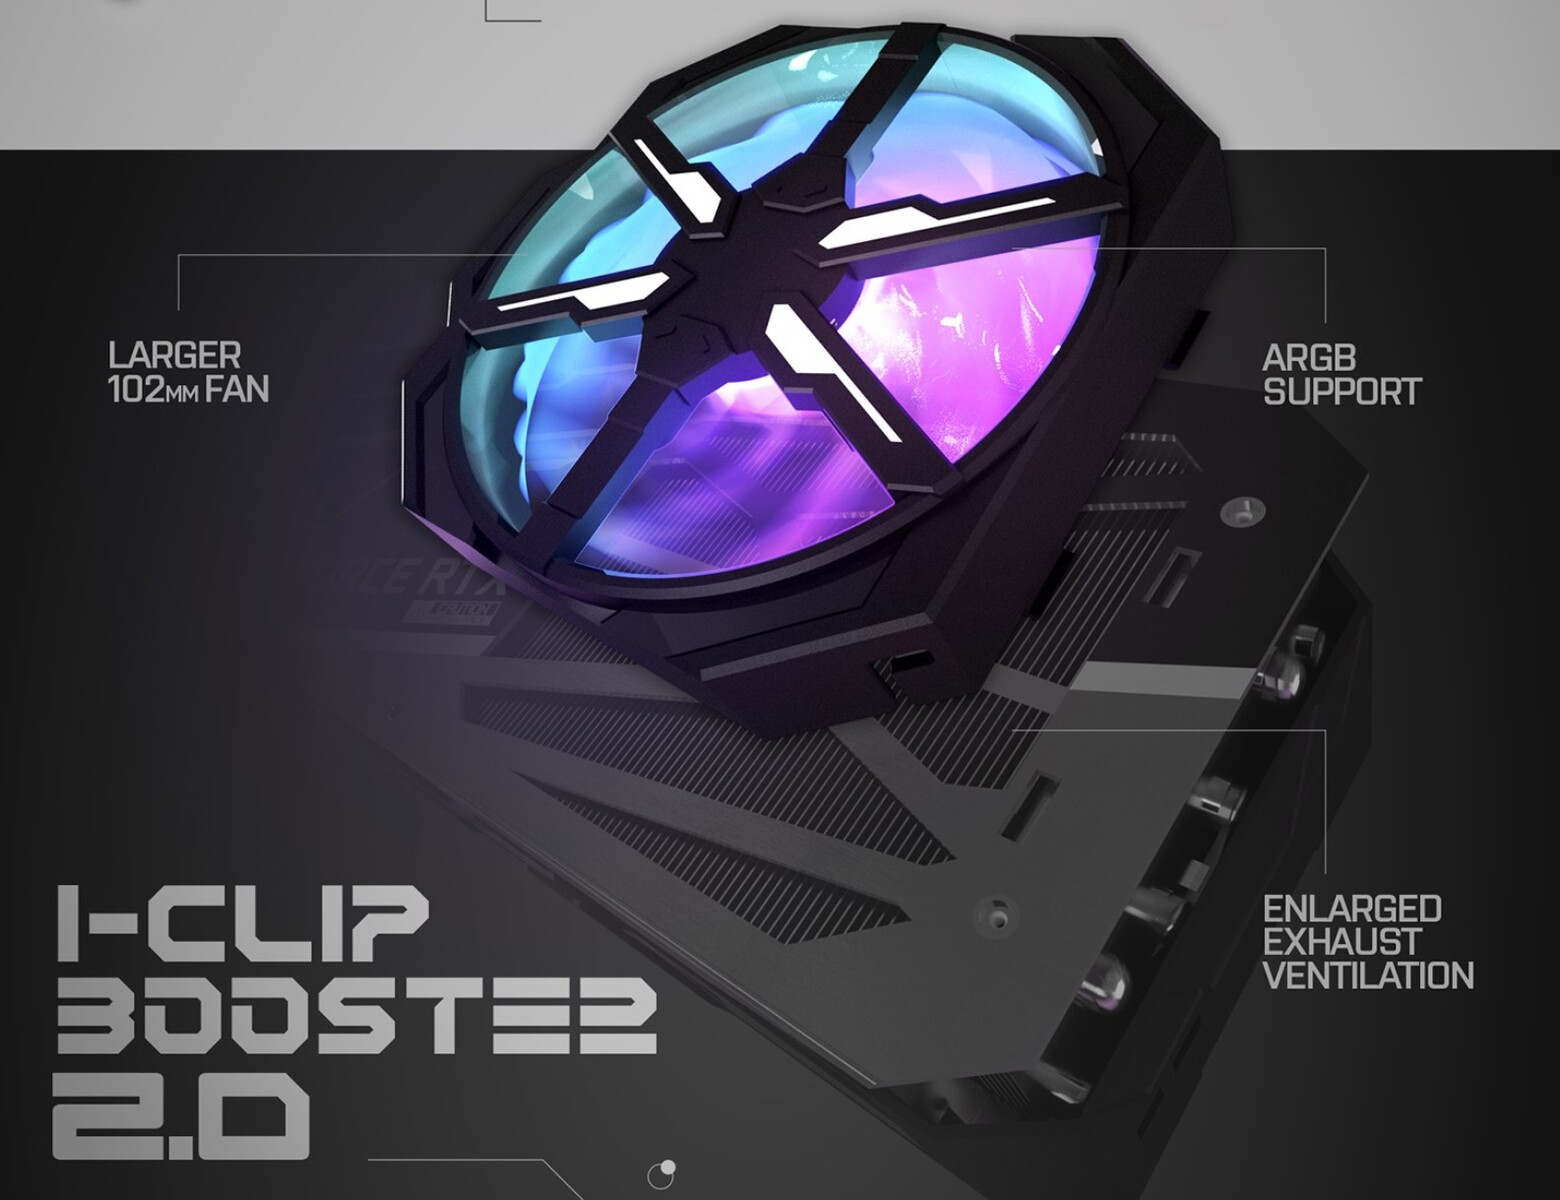
KFA2 heeft de GeForce RTX 4080 SG iets hogere kloksnelheden gegeven dan door Nvidia gespecificeerd - de maximale boost klok is met 60 MHz verhoogd om precies te zijn. Maar dit is niet relevant in de praktijk, omdat we consequent hogere snelheden wisten te bereiken tijdens onze tests. Gemiddeld zagen we GPU-kloksnelheden van ongeveer 2,8 GHz tijdens het gamen. Met de lichtgewicht Xtreme Tuner tool kunnen gebruikers de ventilatoren en verlichting van de grafische kaart regelen. Voor onze tests hebben we de standaardinstellingen echter niet gewijzigd. De 1-Click OC functie die vaak op KFA2 modellen te vinden is, is meer voor de show. In echte toepassingen maakt het verhogen van de GPU-snelheid met slechts 15 MHz nauwelijks verschil. We hopen dat deze functie in de toekomst aanzienlijk meer oplevert. Behalve de grafische kaart zelf, vindt u in de doos ook een optionele ventilator die ontworpen is om op de achterkant van de kaart te worden gemonteerd. Jammer genoeg is de ventilator niet compatibel met ons moederbord, waardoor we hem niet kunnen gebruiken in onze review. Het bedrijf heeft ook een GPU-beugel (ARGB Dark Obelisk) meegeleverd. Dit item is uitgerust met geïntegreerde RGB-verlichting en past daarom goed bij het algehele ontwerp van de KFA2 GeForce RTX 4080 SG.

GPU-Z
GPU-Z
GPU-Z
GPU-Z
GPU-Z
GPU-Z
ARGB Dark Obelisk - GPU-beugel (bron: KFA2)
optionele ARGB-ventilator voor de achterkant (bron: KFA2)

Synthetische benchmarks

In synthetische tests leverde de KFA2 GeForce RTX 4080 SG precies dezelfde prestaties als de Founders Edition van Nvidia. De KFA2-kaart presteerde elf procent beter dan een AMD Radeon RX 7900 XT. AMD's vlaggenschip GPU, de Radeon RX 7900 XTX, ligt binnen hetzelfde prestatiebereik en is slechts verwaarloosbaar sneller dan onze recensie-eenheid. Na een enorme prestatie sprong van de GeForce RTX 3090 naar de RTX 4090, zagen we een vergelijkbare prestatiewinst toen we de RTX 4080 vergeleken met de RTX 3080 Ti. In totaal levert Nvidia's Ada Lovelace-architectuur maar liefst 26 procent meer prestaties dan Ampere.

Qua rekenprestaties heeft Nvidia soms duidelijk de overhand, terwijl AMD in andere gevallen duidelijk beter is. Wie dus vooral op zoek is naar hoge rekenprestaties, moet zorgvuldig nagaan welke softwareprogramma's hij wil gebruiken en welke grafische kaart in die specifieke toepassingen een voorsprong heeft. Daarom kunnen we in dit opzicht geen specifiek product definitief aanbevelen.

Performance Rating - Percent
Palit GeForce RTX 4090 GameRock OC
99.4 pt
KFA2 GeForce RTX 4090 SG
98.3 pt
AMD Radeon RX 7900 XTX
80.9 pt
NVIDIA GeForce RTX 4080 Founders Edition
80.2 pt
KFA2 GeForce RTX 4080 SG
79.5 pt
AMD Radeon RX 7900 XT
71.9 pt
MSI Radeon RX 6950 XT Gaming X Trio
65.2 pt
ASUS TUF Gaming GeForce RTX 3080 Ti OC
62.9 pt
NVIDIA GeForce RTX 3090 Founders Edition
62.4 pt
Sapphire AMD Radeon RX 6950 XT Nitro+ Pure
61.5 pt
KFA2 GeForce RTX 3080 SG
55.4 pt
Nvidia Titan RTX
50.3 pt
3DMark
2560x1440 Time Spy Graphics
Palit GeForce RTX 4090 GameRock OC
36836 Points +33%
KFA2 GeForce RTX 4090 SG
36252 Points +30%
AMD Radeon RX 7900 XTX
29699 Points +7%
NVIDIA GeForce RTX 4080 Founders Edition
28133 Points +1%
KFA2 GeForce RTX 4080 SG
27791 Points
AMD Radeon RX 7900 XT
25874 Points -7%
MSI Radeon RX 6950 XT Gaming X Trio
22289 Points -20%
Sapphire AMD Radeon RX 6950 XT Nitro+ Pure
21719 Points -22%
NVIDIA GeForce RTX 3090 Founders Edition
19467 Points -30%
ASUS TUF Gaming GeForce RTX 3080 Ti OC
19460 Points -30%
KFA2 GeForce RTX 3080 SG
17956 Points -35%
Nvidia Titan RTX
15106 Points -46%
Fire Strike Extreme Graphics
Palit GeForce RTX 4090 GameRock OC
46270 Points +36%
KFA2 GeForce RTX 4090 SG
45470 Points +34%
AMD Radeon RX 7900 XTX
39570 Points +17%
KFA2 GeForce RTX 4080 SG
33912 Points
AMD Radeon RX 7900 XT
33747 Points 0%
NVIDIA GeForce RTX 4080 Founders Edition
33475 Points -1%
MSI Radeon RX 6950 XT Gaming X Trio
30406 Points -10%
Sapphire AMD Radeon RX 6950 XT Nitro+ Pure
29704 Points -12%
NVIDIA GeForce RTX 3090 Founders Edition
24730 Points -27%
ASUS TUF Gaming GeForce RTX 3080 Ti OC
24250 Points -28%
KFA2 GeForce RTX 3080 SG
22078 Points -35%
Nvidia Titan RTX
17759 Points -48%
3840x2160 Fire Strike Ultra Graphics
Palit GeForce RTX 4090 GameRock OC
25018 Points +46%
KFA2 GeForce RTX 4090 SG
24633 Points +44%
AMD Radeon RX 7900 XTX
20214 Points +18%
NVIDIA GeForce RTX 4080 Founders Edition
17122 Points 0%
KFA2 GeForce RTX 4080 SG
17120 Points
AMD Radeon RX 7900 XT
17078 Points 0%
MSI Radeon RX 6950 XT Gaming X Trio
15188 Points -11%
Sapphire AMD Radeon RX 6950 XT Nitro+ Pure
14978 Points -13%
NVIDIA GeForce RTX 3090 Founders Edition
12587 Points -26%
ASUS TUF Gaming GeForce RTX 3080 Ti OC
12341 Points -28%
KFA2 GeForce RTX 3080 SG
11340 Points -34%
Nvidia Titan RTX
8755 Points -49%
1920x1080 Fire Strike Graphics
Palit GeForce RTX 4090 GameRock OC
72678 Points +11%
KFA2 GeForce RTX 4090 SG
72165 Points +11%
AMD Radeon RX 7900 XTX
66967 Points +3%
KFA2 GeForce RTX 4080 SG
65190 Points
AMD Radeon RX 7900 XT
63712 Points -2%
Sapphire AMD Radeon RX 6950 XT Nitro+ Pure
60092 Points -8%
MSI Radeon RX 6950 XT Gaming X Trio
59672 Points -8%
NVIDIA GeForce RTX 4080 Founders Edition
58893 Points -10%
NVIDIA GeForce RTX 3090 Founders Edition
48831 Points -25%
ASUS TUF Gaming GeForce RTX 3080 Ti OC
48709 Points -25%
KFA2 GeForce RTX 3080 SG
44533 Points -32%
Nvidia Titan RTX
37257 Points -43%
Unigine Superposition
7680x4320 8k Optimized
Palit GeForce RTX 4090 GameRock OC
13082 Points +52%
KFA2 GeForce RTX 4090 SG
12979 Points +51%
AMD Radeon RX 7900 XTX
8751 Points +2%
KFA2 GeForce RTX 4080 SG
8604 Points
NVIDIA GeForce RTX 4080 Founders Edition
8556 Points -1%
ASUS TUF Gaming GeForce RTX 3080 Ti OC
7161 Points -17%
NVIDIA GeForce RTX 3090 Founders Edition
7051 Points -18%
AMD Radeon RX 7900 XT
7034 Points -18%
Sapphire AMD Radeon RX 6950 XT Nitro+ Pure
6645 Points -23%
KFA2 GeForce RTX 3080 SG
6548 Points -24%
MSI Radeon RX 6950 XT Gaming X Trio
6464 Points -25%
Nvidia Titan RTX
5402 Points -37%
3840x2160 4k Optimized
Palit GeForce RTX 4090 GameRock OC
33943 Points +51%
KFA2 GeForce RTX 4090 SG
33581 Points +49%
AMD Radeon RX 7900 XTX
23174 Points +3%
KFA2 GeForce RTX 4080 SG
22482 Points
NVIDIA GeForce RTX 4080 Founders Edition
22343 Points -1%
AMD Radeon RX 7900 XT
18806 Points -16%
Sapphire AMD Radeon RX 6950 XT Nitro+ Pure
17725 Points -21%
MSI Radeon RX 6950 XT Gaming X Trio
16993 Points -24%
ASUS TUF Gaming GeForce RTX 3080 Ti OC
16412 Points -27%
NVIDIA GeForce RTX 3090 Founders Edition
16188 Points -28%
KFA2 GeForce RTX 3080 SG
14986 Points -33%
Nvidia Titan RTX
12050 Points -46%
1920x1080 1080p Extreme
Palit GeForce RTX 4090 GameRock OC
21824 Points +31%
KFA2 GeForce RTX 4090 SG
21288 Points +28%
AMD Radeon RX 7900 XTX
17264 Points +4%
KFA2 GeForce RTX 4080 SG
16635 Points
NVIDIA GeForce RTX 4080 Founders Edition
16623 Points 0%
AMD Radeon RX 7900 XT
14181 Points -15%
ASUS TUF Gaming GeForce RTX 3080 Ti OC
12347 Points -26%
Sapphire AMD Radeon RX 6950 XT Nitro+ Pure
12079 Points -27%
NVIDIA GeForce RTX 3090 Founders Edition
12059 Points -28%
MSI Radeon RX 6950 XT Gaming X Trio
12048 Points -28%
KFA2 GeForce RTX 3080 SG
11424 Points -31%
Nvidia Titan RTX
9014 Points -46%
1920x1080 1080p High
Palit GeForce RTX 4090 GameRock OC
46814 Points +27%
KFA2 GeForce RTX 4090 SG
45619 Points +24%
NVIDIA GeForce RTX 4080 Founders Edition
37399 Points +2%
KFA2 GeForce RTX 4080 SG
36824 Points
AMD Radeon RX 7900 XTX
36536 Points -1%
AMD Radeon RX 7900 XT
31426 Points -15%
MSI Radeon RX 6950 XT Gaming X Trio
28797 Points -22%
Sapphire AMD Radeon RX 6950 XT Nitro+ Pure
28478 Points -23%
ASUS TUF Gaming GeForce RTX 3080 Ti OC
26711 Points -27%
NVIDIA GeForce RTX 3090 Founders Edition
26320 Points -29%
KFA2 GeForce RTX 3080 SG
24051 Points -35%
Nvidia Titan RTX
20335 Points -45%
1280x720 720p Low
NVIDIA GeForce RTX 4080 Founders Edition
55670 Points +12%
Palit GeForce RTX 4090 GameRock OC
51741 Points +4%
Nvidia Titan RTX
50876 Points +2%
KFA2 GeForce RTX 4090 SG
50650 Points +2%
NVIDIA GeForce RTX 3090 Founders Edition
50487 Points +2%
ASUS TUF Gaming GeForce RTX 3080 Ti OC
49754 Points 0%
KFA2 GeForce RTX 4080 SG
49734 Points
AMD Radeon RX 7900 XTX
47274 Points -5%
AMD Radeon RX 7900 XT
45904 Points -8%
MSI Radeon RX 6950 XT Gaming X Trio
42809 Points -14%
KFA2 GeForce RTX 3080 SG
38209 Points -23%
Sapphire AMD Radeon RX 6950 XT Nitro+ Pure
33955 Points -32%
Unigine Heaven 4.0
Extreme Preset DX11
Palit GeForce RTX 4090 GameRock OC
491.5 fps +23%
KFA2 GeForce RTX 4090 SG
486.9 fps +22%
KFA2 GeForce RTX 4080 SG
399.9 fps
NVIDIA GeForce RTX 4080 Founders Edition
389.4 (11.3min - 813.1max) fps -3%
AMD Radeon RX 7900 XTX
357.6 fps -11%
AMD Radeon RX 7900 XT
319.7 fps -20%
MSI Radeon RX 6950 XT Gaming X Trio
317.8 fps -21%
ASUS TUF Gaming GeForce RTX 3080 Ti OC
311.6 fps -22%
NVIDIA GeForce RTX 3090 Founders Edition
309.7 fps -23%
Sapphire AMD Radeon RX 6950 XT Nitro+ Pure
293.8 fps -27%
KFA2 GeForce RTX 3080 SG
274.3 fps -31%
Nvidia Titan RTX
248.1 fps -38%
Extreme Preset OpenGL
Palit GeForce RTX 4090 GameRock OC
450.4 fps +21%
KFA2 GeForce RTX 4090 SG
447.1 fps +20%
KFA2 GeForce RTX 4080 SG
371.1 fps
AMD Radeon RX 7900 XTX
370.2 fps 0%
NVIDIA GeForce RTX 4080 Founders Edition
364.2 (15min - 770.5max) fps -2%
AMD Radeon RX 7900 XT
330.2 fps -11%
ASUS TUF Gaming GeForce RTX 3080 Ti OC
282.1 fps -24%
NVIDIA GeForce RTX 3090 Founders Edition
274.7 fps -26%
MSI Radeon RX 6950 XT Gaming X Trio
251.9 fps -32%
KFA2 GeForce RTX 3080 SG
251.4 fps -32%
Sapphire AMD Radeon RX 6950 XT Nitro+ Pure
222.7 fps -40%
Nvidia Titan RTX
218 fps -41%
Unigine Valley 1.0
1920x1080 Extreme HD DirectX AA:x8
NVIDIA GeForce RTX 4080 Founders Edition
277.5 (71.7min - 487.9max) fps +8%
KFA2 GeForce RTX 4090 SG
276 fps +7%
Palit GeForce RTX 4090 GameRock OC
270.7 fps +5%
AMD Radeon RX 7900 XTX
264.5 fps +3%
KFA2 GeForce RTX 4080 SG
257 fps
AMD Radeon RX 7900 XT
243.3 fps -5%
MSI Radeon RX 6950 XT Gaming X Trio
239.4 fps -7%
ASUS TUF Gaming GeForce RTX 3080 Ti OC
237.3 fps -8%
NVIDIA GeForce RTX 3090 Founders Edition
235.4 fps -8%
Sapphire AMD Radeon RX 6950 XT Nitro+ Pure
209.2 fps -19%
KFA2 GeForce RTX 3080 SG
203.8 fps -21%
Nvidia Titan RTX
191.4 fps -26%
1920x1080 Extreme HD Preset OpenGL AA:x8
Palit GeForce RTX 4090 GameRock OC
288 fps +24%
KFA2 GeForce RTX 4090 SG
288 fps +24%
NVIDIA GeForce RTX 4080 Founders Edition
257 (79.3min - 462.8max) fps +11%
AMD Radeon RX 7900 XTX
254.2 fps +10%
KFA2 GeForce RTX 4080 SG
231.8 fps
AMD Radeon RX 7900 XT
225.9 fps -3%
ASUS TUF Gaming GeForce RTX 3080 Ti OC
208.8 fps -10%
NVIDIA GeForce RTX 3090 Founders Edition
205.8 fps -11%
MSI Radeon RX 6950 XT Gaming X Trio
186.5 fps -20%
KFA2 GeForce RTX 3080 SG
186.1 fps -20%
Sapphire AMD Radeon RX 6950 XT Nitro+ Pure
176.9 fps -24%
Nvidia Titan RTX
160.8 fps -31%
3DMark 11
1280x720 Performance GPU
Palit GeForce RTX 4090 GameRock OC
107723 Points +22%
KFA2 GeForce RTX 4090 SG
106709 Points +21%
KFA2 GeForce RTX 4080 SG
88359 Points
NVIDIA GeForce RTX 4080 Founders Edition
86838 Points -2%
AMD Radeon RX 7900 XTX
83322 Points -6%
AMD Radeon RX 7900 XT
77784 Points -12%
MSI Radeon RX 6950 XT Gaming X Trio
73975 Points -16%
Sapphire AMD Radeon RX 6950 XT Nitro+ Pure
70480 Points -20%
NVIDIA GeForce RTX 3090 Founders Edition
62735 Points -29%
ASUS TUF Gaming GeForce RTX 3080 Ti OC
62189 Points -30%
KFA2 GeForce RTX 3080 SG
56634 Points -36%
Nvidia Titan RTX
50900 Points -42%
1280x720 Performance
Palit GeForce RTX 4090 GameRock OC
69323 Points +10%
KFA2 GeForce RTX 4090 SG
69012 Points +10%
KFA2 GeForce RTX 4080 SG
62760 Points
NVIDIA GeForce RTX 4080 Founders Edition
60209 Points -4%
AMD Radeon RX 7900 XTX
56526 Points -10%
AMD Radeon RX 7900 XT
54796 Points -13%
MSI Radeon RX 6950 XT Gaming X Trio
52806 Points -16%
ASUS TUF Gaming GeForce RTX 3080 Ti OC
51094 Points -19%
NVIDIA GeForce RTX 3090 Founders Edition
48185 Points -23%
Nvidia Titan RTX
44979 Points -28%
Sapphire AMD Radeon RX 6950 XT Nitro+ Pure
44827 Points -29%
KFA2 GeForce RTX 3080 SG
41410 Points -34%

Compute benchmarks and professional applications

LuxMark v2.0 64Bit
Sala GPUs-only
AMD Radeon RX 6950 XT
31954 Samples/s +34%
NVIDIA GeForce RTX 4090
27201 Samples/s +14%
NVIDIA GeForce RTX 4090
26576 Samples/s +12%
NVIDIA GeForce RTX 4080
24835 Samples/s +4%
KFA2 GeForce RTX 4080 SG
23809 Samples/s
NVIDIA GeForce RTX 3080 Ti
15115 Samples/s -37%
AMD Radeon RX 7900 XTX
15019 Samples/s -37%
NVIDIA GeForce RTX 3090
14990 Samples/s -37%
NVIDIA GeForce RTX 3080 12 GB
14204 Samples/s -40%
AMD Radeon RX 7900 XT
13489 Samples/s -43%
AMD Radeon RX 6950 XT
12057 Samples/s -49%
NVIDIA Titan RTX
10996 Samples/s -54%
Room GPUs-only
NVIDIA GeForce RTX 4090
12316 Samples/s +26%
NVIDIA GeForce RTX 4090
12190 Samples/s +25%
NVIDIA GeForce RTX 4080
10491 Samples/s +8%
KFA2 GeForce RTX 4080 SG
9757 Samples/s
NVIDIA GeForce RTX 3090
5948 Samples/s -39%
NVIDIA GeForce RTX 3080 Ti
5857 Samples/s -40%
NVIDIA GeForce RTX 3080 12 GB
5768 Samples/s -41%
AMD Radeon RX 7900 XTX
5161 Samples/s -47%
AMD Radeon RX 6950 XT
5097 Samples/s -48%
NVIDIA Titan RTX
4703 Samples/s -52%
AMD Radeon RX 7900 XT
4451 Samples/s -54%
AMD Radeon RX 6950 XT
4173 Samples/s -57%
ComputeMark v2.1
1024x600 Normal, QJuliaRayTrace
NVIDIA GeForce RTX 4090
34332 Points +39%
NVIDIA GeForce RTX 4090
33298 Points +35%
KFA2 GeForce RTX 4080 SG
24631 Points
NVIDIA GeForce RTX 4080
24307 Points -1%
AMD Radeon RX 7900 XTX
17915 Points -27%
NVIDIA GeForce RTX 3080 Ti
17749 Points -28%
NVIDIA GeForce RTX 3090
17713 Points -28%
AMD Radeon RX 7900 XT
16990 Points -31%
NVIDIA GeForce RTX 3080 12 GB
15594 Points -37%
AMD Radeon RX 6950 XT
13672 Points -44%
AMD Radeon RX 6950 XT
13580 Points -45%
NVIDIA Titan RTX
10129 Points -59%
1024x600 Normal, Mandel Scalar
NVIDIA GeForce RTX 4090
22889 Points +55%
NVIDIA GeForce RTX 4090
22402 Points +51%
AMD Radeon RX 7900 XTX
15458 Points +4%
KFA2 GeForce RTX 4080 SG
14810 Points
NVIDIA GeForce RTX 4080
14733 Points -1%
AMD Radeon RX 7900 XT
13989 Points -6%
AMD Radeon RX 6950 XT
12020 Points -19%
AMD Radeon RX 6950 XT
11854 Points -20%
NVIDIA GeForce RTX 3080 Ti
11318 Points -24%
NVIDIA GeForce RTX 3090
11270 Points -24%
NVIDIA GeForce RTX 3080 12 GB
9698 Points -35%
NVIDIA Titan RTX
6406 Points -57%
1024x600 Normal, Mandel Vector
NVIDIA GeForce RTX 4090
17336 Points +55%
NVIDIA GeForce RTX 4090
16935 Points +51%
AMD Radeon RX 7900 XTX
13737 Points +22%
AMD Radeon RX 7900 XT
13022 Points +16%
NVIDIA GeForce RTX 4080
11772 Points +5%
KFA2 GeForce RTX 4080 SG
11220 Points
AMD Radeon RX 6950 XT
9933 Points -11%
NVIDIA GeForce RTX 3090
9861 Points -12%
NVIDIA GeForce RTX 3080 Ti
9860 Points -12%
AMD Radeon RX 6950 XT
9555 Points -15%
NVIDIA GeForce RTX 3080 12 GB
8326 Points -26%
NVIDIA Titan RTX
5440 Points -52%
1024x600 Normal, Fluid 2DTexArr
AMD Radeon RX 7900 XTX
7315 Points +31%
NVIDIA GeForce RTX 4090
6891 Points +23%
NVIDIA GeForce RTX 4090
6792 Points +21%
AMD Radeon RX 7900 XT
6460 Points +15%
KFA2 GeForce RTX 4080 SG
5605 Points
NVIDIA GeForce RTX 4080
5523 Points -1%
NVIDIA GeForce RTX 3080 Ti
4546 Points -19%
NVIDIA GeForce RTX 3090
4517 Points -19%
AMD Radeon RX 6950 XT
4455 Points -21%
AMD Radeon RX 6950 XT
4349 Points -22%
NVIDIA GeForce RTX 3080 12 GB
4175 Points -26%
NVIDIA Titan RTX
3828 Points -32%
1024x600 Normal, Fluid 3DTex
NVIDIA GeForce RTX 4090
10724 Points +65%
NVIDIA GeForce RTX 4090
10589 Points +63%
AMD Radeon RX 7900 XTX
8537 Points +32%
AMD Radeon RX 7900 XT
7109 Points +10%
KFA2 GeForce RTX 4080 SG
6484 Points
NVIDIA GeForce RTX 4080
6385 Points -2%
AMD Radeon RX 6950 XT
5577 Points -14%
AMD Radeon RX 6950 XT
5515 Points -15%
NVIDIA GeForce RTX 3090
5501 Points -15%
NVIDIA GeForce RTX 3080 Ti
5418 Points -16%
NVIDIA GeForce RTX 3080 12 GB
4900 Points -24%
NVIDIA Titan RTX
4027 Points -38%
1024x600 Normal, Score
NVIDIA GeForce RTX 4090
92171 Points +47%
NVIDIA GeForce RTX 4090
90016 Points +43%
AMD Radeon RX 7900 XTX
62963 Points 0%
KFA2 GeForce RTX 4080 SG
62753 Points
NVIDIA GeForce RTX 4080
62720 Points 0%
AMD Radeon RX 7900 XT
57570 Points -8%
NVIDIA GeForce RTX 3080 Ti
48892 Points -22%
NVIDIA GeForce RTX 3090
48862 Points -22%
AMD Radeon RX 6950 XT
45552 Points -27%
AMD Radeon RX 6950 XT
44959 Points -28%
NVIDIA GeForce RTX 3080 12 GB
42692 Points -32%
NVIDIA Titan RTX
29830 Points -52%
Blender - v3.3 Classroom CUDA
NVIDIA Titan RTX
31 Seconds *
NVIDIA GeForce RTX 3080 Ti
21 Seconds *
Geekbench 5.5
OpenCL Score
NVIDIA GeForce RTX 4090
354266 Points +32%
NVIDIA GeForce RTX 4090
351918 Points +31%
KFA2 GeForce RTX 4080 SG
267859 Points
NVIDIA GeForce RTX 4080
267804 Points 0%
NVIDIA GeForce RTX 3090
214334 Points -20%
NVIDIA GeForce RTX 3080 12 GB
201306 Points -25%
AMD Radeon RX 6950 XT
190428 Points -29%
NVIDIA Titan RTX
145407 Points -46%
Vulkan Score
NVIDIA GeForce RTX 4090
139130 Points
NVIDIA GeForce RTX 4090
112022 Points
NVIDIA Titan RTX
94363 Points
NVIDIA GeForce RTX 3090
91596 Points
AMD Radeon RX 6950 XT
87497 Points
NVIDIA GeForce RTX 3080 12 GB
62742 Points
V-Ray 5 Benchmark
GPU CUDA
NVIDIA GeForce RTX 4090
4393 mpaths +42%
NVIDIA GeForce RTX 4090
4332 mpaths +40%
KFA2 GeForce RTX 4080 SG
3089 mpaths
NVIDIA GeForce RTX 4080
3067 mpaths -1%
NVIDIA GeForce RTX 3090
2102 mpaths -32%
NVIDIA GeForce RTX 3080 Ti
2070 mpaths -33%
NVIDIA GeForce RTX 3080 12 GB
383 mpaths -88%
AMD Radeon RX 6950 XT
383 mpaths -88%
GPU RTX
NVIDIA GeForce RTX 4090
6053 mpaths +44%
NVIDIA GeForce RTX 4090
6010 mpaths +43%
KFA2 GeForce RTX 4080 SG
4209 mpaths
NVIDIA GeForce RTX 4080
4193 mpaths 0%
NVIDIA GeForce RTX 3090
2979 mpaths -29%
NVIDIA GeForce RTX 3080 Ti
2883 mpaths -32%
Premiere Pro PugetBench
Overall Score 0.9
NVIDIA GeForce RTX 4090
1018 Points +6%
KFA2 GeForce RTX 4080 SG
962 Points
NVIDIA Titan RTX
954 Points -1%
AMD Radeon RX 7900 XTX
928 Points -4%
NVIDIA GeForce RTX 3080 Ti
927 Points -4%
AMD Radeon RX 6950 XT
920 Points -4%
AMD Radeon RX 7900 XT
903 Points -6%
NVIDIA GeForce RTX 3080 12 GB
796 Points -17%
AMD Radeon RX 6950 XT
717 Points -25%
GPU 0.9
NVIDIA GeForce RTX 4090
100.2 Points +18%
KFA2 GeForce RTX 4080 SG
85.1 Points
NVIDIA GeForce RTX 3080 Ti
81.3 Points -4%
NVIDIA GeForce RTX 3080 12 GB
81.2 Points -5%
AMD Radeon RX 7900 XTX
71.1 Points -16%
NVIDIA Titan RTX
69.7 Points -18%
AMD Radeon RX 7900 XT
67 Points -21%
AMD Radeon RX 6950 XT
66.1 Points -22%
AMD Radeon RX 6950 XT
65.3 Points -23%
Photoshop PugetBench
Overall Score
AMD Radeon RX 7900 XT
1619 Points +4%
AMD Radeon RX 7900 XTX
1594 Points +2%
KFA2 GeForce RTX 4080 SG
1563 Points
AMD Radeon RX 6950 XT
1560 Points 0%
NVIDIA GeForce RTX 4090
1559 Points 0%
NVIDIA GeForce RTX 3080 Ti
1555 Points -1%
NVIDIA Titan RTX
1346 Points -14%
AMD Radeon RX 6950 XT
1128 Points -28%
NVIDIA GeForce RTX 3080 12 GB
1005 Points -36%
GPU Score
AMD Radeon RX 7900 XT
169.5 Points +7%
AMD Radeon RX 7900 XTX
169.3 Points +7%
AMD Radeon RX 6950 XT
169 Points +7%
KFA2 GeForce RTX 4080 SG
158.4 Points
NVIDIA GeForce RTX 4090
155.7 Points -2%
NVIDIA GeForce RTX 3080 Ti
155.2 Points -2%
NVIDIA Titan RTX
132.1 Points -17%
AMD Radeon RX 6950 XT
131.5 Points -17%
NVIDIA GeForce RTX 3080 12 GB
109.4 Points -31%
Affinity Photo 2 - Combined (Single / Multi GPU)
NVIDIA GeForce RTX 4090
8448 Points +4%
KFA2 GeForce RTX 4080 SG
8144 Points
NVIDIA GeForce RTX 3080 Ti
8130 Points 0%
NVIDIA Titan RTX
6714 Points -18%
AMD Radeon RX 6950 XT
2759 Points -66%
AMD Radeon RX 7900 XTX
2656 Points -67%
AMD Radeon RX 7900 XT
2627 Points -68%
SPECviewperf 12
1900x1060 Solidworks (sw-03)
AMD Radeon RX 7900 XTX
360 fps +219%
AMD Radeon RX 7900 XT
342 fps +203%
AMD Radeon RX 6950 XT
218 fps +93%
NVIDIA Titan RTX
207 fps +83%
AMD Radeon RX 6950 XT
157 fps +39%
NVIDIA GeForce RTX 4080
127 fps +12%
NVIDIA GeForce RTX 4090
127 fps +12%
NVIDIA GeForce RTX 4090
126 fps +12%
KFA2 GeForce RTX 4080 SG
113 fps
NVIDIA GeForce RTX 3080 Ti
106 fps -6%
NVIDIA GeForce RTX 3090
105 fps -7%
NVIDIA GeForce RTX 3080 12 GB
73.8 fps -35%
1900x1060 Siemens NX (snx-02)
AMD Radeon RX 7900 XTX
400 fps +1752%
AMD Radeon RX 7900 XT
373 fps +1627%
NVIDIA Titan RTX
283 fps +1210%
AMD Radeon RX 6950 XT
56.4 fps +161%
AMD Radeon RX 6950 XT
49.4 fps +129%
NVIDIA GeForce RTX 4090
27.1 fps +25%
NVIDIA GeForce RTX 4090
26.4 fps +22%
NVIDIA GeForce RTX 4080
23.4 fps +8%
KFA2 GeForce RTX 4080 SG
21.6 fps
NVIDIA GeForce RTX 3080 Ti
16.6 fps -23%
NVIDIA GeForce RTX 3090
16.4 fps -24%
NVIDIA GeForce RTX 3080 12 GB
12 fps -44%
1900x1060 Showcase (showcase-01)
NVIDIA GeForce RTX 4090
457 fps +37%
NVIDIA GeForce RTX 4090
448 fps +35%
KFA2 GeForce RTX 4080 SG
333 fps
AMD Radeon RX 7900 XTX
322 fps -3%
AMD Radeon RX 6950 XT
308 fps -8%
NVIDIA GeForce RTX 4080
304 fps -9%
AMD Radeon RX 7900 XT
278 fps -17%
AMD Radeon RX 6950 XT
264 fps -21%
NVIDIA GeForce RTX 3090
262 fps -21%
NVIDIA GeForce RTX 3080 Ti
252 fps -24%
NVIDIA GeForce RTX 3080 12 GB
226 fps -32%
NVIDIA Titan RTX
197 fps -41%
1900x1060 Medical (medical-01)
AMD Radeon RX 7900 XTX
347 fps +103%
AMD Radeon RX 7900 XT
288 fps +68%
NVIDIA GeForce RTX 4080
227 fps +33%
KFA2 GeForce RTX 4080 SG
171 fps
NVIDIA GeForce RTX 3080 Ti
142 fps -17%
NVIDIA GeForce RTX 4090
119 fps -30%
NVIDIA GeForce RTX 4090
118 fps -31%
NVIDIA Titan RTX
101 fps -41%
AMD Radeon RX 6950 XT
95.2 fps -44%
NVIDIA GeForce RTX 3090
85.8 fps -50%
AMD Radeon RX 6950 XT
58.3 fps -66%
NVIDIA GeForce RTX 3080 12 GB
40.3 fps -76%
1900x1060 Maya (maya-04)
AMD Radeon RX 7900 XTX
367 fps +19%
AMD Radeon RX 7900 XT
347 fps +12%
NVIDIA GeForce RTX 4090
317 fps +3%
NVIDIA GeForce RTX 4090
316 fps +2%
NVIDIA GeForce RTX 4080
310 fps 0%
KFA2 GeForce RTX 4080 SG
309 fps
NVIDIA GeForce RTX 3090
302 fps -2%
NVIDIA GeForce RTX 3080 Ti
302 fps -2%
NVIDIA Titan RTX
260 fps -16%
AMD Radeon RX 6950 XT
195 fps -37%
NVIDIA GeForce RTX 3080 12 GB
139 fps -55%
AMD Radeon RX 6950 XT
90.7 fps -71%
1900x1060 Energy (energy-01)
AMD Radeon RX 7900 XTX
85.2 fps +45%
AMD Radeon RX 7900 XT
72.4 fps +23%
KFA2 GeForce RTX 4080 SG
58.8 fps
NVIDIA GeForce RTX 4080
57.5 fps -2%
NVIDIA GeForce RTX 4090
54.7 fps -7%
NVIDIA GeForce RTX 4090
54.2 fps -8%
AMD Radeon RX 6950 XT
34.3 fps -42%
NVIDIA Titan RTX
28.8 fps -51%
NVIDIA GeForce RTX 3080 Ti
27.6 fps -53%
NVIDIA GeForce RTX 3090
25.6 fps -56%
AMD Radeon RX 6950 XT
23 fps -61%
NVIDIA GeForce RTX 3080 12 GB
17.2 fps -71%
1900x1060 Creo (creo-01)
NVIDIA Titan RTX
197 fps +79%
AMD Radeon RX 7900 XTX
187 fps +70%
AMD Radeon RX 7900 XT
176 fps +60%
AMD Radeon RX 6950 XT
163 fps +48%
NVIDIA GeForce RTX 4080
118 fps +7%
AMD Radeon RX 6950 XT
115 fps +5%
NVIDIA GeForce RTX 4090
115 fps +5%
NVIDIA GeForce RTX 4090
114 fps +4%
KFA2 GeForce RTX 4080 SG
110 fps
NVIDIA GeForce RTX 3080 Ti
94.7 fps -14%
NVIDIA GeForce RTX 3090
93.7 fps -15%
NVIDIA GeForce RTX 3080 12 GB
74.4 fps -32%
1900x1060 Catia (catia-04)
AMD Radeon RX 7900 XTX
536 fps +143%
AMD Radeon RX 7900 XT
481 fps +118%
AMD Radeon RX 6950 XT
368 fps +67%
NVIDIA Titan RTX
332 fps +50%
NVIDIA GeForce RTX 4090
257 fps +16%
NVIDIA GeForce RTX 4090
254 fps +15%
NVIDIA GeForce RTX 4080
229 fps +4%
KFA2 GeForce RTX 4080 SG
221 fps
AMD Radeon RX 6950 XT
199 fps -10%
NVIDIA GeForce RTX 3080 Ti
171 fps -23%
NVIDIA GeForce RTX 3090
167 fps -24%
NVIDIA GeForce RTX 3080 12 GB
79.1 fps -64%
1900x1060 3ds Max (3dsmax-05)
NVIDIA GeForce RTX 4090
571 fps +14%
NVIDIA GeForce RTX 4090
561 fps +12%
AMD Radeon RX 7900 XTX
553 fps +10%
KFA2 GeForce RTX 4080 SG
502 fps
AMD Radeon RX 7900 XT
502 fps 0%
AMD Radeon RX 6950 XT
484 fps -4%
NVIDIA GeForce RTX 4080
477 fps -5%
AMD Radeon RX 6950 XT
418 fps -17%
NVIDIA GeForce RTX 3090
389 fps -23%
NVIDIA GeForce RTX 3080 Ti
385 fps -23%
NVIDIA GeForce RTX 3080 12 GB
334 fps -33%
NVIDIA Titan RTX
315 fps -37%
SPECviewperf 13
Solidworks (sw-04)
AMD Radeon RX 7900 XTX
323 fps +80%
AMD Radeon RX 7900 XT
307 fps +72%
AMD Radeon RX 6950 XT
254 fps +42%
NVIDIA Titan RTX
218 fps +22%
AMD Radeon RX 6950 XT
210 fps +17%
NVIDIA GeForce RTX 4090
186 fps +4%
NVIDIA GeForce RTX 4080
183 fps +2%
NVIDIA GeForce RTX 4090
182 fps +2%
KFA2 GeForce RTX 4080 SG
179 fps
NVIDIA GeForce RTX 3080 Ti
153 fps -15%
NVIDIA GeForce RTX 3090
151 fps -16%
NVIDIA GeForce RTX 3080 12 GB
108 fps -40%
Siemens NX (snx-03)
AMD Radeon RX 7900 XTX
725 fps +1759%
AMD Radeon RX 7900 XT
675 fps +1631%
NVIDIA Titan RTX
512 fps +1213%
AMD Radeon RX 6950 XT
101 fps +159%
AMD Radeon RX 6950 XT
89.7 fps +130%
NVIDIA GeForce RTX 4090
49.1 fps +26%
NVIDIA GeForce RTX 4090
47.9 fps +23%
NVIDIA GeForce RTX 4080
42.1 fps +8%
KFA2 GeForce RTX 4080 SG
39 fps
NVIDIA GeForce RTX 3080 Ti
29.9 fps -23%
NVIDIA GeForce RTX 3090
29.7 fps -24%
NVIDIA GeForce RTX 3080 12 GB
26.3 fps -33%
Showcase (showcase-02)
NVIDIA GeForce RTX 4090
455 fps +36%
NVIDIA GeForce RTX 4090
448 fps +34%
KFA2 GeForce RTX 4080 SG
334 fps
AMD Radeon RX 7900 XTX
323 fps -3%
AMD Radeon RX 6950 XT
312 fps -7%
NVIDIA GeForce RTX 4080
305 fps -9%
AMD Radeon RX 7900 XT
279 fps -16%
AMD Radeon RX 6950 XT
264 fps -21%
NVIDIA GeForce RTX 3090
262 fps -22%
NVIDIA GeForce RTX 3080 Ti
252 fps -25%
NVIDIA GeForce RTX 3080 12 GB
228 fps -32%
NVIDIA Titan RTX
198 fps -41%
Medical (medical-02)
AMD Radeon RX 7900 XTX
263 fps +75%
AMD Radeon RX 7900 XT
237 fps +58%
NVIDIA GeForce RTX 4090
186 fps +24%
NVIDIA GeForce RTX 4090
182 fps +21%
AMD Radeon RX 6950 XT
157 fps +5%
KFA2 GeForce RTX 4080 SG
150 fps
NVIDIA GeForce RTX 4080
148 fps -1%
NVIDIA GeForce RTX 3080 Ti
107 fps -29%
NVIDIA GeForce RTX 3090
106 fps -29%
NVIDIA GeForce RTX 3080 12 GB
102 fps -32%
NVIDIA Titan RTX
92 fps -39%
Maya (maya-05)
AMD Radeon RX 7900 XTX
735 fps +8%
NVIDIA GeForce RTX 4080
726 fps +7%
NVIDIA GeForce RTX 4090
715 fps +5%
NVIDIA GeForce RTX 4090
715 fps +5%
KFA2 GeForce RTX 4080 SG
678 fps
AMD Radeon RX 7900 XT
670 fps -1%
NVIDIA GeForce RTX 3080 Ti
569 fps -16%
NVIDIA GeForce RTX 3090
556 fps -18%
NVIDIA Titan RTX
499 fps -26%
NVIDIA GeForce RTX 3080 12 GB
460 fps -32%
AMD Radeon RX 6950 XT
460 fps -32%
AMD Radeon RX 6950 XT
372 fps -45%
Energy (energy-02)
AMD Radeon RX 7900 XTX
187 fps +102%
AMD Radeon RX 7900 XT
147 fps +59%
NVIDIA GeForce RTX 4090
126 fps +36%
NVIDIA GeForce RTX 4090
123 fps +33%
KFA2 GeForce RTX 4080 SG
92.6 fps
NVIDIA GeForce RTX 4080
91.7 fps -1%
AMD Radeon RX 6950 XT
60.8 fps -34%
AMD Radeon RX 6950 XT
60.3 fps -35%
NVIDIA Titan RTX
51.8 fps -44%
NVIDIA GeForce RTX 3080 Ti
44.1 fps -52%
NVIDIA GeForce RTX 3090
43.8 fps -53%
NVIDIA GeForce RTX 3080 12 GB
37.6 fps -59%
Creo (creo-02)
AMD Radeon RX 7900 XTX
613 fps +16%
AMD Radeon RX 7900 XT
567 fps +7%
NVIDIA GeForce RTX 4090
552 fps +4%
NVIDIA GeForce RTX 4080
544 fps +3%
NVIDIA GeForce RTX 4090
544 fps +3%
KFA2 GeForce RTX 4080 SG
529 fps
NVIDIA GeForce RTX 3080 Ti
402 fps -24%
NVIDIA GeForce RTX 3090
392 fps -26%
NVIDIA Titan RTX
386 fps -27%
AMD Radeon RX 6950 XT
374 fps -29%
NVIDIA GeForce RTX 3080 12 GB
324 fps -39%
AMD Radeon RX 6950 XT
323 fps -39%
Catia (catia-05)
AMD Radeon RX 7900 XTX
825 fps +143%
AMD Radeon RX 7900 XT
728 fps +114%
AMD Radeon RX 6950 XT
588 fps +73%
NVIDIA Titan RTX
534 fps +57%
AMD Radeon RX 6950 XT
450 fps +32%
NVIDIA GeForce RTX 4090
402 fps +18%
NVIDIA GeForce RTX 4090
396 fps +16%
KFA2 GeForce RTX 4080 SG
340 fps
NVIDIA GeForce RTX 4080
333 fps -2%
NVIDIA GeForce RTX 3080 Ti
258 fps -24%
NVIDIA GeForce RTX 3090
252 fps -26%
NVIDIA GeForce RTX 3080 12 GB
206 fps -39%
3ds Max (3dsmax-06)
AMD Radeon RX 7900 XTX
564 fps +13%
NVIDIA GeForce RTX 4090
563 fps +13%
NVIDIA GeForce RTX 4090
558 fps +12%
AMD Radeon RX 7900 XT
506 fps +2%
KFA2 GeForce RTX 4080 SG
497 fps
AMD Radeon RX 6950 XT
483 fps -3%
NVIDIA GeForce RTX 4080
478 fps -4%
AMD Radeon RX 6950 XT
416 fps -16%
NVIDIA GeForce RTX 3090
387 fps -22%
NVIDIA GeForce RTX 3080 Ti
382 fps -23%
NVIDIA GeForce RTX 3080 12 GB
334 fps -33%
NVIDIA Titan RTX
321 fps -35%
SPECviewperf 2020
3840x2160 CATIA (catia-06)
AMD Radeon RX 7900 XTX
127 fps +68%
AMD Radeon RX 7900 XT
113 fps +50%
NVIDIA GeForce RTX 4090
95.3 fps +26%
NVIDIA GeForce RTX 4090
94.7 fps +25%
NVIDIA Titan RTX
90.9 fps +20%
NVIDIA GeForce RTX 4080
76.5 fps +1%
KFA2 GeForce RTX 4080 SG
75.5 fps
NVIDIA GeForce RTX 3080 Ti
59.9 fps -21%
AMD Radeon RX 6950 XT
59.7 fps -21%
NVIDIA GeForce RTX 3090
58.5 fps -23%
NVIDIA GeForce RTX 3080 12 GB
53.7 fps -29%
AMD Radeon RX 6950 XT
53 fps -30%
3840x2160 Creo (creo-03)
AMD Radeon RX 7900 XTX
187 fps +46%
AMD Radeon RX 7900 XT
173 fps +35%
NVIDIA GeForce RTX 4080
136 fps +6%
NVIDIA Titan RTX
135 fps +5%
NVIDIA GeForce RTX 4090
133 fps +4%
NVIDIA GeForce RTX 4090
133 fps +4%
KFA2 GeForce RTX 4080 SG
128 fps
NVIDIA GeForce RTX 3090
115 fps -10%
NVIDIA GeForce RTX 3080 Ti
114 fps -11%
AMD Radeon RX 6950 XT
92.4 fps -28%
NVIDIA GeForce RTX 3080 12 GB
90 fps -30%
AMD Radeon RX 6950 XT
73.1 fps -43%
3840x2160 Energy (energy-03)
NVIDIA GeForce RTX 4090
141 fps +56%
NVIDIA GeForce RTX 4090
137 fps +52%
AMD Radeon RX 7900 XTX
129 fps +43%
AMD Radeon RX 7900 XT
99.6 fps +10%
NVIDIA GeForce RTX 3090
96.6 fps +7%
NVIDIA Titan RTX
93.9 fps +4%
KFA2 GeForce RTX 4080 SG
90.4 fps
AMD Radeon RX 6950 XT
69.3 fps -23%
NVIDIA GeForce RTX 3080 Ti
57.5 fps -36%
AMD Radeon RX 6950 XT
47.6 fps -47%
NVIDIA GeForce RTX 4080
45.6 fps -50%
NVIDIA GeForce RTX 3080 12 GB
37.2 fps -59%
3840x2160 Maya (maya-06)
NVIDIA GeForce RTX 4090
525 fps +17%
NVIDIA GeForce RTX 4090
498 fps +11%
AMD Radeon RX 7900 XTX
481 fps +8%
KFA2 GeForce RTX 4080 SG
447 fps
NVIDIA GeForce RTX 4080
426 fps -5%
AMD Radeon RX 7900 XT
401 fps -10%
NVIDIA GeForce RTX 3080 Ti
366 fps -18%
NVIDIA GeForce RTX 3090
356 fps -20%
AMD Radeon RX 6950 XT
315 fps -30%
NVIDIA GeForce RTX 3080 12 GB
314 fps -30%
AMD Radeon RX 6950 XT
296 fps -34%
NVIDIA Titan RTX
274 fps -39%
3840x2160 Medical (medical-03)
AMD Radeon RX 7900 XTX
62.3 fps +93%
AMD Radeon RX 7900 XT
53.9 fps +67%
NVIDIA GeForce RTX 4090
45.9 fps +43%
NVIDIA GeForce RTX 4090
44.8 fps +39%
AMD Radeon RX 6950 XT
35 fps +9%
AMD Radeon RX 6950 XT
34.4 fps +7%
KFA2 GeForce RTX 4080 SG
32.2 fps
NVIDIA GeForce RTX 4080
28.3 fps -12%
NVIDIA GeForce RTX 3080 Ti
22.9 fps -29%
NVIDIA GeForce RTX 3090
20 fps -38%
NVIDIA GeForce RTX 3080 12 GB
18.8 fps -42%
NVIDIA Titan RTX
16.5 fps -49%
3840x2160 Siemens NX (snx-04)
AMD Radeon RX 7900 XTX
514 fps +1511%
AMD Radeon RX 7900 XT
476 fps +1392%
NVIDIA Titan RTX
375 fps +1076%
AMD Radeon RX 6950 XT
98.4 fps +208%
AMD Radeon RX 6950 XT
88.6 fps +178%
NVIDIA GeForce RTX 4090
41.3 fps +29%
NVIDIA GeForce RTX 4090
41.1 fps +29%
NVIDIA GeForce RTX 4080
34.1 fps +7%
KFA2 GeForce RTX 4080 SG
31.9 fps
NVIDIA GeForce RTX 3080 Ti
24.9 fps -22%
NVIDIA GeForce RTX 3090
24.7 fps -23%
NVIDIA GeForce RTX 3080 12 GB
21.8 fps -32%

* ... kleiner is beter

Gaming benchmarks

Zoals de KFA2 GeForce RTX 4090 SGbiedt de KFA2 GeForce RTX 4080 SG immens hoge gaming prestaties die pas bij 2160p goed zijn spieren laat zien. Onnodig te zeggen dat het model 1440p zeer comfortabel aankan, en dat de CPU minder een beperkende factor is dan bij de snellere RTX 4090. De concurrenten van AMD doen niet veel onder voor de KFA2 GeForce RTX 4080 SG, ondanks het feit dat enkele games beter draaien op AMD grafische kaarten. Aan de andere kant zijn er ook games die veel beter presteren op Nvidia GPU's. Zodra ray tracing-functies zijn ingeschakeld, trekken Nvidia-kaarten nog verder op ten opzichte van de nieuwe RDNA3 grafische kaarten. Zonder DLSS hebben echter zelfs de snelste Nvidia GPU's op dit moment moeite met ray tracing bij hogere resoluties. Zoals Cyberpunk 2077 laat zien, moet je genoegen nemen met 1080p als DLSS is uitgeschakeld

In ieder geval moet worden opgemerkt dat DLSS 3.0 uitsluitend beschikbaar is op de nieuwe GeForce RTX 40 Series GPU's. AMD heeft een soortgelijke functie klaarliggen in de vorm van de open standaard FSR, die ook gebruikt kan worden met Nvidia GPU's. Uiteindelijk is het aan spelontwikkelaars om deze functies te integreren in hun games. Klik op hier voor een lijst met games die DLSS 3.0 ondersteunen of dat in de toekomst zullen doen.

GTA V - 3840x2160 High/On (Advanced Graphics Off) AA:FX AF:8x
Palit GeForce RTX 4090 GameRock OC
187.5 (2.97min, 200P1 - 593max) fps +2%
NVIDIA GeForce RTX 4080 Founders Edition
186.1 (3.61min, 142.9P1 - 612max) fps +1%
AMD Radeon RX 7900 XTX
184.8 (5.75min, 142.9P1 - 559max) fps 0%
KFA2 GeForce RTX 4080 SG
183.9 (5.11min, 142.9P1 - 570max) fps
ASUS TUF Gaming GeForce RTX 3080 Ti OC
182.6 (2.49min, 125P1 - 569max) fps -1%
NVIDIA GeForce RTX 3090 Founders Edition
182.5 (2.85min, 142.9P1 - 284max) fps -1%
MSI Radeon RX 6950 XT Gaming X Trio
175.5 (4.99min, 125P1 - 618max) fps -5%
AMD Radeon RX 7900 XT
175.1 (5.09min, 125P1 - 687max) fps -5%
Sapphire AMD Radeon RX 6950 XT Nitro+ Pure
173.1 (2.93min, 100P1 - 384max) fps -6%
KFA2 GeForce RTX 3080 SG
169.6 (14.8min, 125P1 - 411max) fps -8%
Nvidia Titan RTX
140.8 (6.17min, 100P1 - 320max) fps -23%
The Witcher 3 - 3840x2160 High Graphics & Postprocessing (Nvidia HairWorks Off)
Palit GeForce RTX 4090 GameRock OC
284 (88.3min, 166.6P0.1, 240P1 - 831max) fps +41%
NVIDIA GeForce RTX 4080 Founders Edition
204 (183min, 183.55P1 - 227max) fps +1%
KFA2 GeForce RTX 4080 SG
202 (77.2min, 112.7P0.1, 171.7P1 - 783max) fps
AMD Radeon RX 7900 XTX
163.8 (49.6min, 112P0.1, 134.1P1 - 463max) fps -19%
AMD Radeon RX 7900 XT
158.5 (83.2min, 111.2P0.1, 122.8P1 - 408max) fps -22%
NVIDIA GeForce RTX 3090 Founders Edition
155.5 (28min, 94.5P0.1, 133.8P1 - 704max) fps -23%
ASUS TUF Gaming GeForce RTX 3080 Ti OC
154.9 (54.5min, 91.3P0.1, 134.4P1 - 636max) fps -23%
MSI Radeon RX 6950 XT Gaming X Trio
148.3 (41.6min, 103P0.1, 117.2P1 - 530max) fps -27%
Sapphire AMD Radeon RX 6950 XT Nitro+ Pure
139.7 (10.4min, 105.6P0.1, 118.6P1 - 388max) fps -31%
KFA2 GeForce RTX 3080 SG
131.8 (48.2min, 72.3P0.1, 107.3P1 - 454max) fps -35%
AMD Radeon RX 6900 XT
122 (105min, 105P1 - 134max) fps -40%
Nvidia Titan RTX
107.1 (11min, 80.3P0.1, 94.1P1 - 583max) fps -47%
Final Fantasy XV Benchmark - 3840x2160 High Quality
Palit GeForce RTX 4090 GameRock OC
161.1 fps +38%
KFA2 GeForce RTX 4080 SG
116.9 fps
NVIDIA GeForce RTX 4080 Founders Edition
115.4 fps -1%
AMD Radeon RX 7900 XTX
101.6 fps -13%
NVIDIA GeForce RTX 3090 Founders Edition
87.1 fps -25%
ASUS TUF Gaming GeForce RTX 3080 Ti OC
86.4 fps -26%
Sapphire AMD Radeon RX 6950 XT Nitro+ Pure
86 fps -26%
MSI Radeon RX 6950 XT Gaming X Trio
85.6 fps -27%
AMD Radeon RX 7900 XT
84.9 fps -27%
KFA2 GeForce RTX 3080 SG
76.7 fps -34%
Nvidia Titan RTX
65.2 fps -44%
Strange Brigade - 3840x2160 ultra AA:ultra AF:16
Palit GeForce RTX 4090 GameRock OC
281 (31.7min, 239P1 - 482max) fps +44%
KFA2 GeForce RTX 4080 SG
195.1 (12.1min, 170.6P1 - 503max) fps
MSI Radeon RX 6950 XT Gaming X Trio
175 (140min, 143.3P1 - 264max) fps -10%
AMD Radeon RX 7900 XT
172.6 (138.4min, 143.7P1 - 320max) fps -12%
AMD Radeon RX 7900 XTX
172.6 (138.4min, 143.7P1 - 320max) fps -12%
Sapphire AMD Radeon RX 6950 XT Nitro+ Pure
168.6 (37.6min, 139.6P1 - 268max) fps -14%
NVIDIA GeForce RTX 3090 Founders Edition
163.2 (60.1min, 136.1P1 - 584max) fps -16%
ASUS TUF Gaming GeForce RTX 3080 Ti OC
161.8 (38.7min, 135.9P1 - 423max) fps -17%
KFA2 GeForce RTX 3080 SG
141.5 (44.1min, 113.4P1 - 188.6max) fps -27%
Nvidia Titan RTX
115 (67.4min, 100P1 - 517max) fps -41%
Far Cry 5 - 3840x2160 Ultra Preset AA:T
Palit GeForce RTX 4090 GameRock OC
175 (140min - 212max) fps +26%
AMD Radeon RX 7900 XTX
155 (134min - 180max) fps +12%
NVIDIA GeForce RTX 4080 Founders Edition
140 (126min - 159max) fps +1%
KFA2 GeForce RTX 4080 SG
139 (125min - 163max) fps
AMD Radeon RX 7900 XT
132 (116min - 162max) fps -5%
MSI Radeon RX 6950 XT Gaming X Trio
126 (109min - 157max) fps -9%
Sapphire AMD Radeon RX 6950 XT Nitro+ Pure
121 (106min - 147max) fps -13%
ASUS TUF Gaming GeForce RTX 3080 Ti OC
109 (98min - 128max) fps -22%
NVIDIA GeForce RTX 3090 Founders Edition
107 (96min - 128max) fps -23%
KFA2 GeForce RTX 3080 SG
102 (93min - 121max) fps -27%
Nvidia Titan RTX
82 (73min - 99max) fps -41%
Far Cry New Dawn - 3840x2160 Ultra Preset
Palit GeForce RTX 4090 GameRock OC
145 (104min - 215max) fps +12%
AMD Radeon RX 7900 XTX
138 (98min - 216max) fps +6%
KFA2 GeForce RTX 4080 SG
130 (102min - 169max) fps
AMD Radeon RX 7900 XT
129 (97min - 184max) fps -1%
MSI Radeon RX 6950 XT Gaming X Trio
125 (96min - 174max) fps -4%
Sapphire AMD Radeon RX 6950 XT Nitro+ Pure
111 (75min - 167max) fps -15%
ASUS TUF Gaming GeForce RTX 3080 Ti OC
110 (85min - 131max) fps -15%
NVIDIA GeForce RTX 3090 Founders Edition
108 (93min - 129max) fps -17%
AMD Radeon RX 6900 XT
101 (79min - 135max) fps -22%
KFA2 GeForce RTX 3080 SG
98 (79min - 122max) fps -25%
Nvidia Titan RTX
83 (70min - 100max) fps -36%
Far Cry 6 - 3840x2160 Ultra Graphics Quality + HD Textures AA:T
Palit GeForce RTX 4090 GameRock OC
136.9 (122min - 148max) fps +28%
AMD Radeon RX 7900 XTX
124 (113min - 136max) fps +16%
NVIDIA GeForce RTX 4080 Founders Edition
109 (97min - 117max) fps +2%
KFA2 GeForce RTX 4080 SG
107 (98min - 116max) fps
AMD Radeon RX 7900 XT
104.1 (95min - 114max) fps -3%
MSI Radeon RX 6950 XT Gaming X Trio
94.7 (87min - 103max) fps -11%
Sapphire AMD Radeon RX 6950 XT Nitro+ Pure
86.5 (78min - 100max) fps -19%
ASUS TUF Gaming GeForce RTX 3080 Ti OC
86.2 (79min - 93max) fps -19%
NVIDIA GeForce RTX 3090 Founders Edition
84.9 (78min - 92max) fps -21%
Nvidia Titan RTX
63.6 (56min - 69max) fps -41%
KFA2 GeForce RTX 3080 SG
57.2 (28min - 69max) fps -47%
Metro Exodus - 3840x2160 Ultra Quality AF:16x
Palit GeForce RTX 4090 GameRock OC
139.7 (76.95min - 229.15max) fps +34%
NVIDIA GeForce RTX 4080 Founders Edition
105.7 (67.17min - 159.57max) fps +2%
KFA2 GeForce RTX 4080 SG
103.9 (62.73min - 167.39max) fps
AMD Radeon RX 7900 XTX
103.5 (66.43min - 144.4max) fps 0%
AMD Radeon RX 7900 XT
86.9 (56.86min - 117.84max) fps -16%
MSI Radeon RX 6950 XT Gaming X Trio
79.3 (52.59min - 103.86max) fps -24%
ASUS TUF Gaming GeForce RTX 3080 Ti OC
77.1 (48.66min - 128.68max) fps -26%
NVIDIA GeForce RTX 3090 Founders Edition
75.9 (48.64min - 130.4max) fps -27%
Sapphire AMD Radeon RX 6950 XT Nitro+ Pure
75 (50.07min - 98.87max) fps -28%
AMD Radeon RX 6900 XT
66.7 (42.71min - 92.25max) fps -36%
KFA2 GeForce RTX 3080 SG
65.2 (41.36min - 117.12max) fps -37%
Nvidia Titan RTX
56.8 (35.78min - 93.88max) fps -45%
F1 2020 - 3840x2160 Ultra High Preset AA:T AF:16x
Palit GeForce RTX 4090 GameRock OC
286 (245min - 335max) fps +42%
KFA2 GeForce RTX 4080 SG
201 (172min - 235max) fps
AMD Radeon RX 7900 XTX
199.6 (160min - 242max) fps -1%
AMD Radeon RX 7900 XT
165.5 (136min - 199max) fps -18%
MSI Radeon RX 6950 XT Gaming X Trio
158.1 (126min - 189max) fps -21%
Sapphire AMD Radeon RX 6950 XT Nitro+ Pure
150.1 (119min - 178max) fps -25%
ASUS TUF Gaming GeForce RTX 3080 Ti OC
145.9 (124min - 173max) fps -27%
NVIDIA GeForce RTX 3090 Founders Edition
143.6 (121min - 170max) fps -29%
AMD Radeon RX 6900 XT
137 (109min - 165max) fps -32%
AMD Radeon RX 6900 XT
136 (110min - 161max) fps -32%
KFA2 GeForce RTX 3080 SG
124.6 (107min - 145max) fps -38%
Nvidia Titan RTX
103.4 (89min - 121max) fps -49%
F1 2021 - 3840x2160 Ultra High Preset + Raytracing AA:T AF:16x
Palit GeForce RTX 4090 GameRock OC
199.1 (168min, 166P1 - 223max) fps +38%
KFA2 GeForce RTX 4080 SG
144.3 (123min, 122P1 - 162max) fps
NVIDIA GeForce RTX 4080 Founders Edition
143.5 (123min, 115P1 - 160max) fps -1%
AMD Radeon RX 7900 XTX
133.6 (114min, 113P1 - 154max) fps -7%
AMD Radeon RX 7900 XT
112.3 (95min, 95P1 - 129max) fps -22%
ASUS TUF Gaming GeForce RTX 3080 Ti OC
105.6 (91min, 91P1 - 117max) fps -27%
NVIDIA GeForce RTX 3090 Founders Edition
102.7 (90min, 89P1 - 116max) fps -29%
MSI Radeon RX 6950 XT Gaming X Trio
102.1 (86min, 86P1 - 116max) fps -29%
Sapphire AMD Radeon RX 6950 XT Nitro+ Pure
99.7 (85min, 85P1 - 113max) fps -31%
KFA2 GeForce RTX 3080 SG
93.5 (82min, 82P1 - 105max) fps -35%
Nvidia Titan RTX
73.2 (64min, 64P1 - 84max) fps -49%
F1 22 - 3840x2160 Ultra High Preset AA:T AF:16x
Palit GeForce RTX 4090 GameRock OC
82.5 (72min, 71P1 - 96max) fps +42%
NVIDIA GeForce RTX 4080 Founders Edition
58.9 (50min, 49P1 - 68max) fps +2%
KFA2 GeForce RTX 4080 SG
57.9 (50min, 49P1 - 67max) fps
AMD Radeon RX 7900 XTX
52.4 (37min, 38P1 - 64max) fps -9%
AMD Radeon RX 7900 XT
44.9 (32min, 32P1 - 57max) fps -22%
ASUS TUF Gaming GeForce RTX 3080 Ti OC
43.4 (36min, 36P1 - 51max) fps -25%
NVIDIA GeForce RTX 3090 Founders Edition
42.6 (36min, 28P1 - 49max) fps -26%
MSI Radeon RX 6950 XT Gaming X Trio
36.5 (27min, 27P1 - 47max) fps -37%
Sapphire AMD Radeon RX 6950 XT Nitro+ Pure
35.8 (24min, 25P1 - 47max) fps -38%
Nvidia Titan RTX
29.3 (25min, 24P1 - 34max) fps -49%
Borderlands 3 - 3840x2160 Badass Overall Quality (DX11)
Palit GeForce RTX 4090 GameRock OC
135 fps +42%
NVIDIA GeForce RTX 4080 Founders Edition
95.7 fps +1%
KFA2 GeForce RTX 4080 SG
95.2 fps
AMD Radeon RX 7900 XTX
88.4 fps -7%
AMD Radeon RX 7900 XT
74.6 fps -22%
ASUS TUF Gaming GeForce RTX 3080 Ti OC
73.8 fps -22%
NVIDIA GeForce RTX 3090 Founders Edition
72.8 fps -24%
MSI Radeon RX 6950 XT Gaming X Trio
70.9 fps -26%
KFA2 GeForce RTX 3080 SG
59.9 fps -37%
Sapphire AMD Radeon RX 6950 XT Nitro+ Pure
59.9 fps -37%
AMD Radeon RX 6900 XT
59.8 fps -37%
AMD Radeon RX 6900 XT
57.1 fps -40%
Nvidia Titan RTX
49.7 fps -48%
Cyberpunk 2077 1.6 - 3840x2160 Ultra Preset
Palit GeForce RTX 4090 GameRock OC
78 (48.3min - 106.8max) fps +23%
AMD Radeon RX 7900 XTX
71.4 (59.4min - 93.7max) fps +13%
NVIDIA GeForce RTX 4080 Founders Edition
63.5 (42.2min - 84.6max) fps 0%
KFA2 GeForce RTX 4080 SG
63.4 (54min - 82.1max) fps
AMD Radeon RX 7900 XT
60 (44.6min - 79.3max) fps -5%
ASUS TUF Gaming GeForce RTX 3080 Ti OC
49.7 (41.5min - 63.7max) fps -22%
MSI Radeon RX 6950 XT Gaming X Trio
48.5 (39.1min - 63.9max) fps -24%
Sapphire AMD Radeon RX 6950 XT Nitro+ Pure
43.2 fps -32%
Metro Exodus - 1920x1080 Ultra Quality DXR AF:16x
NVIDIA GeForce RTX 4090
AMD Ryzen 9 7950X, NVIDIA GeForce RTX 4090
157.3 (96.47min - 223.46max) fps +6%
NVIDIA GeForce RTX 4080
AMD Ryzen 9 7950X, NVIDIA GeForce RTX 4080
148.6 (73.78min - 213.36max) fps
AMD Radeon RX 7900 XTX
AMD Ryzen 9 7950X, AMD Radeon RX 7900 XTX
141.2 (89.03min - 194.63max) fps -5%
NVIDIA GeForce RTX 4080
Intel Core i9-13900K, NVIDIA GeForce RTX 4080
137.2 (68.42min - 213.17max) fps -8%
AMD Radeon RX 7900 XT
AMD Ryzen 9 7950X, AMD Radeon RX 7900 XT
124.3 (78.88min - 166max) fps -16%
NVIDIA GeForce RTX 3080 Ti
AMD Ryzen 9 7950X, NVIDIA GeForce RTX 3080 Ti
121.2 (66.05min - 193.46max) fps -18%
NVIDIA GeForce RTX 3090
AMD Ryzen 9 7950X, NVIDIA GeForce RTX 3090
115.4 (65.7min - 181.59max) fps -22%
AMD Radeon RX 6950 XT
AMD Ryzen 9 7950X, AMD Radeon RX 6950 XT
110.2 (69.77min - 143.88max) fps -26%
Far Cry 6 - 1920x1080 Ultra Graphics Quality + HD Textures + DXR AA:T
NVIDIA GeForce RTX 4080
Intel Core i9-13900K, NVIDIA GeForce RTX 4080
154 (125min - 209max) fps +22%
AMD Radeon RX 7900 XTX
AMD Ryzen 9 7950X, AMD Radeon RX 7900 XTX
152.1 (75min - 229max) fps +20%
AMD Radeon RX 7900 XT
AMD Ryzen 9 7950X, AMD Radeon RX 7900 XT
143.6 (46min - 227max) fps +13%
NVIDIA GeForce RTX 4090
AMD Ryzen 9 7950X, NVIDIA GeForce RTX 4090
133.4 (108min - 196max) fps +5%
AMD Radeon RX 6950 XT
AMD Ryzen 9 7950X, AMD Radeon RX 6950 XT
132.8 (51min - 198max) fps +5%
NVIDIA GeForce RTX 3080 Ti
AMD Ryzen 9 7950X, NVIDIA GeForce RTX 3080 Ti
128.6 (109min - 170max) fps +1%
NVIDIA GeForce RTX 4080
AMD Ryzen 9 7950X, NVIDIA GeForce RTX 4080
126.7 (103min - 189max) fps
NVIDIA GeForce RTX 3090
AMD Ryzen 9 7950X, NVIDIA GeForce RTX 3090
123 (106min - 155max) fps -3%
AMD Radeon RX 6800
AMD Ryzen 9 7950X, AMD Radeon RX 6800
112.6 (63min - 152max) fps -11%
AMD Radeon RX 6950 XT
AMD Ryzen 9 5900X, AMD Radeon RX 6950 XT
101.6 (24min - 161max) fps -20%
Cyberpunk 2077 1.6
3840x2160 Ray Tracing Ultra Preset (DLSS off)
NVIDIA GeForce RTX 4090
AMD Ryzen 9 7950X, NVIDIA GeForce RTX 4090 (1.6)
42.5 (31.9min - 56.3max) fps +43%
NVIDIA GeForce RTX 4080
Intel Core i9-13900K, NVIDIA GeForce RTX 4080 (1.6)
30.7 (23.5min - 40.6max) fps +3%
NVIDIA GeForce RTX 4080
AMD Ryzen 9 7950X, NVIDIA GeForce RTX 4080 (1.61)
29.8 (22.7min - 39.4max) fps
NVIDIA GeForce RTX 3090
AMD Ryzen 9 7950X, NVIDIA GeForce RTX 3090 (1.6)
20.8 (14.2min - 28.9max) fps -30%
AMD Radeon RX 7900 XTX
AMD Ryzen 9 7950X, AMD Radeon RX 7900 XTX (1.61)
20.7 (14.4min - 28.9max) fps -31%
NVIDIA GeForce RTX 3080 Ti
AMD Ryzen 9 7950X, NVIDIA GeForce RTX 3080 Ti (1.61)
18.6 (9.13min - 27.1max) fps -38%
AMD Radeon RX 7900 XT
AMD Ryzen 9 7950X, AMD Radeon RX 7900 XT (1.61)
17.6 (12min - 25max) fps -41%
AMD Radeon RX 6950 XT
AMD Ryzen 9 7950X, AMD Radeon RX 6950 XT (1.61)
13.7 (9.28min - 20.6max) fps -54%
AMD Radeon RX 6800
AMD Ryzen 9 7950X, AMD Radeon RX 6800 (1.61)
9.47 (6.59min - 14.7max) fps -68%
1920x1080 Ray Tracing Ultra Preset (DLSS off)
NVIDIA GeForce RTX 4090
AMD Ryzen 9 7950X, NVIDIA GeForce RTX 4090 (1.6)
118.6 (69.3min - 161.9max) fps +23%
NVIDIA GeForce RTX 4080
Intel Core i9-13900K, NVIDIA GeForce RTX 4080 (1.6)
100.1 (77.6min - 133.3max) fps +4%
NVIDIA GeForce RTX 4080
AMD Ryzen 9 7950X, NVIDIA GeForce RTX 4080 (1.61)
96.1 (60.6min - 138.8max) fps
NVIDIA GeForce RTX 3080 Ti
AMD Ryzen 9 7950X, NVIDIA GeForce RTX 3080 Ti (1.61)
69.1 (53.3min - 89.8max) fps -28%
NVIDIA GeForce RTX 3090
AMD Ryzen 9 7950X, NVIDIA GeForce RTX 3090 (1.6)
65.7 (51min - 85.4max) fps -32%
AMD Radeon RX 7900 XTX
AMD Ryzen 9 7950X, AMD Radeon RX 7900 XTX (1.61)
64.6 (49.1min - 85.9max) fps -33%
AMD Radeon RX 7900 XT
AMD Ryzen 9 7950X, AMD Radeon RX 7900 XT (1.61)
57.1 (41.7min - 77.1max) fps -41%
AMD Radeon RX 6950 XT
AMD Ryzen 9 7950X, AMD Radeon RX 6950 XT (1.61)
47.7 (32.5min - 66.9max) fps -50%
AMD Radeon RX 6800
AMD Ryzen 9 7950X, AMD Radeon RX 6800 (1.61)
33.7 (23.1min - 47.4max) fps -65%
Control - 1920x1080 High Quality Preset & High Ray Tracing Preset (DX12)
NVIDIA GeForce RTX 4090
AMD Ryzen 9 7950X, NVIDIA GeForce RTX 4090
189.9 (19.4min, 126.6P0.1, 139.6P1 - 292max) fps +19%
NVIDIA GeForce RTX 4080
Intel Core i9-13900K, NVIDIA GeForce RTX 4080
162.8 (28.9min, 60.8P0.1, 129.4P1 - 273max) fps +2%
NVIDIA GeForce RTX 4080
AMD Ryzen 9 7950X, NVIDIA GeForce RTX 4080
159.4 (18.2min, 92.7P0.1, 125.9P1 - 262max) fps
AMD Radeon RX 7900 XTX
AMD Ryzen 9 7950X, AMD Radeon RX 7900 XTX
133.7 (23.2min, 92.6P0.1, 104.6P1 - 239max) fps -16%
NVIDIA GeForce RTX 3080 Ti
AMD Ryzen 9 7950X, NVIDIA GeForce RTX 3080 Ti
120.6 (6.57min, 82.4P0.1, 100.1P1 - 224max) fps -24%
AMD Radeon RX 7900 XT
AMD Ryzen 9 7950X, AMD Radeon RX 7900 XT
116.1 (8.47min, 62.1P0.1, 91.4P1 - 219max) fps -27%
AMD Radeon RX 6950 XT
AMD Ryzen 9 7950X, AMD Radeon RX 6950 XT
102.9 (20.6min, 66.5P0.1, 80.5P1 - 242max) fps -35%
AMD Radeon RX 6950 XT
AMD Ryzen 9 5900X, AMD Radeon RX 6950 XT
97.7 (7.66min, 62.8P0.1, 73.5P1 - 198.6max) fps -39%
Ghostwire Tokyo - 1920x1080 Highest Settings + Maximum Ray Tracing
NVIDIA GeForce RTX 4090
AMD Ryzen 9 7950X, NVIDIA GeForce RTX 4090
183.2 (43min, 94.2P0.1, 137.8P1 - 221max) fps +15%
NVIDIA GeForce RTX 4080
Intel Core i9-13900K, NVIDIA GeForce RTX 4080
166.2 (30.4min, 60P0.1, 115.2P1 - 248max) fps +4%
NVIDIA GeForce RTX 4080
AMD Ryzen 9 7950X, NVIDIA GeForce RTX 4080
159.6 (39.5min, 86.7P0.1, 114.5P1 - 226max) fps
AMD Radeon RX 7900 XTX
AMD Ryzen 9 7950X, AMD Radeon RX 7900 XTX
136.3 (39.1min, 76.4P0.1, 95.8P1 - 243max) fps -15%
NVIDIA GeForce RTX 3080 Ti
AMD Ryzen 9 7950X, NVIDIA GeForce RTX 3080 Ti
119.9 (39.2min, 61.9P0.1, 80.9P1 - 230max) fps -25%
AMD Radeon RX 7900 XT
AMD Ryzen 9 7950X, AMD Radeon RX 7900 XT
116.5 (30.3min, 71.6P0.1, 78.1P1 - 246max) fps -27%
AMD Radeon RX 6950 XT
AMD Ryzen 9 7950X, AMD Radeon RX 6950 XT
99 (35.8min, 58.6P0.1, 66P1 - 237max) fps -38%
The Callisto Protocol - 1920x1080 Ultra Preset (without FSR Upscaling) + Full Ray-Tracing
AMD Radeon RX 7900 XTX
AMD Ryzen 9 7950X, AMD Radeon RX 7900 XTX
98 fps +13%
NVIDIA GeForce RTX 4090
AMD Ryzen 9 7950X, NVIDIA GeForce RTX 4090
92 fps +6%
AMD Radeon RX 7900 XT
AMD Ryzen 9 7950X, AMD Radeon RX 7900 XT
89 fps +2%
NVIDIA GeForce RTX 4080
AMD Ryzen 9 7950X, NVIDIA GeForce RTX 4080
87 fps
AMD Radeon RX 6950 XT
AMD Ryzen 9 7950X, AMD Radeon RX 6950 XT
84 fps -3%
NVIDIA GeForce RTX 3080 Ti
AMD Ryzen 9 7950X, NVIDIA GeForce RTX 3080 Ti
76 fps -13%
AMD Radeon RX 6800
AMD Ryzen 9 7950X, AMD Radeon RX 6800
66 fps -24%
Spider-Man Miles Morales - 1920x0180 Very High Preset + Ray-Tracing AA:T
NVIDIA GeForce RTX 4090
AMD Ryzen 9 7950X, NVIDIA GeForce RTX 4090
122.2 (60.2min, 67.7P0.1, 89P1 - 221max) fps +7%
NVIDIA GeForce RTX 4080
AMD Ryzen 9 7950X, NVIDIA GeForce RTX 4080
114.7 (49.8min, 65.7P0.1, 93.2P1 - 157.5max) fps
AMD Radeon RX 7900 XTX
AMD Ryzen 9 7950X, AMD Radeon RX 7900 XTX
98.6 (68.4min, 71.9P0.1, 82.3P1 - 147.1max) fps -14%
NVIDIA GeForce RTX 3080 Ti
AMD Ryzen 9 7950X, NVIDIA GeForce RTX 3080 Ti
93.9 (66.7min, 73.8P0.1, 79.2P1 - 160.1max) fps -18%
AMD Radeon RX 7900 XT
AMD Ryzen 9 7950X, AMD Radeon RX 7900 XT
88.5 (67.1min, 70.7P0.1, 74.7P1 - 196.4max) fps -23%
AMD Radeon RX 6950 XT
AMD Ryzen 9 7950X, AMD Radeon RX 6950 XT
80.9 (60.3min, 63.4P0.1, 67.7P1 - 165.3max) fps -29%
AMD Radeon RX 6800
AMD Ryzen 9 7950X, AMD Radeon RX 6800
65 (48.7min, 50.9P0.1, 52.4P1 - 129.3max) fps -43%
lage gem. hoge ultraQHD4K DLSS4K
GTA V (2015) 188.1 188 187.7 164.3 159.2 183.9
The Witcher 3 (2015) 811 719 549 268 202
Dota 2 Reborn (2015) 287.8 256.8 247.1 228.6 221.7
Final Fantasy XV Benchmark (2018) 236 235 225 195.7 116.9
X-Plane 11.11 (2018) 219 193.6 149.4 124.9
Far Cry 5 (2018) 239 209 203 188 185 139
Strange Brigade (2018) 681 548 531 482 390 195.1
Shadow of the Tomb Raider (2018) 334 299 304 288 241 132.2
Far Cry New Dawn (2019) 196 173 166 150 149 130
Metro Exodus (2019) 300 256 212 177.7 153.7 103.9
Control (2019) 240 240 235 162 82.4
Borderlands 3 (2019) 239 203 189.9 187.2 163.2 95.2
F1 2020 (2020) 552 478 463 396 332 201
F1 2021 (2021) 656 606 514 256 240 144.3
Far Cry 6 (2021) 205 177.3 161.6 155 150.6 107
Forza Horizon 5 (2021) 302 242 238 177 164 124
God of War (2022) 274 271 229 164.9 136.3 95.3
GRID Legends (2022) 318 287 254 237 233 163.3
Cyberpunk 2077 1.6 (2022) 216 213 201 190.1 129.1 63.4
Ghostwire Tokyo (2022) 294 283 252 124.6
Tiny Tina's Wonderlands (2022) 385 320 269 226 165.8 89
F1 22 (2022) 423 411 384 172.8 113.8 57.9
The Quarry (2022) 376 291 249 207 149 79.2
FIFA 23 (2022) 278 274 274 274 272 218
A Plague Tale Requiem (2022) 174.1 172.5 153.9 127 95.4 54.4
Uncharted Legacy of Thieves Collection (2022) 145.5 144.7 142.1 140.4 125.6 77.7
Call of Duty Modern Warfare 2 2022 (2022) 317 286 230 219 170 158 112
Spider-Man Miles Morales (2022) 198.6 180.3 178.2 157.3 202 103.9
The Callisto Protocol (2022) 231 213 172 171 138 85
Need for Speed Unbound (2022) 177.8 171.4 160.4 140.3 137.8 104.5

Emissies van de KFA2 GeForce RTX 4080 SG

Herzien ventilatorontwerp met meer luchtstroom (bron: KFA2)
12VHPWR-aansluiting op de KFA2 GeForce RTX 4080 SG (bron: KFA2)

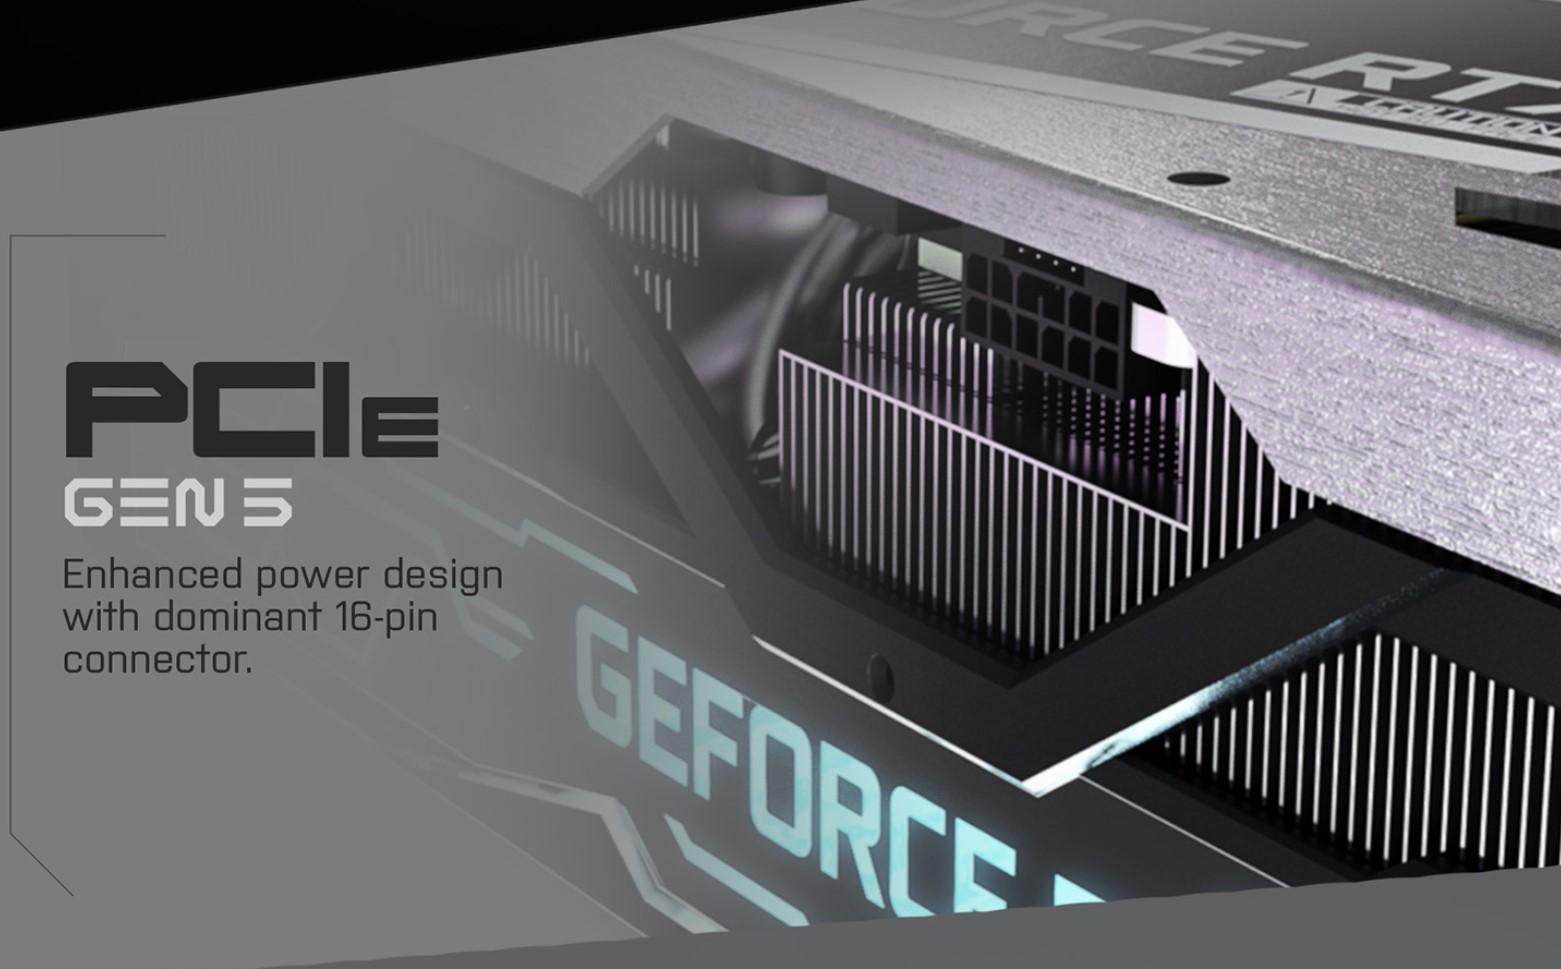
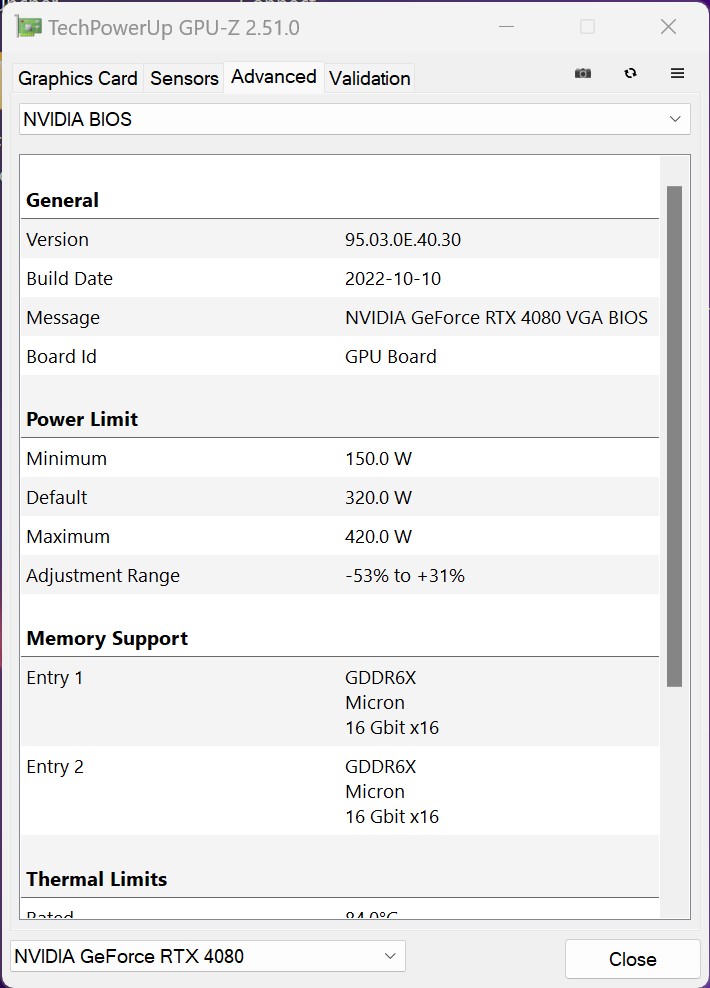
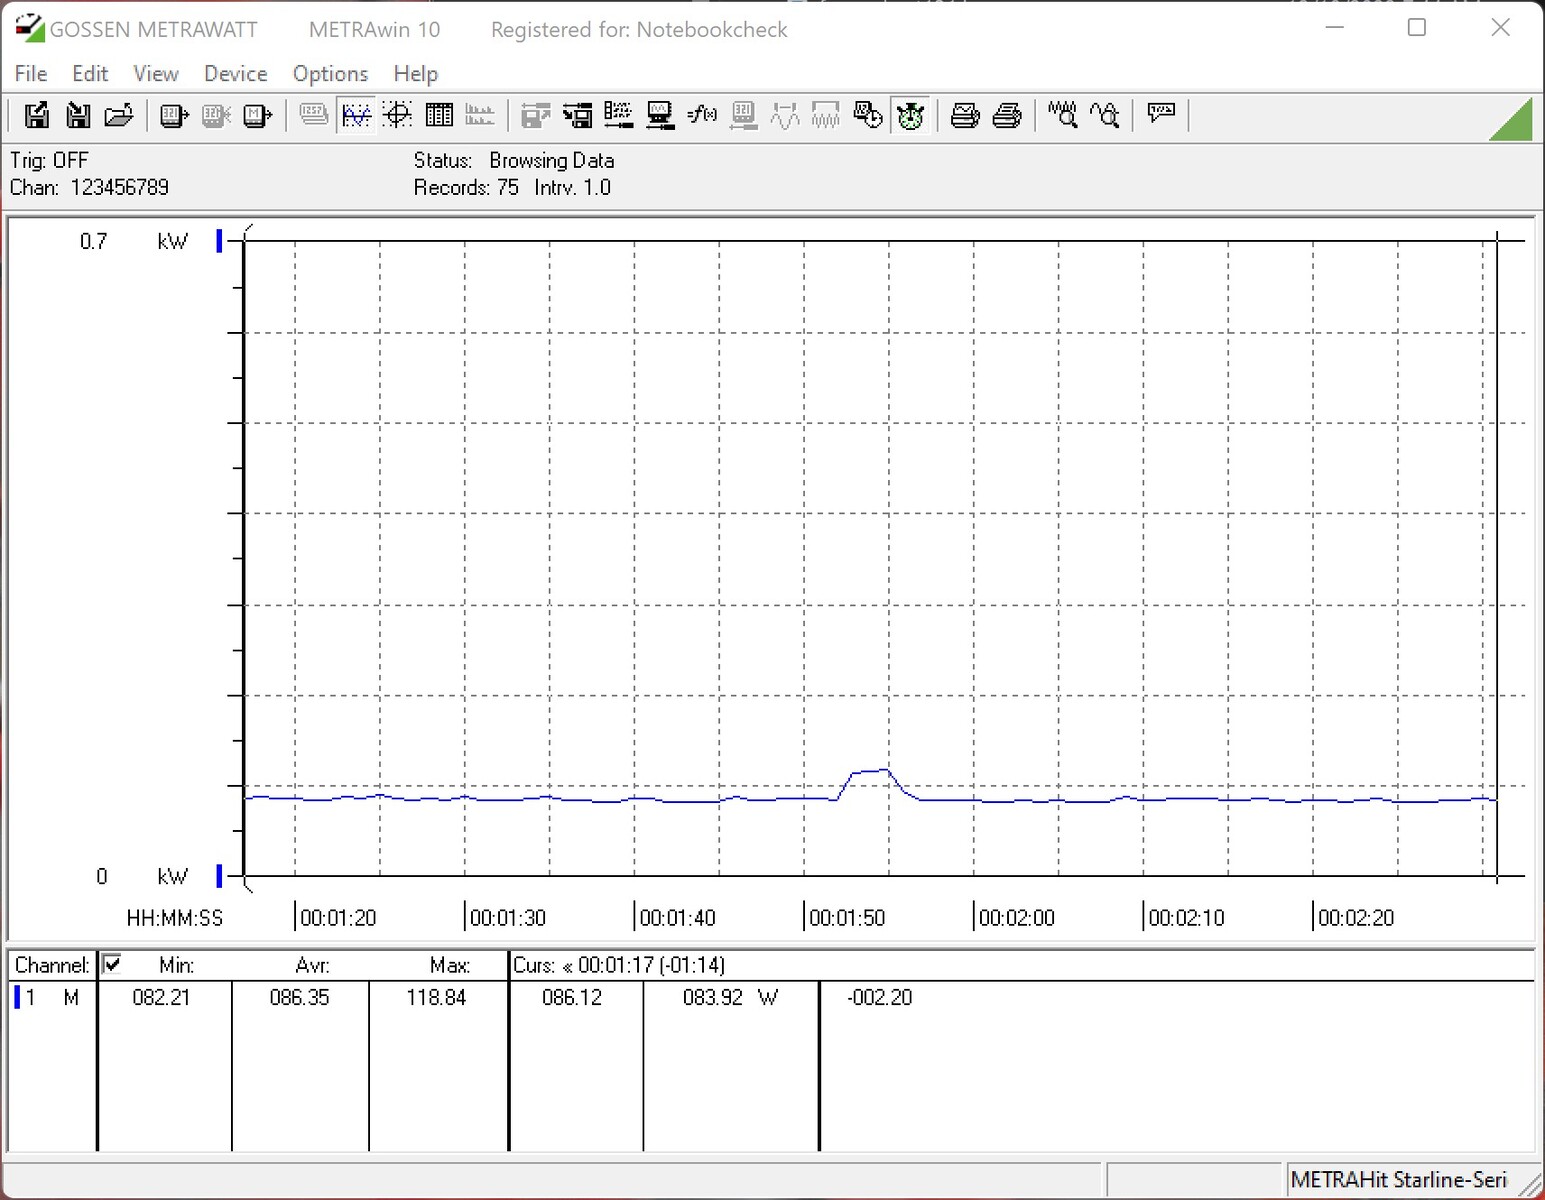
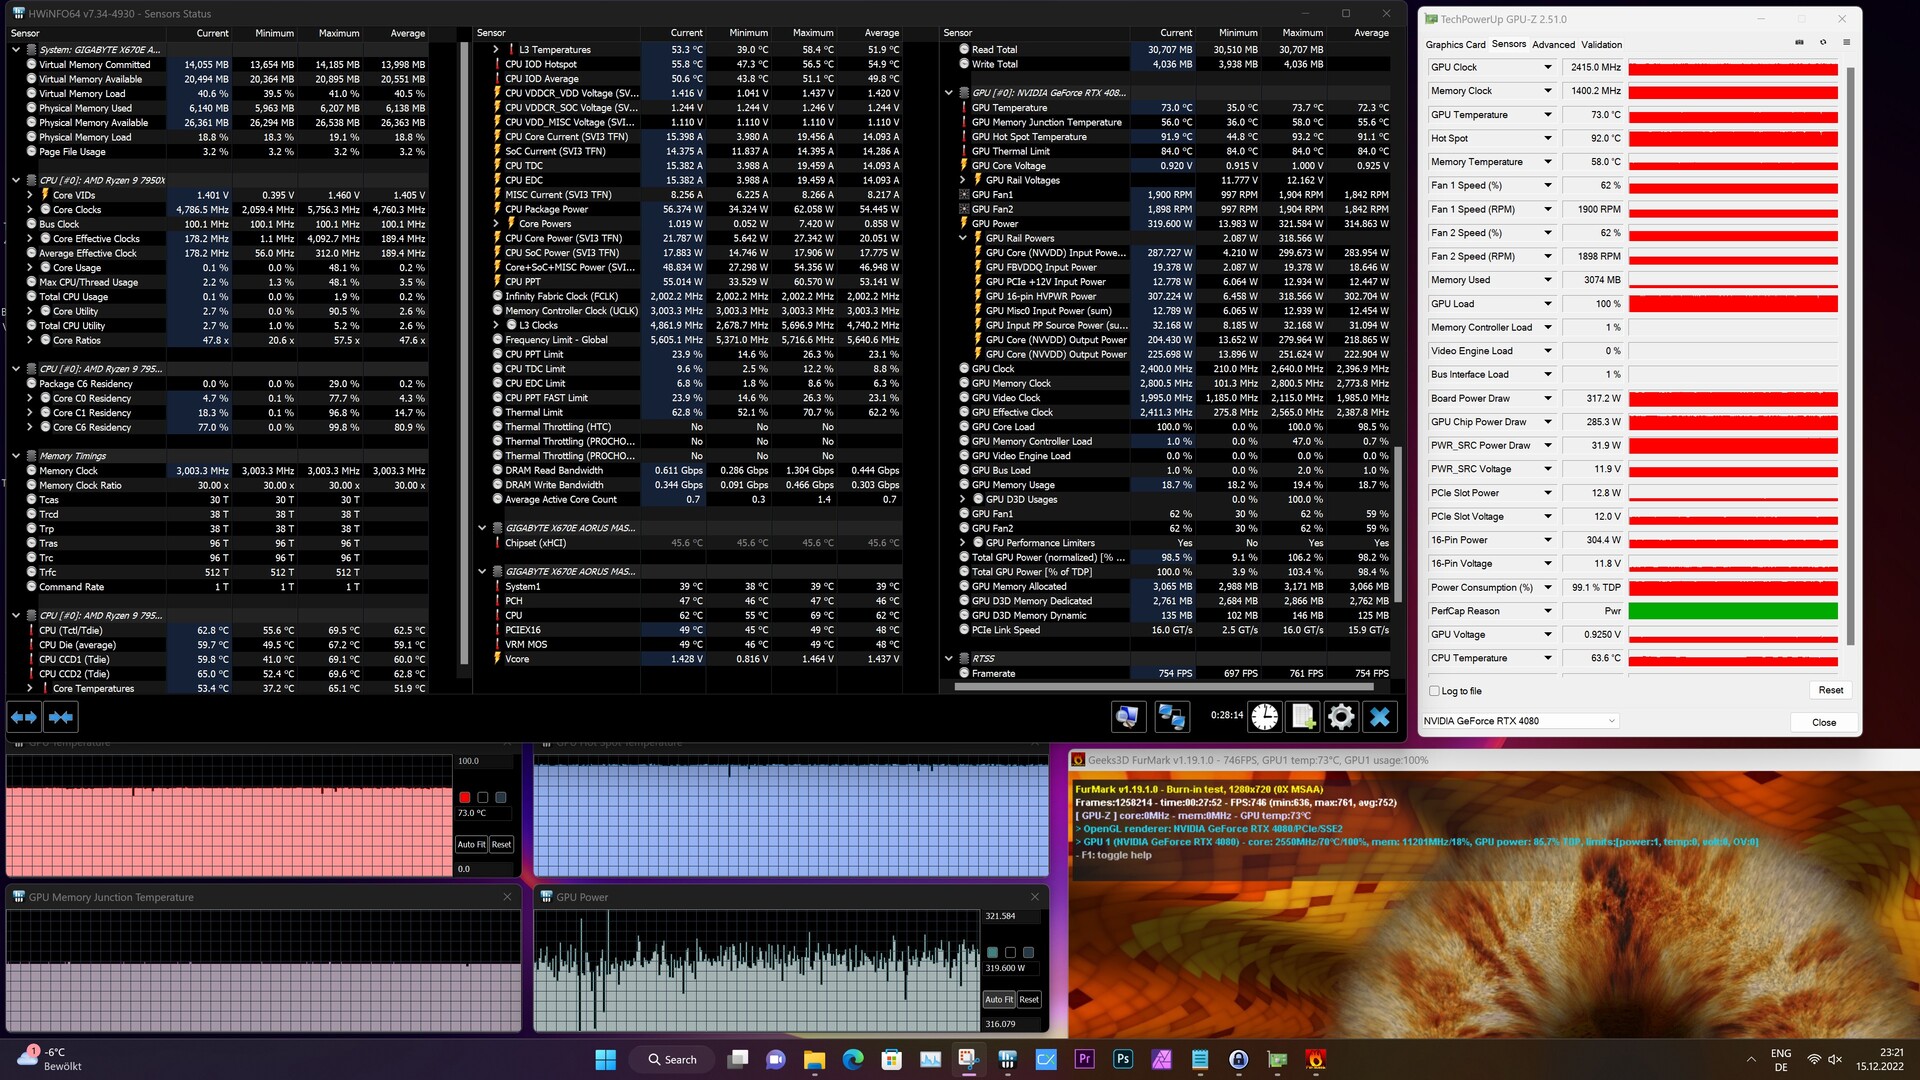
De KFA2 GeForce RTX 4080 SG heeft een stroomverbruik van 320 watt - wat op hetzelfde niveau ligt als een Founders Edition-kaart van Nvidia. Hoewel het stroomverbruik onveranderd is gebleven in vergelijking met een GeForce RTX 3080presteert de RTX 4080 aanzienlijk beter dan zijn voorganger in onze tests. De energie-efficiëntie is met Ada Lovelace en de 4 nm-knoop met een indrukwekkende marge verbeterd. Het vermogensdoel van de KFA2 GeForce RTX 4080 SG kan met maximaal 31 procent worden verhoogd, waardoor de grafische kaart alleen al 420 watt aan stroom kan verbruiken. Met behulp van de 12VHPWR connector (in de doos meegeleverd als adapter met 3x6+2 pin PCIe connectoren) blijft de stroomopname van de GPU binnen de toelaatbare grenzen. Om problemen met de voeding te voorkomen, raden we aan drie aparte kabels te gebruiken om de kaart met de PSU te verbinden

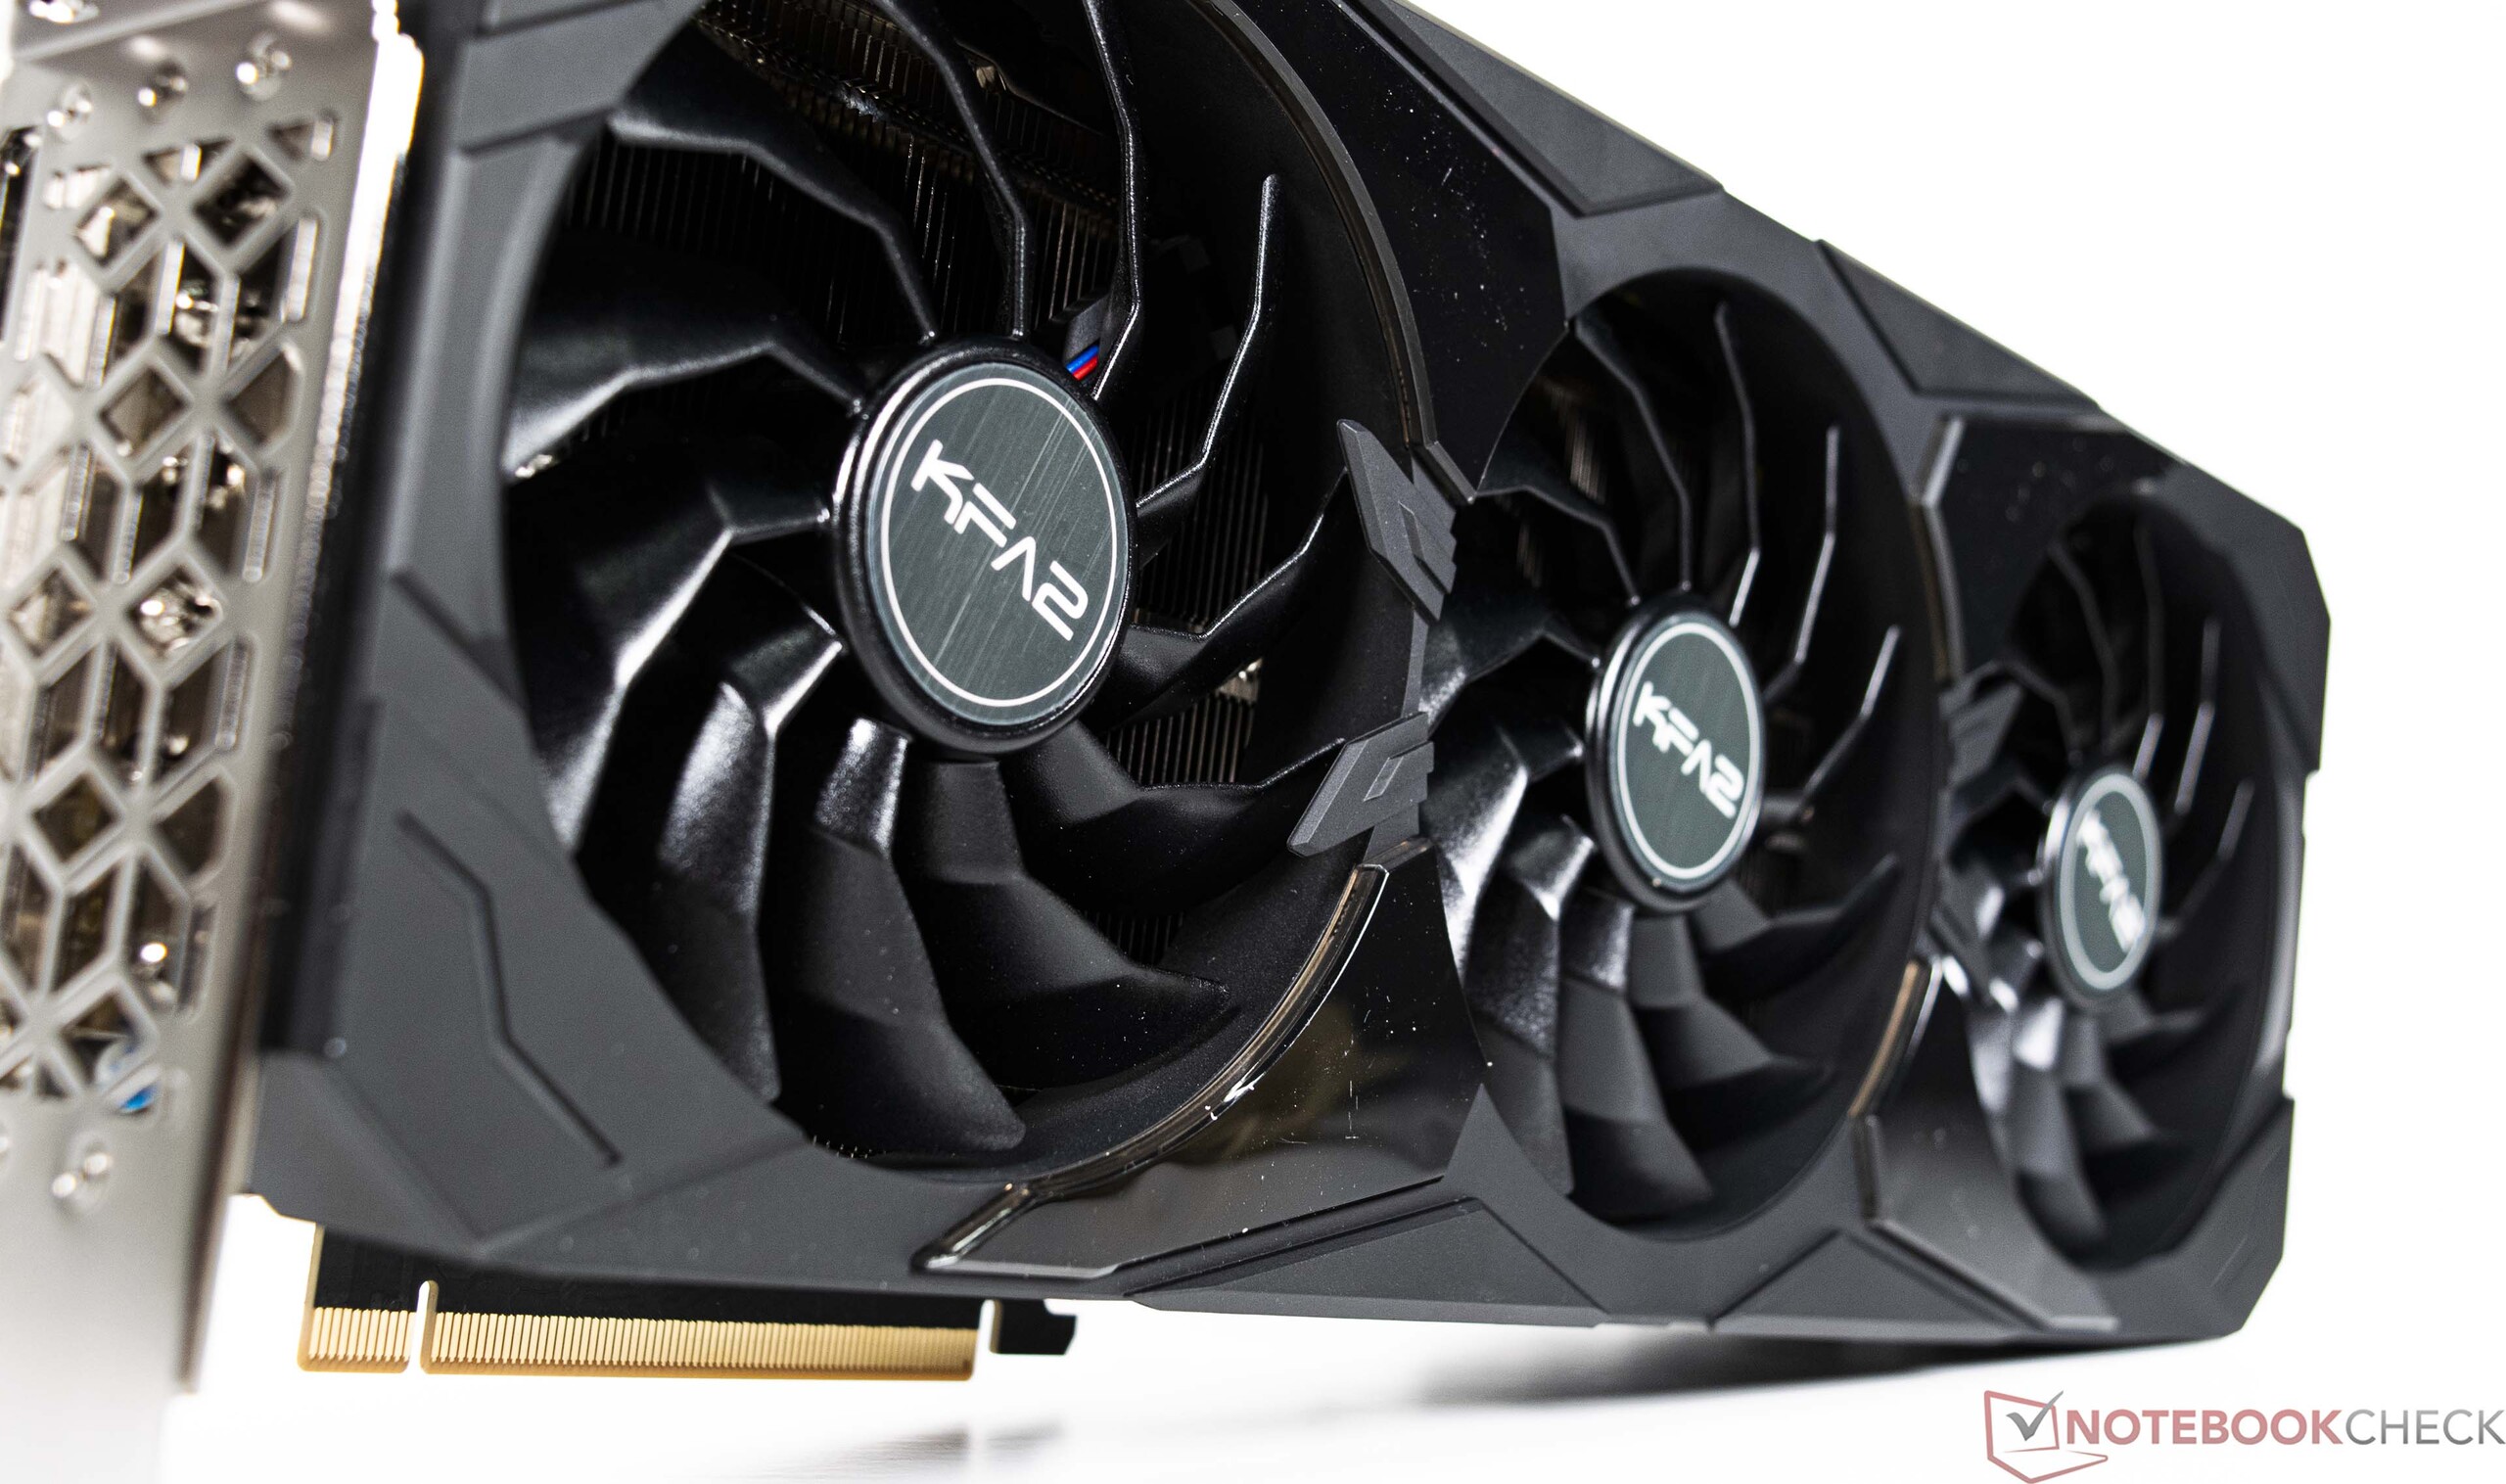
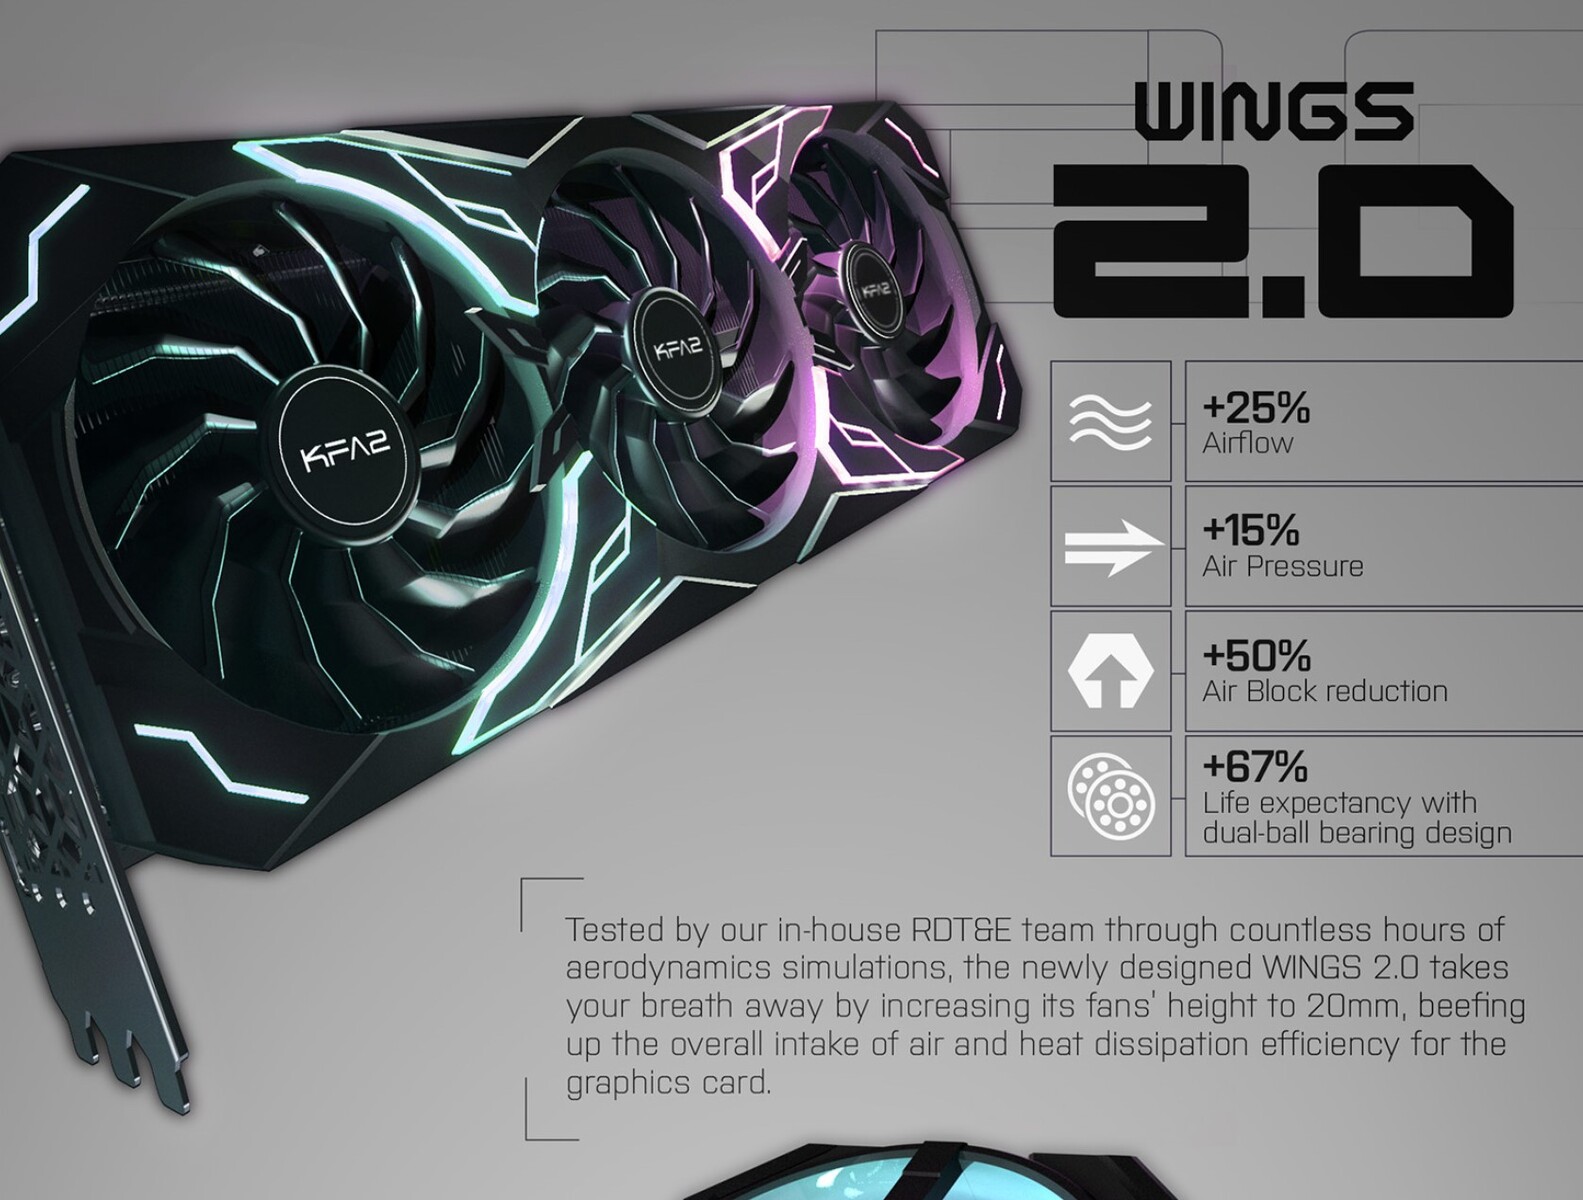
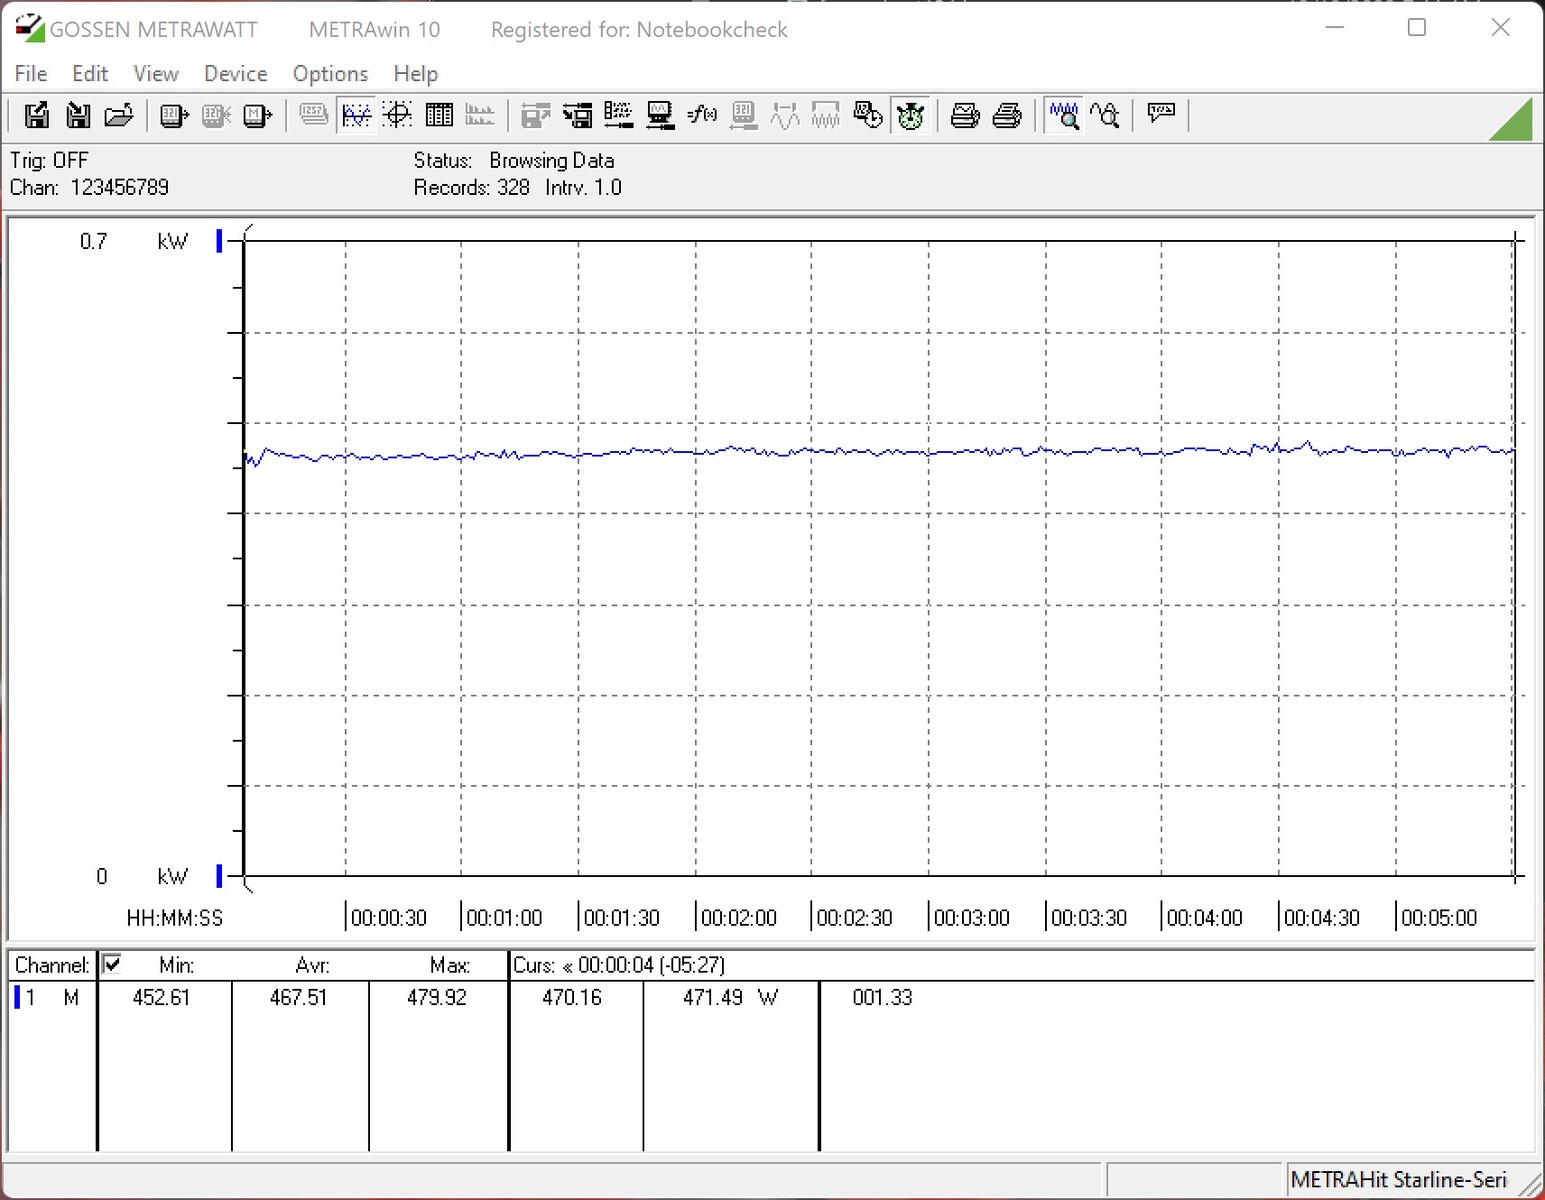
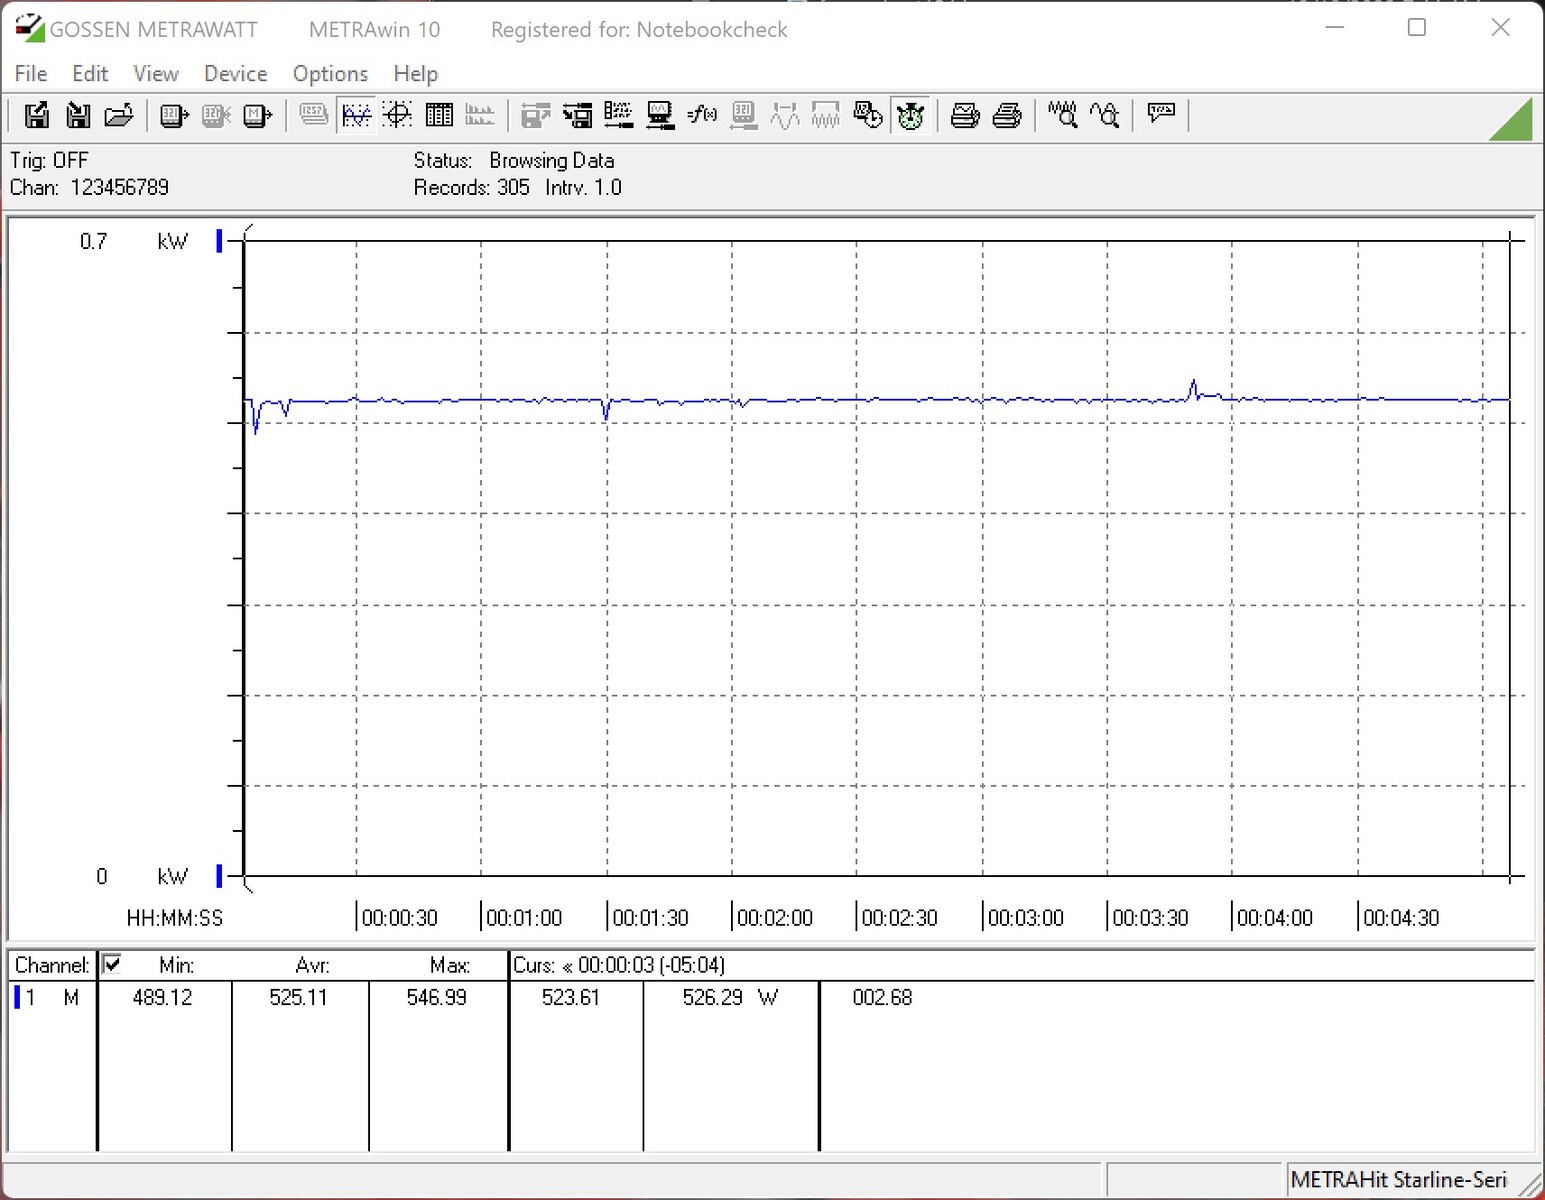
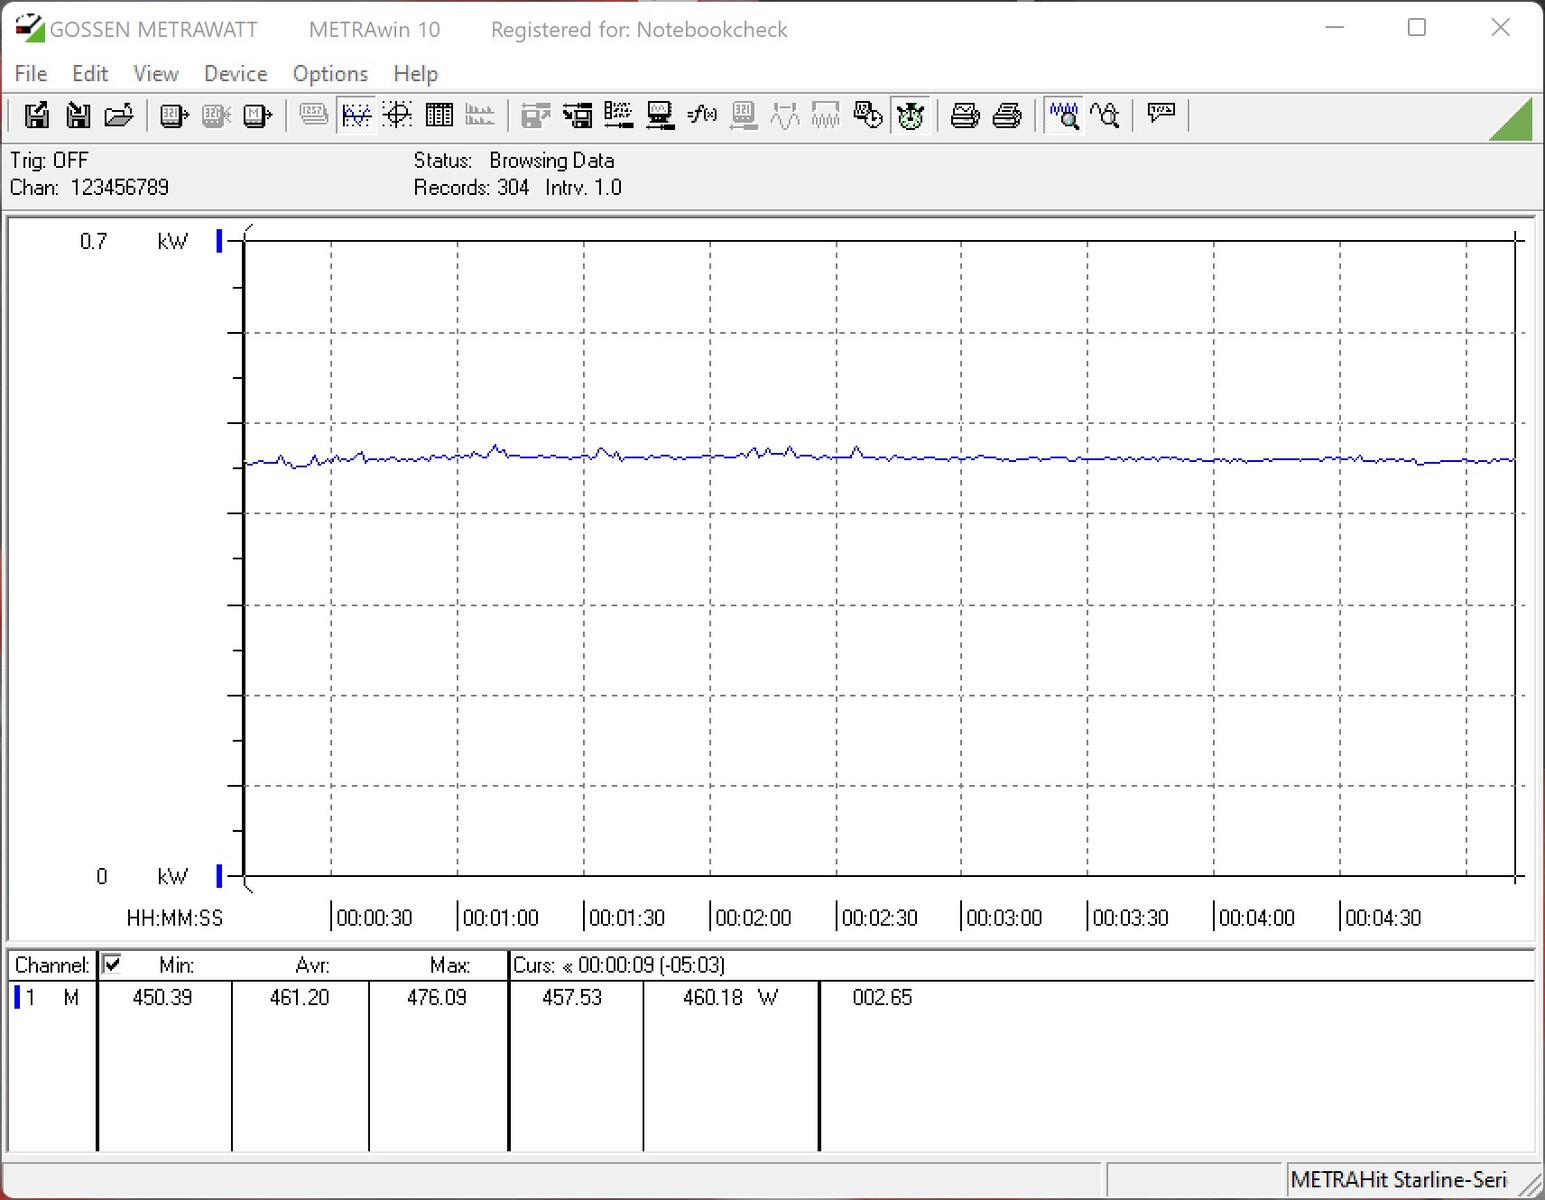
Tijdens de stresstest haalde de KFA2 GeForce RTX 4080 SG moeiteloos 320 watt, en we registreerden een GPU-temperatuur van ongeveer 74°C (165°F). De GPU hotspot temperatuur liep echter op tot 93°C (199°F) onder belasting. Het VRAM bleef met 58°C verbazingwekkend koel. De KFA2-kaart vertrouwt op een enorme heatsink met drie 102 mm axiale ventilatoren om warmte af te voeren. Optioneel kan er nog een 102 mm ventilator op de achterkant van de kaart worden geïnstalleerd. Helaas konden we die niet testen vanwege incompatibiliteit met ons moederbord. De ventilatoren produceerden een stil zoemend geluid dat nog steeds hoorbaar was met de computerkast gesloten (42 dB(A) geluid op basis van onze meting). Toen we de vermogenslimiet verhoogden, steeg het geluidsniveau van de GPU tot 43 dB(A). Tijdens het gamen (The Witcher 3, 1080p, Ultra preset) produceerde onze opstelling een aangename 36 dB(A) aan geluid. We merkten ook geen vervelend spoelgejank

In termen van stroomverbruik laat de KFA2 GeForce RTX 4080 SG een goede indruk achter en is nek aan nek met de AMD Radeon RX 7900 XT - een kaart die aanzienlijk minder prestaties levert. De KFA GeForce RTX 3080 SG, die we eerder hebben beoordeeld, vergde meer stroom onder belasting. Vergeleken met de KFA2 GeForce RTX 4090 SG verbruikt de kleinere Ada Lovelace grafische kaart 30 procent minder stroom onder belasting. Toch moet worden vermeld dat de RTX 4090 een vermogen heeft van 450 watt en aanzienlijk hogere prestaties levert

De fabrikant raadt aan een PSU van 750 watt te gebruiken. Deze aanbeveling is gebaseerd op een systeem met een AMD Ryzen 9 5900X. Maar als uw systeem een Ryzen 9 7000-serie processor of een Intel Raptor Lake-processor heeft, moet u rekening houden met het hogere stroomverbruik van deze CPU's onder belasting. Daarom raden we aan de grafische kaart te koppelen met een 850-watt PSU.

Geluidsniveau

Onbelast
30.9 / 30.9 / 30.9 dB (A)
Belasting
31 / 42.1 dB (A)
  red to green bar
 
 
30 dB
stil
40 dB(A)
hoorbaar
50 dB(A)
luid
 
min: dark, med: mid, max: light   Earthworks M23R, Arta (15 cm afstand)   omgevingslawaai: 30.4 dB(A)
dB(A) 0102030405060708090Deep BassMiddle BassHigh BassLower RangeMidsHigher MidsLower HighsMid HighsUpper HighsSuper Highs2033.331.232.53233.931.533.32532.433.631.130.729.631.732.4313131.731.329.63030.6314029.329.429.328.530.730.329.35028.934.234.233.533.432.928.96328.327.727.827.927.927.728.38028.326.126.428.829.126.928.310027.72625.625.324.526.827.712525.425.224.924.523.724.425.416025.125.123.823.323.62425.120025.724.222.822.822.522.425.725025.524.521.422.821.121.225.531524.822.620.221.320.821.324.840024.721.519.82020.520.124.750023.620.619.219.719.21923.663023.820.318.618.919.118.923.880025.52118.418.31818.225.5100026.422.117.917.317.817.226.4125028.920.817.416.917.216.928.91600312116.816.817.316.931200032.623.816.616.517.316.532.6250031.520.516.816.616.916.331.5315030.221.116.316.51816.130.240002919.716.416.417.416.629500028.517.316.716.717.116.528.563002417.116.716.81716.624800019.917.116.916.917.116.819.91000018.217.417.217.217.117.118.21250017.817.717.517.617.417.417.81600018.118.3181817.917.918.1SPL40.832.729.629.629.929.540.8N3.31.81.31.31.31.33.3median 25.5median 21median 17.9median 17.6median 17.9median 17.4median 25.5Delta3.52.82.32.31.82.33.5hearing rangehide median Fan NoiseKFA2 GeForce RTX 4080 SG
Stroomverbruik van het testsysteem (inactief)
Stroomverbruik van het testsysteem (FurMark PT 100 procent)
Stroomverbruik van het testsysteem (FurMark PT 131 procent)
Stroomverbruik van het testsysteem (gaming - De Witcher 3, Ultra preset)
Stresstest FurMark (PT 100 procent)
Power Consumption / The Witcher 3 ultra (external Monitor)
MSI Radeon RX 6950 XT Gaming X Trio
MSI Radeon RX 6950 XT Gaming X Trio, AMD Ryzen 9 7950X (Idle: 79.6 W)
610 (607min, 608P1 - 618max) Watt * -32%
Sapphire AMD Radeon RX 6950 XT Nitro+ Pure
Sapphire AMD Radeon RX 6950 XT Nitro+ Pure, AMD Ryzen 9 5900X
589 (583min, 584P1 - 598max) Watt * -28%
AMD Ryzen 7 5800X3D
AMD Ryzen 7 5800X3D, AMD Ryzen 7 5800X3D (Idle: 102 W)
561 (533min, 542P1 - 582max) Watt * -22%
KFA2 GeForce RTX 4090 SG
KFA2 GeForce RTX 4090 SG, AMD Ryzen 9 7950X
546 (526min, 532P1 - 564max) Watt * -18%
AMD Radeon RX 7900 XTX
AMD Radeon RX 7900 XTX, AMD Ryzen 9 7950X (Idle: 86.5 W)
540 (527min, 530P1 - 564max) Watt * -17%
NVIDIA GeForce RTX 3090 Founders Edition
NVIDIA GeForce RTX 3090 Founders Edition, AMD Ryzen 9 7950X
538 (532min, 532P1 - 570max) Watt * -17%
ASUS TUF Gaming GeForce RTX 3080 Ti OC
ASUS TUF Gaming GeForce RTX 3080 Ti OC, AMD Ryzen 9 7950X (Idle: 78.2 W)
528 (511min, 523P1 - 549max) Watt * -15%
KFA2 GeForce RTX 3080 SG
KFA2 GeForce RTX 3080 SG, AMD Ryzen 9 5900X
518 (509min, 510P1 - 539max) Watt * -12%
AMD Radeon RX 6900 XT
AMD Radeon RX 6900 XT, AMD Ryzen 9 5950X (Idle: 99.15 W)
488.3 (459.99min - 512.79max) Watt * -6%
KFA2 GeForce RTX 4080 SG
KFA2 GeForce RTX 4080 SG, AMD Ryzen 9 7950X (Idle: 86.4 W)
461 (450min, 453P1 - 476max) Watt *
AMD Radeon RX 7900 XT
AMD Radeon RX 7900 XT, AMD Ryzen 9 7950X (Idle: 84.6 W)
459 (451min, 453P1 - 488max) Watt * -0%
Power Consumption / FurMark 1.19 GPU Stress Test (external Monitor)
KFA2 GeForce RTX 4090 SG
KFA2 GeForce RTX 4090 SG, AMD Ryzen 9 7950X
618 (593min, 605P1 - 652max) Watt * -32%
MSI Radeon RX 6950 XT Gaming X Trio
MSI Radeon RX 6950 XT Gaming X Trio, AMD Ryzen 9 7950X (Idle: 79.6 W)
604 (579min, 587P1 - 627max) Watt * -29%
Sapphire AMD Radeon RX 6950 XT Nitro+ Pure
Sapphire AMD Radeon RX 6950 XT Nitro+ Pure, AMD Ryzen 9 5900X
564 (525min, 551P1 - 601max) Watt * -21%
AMD Radeon RX 7900 XTX
AMD Radeon RX 7900 XTX, AMD Ryzen 9 7950X (Idle: 86.5 W)
518 (501min, 502P1 - 525max) Watt * -11%
NVIDIA GeForce RTX 3090 Founders Edition
NVIDIA GeForce RTX 3090 Founders Edition, AMD Ryzen 9 7950X
516 (512min, 514P1 - 541max) Watt * -10%
ASUS TUF Gaming GeForce RTX 3080 Ti OC
ASUS TUF Gaming GeForce RTX 3080 Ti OC, AMD Ryzen 9 7950X (Idle: 78.2 W)
513 (500min, 506P1 - 527max) Watt * -10%
AMD Radeon RX 7900 XT
AMD Radeon RX 7900 XT, AMD Ryzen 9 7950X (Idle: 84.6 W)
513 (500min, 506P1 - 527max) Watt * -10%
KFA2 GeForce RTX 3080 SG
KFA2 GeForce RTX 3080 SG, AMD Ryzen 9 5900X
487 (475min, 477P1 - 501max) Watt * -4%
KFA2 GeForce RTX 4080 SG
KFA2 GeForce RTX 4080 SG, AMD Ryzen 9 7950X (Idle: 86.4 W)
468 (453min, 459P1 - 480max) Watt *
AMD Radeon RX 6900 XT
AMD Radeon RX 6900 XT, AMD Ryzen 9 5950X (Idle: 99.15 W)
456.8 (378.13min - 484.67max) Watt * +2%

* ... kleiner is beter

Power consumption with external monitor

0255075100125150175200225250275300325350375400425450475Tooltip
KFA2 GeForce RTX 4080 SG; 1280x720 FurMark 1.19 GPU Stress Test (external Monitor): Ø468 (453-480)
KFA2 GeForce RTX 4080 SG; 1920x1080 The Witcher 3 ultra (external Monitor): Ø461 (450-476)
KFA2 GeForce RTX 4080 SG; Idle 1min (external Monitor): Ø86.3 (82.2-118.8)

Pro

+ hoge 3D-prestaties
+ grote sprong in prestaties ten opzichte van de vorige generatie bij hetzelfde TDP
+ moderne 4 nm architectuur
+ 16 GB VRAM DLSS 3.0 met Frame Generation
+ ventilator stop modus
+ geweldig ontwerp
+ aantrekkelijk uiterlijk
+ optionele vierde ventilator
+ stevige GPU-beugel met RGB-verlichting

Contra

- onhandig geplaatste stroomaansluiting
- erg groot (controleer op compatibiliteit met de behuizing)
- geen DisplayPort 2.1
- te duur

Verdict - Geweldige prestaties en veel RGB

KFA2 GeForce RTX 4080 SG review: product is vriendelijk verstrekt door KFA2 Duitsland

De KFA2 GeForce RTX 4080 SG is in alle opzichten een extreem snelle grafische kaart en is geschikt om zonder compromissen veeleisende games te draaien. In vergelijking met de GeForce RTX 3080kan de kaart aanzienlijk meer prestaties leveren bij hetzelfde stroomverbruik. De voordelen van de nieuwe GPU-generatie worden vooral duidelijk wanneer ray tracing is ingeschakeld. Samen met DLSS 3.0 (inclusief Frame Generation) kunnen zelfs nieuwe games soepel draaien op 2160p met ray tracing effecten ingeschakeld. Helaas heb je wel een GeForce RTX 4080 of RTX 4090 nodig om dit prestatieniveau te bereiken. Gebruikers van oudere Nvidia GPU's blijven buiten schot

Het KFA2-model in deze review heeft een speciaal ontwikkeld ontwerp en een enorme koeler die verbluffend goed presteerde tijdens onze review. Hij is zelfs in staat om de kaart stil te koelen in 2D toepassingen dankzij de fan stop modus. De GPU vraagt veel stroom en wordt gewaardeerd op 320 watt, maar dit stroomverbruik valt nog steeds binnen een redelijk bereik. Naar onze mening is een constant toenemend stroomverbruik niet de juiste weg

De KFA2 GeForce RTX 4080 SG is een geweldige grafische kaart en heeft op ons diepe indruk gemaakt met zijn hoge gaming prestaties. Het brede scala aan RGB-verlichting vestigt de aandacht op de enorme koeler.

De grafische kaart wordt gevoed via een 12VHPWR connector. De meningen zijn misschien verdeeld over deze connector, maar we hebben er nog geen problemen mee ondervonden. Het enige probleem is dat we vinden dat de 12VHPWR-aansluiting op een minder dan optimale plaats zit. Omdat de grafische kaart zo ver boven het PCIe-slot uitsteekt, moet er voldoende ruimte worden vrijgemaakt voor de grote adapterkabel, zodat hij niet naast de GPU geknikt raakt. Dit kan in veel computerkasten voor ruimteproblemen zorgen

De KFA2 GeForce RTX 4080 SG concurreert w

Please share our article, every link counts!
> Overzichten en testrapporten over laptops en mobieltjes > Testrapporten > KFA2 GeForce RTX 4080 SG desktop GPU review: Geweldige prestaties ontmoet twijfelachtige prijsstelling
Sebastian Bade, 2023-01- 4 (Update: 2023-01- 4)