MSI Katana 15 laptop review: Budget gamer met RTX 4050 en Alder Lake CPU
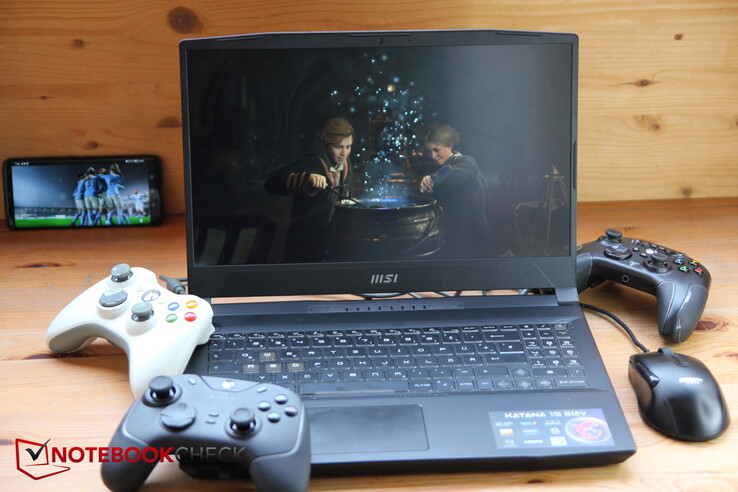
MSI heeft een lijn laptops die visueel erg op elkaar lijken. Vorig jaar hebben we de 15,6-inch quasi-voorganger, deMSI Katana GF66 12UGSmaar de Pulse GL66of MSI Sword slaan ook dezelfde visuele toon aan. Onze huidige review configuratie is interessant omdat MSI heeft besloten om een "oude" Alder Lake processor te combineren met een nieuwe RTX 4050 om mogelijk als een van de eersten een gaming laptop met een RTX 40xx kaart uit te brengen. De benaming is Katana 15 B12, terwijl de Katana 15 B13 al een Intel Gen13 en een RTX 40xx heeft. We zullen eens kijken hoe de twee CPU/GPU generaties zich verhouden in ons B12 model.
Aangezien de Katana 15 een van de eerste laptops met een RTX 4050 is die we onder de loep nemen, vallen we grotendeels terug op de vorige generatie voor instap- tot middenklasse gamers met deRTX 3060ter vergelijking. Deze omvatten de Lenovo Legion 5, de Schenker XMG Core 15, de MSI Pulse GL66 en de Asus TUF Gaming F15de voorganger is ook opgenomen ter vergelijking, maar lezers moeten er rekening mee houden dat deze was uitgerust met de sterkere RTX 3070 Ti.
Potentiële concurrenten in vergelijking
Evaluatie | Datum | Model | Gewicht | Hoogte | Formaat | Resolutie | Beste prijs |
|---|---|---|---|---|---|---|---|
| 82.9 % v7 (old) | 03-2023 | MSI Katana 15 B12VEK i7-12650H, GeForce RTX 4050 Laptop GPU | 2.3 kg | 24.9 mm | 15.60" | 1920x1080 | |
| 80.3 % v7 (old) | 06-2022 | MSI Katana GF66 12UGS i7-12700H, GeForce RTX 3070 Ti Laptop GPU | 2.3 kg | 27.5 mm | 15.60" | 1920x1080 | |
| 80.7 % v7 (old) | 04-2022 | MSI Pulse GL66 12UEK i9-12900H, GeForce RTX 3060 Laptop GPU | 2.3 kg | 25 mm | 15.60" | 1920x1080 | |
| 87.5 % v7 (old) | 11-2022 | Lenovo Legion 5 15IAH7H 82RB i7-12700H, GeForce RTX 3060 Laptop GPU | 2.4 kg | 19.99 mm | 15.60" | 1920x1080 | |
| 87.2 % v7 (old) | 03-2022 | Asus TUF Gaming F15 FX507ZM i7-12700H, GeForce RTX 3060 Laptop GPU | 2.1 kg | 24.95 mm | 15.60" | 1920x1080 | |
| 87.9 % v7 (old) | 01-2023 | Schenker XMG Core 15 (M22) R7 6800H, GeForce RTX 3060 Laptop GPU | 2.1 kg | 23 mm | 15.60" | 2560x1440 |
Geval - Plastic Katana
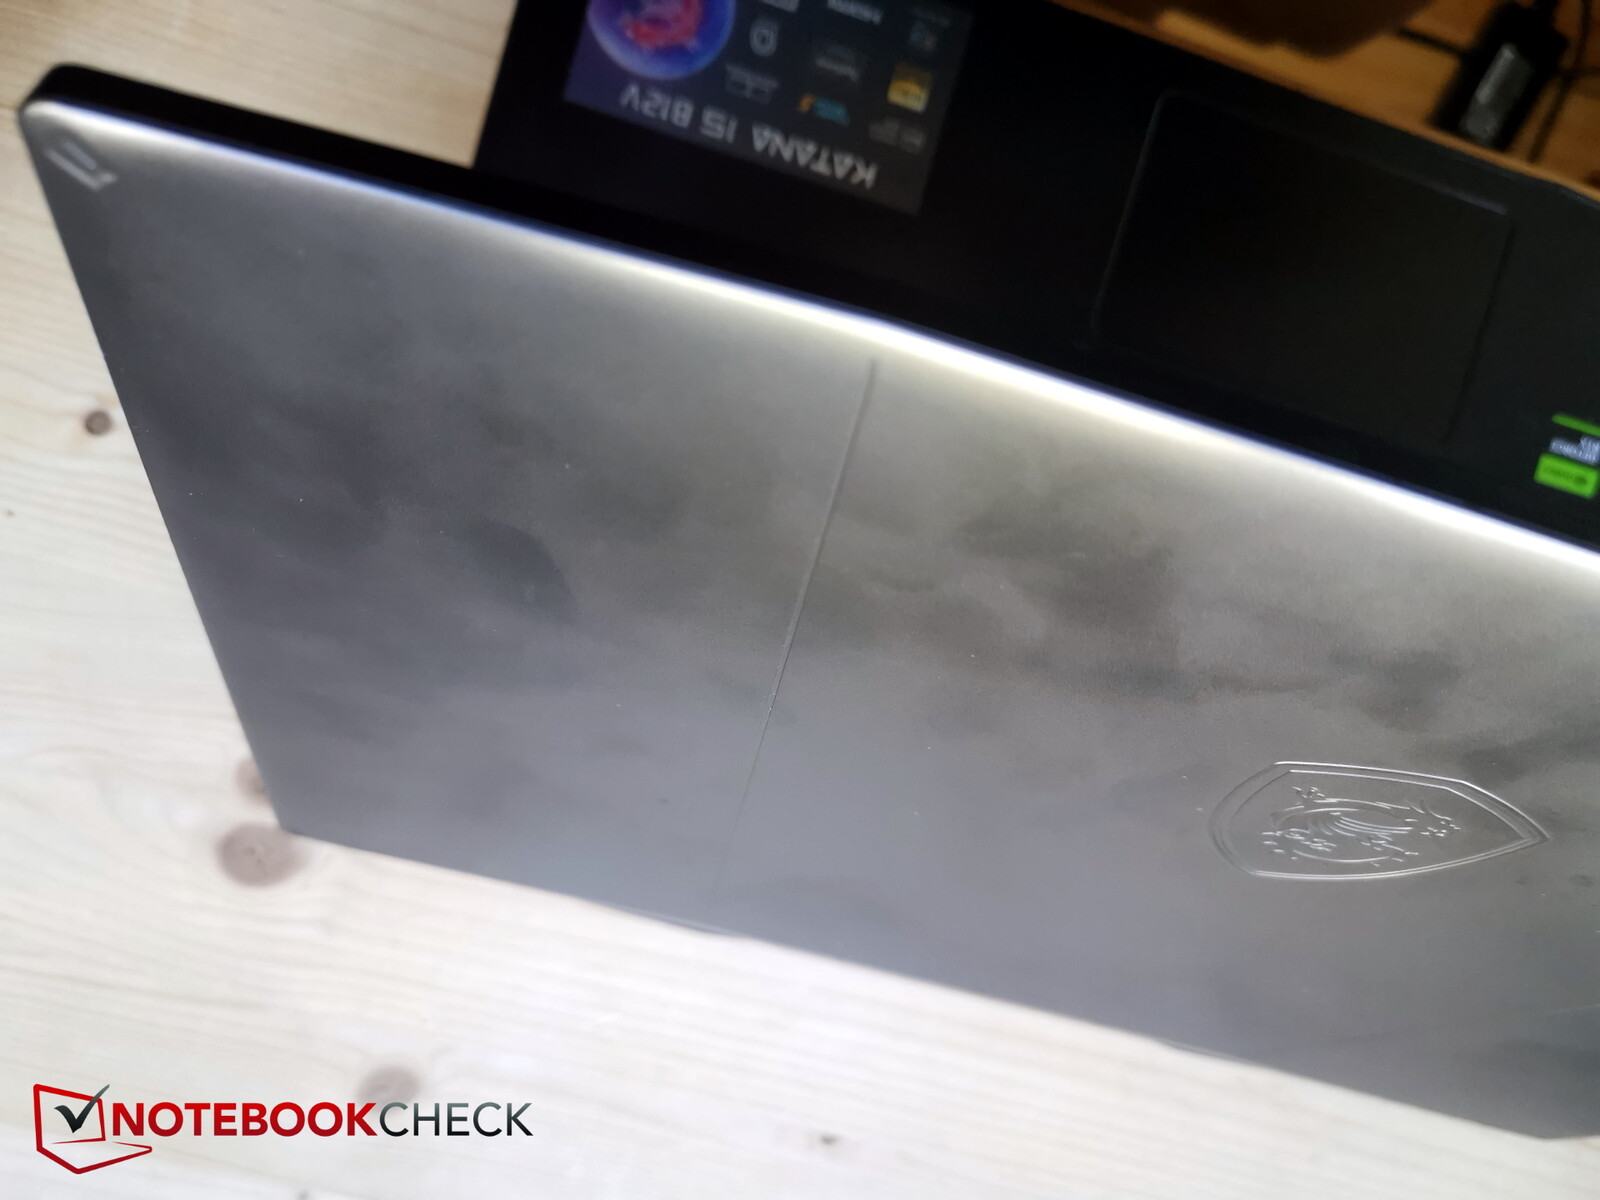
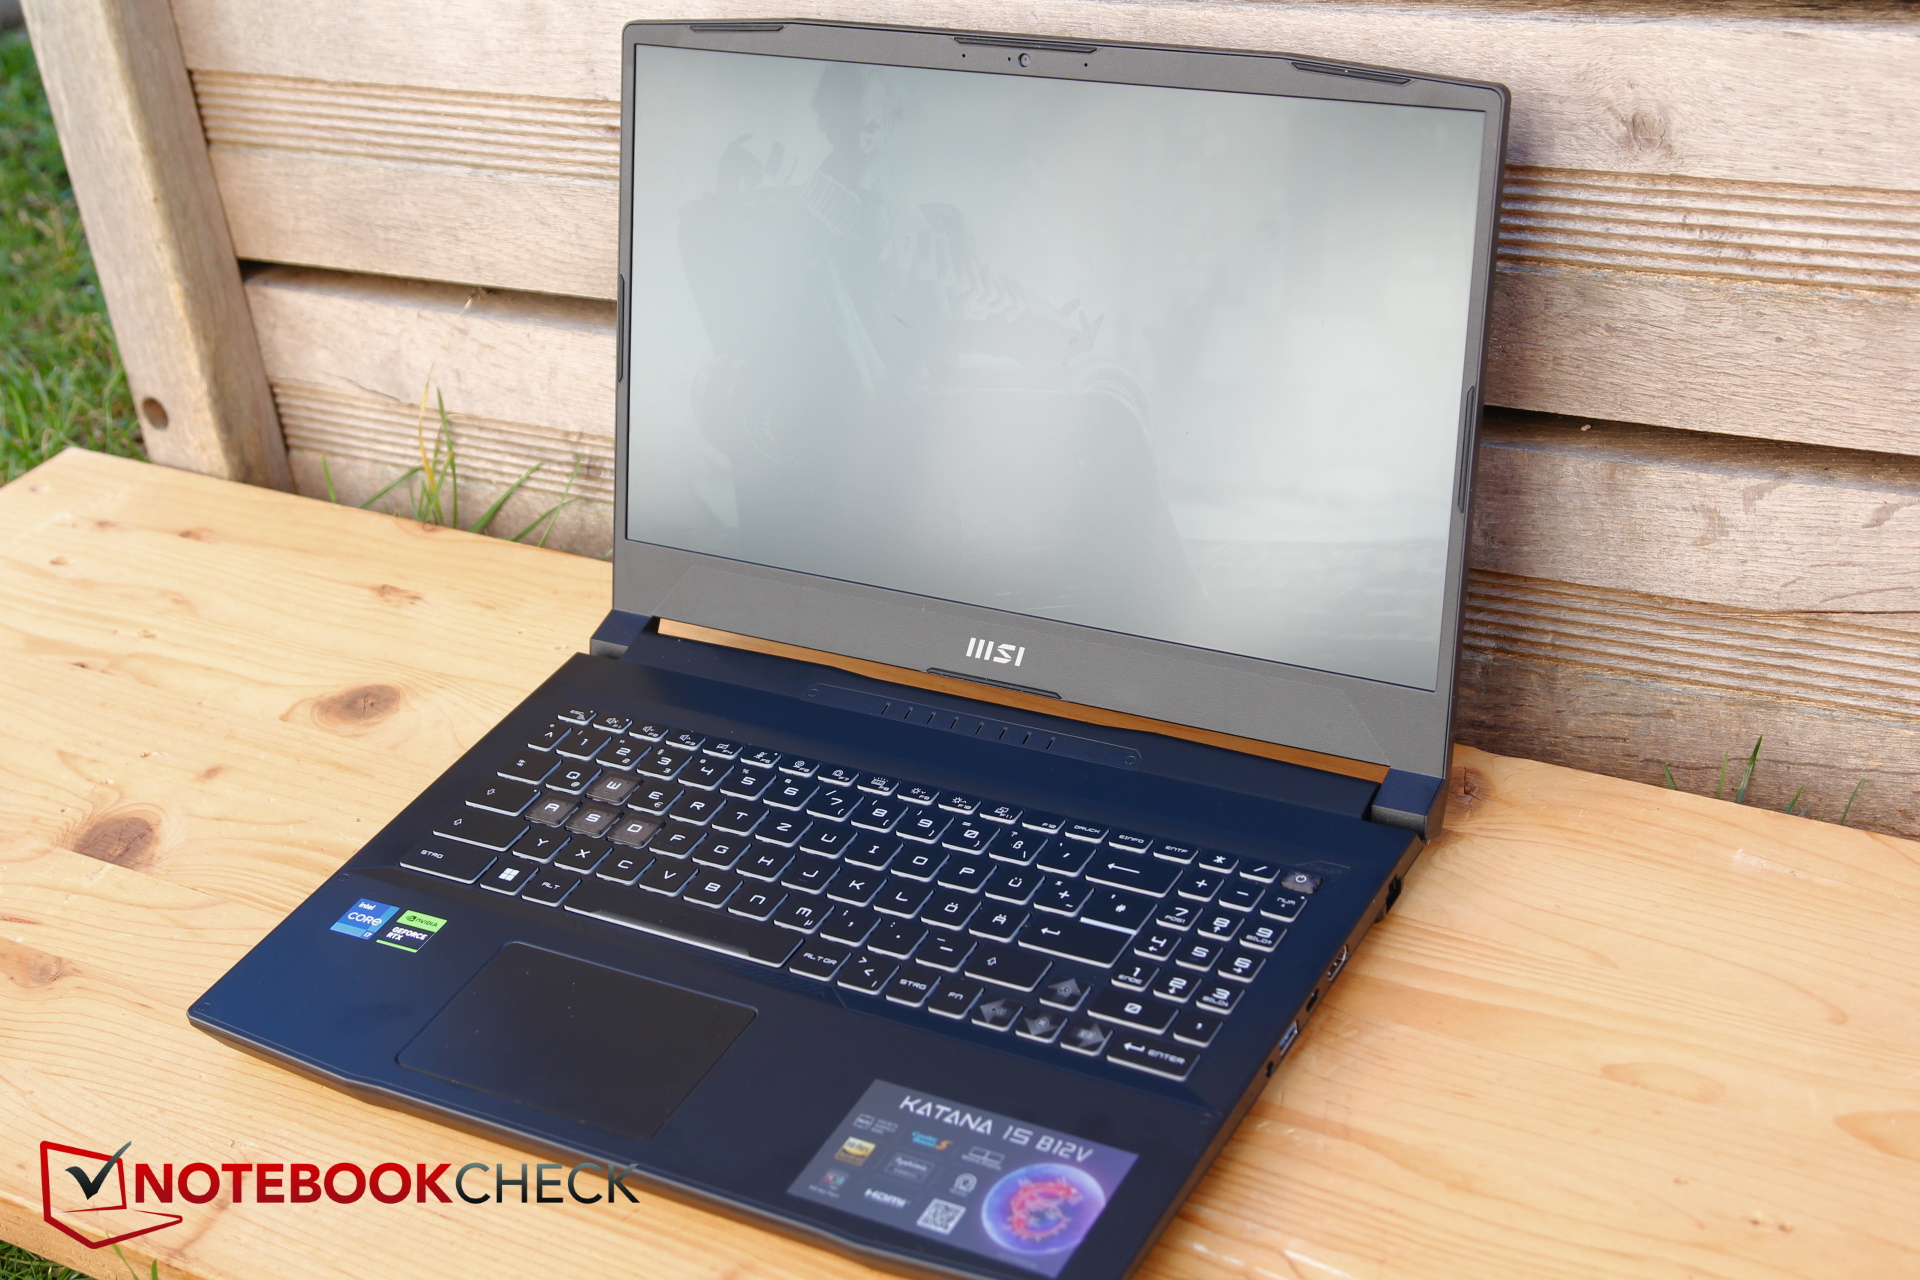
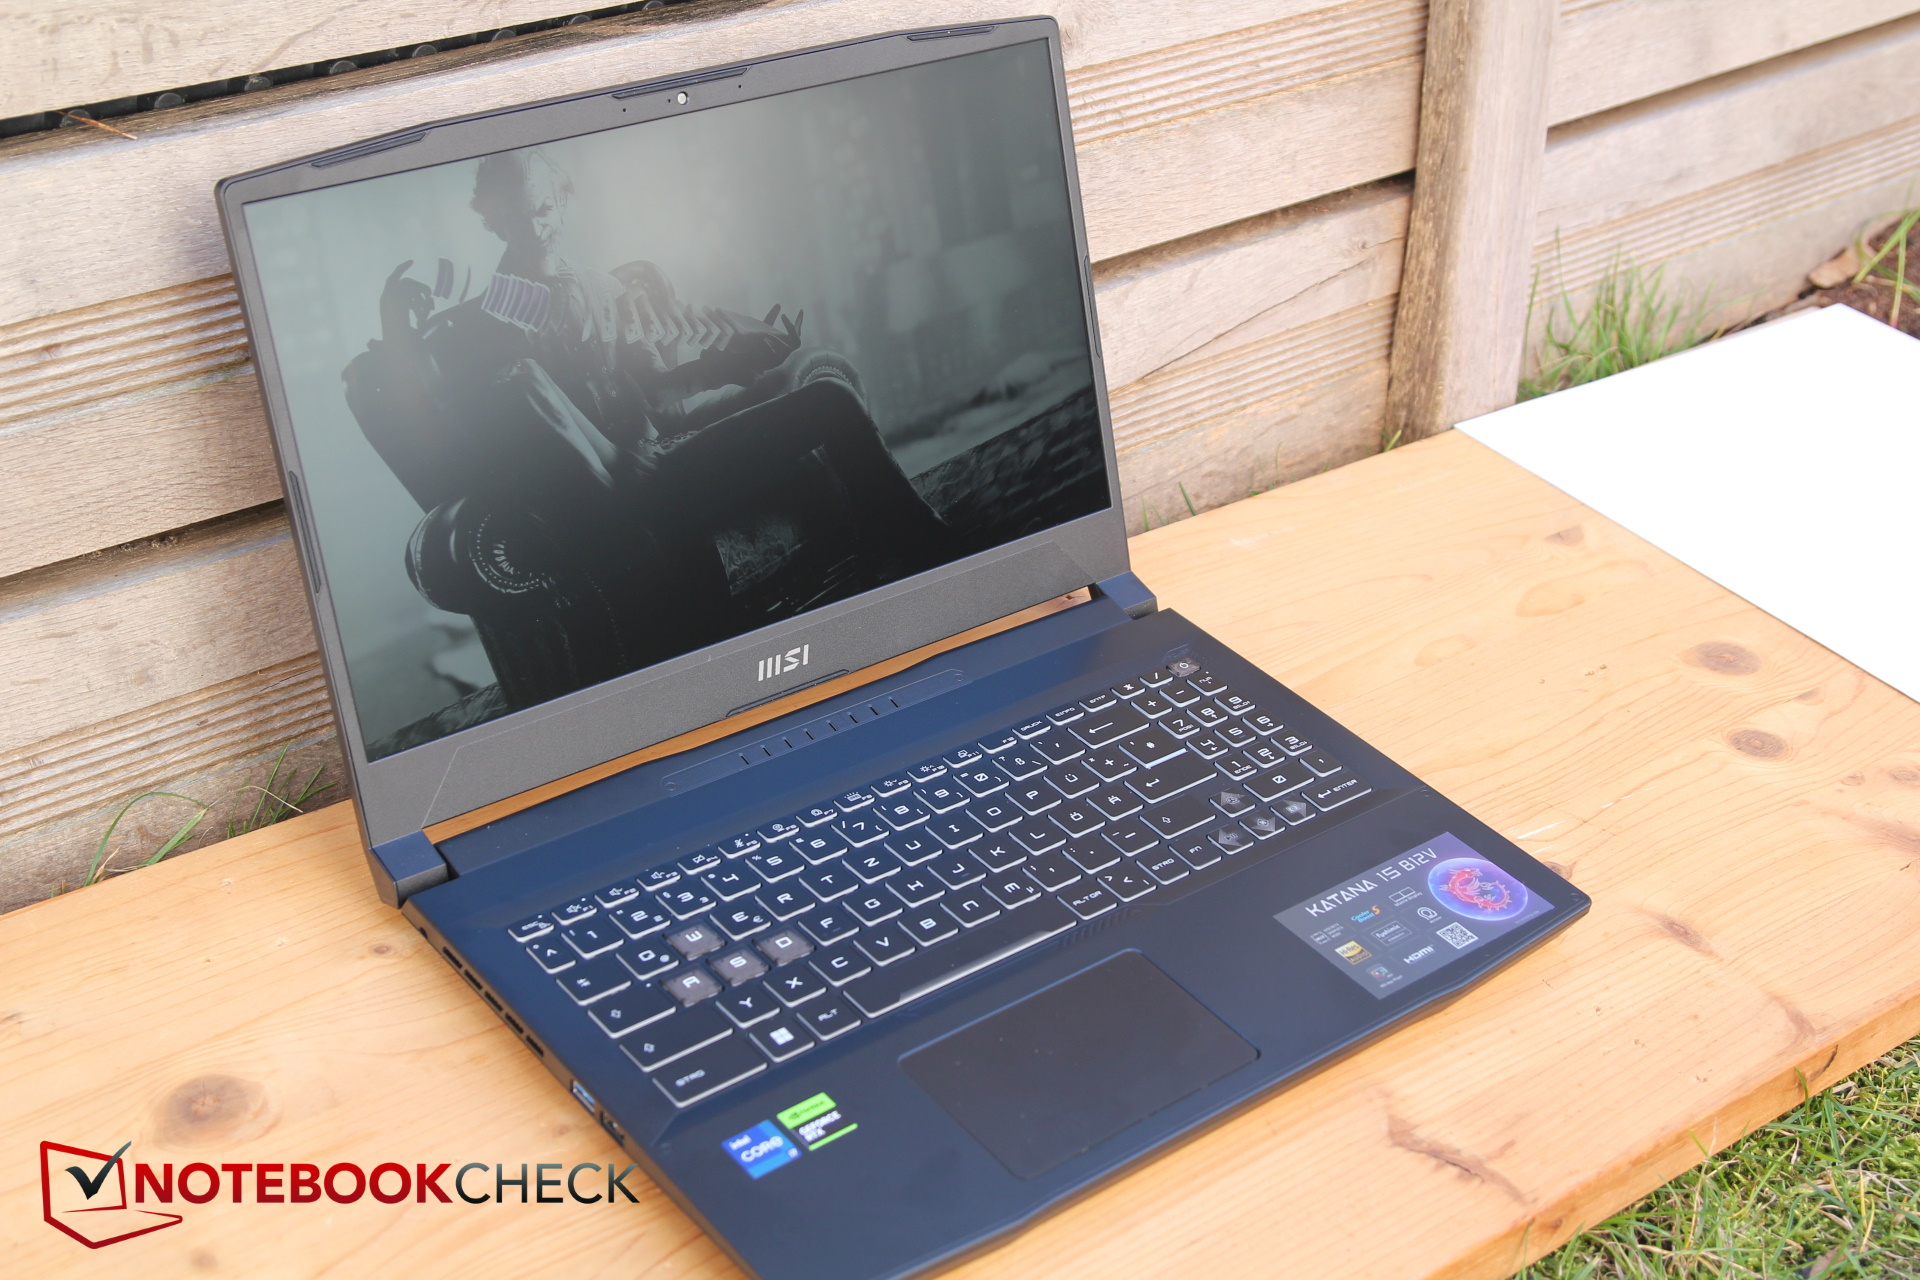
De behuizing van de Katana 15 is geheel van plastic, ook al lijken de gladde oppervlaktematerialen van het displaydeksel en de basis bijna van metaal. De zijkanten vertonen nu een zwart en grijs patroon. Helaas blijkt de behuizing ook erg gevoelig voor vingerafdrukken
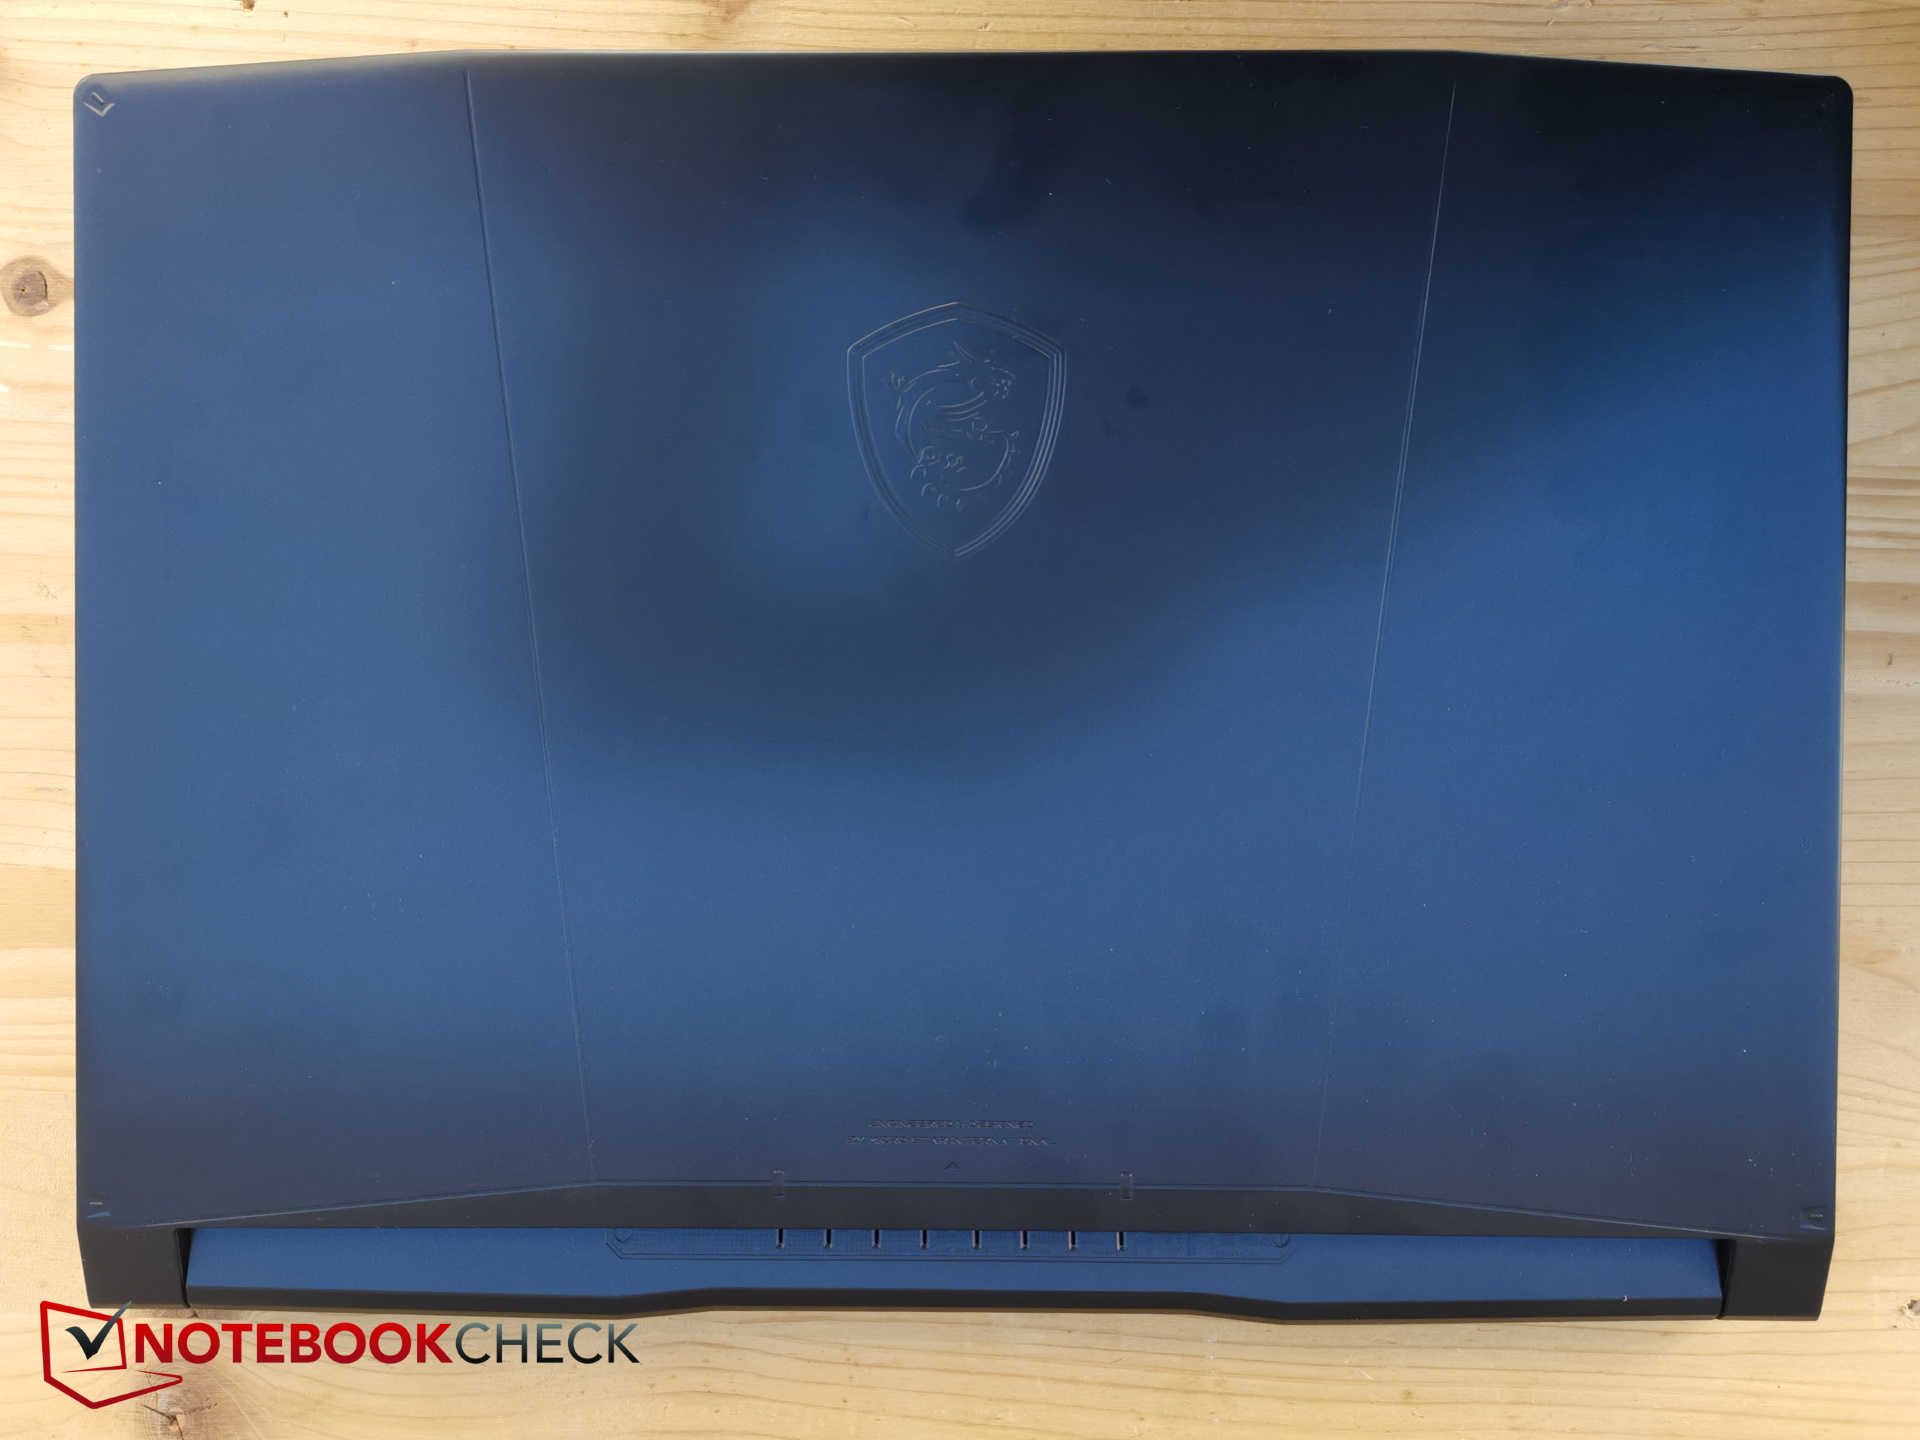
De openingshoek is 180 graden. Naast het logo sieren enkele lijnen en stansvormen het glanzend zwarte oppervlak van het deksel. Het scherm wiebelt langer dan normaal na het openen of aanpassen van de hoek
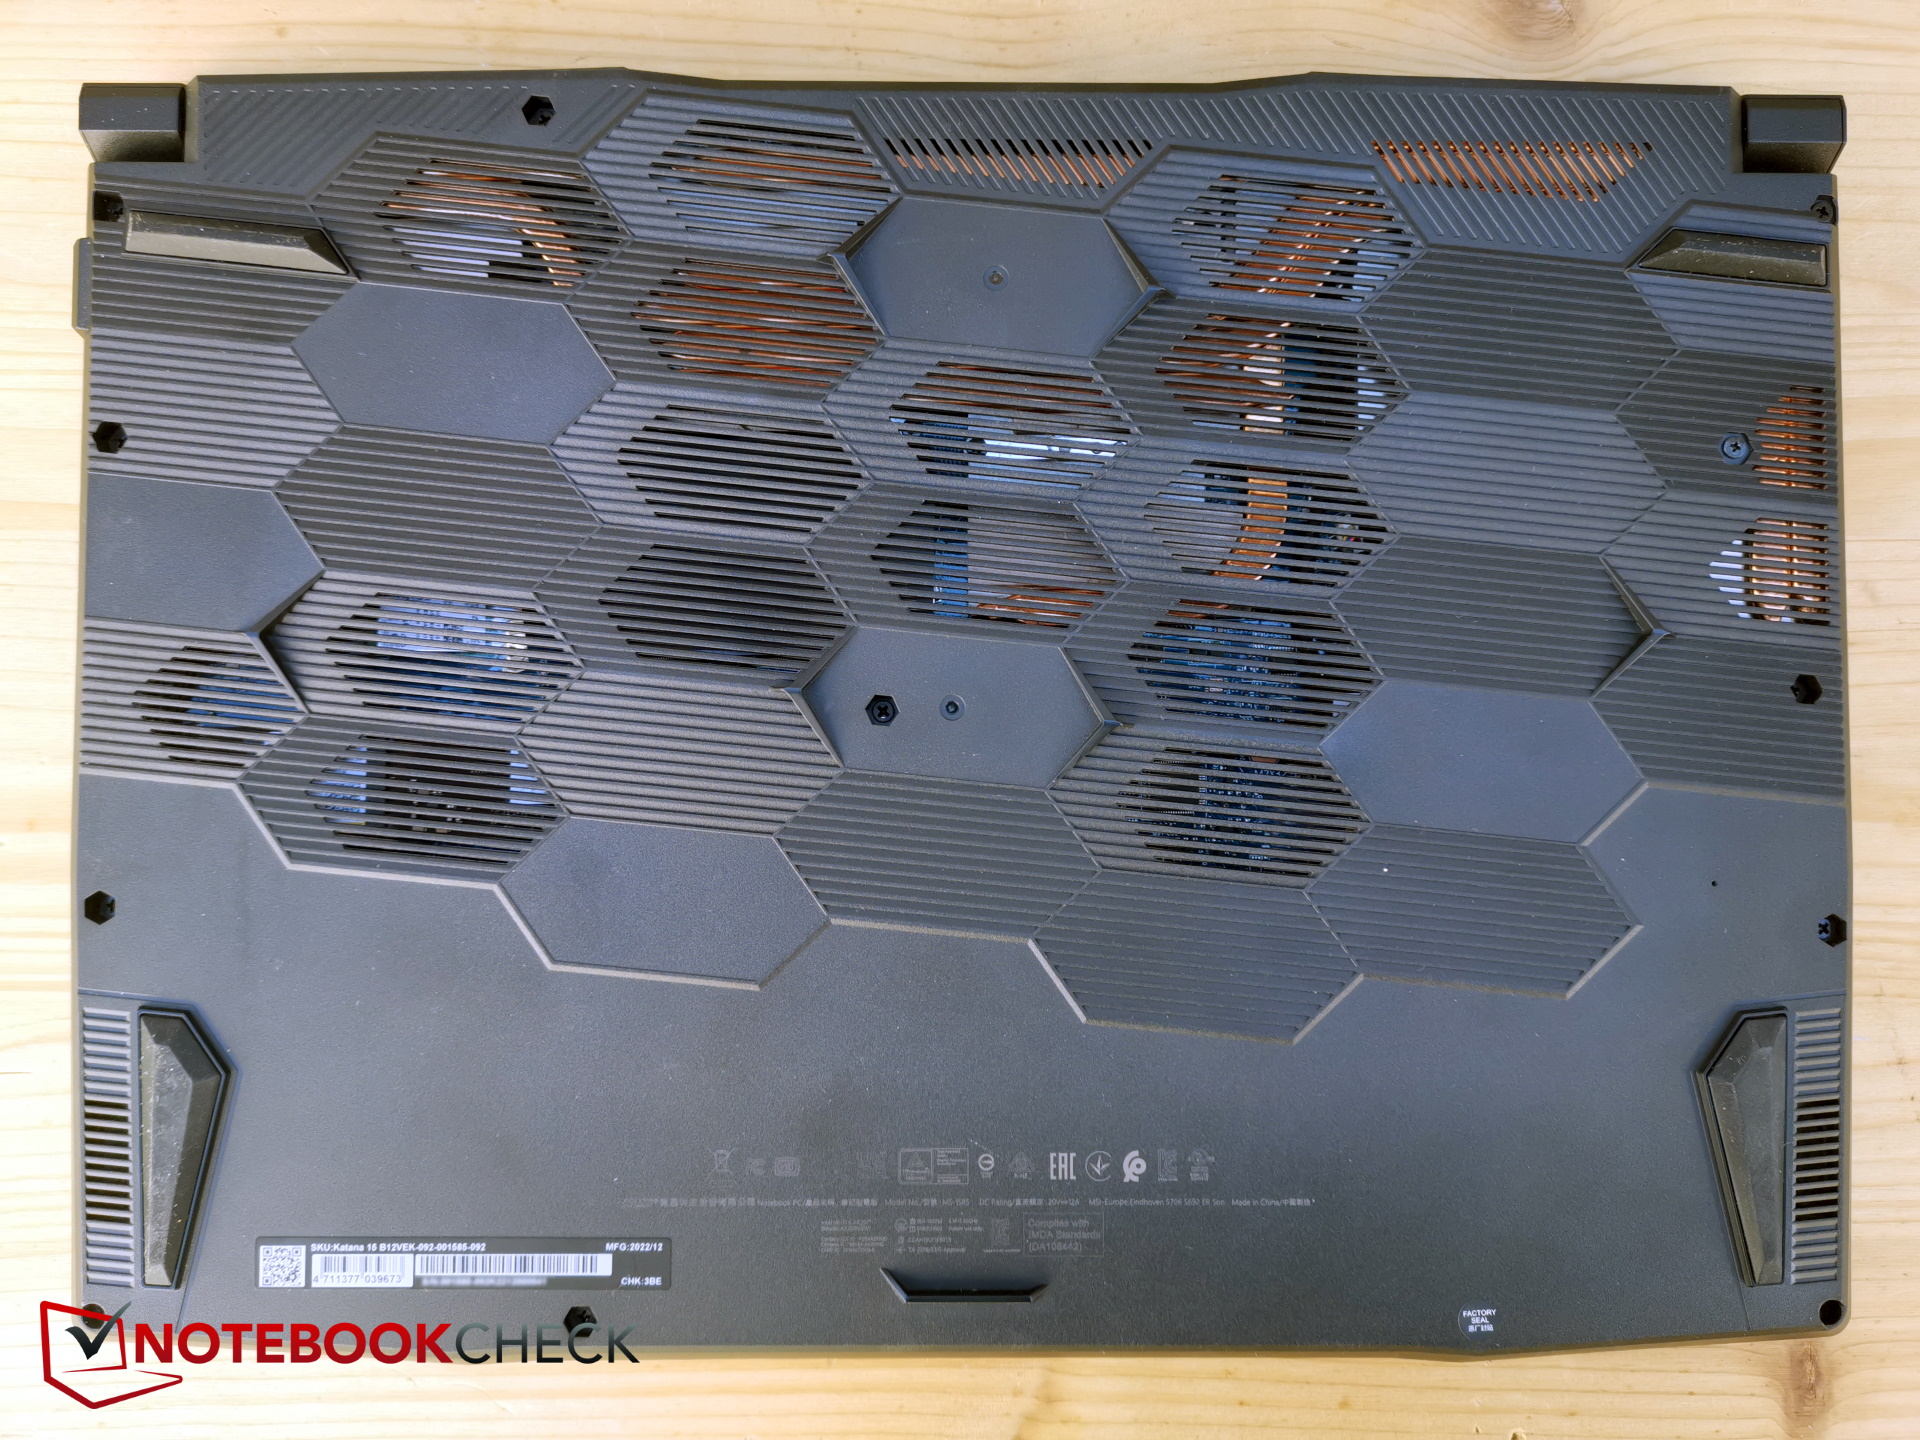
De onderkant is gemaakt van zachter plastic. De basis is relatief torsiebestendig, maar maakt een paar krakende geluiden. Het deksel daarentegen is veel gemakkelijker te buigen en maakt een krakend geluid. De schermranden zijn smal aan de zijkanten, maar nogal breed aan de boven- en onderkant naar hedendaagse maatstaven.
De 2023 Katana 15 is iets dunner dan de Katana GF66en erft de afmetingen en het gewicht van de Pulse GL66de Legion 5 is opnieuw nog dunner, maar de Core 15 ook, zij het minimaal.
Apparatuur - Laatste gen
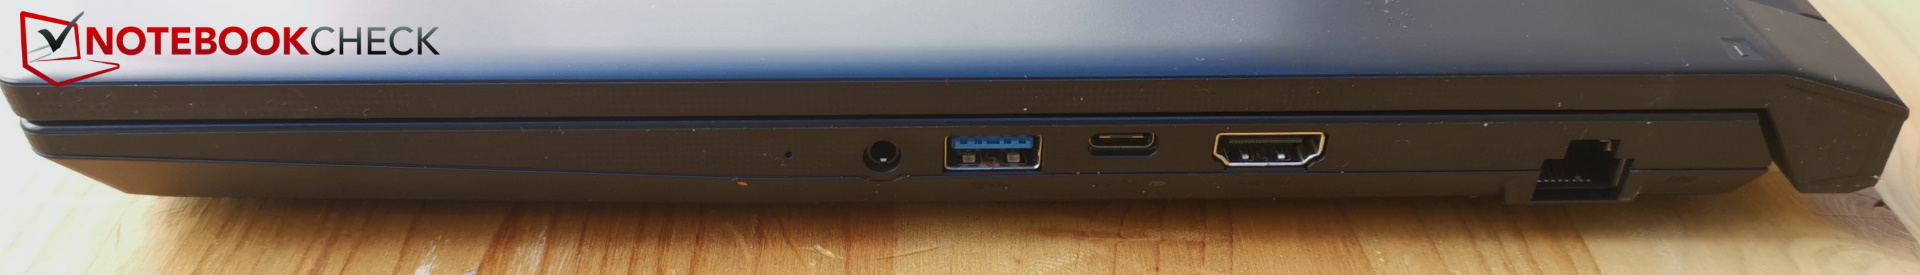
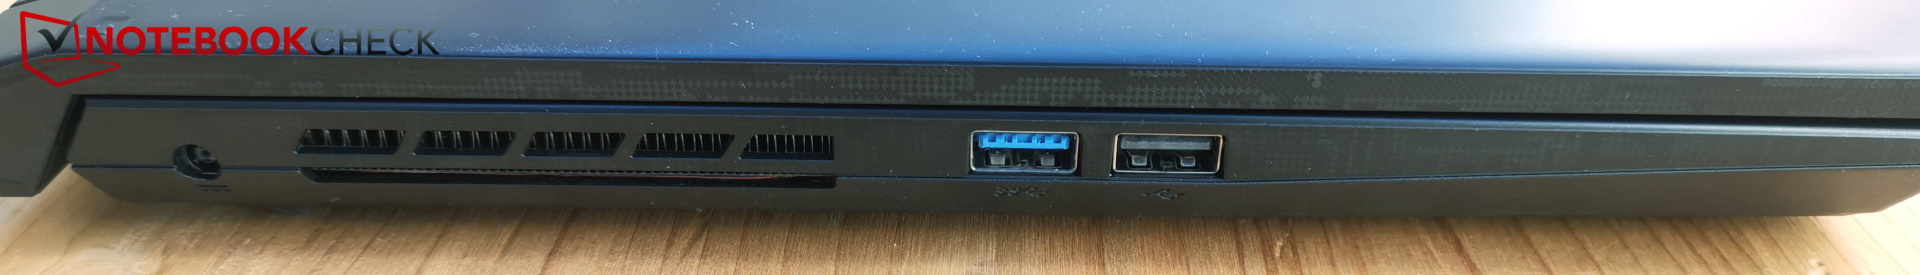
De poortindeling is voor alle drie de MSI modellen hetzelfde. In feite is een van de drie USB-A poorten nog steeds van het type 2.0, wat niet echt thuishoort in het huidige tijdperk. Hetzelfde geldt voor de ene USB-C-sleuf, die geen Thunderbolt ondersteunt en slechts 3.0-snelheid biedt.
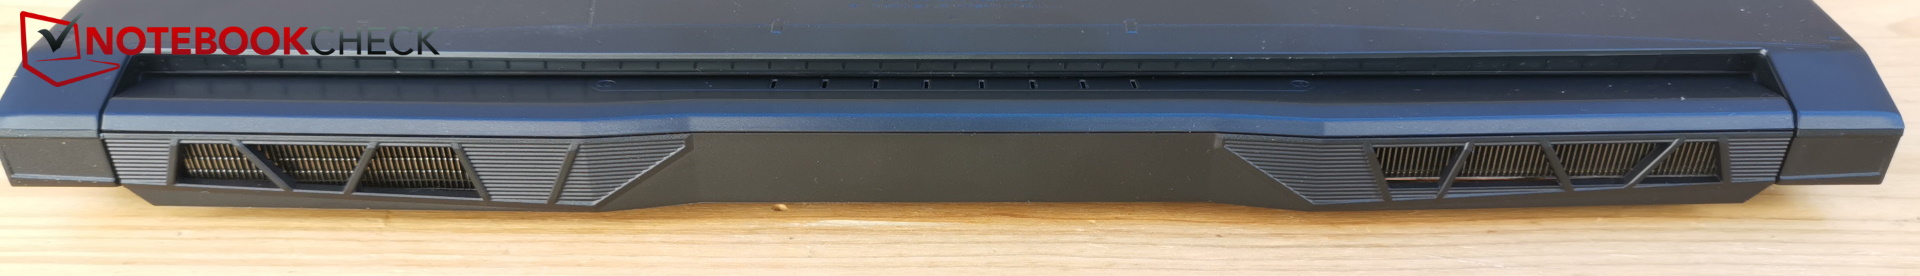
Een SD-lezer ontbreekt, maar LAN en HDMI zijn tenminste aan boord. De headset-aansluiting bevindt zich ongebruikelijk aan de rechterkant, net als de HDMI-poort, die beide kunnen interfereren met de muishand. Ondanks voldoende ruimte zijn er geen poorten aan de achterkant.
Communicatie
MSI heeft de Intel Wi-Fi 6 AX201 WLAN module geïnstalleerd, die nog geen Wi-Fi 6E ondersteunt, dus verbinding met het 6 GHz netwerk is momenteel niet mogelijk. Maar het werkt wel in het 5 GHz bereik (en natuurlijk 2,4 GHz) en dit is nog steeds vrij snel.
Webcam
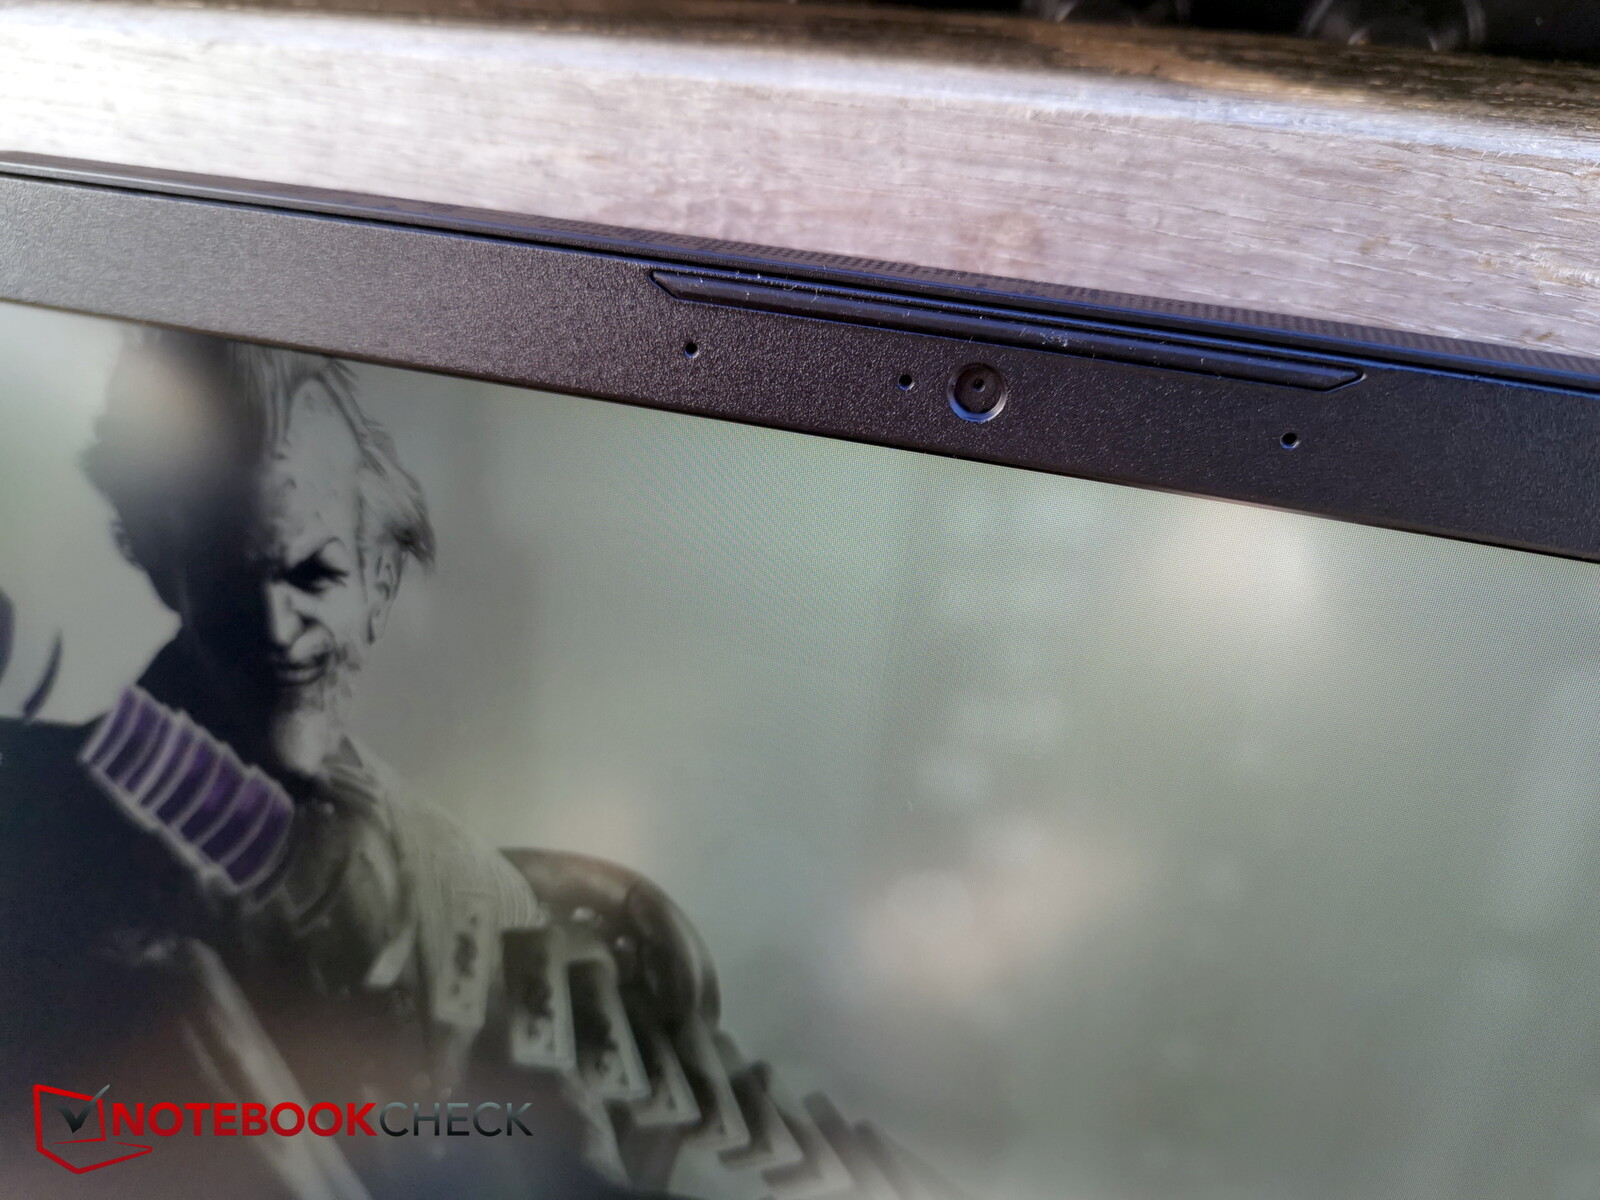
De webcam is ook van de laatste generatie met zijn resolutie van 720p. Zelfs de nieuwere B13 heeft nog een 720p camera. Deze kan via fn+F6 in- en uitgeschakeld worden.
De kleurafwijkingen zijn over het algemeen vrij groot en de beeldkwaliteit nogal suboptimaal.


Beveiliging
TPM is aan boord, anders ontbreekt een Kensington-slot. Er is ook geen vingerafdruksensor aanwezig.
Accessoires en garantie
Goedkope laptops worden meestal niet geleverd met extra's. Dit is ook het geval met de Katana 15.
MSI biedt 24 maanden garantie en een pick-up & return service is inbegrepen.
Onderhoud
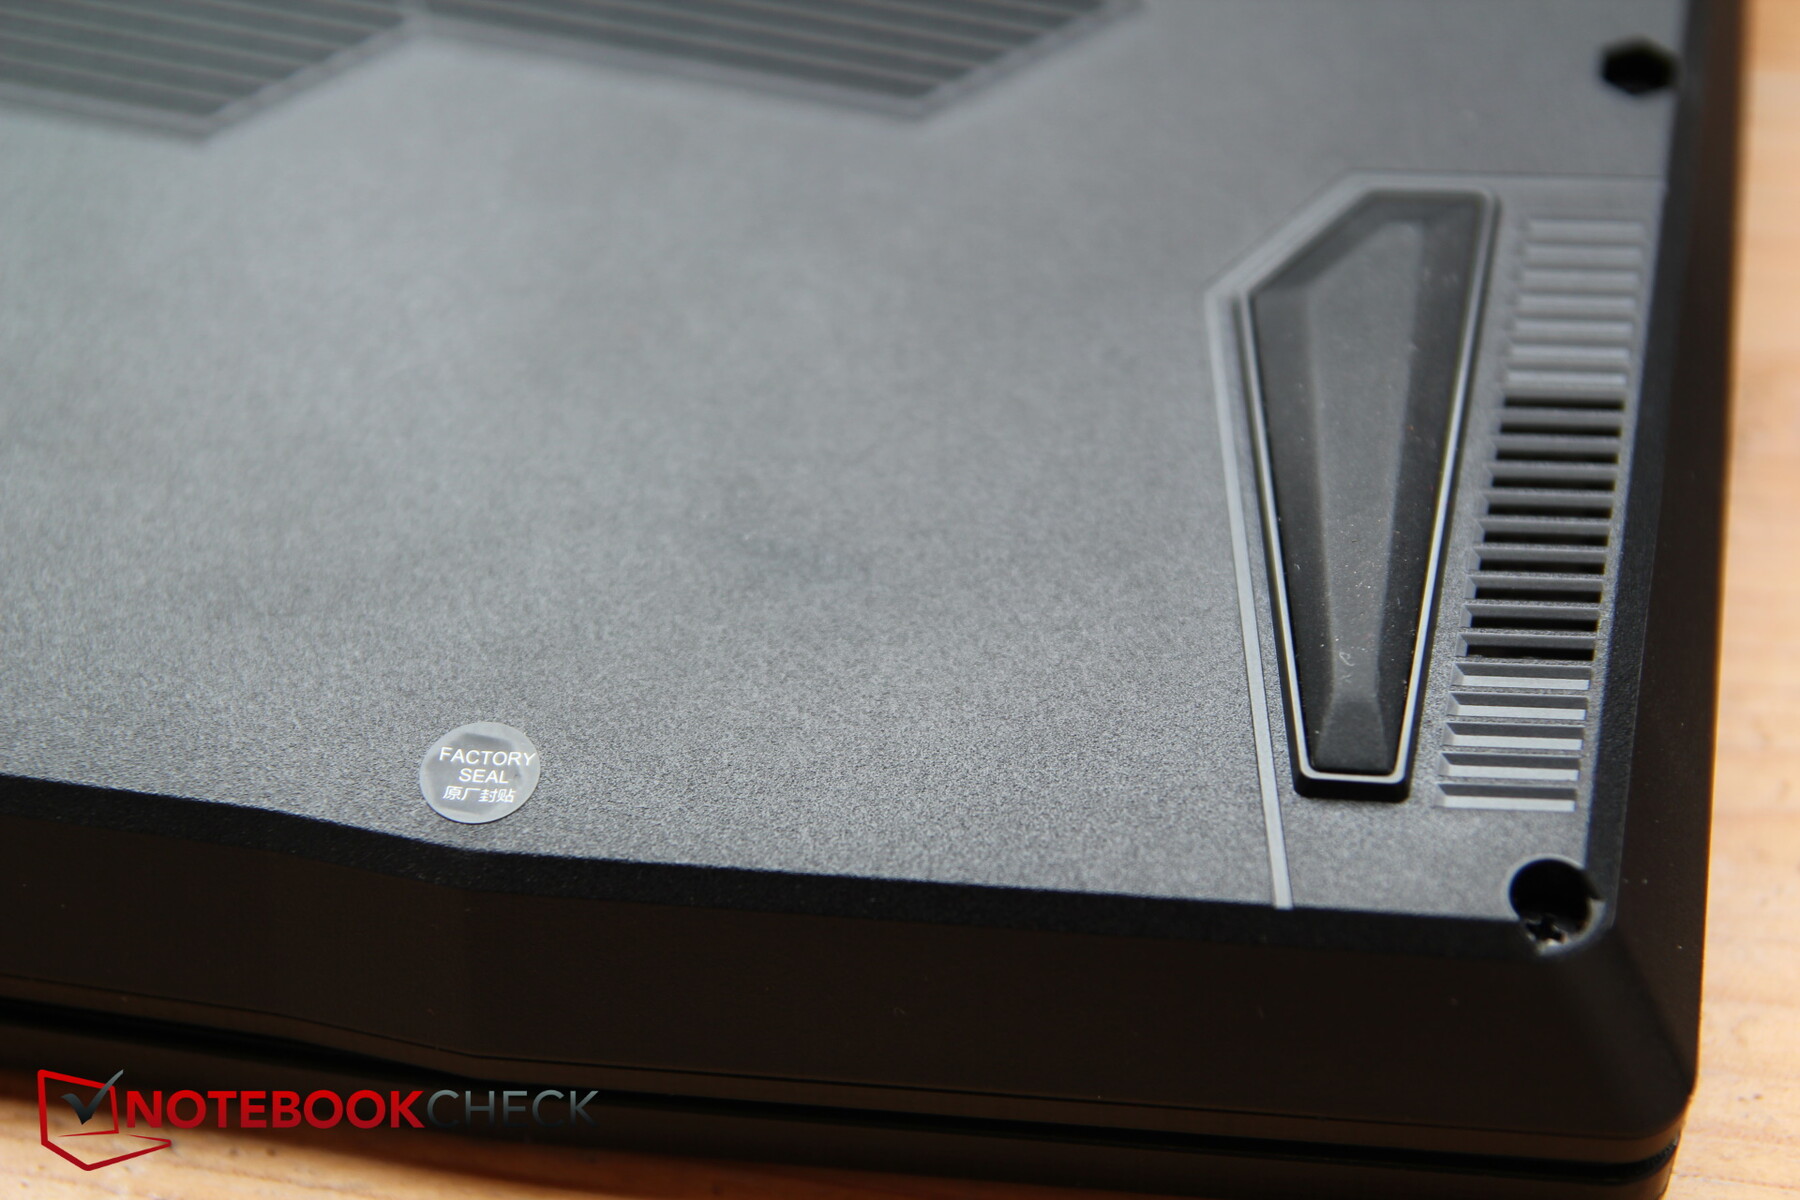
Helaas gebruikt MSI een zegelsticker om vast te stellen of gebruikers het apparaat zelf al hebben geopend. Aangezien ons testmodel afkomstig is van Cyberport, hebben we ervan afgezien het te openen om het apparaat voor onze lener niet te beschadigen.
Volgens MSI mag het apparaat ook door de eigenaar worden geopend voor onderhoudsdoeleinden. Zolang dit "professioneel" gebeurt, blijft de garantie van het apparaat onaangetast.
Invoerapparaten - Fatsoenlijk toetsenbord, klein touchpad
Toetsenbord
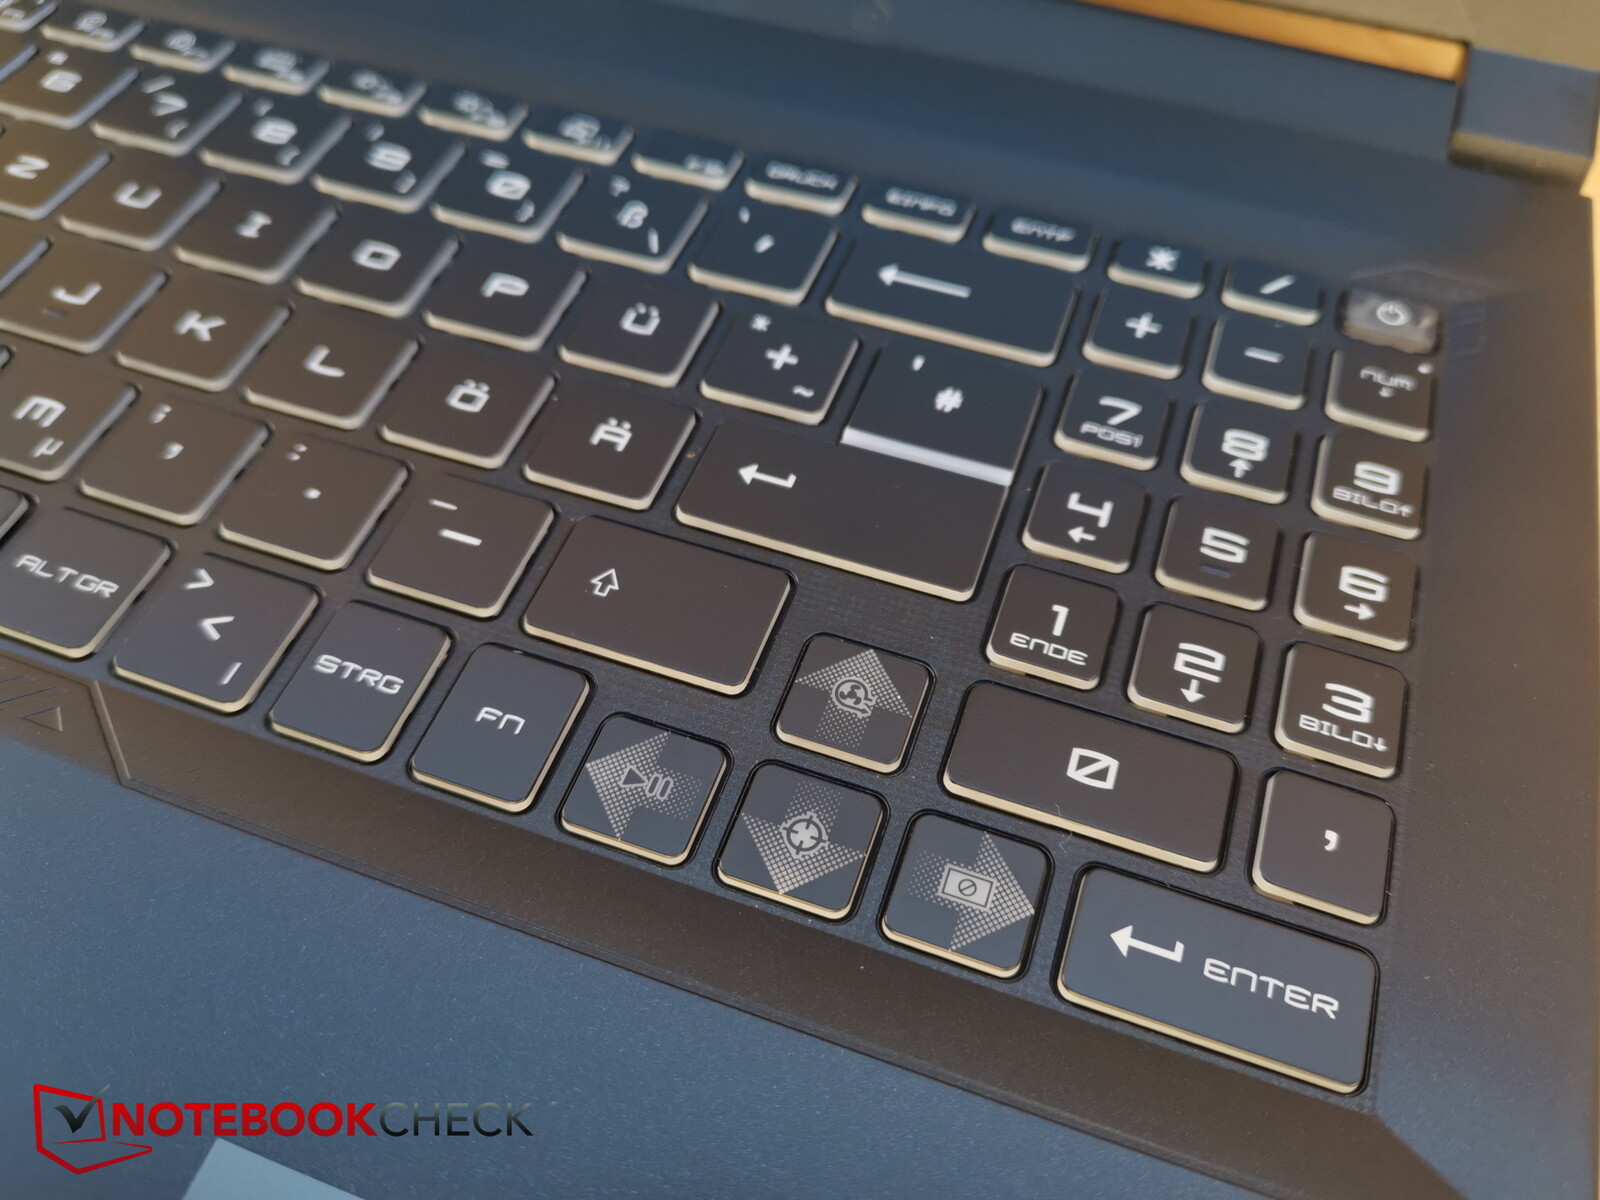
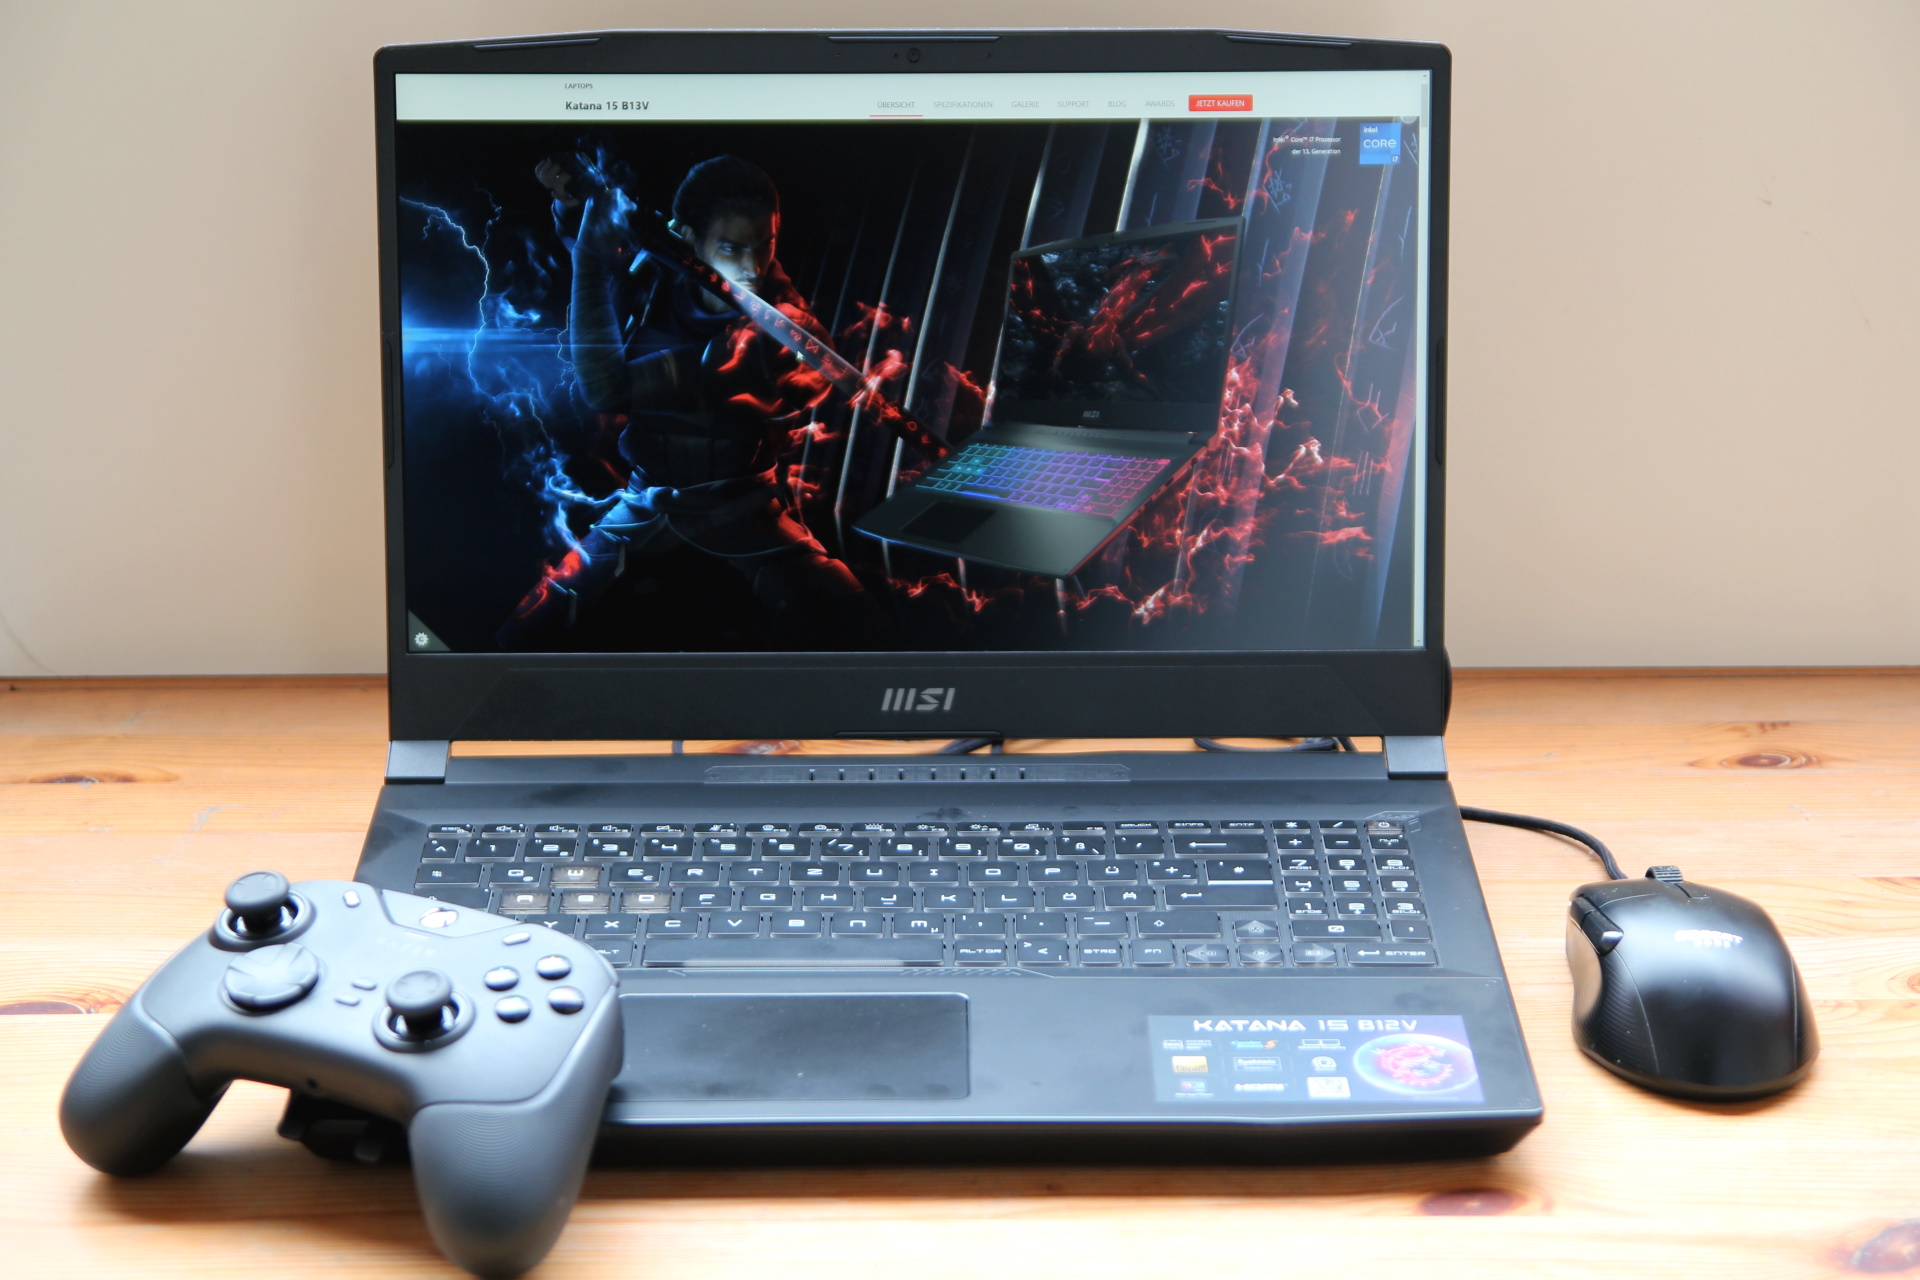
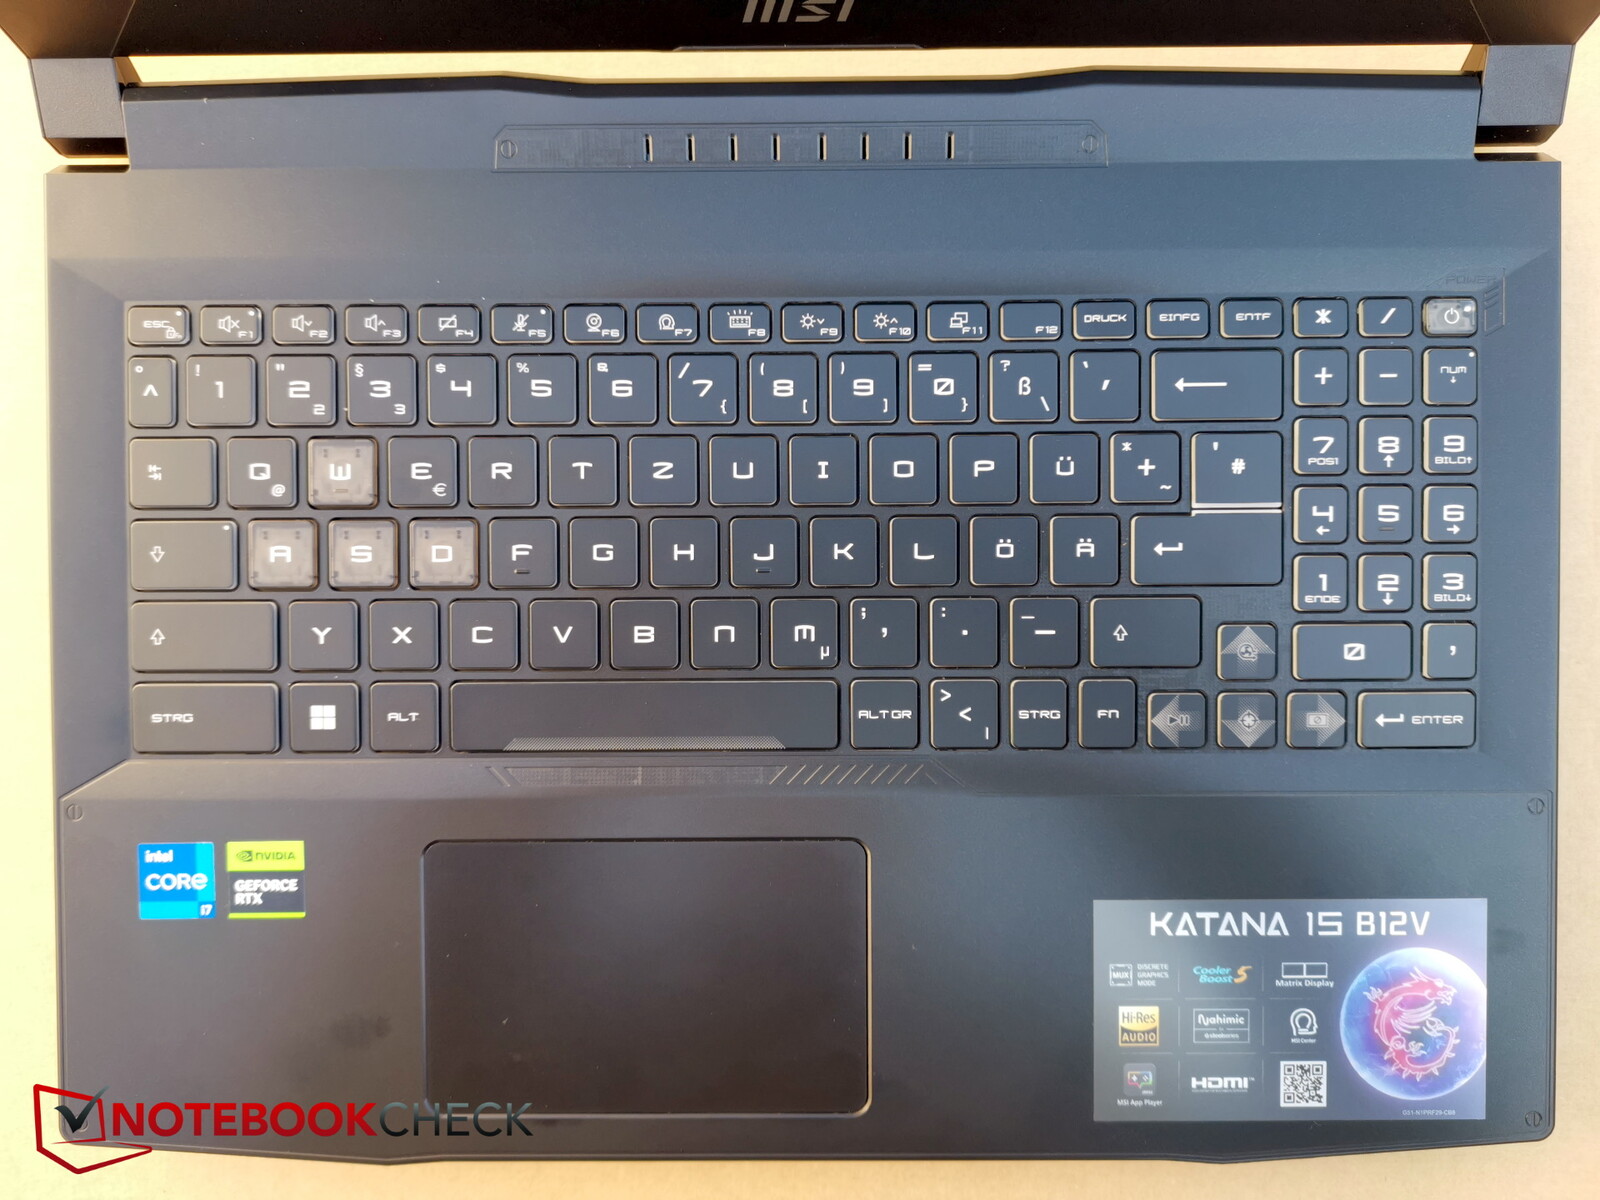
De lay-out lijkt sterk op die van alle Katana-modellen: hij ziet er heel netjes uit, maar het numpad aan de rechterkant lijkt er slecht ingeperst, maar er is er tenminste één.
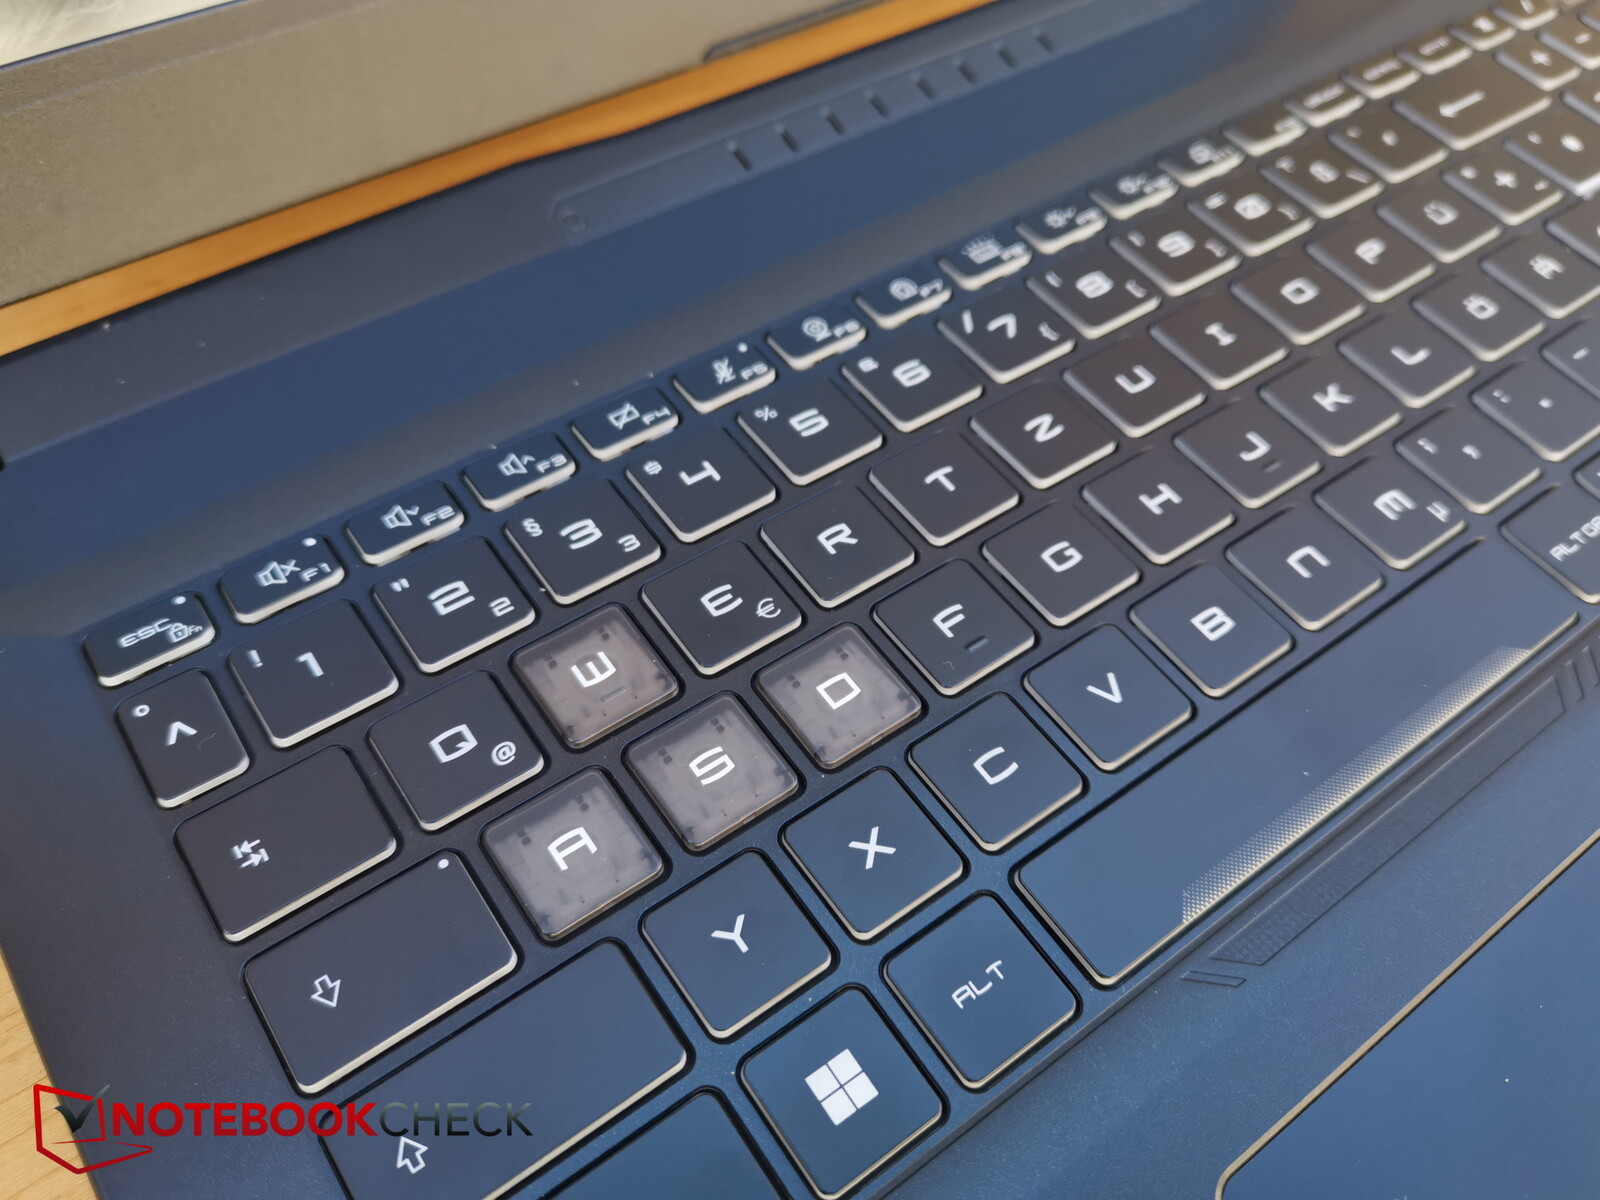
De pijltjestoetsen daartussen zijn niet gehalveerd in hoogte, zoals vaak het geval is, maar zijn globaal iets kleiner in lengte en hoogte. De WASD-toetsen zijn transparant en vallen dus op in kleur. De F en speciale toetsen zijn ook erg klein.
MSI heeft helaas de fn-toets weer naar de rechterkant van de spatiebalk verschoven, wat even wennen is. Vreemd waarom MSI zijn eigen weg blijft gaan. Desnoods kun je de functies van fn- en Windows-toets omwisselen, maar dan heb je hetzelfde probleem met de Windows-toets, die rechts zit in plaats van de fn-toets.
De toetsaanslag is vrij kort, maar de feedback is duidelijk merkbaar, zodat typen vrij snel aanvoelt. Het toetsgeluid is matig, en de voet blijft stabiel en buigt niet door tijdens het typen.
De achtergrondverlichting van het toetsenbord biedt vier zones, met elk vier niveaus van instelbare helderheid.
Touchpad
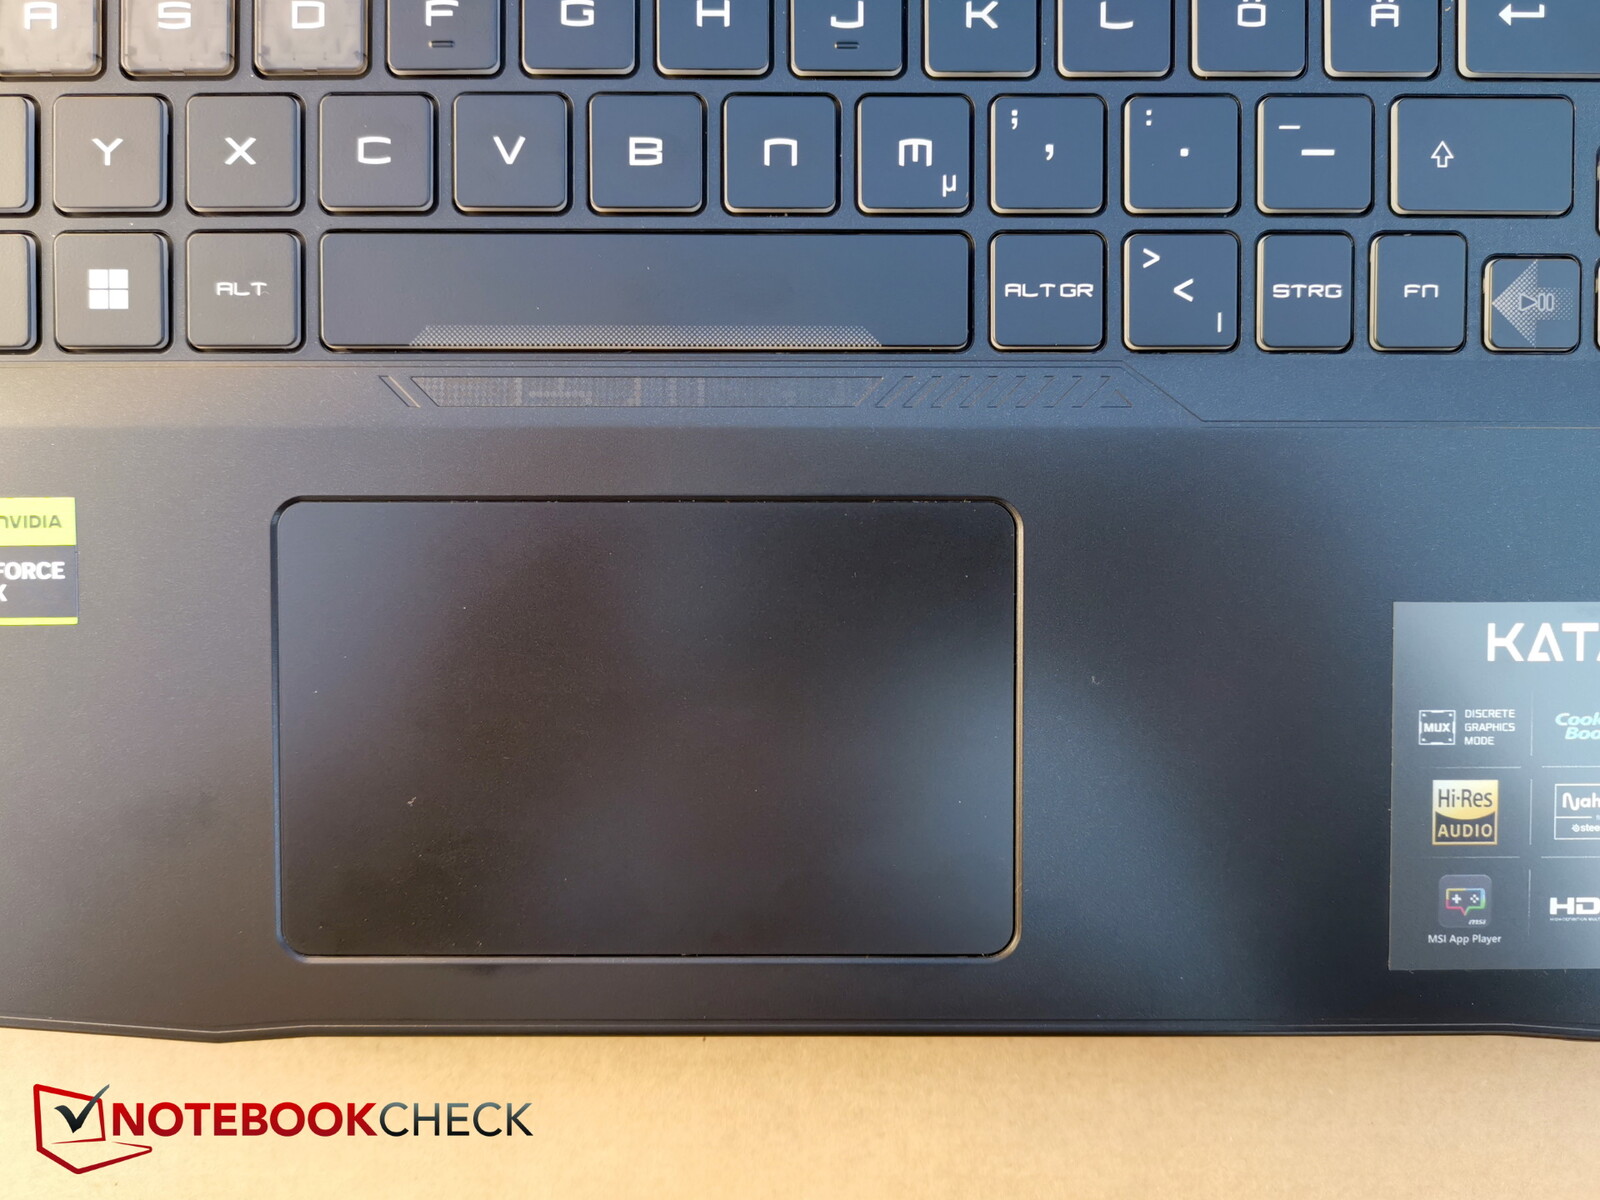
De Katana 15 heeft een van de kleinste touchpads op de markt. Het ziet er een beetje retro uit. Tuurlijk, gamers zullen meestal toch een muis aansluiten, maar een groter touchpad is gewoon comfortabeler voor gebruik onderweg
Het touchpad ligt recht onder de spatiebalk en dus erg ver naar links in de lay-out. Een iets centralere plaatsing zou voordeliger zijn geweest
De klikken van de geïntegreerde toetsen zijn wat luider en lijken niet al te hoogwaardig, maar ze reageren betrouwbaar en accuraat.
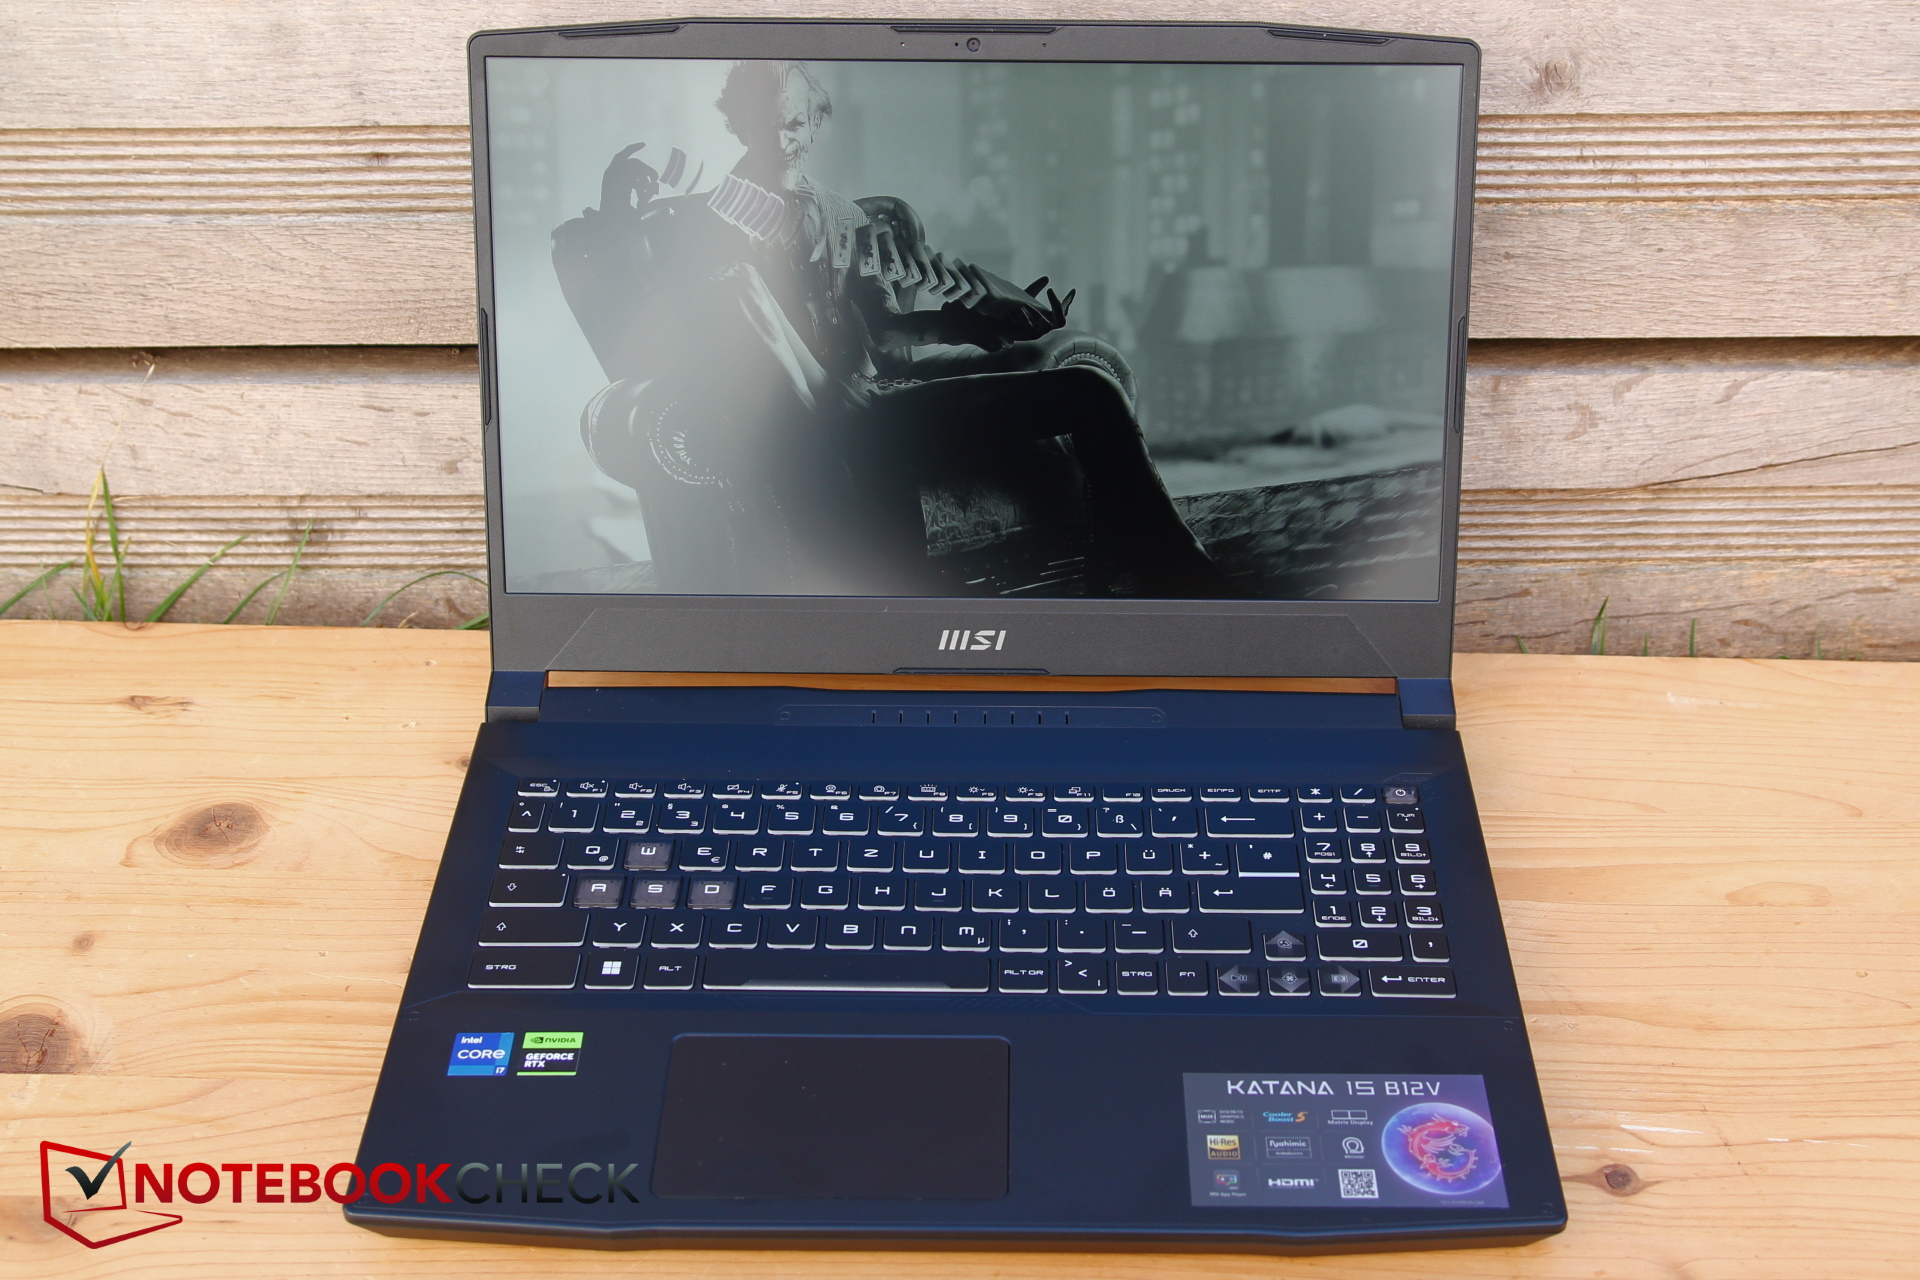
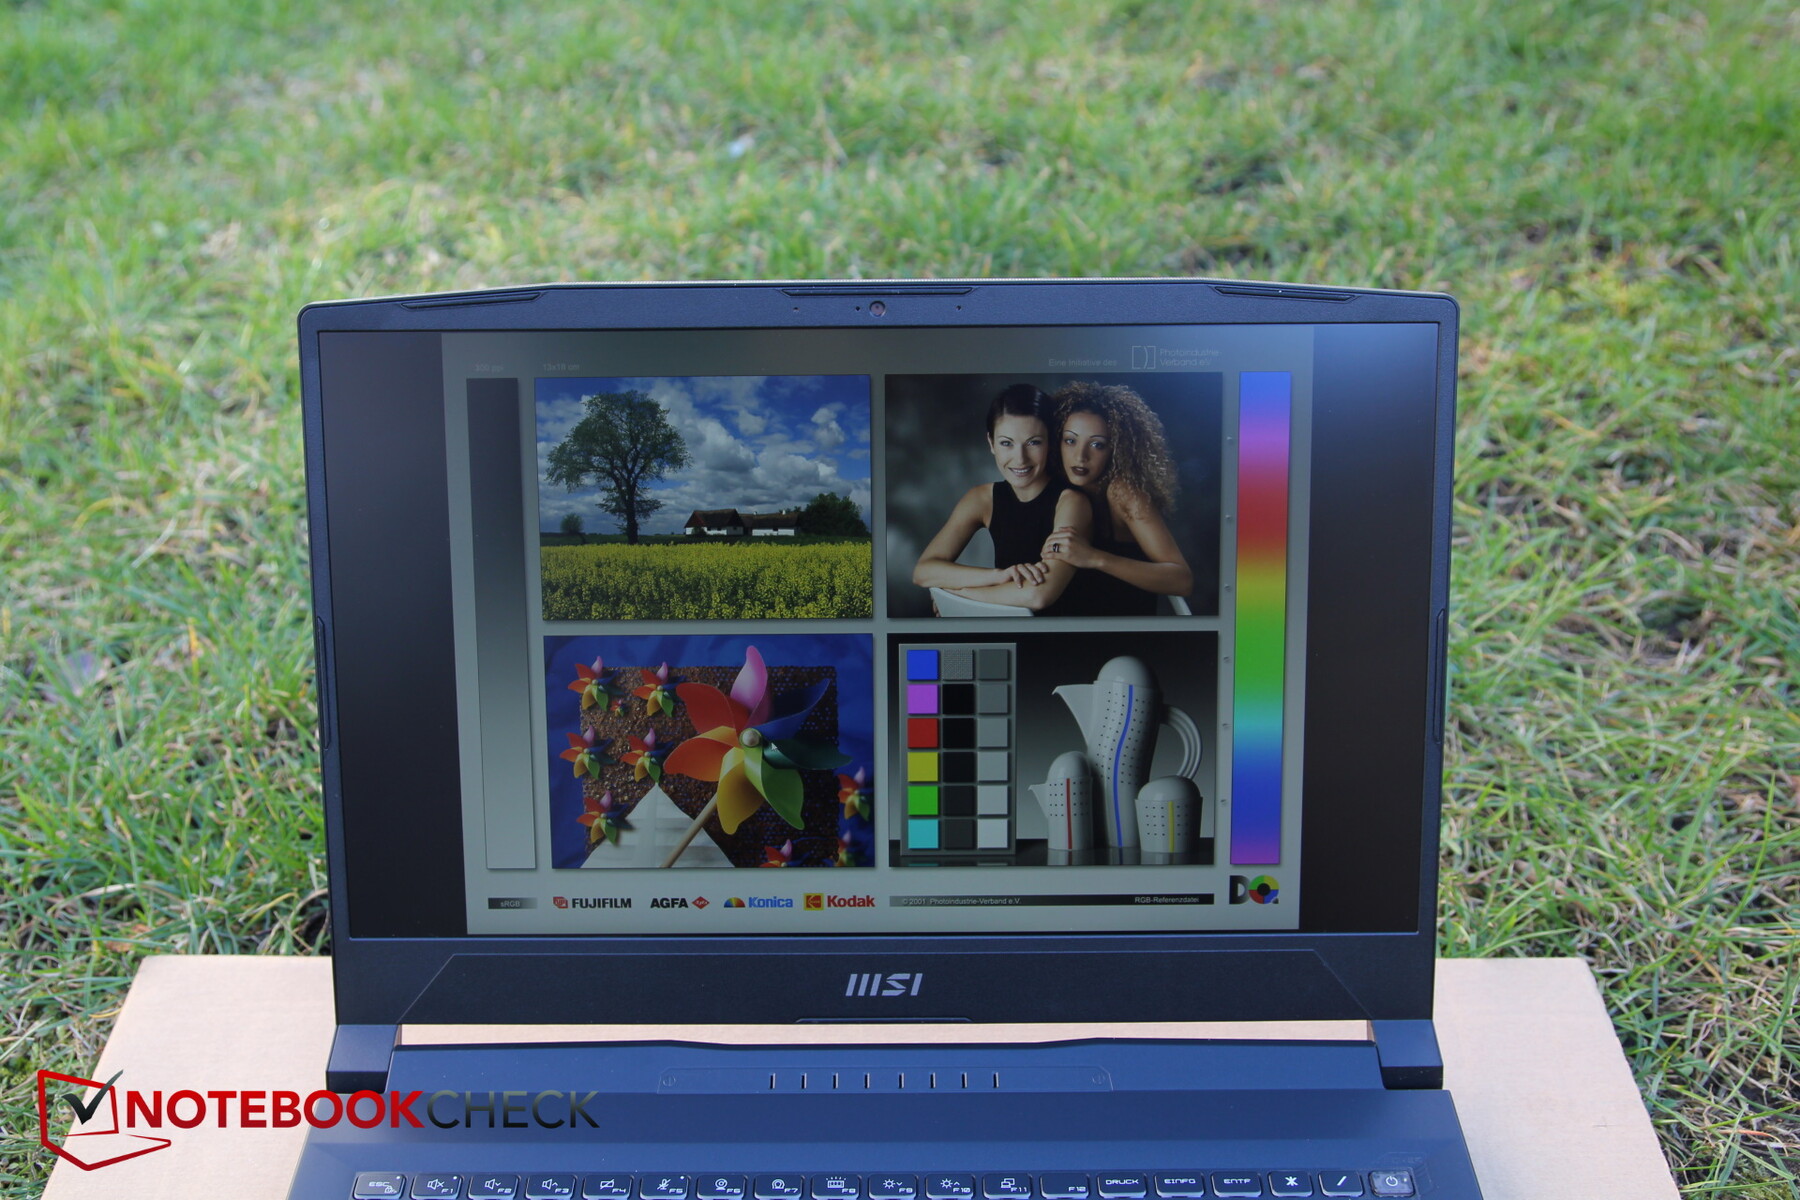
Beeldscherm - 250 nits en 57% sRGB zijn budgetwaarden
MSI blijft een Full HD display gebruiken voor de Katana, terwijl veel concurrenten al QHD en hoger gebruiken. Dit is niet per se een probleem, want de resolutie en de 144 Hz zouden goed samen moeten passen met de RTX 4050. Tot nu toe lijken er ook geen alternatieve beeldschermopties voor de B13 te zijn. Uiteindelijk is het hetzelfde paneel als in de Katana GF66 en de Pulse GL66.
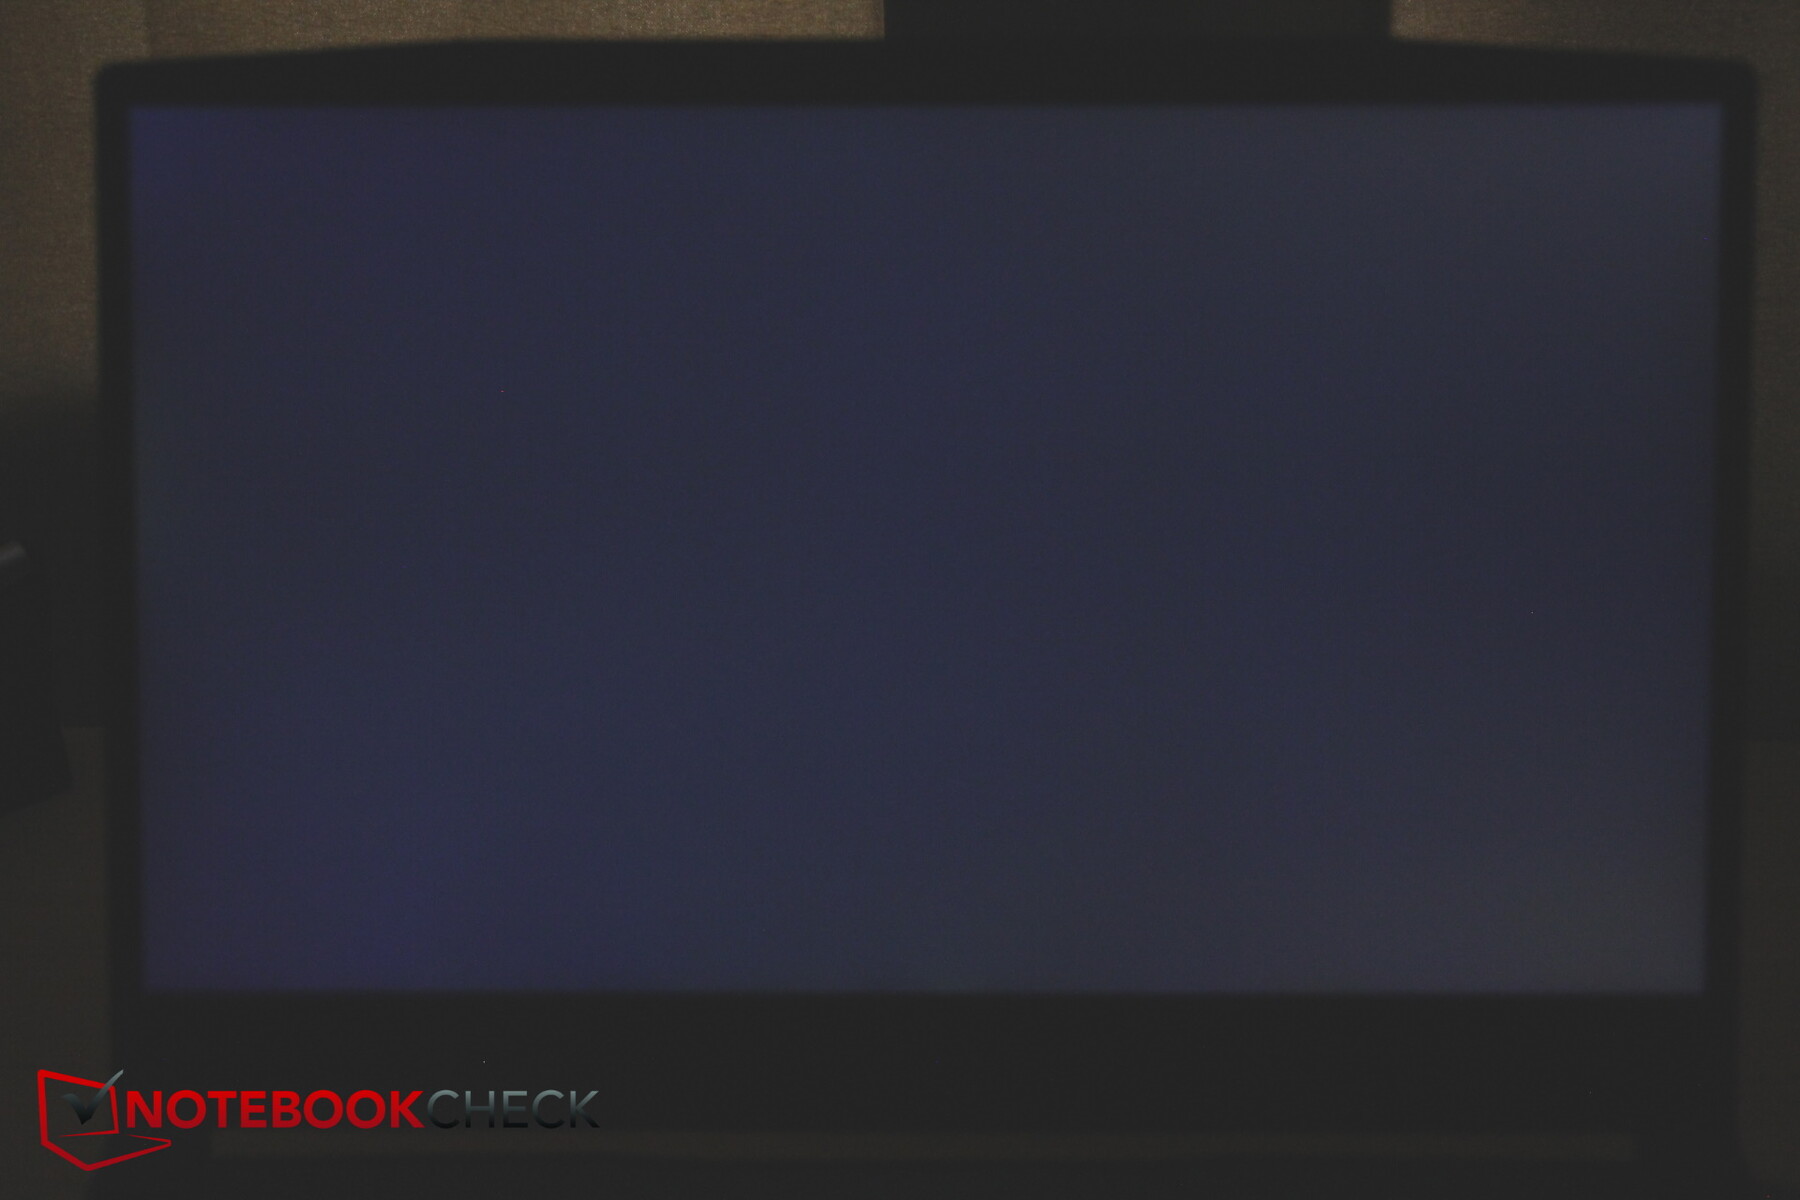
Helaas is de gemiddelde helderheid van 258 nits tegenwoordig nogal onder het gemiddelde, aangezien de meeste concurrerende laptops helderdere schermen bieden. De verlichting van 92 procent is tenminste vrij gelijkmatig, en de helderheid neemt iets af naar rechtsonder
De reactietijden zijn nogal suboptimaal tot middelmatig voor een gamer. PWM is tenminste geen probleem in ons model. Screen bleeding is slechts licht en niet merkbaar in de meeste situaties.
| |||||||||||||||||||||||||
Helderheidsverdeling: 92 %
Helderheid in Batterij-modus: 257 cd/m²
Contrast: 1374:1 (Zwart: 0.19 cd/m²)
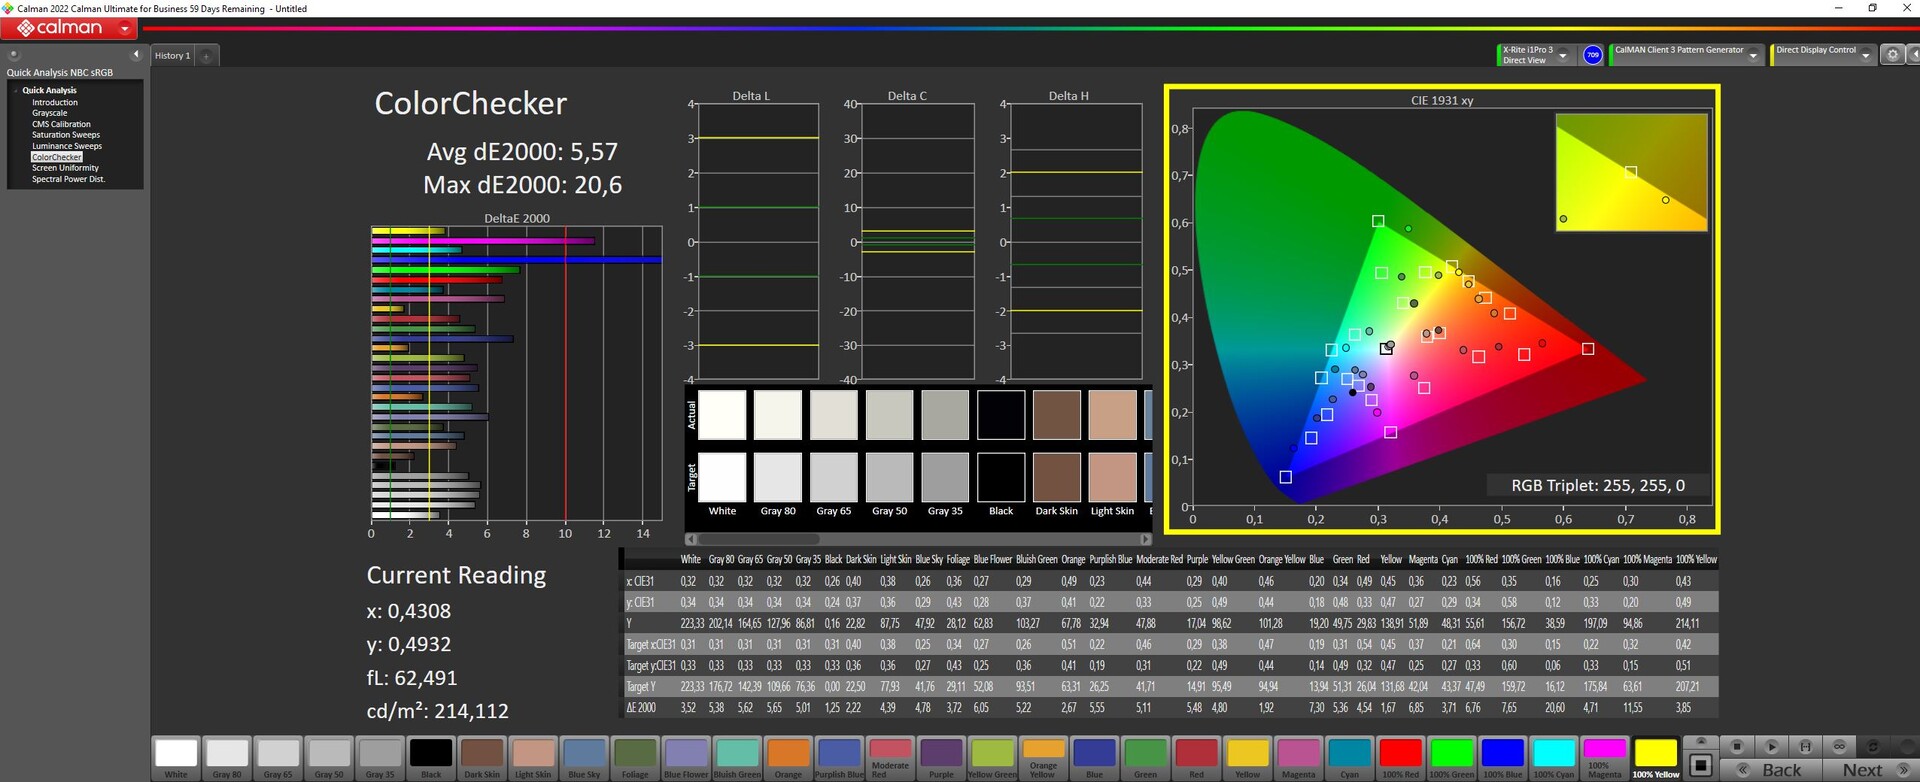
ΔE ColorChecker Calman: 5.57 | ∀{0.5-29.43 Ø4.71}
calibrated: 4.63
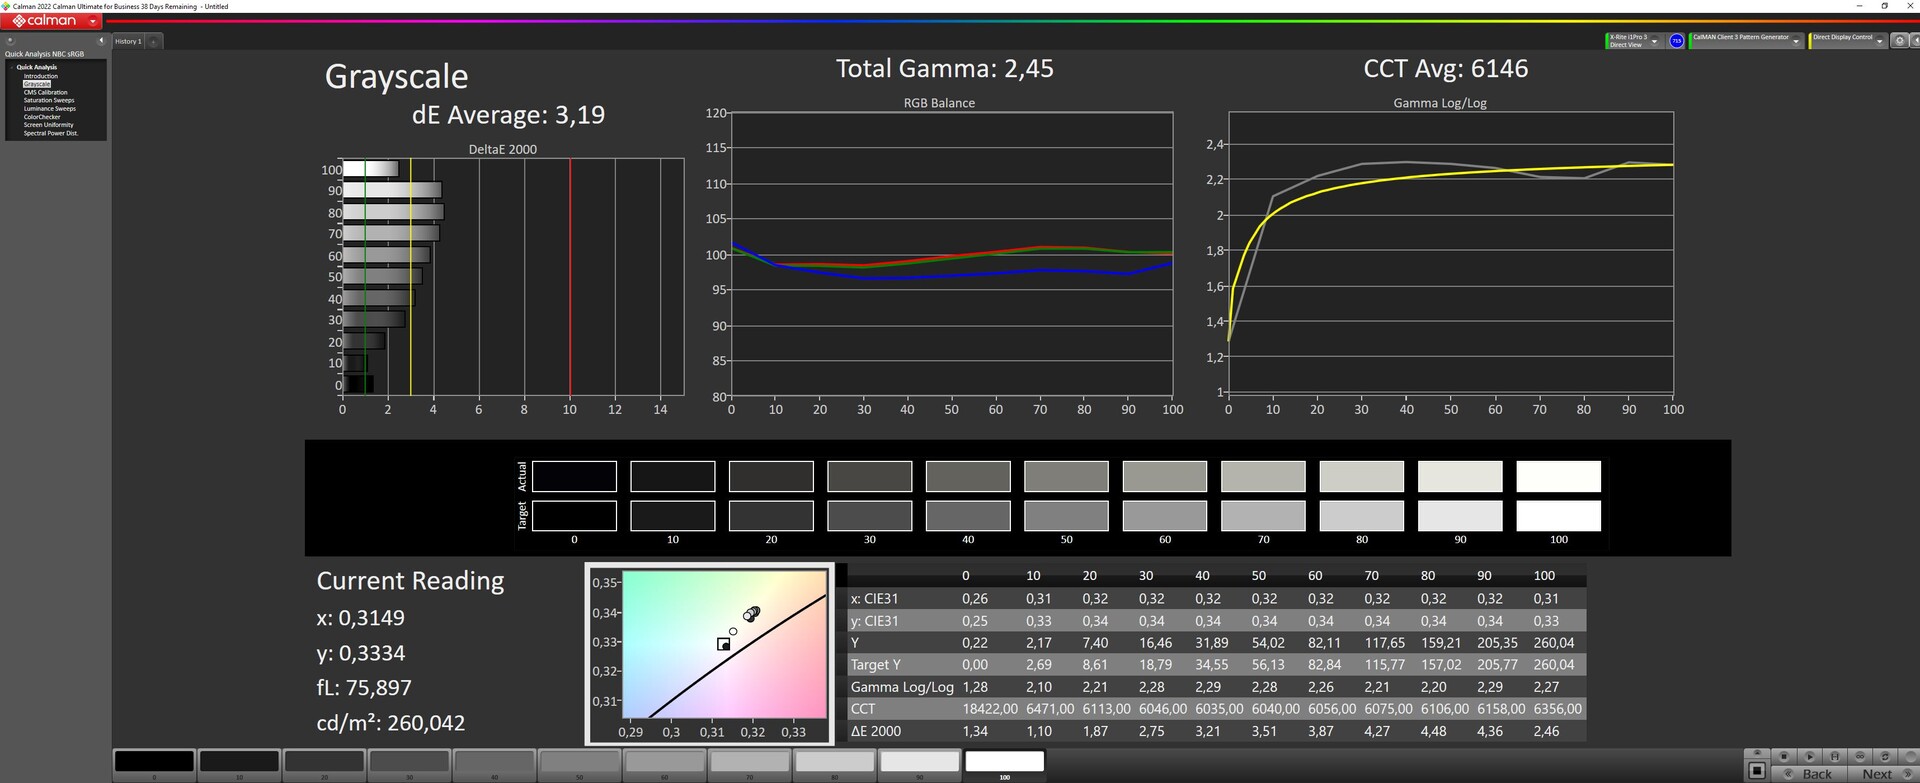
ΔE Greyscale Calman: 3.19 | ∀{0.09-98 Ø4.96}
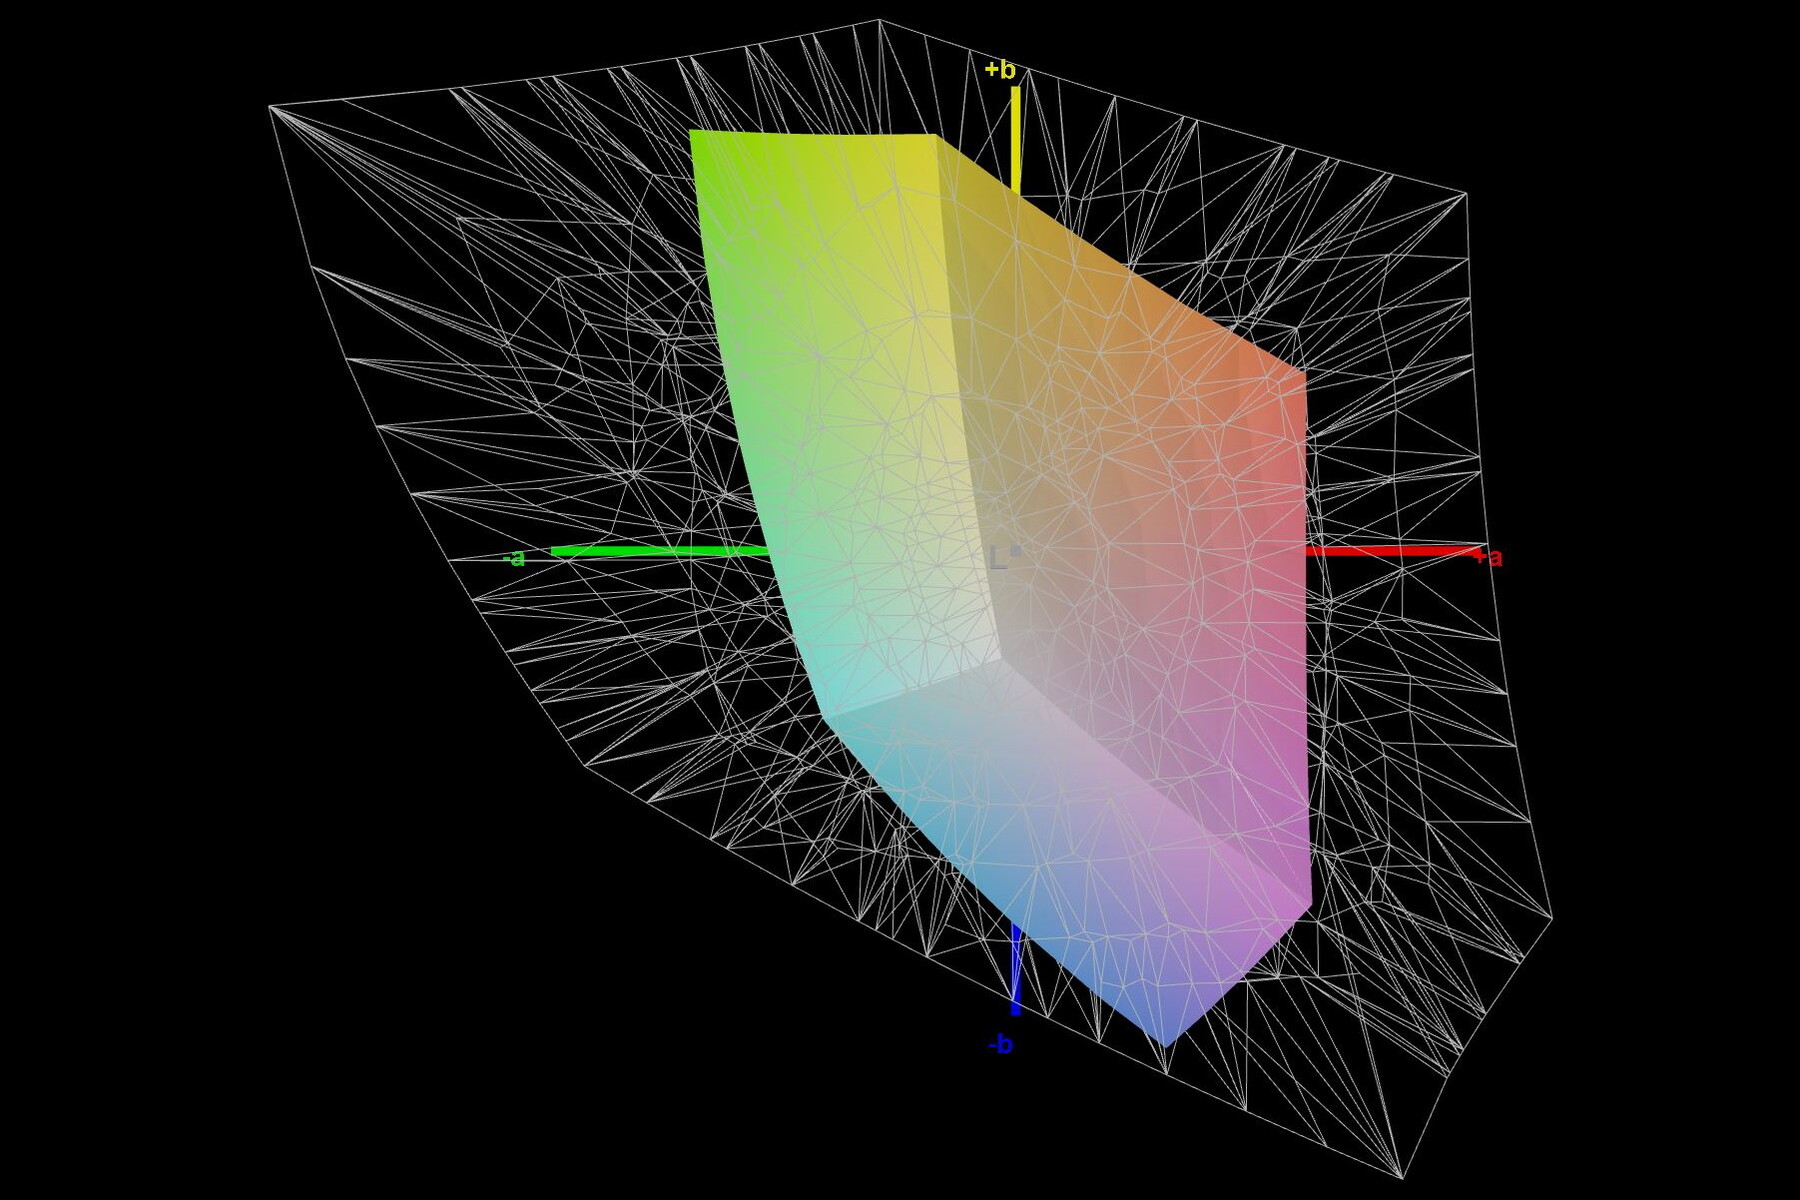
39.3% AdobeRGB 1998 (Argyll 3D)
56.8% sRGB (Argyll 3D)
38.1% Display P3 (Argyll 3D)
Gamma: 2.45
CCT: 6146 K
| MSI Katana 15 B12VEK AUOAF90 (B156HAN08.4), IPS, 1920x1080, 15.6" | MSI Katana GF66 12UGS AU Optronics AUOAF90, IPS, 1920x1080, 15.6" | MSI Pulse GL66 12UEK AU Optronics B156HAN08.4 (AUOAF90), IPS, 1920x1080, 15.6" | Lenovo Legion 5 15IAH7H 82RB CSOT MNF601CA1-3, IPS, 1920x1080, 15.6" | Asus TUF Gaming F15 FX507ZM TL156VDXP0101, IPS, 1920x1080, 15.6" | Schenker XMG Core 15 (M22) CSOT MNF601CA1-1, IPS, 2560x1440, 15.6" | |
|---|---|---|---|---|---|---|
| Display | 3% | 3% | 78% | 73% | 78% | |
| Display P3 Coverage (%) | 38.1 | 39.1 3% | 39 2% | 69.1 81% | 66.4 74% | 68.8 81% |
| sRGB Coverage (%) | 56.8 | 58.3 3% | 58.4 3% | 99.5 75% | 97 71% | 99.3 75% |
| AdobeRGB 1998 Coverage (%) | 39.3 | 40.4 3% | 40.3 3% | 70 78% | 68.5 74% | 69.9 78% |
| Response Times | -5% | -2% | 59% | 69% | 66% | |
| Response Time Grey 50% / Grey 80% * (ms) | 38.8 ? | 40 ? -3% | 38.8 ? -0% | 14.8 ? 62% | 5.6 ? 86% | 16 ? 59% |
| Response Time Black / White * (ms) | 26.8 ? | 28.4 ? -6% | 28 ? -4% | 12 ? 55% | 12.8 ? 52% | 7.6 ? 72% |
| PWM Frequency (Hz) | ||||||
| Screen | 1% | 29% | 1% | 26% | 15% | |
| Brightness middle (cd/m²) | 261 | 227 -13% | 248 -5% | 363.5 39% | 353.7 36% | 378 45% |
| Brightness (cd/m²) | 258 | 225 -13% | 245 -5% | 350 36% | 340 32% | 371 44% |
| Brightness Distribution (%) | 92 | 90 -2% | 86 -7% | 89 -3% | 89 -3% | 93 1% |
| Black Level * (cd/m²) | 0.19 | 0.21 -11% | 0.13 32% | 0.39 -105% | 0.34 -79% | 0.33 -74% |
| Contrast (:1) | 1374 | 1081 -21% | 1908 39% | 932 -32% | 1040 -24% | 1145 -17% |
| Colorchecker dE 2000 * | 5.57 | 4.19 25% | 3.14 44% | 3.68 34% | 1.74 69% | 2.84 49% |
| Colorchecker dE 2000 max. * | 20.6 | 17.45 15% | 5.82 72% | 8.92 57% | 3.63 82% | 5.51 73% |
| Colorchecker dE 2000 calibrated * | 4.63 | 3.81 18% | 3.14 32% | 0.53 89% | 0.5 89% | 2.75 41% |
| Greyscale dE 2000 * | 3.19 | 2.7 15% | 1.2 62% | 6.5 -104% | 2.1 34% | 4.08 -28% |
| Gamma | 2.45 90% | 2.208 100% | 2.49 88% | 2.2 100% | 2.3 96% | 2.4 92% |
| CCT | 6146 106% | 6176 105% | 6468 100% | 5995 108% | 6257 104% | 5841 111% |
| Totaal Gemiddelde (Programma / Instellingen) | -0% /
1% | 10% /
19% | 46% /
26% | 56% /
42% | 53% /
36% |
* ... kleiner is beter
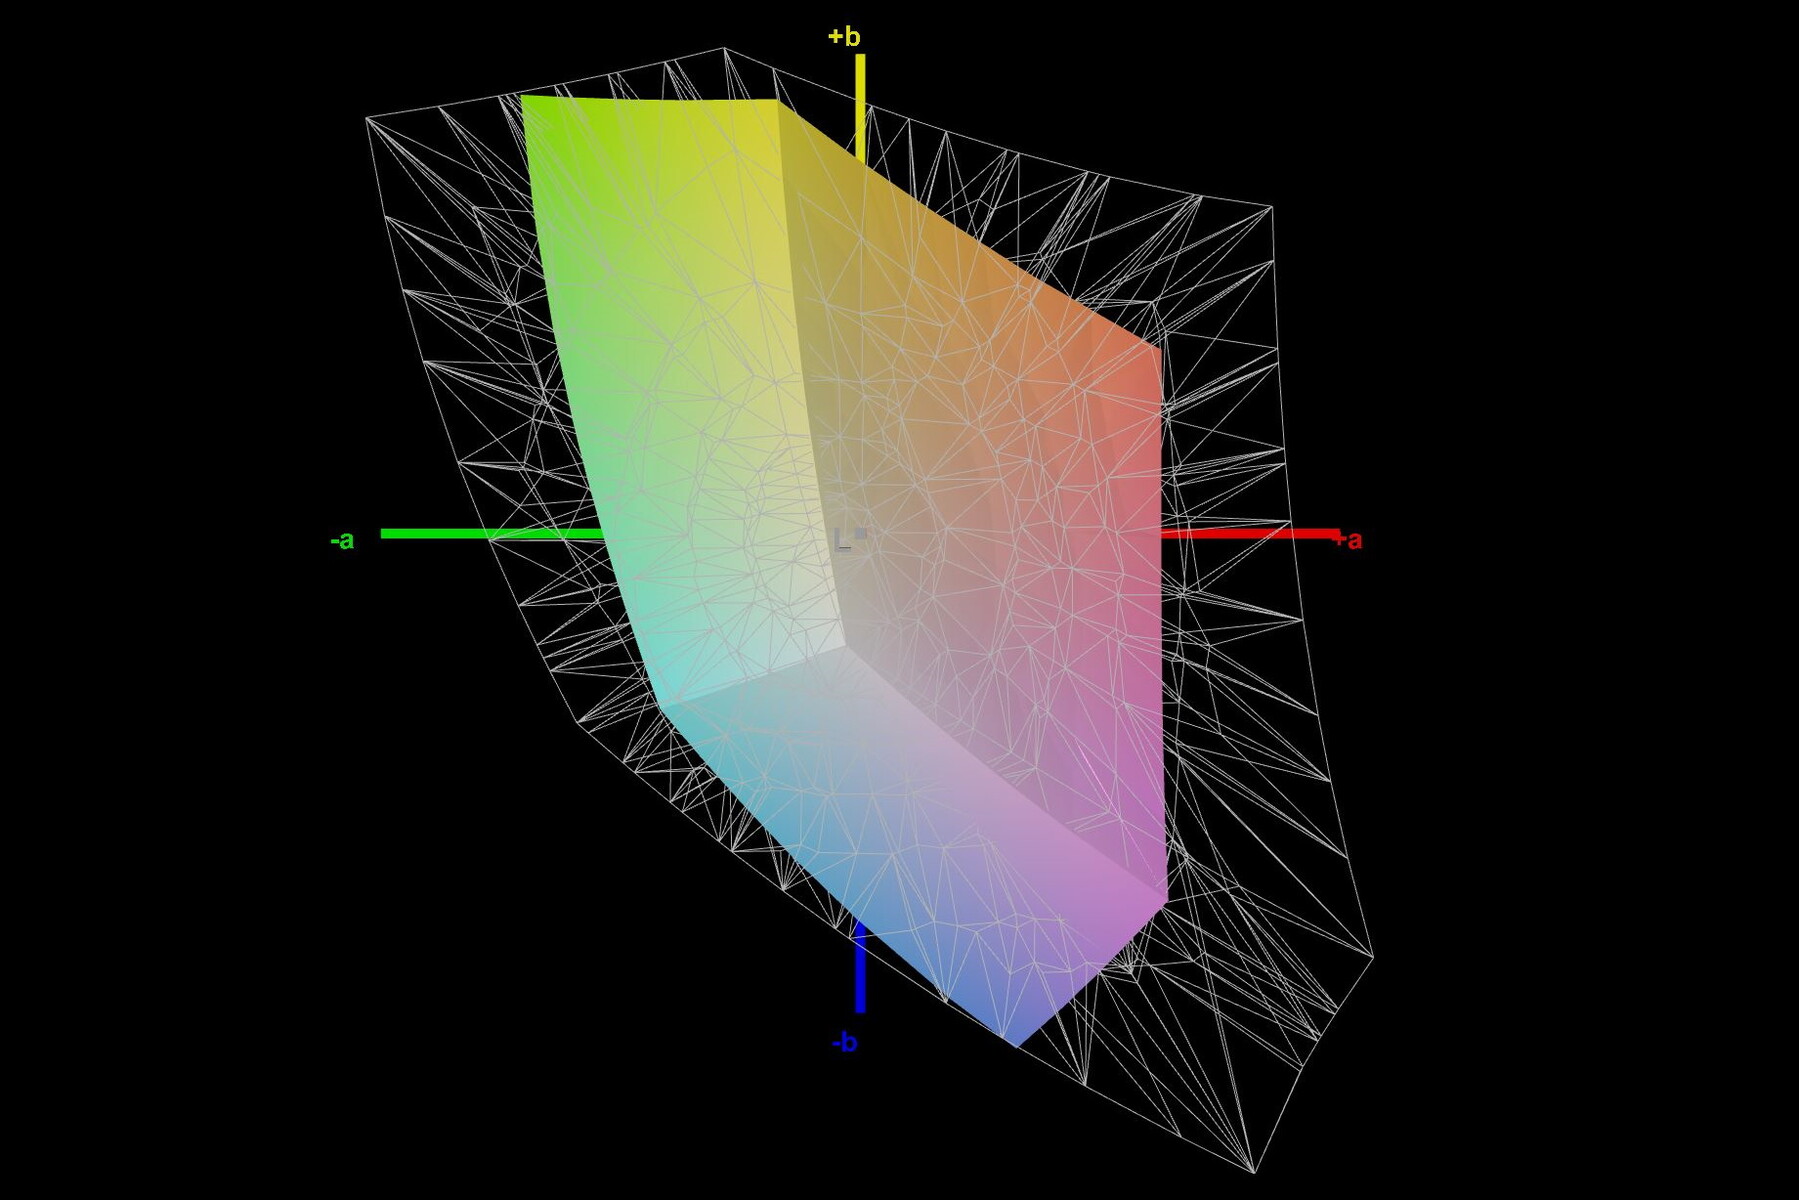
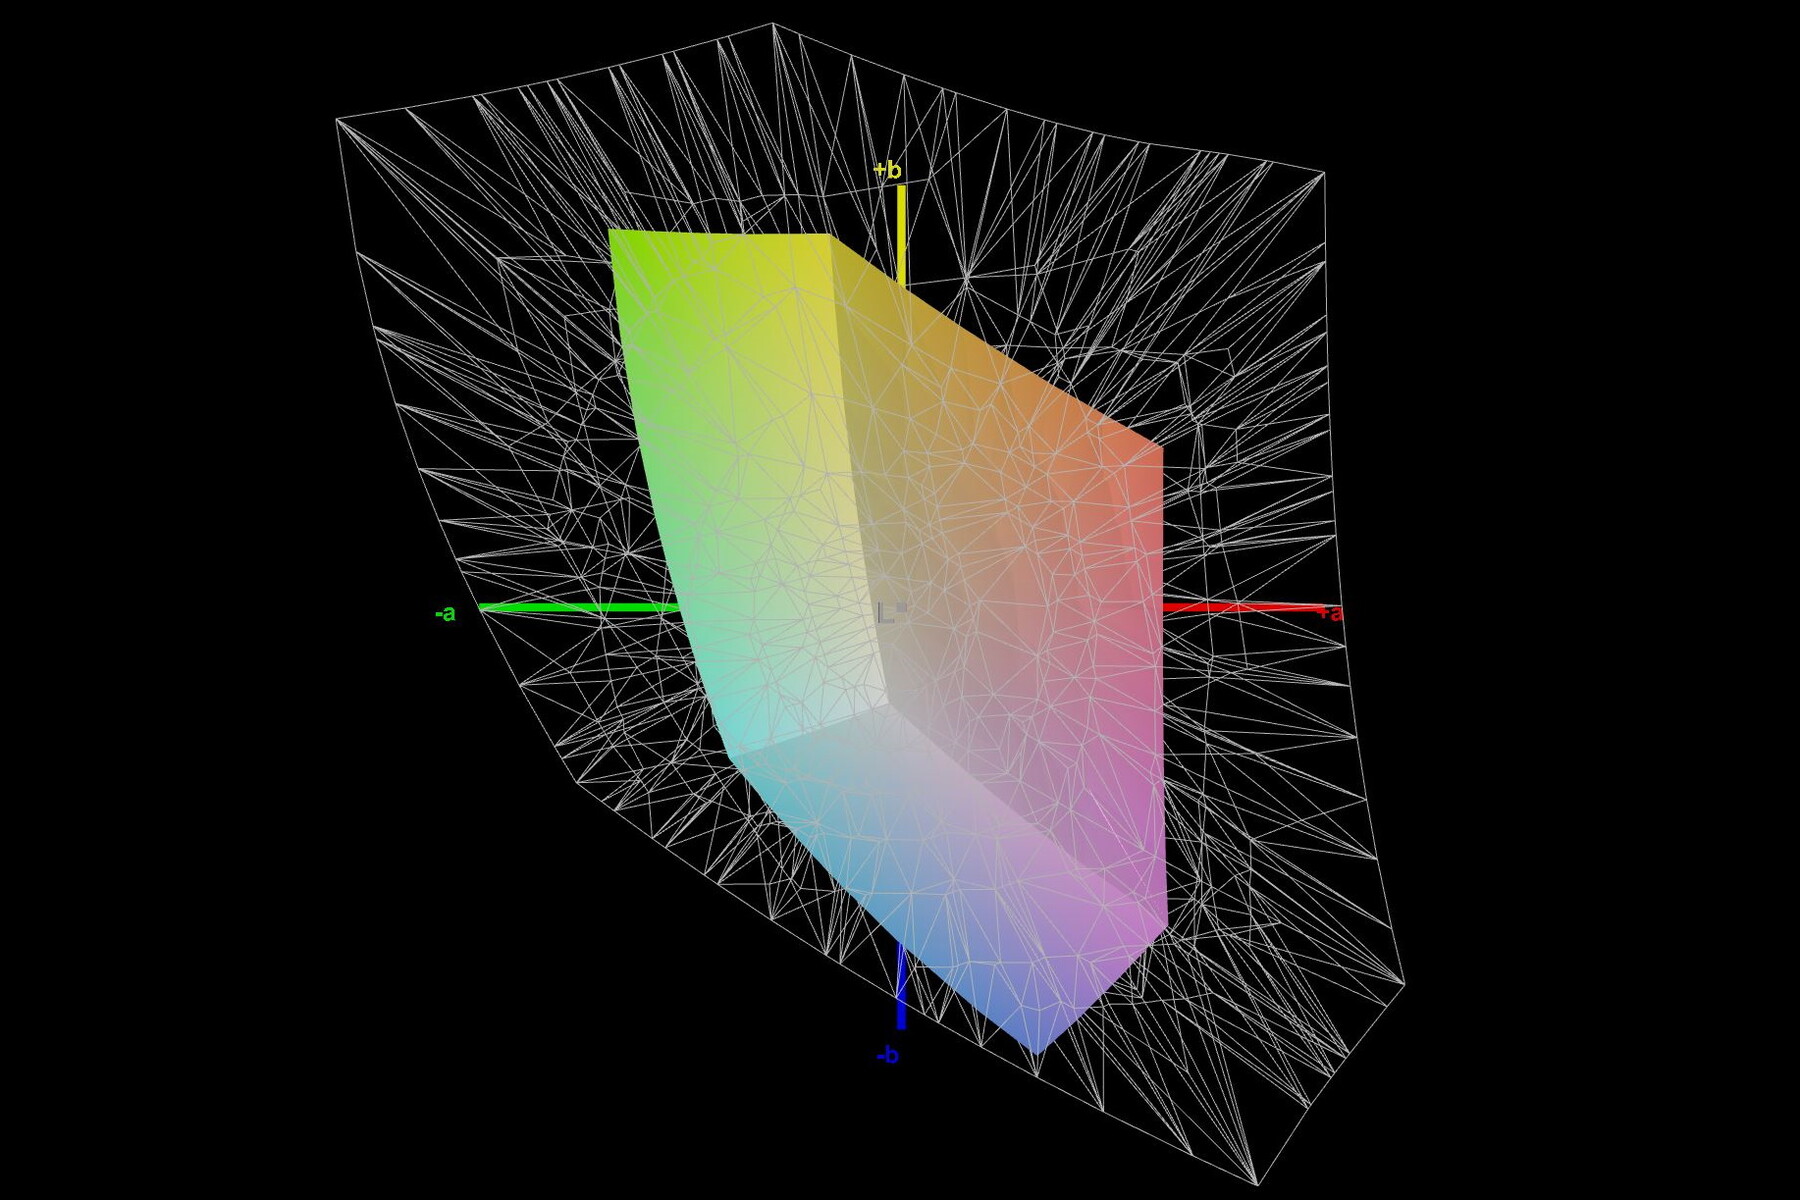
De fabrikant geeft geen informatie over de dekking van de kleurruimte. Wij hebben iets minder dan 57 procent gemeten in sRGB en ongeveer 39 procent in AdobeRGB en DisplayP3. Ook hier is het budgetkarakter van de Katana 15 duidelijk; de concurrentie biedt een hogere kleurruimtedekking.
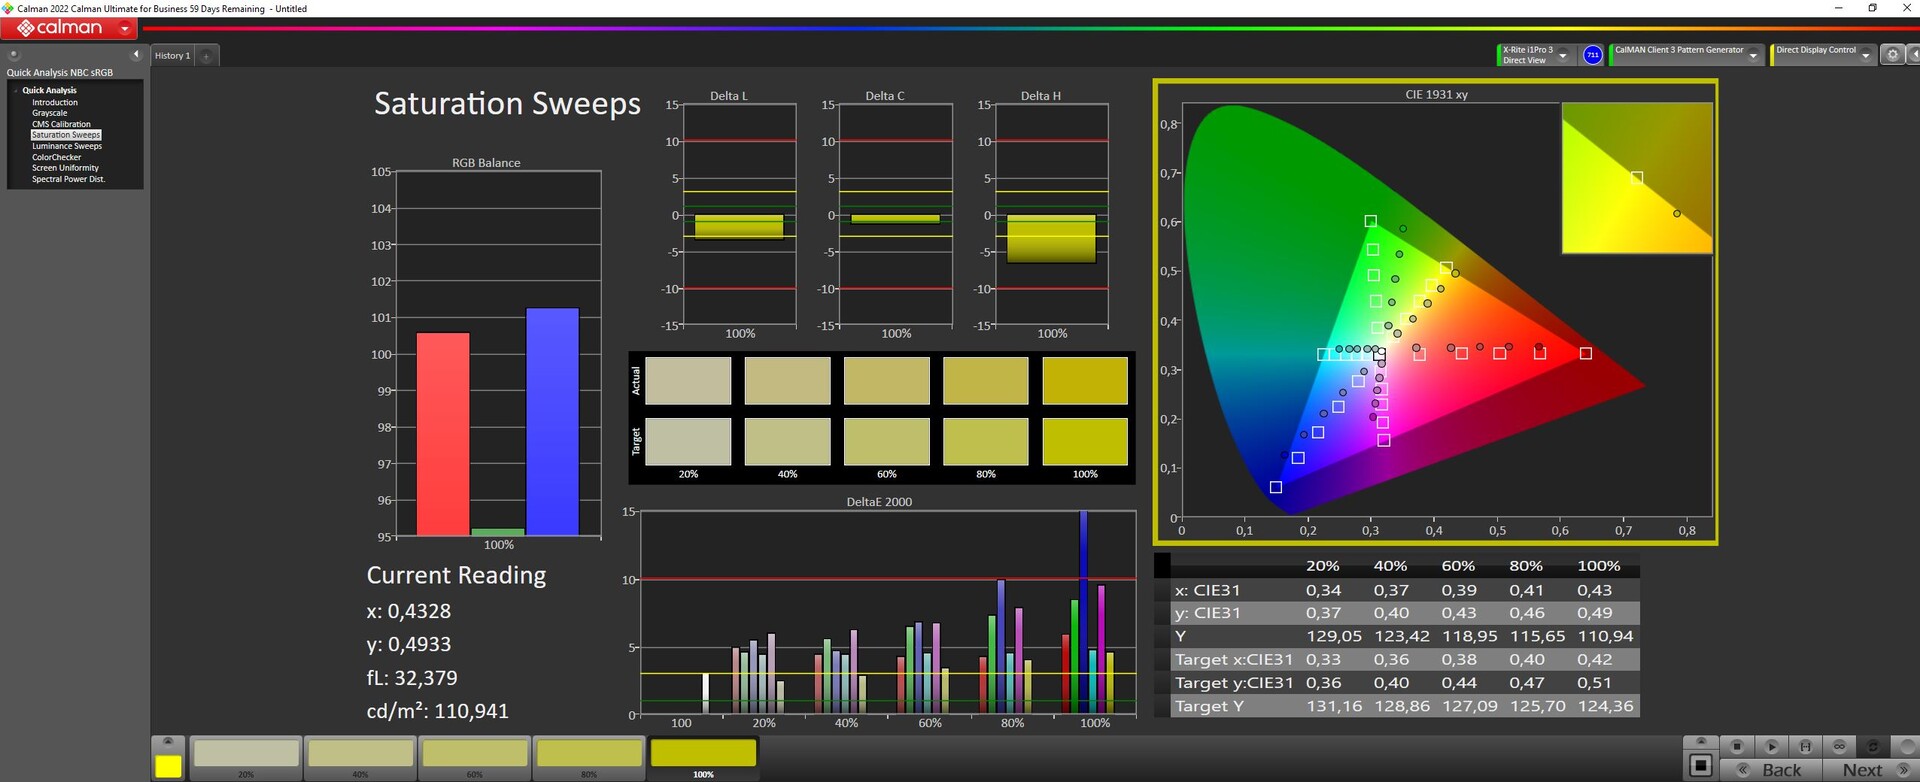
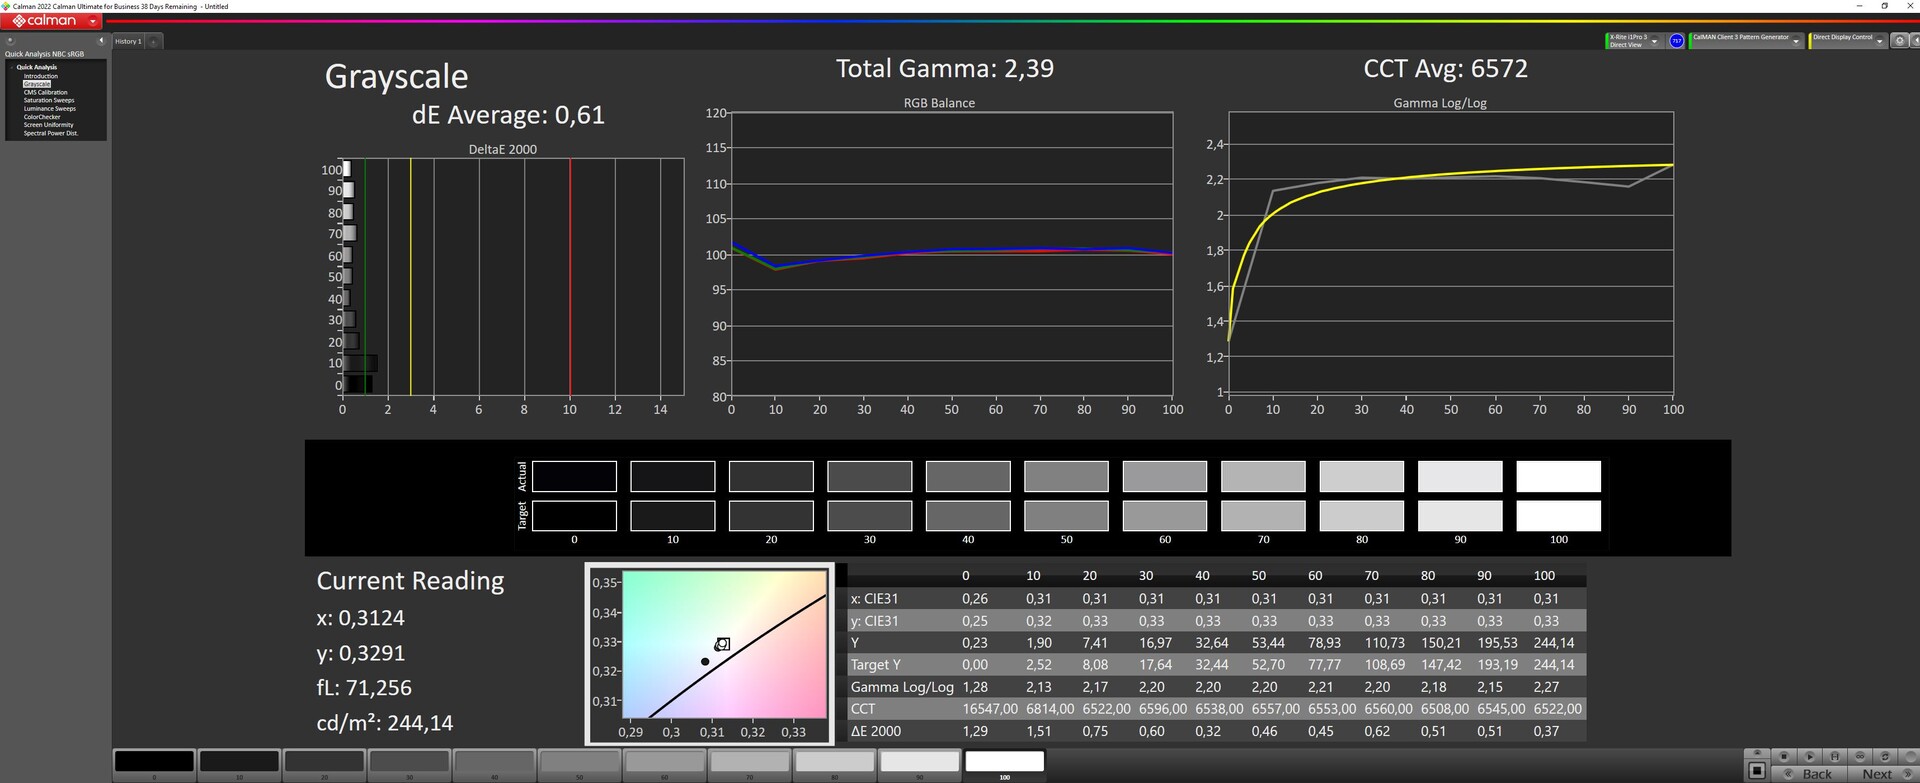
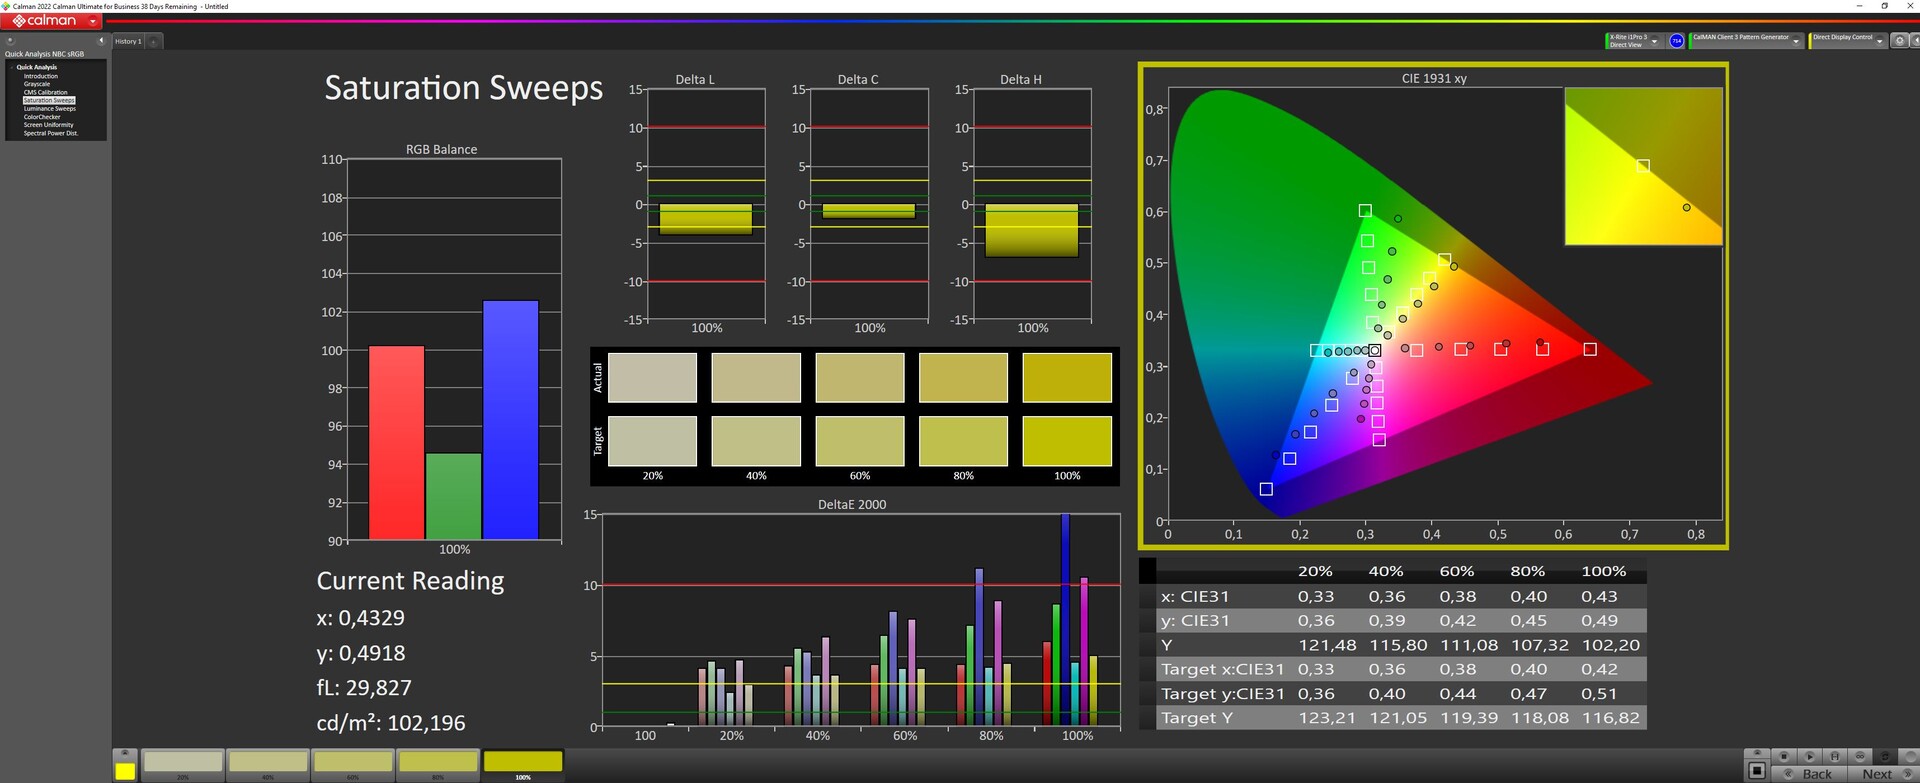
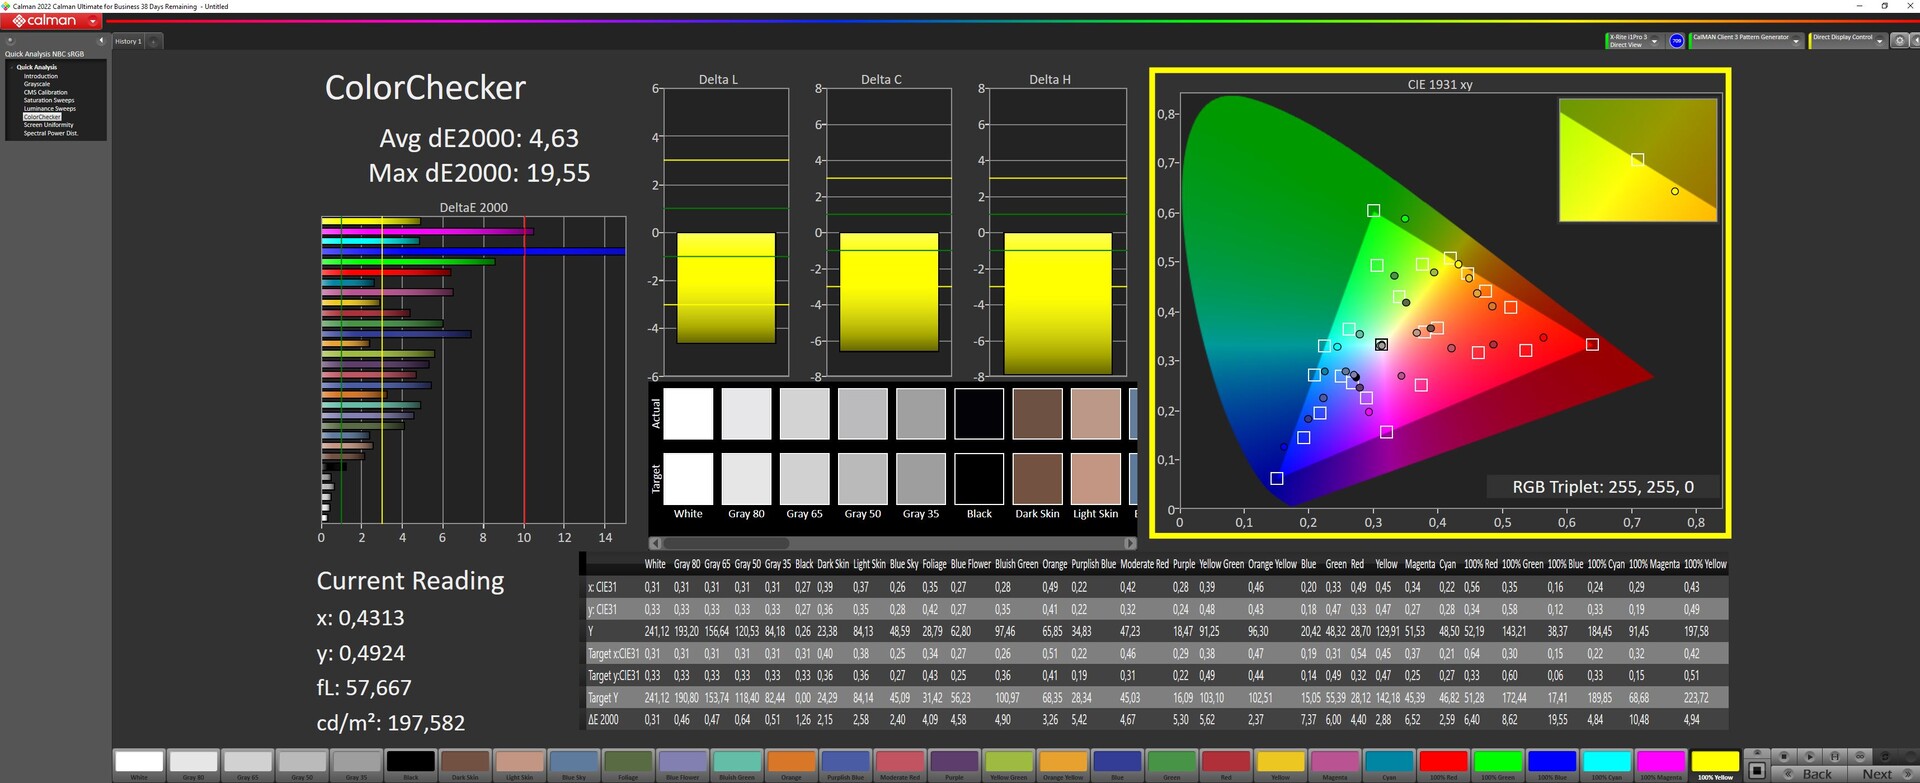
Het scherm is af fabriek niet zo goed afgesteld. We hebben hier alleen gemeten tegen de sRGB-norm. Het verlagen van de helderheid verlaagt de DeltaE waarde voor de grijswaarden slechts licht, maar blijft nog steeds net onder de 3. De Calman ColorChecker laat echter hoge kleurafwijkingen zien.
Handmatige kalibratie minimaliseert de afwijkingen in grijswaarden tot een goede 0,61, maar de DeltaE-waarde van de ColorChecker van 4,63 blijft veel te hoog. Meer lijkt het scherm niet aan te kunnen. Ons gekalibreerde icc kleurprofiel kan hierboven worden gedownload.
Responstijd Scherm
| ↔ Responstijd Zwart naar Wit | ||
|---|---|---|
| 26.8 ms ... stijging ↗ en daling ↘ gecombineerd | ↗ 14.2 ms stijging | 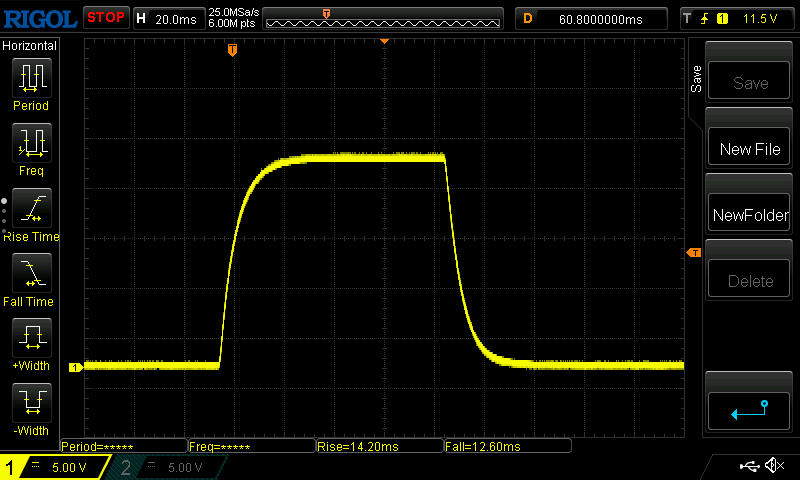 |
| ↘ 12.6 ms daling | ||
| Het scherm vertoonde relatief trage responstijden in onze tests en is misschien te traag voor games. Ter vergelijking: alle testtoestellen variëren van 0.1 (minimum) tot 240 (maximum) ms. » 67 % van alle toestellen zijn beter. Dit betekent dat de gemeten responstijd slechter is dan het gemiddelde (19.8 ms) van alle geteste toestellen. | ||
| ↔ Responstijd 50% Grijs naar 80% Grijs | ||
| 38.8 ms ... stijging ↗ en daling ↘ gecombineerd | ↗ 18.6 ms stijging | 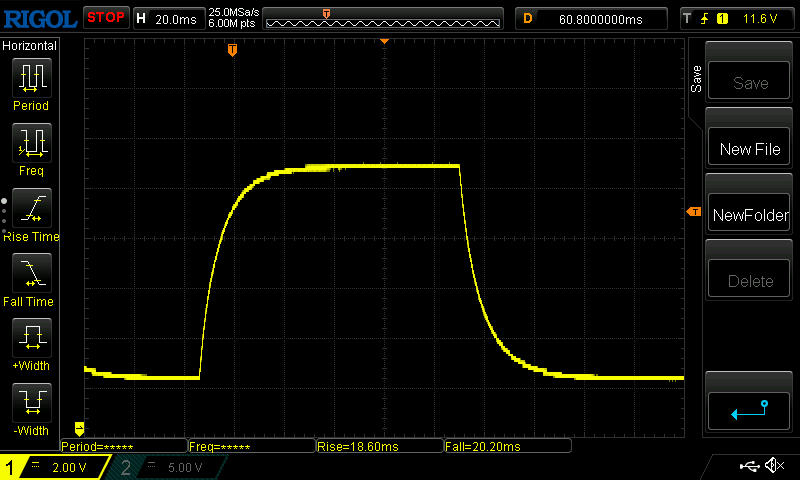 |
| ↘ 20.2 ms daling | ||
| Het scherm vertoonde trage responstijden in onze tests en is misschien te traag voor games. Ter vergelijking: alle testtoestellen variëren van 0.165 (minimum) tot 636 (maximum) ms. » 58 % van alle toestellen zijn beter. Dit betekent dat de gemeten responstijd slechter is dan het gemiddelde (31 ms) van alle geteste toestellen. | ||
Screen Flickering / PWM (Pulse-Width Modulation)
| Screen flickering / PWM niet waargenomen | 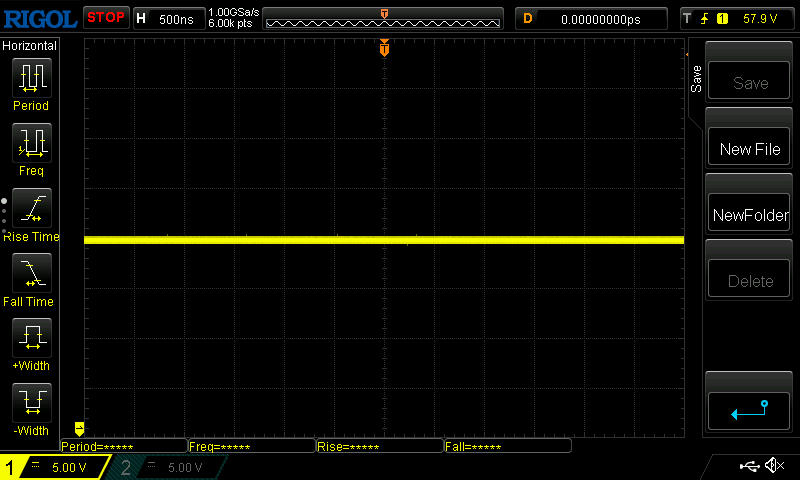 | ||
Ter vergelijking: 52 % van alle geteste toestellen maakten geen gebruik van PWM om de schermhelderheid te verlagen. Als het wel werd gebruikt, werd een gemiddelde van 7757 (minimum: 5 - maximum: 343500) Hz waargenomen. | |||
Het matte oppervlak filtert agressieve reflecties buiten. De zwakke helderheid van het paneel vraagt echter om een plaats in de schaduw.
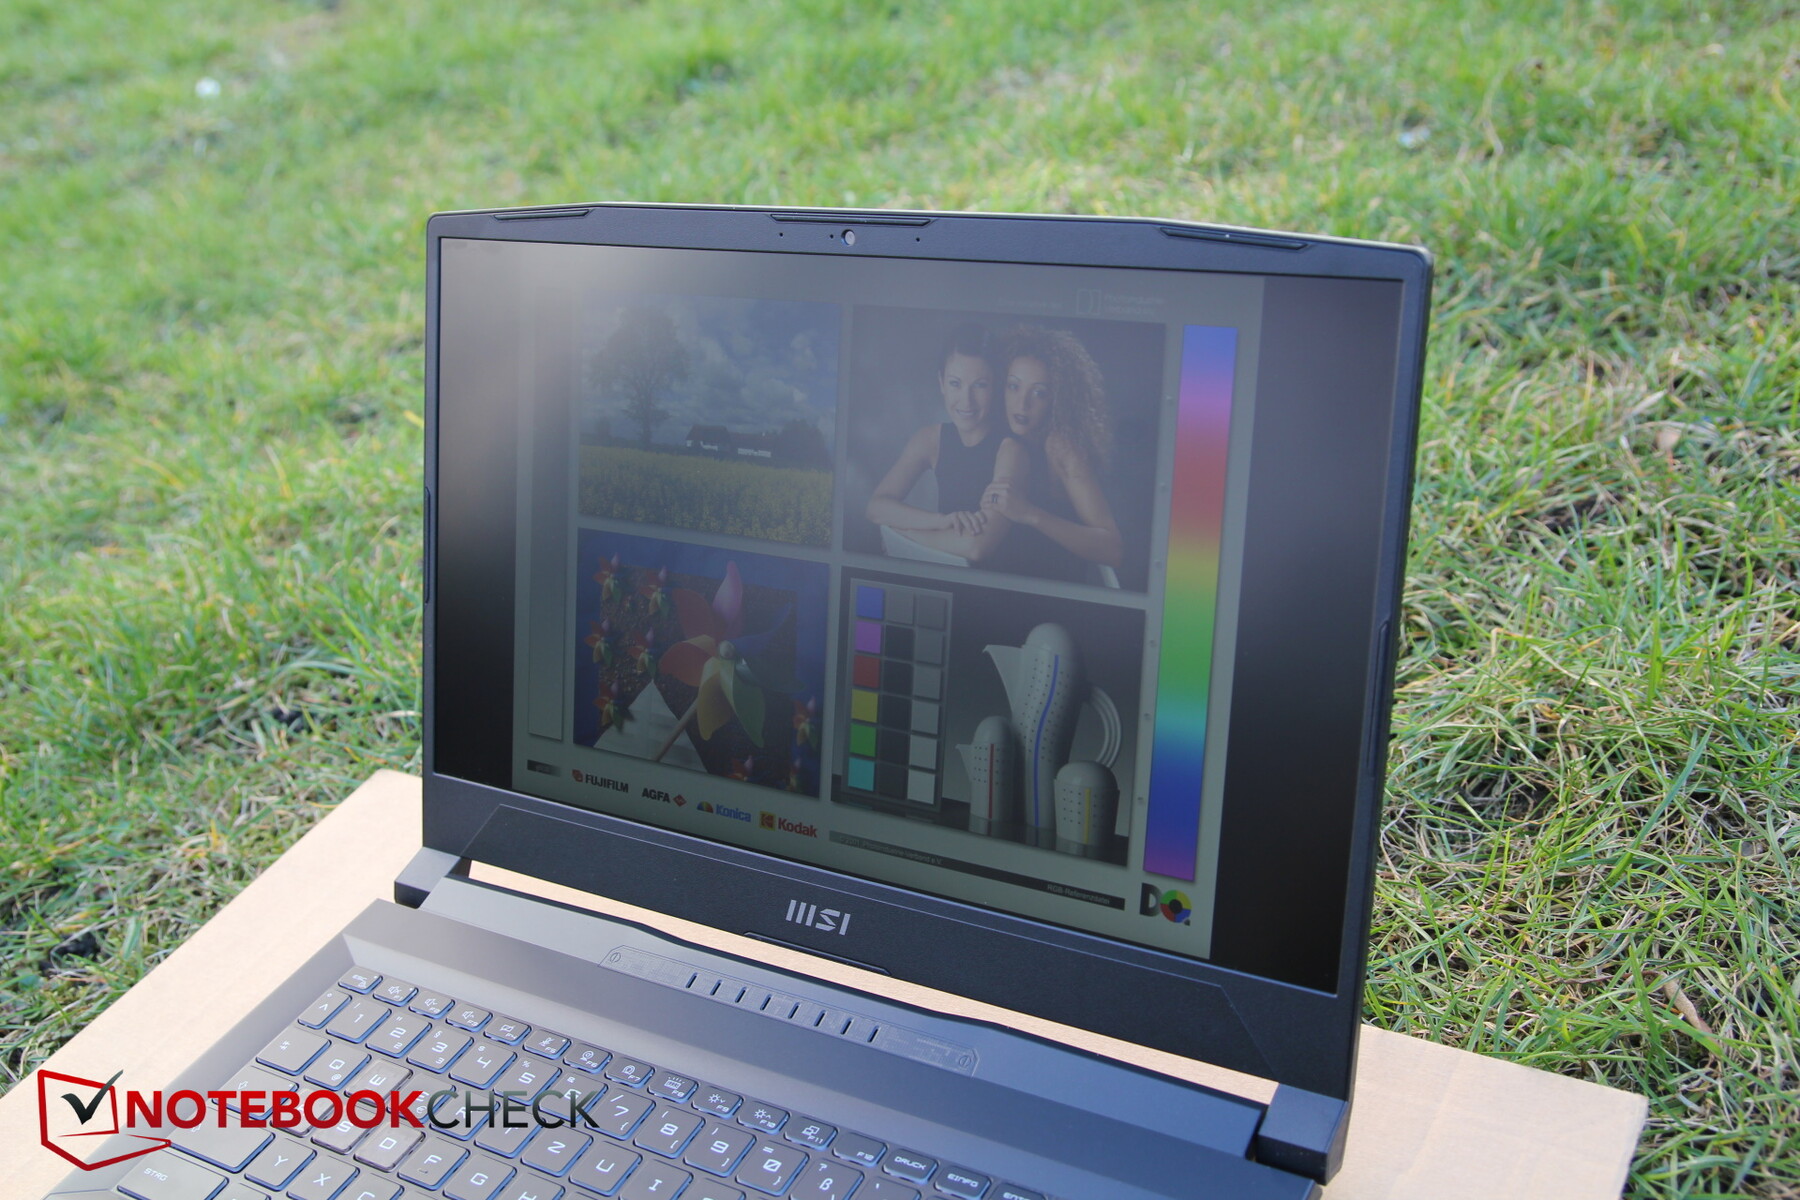
De kijkhoekstabiliteit is oké. Een afname van de helderheid is alleen zichtbaar bij extreme kijkhoeken.

Prestaties - Katana 15 op het niveau van RTX 3060
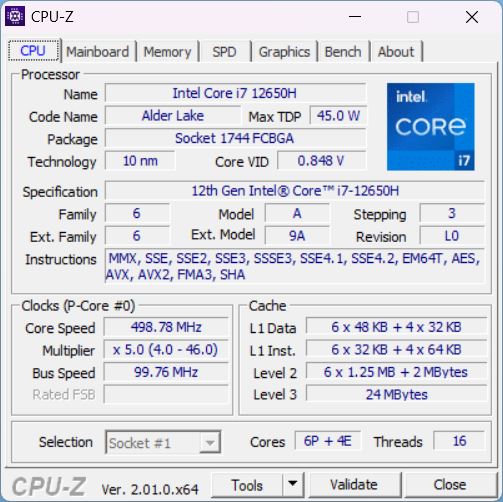
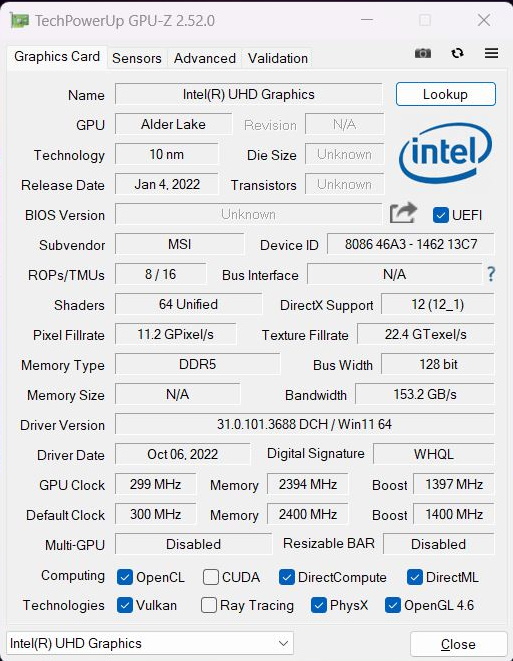
De MSI Katana 15 wordt geadverteerd als een gaming laptop, en hoewel zijnCore i7-12650Hbehoort tot de Alder Lake serie van vorig jaar, behoort hij zeker tot de lagere high-end.
De CPU wordt gecombineerd met eenNvidia RTX 4050de instapkaart onder de nieuwe RTX 40xx modellen. In de Katana kan deze tot 105 W verbruiken. 16 GB RAM is tegenwoordig de (lagere) standaard voor een gamer.
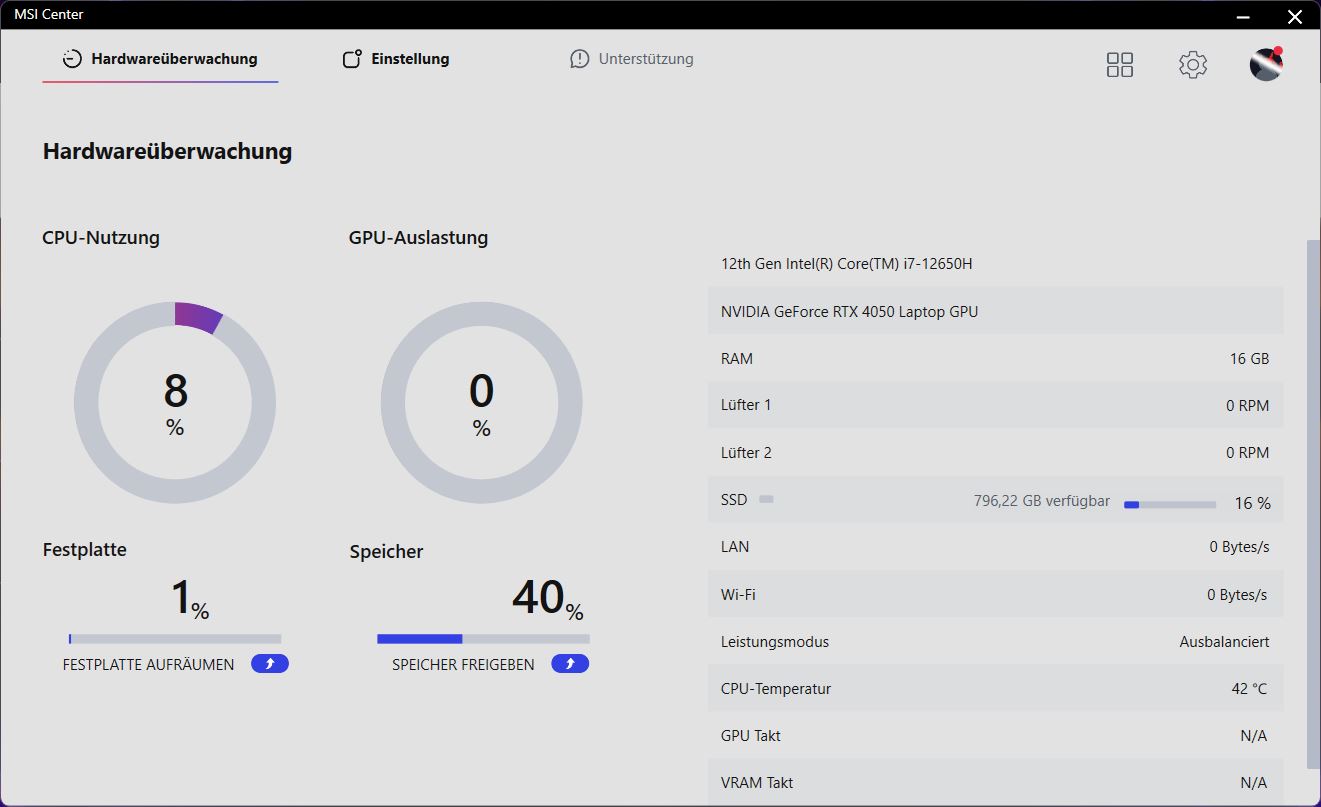
Testomstandigheden
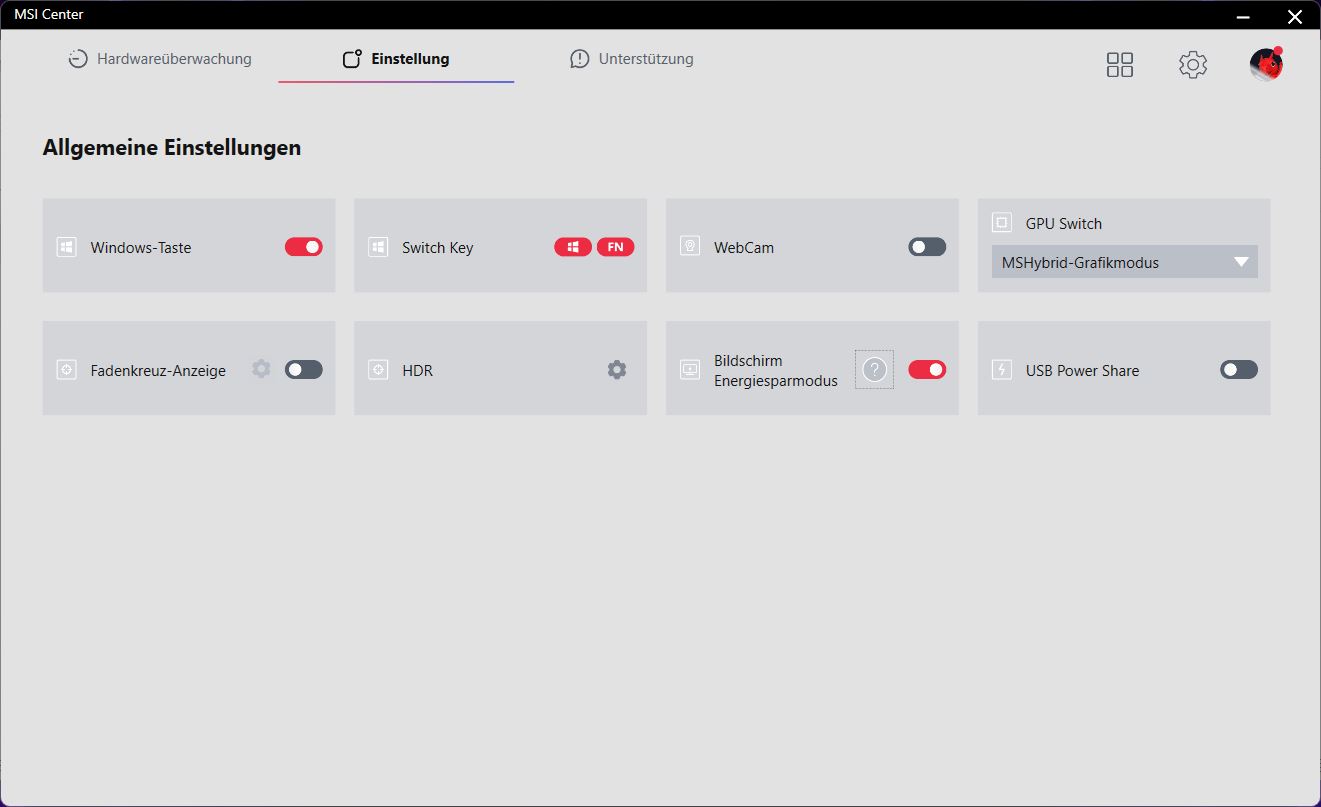
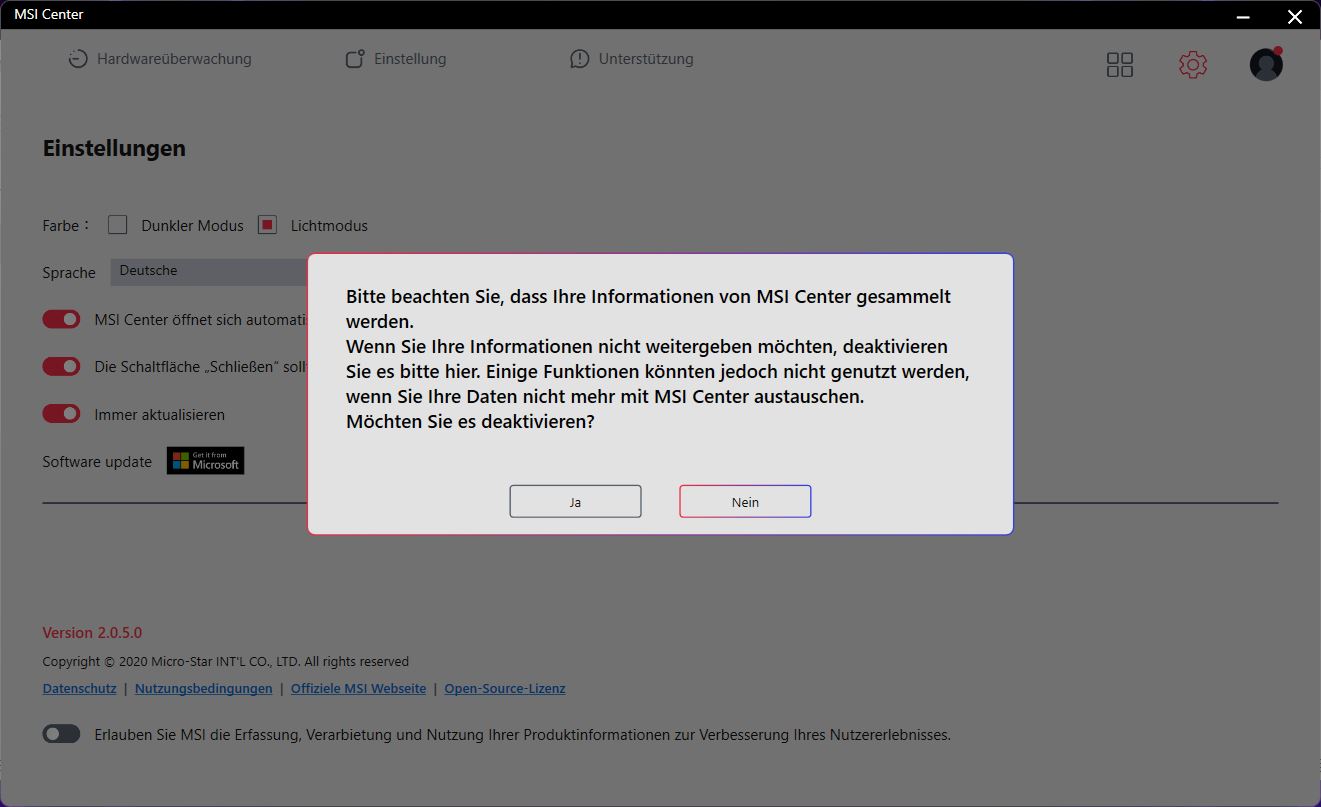
Het MSI Center is het controlecentrum, waarmee de fabrikant natuurlijk allerlei gegevens verzamelt. Hier worden onder andere de prestatie-instellingen aangepast. De AI-modus is hier standaard ingesteld, die de prestatiewaarden automatisch aanpast afhankelijk van de toegepaste belasting. Wij hebben ons vertrouwen gesteld in de competentie van AI en alle benchmarks in deze modus gedraaid.
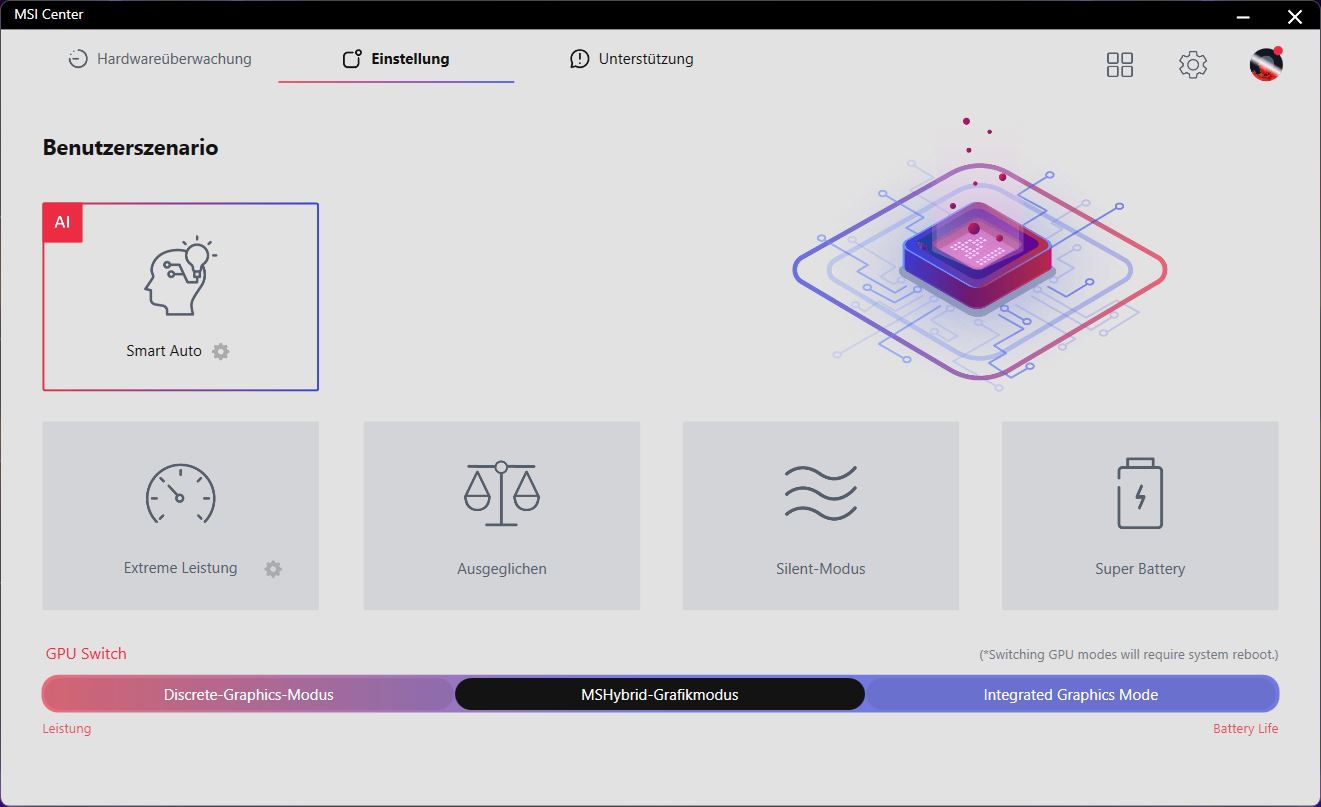
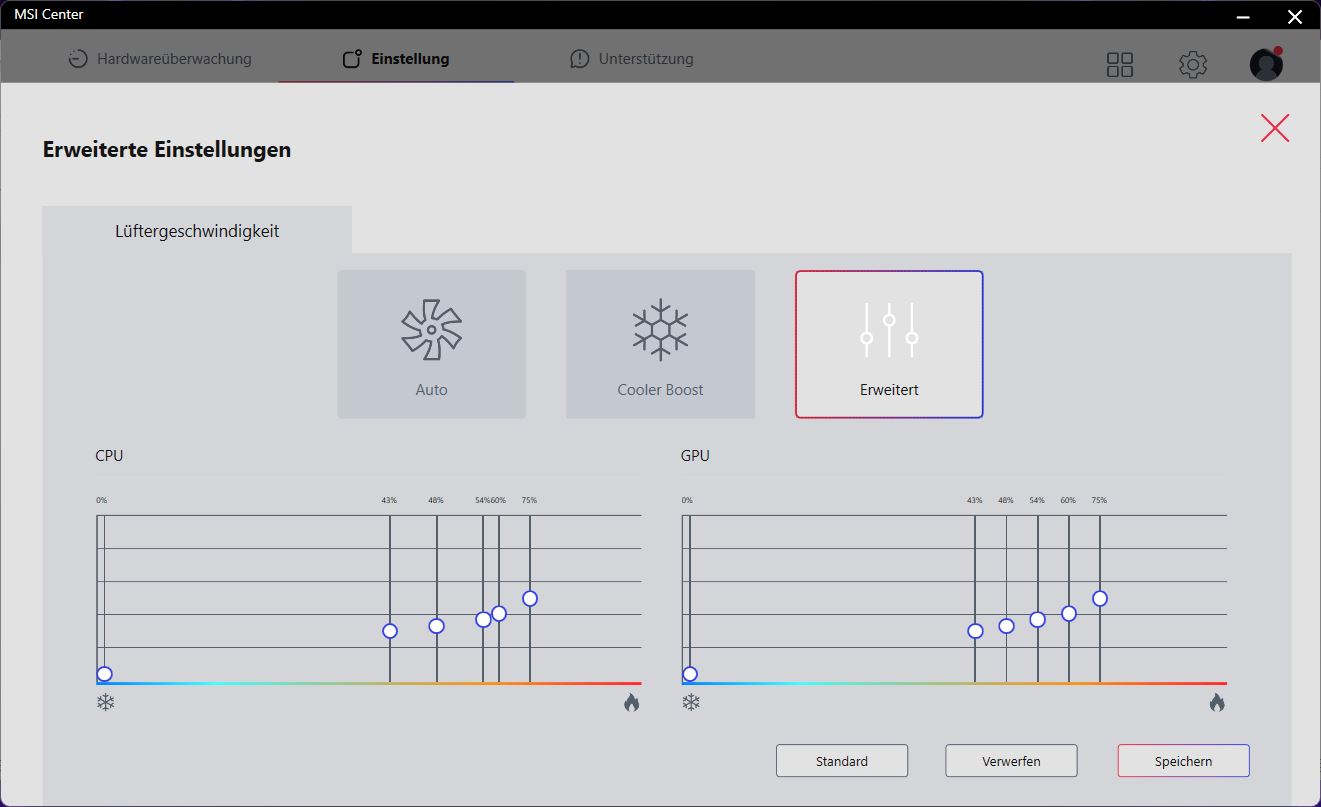
Naast de prestaties kunnen ook andere instellingen worden aangepast in het MSI Center. Zo verwissel je bijvoorbeeld de functies van de fn- en Windows-toetsen, pas je handmatig ventilatorcurves aan in de modus Extreme Performance, of wissel je iGPU en dGPU om. De tool heeft problemen met bepaalde resoluties
Meestal werd de GPU hybride modus geactiveerd in het MSI Center, die automatisch schakelt tussen iGPU en dGPU. Dit werkte echter niet betrouwbaar in onze benchmarks. We moesten bijvoorbeeld handmatig de dGPU activeren voor Blender, omdat de test automatisch alleen met iGPU draaide en zeer slechte resultaten opleverde.
Processor
In tegenstelling tot de algemeen gebruiktei7-12700Hde i7-12650H heeft slechts 4 van de 8 E-kernen, maar de 6 P-kernen zijn hetzelfde. Deze laatste klokken tot 4,7 GHz. De CPU behoort tot de lagere high-end van de nieuwste Intel-generatie. Als alternatief is er nu ook de Katana 15 B13 met een Gen13 CPU van Intel, waarvan de prijs waarschijnlijk hoger ligt.
In de Cinebench loop zien we een kleine prestatiedaling tijdens de eerste twee runs. Daarna zijn de prestaties grotendeels constant, maar niet overdreven hoog. Onze Katana is in het nadeel ten opzichte van de concurrentie met i7-12700H, en wordt ook verslagen door de Ryzen 7 6800H.
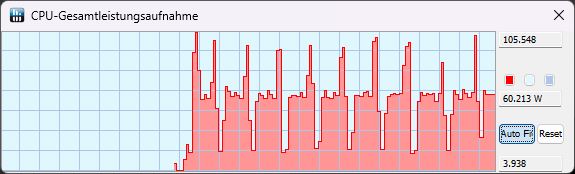
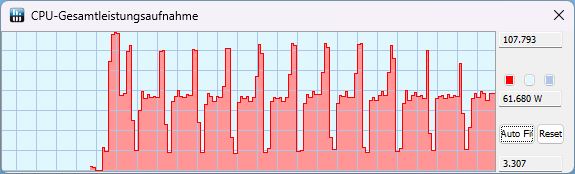
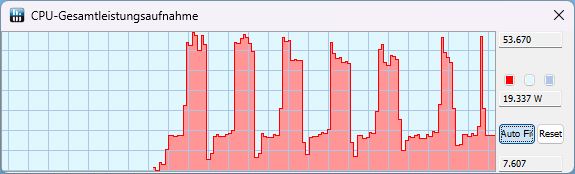
TDP blijft vrijwel gelijk in zowel KI als Extreme modus: we maten rond de 105 W aan het begin en einde van een run, respectievelijk, en het stroomverbruik daalt tot 60 W in de loop van de run. In batterijmodus is de piek slechts 53 W, anders is er slechts 19 W beschikbaar
In het algemeen liggen de CPU-prestaties op het verwachte niveau, maar de single-core prestaties van de Katana zijn wat zwakker.
Cinebench R15 Multi Sustained Load
Cinebench R23: Multi Core | Single Core
Cinebench R20: CPU (Multi Core) | CPU (Single Core)
Cinebench R15: CPU Multi 64Bit | CPU Single 64Bit
Blender: v2.79 BMW27 CPU
7-Zip 18.03: 7z b 4 | 7z b 4 -mmt1
Geekbench 5.5: Multi-Core | Single-Core
HWBOT x265 Benchmark v2.2: 4k Preset
LibreOffice : 20 Documents To PDF
R Benchmark 2.5: Overall mean
| CPU Performance rating | |
| Gemiddelde van klas Gaming | |
| Lenovo Legion 5 15IAH7H 82RB | |
| MSI Pulse GL66 12UEK | |
| Asus TUF Gaming F15 FX507ZM | |
| MSI Katana GF66 12UGS | |
| MSI Katana 15 B12VEK | |
| Schenker XMG Core 15 (M22) | |
| Gemiddeld Intel Core i7-12650H | |
| Cinebench R23 / Multi Core | |
| Gemiddelde van klas Gaming (10488 - 42661, n=107, laatste 2 jaar) | |
| Lenovo Legion 5 15IAH7H 82RB | |
| Asus TUF Gaming F15 FX507ZM | |
| MSI Pulse GL66 12UEK | |
| MSI Katana GF66 12UGS | |
| MSI Katana 15 B12VEK | |
| Schenker XMG Core 15 (M22) | |
| Gemiddeld Intel Core i7-12650H (5362 - 15537, n=14) | |
| Cinebench R23 / Single Core | |
| Gemiddelde van klas Gaming (1166 - 2415, n=107, laatste 2 jaar) | |
| MSI Pulse GL66 12UEK | |
| MSI Katana GF66 12UGS | |
| Lenovo Legion 5 15IAH7H 82RB | |
| Asus TUF Gaming F15 FX507ZM | |
| Gemiddeld Intel Core i7-12650H (1428 - 1808, n=14) | |
| MSI Katana 15 B12VEK | |
| Schenker XMG Core 15 (M22) | |
| Cinebench R20 / CPU (Multi Core) | |
| Gemiddelde van klas Gaming (4029 - 16433, n=106, laatste 2 jaar) | |
| Lenovo Legion 5 15IAH7H 82RB | |
| Asus TUF Gaming F15 FX507ZM | |
| MSI Pulse GL66 12UEK | |
| MSI Katana GF66 12UGS | |
| MSI Katana 15 B12VEK | |
| Schenker XMG Core 15 (M22) | |
| Gemiddeld Intel Core i7-12650H (2106 - 6009, n=14) | |
| Cinebench R20 / CPU (Single Core) | |
| Gemiddelde van klas Gaming (442 - 913, n=106, laatste 2 jaar) | |
| MSI Pulse GL66 12UEK | |
| MSI Katana GF66 12UGS | |
| Lenovo Legion 5 15IAH7H 82RB | |
| Asus TUF Gaming F15 FX507ZM | |
| Gemiddeld Intel Core i7-12650H (552 - 696, n=14) | |
| MSI Katana 15 B12VEK | |
| Schenker XMG Core 15 (M22) | |
| Cinebench R15 / CPU Multi 64Bit | |
| Gemiddelde van klas Gaming (1578 - 6330, n=105, laatste 2 jaar) | |
| Lenovo Legion 5 15IAH7H 82RB | |
| Asus TUF Gaming F15 FX507ZM | |
| MSI Pulse GL66 12UEK | |
| MSI Katana GF66 12UGS | |
| MSI Katana GF66 12UGS | |
| Schenker XMG Core 15 (M22) | |
| MSI Katana 15 B12VEK | |
| Gemiddeld Intel Core i7-12650H (753 - 2253, n=14) | |
| Cinebench R15 / CPU Single 64Bit | |
| Gemiddelde van klas Gaming (188.8 - 350, n=106, laatste 2 jaar) | |
| MSI Pulse GL66 12UEK | |
| MSI Katana GF66 12UGS | |
| MSI Katana GF66 12UGS | |
| Lenovo Legion 5 15IAH7H 82RB | |
| Asus TUF Gaming F15 FX507ZM | |
| Schenker XMG Core 15 (M22) | |
| MSI Katana 15 B12VEK | |
| Gemiddeld Intel Core i7-12650H (206 - 261, n=14) | |
| Blender / v2.79 BMW27 CPU | |
| Gemiddeld Intel Core i7-12650H (222 - 553, n=15) | |
| MSI Katana GF66 12UGS | |
| MSI Katana 15 B12VEK | |
| Schenker XMG Core 15 (M22) | |
| MSI Pulse GL66 12UEK | |
| Asus TUF Gaming F15 FX507ZM | |
| Lenovo Legion 5 15IAH7H 82RB | |
| Gemiddelde van klas Gaming (79 - 330, n=104, laatste 2 jaar) | |
| 7-Zip 18.03 / 7z b 4 | |
| Gemiddelde van klas Gaming (33491 - 148086, n=105, laatste 2 jaar) | |
| Lenovo Legion 5 15IAH7H 82RB | |
| Asus TUF Gaming F15 FX507ZM | |
| MSI Pulse GL66 12UEK | |
| Schenker XMG Core 15 (M22) | |
| MSI Katana 15 B12VEK | |
| MSI Katana GF66 12UGS | |
| Gemiddeld Intel Core i7-12650H (27053 - 59034, n=14) | |
| 7-Zip 18.03 / 7z b 4 -mmt1 | |
| Gemiddelde van klas Gaming (4199 - 7436, n=105, laatste 2 jaar) | |
| MSI Pulse GL66 12UEK | |
| MSI Katana GF66 12UGS | |
| Lenovo Legion 5 15IAH7H 82RB | |
| Schenker XMG Core 15 (M22) | |
| Gemiddeld Intel Core i7-12650H (5265 - 6116, n=14) | |
| MSI Katana 15 B12VEK | |
| Asus TUF Gaming F15 FX507ZM | |
| Geekbench 5.5 / Multi-Core | |
| Gemiddelde van klas Gaming (6460 - 28263, n=105, laatste 2 jaar) | |
| Lenovo Legion 5 15IAH7H 82RB | |
| Asus TUF Gaming F15 FX507ZM | |
| MSI Pulse GL66 12UEK | |
| MSI Katana GF66 12UGS | |
| MSI Katana 15 B12VEK | |
| Schenker XMG Core 15 (M22) | |
| Gemiddeld Intel Core i7-12650H (6478 - 11284, n=16) | |
| Geekbench 5.5 / Single-Core | |
| Gemiddelde van klas Gaming (986 - 2474, n=105, laatste 2 jaar) | |
| MSI Pulse GL66 12UEK | |
| MSI Katana GF66 12UGS | |
| Lenovo Legion 5 15IAH7H 82RB | |
| Asus TUF Gaming F15 FX507ZM | |
| Gemiddeld Intel Core i7-12650H (1590 - 1797, n=16) | |
| MSI Katana 15 B12VEK | |
| Schenker XMG Core 15 (M22) | |
| HWBOT x265 Benchmark v2.2 / 4k Preset | |
| Gemiddelde van klas Gaming (11.5 - 44.4, n=105, laatste 2 jaar) | |
| Lenovo Legion 5 15IAH7H 82RB | |
| Asus TUF Gaming F15 FX507ZM | |
| MSI Pulse GL66 12UEK | |
| Schenker XMG Core 15 (M22) | |
| MSI Katana 15 B12VEK | |
| Gemiddeld Intel Core i7-12650H (6.62 - 17.4, n=16) | |
| MSI Katana GF66 12UGS | |
| LibreOffice / 20 Documents To PDF | |
| Schenker XMG Core 15 (M22) | |
| Asus TUF Gaming F15 FX507ZM | |
| Gemiddelde van klas Gaming (33.2 - 88.8, n=105, laatste 2 jaar) | |
| MSI Katana 15 B12VEK | |
| Gemiddeld Intel Core i7-12650H (35.1 - 58.5, n=14) | |
| MSI Pulse GL66 12UEK | |
| Lenovo Legion 5 15IAH7H 82RB | |
| MSI Katana GF66 12UGS | |
| R Benchmark 2.5 / Overall mean | |
| MSI Katana 15 B12VEK | |
| Schenker XMG Core 15 (M22) | |
| Gemiddeld Intel Core i7-12650H (0.4584 - 0.515, n=14) | |
| Asus TUF Gaming F15 FX507ZM | |
| Lenovo Legion 5 15IAH7H 82RB | |
| MSI Katana GF66 12UGS | |
| Gemiddelde van klas Gaming (0.3439 - 0.759, n=106, laatste 2 jaar) | |
| MSI Pulse GL66 12UEK | |
* ... kleiner is beter
AIDA64: FP32 Ray-Trace | FPU Julia | CPU SHA3 | CPU Queen | FPU SinJulia | FPU Mandel | CPU AES | CPU ZLib | FP64 Ray-Trace | CPU PhotoWorxx
| Performance rating | |
| Gemiddelde van klas Gaming | |
| Lenovo Legion 5 15IAH7H 82RB | |
| Schenker XMG Core 15 (M22) | |
| MSI Katana 15 B12VEK | |
| MSI Pulse GL66 12UEK | |
| Asus TUF Gaming F15 FX507ZM | |
| MSI Katana GF66 12UGS | |
| Gemiddeld Intel Core i7-12650H | |
| AIDA64 / FP32 Ray-Trace | |
| Gemiddelde van klas Gaming (10227 - 85542, n=105, laatste 2 jaar) | |
| Lenovo Legion 5 15IAH7H 82RB | |
| Schenker XMG Core 15 (M22) | |
| MSI Katana 15 B12VEK | |
| Gemiddeld Intel Core i7-12650H (5422 - 15620, n=14) | |
| Asus TUF Gaming F15 FX507ZM | |
| MSI Pulse GL66 12UEK | |
| MSI Katana GF66 12UGS | |
| AIDA64 / FPU Julia | |
| Gemiddelde van klas Gaming (51376 - 238426, n=105, laatste 2 jaar) | |
| Schenker XMG Core 15 (M22) | |
| Lenovo Legion 5 15IAH7H 82RB | |
| MSI Katana 15 B12VEK | |
| Gemiddeld Intel Core i7-12650H (26386 - 76434, n=14) | |
| Asus TUF Gaming F15 FX507ZM | |
| MSI Pulse GL66 12UEK | |
| MSI Katana GF66 12UGS | |
| AIDA64 / CPU SHA3 | |
| Gemiddelde van klas Gaming (2180 - 10115, n=105, laatste 2 jaar) | |
| Lenovo Legion 5 15IAH7H 82RB | |
| Schenker XMG Core 15 (M22) | |
| Asus TUF Gaming F15 FX507ZM | |
| MSI Katana 15 B12VEK | |
| MSI Pulse GL66 12UEK | |
| MSI Katana GF66 12UGS | |
| Gemiddeld Intel Core i7-12650H (1479 - 3244, n=14) | |
| AIDA64 / CPU Queen | |
| Gemiddelde van klas Gaming (49785 - 173351, n=90, laatste 2 jaar) | |
| MSI Pulse GL66 12UEK | |
| Lenovo Legion 5 15IAH7H 82RB | |
| MSI Katana GF66 12UGS | |
| Asus TUF Gaming F15 FX507ZM | |
| Schenker XMG Core 15 (M22) | |
| MSI Katana 15 B12VEK | |
| Gemiddeld Intel Core i7-12650H (59278 - 89537, n=14) | |
| AIDA64 / FPU SinJulia | |
| Gemiddelde van klas Gaming (4424 - 33636, n=105, laatste 2 jaar) | |
| Schenker XMG Core 15 (M22) | |
| Lenovo Legion 5 15IAH7H 82RB | |
| MSI Pulse GL66 12UEK | |
| Asus TUF Gaming F15 FX507ZM | |
| MSI Katana GF66 12UGS | |
| MSI Katana 15 B12VEK | |
| Gemiddeld Intel Core i7-12650H (4690 - 8726, n=14) | |
| AIDA64 / FPU Mandel | |
| Gemiddelde van klas Gaming (25115 - 128721, n=105, laatste 2 jaar) | |
| Schenker XMG Core 15 (M22) | |
| Lenovo Legion 5 15IAH7H 82RB | |
| MSI Katana 15 B12VEK | |
| Gemiddeld Intel Core i7-12650H (15001 - 37738, n=14) | |
| Asus TUF Gaming F15 FX507ZM | |
| MSI Pulse GL66 12UEK | |
| MSI Katana GF66 12UGS | |
| AIDA64 / CPU AES | |
| Lenovo Legion 5 15IAH7H 82RB | |
| Gemiddelde van klas Gaming (39258 - 247074, n=105, laatste 2 jaar) | |
| MSI Pulse GL66 12UEK | |
| MSI Katana GF66 12UGS | |
| Schenker XMG Core 15 (M22) | |
| MSI Katana 15 B12VEK | |
| Asus TUF Gaming F15 FX507ZM | |
| Gemiddeld Intel Core i7-12650H (32702 - 92530, n=14) | |
| AIDA64 / CPU ZLib | |
| Gemiddelde van klas Gaming (574 - 2531, n=105, laatste 2 jaar) | |
| Asus TUF Gaming F15 FX507ZM | |
| Lenovo Legion 5 15IAH7H 82RB | |
| MSI Pulse GL66 12UEK | |
| MSI Katana GF66 12UGS | |
| Schenker XMG Core 15 (M22) | |
| MSI Katana 15 B12VEK | |
| Gemiddeld Intel Core i7-12650H (443 - 891, n=14) | |
| AIDA64 / FP64 Ray-Trace | |
| Gemiddelde van klas Gaming (5509 - 45446, n=105, laatste 2 jaar) | |
| Lenovo Legion 5 15IAH7H 82RB | |
| Schenker XMG Core 15 (M22) | |
| MSI Katana 15 B12VEK | |
| Gemiddeld Intel Core i7-12650H (3096 - 8448, n=14) | |
| Asus TUF Gaming F15 FX507ZM | |
| MSI Pulse GL66 12UEK | |
| MSI Katana GF66 12UGS | |
| AIDA64 / CPU PhotoWorxx | |
| Gemiddelde van klas Gaming (12271 - 89891, n=105, laatste 2 jaar) | |
| MSI Katana 15 B12VEK | |
| Lenovo Legion 5 15IAH7H 82RB | |
| Asus TUF Gaming F15 FX507ZM | |
| Gemiddeld Intel Core i7-12650H (22046 - 44164, n=14) | |
| Schenker XMG Core 15 (M22) | |
| MSI Katana GF66 12UGS | |
| MSI Pulse GL66 12UEK | |
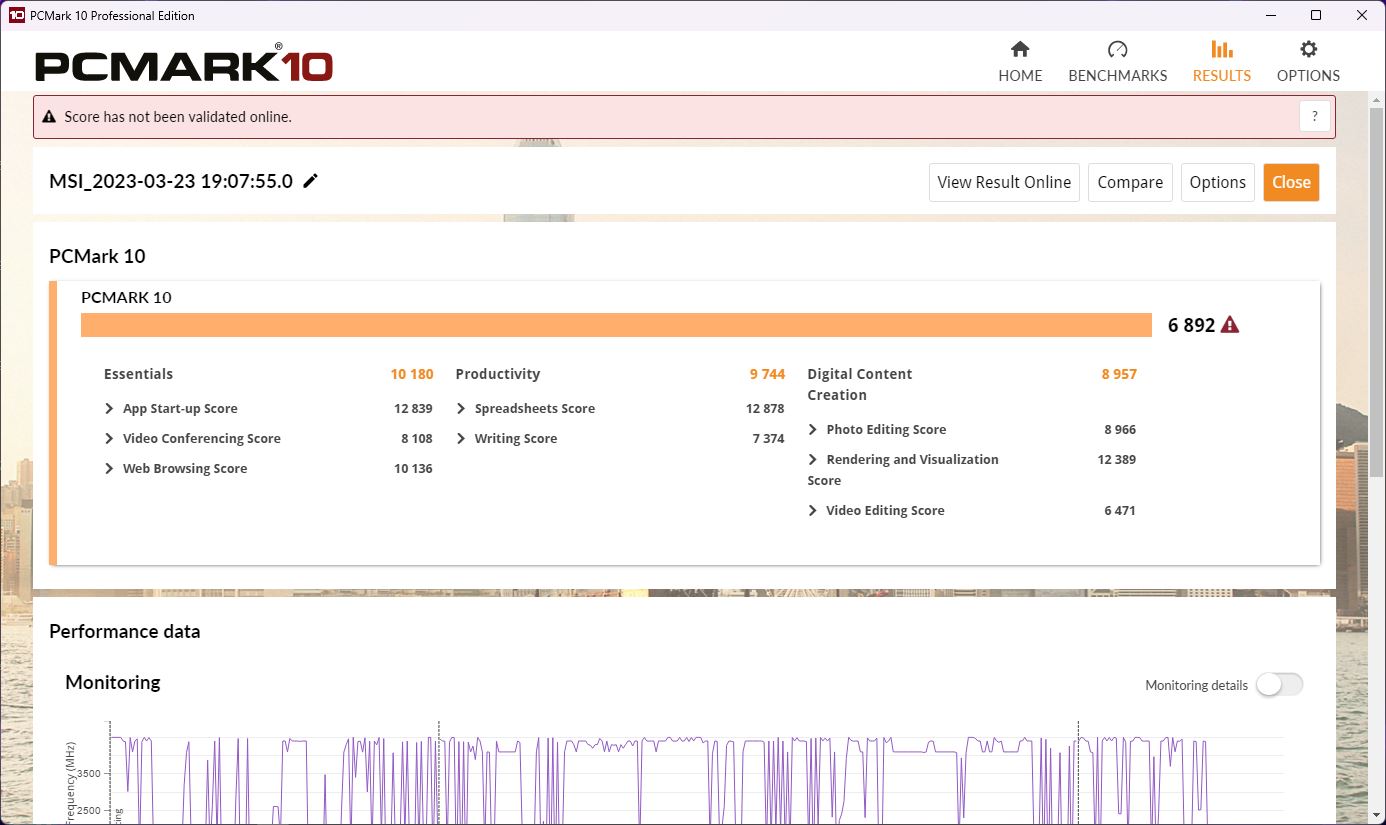
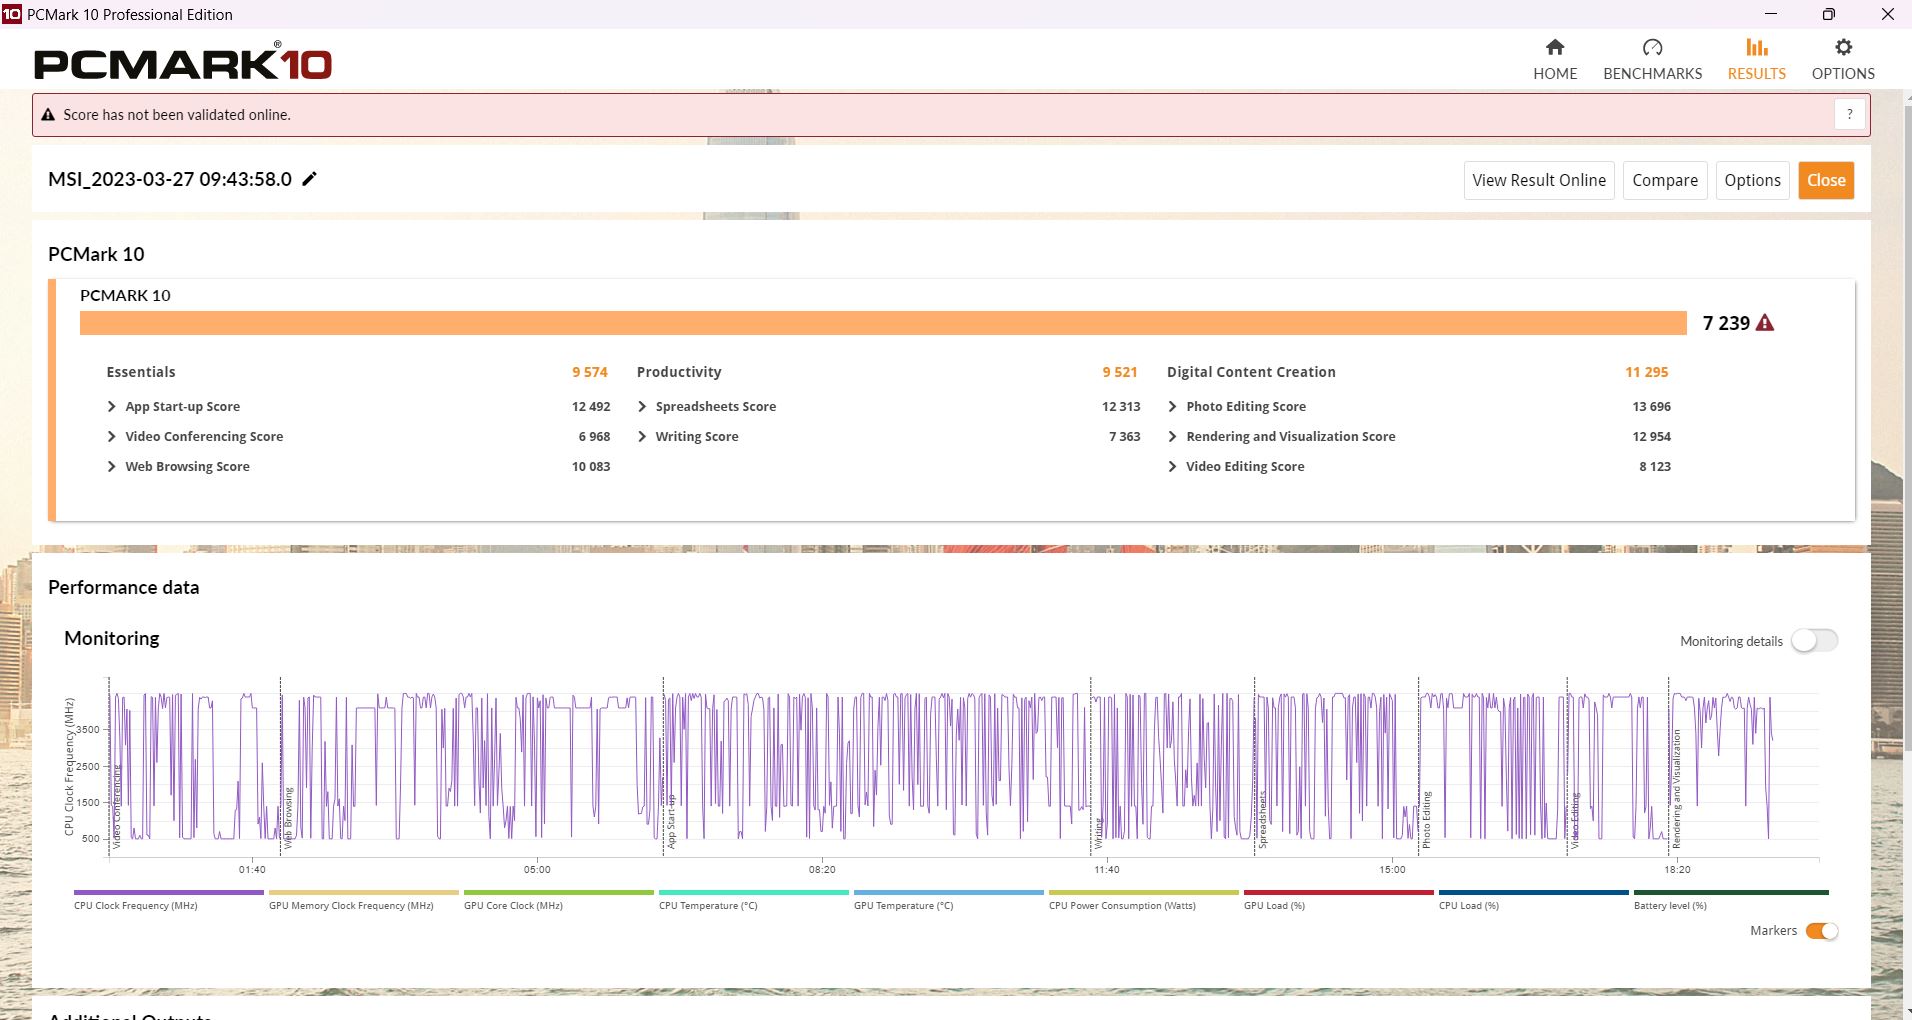
Systeemprestaties
Niet verrassend kan de Katana zich niet onderscheiden van zijn zustermodellenGF66 of GL66 in termen van systeemprestaties. In vergelijking behaalt het een nogal lagere score. De score is beter met de dGPU handmatig geactiveerd, maar niet in alle subtests.
CrossMark: Overall | Productivity | Creativity | Responsiveness
| PCMark 10 / Score | |
| Gemiddelde van klas Gaming (5828 - 12414, n=93, laatste 2 jaar) | |
| Lenovo Legion 5 15IAH7H 82RB | |
| MSI Katana GF66 12UGS | |
| Asus TUF Gaming F15 FX507ZM | |
| Schenker XMG Core 15 (M22) | |
| MSI Pulse GL66 12UEK | |
| MSI Katana 15 B12VEK | |
| Gemiddeld Intel Core i7-12650H, NVIDIA GeForce RTX 4050 Laptop GPU (n=1) | |
| PCMark 10 / Essentials | |
| Lenovo Legion 5 15IAH7H 82RB | |
| Schenker XMG Core 15 (M22) | |
| Gemiddelde van klas Gaming (8810 - 11935, n=97, laatste 2 jaar) | |
| Asus TUF Gaming F15 FX507ZM | |
| MSI Pulse GL66 12UEK | |
| MSI Katana GF66 12UGS | |
| MSI Katana 15 B12VEK | |
| Gemiddeld Intel Core i7-12650H, NVIDIA GeForce RTX 4050 Laptop GPU (n=1) | |
| PCMark 10 / Productivity | |
| Gemiddelde van klas Gaming (6845 - 25323, n=95, laatste 2 jaar) | |
| Lenovo Legion 5 15IAH7H 82RB | |
| MSI Katana GF66 12UGS | |
| MSI Pulse GL66 12UEK | |
| MSI Katana 15 B12VEK | |
| Gemiddeld Intel Core i7-12650H, NVIDIA GeForce RTX 4050 Laptop GPU (n=1) | |
| Schenker XMG Core 15 (M22) | |
| Asus TUF Gaming F15 FX507ZM | |
| PCMark 10 / Digital Content Creation | |
| Gemiddelde van klas Gaming (7602 - 19954, n=95, laatste 2 jaar) | |
| Lenovo Legion 5 15IAH7H 82RB | |
| Asus TUF Gaming F15 FX507ZM | |
| MSI Katana GF66 12UGS | |
| Schenker XMG Core 15 (M22) | |
| MSI Pulse GL66 12UEK | |
| MSI Katana 15 B12VEK | |
| Gemiddeld Intel Core i7-12650H, NVIDIA GeForce RTX 4050 Laptop GPU (n=1) | |
| CrossMark / Overall | |
| MSI Pulse GL66 12UEK | |
| Lenovo Legion 5 15IAH7H 82RB | |
| Gemiddelde van klas Gaming (1366 - 2409, n=94, laatste 2 jaar) | |
| MSI Katana GF66 12UGS | |
| MSI Katana 15 B12VEK | |
| Gemiddeld Intel Core i7-12650H, NVIDIA GeForce RTX 4050 Laptop GPU (n=1) | |
| Schenker XMG Core 15 (M22) | |
| CrossMark / Productivity | |
| MSI Pulse GL66 12UEK | |
| Lenovo Legion 5 15IAH7H 82RB | |
| MSI Katana GF66 12UGS | |
| Gemiddelde van klas Gaming (1386 - 2254, n=94, laatste 2 jaar) | |
| MSI Katana 15 B12VEK | |
| Gemiddeld Intel Core i7-12650H, NVIDIA GeForce RTX 4050 Laptop GPU (n=1) | |
| Schenker XMG Core 15 (M22) | |
| CrossMark / Creativity | |
| Gemiddelde van klas Gaming (1343 - 2786, n=94, laatste 2 jaar) | |
| MSI Pulse GL66 12UEK | |
| Lenovo Legion 5 15IAH7H 82RB | |
| MSI Katana GF66 12UGS | |
| MSI Katana 15 B12VEK | |
| Gemiddeld Intel Core i7-12650H, NVIDIA GeForce RTX 4050 Laptop GPU (n=1) | |
| Schenker XMG Core 15 (M22) | |
| CrossMark / Responsiveness | |
| MSI Pulse GL66 12UEK | |
| Lenovo Legion 5 15IAH7H 82RB | |
| MSI Katana GF66 12UGS | |
| Gemiddelde van klas Gaming (1226 - 2334, n=94, laatste 2 jaar) | |
| MSI Katana 15 B12VEK | |
| Gemiddeld Intel Core i7-12650H, NVIDIA GeForce RTX 4050 Laptop GPU (n=1) | |
| Schenker XMG Core 15 (M22) | |
| PCMark 10 Score | 6892 punten | |
Help | ||
| AIDA64 / Memory Copy | |
| Gemiddelde van klas Gaming (21750 - 129946, n=105, laatste 2 jaar) | |
| MSI Katana 15 B12VEK | |
| Asus TUF Gaming F15 FX507ZM | |
| Lenovo Legion 5 15IAH7H 82RB | |
| Gemiddeld Intel Core i7-12650H (43261 - 69735, n=14) | |
| Schenker XMG Core 15 (M22) | |
| MSI Katana GF66 12UGS | |
| MSI Pulse GL66 12UEK | |
| AIDA64 / Memory Read | |
| Gemiddelde van klas Gaming (22956 - 118858, n=105, laatste 2 jaar) | |
| MSI Katana 15 B12VEK | |
| Lenovo Legion 5 15IAH7H 82RB | |
| Asus TUF Gaming F15 FX507ZM | |
| Gemiddeld Intel Core i7-12650H (47313 - 67412, n=14) | |
| Schenker XMG Core 15 (M22) | |
| MSI Pulse GL66 12UEK | |
| MSI Katana GF66 12UGS | |
| AIDA64 / Memory Write | |
| Gemiddelde van klas Gaming (22297 - 135096, n=105, laatste 2 jaar) | |
| Lenovo Legion 5 15IAH7H 82RB | |
| Asus TUF Gaming F15 FX507ZM | |
| MSI Katana 15 B12VEK | |
| Schenker XMG Core 15 (M22) | |
| Gemiddeld Intel Core i7-12650H (45617 - 59361, n=14) | |
| MSI Katana GF66 12UGS | |
| MSI Pulse GL66 12UEK | |
| AIDA64 / Memory Latency | |
| Gemiddelde van klas Gaming (75.3 - 259, n=105, laatste 2 jaar) | |
| Lenovo Legion 5 15IAH7H 82RB | |
| MSI Katana GF66 12UGS | |
| MSI Katana 15 B12VEK | |
| MSI Pulse GL66 12UEK | |
| Schenker XMG Core 15 (M22) | |
| Gemiddeld Intel Core i7-12650H (71.6 - 103.9, n=14) | |
| Asus TUF Gaming F15 FX507ZM | |
* ... kleiner is beter
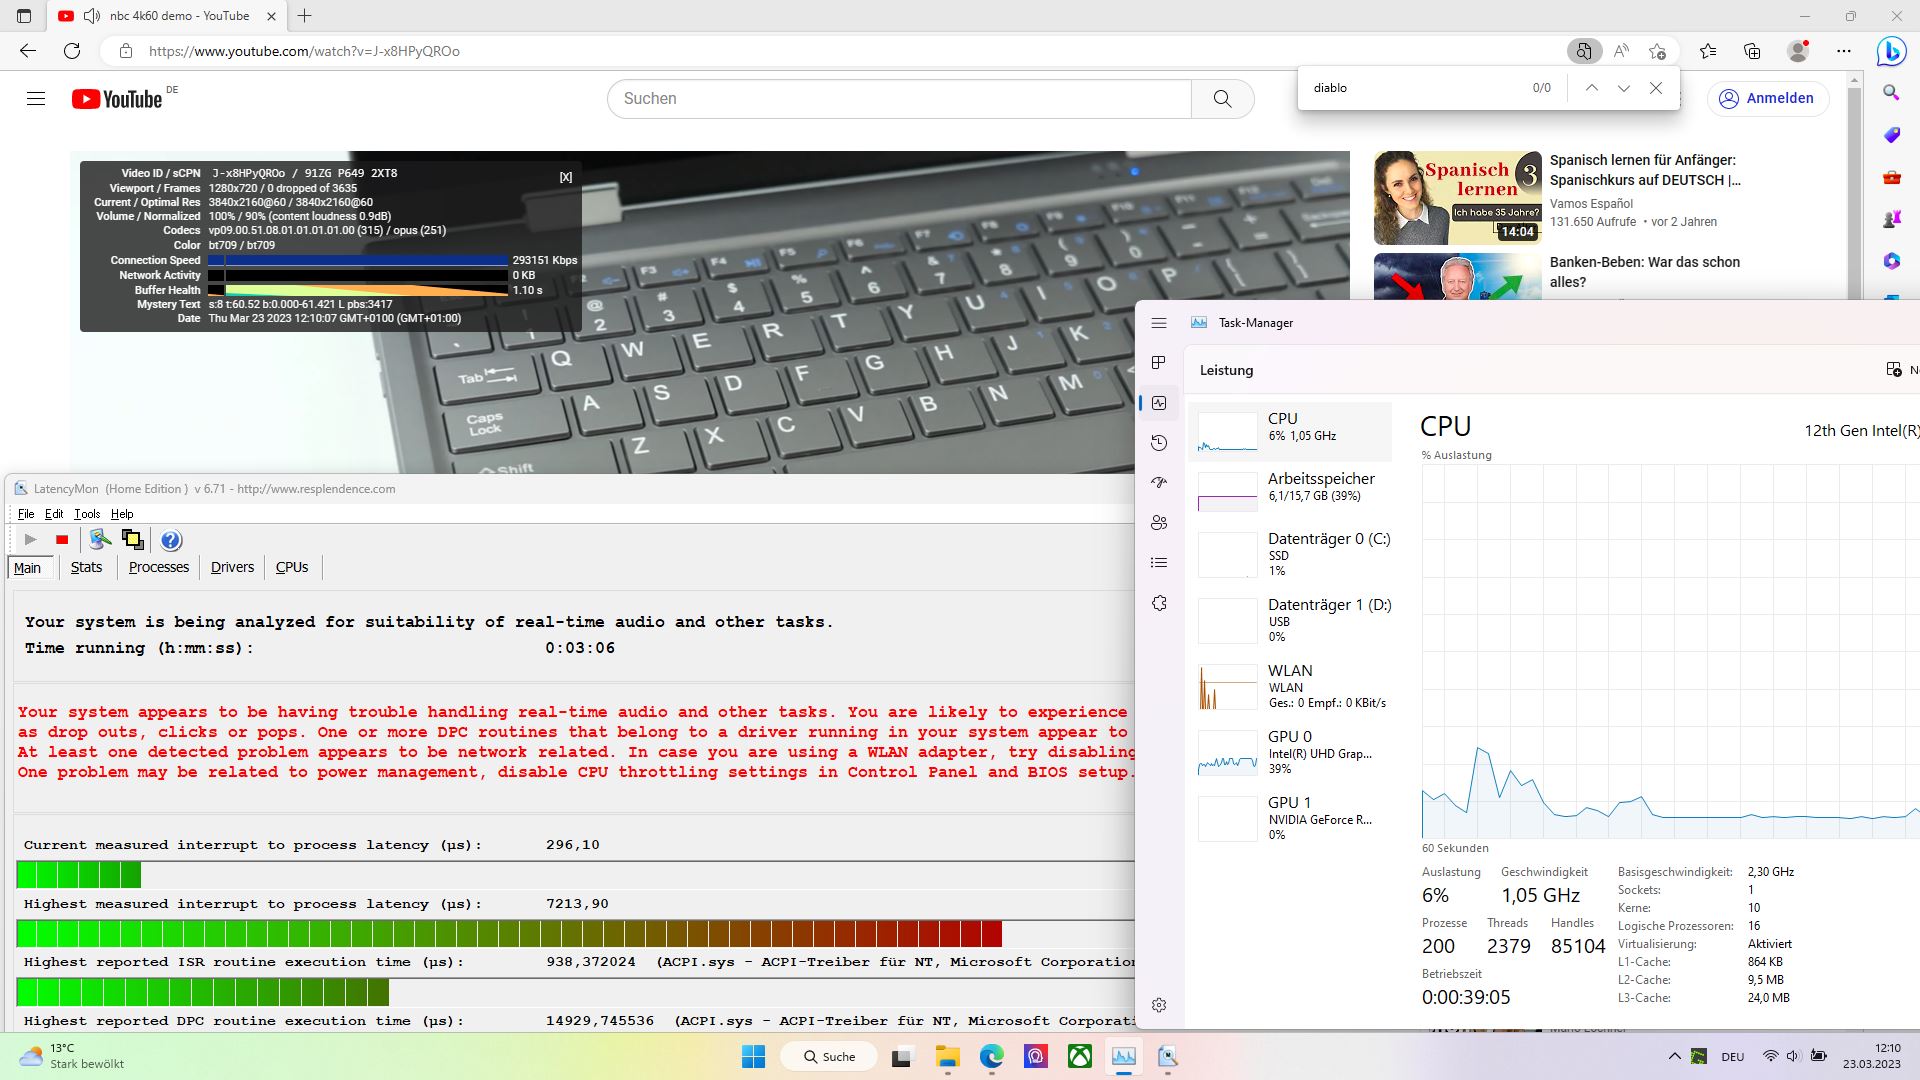
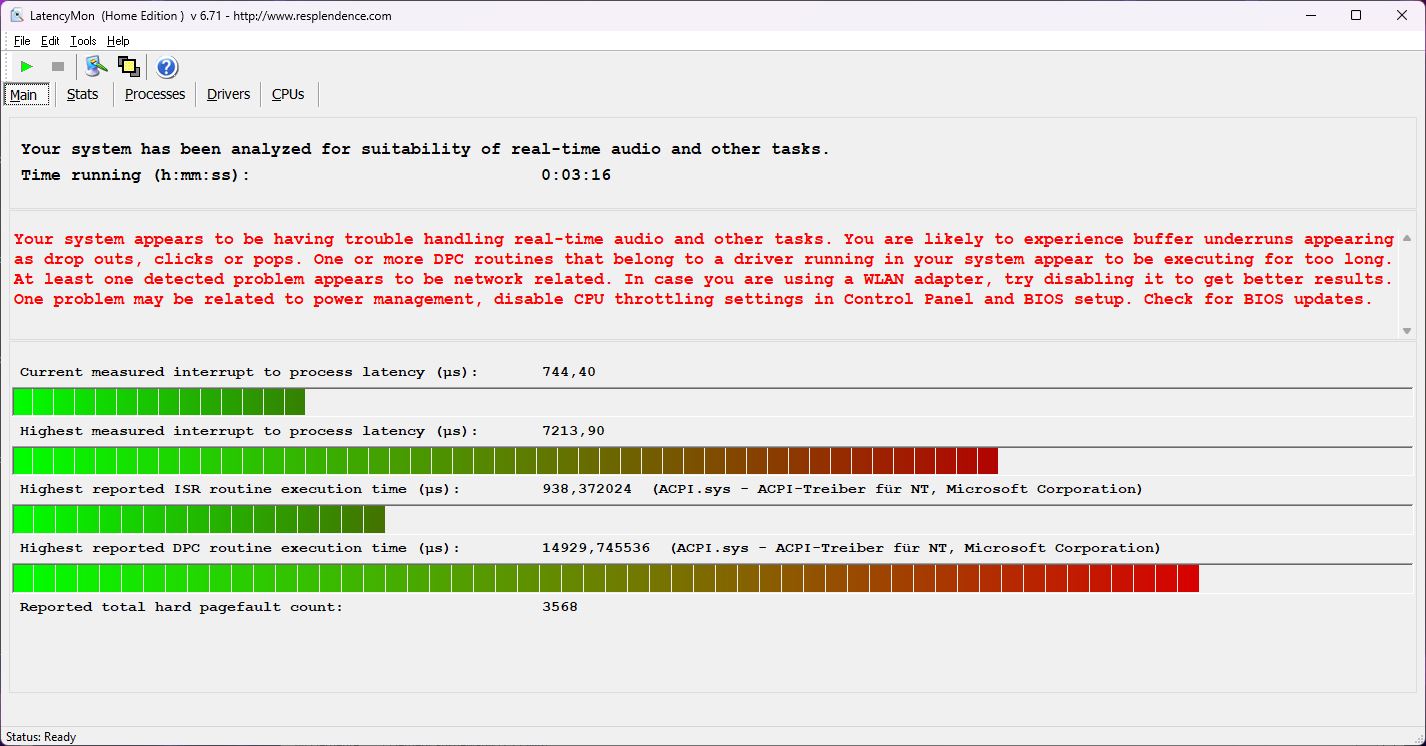
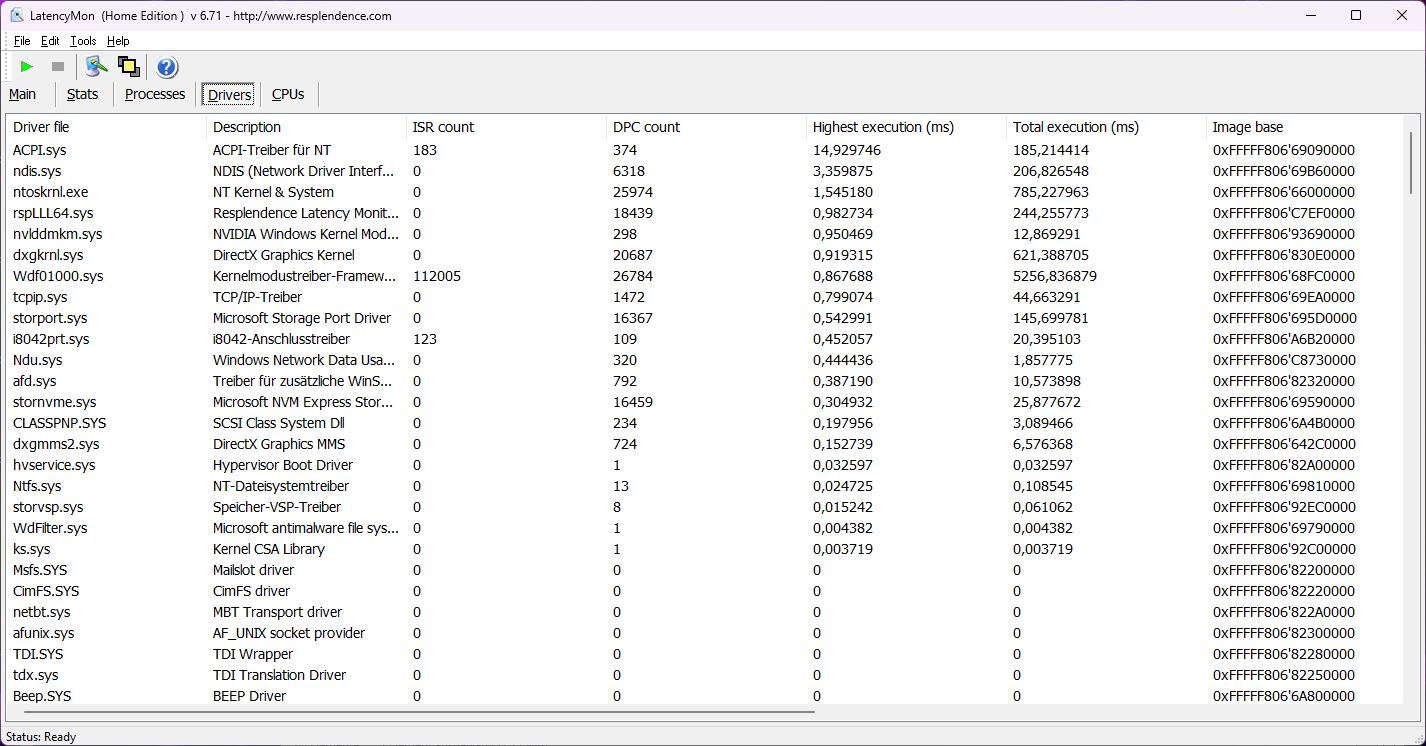
DPC latentie
Momenteel hebben de Nvidia drivers voor laptops met een RTX 40xx kaart nog steeds zeer hoge latencies onder LatencyMon en onze Katana is geen uitzondering. De eerste latenties treden direct na het starten van de tool op. Het openen van verschillende browsertabbladen en het afspelen van onze 4K/60 fps YouTube-video duwt de waarde sterk omhoog. Maar er werden geen frames overgeslagen.
| DPC Latencies / LatencyMon - interrupt to process latency (max), Web, Youtube, Prime95 | |
| MSI Katana 15 B12VEK | |
| Schenker XMG Core 15 (M22) | |
| MSI Pulse GL66 12UEK | |
| Lenovo Legion 5 15IAH7H 82RB | |
| Asus TUF Gaming F15 FX507ZM | |
| MSI Katana GF66 12UGS | |
* ... kleiner is beter
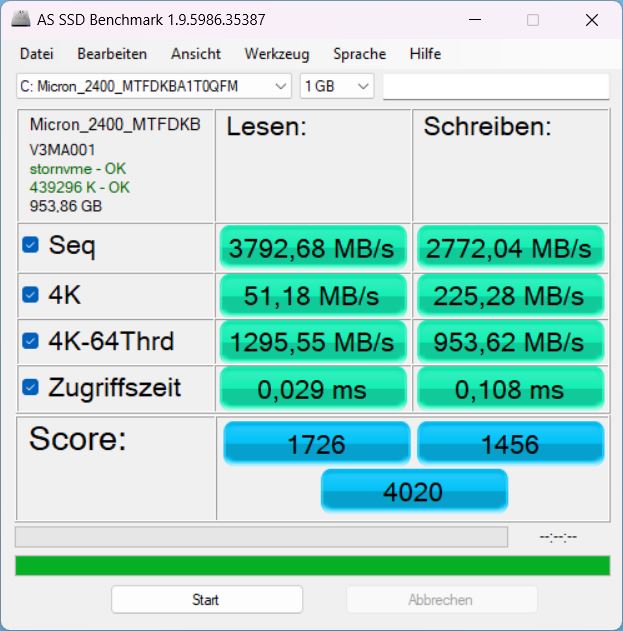
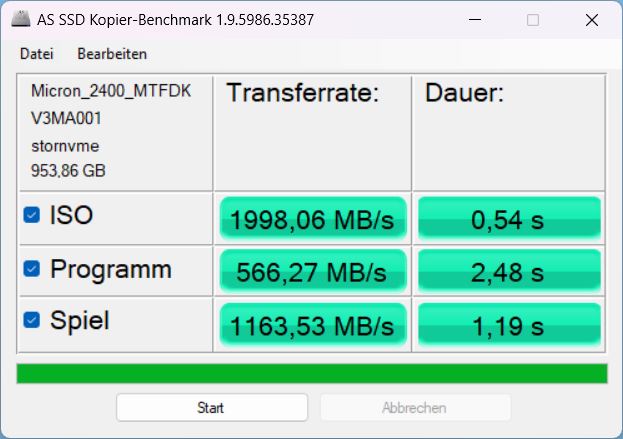
Opslagapparaten
Een 1 TB PCIe 4.0 x4 NVMe SSD van Micron dient als belangrijkste opslagapparaat. In de Katana wordt het prestatiepotentieel niet volledig benut en blijft het ver achter bij de 2450 modellen van Micron in deKatana GF66 of de Pulse GL66.
De prestaties zijn in ieder geval relatief constant en nemen slechts minimaal af na langere tijd. Meer informatie over dit model vindt u in onze SSD bestseller lijst.

* ... kleiner is beter
Sustained Read Performance: DiskSpd Read Loop, Queue Depth 8
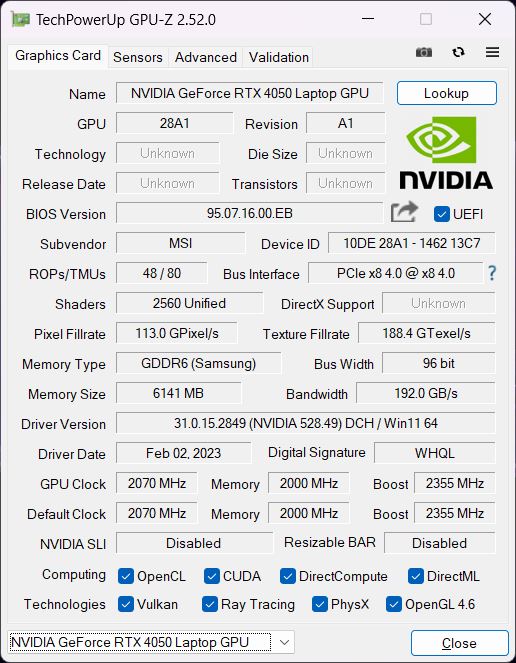
Grafische kaart
De Nvidia Geforce RTX 4050is de instapkaart van de nieuwe RTX 40xx generatie. De prestaties zouden ongeveer gelijk moeten zijn aan die van een oudere RTX 3060afhankelijk van de gekozen TGP (hier 105 W), hoewel de huidige benchmarks suggereren dat de kaart nauwelijks baat heeft bij meer dan 100 W.
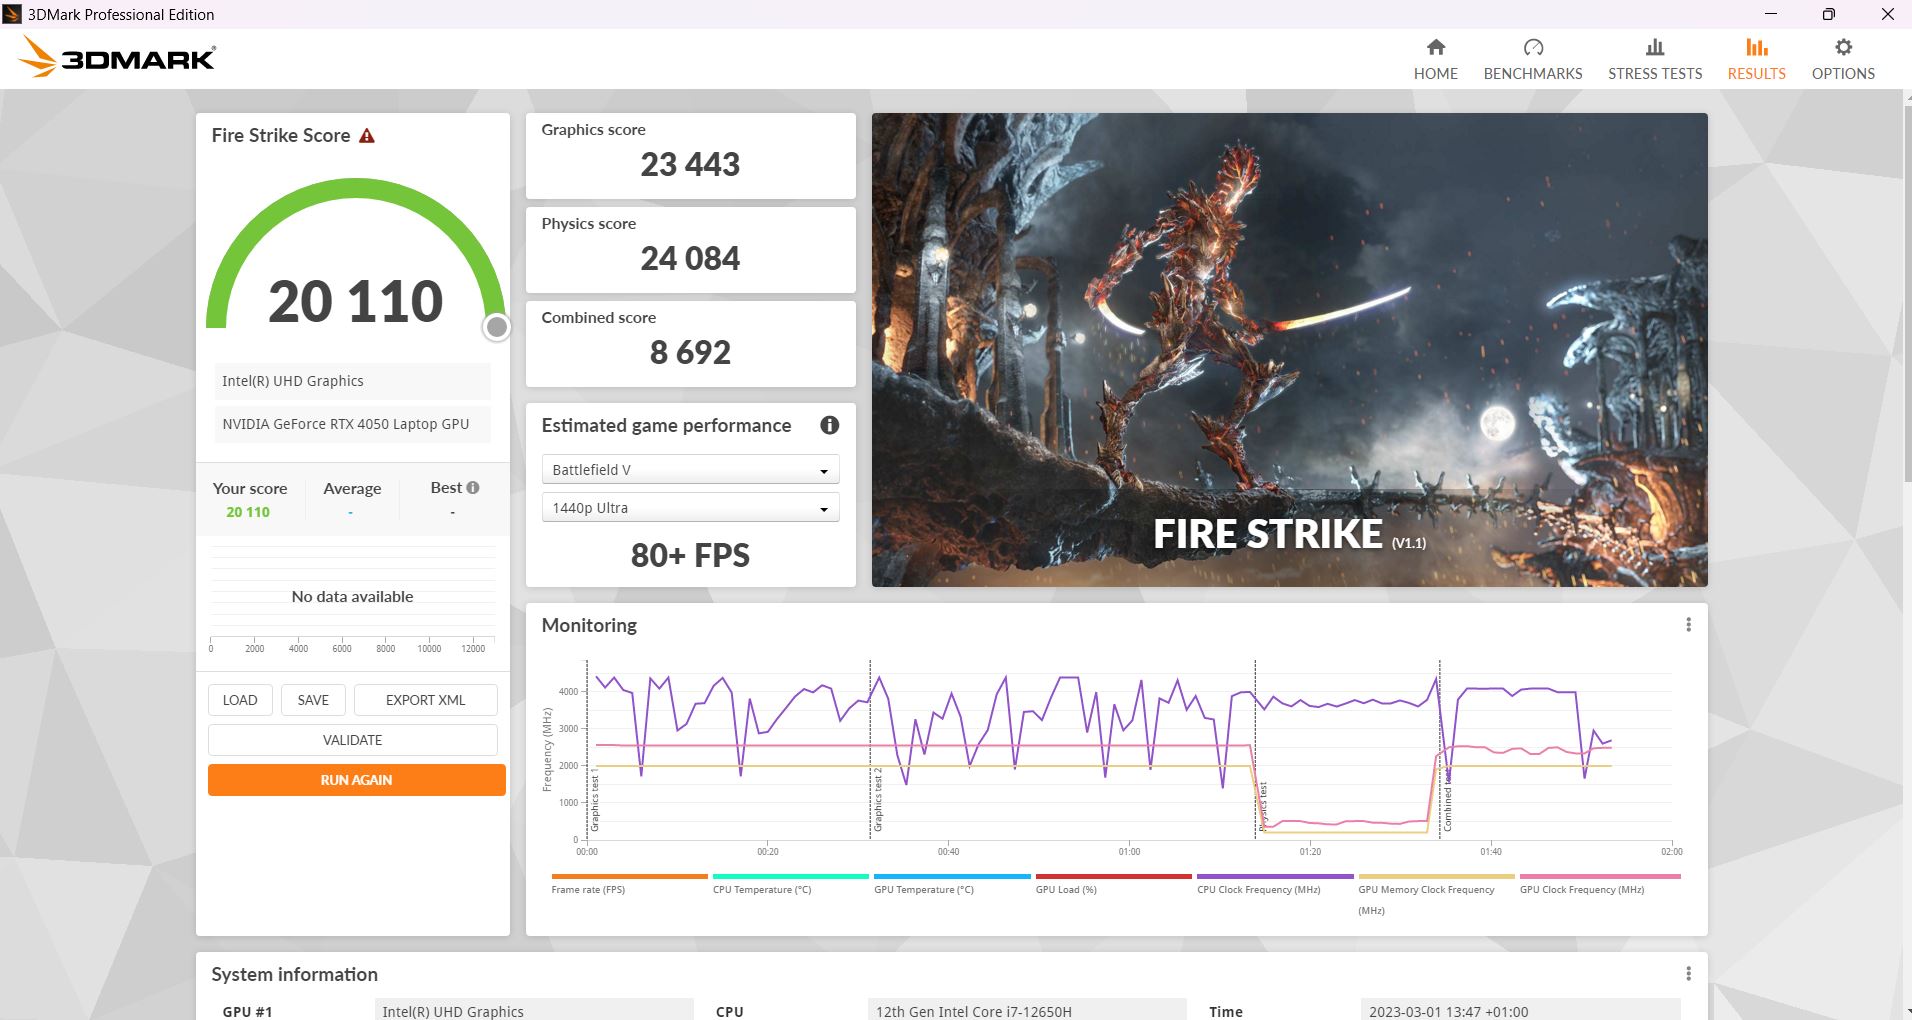
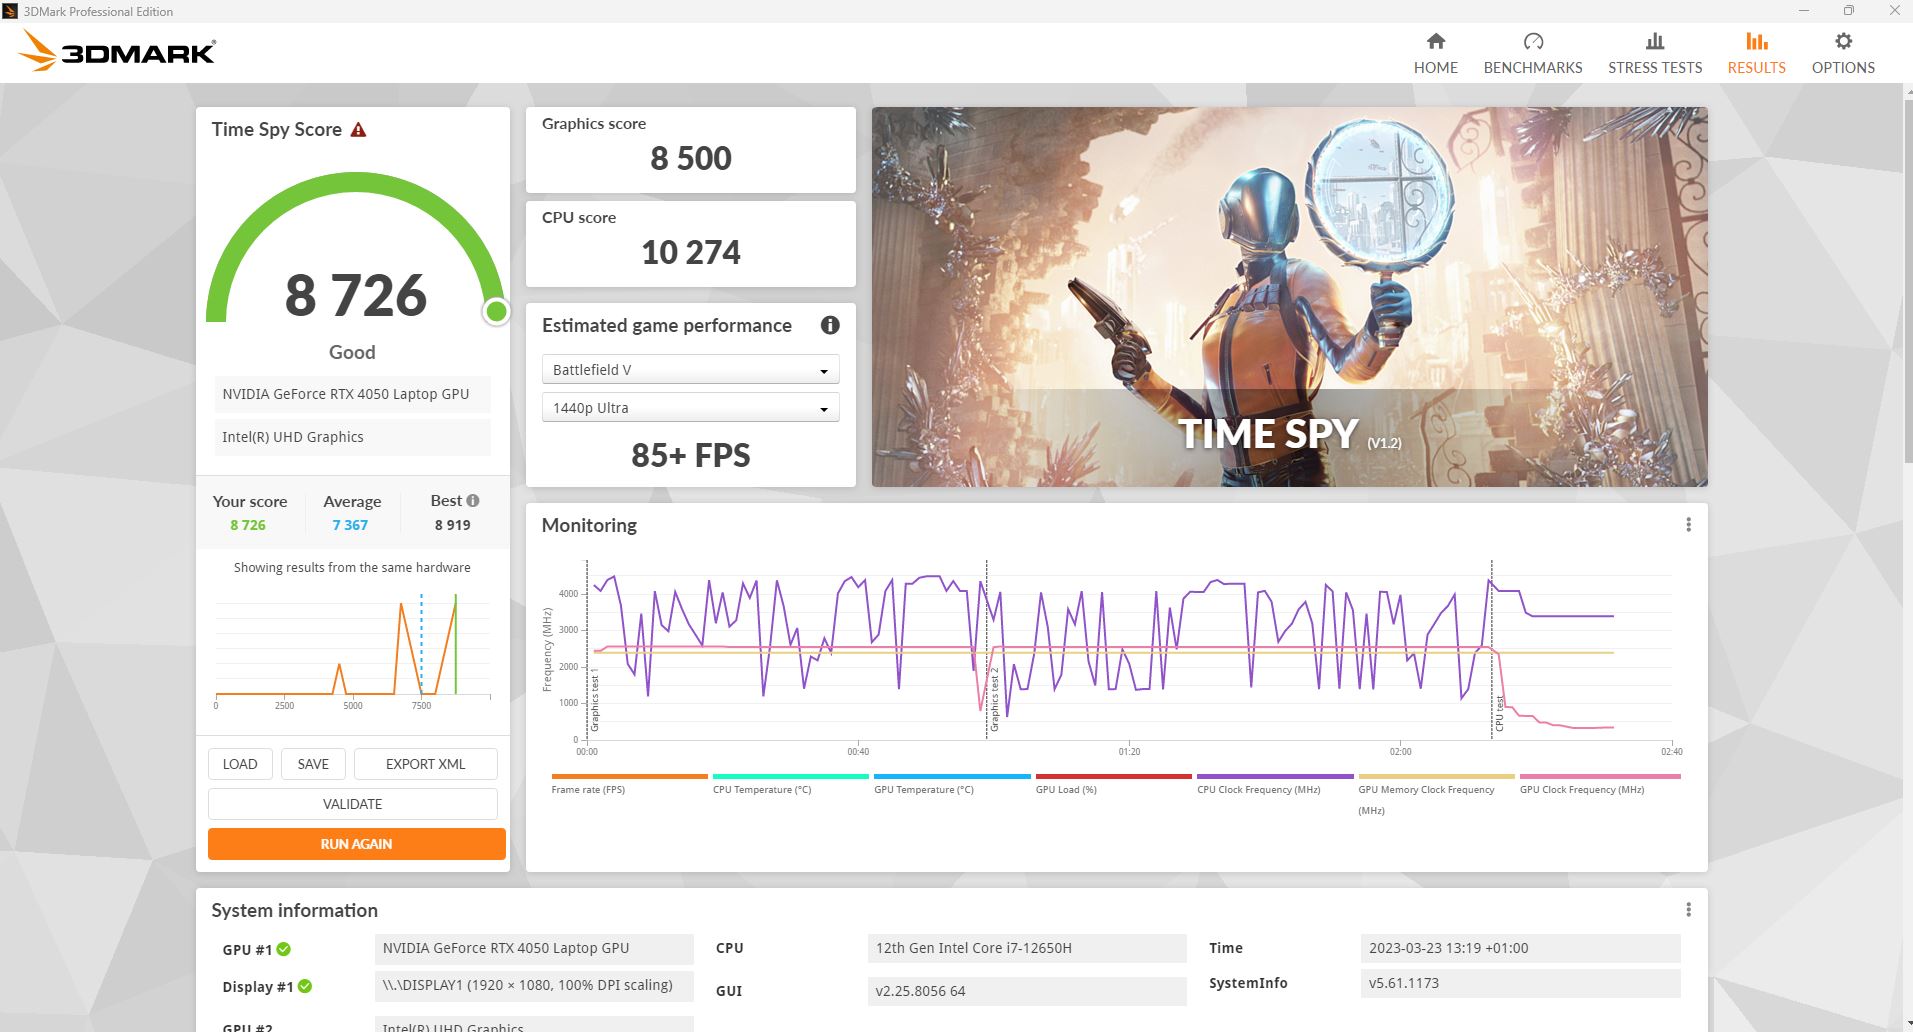
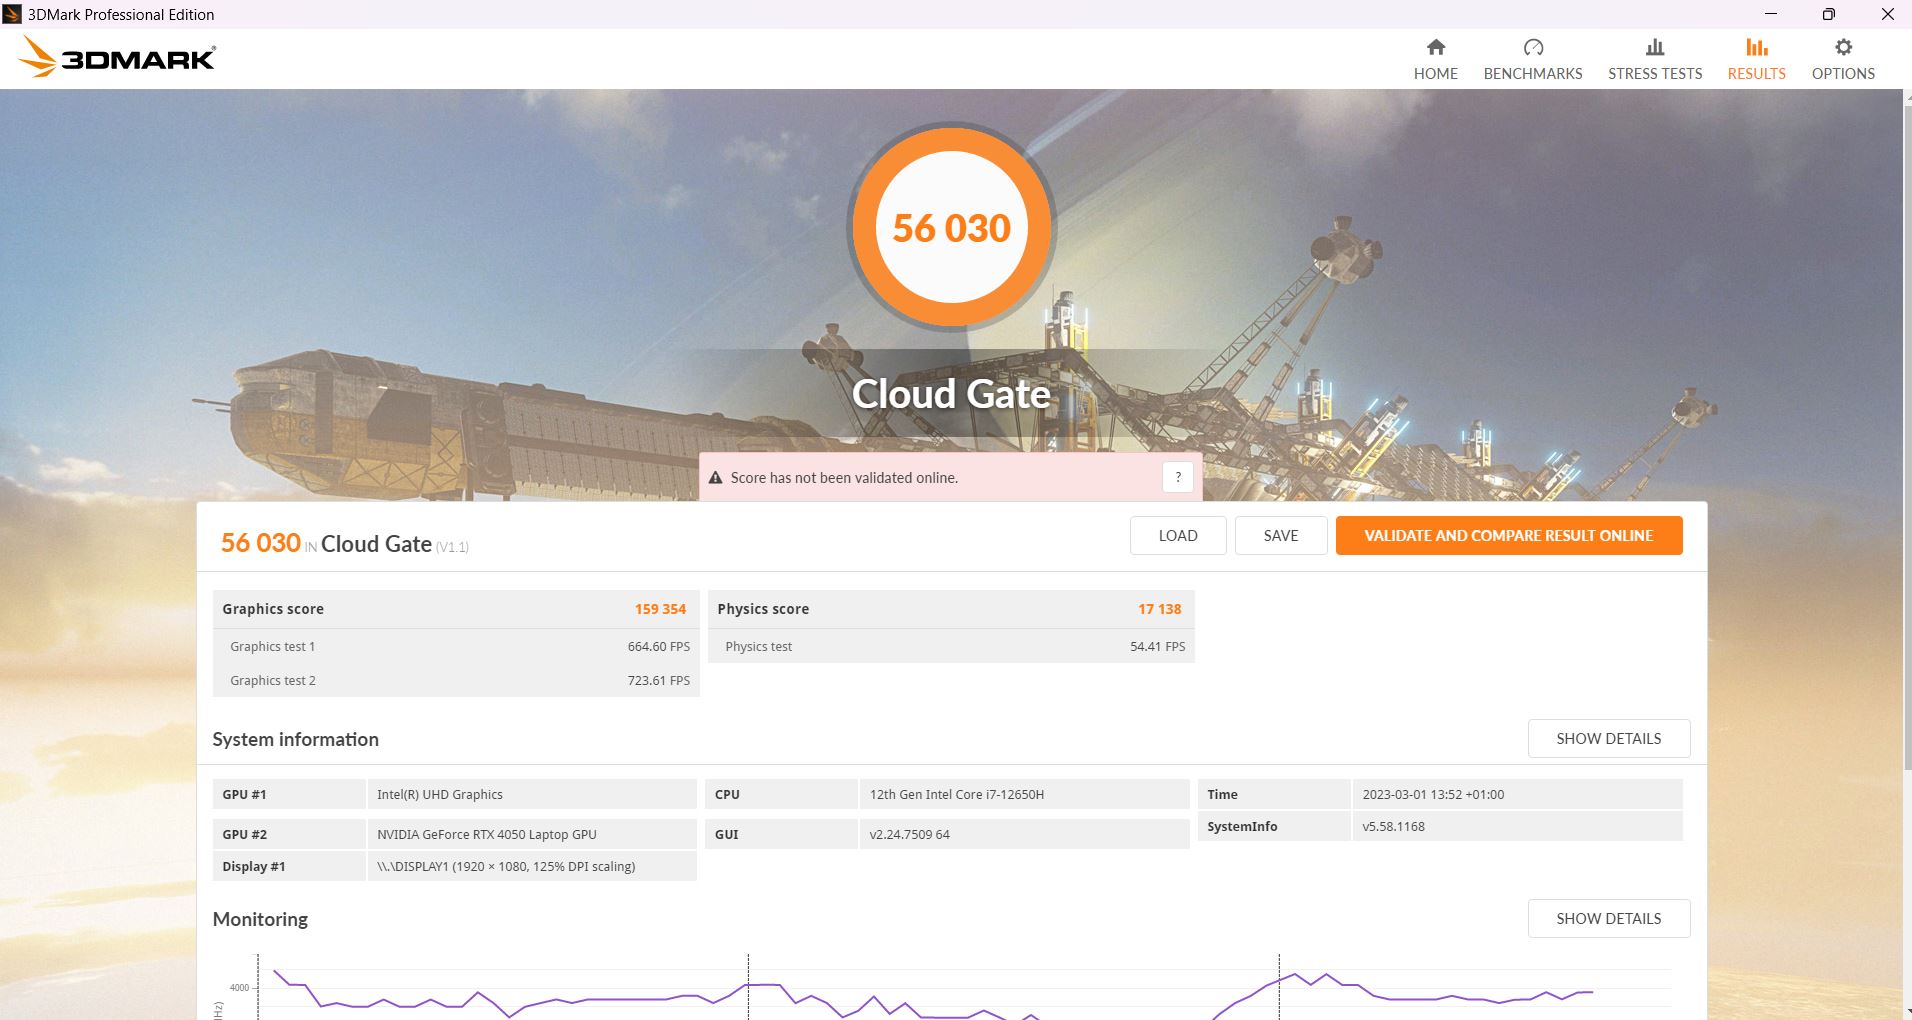
In het synthetische 3DMarks presteert de GPU behoorlijk op het verwachte niveau en ligt hij net voor op de concurrentie van vorig jaar met de RTX 3060. DeKatana GF66 met de RTX 3070 Tiligt slechts ongeveer 10 procent voor.
Weg van het stopcontact lijden de prestaties natuurlijk. In een andere Fire Strike run in batterijmodus, behaalde de Katana slechts 14.446 grafische punten in plaats van de 23.443 punten wanneer aangesloten.
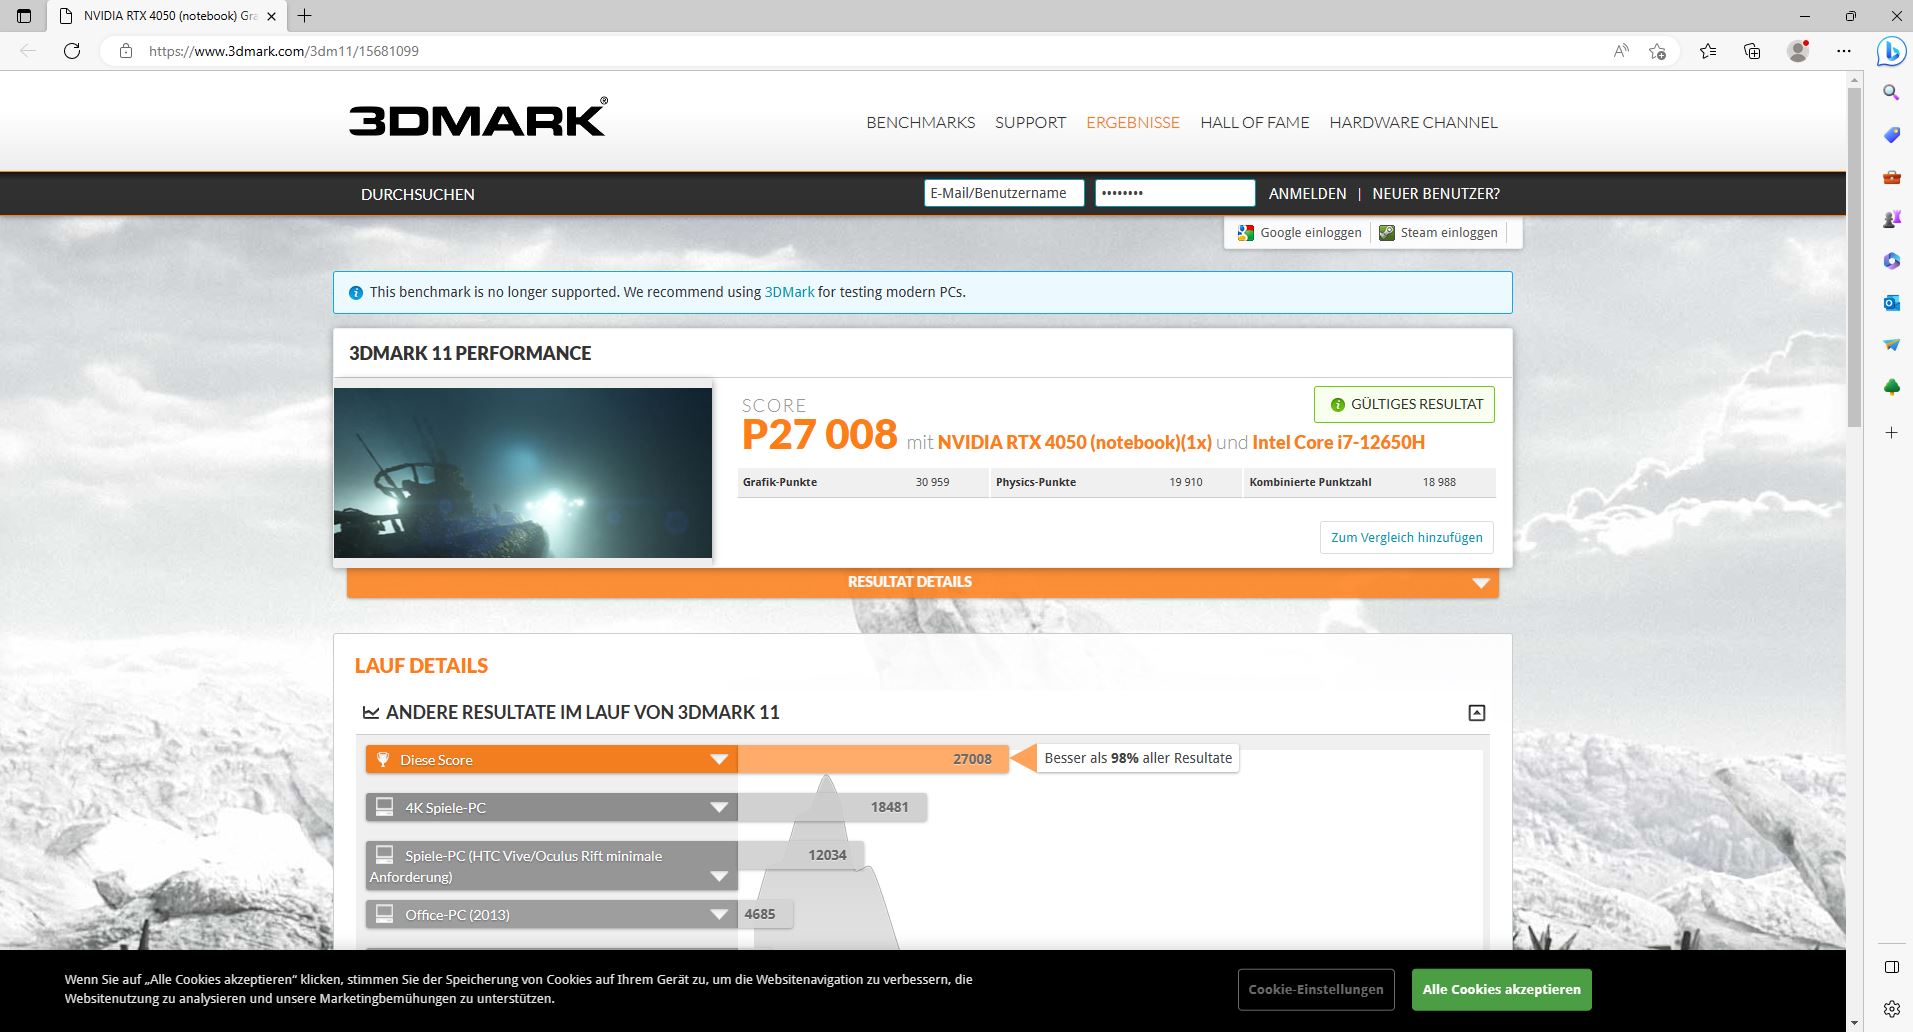
| 3DMark 11 Performance | 27008 punten | |
| 3DMark Cloud Gate Standard Score | 56030 punten | |
| 3DMark Fire Strike Score | 20110 punten | |
| 3DMark Time Spy Score | 8726 punten | |
Help | ||
* ... kleiner is beter
Spelprestaties
In de gaming benchmarks neigt de Katana 15 naar een lagere rang in vergelijking met de directe concurrentie. Alleen deXMG Core 15 met zijn RTX 3060is iets langzamer, terwijl de Pulse GL66 met een RTX 3060 ongeveer even snel is. De Legion 5 in het bijzonder, ook met een RTX 3060, is merkbaar sneller.
In Far Cry 5 daarentegen ligt de Katana zelfs iets voor op de concurrentie. Het hangt dus ook erg af van de game die je speelt.
| The Witcher 3 - 1920x1080 Ultra Graphics & Postprocessing (HBAO+) | |
| Gemiddelde van klas Gaming (104.7 - 240, n=7, laatste 2 jaar) | |
| MSI Katana GF66 12UGS | |
| Asus TUF Gaming F15 FX507ZM | |
| Lenovo Legion 5 15IAH7H 82RB | |
| MSI Katana 15 B12VEK | |
| Schenker XMG Core 15 (M22) | |
| MSI Pulse GL66 12UEK | |
| GTA V - 1920x1080 Highest AA:4xMSAA + FX AF:16x | |
| Gemiddelde van klas Gaming (48.3 - 186.9, n=94, laatste 2 jaar) | |
| Lenovo Legion 5 15IAH7H 82RB | |
| MSI Katana GF66 12UGS | |
| Asus TUF Gaming F15 FX507ZM | |
| Schenker XMG Core 15 (M22) | |
| MSI Katana 15 B12VEK | |
| Final Fantasy XV Benchmark - 1920x1080 High Quality | |
| Gemiddelde van klas Gaming (41 - 215, n=95, laatste 2 jaar) | |
| Lenovo Legion 5 15IAH7H 82RB | |
| Asus TUF Gaming F15 FX507ZM | |
| Schenker XMG Core 15 (M22) | |
| MSI Katana GF66 12UGS | |
| MSI Katana 15 B12VEK | |
| Strange Brigade - 1920x1080 ultra AA:ultra AF:16 | |
| Gemiddelde van klas Gaming (76.3 - 458, n=87, laatste 2 jaar) | |
| MSI Katana GF66 12UGS | |
| Lenovo Legion 5 15IAH7H 82RB | |
| Asus TUF Gaming F15 FX507ZM | |
| Schenker XMG Core 15 (M22) | |
| MSI Katana 15 B12VEK | |
| Dota 2 Reborn - 1920x1080 ultra (3/3) best looking | |
| Lenovo Legion 5 15IAH7H 82RB | |
| Gemiddelde van klas Gaming (84.8 - 248, n=107, laatste 2 jaar) | |
| Asus TUF Gaming F15 FX507ZM | |
| MSI Pulse GL66 12UEK | |
| MSI Katana 15 B12VEK | |
| MSI Katana GF66 12UGS | |
| Schenker XMG Core 15 (M22) | |
Er is een MUX-schakelaar beschikbaar, waarmee je in het MSI Center kunt kiezen tussen de iGPU of de dGPU, wat altijd een herstart inhoudt.
De Witcher 3 framerate blijft stabiel binnen de gebruikelijke schommelingen (dag/nacht cyclus in het spel). Maar concurrerende laptops zijn vaak iets sneller, zelfs die met de RTX 3060.
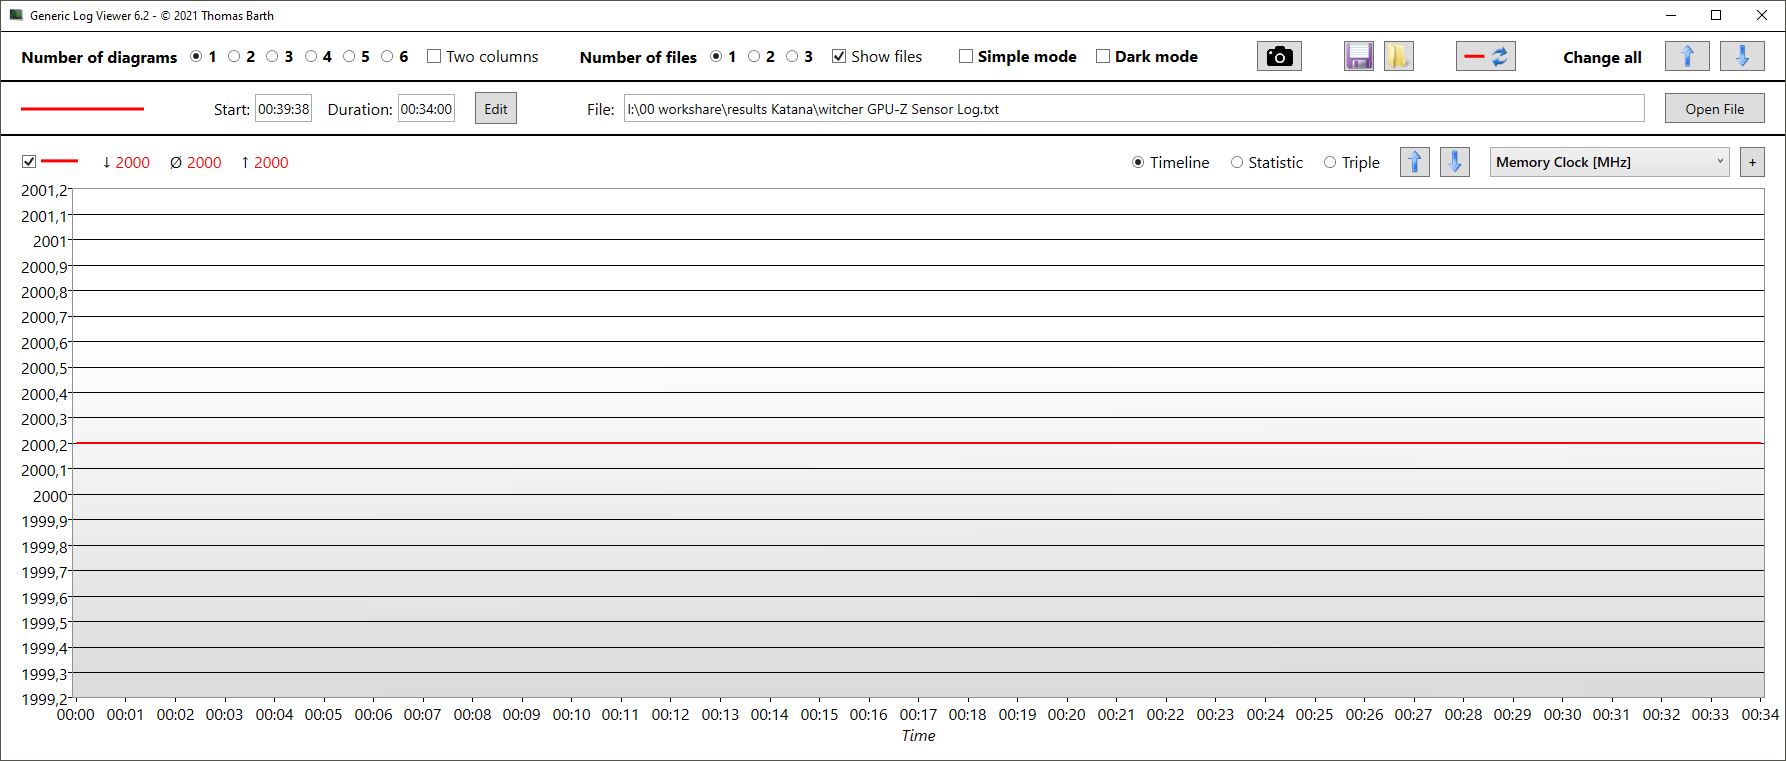
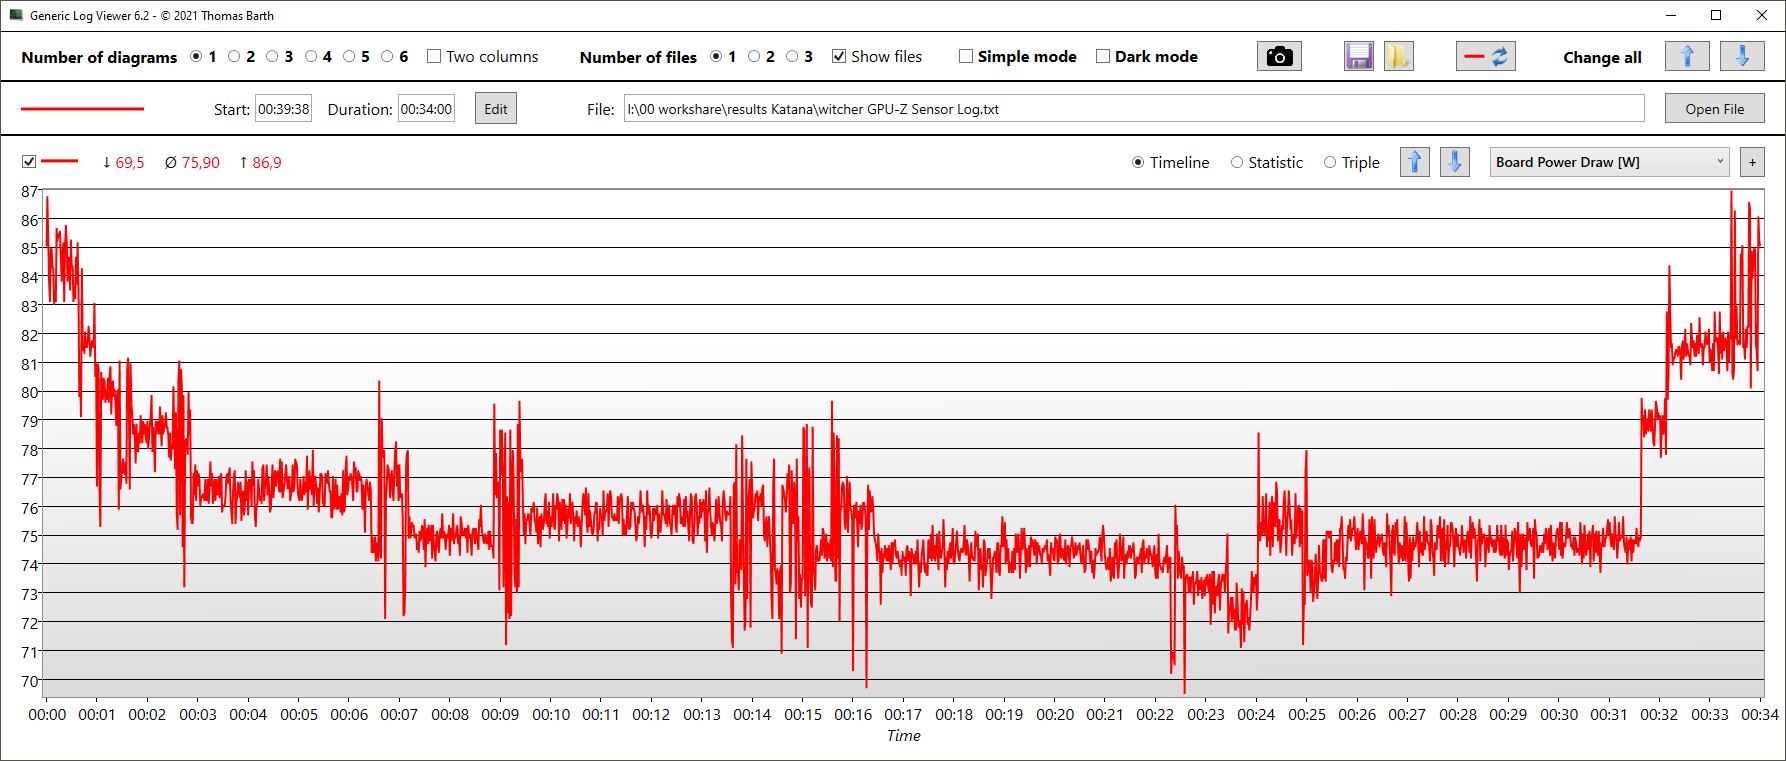
De GPU-kloksnelheid is vrij stabiel op 2,4 GHz, en de geheugenklok is ook constant op 2 GHz. De GPU-temperaturen komen niet boven de 76 °C uit en liggen gemiddeld rond de 75 °C. Het stroomverbruik van gemiddeld 76 W is ver verwijderd van de opgegeven 105 W.
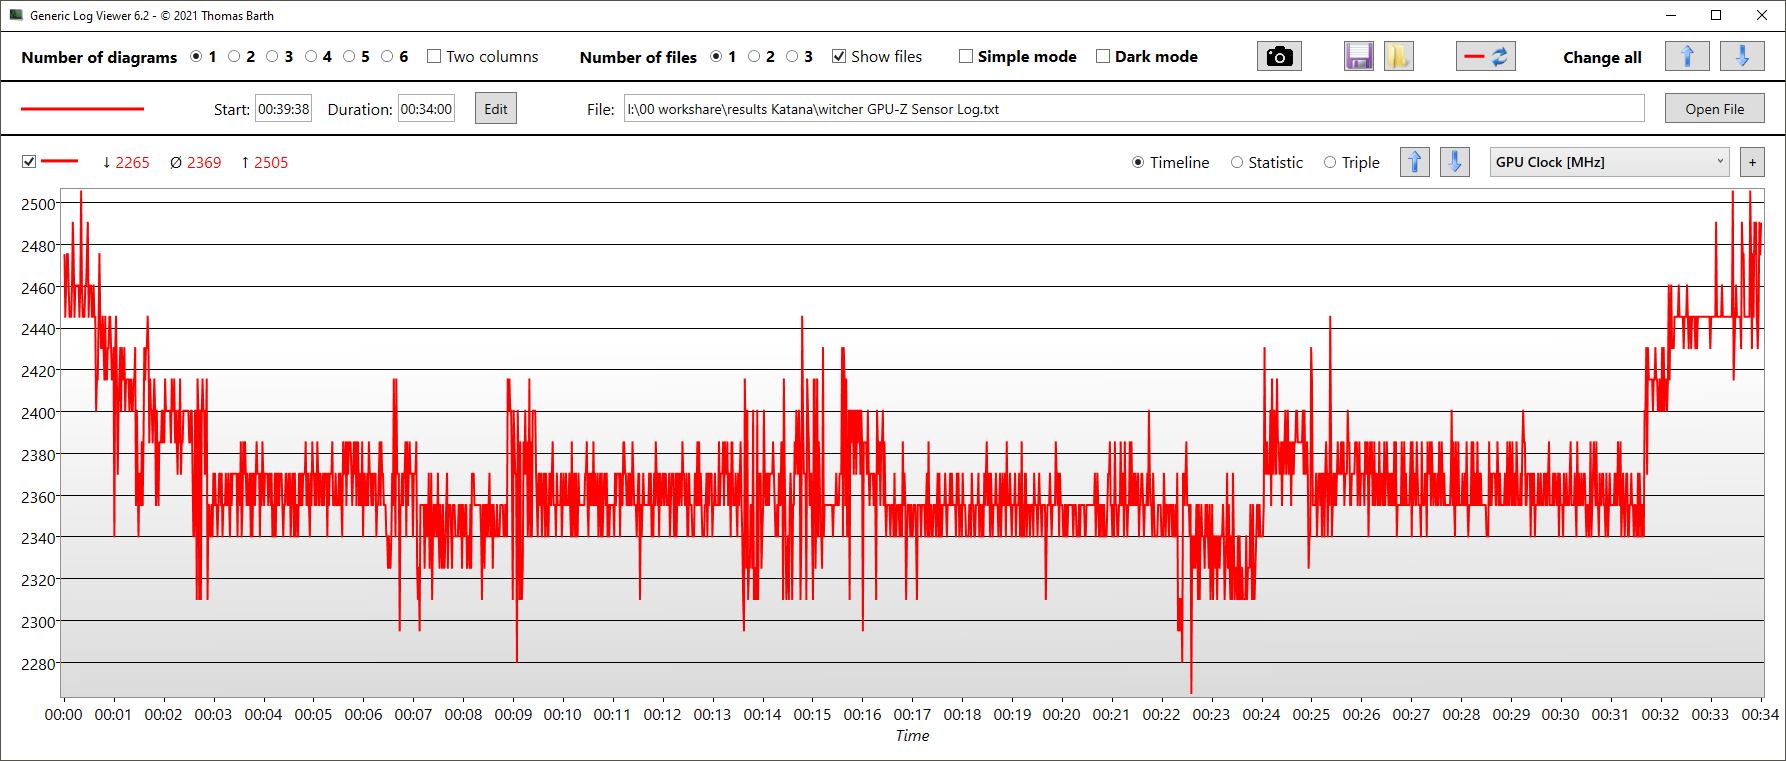
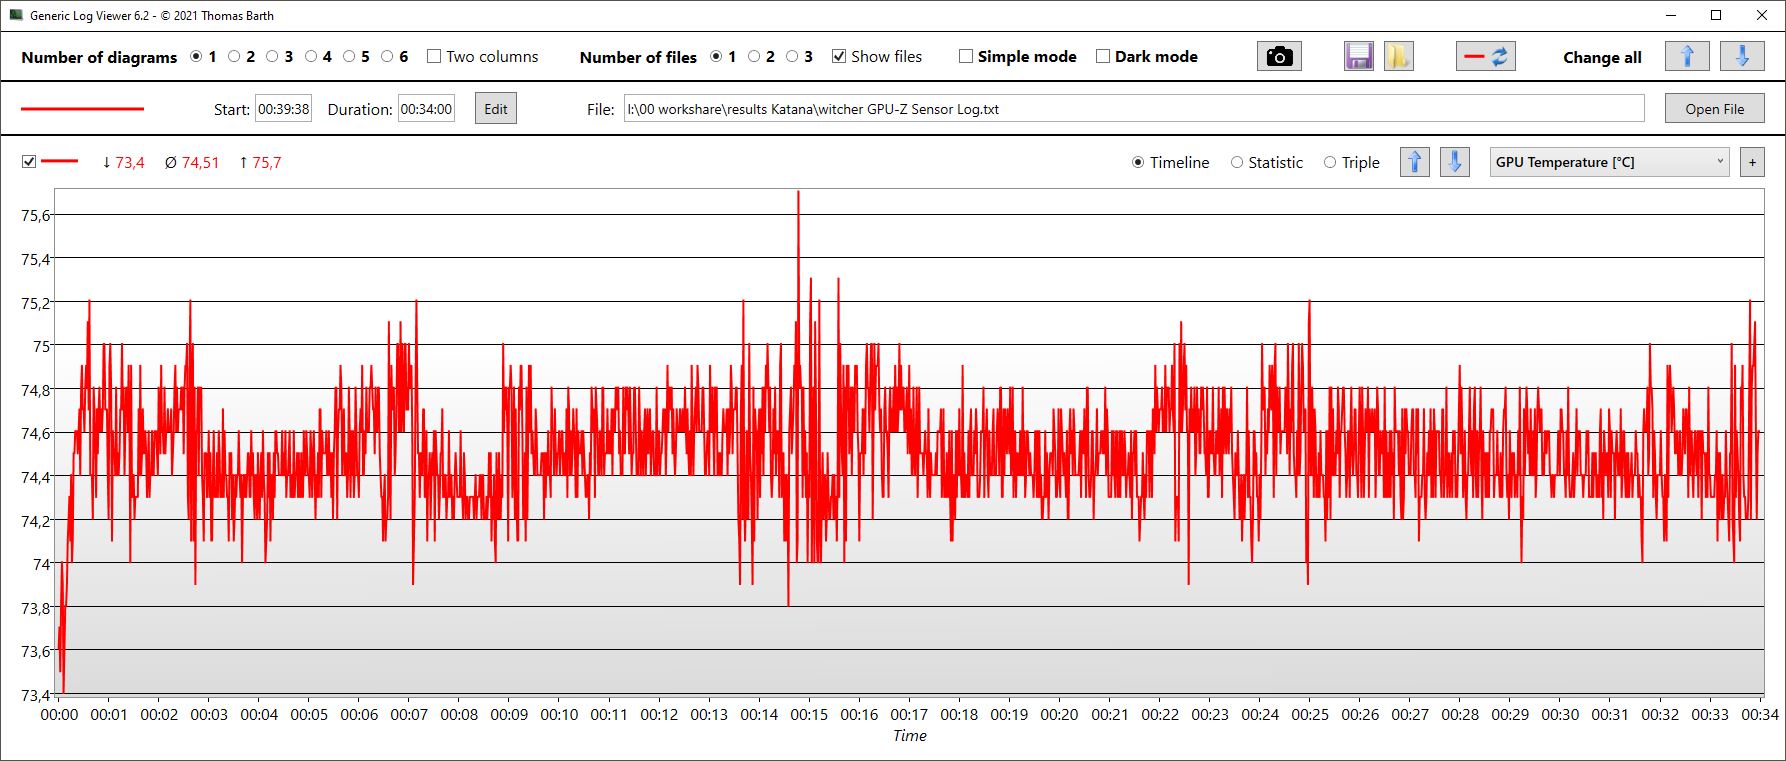
Witcher 3 FPS Chart
| lage | gem. | hoge | ultra | |
|---|---|---|---|---|
| GTA V (2015) | 183.5 | 176.6 | 172.7 | 92.2 |
| The Witcher 3 (2015) | 395 | 293 | 161 | 83 |
| Dota 2 Reborn (2015) | 175.1 | 158.1 | 150.5 | 142.5 |
| Final Fantasy XV Benchmark (2018) | 188 | 120.7 | 82.8 | |
| X-Plane 11.11 (2018) | 139.9 | 122.4 | 97 | |
| Far Cry 5 (2018) | 170 | 135 | 126 | 119 |
| Strange Brigade (2018) | 214 | 173 | 148.7 | |
| Dying Light 2 (2022) | 122.1 | 75.2 | 62.4 |
Emissies - In rust ligt de kracht van het zwaard
Lawaai
In rust op de desktop zijn de ventilatoren meestal stil, zelfs in Extreme Performance modus, wat ongebruikelijk is. En zelfs in 3DMark06 starten de ventilatoren relatief laat op en bereiken ze slechts 37,7 dB tegen het einde van het eerste benchmarkscenario. Alleen de Legion 5is stiller, de Asus TUF Gaming is even stil, terwijl de zustermodellen en de XMG Core luider zijn.
De gematigde geluidsontwikkeling is ook duidelijk bij gaming (AI-modus), en de Katana wordt alleen luid tijdens gecombineerde CPU/GPU-stress.
Geluidsniveau
| Onbelast |
| 24 / 24 / 24 dB (A) |
| Belasting |
| 37.71 / 54.55 dB (A) |
 | ||
30 dB stil 40 dB(A) hoorbaar 50 dB(A) luid |
||
min: | ||
| MSI Katana 15 B12VEK GeForce RTX 4050 Laptop GPU, i7-12650H, Micron 2400 MTFDKBA1T0QFM | MSI Katana GF66 12UGS GeForce RTX 3070 Ti Laptop GPU, i7-12700H, Micron 2450 1TB MTFDKBA1T0TFK | MSI Pulse GL66 12UEK GeForce RTX 3060 Laptop GPU, i9-12900H, Micron 2450 512GB MTFDKBA512TFK | Lenovo Legion 5 15IAH7H 82RB GeForce RTX 3060 Laptop GPU, i7-12700H | Asus TUF Gaming F15 FX507ZM GeForce RTX 3060 Laptop GPU, i7-12700H, SK Hynix HFM001TD3JX013N | Schenker XMG Core 15 (M22) GeForce RTX 3060 Laptop GPU, R7 6800H, Samsung SSD 980 Pro 1TB MZ-V8P1T0BW | |
|---|---|---|---|---|---|---|
| Noise | -9% | -11% | 1% | -3% | -2% | |
| uit / omgeving * (dB) | 24 | 26 -8% | 23 4% | 23.3 3% | 23.2 3% | 23 4% |
| Idle Minimum * (dB) | 24 | 27 -13% | 23 4% | 23.5 2% | 23.6 2% | 23 4% |
| Idle Average * (dB) | 24 | 28 -17% | 27 -13% | 23.5 2% | 23.6 2% | 23 4% |
| Idle Maximum * (dB) | 24 | 31 -29% | 27 -13% | 26.8 -12% | 25.4 -6% | 23 4% |
| Load Average * (dB) | 37.71 | 44 -17% | 48.2 -28% | 29.3 22% | 38 -1% | 42.41 -12% |
| Witcher 3 ultra * (dB) | 45.75 | 44 4% | 56.9 -24% | 51.4 -12% | 54.1 -18% | 54.71 -20% |
| Load Maximum * (dB) | 54.55 | 45 18% | 56.94 -4% | 53 3% | 57.2 -5% | 55.05 -1% |
* ... kleiner is beter
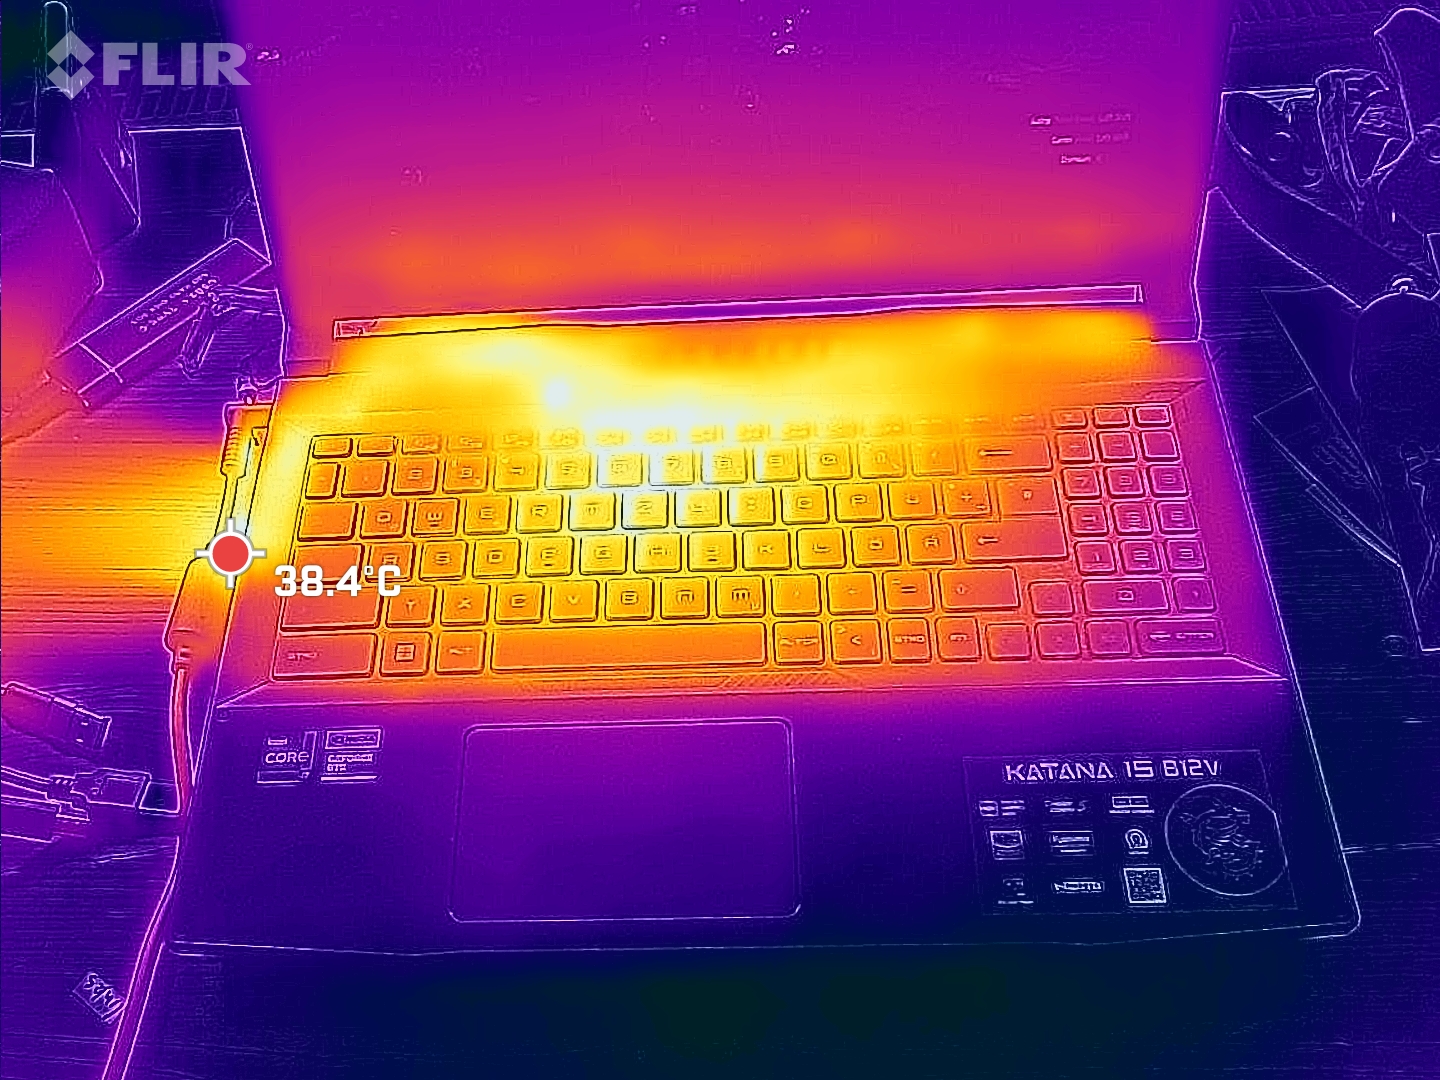
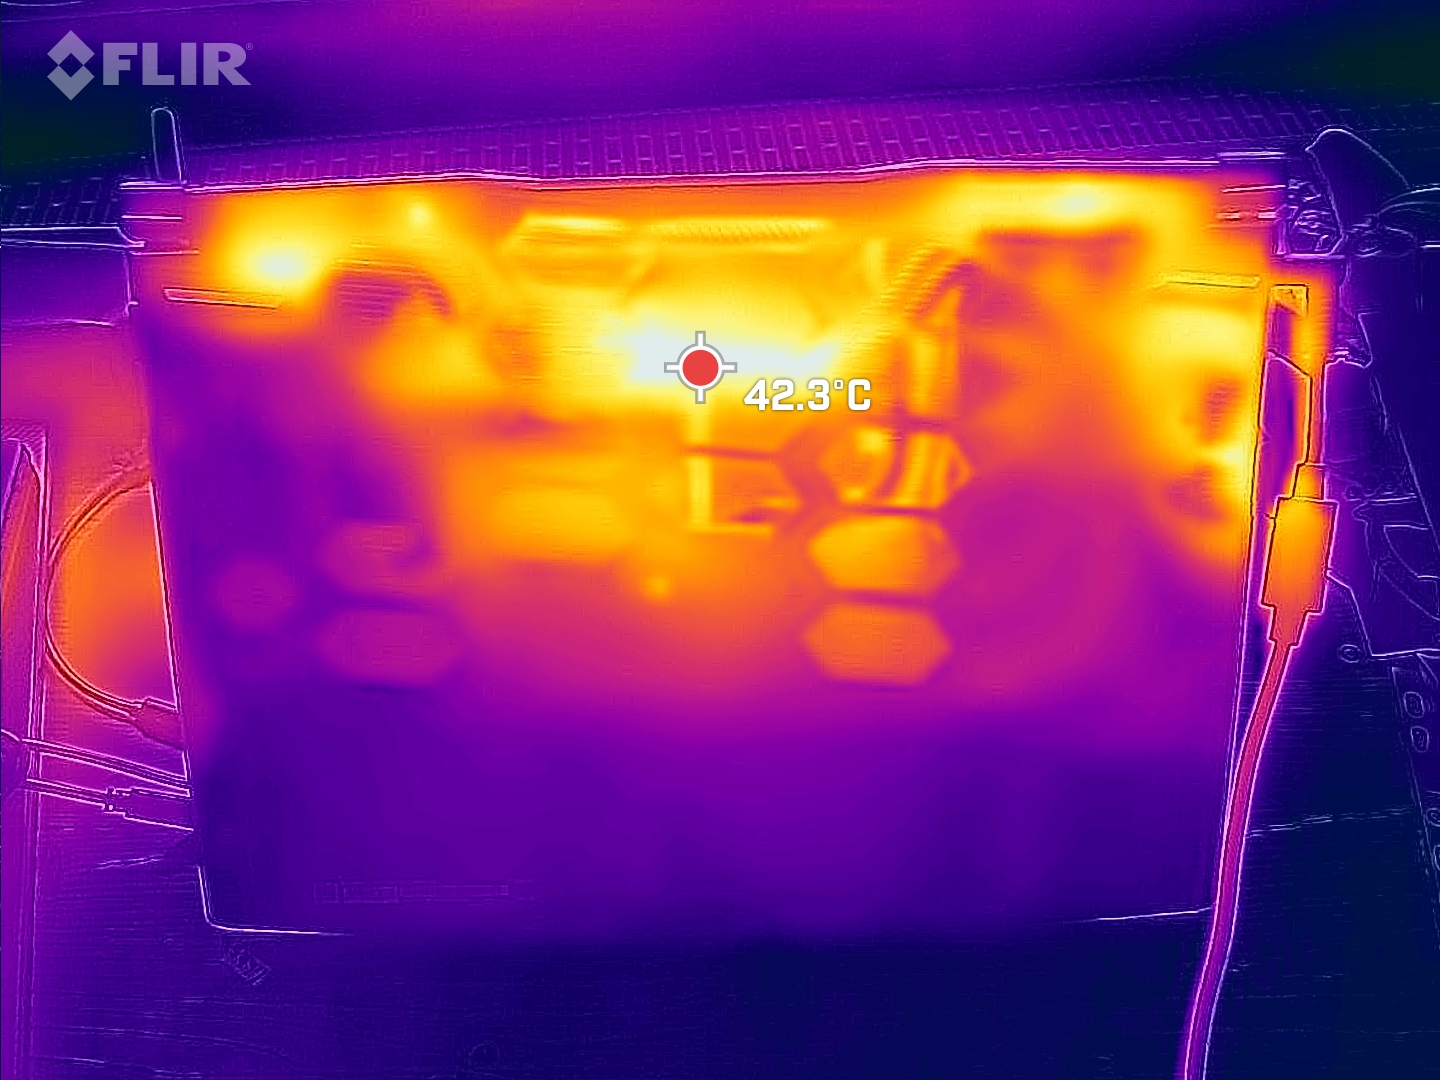
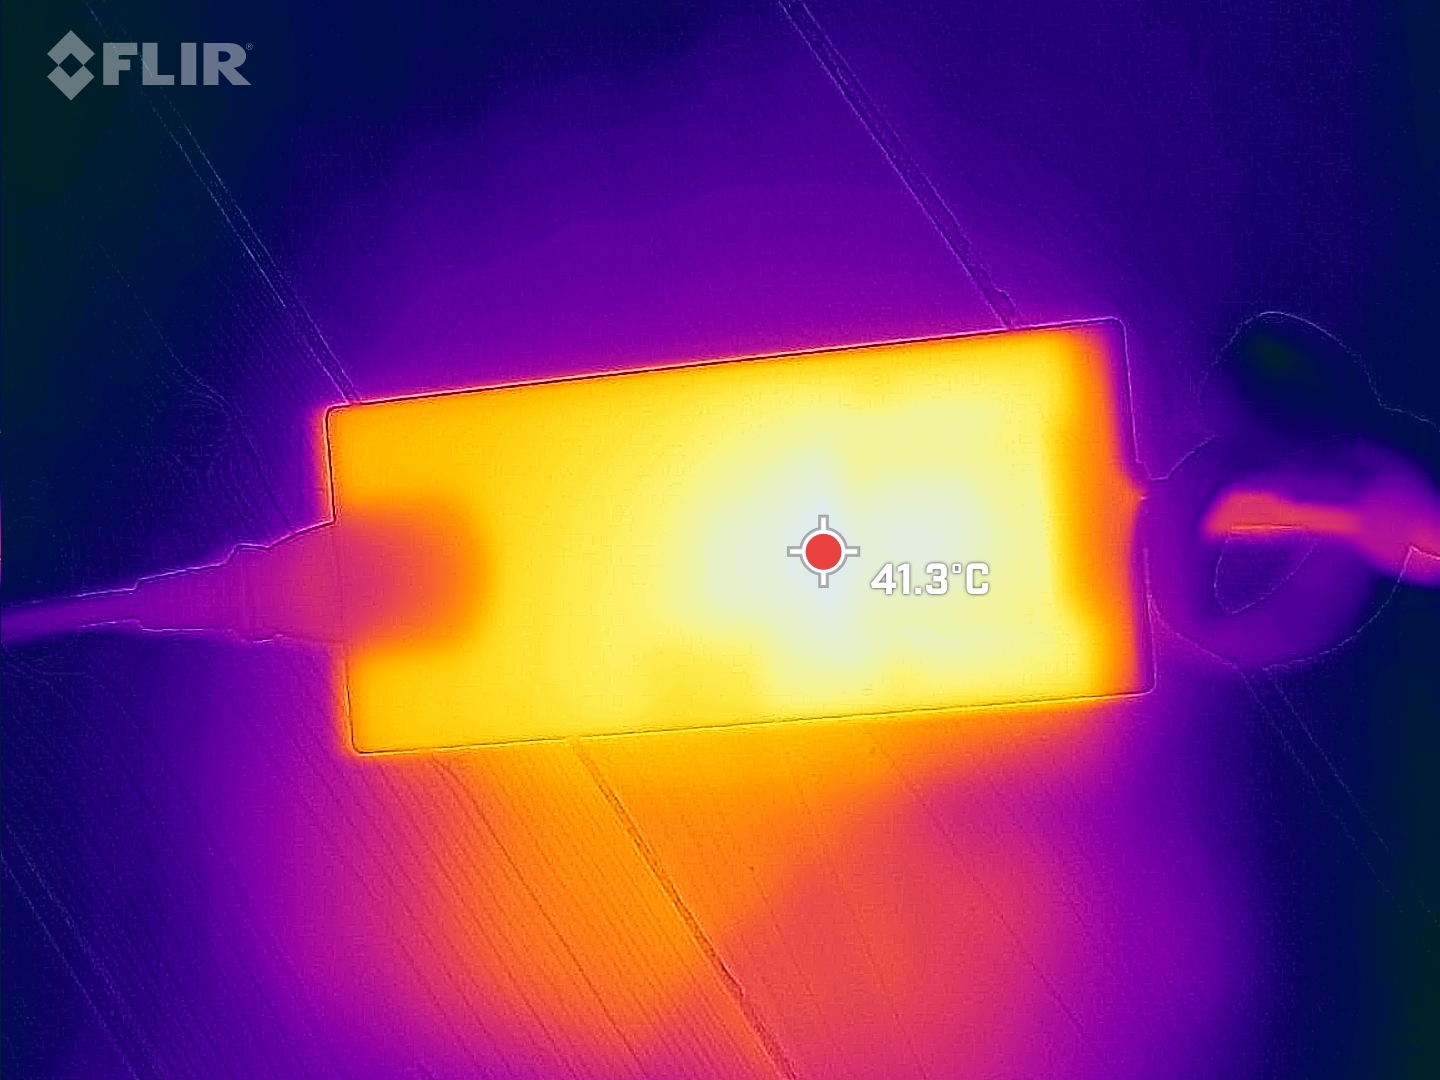
Temperatuur
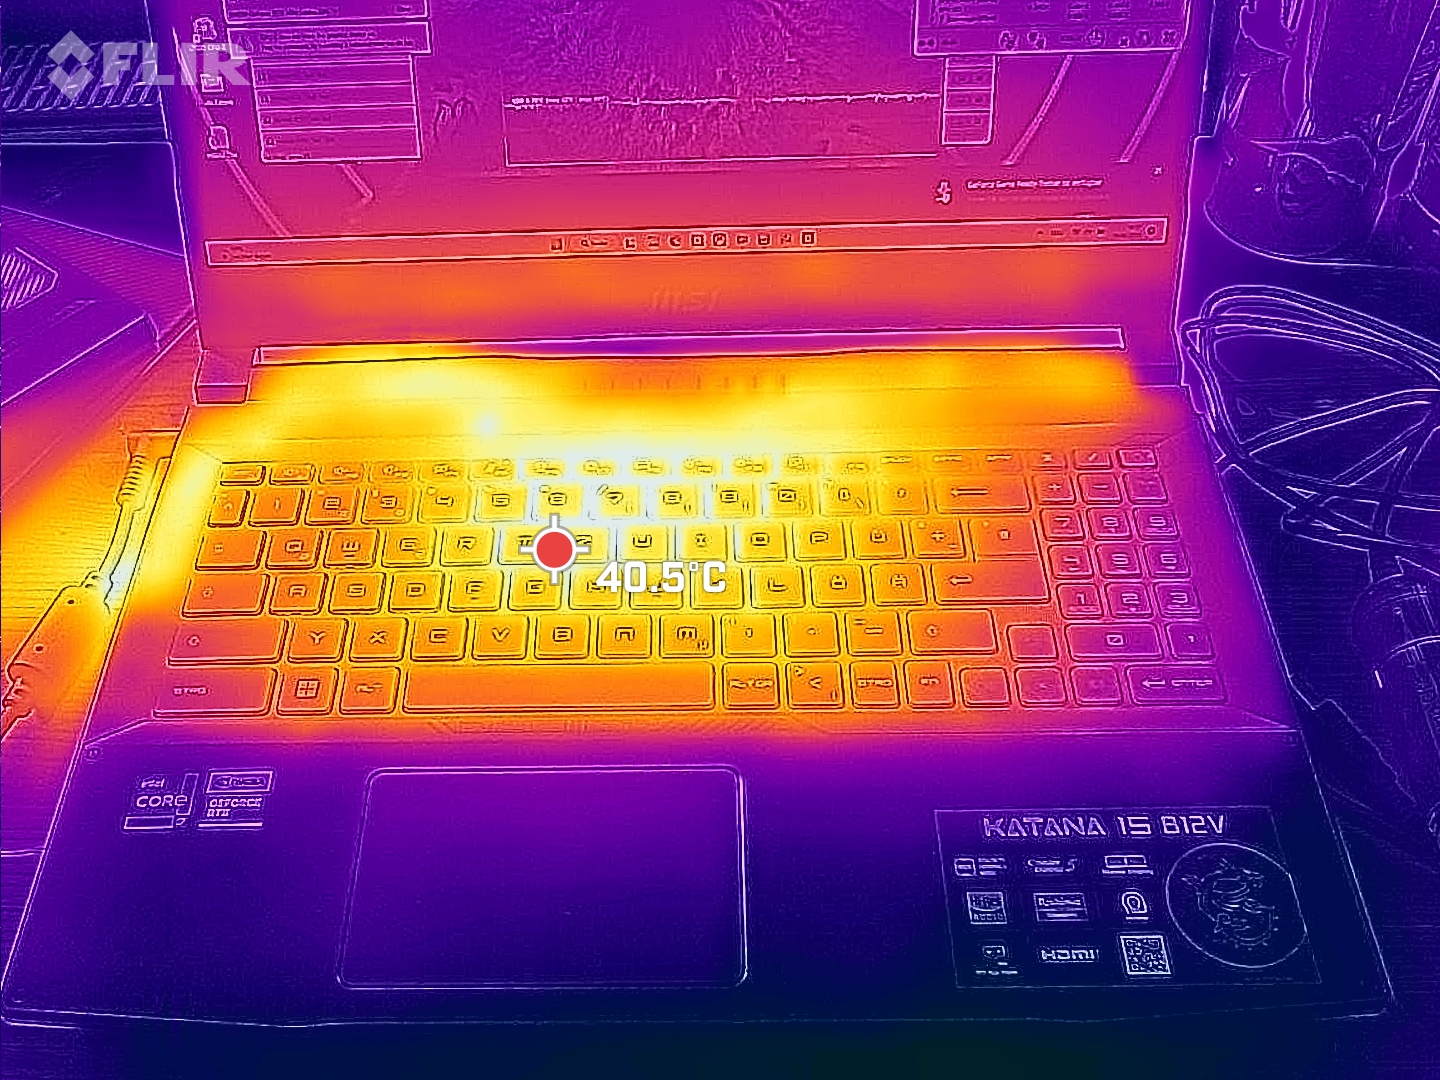
De hete plekken zitten net onder de 50 °C in het midden naar de achterkant toe. De palmsteunen blijven altijd koel, maar de WASD-toetsen kunnen bij zware belasting wat onaangenaam warm worden.
(-) De maximumtemperatuur aan de bovenzijde bedraagt 47 °C / 117 F, vergeleken met het gemiddelde van 40.4 °C / 105 F, variërend van 21.2 tot 68.8 °C voor de klasse Gaming.
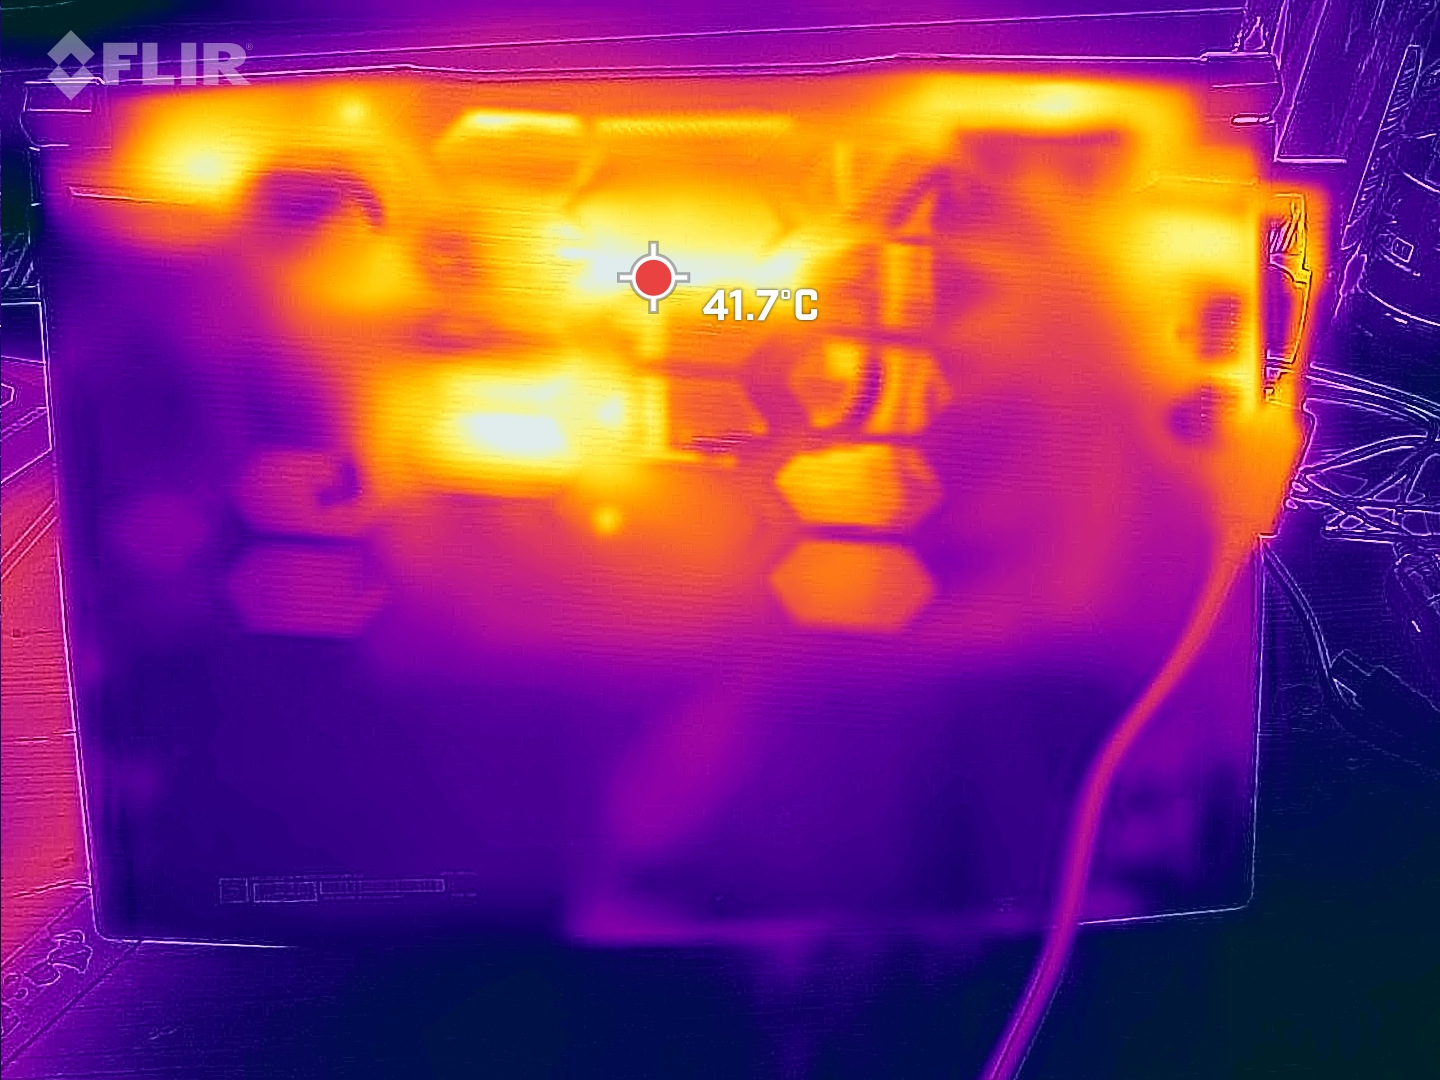
(-) De bodem warmt op tot een maximum van 48 °C / 118 F, vergeleken met een gemiddelde van 43.2 °C / 110 F
(+) Bij onbelast gebruik bedraagt de gemiddelde temperatuur voor de bovenzijde 29 °C / 84 F, vergeleken met het apparaatgemiddelde van 33.9 °C / 93 F.
(±) Bij het spelen van The Witcher 3 is de gemiddelde temperatuur voor de bovenzijde 35 °C / 95 F, vergeleken met het apparaatgemiddelde van 33.9 °C / 93 F.
(+) De palmsteunen en het touchpad zijn met een maximum van ###max## °C / 73.4 F koeler dan de huidtemperatuur en voelen daarom koel aan.
(+) De gemiddelde temperatuur van de handpalmsteun van soortgelijke toestellen bedroeg 28.8 °C / 83.8 F (+5.8 °C / 10.4 F).
| MSI Katana 15 B12VEK Intel Core i7-12650H, NVIDIA GeForce RTX 4050 Laptop GPU | MSI Katana GF66 12UGS Intel Core i7-12700H, NVIDIA GeForce RTX 3070 Ti Laptop GPU | MSI Pulse GL66 12UEK Intel Core i9-12900H, NVIDIA GeForce RTX 3060 Laptop GPU | Lenovo Legion 5 15IAH7H 82RB Intel Core i7-12700H, NVIDIA GeForce RTX 3060 Laptop GPU | Asus TUF Gaming F15 FX507ZM Intel Core i7-12700H, NVIDIA GeForce RTX 3060 Laptop GPU | Schenker XMG Core 15 (M22) AMD Ryzen 7 6800H, NVIDIA GeForce RTX 3060 Laptop GPU | |
|---|---|---|---|---|---|---|
| Heat | -17% | -2% | 16% | -2% | 6% | |
| Maximum Upper Side * (°C) | 47 | 61 -30% | 50 -6% | 37.8 20% | 44.4 6% | 48 -2% |
| Maximum Bottom * (°C) | 48 | 55 -15% | 47 2% | 51 -6% | 48.8 -2% | 51 -6% |
| Idle Upper Side * (°C) | 35 | 43 -23% | 36 -3% | 25.8 26% | 37.8 -8% | 28 20% |
| Idle Bottom * (°C) | 38 | 38 -0% | 38 -0% | 28.8 24% | 39.6 -4% | 33 13% |
* ... kleiner is beter
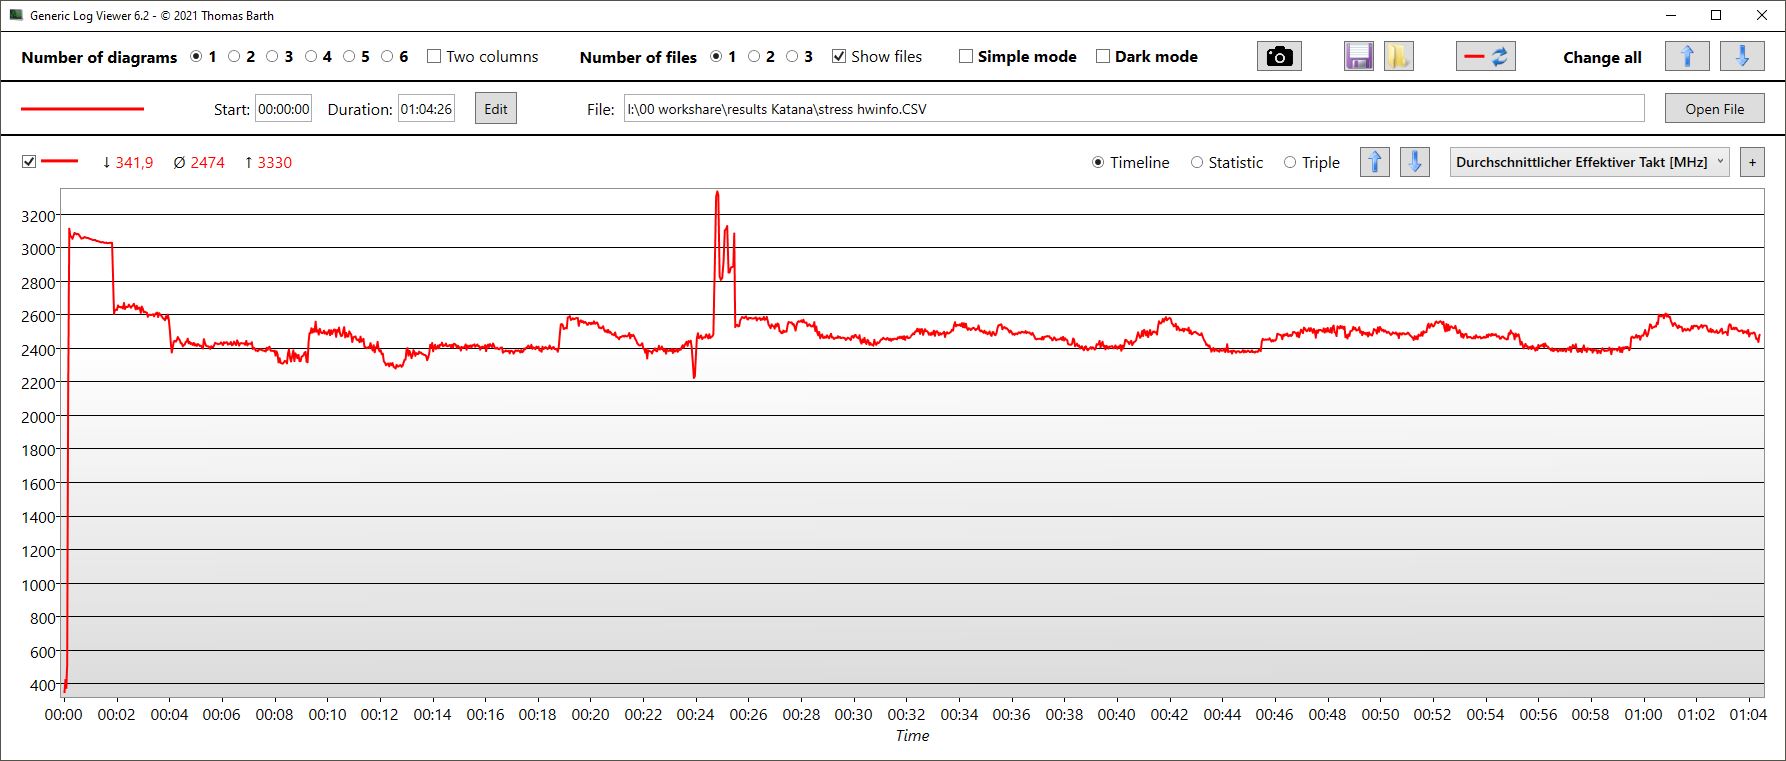
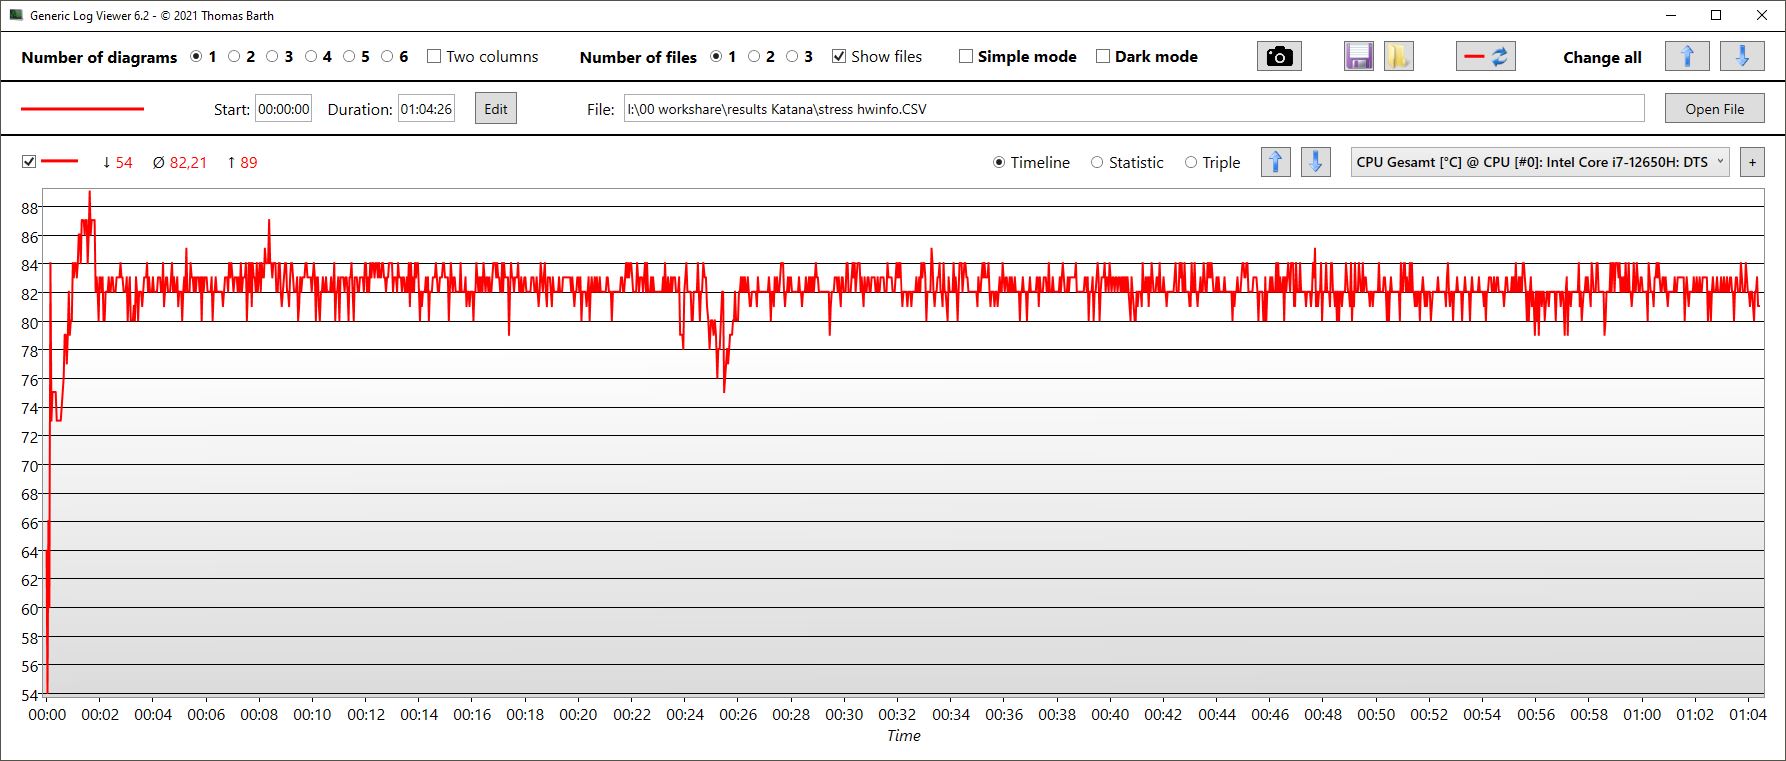
Stresstest
De kernen beginnen onze stresstest heel kort op 3,1 GHz. Na enkele seconden stijgen de kerntemperaturen tot 89 °C, waarna de kloksnelheden dalen en gemiddeld een stabiele 2,5 GHz bereiken. Het stroomverbruik bedraagt gemiddeld 50 W. De temperaturen stabiliseren zich rond 82 °C
De GPU-klok schommelt tussen 2 en 2,5 GHz. Er worden gemiddelde temperaturen van 75 °C bereikt, terwijl het stroomverbruik slechts ongeveer 62 W bedraagt.
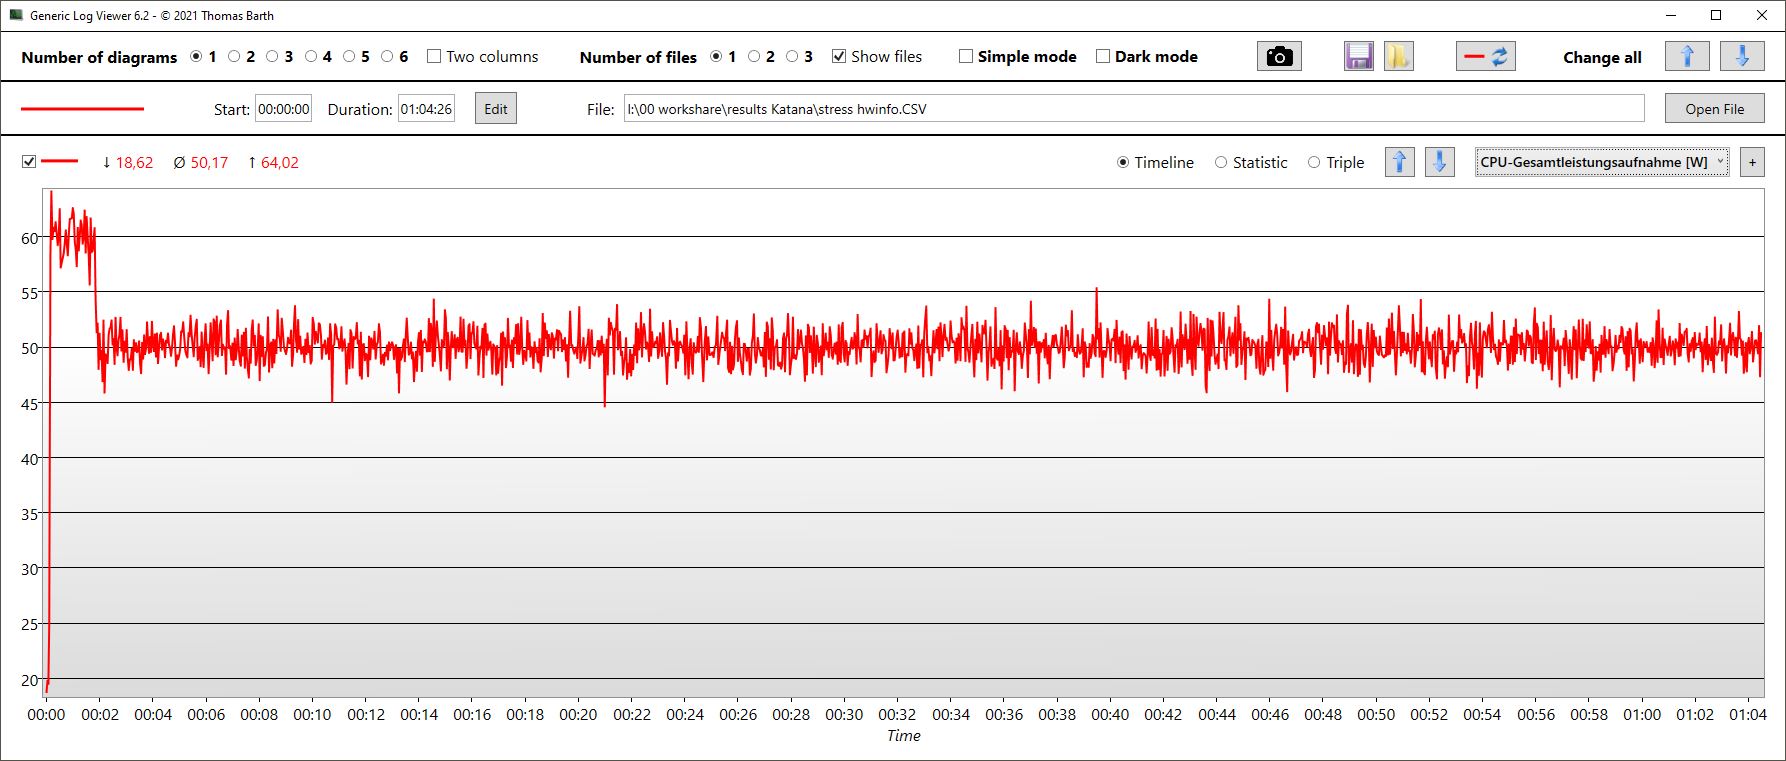
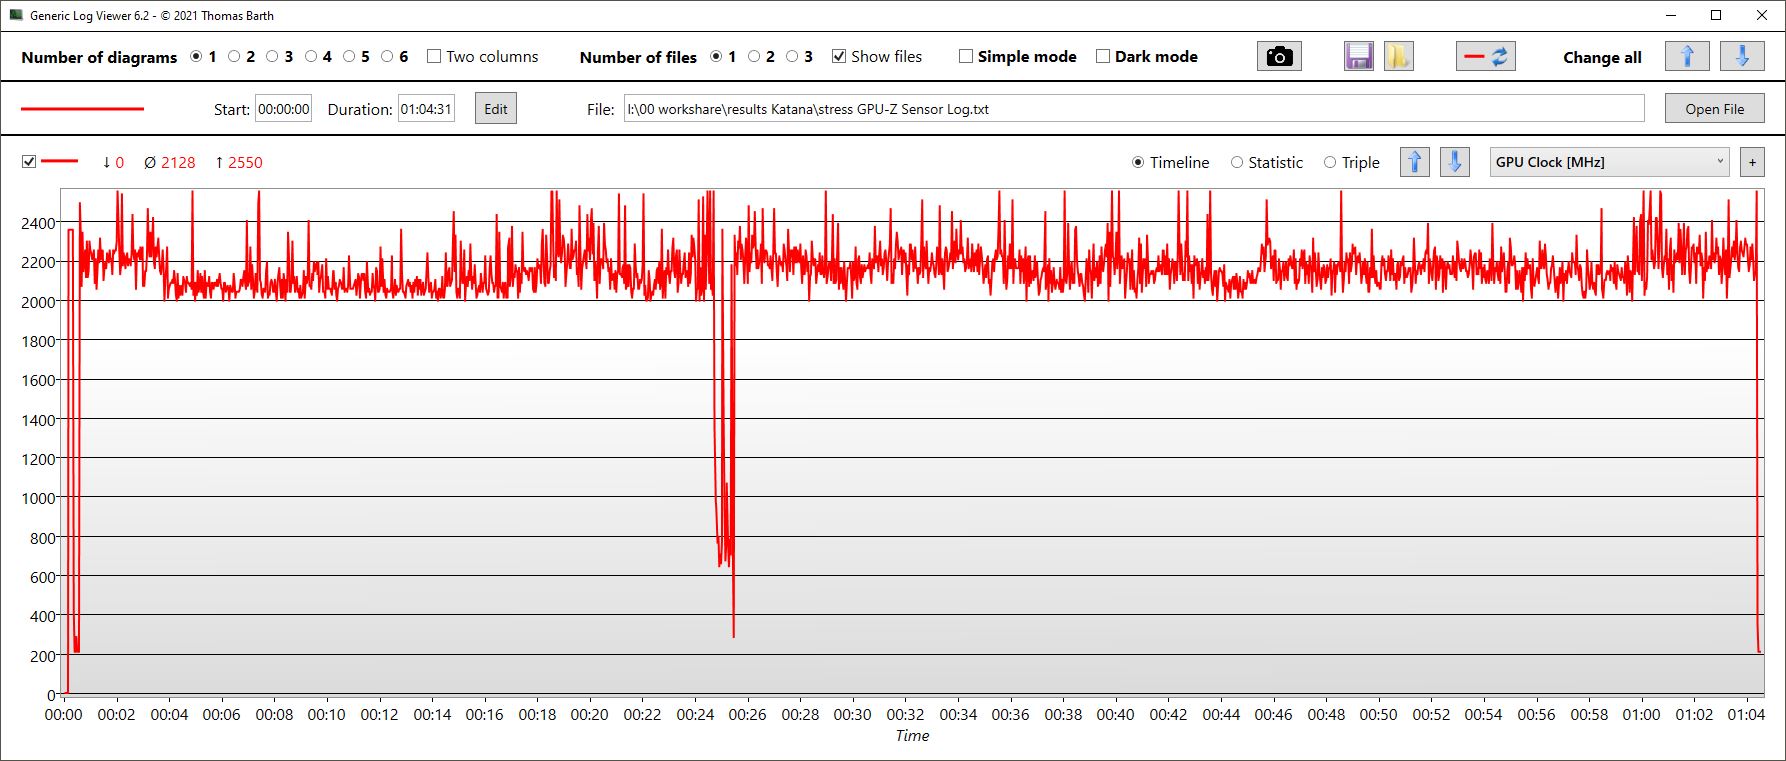
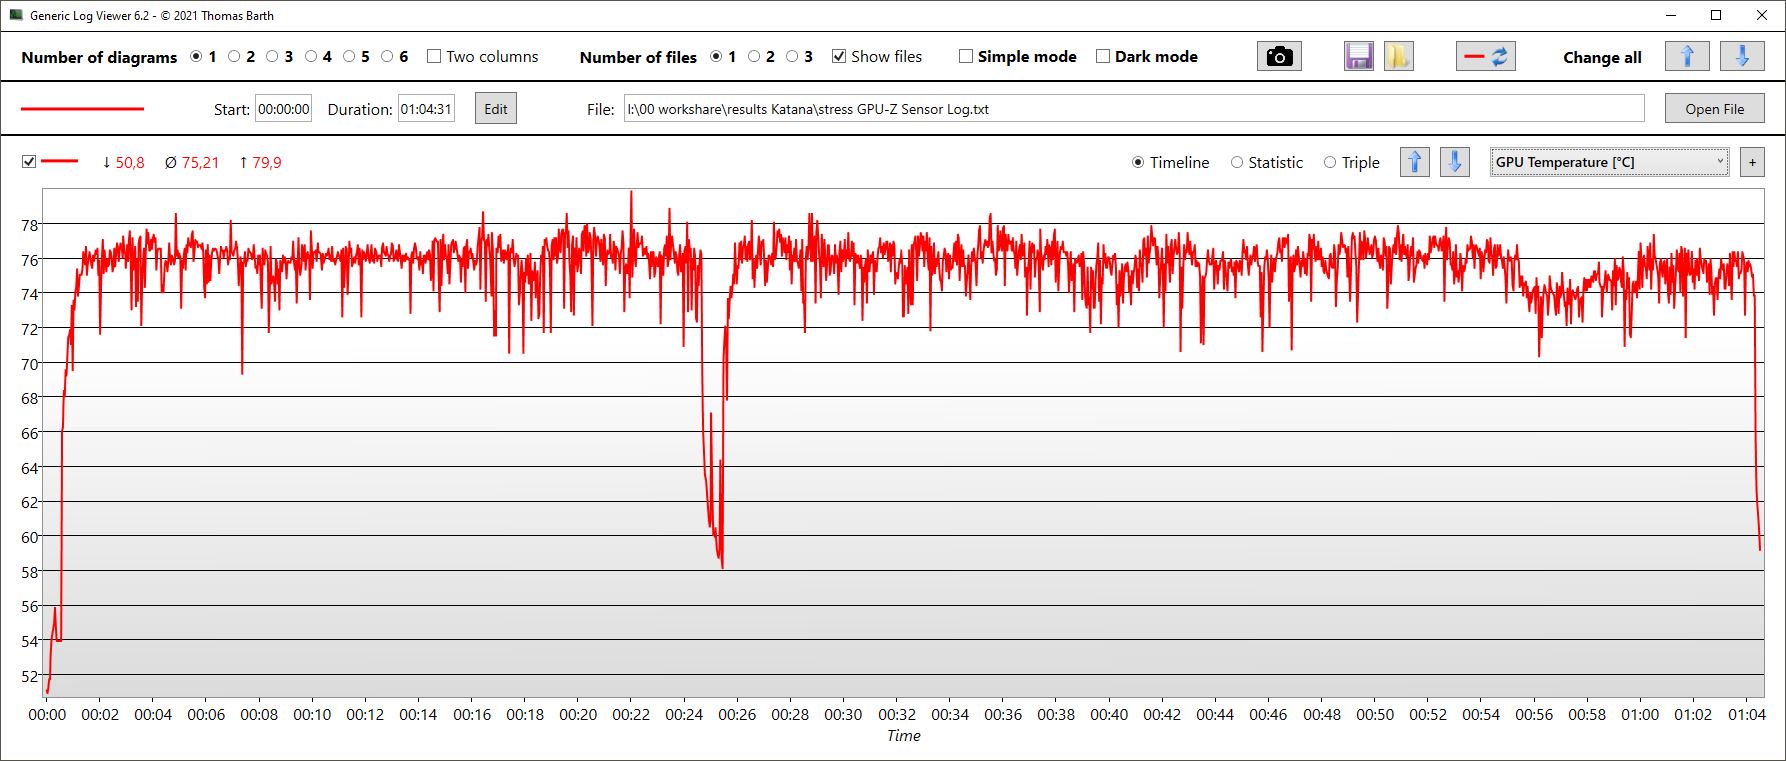
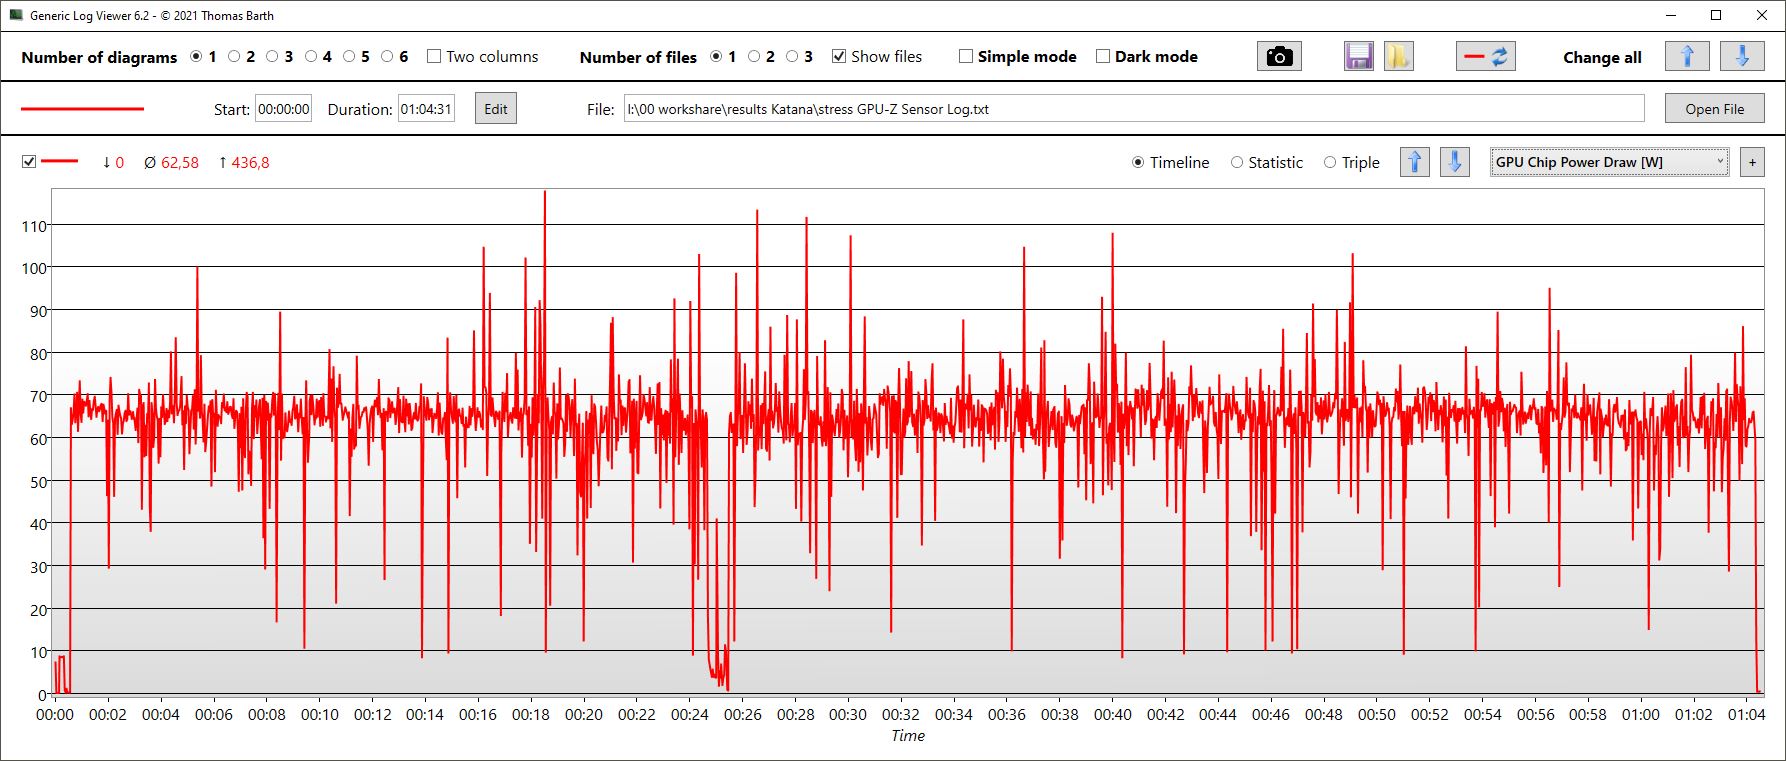
| CPU Klok (GHz) | GPU Klok (MHz) | Gemiddelde CPU Temperatuur (°C) | Gemiddelde GPU Temperatuur (°C) | |
| Prime95 + FurMark Stress | 2,5 | 2,121 | 82 | 75 |
| Witcher 3 Stress | 0,6 | 2.400 | 75 | 75 |
Luidsprekers
De stereoluidsprekers bieden uitgebalanceerde midden- en hoge tonen, maar nauwelijks lage tonen en op zijn best een gemiddeld volume. De hoofdtelefoonaansluiting is ideaal voor analoge apparaten.
MSI Katana 15 B12VEK audioanalyse
(±) | luidspreker luidheid is gemiddeld maar goed (75.69 dB)
Bas 100 - 315 Hz
(-) | bijna geen lage tonen - gemiddeld 21.5% lager dan de mediaan
(±) | lineariteit van de lage tonen is gemiddeld (8.8% delta ten opzichte van de vorige frequentie)
Midden 400 - 2000 Hz
(+) | evenwichtige middens - slechts 4.1% verwijderd van de mediaan
(+) | de middentonen zijn lineair (4.8% delta ten opzichte van de vorige frequentie)
Hoog 2 - 16 kHz
(+) | evenwichtige hoogtepunten - slechts 2.3% verwijderd van de mediaan
(+) | de hoge tonen zijn lineair (4% delta naar de vorige frequentie)
Algemeen 100 - 16.000 Hz
(±) | lineariteit van het totale geluid is gemiddeld (17.3% verschil met de mediaan)
Vergeleken met dezelfde klasse
» 47% van alle geteste apparaten in deze klasse waren beter, 12% vergelijkbaar, 41% slechter
» De beste had een delta van 6%, het gemiddelde was 18%, de slechtste was 132%
Vergeleken met alle geteste toestellen
» 32% van alle geteste apparaten waren beter, 8% gelijk, 59% slechter
» De beste had een delta van 4%, het gemiddelde was 23%, de slechtste was 134%
Lenovo Legion 5 15IAH7H 82RB audioanalyse
(+) | luidsprekers kunnen relatief luid spelen (83.3 dB)
Bas 100 - 315 Hz
(-) | bijna geen lage tonen - gemiddeld 28.2% lager dan de mediaan
(±) | lineariteit van de lage tonen is gemiddeld (12.9% delta ten opzichte van de vorige frequentie)
Midden 400 - 2000 Hz
(±) | hogere middens - gemiddeld 5.7% hoger dan de mediaan
(±) | lineariteit van de middentonen is gemiddeld (7.4% delta ten opzichte van de vorige frequentie)
Hoog 2 - 16 kHz
(+) | evenwichtige hoogtepunten - slechts 3.3% verwijderd van de mediaan
(+) | de hoge tonen zijn lineair (6.4% delta naar de vorige frequentie)
Algemeen 100 - 16.000 Hz
(±) | lineariteit van het totale geluid is gemiddeld (23.6% verschil met de mediaan)
Vergeleken met dezelfde klasse
» 86% van alle geteste apparaten in deze klasse waren beter, 4% vergelijkbaar, 10% slechter
» De beste had een delta van 6%, het gemiddelde was 18%, de slechtste was 132%
Vergeleken met alle geteste toestellen
» 71% van alle geteste apparaten waren beter, 6% gelijk, 23% slechter
» De beste had een delta van 4%, het gemiddelde was 23%, de slechtste was 134%
Energiebeheer - Efficiënte RTX 4050 in de MSI Katana
Stroomverbruik
Qua stroomverbruik is de nieuwe Katana 15 zuiniger dan de concurrentie met een last-gen GPU. Ons testmodel heeft goede cijfers tijdens het stationair draaien, en blijft dat ook tijdens het gamen of onder zware stress. Hoewel de 3D prestaties ook iets lager zijn, is het verschil in verbruik veel groter dan het verschil in prestaties.
Bijvoorbeeld, zowel de Legion 5 en de XMG Core 15 tot en met de Asus TUF Gaming F15 verbruiken bijna 50 procent meer tijdens het gamen met Witcher 3 dan onze Katana 15! Maar de Katana GF66 met zijn RTX 3070 Ti verbruikt ook slechts 16 procent meer tijdens het gamen.
We hebben op korte termijn een maximaal verbruik gemeten van maximaal 189 W. De standaard Chicony voeding, die ontworpen is voor 240 W, zou dit prima aan moeten kunnen.
| Uit / Standby | |
| Inactief | |
| Belasting |
|
Key:
min: | |
| MSI Katana 15 B12VEK i7-12650H, GeForce RTX 4050 Laptop GPU, Micron 2400 MTFDKBA1T0QFM, IPS, 1920x1080, 15.6" | MSI Katana GF66 12UGS i7-12700H, GeForce RTX 3070 Ti Laptop GPU, Micron 2450 1TB MTFDKBA1T0TFK, IPS, 1920x1080, 15.6" | MSI Pulse GL66 12UEK i9-12900H, GeForce RTX 3060 Laptop GPU, Micron 2450 512GB MTFDKBA512TFK, IPS, 1920x1080, 15.6" | Lenovo Legion 5 15IAH7H 82RB i7-12700H, GeForce RTX 3060 Laptop GPU, , IPS, 1920x1080, 15.6" | Asus TUF Gaming F15 FX507ZM i7-12700H, GeForce RTX 3060 Laptop GPU, SK Hynix HFM001TD3JX013N, IPS, 1920x1080, 15.6" | Schenker XMG Core 15 (M22) R7 6800H, GeForce RTX 3060 Laptop GPU, Samsung SSD 980 Pro 1TB MZ-V8P1T0BW, IPS, 2560x1440, 15.6" | Gemiddeld NVIDIA GeForce RTX 4050 Laptop GPU | Gemiddelde van klas Gaming | |
|---|---|---|---|---|---|---|---|---|
| Power Consumption | -26% | -6% | -121% | -34% | -34% | -30% | -65% | |
| Idle Minimum * (Watt) | 8.5 | 9 -6% | 7 18% | 19.8 -133% | 6.3 26% | 11.8 -39% | 9.95 ? -17% | 13 ? -53% |
| Idle Average * (Watt) | 10.2 | 13 -27% | 13 -27% | 26.2 -157% | 9.8 4% | 14.7 -44% | 15.8 ? -55% | 19 ? -86% |
| Idle Maximum * (Watt) | 11.3 | 20 -77% | 13.7 -21% | 48.2 -327% | 26.5 -135% | 15 -33% | 20.1 ? -78% | 24.6 ? -118% |
| Load Average * (Watt) | 84 | 100 -19% | 48.4 42% | 102.9 -23% | 103.8 -24% | 100 -19% | 88 ? -5% | 110.7 ? -32% |
| Witcher 3 ultra * (Watt) | 128 | 149 -16% | 148 -16% | 186.7 -46% | 189 -48% | 184 -44% | ||
| Load Maximum * (Watt) | 189 | 212 -12% | 244 -29% | 268 -42% | 241.9 -28% | 237 -25% | 176.3 ? 7% | 259 ? -37% |
* ... kleiner is beter
Power Consumption Witcher 3 / Stresstest
Power Consumption with an External Monitor
Levensduur van de batterij
Waar anders besparen budgetlaptops geld? Correct, de batterij. Het model in de Katana 15 heeft slechts 53 Wh, wat standaard is in de Katana of Pulse. De rest van de concurrentie heeft batterijen van 62 tot 90 Wh. Bijgevolg zijn de looptijden eerder middelmatig, ondanks de relatief goede energie-efficiëntie.
Een filmavond kan worden gepland voor ongeveer 4 uur en 20 minuten. Onze WLAN-test levert duidelijk verschillende resultaten op, afhankelijk van de gekozen modus. In de Balanced modus bij maximale helderheid (258 nits) gaat de batterij slechts 2 uur en 20 minuten mee. In Power Saver bij 150 nits meten we daarentegen ongeveer dezelfde tijd als in de videotest.
| MSI Katana 15 B12VEK i7-12650H, GeForce RTX 4050 Laptop GPU, 53.5 Wh | MSI Katana GF66 12UGS i7-12700H, GeForce RTX 3070 Ti Laptop GPU, 52 Wh | MSI Pulse GL66 12UEK i9-12900H, GeForce RTX 3060 Laptop GPU, 53.5 Wh | Lenovo Legion 5 15IAH7H 82RB i7-12700H, GeForce RTX 3060 Laptop GPU, 80 Wh | Asus TUF Gaming F15 FX507ZM i7-12700H, GeForce RTX 3060 Laptop GPU, 90 Wh | Schenker XMG Core 15 (M22) R7 6800H, GeForce RTX 3060 Laptop GPU, 62 Wh | Gemiddelde van klas Gaming | |
|---|---|---|---|---|---|---|---|
| Batterijduur | -26% | 9% | -6% | -8% | 27% | 51% | |
| H.264 (h) | 4.4 | 4 -9% | 8.32 ? 89% | ||||
| WiFi v1.3 (h) | 4.3 | 2.4 -44% | 5 16% | 4.8 12% | 7.8 81% | 7.11 ? 65% | |
| Load (h) | 1.5 | 1.4 -7% | 1.9 27% | 1.1 -27% | 1.1 -27% | 1.1 -27% | 1.502 ? 0% |
| Reader / Idle (h) | 8.1 | 15.8 | 8.27 ? |
Pro
Contra
Verdict - Budget RTX 4050 is nog steeds te duur

De MSI Katana 15 B12 combineert een Gen12 CPU met een RTX 4050, wat eigenlijk geen slecht idee is voor een budget gamer. De CPU is allesbehalve slecht en de GPU in de Katana 15 blijkt aanzienlijk efficiënter te zijn dan de modellen van vorig jaar.
Ons belangrijkste punt van kritiek voor budgetgamers is echter de prijs: terwijl je budgetlaptops met RTX 3060 kunt krijgen vanaf ongeveer US$800, betaal je hier een hele US$1.499,99! De efficiëntievoordelen van de RTX 4050 rechtvaardigen deze prijspremie niet. Temeer daar bijna alle andere componenten in de Katana 15 duidelijk budgetklasse zijn, van de deels verouderde poorten tot het nogal donkere Full HD-scherm tot de relatief kleine batterij. Daar komt bij dat de prestaties van de laptop de neiging hebben om achter te blijven bij de meeste RTX 3060 gamers en de RTX 4050 duidelijk zijn TGP doel van 105 mist.
De MSI Katana 15 B12 combineert een goede last-gen CPU met een actuele RTX 4050, maar slaagt er niet in een prijs neer te zetten die redelijk is voor de vele budgetcomponenten. Op dit moment is de Katana 15 simpelweg te duur.
Er zijn immers genoeg alternatieven. Wil je meer prestaties en minder budgetcomponenten tegen een nog lagere prijs, dan is je beste gok de Lenovo Legion 5 met zijn RTX 3060. Maar de meeste andere RTX 3060 gamers zouden ook goedkoper, beter uitgerust en meestal sneller moeten zijn.
Prijs en beschikbaarheid
In MSI's officiële webwinkel US is de Katana 15 B12VGK-082 geprijsd voor $1.499,99. Geïnteresseerde kopers (afhankelijk van de locatie) kunnen hetzelfde model vinden tegen goedkopere prijzen elders op wederverkopers zoals Amazon.
MSI Katana 15 B12VEK
- 28-03-2023 v7 (old)
Christian Hintze
Transparantie
De selectie van te beoordelen apparaten wordt gemaakt door onze redactie. Het testexemplaar werd ten behoeve van deze beoordeling door de fabrikant of detailhandelaar in bruikleen aan de auteur verstrekt. De kredietverstrekker had geen invloed op deze recensie, noch ontving de fabrikant vóór publicatie een exemplaar van deze recensie. Er bestond geen verplichting om deze recensie te publiceren. Als onafhankelijk mediabedrijf is Notebookcheck niet onderworpen aan het gezag van fabrikanten, detailhandelaren of uitgevers.
[transparency_disclaimer]Dit is hoe Notebookcheck test
Elk jaar beoordeelt Notebookcheck onafhankelijk honderden laptops en smartphones met behulp van gestandaardiseerde procedures om ervoor te zorgen dat alle resultaten vergelijkbaar zijn. We hebben onze testmethoden al zo'n 20 jaar voortdurend ontwikkeld en daarbij de industriestandaard bepaald. In onze testlaboratoria wordt gebruik gemaakt van hoogwaardige meetapparatuur door ervaren technici en redacteuren. Deze tests omvatten een validatieproces in meerdere fasen. Ons complexe beoordelingssysteem is gebaseerd op honderden goed onderbouwde metingen en benchmarks, waardoor de objectiviteit behouden blijft. Meer informatie over onze testmethoden kunt u hier vinden.
Price comparison

