Lenovo Legion Slim 7 16 gaming laptop in review: Overtuigend, zelfs met AMD Ryzen

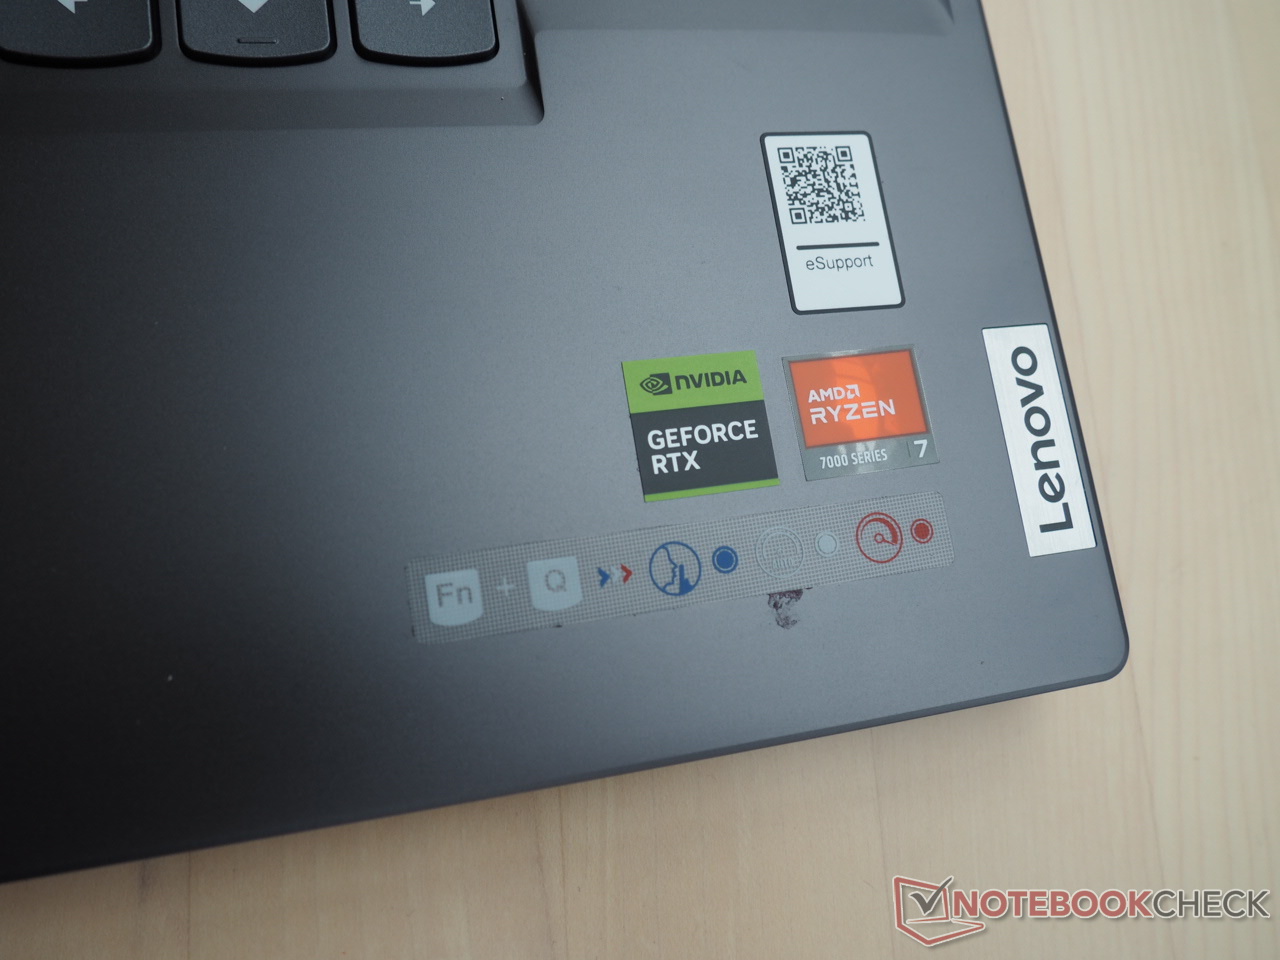
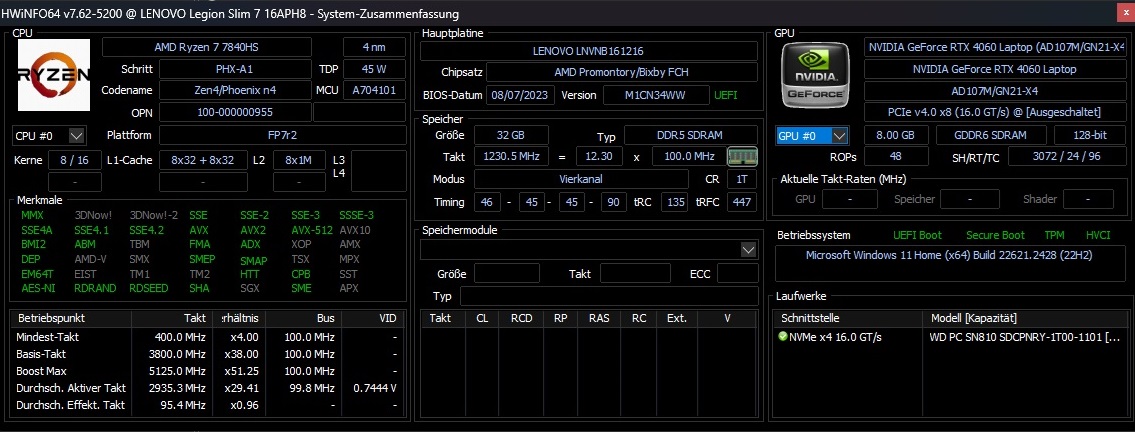
Naast Intel-processors biedt Lenovo ook AMD CPU's voor de Legion Slim 7-serie. Het model dat wij getest hebben, 16APH8, heeft een Ryzen 7 7840HS processor in combinatie met een GeForce RTX 4060 GPU, 32 GB DDR5-5600-RAM en een ruime 1 TB M.2 SSD. De laptop heeft een levendig WQXGA-beeldscherm met een resolutie van 2.560 x 1.600 pixels, een hoge vernieuwingsfrequentie van 240 Hz, fabriekskalibratie en HDR-ondersteuning. Windows 11 Home maakt het product compleet. Ondanks de indrukwekkende specificaties kost de 16APH8 ongeveer $1750 USD, waardoor hij relatief duur is voor een laptop die is uitgerust met een RTX 4060 grafische kaart.
De Slim 7 ondervindt concurrentie van andere 16-inch gaming notebooks met de RTX 4060, waaronder modellen zoals de Asus ROG Flow X16 GV601V, Alienware m16 R1, Acer Predator Helios 16 PH16-71-731Qevenals Lenovo's eigen Legion Pro 5 16IRX8 en Lenovo LOQ 16IRH8 notebooks.
Potentiële concurrenten in vergelijking
Evaluatie | Datum | Model | Gewicht | Hoogte | Formaat | Resolutie | Beste prijs |
|---|---|---|---|---|---|---|---|
| 90.4 % v7 (old) | 11-2023 | Lenovo Legion Slim 7 16APH8 R7 7840HS, GeForce RTX 4060 Laptop GPU | 2.1 kg | 20 mm | 16.00" | 2560x1600 | |
| 89.7 % v7 (old) | 06-2023 | Asus ROG Flow X16 GV601V i9-13900H, GeForce RTX 4060 Laptop GPU | 2.1 kg | 19.4 mm | 16.00" | 2560x1600 | |
| 88.3 % v7 (old) | 09-2023 | Alienware m16 R1 Intel i7-13700HX, GeForce RTX 4060 Laptop GPU | 3 kg | 25.4 mm | 16.00" | 2560x1600 | |
| 89.5 % v7 (old) | 07-2023 | Acer Predator Helios 16 PH16-71-731Q i7-13700HX, GeForce RTX 4060 Laptop GPU | 2.6 kg | 26.9 mm | 16.00" | 2560x1600 | |
| 87.9 % v7 (old) | 05-2023 | Lenovo Legion Pro 5 16IRX8 i7-13700HX, GeForce RTX 4060 Laptop GPU | 2.5 kg | 26.8 mm | 16.00" | 2560x1600 | |
| 87.3 % v7 (old) | 09-2023 | Lenovo LOQ 16IRH8 i7-13620H, GeForce RTX 4060 Laptop GPU | 2.7 kg | 25.9 mm | 16.00" | 2560x1600 |
Op een paar kleine verschillen na is de behuizing hetzelfde als de Intel-versie met de Core i9-13900H en GeForce RTX 4070 die we al hebben onderzocht. Daarom zullen we in dit artikel alleen de behuizing, functies en invoerapparaten kort bespreken.
Zaak
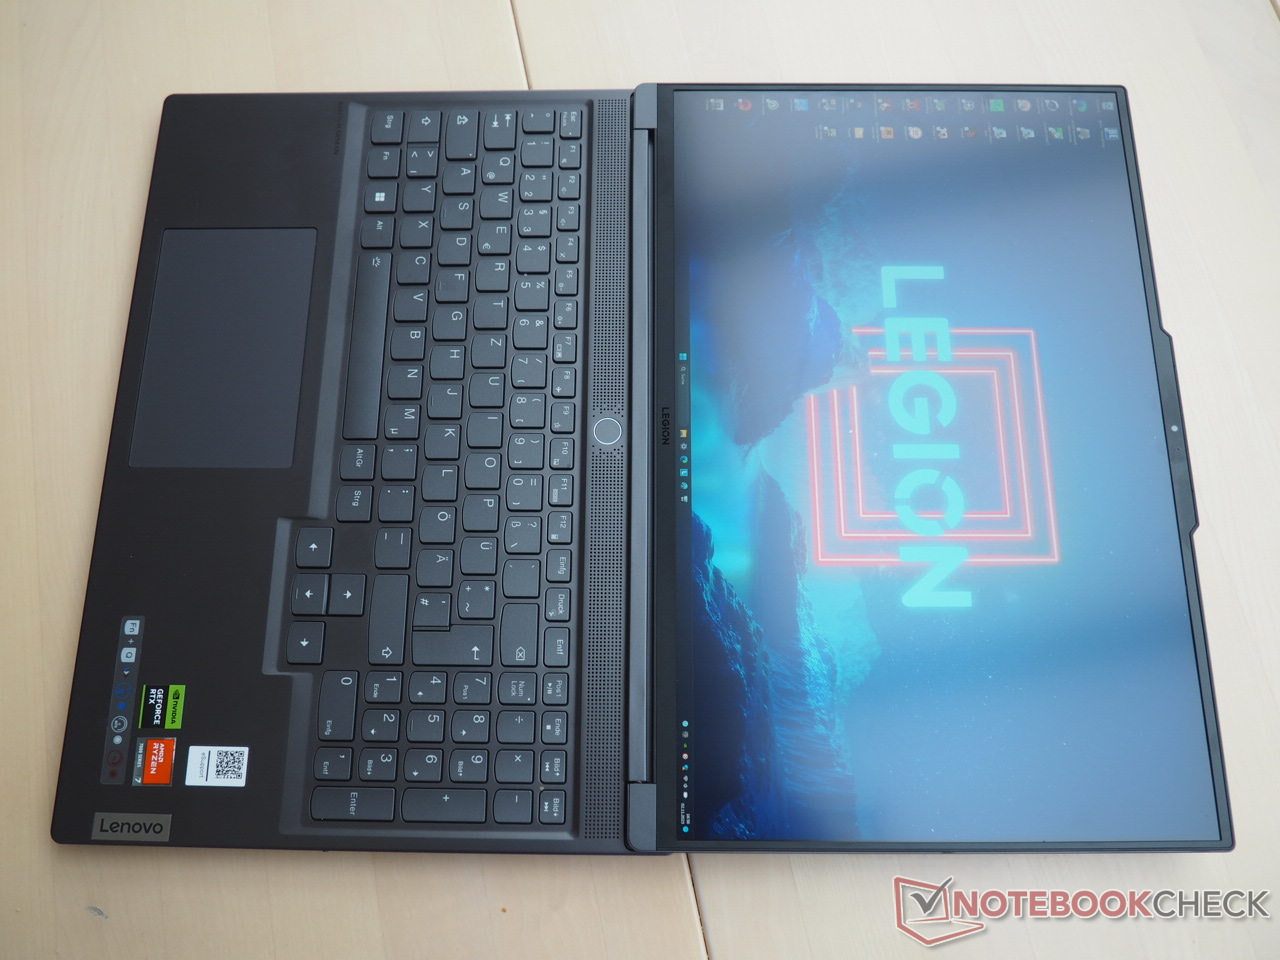
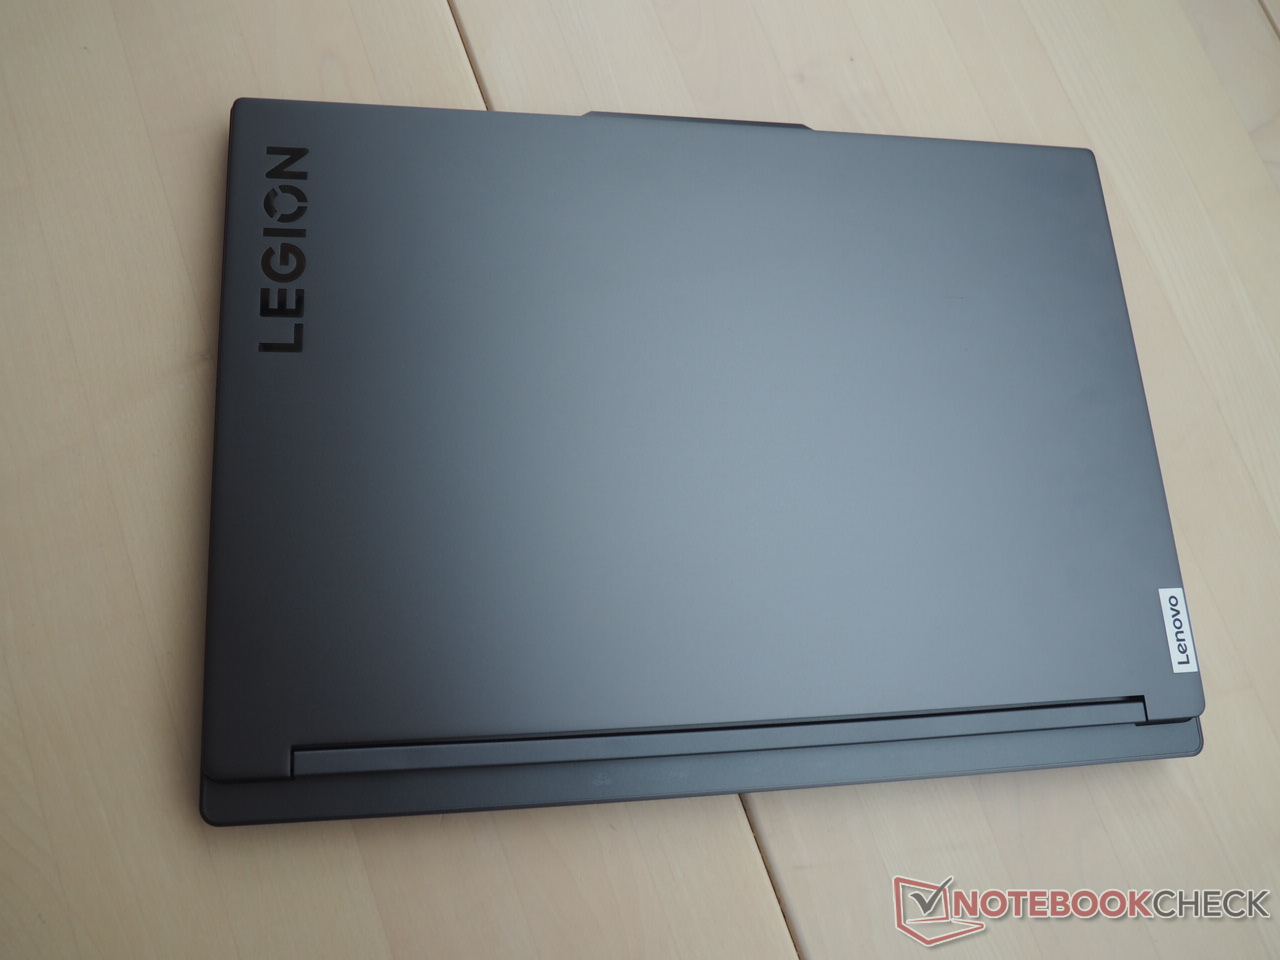
Een van de opvallende kenmerken is de stijlvolle behuizing. Het 16-inch apparaat heeft een gestroomlijnd ontwerp, eersteklas materialen en een uitstekende stabiliteit. Met een gewicht van slechts 4,6 lbs is hij lichter dan zijn concurrenten.
Connectiviteit
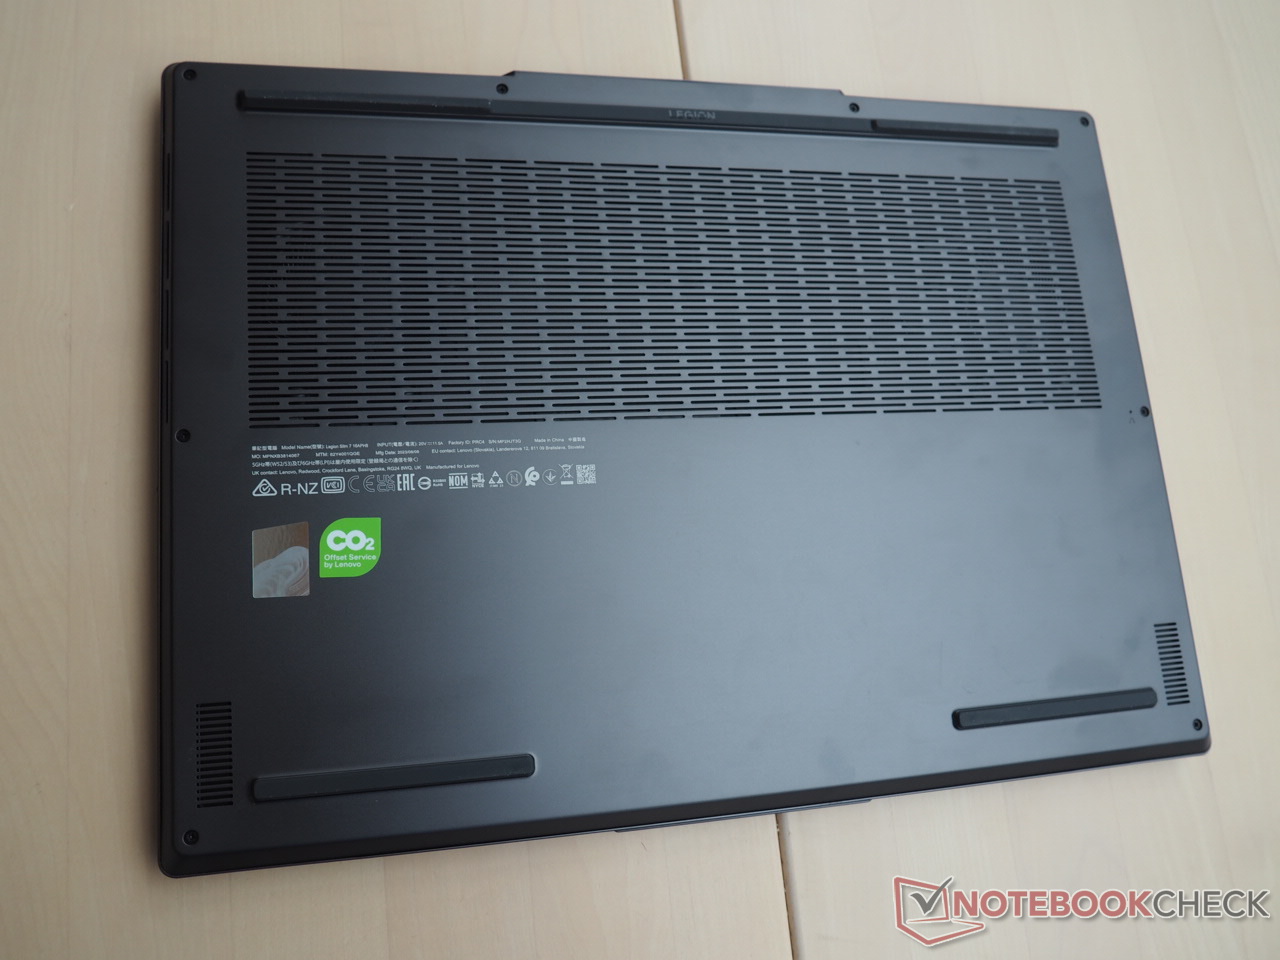
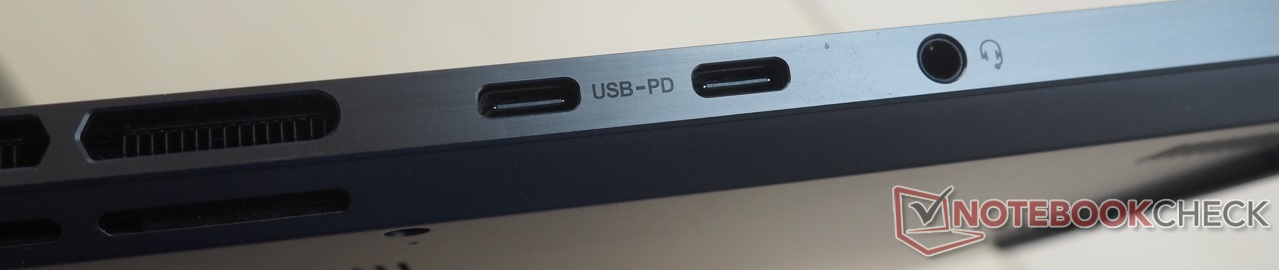
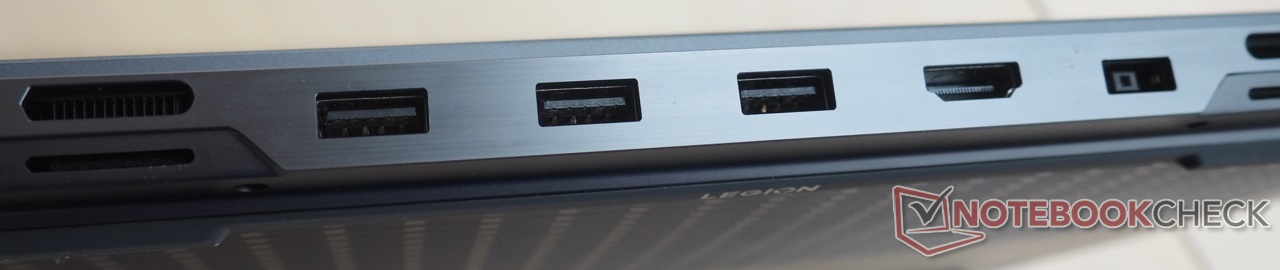
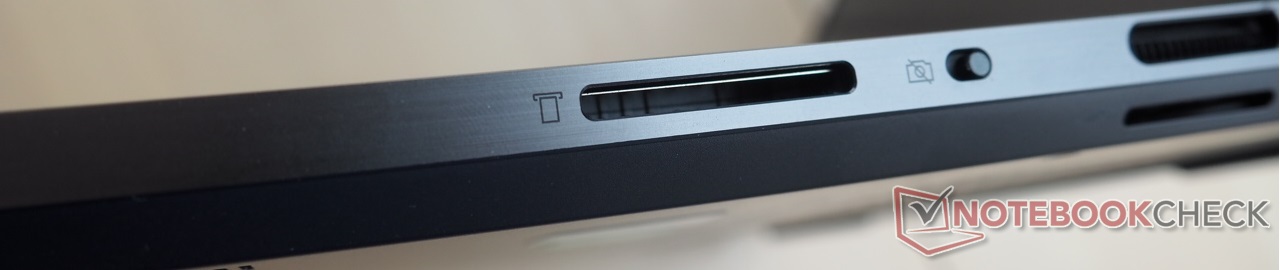
Ondanks het ontbreken van een RJ45-poort biedt de Slim 7 een royale hoeveelheid aansluitingen. Aan de rechterkant vindt u een kaartlezer met gemiddelde snelheid en een privacy shutter voor een fatsoenlijke webcam. Aan de linkerkant vindt u een audio-aansluiting en twee USB-poorten (1x USB 4, 1x USB 3.2 Gen2), die beide DisplayPort 1.4 en 140 watt voeding ondersteunen. Daarnaast is er een HDMI 2.1-poort, zodat u tot drie externe beeldschermen kunt aansluiten. Aan de achterkant bevinden zich drie USB 3.2 Gen2 poorten en de aansluiting voor de meegeleverde 230-watt voeding.
Voor draadloze connectiviteit gebruikt de laptop een Wi-Fi 6E chip (MediaTek RZ616), die iets ondergemiddeld presteert tijdens het zenden, maar bovengemiddeld tijdens het ontvangen.
SD-kaartlezer
| SD Card Reader | |
| average JPG Copy Test (av. of 3 runs) | |
| Alienware m16 R1 Intel (AV PRO microSD 128 GB V60) | |
| Gemiddelde van klas Gaming (20.9 - 210, n=54, laatste 2 jaar) | |
| Asus ROG Flow X16 GV601V | |
| Lenovo Legion Slim 7 16APH8 (AV PRO microSD 128 GB V60) | |
| Acer Predator Helios 16 PH16-71-731Q | |
| maximum AS SSD Seq Read Test (1GB) | |
| Asus ROG Flow X16 GV601V | |
| Alienware m16 R1 Intel (AV PRO microSD 128 GB V60) | |
| Gemiddelde van klas Gaming (25.5 - 261, n=51, laatste 2 jaar) | |
| Acer Predator Helios 16 PH16-71-731Q | |
| Lenovo Legion Slim 7 16APH8 (AV PRO microSD 128 GB V60) | |
Communicatie
Webcam


Invoerapparaten
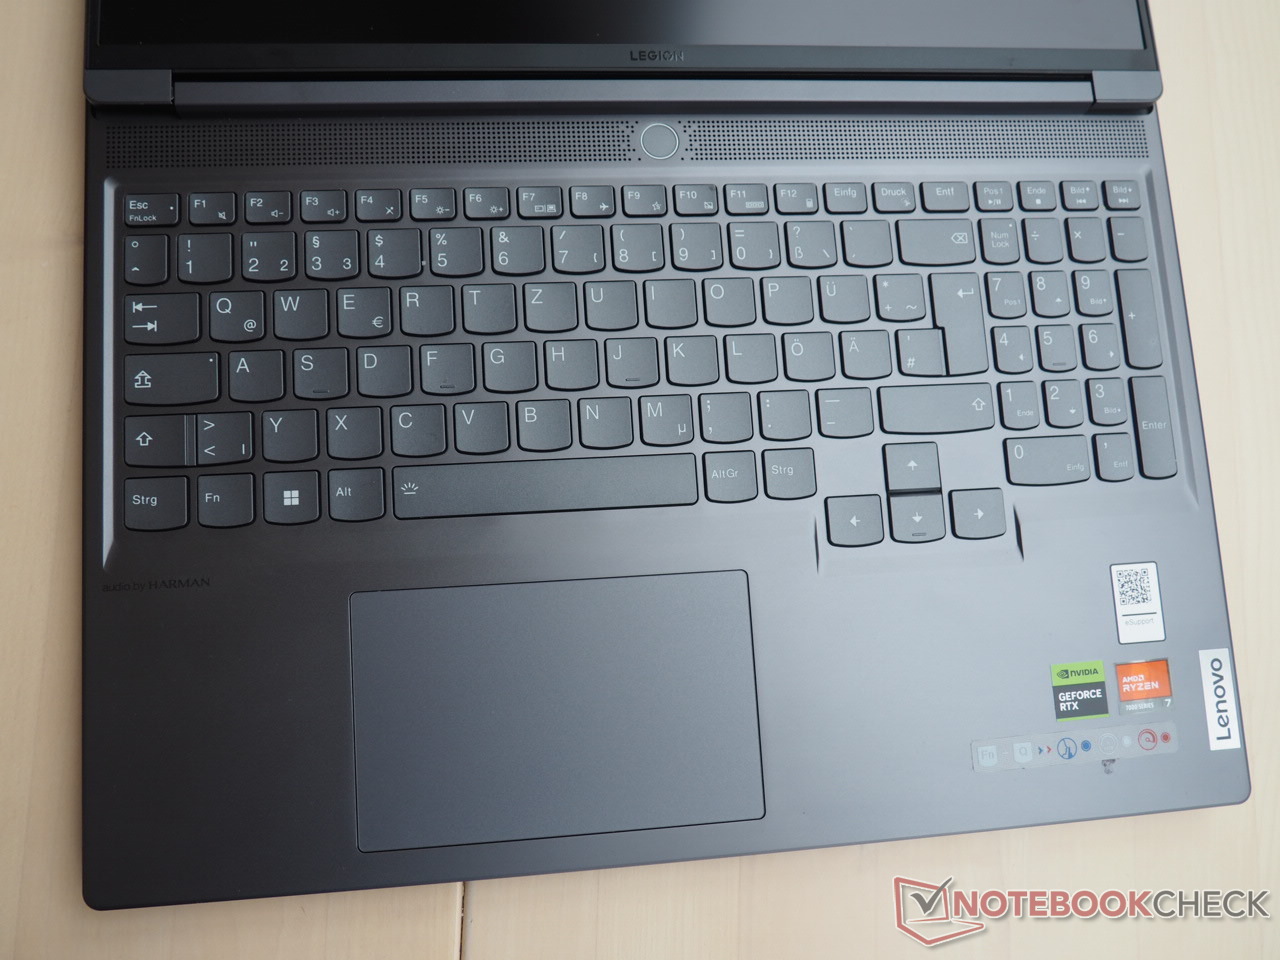
Het toetsenbord heeft niet alleen toetsen van goed formaat, maar ook een mooie indeling, een prettige toetsvorm en een speciaal numeriek toetsenblok. Het voelt ook solide aan. Een clickpad van ongeveer 4,72 x 2,95 inch vervangt de muis en maakt ook een mooie indruk.
Weergave
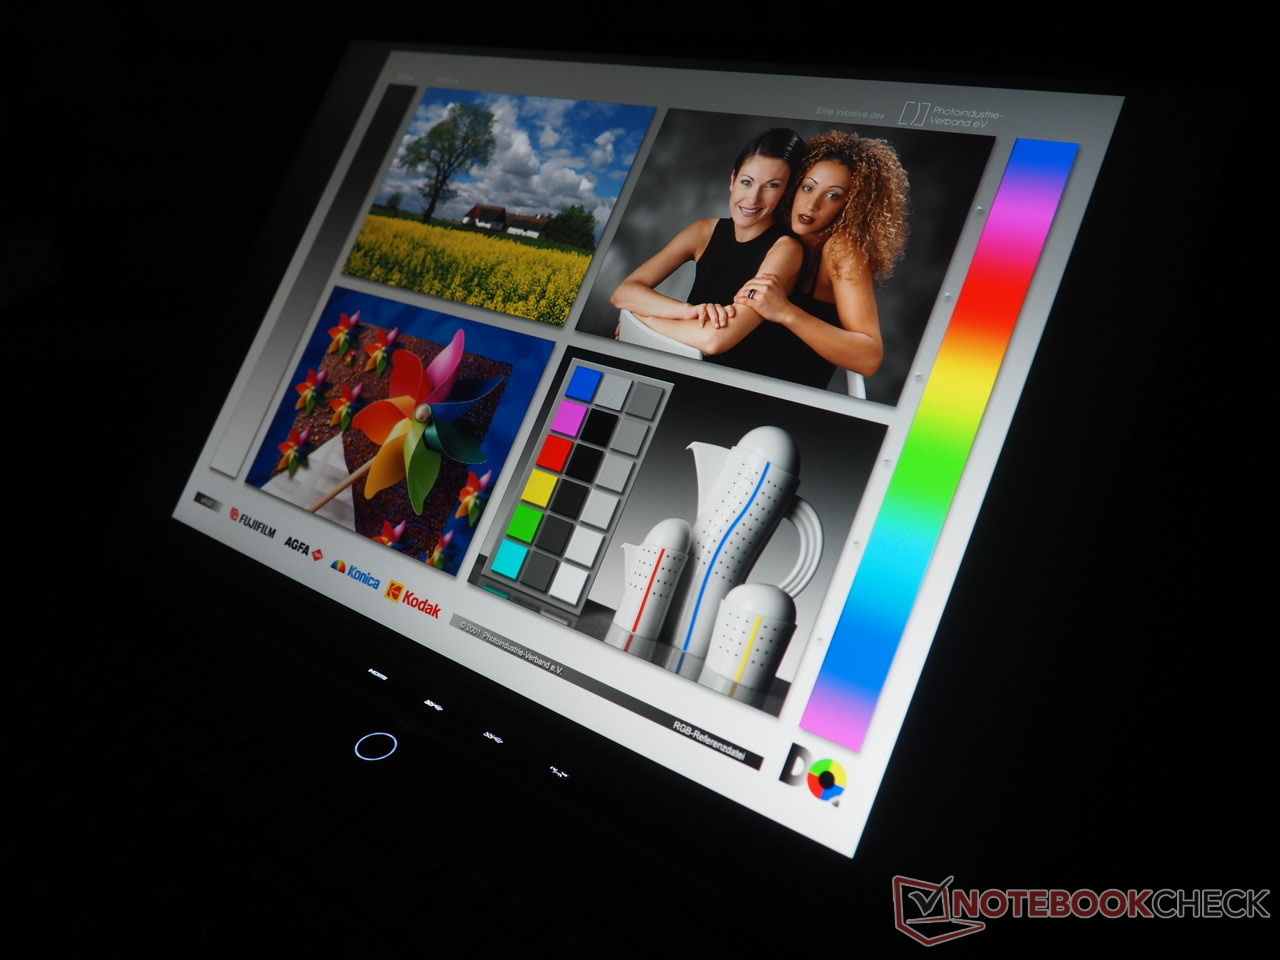
Hoewel het beeldscherm van het Intel-model en ons testapparaat vergelijkbare basiskenmerken hebben, zijn ze niet hetzelfde. Ons model had een BOE-paneel met het label NE160QDM-NZ3.
| |||||||||||||||||||||||||
Helderheidsverdeling: 82 %
Helderheid in Batterij-modus: 545 cd/m²
Contrast: 1135:1 (Zwart: 0.48 cd/m²)
ΔE ColorChecker Calman: 1.36 | ∀{0.5-29.43 Ø4.71}
calibrated: 1.04
ΔE Greyscale Calman: 1.4 | ∀{0.09-98 Ø4.96}
72.4% AdobeRGB 1998 (Argyll 3D)
99.6% sRGB (Argyll 3D)
70.3% Display P3 (Argyll 3D)
Gamma: 2.253
CCT: 6631 K
| Lenovo Legion Slim 7 16APH8 BOE NE160QDM-NZ3, IPS, 2560x1600, 16" | Asus ROG Flow X16 GV601V TMX1603 (TL160ADMP03-0), IPS, 2560x1600, 16" | Alienware m16 R1 Intel BOE NE16NYB, IPS, 2560x1600, 16" | Acer Predator Helios 16 PH16-71-731Q BOE NE160QDM-NZ2, IPS-LED, 2560x1600, 16" | Lenovo Legion Pro 5 16IRX8 AU Optronics B160QAN03.1, IPS, 2560x1600, 16" | Lenovo LOQ 16IRH8 AUOC1A5 (B160QAN03.L), IPS, 2560x1600, 16" | |
|---|---|---|---|---|---|---|
| Display | 18% | -3% | 18% | 0% | -0% | |
| Display P3 Coverage (%) | 70.3 | 96.61 37% | 67.7 -4% | 97.1 38% | 71.2 1% | 70.5 0% |
| sRGB Coverage (%) | 99.6 | 99.92 0% | 97.2 -2% | 100 0% | 98.8 -1% | 98.9 -1% |
| AdobeRGB 1998 Coverage (%) | 72.4 | 84.63 17% | 70 -3% | 84.7 17% | 73.3 1% | 72.6 0% |
| Response Times | 21% | 22% | -8% | -46% | 9% | |
| Response Time Grey 50% / Grey 80% * (ms) | 12.6 ? | 3.8 ? 70% | 4 ? 68% | 13.6 ? -8% | 14.5 ? -15% | 7.2 ? 43% |
| Response Time Black / White * (ms) | 5.9 ? | 7.6 ? -29% | 7.3 ? -24% | 6.4 ? -8% | 10.4 ? -76% | 7.4 ? -25% |
| PWM Frequency (Hz) | ||||||
| Screen | -25% | -32% | -17% | -3% | -7% | |
| Brightness middle (cd/m²) | 545 | 486 -11% | 306 -44% | 511 -6% | 405.7 -26% | 407 -25% |
| Brightness (cd/m²) | 502 | 469 -7% | 302 -40% | 498 -1% | 368 -27% | 369 -26% |
| Brightness Distribution (%) | 82 | 91 11% | 89 9% | 94 15% | 87 6% | 85 4% |
| Black Level * (cd/m²) | 0.48 | 0.39 19% | 0.3 37% | 0.36 25% | 0.38 21% | 0.45 6% |
| Contrast (:1) | 1135 | 1246 10% | 1020 -10% | 1419 25% | 1068 -6% | 904 -20% |
| Colorchecker dE 2000 * | 1.36 | 2.27 -67% | 2.57 -89% | 1.76 -29% | 1.65 -21% | 1.43 -5% |
| Colorchecker dE 2000 max. * | 3.11 | 5.73 -84% | 4.26 -37% | 3.7 -19% | 4.2 -35% | 3.58 -15% |
| Colorchecker dE 2000 calibrated * | 1.04 | 0.6 42% | 0.85 18% | 1.56 -50% | 0.53 49% | 1.07 -3% |
| Greyscale dE 2000 * | 1.4 | 3.36 -140% | 3.3 -136% | 3 -114% | 1.2 14% | 1.13 19% |
| Gamma | 2.253 98% | 2.46 89% | 1.997 110% | 2.33 94% | 2.3 96% | 2.5 88% |
| CCT | 6631 98% | 6625 98% | 6895 94% | 6341 103% | 6453 101% | 6526 100% |
| Totaal Gemiddelde (Programma / Instellingen) | 5% /
-9% | -4% /
-18% | -2% /
-8% | -16% /
-8% | 1% /
-3% |
* ... kleiner is beter
Afgezien van de kleurruimte, die iets groter zou kunnen zijn gezien de 70% DCI-P3 en 72% AdobeRGB dekking (in vergelijking met de Alienware m16 en de Acer Predator Helios 16), werkt het WQXGA-scherm in bijna elk aspect buitengewoon goed. Dankzij de fabriekskalibratie is de kleurnauwkeurigheid vanaf het begin uitzonderlijk. Daarnaast zijn de responstijden van het 240 Hz paneel behoorlijk, met iets minder dan 6 ms voor overgangen van zwart naar wit en 12 ms voor overgangen van grijs naar grijs.
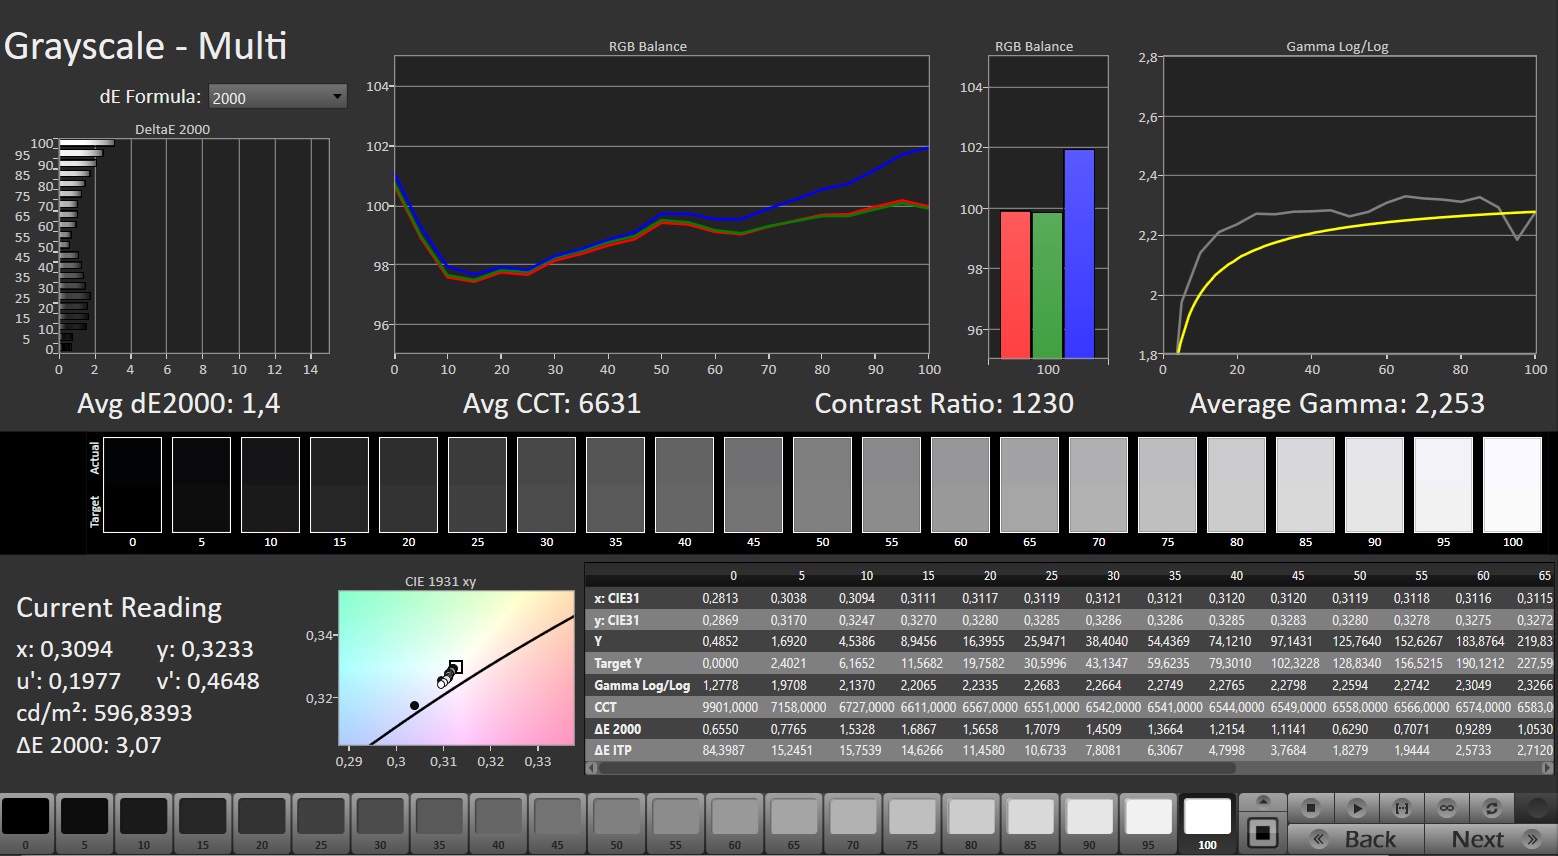

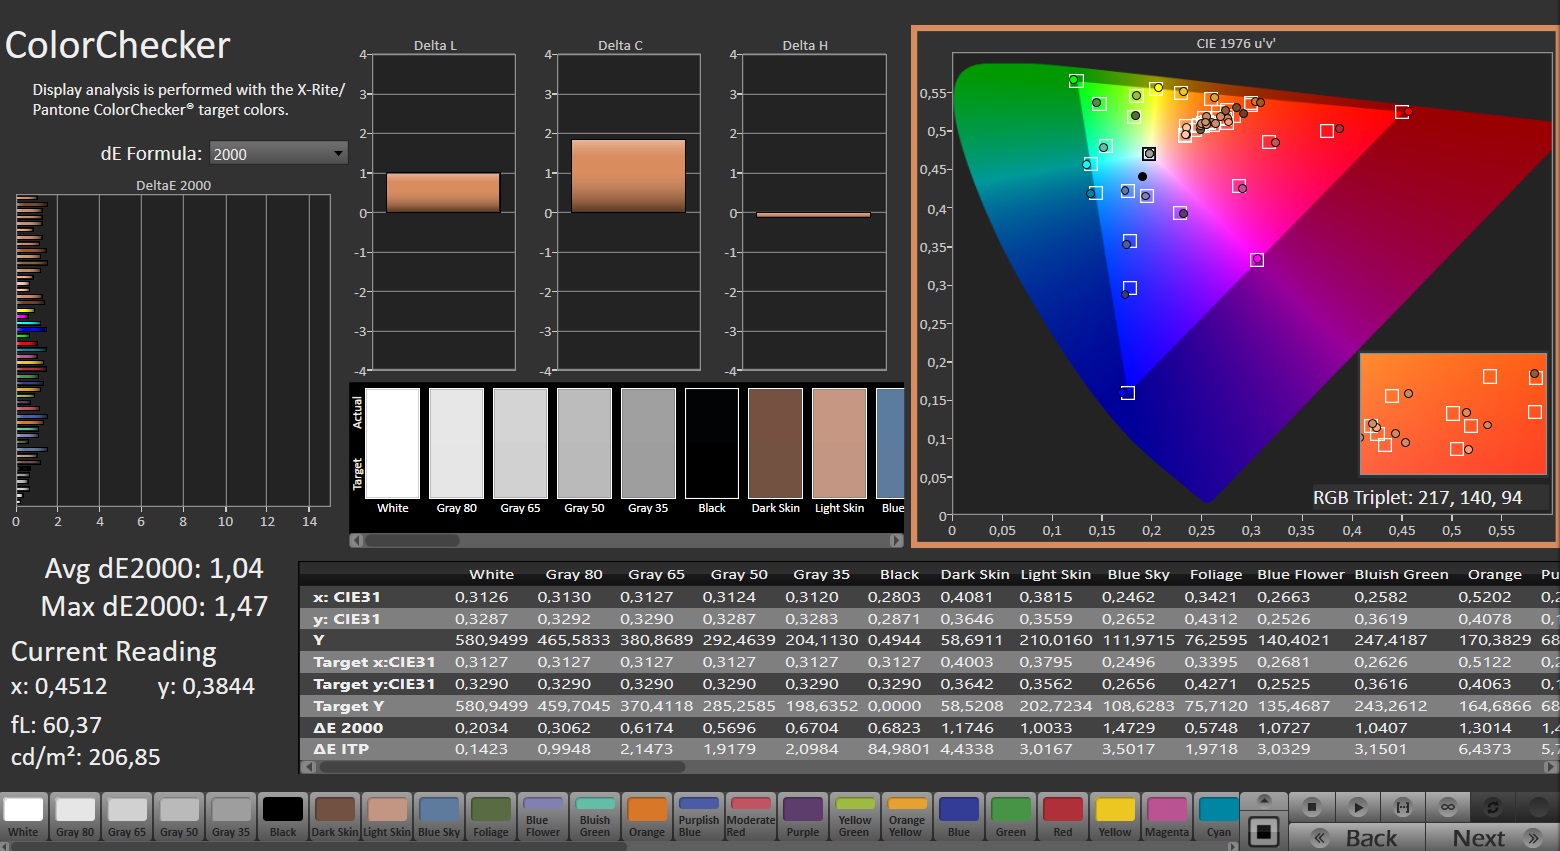
De helderheid is bijzonder opmerkelijk: een gemiddelde waarde van 502 cd/m2 is behoorlijk hoog voor een IPS-scherm en overtreft zelfs de normen van het bedrijf voor SDR-helderheid in een kamer (400 cd/m2). Gamers zullen de FreeSync en GSync ondersteuning zeker waarderen. Ondanks de maximale helderheid in het testveld, springt het contrast er niet uit tussen de concurrenten. Dit komt door de onbevredigende zwartwaarde van 0,48 cd/m².

De kijkhoeken voldoen aan de typische IPS-norm, zoals duidelijk te zien is op onze foto. Er waren geen merkbare schermflikkeringen.
Responstijd Scherm
| ↔ Responstijd Zwart naar Wit | ||
|---|---|---|
| 5.9 ms ... stijging ↗ en daling ↘ gecombineerd | ↗ 1.9 ms stijging | 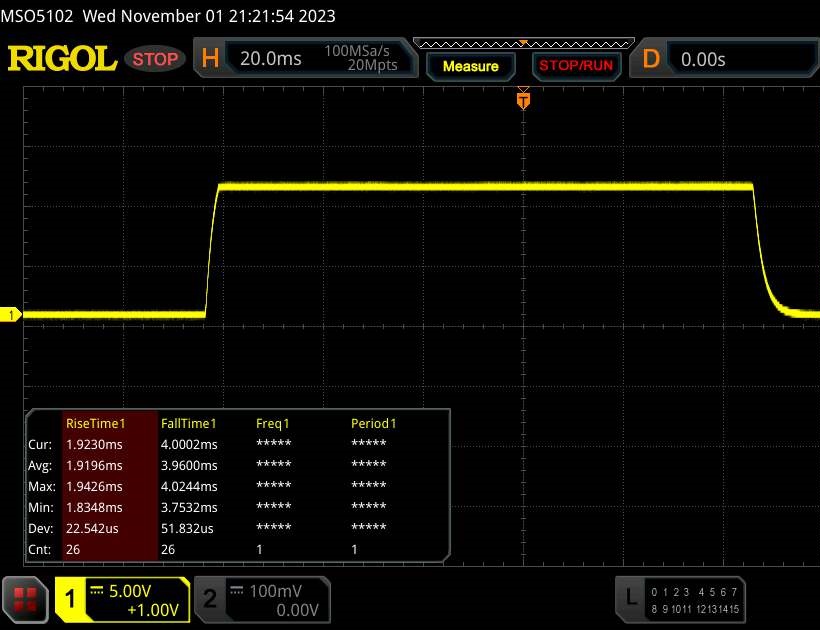 |
| ↘ 4 ms daling | ||
| Het scherm vertoonde erg snelle responstijden in onze tests en zou zeer geschikt moeten zijn voor snelle games. Ter vergelijking: alle testtoestellen variëren van 0.1 (minimum) tot 240 (maximum) ms. » 19 % van alle toestellen zijn beter. Dit betekent dat de gemeten responstijd beter is dan het gemiddelde (19.8 ms) van alle geteste toestellen. | ||
| ↔ Responstijd 50% Grijs naar 80% Grijs | ||
| 12.6 ms ... stijging ↗ en daling ↘ gecombineerd | ↗ 6.1 ms stijging | 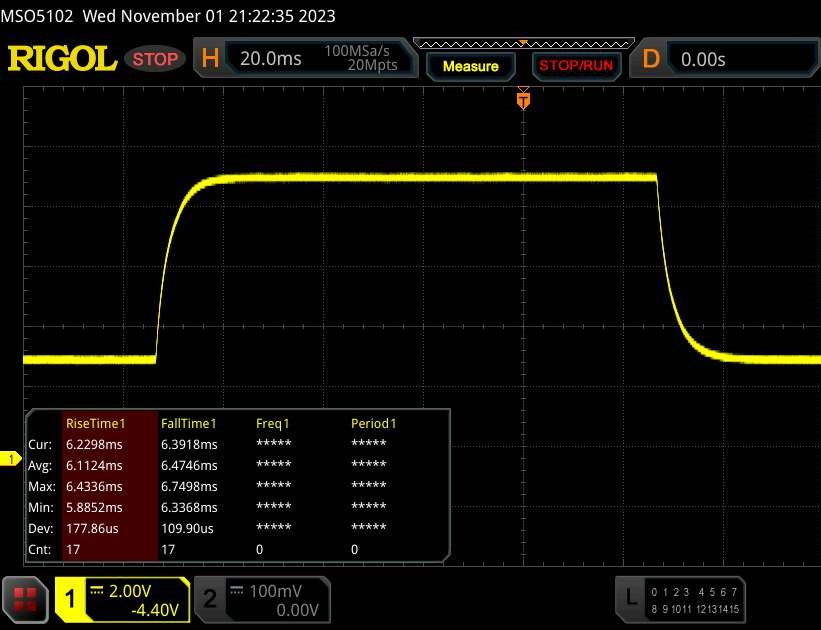 |
| ↘ 6.5 ms daling | ||
| Het scherm vertoonde prima responstijden in onze tests maar is misschien wat te traag voor competitieve games. Ter vergelijking: alle testtoestellen variëren van 0.165 (minimum) tot 636 (maximum) ms. » 26 % van alle toestellen zijn beter. Dit betekent dat de gemeten responstijd beter is dan het gemiddelde (31 ms) van alle geteste toestellen. | ||
Screen Flickering / PWM (Pulse-Width Modulation)
| Screen flickering / PWM niet waargenomen | 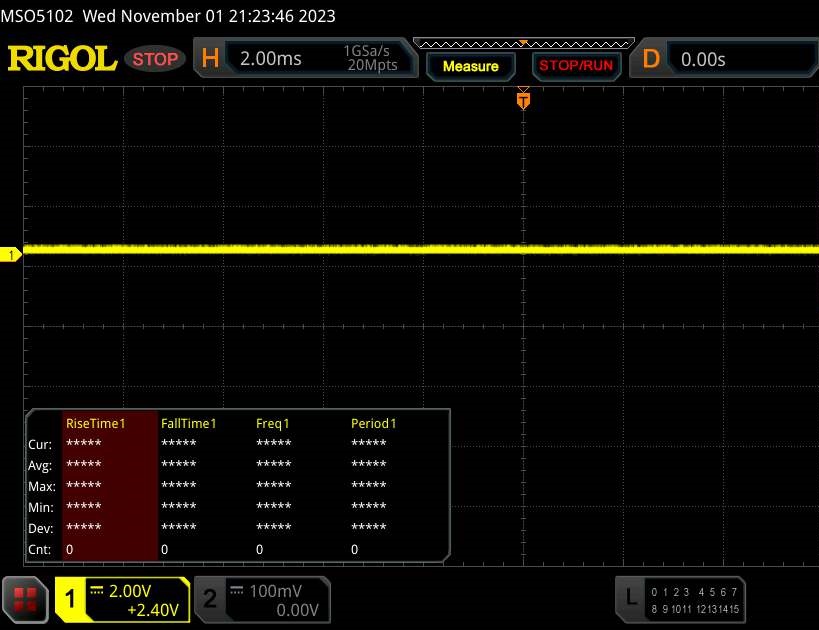 | ||
Ter vergelijking: 52 % van alle geteste toestellen maakten geen gebruik van PWM om de schermhelderheid te verlagen. Als het wel werd gebruikt, werd een gemiddelde van 7757 (minimum: 5 - maximum: 343500) Hz waargenomen. | |||
Prestaties
De GeForce RTX 4060 positioneert de Legion in het middensegment van gaming notebooks. Met 32 GB RAM en een SSD van 1 TB zou dit voorlopig genoeg moeten zijn voor de meeste kopers. Wie op zoek is naar hogere prestaties, kan kiezen voor de RTX 4070-versie. Maar Lenovo biedt momenteel geen RTX 4080 of RTX 4090 voor de Slim 7.
Testomstandigheden
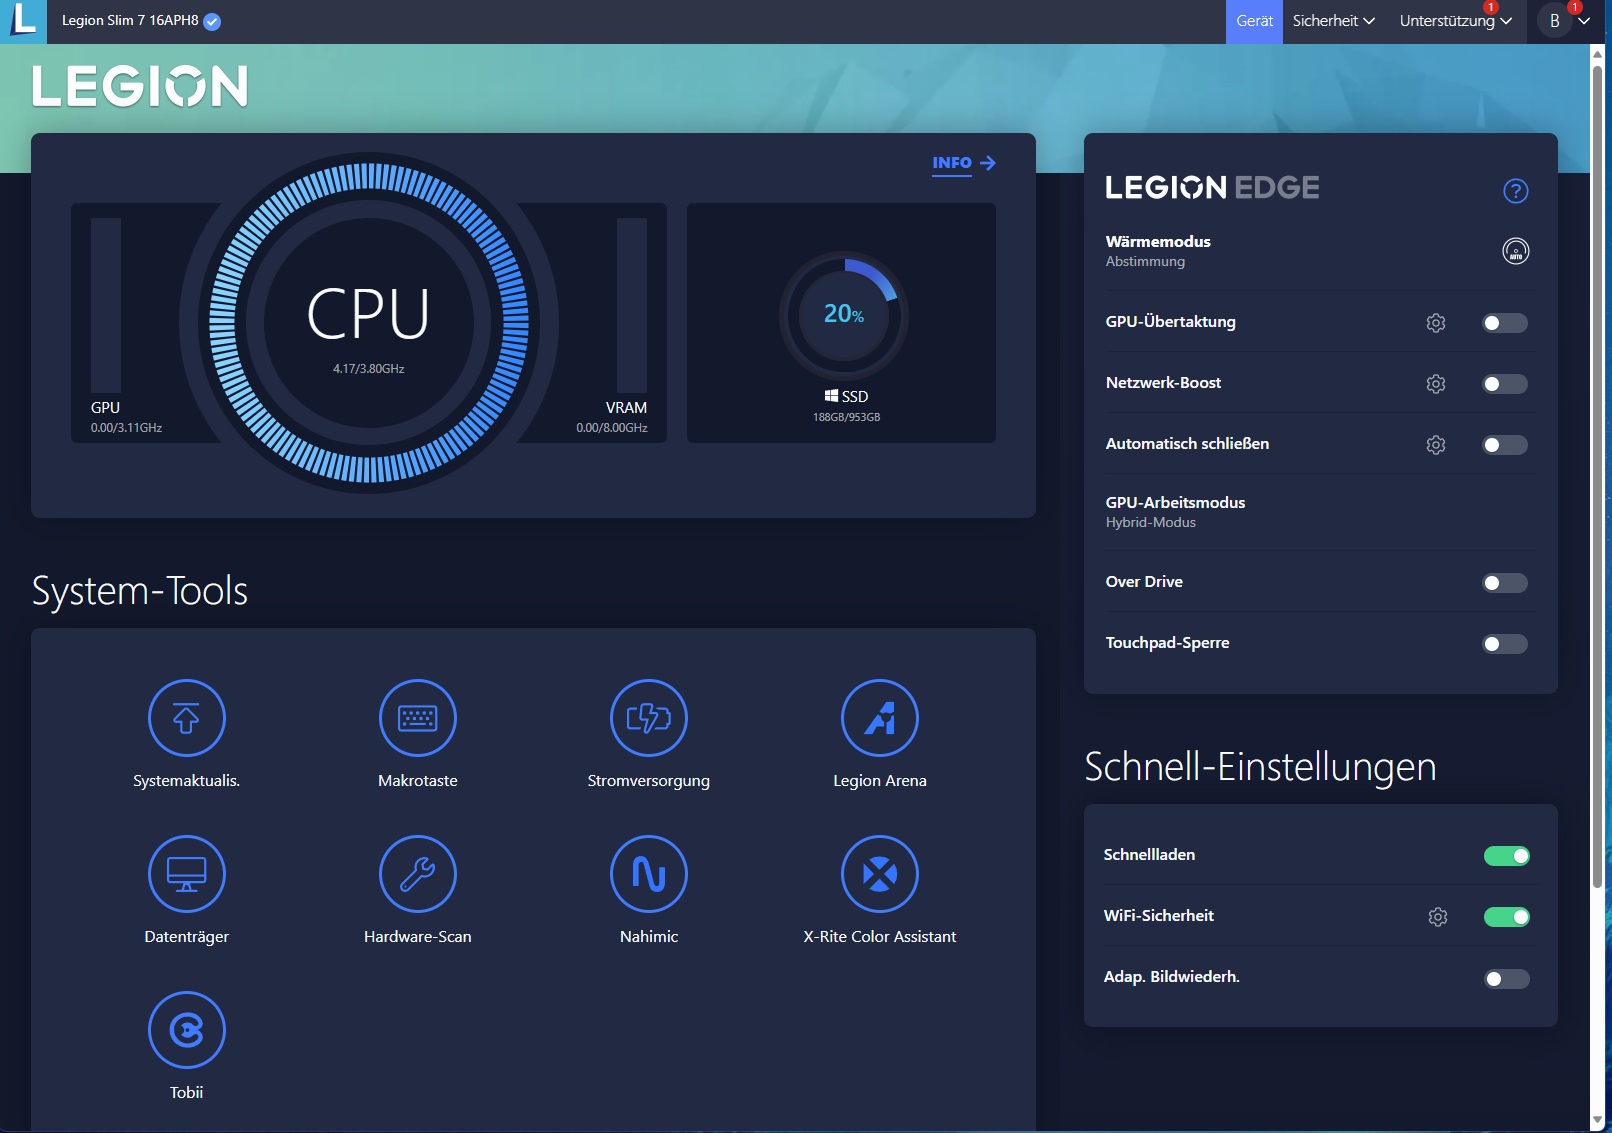
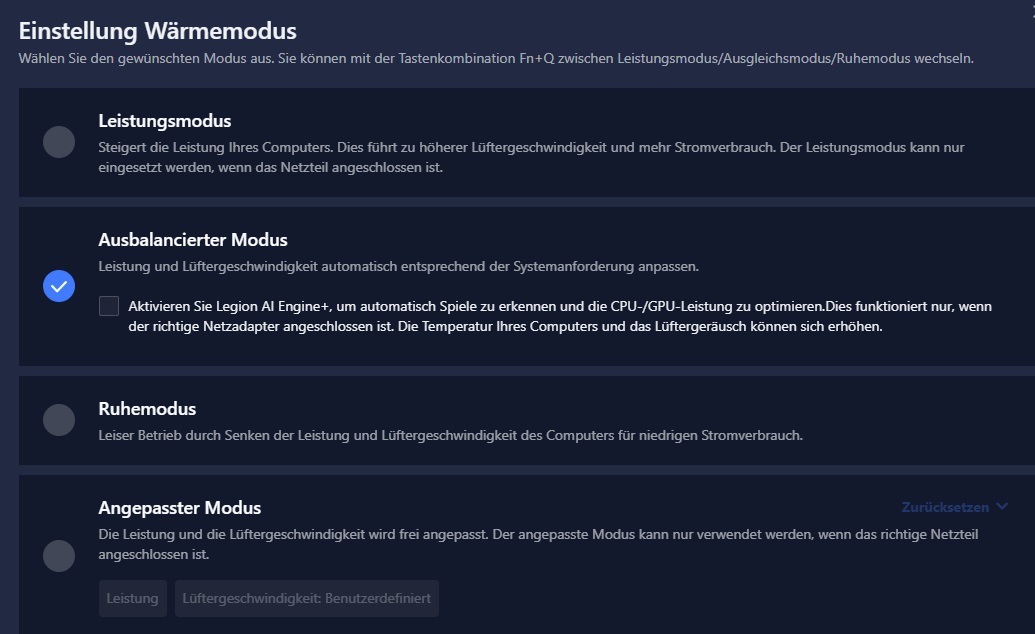
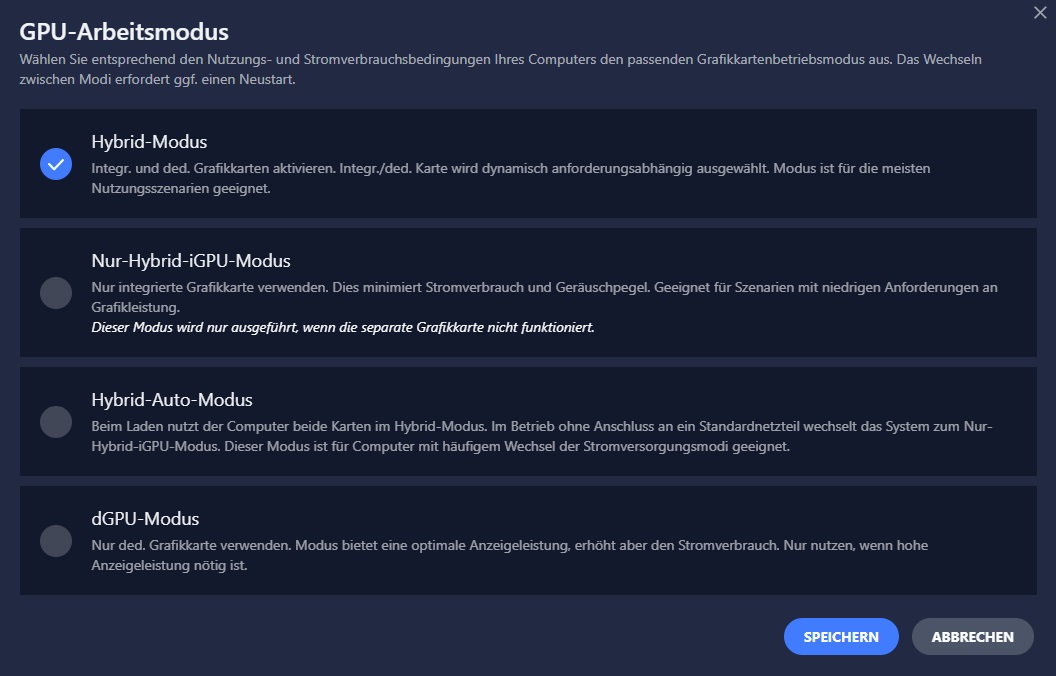
De vooraf geïnstalleerde Lenovo Vantage software valt op door de uitgebreide aanpassingsmogelijkheden. Naast de thermische modus kunnen gebruikers ook de GPU-werkmodus kiezen. Aangezien de FPS-toename in het Performance-profiel niet evenredig is met het hogere volume (zoals in de tabel te zien is), hebben we alle metingen in het Balanced-profiel uitgevoerd. De standaard grafische omschakeling (hybride modus) stond altijd aan.
| Stil | Gebalanceerd | Prestaties | |
|---|---|---|---|
| Ruis (Witcher 3, FHD/Ultra) | 36 dB(A) | 47 dB(A) | 52 dB(A) |
| Prestaties (Witcher 3, FHD/Ultra) | ~86 fps | ~98 fps | ~100 fps |
| Vermogenslimiet 1 (HWInfo) | 50 w | 54 w | 100 w |
| Vermogenslimiet 2 (HWInfo) | 60 w | 65 w | 125 w |
Processor
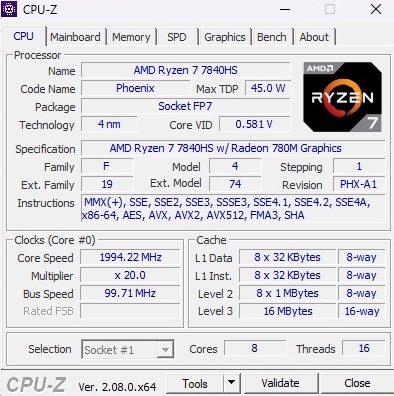
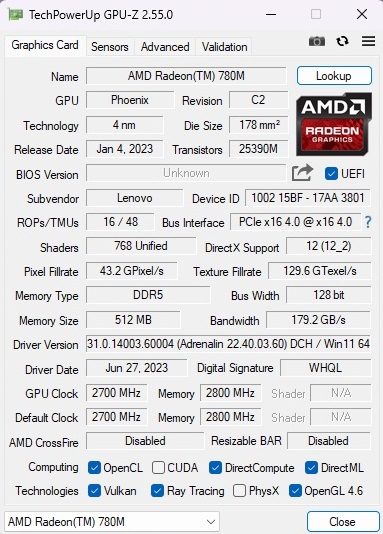
De Ryzen 7 7840HS is een achtkernige processor met 16 MB L3-cache en de mogelijkheid om tot 16 threads tegelijk te verwerken, dankzij SMT. Daarnaast beschikt de 4 nm-chip over een relatief snelle geïntegreerde GPU, de Radeon 780Mdie verantwoordelijk is voor beeldberekeningen en weergave, voor minder veeleisende taken zoals kantoorwerk, videostreaming en surfen op het web. Tijdens benchmarktests liggen de prestaties van de CPU tussen die van de Core i7-13620H en de Core i7-13700HX. Een opmerkelijk voordeel van de AMD-processor is de consistente prestatieverbetering, een eigenschap die niet volledig of slechts gedeeltelijk geldt voor veel Intel-tegenhangers, zoals blijkt uit benchmarks zoals de Cinebench-loop.
Cinebench R15 Multi Loop
* ... kleiner is beter
AIDA64: FP32 Ray-Trace | FPU Julia | CPU SHA3 | CPU Queen | FPU SinJulia | FPU Mandel | CPU AES | CPU ZLib | FP64 Ray-Trace | CPU PhotoWorxx
| Performance rating | |
| Gemiddelde van klas Gaming | |
| Gemiddeld AMD Ryzen 7 7840HS | |
| Alienware m16 R1 Intel | |
| Lenovo Legion Slim 7 16APH8 | |
| Acer Predator Helios 16 PH16-71-731Q | |
| Lenovo Legion Pro 5 16IRX8 | |
| Asus ROG Flow X16 GV601V | |
| Lenovo LOQ 16IRH8 | |
| AIDA64 / FP32 Ray-Trace | |
| Gemiddelde van klas Gaming (10227 - 85542, n=105, laatste 2 jaar) | |
| Gemiddeld AMD Ryzen 7 7840HS (22845 - 28921, n=21) | |
| Lenovo Legion Slim 7 16APH8 | |
| Lenovo Legion Pro 5 16IRX8 | |
| Alienware m16 R1 Intel | |
| Acer Predator Helios 16 PH16-71-731Q | |
| Asus ROG Flow X16 GV601V | |
| Lenovo LOQ 16IRH8 | |
| AIDA64 / FPU Julia | |
| Gemiddelde van klas Gaming (51376 - 238426, n=105, laatste 2 jaar) | |
| Lenovo Legion Slim 7 16APH8 | |
| Gemiddeld AMD Ryzen 7 7840HS (97164 - 123167, n=21) | |
| Lenovo Legion Pro 5 16IRX8 | |
| Alienware m16 R1 Intel | |
| Acer Predator Helios 16 PH16-71-731Q | |
| Asus ROG Flow X16 GV601V | |
| Lenovo LOQ 16IRH8 | |
| AIDA64 / CPU SHA3 | |
| Gemiddelde van klas Gaming (2180 - 10115, n=105, laatste 2 jaar) | |
| Alienware m16 R1 Intel | |
| Gemiddeld AMD Ryzen 7 7840HS (4293 - 5155, n=21) | |
| Lenovo Legion Slim 7 16APH8 | |
| Lenovo Legion Pro 5 16IRX8 | |
| Acer Predator Helios 16 PH16-71-731Q | |
| Asus ROG Flow X16 GV601V | |
| Lenovo LOQ 16IRH8 | |
| AIDA64 / CPU Queen | |
| Gemiddelde van klas Gaming (49785 - 173351, n=90, laatste 2 jaar) | |
| Lenovo Legion Slim 7 16APH8 | |
| Gemiddeld AMD Ryzen 7 7840HS (102271 - 125820, n=21) | |
| Alienware m16 R1 Intel | |
| Acer Predator Helios 16 PH16-71-731Q | |
| Lenovo Legion Pro 5 16IRX8 | |
| Asus ROG Flow X16 GV601V | |
| Lenovo LOQ 16IRH8 | |
| AIDA64 / FPU SinJulia | |
| Lenovo Legion Slim 7 16APH8 | |
| Gemiddeld AMD Ryzen 7 7840HS (13767 - 15525, n=21) | |
| Gemiddelde van klas Gaming (4424 - 33636, n=105, laatste 2 jaar) | |
| Alienware m16 R1 Intel | |
| Lenovo Legion Pro 5 16IRX8 | |
| Acer Predator Helios 16 PH16-71-731Q | |
| Asus ROG Flow X16 GV601V | |
| Lenovo LOQ 16IRH8 | |
| AIDA64 / FPU Mandel | |
| Gemiddelde van klas Gaming (25115 - 128721, n=105, laatste 2 jaar) | |
| Lenovo Legion Slim 7 16APH8 | |
| Gemiddeld AMD Ryzen 7 7840HS (52084 - 65812, n=21) | |
| Lenovo Legion Pro 5 16IRX8 | |
| Alienware m16 R1 Intel | |
| Acer Predator Helios 16 PH16-71-731Q | |
| Asus ROG Flow X16 GV601V | |
| Lenovo LOQ 16IRH8 | |
| AIDA64 / CPU AES | |
| Alienware m16 R1 Intel | |
| Acer Predator Helios 16 PH16-71-731Q | |
| Gemiddeld AMD Ryzen 7 7840HS (67389 - 177158, n=21) | |
| Gemiddelde van klas Gaming (39258 - 247074, n=105, laatste 2 jaar) | |
| Lenovo Legion Pro 5 16IRX8 | |
| Asus ROG Flow X16 GV601V | |
| Lenovo Legion Slim 7 16APH8 | |
| Lenovo LOQ 16IRH8 | |
| AIDA64 / CPU ZLib | |
| Gemiddelde van klas Gaming (574 - 2531, n=105, laatste 2 jaar) | |
| Acer Predator Helios 16 PH16-71-731Q | |
| Alienware m16 R1 Intel | |
| Lenovo Legion Pro 5 16IRX8 | |
| Asus ROG Flow X16 GV601V | |
| Lenovo Legion Slim 7 16APH8 | |
| Gemiddeld AMD Ryzen 7 7840HS (944 - 1123, n=21) | |
| Lenovo LOQ 16IRH8 | |
| AIDA64 / FP64 Ray-Trace | |
| Gemiddelde van klas Gaming (5509 - 45446, n=105, laatste 2 jaar) | |
| Gemiddeld AMD Ryzen 7 7840HS (12248 - 15599, n=21) | |
| Lenovo Legion Slim 7 16APH8 | |
| Lenovo Legion Pro 5 16IRX8 | |
| Alienware m16 R1 Intel | |
| Acer Predator Helios 16 PH16-71-731Q | |
| Asus ROG Flow X16 GV601V | |
| Lenovo LOQ 16IRH8 | |
| AIDA64 / CPU PhotoWorxx | |
| Gemiddelde van klas Gaming (12271 - 89891, n=105, laatste 2 jaar) | |
| Lenovo Legion Slim 7 16APH8 | |
| Asus ROG Flow X16 GV601V | |
| Gemiddeld AMD Ryzen 7 7840HS (17615 - 41516, n=21) | |
| Lenovo Legion Pro 5 16IRX8 | |
| Alienware m16 R1 Intel | |
| Acer Predator Helios 16 PH16-71-731Q | |
| Lenovo LOQ 16IRH8 | |
Systeemprestaties
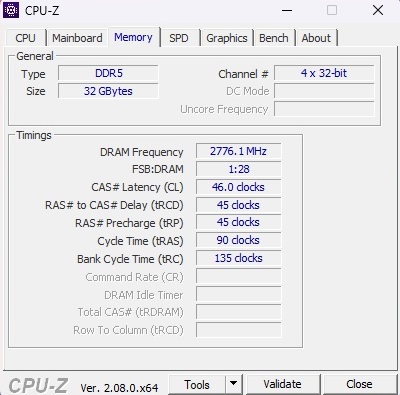
Op het gebied van systeemprestaties kan de Slim 7 gemakkelijk concurreren met zijn rivalen, met een score van 7.502 punten in PCMark 10. Het DDR5-geheugen, dat bekend staat om zijn uitzonderlijke snelheid, overtreft het gemiddelde. Bovendien reageert de computer prettig en snel in praktische gebruiksscenario's.
CrossMark: Overall | Productivity | Creativity | Responsiveness
| PCMark 10 / Score | |
| Gemiddelde van klas Gaming (5828 - 12414, n=93, laatste 2 jaar) | |
| Asus ROG Flow X16 GV601V | |
| Gemiddeld AMD Ryzen 7 7840HS, NVIDIA GeForce RTX 4060 Laptop GPU (7502 - 7946, n=4) | |
| Acer Predator Helios 16 PH16-71-731Q | |
| Lenovo Legion Pro 5 16IRX8 | |
| Lenovo Legion Slim 7 16APH8 | |
| Alienware m16 R1 Intel | |
| Lenovo LOQ 16IRH8 | |
| PCMark 10 / Essentials | |
| Asus ROG Flow X16 GV601V | |
| Acer Predator Helios 16 PH16-71-731Q | |
| Lenovo Legion Pro 5 16IRX8 | |
| Gemiddeld AMD Ryzen 7 7840HS, NVIDIA GeForce RTX 4060 Laptop GPU (10441 - 11169, n=4) | |
| Alienware m16 R1 Intel | |
| Gemiddelde van klas Gaming (8810 - 11935, n=97, laatste 2 jaar) | |
| Lenovo Legion Slim 7 16APH8 | |
| Lenovo LOQ 16IRH8 | |
| PCMark 10 / Productivity | |
| Gemiddelde van klas Gaming (6845 - 25323, n=95, laatste 2 jaar) | |
| Acer Predator Helios 16 PH16-71-731Q | |
| Asus ROG Flow X16 GV601V | |
| Gemiddeld AMD Ryzen 7 7840HS, NVIDIA GeForce RTX 4060 Laptop GPU (9575 - 10273, n=4) | |
| Lenovo Legion Slim 7 16APH8 | |
| Alienware m16 R1 Intel | |
| Lenovo Legion Pro 5 16IRX8 | |
| Lenovo LOQ 16IRH8 | |
| PCMark 10 / Digital Content Creation | |
| Gemiddelde van klas Gaming (7602 - 19954, n=95, laatste 2 jaar) | |
| Lenovo Legion Pro 5 16IRX8 | |
| Gemiddeld AMD Ryzen 7 7840HS, NVIDIA GeForce RTX 4060 Laptop GPU (11464 - 12418, n=4) | |
| Lenovo Legion Slim 7 16APH8 | |
| Asus ROG Flow X16 GV601V | |
| Acer Predator Helios 16 PH16-71-731Q | |
| Alienware m16 R1 Intel | |
| Lenovo LOQ 16IRH8 | |
| CrossMark / Overall | |
| Acer Predator Helios 16 PH16-71-731Q | |
| Alienware m16 R1 Intel | |
| Gemiddelde van klas Gaming (1366 - 2409, n=94, laatste 2 jaar) | |
| Asus ROG Flow X16 GV601V | |
| Lenovo LOQ 16IRH8 | |
| Gemiddeld AMD Ryzen 7 7840HS, NVIDIA GeForce RTX 4060 Laptop GPU (1800 - 1866, n=3) | |
| Lenovo Legion Pro 5 16IRX8 | |
| CrossMark / Productivity | |
| Acer Predator Helios 16 PH16-71-731Q | |
| Alienware m16 R1 Intel | |
| Lenovo LOQ 16IRH8 | |
| Asus ROG Flow X16 GV601V | |
| Gemiddelde van klas Gaming (1386 - 2254, n=94, laatste 2 jaar) | |
| Gemiddeld AMD Ryzen 7 7840HS, NVIDIA GeForce RTX 4060 Laptop GPU (1743 - 1821, n=3) | |
| Lenovo Legion Pro 5 16IRX8 | |
| CrossMark / Creativity | |
| Acer Predator Helios 16 PH16-71-731Q | |
| Gemiddelde van klas Gaming (1343 - 2786, n=94, laatste 2 jaar) | |
| Alienware m16 R1 Intel | |
| Asus ROG Flow X16 GV601V | |
| Lenovo LOQ 16IRH8 | |
| Gemiddeld AMD Ryzen 7 7840HS, NVIDIA GeForce RTX 4060 Laptop GPU (1908 - 1966, n=3) | |
| Lenovo Legion Pro 5 16IRX8 | |
| CrossMark / Responsiveness | |
| Acer Predator Helios 16 PH16-71-731Q | |
| Alienware m16 R1 Intel | |
| Lenovo LOQ 16IRH8 | |
| Gemiddelde van klas Gaming (1226 - 2334, n=94, laatste 2 jaar) | |
| Asus ROG Flow X16 GV601V | |
| Lenovo Legion Pro 5 16IRX8 | |
| Gemiddeld AMD Ryzen 7 7840HS, NVIDIA GeForce RTX 4060 Laptop GPU (1522 - 1776, n=3) | |
| PCMark 10 Score | 7502 punten | |
Help | ||
| AIDA64 / Memory Copy | |
| Gemiddelde van klas Gaming (21750 - 129946, n=105, laatste 2 jaar) | |
| Lenovo Legion Slim 7 16APH8 | |
| Gemiddeld AMD Ryzen 7 7840HS (30937 - 72158, n=21) | |
| Asus ROG Flow X16 GV601V | |
| Lenovo Legion Pro 5 16IRX8 | |
| Alienware m16 R1 Intel | |
| Acer Predator Helios 16 PH16-71-731Q | |
| Lenovo LOQ 16IRH8 | |
| AIDA64 / Memory Read | |
| Gemiddelde van klas Gaming (22956 - 118858, n=105, laatste 2 jaar) | |
| Asus ROG Flow X16 GV601V | |
| Lenovo Legion Pro 5 16IRX8 | |
| Alienware m16 R1 Intel | |
| Acer Predator Helios 16 PH16-71-731Q | |
| Lenovo LOQ 16IRH8 | |
| Lenovo Legion Slim 7 16APH8 | |
| Gemiddeld AMD Ryzen 7 7840HS (30497 - 62147, n=21) | |
| AIDA64 / Memory Write | |
| Lenovo Legion Slim 7 16APH8 | |
| Acer Predator Helios 16 PH16-71-731Q | |
| Gemiddeld AMD Ryzen 7 7840HS (34590 - 93323, n=21) | |
| Gemiddelde van klas Gaming (22297 - 135096, n=105, laatste 2 jaar) | |
| Lenovo Legion Pro 5 16IRX8 | |
| Asus ROG Flow X16 GV601V | |
| Alienware m16 R1 Intel | |
| Lenovo LOQ 16IRH8 | |
| AIDA64 / Memory Latency | |
| Lenovo LOQ 16IRH8 | |
| Gemiddelde van klas Gaming (75.3 - 259, n=105, laatste 2 jaar) | |
| Gemiddeld AMD Ryzen 7 7840HS (85.1 - 112, n=21) | |
| Asus ROG Flow X16 GV601V | |
| Lenovo Legion Slim 7 16APH8 | |
| Alienware m16 R1 Intel | |
| Acer Predator Helios 16 PH16-71-731Q | |
| Lenovo Legion Pro 5 16IRX8 | |
* ... kleiner is beter
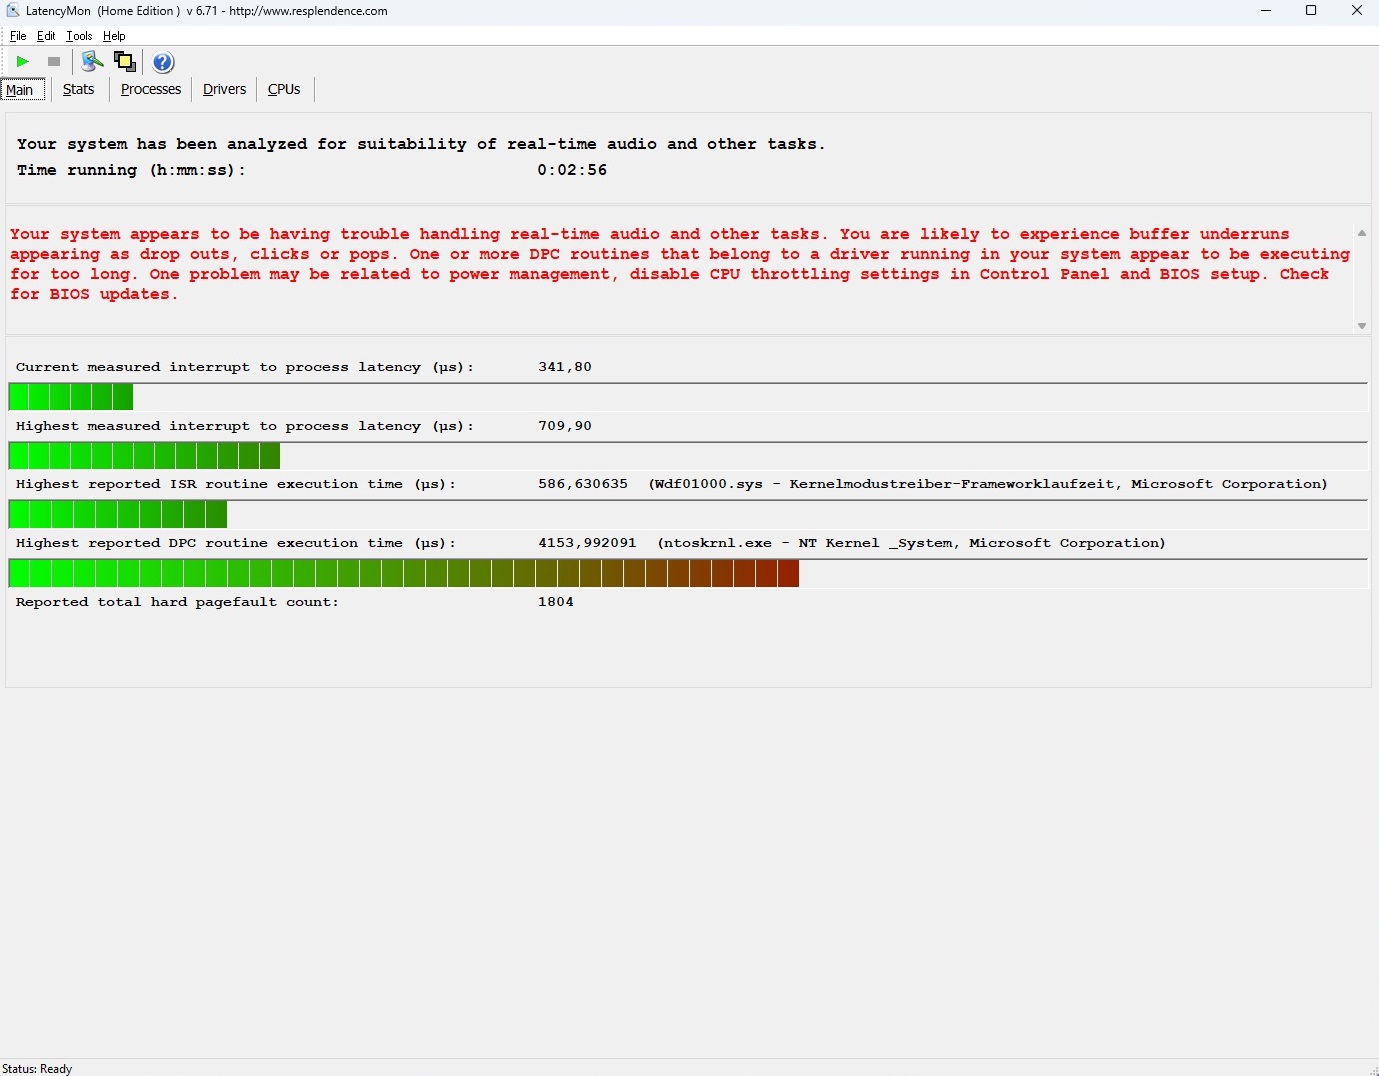
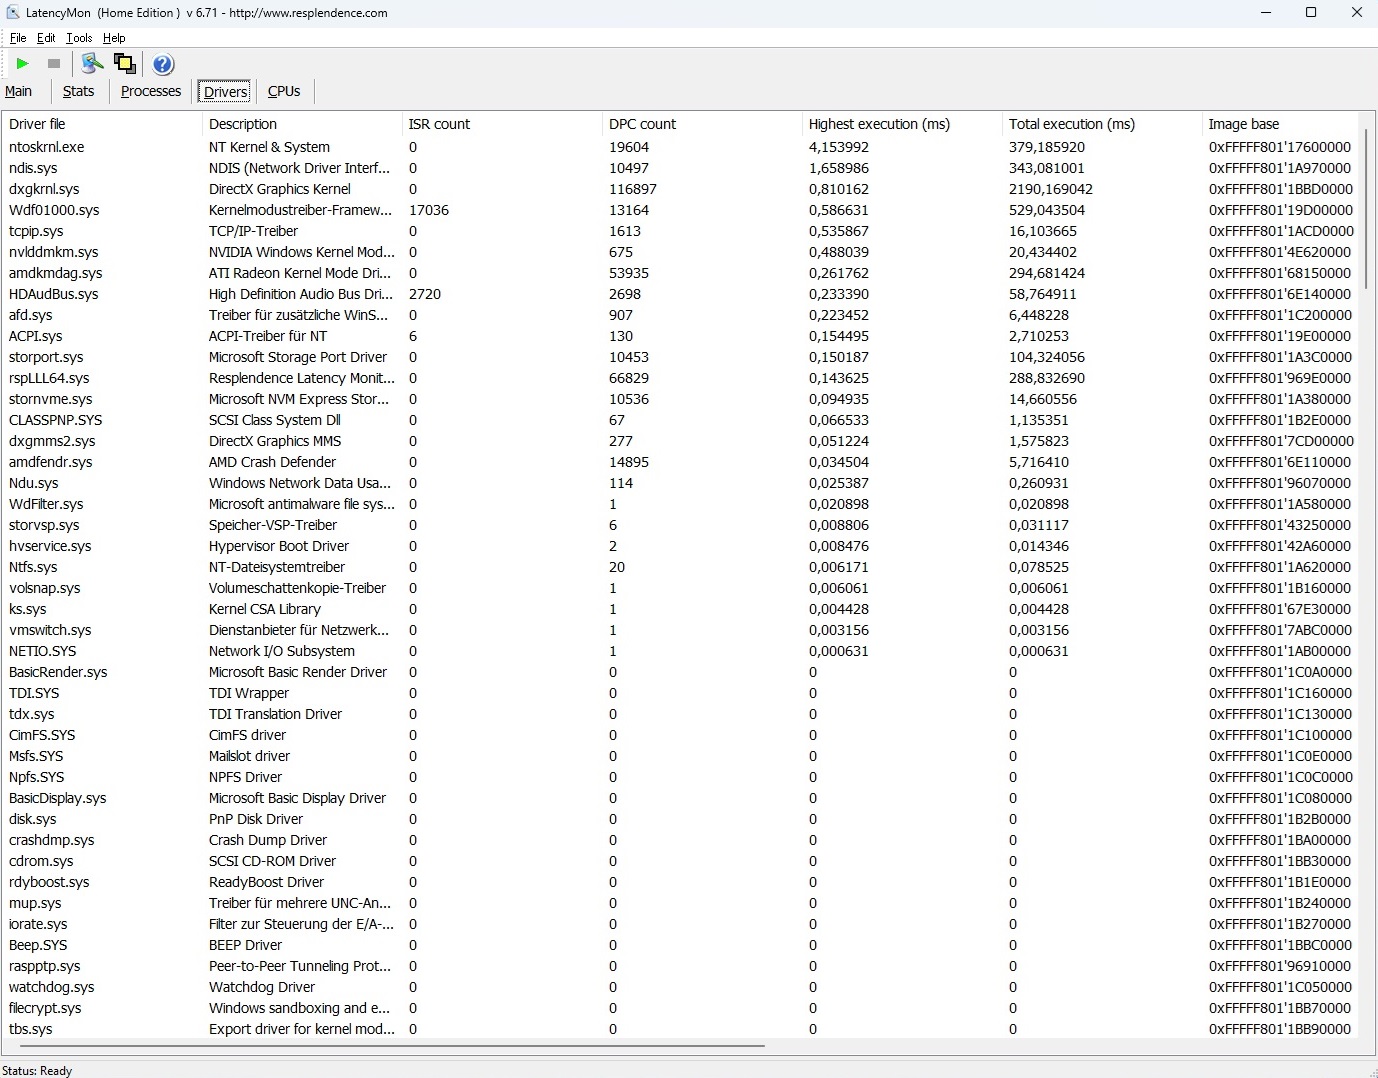
DPC latentie
Hoewel het de laagste latency van alle 16-inch apparaten in de test heeft, toont het LatencyMon-hulpprogramma mogelijke problemen met realtime audio- en videobewerking.
| DPC Latencies / LatencyMon - interrupt to process latency (max), Web, Youtube, Prime95 | |
| Alienware m16 R1 Intel | |
| Acer Predator Helios 16 PH16-71-731Q | |
| Lenovo LOQ 16IRH8 | |
| Asus ROG Flow X16 GV601V | |
| Lenovo Legion Pro 5 16IRX8 | |
| Lenovo Legion Slim 7 16APH8 | |
* ... kleiner is beter
Opslagapparaten
De geïntegreerde 1 TB SSD van WDC (model SN810) biedt over het algemeen een uitstekende snelheid, maar heeft af en toe last van throttling-problemen bij langdurige belasting. Deze problemen zijn echter niet zo ernstig als bij de Acer Predator Helios 16.

* ... kleiner is beter
Continuous power read: DiskSpd Read Loop, Queue Depth 8
Grafische kaart
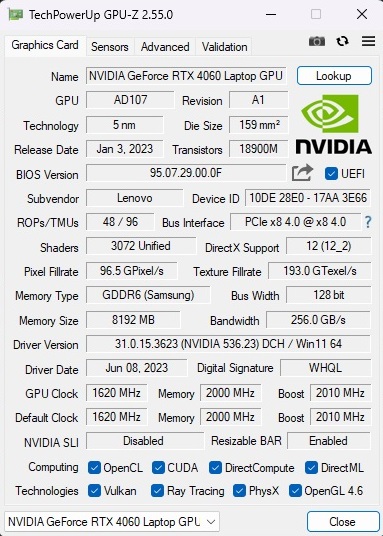
De GeForce RTX 4060 is een van de populairste en succesvolste laptop-GPU's van dit moment. Hoewel dit model uit het middensegment niet geschikt is voor UHD-schermen en mogelijk beperkt toekomstbestendig is vanwege de lage 8 GB GDDR6 VRAM-architectuur, zijn de prestaties voor Full HD (FHD) of Quad HD (QHD) resoluties toch opmerkelijk.
In synthetische grafische benchmarks zijn de 3D-prestaties in Gebalanceerde modus vergelijkbaar met de gemiddelde RTX 4060-prestaties tot nu toe, hoewel ze iets onder die van de vergelijkingsapparaten vallen. De Slim 7 komt zelfs niet in de buurt van de maximale TGP van 140 watt, inclusief Dynamic Boost.
| 3DMark 11 Performance | 30859 punten | |
| 3DMark Ice Storm Standard Score | 123335 punten | |
| 3DMark Cloud Gate Standard Score | 60481 punten | |
| 3DMark Fire Strike Score | 23735 punten | |
| 3DMark Time Spy Score | 10032 punten | |
Help | ||
* ... kleiner is beter
Gaming prestaties
De gaming benchmarks laten een vergelijkbaar patroon zien. Afgezien van een paar zeer veeleisende games zoals Lords of the Fallen of Alan Wake 2kunnen de meeste games zonder problemen op native resolutie met hoge tot maximale instellingen worden gespeeld, hoewel het bereiken van de 60 FPS-grens niet altijd gegarandeerd is.
| The Witcher 3 - 1920x1080 Ultra Graphics & Postprocessing (HBAO+) | |
| Gemiddelde van klas Gaming (104.7 - 240, n=7, laatste 2 jaar) | |
| Lenovo Legion Pro 5 16IRX8 | |
| Asus ROG Flow X16 GV601V | |
| Alienware m16 R1 Intel | |
| Lenovo LOQ 16IRH8 | |
| Acer Predator Helios 16 PH16-71-731Q | |
| Gemiddeld NVIDIA GeForce RTX 4060 Laptop GPU (77 - 159.7, n=42) | |
| Lenovo Legion Slim 7 16APH8 | |
| Alan Wake 2 | |
| 1920x1080 High Preset | |
| Gemiddelde van klas Gaming (61.7 - 133.2, n=31, laatste 2 jaar) | |
| Gemiddeld NVIDIA GeForce RTX 4060 Laptop GPU (53.8 - 64.3, n=3) | |
| XMG Pro 15 E23 | |
| Lenovo Legion Slim 7 16APH8 | |
| 2560x1440 High Preset | |
| Gemiddelde van klas Gaming (36.7 - 93.1, n=33, laatste 2 jaar) | |
| XMG Pro 15 E23 | |
| Gemiddeld NVIDIA GeForce RTX 4060 Laptop GPU (33 - 36.7, n=3) | |
| Lenovo Legion Slim 7 16APH8 | |
| Lords of the Fallen | |
| 1920x1080 High Preset | |
| XMG Pro 15 E23 | |
| Gemiddeld NVIDIA GeForce RTX 4060 Laptop GPU (46.7 - 53.9, n=3) | |
| Lenovo Legion Slim 7 16APH8 | |
| 1920x1080 Ultra Preset | |
| XMG Pro 15 E23 | |
| Gemiddeld NVIDIA GeForce RTX 4060 Laptop GPU (32.8 - 38.1, n=3) | |
| Lenovo Legion Slim 7 16APH8 | |
| 2560x1440 Ultra Preset | |
| XMG Pro 15 E23 | |
| Gemiddeld NVIDIA GeForce RTX 4060 Laptop GPU (24.2 - 25.7, n=2) | |
| Lenovo Legion Slim 7 16APH8 | |
| Total War Pharaoh | |
| 1920x1080 High Preset | |
| XMG Pro 15 E23 | |
| Gemiddeld NVIDIA GeForce RTX 4060 Laptop GPU (128 - 149, n=2) | |
| Lenovo Legion Slim 7 16APH8 | |
| Gemiddelde van klas Gaming (47.4 - 200, n=2, laatste 2 jaar) | |
| 1920x1080 Ultra Preset | |
| XMG Pro 15 E23 | |
| Gemiddeld NVIDIA GeForce RTX 4060 Laptop GPU (104 - 116, n=2) | |
| Lenovo Legion Slim 7 16APH8 | |
| Gemiddelde van klas Gaming (42.9 - 161.4, n=2, laatste 2 jaar) | |
| 2560x1440 Ultra Preset | |
| XMG Pro 15 E23 | |
| Gemiddeld NVIDIA GeForce RTX 4060 Laptop GPU (76 - 81.6, n=2) | |
| Lenovo Legion Slim 7 16APH8 | |
| Gemiddelde van klas Gaming (24.1 - 127.4, n=2, laatste 2 jaar) | |
| Assassin's Creed Mirage | |
| 1920x1080 High Preset (Adaptive Quality Off) | |
| XMG Pro 15 E23 | |
| Gemiddeld NVIDIA GeForce RTX 4060 Laptop GPU (76 - 118, n=4) | |
| Lenovo Legion Slim 7 16APH8 | |
| 1920x1080 Ultra High Preset (Adaptive Quality Off) | |
| XMG Pro 15 E23 | |
| Gemiddeld NVIDIA GeForce RTX 4060 Laptop GPU (65 - 93, n=6) | |
| Lenovo Legion Slim 7 16APH8 | |
| 2560x1440 Ultra High Preset (Adaptive Quality Off) | |
| XMG Pro 15 E23 | |
| Gemiddeld NVIDIA GeForce RTX 4060 Laptop GPU (64 - 72, n=5) | |
| Lenovo Legion Slim 7 16APH8 | |
| EA Sports FC 24 | |
| 1920x1080 High Preset | |
| Lenovo Legion Slim 7 16APH8 | |
| XMG Pro 15 E23 | |
| Gemiddeld NVIDIA GeForce RTX 4060 Laptop GPU (142.9 - 155.2, n=3) | |
| 1920x1080 Ultra Preset | |
| XMG Pro 15 E23 | |
| Gemiddeld NVIDIA GeForce RTX 4060 Laptop GPU (136.9 - 138, n=3) | |
| Lenovo Legion Slim 7 16APH8 | |
| Gemiddelde van klas Gaming (n=1laatste 2 jaar) | |
| 2560x1440 Ultra Preset | |
| XMG Pro 15 E23 | |
| Gemiddeld NVIDIA GeForce RTX 4060 Laptop GPU (117.5 - 121, n=2) | |
| Lenovo Legion Slim 7 16APH8 | |
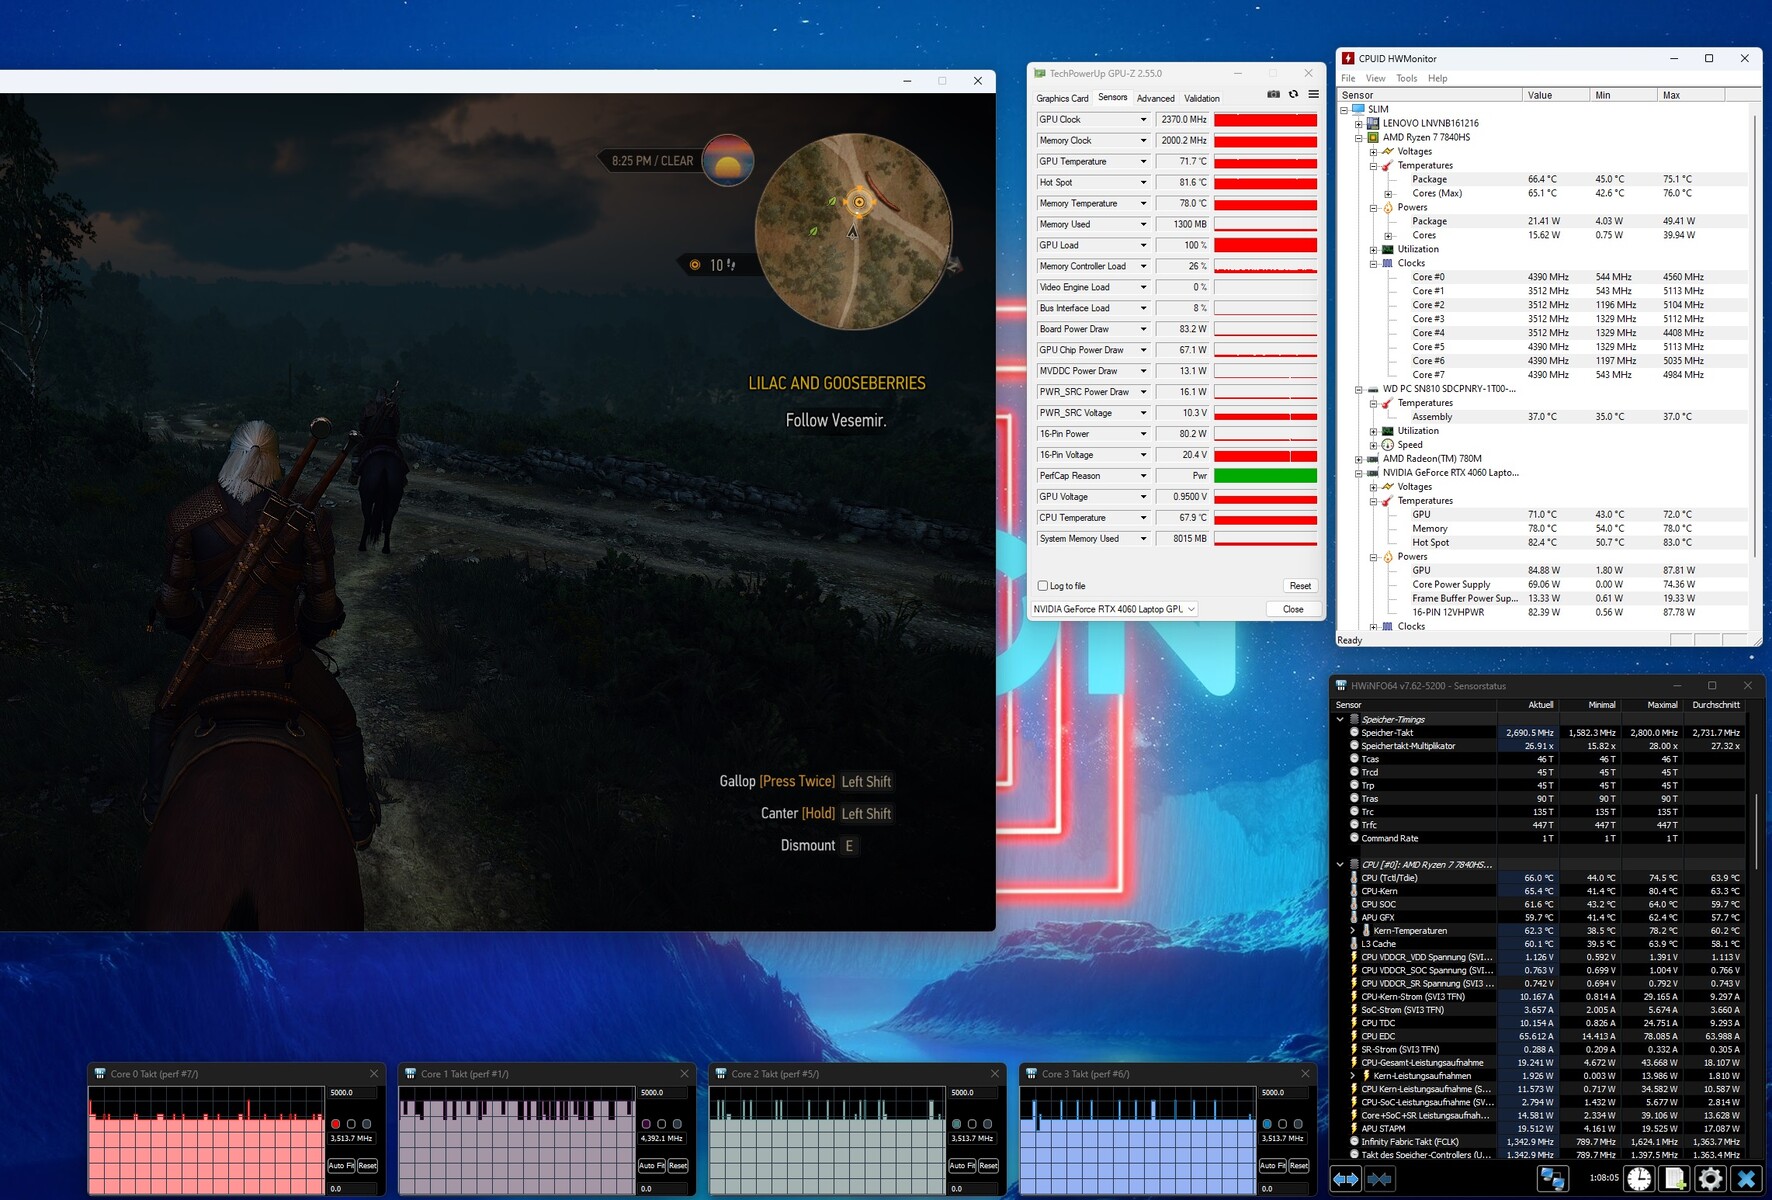
Tijdens de 60 minuten durende test met De Witcher 3werden er geen afwijkingen waargenomen. De framerate bleef gedurende de hele duur relatief stabiel.
Witcher 3 FPS chart
| lage | gem. | hoge | ultra | QHD | |
|---|---|---|---|---|---|
| GTA V (2015) | 172.9 | 166 | 103.2 | ||
| The Witcher 3 (2015) | 98 | ||||
| Dota 2 Reborn (2015) | 161.6 | 159.2 | 140.6 | 134.7 | |
| X-Plane 11.11 (2018) | 116 | 103.5 | 81.6 | ||
| Strange Brigade (2018) | 258 | 208 | 180.8 | ||
| Atomic Heart (2023) | 122.1 | 82.7 | 64.9 | 50.7 | |
| Company of Heroes 3 (2023) | 156 | 122 | 120 | 92 | |
| Sons of the Forest (2023) | 83.8 | 80.2 | 78.8 | 64.2 | |
| Resident Evil 4 Remake (2023) | 98.4 | 92.1 | 64.4 | 55.1 | |
| Armored Core 6 (2023) | 104.5 | 103.1 | 95.6 | 73.2 | |
| Baldur's Gate 3 (2023) | 98.7 | 84.8 | 82.6 | 55.8 | |
| EA Sports FC 24 (2023) | 187.9 | 155.2 | 136.9 | 117.5 | |
| Assassin's Creed Mirage (2023) | 80 | 76 | 65 | 64 | |
| Total War Pharaoh (2023) | 193 | 128 | 104 | 76 | |
| Lords of the Fallen (2023) | 66.4 | 48.2 | 33.2 | 24.2 | |
| Alan Wake 2 (2023) | 58.5 | 53.8 | 33.8 |
Uitstoot
Systeemgeluid
Het heeft de laagste geluidsniveaus in het testveld, met geluidsniveaus van 33 tot 49 dB(A) in 3D-modus. Voor geluidsgevoelige gamers raden we aan om de stille modus te kiezen, die resulteert in minimaal prestatieverlies terwijl het werkgeluid drastisch wordt verlaagd (raadpleeg de tabel voor specifieke testomstandigheden). De ventilatoren zijn af en toe helemaal stil als ze niet actief zijn, en zelfs als ze actief zijn, wordt het geproduceerde geluid tot een minimum beperkt. Het is het vermelden waard dat onze testunit geen tekenen van spoelgejank vertoonde.
Geluidsniveau
| Onbelast |
| 25 / 28 / 31 dB (A) |
| Belasting |
| 33 / 49 dB (A) |
 | ||
30 dB stil 40 dB(A) hoorbaar 50 dB(A) luid |
||
min: | ||
| Lenovo Legion Slim 7 16APH8 R7 7840HS, GeForce RTX 4060 Laptop GPU | Asus ROG Flow X16 GV601V i9-13900H, GeForce RTX 4060 Laptop GPU | Alienware m16 R1 Intel i7-13700HX, GeForce RTX 4060 Laptop GPU | Acer Predator Helios 16 PH16-71-731Q i7-13700HX, GeForce RTX 4060 Laptop GPU | Lenovo Legion Pro 5 16IRX8 i7-13700HX, GeForce RTX 4060 Laptop GPU | Lenovo LOQ 16IRH8 i7-13620H, GeForce RTX 4060 Laptop GPU | |
|---|---|---|---|---|---|---|
| Noise | 3% | -8% | -0% | 4% | -6% | |
| uit / omgeving * (dB) | 24 | 24 -0% | 25 -4% | 24 -0% | 23 4% | 23 4% |
| Idle Minimum * (dB) | 25 | 24 4% | 25 -0% | 24 4% | 23.1 8% | 23 8% |
| Idle Average * (dB) | 28 | 24 14% | 26 7% | 24 14% | 23.1 17% | 23 18% |
| Idle Maximum * (dB) | 31 | 24 23% | 27 13% | 32.32 -4% | 26.6 14% | 27.66 11% |
| Load Average * (dB) | 33 | 36.71 -11% | 52 -58% | 36.66 -11% | 34.7 -5% | 53.62 -62% |
| Witcher 3 ultra * (dB) | 47 | 50.92 -8% | 51 -9% | 49.06 -4% | 47.6 -1% | 53.5 -14% |
| Load Maximum * (dB) | 49 | 50.92 -4% | 53 -8% | 49.49 -1% | 54.8 -12% | 53.5 -9% |
* ... kleiner is beter
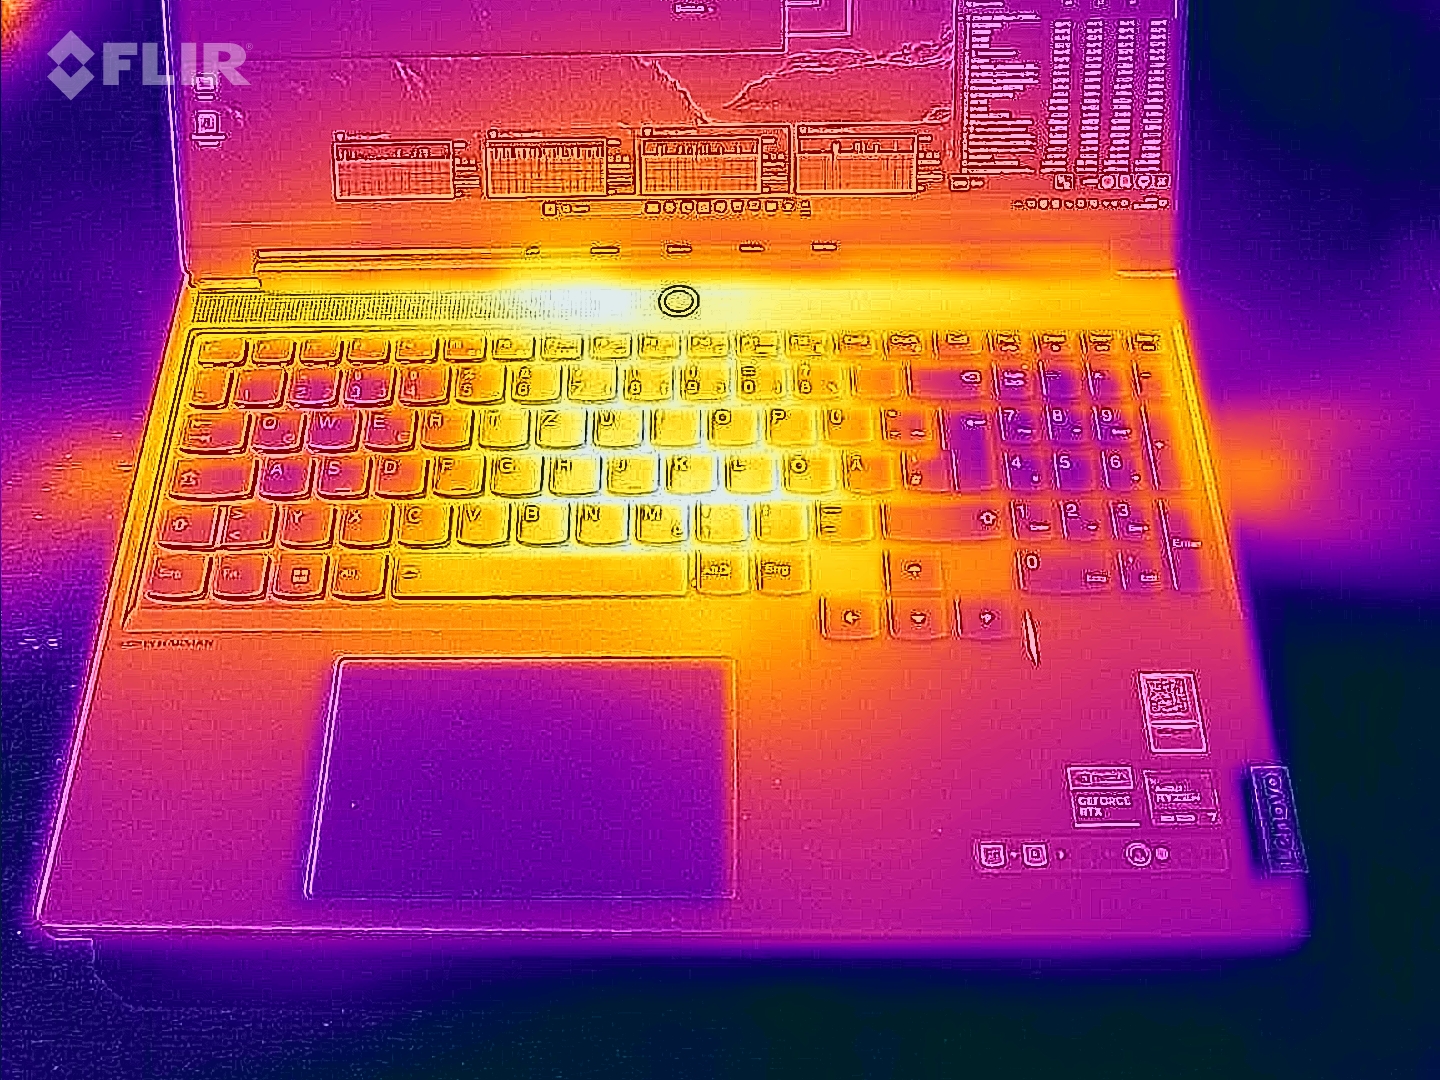
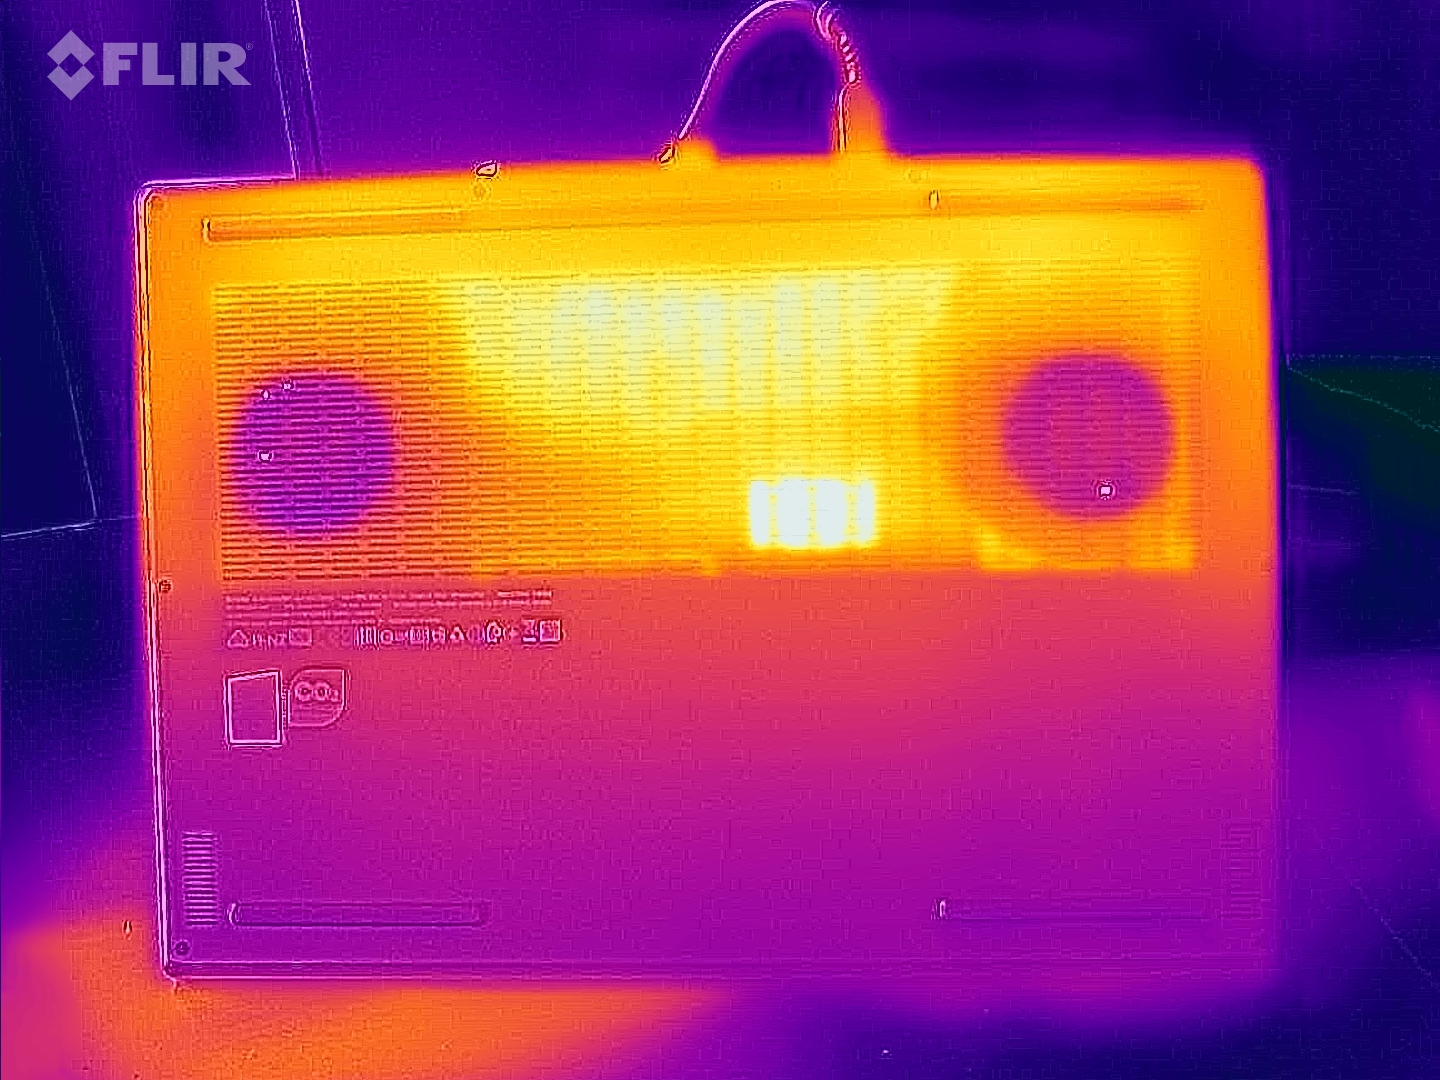
Temperatuur
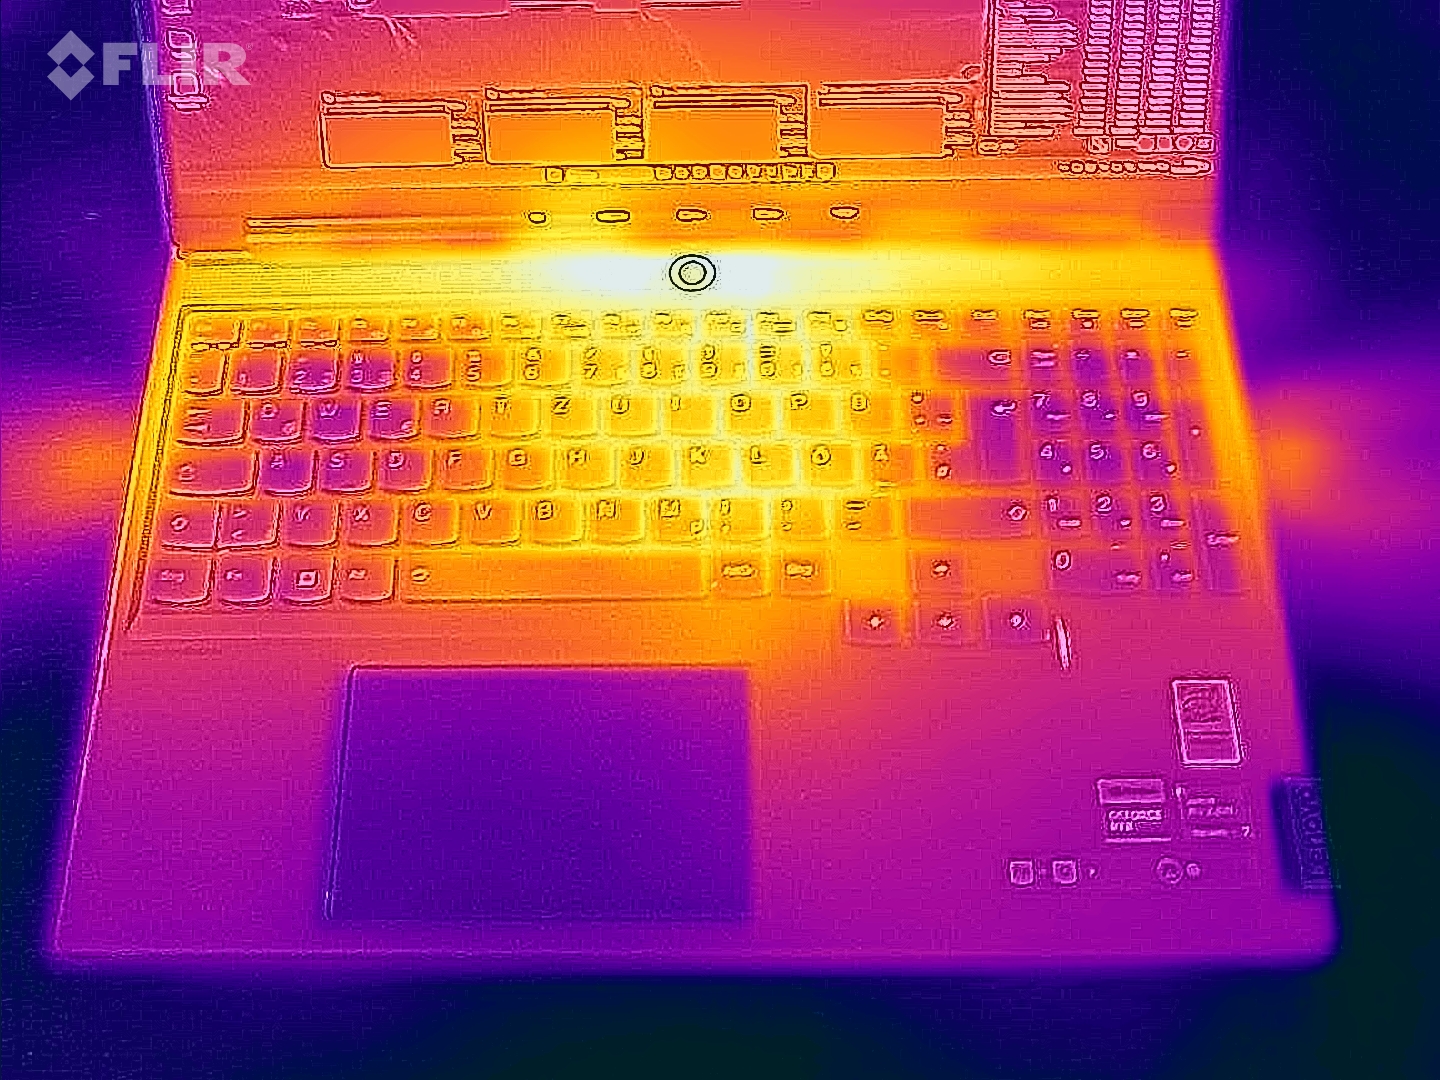
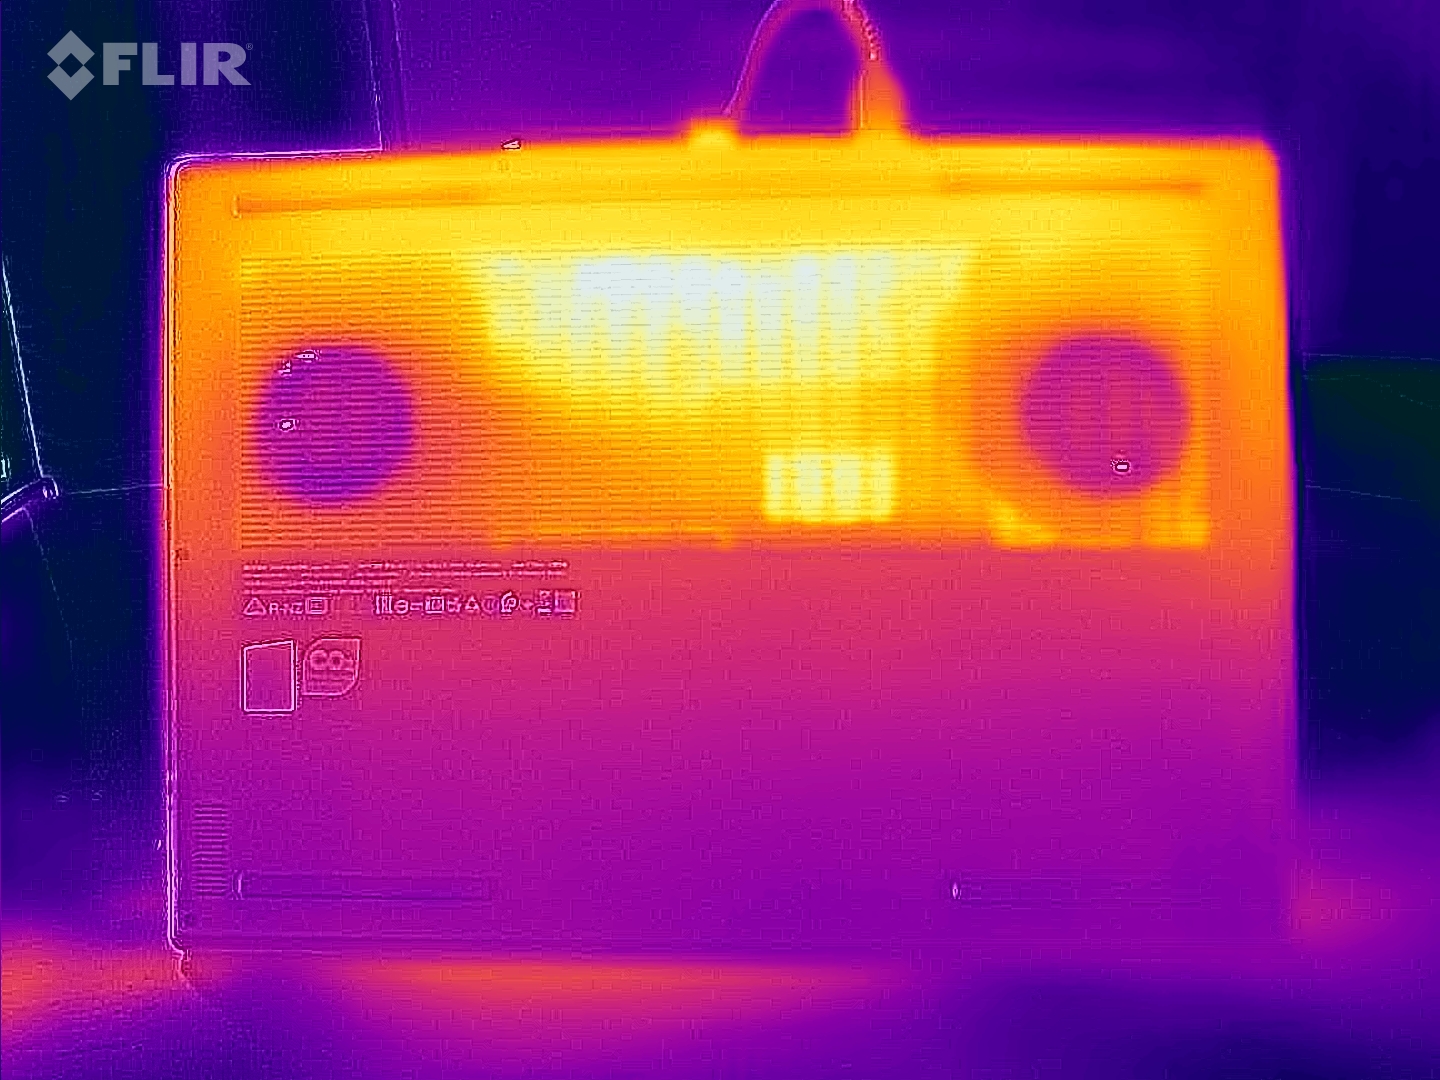
De temperatuur in de behuizing ligt binnen het middenbereik en bereikt geen uitzonderlijk lage of hoge niveaus. Tijdens stresstests met de tools Furmark en Prime95 gaf de grafische kaart gas, waardoor de hoogste temperaturen werden waargenomen in de gamingmodus. Na 60 minuten The Witcher 3 te hebben uitgevoerd, bereikte het chassis een maximum van 49°C aan de bovenkant en 52°C aan de onderkant, wat typische waarden zijn voor een gaming notebook. In de ruststand schommelen de oppervlaktetemperaturen rond een gemiddelde van 30°C, wat duidt op een gematigd warmteniveau.
(-) De maximumtemperatuur aan de bovenzijde bedraagt 46 °C / 115 F, vergeleken met het gemiddelde van 40.4 °C / 105 F, variërend van 21.2 tot 68.8 °C voor de klasse Gaming.
(-) De bodem warmt op tot een maximum van 46 °C / 115 F, vergeleken met een gemiddelde van 43.2 °C / 110 F
(+) Bij onbelast gebruik bedraagt de gemiddelde temperatuur voor de bovenzijde 30.3 °C / 87 F, vergeleken met het apparaatgemiddelde van 33.9 °C / 93 F.
(-) Bij het spelen van The Witcher 3 is de gemiddelde temperatuur voor de bovenzijde 41.6 °C / 107 F, vergeleken met het apparaatgemiddelde van 33.9 °C / 93 F.
(+) De handpalmsteunen en het touchpad bereiken maximaal de huidtemperatuur (35 °C / 95 F) en zijn dus niet heet.
(-) De gemiddelde temperatuur van de handpalmsteun van soortgelijke toestellen bedroeg 28.8 °C / 83.8 F (-6.2 °C / -11.2 F).
| Lenovo Legion Slim 7 16APH8 R7 7840HS, GeForce RTX 4060 Laptop GPU | Asus ROG Flow X16 GV601V i9-13900H, GeForce RTX 4060 Laptop GPU | Alienware m16 R1 Intel i7-13700HX, GeForce RTX 4060 Laptop GPU | Acer Predator Helios 16 PH16-71-731Q i7-13700HX, GeForce RTX 4060 Laptop GPU | Lenovo Legion Pro 5 16IRX8 i7-13700HX, GeForce RTX 4060 Laptop GPU | Lenovo LOQ 16IRH8 i7-13620H, GeForce RTX 4060 Laptop GPU | |
|---|---|---|---|---|---|---|
| Heat | 1% | -12% | -13% | 2% | 0% | |
| Maximum Upper Side * (°C) | 46 | 46 -0% | 49 -7% | 41 11% | 42.8 7% | 48 -4% |
| Maximum Bottom * (°C) | 46 | 41 11% | 48 -4% | 66 -43% | 50 -9% | 59 -28% |
| Idle Upper Side * (°C) | 33 | 36 -9% | 40 -21% | 36 -9% | 29.6 10% | 28 15% |
| Idle Bottom * (°C) | 34 | 33 3% | 39 -15% | 37 -9% | 34 -0% | 28 18% |
* ... kleiner is beter
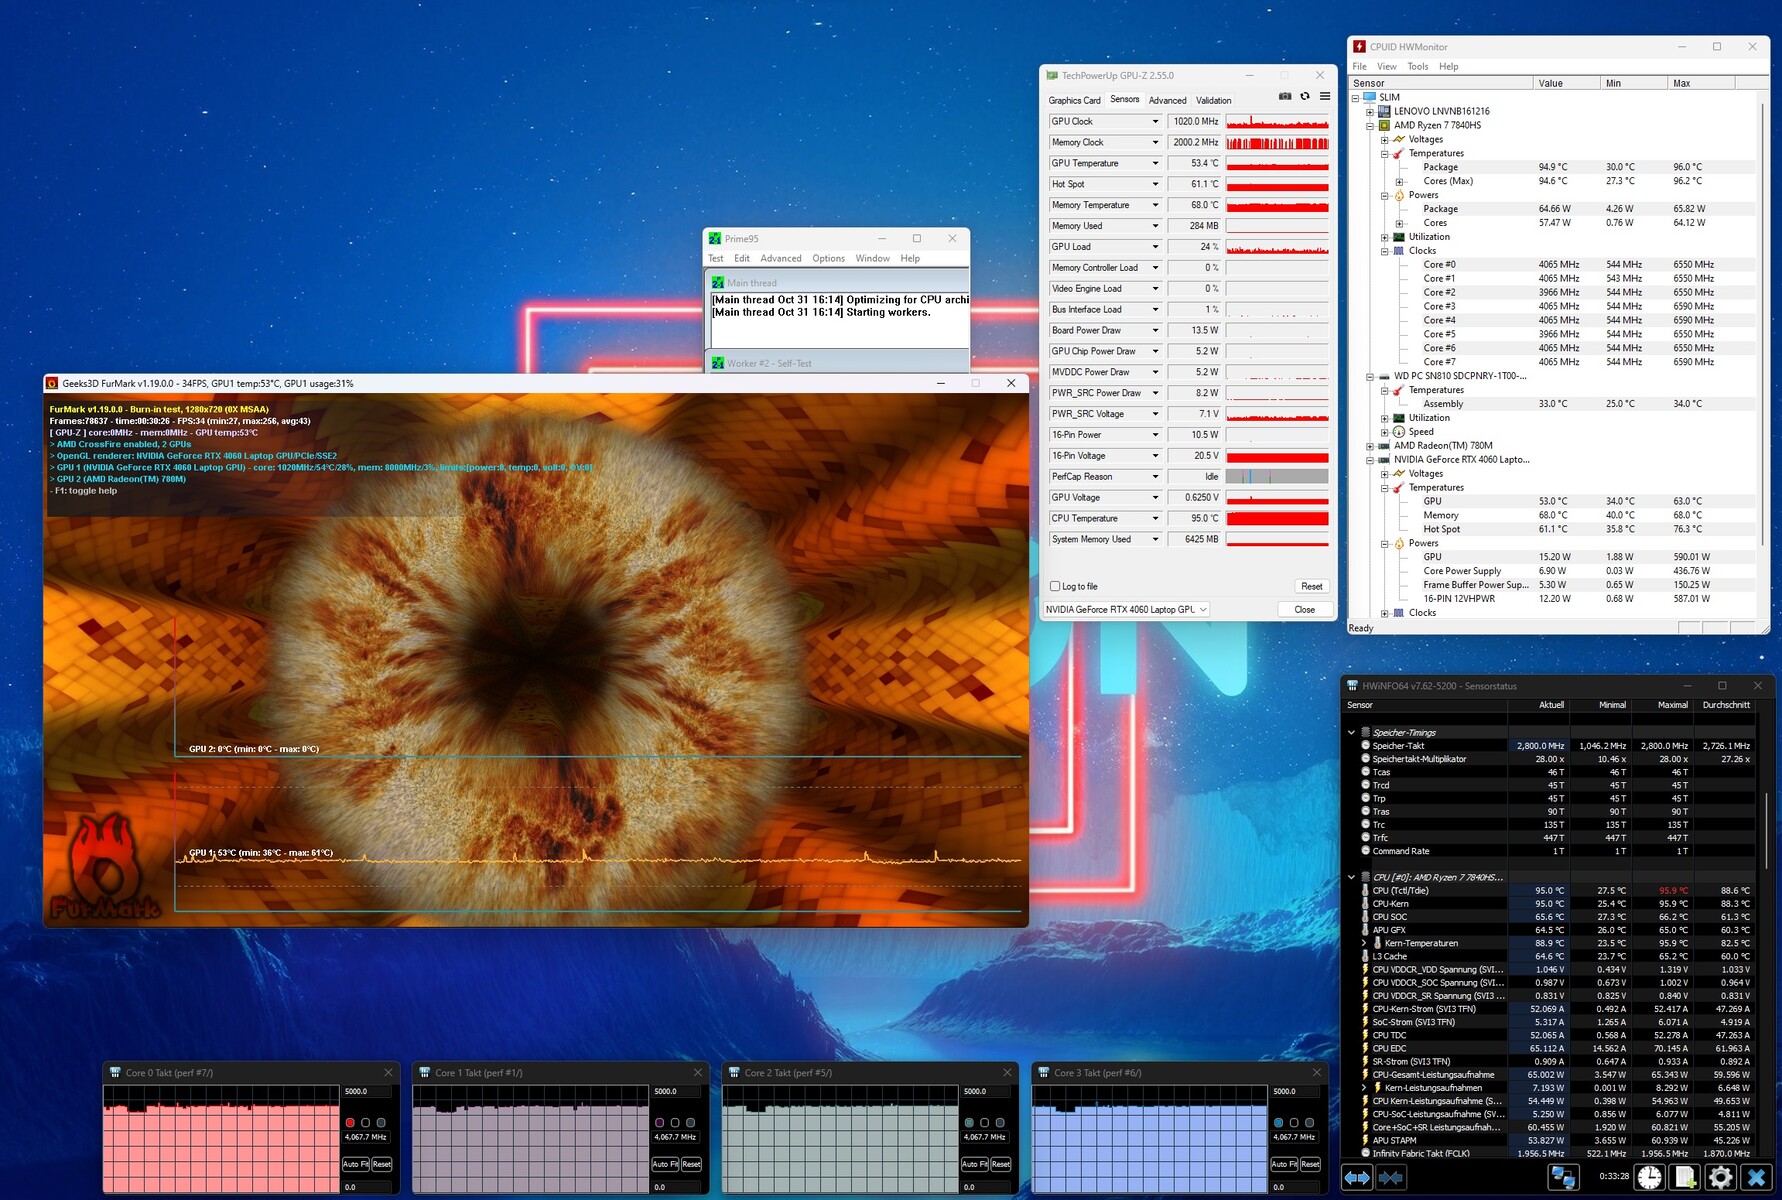
Stresstest
De CPU werd behoorlijk heet tijdens onze 60-minuten durende stresstest. Hoewel de Ryzen 7 7840HS 95°C bereikte, bleef hij constant op 4,1 GHz. In de gamingmodus is de situatie aanzienlijk rustiger. Tijdens het spelen van The Witcher 3 schommelde de CPU-temperatuur op 66°C, terwijl de temperatuur van de grafische kaart net onder 72°C bleef.
Luidsprekers
De geluidskwaliteit overtreft die van de meeste concurrenten. Het 2.0 systeem (Harman) produceert een robuust geluid dat indien nodig aangenaam luid kan zijn. Net als bij de meeste notebooks ontbreken de lage tonen echter een beetje.
Lenovo Legion Slim 7 16APH8 audioanalyse
(+) | luidsprekers kunnen relatief luid spelen (87 dB)
Bas 100 - 315 Hz
(±) | verminderde zeebaars - gemiddeld 13.8% lager dan de mediaan
(±) | lineariteit van de lage tonen is gemiddeld (8.5% delta ten opzichte van de vorige frequentie)
Midden 400 - 2000 Hz
(+) | evenwichtige middens - slechts 1.1% verwijderd van de mediaan
(+) | de middentonen zijn lineair (2.5% delta ten opzichte van de vorige frequentie)
Hoog 2 - 16 kHz
(+) | evenwichtige hoogtepunten - slechts 4.1% verwijderd van de mediaan
(+) | de hoge tonen zijn lineair (4.8% delta naar de vorige frequentie)
Algemeen 100 - 16.000 Hz
(+) | het totale geluid is lineair (9.9% verschil met de mediaan)
Vergeleken met dezelfde klasse
» 5% van alle geteste apparaten in deze klasse waren beter, 2% vergelijkbaar, 94% slechter
» De beste had een delta van 6%, het gemiddelde was 18%, de slechtste was 132%
Vergeleken met alle geteste toestellen
» 4% van alle geteste apparaten waren beter, 1% gelijk, 95% slechter
» De beste had een delta van 4%, het gemiddelde was 23%, de slechtste was 134%
Asus ROG Flow X16 GV601V audioanalyse
(±) | luidspreker luidheid is gemiddeld maar goed (77.38 dB)
Bas 100 - 315 Hz
(±) | verminderde zeebaars - gemiddeld 9.6% lager dan de mediaan
(±) | lineariteit van de lage tonen is gemiddeld (9.2% delta ten opzichte van de vorige frequentie)
Midden 400 - 2000 Hz
(+) | evenwichtige middens - slechts 4.7% verwijderd van de mediaan
(±) | lineariteit van de middentonen is gemiddeld (7.5% delta ten opzichte van de vorige frequentie)
Hoog 2 - 16 kHz
(+) | evenwichtige hoogtepunten - slechts 2.2% verwijderd van de mediaan
(+) | de hoge tonen zijn lineair (6.1% delta naar de vorige frequentie)
Algemeen 100 - 16.000 Hz
(+) | het totale geluid is lineair (12% verschil met de mediaan)
Vergeleken met dezelfde klasse
» 12% van alle geteste apparaten in deze klasse waren beter, 4% vergelijkbaar, 84% slechter
» De beste had een delta van 6%, het gemiddelde was 18%, de slechtste was 132%
Vergeleken met alle geteste toestellen
» 9% van alle geteste apparaten waren beter, 2% gelijk, 88% slechter
» De beste had een delta van 4%, het gemiddelde was 23%, de slechtste was 134%
Energiebeheer
Stroomverbruik
Het stroomverbruik lijkt soms inconsistent. Ondanks actieve grafische schakelingen is het stroomverbruik in ruststand van 33 tot 45 watt hoger dan gemiddeld. Het stroomverbruik van 3DMark 06 van ongeveer 59 watt is echter erg laag. Bovendien liggen de resultaten tijdens The Witcher 3 (131 watt) en de stresstest (maximaal 177 watt) onder die van de concurrentie, wat de energie-efficiëntie van de Zen 4 CPU laat zien, in ieder geval onder belasting.
| Uit / Standby | |
| Inactief | |
| Belasting |
|
Key:
min: | |
| Lenovo Legion Slim 7 16APH8 R7 7840HS, GeForce RTX 4060 Laptop GPU | Asus ROG Flow X16 GV601V i9-13900H, GeForce RTX 4060 Laptop GPU | Alienware m16 R1 Intel i7-13700HX, GeForce RTX 4060 Laptop GPU | Acer Predator Helios 16 PH16-71-731Q i7-13700HX, GeForce RTX 4060 Laptop GPU | Lenovo Legion Pro 5 16IRX8 i7-13700HX, GeForce RTX 4060 Laptop GPU | Lenovo LOQ 16IRH8 i7-13620H, GeForce RTX 4060 Laptop GPU | Gemiddelde van klas Gaming | |
|---|---|---|---|---|---|---|---|
| Power Consumption | 14% | -7% | -4% | -13% | 8% | 4% | |
| Idle Minimum * (Watt) | 33 | 9.6 71% | 10 70% | 15.9 52% | 24.5 26% | 17.2 48% | 13 ? 61% |
| Idle Average * (Watt) | 35 | 16 54% | 14 60% | 20.5 41% | 29.2 17% | 19.3 45% | 19 ? 46% |
| Idle Maximum * (Watt) | 45 | 16.9 62% | 21 53% | 20.9 54% | 34.3 24% | 21.2 53% | 24.6 ? 45% |
| Load Average * (Watt) | 59 | 104 -76% | 119 -102% | 106 -80% | 98.7 -67% | 90 -53% | 110.7 ? -88% |
| Witcher 3 ultra * (Watt) | 131 | 142 -8% | 186.7 -43% | 175 -34% | 178.6 -36% | 168 -28% | |
| Load Maximum * (Watt) | 177 | 214 -21% | 323 -82% | 276 -56% | 249.6 -41% | 211 -19% | 259 ? -46% |
* ... kleiner is beter
Power consumption Witcher 3 / stress test
Power consumption with external monitor
Levensduur batterij
Gezien de grote batterij van 99,9 Wh breekt de gebruiksduur geen records. Ongeveer 7 uur internetten met een verlaagde helderheid van 150 cd/m2 is goed, maar gezien de grootte van de batterij kan het aanzienlijk beter. Desondanks verovert het de tweede plaats in het testveld, vlak achter de Asus ROG Flow X16.
| Lenovo Legion Slim 7 16APH8 R7 7840HS, GeForce RTX 4060 Laptop GPU, 99.9 Wh | Asus ROG Flow X16 GV601V i9-13900H, GeForce RTX 4060 Laptop GPU, 90 Wh | Alienware m16 R1 Intel i7-13700HX, GeForce RTX 4060 Laptop GPU, 86 Wh | Acer Predator Helios 16 PH16-71-731Q i7-13700HX, GeForce RTX 4060 Laptop GPU, 90 Wh | Lenovo Legion Pro 5 16IRX8 i7-13700HX, GeForce RTX 4060 Laptop GPU, 80 Wh | Lenovo LOQ 16IRH8 i7-13620H, GeForce RTX 4060 Laptop GPU, 80 Wh | Gemiddelde van klas Gaming | |
|---|---|---|---|---|---|---|---|
| Batterijduur | 11% | -32% | -21% | -52% | -11% | 0% | |
| WiFi v1.3 (h) | 7.1 | 7.9 11% | 4.8 -32% | 5.6 -21% | 3.4 -52% | 6.3 -11% | 7.11 ? 0% |
| H.264 (h) | 8.9 | 5.6 | 4.8 | 6.4 | 8.32 ? | ||
| Load (h) | 1.5 | 1 | 1.5 | 0.7 | 1.5 | 1.502 ? | |
| Reader / Idle (h) | 6.4 | 6.7 | 8.27 ? | ||||
| Witcher 3 ultra (h) | 1.5 |
Pro
Contra
Uitspraak

De AMD-versie van de laptop is, net als zijn Intel-tegenhanger, een echte aanrader.
De synergie tussen de Ryzen 7 7840HS en de GeForce RTX 4060 zorgt voor soepele prestaties, waardoor hoge tot maximale instellingen mogelijk zijn met een resolutie van 2.560 x 1.600 pixels.
Het 240 Hz beeldscherm valt niet alleen op door de hoge helderheid, maar ook door de zichtbaarheid in buitenomgevingen. De behuizing van de laptop blinkt uit in verschillende aspecten, waaronder aansluitingen, stabiliteit, ontwerp en materiaalkwaliteit. Ondanks het formaat van 16 inch is hij vrij licht (4,6 lbs). Hij heeft ook goed doordachte invoerapparaten en een uitstekende geluidskwaliteit.
Hoewel er kleine minpuntjes zijn, zoals een iets hoger energieverbruik in de inactieve modus en af en toe een haperende SSD na verloop van tijd, leiden deze tekortkomingen niet significant af van de algehele uitstekende ervaring. Daarom krijgt de laptop een zeer goede algemene beoordeling.
Het is het vermelden waard dat de concurrentie, zoals de Asus ROG Flow X16ook uitstekende prestaties levert, maar tegen een hogere prijs, waardoor onze suggestie nog verleidelijker wordt.
Prijs & Beschikbaarheid
De geteste Lenovo Legion Slim 7 16APH8 is verkrijgbaar voor ongeveer $1750 USD op Amazon.
Lenovo Legion Slim 7 16APH8
- 03-11-2023 v7 (old)
Florian Glaser
Transparantie
De selectie van te beoordelen apparaten wordt gemaakt door onze redactie. Het testexemplaar werd ten behoeve van deze beoordeling door de fabrikant of detailhandelaar in bruikleen aan de auteur verstrekt. De kredietverstrekker had geen invloed op deze recensie, noch ontving de fabrikant vóór publicatie een exemplaar van deze recensie. Er bestond geen verplichting om deze recensie te publiceren. Als onafhankelijk mediabedrijf is Notebookcheck niet onderworpen aan het gezag van fabrikanten, detailhandelaren of uitgevers.
[transparency_disclaimer]Dit is hoe Notebookcheck test
Elk jaar beoordeelt Notebookcheck onafhankelijk honderden laptops en smartphones met behulp van gestandaardiseerde procedures om ervoor te zorgen dat alle resultaten vergelijkbaar zijn. We hebben onze testmethoden al zo'n 20 jaar voortdurend ontwikkeld en daarbij de industriestandaard bepaald. In onze testlaboratoria wordt gebruik gemaakt van hoogwaardige meetapparatuur door ervaren technici en redacteuren. Deze tests omvatten een validatieproces in meerdere fasen. Ons complexe beoordelingssysteem is gebaseerd op honderden goed onderbouwde metingen en benchmarks, waardoor de objectiviteit behouden blijft. Meer informatie over onze testmethoden kunt u hier vinden.
Price comparison

