Intel UHD Graphics (Jasper Lake 32 EU)
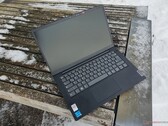
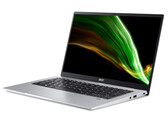
De Intel UHD Graphics 32 EU's (Jasper Lake, Gen. 11) is een geïntegreerde grafische kaart in de Jasper Lake Pentium SoC's voor laptops en kleine desktops. Het is de snelste GPU-versie in de Jasper Lake-serie (Pentium Silver) en biedt alle 32 EU's (Execution Units / Shader Blocks). Hij biedt geen specifiek grafisch geheugen en de kloksnelheid is afhankelijk van het processormodel. Bij de lancering zijn er twee Pentium Silver modellen (N6000 met 6W en N6005 met 10W) geklokt op 350 - 900 MHz.
Dankzij de verbeterde architectuur en meer EU's is de UHD Graphics duidelijk sneller dan de oude Gemini Lake SoC's (bv. N5000). Intel vermeldt tot 78% betere 3DMark Fire Strike scores en tot 22% meer FPS in Rocket League. Toch zouden alleen zeer weinig veeleisende games speelbaar moeten zijn.
Een speciale nieuwe functie van de Gen11 grafische kaart is de nieuwe Variable Rate Shading (VRS) ondersteuning. Hiermee kunnen spelontwerpers beslissen waar ze schaduwtijd aan besteden en bijvoorbeeld objecten op de achtergrond of achter mist schaduwen met minder resolutie (tot het gebruik van slechts één bron voor een 4x4 blok). Met deze techniek tonen vroege resultaten tot 1.3x performance in Unreal Engine POC en 1.2x speedup in Civ 6. Tot nu toe wordt VRS alleen ondersteund door de nieuwe Nvidia Turing architectuur (GTX 1650 en hoger).
Een ander verbeterd stukje hardware is de geïntegreerde video de- en encoder die volgens Intel aanzienlijk verbeterd is. Ze specificeerden niet meer details, maar de vorige generatie was in staat om VP9 en H.265/HEVC in Main10 profiel met 10 bit kleurdiepte te decoderen met behulp van de speciale hardware.
De Jasper Lake SoC's en dus ook de geïntegreerde GPU worden gefabriceerd in het 10nm proces (net als Ice Lake waarschijnlijk) bij Intel dat vergelijkbaar zou moeten zijn met het 7nm proces van TSMC.
Gen. 11 Serie Iris Plus Graphics G7 (Ice Lake 64 EU) 64 @ 0.3 - 1.1 GHz Iris Plus Graphics G4 (Ice Lake 48 EU) 48 @ 0.3 - 1.1 GHz UHD Graphics G1 (Ice Lake 32 EU) 32 @ 0.3 - 1.1 GHz UHD Graphics G7 (Lakefield GT2 64 EU) 64 @ 0.2 - 0.5 GHz UHD Graphics G4 (Lakefield GT1 48 EU) 48 @ 0.2 - 0.5 GHz UHD Graphics (Jasper Lake 32 EU) 32 @ 0.35 - 0.9 GHz UHD Graphics (Jasper Lake 24 EU) 24 @ 0.35 - 0.8 GHz UHD Graphics (Jasper Lake 16 EU) 24 @ 0.35 - 0.8 GHz
Codenaam Gen. 11 Architectuur Gen. 11 Pipelines 32 - verenigd Core-snelheid 350 - 900 (Boost) MHz Gedeeld geheugen ja API DirectX 12_1, OpenGL 4.5 Stroomverbruik 4.8 - 10 Watt technologie 10 nm Faciliteiten QuickSync Aangekondigde datum 11.01.2021
Benchmarks Performance Rating - 3DMark 11 + Fire Strike + Time Spy
3.5 pt (4%)
...
Intel UHD Graphics 615 -8%
AMD Radeon R6 (Carrizo) -1%
Intel UHD Graphics (Jasper Lake 32 EU)
AMD Radeon R5 M335 1%
AMD Radeon R7 M260X 1%
...
3DMark - 3DMark Time Spy Score
min: 322 gem: 375.3 mediaan: 372 (2%) max: 432 Points
Intel UHD Graphics 605 -66%
...
AMD Radeon R6 (Carrizo) -20%
Intel UHD Graphics 617 -10%
Intel UHD Graphics (Jasper Lake 32 EU)
Intel UHD Graphics G7 (Lakefield GT2 64 EU) 4%
Intel HD Graphics 630 13%
Intel UHD Graphics Xe 16EUs (Tiger Lake-H) 15%
...
3DMark - 3DMark Time Spy Graphics
min: 286 gem: 333.3 mediaan: 330 (2%) max: 384 Points
Intel UHD Graphics 605 -66%
...
Intel UHD Graphics 615 -27%
AMD Radeon R6 (Carrizo) -18%
Intel UHD Graphics 617 -10%
Intel UHD Graphics (Jasper Lake 32 EU)
Intel UHD Graphics G7 (Lakefield GT2 64 EU) 5%
Intel HD Graphics 630 10%
Intel UHD Graphics Xe 16EUs (Tiger Lake-H) 12%
...
3DMark - 3DMark Ice Storm Unlimited Graphics
min: 62122 gem: 69829 mediaan: 69098 (9%) max: 78266 Points
...
AMD Radeon R7 (Carrizo) -13%
Intel UHD Graphics 615 -12%
Intel UHD Graphics Xe 16EUs (Tiger Lake-H) -5%
AMD Radeon R8 M365DX -3%
AMD Radeon R7 M340 -1%
Intel UHD Graphics (Jasper Lake 32 EU)
AMD Radeon R5 M335 1%
NVIDIA Quadro T2000 Max-Q 8%
Intel UHD Graphics 617 10%
...
3DMark - 3DMark Ice Storm Extreme Graphics
min: 20602 gem: 27876 mediaan: 29235 (4%) max: 33792 Points
...
NVIDIA GeForce 910M -12%
Intel UHD Graphics 615 -3%
Intel UHD Graphics (Jasper Lake 32 EU)
AMD Radeon R5 M335 12%
AMD Radeon R7 M260X 16%
AMD Radeon R5 (Carrizo) 18%
Intel UHD Graphics G7 (Lakefield GT2 64 EU) 20%
...
NVIDIA GeForce RTX 3080 Laptop GPU 1390%
3DMark - 3DMark Cloud Gate Score
min: 4821 gem: 5531 mediaan: 5531.5 (7%) max: 6241 Points
...
AMD Radeon R7 M340 -4%
AMD Radeon R8 M365DX -4%
Intel UHD Graphics (Jasper Lake 32 EU)
Intel UHD Graphics G7 (Lakefield GT2 64 EU) 5%
...
3DMark - 3DMark Cloud Gate Graphics
min: 5895 gem: 7133 mediaan: 6977 (3%) max: 8528 Points
...
AMD Radeon R7 (Carrizo) -9%
NVIDIA GeForce 910M -7%
AMD Radeon R7 M340 0%
Intel UHD Graphics (Jasper Lake 32 EU)
AMD Radeon R6 M255DX 1%
Intel UHD Graphics 617 1%
...
3DMark - 3DMark Fire Strike Standard Score
min: 797 gem: 1015 mediaan: 982 (2%) max: 1245 Points
...
NVIDIA GeForce 910M -10%
AMD Radeon R7 M260 -6%
AMD Radeon R7 (Carrizo) -2%
Intel UHD Graphics (Jasper Lake 32 EU)
AMD Radeon R7 M360 0%
AMD Radeon R5 (Bristol Ridge) 4%
...
3DMark - 3DMark Fire Strike Standard Graphics
min: 881 gem: 1068 mediaan: 1016 (2%) max: 1360 Points
...
Intel UHD Graphics 617 -7%
AMD Radeon R5 (Carrizo) -6%
NVIDIA GeForce 910M -4%
Intel UHD Graphics (Jasper Lake 32 EU)
AMD Radeon R7 M260 1%
AMD Radeon R7 (Carrizo) 4%
AMD Radeon R6 M255DX 4%
AMD Radeon R7 M360 7%
...
3DMark - 3DMark Ice Storm Graphics
min: 21465 gem: 39510 mediaan: 42801 (6%) max: 54265 Points
...
Intel UHD Graphics Xe 750 32EUs (Rocket Lake) -3%
NVIDIA Quadro K620M -2%
AMD Radeon R2 (Stoney Ridge) 0%
Intel UHD Graphics 610 0%
Intel UHD Graphics (Jasper Lake 32 EU)
AMD FirePro W4190M 0%
AMD Radeon R7 M260 1%
AMD Radeon R5 M330 2%
...
3DMark - 3DMark Night Raid
min: 3217 gem: 3440 mediaan: 3439.5 (4%) max: 3662 Points
Intel UHD Graphics 600 -48%
...
Intel UHD Graphics 605 -49%
Intel UHD Graphics 600 -48%
Intel UHD Graphics 610 -24%
Intel HD Graphics 610 -23%
Intel UHD Graphics 615 -14%
Intel UHD Graphics (Jasper Lake 32 EU)
Intel UHD Graphics G7 (Lakefield GT2 64 EU) 6%
Intel UHD Graphics 617 8%
Intel UHD Graphics G1 (Ice Lake 32 EU) 69%
AMD Radeon RX Vega 6 (Ryzen 2000/3000) 80%
AMD Radeon RX Vega 8 (Ryzen 2000/3000) 122%
AMD Radeon RX Vega 10 135%
...
NVIDIA GeForce RTX 3070 Laptop GPU 1412%
3DMark - 3DMark Night Raid Graphics Score
min: 4254 gem: 4588 mediaan: 4588 (3%) max: 4922 Points
Intel UHD Graphics 600 -58%
...
Intel UHD Graphics 605 -55%
Intel UHD Graphics 610 -38%
Intel HD Graphics 610 -37%
Intel UHD Graphics 615 -26%
Intel UHD Graphics 617 -2%
Intel UHD Graphics (Jasper Lake 32 EU)
Intel UHD Graphics G7 (Lakefield GT2 64 EU) 5%
Intel UHD Graphics G1 (Ice Lake 32 EU) 38%
AMD Radeon RX Vega 6 (Ryzen 2000/3000) 67%
AMD Radeon RX Vega 8 (Ryzen 2000/3000) 95%
Intel Iris Plus Graphics G4 (Ice Lake 48 EU) 100%
Intel Iris Plus Graphics G7 (Ice Lake 64 EU) 103%
...
3DMark 11 - 3DM11 Performance Score
min: 1448 gem: 1674 mediaan: 1642.5 (3%) max: 1963 Points
...
AMD Radeon R5 M320 -1%
AMD Radeon R5 M240 0%
Intel UHD Graphics 617 0%
Intel UHD Graphics (Jasper Lake 32 EU)
AMD Radeon R5 (Carrizo) 1%
AMD Radeon R5 M330 7%
...
3DMark 11 - 3DM11 Performance GPU
min: 1356 gem: 1563 mediaan: 1552 (2%) max: 1792 Points
...
AMD Radeon R6 (Carrizo) -7%
AMD Radeon HD 6720G2 -5%
AMD Radeon HD 6755G2 -2%
Intel UHD Graphics 617 -1%
Intel UHD Graphics (Jasper Lake 32 EU)
AMD Radeon R5 M240 2%
NVIDIA GeForce GTX 460M 4%
...
3DMark Vantage 3DM Vant. Perf. total + 3DMark Vantage - 3DM Vant. Perf. total
5185 Points (4%)
...
AMD Radeon R6 M255DX -3%
AMD Radeon R5 M240 -2%
Intel UHD Graphics (Jasper Lake 32 EU)
AMD Radeon R7 M460 2%
AMD Radeon HD 6750M 3%
...
3DM Vant. Perf. GPU no PhysX + 3DMark Vantage - 3DM Vant. Perf. GPU no PhysX
4446 Points (3%)
...
ATI Mobility Radeon HD 5830 -5%
AMD Radeon R6 (Carrizo) -1%
AMD Radeon R7 (Carrizo) -1%
Intel UHD Graphics (Jasper Lake 32 EU)
AMD Radeon HD 6750M 2%
AMD Radeon R7 M340 4%
AMD Radeon R7 M460 4%
AMD Radeon R5 M240 7%
...
3DMark 05 - 3DMark 05 - Standard
8291 Points (12%)
...
AMD Radeon HD 6510G2 -8%
Intel UHD Graphics (Jasper Lake 32 EU)
AMD Radeon HD 6540G2 2%
...
3DMark 06 3DMark 06 - Standard 1280x1024 +
min: 5416 gem: 5745 mediaan: 5745 (9%) max: 6074 Points
...
AMD Radeon R6 M340DX -6%
AMD Radeon R5 M240 -1%
Intel UHD Graphics (Jasper Lake 32 EU)
AMD Radeon R5 M335 3%
AMD Radeon R5 M330 4%
Intel UHD Graphics 610 5%
...
Unigine Valley 1.0 - Unigine Valley 1.0 DX
3.5 fps (2%)
Intel HD Graphics (Cherry Trail) -66%
Intel UHD Graphics 605 -51%
AMD Radeon R2 (Stoney Ridge) -20%
AMD Radeon R4 (Stoney Ridge) -16%
Intel UHD Graphics 610 -14%
Intel HD Graphics 610 -6%
Intel UHD Graphics (Jasper Lake 32 EU)
Intel HD Graphics 630 51%
...
NVIDIA GeForce RTX 3070 Laptop GPU 3660%
Unigine Heaven 3.0 - Unigine Heaven 3.0 DX 11
12.6 fps (4%)
...
Intel HD Graphics 610 -6%
Intel UHD Graphics (Jasper Lake 32 EU)
AMD Radeon R7 M260 13%
NVIDIA GeForce 910M 14%
...
Unigine Heaven 3.0 - Unigine Heaven 3.0 OpenGL
13.7 fps (6%)
...
AMD Radeon R7 M260 -18%
Intel HD Graphics 610 -14%
AMD Radeon R7 M360 -9%
NVIDIA GeForce 910M -3%
Intel UHD Graphics (Jasper Lake 32 EU)
...
Unigine Heaven 2.1 - Heaven 2.1 high
15.4 fps (3%)
...
AMD Radeon R7 (Carrizo) -5%
AMD Radeon HD 6720G2 -4%
AMD Radeon HD 6750M -1%
AMD Radeon R5 M335 -1%
AMD Radeon R6 M340DX -1%
Intel UHD Graphics (Jasper Lake 32 EU)
...
Cinebench R10 Cinebench R10 Shading (32bit) + Cinebench R10 - Cinebench R10 Shading (32bit)
min: 6115 gem: 6571 mediaan: 6731 (29%) max: 6868 punten
...
AMD Radeon HD 6750M -3%
AMD Radeon R7 M360 -1%
NVIDIA Quadro P3000 -1%
AMD Radeon R9 M375 0%
Intel UHD Graphics (Jasper Lake 32 EU)
AMD Radeon HD 6490M 0%
AMD Radeon R5 M330 1%
NVIDIA GeForce GTX 1050 Ti Mobile 1%
...
Cinebench R11.5 Cinebench R11.5 OpenGL 64 Bit + Cinebench R11.5 - Cinebench R11.5 OpenGL 64 Bit
min: 18.59 gem: 19.4 mediaan: 18.7 (7%) max: 20.89 fps
...
ATI Mobility Radeon HD 5165 -5%
AMD Radeon R6 (Carrizo) -5%
Intel UHD Graphics (Jasper Lake 32 EU)
AMD Radeon R5 (Carrizo) 3%
AMD Radeon HD 6720G2 4%
...
Cinebench R15 Cinebench R15 OpenGL 64 Bit + Cinebench R15 - Cinebench R15 OpenGL 64 Bit
min: 27.94 gem: 31.3 mediaan: 31.6 (9%) max: 36.7 fps
...
AMD Radeon R5 (Bristol Ridge) -4%
AMD Radeon R5 M335 -1%
Intel UHD Graphics Xe 750 32EUs (Rocket Lake) -1%
Intel UHD Graphics (Jasper Lake 32 EU)
AMD Radeon R8 M365DX 2%
Intel UHD Graphics G7 (Lakefield GT2 64 EU) 6%
Intel UHD Graphics 615 6%
...
Cinebench R15 OpenGL Ref. Match 64 Bit + Cinebench R15 - Cinebench R15 OpenGL Ref. Match 64 Bit
97.8 % (98%)
...
Intel UHD Graphics (Jasper Lake 32 EU)
Intel UHD Graphics G1 (Ice Lake 32 EU) 0%
Intel UHD Graphics 600 0%
Intel HD Graphics 610 0%
Intel UHD Graphics Xe G4 48EUs 0%
Intel UHD Graphics 605 0%
Intel UHD Graphics Xe 32EUs (Tiger Lake-H) 0%
...
GFXBench (DX / GLBenchmark) 2.7 GFXBench 2.7 T-Rex HD Onscreen C24Z16 + GFXBench (DX / GLBenchmark) 2.7 - GFXBench 2.7 T-Rex HD Onscreen C24Z16
min: 76 gem: 82.9 mediaan: 82.9 (2%) max: 89.7 fps
...
Apple M1 7-Core GPU -28%
AMD Radeon R4 (Stoney Ridge) -21%
Intel UHD Graphics 610 -14%
Intel UHD Graphics (Jasper Lake 32 EU)
Apple M1 8-Core GPU 1%
AMD Radeon RX 550X (Laptop) 8%
...
GFXBench T-Rex HD Offscreen C24Z16 + GFXBench (DX / GLBenchmark) 2.7 - GFXBench T-Rex HD Offscreen C24Z16
min: 85.6 gem: 91.2 mediaan: 91.2 (1%) max: 96.8 fps
...
NVIDIA GeForce 910M -14%
AMD Radeon R6 (Carrizo) -3%
AMD Radeon R7 (Carrizo) 0%
Intel UHD Graphics (Jasper Lake 32 EU)
AMD Radeon R7 M460 11%
AMD Radeon R5 (Bristol Ridge) 17%
AMD Radeon R7 M340 20%
...
Apple M1 Max 32-Core GPU 2582%
GFXBench 3.0 - GFXBench 3.0 Manhattan
min: 42.2 gem: 46.8 mediaan: 46.8 (13%) max: 51.3 fps
...
AMD Radeon R5 M240 -9%
NVIDIA Quadro M3000M -9%
Intel UHD Graphics (Jasper Lake 32 EU)
NVIDIA Quadro K620M 4%
Intel HD Graphics 610 11%
AMD Radeon RX 550X (Laptop) 11%
...
NVIDIA GeForce GTX 1070 Max-Q 681%
GFXBench 3.0 - GFXBench 3.0 Manhattan Offscreen
min: 48.7 gem: 53.7 mediaan: 53.7 (4%) max: 58.7 fps
...
AMD Radeon R7 M460 -15%
AMD Radeon RX Vega 10 -14%
Intel Iris Plus Graphics G7 (Ice Lake 64 EU) -13%
Intel HD Graphics 630 -12%
Intel UHD Graphics G7 (Lakefield GT2 64 EU) -10%
Intel UHD Graphics (Jasper Lake 32 EU)
NVIDIA Quadro K620M 12%
...
Apple M1 Max 32-Core GPU 2306%
GFXBench - GFXBench 5.0 Aztec Ruins High Tier Onscreen
min: 16.6 gem: 17.9 mediaan: 17.9 (11%) max: 19.2 fps
...
Intel UHD Graphics 600 -54%
Intel UHD Graphics 610 -45%
Intel UHD Graphics 615 -39%
Intel UHD Graphics 605 -37%
AMD Radeon R4 (Stoney Ridge) -37%
Intel UHD Graphics (Jasper Lake 32 EU)
Intel UHD Graphics G7 (Lakefield GT2 64 EU) 2%
Intel UHD Graphics Xe 16EUs (Tiger Lake-H) 6%
NVIDIA GeForce GTX 1050 Max-Q 19%
NVIDIA Quadro T2000 Max-Q 58%
Intel UHD Graphics G1 (Ice Lake 32 EU) 65%
...
GFXBench - GFXBench 5.0 Aztec Ruins High Tier Offscreen
min: 9.6 gem: 10.5 mediaan: 10.5 (3%) max: 11.3 fps
...
Intel UHD Graphics 600 -65%
Intel UHD Graphics 610 -48%
Intel UHD Graphics 605 -39%
Intel UHD Graphics 615 -38%
AMD Radeon R4 (Stoney Ridge) -36%
Intel Iris Plus Graphics G7 (Ice Lake 64 EU) -11%
Intel UHD Graphics (Jasper Lake 32 EU)
Intel UHD Graphics G7 (Lakefield GT2 64 EU) 5%
Intel UHD Graphics Xe 16EUs (Tiger Lake-H) 9%
Intel UHD Graphics G1 (Ice Lake 32 EU) 56%
...
Apple M1 Max 32-Core GPU 2869%
GFXBench - GFXBench 5.0 Aztec Ruins Normal Tier Onscreen
min: 22.3 gem: 24.4 mediaan: 24.4 (12%) max: 26.5 fps
...
Intel UHD Graphics 600 -50%
Intel UHD Graphics 610 -39%
Intel UHD Graphics 615 -34%
AMD Radeon R4 (Stoney Ridge) -30%
Intel UHD Graphics 605 -22%
Intel UHD Graphics (Jasper Lake 32 EU)
Intel UHD Graphics G7 (Lakefield GT2 64 EU) 6%
Intel UHD Graphics Xe 16EUs (Tiger Lake-H) 24%
NVIDIA GeForce GTX 1050 Max-Q 34%
NVIDIA Quadro T2000 Max-Q 77%
...
GFXBench - GFXBench 5.0 Aztec Ruins Normal Tier Offscreen
min: 24.4 gem: 26.5 mediaan: 26.5 (4%) max: 28.6 fps
...
Intel UHD Graphics 600 -62%
Intel UHD Graphics 605 -52%
Intel UHD Graphics 610 -42%
Intel UHD Graphics 615 -40%
AMD Radeon R4 (Stoney Ridge) -32%
Intel Iris Plus Graphics G7 (Ice Lake 64 EU) -11%
Intel UHD Graphics (Jasper Lake 32 EU)
Intel UHD Graphics G7 (Lakefield GT2 64 EU) 8%
Intel UHD Graphics Xe 16EUs (Tiger Lake-H) 27%
Intel UHD Graphics G1 (Ice Lake 32 EU) 60%
AMD Radeon RX Vega 8 (Ryzen 2000/3000) 105%
...
Apple M1 Max 32-Core GPU 2738%
GFXBench - GFXBench Car Chase Onscreen
min: 21.4 gem: 23.1 mediaan: 23.1 (1%) max: 24.8 fps
Intel HD Graphics (Cherry Trail) -74%
...
Intel UHD Graphics 605 -36%
AMD Radeon R2 (Stoney Ridge) -35%
Intel UHD Graphics 610 -34%
Intel UHD Graphics 615 -24%
AMD Radeon R4 (Stoney Ridge) -21%
Intel UHD Graphics (Jasper Lake 32 EU)
Intel Iris Plus Graphics G7 (Ice Lake 64 EU) 4%
NVIDIA GeForce GTX 1050 Max-Q 8%
NVIDIA GeForce 910M 9%
Intel HD Graphics 610 12%
...
NVIDIA GeForce RTX 3070 Laptop GPU 15242%
GFXBench - GFXBench Car Chase Offscreen
min: 24 gem: 25.1 mediaan: 25.1 (0%) max: 26.1 fps
...
Intel UHD Graphics 615 -36%
Intel UHD Graphics 610 -33%
NVIDIA GeForce 910M -11%
Intel UHD Graphics (Jasper Lake 32 EU)
Intel UHD Graphics Xe 16EUs (Tiger Lake-H) 24%
Intel HD Graphics 630 27%
...
NVIDIA GeForce RTX 3070 Laptop GPU 96331%
LuxMark v2.0 64Bit - LuxMark v2.0 Room GPU
min: 136 gem: 166 mediaan: 163 (1%) max: 199 Samples/s
...
Intel HD Graphics 610 -9%
AMD Radeon R7 M340 -2%
Intel UHD Graphics (Jasper Lake 32 EU)
AMD Radeon R7 M260 1%
AMD Radeon R7 M360 4%
AMD Radeon R5 (Bristol Ridge) 5%
...
LuxMark v2.0 64Bit - LuxMark v2.0 Sala GPU
min: 274 gem: 360.3 mediaan: 397 (1%) max: 410 Samples/s
...
AMD Radeon R7 M360 -13%
AMD Radeon R7 M460 -11%
AMD Radeon R5 (Bristol Ridge) -8%
Intel UHD Graphics (Jasper Lake 32 EU)
AMD Radeon R7 (Carrizo) 8%
...
ComputeMark v2.1 - ComputeMark v2.1 Result
min: 771 gem: 932 mediaan: 959 (2%) max: 1066 punten
...
AMD Radeon R6 (Carrizo) -5%
AMD FirePro W5130M -4%
AMD FirePro W4190M -3%
AMD Radeon RX 550 (Laptop) -1%
AMD FirePro W7170M -1%
NVIDIA GeForce 910M 0%
Intel UHD Graphics (Jasper Lake 32 EU)
Intel HD Graphics 630 2%
AMD Radeon Pro WX Vega M GL 4%
...
Power Consumption - Furmark Stress Test Power Consumption - external Monitor *
min: 11.2 gem: 15.5 mediaan: 16.5 (3%) max: 18.8 Watt
Intel UHD Graphics 600 -30%
Intel UHD Graphics 605 -29%
Qualcomm Adreno 680 -19%
Intel UHD Graphics (Jasper Lake 32 EU)
Intel UHD Graphics 610 16%
Intel UHD Graphics 615 35%
Intel UHD Graphics G1 (Ice Lake 32 EU) 36%
Intel UHD Graphics Xe 16EUs (Tiger Lake-H) 51%
...
Power Consumption - The Witcher 3 Power Consumption - external Monitor *
min: 13.9 gem: 15.1 mediaan: 15.1 (2%) max: 16.3 Watt
Intel UHD Graphics (Jasper Lake 32 EU)
Intel UHD Graphics Xe 16EUs (Tiger Lake-H) 82%
Intel Iris Plus Graphics G7 (Ice Lake 64 EU) 100%
...
Power Consumption - Witcher 3 Power Consumption *
14.3 Watt (3%)
Intel UHD Graphics 605 -17%
Intel UHD Graphics (Jasper Lake 32 EU)
Intel UHD Graphics G1 (Ice Lake 32 EU) 88%
Intel Iris Plus Graphics G4 (Ice Lake 48 EU) 96%
Intel UHD Graphics Xe 16EUs (Tiger Lake-H) 114%
Intel UHD Graphics Xe G4 48EUs 136%
...
- Benchmarkresultaten voor deze videokaart
- Gemiddelde benchmarkresultaten voor deze videokaart
* Kleinere getallen betekenen een hogere prestatie
Game Benchmarks De volgende benchmarks zijn afgeleid van onze laptop-testrapporten. De prestaties variëren afhankelijk van het gebruikte grafische geheugen, kloksnelheid, processor, systeeminstellingen, drivers en besturingssysteem. De resultaten zijn daarom niet noodzakelijk representatief voor alle laptops met deze GPU. Voor meer gedetailleerde informatie over de benchmarkresultaten, klik op het fps-aantal.
20.5 fps [X] Acer Swift 1 SF114-34-P91A Intel Pentium Silver N6000 1.1GHz
UHD Graphics (Jasper Lake 32 EU)
min:
3.75 fps, P0.1:
3.92 fps, P1:
7.13 fps, max:
56.6 fps
Your browser does not support the canvas
element! fps
+ Vergelijk
- Verberg vergelijking
Intel UHD Graphics (Jasper Lake 32 EU)
Intel UHD Graphics G1 (Ice Lake 32 EU) 87%
Intel UHD Graphics Xe G4 48EUs 205%
Intel UHD Graphics Xe 32EUs (Tiger Lake-H) 205%
AMD Radeon RX Vega 10 231%
AMD Radeon 540X 262%
AMD Radeon RX Vega 6 (Ryzen 4000/5000) 353%
NVIDIA GeForce GTX 1050 Ti Mobile 476%
...
NVIDIA GeForce RTX 3070 Laptop GPU 900%
» De benchmarkresultaten tonen aan dat de game niet speelbaar is met de geteste instellingen.
12.8 fps [X] Acer Swift 1 SF114-34-P91A Intel Pentium Silver N6000 1.1GHz
UHD Graphics (Jasper Lake 32 EU)
min:
1.994 fps, P0.1:
2.09 fps, P1:
6.35 fps, max:
76.3 fps
Your browser does not support the canvas
element! fps
+ Vergelijk
- Verberg vergelijking
Intel UHD Graphics (Jasper Lake 32 EU)
Intel UHD Graphics Xe 16EUs (Tiger Lake-H) 48%
Intel UHD Graphics G1 (Ice Lake 32 EU) 97%
Intel UHD Graphics Xe 32EUs (Tiger Lake-H) 155%
Intel UHD Graphics Xe G4 48EUs 172%
AMD Radeon RX Vega 6 (Ryzen 2000/3000) 287%
AMD Radeon RX Vega 8 (Ryzen 2000/3000) 300%
AMD Radeon RX Vega 10 323%
...
NVIDIA GeForce RTX 3060 Laptop GPU 2189%
» De benchmarkresultaten tonen aan dat de game niet speelbaar is met de geteste instellingen.
Additional Benchmarks
Low Preset (DX12) 1920x1080
7.6 fps [X] Acer Swift 1 SF114-34-P91A Intel Pentium Silver N6000 1.1GHz
UHD Graphics (Jasper Lake 32 EU)
min:
1.497 fps, P0.1:
1.563 fps, P1:
2.46 fps, max:
63.8 fps
Your browser does not support the canvas
element!
10.6 fps [X] Acer Swift 1 SF114-34-P91A Intel Pentium Silver N6000 1.1GHz
UHD Graphics (Jasper Lake 32 EU)
min:
5.85 fps, P0.1:
5.92 fps, P1:
6.3 fps, max:
13.4 fps
Your browser does not support the canvas
element! fps
+ Vergelijk
- Verberg vergelijking
AMD Radeon RX 550 (Laptop) -22%
Intel UHD Graphics (Jasper Lake 32 EU)
AMD Radeon RX Vega 6 (Ryzen 2000/3000) 87%
Intel UHD Graphics Xe 16EUs (Tiger Lake-H) 105%
Intel UHD Graphics G1 (Ice Lake 32 EU) 109%
AMD Radeon RX Vega 8 (Ryzen 2000/3000) 207%
Intel UHD Graphics Xe G4 48EUs 229%
AMD Radeon RX Vega 10 233%
Intel UHD Graphics Xe 32EUs (Tiger Lake-H) 264%
...
» De benchmarkresultaten tonen aan dat de game niet speelbaar is met de geteste instellingen.
AMD Radeon RX Vega 6 (Ryzen 2000/3000) -40%
Intel UHD Graphics (Jasper Lake 32 EU)
AMD Radeon RX Vega 8 (Ryzen 2000/3000) 4%
AMD Radeon RX Vega 10 6%
AMD Radeon 540X 54%
AMD Radeon RX 560X (Laptop) 229%
...
NVIDIA GeForce RTX 3070 Laptop GPU 653%
» De benchmarkresultaten tonen aan dat de game niet speelbaar is met de geteste instellingen.
18.8 fps [X] Acer Swift 1 SF114-34-P91A Intel Pentium Silver N6000 1.1GHz
UHD Graphics (Jasper Lake 32 EU)
min:
8.88 fps, P0.1:
9.34 fps, P1:
12.5 fps, max:
30.4 fps
Your browser does not support the canvas
element! fps
+ Vergelijk
- Verberg vergelijking
Intel UHD Graphics (Jasper Lake 32 EU)
AMD Radeon RX Vega 6 (Ryzen 2000/3000) 115%
AMD Radeon RX Vega 10 121%
Intel UHD Graphics G1 (Ice Lake 32 EU) 147%
Intel UHD Graphics Xe 16EUs (Tiger Lake-H) 160%
AMD Radeon RX Vega 8 (Ryzen 2000/3000) 169%
AMD Radeon RX Vega 6 (Ryzen 4000/5000) 170%
...
» De benchmarkresultaten tonen aan dat de game niet speelbaar is met de geteste instellingen.
Additional Benchmarks
Low Preset 1920x1080
13.5 fps [X] Acer Swift 1 SF114-34-P91A Intel Pentium Silver N6000 1.1GHz
UHD Graphics (Jasper Lake 32 EU)
min:
10.3 fps, P0.1:
10.4 fps, P1:
10.9 fps, max:
17.3 fps
Your browser does not support the canvas
element!
4.4 fps [X] Acer Swift 1 SF114-34-P91A Intel Pentium Silver N6000 1.1GHz
UHD Graphics (Jasper Lake 32 EU)
min:
0.2191 fps, P0.1:
0.2642 fps, P1:
2.65 fps, max:
9.85 fps
Your browser does not support the canvas
element! fps
+ Vergelijk
- Verberg vergelijking
Intel UHD Graphics (Jasper Lake 32 EU)
AMD Radeon RX Vega 6 (Ryzen 2000/3000) 440%
Intel UHD Graphics G1 (Ice Lake 32 EU) 488%
AMD Radeon RX Vega 10 570%
Intel UHD Graphics Xe G4 48EUs 659%
AMD Radeon 540X 800%
AMD Radeon RX Vega 6 (Ryzen 4000/5000) 820%
...
» De benchmarkresultaten tonen aan dat de game niet speelbaar is met de geteste instellingen.
6.8 fps [X] Acer Swift 1 SF114-34-P91A Intel Pentium Silver N6000 1.1GHz
UHD Graphics (Jasper Lake 32 EU)
min:
1.009 fps, P0.1:
1.192 fps, P1:
2.33 fps, max:
32.1 fps
Your browser does not support the canvas
element! fps
+ Vergelijk
- Verberg vergelijking
Intel UHD Graphics (Jasper Lake 32 EU)
Intel UHD Graphics G1 (Ice Lake 32 EU) 398%
Intel UHD Graphics Xe 16EUs (Tiger Lake-H) 399%
Intel Iris Plus Graphics G7 (Ice Lake 64 EU) 499%
Intel UHD Graphics Xe 32EUs (Tiger Lake-H) 768%
Intel UHD Graphics Xe G4 48EUs 808%
...
» De benchmarkresultaten tonen aan dat de game niet speelbaar is met de geteste instellingen.
Intel UHD Graphics (Jasper Lake 32 EU)
Intel UHD Graphics Xe 16EUs (Tiger Lake-H) 70%
Intel UHD Graphics G1 (Ice Lake 32 EU) 76%
Intel Iris Plus Graphics G7 (Ice Lake 64 EU) 194%
...
» De benchmarkresultaten tonen aan dat de game niet speelbaar is met de geteste instellingen.
Intel UHD Graphics (Jasper Lake 32 EU)
Intel UHD Graphics 615 77%
AMD Radeon R4 (Stoney Ridge) 99%
AMD Radeon R5 (Bristol Ridge) 148%
Intel HD Graphics 630 245%
...
» De benchmarkresultaten tonen aan dat de game niet speelbaar is met de geteste instellingen.
5.2 fps [X] Acer Swift 1 SF114-34-P91A Intel Pentium Silver N6000 1.1GHz
UHD Graphics (Jasper Lake 32 EU)
min:
1.096 fps, P0.1:
1.138 fps, P1:
1.517 fps, max:
29.2 fps
Your browser does not support the canvas
element! fps
+ Vergelijk
- Verberg vergelijking
Intel UHD Graphics (Jasper Lake 32 EU)
Intel UHD Graphics 605 38%
Intel UHD Graphics 600 50%
Intel UHD Graphics 615 69%
Intel HD Graphics 610 79%
AMD Radeon R4 (Stoney Ridge) 137%
AMD Radeon R5 (Bristol Ridge) 177%
...
» De benchmarkresultaten tonen aan dat de game niet speelbaar is met de geteste instellingen.
15.6 fps [X] Acer Swift 1 SF114-34-P6U1 1.47.22.14 D3D12
Intel Pentium Silver N6000 1.1GHz
UHD Graphics (Jasper Lake 32 EU)
min:
5 fps, P1:
5.74 fps, max:
111 fps
Your browser does not support the canvas
element! 20.3 fps [X] Acer Swift 1 SF114-34-P91A 1.47.22.14 D3D12, 8 GB RAM, Dual-Channel
Intel Pentium Silver N6000 1.1GHz
UHD Graphics (Jasper Lake 32 EU)
min:
5 fps, P1:
5.9 fps, max:
122 fps
Your browser does not support the canvas
element! ~ 18 fps
+ Vergelijk
- Verberg vergelijking
Intel UHD Graphics 605 -53%
Intel UHD Graphics 600 -51%
Intel UHD Graphics (Jasper Lake 32 EU)
Intel UHD Graphics G1 (Ice Lake 32 EU) 79%
Intel UHD Graphics Xe 16EUs (Tiger Lake-H) 80%
AMD Radeon RX Vega 10 141%
Intel UHD Graphics Xe G4 48EUs 169%
...
NVIDIA GeForce RTX 2080 Super Mobile 2761%
8.2 fps [X] Acer Swift 1 SF114-34-P91A 1.47.22.14 D3D12, 8 GB RAM, Dual-Channel
Intel Pentium Silver N6000 1.1GHz
UHD Graphics (Jasper Lake 32 EU)
min:
5 fps, P1:
5 fps, max:
106 fps
Your browser does not support the canvas
element! fps
+ Vergelijk
- Verberg vergelijking
Intel UHD Graphics 600 -26%
Intel UHD Graphics (Jasper Lake 32 EU)
Intel UHD Graphics G1 (Ice Lake 32 EU) 48%
Intel UHD Graphics Xe 16EUs (Tiger Lake-H) 48%
AMD Radeon RX Vega 6 (Ryzen 2000/3000) 99%
AMD Radeon RX Vega 10 112%
Intel UHD Graphics Xe 750 32EUs (Rocket Lake) 132%
...
NVIDIA GeForce RTX 2080 Super Mobile 3132%
» De benchmarkresultaten tonen aan dat de game niet speelbaar is met de geteste instellingen.
Intel UHD Graphics (Jasper Lake 32 EU)
AMD Radeon R5 (Bristol Ridge) 67%
Intel UHD Graphics 615 100%
Intel HD Graphics 610 100%
Intel UHD Graphics 610 133%
...
Intel UHD Graphics (Jasper Lake 32 EU)
Intel HD Graphics 610 200%
Intel HD Graphics 630 500%
Intel UHD Graphics Xe 16EUs (Tiger Lake-H) 700%
...
Intel UHD Graphics (Jasper Lake 32 EU)
Intel Iris Plus Graphics G7 (Ice Lake 64 EU) 900%
Intel Iris Plus Graphics G4 (Ice Lake 48 EU) 900%
AMD Radeon RX Vega 10 1020%
AMD Radeon RX Vega 8 (Ryzen 2000/3000) 1043%
NVIDIA Quadro P500 1050%
...
Intel UHD Graphics (Jasper Lake 32 EU)
NVIDIA Quadro P500 700%
Intel Iris Plus Graphics G4 (Ice Lake 48 EU) 800%
Intel Iris Plus Graphics G7 (Ice Lake 64 EU) 950%
AMD Radeon RX Vega 10 967%
AMD Radeon RX Vega 8 (Ryzen 2000/3000) 971%
...
» De benchmarkresultaten tonen aan dat de game niet speelbaar is met de geteste instellingen.
Additional Benchmarks
Low Preset TAA 1920x1080
91.2 fps [X] Acer Swift 1 SF114-34-P91A Intel Pentium Silver N6000 1.1GHz
UHD Graphics (Jasper Lake 32 EU)
min:
7.34 fps, P0.1:
29 fps, P1:
42 fps, max:
341 fps
Your browser does not support the canvas
element! fps
+ Vergelijk
- Verberg vergelijking
Intel UHD Graphics 600 -62%
Intel UHD Graphics 605 -42%
AMD Radeon R4 (Stoney Ridge) -12%
AMD Radeon R5 (Bristol Ridge) -3%
Intel UHD Graphics (Jasper Lake