Notebook-testrapporten met Intel HD Graphics 500 grafische kaart
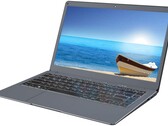
Kort testrapport Jumper EZbook X3: oude technologie in een gammele behuizing
Het spreek voor zich dat je voor weinig geld ook weinig notebook krijgt. De creatie van Jumper, die voor minder dan 300 euro te koop is, kan op geen enkel gebied schitteren. De zwakke afwerking, slechte invoerapparaten en trage hardware zijn slechts enkele aspecten die we niemand zouden toewensen.
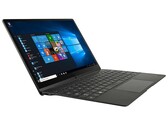
Intel Celeron N3350, HD Graphics 500, 13.3", 1.3 kgKort testrapport NuVision Encite Book 12 Plus (N3350, QHD) Laptop
De NuVision ziet er goed uit, maar dat is het zo'n beetje. Deze super-draagbare en supergoedkope subnotebook wordt naar beneden gehaald door slechte processorprestaties, slap toetsenbord, een zeer trage SSD en de meest beperkte selectie van poorten die we ooit op een laptop hebben gezien.
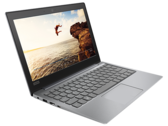
Intel Celeron N3350, HD Graphics 500, 12.5", 1 kgKort testrapport Lenovo Ideapad 120s (11-inch) Notebook
Kleiner formaat, meer waar voor je geld. De 11-inch Lenovo Ideapad 120s neemt veel eigenschappen over van zijn 14-inch-broertje, maar dan in een compactere behuizing. Kan hij zich met maar half zoveel RAM en een kleiner volume ook meten met het grotere model?
Intel Celeron N3350, HD Graphics 500, 11.6", 1.3 kgKort testrapport Lenovo Ideapad 120s (14-inch, HD) Laptop
Ultieme budget notebook. De 14-inch Lenovo Ideapad 120s is een simpele en dunne Windows laptop die verkocht wordt voor ongeveer $250. Hoewel het apparaat er aan de buitenkant goed uitziet voor een budget notebook, laten de interne componenten ons in de steek. Gezien de prijs is de Ideapad 120S echter een van de betere notebooks op de markt.
Intel Celeron N3350, HD Graphics 500, 14", 1.4 kgKort testrapport Chuwi LapBook Air 14.1 (N3450, FHD) Laptop
Aantrekkelijk en traag. Chuwi's MacBook Air kloon ziet er zeker goed uit en kan makkelijk doorgaan voor een twee keer zo duur Ultrabook. Wanneer je wat beter kijkt zie je echter al snel de nodige tekortkomingen.
Intel Celeron N3450, HD Graphics 500, 14.1", 1.4 kgJumper EZbook 3: Intel Celeron N3350, 14.10", 1.2 kg
Testrapport » Kort testrapport Jumper EZBook 3 (N3350, FHD) Laptop
Medion Akoya E11201: Intel Celeron N3450, 11.60", 1.2 kg
Extern testrapport » Medion Akoya E11201
Asus Chromebook CX1 CX1500CNA-EJ0040: Intel Celeron N3350, 15.60", 1.8 kg
Extern testrapport » Asus Chromebook CX1 CX1500CNA-EJ0040
Asus Chromebook Z1400CN-EB0420: Intel Celeron N3350, 14.00", 1.2 kg
Extern testrapport » Asus Chromebook Z1400CN-EB0420
Asus Chromebook CX1100CNA-GJ0035: Intel Celeron N3350, 11.60", 1.2 kg
Extern testrapport » Asus Chromebook CX1100CNA-GJ0035
Teclast F15S: Intel Celeron N3350, 15.60", 1.9 kg
Extern testrapport » Teclast F15S
Asus Chromebook C423NA-DH02: Intel Celeron N3350, 14.00", 1.3 kg
Extern testrapport » Asus Chromebook C423NA-DH02
Asus Chromebook C233NA-GJ0014: Intel Celeron N3350, 11.60", 1 kg
Extern testrapport » Asus Chromebook C233NA-GJ0014
Asus VivoBook L203NA: Intel Celeron N3350, 11.60", 1 kg
Extern testrapport » Asus VivoBook L203NA
Chuwi HeroLook Pro+: Intel Celeron J3455, 13.30", 1.8 kg
Extern testrapport » Chuwi HeroLook Pro+
Acer Chromebook 514 CB514-1HT-C0SJ: Intel Celeron N3350, 14.00", 1.4 kg
Extern testrapport » Acer Chromebook 514 CB514-1HT-C0SJ
Acer Chromebook 514 CB514-1HT-C7AZ: Intel Celeron N3450, 14.00", 1.4 kg
Extern testrapport » Acer Chromebook 514 CB514-1HT-C7AZ
HP Chromebook 11a-nb0210ng: Intel Celeron N3350, 11.60", 1.4 kg
Extern testrapport » HP Chromebook 11a-nb0210ng
HP Chromebook 11a-nb0000ns: Intel Celeron N3350, 11.60", 1.4 kg
Extern testrapport » HP Chromebook 11a-nb0000ns
Asus Chromebook Z1400CN-BV0306: Intel Celeron N3350, 14.00", 1.2 kg
Extern testrapport » Asus Chromebook Z1400CN-BV0306
Asus VivoBook Flip 12 TP202NA-EH008TS: Intel Celeron N3350, 11.60", 1.3 kg
Extern testrapport » Asus VivoBook Flip 12 TP202NA-EH008TS
Lenovo 300e 81FY0007MH: Intel Celeron N3450, 11.60", 1.5 kg
Extern testrapport » Lenovo 300e 81FY0007MH
Trekstor PrimeTab S11B: Intel Celeron N3350, 11.60", 0.8 kg
Extern testrapport » Trekstor PrimeTab S11B
Asus VivoBook Flip 12 TP202NA-EH001T: Intel Celeron N3350, 11.60", 1.3 kg
Extern testrapport » Asus VivoBook Flip 12 TP202NA-EH001T
Acer Aspire ES1-533-C8WC: Intel Celeron N3350, 15.60", 2 kg
Extern testrapport » Acer Aspire ES1-533-C8WC
Asus Chromebook 12 C223NA-GJ006: Intel Celeron N3350, 11.60", 1 kg
Extern testrapport » Asus Chromebook 12 C223NA-GJ006
Lenovo Ideapad 120S-11IAP-81A400EBSP: Intel Celeron N3350, 11.60", 1.2 kg
Extern testrapport » Lenovo Ideapad 120S-11IAP-81A400EBSP
Lenovo Ideapad 120S-11IAP-81A400E9SP: Intel Celeron N3350, 11.60", 1.3 kg
Extern testrapport » Lenovo Ideapad 120S-11IAP-81A400E9SP
Lenovo Ideapad 320-15IAP-80XR017XSP: Intel Celeron N3350, 15.60", 2.2 kg
Extern testrapport » Lenovo Ideapad 320-15IAP-80XR017XSP
Asus VivoBook D540NA-GQ059T: Intel Celeron N3350, 15.60", 2 kg
Extern testrapport » Asus VivoBook D540NA-GQ059T
HP Chromebook x360 11 G1-2XZ59EA: Intel Celeron N3350, 11.60", 1.4 kg
Extern testrapport » HP Chromebook x360 11 G1-2XZ59EA
Prestigio Smartbook 141 C2: Intel Celeron N3350, 14.10", 1.4 kg
Extern testrapport » Prestigio Smartbook 141 C2
Lenovo Ideapad 120S-14IAP-81A500FCSP: Intel Celeron N3350, 14.00", 1.4 kg
Extern testrapport » Lenovo Ideapad 120S-14IAP-81A500FCSP
Asus VivoBook E12 E203NAH-FD013T: Intel Celeron N3350, 15.60", 1.2 kg
Extern testrapport » Asus VivoBook E12 E203NAH-FD013T
Acer Aspire 1 A114-31-C50S: Intel Celeron N3350, 14.00", 1.7 kg
Extern testrapport » Acer Aspire 1 A114-31-C50S
Asus D540NA-GQ059: Intel Celeron N3350, 15.60", 2 kg
Extern testrapport » Asus D540NA-GQ059
Lenovo Ideapad 320-15IAP-80XR019HSP: Intel Celeron N3350, 15.60", 2.2 kg
Extern testrapport » Lenovo Ideapad 320-15IAP-80XR019HSP
Xoro Note 140: Intel Celeron N3350, 14.00", 1.8 kg
Extern testrapport » Xoro Note 140
Asus Chromebook C223: Intel Celeron N3350, 11.60", 1 kg
Extern testrapport » Asus Chromebook C223
Lenovo Ideapad 120S-11IAP-81A400EASP: Intel Celeron N3350, 11.60", 1.2 kg
Extern testrapport » Lenovo Ideapad 120S-11IAP-81A400EASP
Lenovo Ideapad 120S-14IAP-81A500ABSP: Intel Celeron N3350, 14.00", 1.5 kg
Extern testrapport » Lenovo Ideapad 120S-14IAP-81A500ABSP
HP Chromebook 11 x360 G1: Intel Celeron N3350, 11.60", 1.3 kg
Extern testrapport » HP Chromebook 11 x360 G1
Lenovo Ideapad 120S-14IAP-81A500FDSP: Intel Celeron N3350, 14.00", 1.4 kg
Extern testrapport » Lenovo Ideapad 120S-14IAP-81A500FDSP
Acer Swift 1 SF113-31-C5CE: Intel Celeron N3350, 13.30", 1.3 kg
Extern testrapport » Acer Swift 1 SF113-31-C5CE
Acer Chromebook Spin 11 R751TN-C0CG: Intel Celeron N3350, 11.60", 1.4 kg
Extern testrapport » Acer Chromebook Spin 11 R751TN-C0CG
Lenovo 500e Chromebook-81ES0005UK: Intel Celeron N3450, 11.60", 1.4 kg
Extern testrapport » Lenovo 500e Chromebook-81ES0005UK
Lenovo Ideapad 120S-14IAP-81A5008BSP: Intel Celeron N3350, 14.00", 1.4 kg
Extern testrapport » Lenovo Ideapad 120S-14IAP-81A5008BSP
Acer Aspire ES1-132-C1NP: Intel Celeron N3350, 11.60", 1.3 kg
Extern testrapport » Acer Aspire ES1-132-C1NP
Asus VivoBook E12 E203NAH-FD023T: Intel Celeron N3350, 11.60", 1.2 kg
Extern testrapport » Asus VivoBook E12 E203NAH-FD023T
Acer Switch 3 SW312-31-C4P6: Intel Celeron N3350, 12.20", 0.9 kg
Extern testrapport » Acer Switch 3 SW312-31-C4P6
Acer Aspire 1 A114-31-C3MM: Intel Celeron N3350, 14.00", 1.7 kg
Extern testrapport » Acer Aspire 1 A114-31-C3MM
Lenovo YOGA 310-11IAP-80U2006HSP: Intel Celeron N3350, 11.60", 1.4 kg
Extern testrapport » Lenovo YOGA 310-11IAP-80U2006HSP
Acer Chromebook 11 CB311-8H-C5DV: Intel Celeron N3350, 11.60", 1.1 kg
Extern testrapport » Acer Chromebook 11 CB311-8H-C5DV
Dell Chromebook 5190-11us: Intel Celeron N3450, 11.60", 1.3 kg
Extern testrapport » Dell Chromebook 5190-11us
Lenovo IdeaPad 120S-14IAP-81A50093MH: Intel Celeron N3350, 14.00", 1.5 kg
Extern testrapport » Lenovo IdeaPad 120S-14IAP-81A50093MH
Trekstor Primetab T13B: Intel Celeron N3350, 13.30", 1.5 kg
Extern testrapport » Trekstor Primetab T13B
Teclast TBook F7: Intel Celeron N3450, 14.00", 1.2 kg
Extern testrapport » Teclast TBook F7
Trekstor Primebook C11: Intel Celeron N3350, 11.60", 1.2 kg
Extern testrapport » Trekstor Primebook C11
Asus VivoBook E12 X207NA-FD068T: Intel Celeron N3350, 11.60", 1 kg
Extern testrapport » Asus VivoBook E12 X207NA-FD068T
Lenovo Ideapad 320-15IAP-80XR019ESP: Intel Celeron N3350, 15.60", 2.2 kg
Extern testrapport » Lenovo Ideapad 320-15IAP-80XR019ESP
Asus VivoBook Flip 12 TP203NAH-BP073T: Intel Celeron N3350, 11.60", 1.3 kg
Extern testrapport » Asus VivoBook Flip 12 TP203NAH-BP073T
HP Chromebook 14 G5-3PD87UT: Intel Celeron N3350, 14.00", 1.5 kg
Extern testrapport » HP Chromebook 14 G5-3PD87UT
Asus Chromebook Flip C213NA-BU0033: Intel Celeron N3350, 11.60", 1.3 kg
Extern testrapport » Asus Chromebook Flip C213NA-BU0033
Asus VivoBook L402NA-GA042TS: Intel Celeron N3350, 14.00", 1.7 kg
Extern testrapport » Asus VivoBook L402NA-GA042TS
Acer Chromebook 11 CB311-8HT: Intel Celeron N3450, 11.60", 1.1 kg
Extern testrapport » Acer Chromebook 11 CB311-8HT
Acer Aspire 3 A315-31-C873 : Intel Celeron N3350, 15.60", 2.1 kg
Extern testrapport » Acer Aspire 3 A315-31-C873
Acer Switch 3 SW312-31-C8ZK: Intel Celeron N3350, 12.20", 0.9 kg
Extern testrapport » Acer Switch 3 SW312-31-C8ZK
Acer Spin 1 SP111-32N-C2GU: Intel Celeron N3350, 11.60", 1.2 kg
Extern testrapport » Acer Spin 1 SP111-32N-C2GU
Acer Spin 1 SP111-32N-C2X3: Intel Celeron N3350, 11.60", 1.3 kg
Extern testrapport » Acer Spin 1 SP111-32N-C2X3
Acer Spin 1 SP111-32N-C9Q9: Intel Celeron N3350, 11.60", 1.3 kg
Extern testrapport » Acer Spin 1 SP111-32N-C9Q9
Trekstor Primebook C13: Intel Celeron N3350, 13.30", 1.4 kg
Extern testrapport » Trekstor Primebook C13
Asus Vivobook E12 X207NA-FD053T: Intel Celeron N3350, 11.60", 1 kg
Extern testrapport » Asus Vivobook E12 X207NA-FD053T
Trekstor Primebook P14: Intel Celeron N3350, 14.10", 1.4 kg
Extern testrapport » Trekstor Primebook P14
Jumper EZBook 3S: Intel Celeron N3450, 14.10", 1.3 kg
Extern testrapport » Jumper EZBook 3S
Acer Spin 1 SP111-31-C1TK: Intel Celeron N3450, 11.60", 1.5 kg
Extern testrapport » Acer Spin 1 SP111-31-C1TK
Acer Spin 1 SP111-31-C79E: Intel Celeron N3450, 11.60", 1.5 kg
Extern testrapport » Acer Spin 1 SP111-31-C79E
Asus D541NA-GQ263: Intel Celeron N3350, 15.60", 1.5 kg
Extern testrapport » Asus D541NA-GQ263
Acer Chromebook 15 CB515-1H-C1VS: Intel Celeron N3350, 15.60", 1.8 kg
Extern testrapport » Acer Chromebook 15 CB515-1H-C1VS
Acer Chromebook 15 CB515-1HT-C1W7: Intel Celeron N3450, 15.60", 1.8 kg
Extern testrapport » Acer Chromebook 15 CB515-1HT-C1W7
Chuwi Lapbook Air: Intel Celeron N3450, 14.10", 1.7 kg
Extern testrapport » Chuwi Lapbook Air
Asus VivoBook E12 E203NA-FD020T: Intel Celeron N3350, 11.60", 1 kg
Extern testrapport » Asus VivoBook E12 E203NA-FD020T
Lenovo Ideapad 120s-11IAP: Intel Celeron N3350, 11.60", 1.3 kg
Extern testrapport » Lenovo Ideapad 120s-11IAP
Chuwi SurBook Mini: Intel Celeron N3450, 10.80", 0.8 kg
Extern testrapport » Chuwi SurBook Mini
Lenovo Ideapad 120S-14IAP: Intel Celeron N3350, 14.00", 1.4 kg
Extern testrapport » Lenovo Ideapad 120S-14IAP
Acer Chromebook Spin 11 R751T-C4XP: Intel Celeron N3350, 11.60", 1.4 kg
Extern testrapport » Acer Chromebook Spin 11 R751T-C4XP
Acer Aspire ES1-533-C3PZ: Intel Celeron N3350, 15.60", 2.4 kg
Extern testrapport » Acer Aspire ES1-533-C3PZ
Medion Akoya E3213: Intel Celeron N3350, 13.30", 1.5 kg
Extern testrapport » Medion Akoya E3213
Acer Spin 1 SP111-32N-C9FE: Intel Celeron N3350, 11.60", 1.6 kg
Extern testrapport » Acer Spin 1 SP111-32N-C9FE
Asus VivoBook Max F541NA-GQ050T: Intel Celeron N3350, 15.60", 2 kg
Extern testrapport » Asus VivoBook Max F541NA-GQ050T
Medion Akoya E3213T-30023176: Intel Celeron N3350, 13.30", 1.1 kg
Extern testrapport » Medion Akoya E3213T-30023176
Acer Aspire ES1-533-C4GG: Intel Celeron N3350, 15.60", 2.4 kg
Extern testrapport » Acer Aspire ES1-533-C4GG
Chuwi Surbook: Intel Celeron N3450, 12.30", 1 kg
Extern testrapport » Chuwi Surbook
Asus Chromebook Flip C213SA-YS02: Intel Celeron N3350, 11.60", 1.2 kg
Extern testrapport » Asus Chromebook Flip C213SA-YS02
Asus VivoBook W202NA-YS02: Intel Celeron N3350, 11.60", 1.2 kg
Extern testrapport » Asus VivoBook W202NA-YS02
Prestigio Smartbook 133S: Intel Celeron N3350, 13.30", 1.4 kg
Extern testrapport » Prestigio Smartbook 133S
Acer TravelMate Spin B1 B118-RN-C6WX: Intel Celeron N3450, 11.60", 1.5 kg
Extern testrapport » Acer TravelMate Spin B1 B118-RN-C6WX
Asus VivoBook Max X541NA-GQ028T: Intel Celeron N3350, 15.60", 2 kg
Extern testrapport » Asus VivoBook Max X541NA-GQ028T
Acer Aspire ES1-132-C9NX: Intel Celeron N3350, 11.60", 1.3 kg
Extern testrapport » Acer Aspire ES1-132-C9NX
Teclast X3 Plus: Intel Celeron N3450, 11.60", 0.9 kg
Extern testrapport » Teclast X3 Plus
Chuwi Lapbook 12.3: Intel Celeron N3450, 12.30", 1.4 kg
Extern testrapport » Chuwi Lapbook 12.3
Acer Aspire ES1-132-C8J0: Intel Celeron N3350, 11.60", 1.3 kg
Extern testrapport » Acer Aspire ES1-132-C8J0
Chuwi Hi13: Intel Celeron N3450, 13.50", 1.1 kg
Extern testrapport » Chuwi Hi13
Jumper EZbook 3: Intel Celeron N3350, 14.10", 1.2 kg
Extern testrapport » Jumper EZbook 3
Chuwi LapBook 14 inch 2017: Intel Celeron N3450, 14.10", 1.4 kg
Extern testrapport » Chuwi LapBook 14 inch 2017
Alcatel Plus 12: Intel Celeron N3350, 11.60", 0.6 kg
Extern testrapport » Alcatel Plus 12
HP ProBook x360 11 Education Edition: Intel Celeron N3350, 11.60", 1.4 kg
Extern testrapport » HP ProBook x360 11 Education Edition