Notebook-testrapporten met Intel HD Graphics 505 grafische kaart
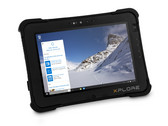
Kort testrapport Xplore Technologies XSlate L10 (Pentium N4200, FHD) Tablet
Modern en robuust. Een geharde tablet met alle voorzieningen die u van een consumententablet mag verwachten en meer. De Xplore XSlate L10 werkt met dezelfde processor als de nieuwste Ultrabooks met NFC, 4G LTE en zelfs een verwisselbare batterij en een volledige grootte HDMI poort.
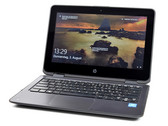
Intel Pentium N4200, HD Graphics 505, 10.1", 1.3 kgKort testrapport HP ProBook x360 11 G1 (Pentium N4200, 256 GB) Convertible
Stevige convertible? Met de ProBook X360 11 biedt HP een kleine convertible die weet te scoren met zijn stevigheid en veelzijdigheid. We vatten in dit testrapport samen hoe de Education Edition het ervan afbrengt op het vlak van prestaties.
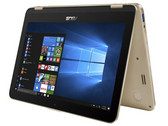
Intel Pentium N4200, HD Graphics 505, 11.6", 1.5 kgKort testrapport Asus VivoBook Flip 12 TP203NAH (N4200, HD) Laptop
Onopmerkelijk. De Asus-convertible beschikt over een Apollo Lake-processor en een grote opslagcapaciteit. De batterijduur kan op zijn best matig genoemd worden. Voor een prijs van bijna 500 euro (~$560) behoort het toestel niet tot de meest betaalbare modellen.
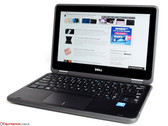
Intel Pentium N4200, HD Graphics 505, 11.6", 1.3 kgKort testrapport Dell Latitude 3189 (N4200, HD) Convertible
Robuust gemaakt! Dell heeft een 11,6 inch laptop uitgerust met energiezuinige CPU. Volgens de fabrikant zou deze combinatie de laptop in staat stellen het een volledige dag uit te houden. In dit testrapport onderzoeken we deze claim en onthullen we of de Latitude 3189 zich aan de afspraken kan houden.
Intel Pentium N4200, HD Graphics 505, 11.6", 1.4 kgKort testrapport Dell Latitude 3180 (N4200, HD) Laptop
Met uithoudingsvermogen. De 11.6-inch Latitude heeft een snelle SSD, een lange batterijduur en is stil in gebruik. Dell vraagt een hoge prijs voor de laptop: ongeveer 580 euro (~$622). Het Windows 10 Pro besturingssysteem is de belangrijkste reden hiervoor.
Intel Pentium N4200, HD Graphics 505, 11.6", 1.6 kgAcer Aspire ES1-332-P91H: Intel Pentium N4200, 13.30", 1.5 kg
Testrapport » Kort testrapport Acer Aspire ES1-332-P91H Notebook
Asus Chromebook C423NA-EB0243: Intel Pentium N4200, 14.00", 1.2 kg
Extern testrapport » Asus Chromebook C423NA-EB0243
Acer Chromebook 514 CB514-1HT-P1BM: Intel Pentium N4200, 14.00", 1.4 kg
Extern testrapport » Acer Chromebook 514 CB514-1HT-P1BM
Asus Chromebook Z1500CN-EJ0165: Intel Pentium N4200, 15.60", 1.5 kg
Extern testrapport » Asus Chromebook Z1500CN-EJ0165
Asus Chromebook Z1400CN-BV0305: Intel Pentium N4200, 14.00", 1.2 kg
Extern testrapport » Asus Chromebook Z1400CN-BV0305
Chuwi LapBook Plus: Intel Atom x7-E3950, 15.60", 1.5 kg
Extern testrapport » Chuwi LapBook Plus
Acer Chromebook 14 CB514-1HT-P2D1: Intel Pentium N4200, 14.00", 1.4 kg
Extern testrapport » Acer Chromebook 14 CB514-1HT-P2D1
Acer Chromebook 14 CB514-1HT-P1BM: Intel Pentium N4200, 14.00", 1.4 kg
Extern testrapport » Acer Chromebook 14 CB514-1HT-P1BM
Trekstor Surfbook A13-P: Intel Pentium N4200, 13.30", 1.2 kg
Extern testrapport » Trekstor Surfbook A13-P
Acer Aspire ES1-732-P7YA: Intel Pentium N4200, 17.30", 2.8 kg
Extern testrapport » Acer Aspire ES1-732-P7YA
Acer Chromebook Spin 15 CP315-1H: Intel Pentium N4200, 15.60", 1.7 kg
Extern testrapport » Acer Chromebook Spin 15 CP315-1H
Acer Chromebook C523NA-IH24T: Intel Pentium N4200, 15.60", 1.4 kg
Extern testrapport » Acer Chromebook C523NA-IH24T
Acer Spin 1 SP111-32N-P1PR: Intel Pentium N4200, 11.60", 1.3 kg
Extern testrapport » Acer Spin 1 SP111-32N-P1PR
Lenovo IdeaPad 120S-14IAP-81A500EDGE: Intel Pentium N4200, 14.00", 1.4 kg
Extern testrapport » Lenovo IdeaPad 120S-14IAP-81A500EDGE
Trekstor Primebook P14B: Intel Pentium N4200, 14.10", 1.4 kg
Extern testrapport » Trekstor Primebook P14B
Asus VivoBook Flip 14 TP401NA: Intel Pentium N4200, 14.00", 1.5 kg
Extern testrapport » Asus VivoBook Flip 14 TP401NA
Acer Chromebook Spin 15 CP315-1H-P75Z: Intel Pentium N4200, 15.60", 2.1 kg
Extern testrapport » Acer Chromebook Spin 15 CP315-1H-P75Z
Acer Chromebook 15 CB515-1HT-P099: Intel Pentium N4200, 15.60", 2 kg
Extern testrapport » Acer Chromebook 15 CB515-1HT-P099
Acer Chromebook Spin 15 CP315-1H-P1K8: Intel Pentium N4200, 15.60", 2.2 kg
Extern testrapport » Acer Chromebook Spin 15 CP315-1H-P1K8
Asus X540NA-GQ151T: Intel Pentium N4200, 15.60", 2 kg
Extern testrapport » Asus X540NA-GQ151T
Acer Aspire ES1-533-P5MS: Intel Pentium N4200, 15.60", 2.4 kg
Extern testrapport » Acer Aspire ES1-533-P5MS
Acer Aspire 3 A315-31-P3ZM: Intel Pentium N4200, 15.60", 2.4 kg
Extern testrapport » Acer Aspire 3 A315-31-P3ZM
Lenovo Ideapad 320-15IAP-80XR0094GE: Intel Pentium N4200, 15.60", 2.2 kg
Extern testrapport » Lenovo Ideapad 320-15IAP-80XR0094GE
Acer Switch 3 SW312-31-P7SF: Intel Pentium N4200, 12.20", 0.9 kg
Extern testrapport » Acer Switch 3 SW312-31-P7SF
Acer Chromebook 15 CB515-1HT-P80X: Intel Pentium N4200, 15.60", 1.8 kg
Extern testrapport » Acer Chromebook 15 CB515-1HT-P80X
Acer Swift 1 SF113-31-P72F: Intel Pentium N4200, 13.30", 1.3 kg
Extern testrapport » Acer Swift 1 SF113-31-P72F
Acer Chromebook 15 CB515-1HT-P39B: Intel Pentium N4200, 15.60", 1.8 kg
Extern testrapport » Acer Chromebook 15 CB515-1HT-P39B
Medion Akoya E3216-MD61800: Intel Pentium N4200, 13.30", 1.5 kg
Extern testrapport » Medion Akoya E3216-MD61800
Acer Aspire ES1-533-P8BX: Intel Pentium N4200, 15.60", 2.4 kg
Extern testrapport » Acer Aspire ES1-533-P8BX
Acer Swift 1 SF113-31-P56D: Intel Pentium N4200, 13.30", 1.4 kg
Extern testrapport » Acer Swift 1 SF113-31-P56D
Acer Swift 1 SF113-31-P3P0: Intel Pentium N4200, 13.30", 1.3 kg
Extern testrapport » Acer Swift 1 SF113-31-P3P0
Acer Switch 3 SW312-31-P3FT: Intel Pentium N4200, 12.20", 0.9 kg
Extern testrapport » Acer Switch 3 SW312-31-P3FT
Asus VivoBook E14 E403NA-GA016T: Intel Pentium N4200, 14.00", 1.5 kg
Extern testrapport » Asus VivoBook E403NA-GA016T
Acer Spin 1 SP111-32N-P9VD: Intel Pentium N4200, 11.60", 1.3 kg
Extern testrapport » Acer Spin 1 SP111-32N-P9VD
Lenovo IdeaPad V110-15IAP-80TG00W3GE: Intel Pentium N4200, 15.60", 1.9 kg
Extern testrapport » Lenovo IdeaPad V110-15IAP-80TG00W3GE
Acer TravelMate Spin B1 B118-RN-P6BE: Intel Pentium N4200, 11.60", 1.5 kg
Extern testrapport » Acer TravelMate Spin B1 B118-RN-P6BE
Medion Akoya E3215-MD60794: Intel Pentium N4200, 13.30", 1.5 kg
Extern testrapport » Medion Akoya E3215-MD60794
HP Pavilion x360 11-ad051nr: Intel Pentium N4200, 11.60", 1.4 kg
Extern testrapport » HP Pavilion x360 11-ad051nr
Acer Switch 3 SW312-31P: Intel Pentium N4200, 12.00", 1.2 kg
Extern testrapport » Acer Switch 3 SW312-31P
Acer Swift 1 SF113-31-P5CK: Intel Pentium N4200, 13.30", 1.4 kg
Extern testrapport » Acer Swift 1 SF113-31-P5CK
Asus Vivobook E14 L403NA-FA017TS: Intel Pentium N4200, 14.00", 1.4 kg
Extern testrapport » Asus Vivobook E14 L403NA-FA017TS
Acer Swift 1 SF113-31-P63H: Intel Pentium N4200, 13.30", 1.4 kg
Extern testrapport » Acer Swift 1 SF113-31-P63H
Medion Akoya E3216-MD60900: Intel Pentium N4200, 13.30", 1.5 kg
Extern testrapport » Medion Akoya E3216-MD60900
Acer Chromebook 15 CB515-1HT-P58C: Intel Pentium N4200, 15.60", 1.8 kg
Extern testrapport » Acer Chromebook 15 CB515-1HT-P58C
BTO Notebooks U-BOOK 14CL23: Intel Pentium N4200, 14.00", 1.8 kg
Extern testrapport » BTO Notebooks U-BOOK 14CL23
Asus VivoBook Flip 12 TP203NAH-BP049T: Intel Pentium N4200, 11.60", 1.3 kg
Extern testrapport » Asus VivoBook Flip 12 TP203NAH-BP049T
Dell Latitude 3189: Intel Pentium N4200, 11.60", 1.4 kg
Extern testrapport » Dell Latitude 3189
Acer Swift 1 SF113-31-P2CP: Intel Pentium N4200, 13.30", 1.4 kg
Extern testrapport » Acer Swift 1 SF113-31-P2CP
Acer Aspire ES1-533-P2V5: Intel Pentium N4200, 15.60", 2.4 kg
Extern testrapport » Acer Aspire ES1-533-P2V5
Acer Switch 3 SW312-31-P5VG: Intel Pentium N4200, 12.20", 0.9 kg
Extern testrapport » Acer Switch 3 SW312-31-P5VG
Acer Aspire A315-31-P72U: Intel Pentium N4200, 15.60", 2.4 kg
Extern testrapport » Acer Aspire A315-31-P72U
Acer Aspire ES1-533-P6NL: Intel Pentium N4200, 15.60", 2.4 kg
Extern testrapport » Acer Aspire ES1-533-P6NL
Acer Aspire ES1-132-P065: Intel Pentium N4200, 11.60", 1.3 kg
Extern testrapport » Acer Aspire ES1-132-P065
Acer Swift 1 SF113-31-P2CP: Intel Pentium N4200, 13.30", 1.4 kg
Extern testrapport » Acer Swift 1 SF113-31-P2CP
Acer Aspire ES1-332-P7SA: Intel Pentium N4200, 13.30", 1.7 kg
Extern testrapport » Acer Aspire ES1-332-P7SA
Lenovo IdeaPad V110-15IAP-80TG00W8GE: Intel Pentium N4200, 15.60", 1.9 kg
Extern testrapport » Lenovo IdeaPad V110-15IAP-80TG00W8GE
Acer Spin 1 SP113-31-P0ZN: Intel Pentium N4200, 13.30", 1.6 kg
Extern testrapport » Acer Spin 1 SP113-31-P0ZN
Lenovo IdeaPad V110-15IAP 80TG00W4GE: Intel Pentium N4200, 15.60", 1.9 kg
Extern testrapport » Lenovo IdeaPad V110-15IAP 80TG00W4GE
Acer Spin 1 SP111-31-P40B: Intel Pentium N4200, 11.60", 1.5 kg
Extern testrapport » Acer Spin 1 SP111-31-P40B
Acer Aspire ES1-533-P591: Intel Pentium N4200, 15.60", 2.4 kg
Extern testrapport » Acer Aspire ES1-533-P591
HP ProBook x360 11-G1: Intel Pentium N4200, 11.60", 1.4 kg
Extern testrapport » HP ProBook x360 11-G1