Intel HD Graphics 530
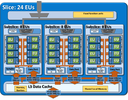
De Intel HD Graphics 530 (GT2) is een geïntegreerde grafische kaart die aangetroffen wordt in verschillende desktop- en notebook-processors van de Skylake-generatie. De 'GT2'-versie van de Skylake-GPU biedt 24 Execution Units (EU's) geklokt aan maximaal 1150 MHz (afhankelijk van het CPU-model). De HD 530 mist dedicated grafisch geheugen of een eDRAM-cache, waardoor de GPU in plaats gebruik maakt van het hoofdgeheugen (2x 64-Bit DDR3L-1600/DDR4-2133).
De precieze performance van de Iris Graphics 530 hangt af van uiteenlopende factoren zoals het TDP, het geheugen (DDR3/DDR4) en de maximumkloksnelheid van het specifieke model. De snelste desktop-versies (Core i7-6700K) kunnen concurreren met een dedicated GeForce 920M en moderne games (2015) aankunnen in lage of gemiddelde instellingen.
De herziene video-engine kan nu H.265/HEVC volledig in hardware decoderen wat veel efficiënter is dan voordien. Schermen kunnen aangesloten worden via DP 1.2/eDP 1.3 (max. 3840 x 2160 @ 60 Hz), terwijl HDMI beperkt is tot de oudere versie 1.4a (max. 3840 x 2160 @ 30 Hz). HDMI 2.0 kan toegevoegd worden via een DisplayPort-converter. De GPU is in staat om maximaal drie schermen tegelijk aan te sturen.
De HD Graphics 530 kan aangetroffen worden in uiteenlopende notebook- en desktop-processors van verschillende TDP-klassen (35-91 Watt).
Gen. 9 Serie Iris Pro Graphics P580 72 @ 0.35 - 1.1 GHz eDRAM + 64/128 bit Iris Pro Graphics 580 72 @ 0.35 - 1.05 GHz eDRAM + 64/128 bit Iris Graphics 550 48 @ 0.3 - 1.1 GHz eDRAM + 64/128 bit Iris Graphics 540 48 @ 0.3 - 1.05 GHz eDRAM + 64/128 bit HD Graphics 530 24 @ 0.35 - 1.15 GHz 64/128 bit HD Graphics 520 24 @ 0.3 - 1.05 GHz 64/128 bit HD Graphics 515 24 @ 0.3 - 1 GHz 64/128 bit UHD Graphics 610 12 @ 0.3 - 0.95 GHz 64/128 bit HD Graphics 610 12 @ 0.3 - 0.95 GHz 64/128 bit HD Graphics 510 12 @ 0.3 - 0.95 GHz 64/128 bit UHD Graphics 605 18 @ 0.3 - 0.75 GHz 64/128 bit HD Graphics 505 18 @ 0.3 - 0.75 GHz 64/128 bit UHD Graphics 600 12 @ 0.3 - 0.7 GHz 64/128 bit HD Graphics 500 12 @ 0.3 - 0.7 GHz 64/128 bit
Codenaam Skylake GT2 Architectuur Gen. 9 Skylake Pipelines 24 - verenigd Core-snelheid 350 - 1150 (Boost) MHz Geheugenbusbreedte 64/128 bit Gedeeld geheugen ja API DirectX 12_1, OpenGL 4.4 technologie 14 nm Faciliteiten QuickSync Aangekondigde datum 05.08.2015
CPU in HD Graphics 530 GPU Base Speed GPU Boost / Turbo Intel Core i7-6700K 4 x 4000 MHz, 91 W 350 MHz 1150 MHz Intel Core i7-6700 4 x 3400 MHz, 65 W 350 MHz 1150 MHz Intel Core i7-6920HQ 4 x 2900 MHz, 45 W 350 MHz 1050 MHz » show 14 more Intel Core i5-6600K 4 x 3500 MHz, 91 W 350 MHz 1150 MHz Intel Core i7-6820HK 4 x 2700 MHz, 45 W 350 MHz 1050 MHz Intel Core i7-6820HQ 4 x 2700 MHz, 45 W 350 MHz 1050 MHz Intel Core i7-6700T 4 x 2800 MHz, 35 W 350 MHz 1100 MHz Intel Core i7-6700HQ 4 x 2600 MHz, 45 W 350 MHz 1050 MHz Intel Core i5-6500 4 x 3200 MHz, 65 W 350 MHz 1050 MHz Intel Core i5-6600T 4 x 2700 MHz, 35 W 350 MHz 1100 MHz Intel Core i5-6440HQ 4 x 2600 MHz, 45 W 350 MHz 950 MHz Intel Core i5-6300HQ 4 x 2300 MHz, 45 W 350 MHz 950 MHz Intel Core i5-6400 4 x 2700 MHz, 65 W 350 MHz 950 MHz Intel Core i5-6500T 4 x 2500 MHz, 35 W 350 MHz 1100 MHz Intel Core i5-6400T 4 x 2200 MHz, 35 W 350 MHz 950 MHz Intel Core i3-6100H 2 x 2700 MHz, 35 W 350 MHz 900 MHz Intel Pentium G4500T 2 x 3000 MHz, 35 W 350 MHz 950 MHz min. - max. 350 MHz 900 - 1150 MHz
Benchmarks Performance Rating - 3DMark 11 + Fire Strike + Time Spy
4.2 pt (5%)
...
AMD Radeon R5 (Bristol Ridge) -2%
AMD FirePro W4190M -1%
AMD Radeon R7 (Carrizo) 0%
AMD Radeon R6 M255DX 0%
AMD Radeon R7 M360 0%
Intel UHD Graphics Xe 16EUs (Tiger Lake-H) 2%
AMD Radeon R7 M445 3%
...
3DMark - 3DMark Time Spy Score
271 Points (1%)
Intel UHD Graphics 605 -52%
...
Intel UHD Graphics 600 -54%
Intel UHD Graphics 605 -52%
Intel UHD Graphics 610 -18%
Intel HD Graphics 610 -18%
AMD Radeon R4 (Stoney Ridge) -16%
Intel UHD Graphics 615 2%
AMD Radeon R6 (Carrizo) 11%
Intel UHD Graphics 617 25%
...
3DMark - 3DMark Time Spy Graphics
235 Points (1%)
Intel UHD Graphics 605 -52%
...
Intel UHD Graphics 600 -54%
Intel UHD Graphics 605 -52%
Intel UHD Graphics 610 -17%
Intel HD Graphics 610 -17%
AMD Radeon R4 (Stoney Ridge) -13%
Intel UHD Graphics 615 4%
AMD Radeon R6 (Carrizo) 17%
Intel UHD Graphics 617 27%
...
3DMark - 3DMark Ice Storm Unlimited Graphics
min: 72022 gem: 80242 mediaan: 80241.5 (11%) max: 88461 Points
...
NVIDIA Quadro T2000 Max-Q -6%
Intel UHD Graphics 617 -4%
AMD Radeon R7 M360 3%
Intel Iris Plus Graphics G4 (Ice Lake 48 EU) 3%
Intel UHD Graphics G7 (Lakefield GT2 64 EU) 9%
...
3DMark - 3DMark Ice Storm Extreme Graphics
min: 33064 gem: 38022 mediaan: 33851 (5%) max: 47150 Points
...
AMD Radeon R6 (Carrizo) -11%
NVIDIA Quadro P2000 Max-Q -4%
AMD Radeon R5 (Bristol Ridge) -3%
AMD Radeon R7 M460 2%
NVIDIA GeForce GTX 1050 Ti Max-Q 4%
AMD Radeon R6 M340DX 6%
AMD Radeon R7 (Carrizo) 8%
...
NVIDIA GeForce RTX 3080 Laptop GPU 992%
3DMark - 3DMark Cloud Gate Score
min: 5731 gem: 7593 mediaan: 7652 (9%) max: 10384 Points
...
AMD Radeon R9 M280X -5%
AMD FirePro W4190M 0%
...
3DMark - 3DMark Cloud Gate Graphics
min: 6155 gem: 7859 mediaan: 7500 (3%) max: 10598 Points
...
AMD Radeon R5 (Bristol Ridge) 5%
Intel UHD Graphics G7 (Lakefield GT2 64 EU) 7%
...
3DMark - 3DMark Fire Strike Standard Score
min: 637 gem: 876 mediaan: 878 (2%) max: 1112 Points
...
AMD Radeon R5 M335 -6%
AMD Radeon R5 M330 -4%
AMD Radeon R6 (Carrizo) -4%
AMD Radeon R5 M240 0%
AMD Radeon R6 M255DX 1%
Intel UHD Graphics 617 2%
Intel HD Graphics 630 2%
AMD Radeon R5 (Carrizo) 3%
NVIDIA GeForce 910M 4%
...
3DMark - 3DMark Fire Strike Standard Graphics
min: 672 gem: 941 mediaan: 935 (2%) max: 1202 Points
...
AMD Radeon R5 M335 -3%
AMD Radeon R6 (Carrizo) -3%
AMD Radeon R5 M330 -3%
AMD Radeon R5 M315 -2%
AMD Radeon R5 M240 1%
Intel HD Graphics 630 3%
Intel UHD Graphics 617 6%
AMD Radeon R5 (Carrizo) 6%
NVIDIA GeForce 910M 9%
...
3DMark - 3DMark Ice Storm Graphics
min: 49675 gem: 69987 mediaan: 61056.5 (8%) max: 93641 Points
...
NVIDIA GeForce RTX 2070 Super Max-Q -4%
Intel Iris Plus Graphics G7 (Ice Lake 64 EU) 1%
NVIDIA Quadro P520 2%
NVIDIA GeForce GTX 1050 Ti Max-Q 5%
NVIDIA Quadro M600M 5%
...
3DMark 11 - 3DM11 Performance Score
min: 1327 gem: 1560 mediaan: 1579 (3%) max: 1761 Points
...
AMD Radeon HD 6755G2 -3%
AMD Radeon R6 (Carrizo) 1%
AMD Radeon R5 M320 6%
...
3DMark 11 - 3DM11 Performance GPU
min: 1162 gem: 1355 mediaan: 1362 (2%) max: 1549 Points
...
NVIDIA GeForce 910M 4%
AMD Radeon R6 (Carrizo) 7%
AMD Radeon HD 6720G2 9%
...
3DMark Vantage 3DM Vant. Perf. total + 3DMark Vantage - 3DM Vant. Perf. total
min: 5376 gem: 6414 mediaan: 6831 (6%) max: 7036 Points
...
...
3DM Vant. Perf. GPU no PhysX + 3DMark Vantage - 3DM Vant. Perf. GPU no PhysX
min: 4345 gem: 5173 mediaan: 5520 (4%) max: 5653 Points
...
AMD Radeon R7 M360 0%
...
3DMark 03 - 3DMark 03 - Standard
16802 Points (9%)
VIA S3 Graphics ProSavage8 -100%
...
NVIDIA GeForce GT 525M 5%
...
3DMark 05 - 3DMark 05 - Standard
13920 Points (19%)
...
ATI Mobility Radeon HD 5165 -5%
NVIDIA GeForce GT 525M -4%
ATI Mobility Radeon HD 5730 -1%
...
3DMark 06 3DMark 06 - Standard 1280x1024 +
min: 8504 gem: 10716 mediaan: 11309 (17%) max: 11840 Points
...
Intel Iris Plus Graphics G4 (Ice Lake 48 EU) 1%
NVIDIA Quadro K620M 2%
Intel UHD Graphics G1 (Ice Lake 32 EU) 2%
Intel UHD Graphics Xe G4 48EUs 3%
...
SPECviewperf 11 specvp11 snx-01 + SPECviewperf 11 - specvp11 snx-01
min: 2.38 gem: 2.5 mediaan: 2.5 (2%) max: 2.54 fps
...
NVIDIA GeForce GTX 765M -4%
NVIDIA NVS 4200M -1%
Intel HD Graphics 630 13%
...
NVIDIA Quadro M4000M 4428%
specvp11 tcvis-02 + SPECviewperf 11 - specvp11 tcvis-02
min: 3.28 gem: 3.4 mediaan: 3.4 (6%) max: 3.52 fps
...
AMD Radeon R7 M260 -3%
NVIDIA GeForce GTX 1070 Max-Q -1%
AMD Radeon HD 6490M 10%
NVIDIA GeForce GTX 1070 Mobile 18%
...
NVIDIA Quadro M4000M 1609%
specvp11 sw-02 + SPECviewperf 11 - specvp11 sw-02
min: 16.01 gem: 16.7 mediaan: 16.7 (20%) max: 17.47 fps
...
AMD Radeon HD 6730M 11%
...
AMD FirePro W7170M 342%
specvp11 proe-05 + SPECviewperf 11 - specvp11 proe-05
min: 2.54 gem: 2.7 mediaan: 2.7 (11%) max: 2.76 fps
...
NVIDIA GeForce GTX 1050 Ti Mobile 7%
NVIDIA GeForce GTX 1070 Max-Q 8%
...
specvp11 maya-03 + SPECviewperf 11 - specvp11 maya-03
min: 21.9 gem: 22.3 mediaan: 22.2 (17%) max: 22.59 fps
...
NVIDIA GeForce GTX 1070 Max-Q -17%
NVIDIA GeForce GTX 1050 Ti Mobile -9%
Intel HD Graphics 630 10%
NVIDIA GeForce GTX 1070 Mobile 22%
...
NVIDIA Quadro M4000M 391%
specvp11 lightwave-01 + SPECviewperf 11 - specvp11 lightwave-01
min: 22.54 gem: 23.3 mediaan: 23.3 (25%) max: 24.05 fps
...
NVIDIA GeForce GTX 1050 Ti Mobile -6%
AMD Radeon HD 6730M 4%
Intel HD Graphics 630 10%
NVIDIA GeForce GTX 1070 Mobile 14%
...
AMD FirePro W7170M 261%
specvp11 ensight-04 + SPECviewperf 11 - specvp11 ensight-04
min: 3.2 gem: 3.3 mediaan: 3.3 (2%) max: 3.39 fps
...
Intel HD Graphics 630 11%
NVIDIA NVS 4200M 74%
AMD Radeon HD 6490M 88%
...
NVIDIA GeForce GTX 1070 Max-Q 4765%
Cinebench R10 Cinebench R10 Shading (32bit) + Cinebench R10 - Cinebench R10 Shading (32bit)
min: 7523 gem: 8622 mediaan: 8926 (38%) max: 9569 punten
...
AMD Radeon Pro WX 3100 -2%
NVIDIA GeForce GTX 1070 Mobile -1%
AMD Radeon R5 M335 -1%
Intel Iris Plus Graphics 650 2%
NVIDIA GeForce GTX 1080 Max-Q 6%
...
Cinebench R11.5 Cinebench R11.5 OpenGL 64 Bit + Cinebench R11.5 - Cinebench R11.5 OpenGL 64 Bit
min: 35.45 gem: 41 mediaan: 40.5 (15%) max: 46.98 fps
...
AMD Radeon R9 M280X -2%
AMD Radeon RX Vega 6 (Ryzen 4000/5000) -1%
AMD Radeon RX Vega 8 (Ryzen 2000/3000) 0%
AMD Radeon RX Vega 6 (Ryzen 2000/3000) 0%
AMD Radeon R7 M445 2%
...
Cinebench R15 Cinebench R15 OpenGL 64 Bit + Cinebench R15 - Cinebench R15 OpenGL 64 Bit
min: 34.51 gem: 41.7 mediaan: 42.3 (11%) max: 47.32 fps
...
Intel UHD Graphics 617 -6%
AMD Radeon RX Vega 10 5%
AMD Radeon RX Vega 6 (Ryzen 2000/3000) 7%
AMD Radeon R9 M385X 8%
AMD Radeon R9 M375 9%
AMD Radeon R7 M445 10%
AMD Radeon RX Vega 8 (Ryzen 2000/3000) 10%
...
Cinebench R15 OpenGL Ref. Match 64 Bit + Cinebench R15 - Cinebench R15 OpenGL Ref. Match 64 Bit
min: 97.8 gem: 97.8 mediaan: 97.8 (98%) max: 97.9 %
...
Intel UHD Graphics G1 (Ice Lake 32 EU) 0%
Intel UHD Graphics Xe G4 48EUs 0%
Intel UHD Graphics G7 (Lakefield GT2 64 EU) 0%
Intel UHD Graphics Xe 32EUs (Tiger Lake-H) 0%
Intel UHD Graphics 605 0%
Intel UHD Graphics Xe 750 32EUs (Rocket Lake) 0%
...
GFXBench 3.0 - GFXBench 3.0 Manhattan
50.1 fps (14%)
...
NVIDIA Quadro K620M -3%
Intel HD Graphics 610 3%
AMD Radeon RX 550X (Laptop) 4%
AMD Radeon RX Vega 9 15%
NVIDIA GeForce GTX 1050 Ti Max-Q 16%
...
NVIDIA GeForce GTX 1070 Max-Q 629%
GFXBench 3.0 - GFXBench 3.0 Manhattan Offscreen
60.6 fps (5%)
...
Intel HD Graphics 630 -22%
Intel UHD Graphics G7 (Lakefield GT2 64 EU) -20%
NVIDIA Quadro K620M 0%
AMD Radeon Pro 560 16%
...
Apple M1 Max 32-Core GPU 2032%
ComputeMark v2.1 - ComputeMark v2.1 Result
868 punten (2%)
...
Intel UHD Graphics Xe 16EUs (Tiger Lake-H) -8%
Intel UHD Graphics 615 -1%
AMD Radeon R6 M255DX 2%
AMD Radeon R6 (Carrizo) 2%
AMD FirePro W5130M 3%
AMD FirePro W4190M 4%
AMD Radeon RX 550 (Laptop) 6%
AMD FirePro W7170M 7%
...
Power Consumption - Furmark Stress Test Power Consumption - external Monitor *
52 Watt (8%)
...
NVIDIA Quadro M620 -13%
NVIDIA T500 Laptop GPU -10%
Intel Iris Plus Graphics 650 -1%
AMD Radeon Pro 455 8%
NVIDIA Quadro M600M 14%
Intel UHD Graphics Xe 750 32EUs (Rocket Lake) 16%
AMD Radeon Pro 555 17%
...
Power Consumption - The Witcher 3 Power Consumption - external Monitor *
min: 34.1 gem: 36.7 mediaan: 37.1 (5%) max: 39 Watt
...
AMD Radeon RX Vega 10 -12%
Intel UHD Graphics Xe 32EUs (Tiger Lake-H) -11%
AMD Radeon RX Vega 7 -8%
AMD Radeon RX Vega 6 (Ryzen 4000/5000) -7%
AMD Radeon RX Vega 8 (Ryzen 2000/3000) 4%
AMD Radeon RX Vega 9 10%
Intel HD Graphics 630 13%
...
- Benchmarkresultaten voor deze videokaart
- Gemiddelde benchmarkresultaten voor deze videokaart
* Kleinere getallen betekenen een hogere prestatie
Game Benchmarks De volgende benchmarks zijn afgeleid van onze laptop-testrapporten. De prestaties variëren afhankelijk van het gebruikte grafische geheugen, kloksnelheid, processor, systeeminstellingen, drivers en besturingssysteem. De resultaten zijn daarom niet noodzakelijk representatief voor alle laptops met deze GPU. Voor meer gedetailleerde informatie over de benchmarkresultaten, klik op het fps-aantal.
AMD Radeon R5 (Bristol Ridge) -30%
Intel HD Graphics 630 3%
AMD Radeon RX Vega 10 65%
...
NVIDIA GeForce GTX 1080 Max-Q 305%
» De benchmarkresultaten tonen aan dat de game niet speelbaar is met de geteste instellingen.
...
Intel UHD Graphics 615 -36%
AMD Radeon R5 (Bristol Ridge) -24%
Intel HD Graphics 630 -6%
AMD Radeon RX Vega 10 39%
AMD Radeon RX Vega 8 (Ryzen 2000/3000) 115%
...
» De benchmarkresultaten tonen aan dat de game niet speelbaar is met de geteste instellingen.
Intel UHD Graphics 605 -78%
...
Intel UHD Graphics 615 -28%
AMD Radeon R5 (Bristol Ridge) -11%
Intel Iris Plus Graphics G7 (Ice Lake 64 EU) 22%
AMD Radeon RX Vega 6 (Ryzen 2000/3000) 26%
...
» De benchmarkresultaten tonen aan dat de game niet speelbaar is met de geteste instellingen.
...
AMD Radeon R5 (Bristol Ridge) -47%
AMD Radeon RX Vega 6 (Ryzen 2000/3000) -33%
Intel UHD Graphics 615 -33%
Intel HD Graphics 630 -8%
AMD Radeon R9 M375 6%
AMD Radeon R9 M280X 23%
...
NVIDIA Quadro RTX 4000 (Laptop) 755%
AMD Radeon RX Vega 6 (Ryzen 2000/3000) -9%
...
Intel UHD Graphics 615 -9%
Intel HD Graphics 630 -9%
AMD Radeon RX Vega 6 (Ryzen 2000/3000) -9%
AMD Radeon R9 M375 52%
AMD Radeon RX Vega 10 52%
...
» De benchmarkresultaten tonen aan dat de game niet speelbaar is met de geteste instellingen.
...
AMD Radeon R5 (Bristol Ridge) -55%
Intel HD Graphics 630 -1%
AMD Radeon RX Vega 10 23%
...
AMD Radeon Pro 555 194%
» De benchmarkresultaten tonen aan dat de game niet speelbaar is met de geteste instellingen.
...
Intel UHD Graphics 615 -54%
Intel UHD Graphics 610 -46%
Intel UHD Graphics G1 (Ice Lake 32 EU) 38%
Intel UHD Graphics Xe 16EUs (Tiger Lake-H) 38%
Intel Iris Plus Graphics G4 (Ice Lake 48 EU) 46%
...
Intel HD Graphics 610 -50%
Intel UHD Graphics Xe 16EUs (Tiger Lake-H) 33%
Intel Iris Plus Graphics G4 (Ice Lake 48 EU) 83%
...
» De benchmarkresultaten tonen aan dat de game niet speelbaar is met de geteste instellingen.
Intel UHD Graphics 605 -61%
...
AMD Radeon R5 (Bristol Ridge) -33%
Intel HD Graphics 630 9%
AMD Radeon RX Vega 10 74%
...
» De benchmarkresultaten tonen aan dat de game niet speelbaar is met de geteste instellingen.
Intel UHD Graphics 605 -54%
...
Intel UHD Graphics 615 -34%
Intel HD Graphics 610 -34%
AMD Radeon R4 (Stoney Ridge) -27%
AMD Radeon R5 (Bristol Ridge) -14%
Intel HD Graphics 630 5%
...
NVIDIA GeForce RTX 2080 Super Mobile 1991%
» De benchmarkresultaten tonen aan dat de game niet speelbaar is met de geteste instellingen.
Intel UHD Graphics 615 -65%
...
AMD Radeon R5 (Bristol Ridge) -35%
Intel Iris Plus Graphics G4 (Ice Lake 48 EU) -12%
AMD Radeon R9 M375 1%
AMD Radeon RX Vega 9 7%
AMD Radeon RX Vega 6 (Ryzen 2000/3000) 8%
AMD Radeon RX Vega 10 26%
...
NVIDIA GeForce GTX 1070 Mobile 540%
...
AMD Radeon R5 (Bristol Ridge) -54%
Intel Iris Plus Graphics G4 (Ice Lake 48 EU) -37%
AMD Radeon RX Vega 6 (Ryzen 2000/3000) -3%
AMD Radeon R9 M375 13%
AMD Radeon RX Vega 9 14%
Intel HD Graphics 630 24%
...
» Met alle geteste laptops speelbaar met lage instellingen.
...
NVIDIA GeForce GTX 1070 Mobile
Intel HD Graphics 610 -46%
Intel HD Graphics 630 5%
...
NVIDIA GeForce GTX 1070 Mobile 404%
Intel HD Graphics 630 28%
...
NVIDIA GeForce GTX 1070 Mobile 890%
...
...
» Met alle geteste laptops speelbaar met lage instellingen.
AMD Radeon RX Vega 8 (Ryzen 2000/3000) 66%
AMD FirePro W4190M 120%
AMD Radeon Pro 450 193%
...
» De benchmarkresultaten tonen aan dat de game niet speelbaar is met de geteste instellingen.
...
AMD Radeon R5 (Bristol Ridge) -40%
Intel HD Graphics 610 -33%
AMD Radeon RX Vega 10 -13%
Intel HD Graphics 630 8%
...
...
AMD Radeon R5 (Bristol Ridge) -18%
AMD Radeon RX Vega 10 -12%
AMD FirePro W4190M 6%
AMD Radeon Pro WX 3100 24%
AMD Radeon RX Vega 8 (Ryzen 2000/3000) 69%
...
» De benchmarkresultaten tonen aan dat de game niet speelbaar is met de geteste instellingen.
Intel UHD Graphics 600 -66%
...
» De benchmarkresultaten tonen aan dat de game niet speelbaar is met de geteste instellingen.
...
Intel UHD Graphics G1 (Ice Lake 32 EU) -16%
Intel Iris Plus Graphics G4 (Ice Lake 48 EU) 3%
AMD Radeon RX 560X (Laptop) 6%
Intel Iris Plus Graphics G7 (Ice Lake 64 EU) 8%
...
AMD Radeon Pro 560X 90%
...
Intel UHD Graphics G1 (Ice Lake 32 EU) -18%
Intel Iris Plus Graphics G4 (Ice Lake 48 EU) 3%
Intel Iris Plus Graphics G7 (Ice Lake 64 EU) 12%
AMD Radeon RX 560X (Laptop) 14%
...
AMD Radeon Pro 560X 113%
Intel UHD Graphics 605 -54%
...
AMD Radeon RX Vega 10 -28%
Intel UHD Graphics 615 -24%
AMD Radeon R5 (Bristol Ridge) -19%
AMD Radeon RX Vega 6 (Ryzen 2000/3000) 8%
Intel UHD Graphics G1 (Ice Lake 32 EU) 17%
...
AMD Radeon Pro 560X 330%
AMD Radeon R5 (Bristol Ridge) 11%
Intel UHD Graphics G1 (Ice Lake 32 EU) 22%
Intel HD Graphics 630 49%
Intel Iris Plus Graphics G4 (Ice Lake 48 EU) 52%
Intel Iris Plus Graphics G7 (Ice Lake 64 EU) 52%
...
AMD Radeon Pro 560X 602%
» Met alle geteste laptops speelbaar met hoge instellingen.
...
AMD Radeon RX Vega 10 -9%
AMD Radeon R5 (Bristol Ridge) -6%
Intel HD Graphics 630 5%
...
» Met alle geteste laptops speelbaar met lage instellingen.
...
AMD Radeon R4 (Stoney Ridge) -43%
Intel UHD Graphics 615 -25%
Intel HD Graphics 610 -11%
Intel UHD Graphics 617 11%
Intel Iris Plus Graphics G4 (Ice Lake 48 EU) 11%
...
...
Intel UHD Graphics 617 -14%
Intel Iris Plus Graphics G4 (Ice Lake 48 EU) 8%
Intel HD Graphics 630 12%
AMD Radeon RX Vega 6 (Ryzen 2000/3000) 23%
...
Intel UHD Graphics 600 -55%
...
Intel UHD Graphics 617 -12%
Intel HD Graphics 630 6%
AMD Radeon RX Vega 6 (Ryzen 2000/3000) 9%
Intel UHD Graphics G1 (Ice Lake 32 EU) 13%
AMD Radeon R9 M375 21%
Intel Iris Plus Graphics G4 (Ice Lake 48 EU) 27%
...
» Met alle geteste laptops speelbaar met lage instellingen.
...
Intel UHD Graphics 615 -40%
Intel HD Graphics 610 -39%
AMD Radeon R5 (Bristol Ridge) -19%
Intel HD Graphics 630 22%
AMD Radeon R7 M340 48%
...
NVIDIA Quadro P5200 460%
» De benchmarkresultaten tonen aan dat de game niet speelbaar is met de geteste instellingen.
...
AMD Radeon R5 (Bristol Ridge) -57%
Intel HD Graphics 610 -45%
AMD Radeon RX Vega 8 (Ryzen 2000/3000) 43%
Apple M1 7-Core GPU 46%
...
NVIDIA GeForce GTX 1070 Max-Q 456%
» De benchmarkresultaten tonen aan dat de game niet speelbaar is met de geteste instellingen.
Intel HD Graphics 630 15%
AMD Radeon R9 M280X 59%
Intel Iris Plus Graphics 650 63%
...
NVIDIA GeForce GTX 1070 Max-Q 850%
» De benchmarkresultaten tonen aan dat de game niet speelbaar is met de geteste instellingen.
Intel UHD Graphics 605 -76%
...
AMD Radeon R5 (Bristol Ridge) -5%
Intel UHD Graphics G1 (Ice Lake 32 EU) -3%
Intel HD Graphics 630 10%
Intel Iris Plus Graphics G4 (Ice Lake 48 EU) 13%
Intel Iris Plus Graphics G7 (Ice Lake 64 EU) 22%
Intel Iris Plus Graphics 650 31%
AMD Radeon RX Vega 6 (Ryzen 2000/3000) 34%
...
» De benchmarkresultaten tonen aan dat de game niet speelbaar is met de geteste instellingen.
...
AMD Radeon R5 (Bristol Ridge) -13%
Intel HD Graphics 630 12%
Intel UHD Graphics G1 (Ice Lake 32 EU) 19%
AMD Radeon RX Vega 6 (Ryzen 2000/3000) 27%
...
Intel UHD Graphics 600 -64%
AMD Radeon R5 (Bristol Ridge) -19%
Intel HD Graphics 630 23%
Intel UHD Graphics G1 (Ice Lake 32 EU) 26%
...
» De benchmarkresultaten tonen aan dat de game niet speelbaar is met de geteste instellingen.
Intel UHD Graphics 605 -73%
...
AMD FirePro W4190M -18%
AMD Radeon R4 (Stoney Ridge) -16%
Intel HD Graphics 630 18%
AMD Radeon R5 (Bristol Ridge) 34%
...
AMD FirePro W4190M -12%
Intel HD Graphics 630 20%
...
» De benchmarkresultaten tonen aan dat de game niet speelbaar is met de geteste instellingen.
Additional Benchmarks
Medium / Off FXAA 1366x768
21.6 [X] MSI GE72 965M Ti Intel Core i7-6700HQ 2.6GHz
HD Graphics 530
min:
15 fps, max:
27 fps
Intel HD Graphics 630 9%
AMD Radeon R9 M280X 77%
AMD Radeon RX Vega 8 (Ryzen 2000/3000) 86%
AMD Radeon R7 M445 90%
...
NVIDIA GeForce GTX 1070 Mobile 642%
» De benchmarkresultaten tonen aan dat de game niet speelbaar is met de geteste instellingen.
AMD Radeon R7 M360 -12%
Intel Iris Plus Graphics 650 24%
Intel HD Graphics 630 35%
AMD Radeon RX Vega 10 75%
AMD Radeon R7 M445 93%
...
NVIDIA GeForce GTX 1070 Mobile 678%
» De benchmarkresultaten tonen aan dat de game niet speelbaar is met de geteste instellingen.
...
AMD Radeon R7 M360 -20%
AMD Radeon RX Vega 10 -13%
AMD Radeon R7 M460 6%
AMD Radeon RX Vega 6 (Ryzen 2000/3000) 11%
AMD Radeon RX Vega 8 (Ryzen 2000/3000) 14%
Intel HD Graphics 630 18%
...
NVIDIA Quadro P2000 289%
...
AMD Radeon RX Vega 6 (Ryzen 2000/3000) -11%
AMD Radeon R7 M360 3%
AMD Radeon R7 M460 10%
Intel HD Graphics 630 14%
...
NVIDIA Quadro P2000 405%
...
AMD Radeon RX Vega 6 (Ryzen 2000/3000) -11%
AMD Radeon R7 M360 10%
...
NVIDIA GeForce GTX 1070 Mobile 984%
...
AMD Radeon R7 M360 -20%
AMD Radeon R7 M460 -17%
AMD Radeon R7 M445 -17%
Intel HD Graphics 630 7%
AMD Radeon RX Vega 8 (Ryzen 2000/3000) 29%
Intel Iris Plus Graphics 650 64%
...
NVIDIA GeForce GTX 1080 Max-Q 1512%
NVIDIA Quadro M520 136%
AMD Radeon Pro 555 290%
AMD Radeon Pro 455 293%
AMD Radeon Pro 560X 364%
...
NVIDIA GeForce GTX 1070 Mobile 2348%
» Met alle geteste laptops speelbaar met gem. instellingen.
Additional Benchmarks
Medium Preset 1920x1080
35.3 [X] MSI GE72 965M Ti Intel Core i7-6700HQ 2.6GHz
HD Graphics 530
min:
32 fps, max:
45 fps
AMD Radeon R4 (Stoney Ridge) -72%
...
AMD Radeon R7 M460 1%
Intel HD Graphics 630 14%
AMD Radeon R9 M280X 27%
...
NVIDIA Quadro P3200 481%
Intel HD Graphics 610 -51%
...
Intel HD Graphics 630 7%
AMD Radeon R7 M460 13%
...