MSI Raider GE68 HX 13VF laptop review: Een compleet nieuw ontwerp

De GE68HX volgt direct de GE67HX van vorig jaar op met zowel opgefriste internals als een nieuw chassisontwerp. Naast de verwachte 13e generatie Raptor Lake-HX CPU's en Nvidia Ada Lovelace GPU's ter vervanging van de oudere 12e generatie Alder Lake-HX en Ampere opties, biedt het nieuwere model ook een groter 16:10 16-inch schermformaat in plaats van de afnemende 16:9 15,6-inch beeldverhouding.
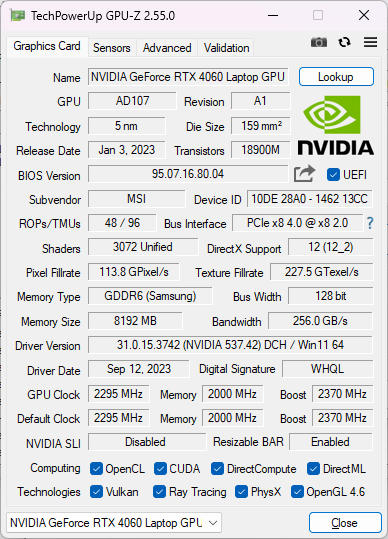
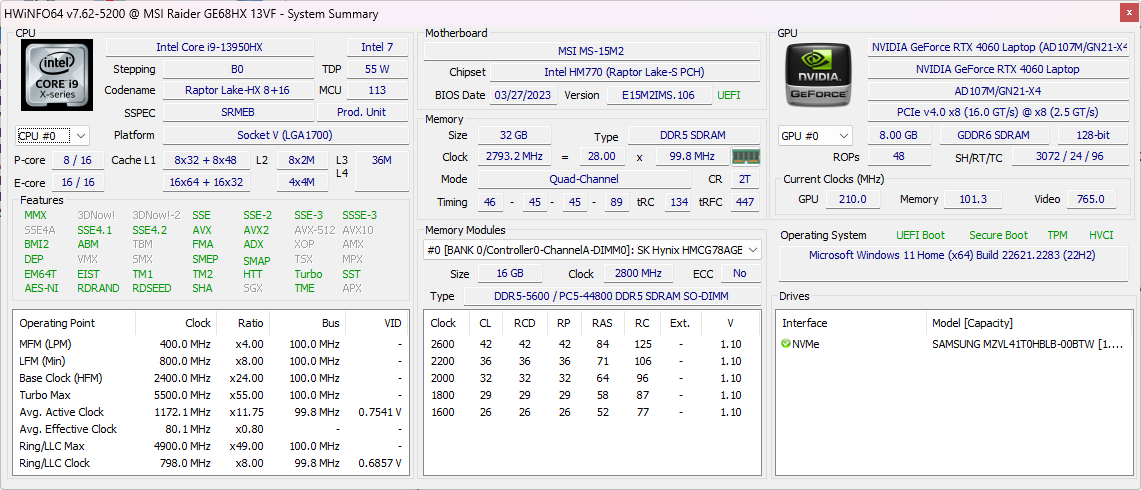
Ons apparaat is de basisconfiguratie met de Core i7-13950HX, 140 W GeForce RTX 4060 en 1080p 144 Hz IPS-scherm en wordt verkocht voor ongeveer $1700 USD of $1300 indien in de uitverkoop. Tot de duurdere SKU's behoren de Core i9-13980HX, RTX 4090 en een 1440p 240 Hz beeldscherm voor meer dan $3500.
Concurrenten voor de GE68HX zijn andere high-end 16-inch gaming laptops zoals de HP Omen 16,Alienware m16 R1, Lenovo Legion Slim 7i 16 Gen 8of de Asus ROG Zephyrus M16.
Meer MSI beoordelingen:
Potentiële concurrenten in vergelijking
Evaluatie | Datum | Model | Gewicht | Hoogte | Formaat | Resolutie | Beste prijs |
|---|---|---|---|---|---|---|---|
| 86.9 % v7 (old) | 10-2023 | MSI Raider GE68HX 13VF i9-13950HX, GeForce RTX 4060 Laptop GPU | 2.7 kg | 27.9 mm | 16.00" | 1900x1200 | |
| 87.7 % v7 (old) | 07-2022 | MSI GE67 HX 12UGS i7-12800HX, GeForce RTX 3070 Ti Laptop GPU | 2.5 kg | 23.4 mm | 15.60" | 1920x1080 | |
| 86.6 % v7 (old) | 09-2023 | HP Omen 16-xf0376ng R7 7840HS, GeForce RTX 4070 Laptop GPU | 2.4 kg | 23.5 mm | 16.10" | 1920x1080 | |
| 89.2 % v7 (old) | 08-2023 | Alienware m16 R1 AMD R9 7845HX, GeForce RTX 4080 Laptop GPU | 3.1 kg | 25.4 mm | 16.00" | 2560x1600 | |
| 90 % v7 (old) | 07-2023 | Lenovo Legion Slim 7i 16 Gen 8 i9-13900H, GeForce RTX 4070 Laptop GPU | 2.1 kg | 19.9 mm | 16.00" | 2560x1600 | |
| 89.4 % v7 (old) | 03-2023 | Asus ROG Zephyrus M16 GU604VY-NM042X i9-13900H, GeForce RTX 4090 Laptop GPU | 2.3 kg | 22.9 mm | 16.00" | 2560x1600 |
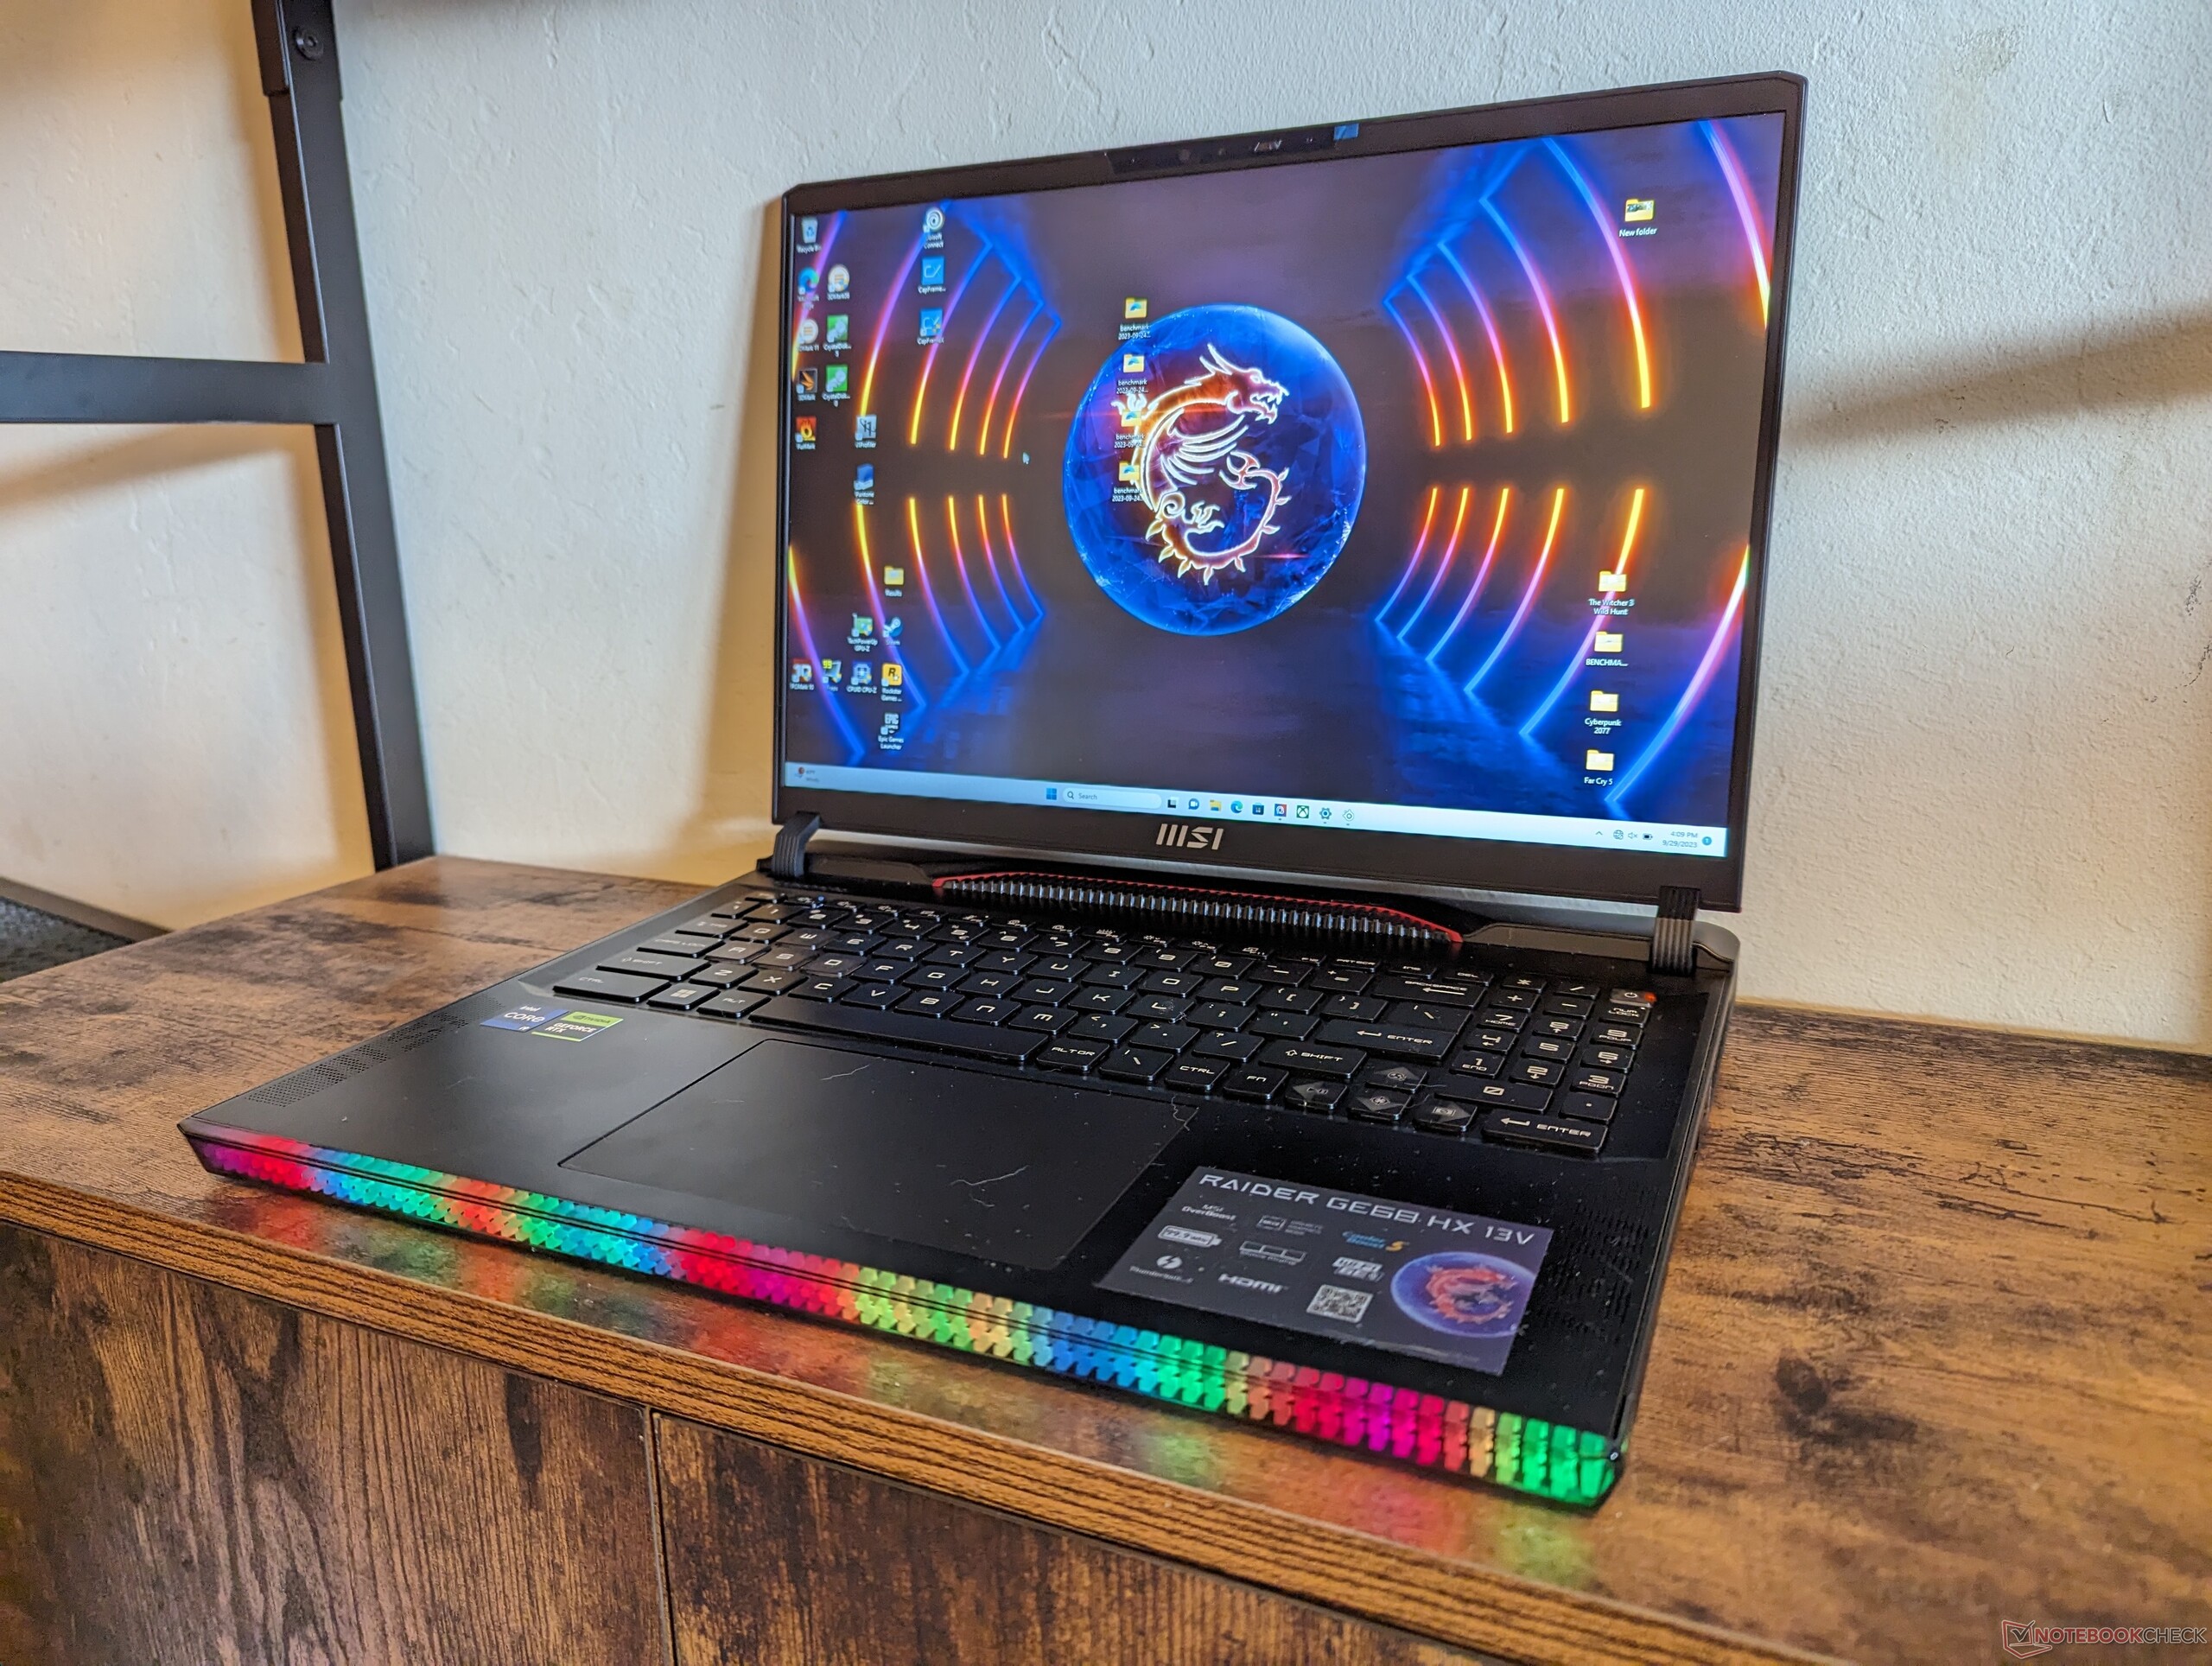
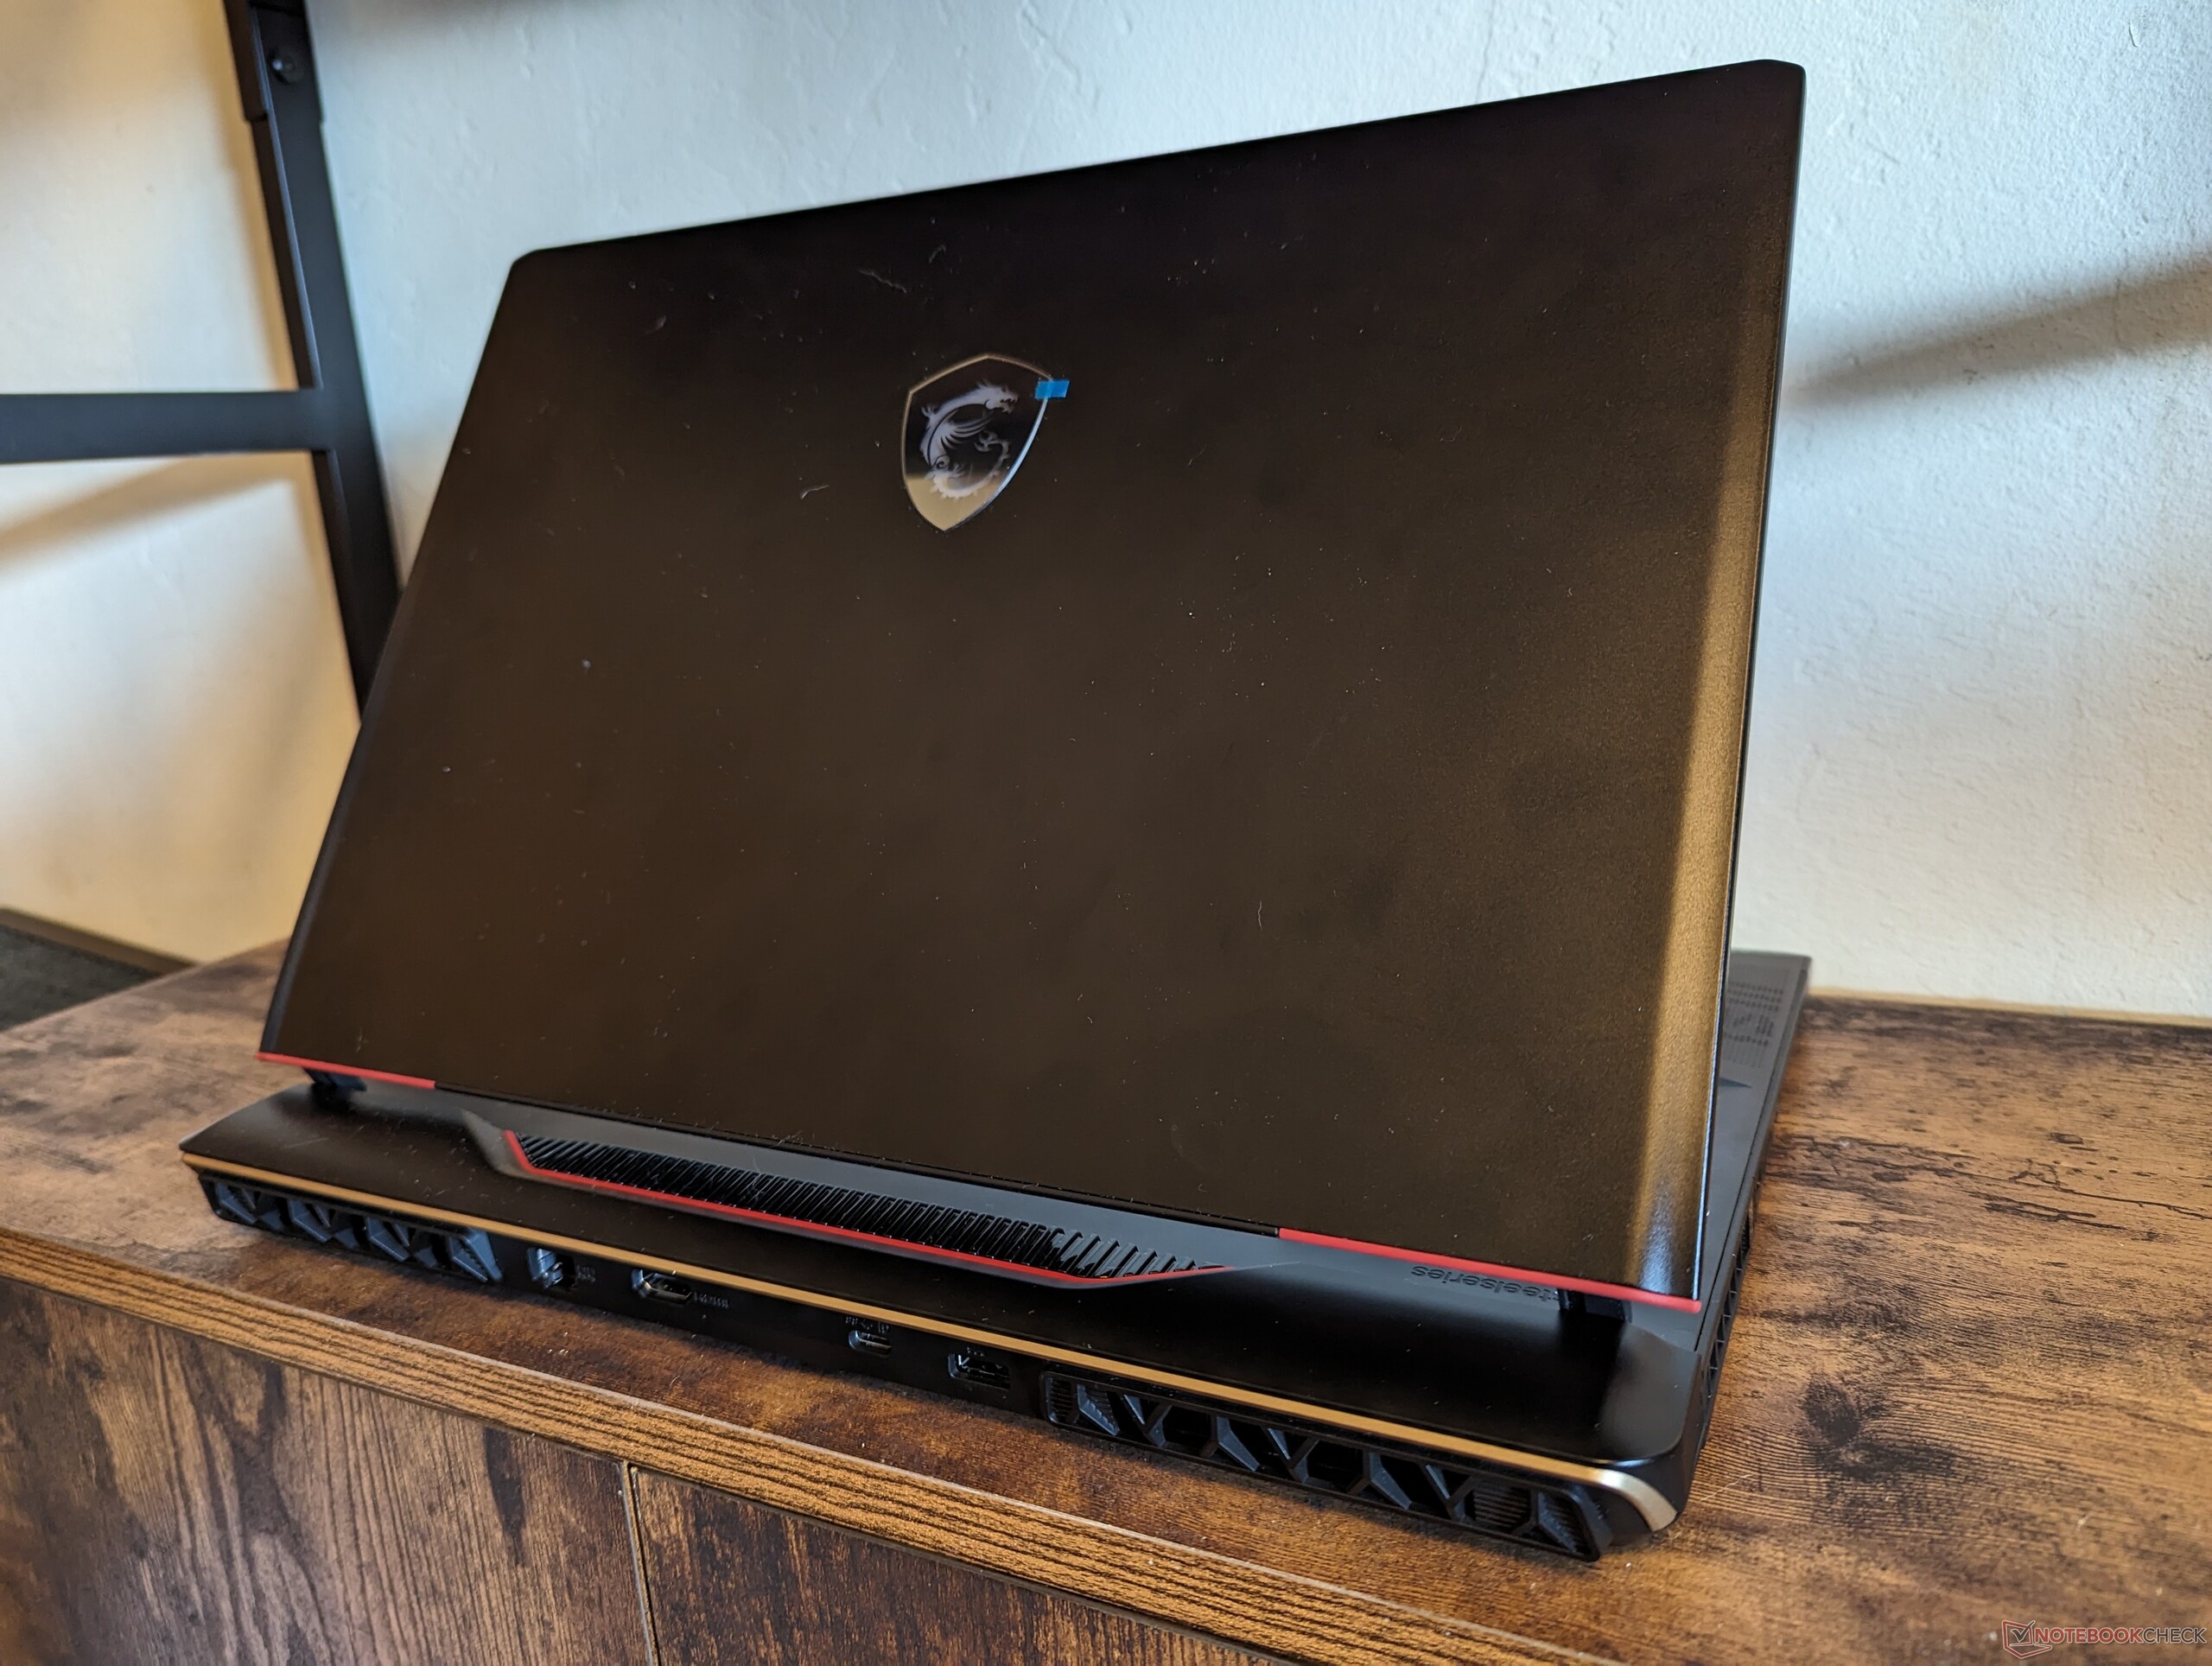
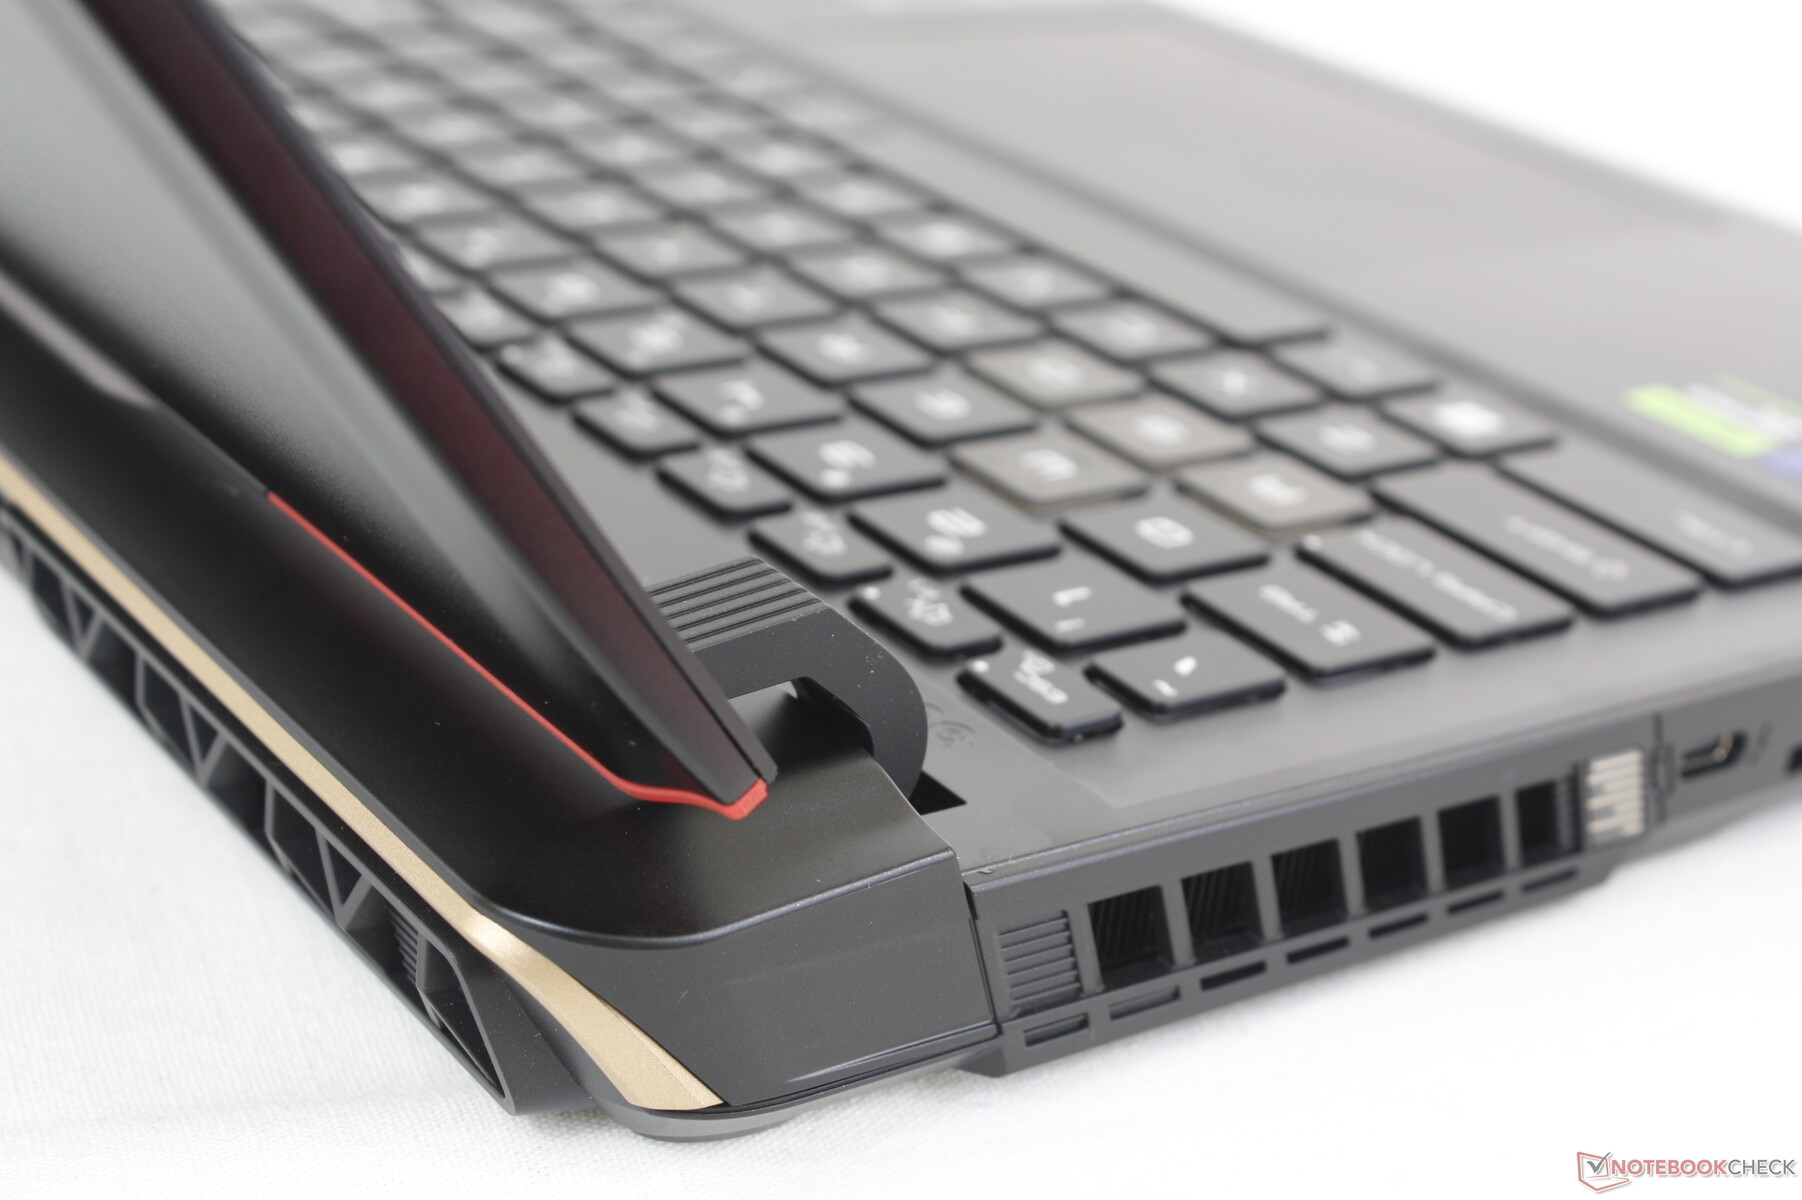
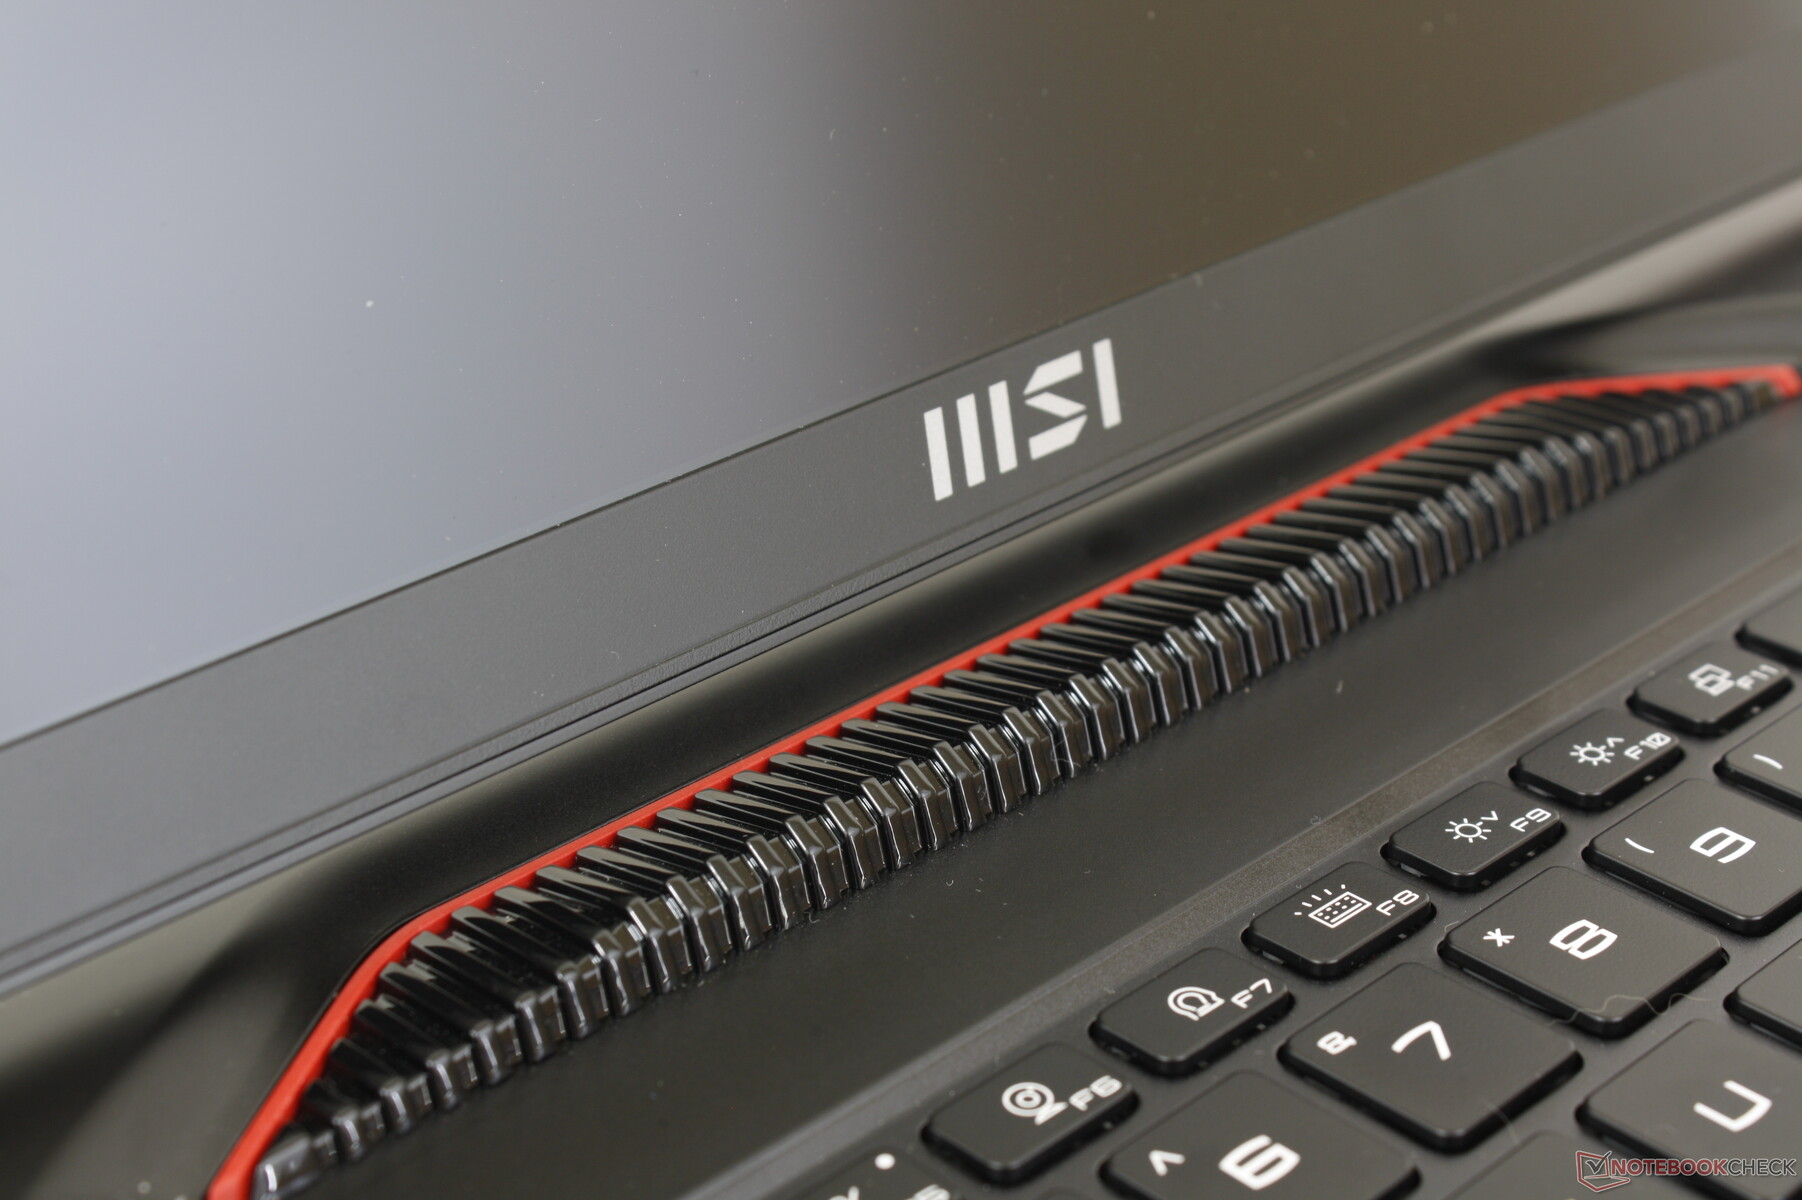
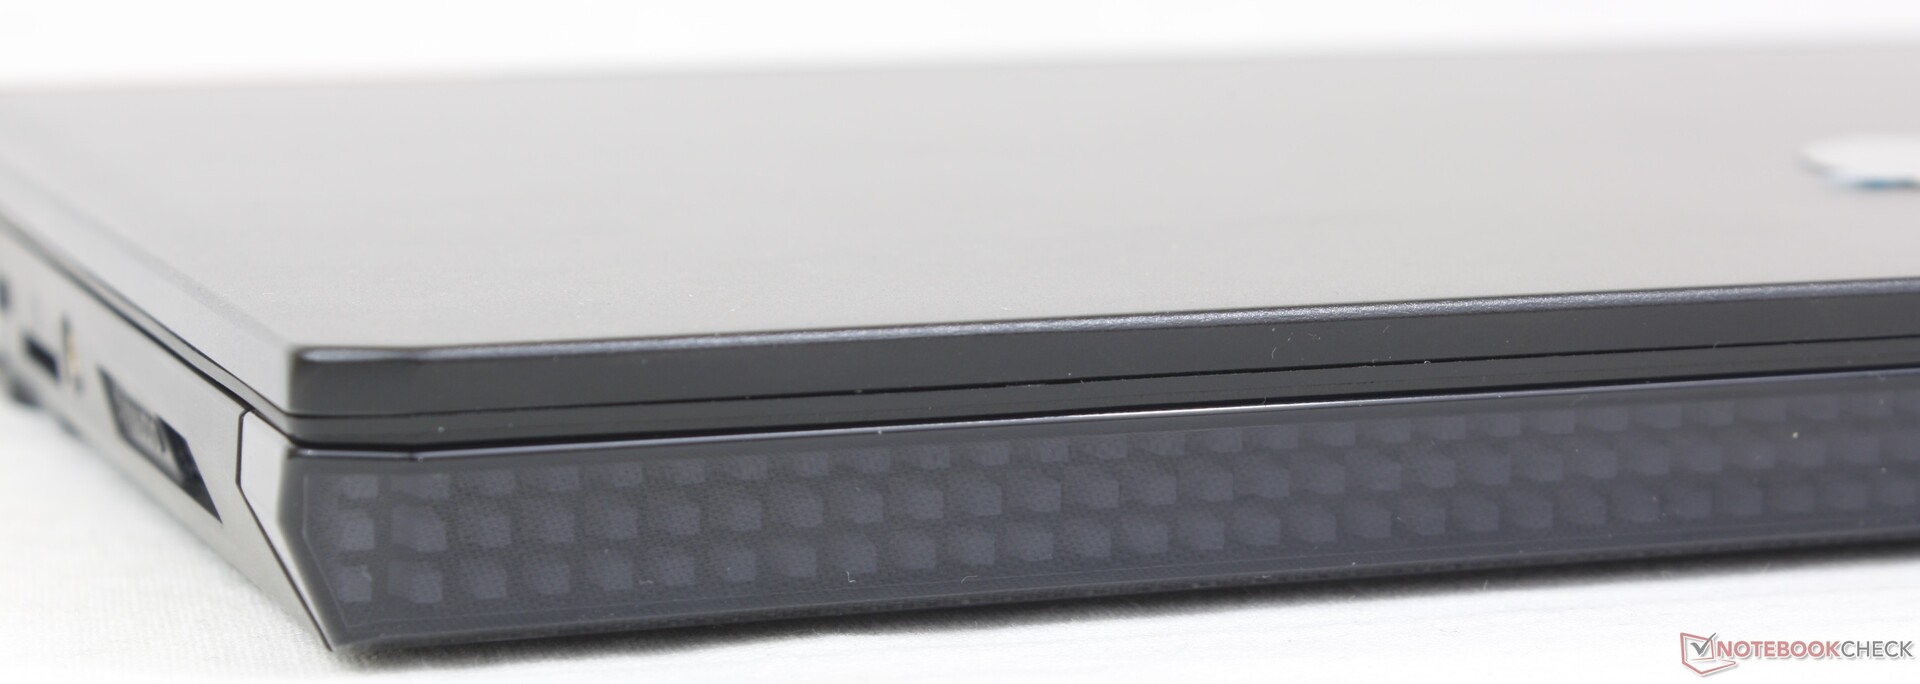
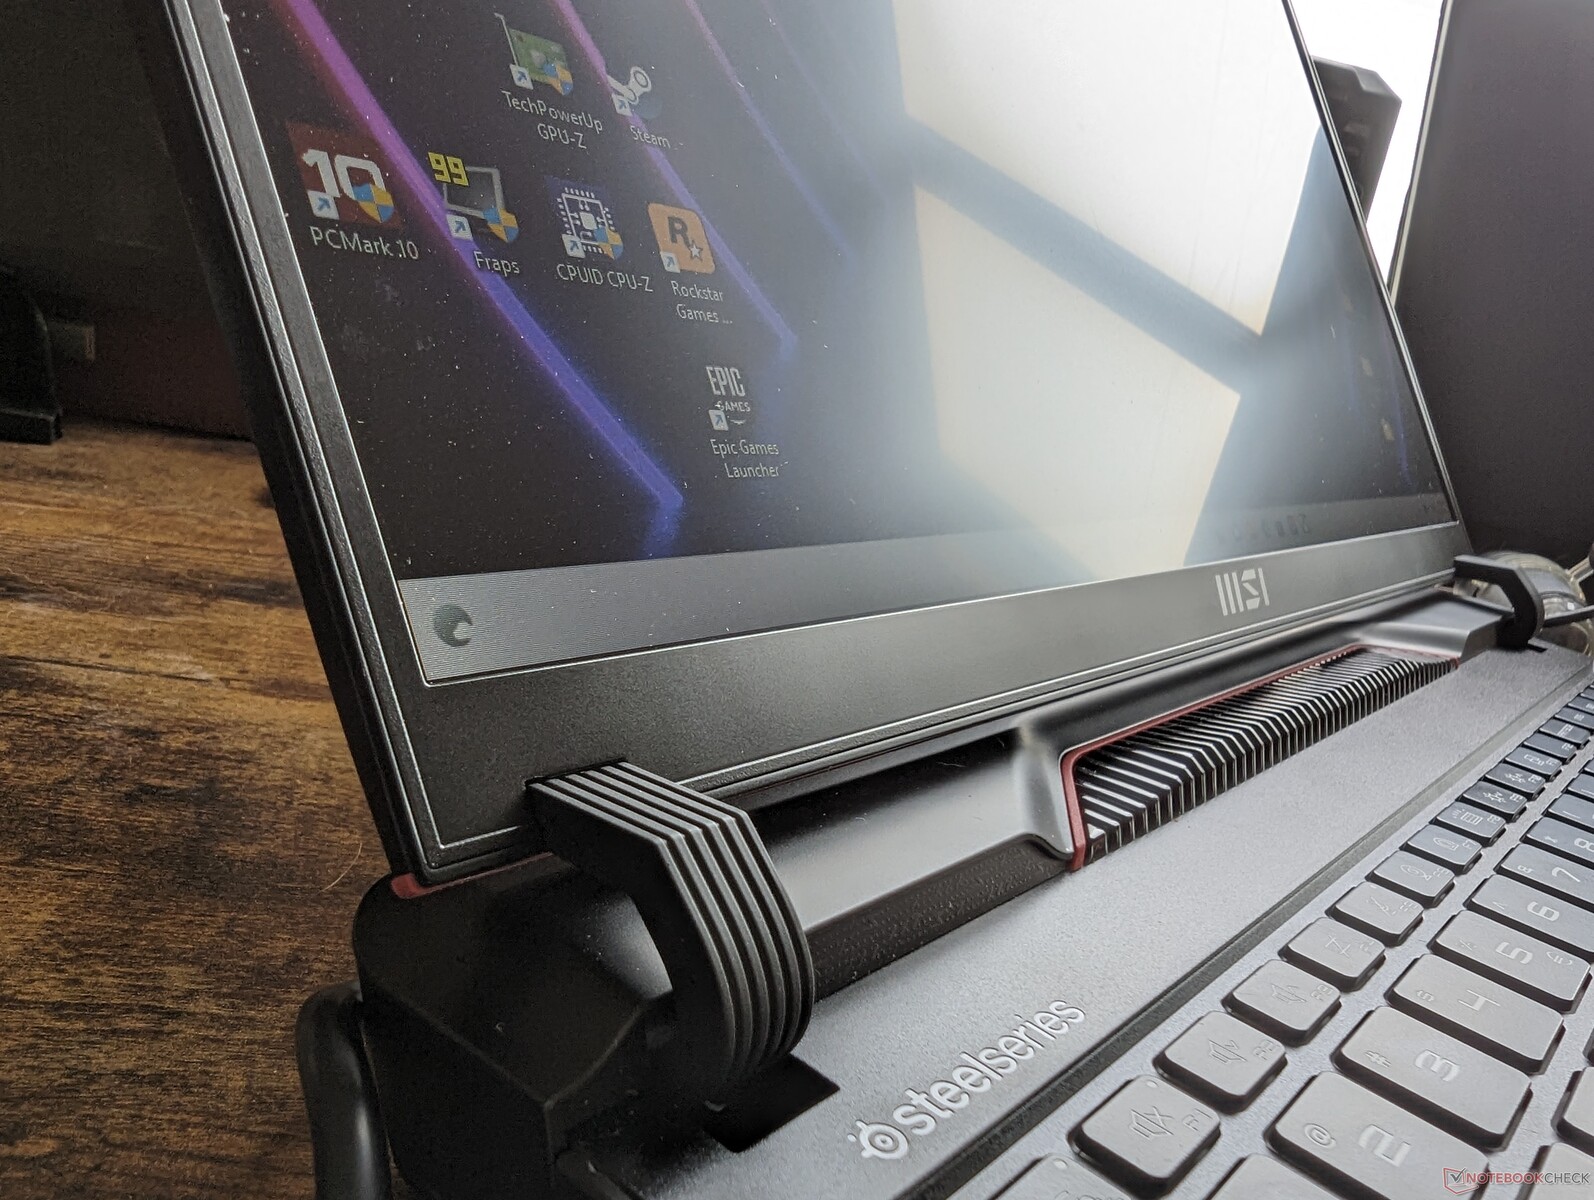
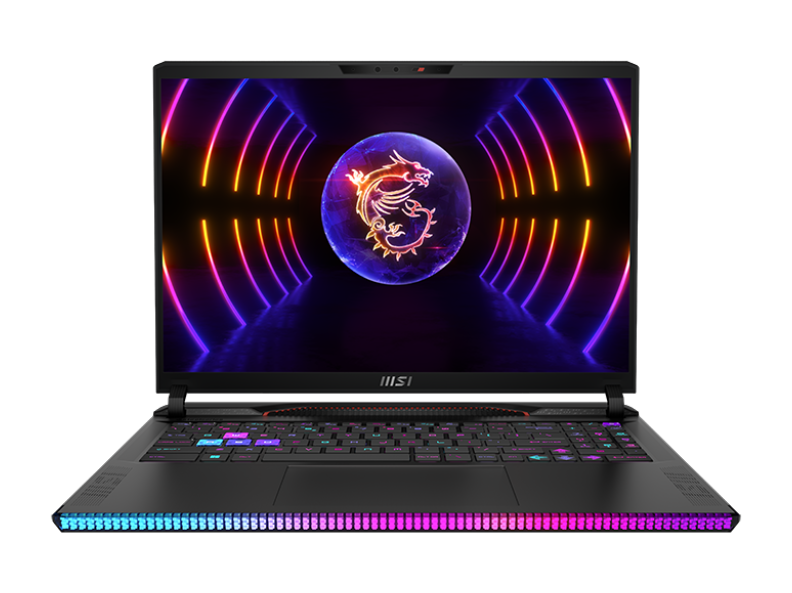
Zaak - Groter dan voorheen
Het chassis kan het best worden omschreven als een kleinere versie van de 17-inch Raider GE78HX. De LED pixelbalk aan de voorkant vervangt de continue verlichting op het model van vorig jaar, terwijl de achterkant nu meer gestileerd is met goud, rood en glanzende randen. Een van MSI's doelen dit jaar was om meer visueel interessante laptop ontwerpen te maken in plaats van de steeds vaker voorkomende gitzwarte en minimalistische esthetiek. De fabrikant is hierin geslaagd, want het ontwerp van de GE68HX is zeker onmiskenbaar en heel anders dan andere gaming laptops van concurrenten.
De stevigheid van het chassis is uitstekend, ondanks alle rondingen en stukken waaruit het niet-unibody skelet bestaat. Druk uitoefenen op het midden van het toetsenbord of proberen de hoeken te verdraaien resulteerde in zeer weinig buiging en geen hoorbaar kraken. We waarderen vooral de grotere en stevigere scharnieren in vergelijking met de GE67HX van vorig jaar voor een beter gevoel van lange levensduur.
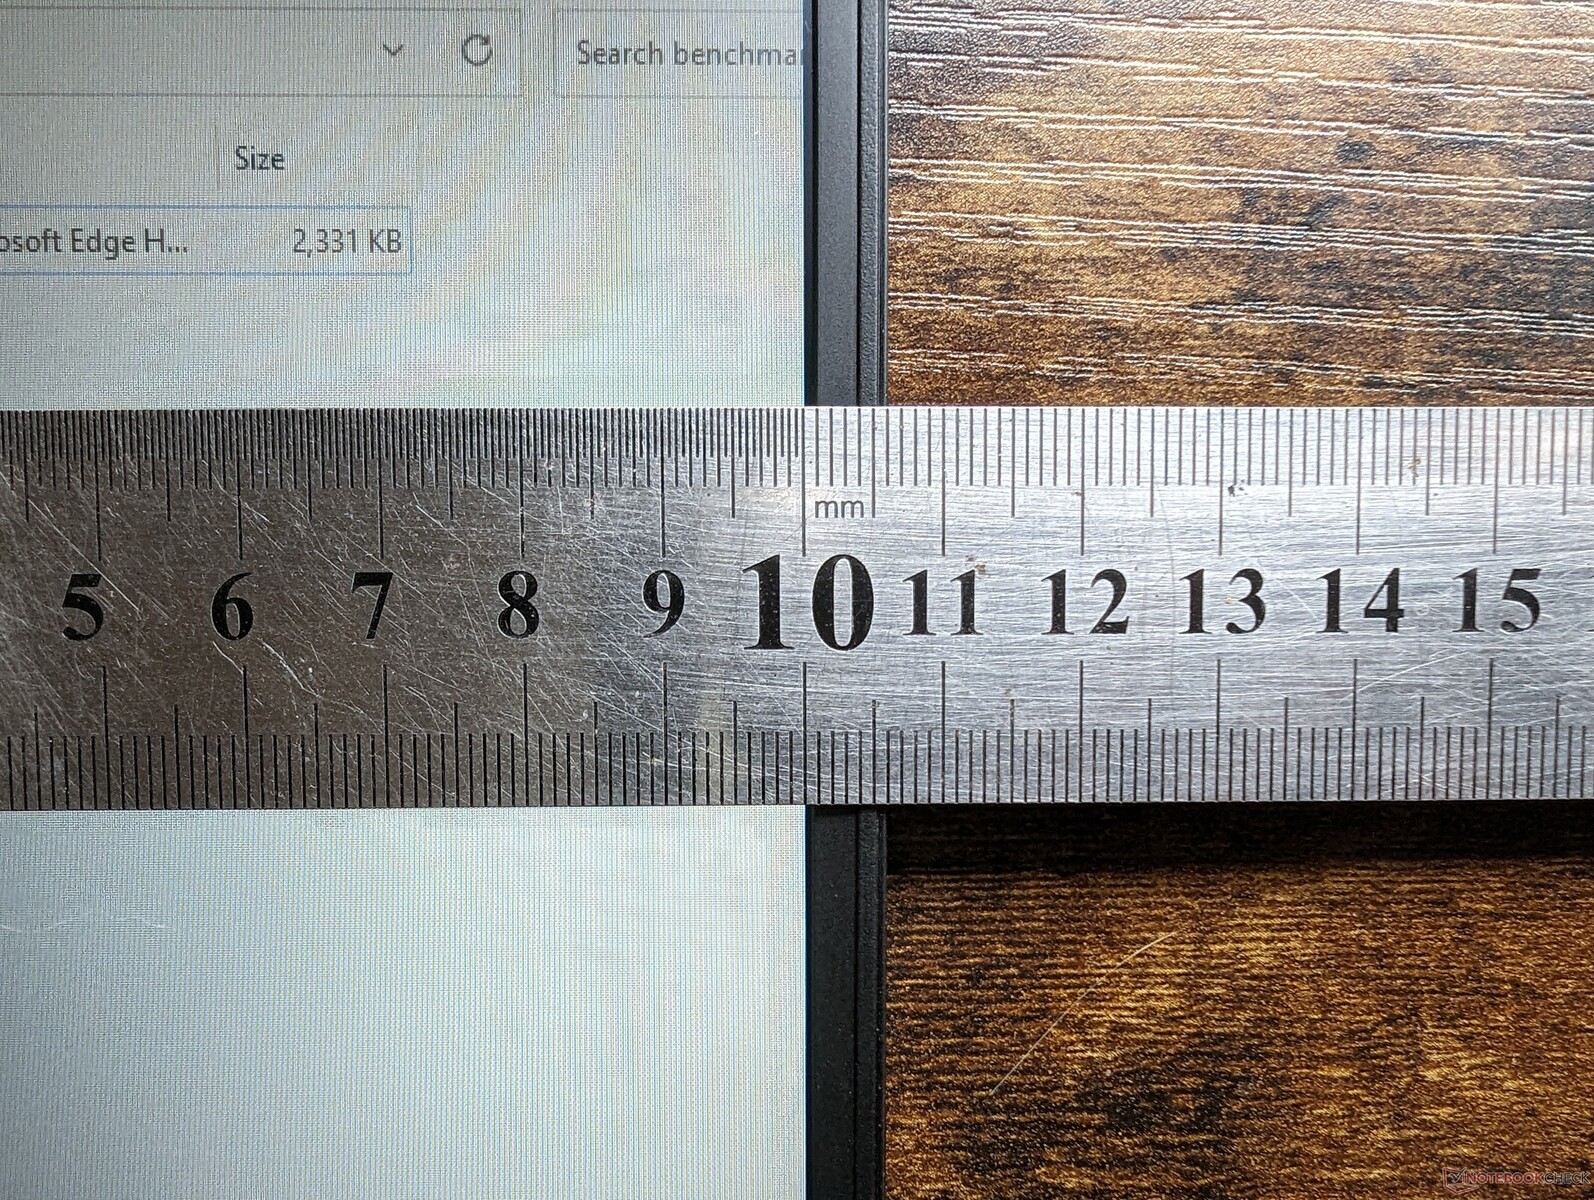
Het nieuwe model is zowel groter als zwaarder dan de uitgaande GE67HX met aanzienlijke marges, zoals blijkt uit onze grootte vergelijkingstabel hieronder. In feite is de GE68HX een van de grotere en zwaardere 16-inch gaming laptops beschikbaar.
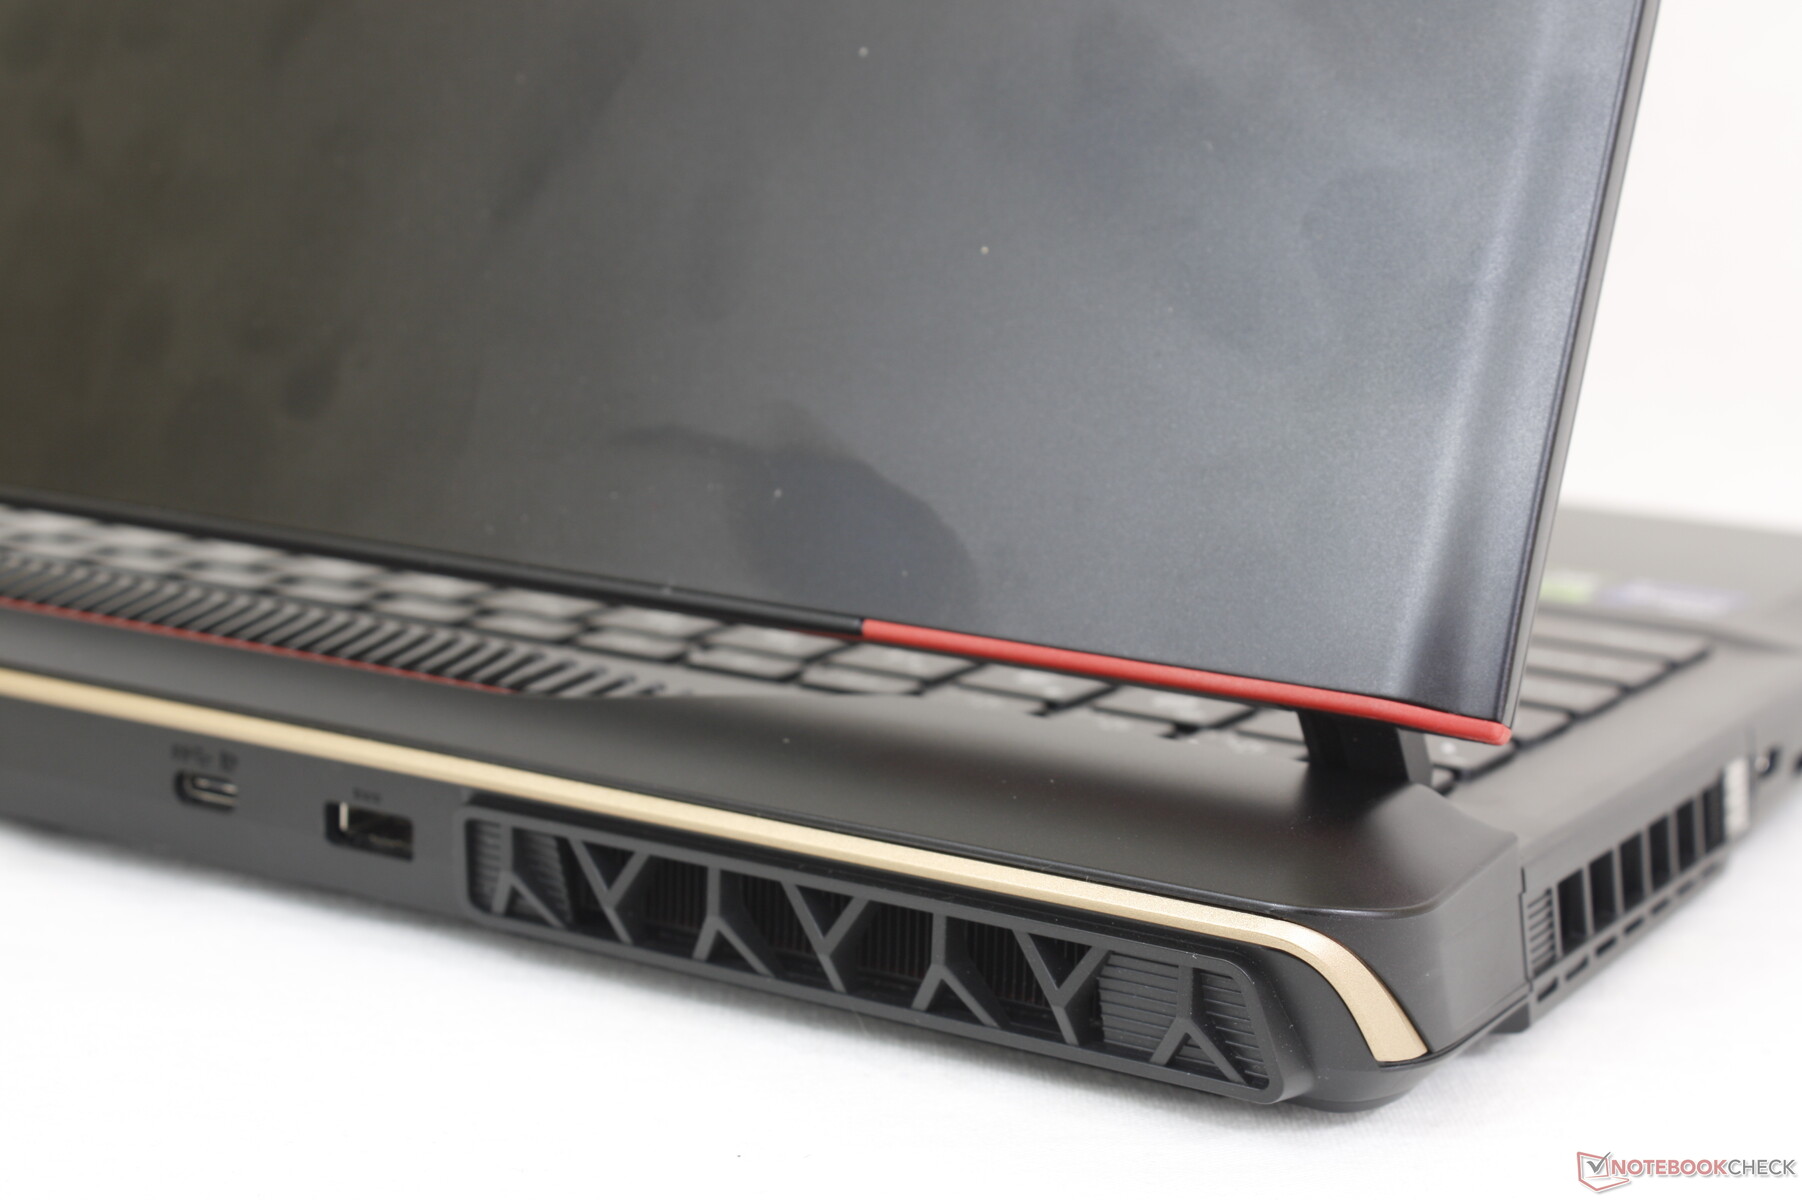
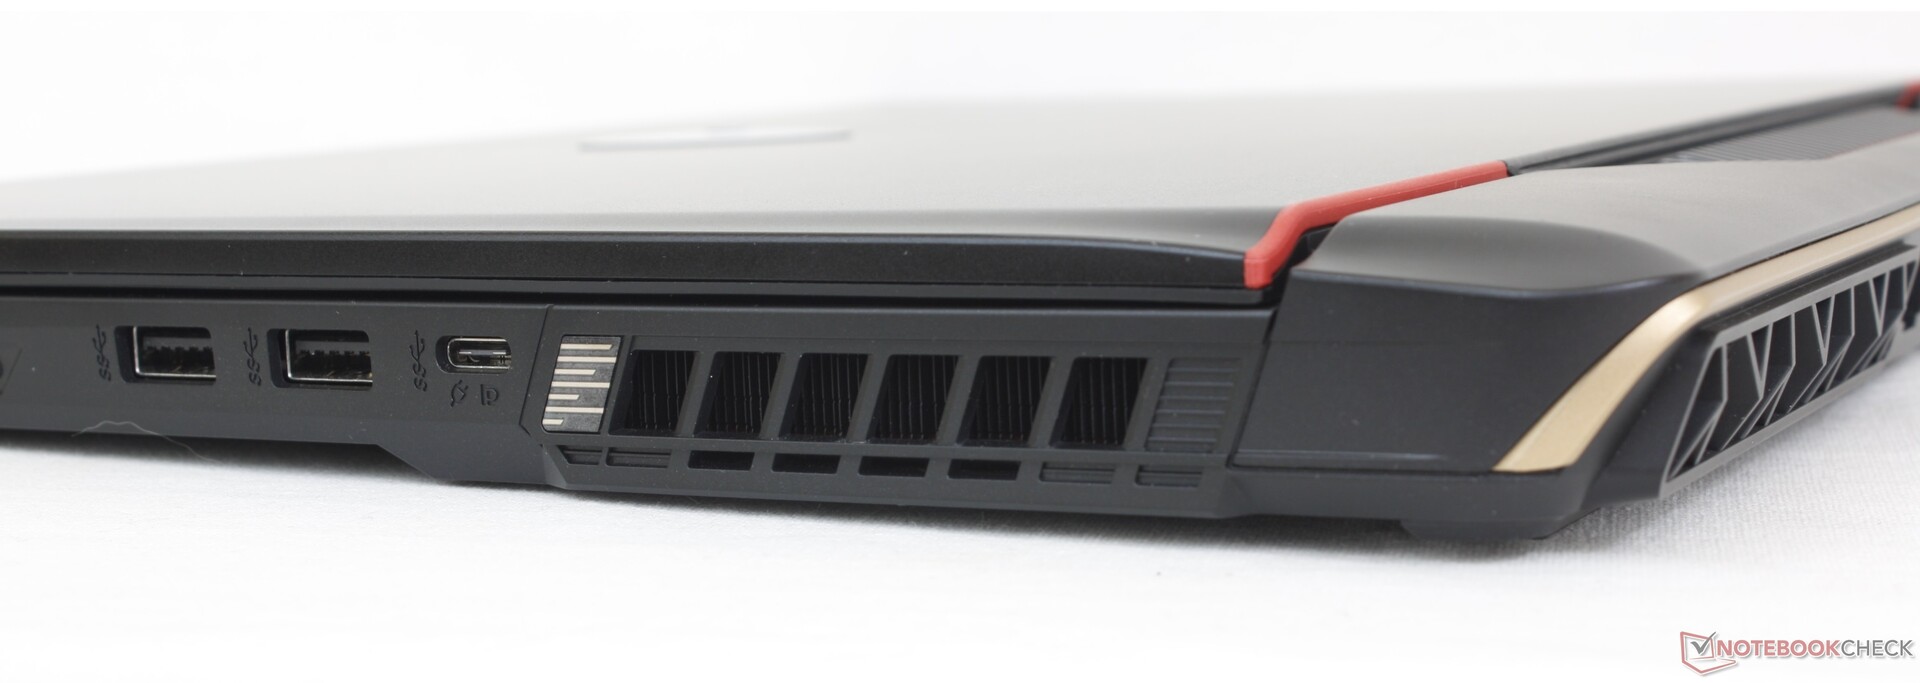
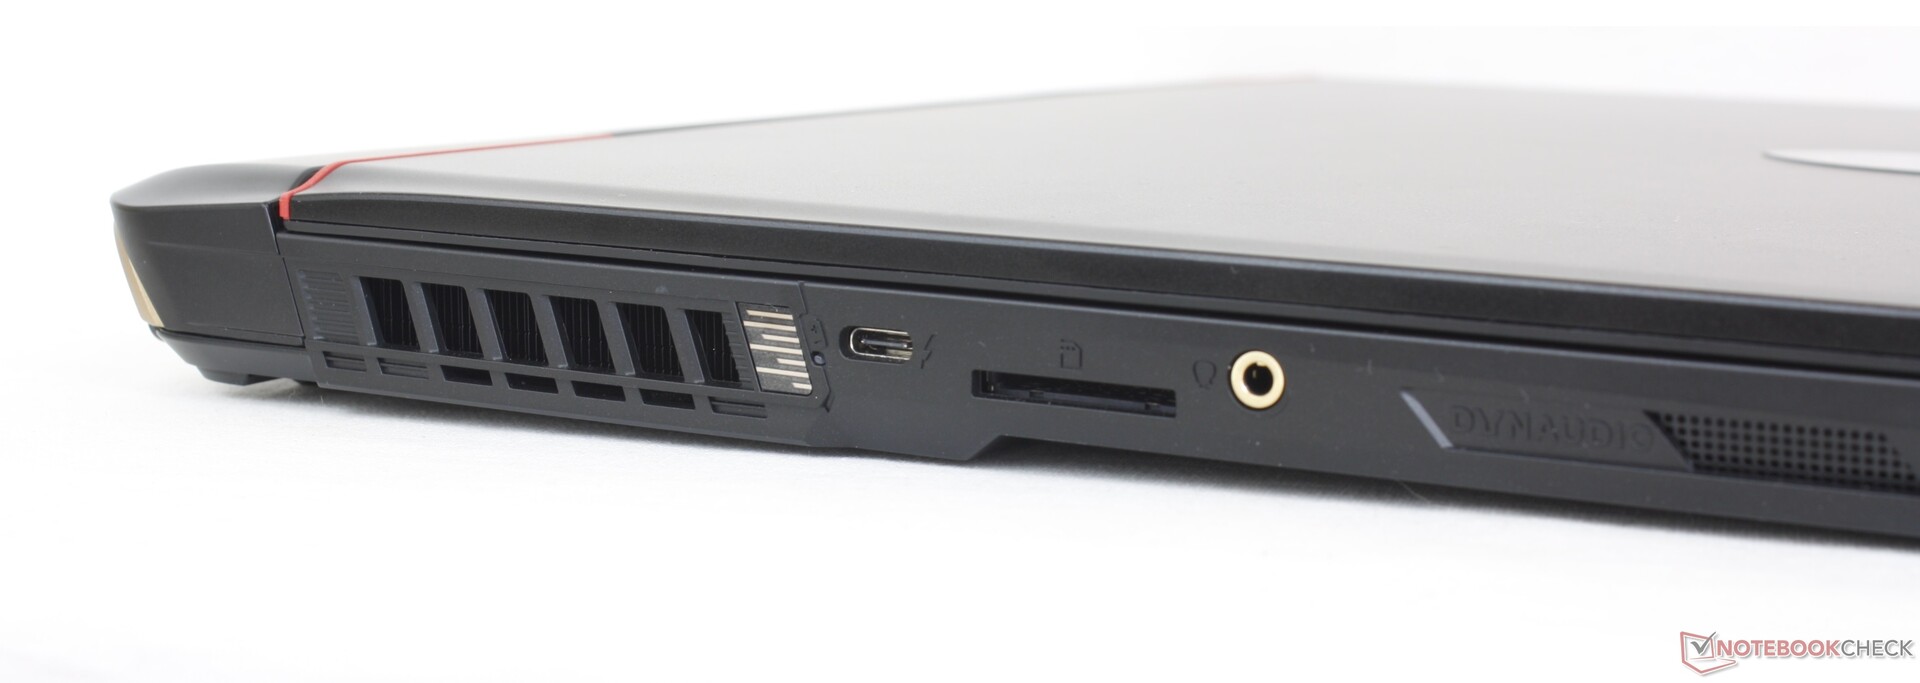
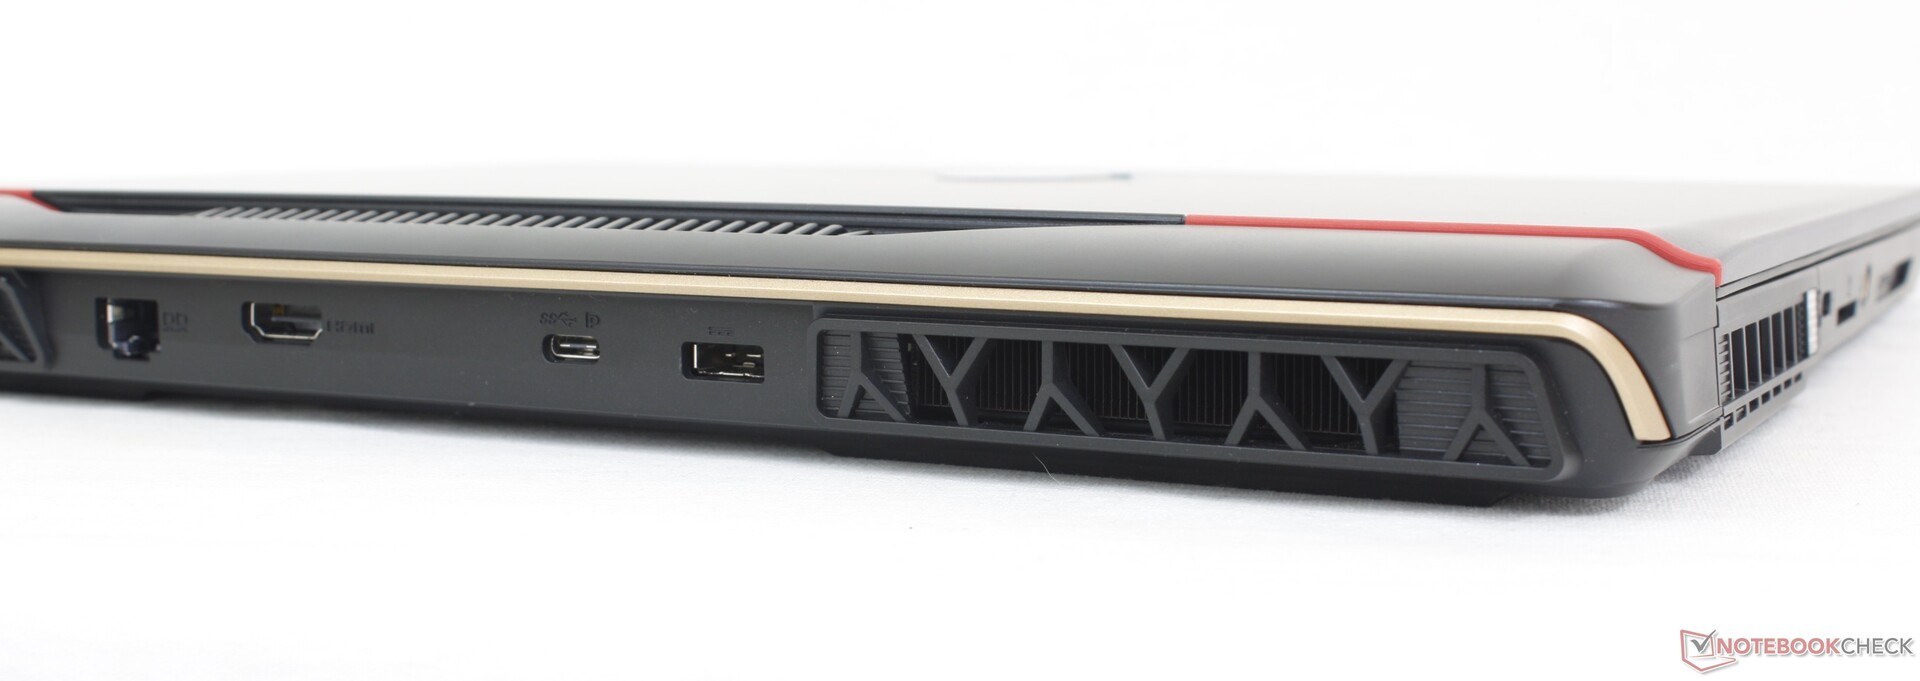
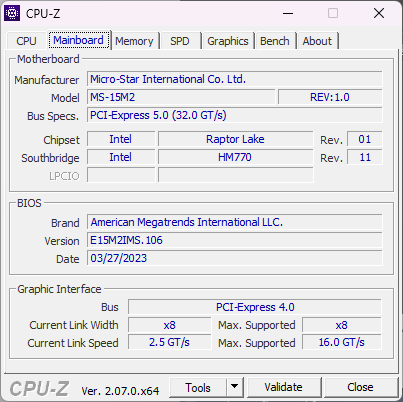
Connectiviteit
De poortopties zijn licht gewijzigd ten opzichte van vorig jaar GE67HX. Waar de GE67HX 3x USB-A poorten en 2x USB-C poorten zou hebben, wordt de GE68HX geleverd met 2x USB-A poorten en 3x USB-C poorten. Alle drie de USB-C poorten ondersteunen Displayport, maar alleen de poort aan de linkerkant is compatibel met Thunderbolt 4.
Vreemd genoeg heeft MSI ervoor gekozen om het Kensington-slot te laten vallen op het ontwerp van dit jaar. Er is ook geen mini-DisplayPort, in tegenstelling tot deAlienware m16 R1.
SD-kaartlezer
De geïntegreerde SD-kaartlezer is een beetje traag voor wat wordt verondersteld een gamingmodel uit het hogere middensegment te zijn. Het overzetten van 1 GB aan foto's van onze UHS-II testkaart naar de desktop duurde iets meer dan 12 seconden, terwijl dezelfde test op de Alienware m16 R1 meer dan 2x sneller zou zijn.
| SD Card Reader | |
| average JPG Copy Test (av. of 3 runs) | |
| Alienware m16 R1 AMD (Toshiba Exceria Pro SDXC 64 GB UHS-II) | |
| Asus ROG Zephyrus M16 GU604VY-NM042X | |
| Lenovo Legion Slim 7i 16 Gen 8 (Toshiba Exceria Pro SDXC 64 GB UHS-II) | |
| MSI GE67 HX 12UGS (Toshiba Exceria Pro SDXC 64 GB UHS-II) | |
| MSI Raider GE68HX 13VF (Toshiba Exceria Pro SDXC 64 GB UHS-II) | |
| maximum AS SSD Seq Read Test (1GB) | |
| Alienware m16 R1 AMD (Toshiba Exceria Pro SDXC 64 GB UHS-II) | |
| Asus ROG Zephyrus M16 GU604VY-NM042X | |
| Lenovo Legion Slim 7i 16 Gen 8 (Toshiba Exceria Pro SDXC 64 GB UHS-II) | |
| MSI Raider GE68HX 13VF (Toshiba Exceria Pro SDXC 64 GB UHS-II) | |
| MSI GE67 HX 12UGS (Toshiba Exceria Pro SDXC 64 GB UHS-II) | |
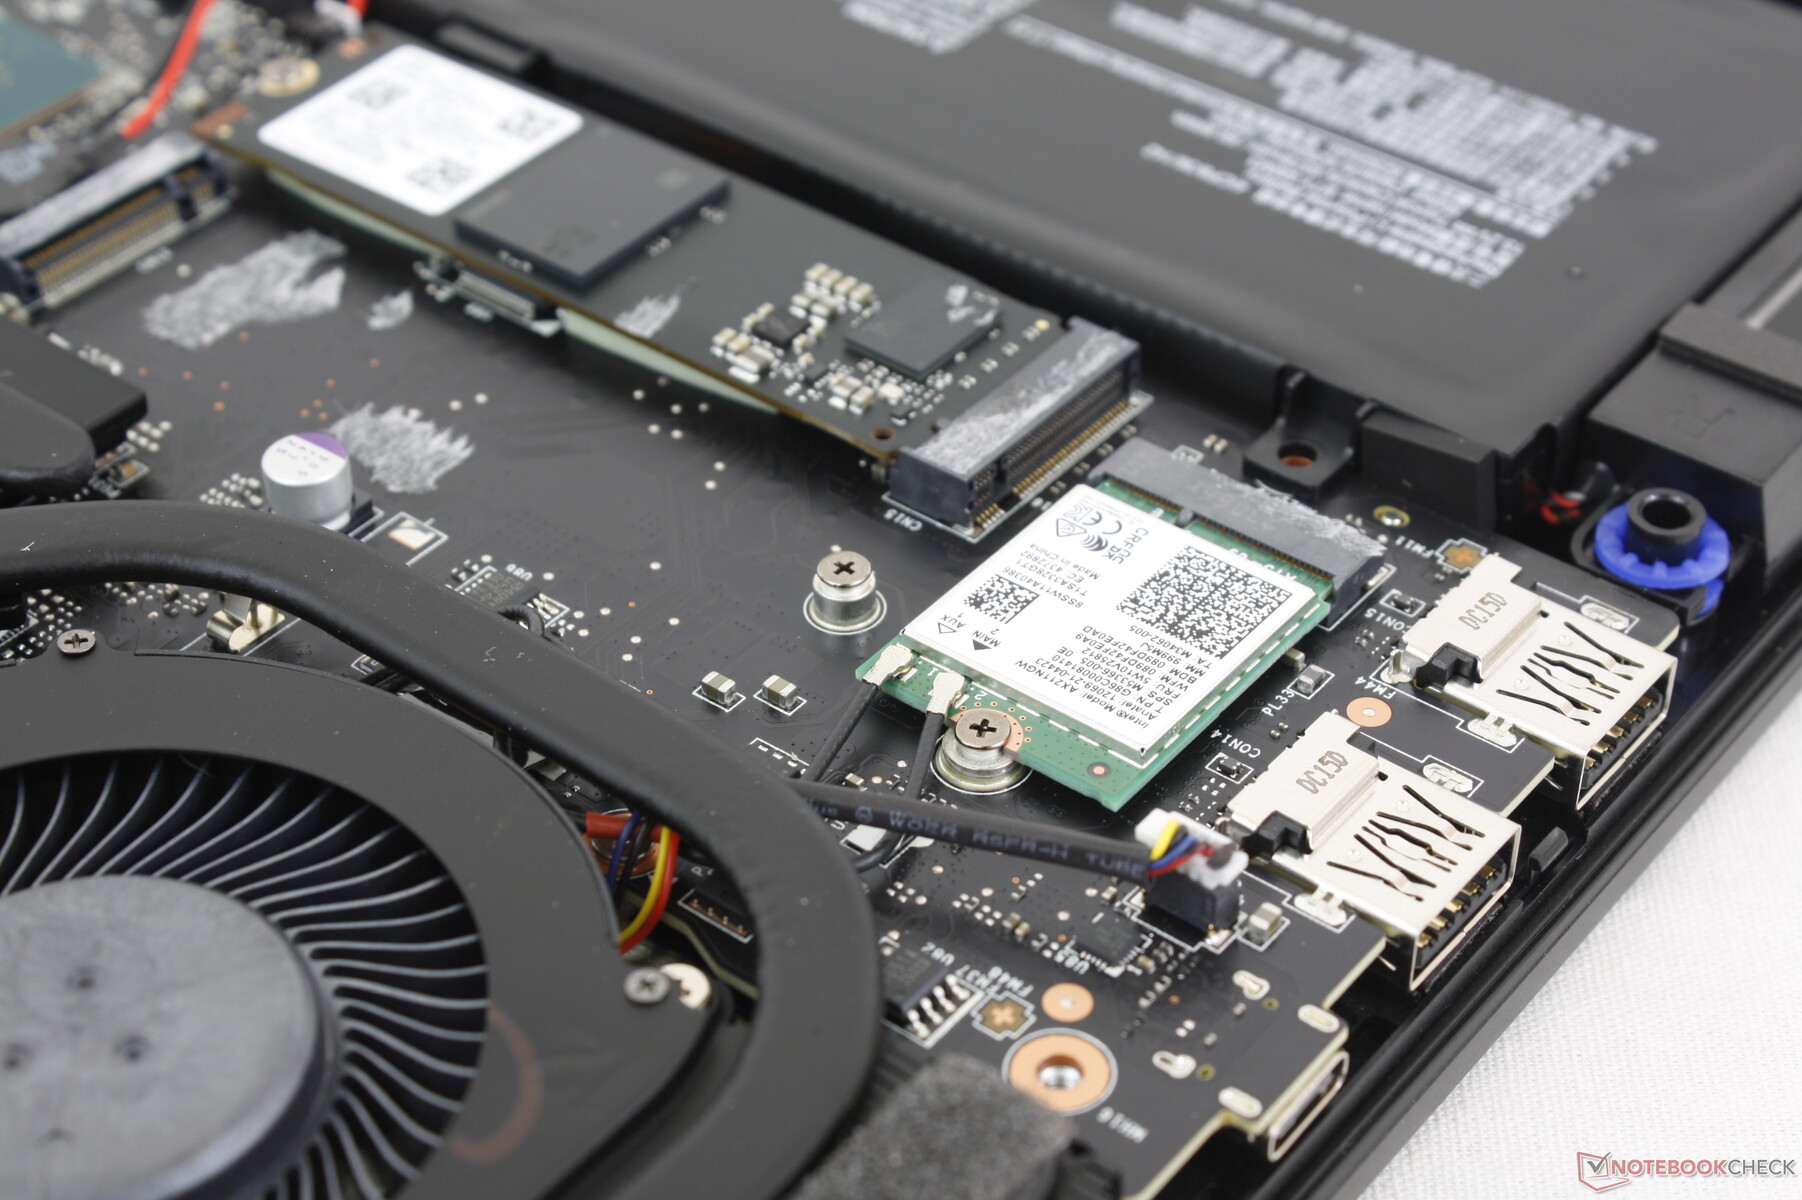
Communicatie
Een Intel AX211 wordt standaard geleverd voor Wi-Fi 6E en Bluetooth 5.3 ondersteuning. We hebben geen connectiviteitsproblemen ondervonden bij het koppelen aan ons AXE11000 6 GHz testnetwerk.
| Networking | |
| iperf3 transmit AXE11000 | |
| Alienware m16 R1 AMD | |
| MSI Raider GE68HX 13VF | |
| HP Omen 16-xf0376ng | |
| Lenovo Legion Slim 7i 16 Gen 8 | |
| iperf3 receive AXE11000 | |
| HP Omen 16-xf0376ng | |
| Alienware m16 R1 AMD | |
| Lenovo Legion Slim 7i 16 Gen 8 | |
| MSI Raider GE68HX 13VF | |
| iperf3 transmit AXE11000 6GHz | |
| Alienware m16 R1 AMD | |
| Asus ROG Zephyrus M16 GU604VY-NM042X | |
| Lenovo Legion Slim 7i 16 Gen 8 | |
| MSI Raider GE68HX 13VF | |
| MSI GE67 HX 12UGS | |
| iperf3 receive AXE11000 6GHz | |
| Asus ROG Zephyrus M16 GU604VY-NM042X | |
| Alienware m16 R1 AMD | |
| Lenovo Legion Slim 7i 16 Gen 8 | |
| MSI Raider GE68HX 13VF | |
| MSI GE67 HX 12UGS | |
Webcam
Hoewel de 2 MP kwaliteit niet is veranderd, zijn er toch een paar verschillen rondom de webcam. De sluiter is nu bijvoorbeeld een fysieke schuifknop naast de lens in plaats van een elektronische schakelaar op het toetsenbord. En ten tweede is er nu een IR-sensor ingebouwd voor ondersteuning van Hello.


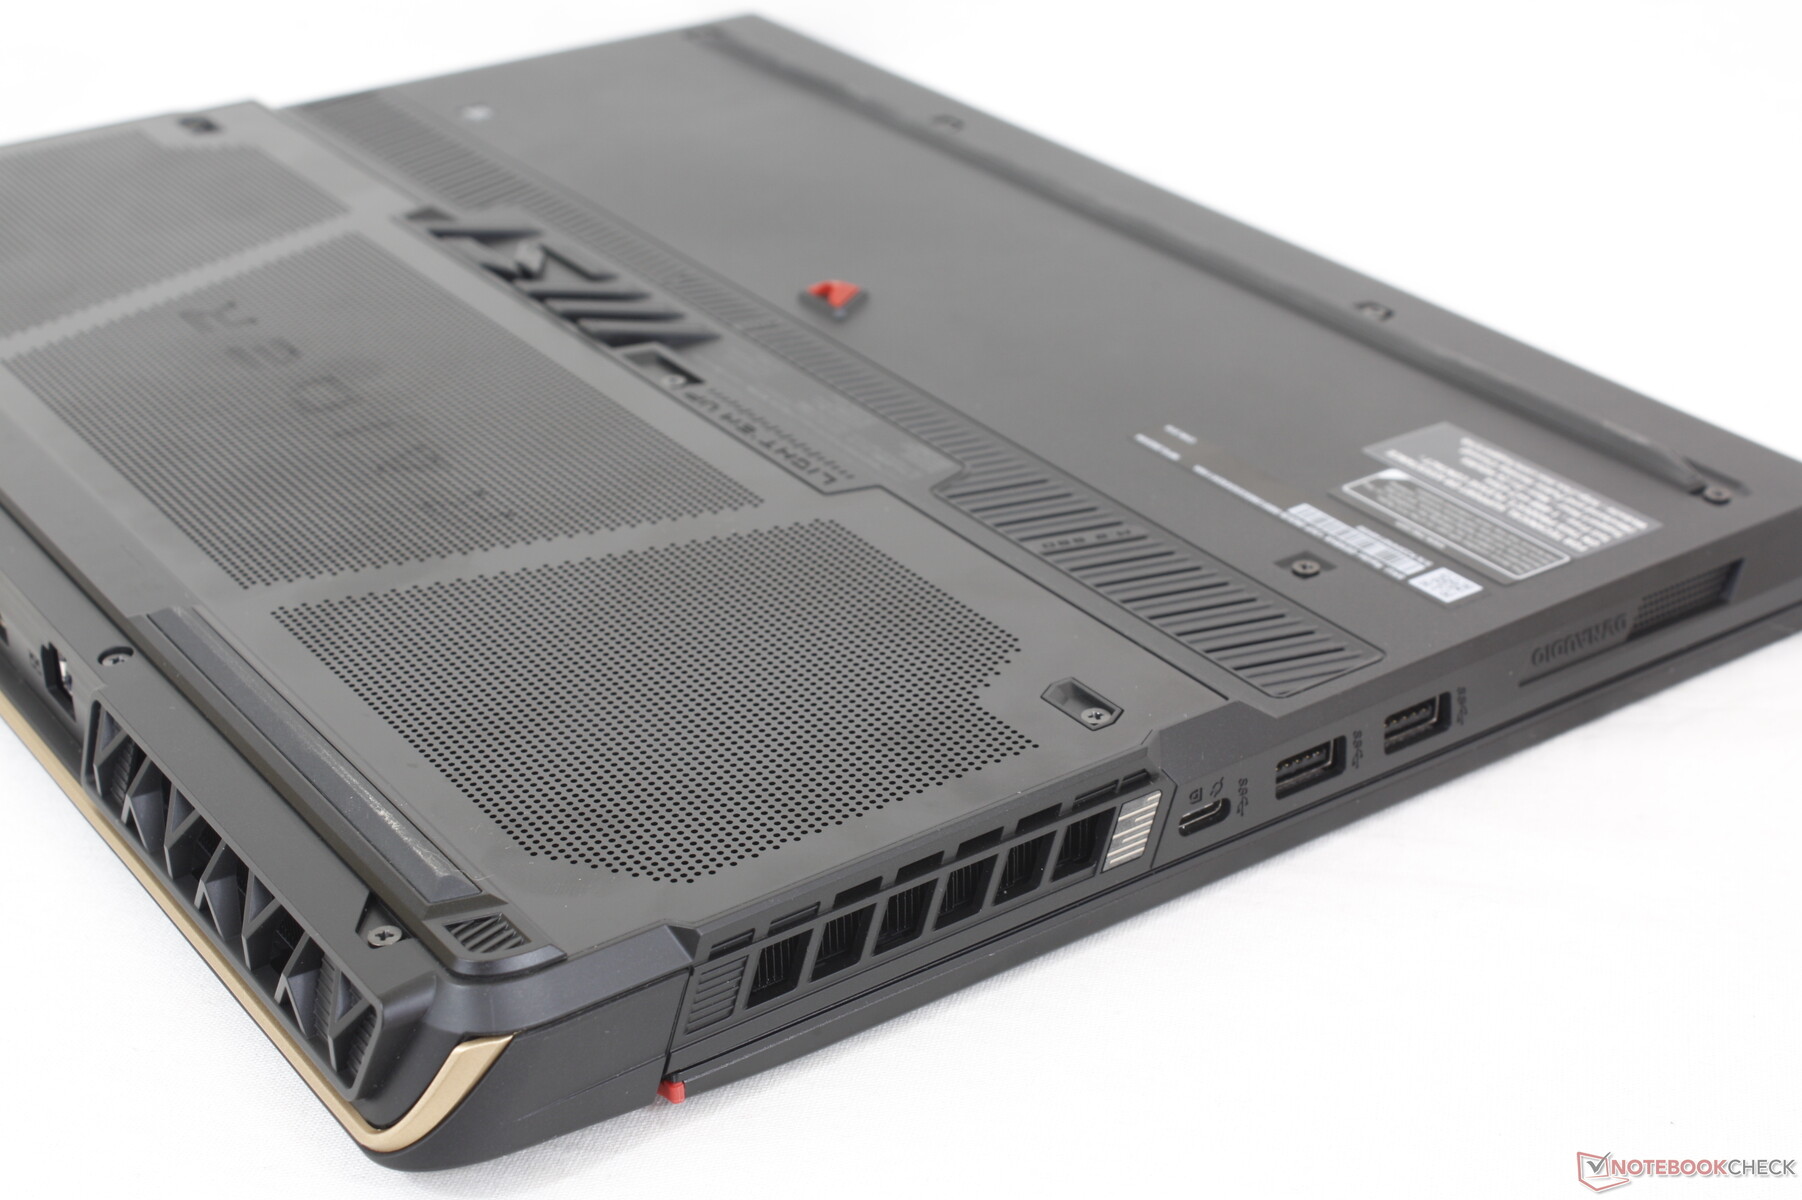
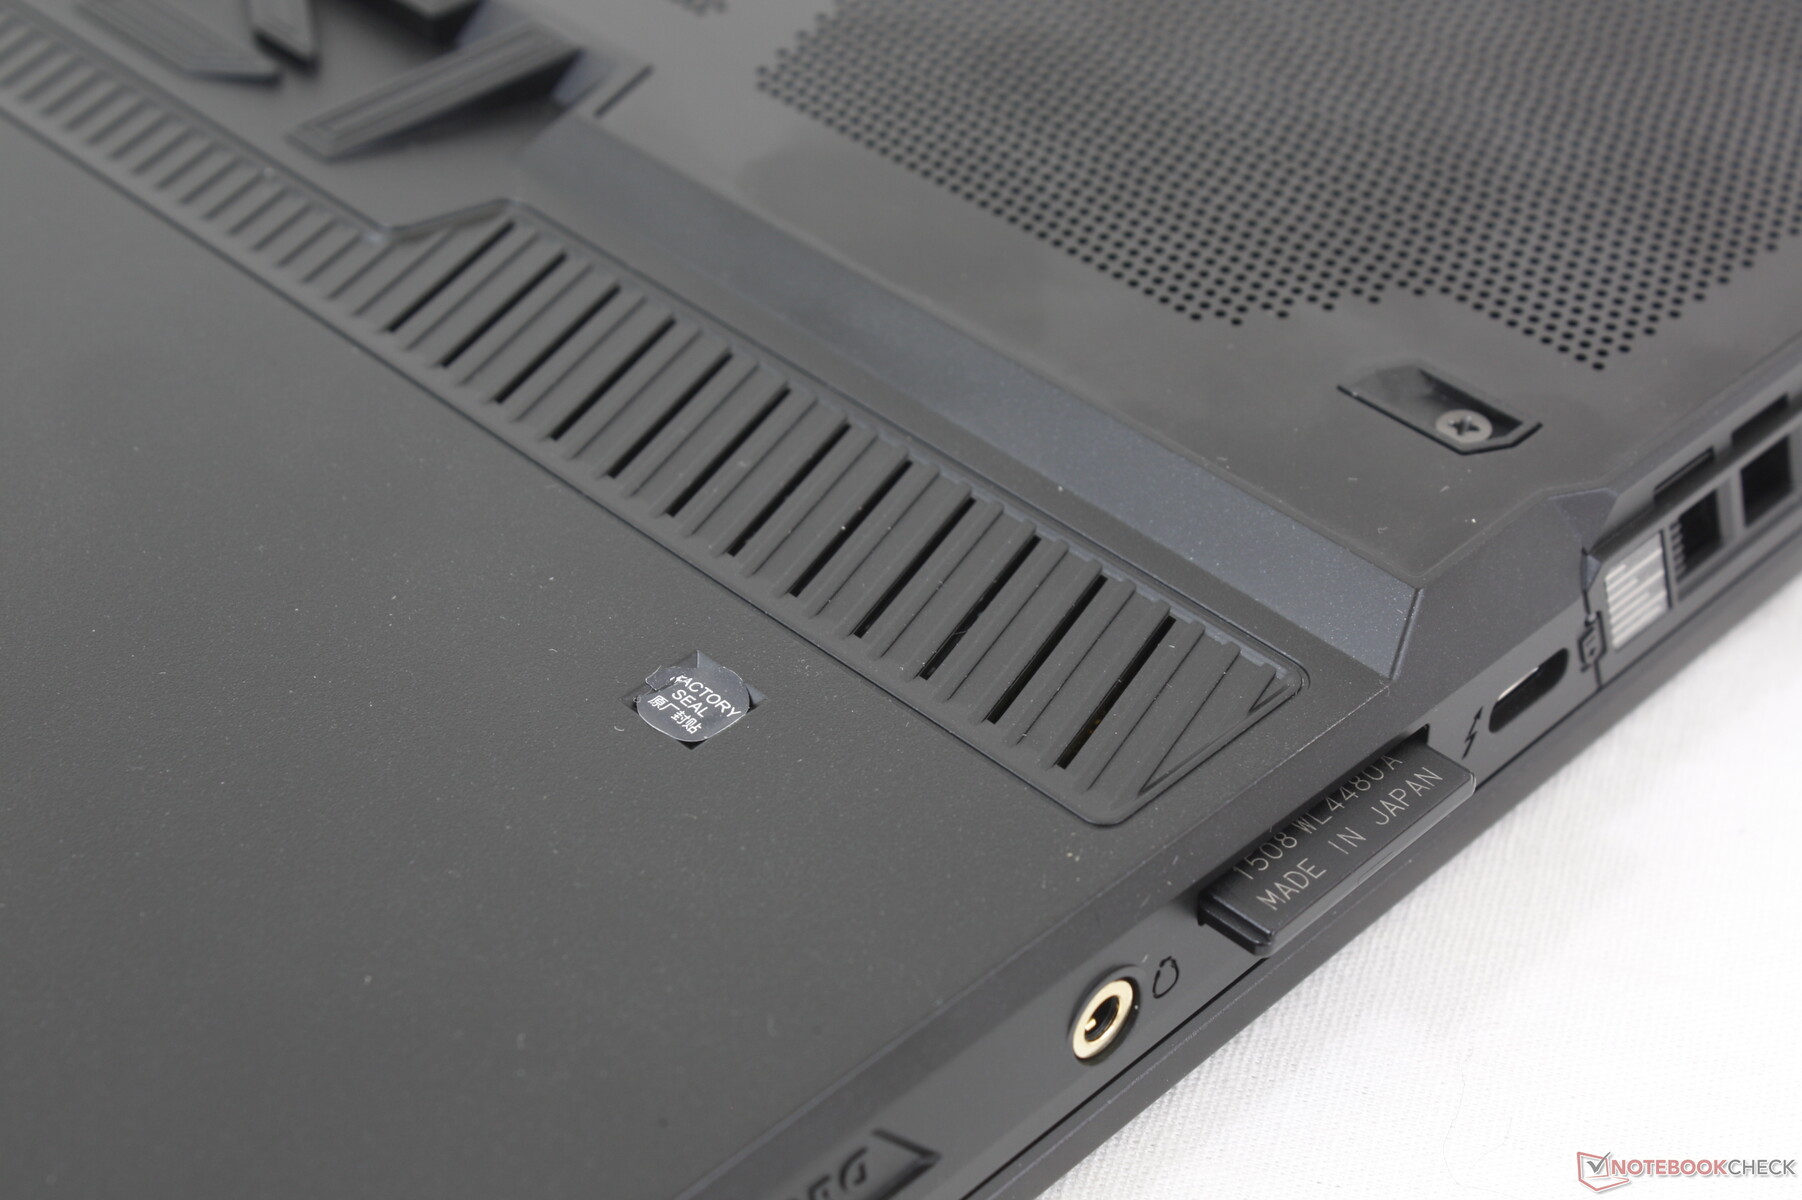
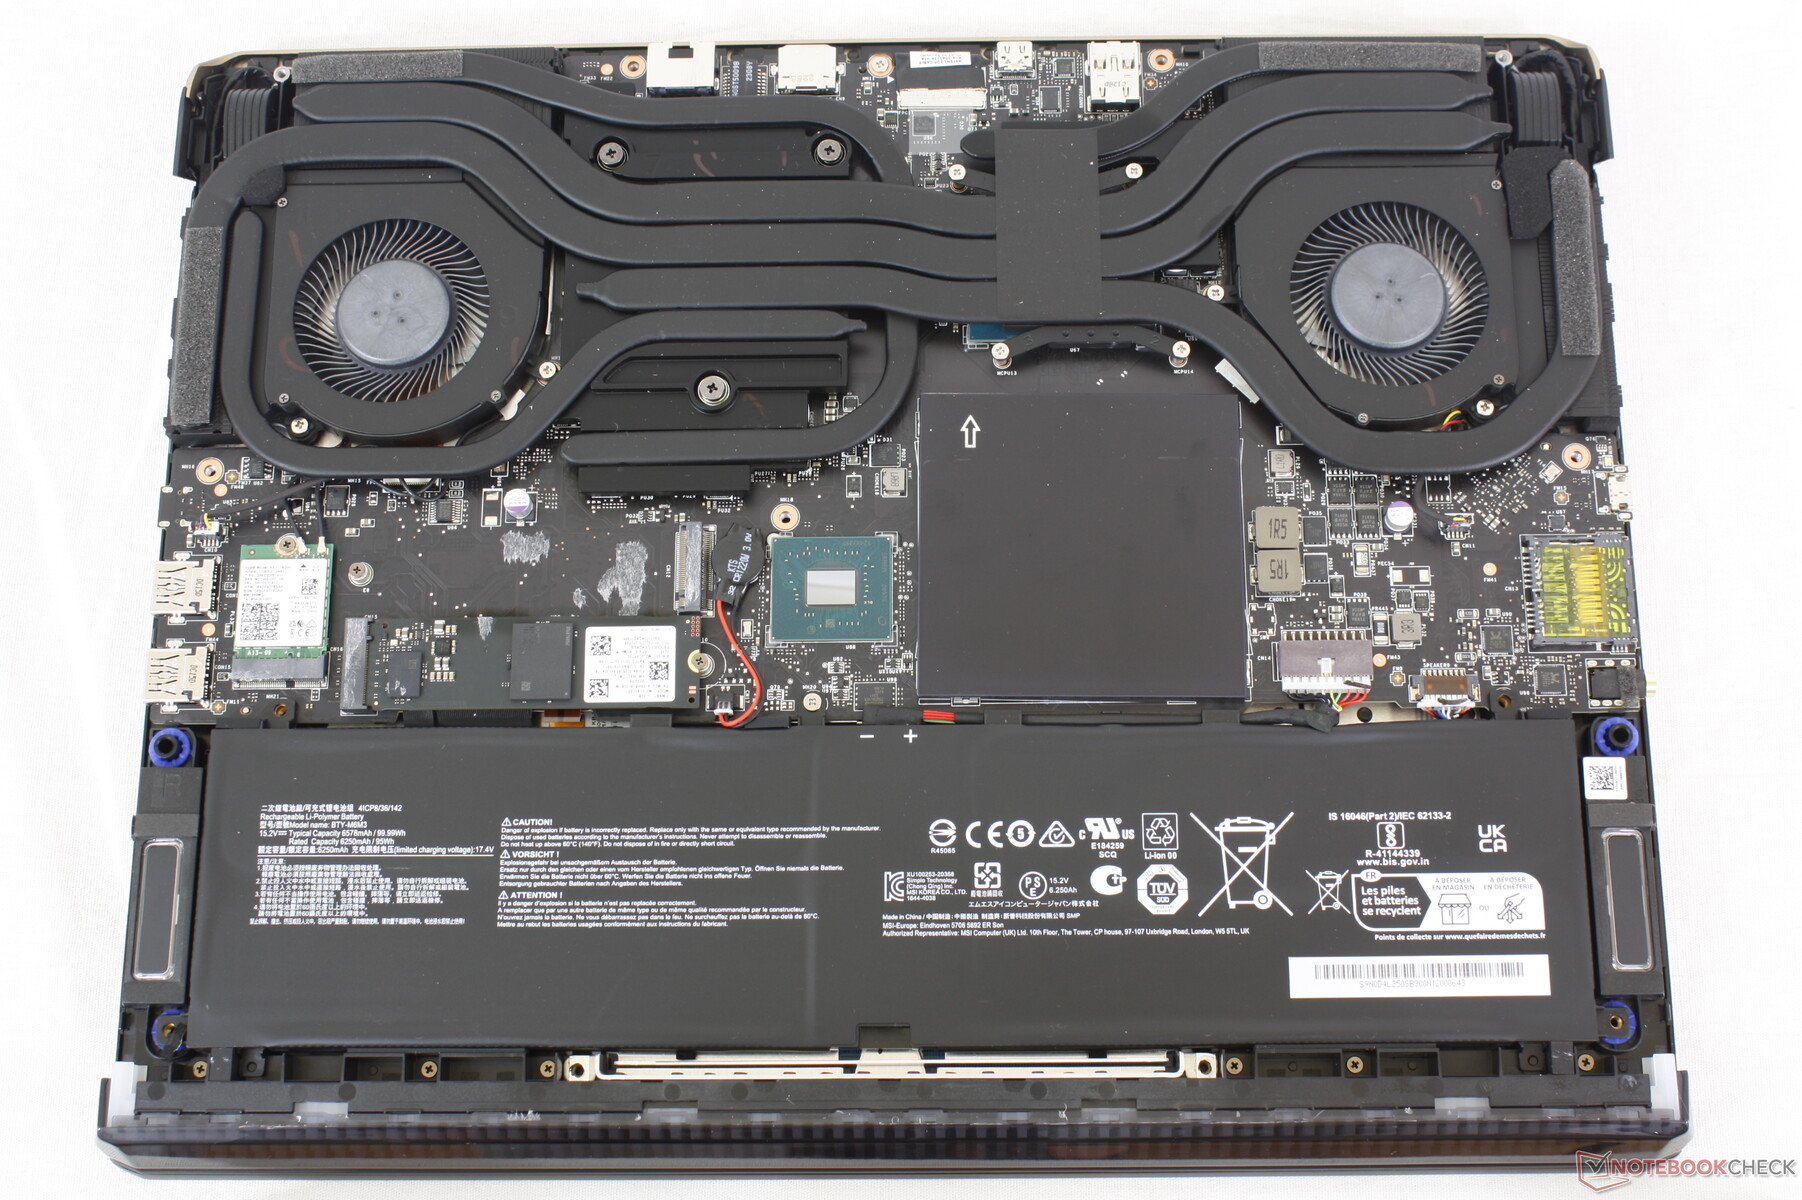
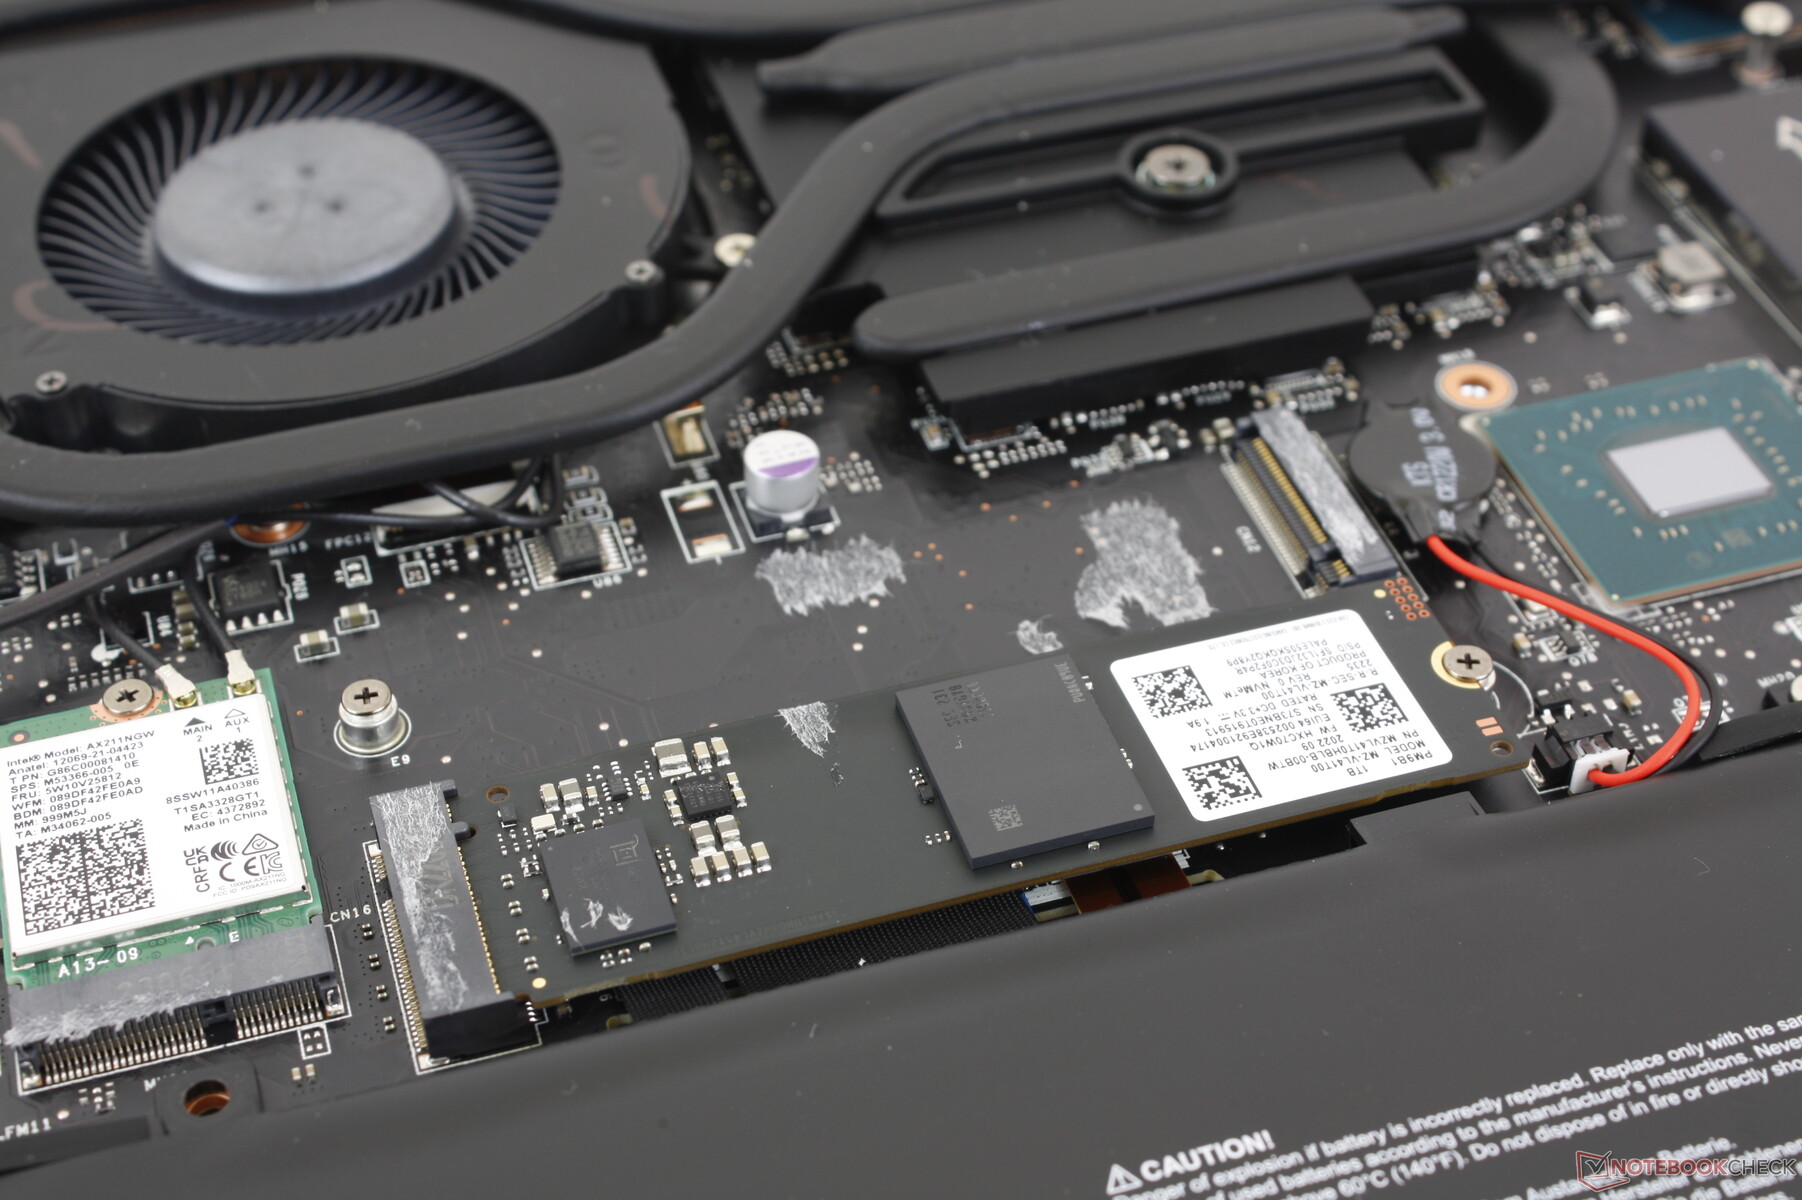
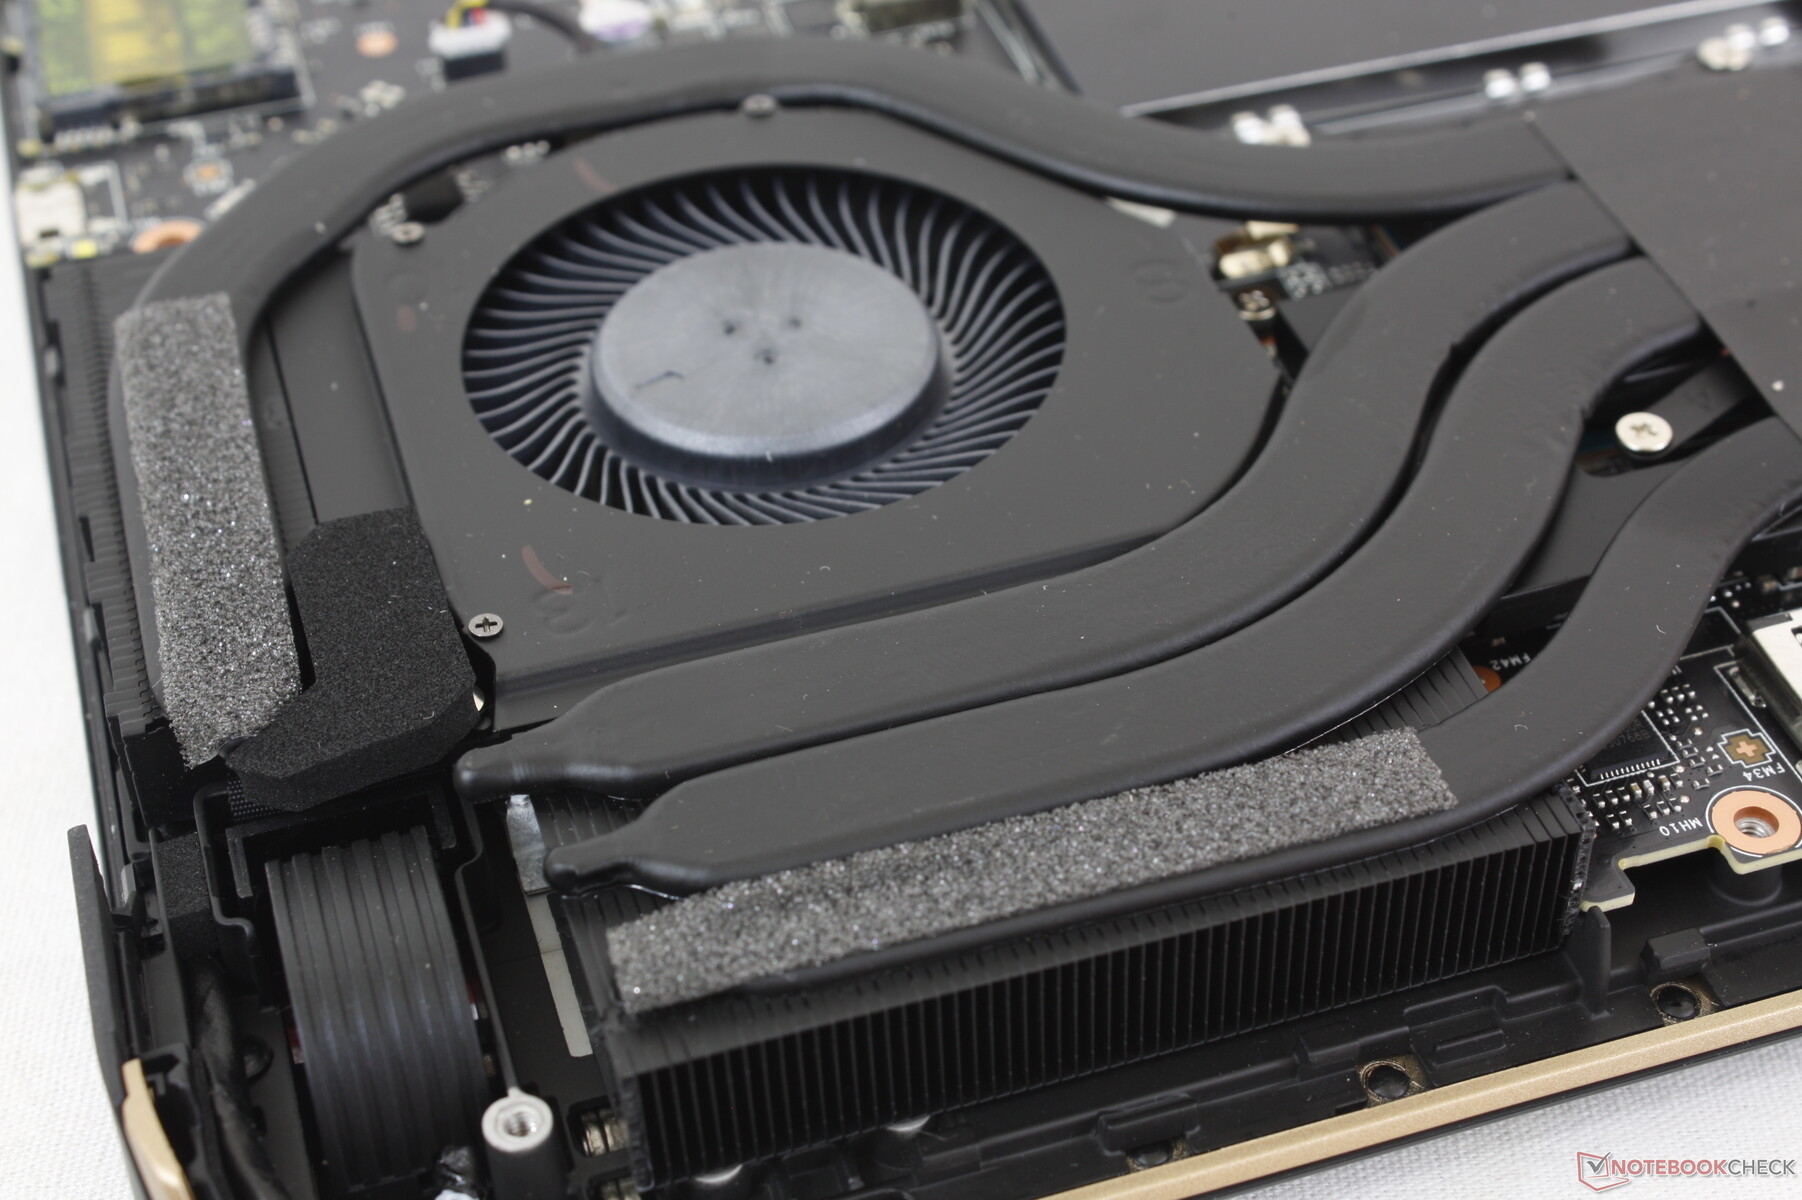
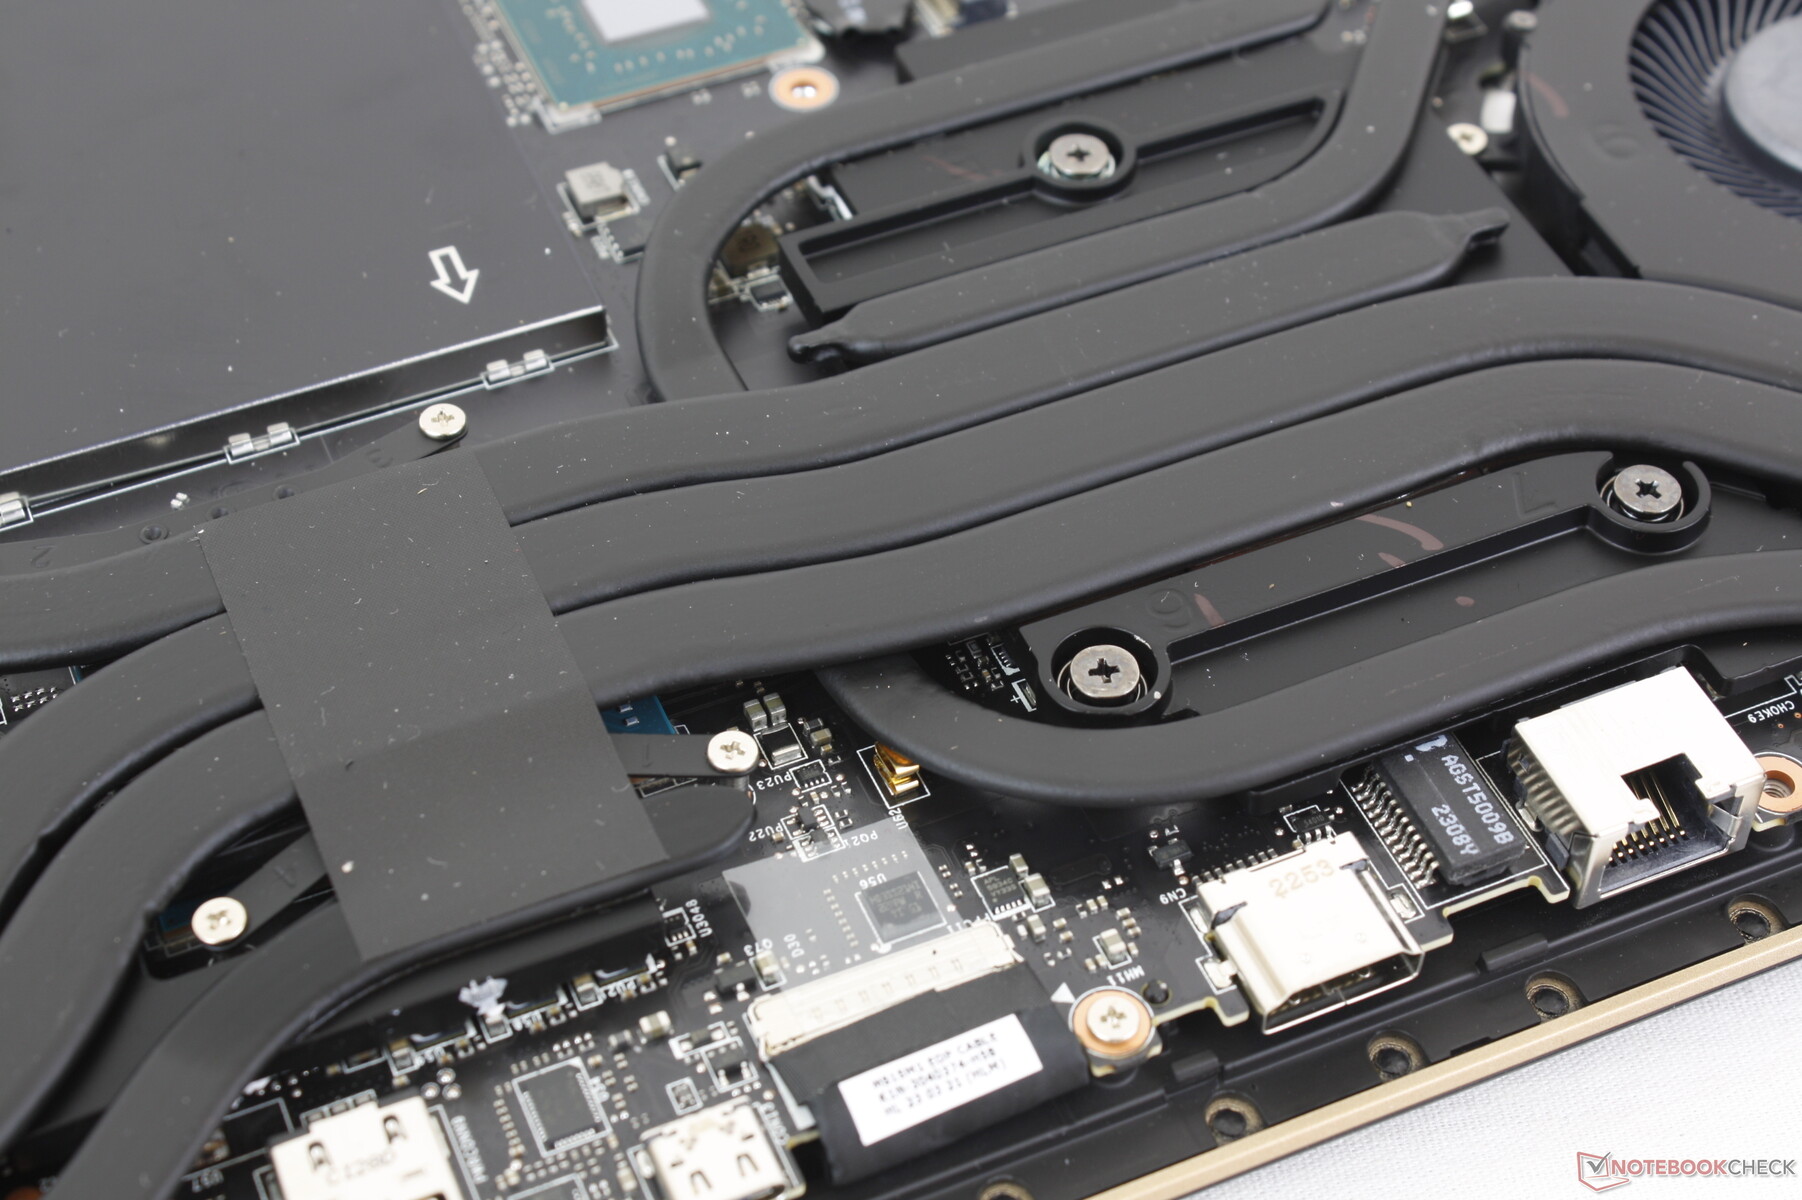
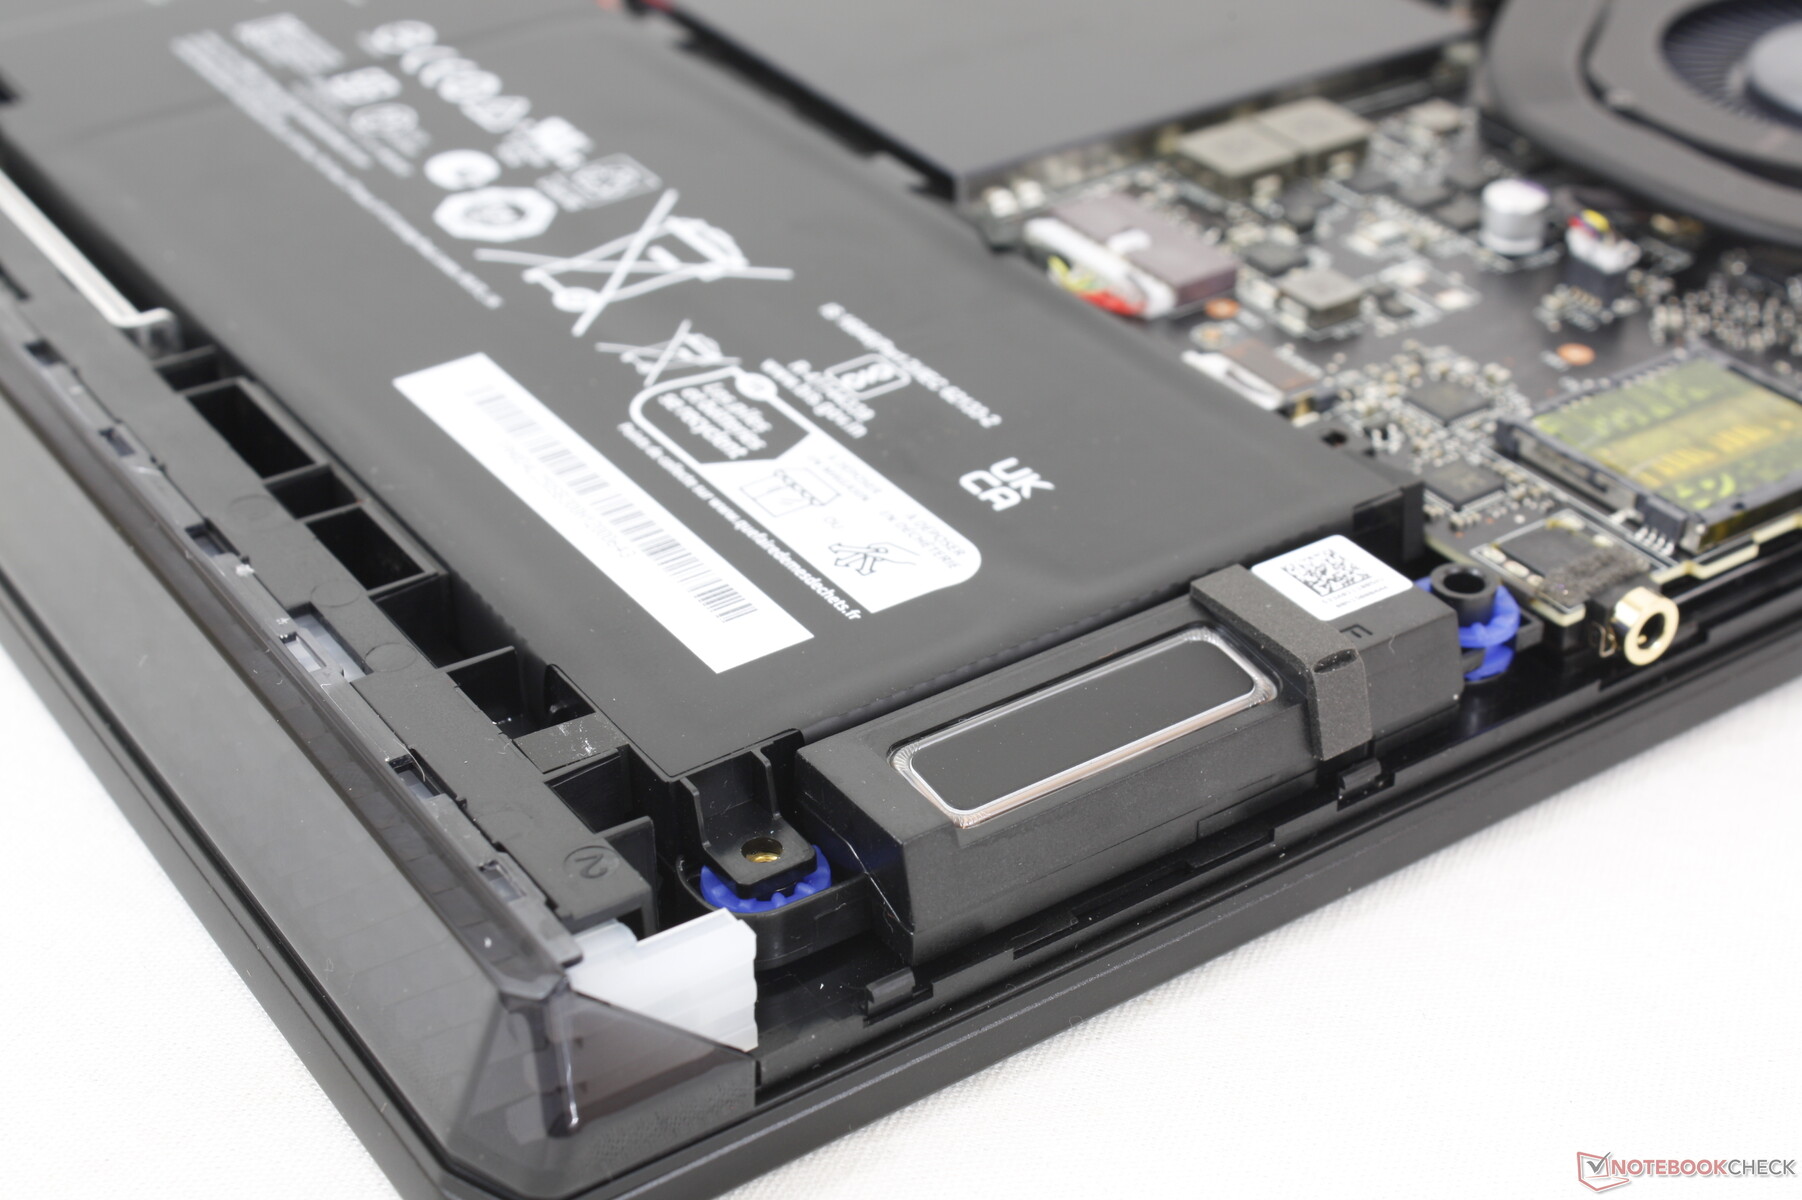
Onderhoud
Helaas zijn MSI-laptops tegenwoordig steeds moeilijker te onderhouden. Het onderpaneel wordt vastgezet met 13 kruiskopschroeven waarvan er één achter een anti-tamper sticker om onderhoud door eindgebruikers te ontmoedigen. Het grootste probleem is dat de plastic haken langs de randen van het paneel schuin staan en stevig vastzitten aan de basis, vooral langs de achterkant. Deze haken zijn moeilijk los te maken en nog moeilijker opnieuw te installeren.
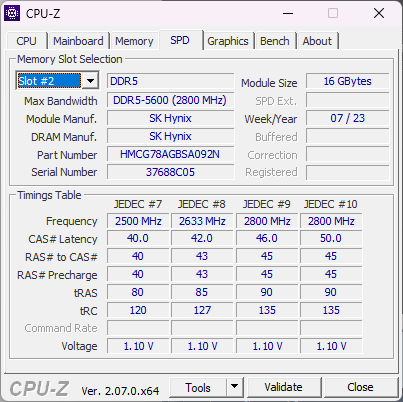
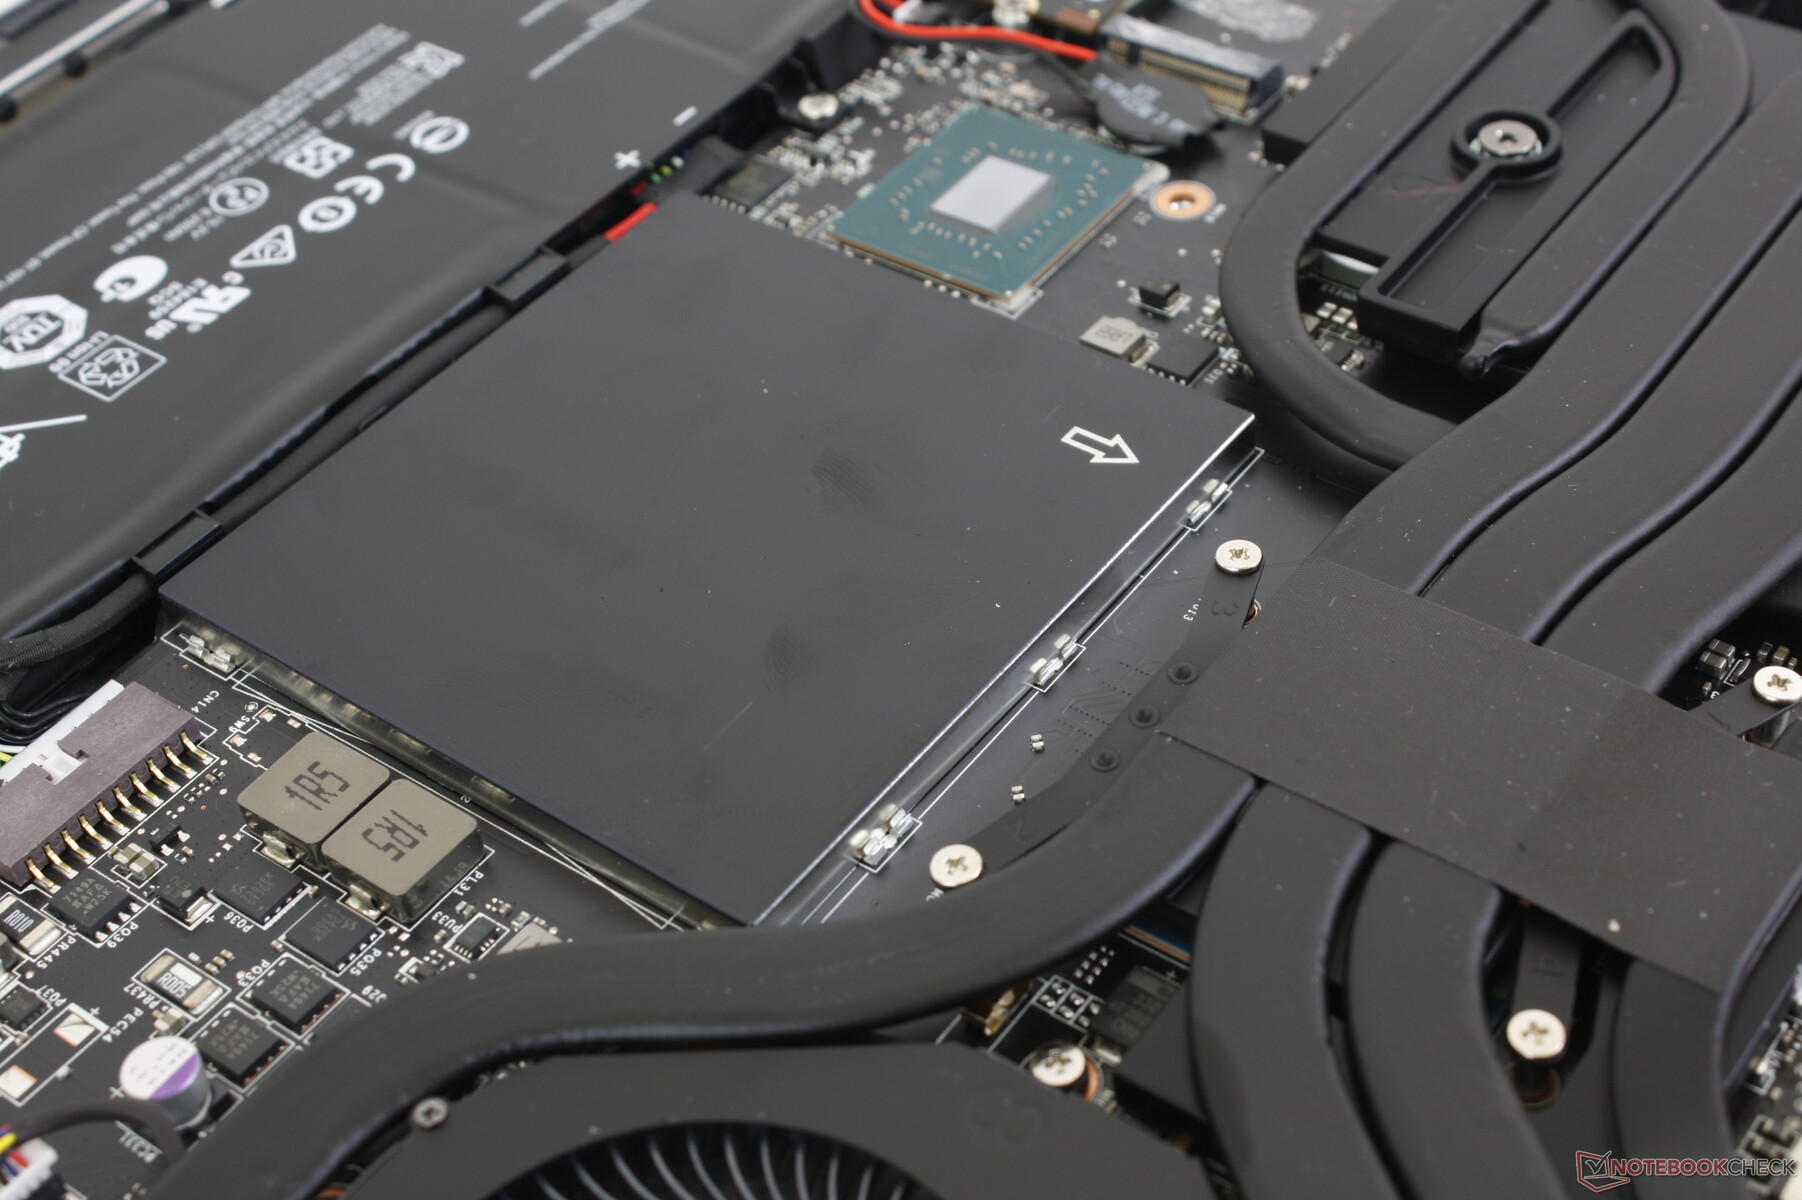
Gebruikers hebben directe toegang tot twee M.2 2280 opslagsleuven, twee DDR5 SODIMM-sleuven en de WLAN-module en batterij als ze eenmaal binnen zijn.
Accessoires en garantie
De verpakking bevat naast de AC-adapter en papieren ook een schoonmaakdoekje. Bij aankoop in de VS geldt een beperkte fabrieksgarantie van een jaar.
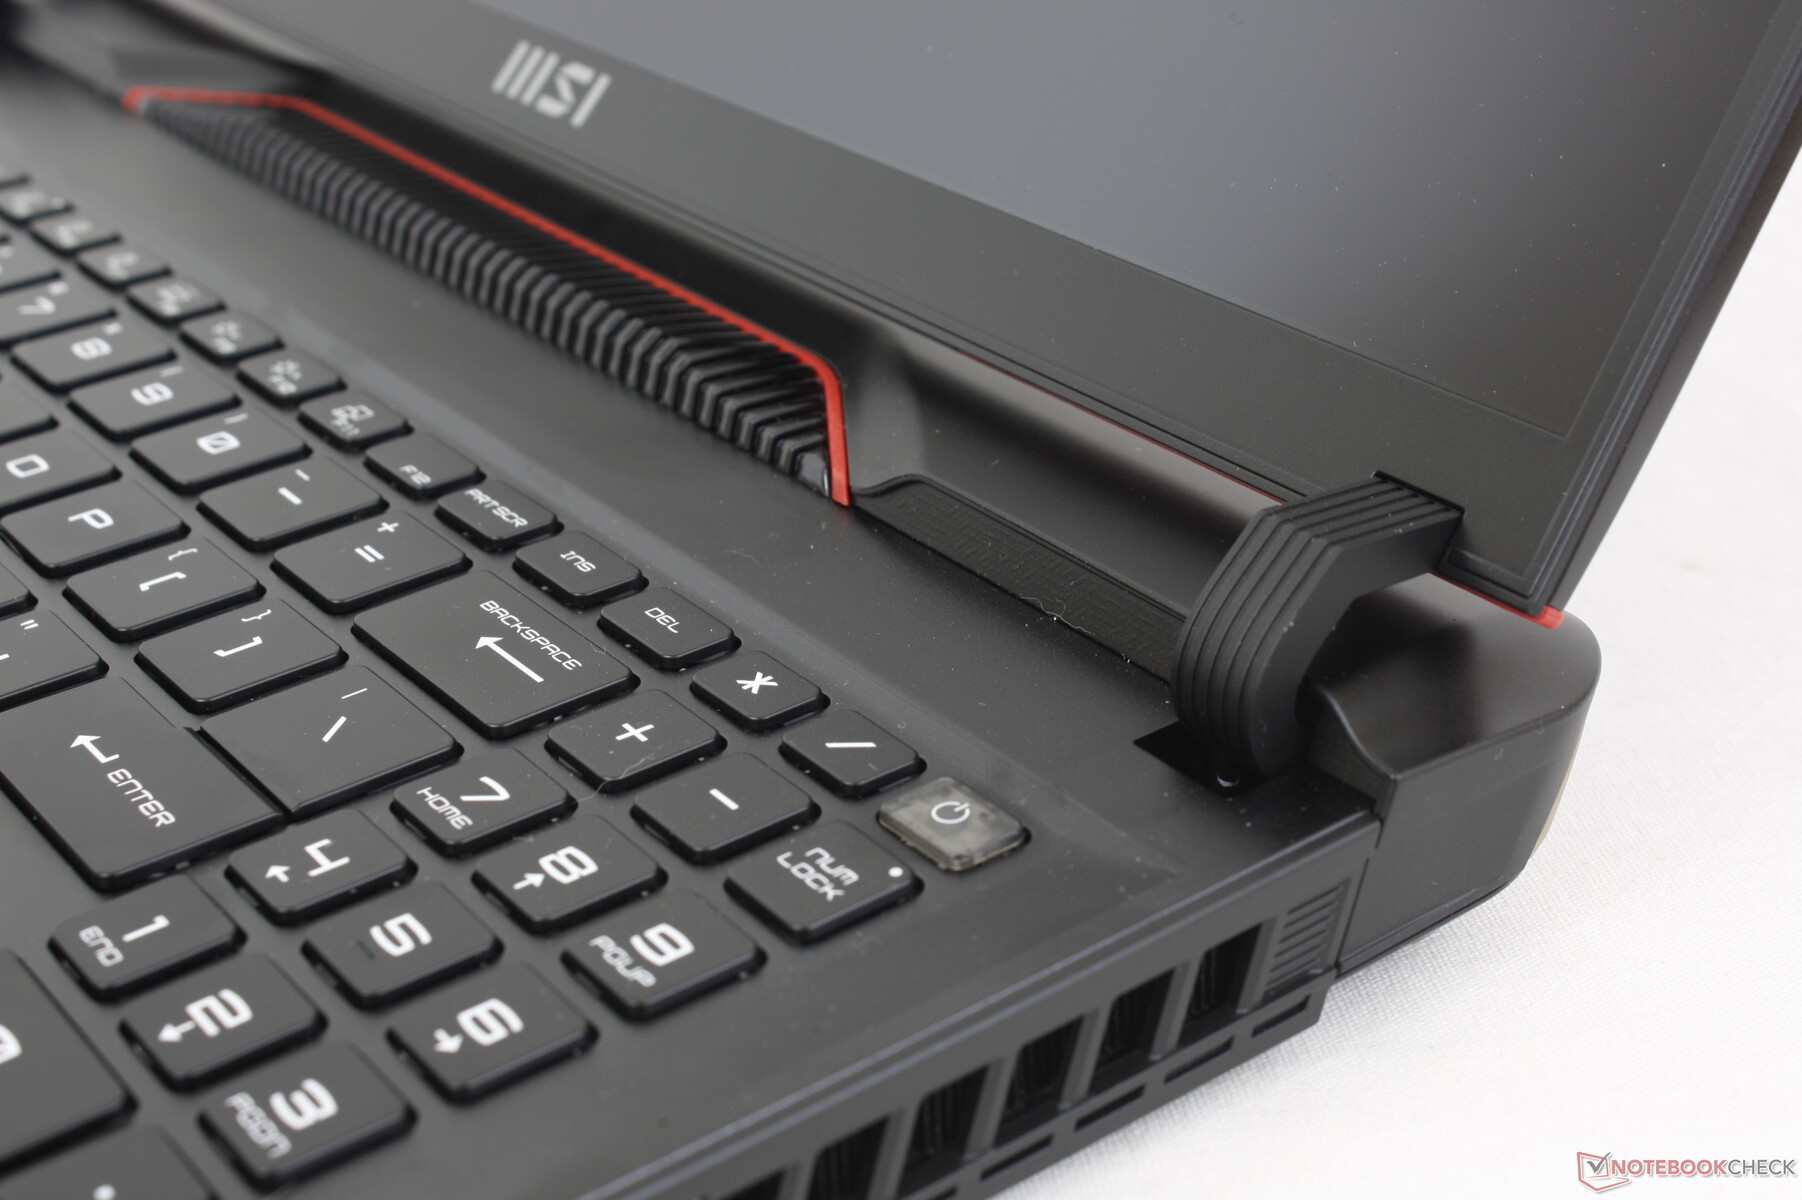
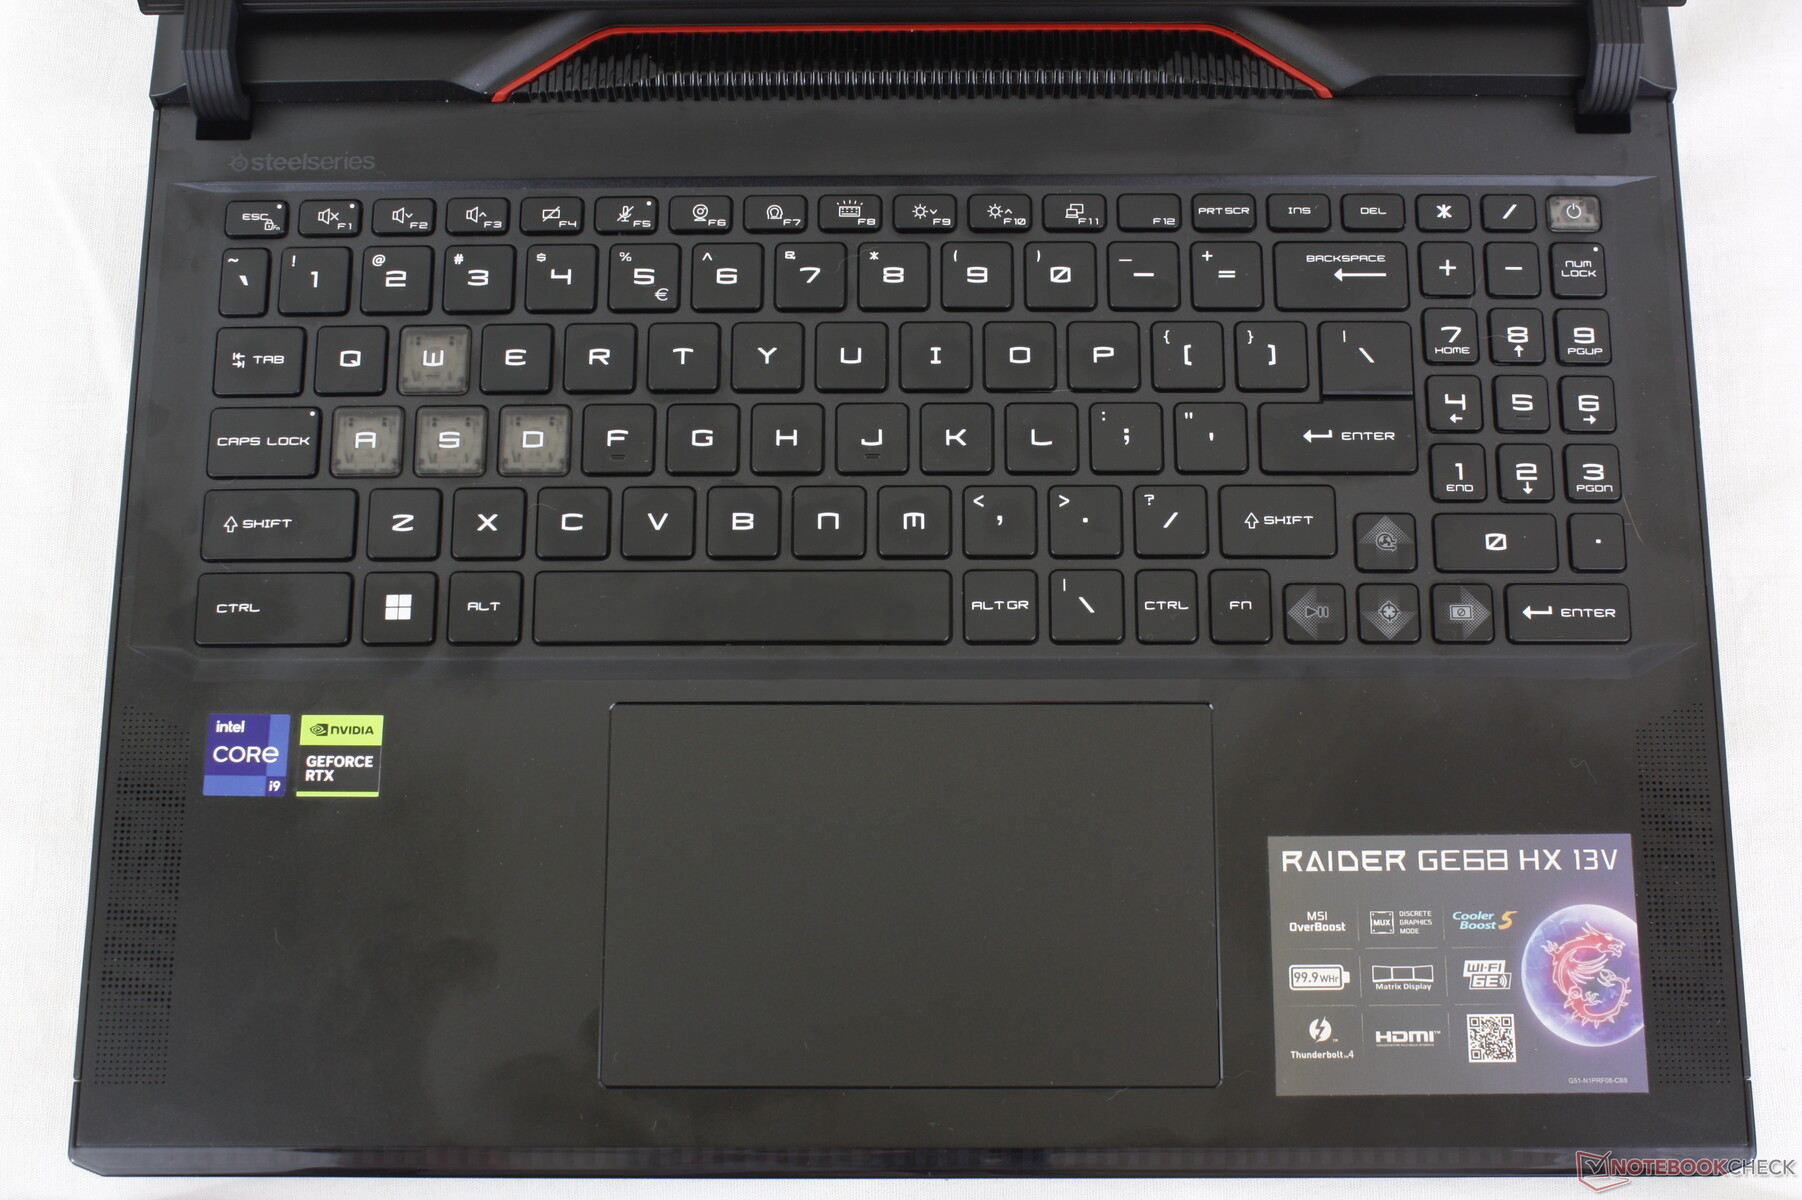
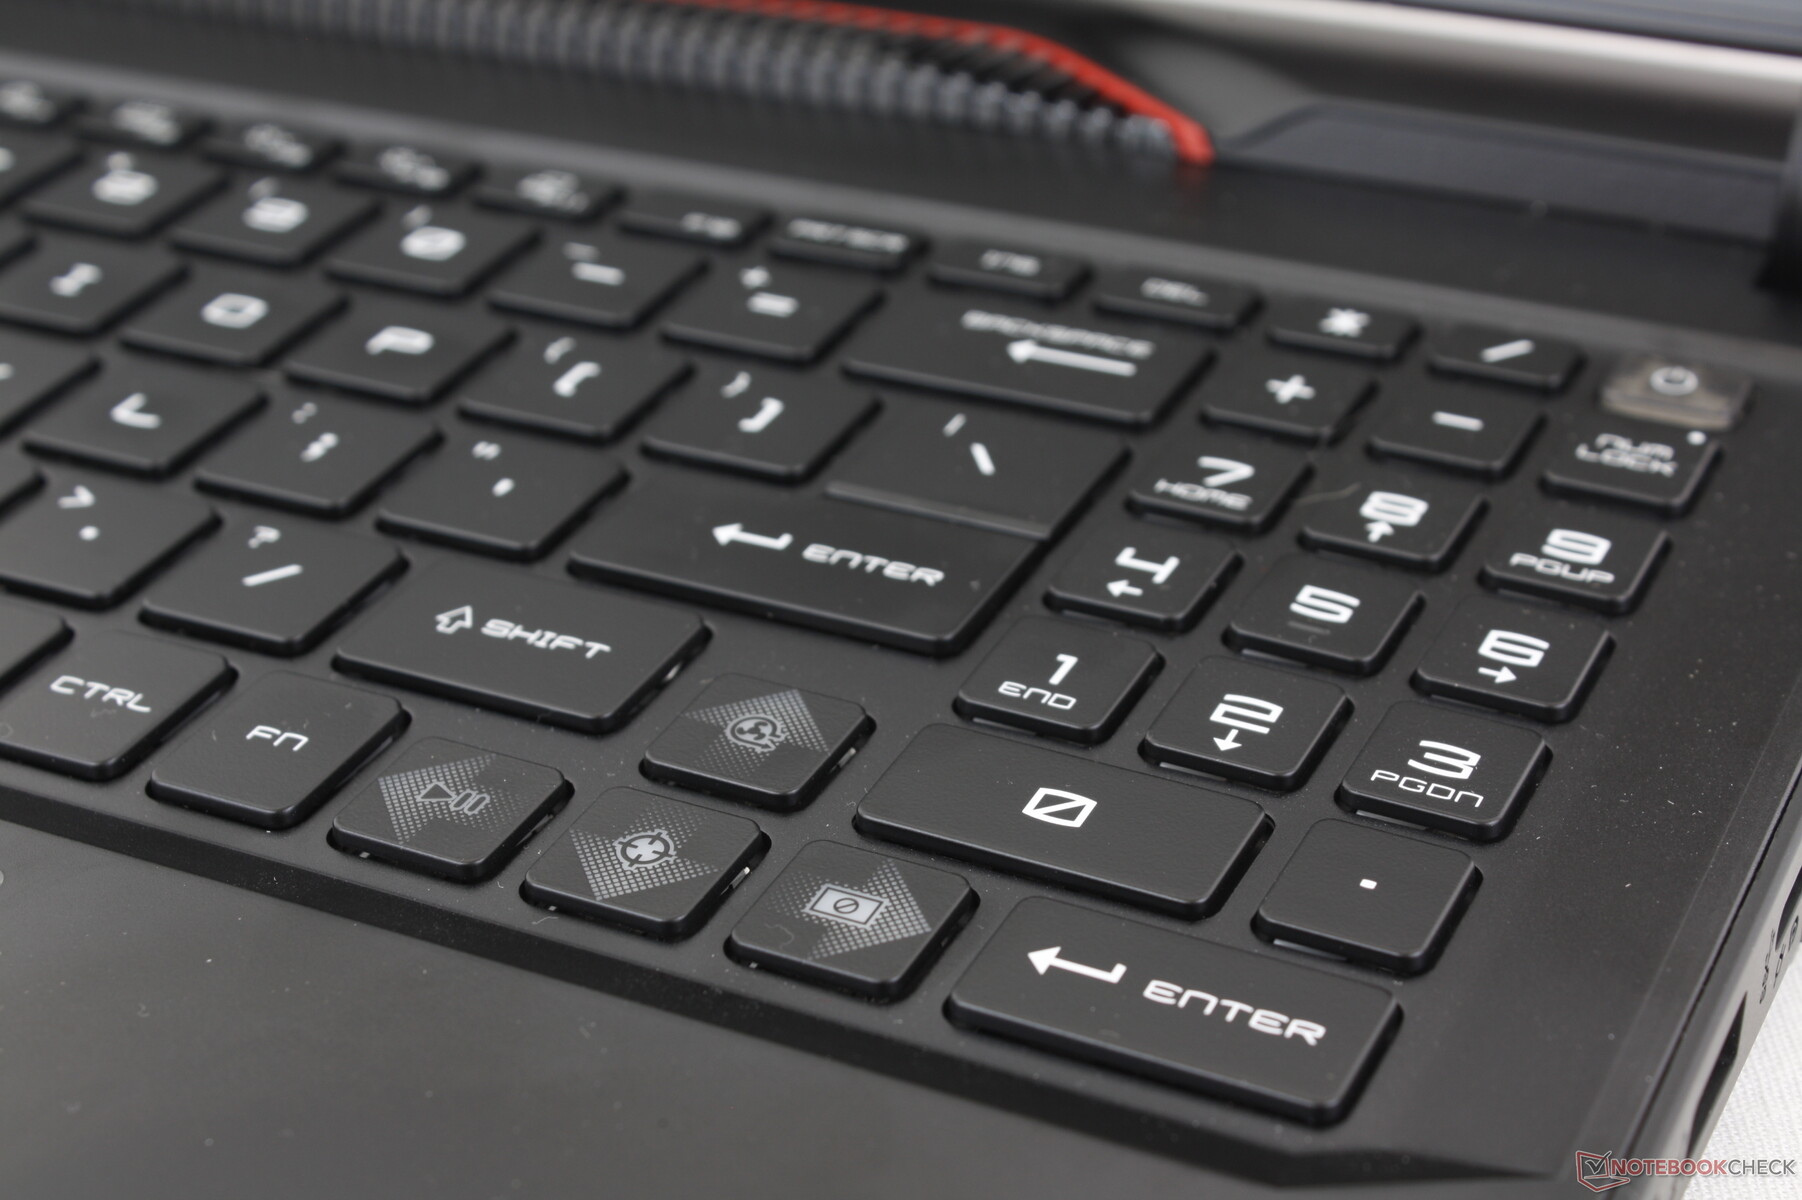
Invoerapparaten - Groter clickpad en nieuwe Numpad
Toetsenbord
MSI heeft de toetsenbordindeling vernieuwd ten opzichte van de GE67HX. Er is nu een geïntegreerd numpad, terwijl de Ctrl- en Fn-toetsen niet langer onhandig in elkaar gedrukt zijn. Helaas zijn de pijltjestoetsen verkleind om ruimte te maken voor het nieuwe numpad.
De feedback is verder uitstekend met stevige en gelijkmatige feedback tussen de belangrijkste QWERTY-toetsen. Vooral de spatiebalk en Enter toetsen zijn duidelijk luider voor een meer bevredigend gevoel.
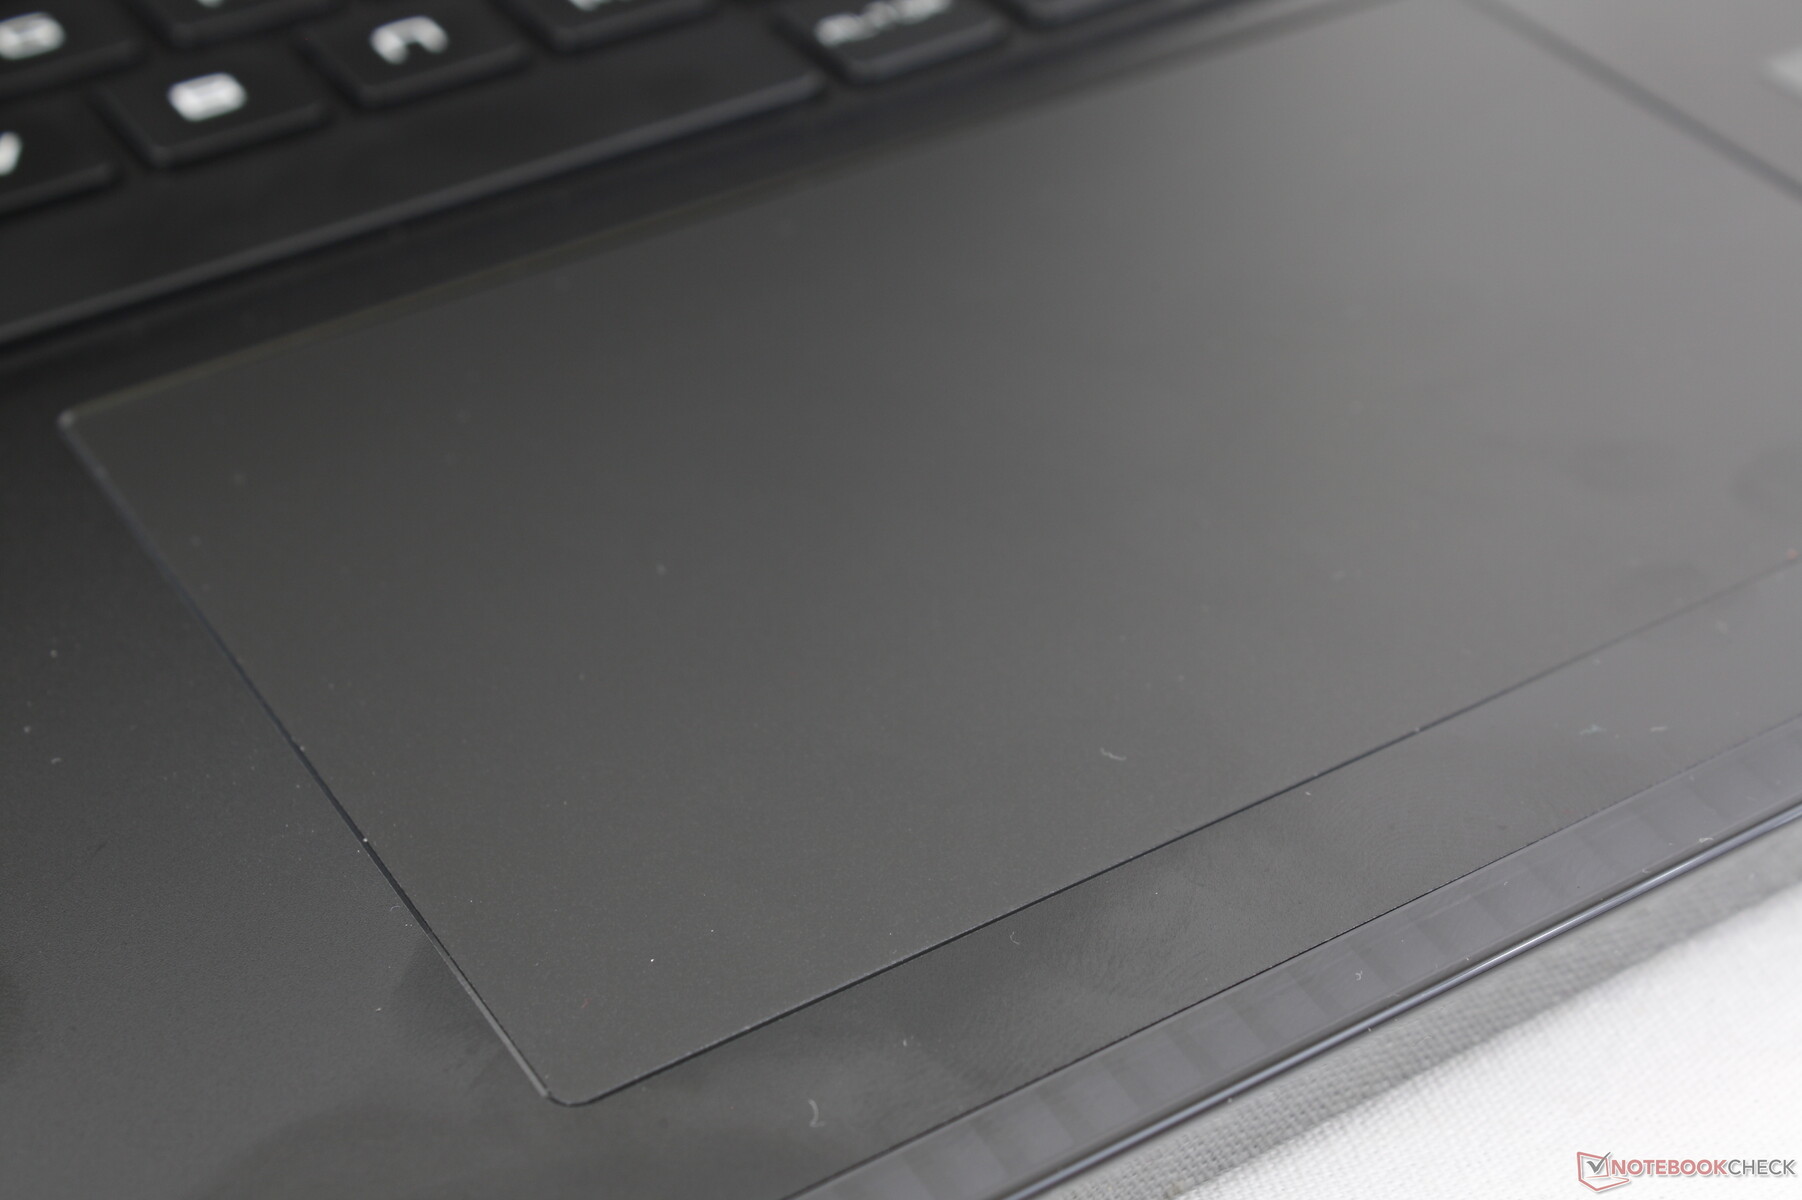
Touchpad
De grootte van het clickpad is aanzienlijk toegenomen van slechts 10,5 x 6,5 cm op de GE67HX naar 13 x 8,3 cm op de GE68HX. Het glijden gaat erg soepel en responsief en er is bijna geen sprake van haperen, zelfs niet bij lagere snelheden. Klikken is ook bevredigend, maar de feedback is niet perfect gelijkmatig, want het voelt klikter aan als je in het midden drukt, terwijl de onderste hoeken sponsachtiger aanvoelen.

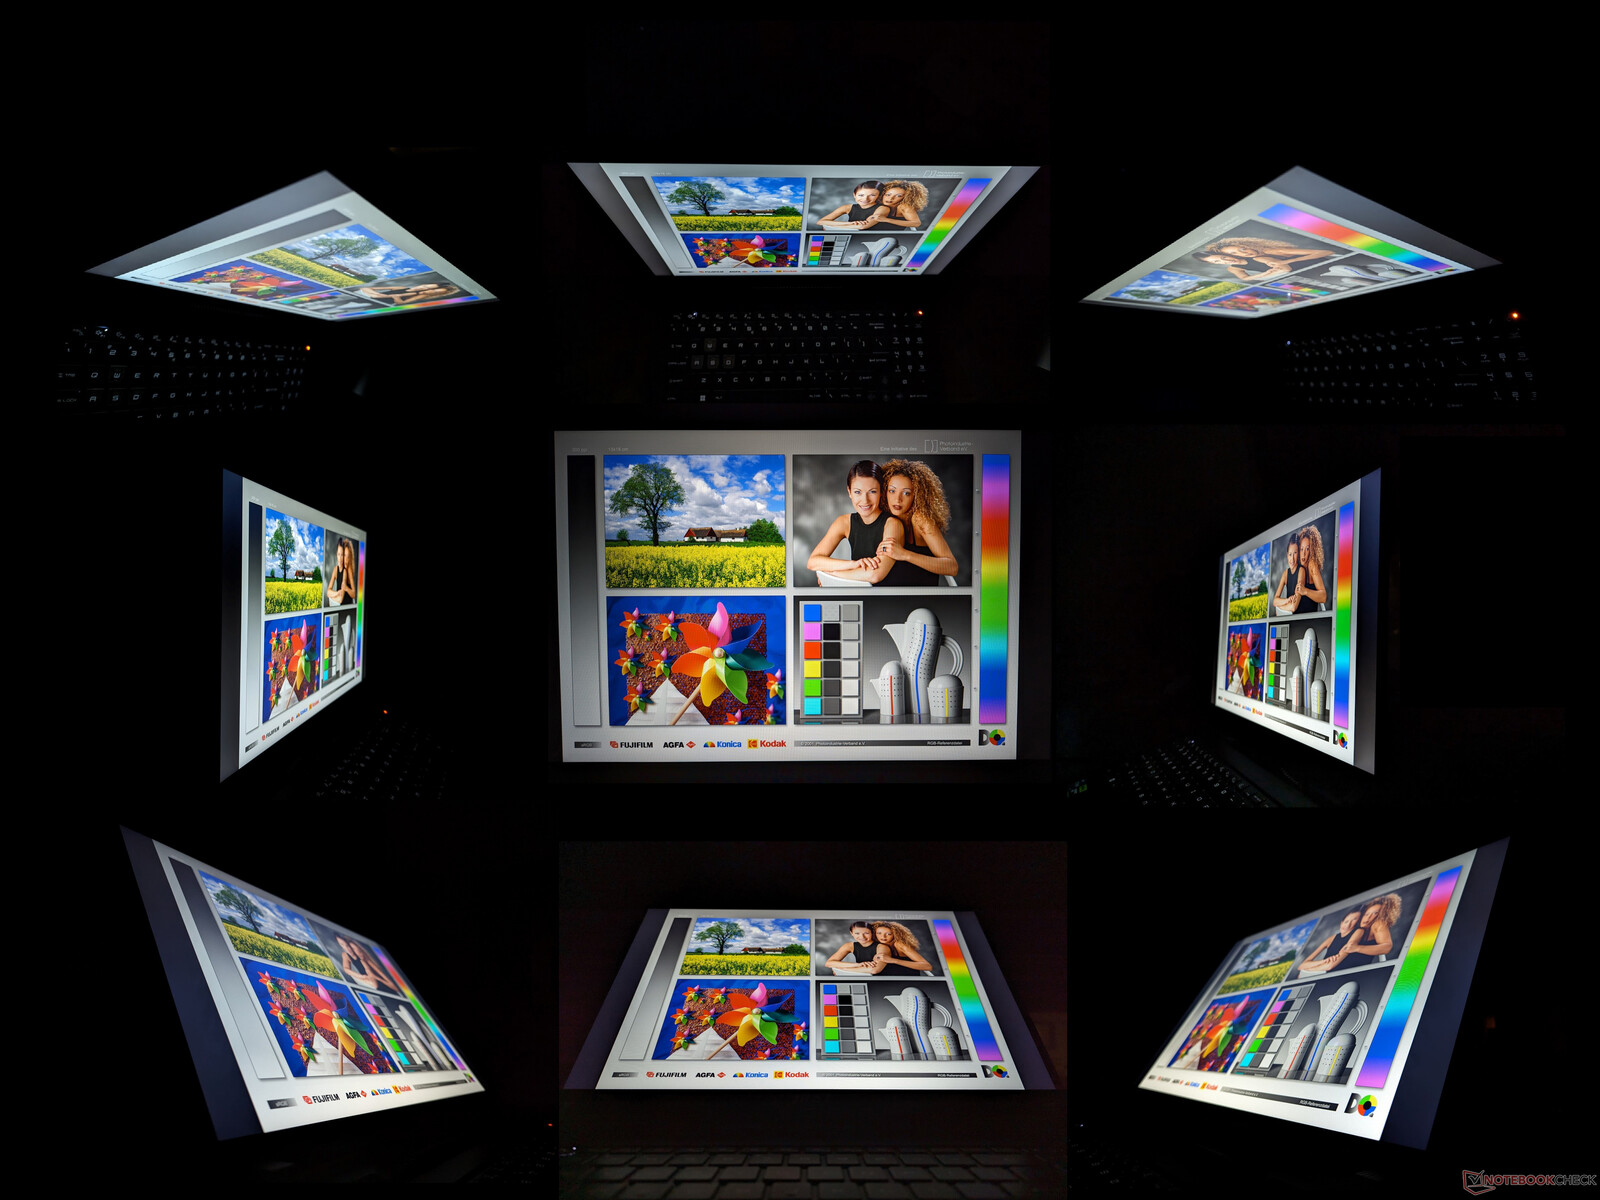
Beeldscherm - slechte kleuren
De Raider GE68HX wordt geleverd met twee verschillende paneelopties. Onze review unit wordt geleverd met de vetgedrukte optie hieronder:
- 2560 x 1600, 240 Hz, 100% DCI-P3, 3 ms, IPS
- 1920 x 1200, 144 Hz, 60% sRGB, 11 ms, IPS
De goedkopere 144 Hz optie is niet aan te raden vanwege de smallere kleurdekking en langzamere reactietijden voor meer merkbare ghosting. De ondiepere kleuren zijn moeilijk over het hoofd te zien, zelfs als je niet veel aan grafische bewerking doet. Dit paneel is meer geschikt voor goedkopere gaming laptops zoals de MSI Pulse 17 waar smalle kleurbereiken gebruikelijk zijn.
G-Sync is opvallend afwezig op alle huidige configuraties van de GE68HX.

| |||||||||||||||||||||||||
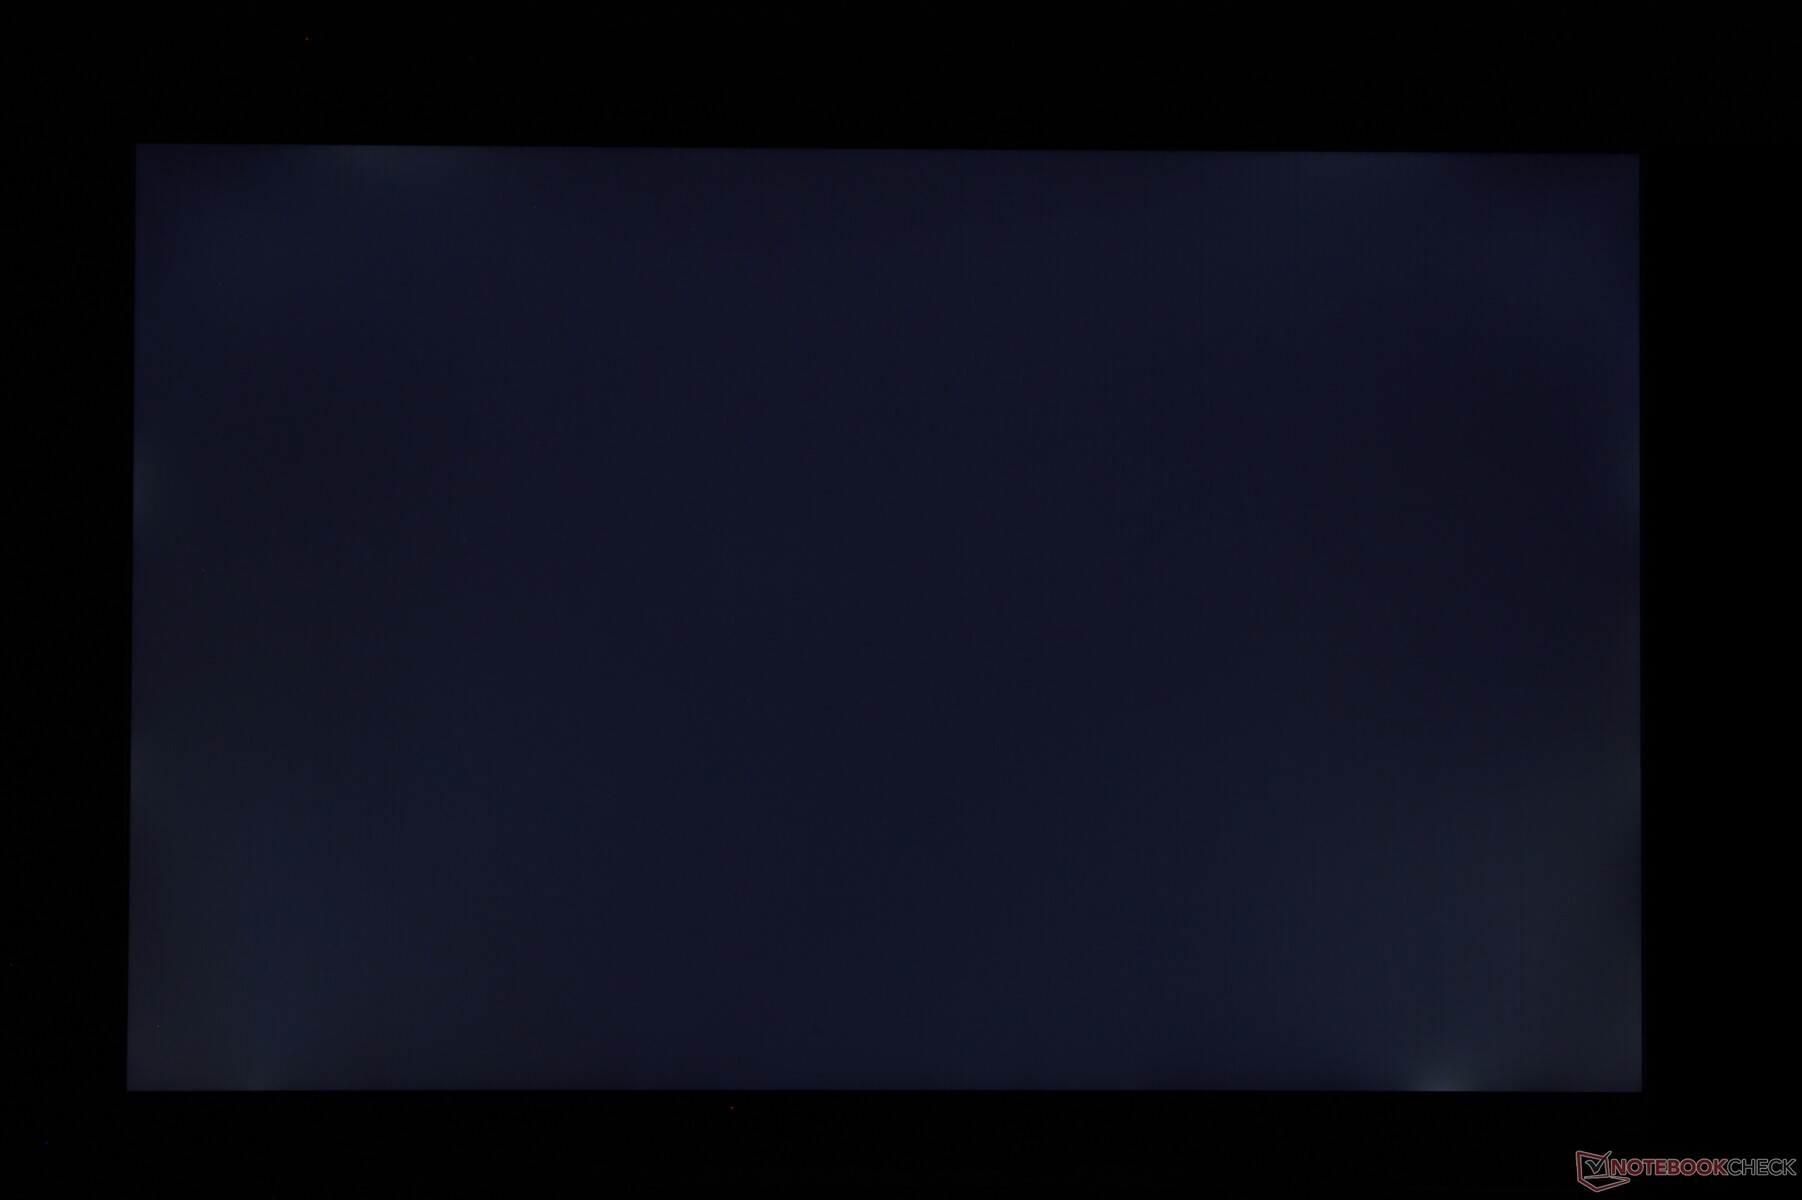
Helderheidsverdeling: 93 %
Helderheid in Batterij-modus: 300.9 cd/m²
Contrast: 971:1 (Zwart: 0.31 cd/m²)
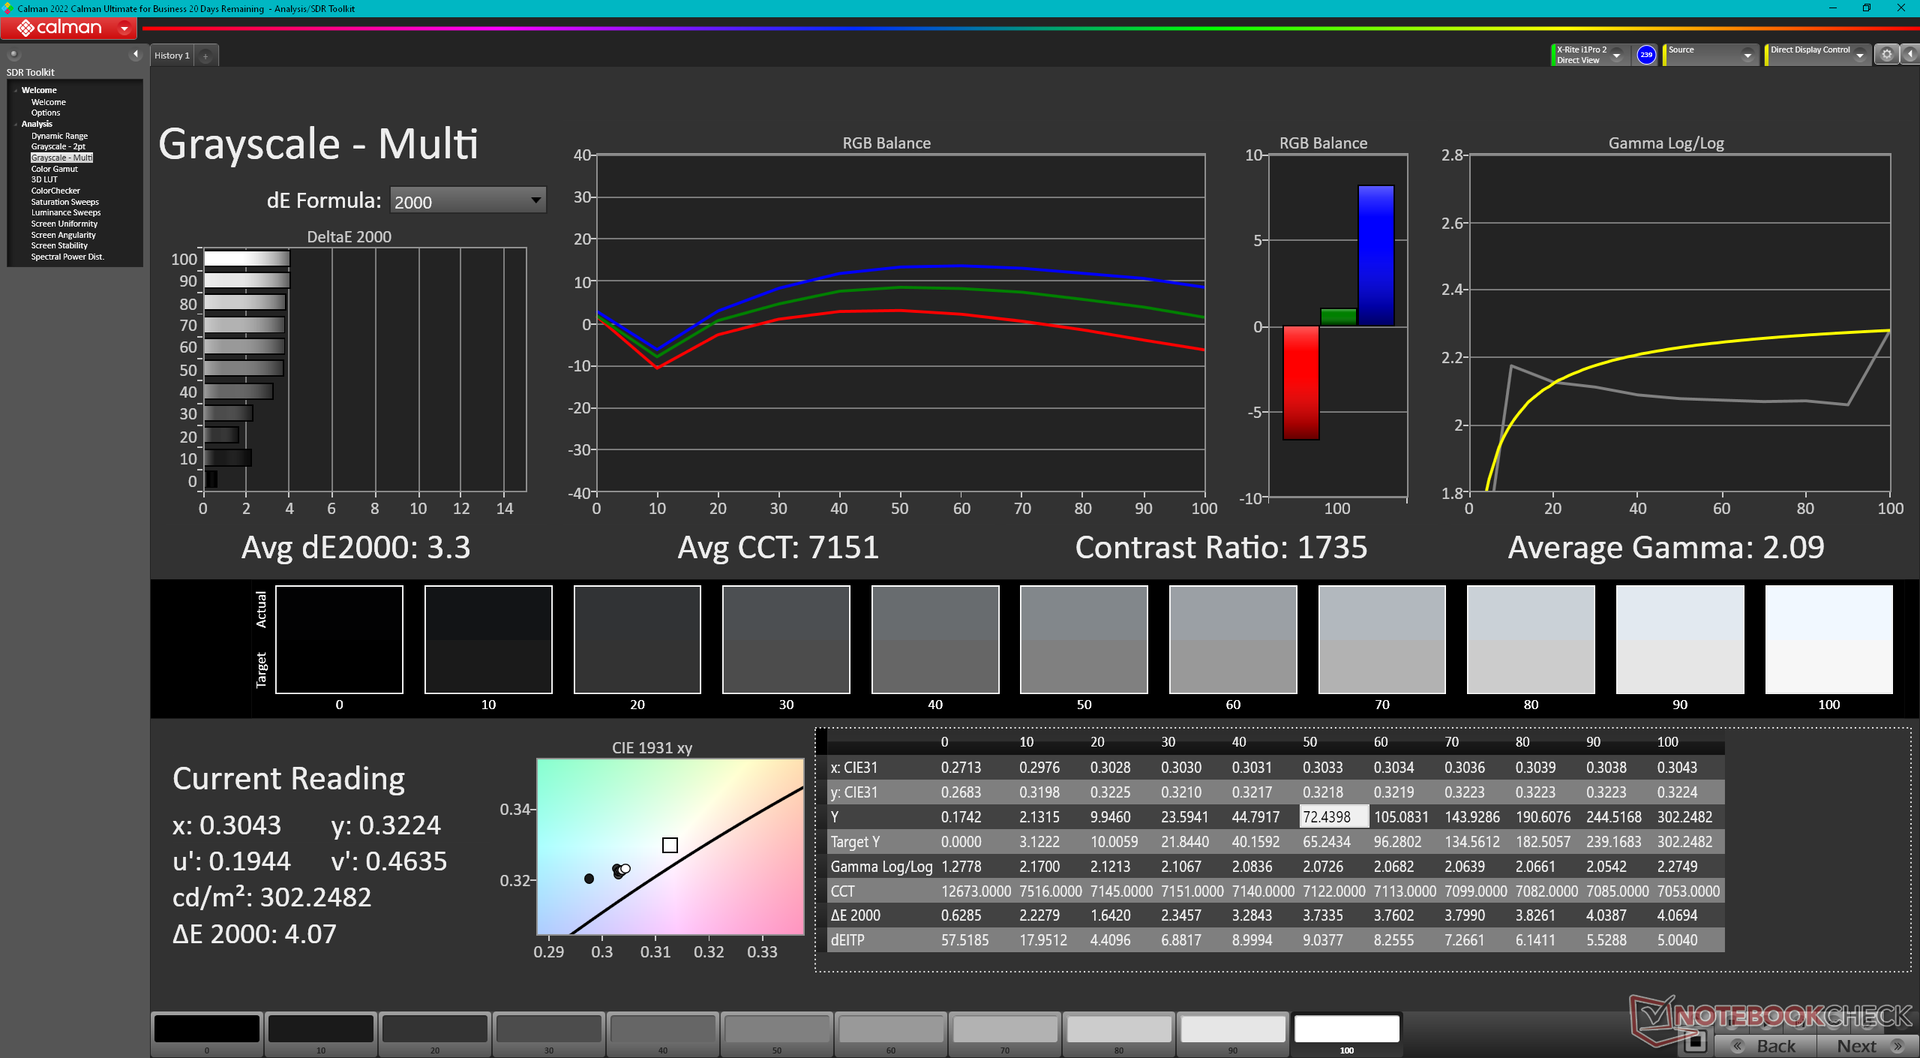
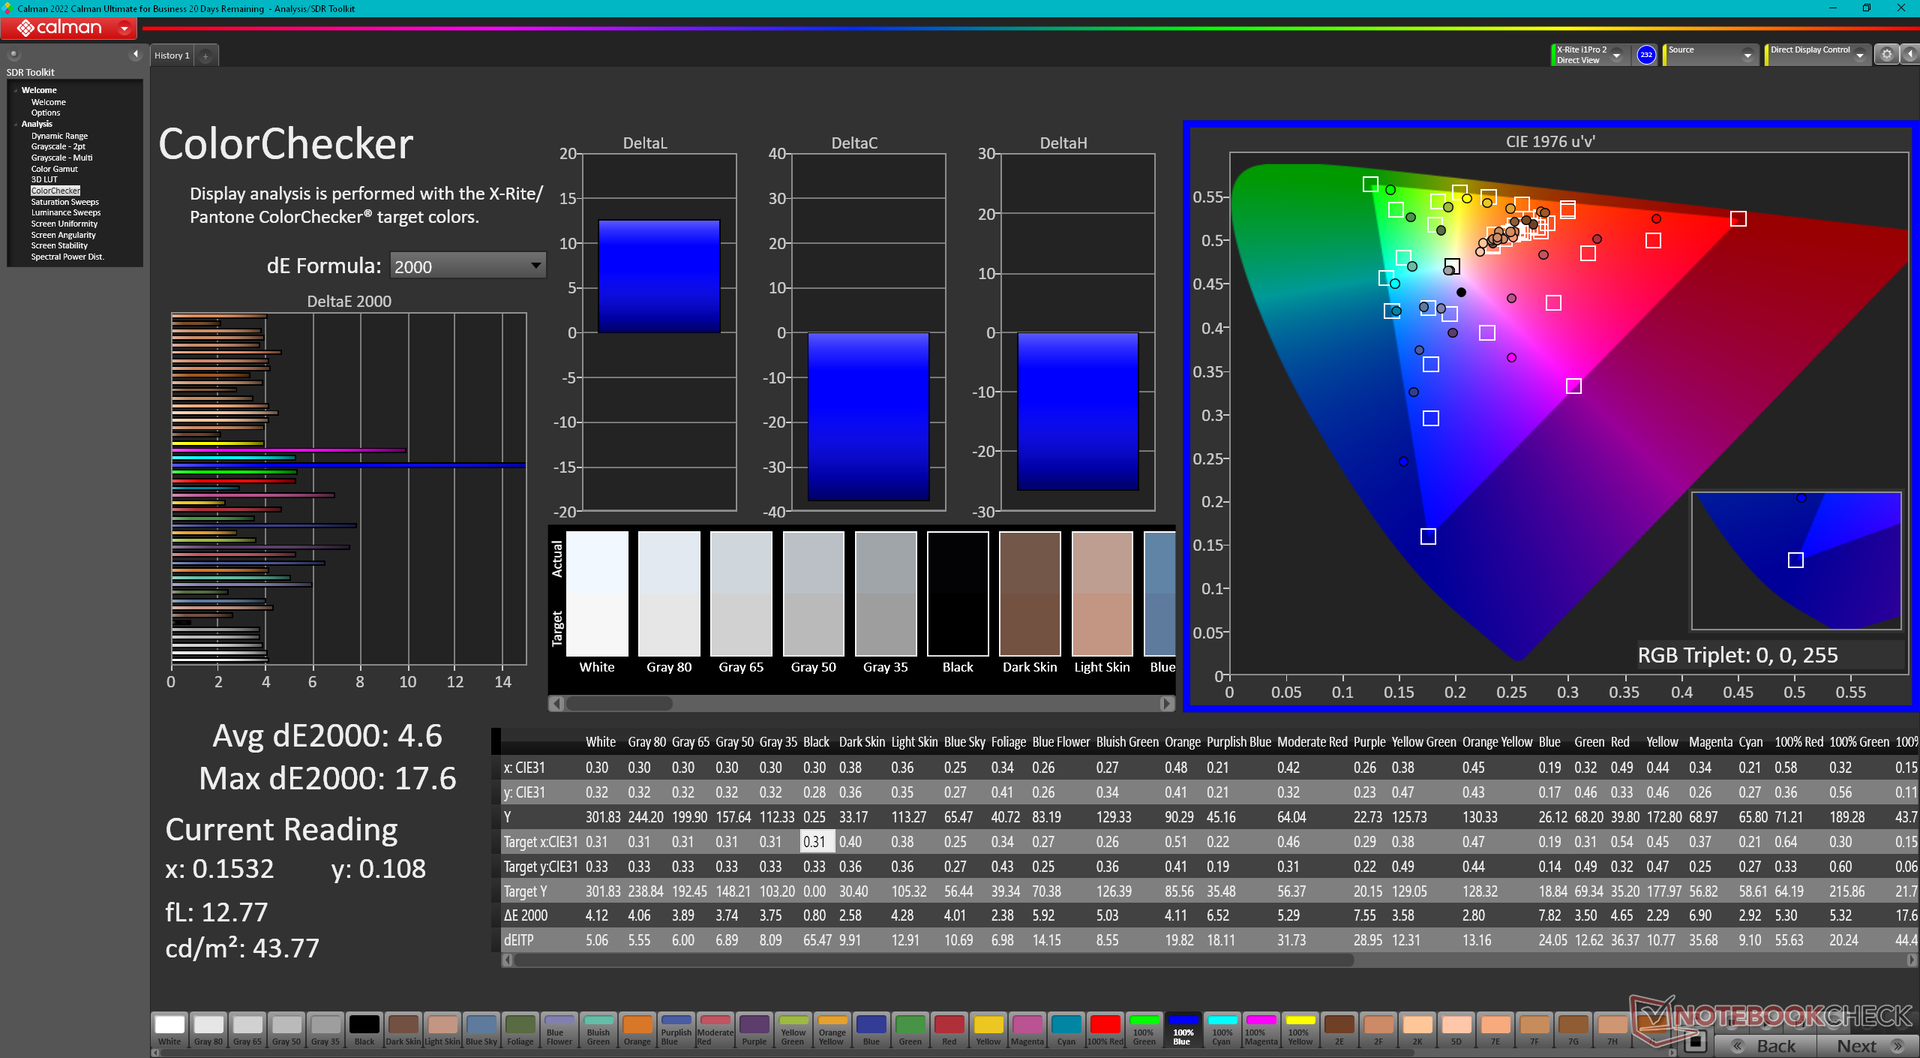
ΔE ColorChecker Calman: 4.6 | ∀{0.5-29.43 Ø4.71}
calibrated: 2.04
ΔE Greyscale Calman: 3.3 | ∀{0.09-98 Ø4.96}
43% AdobeRGB 1998 (Argyll 3D)
62.2% sRGB (Argyll 3D)
41.6% Display P3 (Argyll 3D)
Gamma: 2.09
CCT: 7151 K
| MSI Raider GE68HX 13VF Chi Mei N160JME-GTK, IPS, 1900x1200, 16" | MSI GE67 HX 12UGS Samsung ATNA562P02-0, OLED, 1920x1080, 15.6" | HP Omen 16-xf0376ng BOE0B81, IPS, 1920x1080, 16.1" | Alienware m16 R1 AMD BOE NE16NZ4, IPS, 2560x1600, 16" | Lenovo Legion Slim 7i 16 Gen 8 CSOT T3 MNG007DA2-3, IPS, 2560x1600, 16" | Asus ROG Zephyrus M16 GU604VY-NM042X BOE0B74 (NE160QDM-NM4, IPS, 2560x1600, 16" | |
|---|---|---|---|---|---|---|
| Display | 64% | 67% | 102% | 66% | 103% | |
| Display P3 Coverage (%) | 41.6 | 71.7 72% | 72.1 73% | 98.6 137% | 70.4 69% | 99.33 139% |
| sRGB Coverage (%) | 62.2 | 89.7 44% | 99.6 60% | 99.9 61% | 99.4 60% | 99.9 61% |
| AdobeRGB 1998 Coverage (%) | 43 | 75.2 75% | 72.3 68% | 88.9 107% | 72.5 69% | 90.01 109% |
| Response Times | 99% | 50% | 67% | 47% | -108% | |
| Response Time Grey 50% / Grey 80% * (ms) | 17.3 ? | 0.25 ? 99% | 12.3 ? 29% | 5.1 ? 71% | 12 ? 31% | 50.8 ? -194% |
| Response Time Black / White * (ms) | 24.2 ? | 0.4 ? 98% | 7.2 ? 70% | 9 ? 63% | 8.9 ? 63% | 29.6 ? -22% |
| PWM Frequency (Hz) | 480.4 ? | 12000 | ||||
| Screen | 17% | 10% | 10% | 34% | 297% | |
| Brightness middle (cd/m²) | 300.9 | 356.1 18% | 350 16% | 329 9% | 474.6 58% | 634 111% |
| Brightness (cd/m²) | 302 | 358 19% | 338 12% | 317 5% | 445 47% | 627 108% |
| Brightness Distribution (%) | 93 | 99 6% | 91 -2% | 89 -4% | 86 -8% | 92 -1% |
| Black Level * (cd/m²) | 0.31 | 0.35 -13% | 0.32 -3% | 0.39 -26% | 0.03 90% | |
| Contrast (:1) | 971 | 1000 3% | 1028 6% | 1217 25% | 21133 2076% | |
| Colorchecker dE 2000 * | 4.6 | 4.83 -5% | 3.29 28% | 3.71 19% | 2.12 54% | 0.89 81% |
| Colorchecker dE 2000 max. * | 17.6 | 7.94 55% | 8.47 52% | 7.23 59% | 4.73 73% | 1.79 90% |
| Colorchecker dE 2000 calibrated * | 2.04 | 2.23 -9% | 2.82 -38% | 0.57 72% | 0.91 55% | |
| Greyscale dE 2000 * | 3.3 | 3.1 6% | 3.2 3% | 2.2 33% | 2.8 15% | 1.13 66% |
| Gamma | 2.09 105% | 2.2 100% | 2.131 103% | 2.3 96% | 2.22 99% | 2.47 89% |
| CCT | 7151 91% | 5938 109% | 6317 103% | 6270 104% | 6542 99% | 6497 100% |
| Totaal Gemiddelde (Programma / Instellingen) | 60% /
44% | 42% /
28% | 60% /
38% | 49% /
43% | 97% /
198% |
* ... kleiner is beter
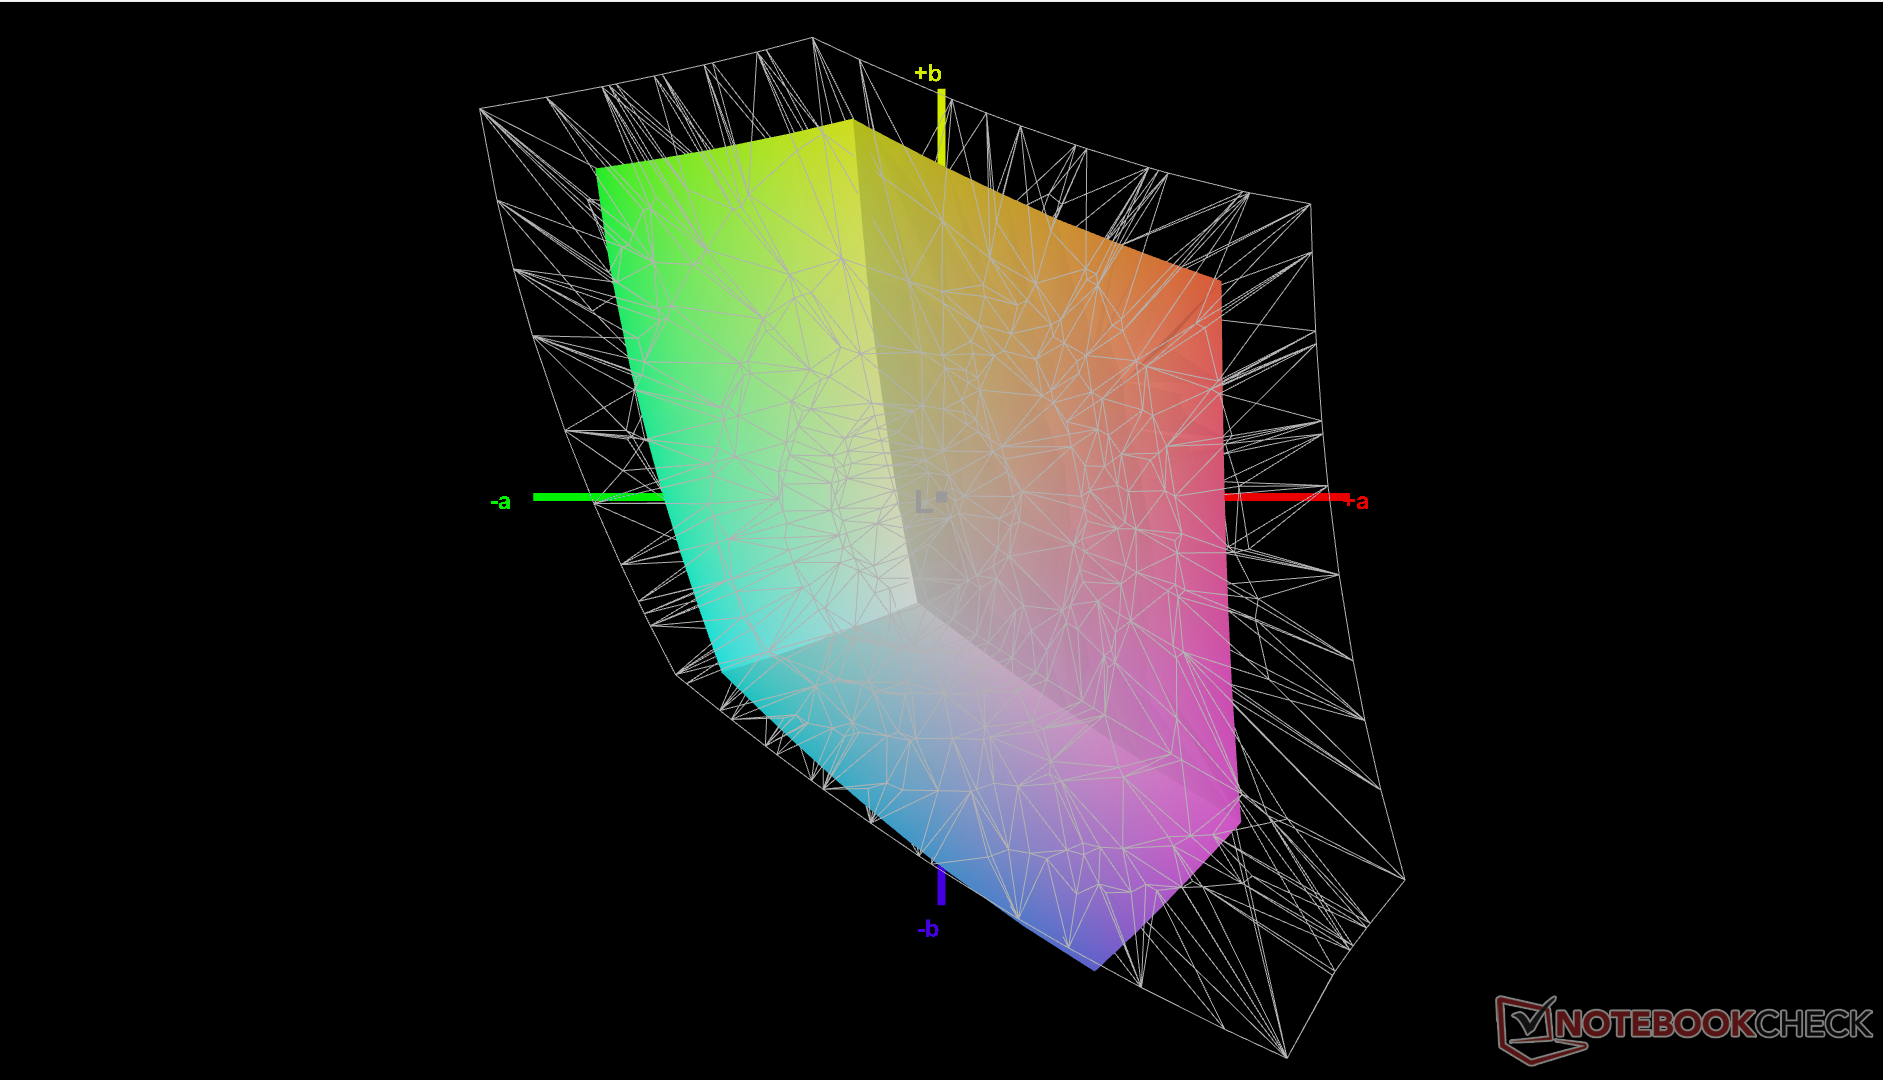
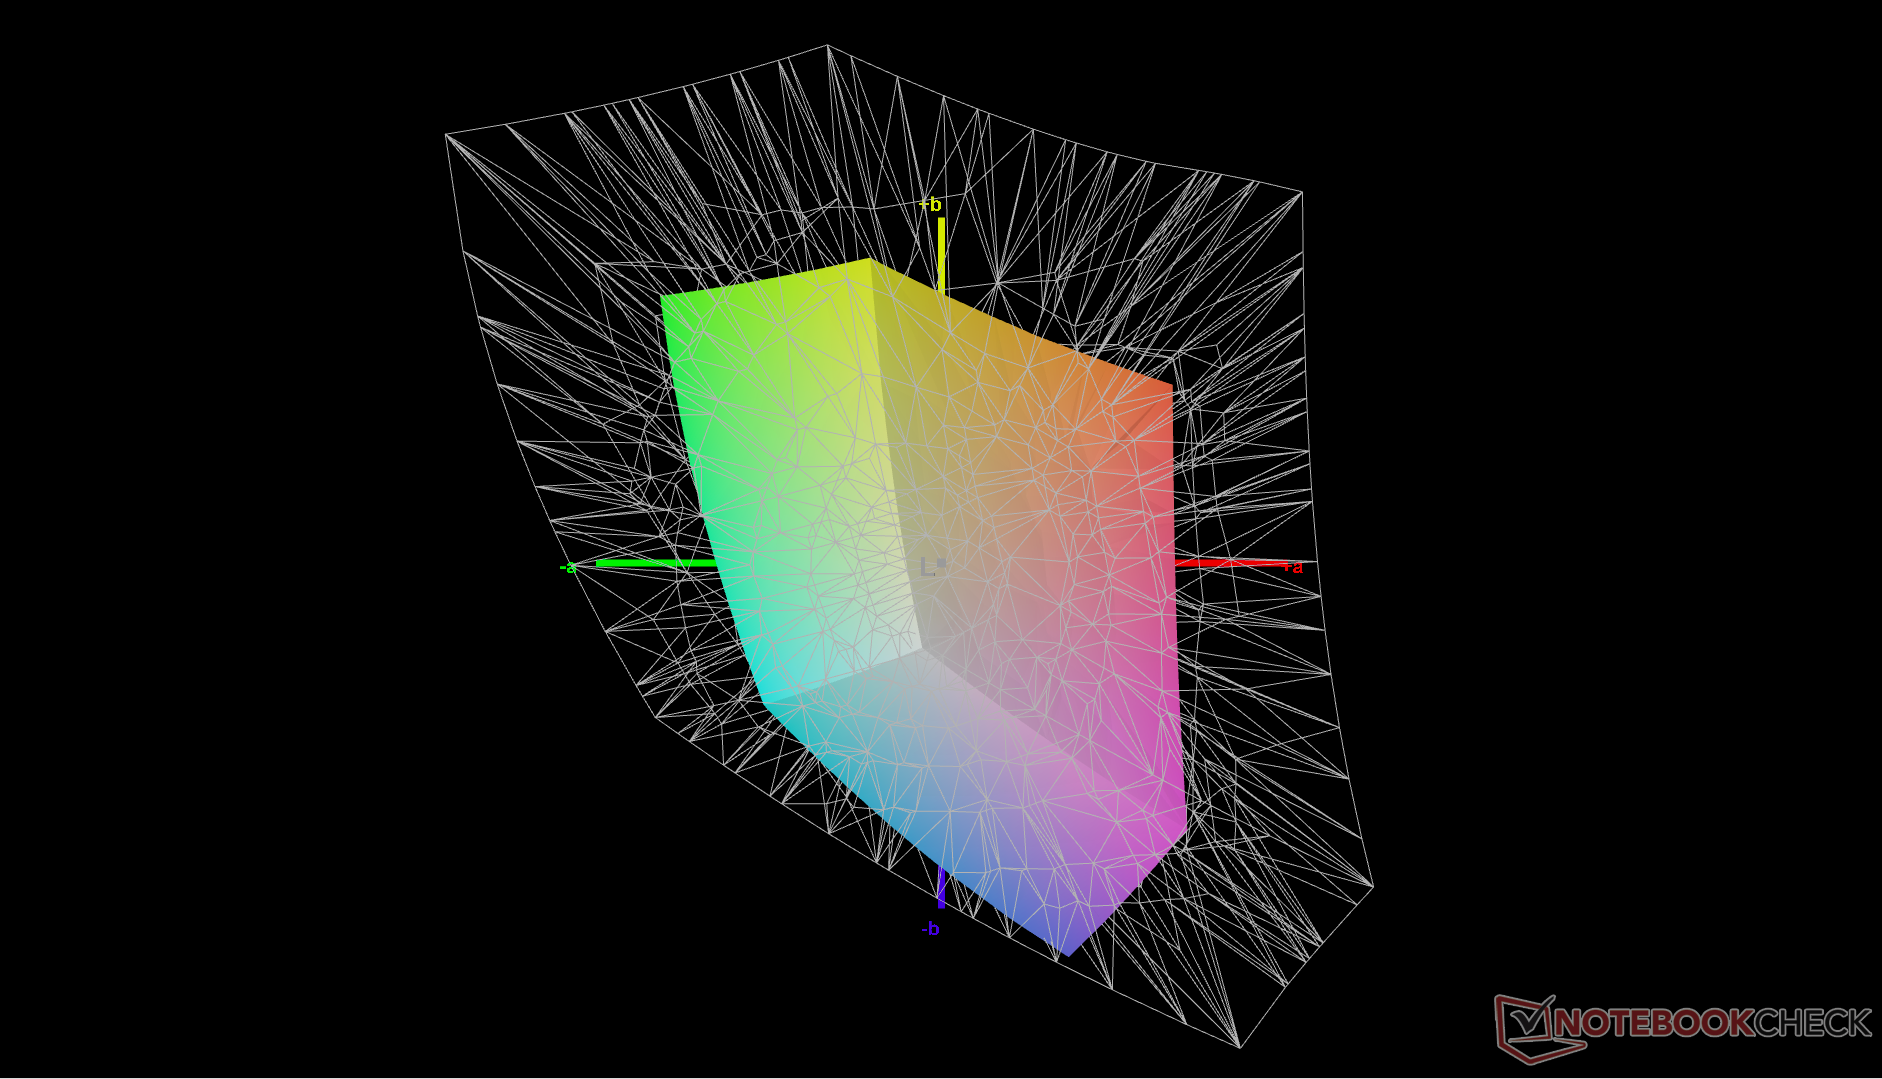
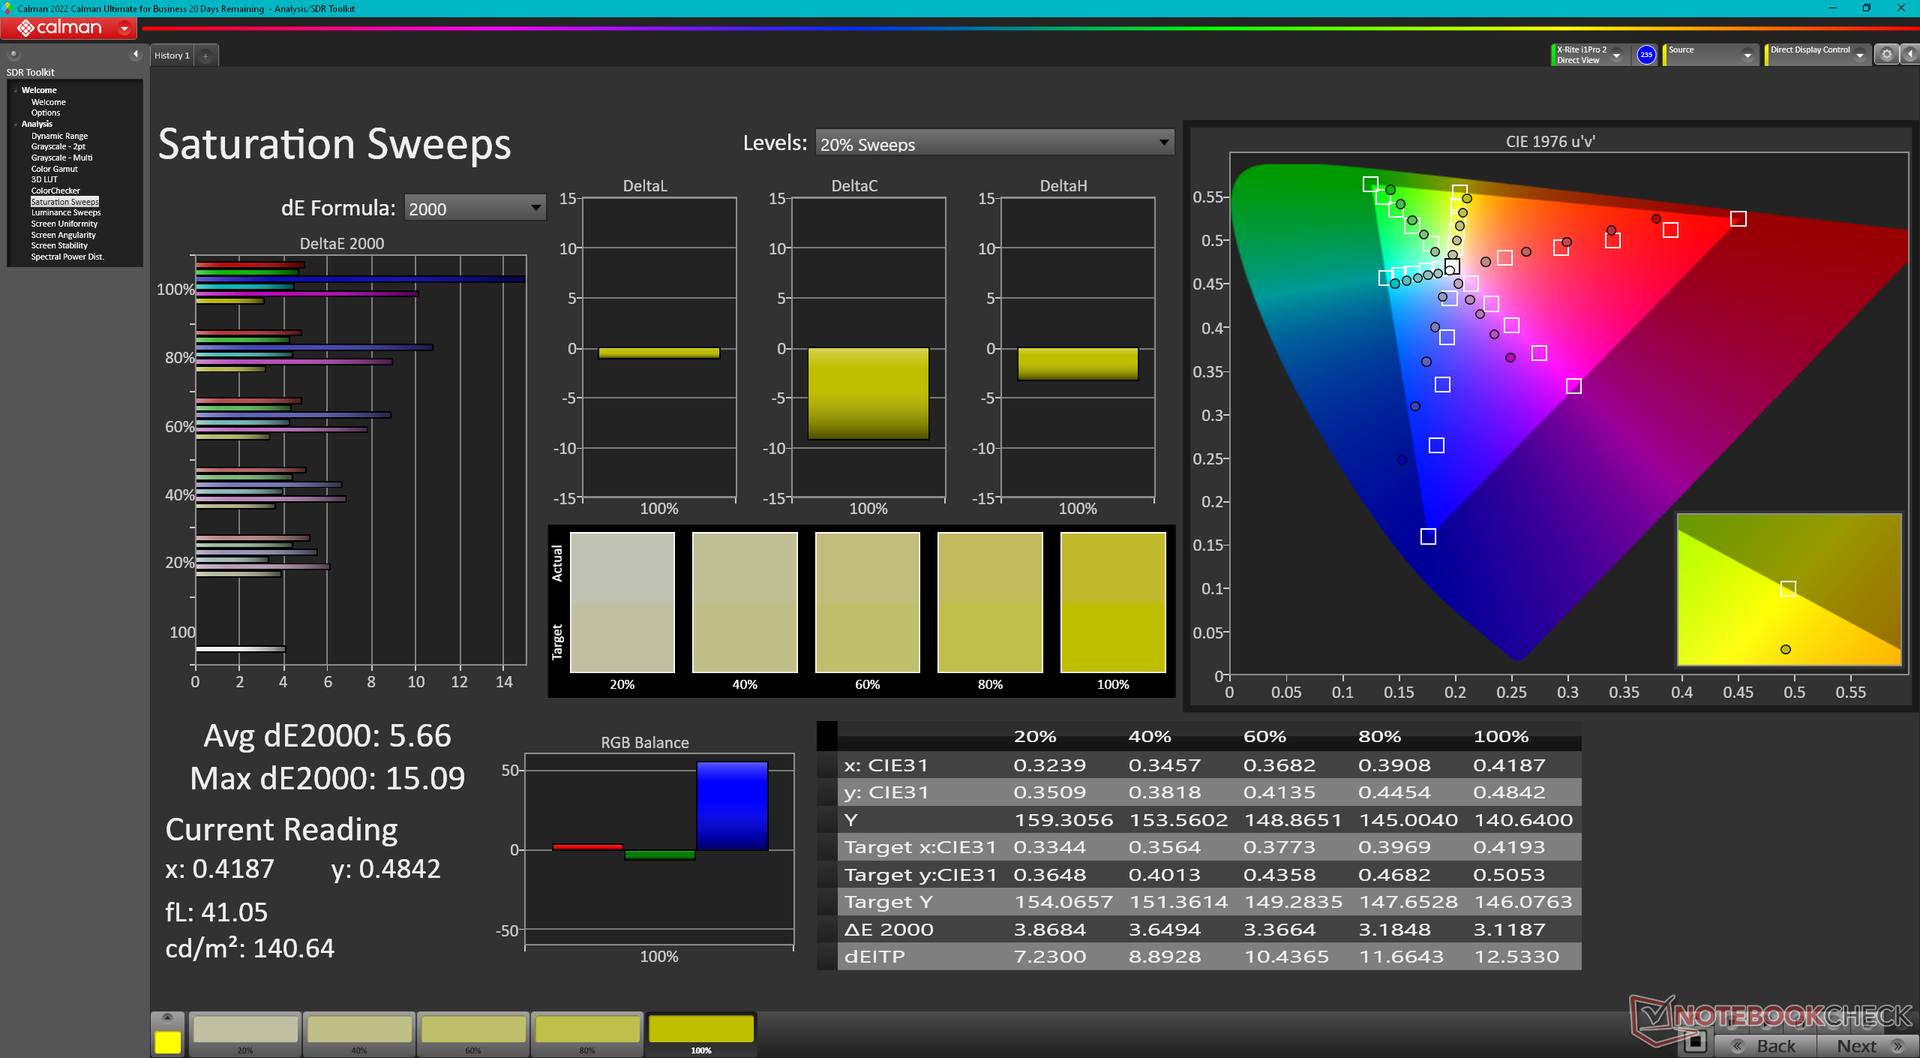
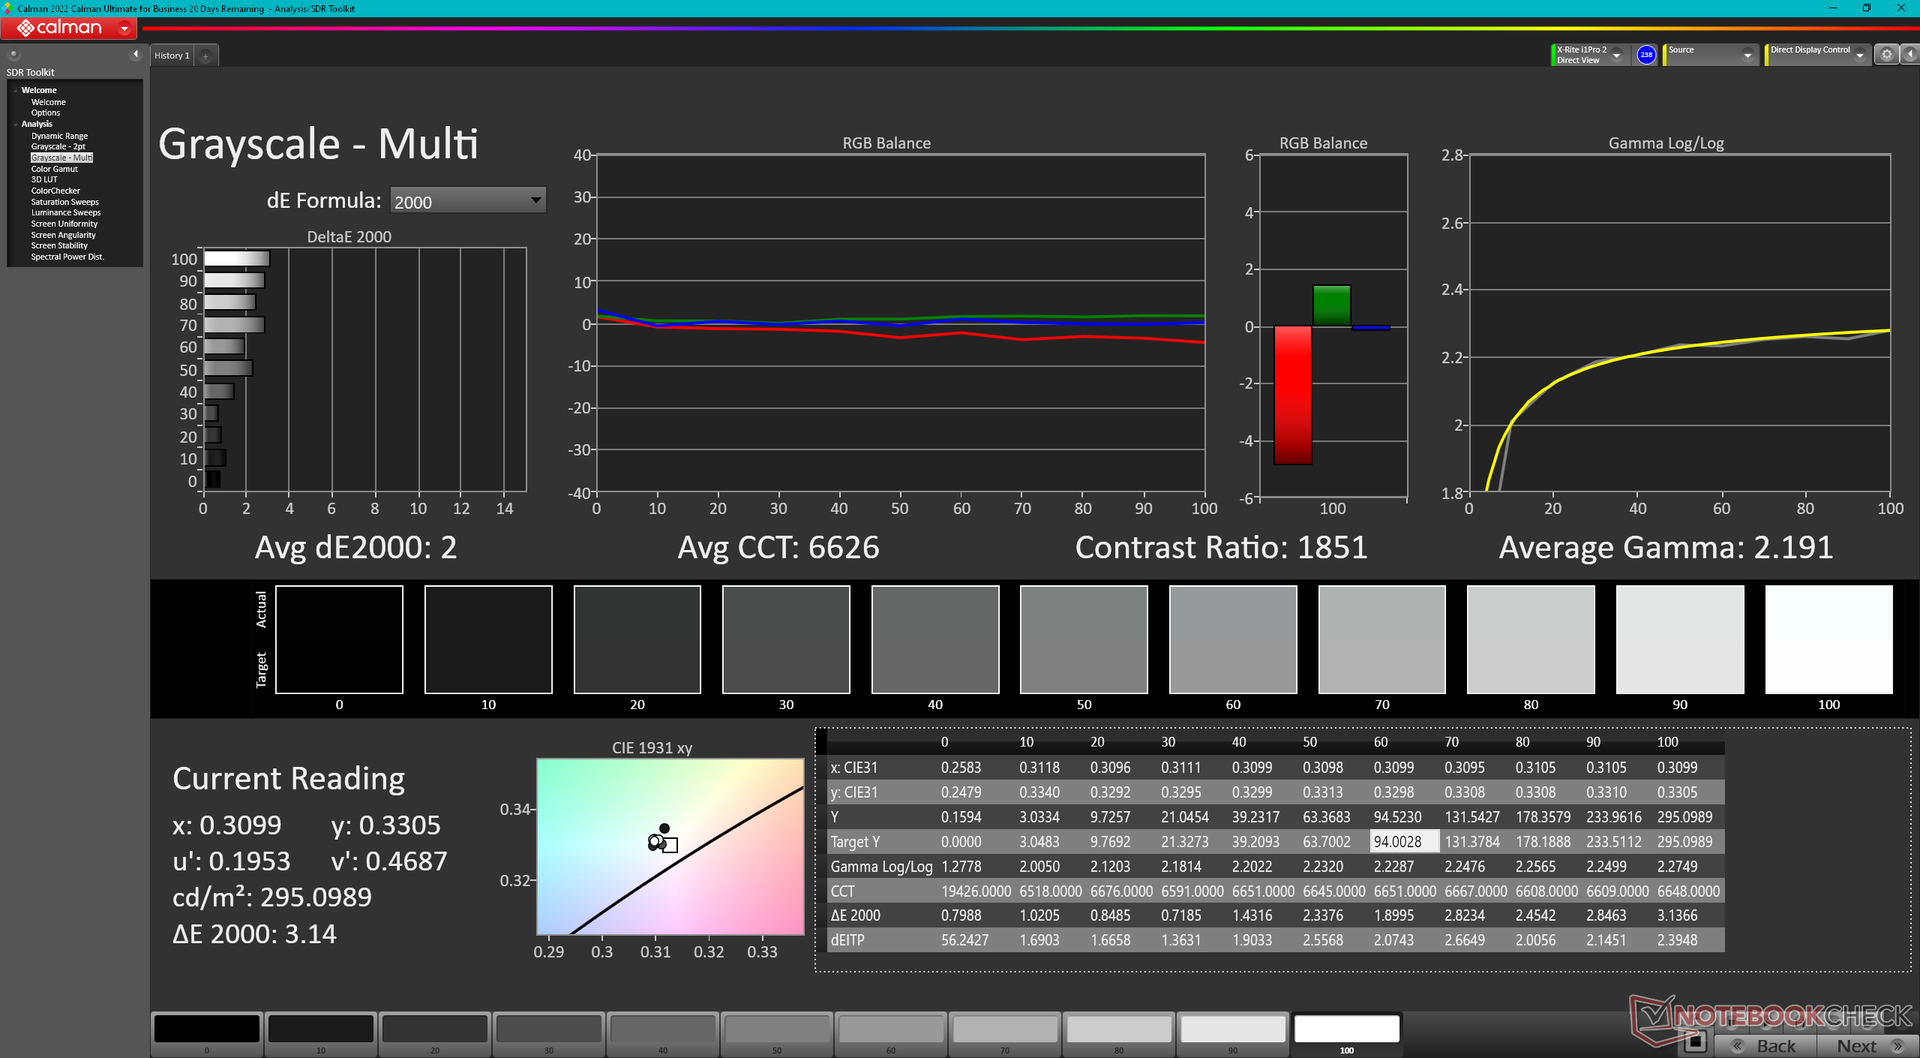
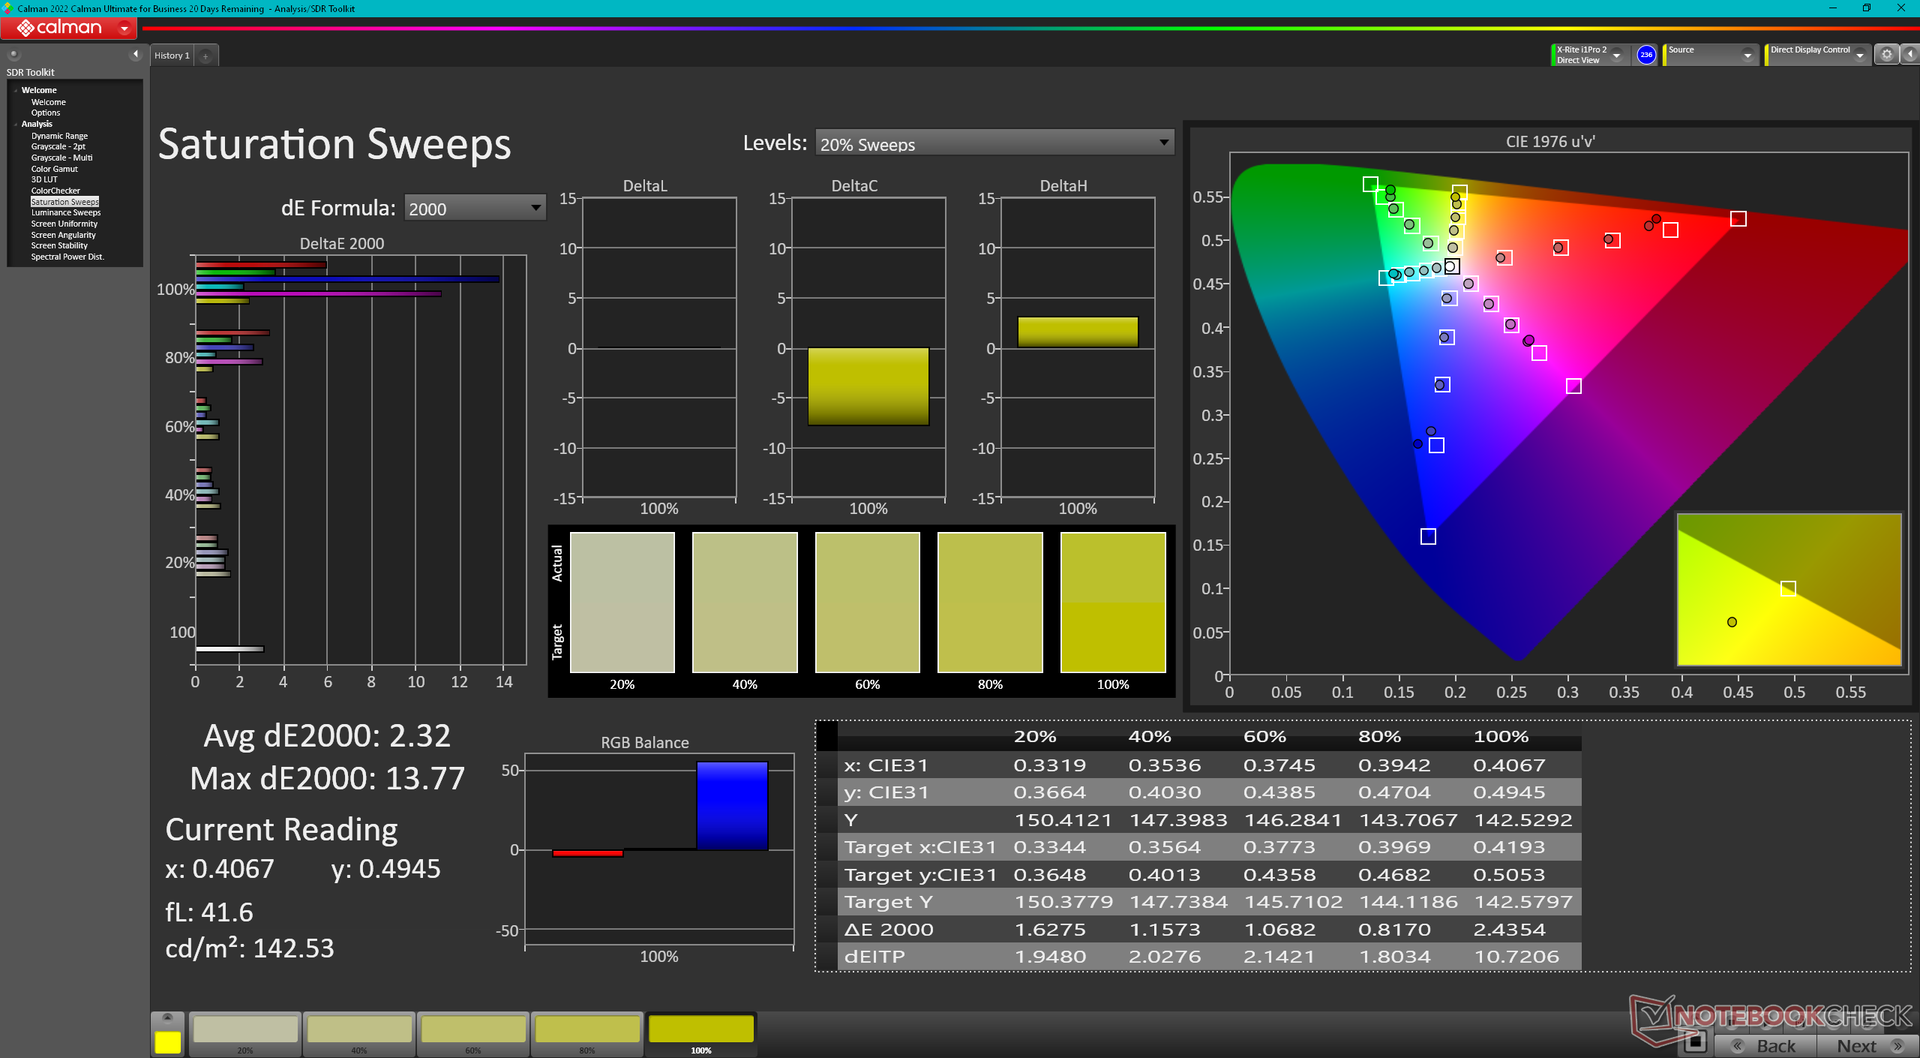
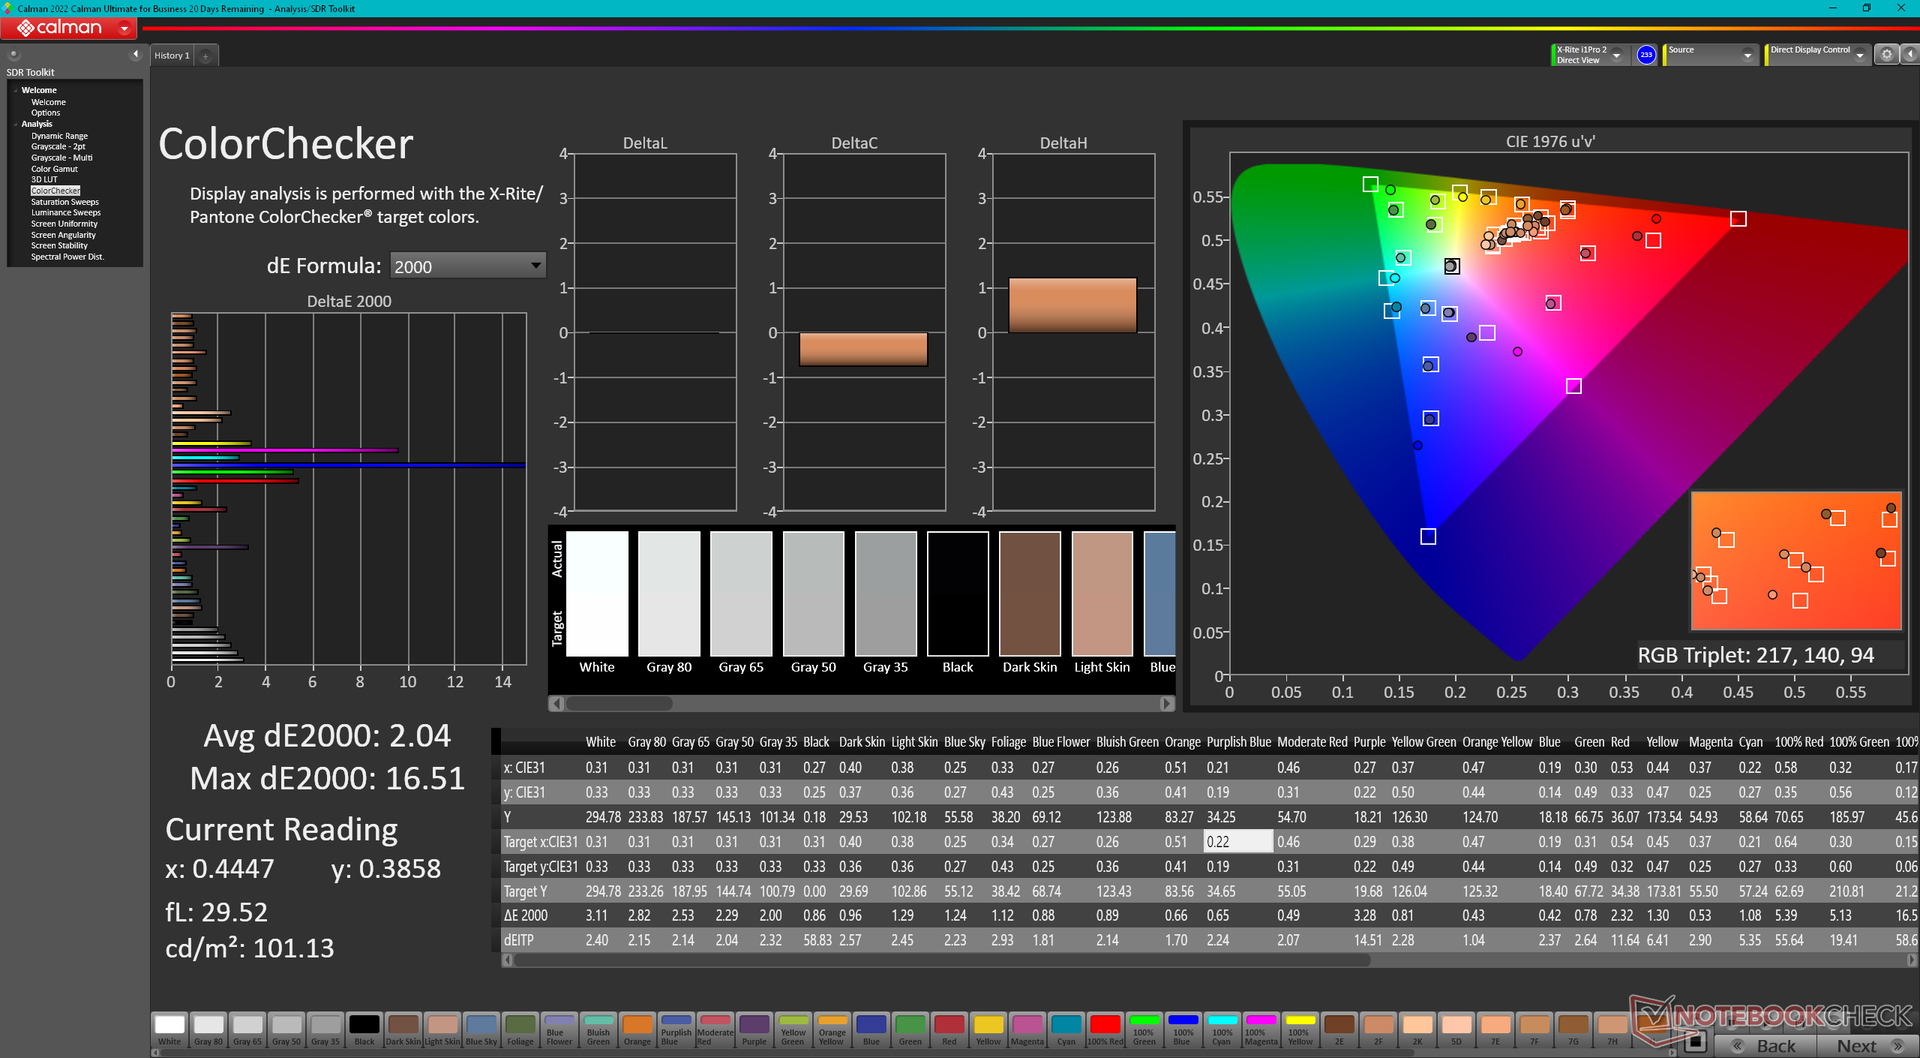
Het scherm is niet voorgekalibreerd, maar de gemiddelde kleurnauwkeurigheid is al met al niet slecht. Door het paneel zelf te kalibreren met een X-Rite colorimeter zouden de gemiddelde grijswaarden en DeltaE-waarden voor kleuren verbeteren van respectievelijk 3,3 en 4,6 tot slechts 2 en 2,04. Bij hogere verzadigingsniveaus worden kleuren nog steeds steeds onnauwkeuriger. Kleuren worden nog steeds steeds onnauwkeuriger bij hogere verzadigingsniveaus, ongeacht hoe vaak je het paneel kalibreert vanwege de beperkte kleurruimte van het paneel. Blauw is misschien wel de ergste overtreder, omdat het dan licht violet lijkt. Ons ICM-profiel is hierboven beschikbaar om gratis te downloaden.
Responstijd Scherm
| ↔ Responstijd Zwart naar Wit | ||
|---|---|---|
| 24.2 ms ... stijging ↗ en daling ↘ gecombineerd | ↗ 10.6 ms stijging | 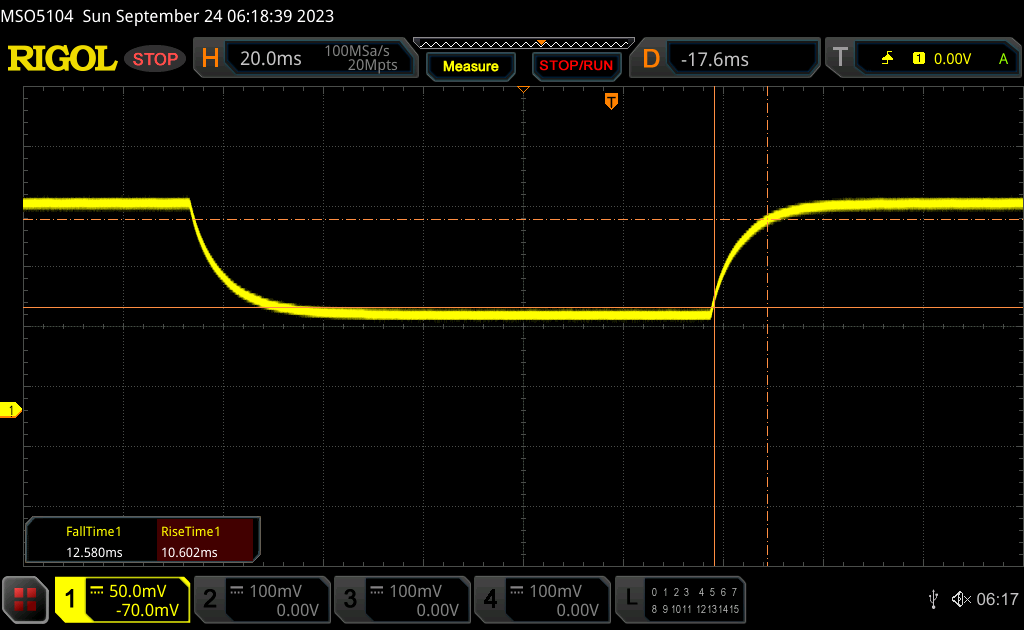 |
| ↘ 12.6 ms daling | ||
| Het scherm vertoonde prima responstijden in onze tests maar is misschien wat te traag voor competitieve games. Ter vergelijking: alle testtoestellen variëren van 0.1 (minimum) tot 240 (maximum) ms. » 57 % van alle toestellen zijn beter. Dit betekent dat de gemeten responstijd slechter is dan het gemiddelde (19.8 ms) van alle geteste toestellen. | ||
| ↔ Responstijd 50% Grijs naar 80% Grijs | ||
| 17.3 ms ... stijging ↗ en daling ↘ gecombineerd | ↗ 9.4 ms stijging | 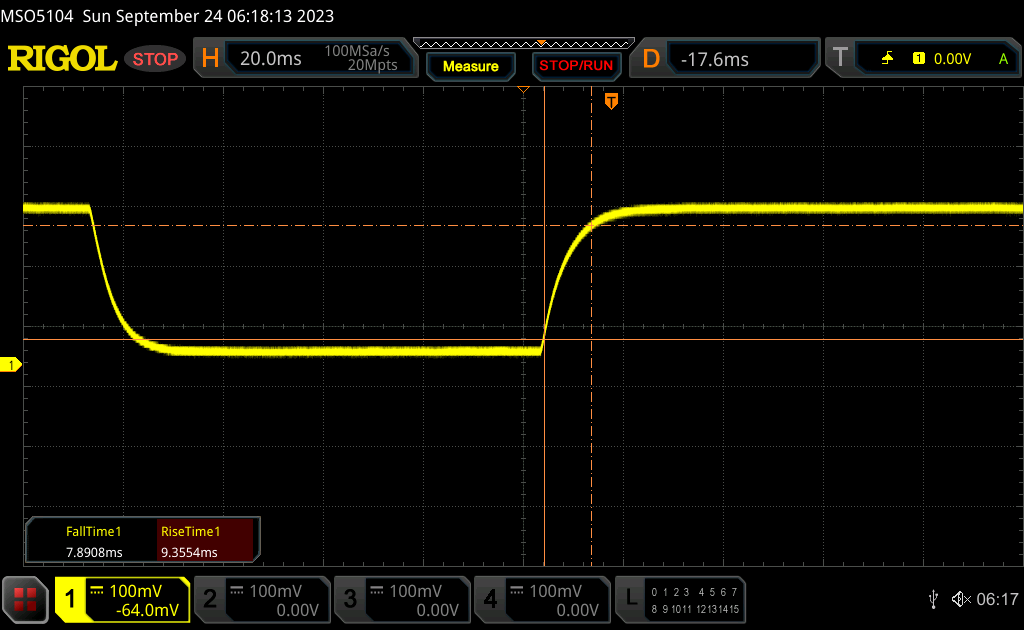 |
| ↘ 7.9 ms daling | ||
| Het scherm vertoonde prima responstijden in onze tests maar is misschien wat te traag voor competitieve games. Ter vergelijking: alle testtoestellen variëren van 0.165 (minimum) tot 636 (maximum) ms. » 32 % van alle toestellen zijn beter. Dit betekent dat de gemeten responstijd beter is dan het gemiddelde (31 ms) van alle geteste toestellen. | ||
Screen Flickering / PWM (Pulse-Width Modulation)
| Screen flickering / PWM niet waargenomen |  | ||
Ter vergelijking: 52 % van alle geteste toestellen maakten geen gebruik van PWM om de schermhelderheid te verlagen. Als het wel werd gebruikt, werd een gemiddelde van 7757 (minimum: 5 - maximum: 343500) Hz waargenomen. | |||
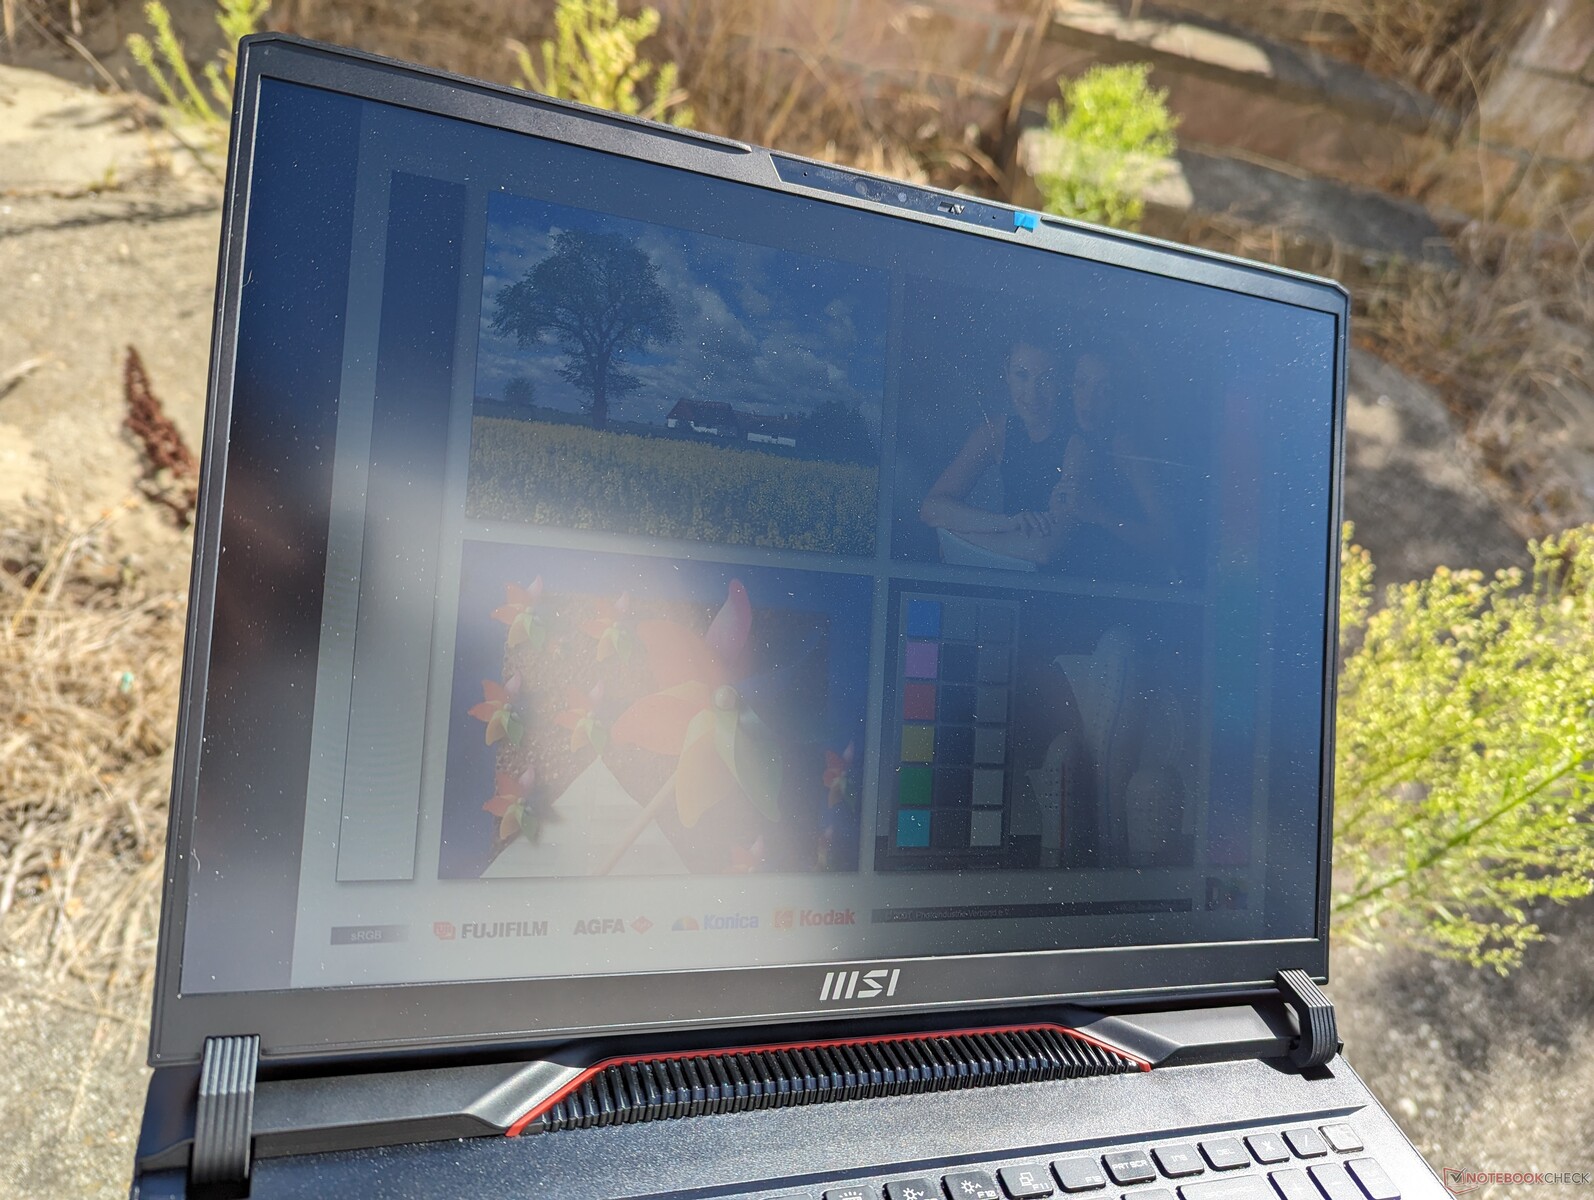
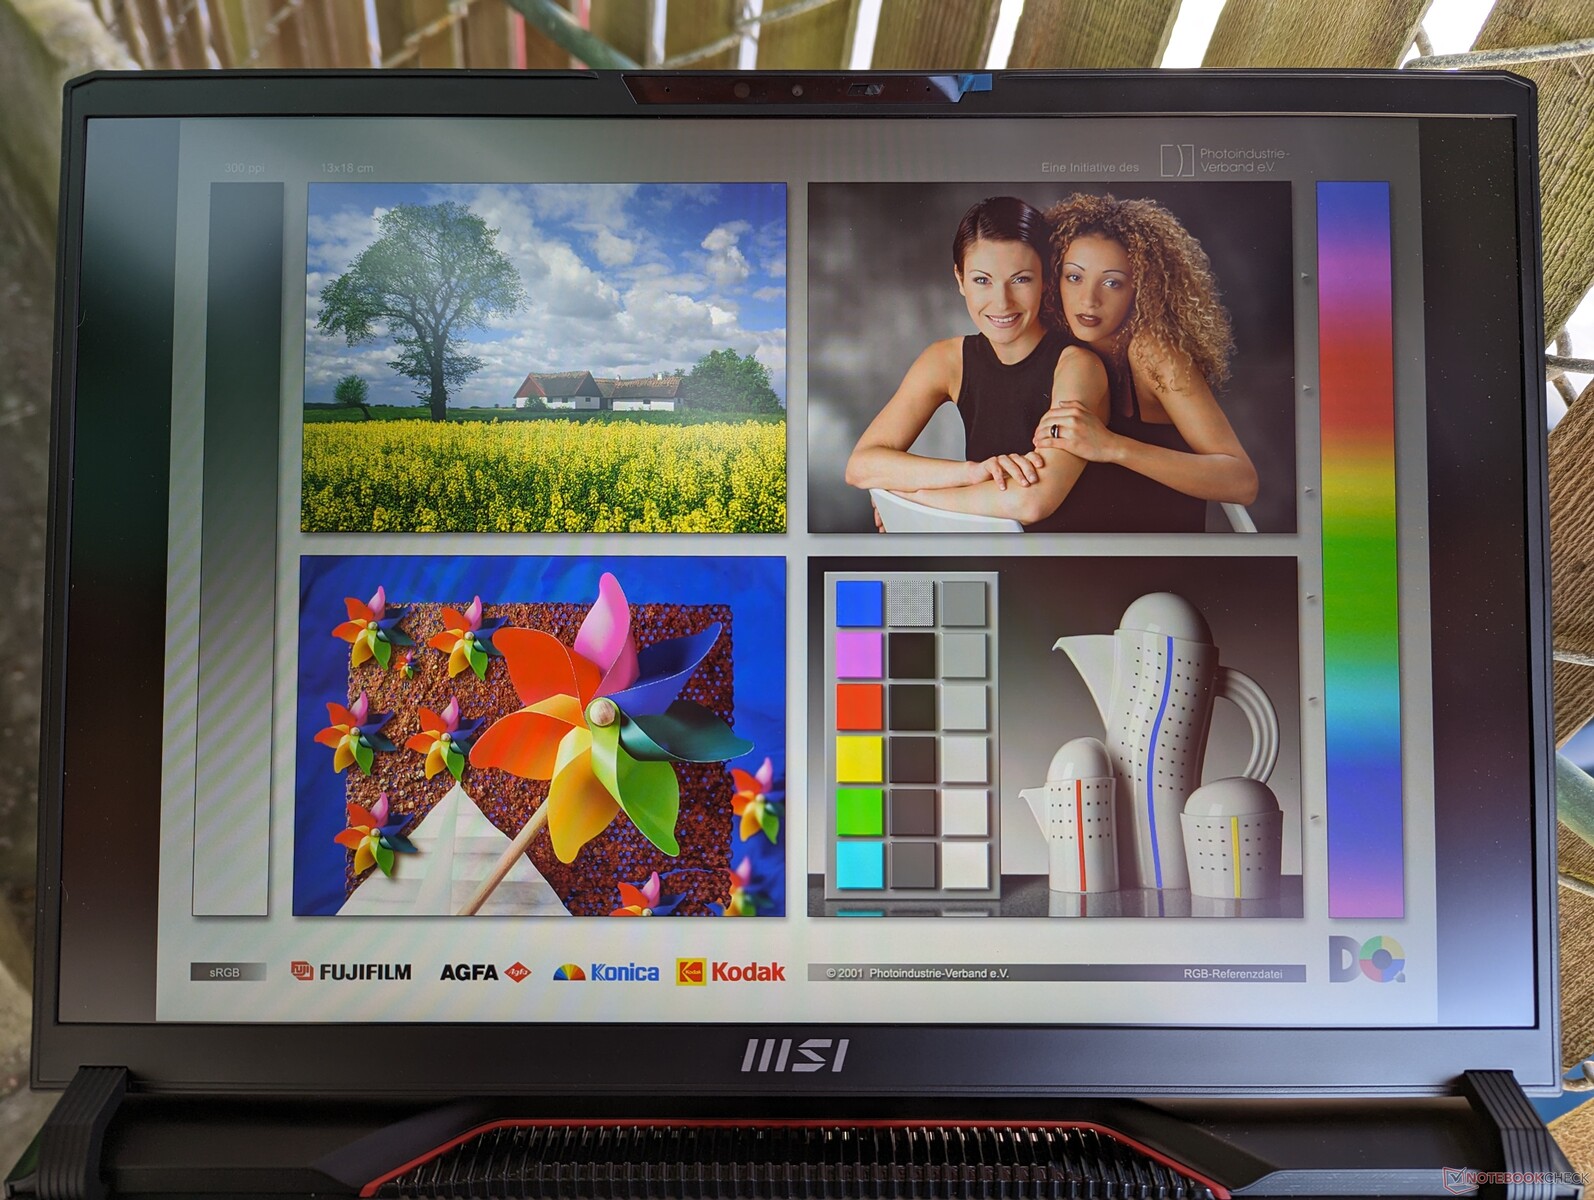
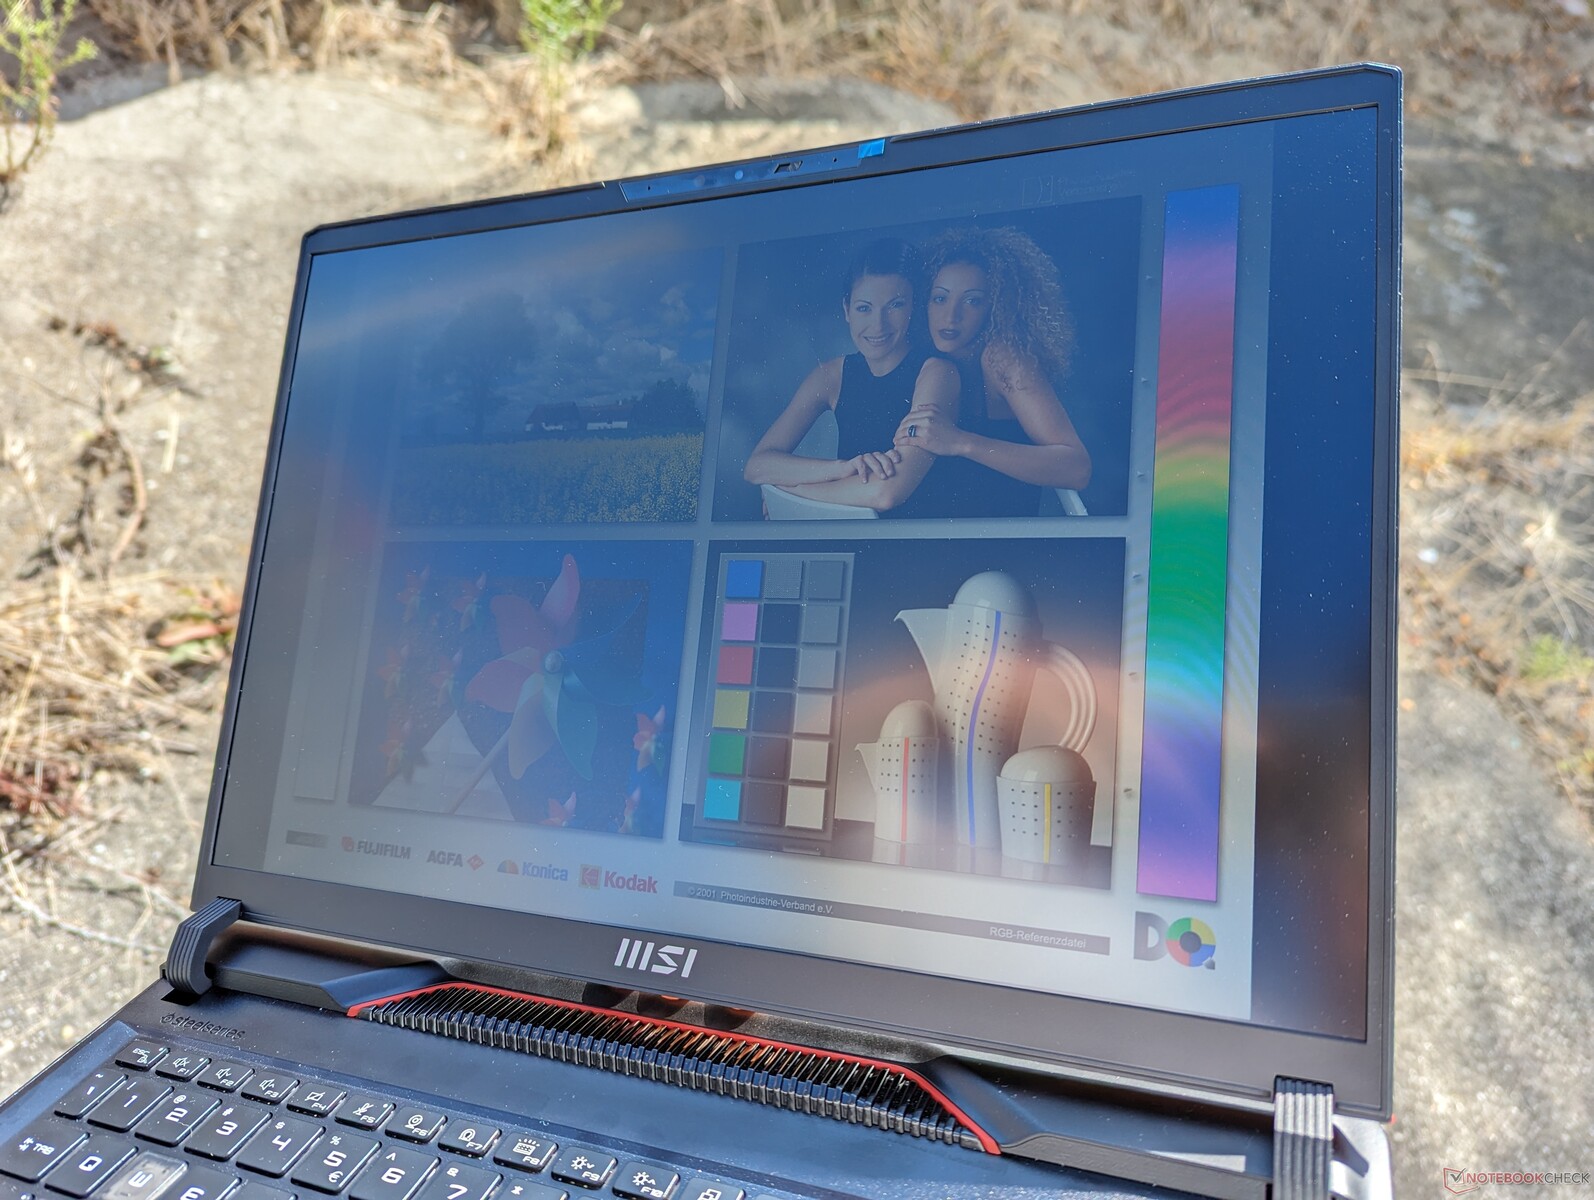
De maximale helderheid van 300 nit is typisch voor de meeste gaming laptops. Direct zonlicht moet worden vermeden, anders worden kleuren uitgewassen. Voor een betere zichtbaarheid buitenshuis kunnen gebruikers de Zephyrus M16 en zijn 2x helderdere scherm overwegen.
Prestaties - Indrukwekkende stijging van jaar tot jaar
Testomstandigheden
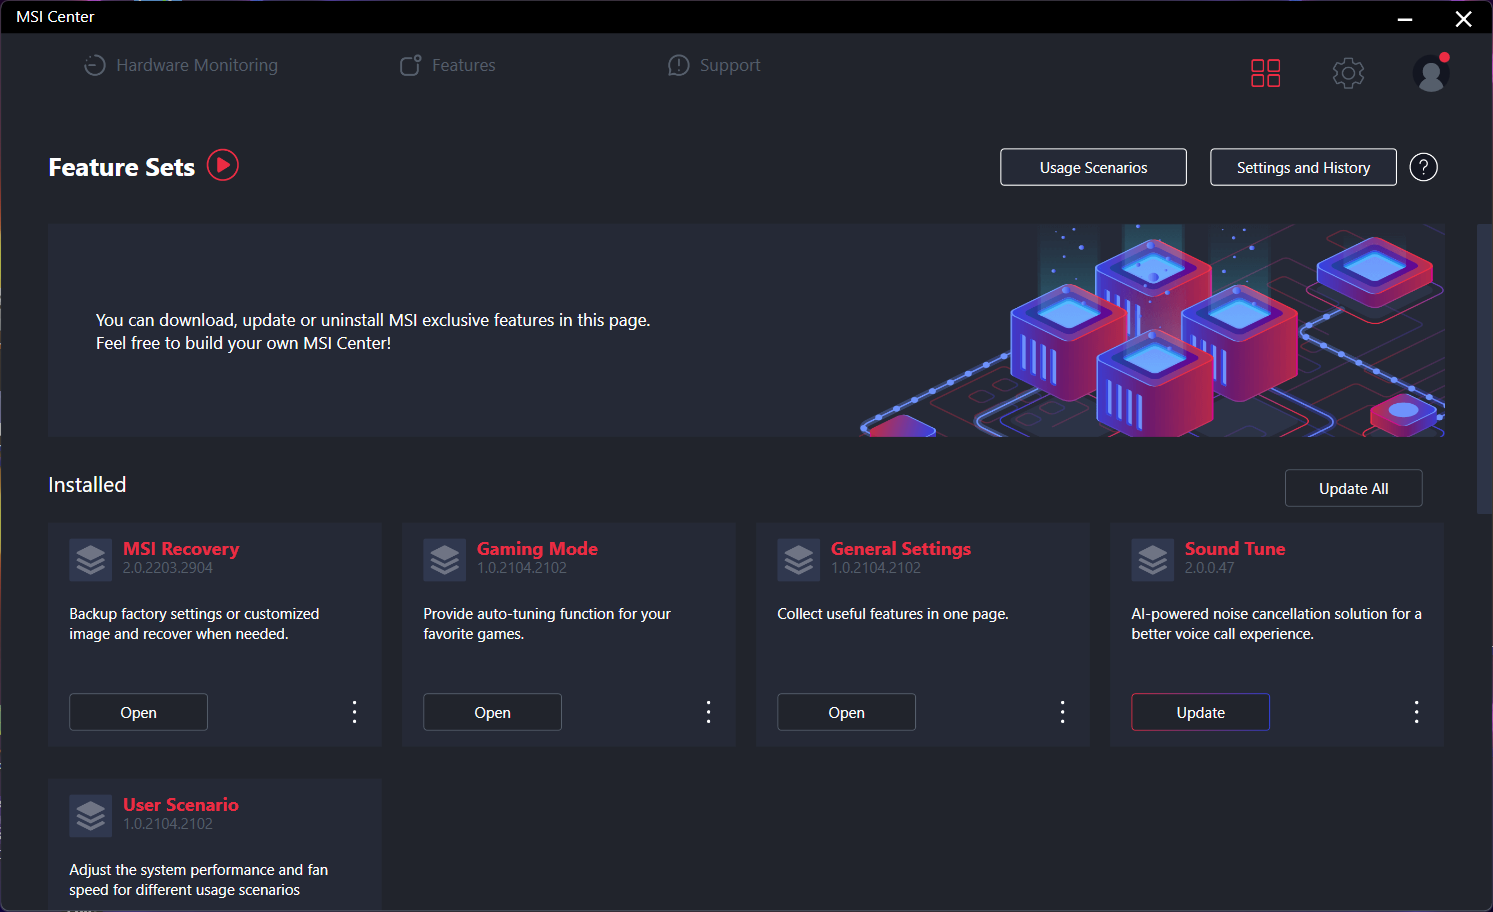
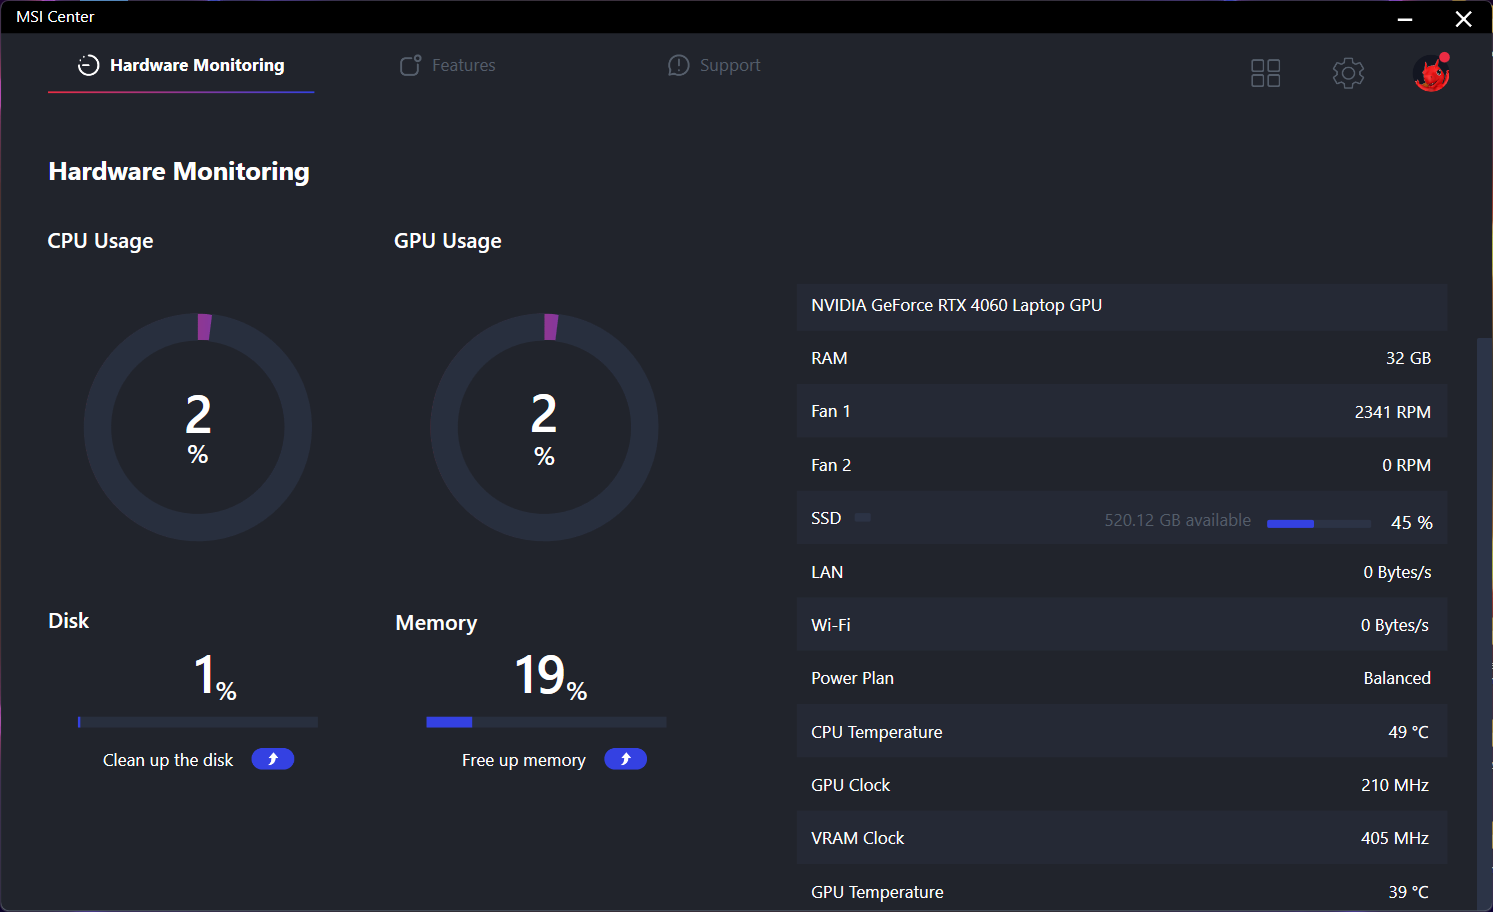
We hebben Windows ingesteld op de modus Prestaties en MSI Center op zowel de modus Extreme prestaties als de modus dGPU voordat we de onderstaande benchmarks uitvoerden. MSI Center is het controlecentrum voor systeemupdates, vitale functies, energieprofielen, GPU-modi en meer. RGB-instellingen worden echter afgehandeld door een aparte app genaamd SteelSeries GG.
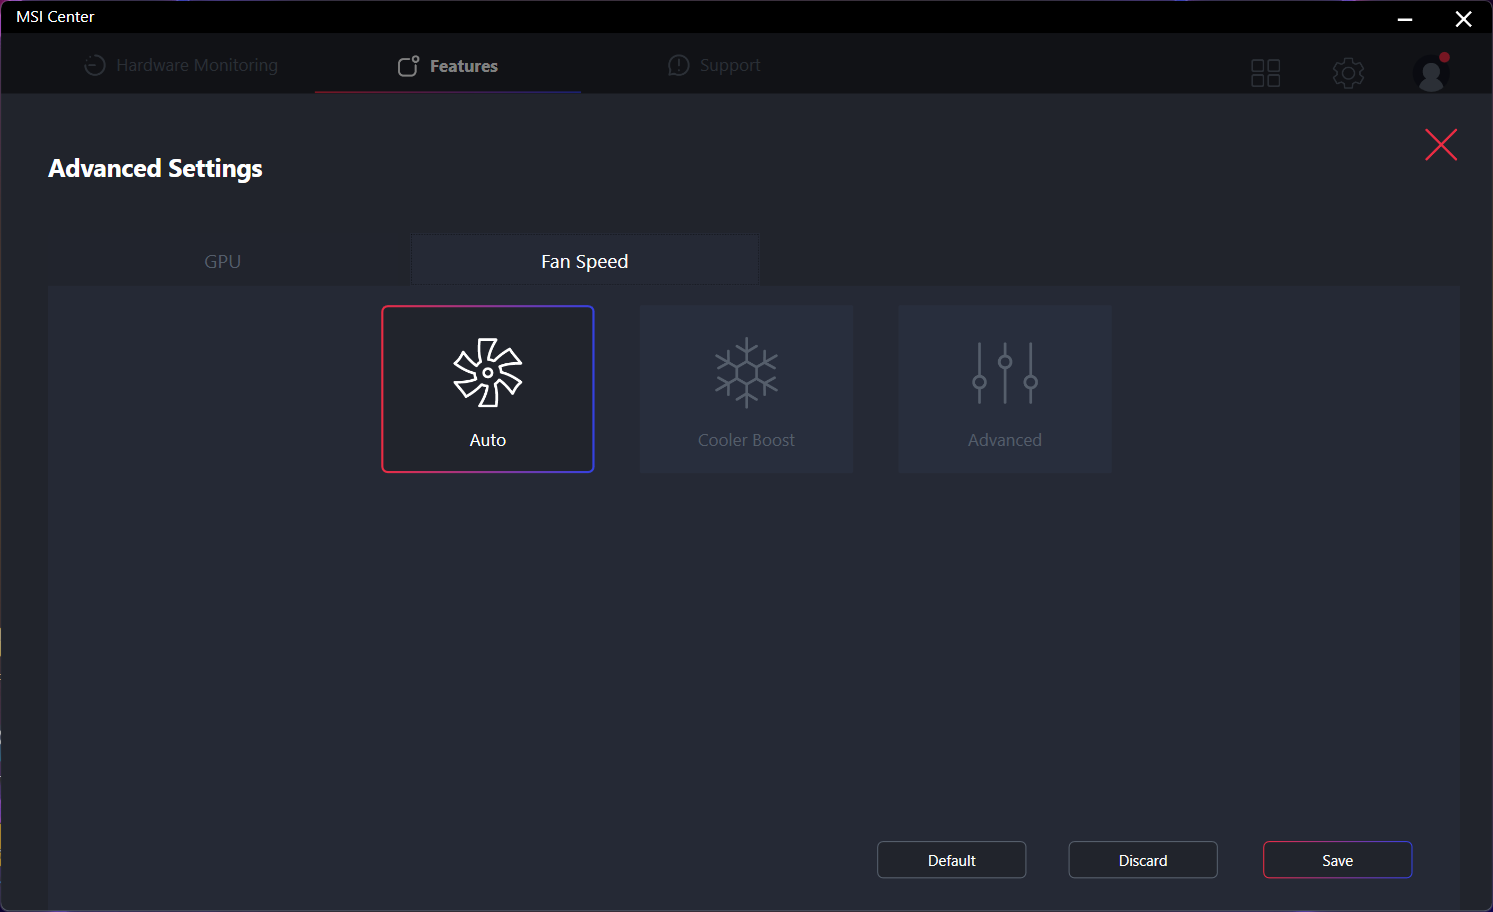
Cooler Boost is een submenu-instelling binnen de modus Extreme prestaties. Als je deze inschakelt, draaien de interne ventilatoren op hun maximale toerental, ongeacht de belasting op het scherm.
De RTX 4060 configuratie ondersteunt MUX maar niet Advanced Optimus, wat betekent dat er een reboot nodig is bij het schakelen tussen dGPU, MSHybrid en iGPU modi.

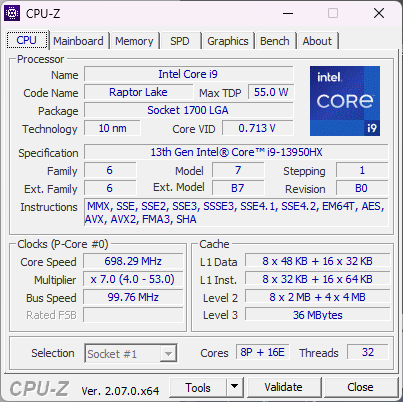
Processor
CPU-prestaties en kloksnelheidstabiliteit zijn uitstekend met resultaten die 5 tot 10 procent sneller zijn dan de gemiddeldeCore i9-13950HX in onze database of bijna 2x sneller dan de Core i7-13700H die vaak wordt aangetroffen op de meeste andere gaming laptops. Dit is een van de snelste mobiele CPU's op de markt op dit moment en hij concurreert met de Zen 4 Ryzen 9 7945HX voor de top drie.
Upgraden naar de duurdere Core i9-13980HX optie zal de prestaties naar verwachting slechts met ongeveer 5 procent verbeteren, gebaseerd op onze ervaringen met de Alienware m18 R1. De voordelen zijn zo marginaal dat we aanraden om het bij de Core i9-13950HX te houden om een paar honderd dollar te besparen.
Cinebench R15 Multi Loop
Cinebench R23: Multi Core | Single Core
Cinebench R20: CPU (Multi Core) | CPU (Single Core)
Cinebench R15: CPU Multi 64Bit | CPU Single 64Bit
Blender: v2.79 BMW27 CPU
7-Zip 18.03: 7z b 4 | 7z b 4 -mmt1
Geekbench 5.5: Multi-Core | Single-Core
HWBOT x265 Benchmark v2.2: 4k Preset
LibreOffice : 20 Documents To PDF
R Benchmark 2.5: Overall mean
* ... kleiner is beter
AIDA64: FP32 Ray-Trace | FPU Julia | CPU SHA3 | CPU Queen | FPU SinJulia | FPU Mandel | CPU AES | CPU ZLib | FP64 Ray-Trace | CPU PhotoWorxx
| Performance rating | |
| Alienware m16 R1 AMD | |
| MSI Raider GE68HX 13VF | |
| Gemiddeld Intel Core i9-13950HX | |
| HP Omen 16-xf0376ng | |
| Asus ROG Zephyrus M16 GU604VY-NM042X | |
| Lenovo Legion Slim 7i 16 Gen 8 | |
| MSI GE67 HX 12UGS | |
| AIDA64 / FP32 Ray-Trace | |
| Alienware m16 R1 AMD | |
| MSI Raider GE68HX 13VF | |
| HP Omen 16-xf0376ng | |
| Gemiddeld Intel Core i9-13950HX (17993 - 28957, n=9) | |
| Asus ROG Zephyrus M16 GU604VY-NM042X | |
| Lenovo Legion Slim 7i 16 Gen 8 | |
| MSI GE67 HX 12UGS | |
| AIDA64 / FPU Julia | |
| Alienware m16 R1 AMD | |
| MSI Raider GE68HX 13VF | |
| Gemiddeld Intel Core i9-13950HX (89362 - 144303, n=9) | |
| HP Omen 16-xf0376ng | |
| Asus ROG Zephyrus M16 GU604VY-NM042X | |
| Lenovo Legion Slim 7i 16 Gen 8 | |
| MSI GE67 HX 12UGS | |
| AIDA64 / CPU SHA3 | |
| Alienware m16 R1 AMD | |
| MSI Raider GE68HX 13VF | |
| Gemiddeld Intel Core i9-13950HX (4518 - 7093, n=9) | |
| HP Omen 16-xf0376ng | |
| Asus ROG Zephyrus M16 GU604VY-NM042X | |
| MSI GE67 HX 12UGS | |
| Lenovo Legion Slim 7i 16 Gen 8 | |
| AIDA64 / CPU Queen | |
| Alienware m16 R1 AMD | |
| MSI Raider GE68HX 13VF | |
| Gemiddeld Intel Core i9-13950HX (131931 - 140103, n=8) | |
| Lenovo Legion Slim 7i 16 Gen 8 | |
| Asus ROG Zephyrus M16 GU604VY-NM042X | |
| HP Omen 16-xf0376ng | |
| MSI GE67 HX 12UGS | |
| AIDA64 / FPU SinJulia | |
| Alienware m16 R1 AMD | |
| MSI Raider GE68HX 13VF | |
| HP Omen 16-xf0376ng | |
| Gemiddeld Intel Core i9-13950HX (12318 - 17057, n=9) | |
| MSI GE67 HX 12UGS | |
| Asus ROG Zephyrus M16 GU604VY-NM042X | |
| Lenovo Legion Slim 7i 16 Gen 8 | |
| AIDA64 / FPU Mandel | |
| Alienware m16 R1 AMD | |
| MSI Raider GE68HX 13VF | |
| HP Omen 16-xf0376ng | |
| Gemiddeld Intel Core i9-13950HX (44372 - 71038, n=9) | |
| Asus ROG Zephyrus M16 GU604VY-NM042X | |
| Lenovo Legion Slim 7i 16 Gen 8 | |
| MSI GE67 HX 12UGS | |
| AIDA64 / CPU AES | |
| Gemiddeld Intel Core i9-13950HX (99981 - 204491, n=9) | |
| MSI Raider GE68HX 13VF | |
| MSI GE67 HX 12UGS | |
| Alienware m16 R1 AMD | |
| Asus ROG Zephyrus M16 GU604VY-NM042X | |
| Lenovo Legion Slim 7i 16 Gen 8 | |
| HP Omen 16-xf0376ng | |
| AIDA64 / CPU ZLib | |
| MSI Raider GE68HX 13VF | |
| Alienware m16 R1 AMD | |
| Gemiddeld Intel Core i9-13950HX (1263 - 2069, n=9) | |
| MSI GE67 HX 12UGS | |
| Lenovo Legion Slim 7i 16 Gen 8 | |
| Asus ROG Zephyrus M16 GU604VY-NM042X | |
| HP Omen 16-xf0376ng | |
| AIDA64 / FP64 Ray-Trace | |
| Alienware m16 R1 AMD | |
| MSI Raider GE68HX 13VF | |
| HP Omen 16-xf0376ng | |
| Gemiddeld Intel Core i9-13950HX (9649 - 15573, n=9) | |
| Asus ROG Zephyrus M16 GU604VY-NM042X | |
| Lenovo Legion Slim 7i 16 Gen 8 | |
| MSI GE67 HX 12UGS | |
| AIDA64 / CPU PhotoWorxx | |
| MSI Raider GE68HX 13VF | |
| Asus ROG Zephyrus M16 GU604VY-NM042X | |
| Gemiddeld Intel Core i9-13950HX (40233 - 50864, n=9) | |
| HP Omen 16-xf0376ng | |
| MSI GE67 HX 12UGS | |
| Alienware m16 R1 AMD | |
| Lenovo Legion Slim 7i 16 Gen 8 | |
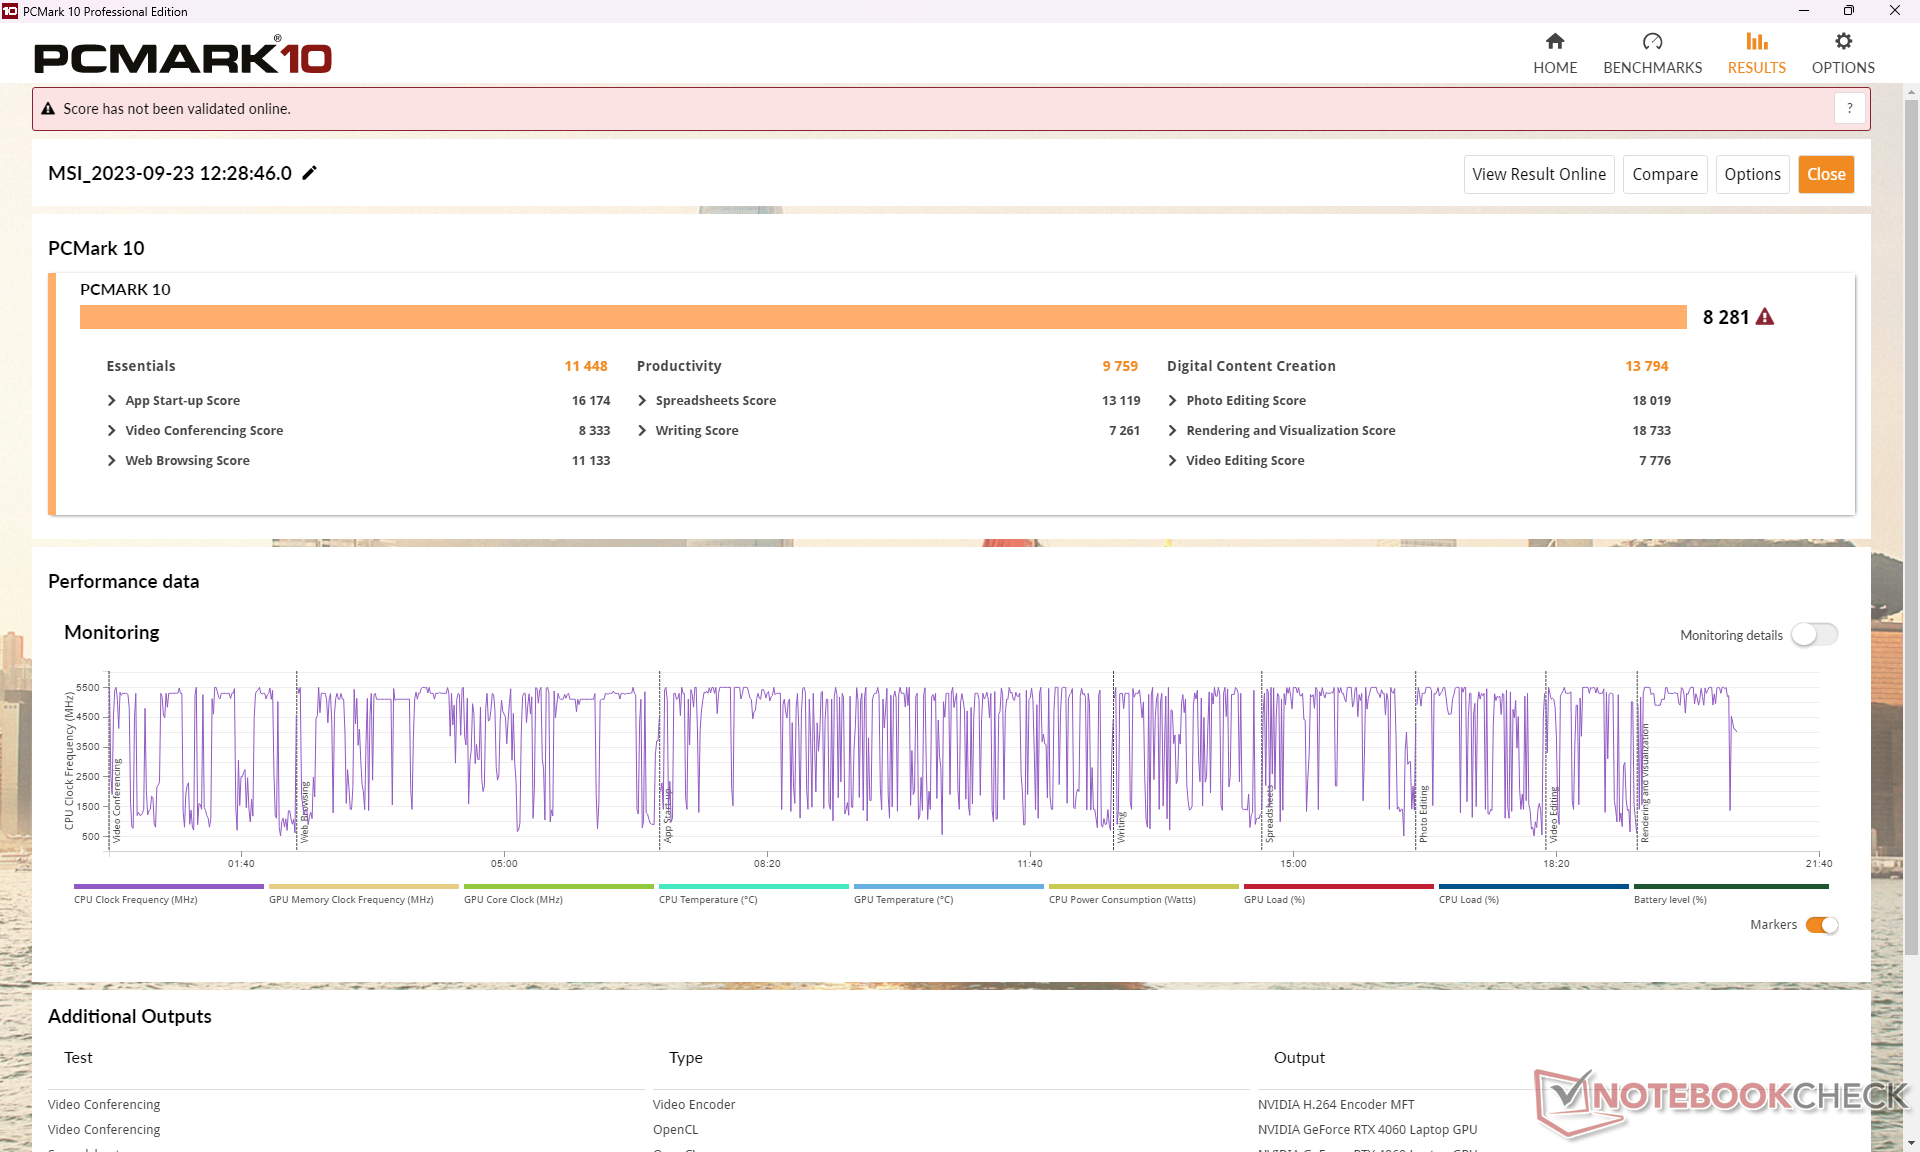
Systeemprestaties
PCMark-benchmarks zijn vergelijkbaar met andere 16-inch gaminglaptops zoals de Alienware m16 R1 of Lenovo Legion Slim 7i 16 met slechts een paar procentpunten. We hebben tijdens het testen geen problemen ondervonden met ontwaken uit de slaapstand of andere noemenswaardige problemen met onze testunit.
CrossMark: Overall | Productivity | Creativity | Responsiveness
| PCMark 10 / Score | |
| Alienware m16 R1 AMD | |
| Lenovo Legion Slim 7i 16 Gen 8 | |
| MSI Raider GE68HX 13VF | |
| Gemiddeld Intel Core i9-13950HX, NVIDIA GeForce RTX 4060 Laptop GPU (n=1) | |
| Asus ROG Zephyrus M16 GU604VY-NM042X | |
| HP Omen 16-xf0376ng | |
| MSI GE67 HX 12UGS | |
| PCMark 10 / Essentials | |
| Asus ROG Zephyrus M16 GU604VY-NM042X | |
| Alienware m16 R1 AMD | |
| MSI Raider GE68HX 13VF | |
| Gemiddeld Intel Core i9-13950HX, NVIDIA GeForce RTX 4060 Laptop GPU (n=1) | |
| Lenovo Legion Slim 7i 16 Gen 8 | |
| HP Omen 16-xf0376ng | |
| MSI GE67 HX 12UGS | |
| PCMark 10 / Productivity | |
| Asus ROG Zephyrus M16 GU604VY-NM042X | |
| Lenovo Legion Slim 7i 16 Gen 8 | |
| Alienware m16 R1 AMD | |
| HP Omen 16-xf0376ng | |
| MSI GE67 HX 12UGS | |
| MSI Raider GE68HX 13VF | |
| Gemiddeld Intel Core i9-13950HX, NVIDIA GeForce RTX 4060 Laptop GPU (n=1) | |
| PCMark 10 / Digital Content Creation | |
| Alienware m16 R1 AMD | |
| MSI Raider GE68HX 13VF | |
| Gemiddeld Intel Core i9-13950HX, NVIDIA GeForce RTX 4060 Laptop GPU (n=1) | |
| Lenovo Legion Slim 7i 16 Gen 8 | |
| HP Omen 16-xf0376ng | |
| MSI GE67 HX 12UGS | |
| Asus ROG Zephyrus M16 GU604VY-NM042X | |
| CrossMark / Overall | |
| Alienware m16 R1 AMD | |
| Lenovo Legion Slim 7i 16 Gen 8 | |
| MSI GE67 HX 12UGS | |
| Asus ROG Zephyrus M16 GU604VY-NM042X | |
| MSI Raider GE68HX 13VF | |
| Gemiddeld Intel Core i9-13950HX, NVIDIA GeForce RTX 4060 Laptop GPU (n=1) | |
| CrossMark / Productivity | |
| Lenovo Legion Slim 7i 16 Gen 8 | |
| Alienware m16 R1 AMD | |
| MSI GE67 HX 12UGS | |
| Asus ROG Zephyrus M16 GU604VY-NM042X | |
| MSI Raider GE68HX 13VF | |
| Gemiddeld Intel Core i9-13950HX, NVIDIA GeForce RTX 4060 Laptop GPU (n=1) | |
| CrossMark / Creativity | |
| MSI Raider GE68HX 13VF | |
| Gemiddeld Intel Core i9-13950HX, NVIDIA GeForce RTX 4060 Laptop GPU (n=1) | |
| Asus ROG Zephyrus M16 GU604VY-NM042X | |
| Alienware m16 R1 AMD | |
| MSI GE67 HX 12UGS | |
| Lenovo Legion Slim 7i 16 Gen 8 | |
| CrossMark / Responsiveness | |
| MSI GE67 HX 12UGS | |
| Lenovo Legion Slim 7i 16 Gen 8 | |
| Alienware m16 R1 AMD | |
| Asus ROG Zephyrus M16 GU604VY-NM042X | |
| MSI Raider GE68HX 13VF | |
| Gemiddeld Intel Core i9-13950HX, NVIDIA GeForce RTX 4060 Laptop GPU (n=1) | |
| PCMark 10 Score | 8281 punten | |
Help | ||
| AIDA64 / Memory Copy | |
| MSI Raider GE68HX 13VF | |
| Gemiddeld Intel Core i9-13950HX (61938 - 78813, n=9) | |
| Asus ROG Zephyrus M16 GU604VY-NM042X | |
| HP Omen 16-xf0376ng | |
| MSI GE67 HX 12UGS | |
| Alienware m16 R1 AMD | |
| Lenovo Legion Slim 7i 16 Gen 8 | |
| AIDA64 / Memory Read | |
| MSI Raider GE68HX 13VF | |
| Gemiddeld Intel Core i9-13950HX (62368 - 86831, n=9) | |
| Asus ROG Zephyrus M16 GU604VY-NM042X | |
| HP Omen 16-xf0376ng | |
| MSI GE67 HX 12UGS | |
| Alienware m16 R1 AMD | |
| Lenovo Legion Slim 7i 16 Gen 8 | |
| AIDA64 / Memory Write | |
| HP Omen 16-xf0376ng | |
| MSI Raider GE68HX 13VF | |
| Gemiddeld Intel Core i9-13950HX (59501 - 80441, n=9) | |
| Asus ROG Zephyrus M16 GU604VY-NM042X | |
| MSI GE67 HX 12UGS | |
| Alienware m16 R1 AMD | |
| Lenovo Legion Slim 7i 16 Gen 8 | |
| AIDA64 / Memory Latency | |
| MSI GE67 HX 12UGS | |
| Alienware m16 R1 AMD | |
| HP Omen 16-xf0376ng | |
| Gemiddeld Intel Core i9-13950HX (84.4 - 99.5, n=9) | |
| Asus ROG Zephyrus M16 GU604VY-NM042X | |
| MSI Raider GE68HX 13VF | |
| Lenovo Legion Slim 7i 16 Gen 8 | |
* ... kleiner is beter
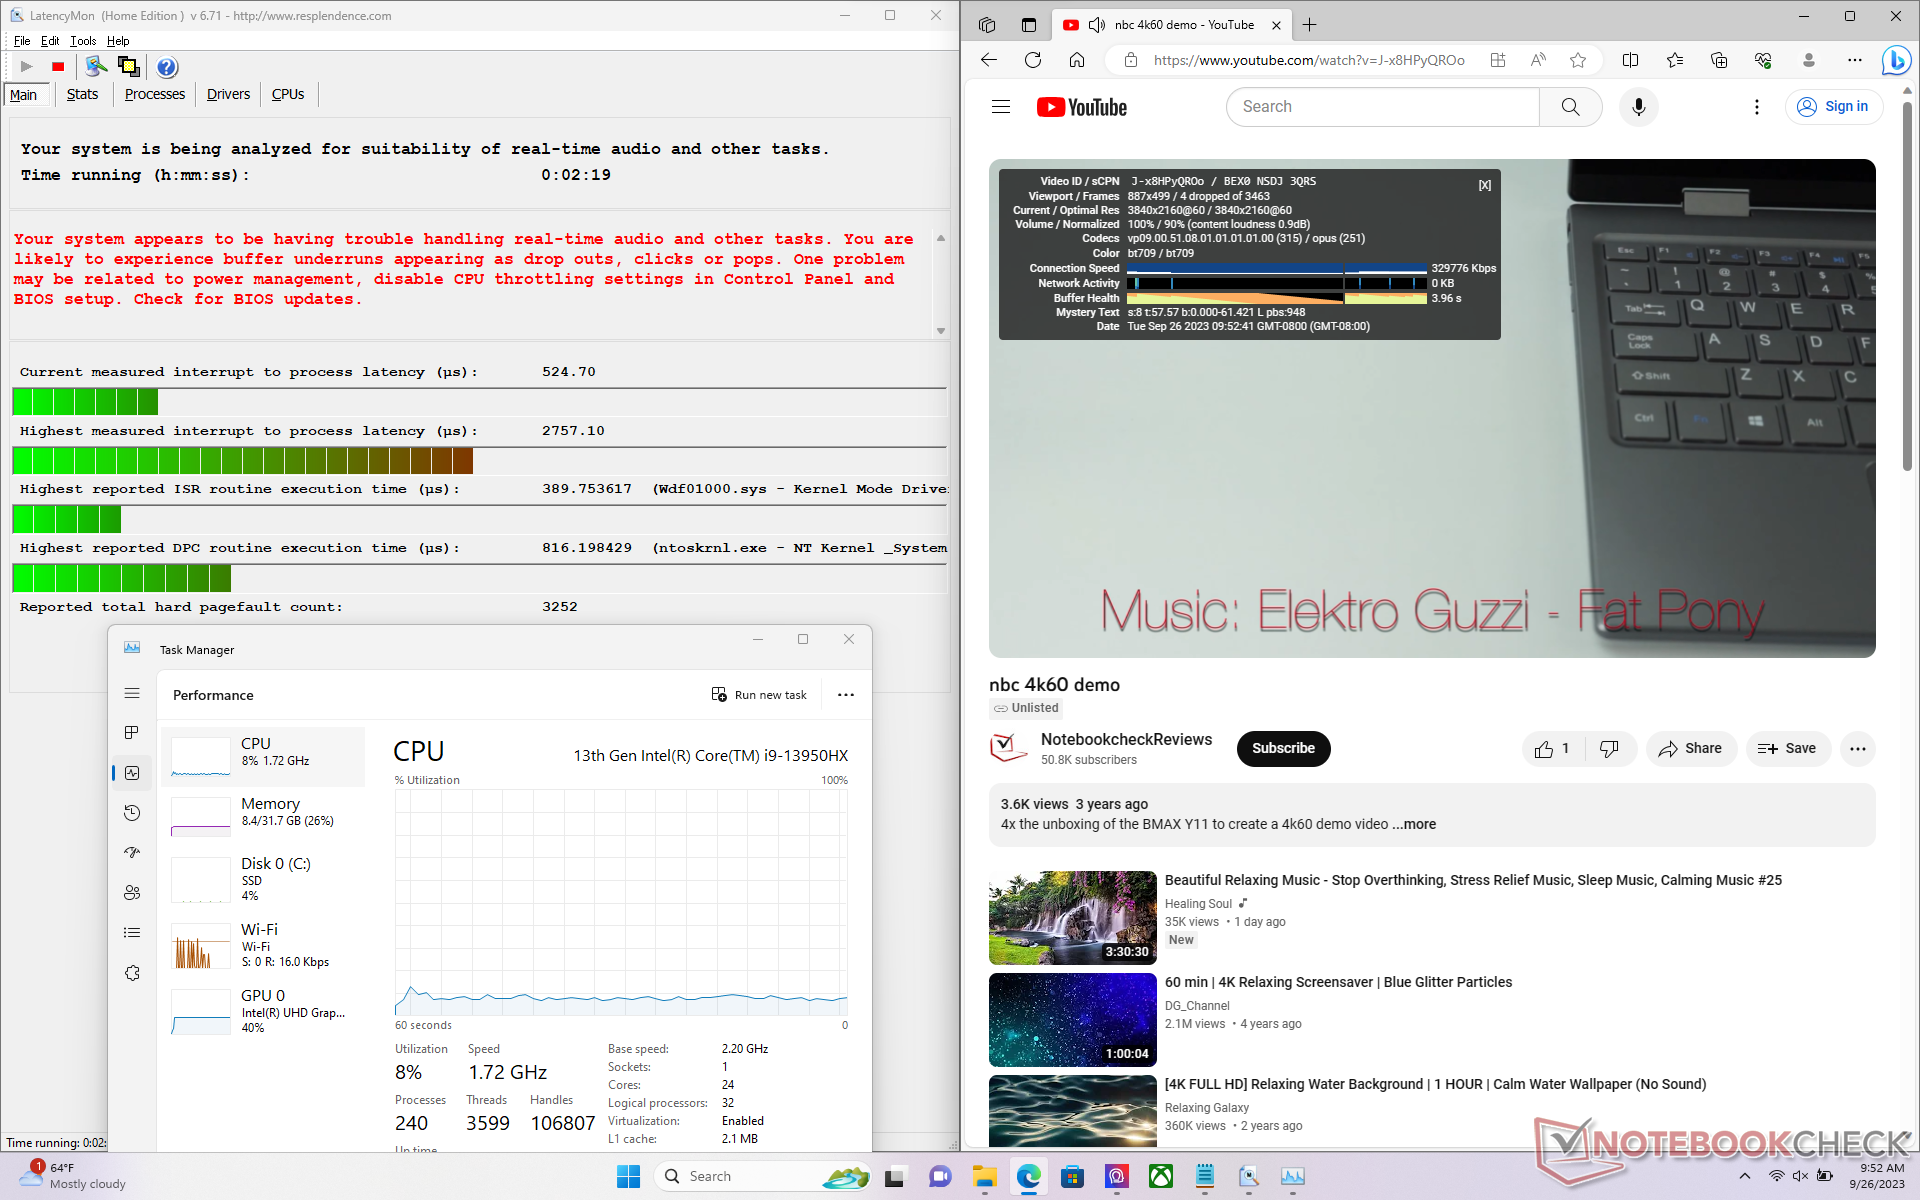
DPC latentie
LatencyMon onthult DPC-problemen bij het openen van meerdere browsertabbladen van onze startpagina. het afspelen van 4K-video's met 60 FPS is onvolmaakt met 4 dropped frames die zijn opgenomen in een venster van 60 seconden.

| DPC Latencies / LatencyMon - interrupt to process latency (max), Web, Youtube, Prime95 | |
| Lenovo Legion Slim 7i 16 Gen 8 | |
| Asus ROG Zephyrus M16 GU604VY-NM042X | |
| MSI Raider GE68HX 13VF | |
| HP Omen 16-xf0376ng | |
| Alienware m16 R1 AMD | |
| MSI GE67 HX 12UGS | |
* ... kleiner is beter
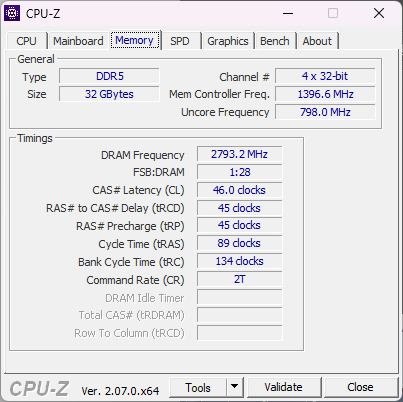
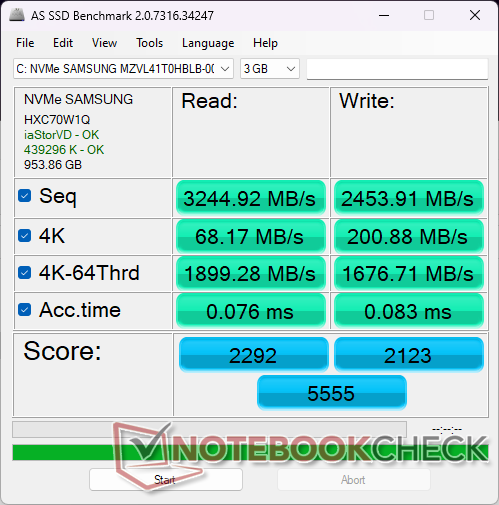
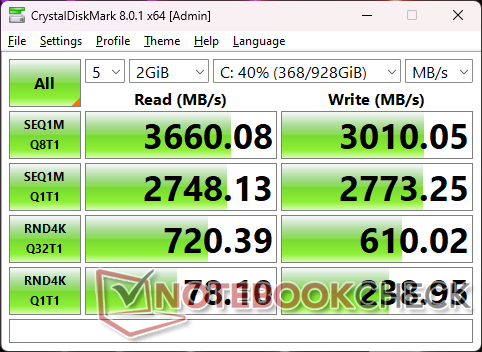
Opslagapparaten
Ons apparaat wordt geleverd met de goedkopere 1 TB Samsung PM9B1 in plaats van de duurdere Samsung PM9A1, waarschijnlijk om kosten te besparen. De PM9B1 is bijna half zo snel met maximale sequentiële leessnelheden van ongeveer 3600 MB/s vergeleken met ~7000 MB/s op de PM9A1. De prestaties van de SSD zijn desondanks stabiel en er is geen sprake van throttling.

| Drive Performance rating - Percent | |
| MSI GE67 HX 12UGS | |
| Lenovo Legion Slim 7i 16 Gen 8 | |
| Alienware m16 R1 AMD | |
| Asus ROG Zephyrus M16 GU604VY-NM042X | |
| HP Omen 16-xf0376ng | |
| MSI Raider GE68HX 13VF -11! | |
* ... kleiner is beter
Disk Throttling: DiskSpd Read Loop, Queue Depth 8
GPU-prestaties
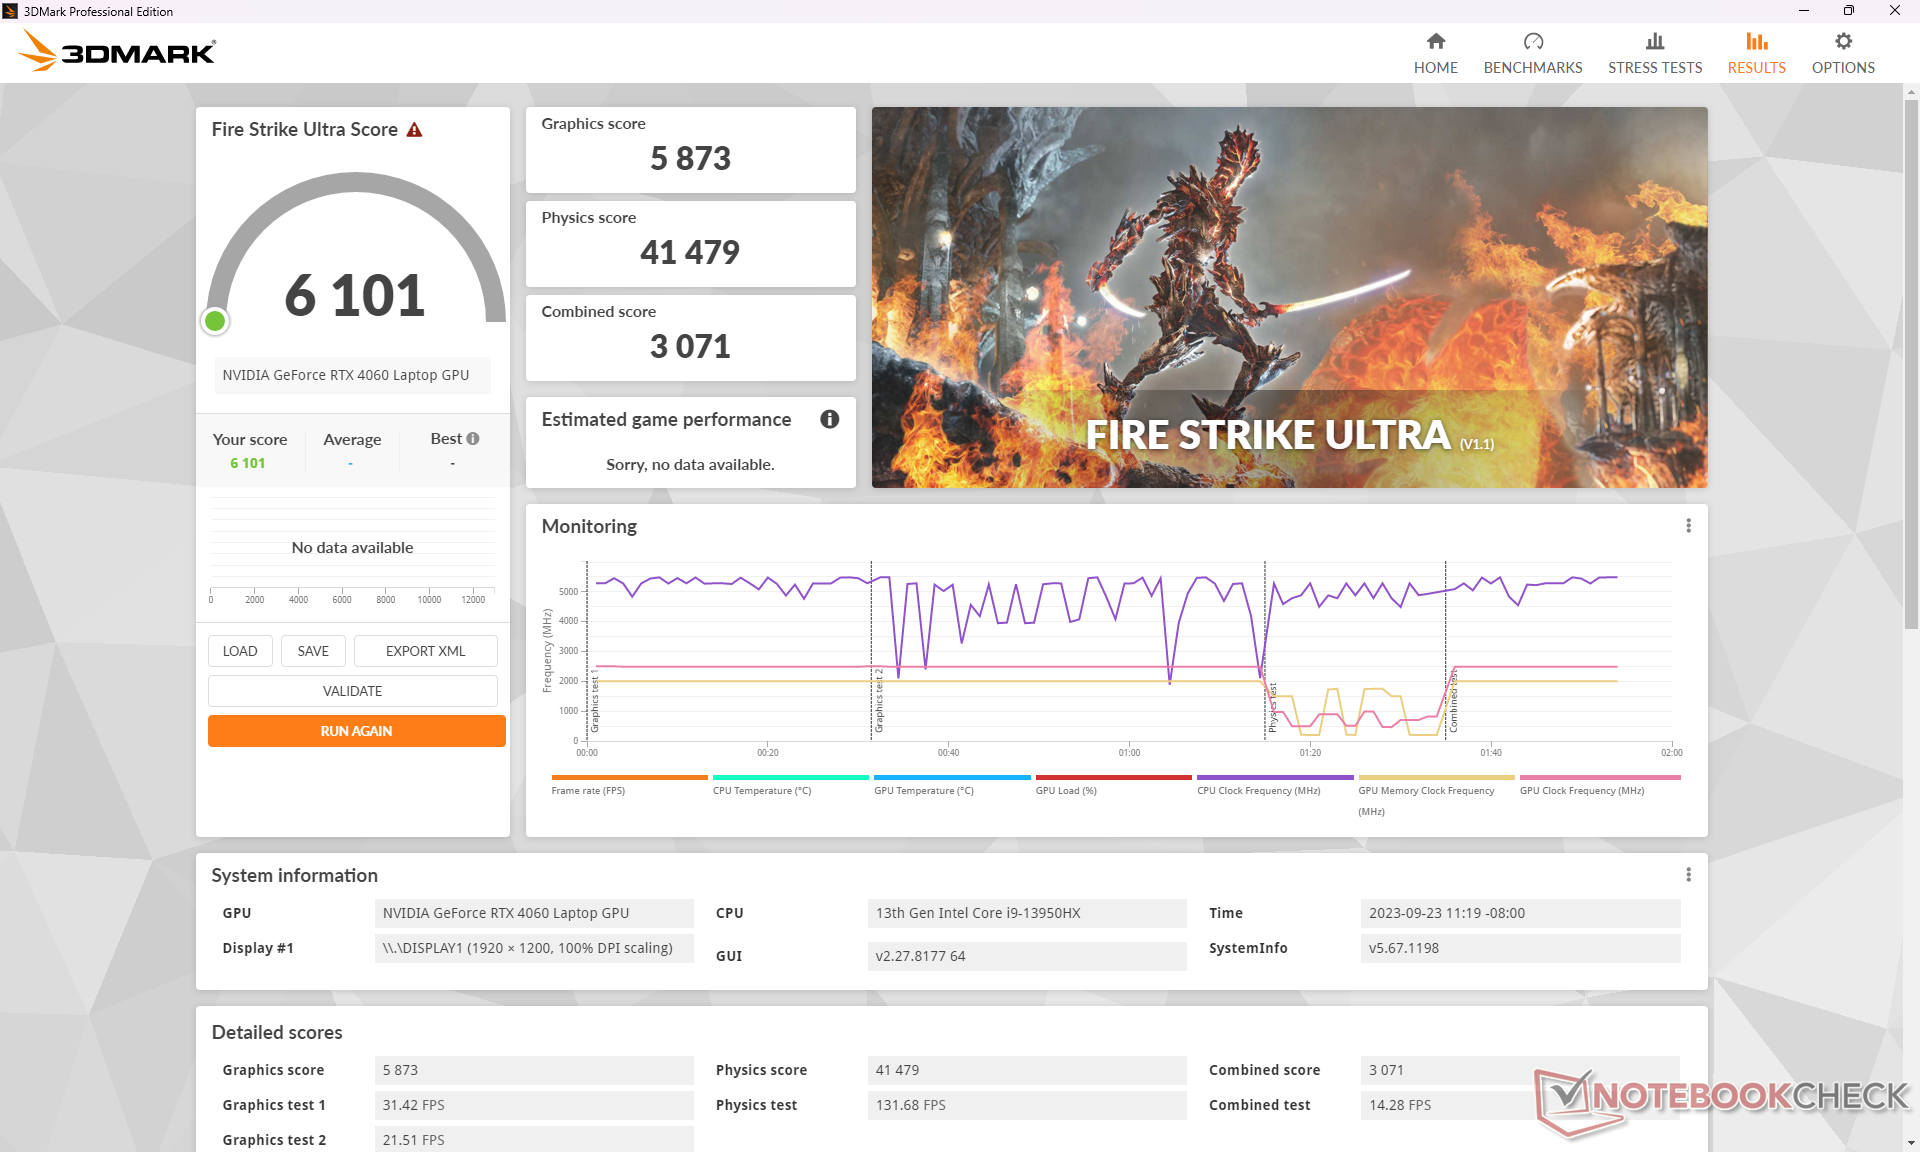
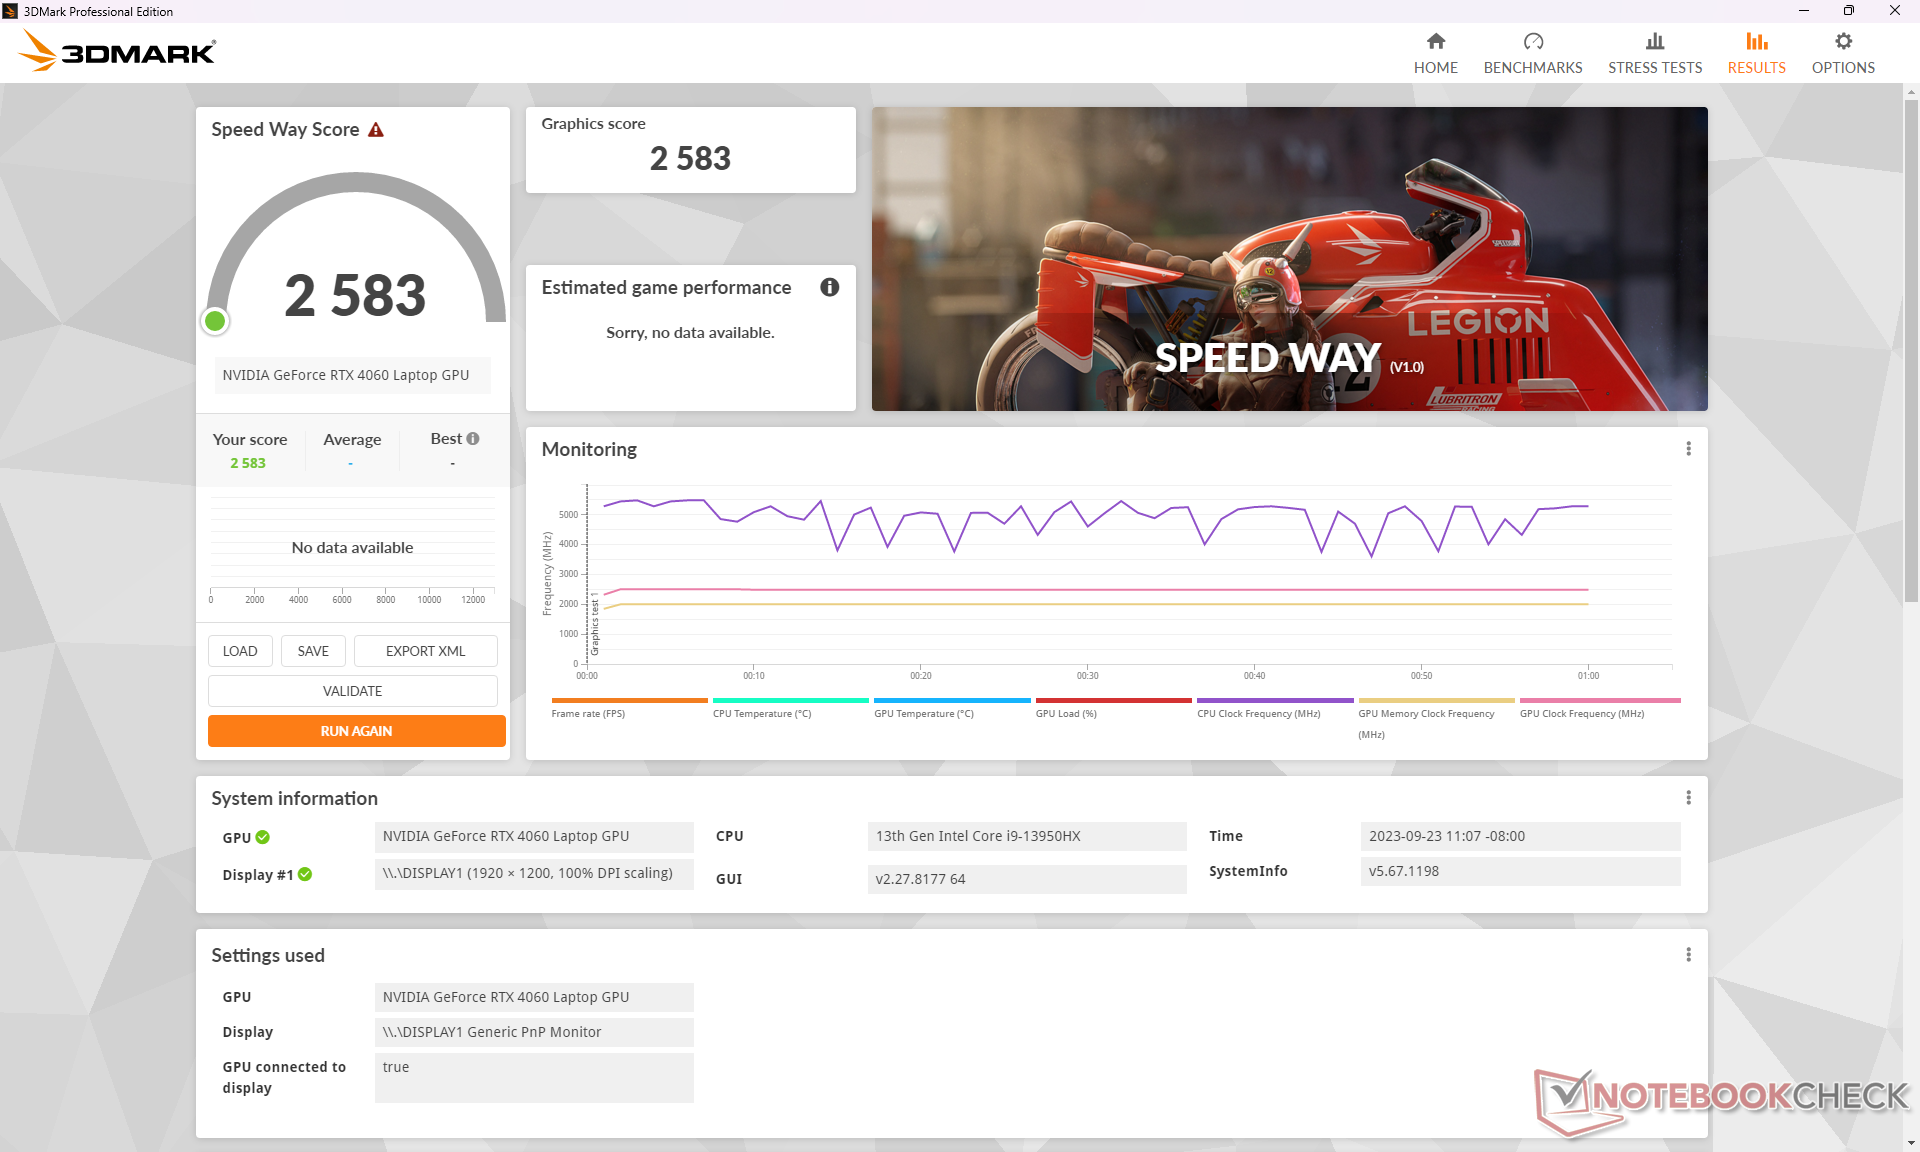
Onze RTX 4060 presteert goed met resultaten die net iets boven de gemiddelde gaming laptop in onze database liggen die is uitgerust met dezelfde GPU. Upgraden naar de RTX 4070, 4080 of 4090 zal de prestaties naar verwachting met respectievelijk 10 tot 20 procent, 60 tot 80 procent en 80 tot 100 procent verbeteren ten opzichte van de RTX 4060. De prestatiekloof is het grootst tussen de RTX 4070 en 4080.
Vervelend genoeg heeft MSI MSI Center zo geprogrammeerd dat het automatisch overschakelt naar de Extreme Performance modus zodra het detecteert dat 3DMark wordt uitgevoerd en er is helaas geen gemakkelijke manier om dit uit te schakelen. We vinden dit frustrerend omdat het de controle wegneemt van de eindgebruiker. Het automatisch overschakelen gebeurt niet als er games worden uitgevoerd.
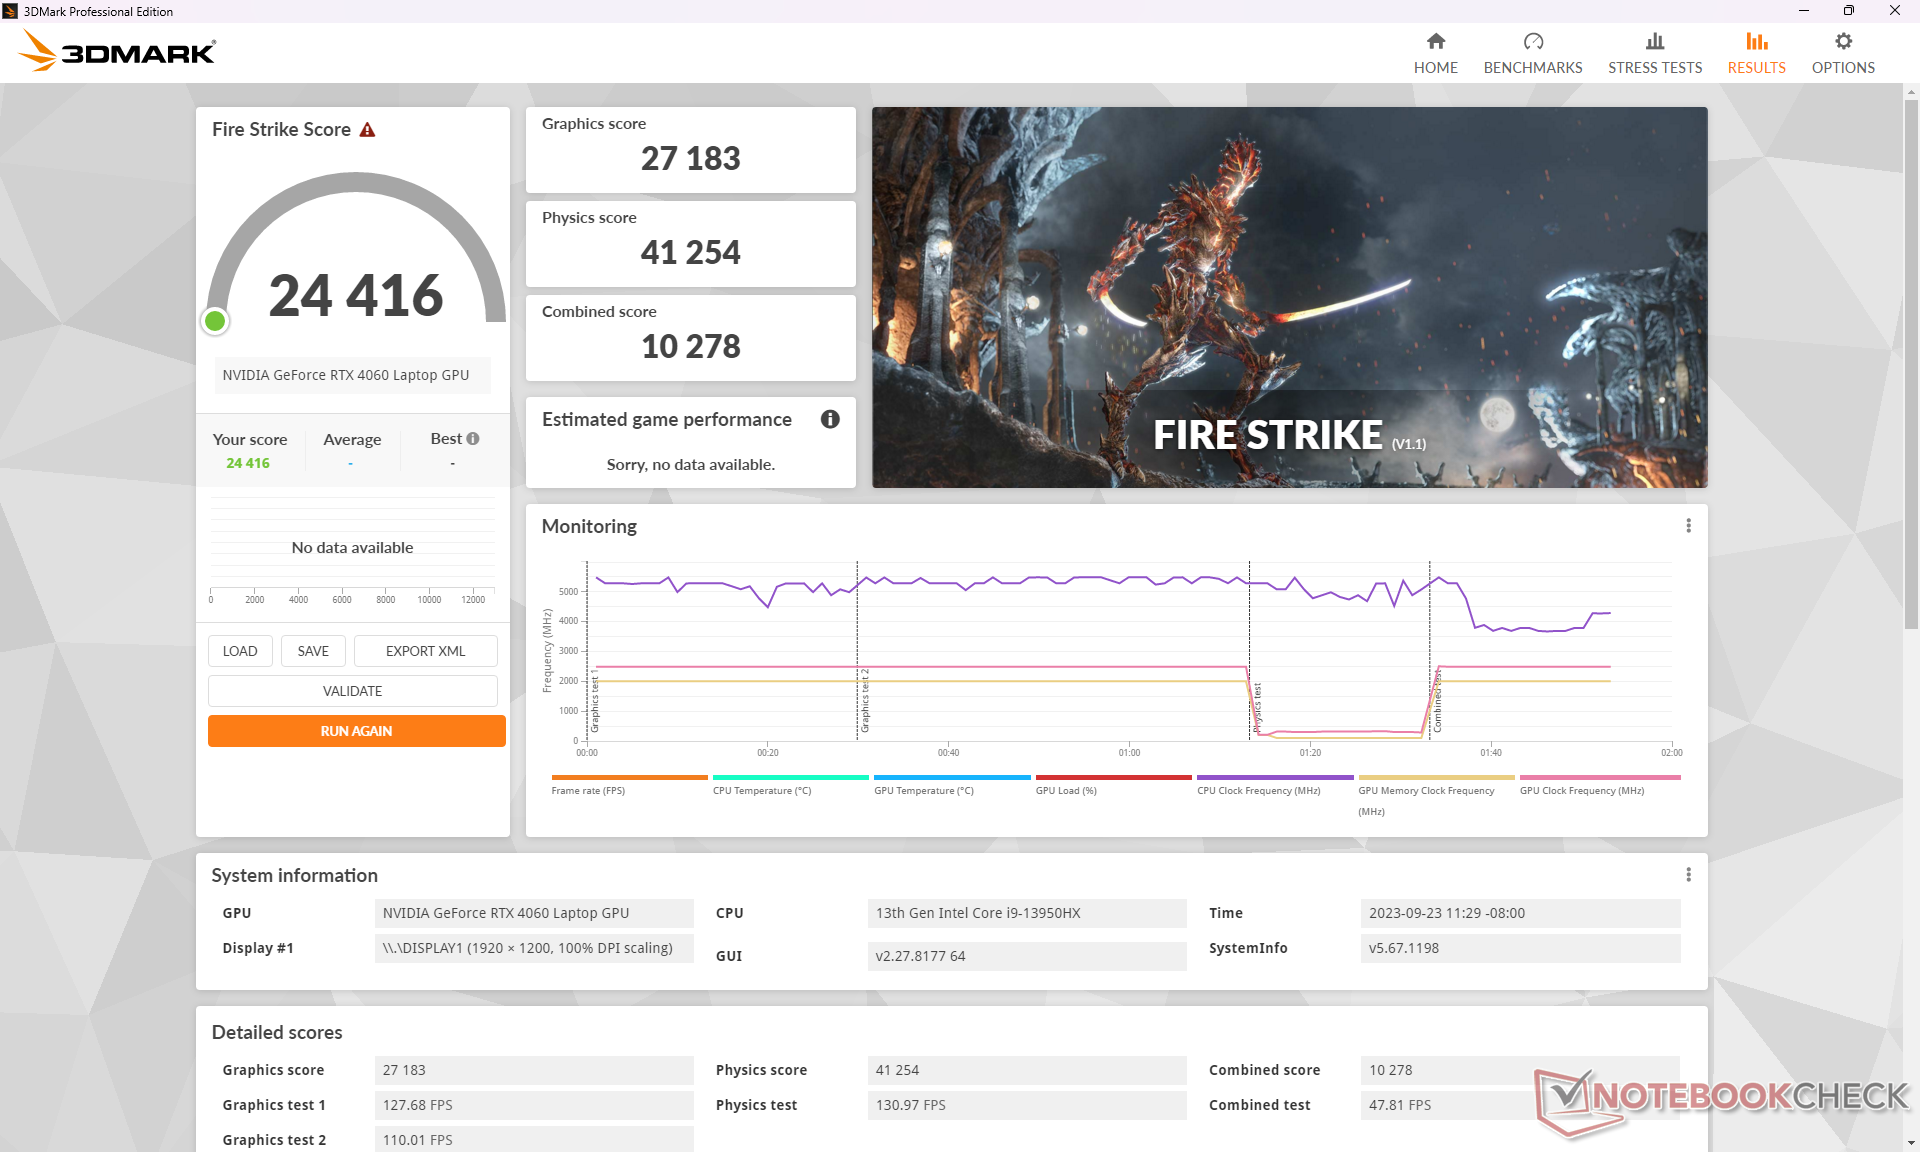
Het inschakelen van Cooler Boost lijkt geen significante invloed te hebben op de prestaties van CPU of GPU, zoals blijkt uit onze onderstaande Fire Strike resultaten. De functie is dus niet essentieel voor maximale prestaties en wordt alleen aanbevolen als koelere temperaturen gewenst zijn.
| Vermogen Profiel | Fire Strike Graphics | Fire Strike Natuurkunde | Gecombineerde score |
| Modus Extreme prestaties (Cooler Boost aan) | 27127 | 41525 | 11480 |
| Extreme prestatiemodus (Koeler Boost uit) | 27183 (0%) | 41254 (-1%) | 10278 (-10%) |
| Batterijvermogen | 19528 (-28%) | 18623 (-55%) | 5986 (-48%) |
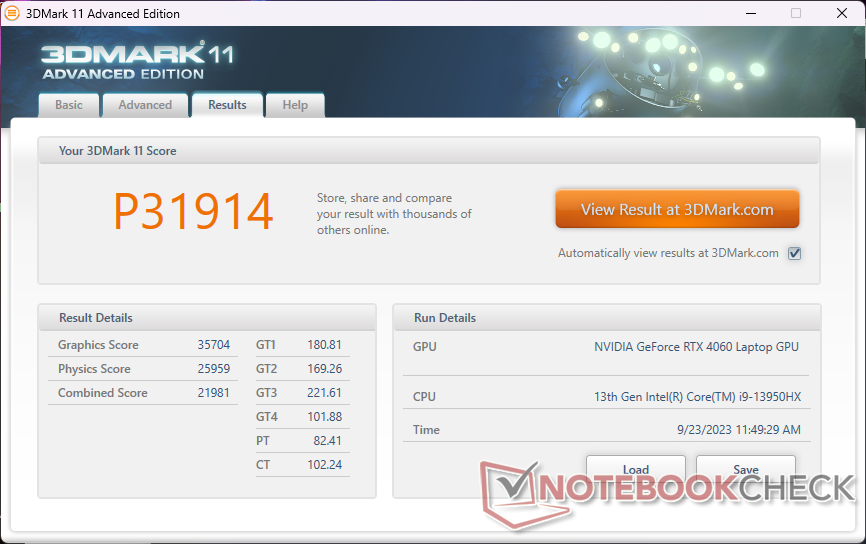
| 3DMark 11 Performance | 31914 punten | |
| 3DMark Fire Strike Score | 24416 punten | |
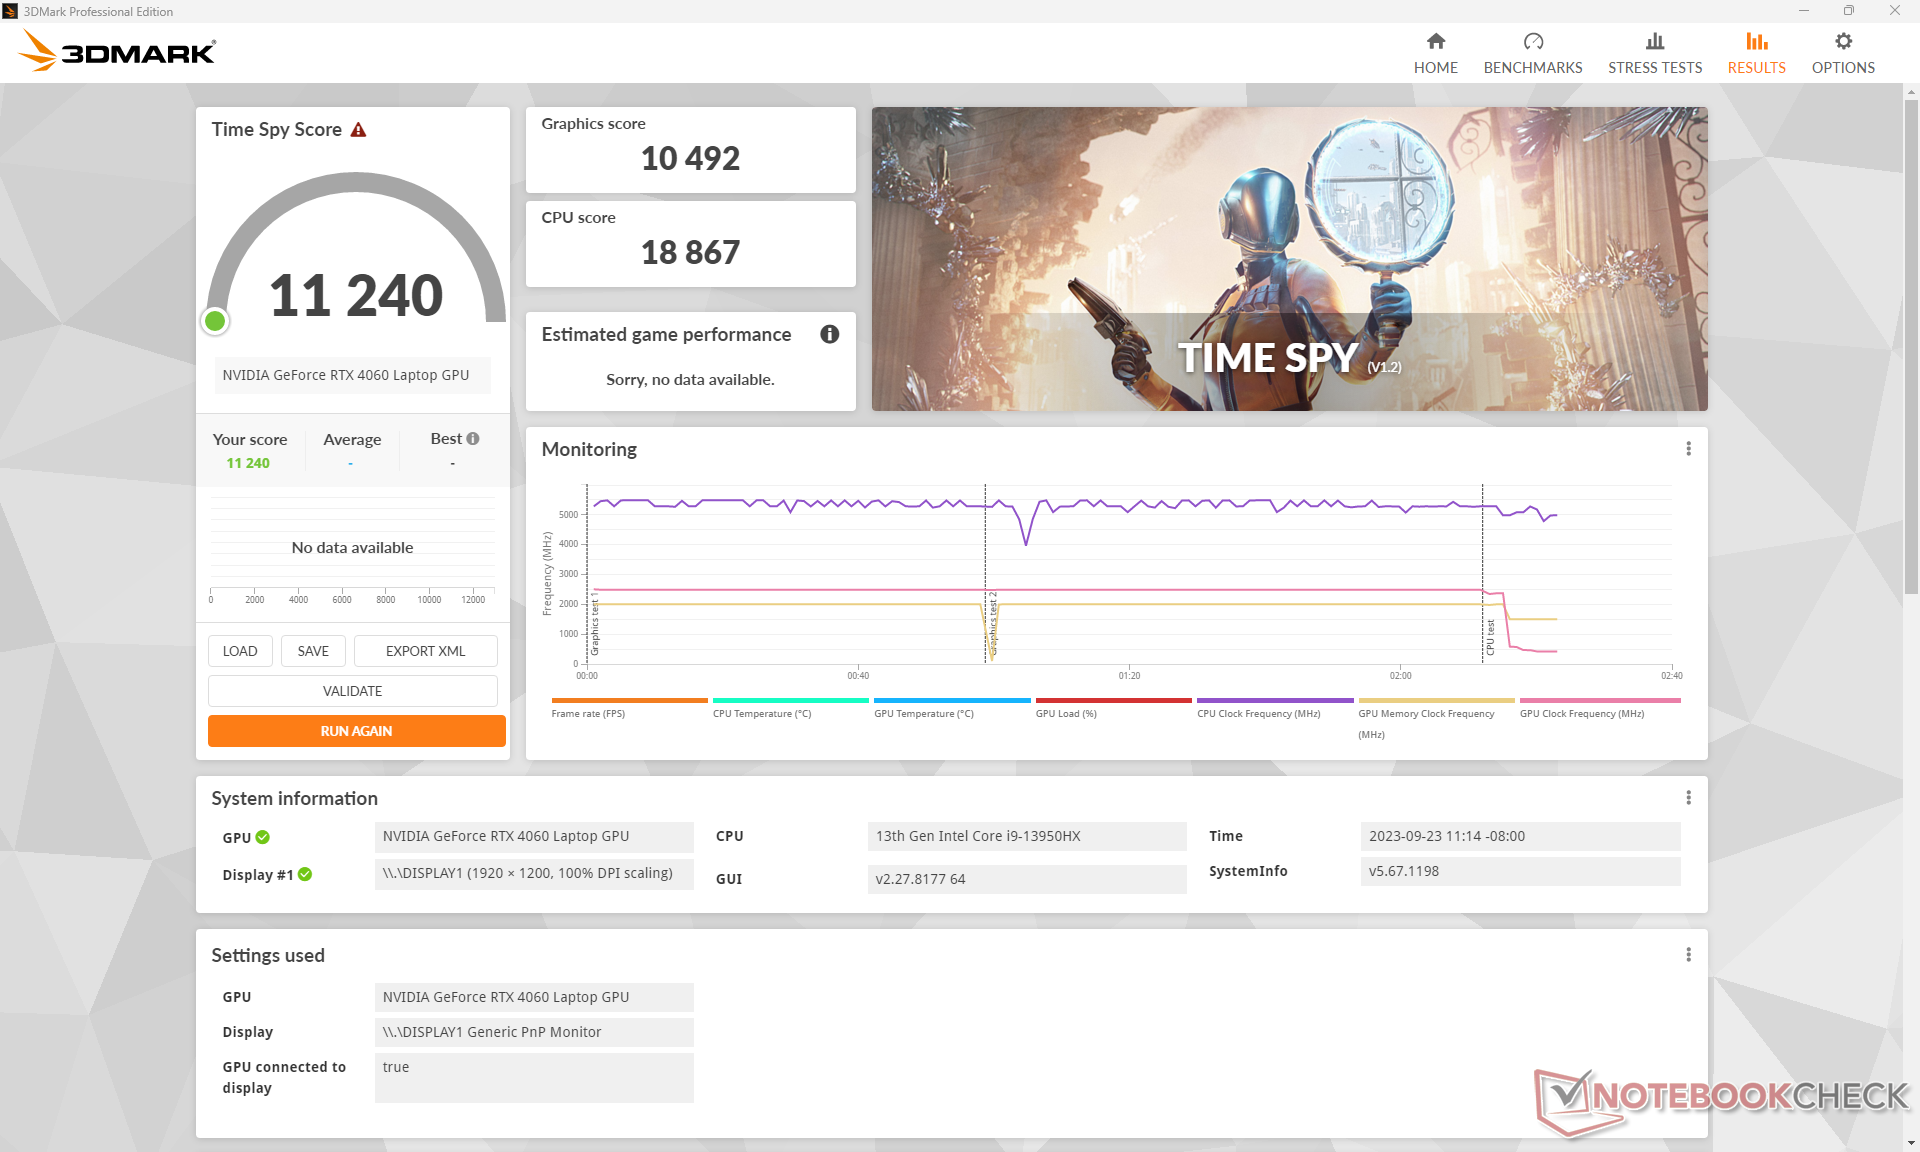
| 3DMark Time Spy Score | 11240 punten | |
Help | ||
* ... kleiner is beter
Spelprestaties
Net als de RTX 2060 en RTX 3060 daarvoor, is de RTX 4060 perfect voor 1080p60 gaming. Alle geteste games draaien erg goed op 1080p maximale instellingen, maar nieuwere en veeleisendere games zoals Ratchet and Clank Rift Apart hebben de neiging om onder de 60 FPS te zakken. Lagere instellingen of DLSS worden in dergelijke gevallen aanbevolen, vooral omdat het hoofdbeeldscherm geen G-Sync ondersteuning heeft.
| Tiny Tina's Wonderlands | |
| 1920x1080 Low Preset (DX12) | |
| Alienware m16 R1 AMD | |
| Lenovo Legion Slim 7i 16 Gen 8 | |
| MSI Raider GE68HX 13VF | |
| Gemiddeld NVIDIA GeForce RTX 4060 Laptop GPU (164.4 - 235, n=9) | |
| 1920x1080 Medium Preset (DX12) | |
| Alienware m16 R1 AMD | |
| Lenovo Legion Slim 7i 16 Gen 8 | |
| MSI Raider GE68HX 13VF | |
| Gemiddeld NVIDIA GeForce RTX 4060 Laptop GPU (116 - 192.3, n=9) | |
| 1920x1080 High Preset (DX12) | |
| Alienware m16 R1 AMD | |
| Lenovo Legion Slim 7i 16 Gen 8 | |
| MSI Raider GE68HX 13VF | |
| Gemiddeld NVIDIA GeForce RTX 4060 Laptop GPU (86.6 - 121.2, n=10) | |
| 1920x1080 Badass Preset (DX12) | |
| Asus Zephyrus Duo 16 GX650PY-NM006W | |
| Alienware m16 R1 AMD | |
| Lenovo Legion Slim 7i 16 Gen 8 | |
| MSI Raider GE68HX 13VF | |
| Gemiddeld NVIDIA GeForce RTX 4060 Laptop GPU (67.5 - 92.7, n=11) | |
| Ratchet & Clank Rift Apart | |
| 1920x1080 Low Preset | |
| Gemiddeld NVIDIA GeForce RTX 4060 Laptop GPU (84.7 - 86, n=3) | |
| MSI Raider GE68HX 13VF | |
| 1920x1080 Medium Preset AA:T | |
| MSI Raider GE68HX 13VF | |
| Gemiddeld NVIDIA GeForce RTX 4060 Laptop GPU (73.4 - 75, n=4) | |
| 1920x1080 High Preset AA:T | |
| Gemiddeld NVIDIA GeForce RTX 4060 Laptop GPU (59 - 60.6, n=4) | |
| MSI Raider GE68HX 13VF | |
| 1920x1080 Very High Preset AA:T | |
| Gemiddeld NVIDIA GeForce RTX 4060 Laptop GPU (51.6 - 54.8, n=4) | |
| MSI Raider GE68HX 13VF | |
Witcher 3 FPS Chart
| lage | gem. | hoge | ultra | |
|---|---|---|---|---|
| The Witcher 3 (2015) | 556.3 | 364.9 | 213.1 | 103.5 |
| Dota 2 Reborn (2015) | 232 | 207 | 199 | 182.2 |
| Final Fantasy XV Benchmark (2018) | 223 | 151.3 | 103.2 | |
| X-Plane 11.11 (2018) | 209 | 184 | 141.1 | |
| Far Cry 5 (2018) | 191 | 158 | 147 | 138 |
| Strange Brigade (2018) | 487 | 291 | 232 | 194 |
| Cyberpunk 2077 1.6 (2022) | 129.1 | 103 | 88.3 | 80.4 |
| Tiny Tina's Wonderlands (2022) | 233.9 | 184.6 | 116.5 | 88.3 |
| F1 22 (2022) | 288 | 271 | 206 | 65.5 |
| Ratchet & Clank Rift Apart (2023) | 84.7 | 75 | 59 | 51.6 |
Uitstoot
Systeemruis - gebalanceerde modus wordt aanbevolen voor de meeste scenario's
Het ventilatorgeluid is een allegaartje. De twee ventilatoren zijn erg gevoelig voor belasting van het scherm, wat betekent dat ze sterk en snel toenemen bij het starten van toepassingen of surfen op het web, zelfs wanneer ze zijn ingesteld op het gebalanceerde energieprofiel. Er is ook ventilatorgeluid hoorbaar in de Stille modus, maar het pulseren is veel minder frequent. Over het algemeen kunnen gebruikers een geluidsniveau van 25 tot 38 dB(A) verwachten tijdens het browsen of streamen van video, zelfs in de Stille modus.
Het geluid van de ventilator tijdens het gamen kan sterk variëren, afhankelijk van het gekozen energieprofiel. Als Witcher 3 in de standen Gebalanceerd of Extreme prestaties resulteert dit in een geluidsniveau van respectievelijk 46,2 dB(A) of 57 dB(A). Als Cooler Boost is ingeschakeld, springt het maximum zelfs nog hoger naar 60,1 dB(A) om een van de luidste 16-inch gaming laptops te zijn. Gelukkig is het verlies in grafische prestaties tijdens het gamen in de Gebalanceerde modus zeer marginaal en daarom worden de instellingen Extreme prestaties en Cooler Boost alleen aanbevolen als je koelere temperaturen wilt of de GPU handmatig wilt overklokken.
Geluidsniveau
| Onbelast |
| 25 / 31.3 / 37.5 dB (A) |
| Belasting |
| 44 / 60.1 dB (A) |
 | ||
30 dB stil 40 dB(A) hoorbaar 50 dB(A) luid |
||
min: | ||
| MSI Raider GE68HX 13VF GeForce RTX 4060 Laptop GPU, i9-13950HX, Samsung PM9B1 1024GB MZVL41T0HBLB | MSI GE67 HX 12UGS GeForce RTX 3070 Ti Laptop GPU, i7-12800HX, Samsung PM9A1 MZVL21T0HCLR | HP Omen 16-xf0376ng GeForce RTX 4070 Laptop GPU, R7 7840HS, WDC PC SN810 512GB | Alienware m16 R1 AMD GeForce RTX 4080 Laptop GPU, R9 7845HX, Kioxia XG8 KXG80ZNV1T02 | Lenovo Legion Slim 7i 16 Gen 8 GeForce RTX 4070 Laptop GPU, i9-13900H, Samsung PM9A1 MZVL21T0HCLR | Asus ROG Zephyrus M16 GU604VY-NM042X GeForce RTX 4090 Laptop GPU, i9-13900H, Samsung PM9A1 MZVL22T0HBLB | |
|---|---|---|---|---|---|---|
| Noise | 12% | 9% | 12% | 16% | 5% | |
| uit / omgeving * (dB) | 23.3 | 22.7 3% | 24 -3% | 22.9 2% | 22.8 2% | 24 -3% |
| Idle Minimum * (dB) | 25 | 22.9 8% | 25 -0% | 22.9 8% | 23.6 6% | 24 4% |
| Idle Average * (dB) | 31.3 | 22.9 27% | 29 7% | 29.7 5% | 23.6 25% | 29.96 4% |
| Idle Maximum * (dB) | 37.5 | 22.9 39% | 32 15% | 29.7 21% | 25.7 31% | 34.27 9% |
| Load Average * (dB) | 44 | 44.4 -1% | 44 -0% | 29.8 32% | 27.6 37% | 35.89 18% |
| Witcher 3 ultra * (dB) | 57 | 55.7 2% | 44 23% | 54.7 4% | 54.4 5% | 57.5 -1% |
| Load Maximum * (dB) | 60.1 | 57.4 4% | 46 23% | 54.7 9% | 54.4 9% | 57.54 4% |
* ... kleiner is beter
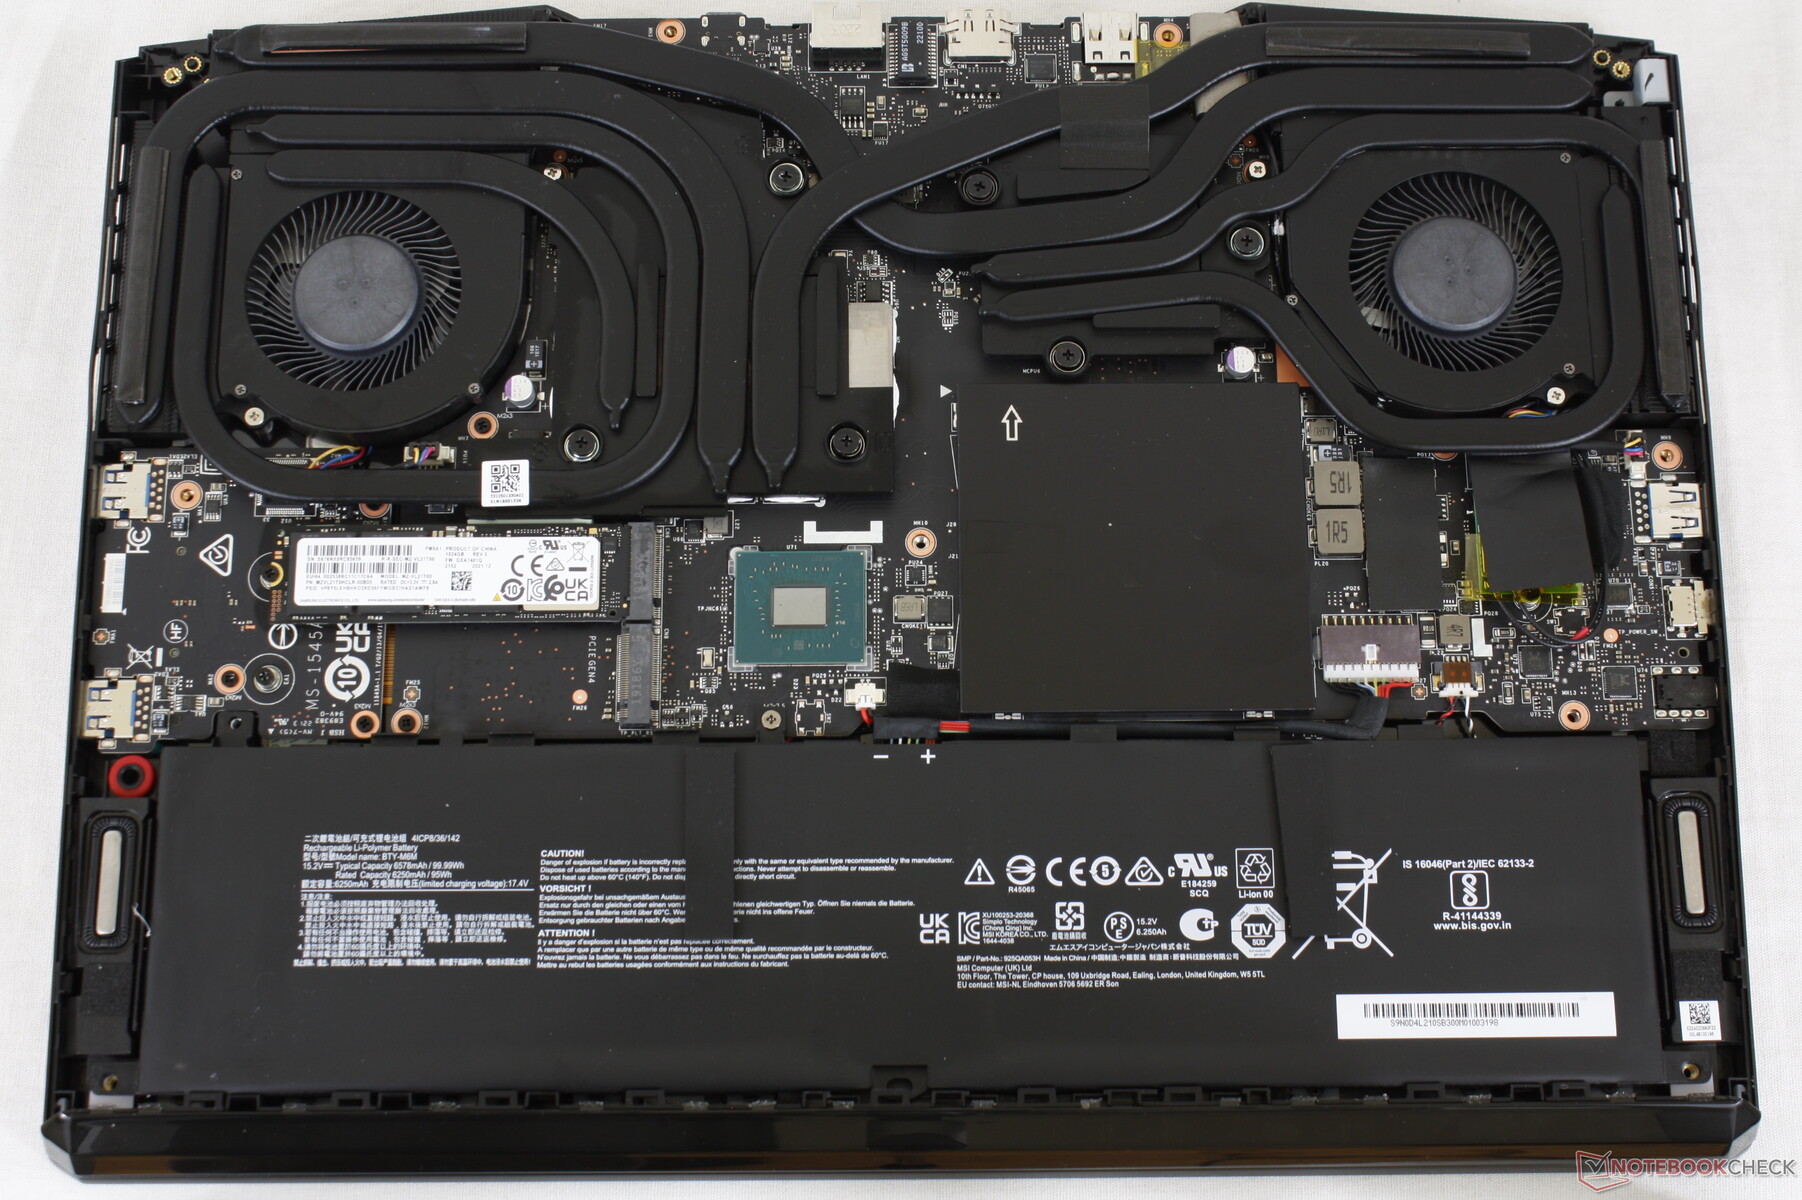
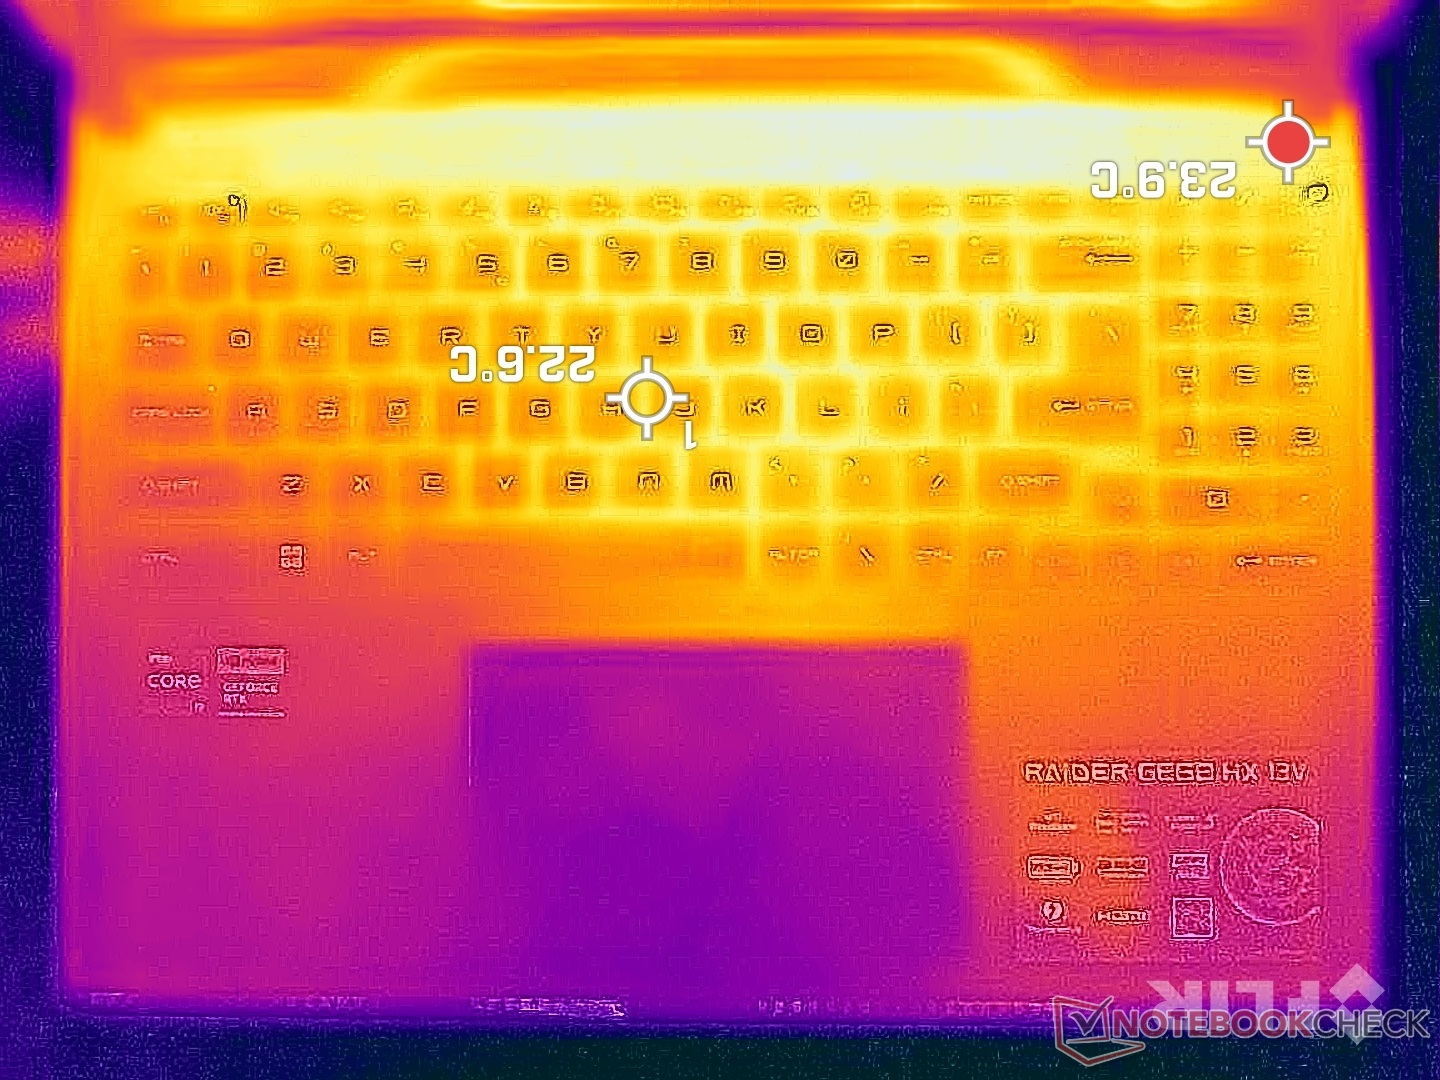
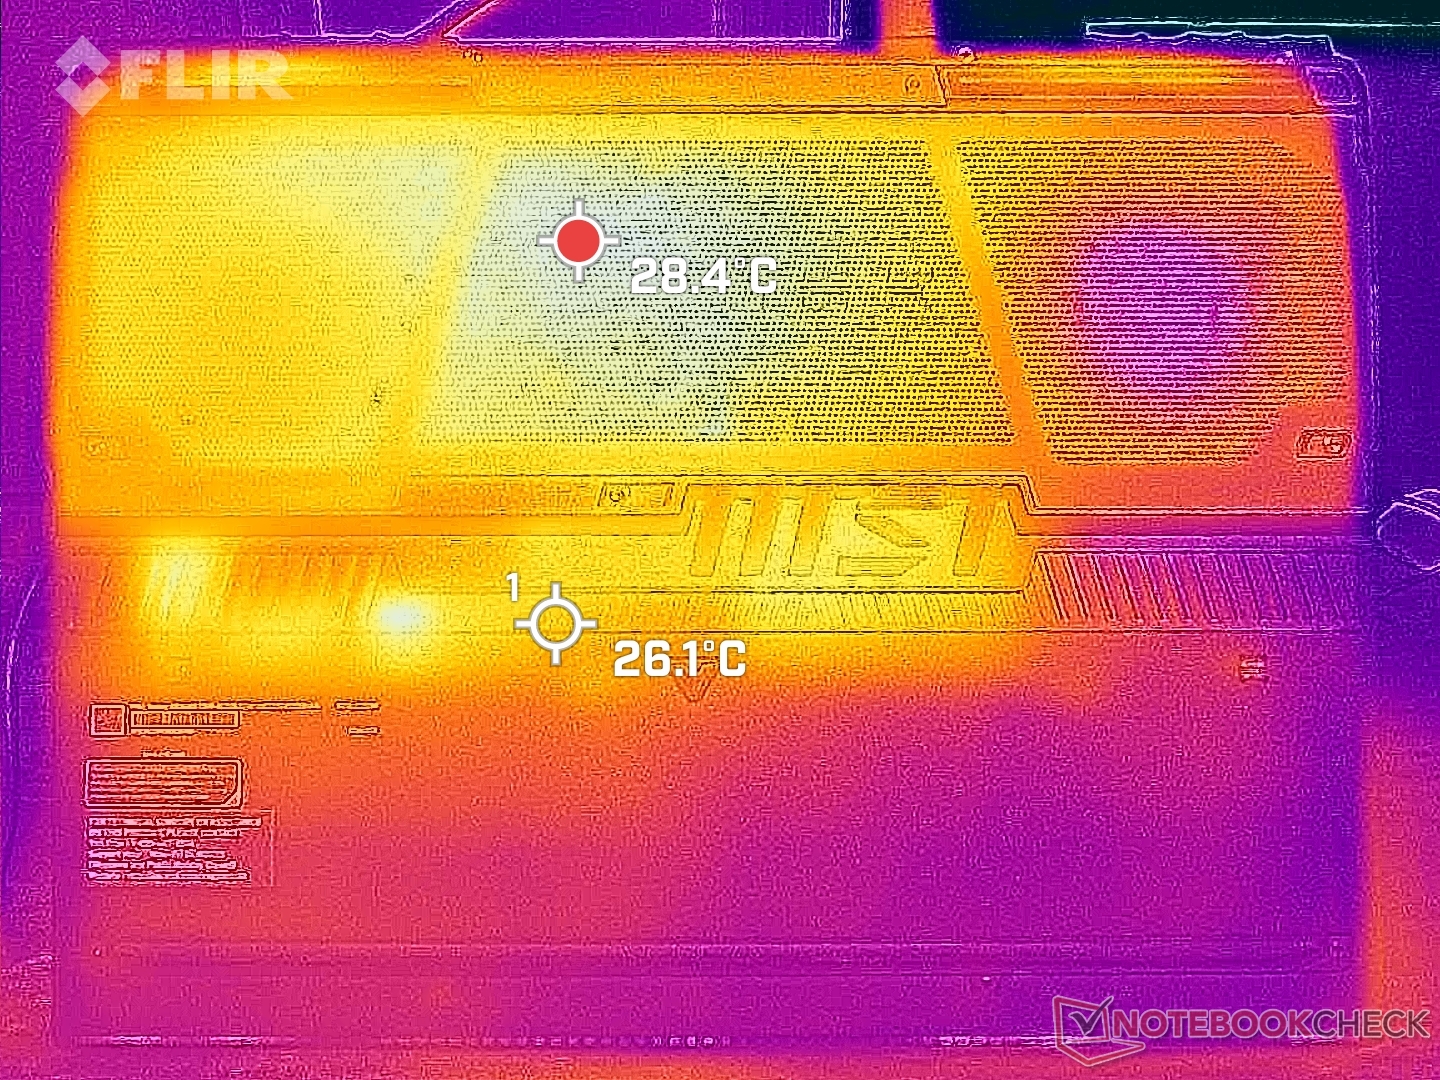
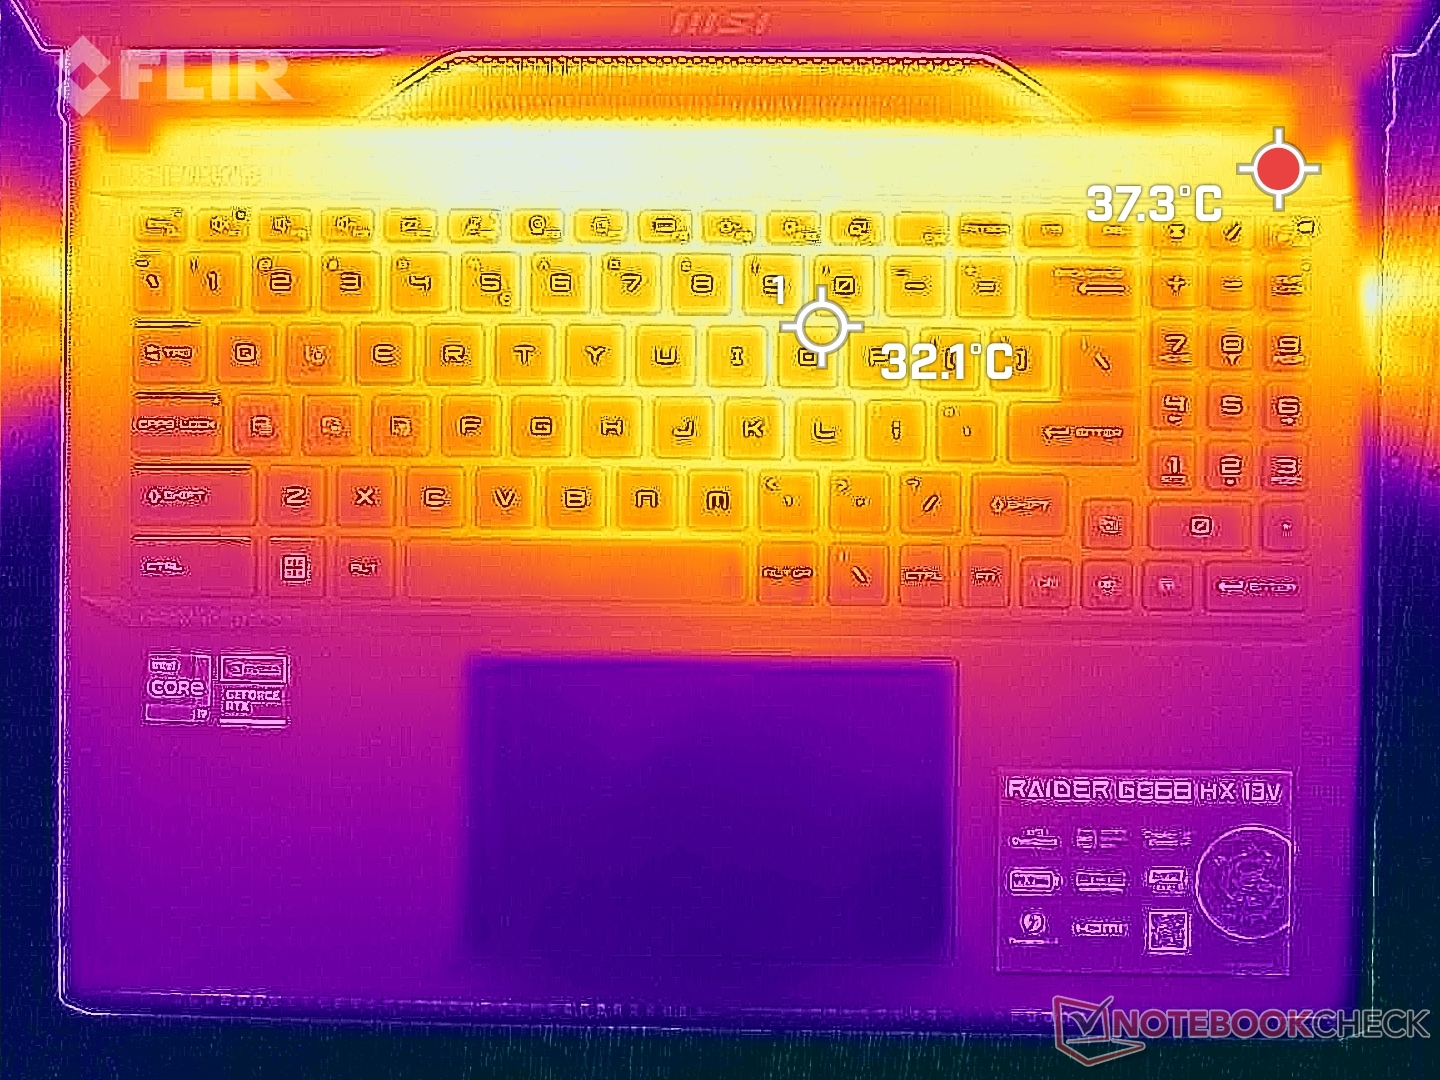
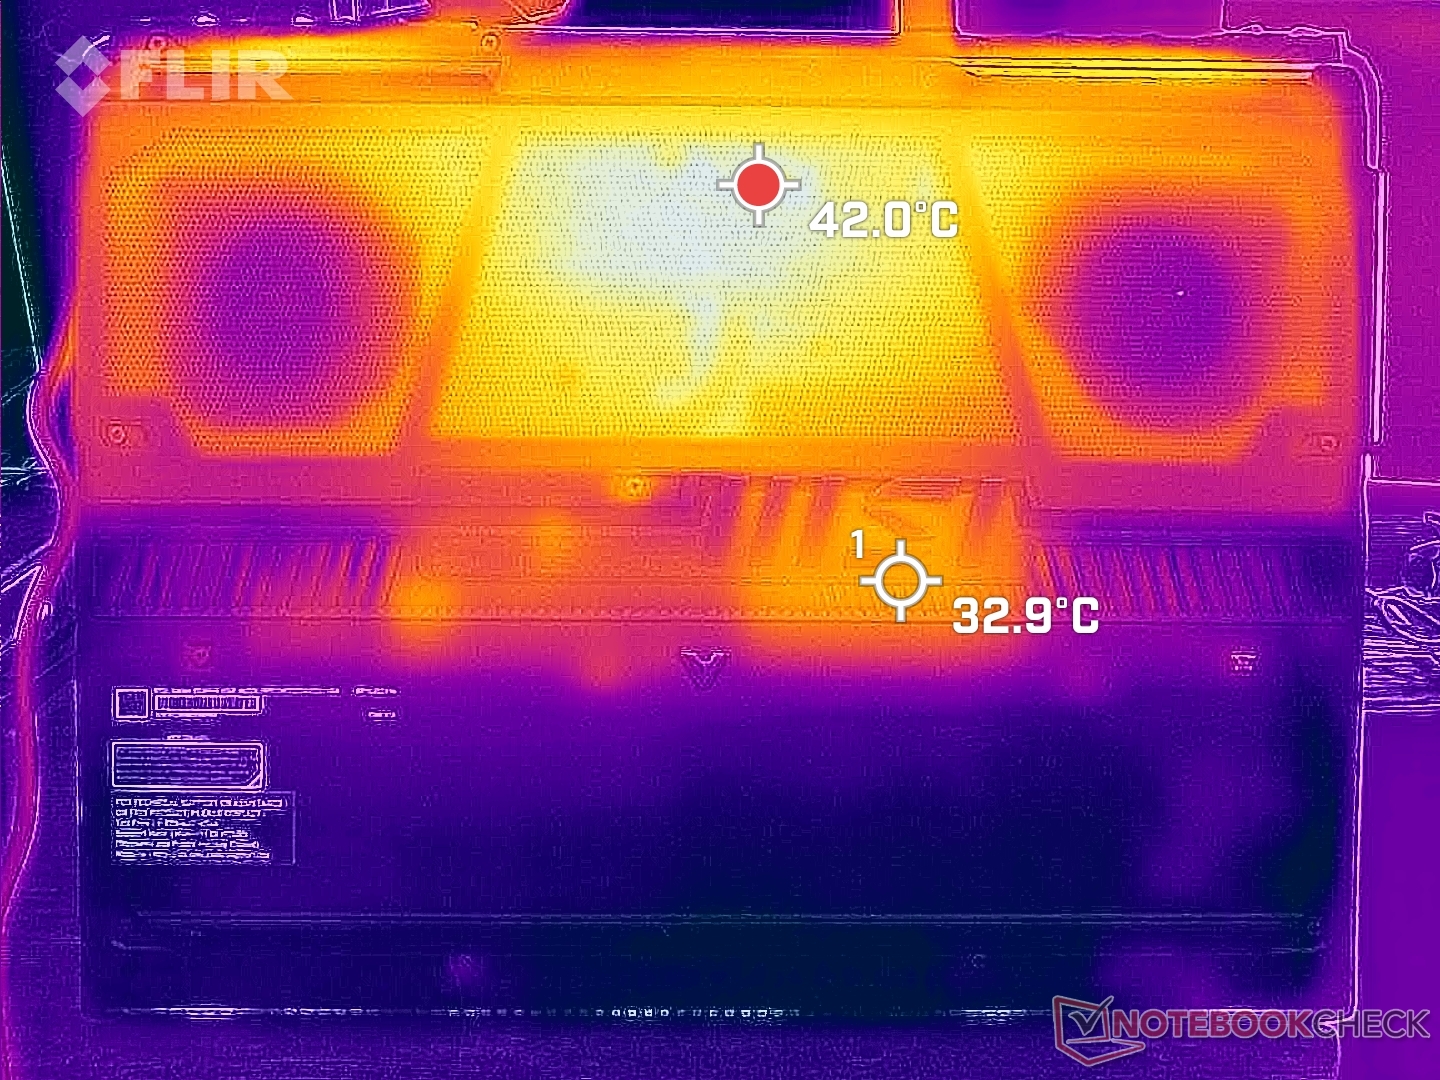
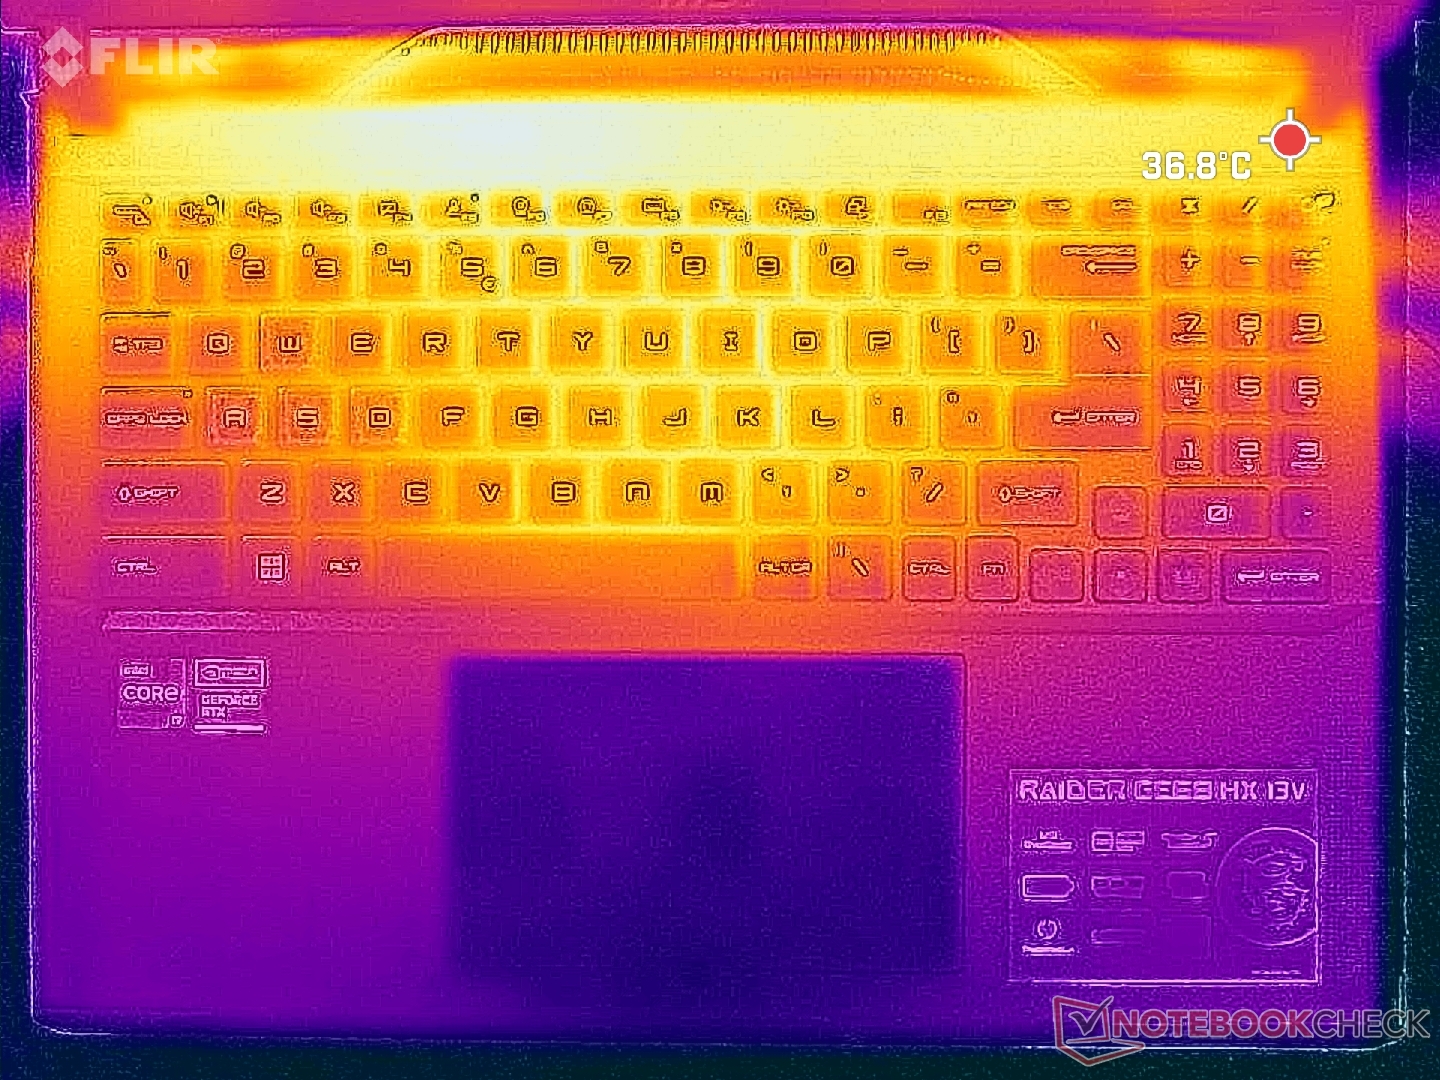
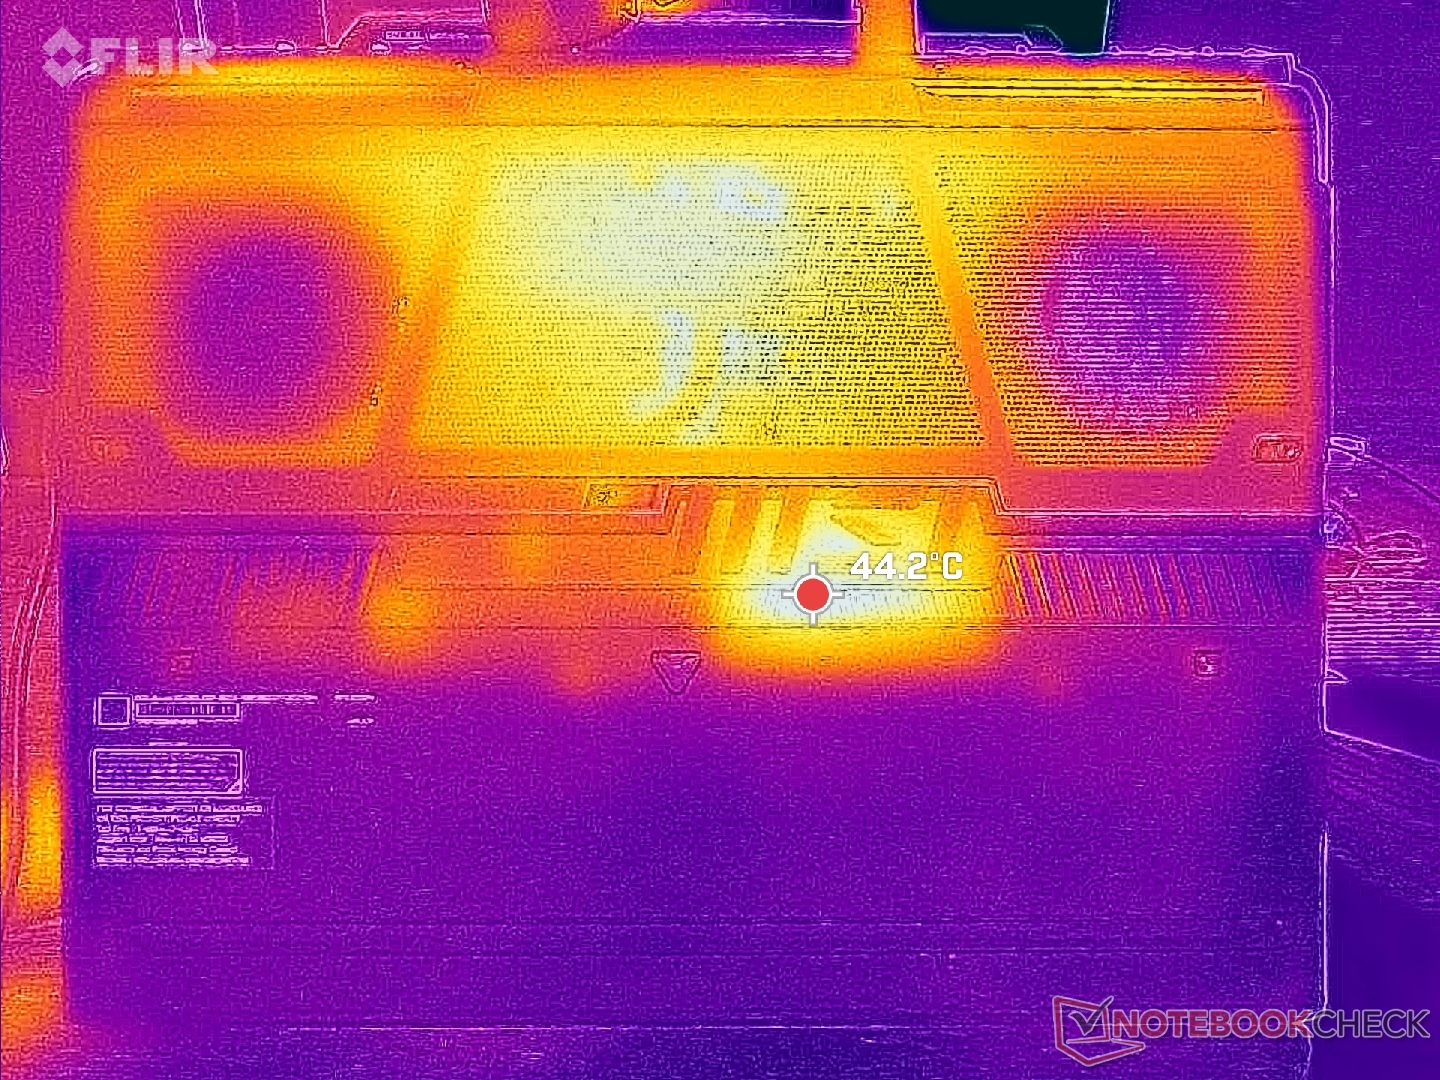
Temperatuur
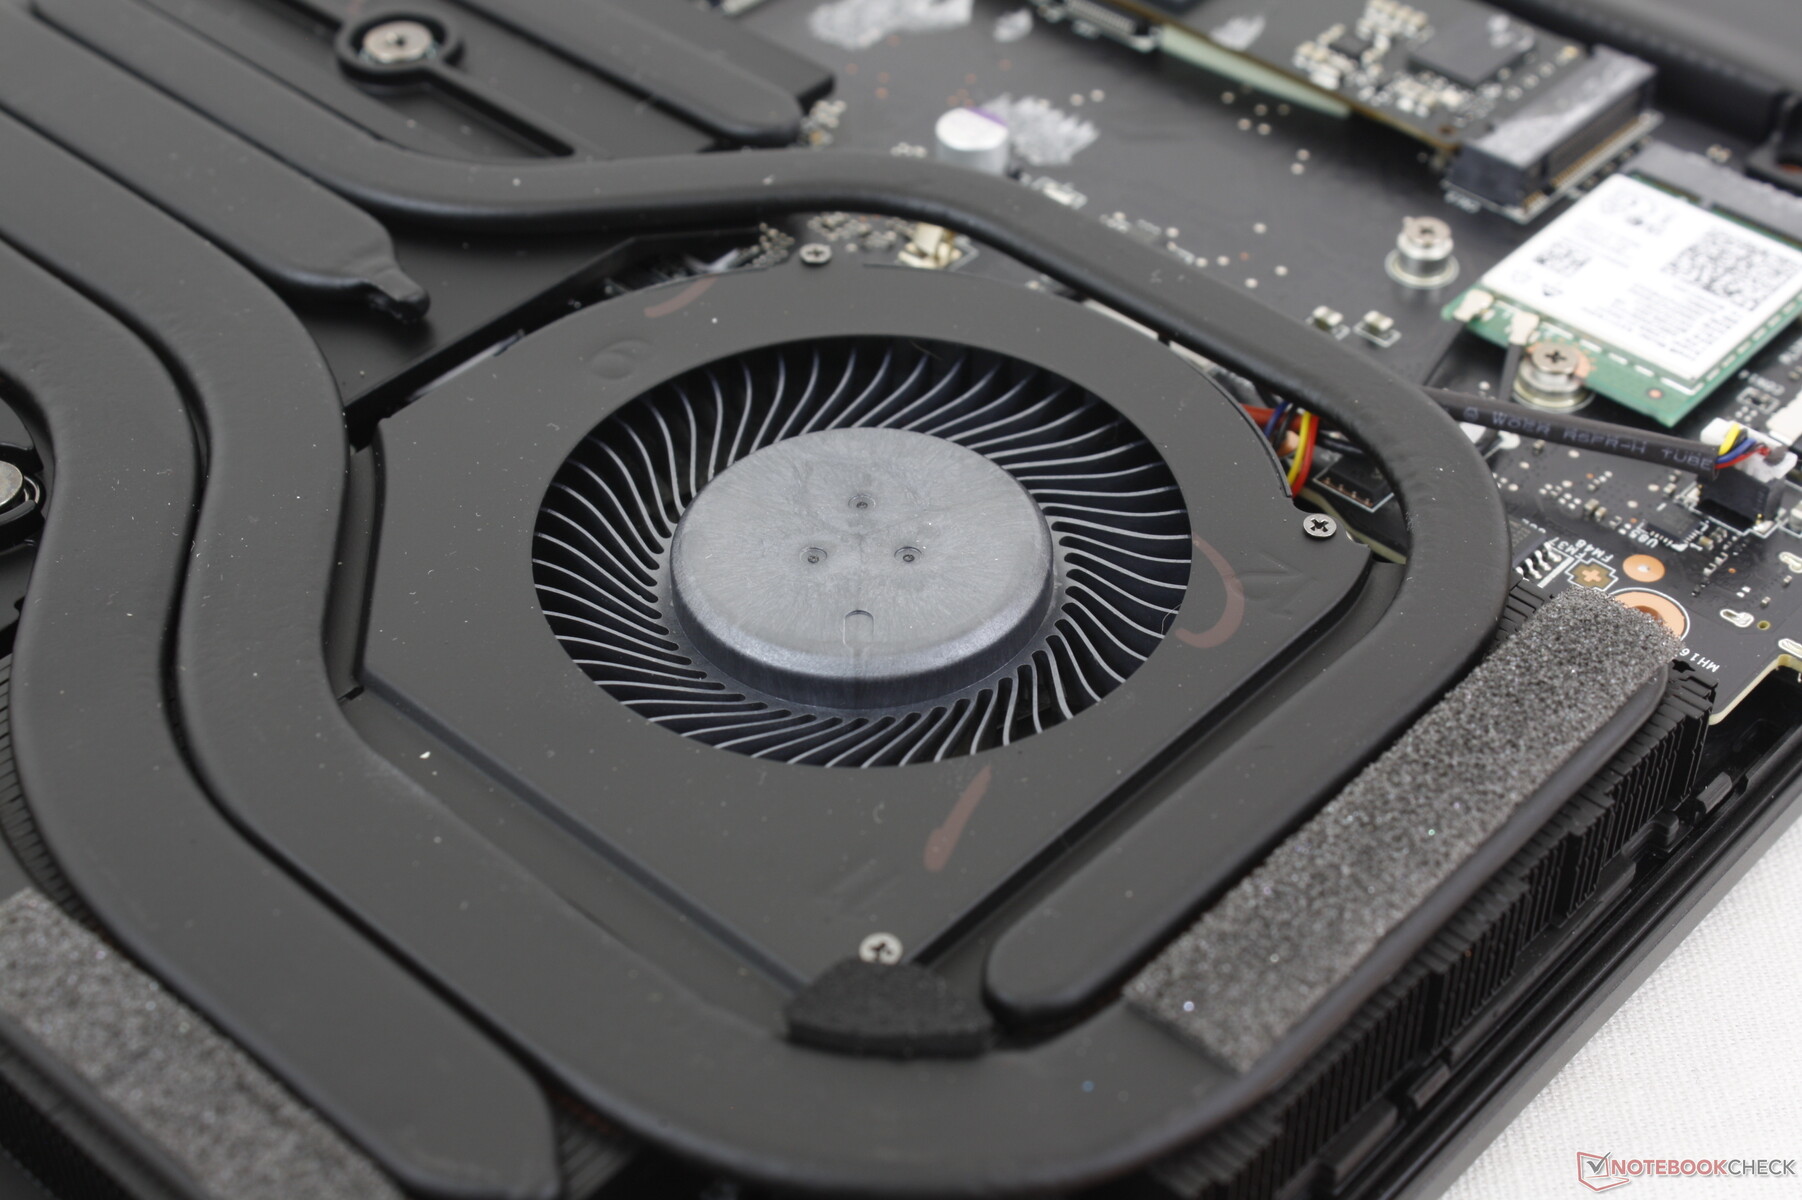
De ontwikkeling van de oppervlaktetemperatuur is symmetrisch door de manier waarop de koeloplossing is ontworpen. Het midden van het toetsenbord kan tot 40 C bereiken, wat veel koeler is dan wat we hebben gemeten op de HP Omen 16 of Legion Slim 7i 16 G8 waar de hotspots elk 45 tot 50 C kunnen bereiken. De over het algemeen luidere ventilatoren en dikkere bouw van de GE68HX werken in het voordeel van MSI vanuit dit perspectief.
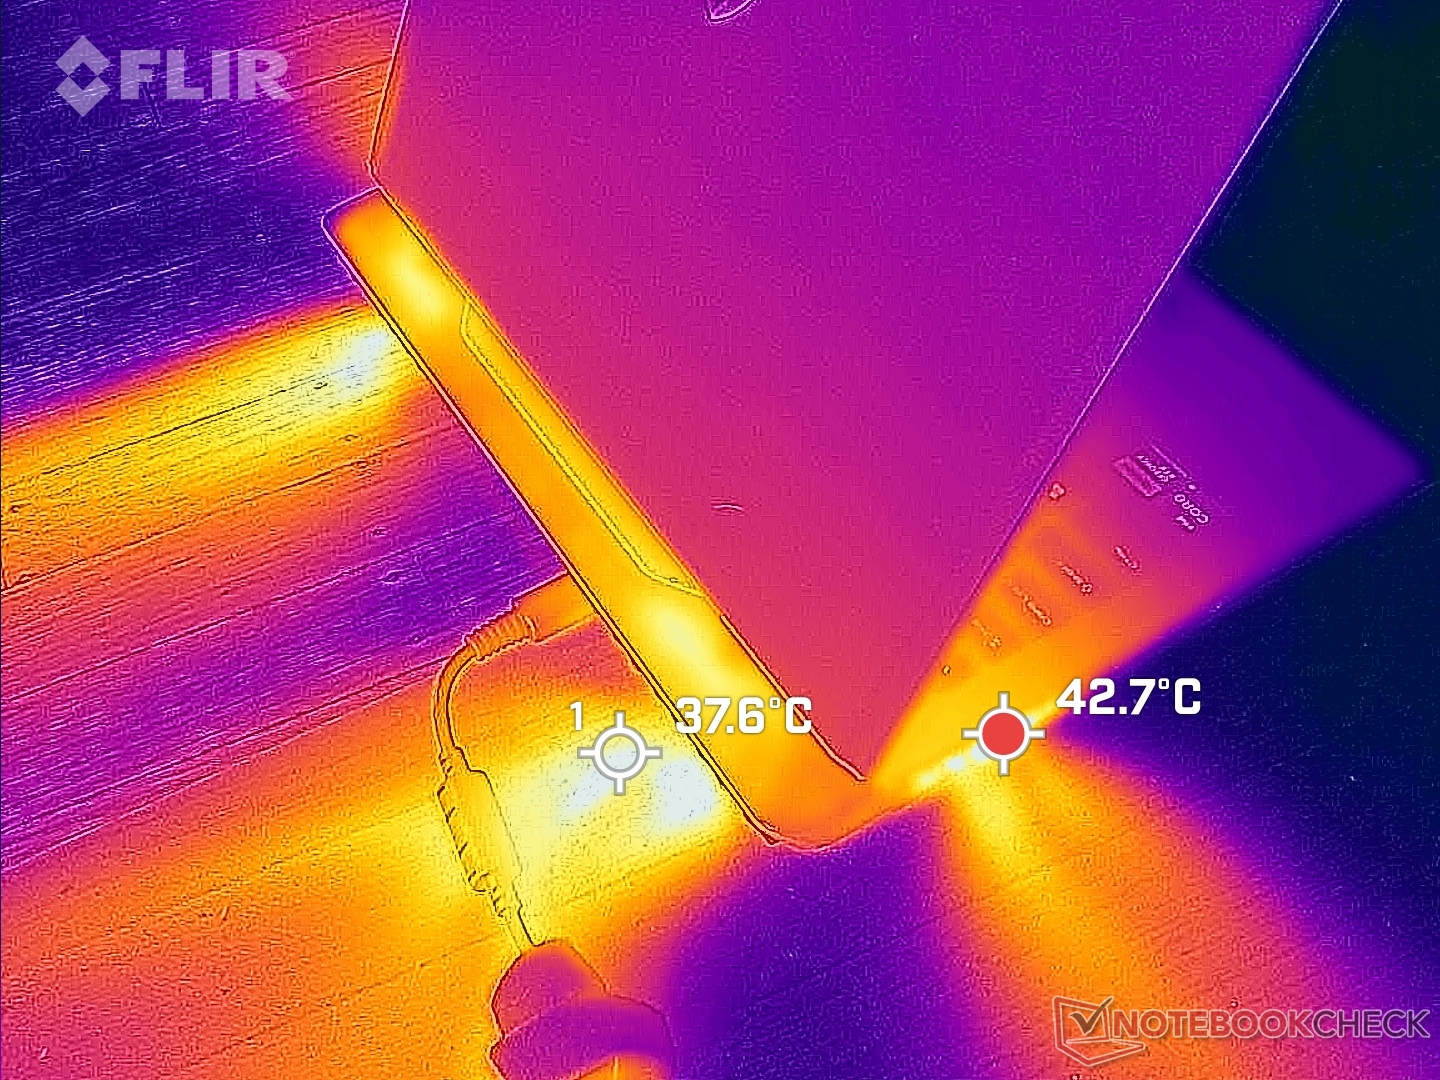
(±) De maximumtemperatuur aan de bovenzijde bedraagt 41.4 °C / 107 F, vergeleken met het gemiddelde van 40.4 °C / 105 F, variërend van 21.2 tot 68.8 °C voor de klasse Gaming.
(-) De bodem warmt op tot een maximum van 45.4 °C / 114 F, vergeleken met een gemiddelde van 43.2 °C / 110 F
(+) Bij onbelast gebruik bedraagt de gemiddelde temperatuur voor de bovenzijde 27.7 °C / 82 F, vergeleken met het apparaatgemiddelde van 33.9 °C / 93 F.
(±) Bij het spelen van The Witcher 3 is de gemiddelde temperatuur voor de bovenzijde 34 °C / 93 F, vergeleken met het apparaatgemiddelde van 33.9 °C / 93 F.
(+) De palmsteunen en het touchpad zijn met een maximum van ###max## °C / 85.3 F koeler dan de huidtemperatuur en voelen daarom koel aan.
(±) De gemiddelde temperatuur van de handpalmsteun van soortgelijke toestellen bedroeg 28.8 °C / 83.8 F (-0.8 °C / -1.5 F).
| MSI Raider GE68HX 13VF Intel Core i9-13950HX, NVIDIA GeForce RTX 4060 Laptop GPU | MSI GE67 HX 12UGS Intel Core i7-12800HX, NVIDIA GeForce RTX 3070 Ti Laptop GPU | HP Omen 16-xf0376ng AMD Ryzen 7 7840HS, NVIDIA GeForce RTX 4070 Laptop GPU | Alienware m16 R1 AMD AMD Ryzen 9 7845HX, NVIDIA GeForce RTX 4080 Laptop GPU | Lenovo Legion Slim 7i 16 Gen 8 Intel Core i9-13900H, NVIDIA GeForce RTX 4070 Laptop GPU | Asus ROG Zephyrus M16 GU604VY-NM042X Intel Core i9-13900H, NVIDIA GeForce RTX 4090 Laptop GPU | |
|---|---|---|---|---|---|---|
| Heat | 9% | -12% | -10% | -6% | -6% | |
| Maximum Upper Side * (°C) | 41.4 | 34.4 17% | 49 -18% | 48 -16% | 49.8 -20% | 50 -21% |
| Maximum Bottom * (°C) | 45.4 | 42 7% | 57 -26% | 39 14% | 48.8 -7% | 58 -28% |
| Idle Upper Side * (°C) | 29.8 | 24 19% | 31 -4% | 37 -24% | 29.4 1% | 26 13% |
| Idle Bottom * (°C) | 31.4 | 33.2 -6% | 31 1% | 36.2 -15% | 30 4% | 28 11% |
* ... kleiner is beter
Stresstest
De CPU steeg naar 4,1 GHz en 183 W bij het starten van Prime95 stress, voordat hij zich een paar seconden later vestigde op 3,6 GHz, 134 W en 93 C. Het herhalen van deze test op het model van vorig jaar met de oudere 12e generatie Core i7-12800HX zou resulteren in een veel lager CPU-pakketvermogen van slechts 55 W om aan te tonen hoeveel veeleisender de nieuwe 13e generatie CPU kan zijn.
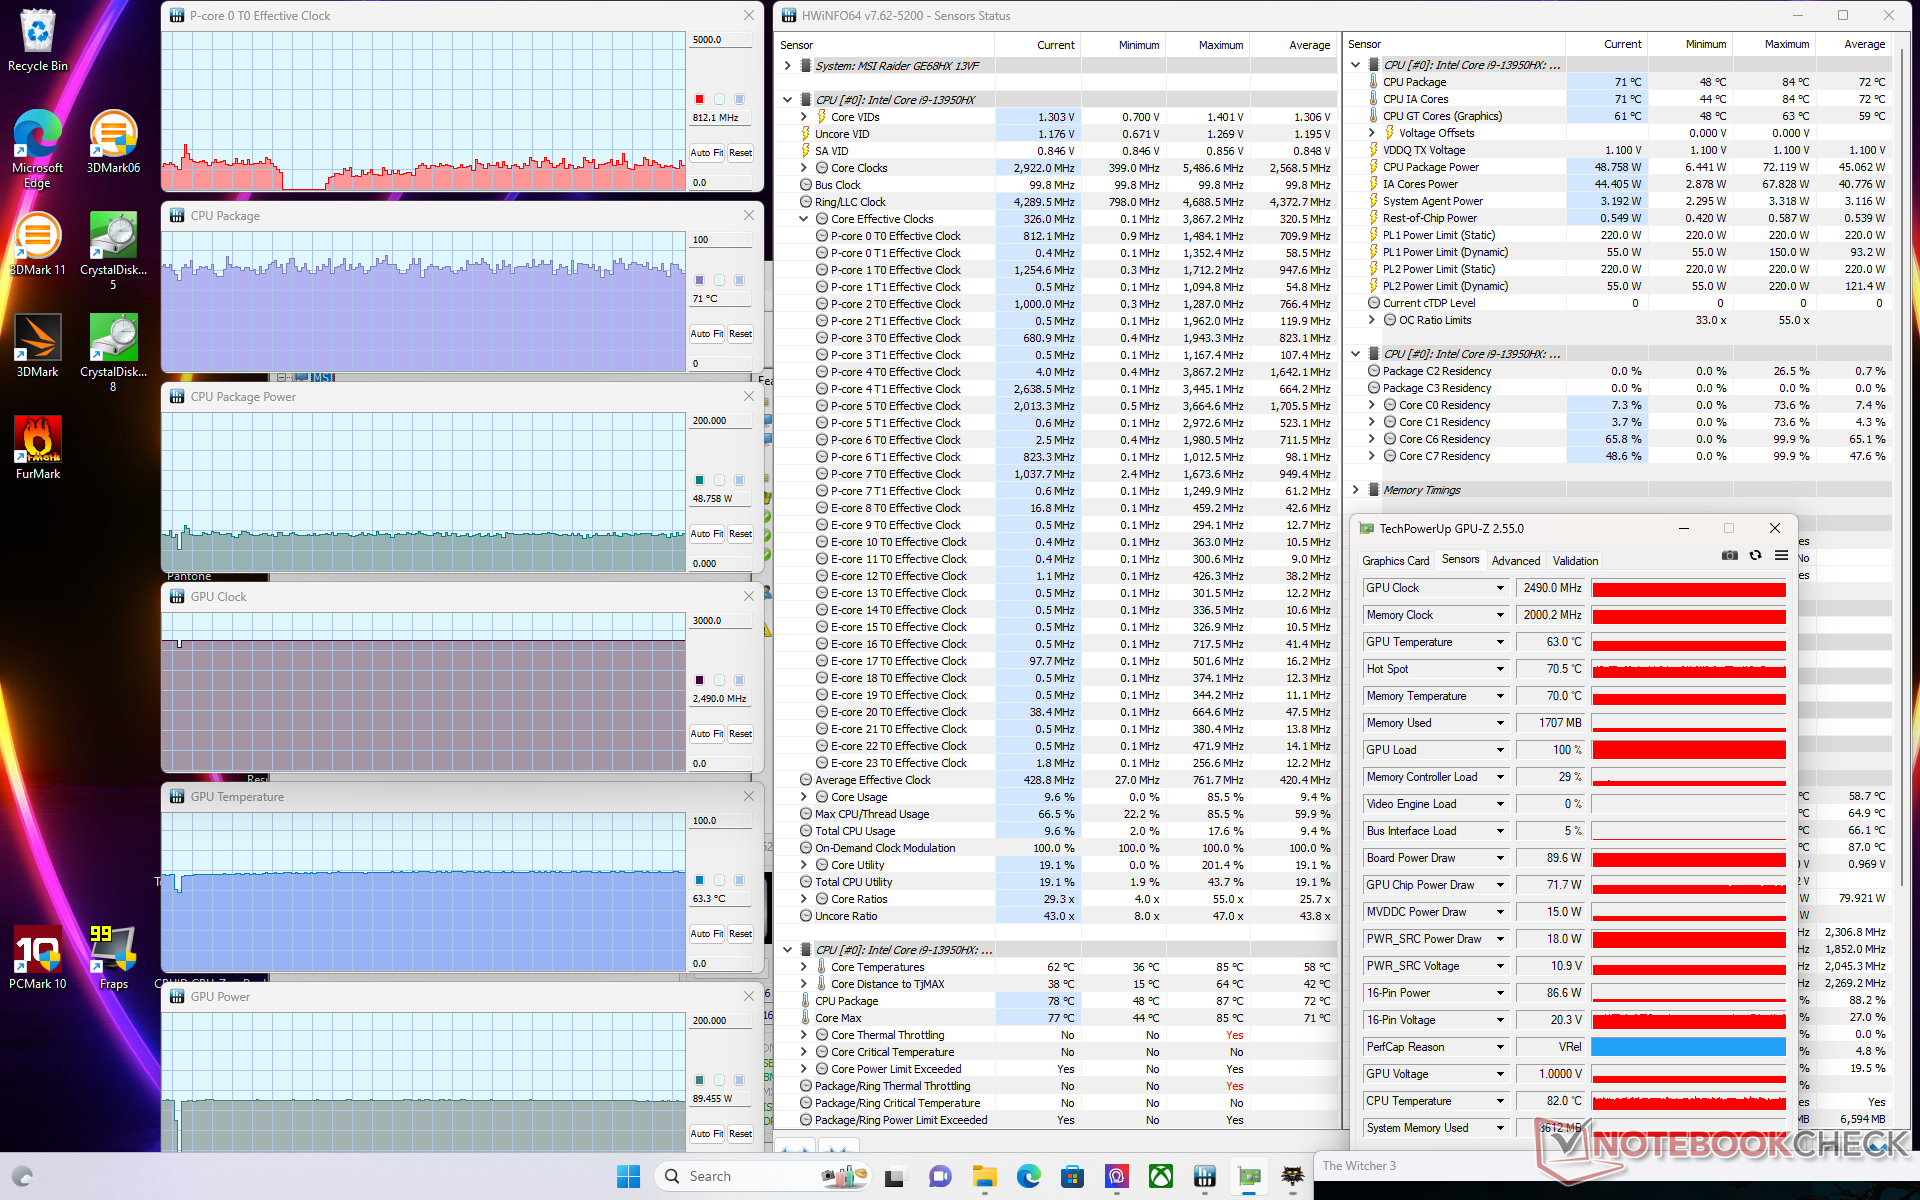
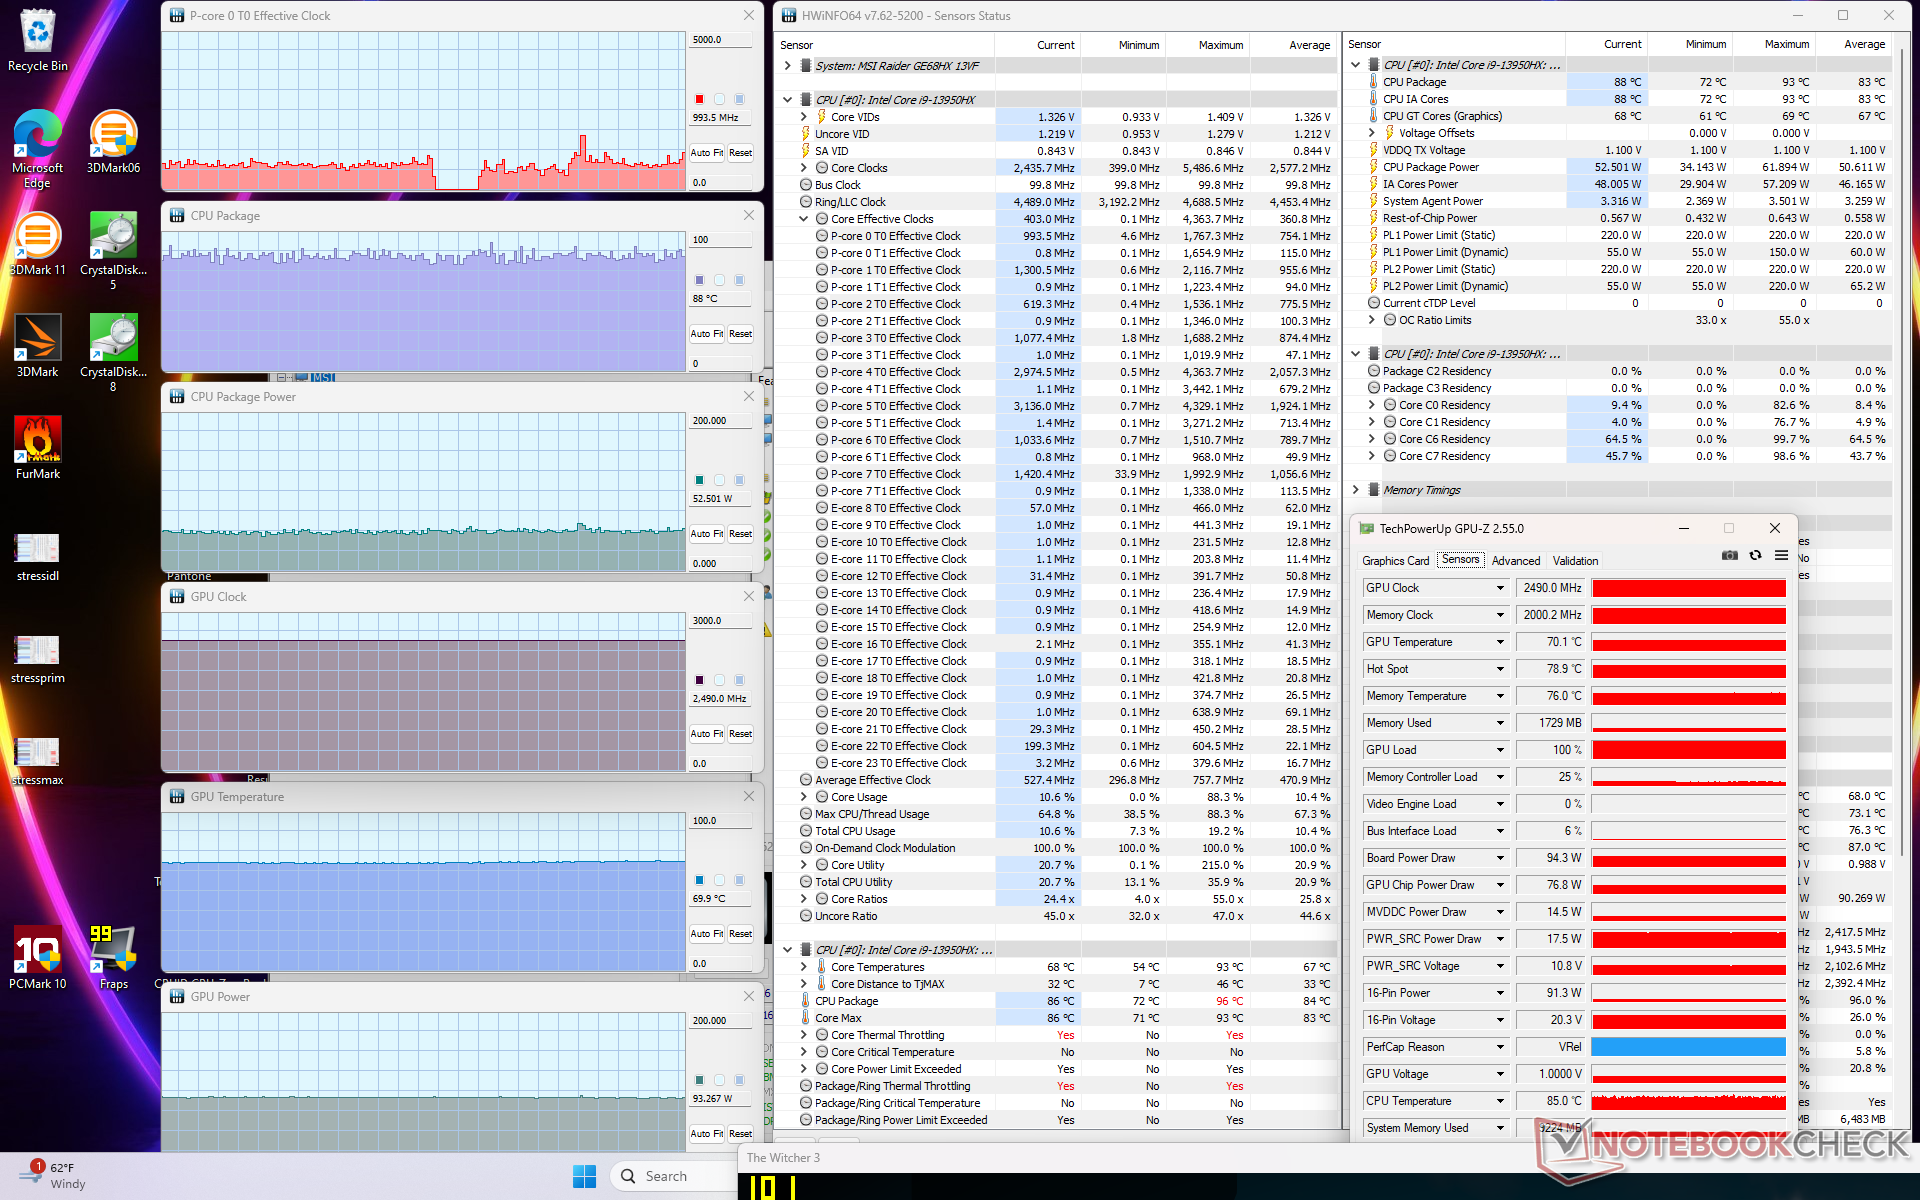
De kloksnelheid en temperatuur van de GPU zouden zich stabiliseren op 2475 MHz en 84 C wanneer deze in de Witcher 3 in gebalanceerde modus. Interessant genoeg zou de kloksnelheid slechts marginaal stijgen tot 2490 MHz als de Extreme Performance-modus wordt gebruikt, terwijl de GPU-temperatuur aanzienlijker zou dalen tot 70 C of zelfs slechts 63 C als Cooler Boost actief is, zoals blijkt uit onze screenshots en onderstaande tabel. De meeste andere MSI gaming laptops zouden vergelijkbare resultaten laten zien. Het is daarom aan te raden om te gamen in de Gebalanceerde modus, omdat de klap voor de GPU-prestaties zeer marginaal is in verhouding tot de immense verschillen in ventilatorgeluid tussen de vooraf ingestelde energieprofielen. De prestatieverschillen tussen de modi Balanced en Performance zijn meestal groter op andere gaming laptops zoals de Asus Zephyrus serie.
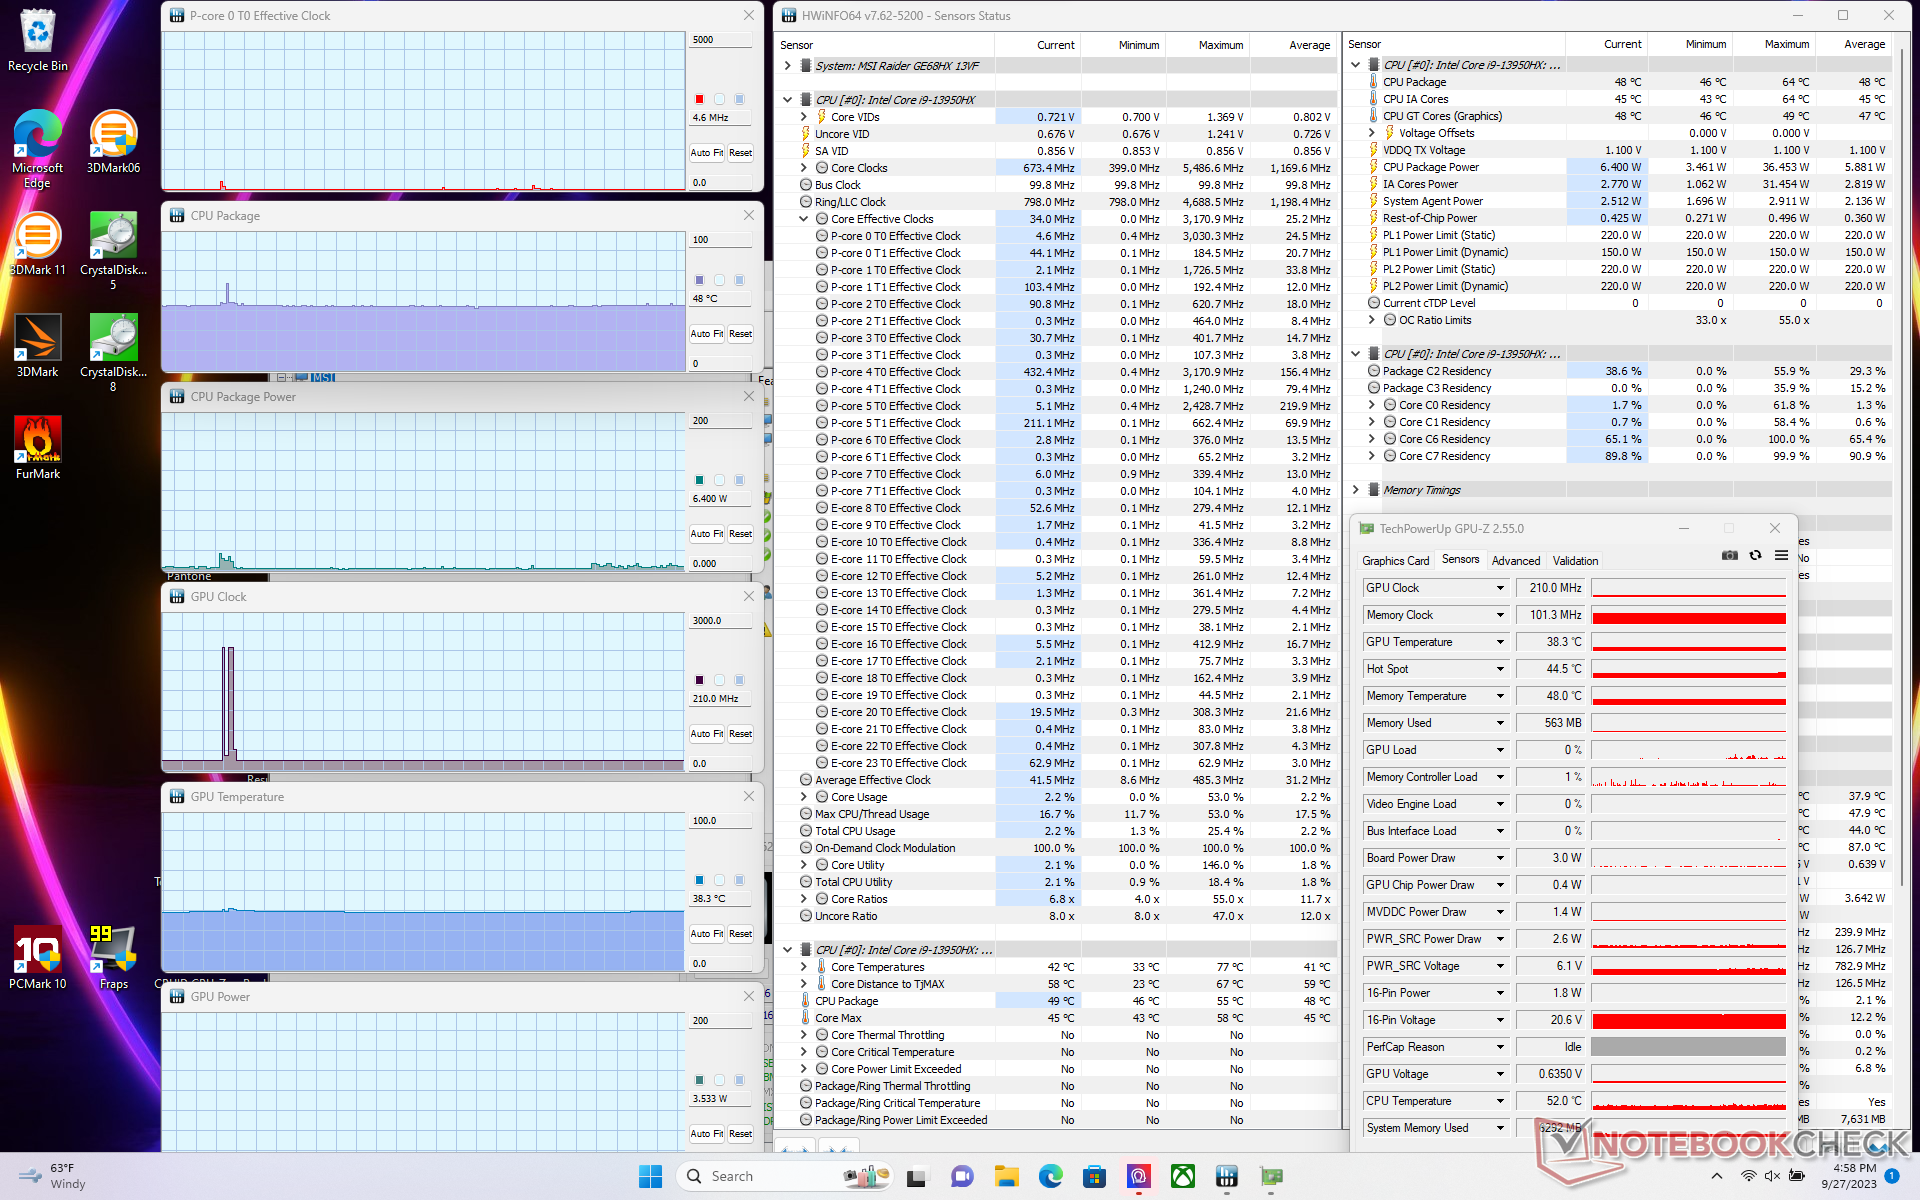
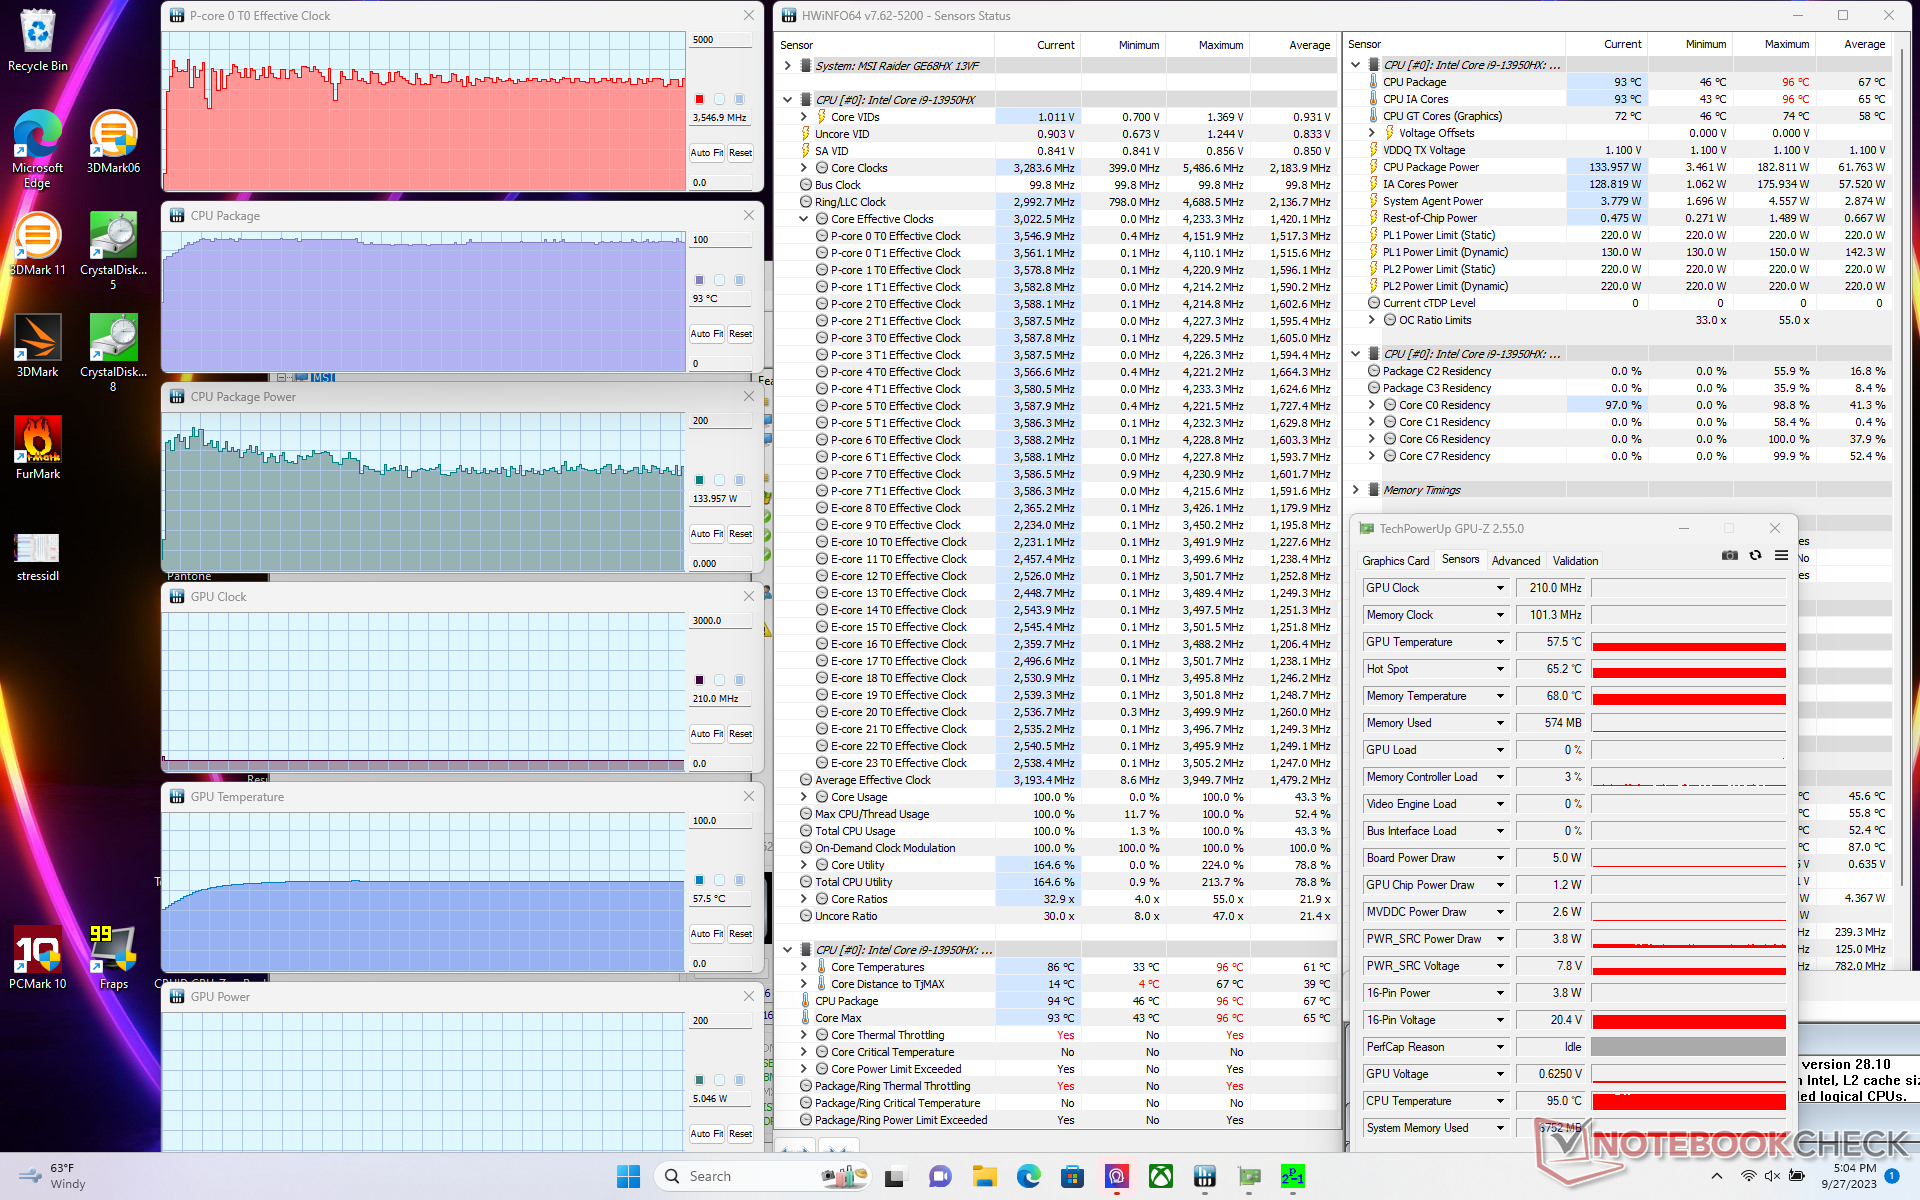
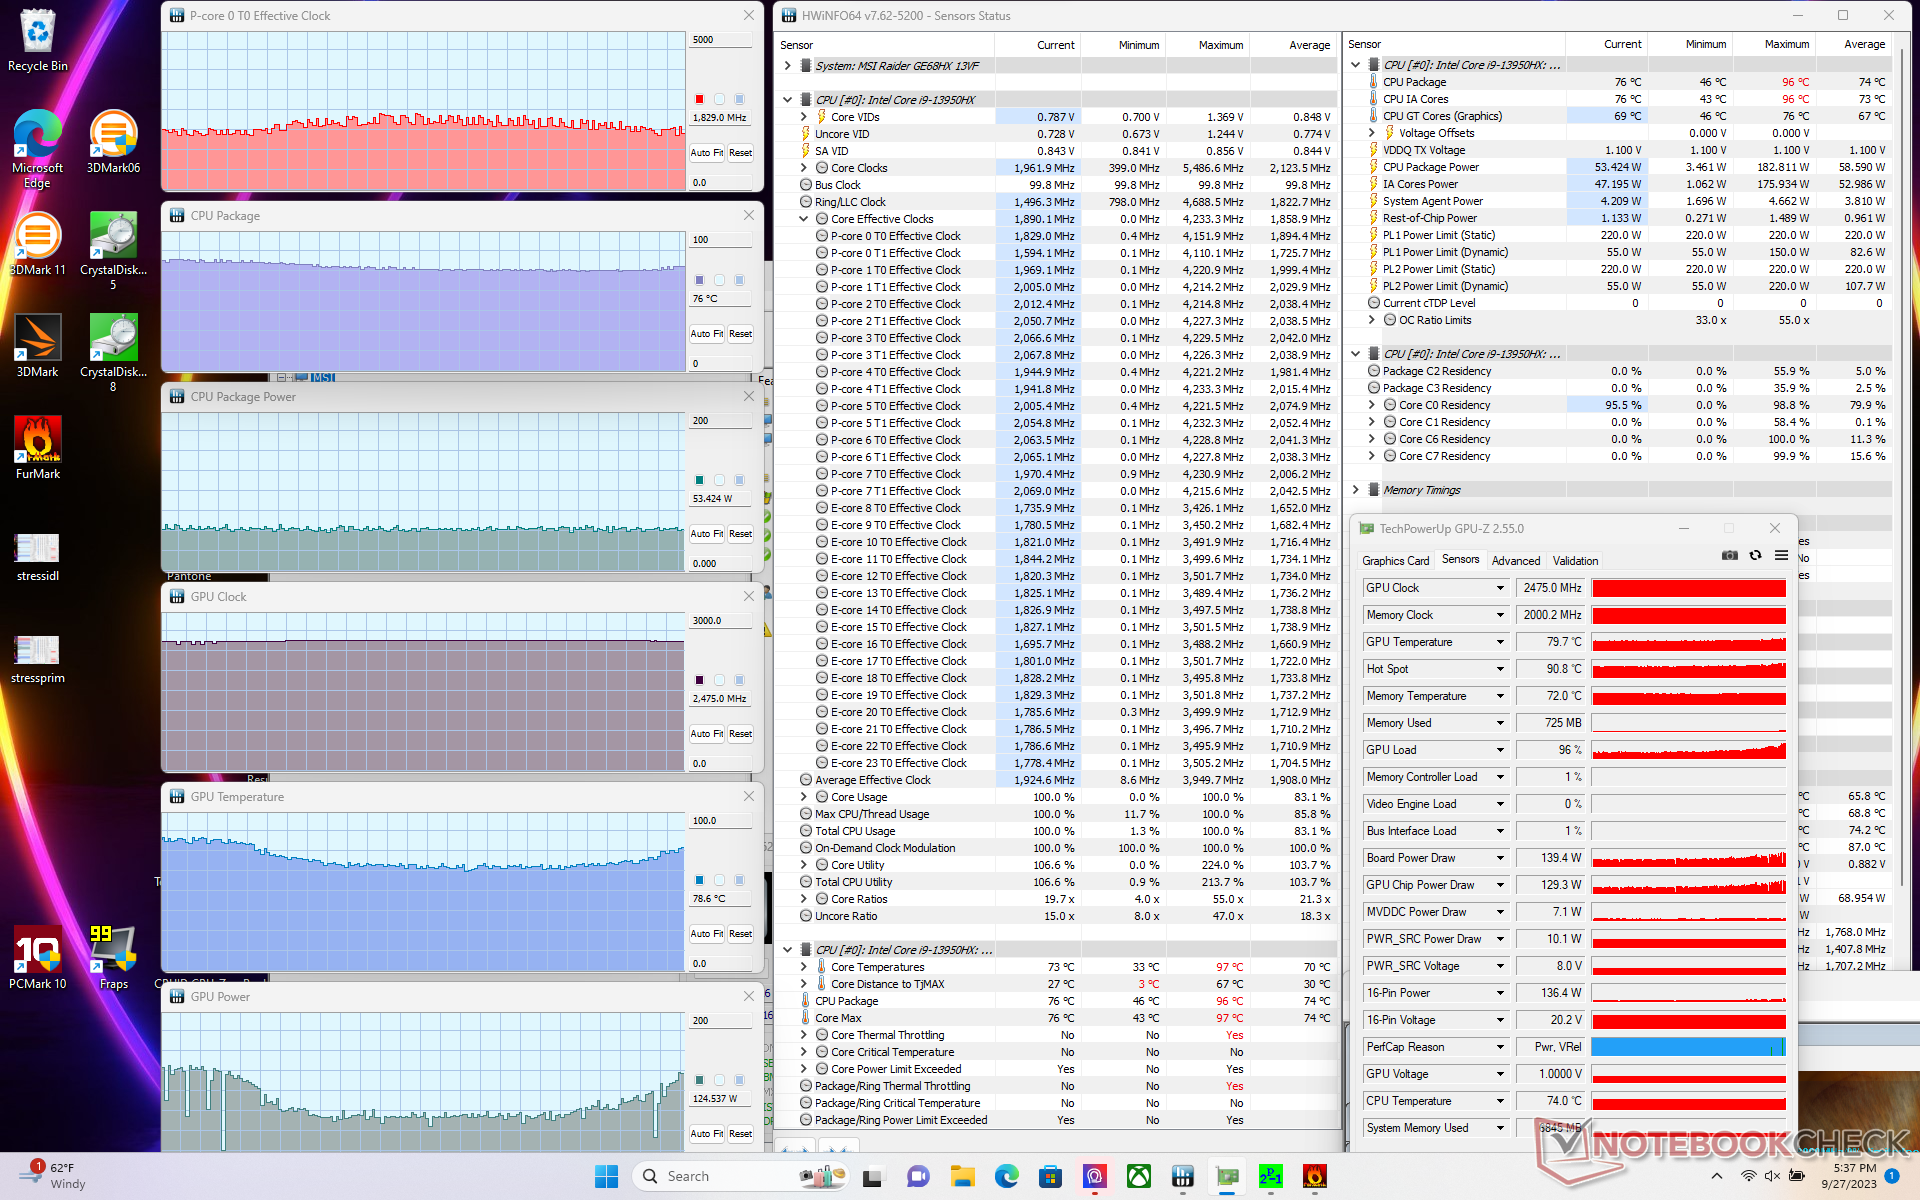
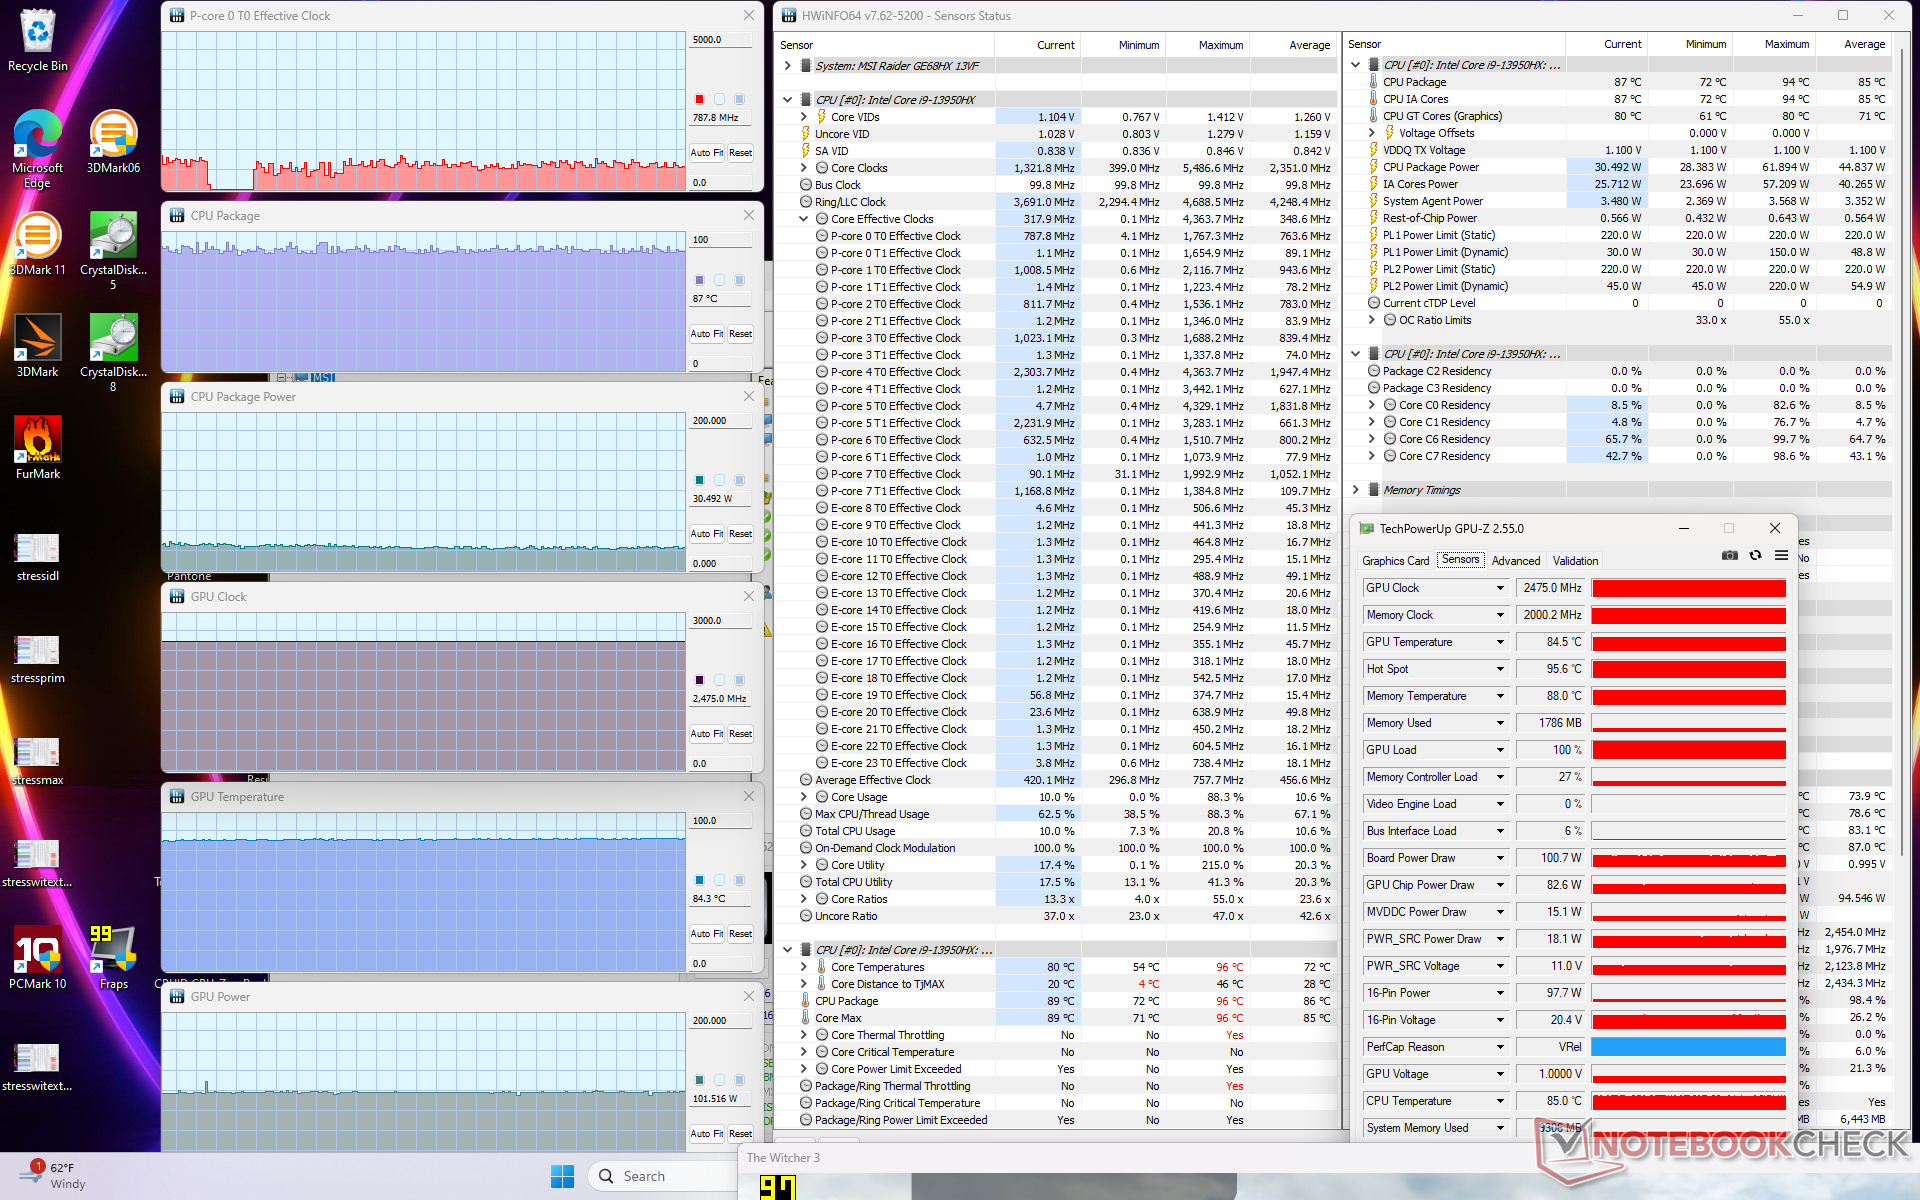
| CPU-klok (GHz) | GPU-klok (MHz) | Gemiddelde CPU-temperatuur (°C) | Gemiddelde GPU-temperatuur (°C) | |
| Inactief systeem | -- | -- | 48 | 38 |
| Prime95-stress (modus Extreme prestaties/ Cooler Boost uit) | ~3.6 | -- | 93 | 58 |
| Prime95 + FurMark-stress (extreme prestatiemodus met Cooler Boost uitgeschakeld) | ~1,9 | 2475 | 73 - 78 | 63 - 81 |
| Witcher 3 Belasting (evenwichtige modus) | ~0,8 | 2475 | 87 | 84 |
| Witcher 3 Belasting (modus Extreme prestaties/ Cooler Boost uit) | ~0,8 | 2490 | 88 | 70 |
| Witcher 3 Stress (modus Extreme prestaties/ Cooler Boost aan) | ~0,8 | 2490 | 71 | 63 |
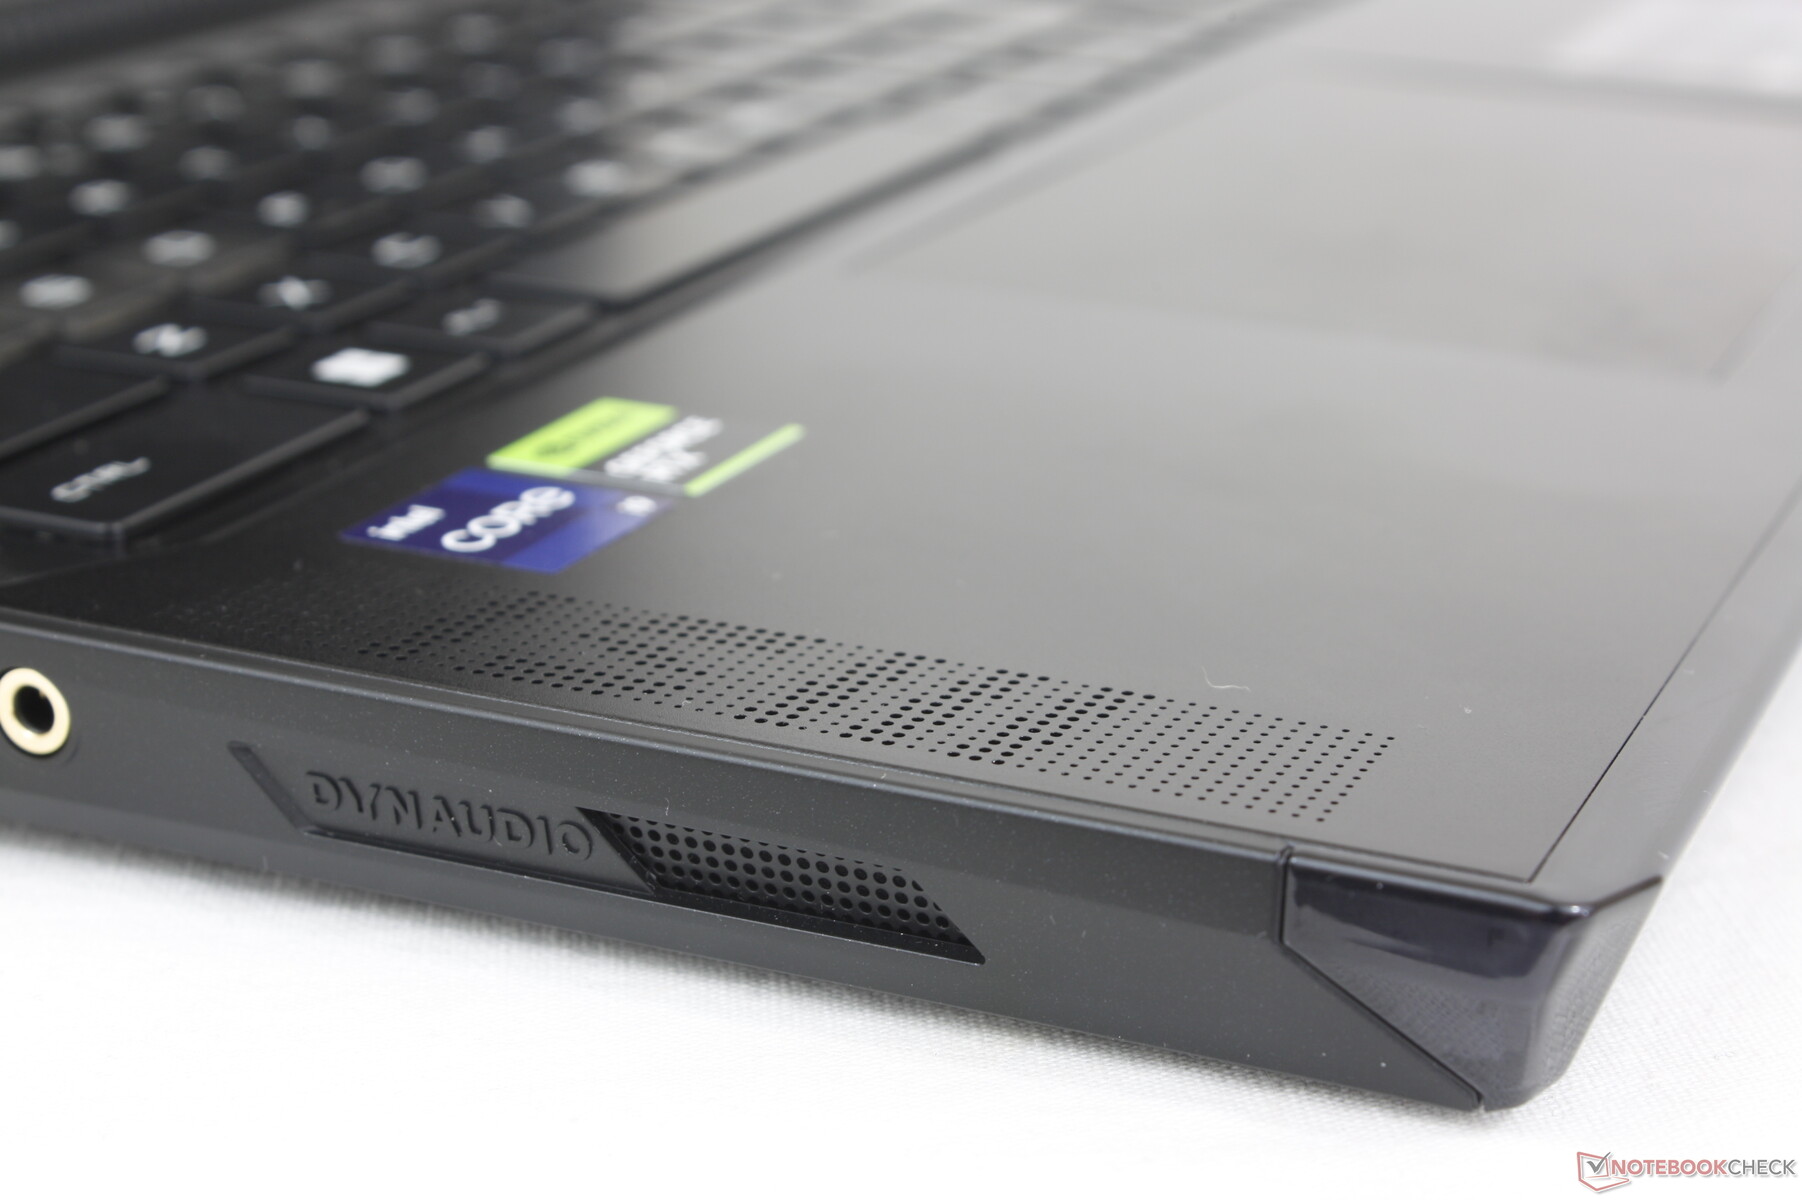
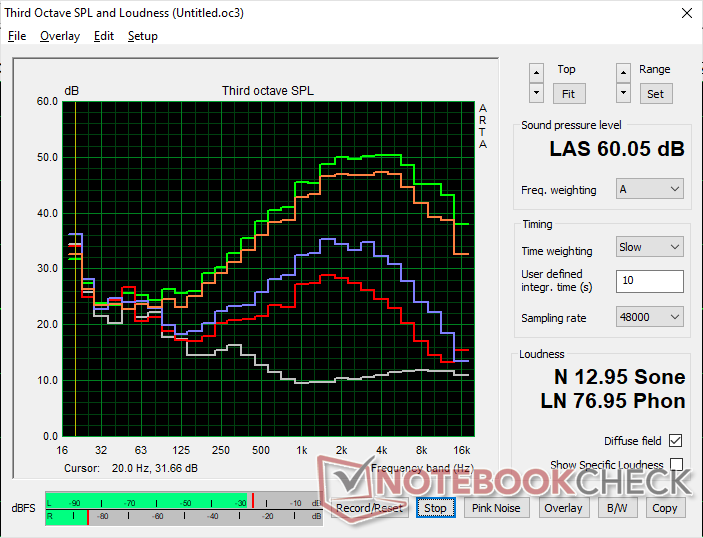
Luidsprekers
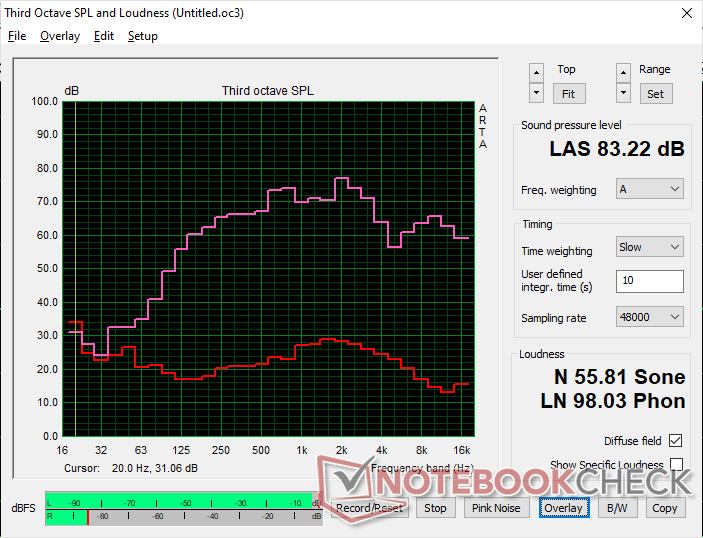
MSI Raider GE68HX 13VF audioanalyse
(+) | luidsprekers kunnen relatief luid spelen (83.2 dB)
Bas 100 - 315 Hz
(±) | verminderde zeebaars - gemiddeld 6% lager dan de mediaan
(±) | lineariteit van de lage tonen is gemiddeld (9.5% delta ten opzichte van de vorige frequentie)
Midden 400 - 2000 Hz
(±) | hogere middens - gemiddeld 5.6% hoger dan de mediaan
(+) | de middentonen zijn lineair (5.8% delta ten opzichte van de vorige frequentie)
Hoog 2 - 16 kHz
(+) | evenwichtige hoogtepunten - slechts 4.5% verwijderd van de mediaan
(±) | lineariteit van de hoogtepunten is gemiddeld (9.5% delta ten opzichte van de vorige frequentie)
Algemeen 100 - 16.000 Hz
(+) | het totale geluid is lineair (13.3% verschil met de mediaan)
Vergeleken met dezelfde klasse
» 19% van alle geteste apparaten in deze klasse waren beter, 5% vergelijkbaar, 76% slechter
» De beste had een delta van 6%, het gemiddelde was 18%, de slechtste was 132%
Vergeleken met alle geteste toestellen
» 14% van alle geteste apparaten waren beter, 3% gelijk, 83% slechter
» De beste had een delta van 4%, het gemiddelde was 23%, de slechtste was 134%
Apple MacBook Pro 16 2021 M1 Pro audioanalyse
(+) | luidsprekers kunnen relatief luid spelen (84.7 dB)
Bas 100 - 315 Hz
(+) | goede baars - slechts 3.8% verwijderd van de mediaan
(+) | de lage tonen zijn lineair (5.2% delta naar de vorige frequentie)
Midden 400 - 2000 Hz
(+) | evenwichtige middens - slechts 1.3% verwijderd van de mediaan
(+) | de middentonen zijn lineair (2.1% delta ten opzichte van de vorige frequentie)
Hoog 2 - 16 kHz
(+) | evenwichtige hoogtepunten - slechts 1.9% verwijderd van de mediaan
(+) | de hoge tonen zijn lineair (2.7% delta naar de vorige frequentie)
Algemeen 100 - 16.000 Hz
(+) | het totale geluid is lineair (4.6% verschil met de mediaan)
Vergeleken met dezelfde klasse
» 0% van alle geteste apparaten in deze klasse waren beter, 0% vergelijkbaar, 100% slechter
» De beste had een delta van 5%, het gemiddelde was 17%, de slechtste was 45%
Vergeleken met alle geteste toestellen
» 0% van alle geteste apparaten waren beter, 0% gelijk, 100% slechter
» De beste had een delta van 4%, het gemiddelde was 23%, de slechtste was 134%
Energiebeheer - Hogere prestaties, hoger verbruik
Stroomverbruik
Het stroomverbruik bij stationair draaien op de desktop is ongeveer hetzelfde als bij het model van vorig jaar. Stationair draaien in de iGPU-modus met de LED's uit bespaart maar liefst 8 W vergeleken met stationair draaien in de dGPU-modus met de LED's aan de voorkant actief.
Bij gebruik van Witcher 3 zou 22 procent minder stroom vragen dan op de RTX 3070 Ti-gevoede GE67HX van vorig jaar, wat overeenkomt met de 10 tot 15 procent tragere grafische prestaties van onze RTX 4060. Omgekeerd zou het draaien van Prime95 21 procent meer stroom vragen dan voorheen voor een toename van 35 tot 40 procent in multi-thread prestaties.
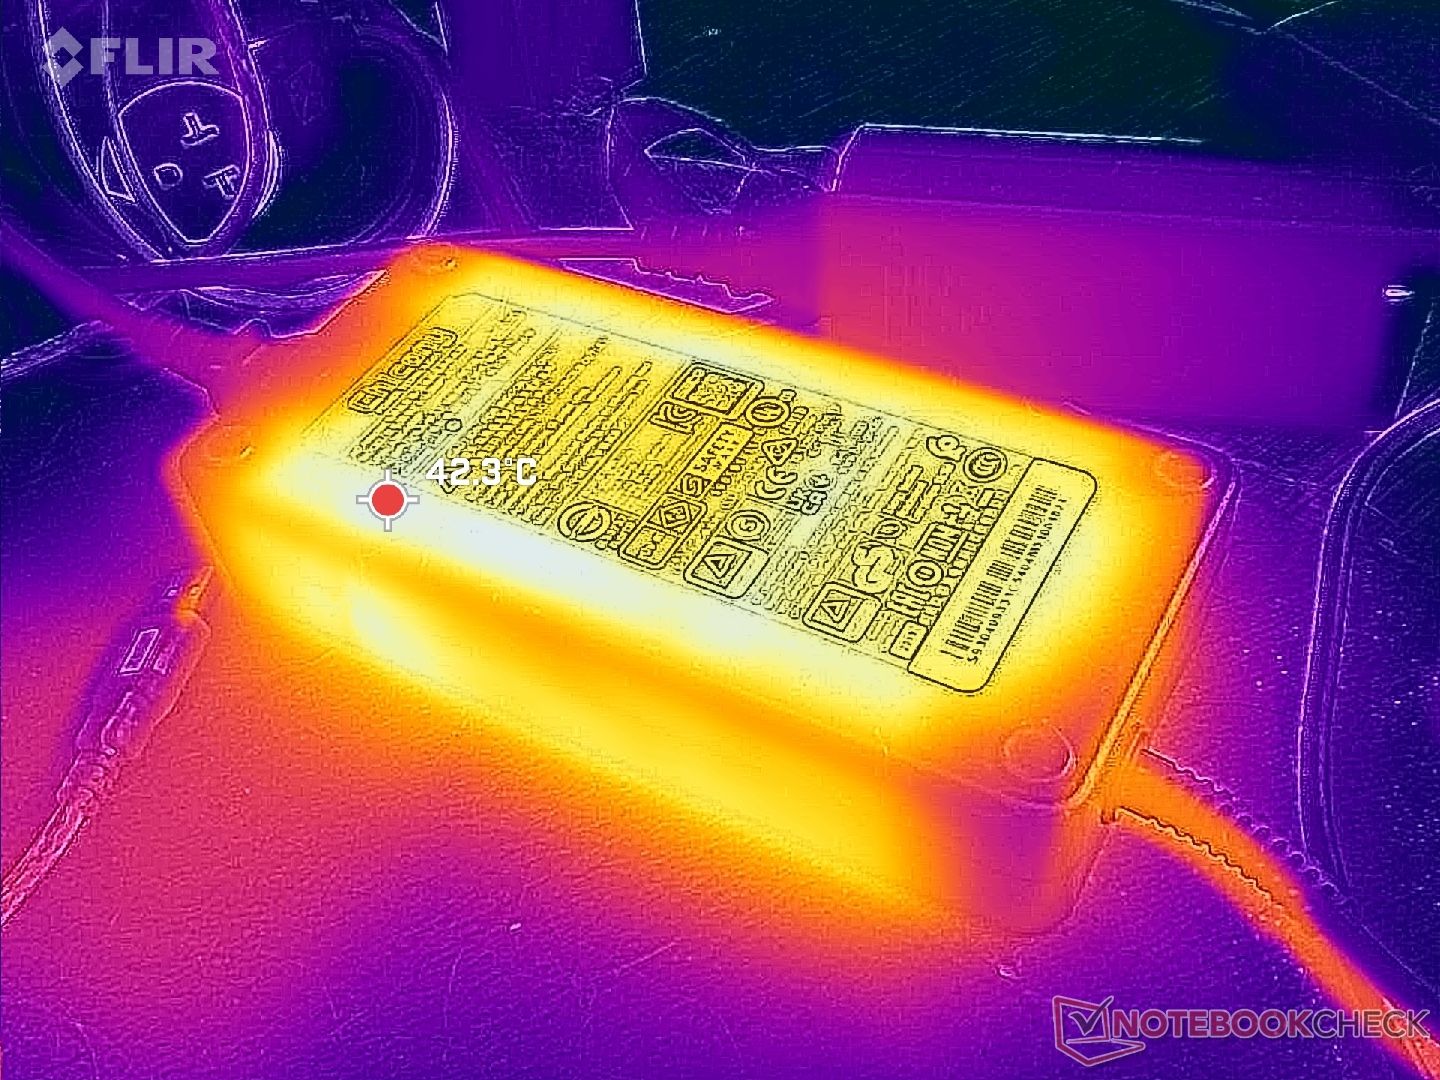
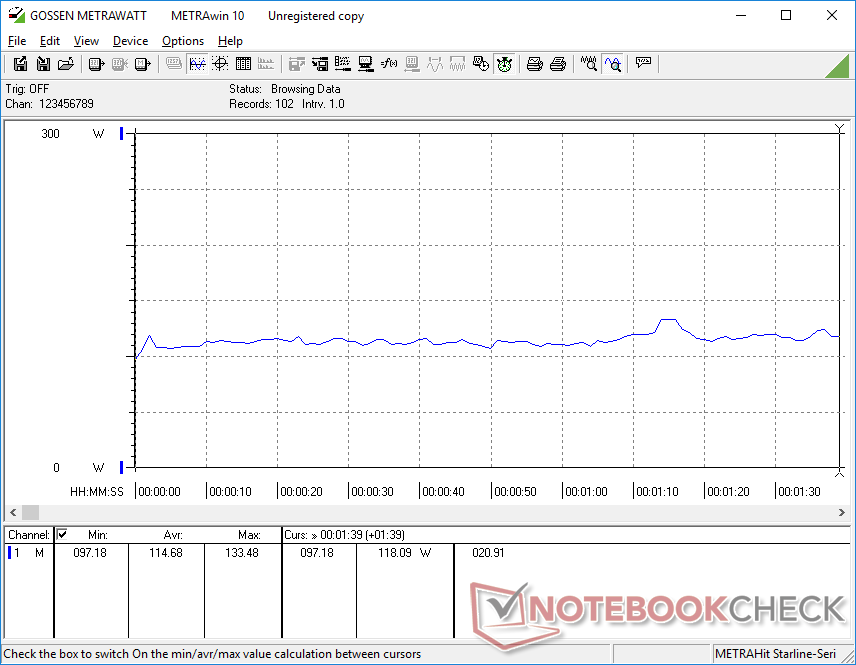
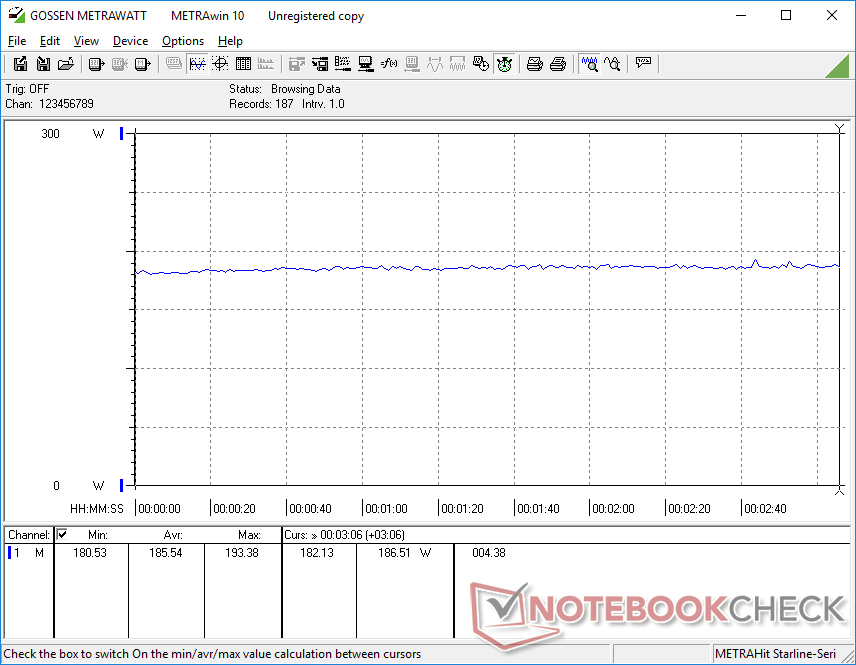
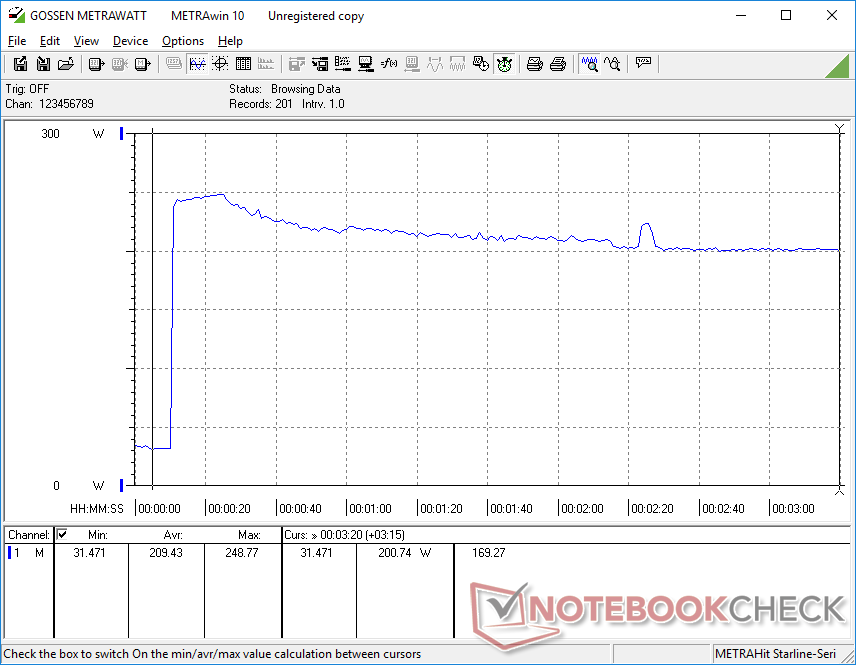
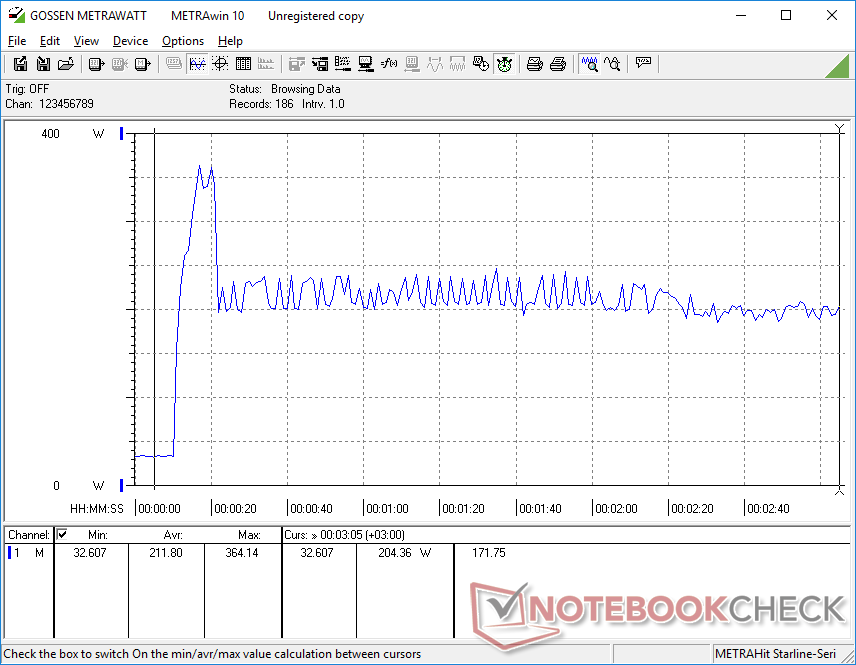
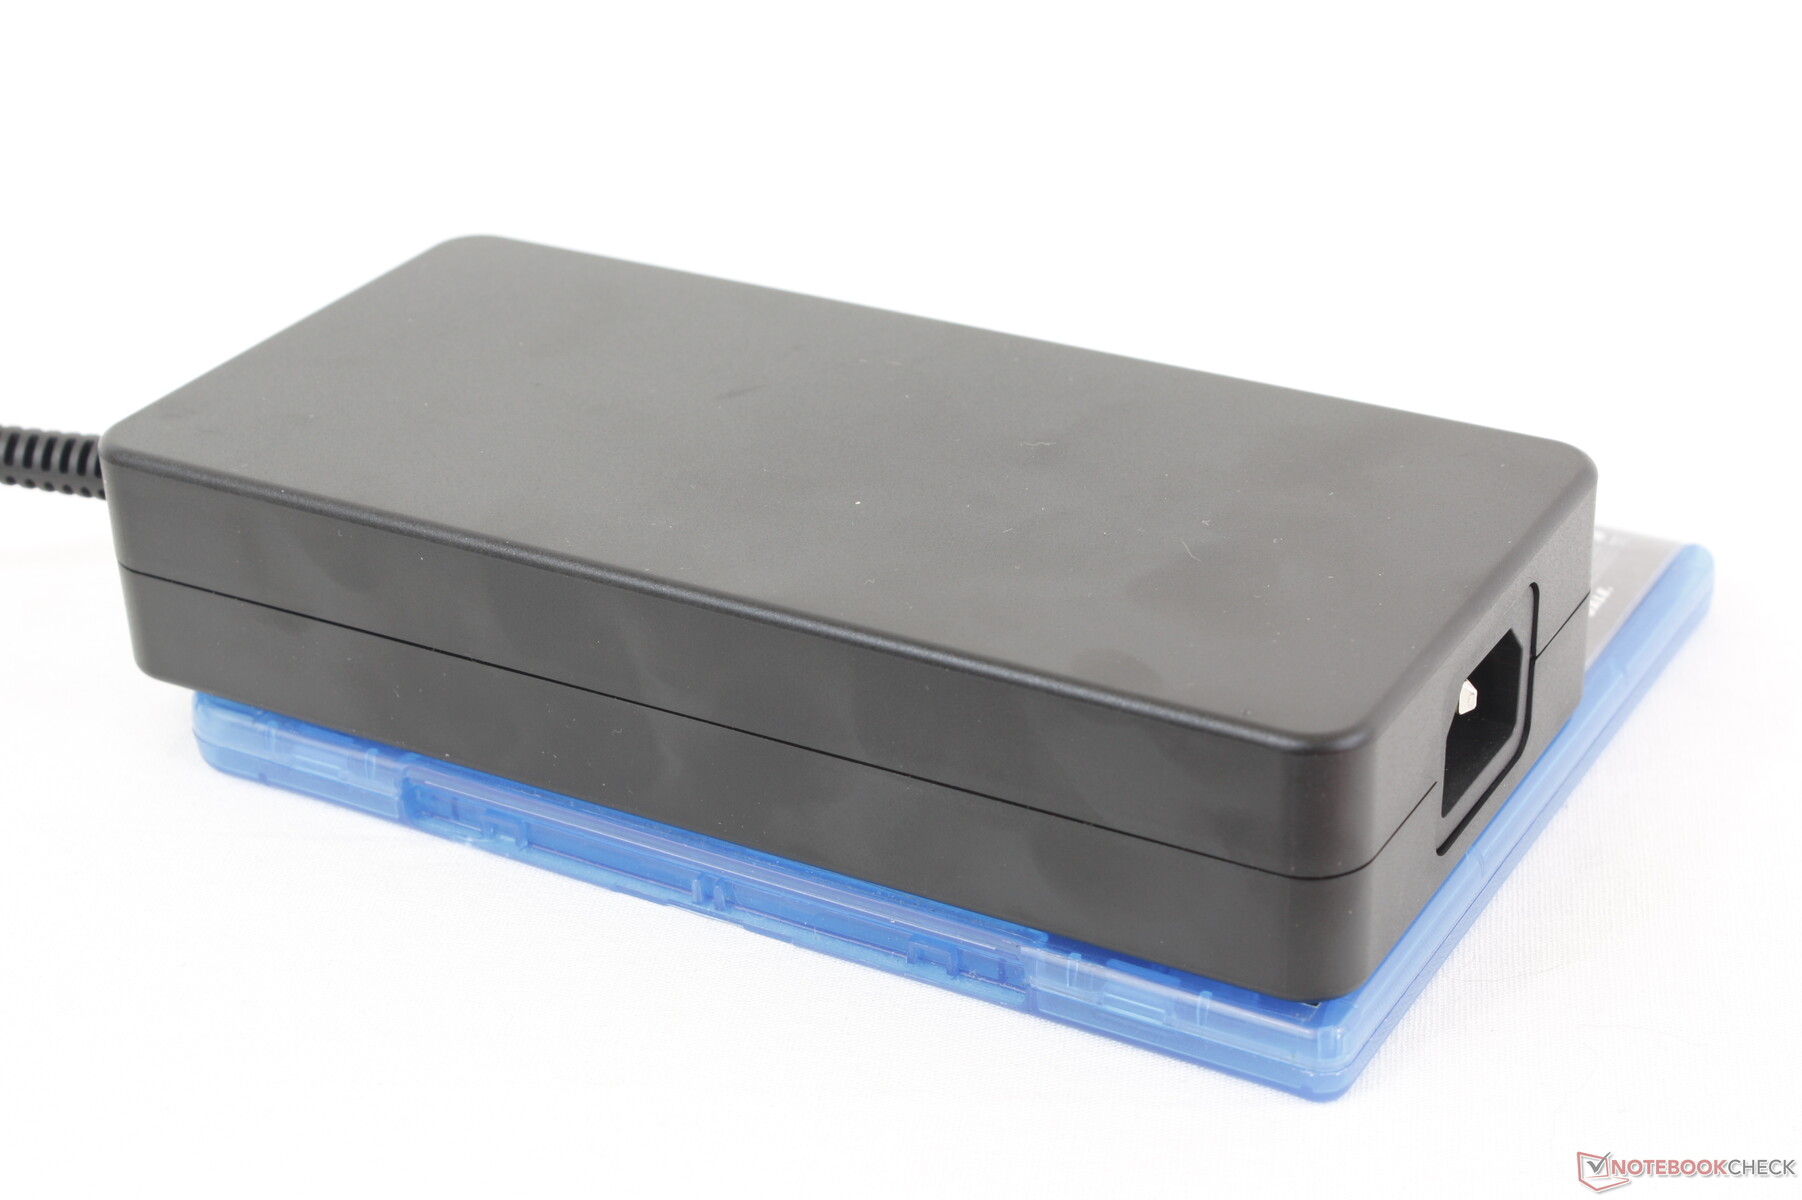
We zijn in staat om een tijdelijke maximale stroomopname van 365 W te registreren van de grote (~18 x 8,5 x 3,5 cm) 280 W AC adapter bij het starten van zowel Prime95 als FurMark stress. Deze snelheid daalde en stabiliseerde rond 204 W na slechts een paar seconden, zoals te zien is in de grafieken hieronder. MSI moet GaN opladen nog toepassen, in tegenstelling tot de nieuwste Razer Blade laptops.
| Uit / Standby | |
| Inactief | |
| Belasting |
|
Key:
min: | |
| MSI Raider GE68HX 13VF i9-13950HX, GeForce RTX 4060 Laptop GPU, Samsung PM9B1 1024GB MZVL41T0HBLB, IPS, 1900x1200, 16" | MSI GE67 HX 12UGS i7-12800HX, GeForce RTX 3070 Ti Laptop GPU, Samsung PM9A1 MZVL21T0HCLR, OLED, 1920x1080, 15.6" | HP Omen 16-xf0376ng R7 7840HS, GeForce RTX 4070 Laptop GPU, WDC PC SN810 512GB, IPS, 1920x1080, 16.1" | Alienware m16 R1 AMD R9 7845HX, GeForce RTX 4080 Laptop GPU, Kioxia XG8 KXG80ZNV1T02, IPS, 2560x1600, 16" | Lenovo Legion Slim 7i 16 Gen 8 i9-13900H, GeForce RTX 4070 Laptop GPU, Samsung PM9A1 MZVL21T0HCLR, IPS, 2560x1600, 16" | Asus ROG Zephyrus M16 GU604VY-NM042X i9-13900H, GeForce RTX 4090 Laptop GPU, Samsung PM9A1 MZVL22T0HBLB, IPS, 2560x1600, 16" | |
|---|---|---|---|---|---|---|
| Power Consumption | 1% | 34% | -81% | -12% | -4% | |
| Idle Minimum * (Watt) | 15.8 | 16.1 -2% | 9 43% | 39 -147% | 22 -39% | 20 -27% |
| Idle Average * (Watt) | 19.4 | 17.1 12% | 14 28% | 44.6 -130% | 29 -49% | 24 -24% |
| Idle Maximum * (Watt) | 27.3 | 26.6 3% | 20 27% | 68.1 -149% | 39.5 -45% | 25 8% |
| Load Average * (Watt) | 114.7 | 116.3 -1% | 84 27% | 129.8 -13% | 98.7 14% | 107 7% |
| Witcher 3 ultra * (Watt) | 185.5 | 237 -28% | 140.9 24% | 285 -54% | 171.8 7% | 208 -12% |
| Load Maximum * (Watt) | 364.2 | 291.1 20% | 176 52% | 327.3 10% | 213.2 41% | 267 27% |
* ... kleiner is beter
Power Consumption Witcher 3 / Stresstest
Power Consumption external Monitor
Levensduur batterij
De accucapaciteit is met 99,9 Wh het hoogst haalbare. De runtimes zijn erg goed voor een 16-inch gaming laptop met iets meer dan 6,5 uur WLAN browsen op het gebalanceerde energieprofiel met de iGPU actief. Dit is een van de langer meegaande 16-inch gaming laptops die we tot nu toe hebben getest.
Helaas is het opladen van leeg naar vol relatief langzaam: 2,5 uur vergeleken met 1,5 uur bij de meeste andere laptops. Bovendien kon geen van onze USB-C AC adapters de laptop opladen via een van de drie USB-C poorten, ook al adverteert MSI met Power Delivery.
| MSI Raider GE68HX 13VF i9-13950HX, GeForce RTX 4060 Laptop GPU, 99.9 Wh | MSI GE67 HX 12UGS i7-12800HX, GeForce RTX 3070 Ti Laptop GPU, 99.9 Wh | HP Omen 16-xf0376ng R7 7840HS, GeForce RTX 4070 Laptop GPU, 83 Wh | Alienware m16 R1 AMD R9 7845HX, GeForce RTX 4080 Laptop GPU, 86 Wh | Lenovo Legion Slim 7i 16 Gen 8 i9-13900H, GeForce RTX 4070 Laptop GPU, 99.9 Wh | Asus ROG Zephyrus M16 GU604VY-NM042X i9-13900H, GeForce RTX 4090 Laptop GPU, 90 Wh | |
|---|---|---|---|---|---|---|
| Batterijduur | -2% | -16% | -52% | -42% | 12% | |
| Reader / Idle (h) | 8.8 | 8.4 -5% | 4 -55% | 5.1 -42% | ||
| WiFi v1.3 (h) | 6.8 | 5.6 -18% | 5.7 -16% | 3.7 -46% | 4.4 -35% | 4.3 -37% |
| Load (h) | 1.8 | 2.1 17% | 0.8 -56% | 0.9 -50% | 2.9 61% | |
| H.264 (h) | 4.8 |
Pro
Contra
Verdict - Niet slecht, maar mist het doel
Hoewel we de fabrikant waarderen voor het gaan in een andere richting met zijn gaming laptop ontwerpen, zijn we ervan overtuigd dat de veranderingen niet ten koste mogen gaan van de bruikbaarheid voor de eindgebruiker. De GE68HX is moeilijker te openen dan het ontwerp van vorig jaar en dit kan vooral problematisch zijn op een gaming laptop waar eigenaren eerder geneigd zijn om zelf extra RAM en opslag toe te voegen. Ten tweede is het nieuwe ontwerp merkbaar dikker en zwaarder dan het "schonere" uiterlijk van de GE67HX, wat misschien niet goed valt bij veel gebruikers.
Er zijn nog steeds een handvol voordelen met het nieuwere chassis. Ten eerste voelen de scharnieren steviger aan dan voorheen, terwijl de rest van het chassis net zo sterk is. Ten tweede zijn de kerntemperaturen koeler dan op de GE67HX voor een beter overklokpotentieel. De prestaties zijn zelfs iets sneller dan verwacht op het standaard stroomprofiel en de standaardinstellingen. En tot slot kunnen sommige gebruikers het grotere clickpad en het nieuwe numpad waarderen voor andere toepassingen dan gamen.
Prestaties en temperaturen profiteren van het dikkere chassisontwerp, maar niet iedereen zal blij zijn met het zwaardere gewicht, de moeilijkere onderhoudsmogelijkheden en de low-end schermopties gezien de hoge startprijs.
Voor $1700 USD en meer lijken de bezuinigingen op weergavekleuren, G-Sync en SSD-prestaties echter onnodig voor een model uit de GE-serie in het hogere segment. Dergelijke compromissen worden eerder verwacht voor modellen in de goedkopere MSI Sword of Katana series. De fabrikant loopt ook achter op het gebied van oplaadtechnologie; kleinere en meer draagbare GaN-opladers van Razer kunnen net zoveel vermogen leveren, terwijl USB-C-oplaadondersteuning op de GE68HX onbetrouwbaar lijkt.
Alternatieven zoals deLenovo Legion Slim 7i 16 Gen 8, Asus ROG Zephyrus M16of Razer Blade 16 bieden misschien niet altijd Core-HX CPU's, maar ze zijn veel draagbaarder en hebben vergelijkbare grafische opties en betere schermen.
Prijs en beschikbaarheid
MSI Raider GE68HX 13VF
- 30-09-2023 v7 (old)
Allen Ngo
Transparantie
De selectie van te beoordelen apparaten wordt gemaakt door onze redactie. Het proefexemplaar werd door de auteur op eigen kosten vrijelijk aangekocht. De kredietverstrekker had geen invloed op deze recensie, noch ontving de fabrikant vóór publicatie een exemplaar van deze recensie. Er bestond geen verplichting om deze recensie te publiceren. Als onafhankelijk mediabedrijf is Notebookcheck niet onderworpen aan het gezag van fabrikanten, detailhandelaren of uitgevers.
[transparency_disclaimer]Dit is hoe Notebookcheck test
Elk jaar beoordeelt Notebookcheck onafhankelijk honderden laptops en smartphones met behulp van gestandaardiseerde procedures om ervoor te zorgen dat alle resultaten vergelijkbaar zijn. We hebben onze testmethoden al zo'n 20 jaar voortdurend ontwikkeld en daarbij de industriestandaard bepaald. In onze testlaboratoria wordt gebruik gemaakt van hoogwaardige meetapparatuur door ervaren technici en redacteuren. Deze tests omvatten een validatieproces in meerdere fasen. Ons complexe beoordelingssysteem is gebaseerd op honderden goed onderbouwde metingen en benchmarks, waardoor de objectiviteit behouden blijft. Meer informatie over onze testmethoden kunt u hier vinden.
Price comparison

