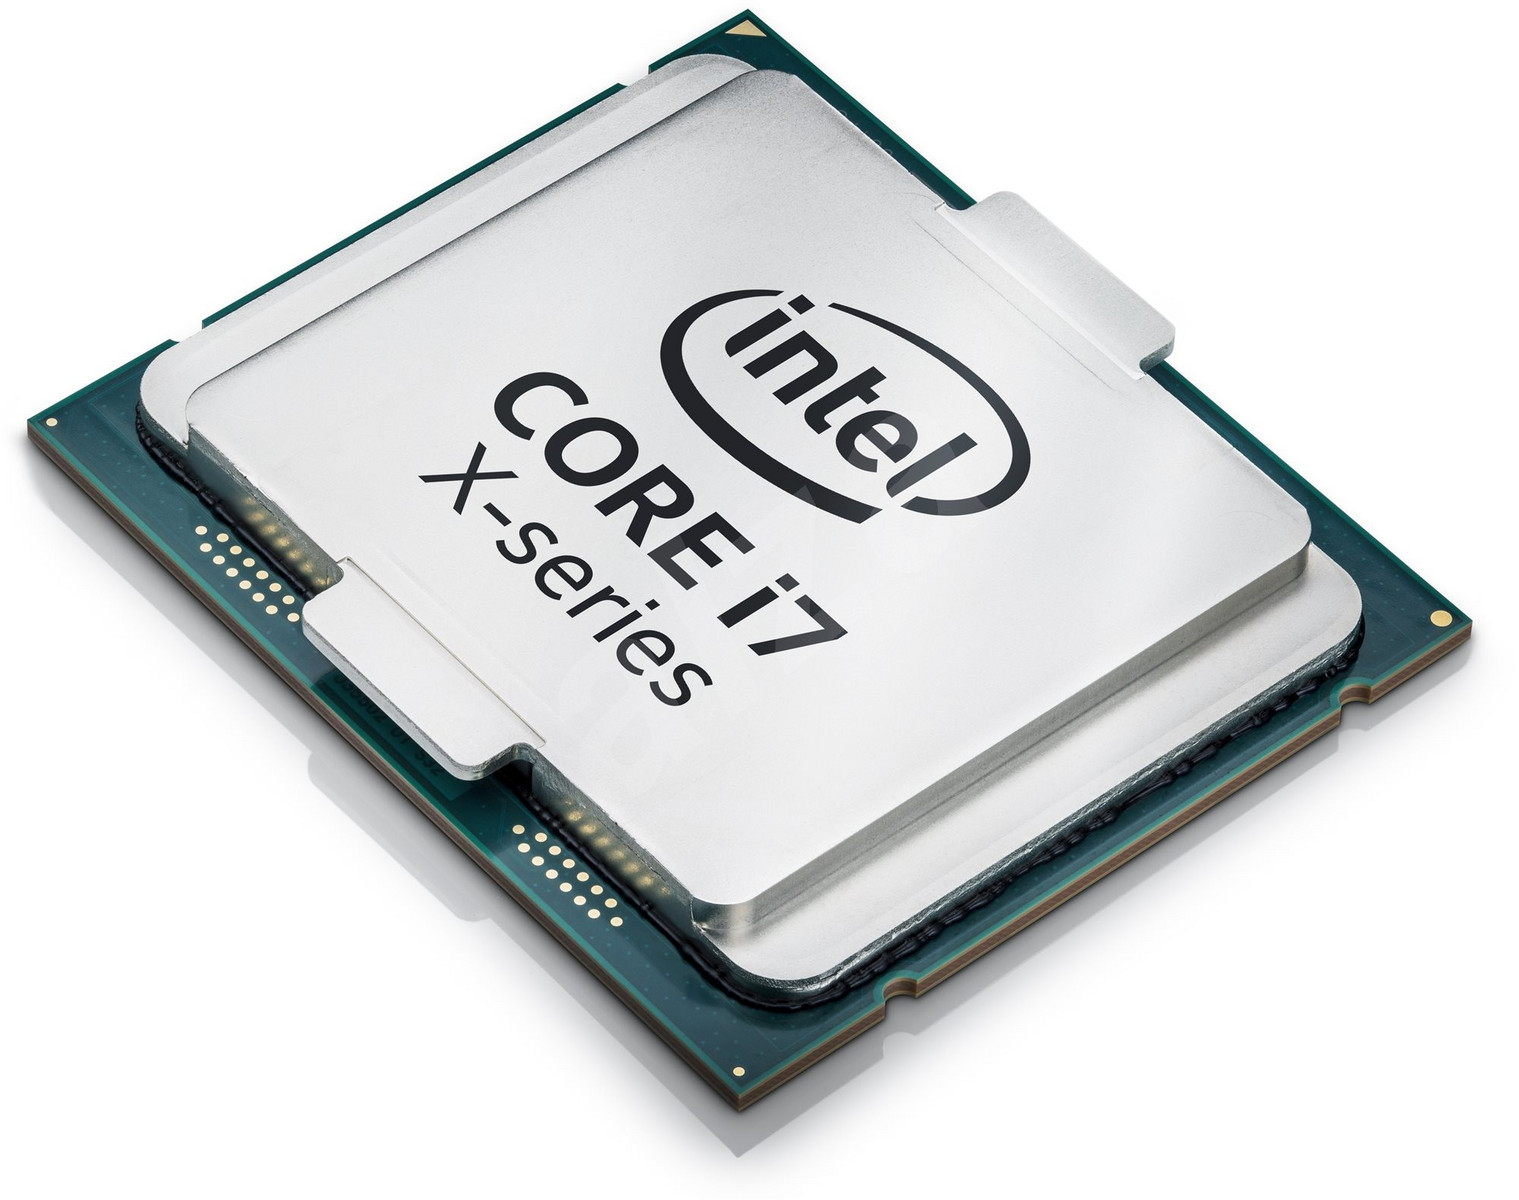
| Codenaam | Kaby Lake-X |
| Serie | Intel Kaby Lake |
| Kloksnelheid | 4300 - 4500 MHz |
| Level 1 Cache | 256 KB |
| Level 2 Cache | 1 MB |
| Level 3 Cache | 8 MB |
| Aantal Cores / Threads | 4 / 8 |
| Stroomverbruik (TDP = Thermal Design Power) | 112 Watt |
| Productietechnologie | 14 nm |
| Socket | FCLGA-2066 |
| Features | DDR4-2666 Memory Controller, HyperThreading, AVX, AVX2, AES-NI, TSX-NI, Quick Sync, Virtualization, vPro |
| 64-Bit | 64-Bit-ondersteuning |
| Architecture | x86 |
| Aankondigingsdatum | 30-05-2017 |
Performance Rating - CB R15 + R20 + 7-Zip + X265 + Blender + 3DM11 CPU
...
Intel Core i7-8086K
Intel Core i5-1240U
AMD Ryzen 7 3700X
...
Cinebench R23 - Cinebench R23 Multi Core
...
Intel Core i7-8850H
Intel Core i3-10320
Intel Core Ultra 5 115U
AMD Ryzen 5 1600
...
Cinebench R23 - Cinebench R23 Single Core
...
Intel Core i3-10320
Intel Core i7-10700
...
Apple M5 10-Core
Cinebench R20 - Cinebench R20 CPU (Single Core)
...
Intel Core i3-10320
Intel Core i9-7900X
Intel Core i9-9980XE
Intel Core i7-8559U
Intel Core i7-9700
Intel Core i7-9700K
...
Intel Core Ultra 7 270K Plus
Cinebench R20 - Cinebench R20 CPU (Multi Core)
...
Intel Core i7-7700K
AMD Ryzen 3 3100
Intel Core i3-10320
Apple M2
Intel Core i5-9400F
Intel Core Ultra 5 115U
Intel Core i7-8850H
Intel Core i7-9750H
AMD Ryzen 5 1600
...
Cinebench R15 - Cinebench R15 CPU Multi 64 Bit
min: 988 gem: 991 mediaan: 991 (6%) max: 994 Points
...
Intel Core i7-7700K
Intel Core i5-8400
Intel Core Ultra 5 115U
Intel Core i3-10320
Intel Core i5-8500
Intel Core i5-9400F
Intel Core i5-8600K
unknown
Apple M1
Intel Xeon E-2176M
Intel Core i5-9600K
Intel Xeon E-2186M
...
Cinebench R15 - Cinebench R15 CPU Single 64 Bit
min: 195 gem: 195.5 mediaan: 195.5 (54%) max: 196 Points
...
Intel Core i5-9600K
Intel Core i7-8700
Intel Xeon E-2276M
AMD Ryzen Threadripper PRO 3995WX
Intel Core i9-8950HK
Intel Core i7-10700
AMD Ryzen 9 3900
Intel Core i9-9980XE
Intel Core i7-9700
...
Intel Core Ultra 9 285K
Cinebench R11.5 - Cinebench R11.5 CPU Multi 64 Bit
Intel Atom Z670
...
Intel Core i5-8500
Intel Core i7-7700K
Intel Core i3-10320
Intel Core i7-3960X
Intel Core i5-8600K
AMD Ryzen 3 3100
Intel Core i5-9600K
Intel Core i5-8400
Intel Core i5-9400F
...
Intel Core Ultra 7 270K Plus
Cinebench R11.5 - Cinebench R11.5 CPU Single 64 Bit
...
Intel Core i7-7700K
AMD Ryzen Threadripper PRO 3975WX
AMD Ryzen 7 4800HS
Intel Core i7-8700K
Intel Core i9-7900X
Intel Xeon E-2176G
Intel Core i9-9980XE
AMD Ryzen 9 3900
Intel Core i9-8950HK
Intel Core i5-9600K
...
Intel Core Ultra 9 285K
Cinebench R10 - Cinebench R10 Rend. Single (32bit)
min: 7395 gem: 7397 mediaan: 7396.5 (45%) max: 7398 punten
AMD Geode LX 800
...
Intel Core i7-8700K
Intel Core i7-7700K
Intel Core i9-9980XE
Intel Xeon E-2176G
Intel Core i7-9700
Intel Core i7-10700
...
Cinebench R10 - Cinebench R10 Rend. Multi (32bit)
min: 29290 gem: 29538 mediaan: 29537.5 (21%) max: 29785 punten
Intel Atom Z670
...
Intel Core i3-10320
Intel Core Ultra 5 115U
Intel Core i7-7700K
AMD Ryzen 7 1700
AMD Ryzen 5 2600X
Intel Core i5-8400
Intel Xeon E5-2680 v4
Intel Core i9-9900T
AMD Ryzen 7 2700
Intel Core i5-9400F
...
Cinebench R10 - Cinebench R10 Rend. Multi (64bit)
...
Intel Core i7-6700K
Intel Core Ultra 5 115U
AMD Ryzen 3 3100
Intel Core i5-8500
Intel Core i5-9600K
Intel Core i5-9400F
Intel Core i7-9750H
Intel Xeon E5-2680 v4
...
Intel Core Ultra 7 270K Plus
Cinebench R10 - Cinebench R10 Rend. Single (64bit)
...
Intel Core i5-1035G1
Intel Core i7-8700K
Intel Core i5-9600K
Intel Core i9-8950HK
Intel Core i7-9700K
Intel Core i7-9700
AMD Ryzen Threadripper PRO 3995WX
Intel Core i7-10700
AMD Ryzen Threadripper PRO 3975WX
AMD Ryzen 7 3700X
Intel Core i7-10700K
...
Intel Core Ultra 7 270K Plus
wPrime 2.10 - wPrime 2.0 1024m *
...
Intel Core i7-980X EE
Intel Core i9-9900T
Intel Xeon E-2176M
AMD Ryzen 9 9955HX3D
Intel Core i7-7700K
...
VIA C3-M C3-M-1200
wPrime 2.10 - wPrime 2.0 32m *
min: 5.4 gem: 5.4 mediaan: 5.4 (1%) max: 5.48 s
...
AMD Ryzen 7 2700
Intel Core i7-990X EE
Intel Core i7-1265U
Intel Xeon E-2176M
Intel Core i5-1245U
AMD Ryzen 5 2600
Intel Core i7-7700K
Intel Core i5-8600K
Intel Core i9-9900T
...
Transmeta Crusoe TM-5800
WinRAR - WinRAR 4.0
AMD Athlon Neo MV-40
...
Intel Xeon E5-2680 v4
Intel Core i7-9750H
Intel Core i9-8950HK
AMD Ryzen Threadripper PRO 3975WX
Intel Core i7-10700
...
7-Zip 18.03 - 7-Zip 18.03 Multi Thread 4 runs
...
Intel Xeon E-2276M
Apple M1
Intel Core i9-9900T
...
7-Zip 18.03 - 7-Zip 18.03 Single Thread 4 runs
...
AMD Ryzen 7 5800X
Intel Core Ultra 5 250K Plus
AMD Ryzen 9 9955HX3D
...
AMD Ryzen 7 9850X3D
X264 HD Benchmark 4.0 - x264 Pass 2
Intel Pentium 4 2.4 GHz
...
AMD Ryzen 3 3100
Intel Core i3-10320
Intel Core i5-8400
Intel Core i7-7700K
Intel Core Ultra 5 115U
Intel Xeon E-2176M
Intel Core i5-8600K
Intel Core i5-9400F
Intel Core i5-11500B
Intel Core i5-9600K
...
X264 HD Benchmark 4.0 - x264 Pass 1
...
Intel Core i7-7700K
Intel Core i7-8700
Intel Core i7-8086K
Intel Core i7-8700K
Intel Core i5-8600K
Intel Xeon E-2176G
Intel Core i5-9400F
Intel Core i5-11500B
Intel Core i7-10700
...
HWBOT x265 Benchmark v2.2 - HWBOT x265 4k Preset
...
AMD Ryzen 5 2600X
Intel Core i7-1265U
Intel Xeon E-2176M
Intel Core i7-9750H
Intel Core i9-8950HK
AMD Ryzen 7 1700X
...
TrueCrypt - TrueCrypt Serpent
...
Intel Core i3-10320
Intel Core i5-8600K
Intel Core i9-9900T
Intel Core i7-7700K
Intel Core Ultra 5 115U
...
TrueCrypt - TrueCrypt Twofish
...
Intel Core i3-10320
AMD Ryzen 3 3100
Intel Core i7-7700K
...
TrueCrypt - TrueCrypt AES
...
AMD Ryzen 3 3100
Intel Core i5-8600K
Intel Core i7-7700K
Intel Core i5-9600K
...
Blender - Blender 2.79 BMW27 CPU *
Intel Core i5-1038NG7
...
Intel Core i7-9750H
Intel Core i5-9600K
Intel Core i7-8850H
Intel Core i7-1265U
Intel Core i5-9400F
Intel Core i3-10320
...
R Benchmark 2.5 - R Benchmark 2.5 *
AMD Ryzen 7 9850X3D
...
Intel Core i5-1230U
Intel Core i7-9700
AMD Ryzen 3 3100
...
3DMark 06 - CPU - 3DMark 06 - CPU
min: 10229 gem: 10252 mediaan: 10252 (17%) max: 10275 Points
VIA C7-M C7-M-1200
...
Intel Core i7-7700K
Intel Core Ultra 5 115U
Intel Core i9-9900T
Intel Core i7-8700
AMD Ryzen 7 2700X
...
Super Pi mod 1.5 XS 1M - Super Pi mod 1.5 XS 1M *
...
Intel Core i7-10700
Intel Core i9-7900X
Intel Core i7-7700K
Intel Core Ultra 5 115U
...
VIA C3-M C3-M-1200
Super Pi mod 1.5 XS 2M - Super Pi mod 1.5 XS 2M *
...
Intel Core i7-8700
Intel Xeon E-2176G
Intel Core i7-4790K
Intel Core i5-12400F
Intel Core i9-8950HK
Intel Core i7-8559U
...
Intel Celeron Dual-Core T1400
Super Pi Mod 1.5 XS 32M - Super Pi mod 1.5 XS 32M *
...
Intel Core i5-12400F
Intel Core i7-10700
Intel Core i7-7700K
Intel Core i5-1245U
Intel Core i7-8700K
Intel Core i7-4790K
Intel Core i5-1035G7
Intel Core i5-1035G4
Intel Core i7-9700
...
VIA C3-M C3-M-1200
3DMark 11 - 3DM11 Performance Physics
min: 12196 gem: 12314 mediaan: 12296 (30%) max: 12488 Points
AMD E-240
...
AMD Ryzen Threadripper 2970WX
AMD Ryzen 5 2600
Intel Xeon E-2276M
...
AMD Ryzen 9 9950X3D
3DMark - 3DMark Ice Storm Unlimited Physics
min: 66212 gem: 67820 mediaan: 66705 (54%) max: 71022 Points
Qualcomm Snapdragon S4 Play MSM8625Q
...
AMD Ryzen 7 2700
AMD Ryzen 7 1800X
Intel Core i7-1265U
Intel Core i7-7700K
AMD Ryzen 3 3100
Intel Core i3-9100F
Intel Core i9-9900K
Intel Core i5-7600K
...
Intel Core Ultra 5 250K Plus
3DMark - 3DMark Cloud Gate Physics
min: 9923 gem: 10233 mediaan: 10197 (26%) max: 10455 Points
...
AMD Ryzen 5 1600
Intel Core i5-1240U
Intel Xeon E-2276M
...
Intel Core Ultra 7 270K Plus
3DMark - 3DMark Fire Strike Standard Physics
min: 13230 gem: 14141 mediaan: 14425 (26%) max: 14523 Points
...
Intel Core i3-10320
Intel Core i5-9600K
Intel Core i7-7700K
Intel Xeon E-2176M
Intel Core i7-1265U
...
Intel Core Ultra 7 270K Plus
3DMark - 3DMark Time Spy CPU
min: 5632 gem: 5685 mediaan: 5663 (24%) max: 5792 Points
AMD PRO A12-9800B
...
Intel Core i5-9400F
Intel Core i9-8950HK
Intel Core i9-9900T
...
Intel Core Ultra 7 270K Plus
Geekbench 5.5 - Geekbench 5.1 - 5.5 64 Bit Single-Core
...
AMD Ryzen 9 3900
Intel Xeon E-2186M
AMD Ryzen 9 3900X
Intel Core i5-1038NG7
Intel Core i7-1065G7
AMD Ryzen Threadripper PRO 3975WX
Intel Core i7-10700
...
Apple M5 10-Core
Geekbench 5.5 - Geekbench 5.1 - 5.5 64 Bit Multi-Core
...
Intel Core i7-8850H
AMD Ryzen 3 3100
Intel Core i9-8950HK
AMD Ryzen 3 1300X
Intel Xeon E-2186M
...
Geekbench 5.0 - Geekbench 5.0 64 Bit Single-Core
...
Intel Core i9-9980XE
AMD Ryzen 9 3900
AMD Ryzen 9 3900X
AMD Ryzen Threadripper PRO 3995WX
Intel Core i7-8086K
Intel Core i7-1065G7
...
AMD Ryzen 7 9850X3D
Geekbench 5.0 - Geekbench 5.0 64 Bit Multi-Core
...
Intel Core i7-8850H
AMD Ryzen 3 3100
AMD Ryzen 5 1600
...
AMD Ryzen Threadripper PRO 3995WX
Geekbench 4.4 - Geekbench 4.1 - 4.4 64 Bit Single-Core
Qualcomm Snapdragon 212 APQ8009
...
AMD Ryzen 9 3900X
Intel Core i7-10700
AMD Ryzen Threadripper PRO 3975WX
Intel Core i7-9700
AMD Ryzen 7 3700X
Intel Core i7-8086K
...
Samsung Exynos 2600
Geekbench 4.4 - Geekbench 4.1 - 4.4 64 Bit Multi-Core
...
AMD Ryzen 3 3100
Google Tensor G5
Intel Core i5-8400
Intel Xeon E-2176M
...
Intel Core Ultra 7 270K Plus
Geekbench 4.0 - Geekbench 4.0 64 Bit Single-Core
...
Intel Core i5-1035G4
Intel Core i5-7600K
Intel Core i7-7700K
AMD Ryzen 9 3900
Intel Core i7-9750H
Intel Xeon E-2176G
Intel Core i7-9700K
Intel Core i7-1065G7
Intel Core i7-8700K
Intel Core i9-9900KS
...
Geekbench 4.0 - Geekbench 4.0 64 Bit Multi-Core
...
Intel Core i5-1035G4
AMD Ryzen 5 1600
Intel Core i7-4790K
Intel Core i7-7700K
Intel Core i5-8500
Intel Core i7-1065G7
AMD Ryzen 7 1700
Intel Core i5-8400
AMD Ryzen 7 1700X
...
Geekbench 3 - Geekbench 3 32 Bit Multi-Core
Samsung Hummingbird S5PC110 / Exynos 3110
...
Intel Core i7-4790K
Intel Core i7-6700K
Intel Core i5-8600K
AMD Ryzen 5 1600
Intel Core i5-1230U
Intel Core i7-9750H
Intel Core i7-8700
...
Geekbench 3 - Geekbench 3 32 Bit Single-Core
Samsung Hummingbird S5PC110 / Exynos 3110
...
Intel Core i5-6600K
Intel Core i5-8600K
Intel Core i7-6700K
Intel Core i7-9750H
Intel Core i7-4790K
Intel Core i7-8700
Intel Core i9-8950HK
Intel Core i7-9700K
Intel Core i5-1230U
Geekbench 3 - Geekbench 3 64 Bit Multi-Core
Qualcomm Snapdragon 215
...
AMD Ryzen 5 1500X
Intel Core i7-8559U
Intel Core i7-6700K
Intel Core i7-7700K
Intel Core i7-3960X
Intel Core i5-8400
Intel Core i5-8600K
AMD Ryzen 5 1600
Intel Core i9-8950HK
...
Geekbench 3 - Geekbench 3 64 Bit Single-Core
Qualcomm Snapdragon 215
...
Intel Core i5-8600K
Intel Core i5-7600K
Intel Core i7-8559U
Intel Core i7-6700K
Intel Core i7-7700K
Intel Core i7-8700
Intel Core i9-8950HK
Intel Core i7-8700K
Intel Core i5-1230U
Geekbench 2 - 32 Bit - Geekbench Stream
Qualcomm Snapdragon S1 MSM7227
...
Intel Core i5-6260U
Intel Core i5-6198DU
Intel Core i5-8265U
Intel Xeon E3-1505M v5
AMD Ryzen 5 1500X
Intel Xeon E3-1535M v5
Intel Core i7-7700K
Geekbench 2 - 32 Bit - Geekbench Memory
Qualcomm Snapdragon S1 MSM7227
...
AMD Ryzen 5 1500X
Intel Core i5-8265U
Intel Core i7-4790K
Intel Xeon E3-1505M v5
Intel Xeon E3-1535M v5
Intel Core i7-8559U
Intel Core i7-7700K
Geekbench 2 - 32 Bit - Geekbench Floating Point
Qualcomm Snapdragon S1 MSM7227
...
Intel Core i7-4790K
HiSilicon Kirin 820
Intel Core i7-7700K
Intel Core i7-6700HQ
Qualcomm Snapdragon 888 5G
...
Geekbench 2 - 32 Bit - Geekbench Integer
Qualcomm Snapdragon S1 MSM7227
...
Intel Xeon E3-1505M v5
Intel Xeon E3-1535M v5
Intel Core i7-7700HQ
Intel Core i5-8265U
AMD Ryzen 5 1500X
Intel Core i7-4790K
Intel Core i7-8559U
Intel Core i7-7700K
AMD Ryzen 5 1600
AMD Ryzen 7 1700X
AMD Ryzen 7 1800X
Intel Core i7-6950X
Intel Core i9-7900X
...
Geekbench 2 - 32 Bit - Geekbench Total Score
Qualcomm Snapdragon S1 MSM7227
...
Intel Xeon E3-1505M v5
Intel Core i7-6700HQ
Intel Xeon E3-1535M v5
AMD Ryzen 5 1500X
Intel Core i7-4790K
Intel Core i7-8559U
Intel Core i7-7700K
AMD Ryzen 5 1600
AMD Ryzen 7 1700
AMD Ryzen 7 1700X
AMD Ryzen 7 1800X
Intel Core i7-6950X
Intel Core i9-7900X
...
Mozilla Kraken 1.1 - Kraken 1.1 Total Score *
Apple M5 Pro 18-Core
...
Intel Core i7-10700K
Intel Core i7-10700
Intel Core i7-8700K
Intel Core i5-1038NG7
AMD Ryzen Threadripper PRO 3995WX
Intel Core i9-7900X
Intel Core i7-7700K
Qualcomm Snapdragon G3x Gen 1
...
Sunspider - Sunspider 1.0 Total Score *
Intel Core i7-7700K
Intel Core i7-8700K
Intel Core i9-7900X
Intel Core i5-7600K
Intel Core i5-6600K
...
Octane V2 - Octane V2 Total Score
...
Intel Xeon W-2145
Intel Core i7-6567U
Intel Core i7-8700K
Apple A13 Bionic
Intel Core i5-8400H
...
Apple M5 Pro 18-Core
WebXPRT 3 - WebXPRT 3 Score
min: 247 gem: 256 mediaan: 256 (43%) max: 265 Points
Mediatek MT8321
...
Apple A15 Bionic
...
Apple M5 Pro 18-Core
Power Consumption - Prime95 Power Consumption - external Monitor *
...
Intel Core i5-9600K
AMD Ryzen 5 1500X
Intel Core i7-8700K
AMD Ryzen 7 1800X
AMD Ryzen 5 2600
...
AMD Ryzen Threadripper PRO 3975WX
Power Consumption - Cinebench R15 Multi Power Consumption - external Monitor *
...
Intel Core i7-7700K
AMD Ryzen 3 3100
AMD Ryzen 5 1500X
AMD Ryzen 7 1700
Intel Core i5-9600K
...
Power Consumption - Power Efficiency - Cinebench R15 Multi external Monitor
AMD A10-7850K
AMD Ryzen 5 1500X
Intel Core i3-9100F
Intel Core i5-7600K
Intel Core i7-9700K
AMD Ryzen 5 1600
Intel Core i7-7700K
AMD Ryzen 3 3100
Intel Core i5-8500T
Intel Core i5-9400F
Intel Core i9-9900KS
AMD Ryzen 5 2600X
...
- Benchmarkresultaten voor deze videokaart

- Gemiddelde benchmarkresultaten voor deze videokaart
* Kleinere getallen betekenen een hogere prestatie
log 07. 04:30:52
#0 ran 0s before starting gpusingle class +0s ... 0s
#1 no ids found in url (should be separated by "_") +0s ... 0s
#2 not redirecting to Ajax server +0s ... 0s
#3 did not recreate cache, as it is less than 5 days old! Created at Sat, 04 Jul 2026 05:30:22 +0200 +0.004s ... 0.004s
#4 composed specs +0.001s ... 0.005s
#5 did output specs +0s ... 0.005s
#6 getting avg benchmarks for device 9174 +0.041s ... 0.047s
#7 got single benchmarks 9174 +0.027s ... 0.074s
#8 got avg benchmarks for devices +0s ... 0.074s
#9 min, max, avg, median took s +2.553s ... 2.627s
#10 no comparison url found in template nbc.compare_page_2 needed +0.551s ... 3.178s
#11 return log +0s ... 3.178s