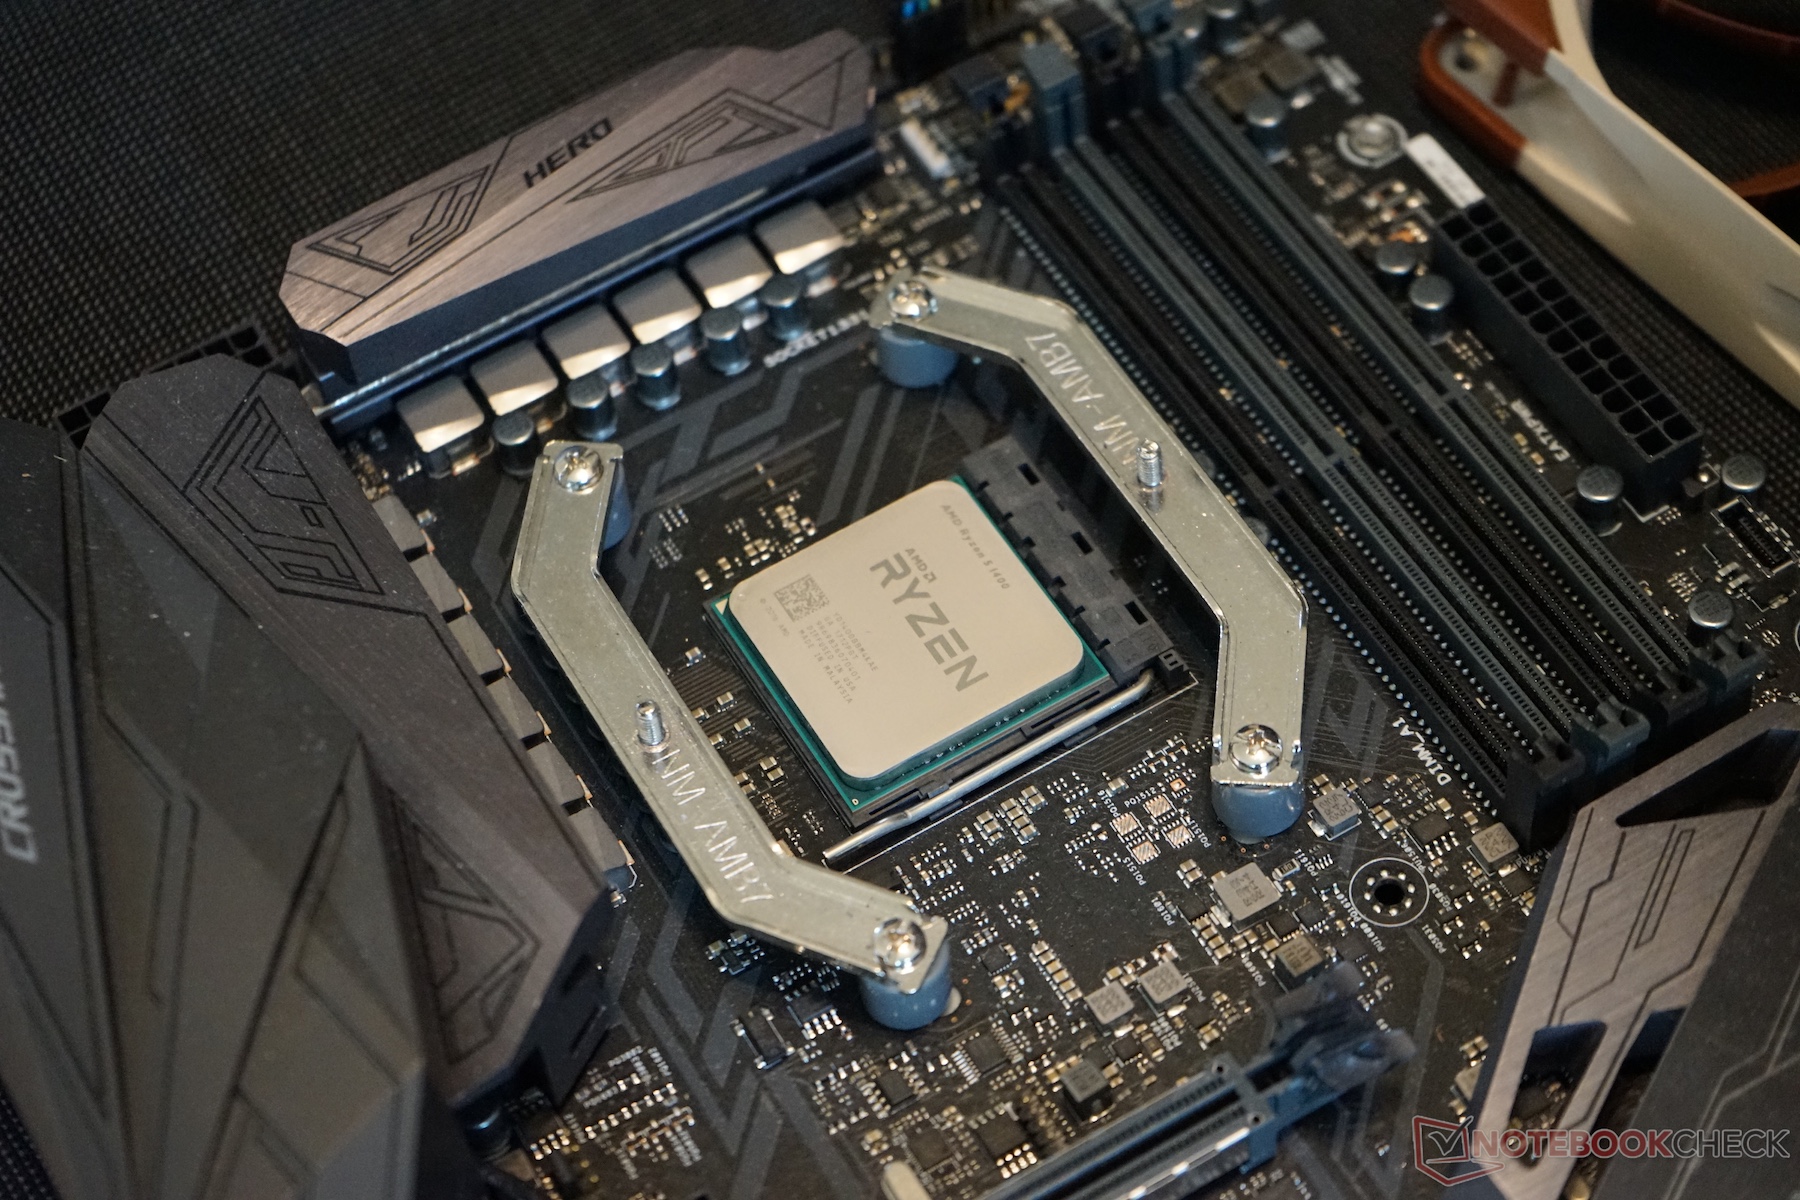
Kort testrapport Ryzen 5 1400 and 1600
| Cinebench R15 | |
| CPU Single 64Bit | |
| Intel Core i7-7700K | |
| Intel Core i5-7600K | |
| Intel Core i7-6950X | |
| Intel Core i7-6950X | |
| AMD Ryzen 7 1800X | |
| AMD Ryzen 7 1700X | |
| Intel Core i7-7700HQ | |
| AMD Ryzen 5 1600 | |
| AMD Ryzen 7 1700 | |
| Intel Core i7-5960X | |
| AMD Ryzen 5 1400 | |
| Intel Xeon E5-2697 v2 | |
| Intel Xeon E5-2680 v4 | |
| AMD FX-8350 | |
| CPU Multi 64Bit | |
| Intel Core i7-6950X | |
| Intel Xeon E5-2680 v4 | |
| AMD Ryzen 7 1800X | |
| AMD Ryzen 7 1700X | |
| Intel Xeon E5-2697 v2 | |
| AMD Ryzen 7 1700 | |
| Intel Core i7-5960X | |
| AMD Ryzen 5 1600 | |
| Intel Core i7-7700K | |
| Intel Core i7-7700HQ | |
| AMD Ryzen 5 1400 | |
| Intel Core i5-7600K | |
| AMD FX-8350 | |
| Performance rating - Percent | |
| Intel Core i7-6950X | |
| AMD Ryzen 7 1800X | |
| Intel Xeon E5-2697 v2 | |
| AMD Ryzen 7 1700X | |
| Intel Xeon E5-2680 v4 | |
| Intel Core i7-5960X | |
| AMD Ryzen 5 1600 | |
| AMD Ryzen 5 1600 | |
| Intel Core i7-7700K | |
| AMD Ryzen 5 1400 | |
| Intel Core i5-7600K | |
| TrueCrypt | |
| Serpent Mean 100MB | |
| Intel Core i7-6950X | |
| AMD Ryzen 7 1800X | |
| Intel Xeon E5-2697 v2 | |
| AMD Ryzen 7 1700X | |
| Intel Xeon E5-2680 v4 | |
| Intel Core i7-5960X | |
| AMD Ryzen 5 1600 | |
| AMD Ryzen 5 1600 | |
| Intel Core i7-7700K | |
| AMD Ryzen 5 1400 | |
| Intel Core i5-7600K | |
| Twofish Mean 100MB | |
| Intel Core i7-6950X | |
| Intel Xeon E5-2697 v2 | |
| AMD Ryzen 7 1800X | |
| Intel Xeon E5-2680 v4 | |
| AMD Ryzen 7 1700X | |
| Intel Core i7-5960X | |
| AMD Ryzen 5 1600 | |
| AMD Ryzen 5 1600 | |
| Intel Core i7-7700K | |
| AMD Ryzen 5 1400 | |
| Intel Core i5-7600K | |
| AES Mean 100MB | |
| Intel Core i7-6950X | |
| AMD Ryzen 7 1800X | |
| Intel Xeon E5-2680 v4 | |
| AMD Ryzen 7 1700X | |
| Intel Xeon E5-2697 v2 | |
| Intel Core i7-5960X | |
| AMD Ryzen 5 1600 | |
| Intel Core i7-7700K | |
| AMD Ryzen 5 1600 | |
| AMD Ryzen 5 1400 | |
| Intel Core i5-7600K | |
| wPrime 2.10 | |
| 1024m | |
| Intel Xeon E5-2697 v2 | |
| Intel Core i5-7600K | |
| AMD Ryzen 5 1400 | |
| Intel Core i7-7700K | |
| Intel Core i7-5960X | |
| AMD Ryzen 7 1700X | |
| AMD Ryzen 7 1800X | |
| Intel Core i7-6950X | |
| 32m | |
| Intel Xeon E5-2697 v2 | |
| Intel Core i5-7600K | |
| AMD Ryzen 5 1400 | |
| Intel Core i7-7700K | |
| Intel Core i7-5960X | |
| AMD Ryzen 7 1700X | |
| AMD Ryzen 7 1800X | |
| Intel Core i7-6950X | |
* ... kleiner is beter
| Geekbench 4.0 | |
| 64 Bit Single-Core Score | |
| Intel Core i7-7700K | |
| Intel Core i5-7600K | |
| AMD Ryzen 7 1800X | |
| AMD Ryzen 7 1700X | |
| Intel Core i7-7700HQ | |
| AMD Ryzen 7 1700 | |
| AMD Ryzen 5 1600 | |
| Intel Core i7-6950X | |
| Intel Core i7-5960X | |
| AMD Ryzen 5 1400 | |
| Intel Xeon E5-2680 v4 | |
| 64 Bit Multi-Core Score | |
| Intel Core i7-6950X | |
| Intel Core i7-5960X | |
| AMD Ryzen 7 1800X | |
| Intel Xeon E5-2680 v4 | |
| AMD Ryzen 7 1700X | |
| AMD Ryzen 7 1700 | |
| AMD Ryzen 5 1600 | |
| Intel Core i7-7700K | |
| Intel Core i5-7600K | |
| Intel Core i7-7700HQ | |
| AMD Ryzen 5 1400 | |
| WinRAR - Result | |
| Intel Core i7-6950X | |
| Intel Xeon E5-2697 v2 | |
| Intel Core i7-5960X | |
| Intel Xeon E5-2680 v4 | |
| Intel Core i7-7700K | |
| AMD Ryzen 7 1800X | |
| AMD Ryzen 7 1700X | |
| AMD Ryzen 5 1600 | |
| Intel Core i5-7600K | |
| AMD Ryzen 5 1400 | |
| X264 HD Benchmark 4.0 | |
| Pass 1 | |
| Intel Core i7-7700K | |
| Intel Core i5-7600K | |
| Intel Core i7-6950X | |
| AMD Ryzen 7 1800X | |
| Intel Core i7-5960X | |
| AMD Ryzen 7 1700X | |
| AMD Ryzen 5 1600 | |
| Intel Xeon E5-2697 v2 | |
| AMD Ryzen 5 1400 | |
| Intel Xeon E5-2680 v4 | |
| Pass 2 | |
| Intel Core i7-6950X | |
| AMD Ryzen 7 1800X | |
| AMD Ryzen 7 1700X | |
| Intel Xeon E5-2697 v2 | |
| Intel Core i7-5960X | |
| Intel Xeon E5-2680 v4 | |
| AMD Ryzen 5 1600 | |
| Intel Core i7-7700K | |
| Intel Core i5-7600K | |
| AMD Ryzen 5 1400 | |
| PCMark 8 | |
| Home Score Accelerated v2 | |
| Intel Core i7-7700K | |
| Intel Core i5-7600K | |
| AMD Ryzen 7 1800X | |
| Intel Core i7-4790K | |
| AMD Ryzen 7 1700X | |
| AMD Ryzen 7 1700 | |
| AMD Ryzen 5 1600 | |
| AMD Ryzen 5 1400 | |
| Intel Core i7-6950X | |
| Intel Core i7-5960X | |
| Intel Core i7-7700HQ | |
| Intel Xeon E5-2697 v2 | |
| Work Score Accelerated v2 | |
| Intel Core i7-7700HQ | |
| Intel Core i7-7700K | |
| Intel Xeon E5-2697 v2 | |
| AMD Ryzen 7 1800X | |
| AMD Ryzen 7 1700X | |
| Intel Core i7-6950X | |
| AMD Ryzen 5 1600 | |
| Intel Core i7-5960X | |
| AMD Ryzen 7 1700 | |
| AMD Ryzen 5 1400 | |
| 3DMark | |
| 1920x1080 Fire Strike Physics | |
| Intel Core i7-6950X | |
| AMD Ryzen 7 1800X | |
| AMD Ryzen 7 1700X | |
| Intel Core i7-5960X | |
| AMD Ryzen 7 1700 | |
| Intel Xeon E5-2697 v2 | |
| Intel Xeon E5-2680 v4 | |
| AMD Ryzen 5 1600 | |
| Intel Core i7-7700K | |
| Intel Core i7-4790K | |
| AMD Ryzen 5 1400 | |
| Intel Core i7-7700HQ | |
| Intel Core i5-7600K | |
| 2560x1440 Time Spy CPU | |
| Intel Core i7-6950X | |
| Intel Xeon E5-2680 v4 | |
| AMD Ryzen 7 1800X | |
| Intel Core i7-5960X | |
| AMD Ryzen 7 1700X | |
| AMD Ryzen 7 1700X | |
| AMD Ryzen 7 1700 | |
| AMD Ryzen 5 1600 | |
| Intel Core i7-7700K | |
| Intel Core i7-4790K | |
| Intel Core i7-7700HQ | |
| Intel Core i5-7600K | |
| AMD Ryzen 5 1400 | |
| 3DMark 11 - 1280x720 Performance Physics | |
| Intel Core i7-6950X | |
| Intel Core i7-5960X | |
| AMD Ryzen 7 1800X | |
| Intel Xeon E5-2697 v2 | |
| AMD Ryzen 7 1700 | |
| Intel Xeon E5-2680 v4 | |
| Intel Core i7-7700K | |
| AMD Ryzen 5 1600 | |
| Intel Core i7-4790K | |
| Intel Core i7-7700HQ | |
| AMD Ryzen 5 1400 | |
| 3DMark 06 - CPU - CPU Score | |
| Intel Core i7-6950X | |
| Intel Core i7-7700K | |
| Intel Core i7-5960X | |
| AMD Ryzen 7 1700 | |
| Intel Xeon E5-2697 v2 | |
| Intel Core i5-7600K | |
| AMD Ryzen 5 1600 | |
| Intel Xeon E5-2680 v4 | |
| Intel Core i7-7700HQ | |
| AMD Ryzen 5 1400 | |
| Farming Simulator 17 - 3840x2160 High Preset AA:2xMS AF:2x | |
| Intel Core i7-6950X | |
| Intel Core i5-7600K | |
| Intel Core i7-4790K | |
| Intel Core i7-7700K | |
| Intel Core i7-5960X | |
| AMD Ryzen 7 1800X | |
| AMD Ryzen 5 1600 | |
| AMD Ryzen 7 1700 | |
| Intel Xeon E5-2680 v4 | |
| AMD Ryzen 5 1400 | |
| The Witcher 3 | |
| 1920x1080 Ultra Graphics & Postprocessing (HBAO+) | |
| Intel Core i7-7700K | |
| Intel Core i7-6950X | |
| Intel Core i7-4790K | |
| AMD Ryzen 7 1700 | |
| AMD Ryzen 7 1800X | |
| AMD Ryzen 5 1400 | |
| AMD Ryzen 5 1600 | |
| Intel Xeon E5-2680 v4 | |
| 1024x768 Low Graphics & Postprocessing | |
| Intel Core i7-4790K | |
| Intel Core i7-6950X | |
| Intel Core i7-7700K | |
| AMD Ryzen 7 1800X | |
| AMD Ryzen 7 1700 | |
| Intel Xeon E5-2680 v4 | |
| AMD Ryzen 5 1600 | |
| AMD Ryzen 5 1400 | |
| For Honor | |
| 3840x2160 High Preset AA:T AF:8x | |
| Intel Xeon E5-2680 v4 | |
| Intel Core i7-7700K | |
| Intel Core i7-6950X | |
| AMD Ryzen 7 1700 | |
| Intel Core i5-7600K | |
| AMD Ryzen 5 1400 | |
| AMD Ryzen 5 1600 | |
| Intel Core i7-4790K | |
| AMD Ryzen 7 1800X | |
| Intel Core i7-5960X | |
| 1280x720 Low Preset | |
| Intel Core i7-7700K | |
| Intel Core i7-4790K | |
| Intel Core i5-7600K | |
| AMD Ryzen 5 1600 | |
| Intel Xeon E5-2680 v4 | |
| AMD Ryzen 5 1400 | |
| AMD Ryzen 7 1800X | |
| Intel Core i7-5960X | |
| AMD Ryzen 7 1700 | |
| Intel Core i7-6950X | |
Voor het volledige, Engelse testrapport, klik hier.
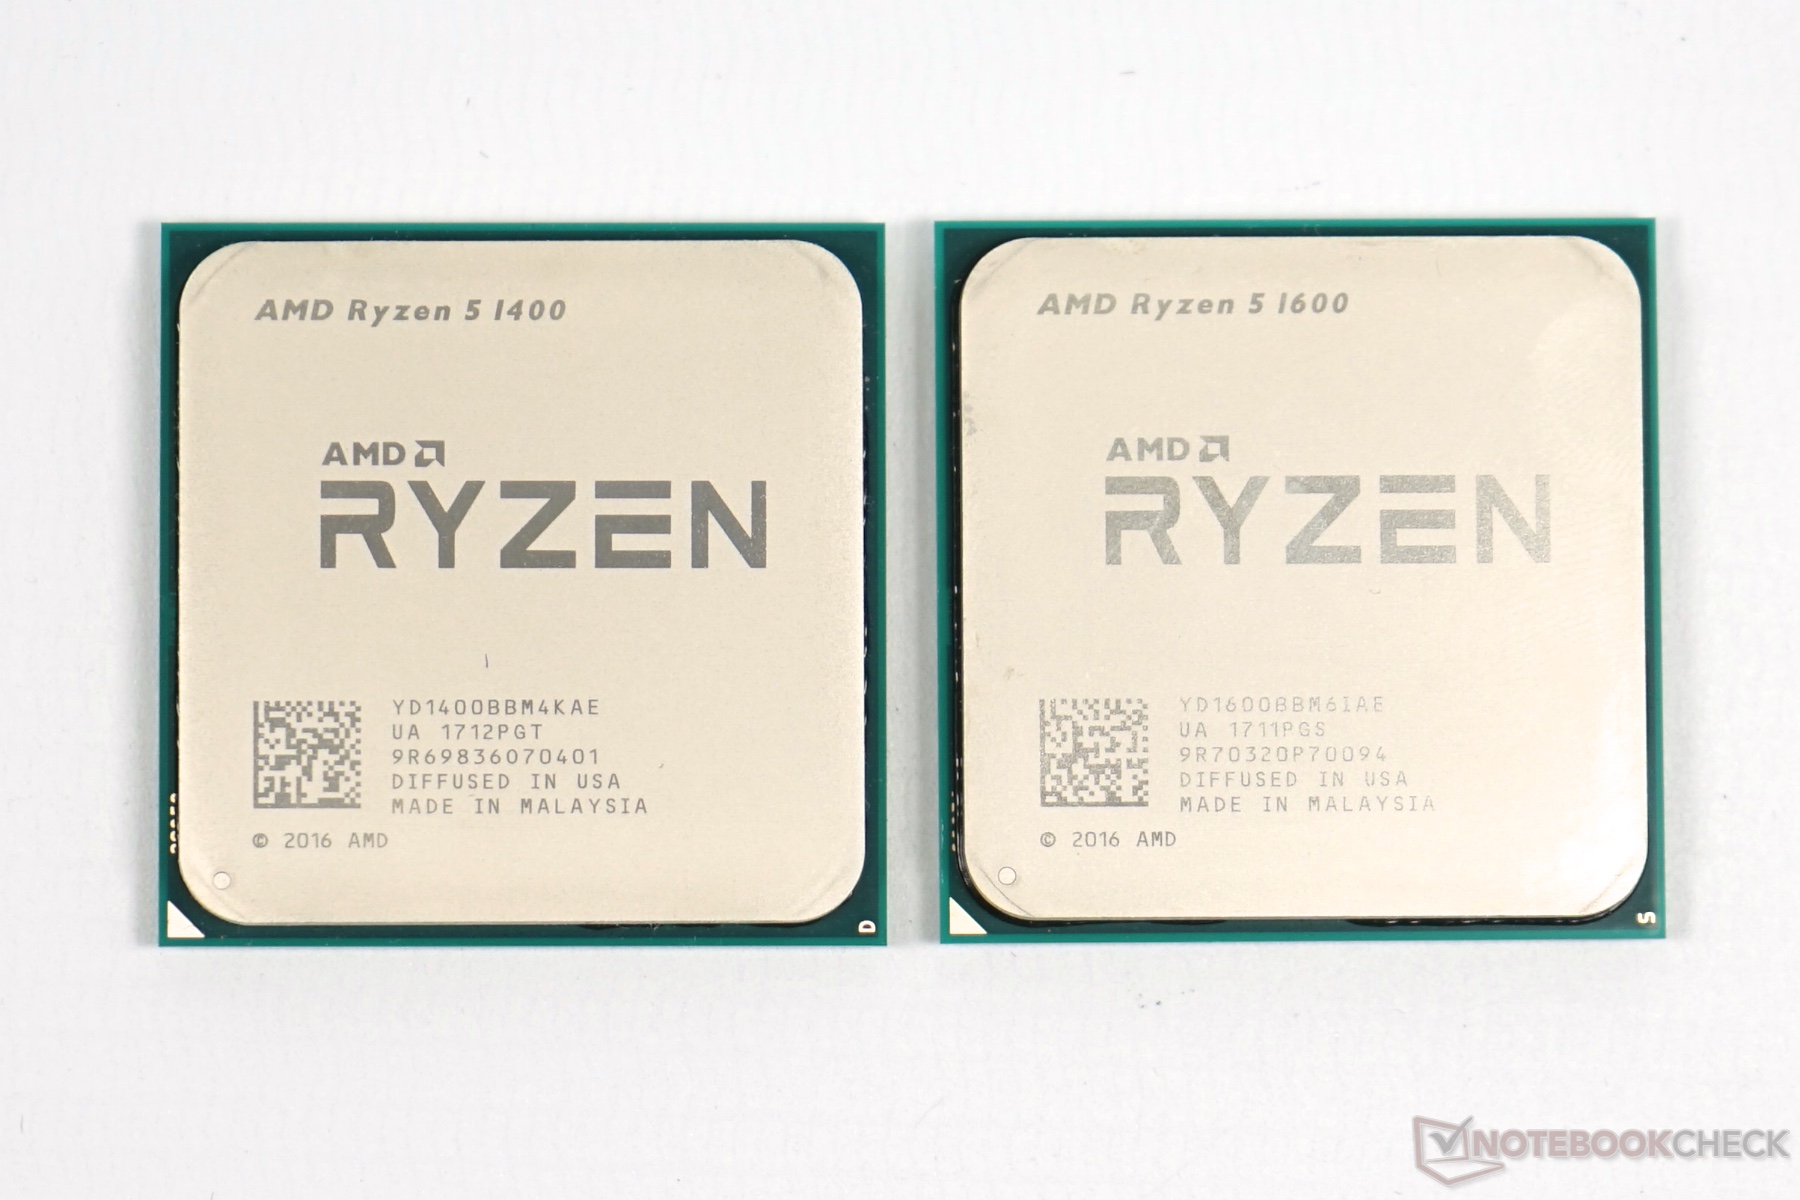
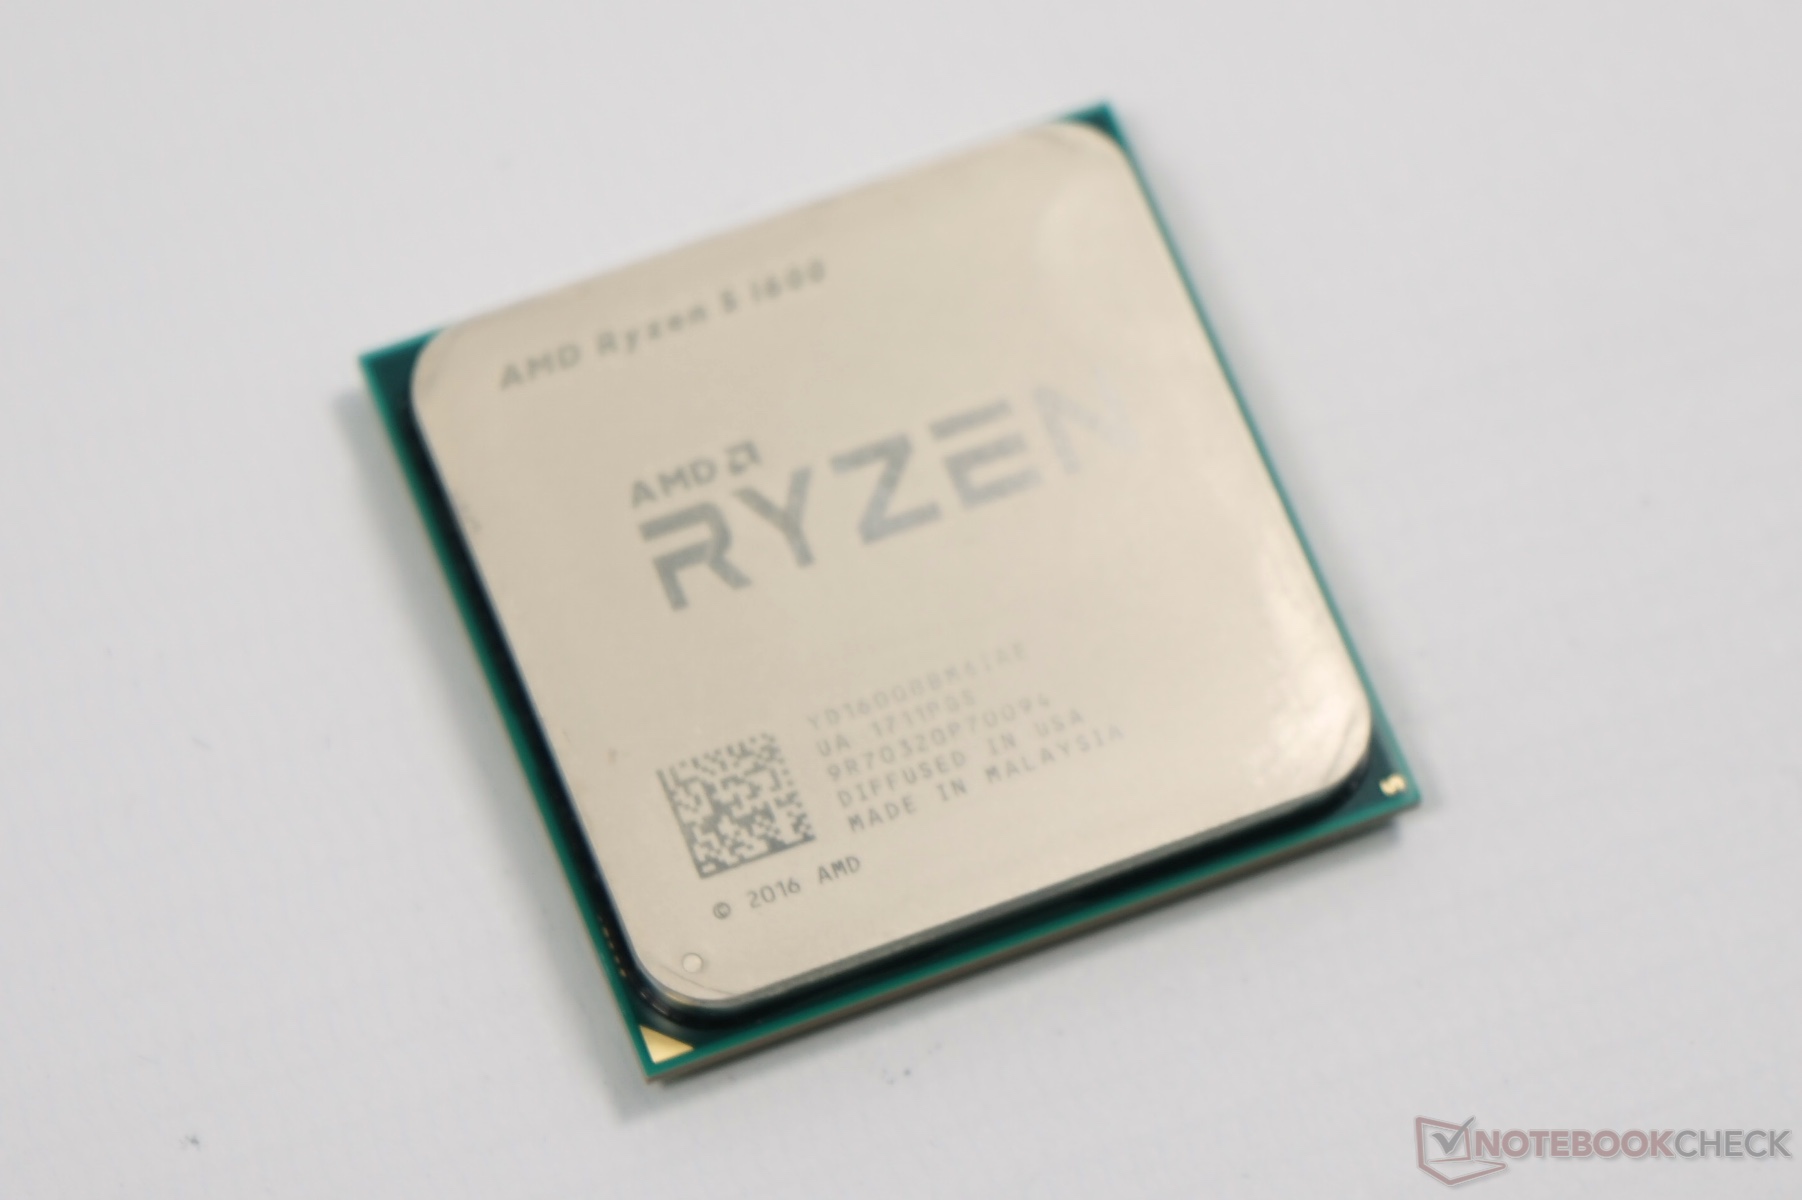
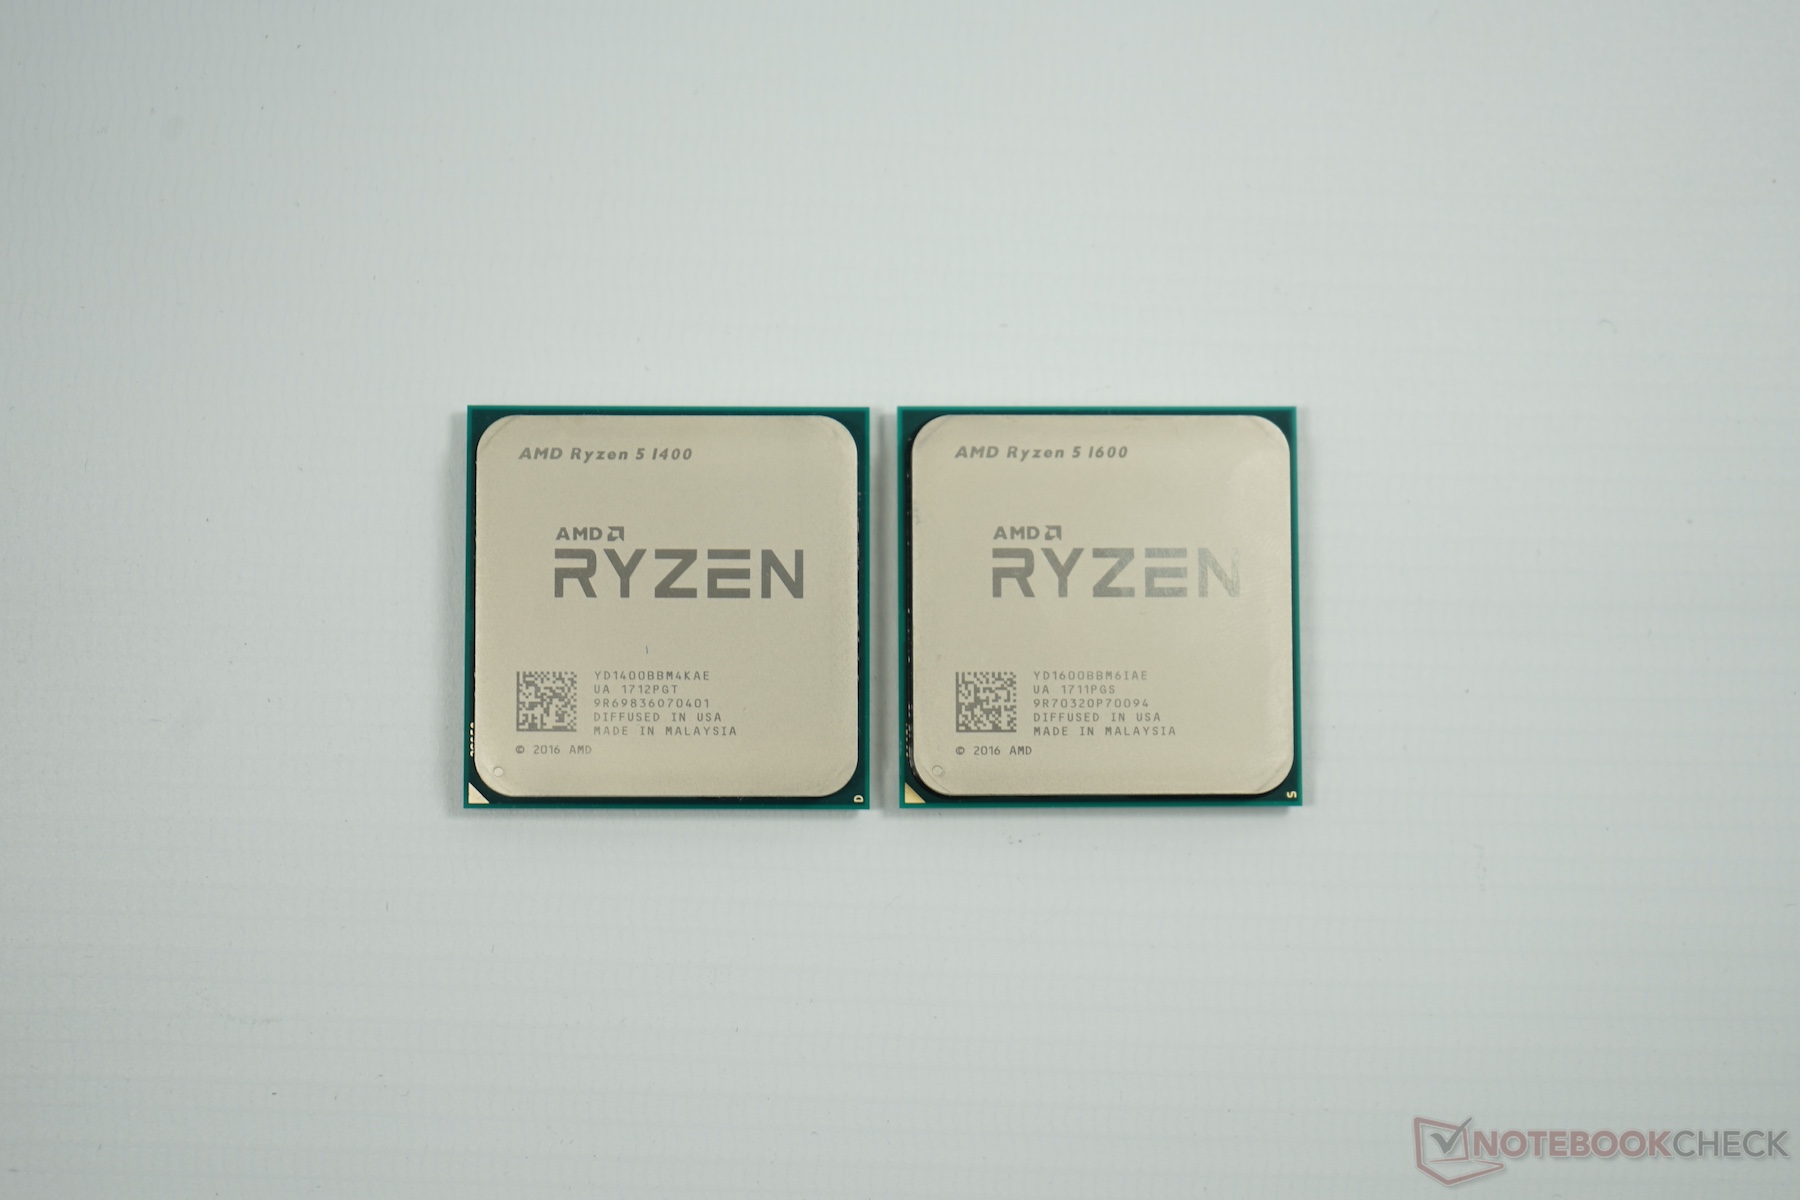
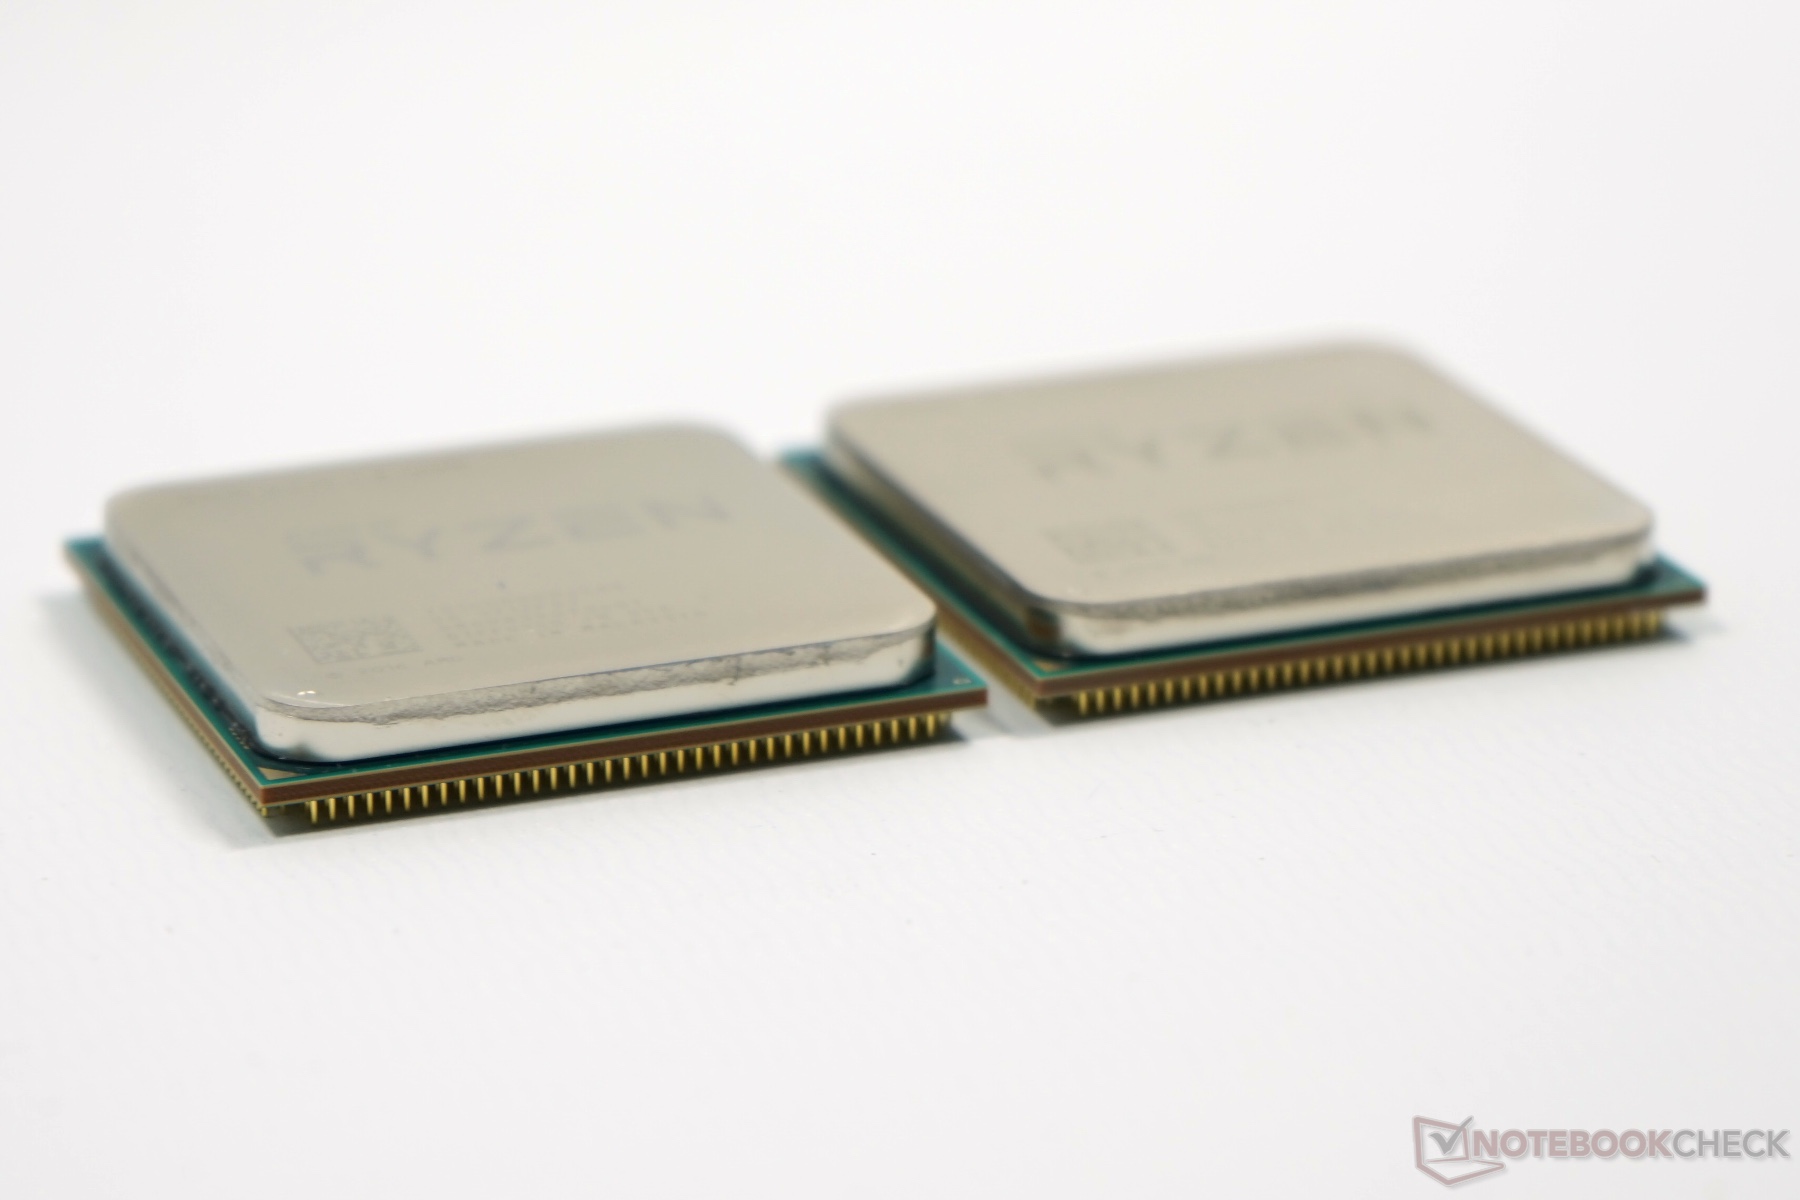
Ons oordeel over de Ryzen 5 1600 is vrij duidelijk: de AMD hexa-core CPU weet voor een zeer aantrekkelijke prijs goede prestaties neer te zetten. De prestaties van deze CPU, welke momenteel verkocht wordt voor €220, voldoen voor complexe games en andere scenario's - samenvattend: zelfs ambitieuze gebruikers hebben nu geen krachtigere CPU nodig.
Net zoals bij krachtigere Ryzen CPU's moeten we ons publiek wel wijzen op mindere single-core prestaties vergeleken met modellen van Intel. Dit wordt echter langzamerhand steeds minder belangrijk, dus heeft de totaalscore hieronder weinig te lijden. Immers, de AMD CPU verslaat zelfs de dure i7 modellen in de meeste praktische gevallen.
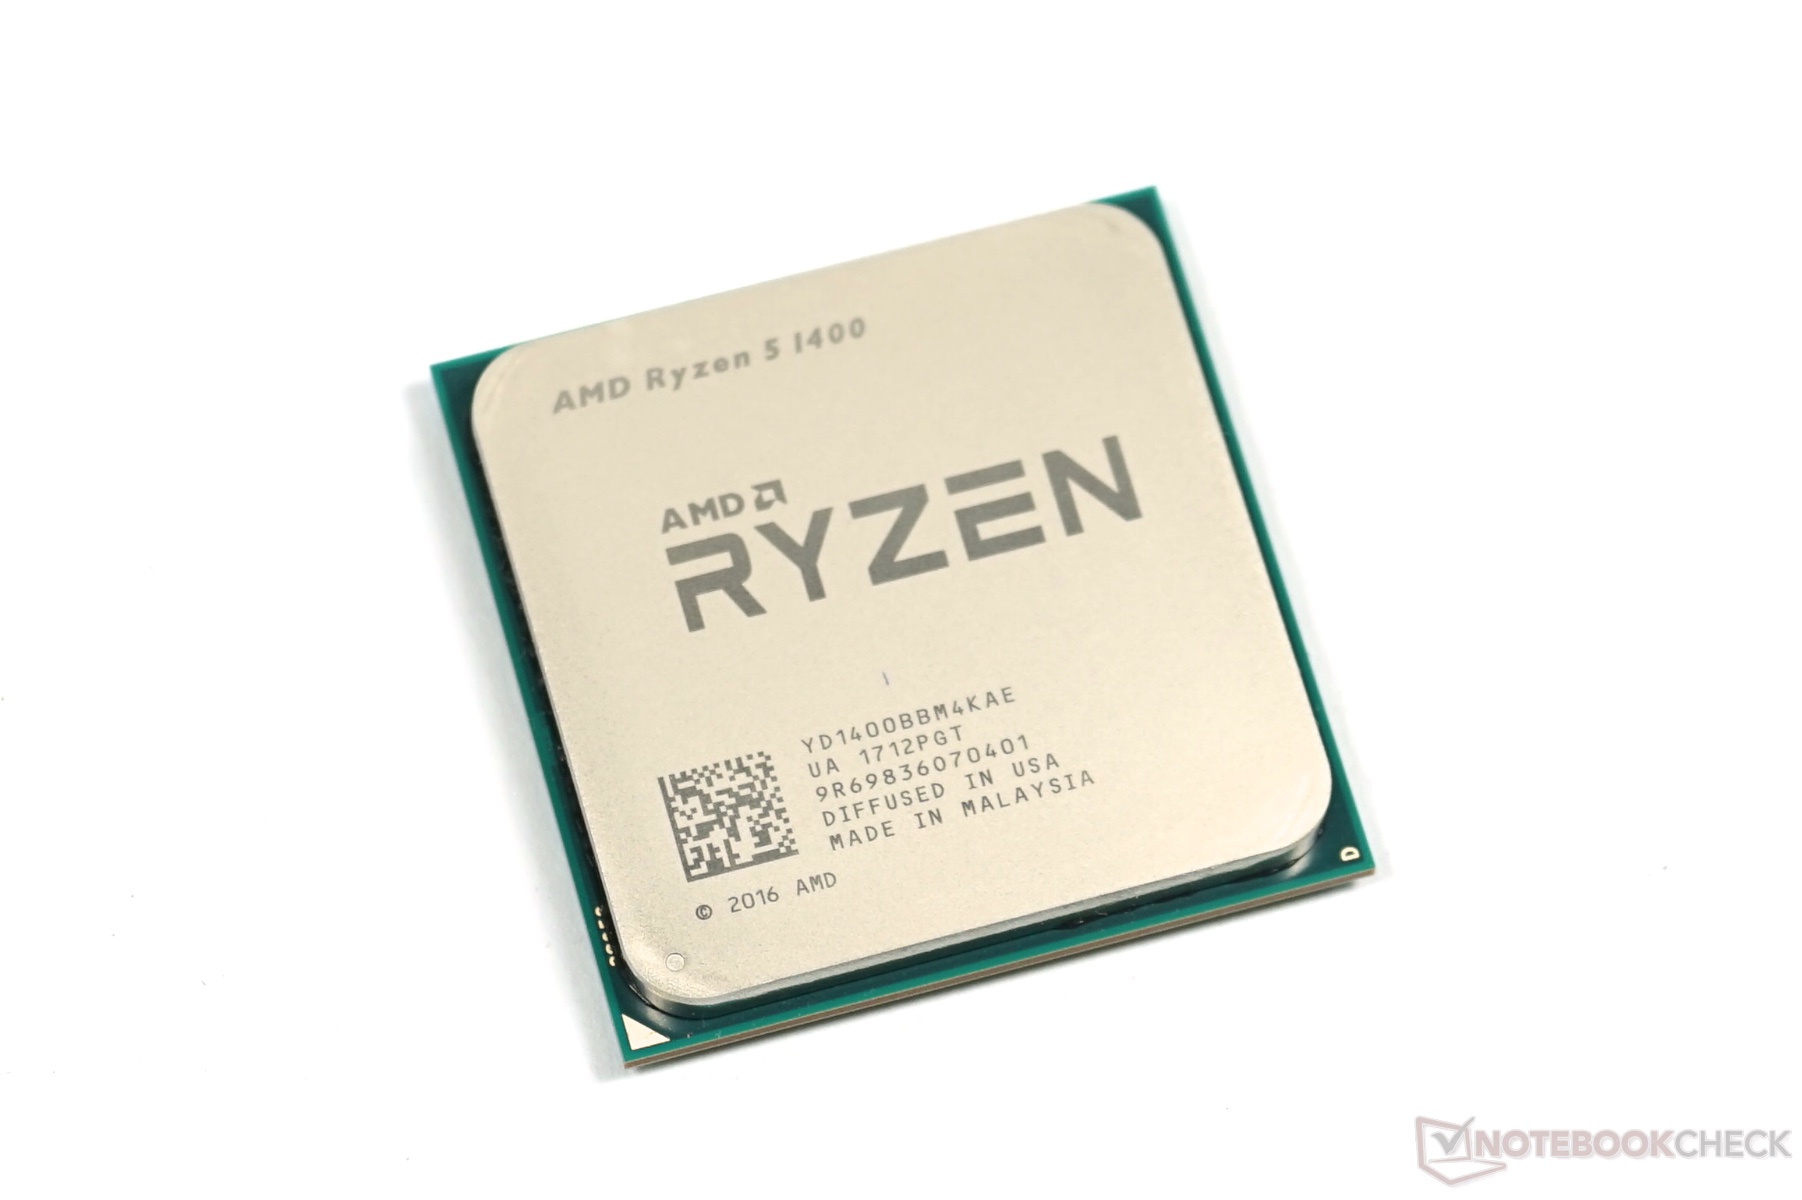
De Ryzen 5 1400, die voor €50 minder verkocht wordt, behoeft meer aandacht van de gebruiker: vier cores en 8 threads kan nog als modern worden beschouwd, maar levert minder reserves voor de toekomst dan hexa-core CPU's. De combinatie van de lagere kloksnelheid en het kleinere cache resulteert in een aanzienlijke achteruitgang in prestaties die niet wordt weerspiegeld in het prijsverschil. Echter, de rekenkracht van de kleinste Ryzen 5 voldoet voor casual gaming en zakelijk gebruik. Overklokken blijft natuurlijk ook een optie.
