Verdict - XPS herboren
Net als de nieuwe XPS 14, pakt de 2026 XPS 16 een aantal van de belangrijkste punten van zorg over het 2025-model aan voor een algehele betere gebruikerservaring. Het systeem is nu veel lichter en reisvriendelijker met een schonere visuele esthetiek en zonder frustrerende aanraakgevoelige toetsen. De overstap naar Panther Lake heeft ook de prestaties per watt aanzienlijk verbeterd, zodat de runtimes op zijn minst enkele uren langer zijn.
Een belangrijke reden voor het slankere, stillere en compactere ontwerp van dit jaar kan worden toegeschreven aan één grote verandering: geen discrete grafische opties meer. Geen dGPU betekent dat het systeem weg kan met kleinere PCB's, een kleinere koeloplossing en een dunner profiel voor een algeheel lichter model. Gebruikers zullen moeten inleveren op grafische prestaties, omdat de geïntegreerde GPU van Panther Lake - hoe efficiënt ook - niet kan tippen aan de ruwe kracht van een GeForce RTX 5070 op de uitgaande Dell 16 Premium. Externe GPU's kunnen deze beperking omzeilen, maar content creators of gamers die onderweg meer grafische prestaties eisen, zullen wellicht meer hebben aan het model uit model 2025.
Het slankere en meer gerichte ontwerp van de nieuwe XPS 16 kan soms kaal aanvoelen in vergelijking met sommige concurrenten. Alternatieven zoals de Samsung Galaxy Book6 Ultra of Asus Zenbook S16 hebben meer geïntegreerde poorten of zelfs ondersteuning voor secundaire M.2 SSD's om minder afhankelijk te zijn van adapters of docking stations.
Pro
Contra
Prijs en beschikbaarheid
Dell levert de XPS 16 nu vanaf $1750 voor de Core Ultra 5 325-configuratie zoals beoordeeld, tot $2160 voor de Core Ultra X7 358H OLED-configuratie met aanraakscherm.
Inhoudsopgave
- Verdict - XPS herboren
- Specificaties
- Koffer - Zoveel lichter dan voorheen
- Connectiviteit
- Invoerapparaten - Zeg maar dag tegen aanraakgevoelige toetsen
- Beeldscherm - Een van de beste FHD+ IPS-panelen
- Voorstelling - Alles inzetten op Panther Lake
- Uitstoot - Stiller, maar nog steeds behoorlijk warm
- Energiebeheer - Panther Lake is de koning van efficiëntie
- Notebookcheck Beoordeling
- Potentiële concurrenten in vergelijking
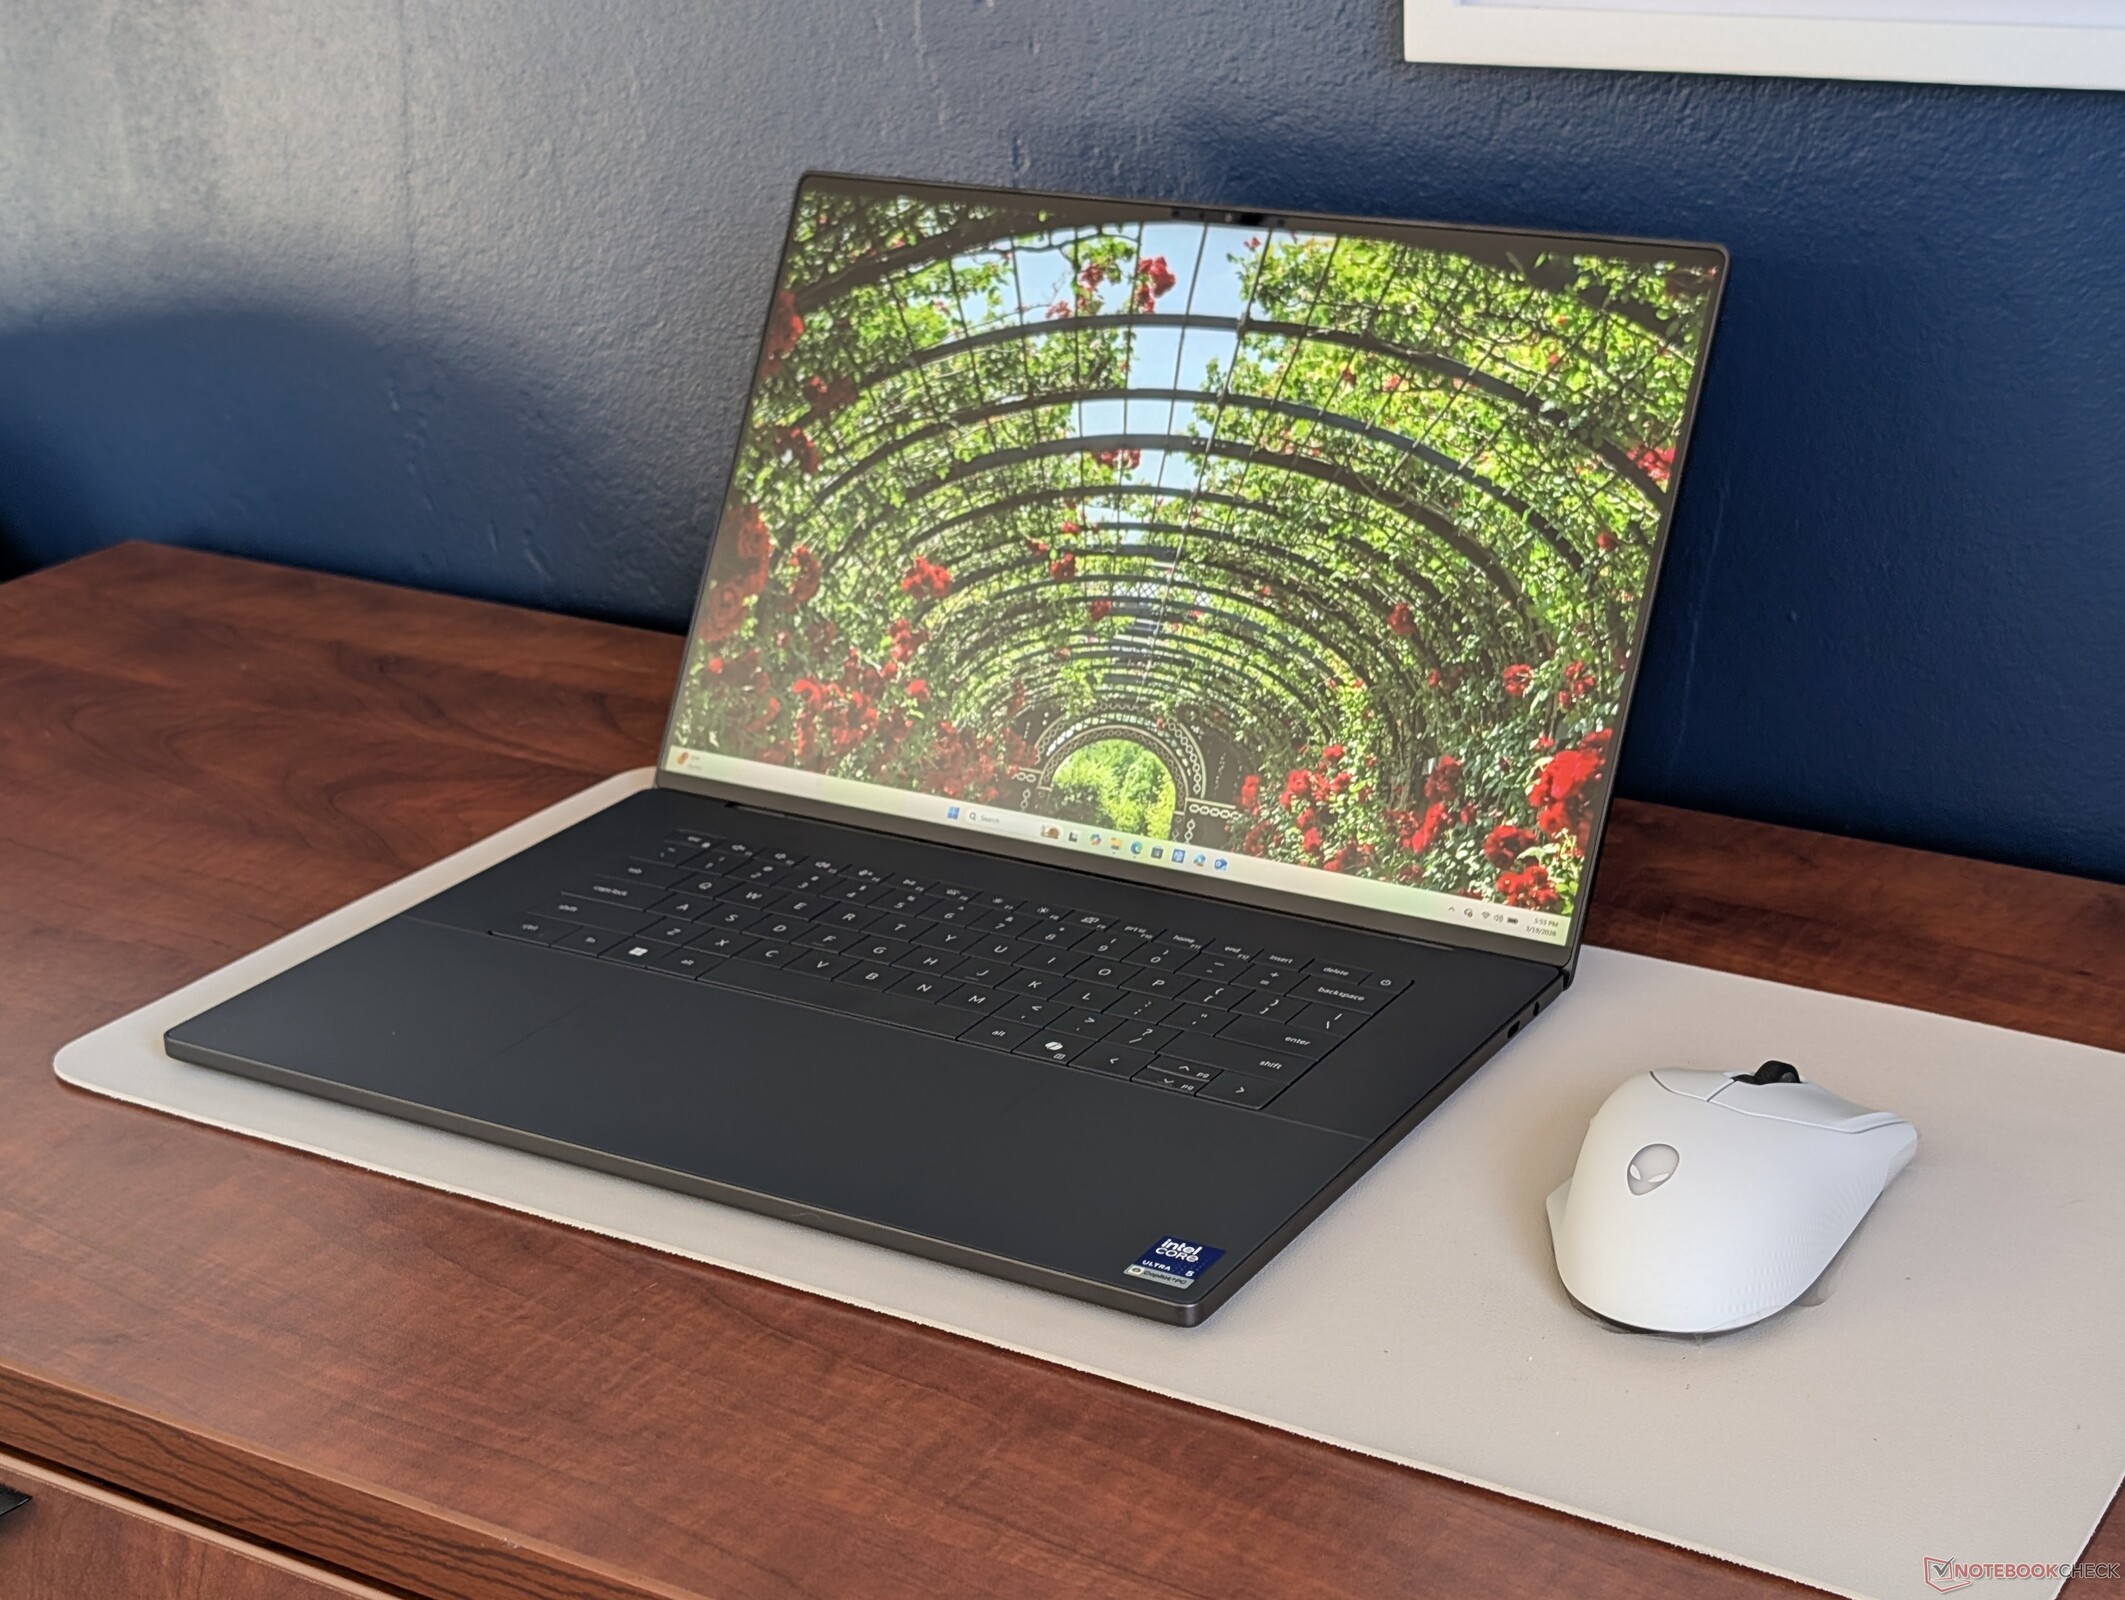
Onthuld op CES 2026 naast de nieuwe XPS 14, is de 2026 XPS 16 een heropleving voor de serie nadat de "XPS" branding vorig jaar werd overgeslagen ten gunste van de "Dell 16 Premium"naam. Het nieuwe model heeft niet alleen de nieuwste Intel Panther Lake processoropties, maar ook een vernieuwd chassisontwerp voor een vernieuwde gebruikerservaring in vergelijking met voorgaande jaren.
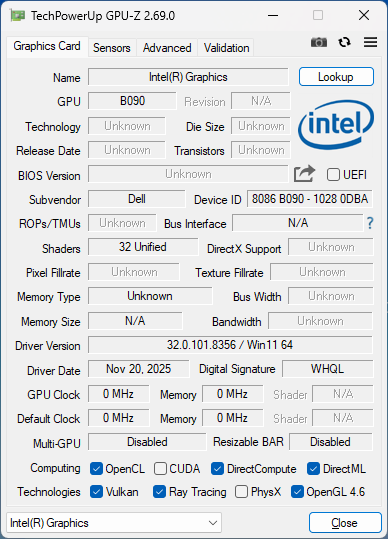
Onze testunit is de basisconfiguratie met de Core Ultra 5 325 CPU en een FHD+ 120 Hz IPS beeldscherm voor ongeveer $1700. Hogere configuraties omvatten de Core Ultra 7 355, Core Ultra X7 358H en OLED 120 Hz touchscreen voor bijna $2200. Alle opties worden op het moment van publicatie geleverd met alleen geïntegreerde graphics.
Alternatieven voor de Dell XPS 16 zijn andere high-end 16-inch multimediamachines zoals de Samsung Galaxy Book6 Ultra, Asus Zenbook S16of Lenovo Yoga Pro 9 16.
Meer Dell beoordelingen:
Specificaties
Koffer - Zoveel lichter dan voorheen
Het opnieuw ontworpen chassis lijkt weinig op de uitgaande Dell 16 Premium of 2024 XPS 16. Het bestaat echter uit dezelfde materialen als de 2026 XPS 14 en dus zijn onze indrukken van de XPS 14 over op de nieuwe XPS 16. De stijfheid voelt net zo goed als voorheen, maar met boxier randen en hoeken die de visuele stijl van de MacBook Pro 16.
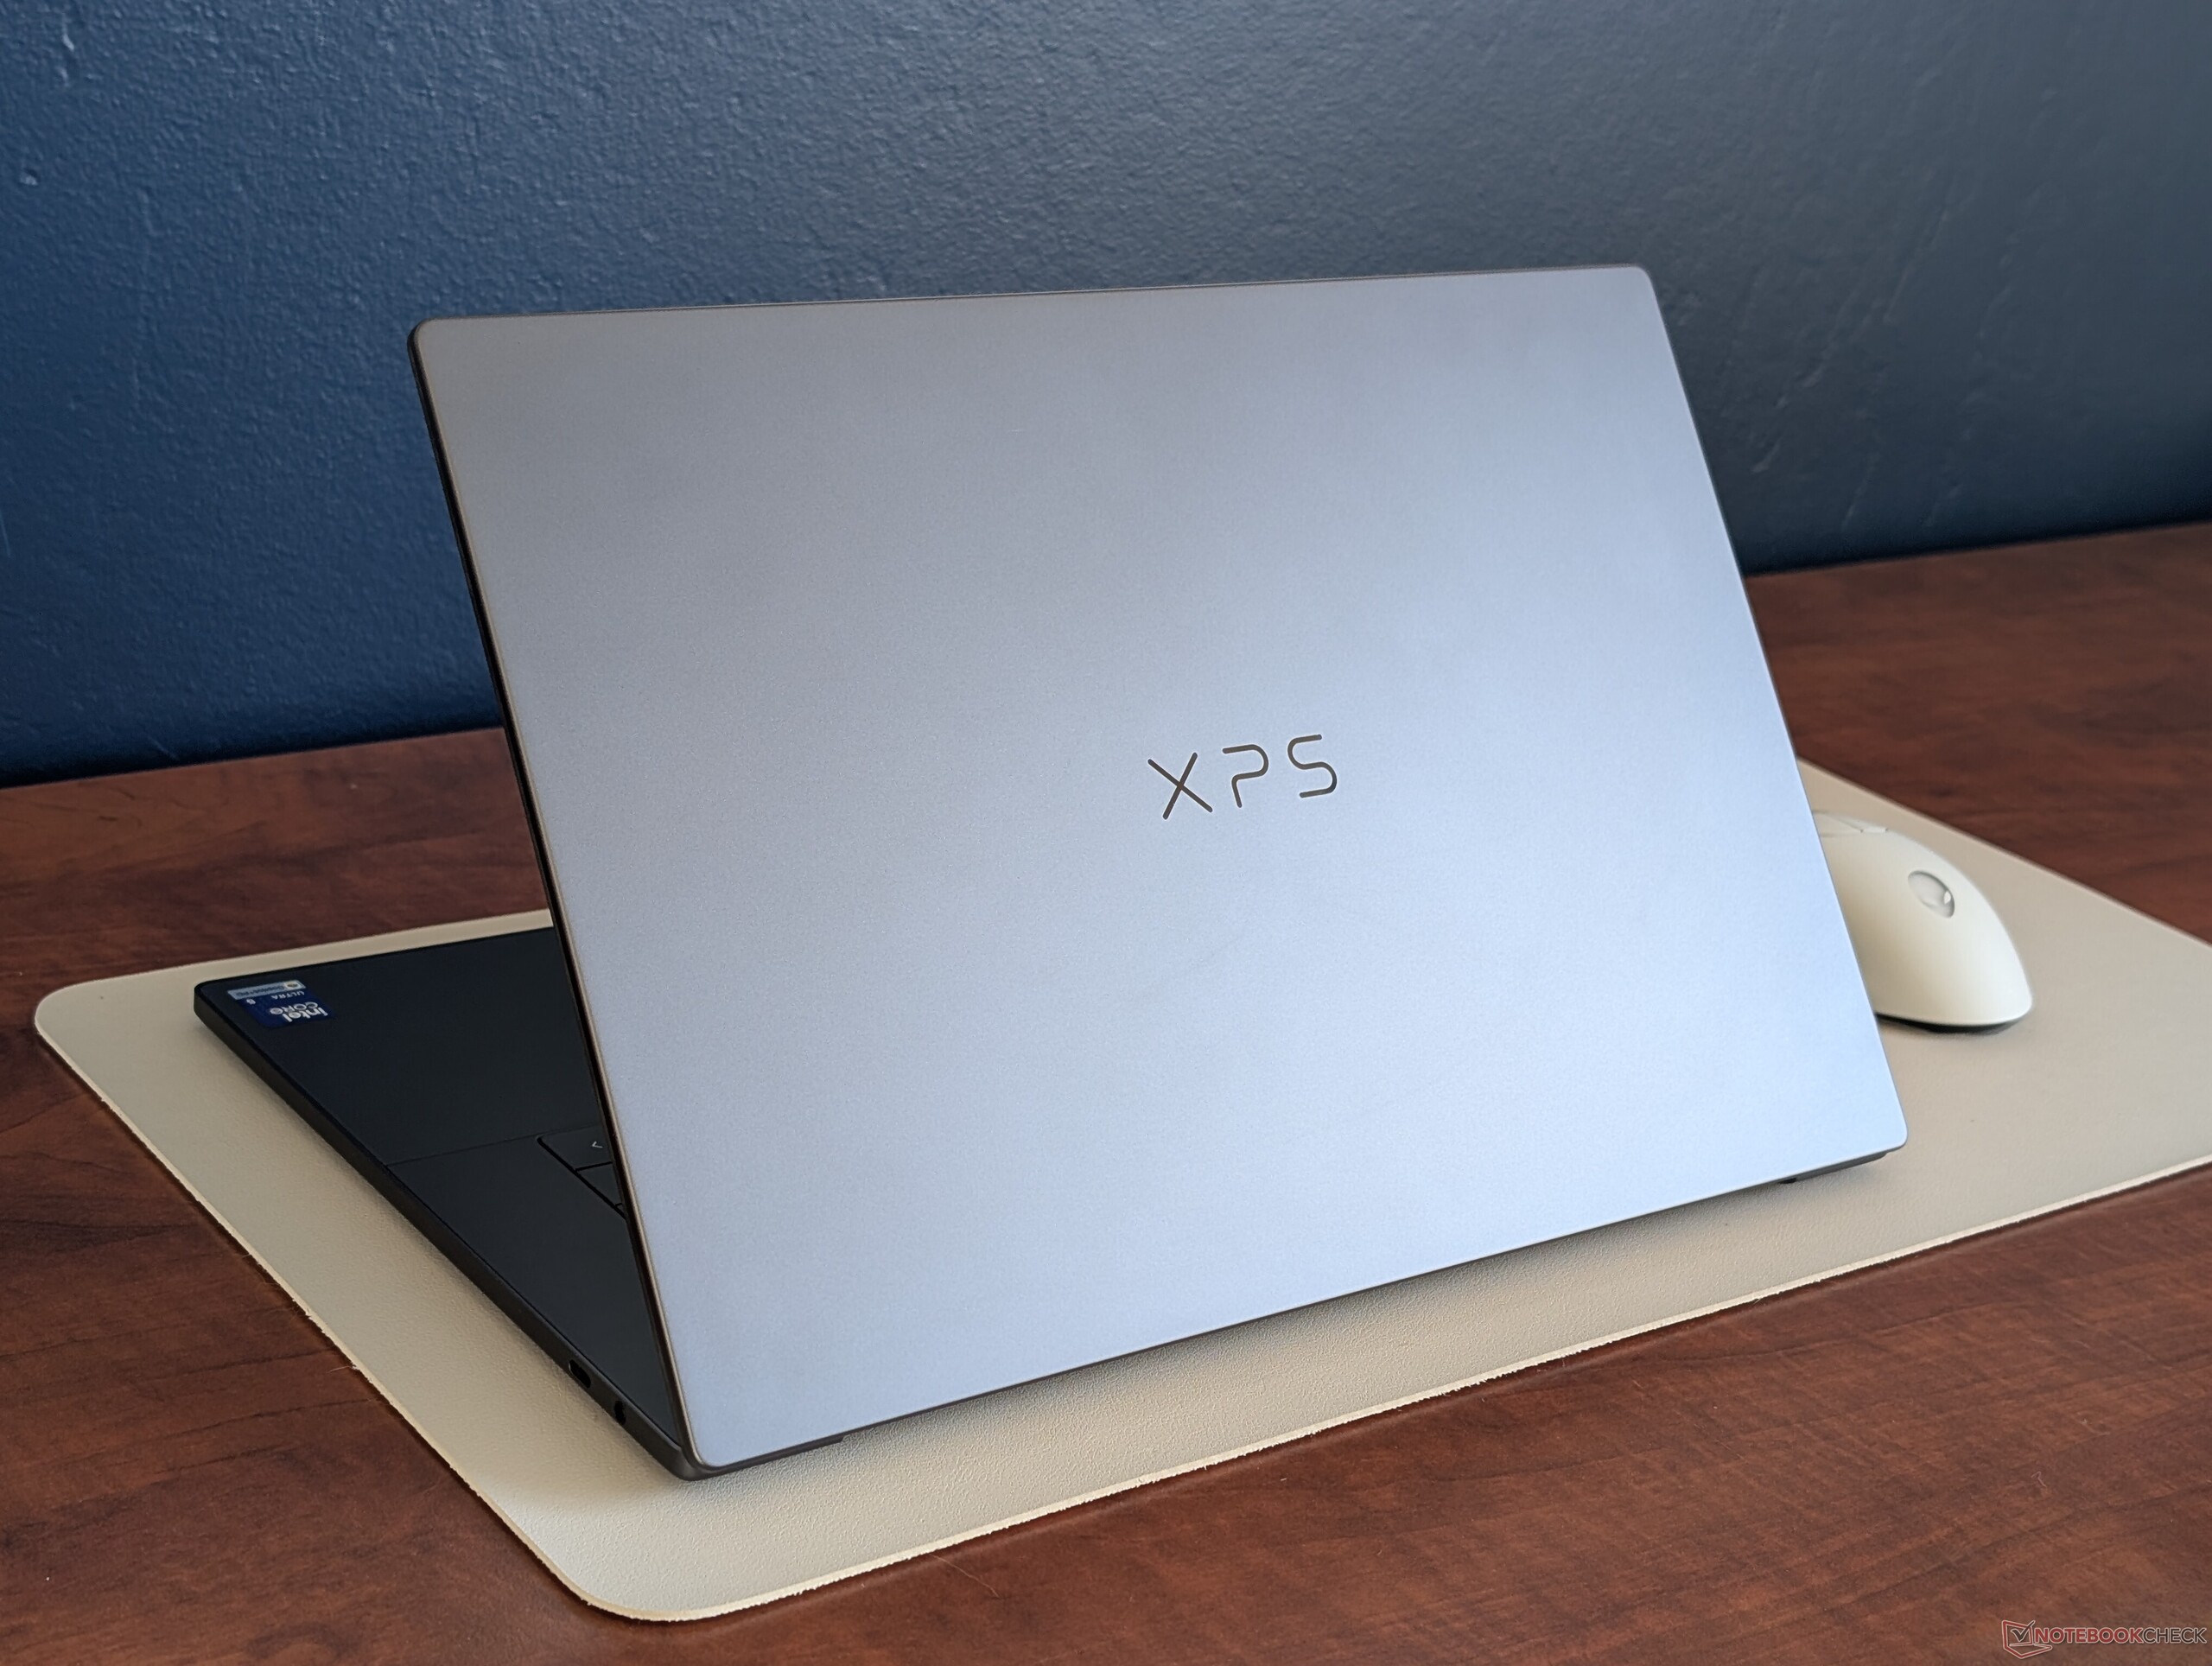
De verschillen in grootte en gewicht tussen de nieuwe XPS 16 en de oudere XPS 16 (of Dell 16 Premium) zijn aanzienlijk. Het bijgewerkte model is merkbaar kleiner in lengte, breedte en hoogte, terwijl het ongeveer 600 gram lichter is. Deze veranderingen werden grotendeels mogelijk gemaakt door het weglaten van discrete grafische opties en dampkamer koeling bij de overgang naar het nieuwe XPS 16 ontwerp. De schermgrootte is ook iets teruggebracht van 16,3 inch naar 16,0 inch.


Connectiviteit
Alle drie de USB-C poorten ondersteunen nu Thunderbolt 4, terwijl dit op het model van vorig jaar niet het geval was. Helaas heeft Dell de MicroSD-kaartsleuf laten vallen, tot verdriet van DSLR-bezitters.
Concurrerende modellen zoals de Asus Zenbook S16 of Lenovo Yoga Pro 9 16IAH10 hebben vaak meer geïntegreerde poorten en opties dan de Dell.


Communicatie

Webcam
De camera is geüpgraded van 2 MP op de Dell 16 Premium naar 8 MP op de nieuwe XPS 16. Hoewel IR wordt ondersteund, is er nog steeds geen fysieke camerasluiter.


Onderhoud
De onderhoudsprocedures zijn volledig anders dan bij het XPS 16-ontwerp van vorig jaar, maar verder vrijwel identiek aan de nieuwe XPS 14, zoals hier gedetailleerd. In plaats van het onderste paneel te verwijderen, moeten gebruikers nu voorzichtig het toetsenbord verwijderen om bij het moederbord te komen, waardoor het proces iets ingewikkelder is.
Upgrade-opties zijn helaas zeer beperkt. Het model ondersteunt slechts een enkele M.2 SSD en geen andere upgradebare componenten, ondanks de grote 16-inch vormfactor.

Duurzaamheid
Dell claimt 75 procent gerecycled aluminium voor de boven- en onderkant, 50 procent gerecycled kobalt voor de batterij, 90 procent gerecycled staal voor de toetscaps, 100 procent gerecycled koper voor de PCB van de batterij en 10 procent gerecycled glas voor de OLED-configuratie. De verpakking is volledig recyclebaar en plasticvrij.
Accessoires en garantie
Er zitten geen extra's in de doos behalve de AC-adapter en papierwerk. De gebruikelijke beperkte fabrieksgarantie van één jaar is van toepassing bij aankoop in de VS, met verlengingsopties tot vier jaar.
Invoerapparaten - Zeg maar dag tegen aanraakgevoelige toetsen
Toetsenbord
Dell heeft (gelukkig) de controversiële aanraakgevoelige toetsen van het model van vorig jaar vervangen door een meer traditionele aanpak. In feite zijn de grootte en feedback van de toetsen identiek aan de nieuwe XPS 14 voor dezelfde type-ervaring ondanks de grotere vormfactor van onze XPS 16.
Touchpad
In tegenstelling tot het toetsenbord profiteert het clickpad van de grotere vormfactor van 16 inch, aangezien het oppervlak iets groter is dan het clickpad op de XPS 14 (~15,2 x 9 cm vs. ~15,2 x 7,5 cm). De grip is ultra-soepel, maar multi-touch of drag-and-drop acties zijn nog steeds moeilijk vanwege de ondiepe en zwakke feedback. Het "onzichtbare" clickpad geeft aantoonbaar nog steeds de voorkeur aan vorm boven functie.


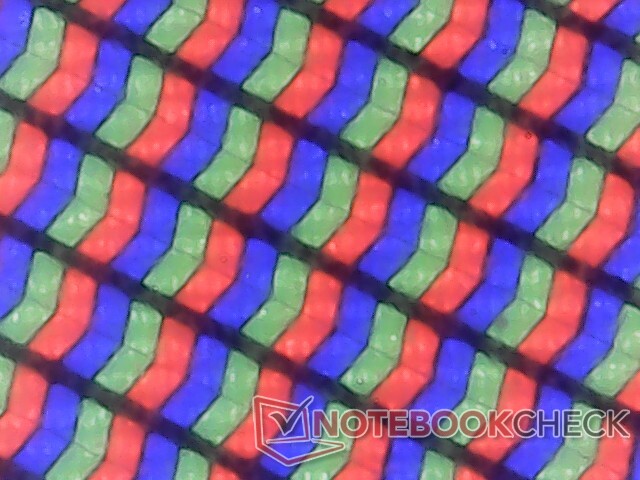
Beeldscherm - Een van de beste FHD+ IPS-panelen
Er zijn twee weergaveopties beschikbaar:
- 1920 x 1200, 100% sRGB, IPS, niet-touch, 1 - 120 Hz, mat
- 3200 x 2000, 100% DCI-P3, OLED, aanraakscherm, 20 - 120 Hz, DisplayHDR 500, glanzend
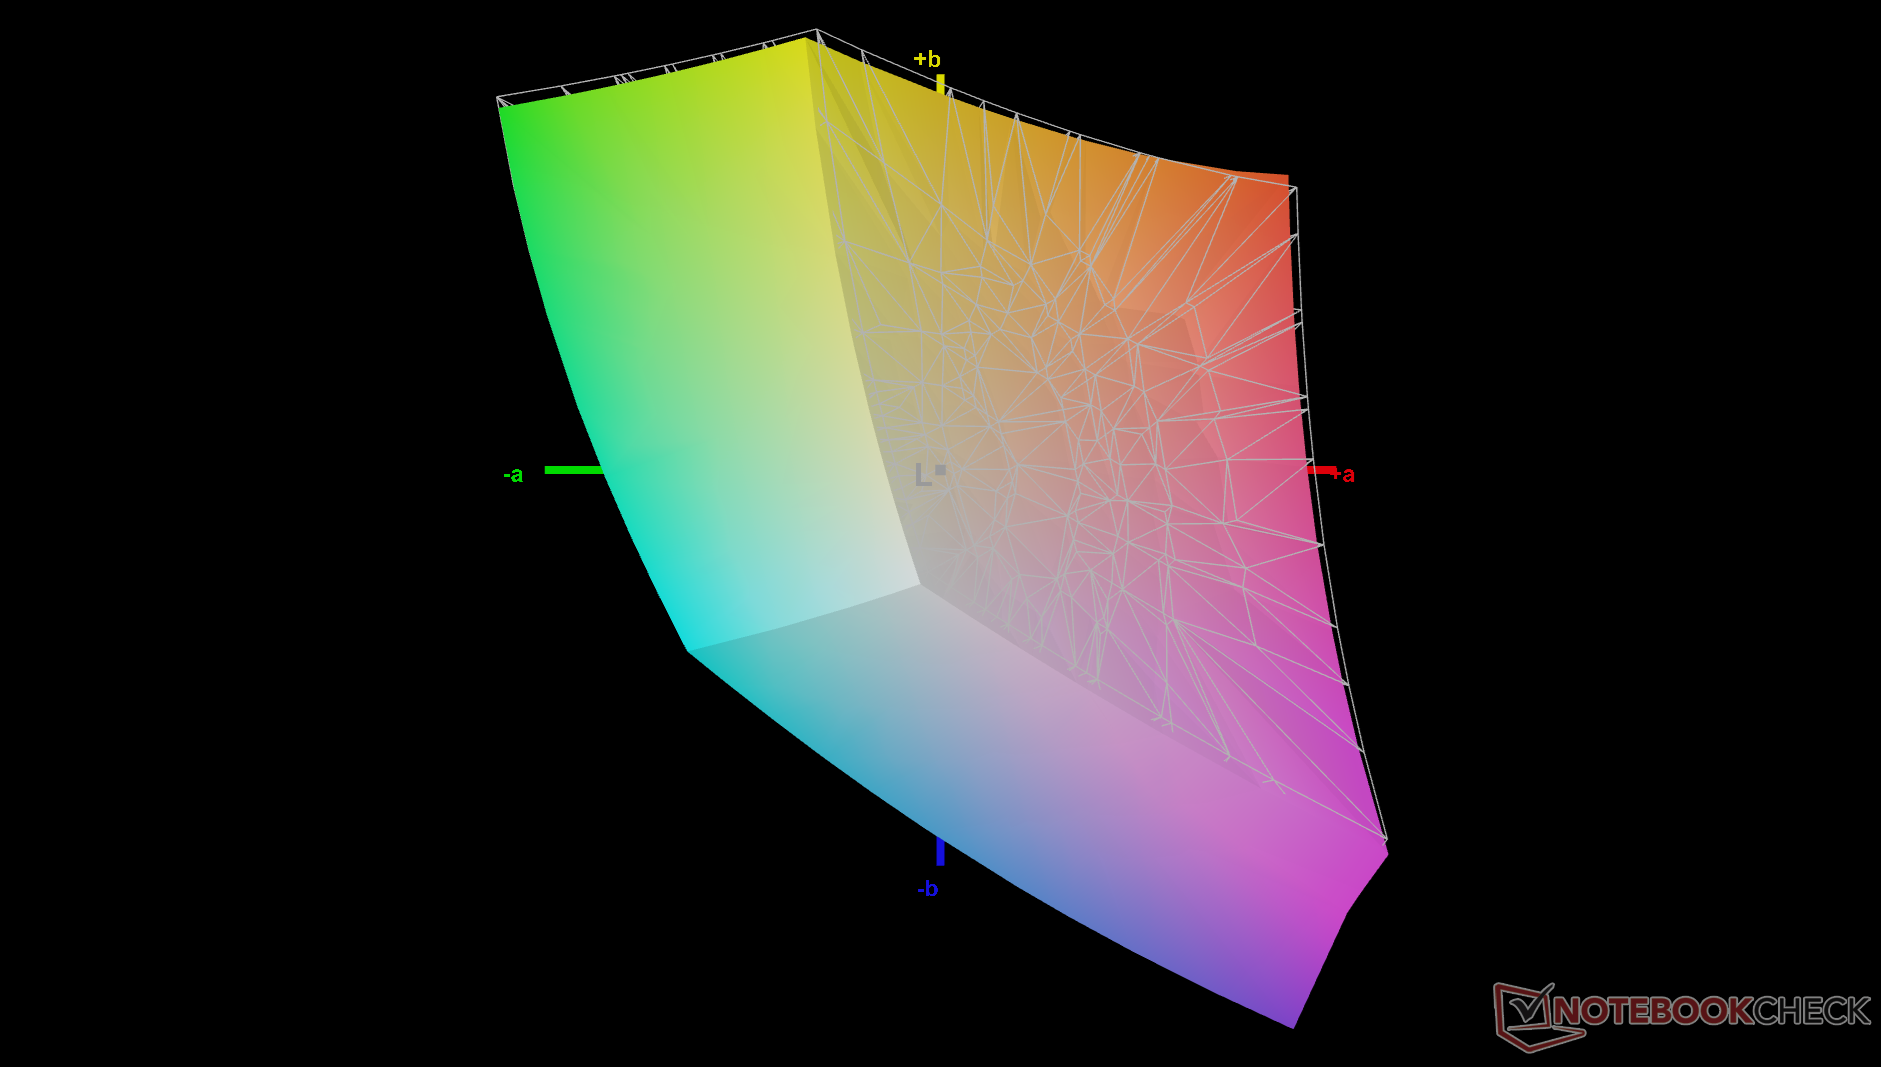
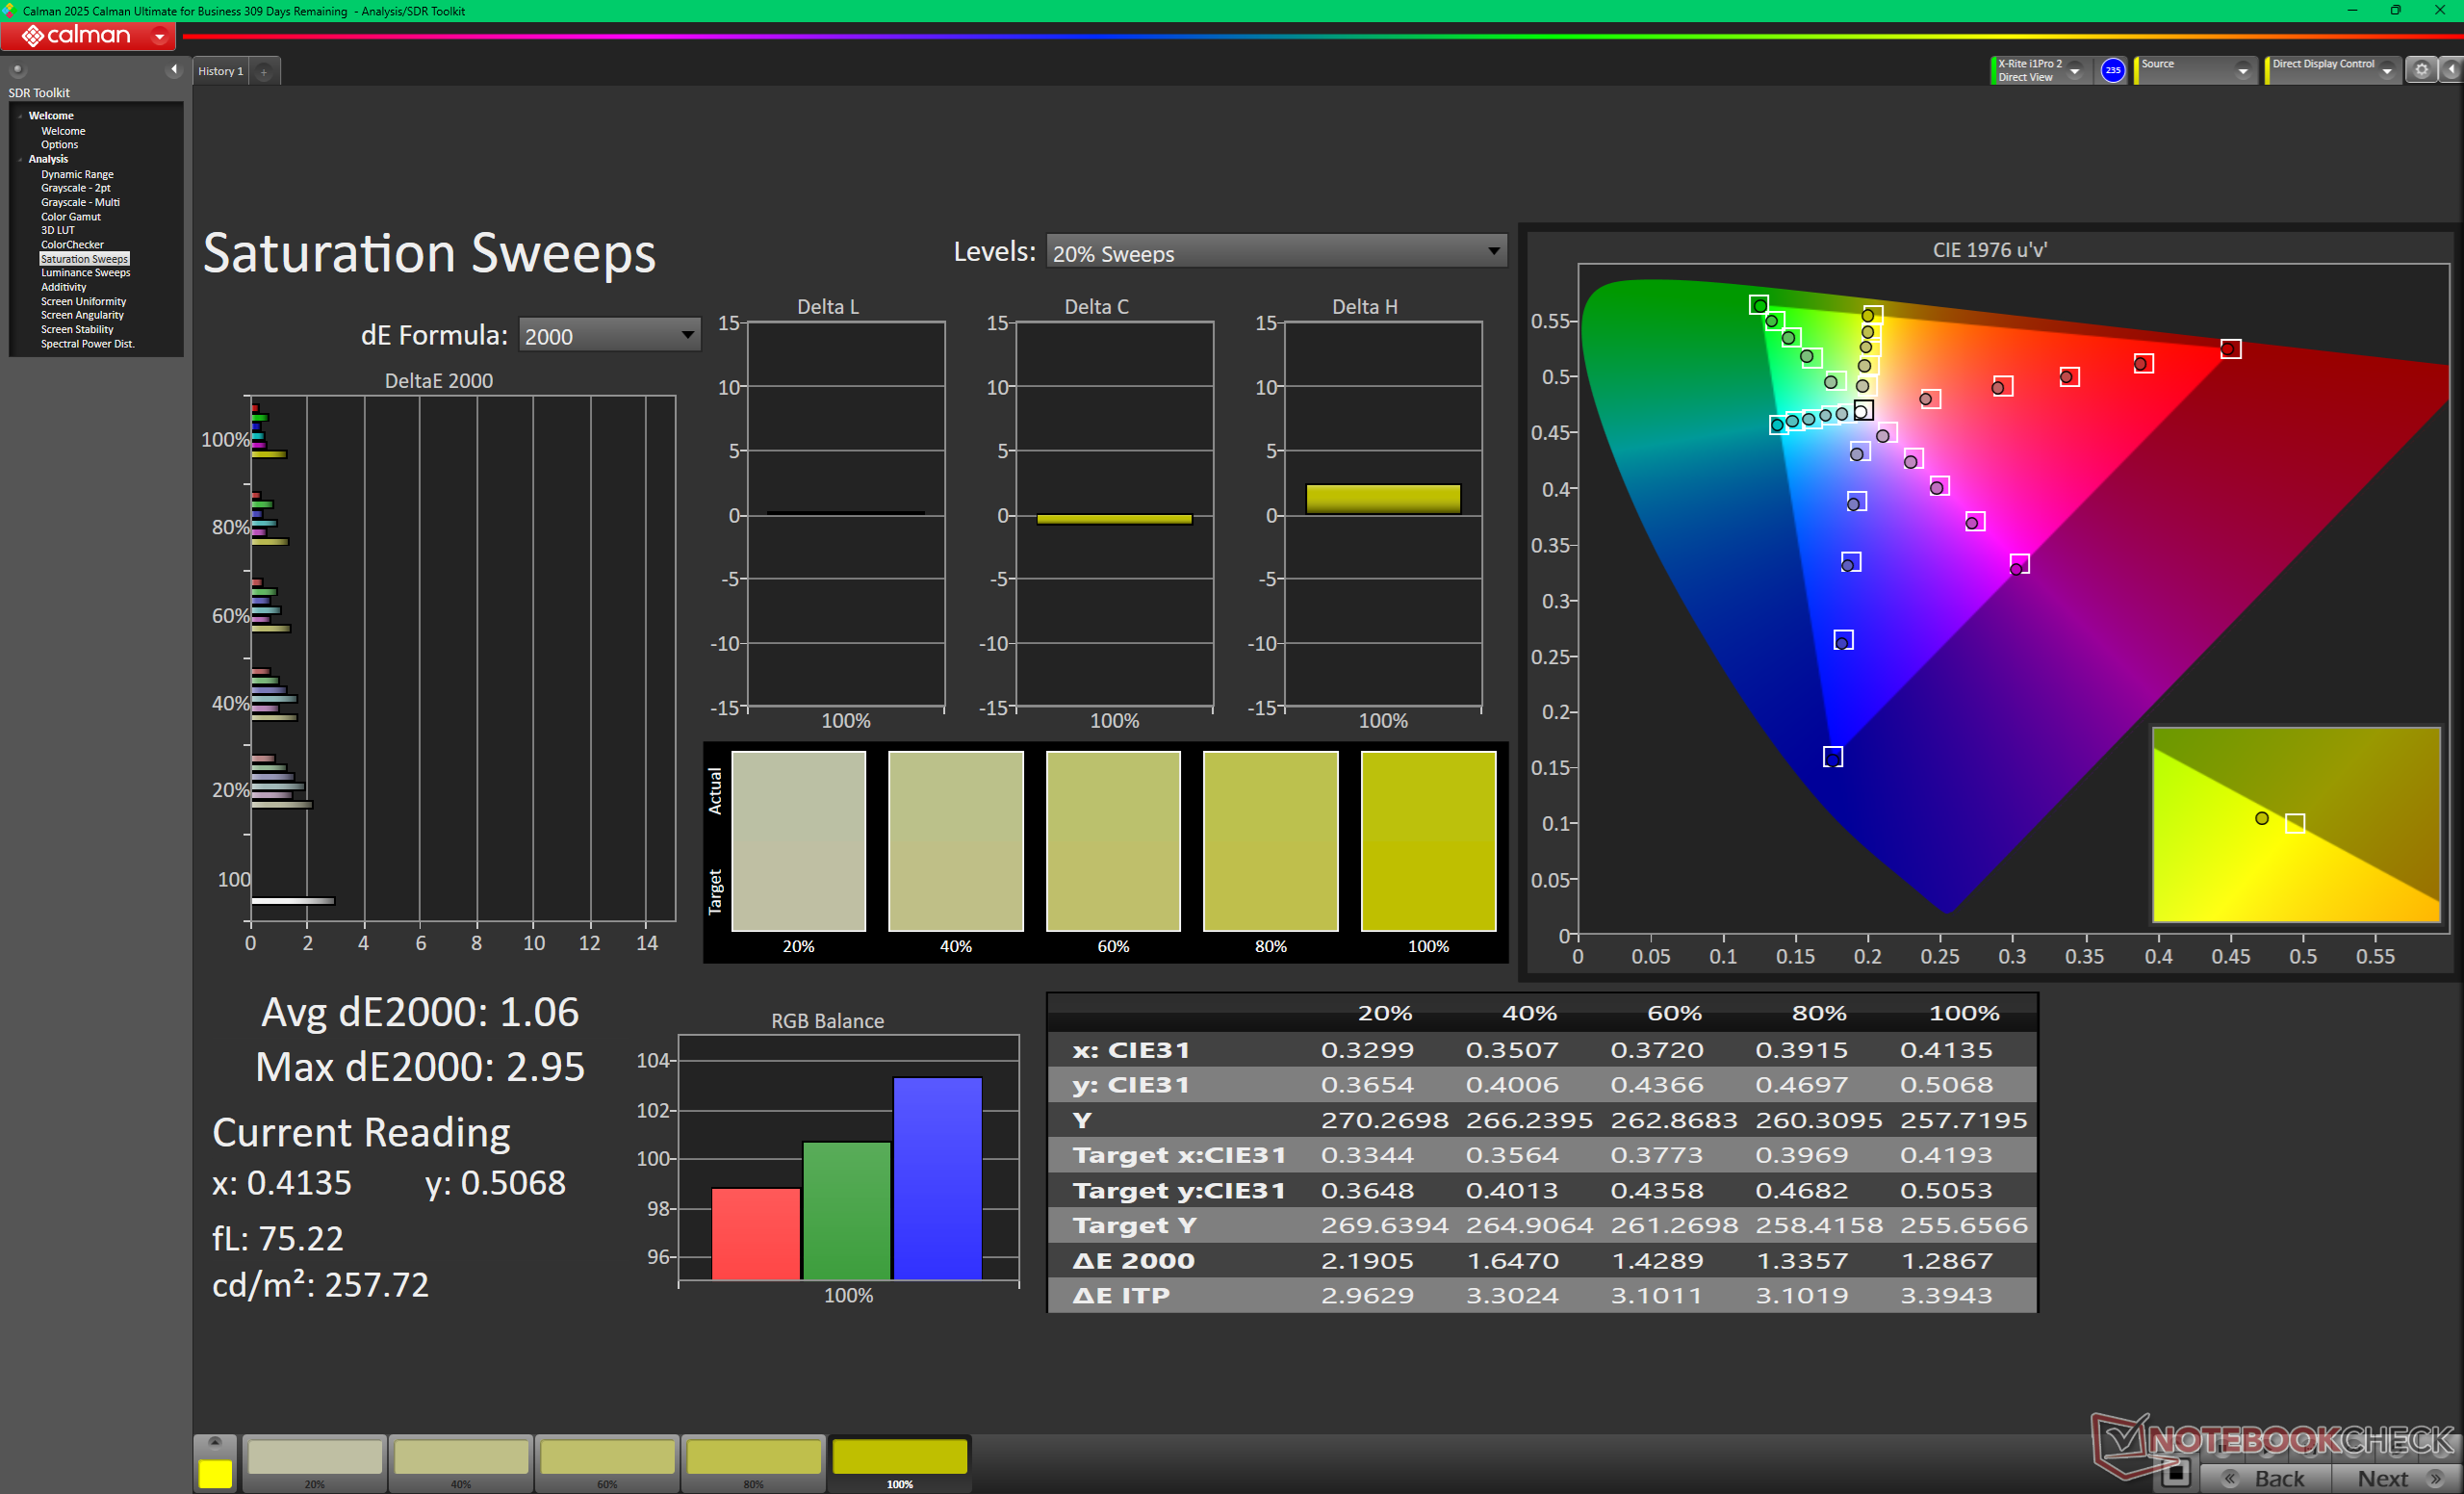
Het basisscherm biedt een zeer hoge contrastverhouding van ~2000:1, vooral voor een IPS-paneel. De beeldkwaliteit is verrassend scherp voor een matte overlay, terwijl de volledige sRGB-kleuren de meeste algemene gebruikers of casual content creators tevreden zouden moeten stellen. Diepere P3-kleuren, HDR-ondersteuning of touchscreen-functionaliteit zijn alleen beschikbaar op de duurdere OLED-configuratie.
VRR is standaard uitgeschakeld. Gebruikers kunnen VRR inschakelen via de geavanceerde weergaveopties van Windows. De minimale vernieuwingsfrequentie van 1 Hz is een unieke eigenschap van het basispaneel die op de meeste andere laptops niet voorkomt.


| |||||||||||||||||||||||||
Helderheidsverdeling: 92 %
Helderheid in Batterij-modus: 534.6 cd/m²
Contrast: 2056:1 (Zwart: 0.26 cd/m²)
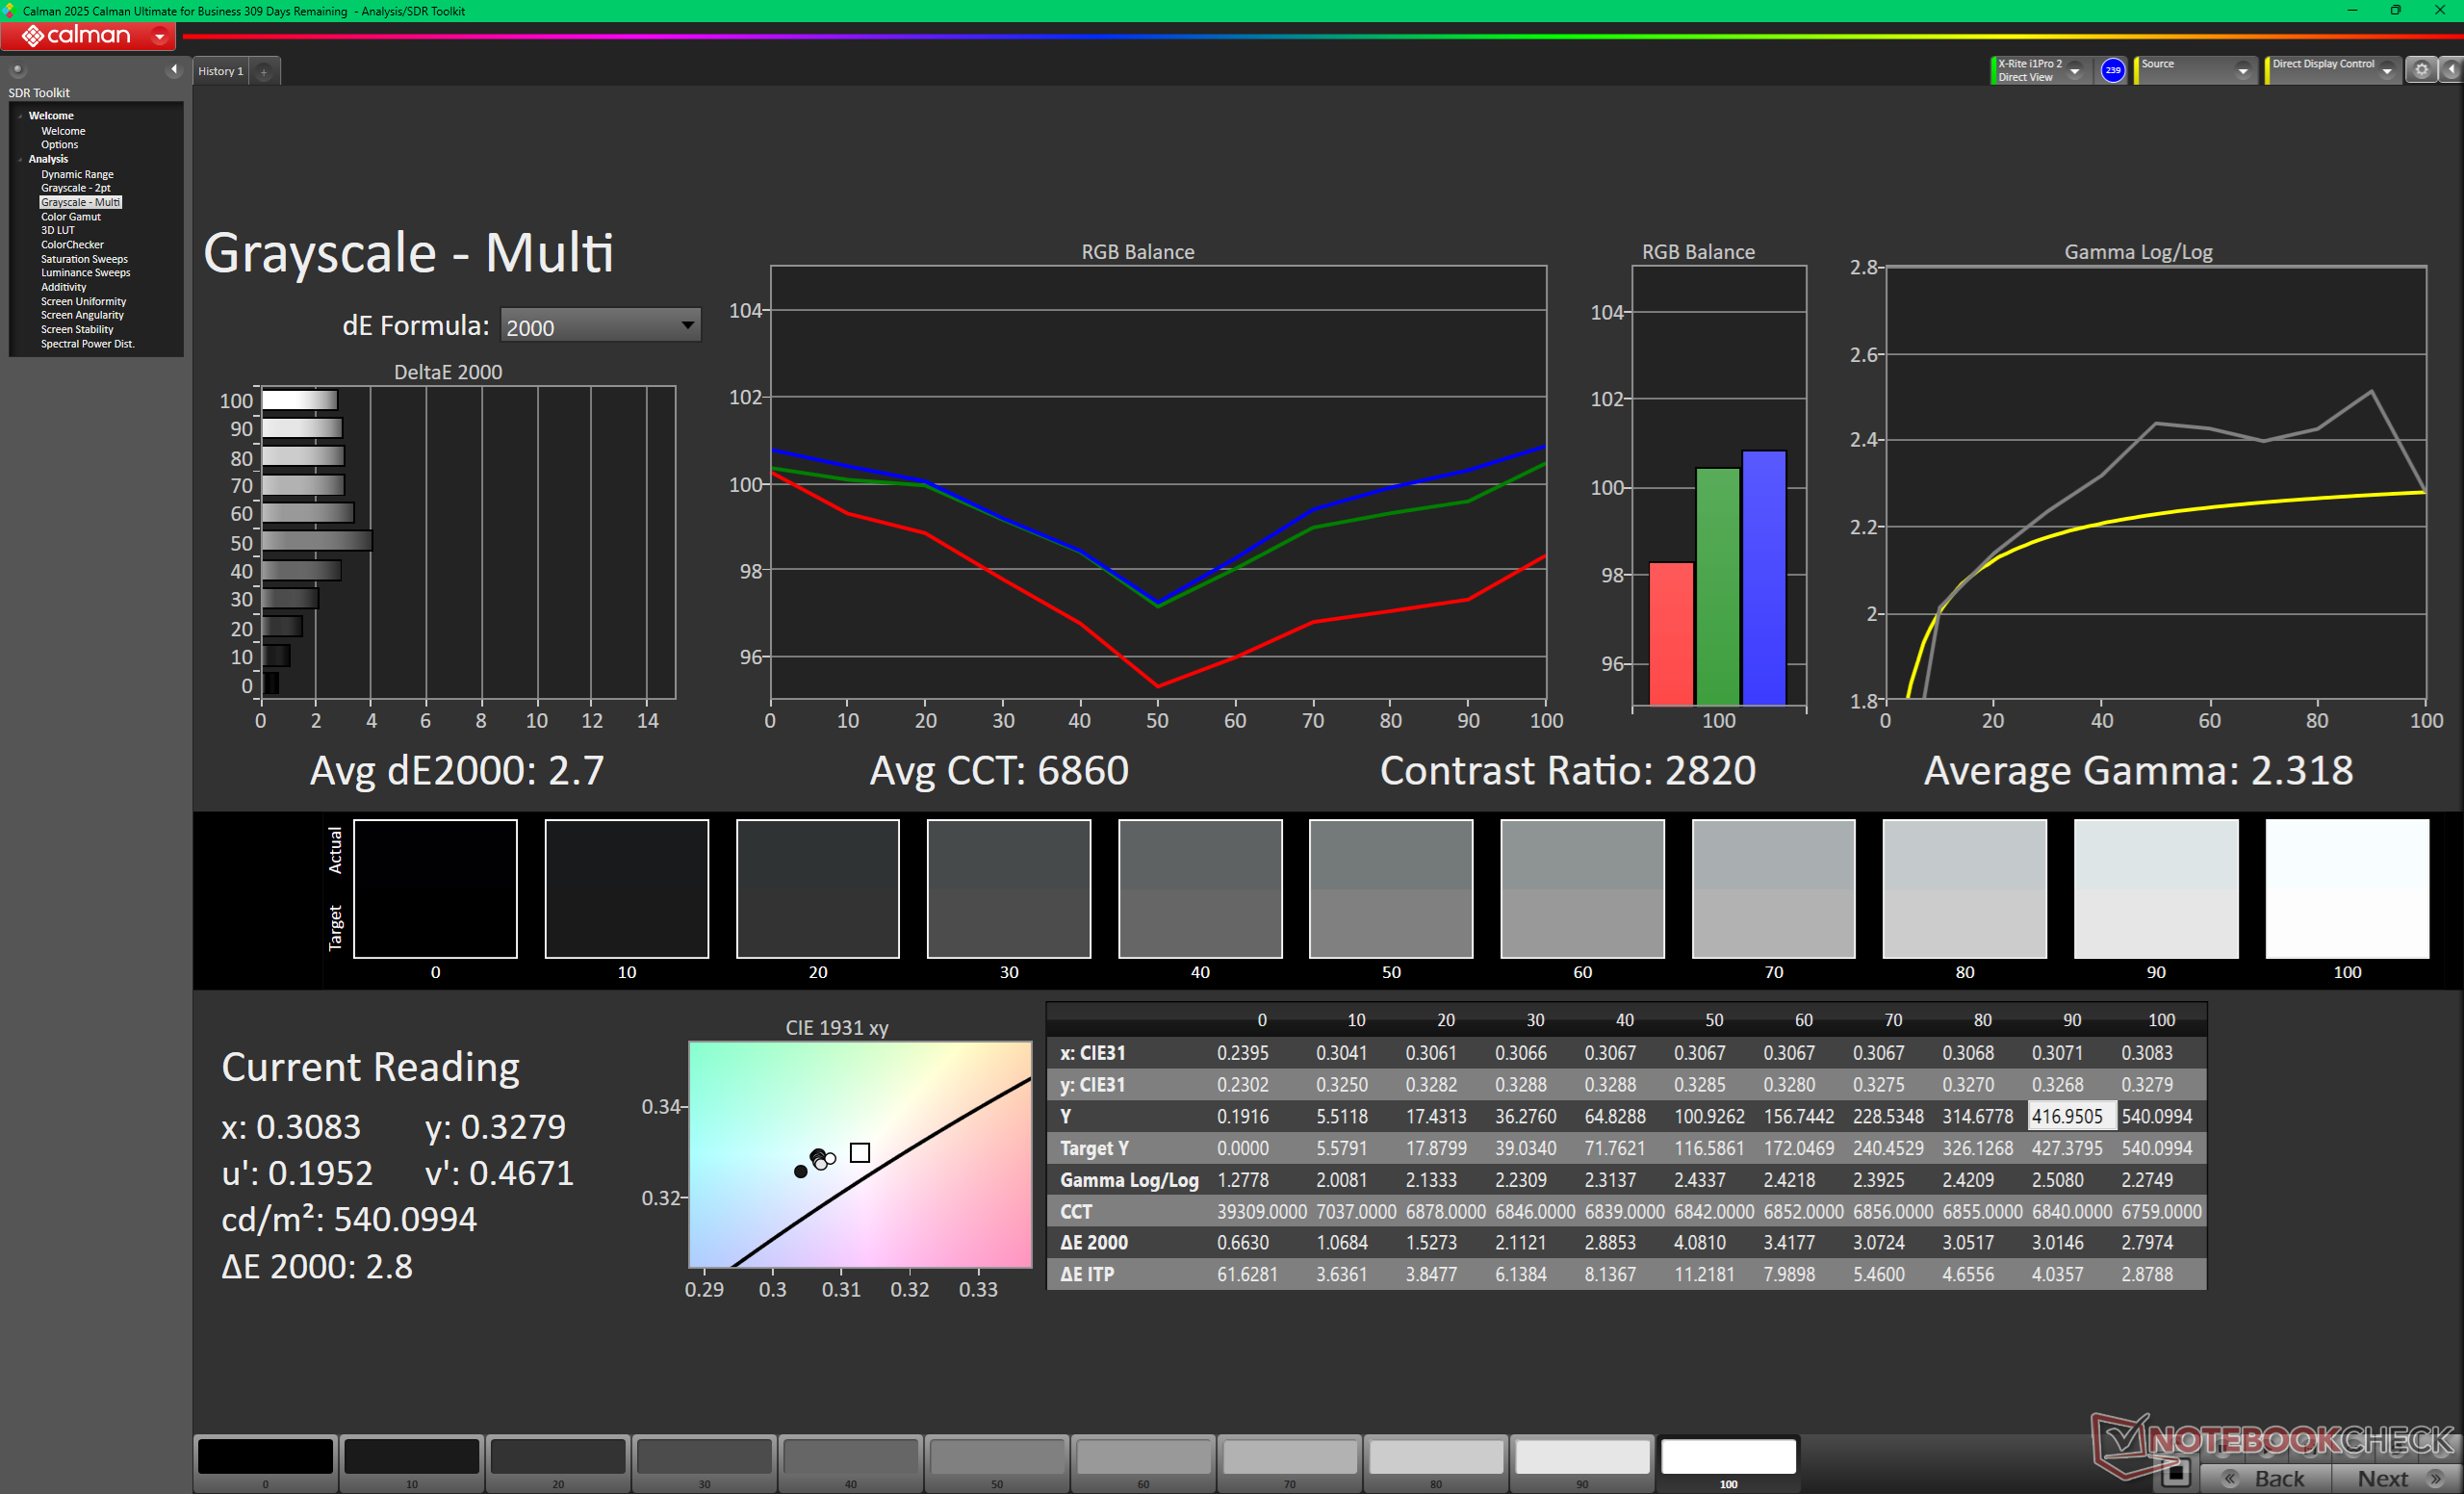
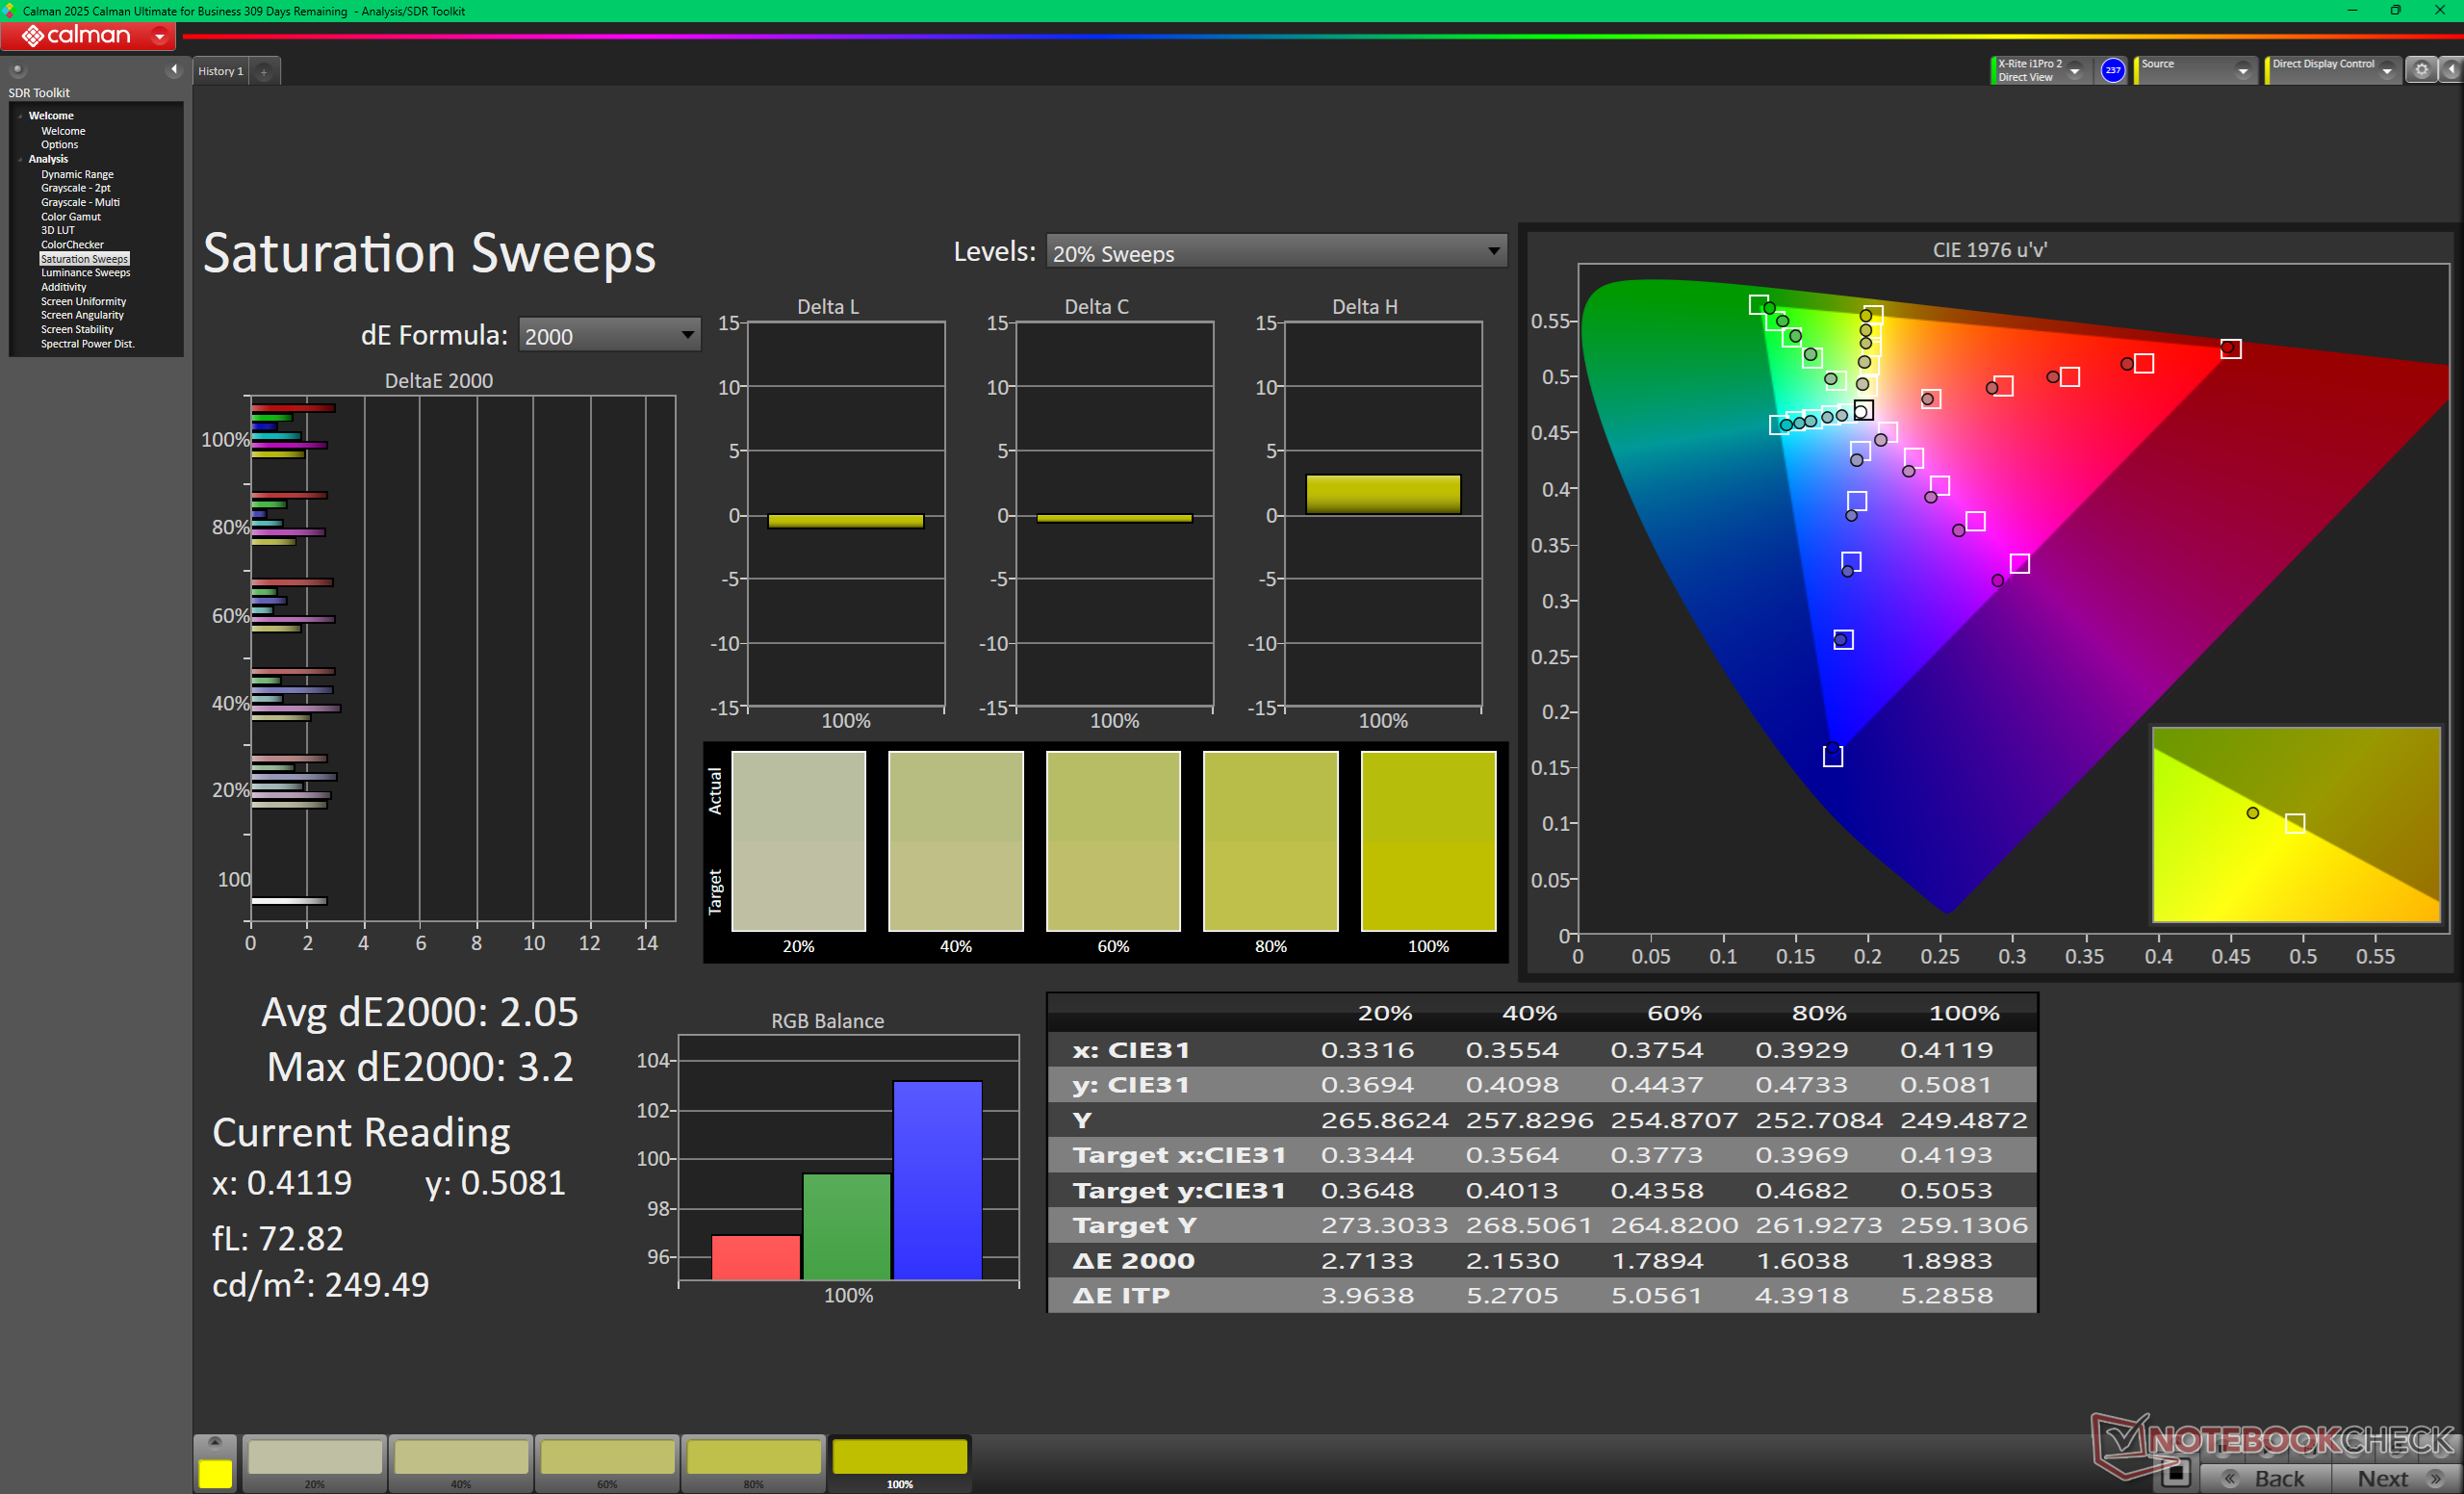
ΔE ColorChecker Calman: 2.53 | ∀{0.5-29.43 Ø4.73}
calibrated: 1.26
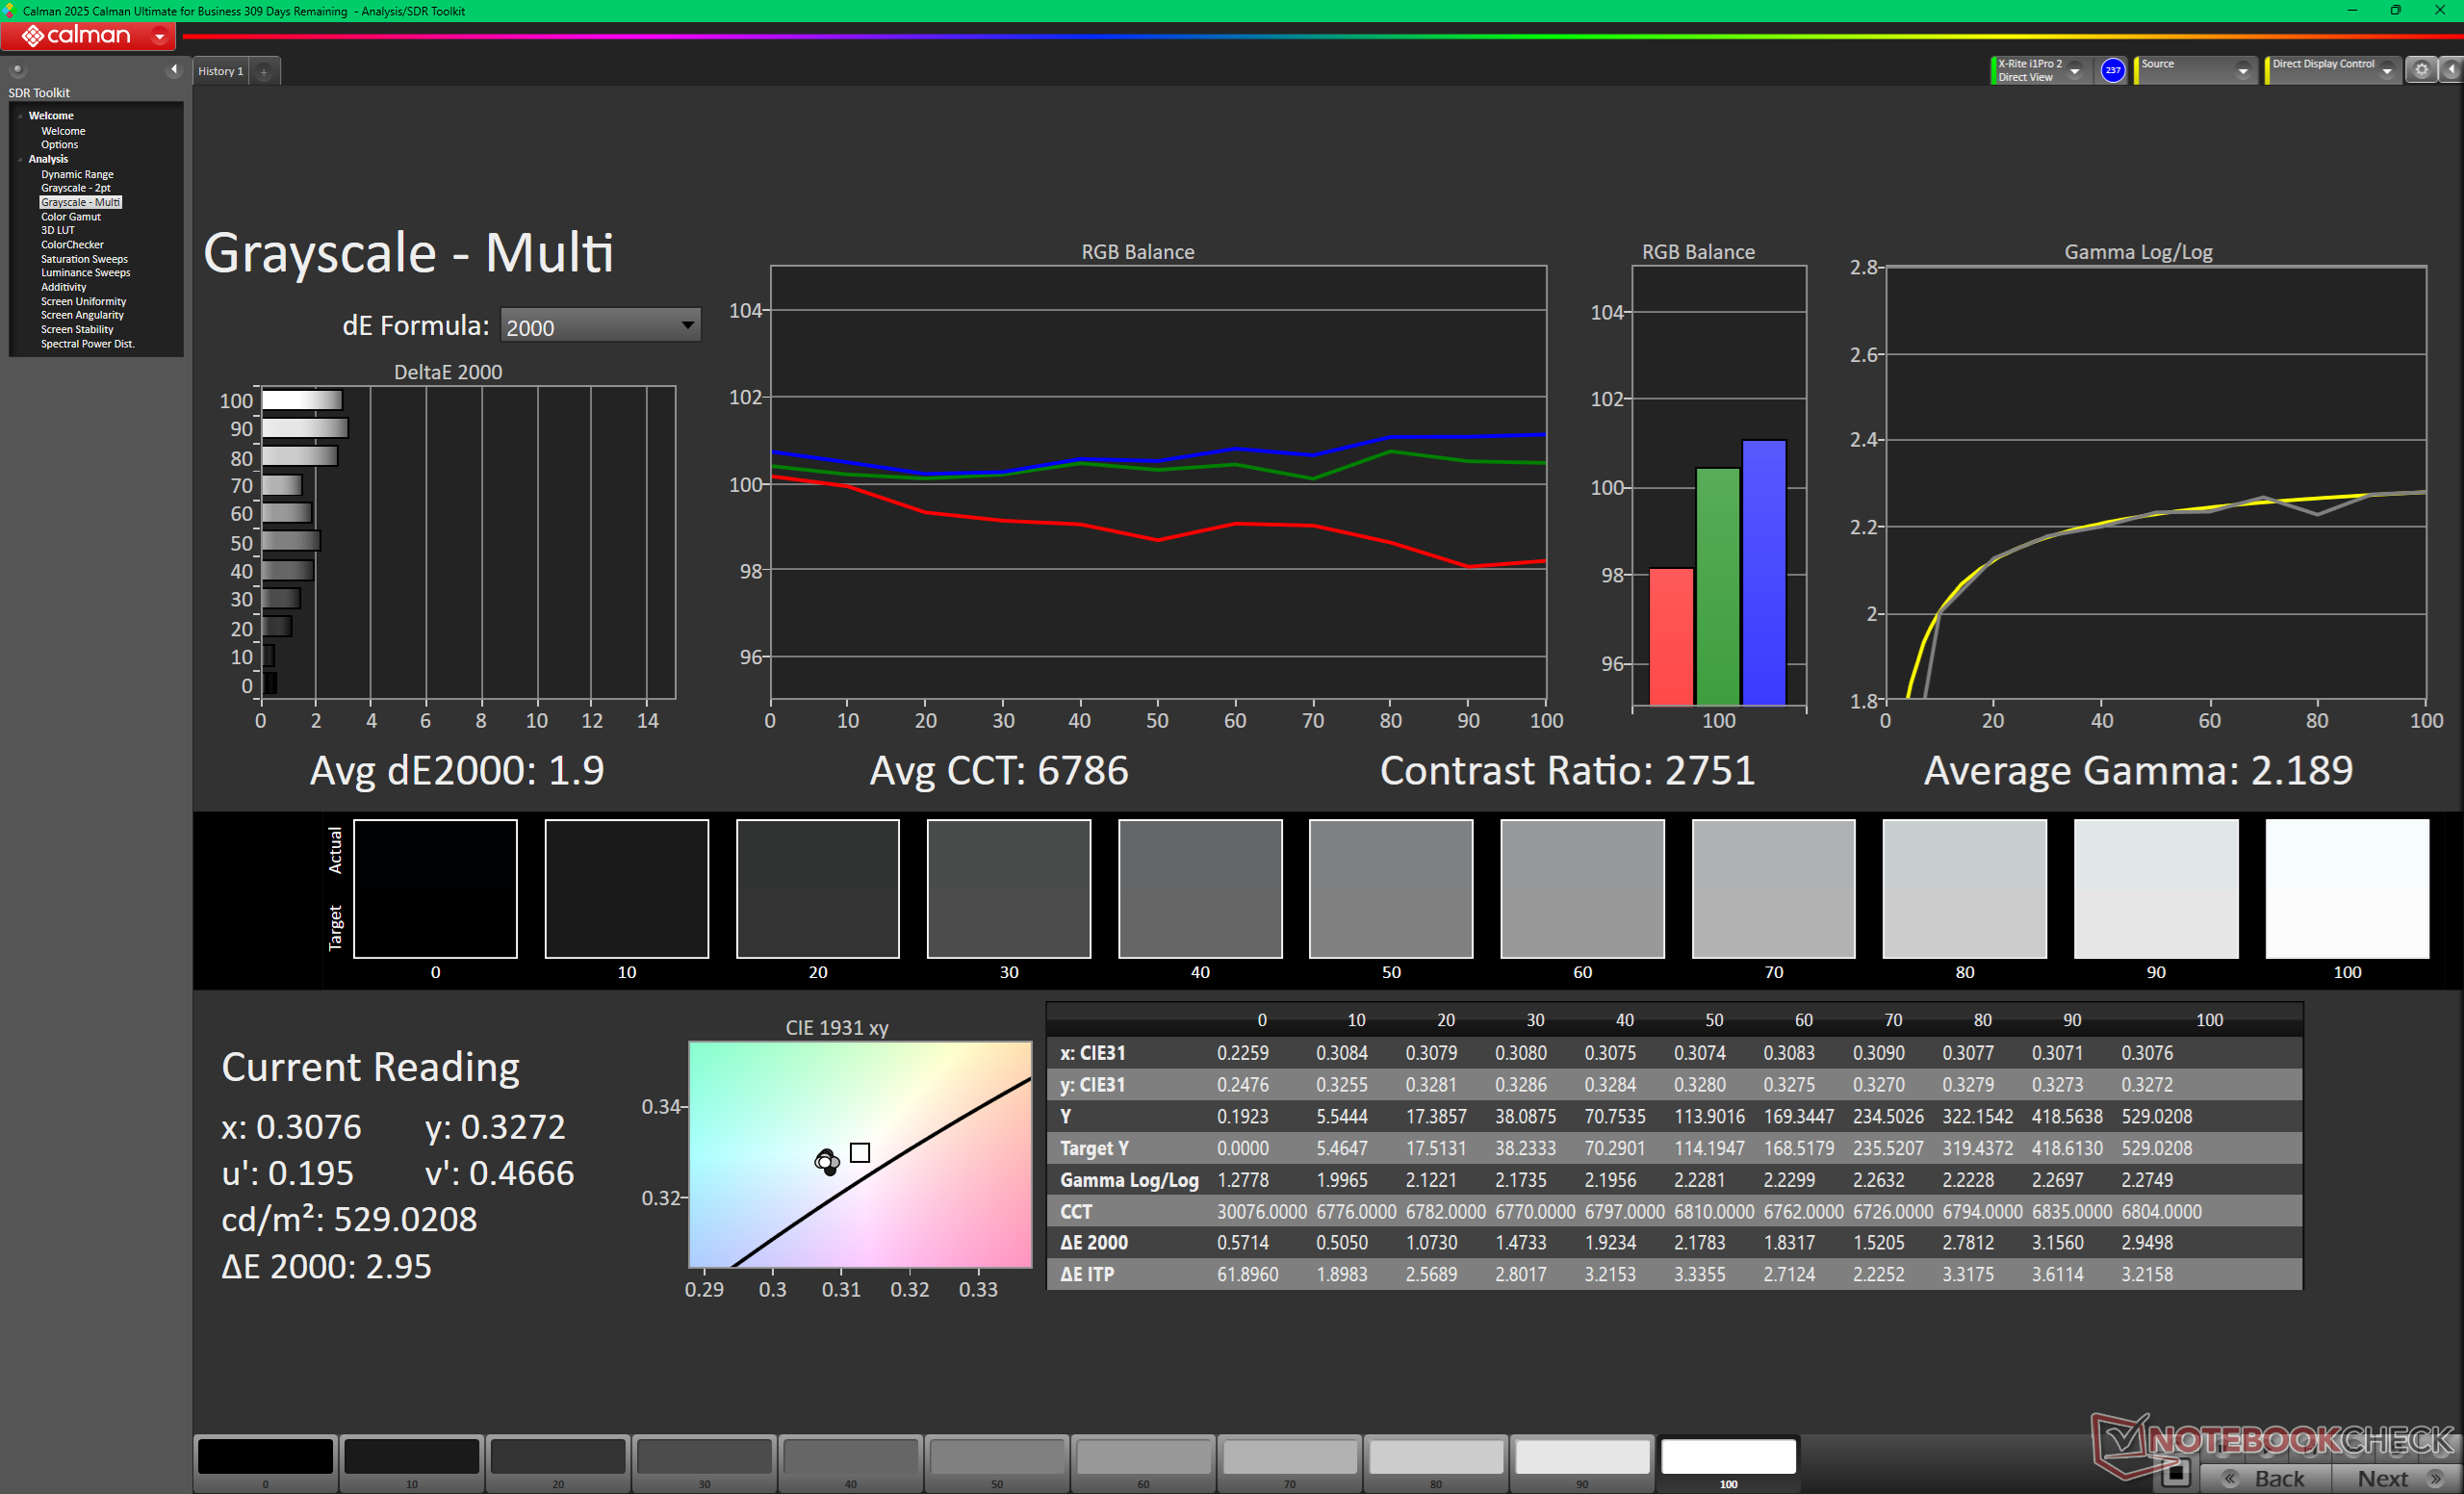
ΔE Greyscale Calman: 2.7 | ∀{0.09-98 Ø4.97}
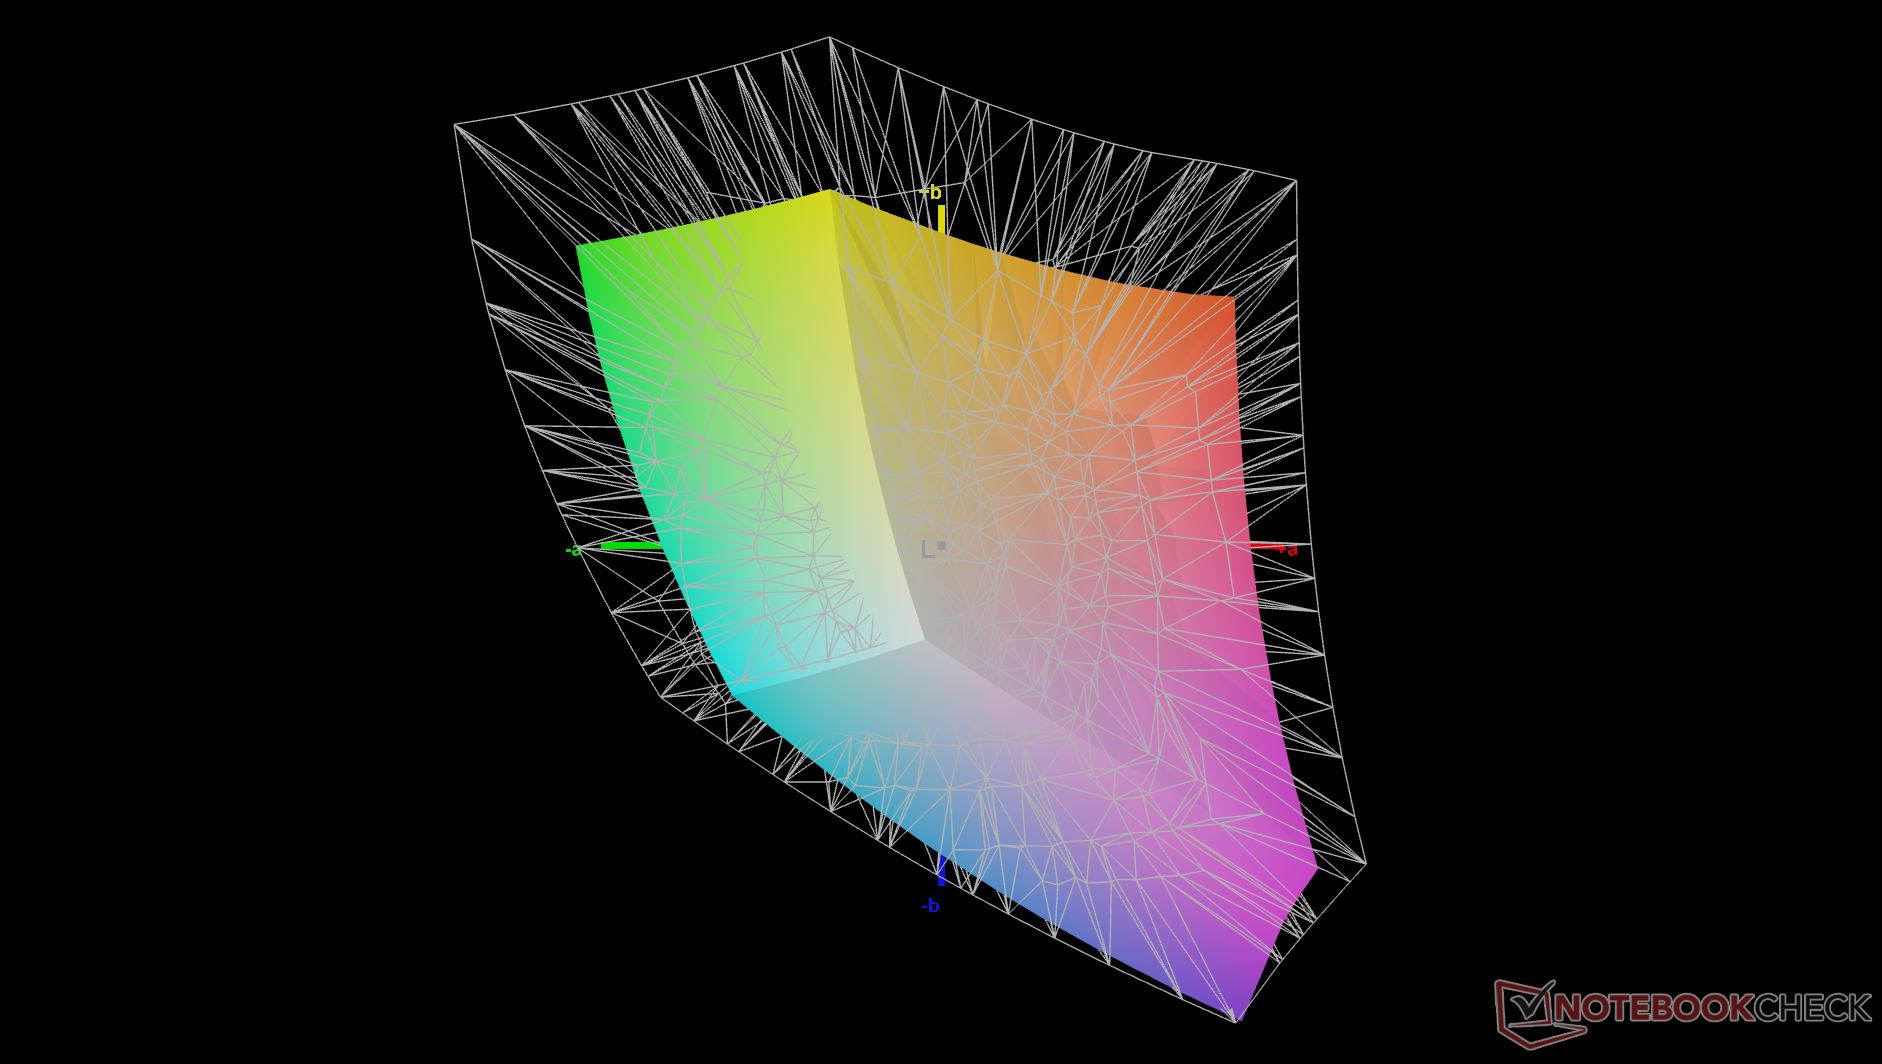
67.7% AdobeRGB 1998 (Argyll 3D)
97.4% sRGB (Argyll 3D)
66.2% Display P3 (Argyll 3D)
Gamma: 2.32
CCT: 6860 K
| Dell XPS 16 Core Ultra 5 325 LG Philips 160WUX, IPS, 1920x1200, 16", 120 Hz | Dell XPS 16 9640 SDC4196, OLED, 3840x2400, 16.3", 90 Hz | Lenovo Yoga Pro 9 16IAH10 RTX 5050 ATNA60HR04-0, OLED, 2880x1800, 16", 120 Hz | Samsung Galaxy Book6 Ultra ATNA60HR05-0, OLED, 2880x1800, 16", 120 Hz | Asus ZenBook S16 UM5606GA ATNA60HR07-0, OLED, 2880x1800, 16", 120 Hz | MSI Prestige 16 AI Evo B2HMG B160QAN03_R, IPS, 2560x1600, 16", 60 Hz | |
|---|---|---|---|---|---|---|
| Display | 27% | 25% | 31% | 24% | ||
| Display P3 Coverage (%) | 66.2 | 98.3 48% | 97 47% | 99.8 51% | 96.4 46% | |
| sRGB Coverage (%) | 97.4 | 100 3% | 99.9 3% | 100 3% | 99.7 2% | |
| AdobeRGB 1998 Coverage (%) | 67.7 | 87.8 30% | 85.3 26% | 94 39% | 84.3 25% | |
| Response Times | 98% | 99% | 98% | -12% | ||
| Response Time Grey 50% / Grey 80% * (ms) | 39.3 ? | 0.82 ? 98% | 0.5 ? 99% | 1.27 ? 97% | 51.5 ? -31% | |
| Response Time Black / White * (ms) | 26 ? | 0.85 ? 97% | 0.4 ? 98% | 0.43 ? 98% | 24.3 ? 7% | |
| PWM Frequency (Hz) | 360 ? | 1200 | 240 ? | 960 ? | ||
| PWM Amplitude * (%) | 37 | 100 | 56 | |||
| Screen | 8% | -15% | 26% | 18% | -55% | |
| Brightness middle (cd/m²) | 534.6 | 366 -32% | 471.7 -12% | 499 -7% | 465 -13% | 471 -12% |
| Brightness (cd/m²) | 515 | 367 -29% | 474 -8% | 505 -2% | 466 -10% | 455 -12% |
| Brightness Distribution (%) | 92 | 96 4% | 98 7% | 97 5% | 99 8% | 92 0% |
| Black Level * (cd/m²) | 0.26 | 0.2 23% | ||||
| Contrast (:1) | 2056 | 2355 15% | ||||
| Colorchecker dE 2000 * | 2.53 | 1.3 49% | 3.53 -40% | 0.9 64% | 1 60% | 5.8 -129% |
| Colorchecker dE 2000 max. * | 4.57 | 3.6 21% | 6.31 -38% | 2.1 54% | 3 34% | 10.8 -136% |
| Colorchecker dE 2000 calibrated * | 1.26 | 1 21% | 1.9 -51% | |||
| Greyscale dE 2000 * | 2.7 | 2.2 19% | 2.6 4% | 1.6 41% | 1.9 30% | 7.8 -189% |
| Gamma | 2.32 95% | 2.14 103% | 2.24 98% | 2.22 99% | 2.19 100% | 2.07 106% |
| CCT | 6860 95% | 6680 97% | 6292 103% | 6445 101% | 6458 101% | 7262 90% |
| Totaal Gemiddelde (Programma / Instellingen) | 44% /
27% | -15% /
-15% | 50% /
39% | 49% /
36% | -14% /
-32% |
* ... kleiner is beter
Het beeldscherm komt redelijk gekalibreerd uit de doos met wat ruimte voor verbetering. Kalibratie met onze eigen X-Rite colorimeter zou bijvoorbeeld de toch al lage gemiddelde deltaE-waarden voor grijswaarden en kleuren verbeteren van respectievelijk 2,7 en 2,53 tot slechts 1,9 en 1,26. Ons gekalibreerde ICM-profiel hierboven kunt u gratis downloaden.


Responstijd Scherm
| ↔ Responstijd Zwart naar Wit | ||
|---|---|---|
| 26 ms ... stijging ↗ en daling ↘ gecombineerd | ↗ 11.7 ms stijging | 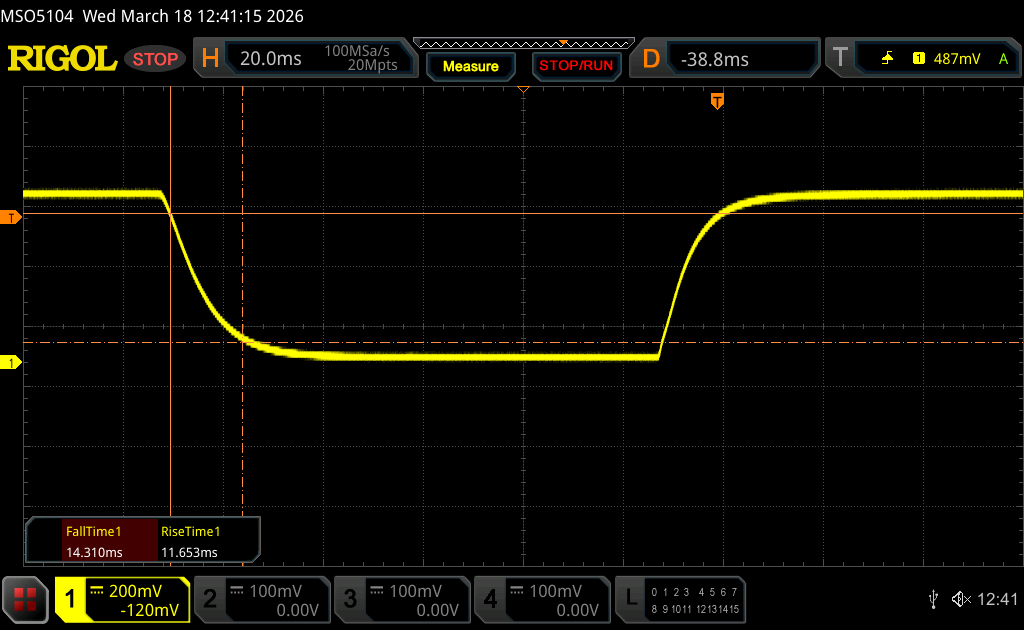 |
| ↘ 14.3 ms daling | ||
| Het scherm vertoonde relatief trage responstijden in onze tests en is misschien te traag voor games. Ter vergelijking: alle testtoestellen variëren van 0.1 (minimum) tot 240 (maximum) ms. » 62 % van alle toestellen zijn beter. Dit betekent dat de gemeten responstijd slechter is dan het gemiddelde (19.9 ms) van alle geteste toestellen. | ||
| ↔ Responstijd 50% Grijs naar 80% Grijs | ||
| 39.3 ms ... stijging ↗ en daling ↘ gecombineerd | ↗ 18.1 ms stijging | 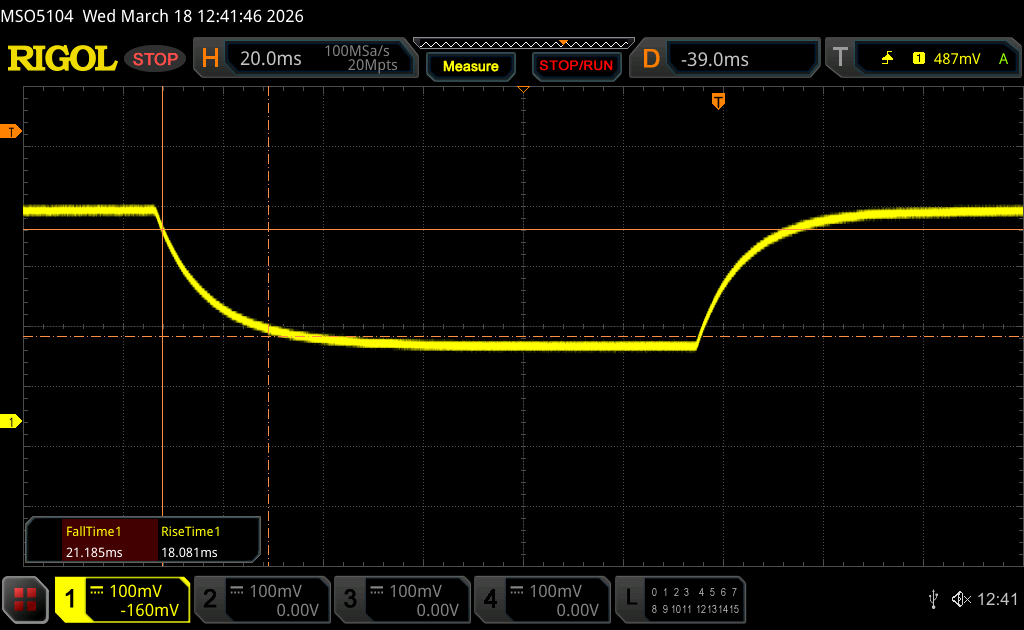 |
| ↘ 21.2 ms daling | ||
| Het scherm vertoonde trage responstijden in onze tests en is misschien te traag voor games. Ter vergelijking: alle testtoestellen variëren van 0.165 (minimum) tot 636 (maximum) ms. » 60 % van alle toestellen zijn beter. Dit betekent dat de gemeten responstijd slechter is dan het gemiddelde (31.1 ms) van alle geteste toestellen. | ||
Screen Flickering / PWM (Pulse-Width Modulation)
| Screen flickering / PWM niet waargenomen | 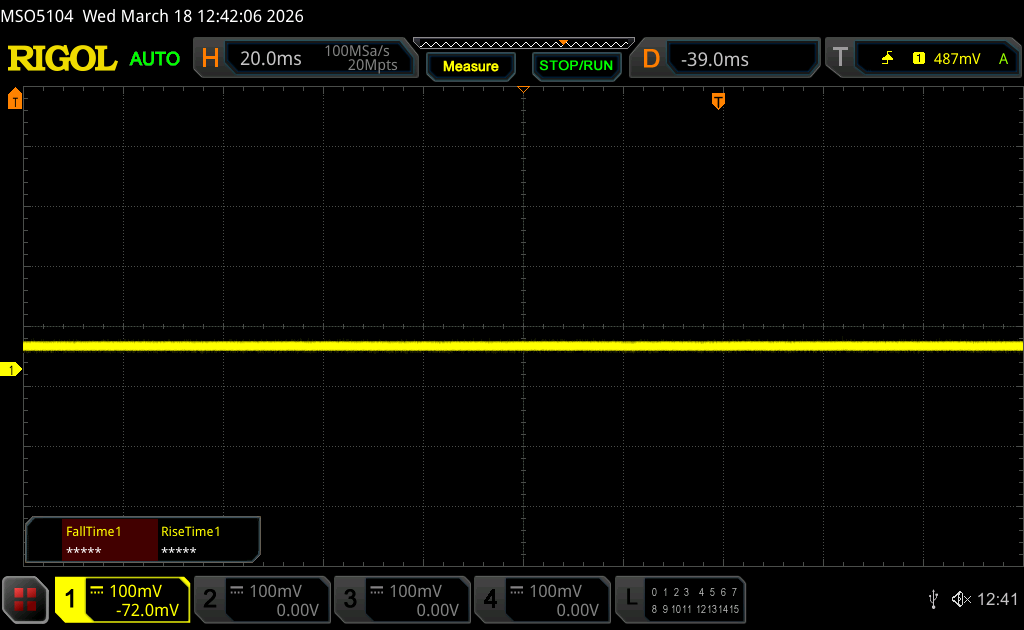 | ||
Ter vergelijking: 52 % van alle geteste toestellen maakten geen gebruik van PWM om de schermhelderheid te verlagen. Als het wel werd gebruikt, werd een gemiddelde van 7810 (minimum: 5 - maximum: 343500) Hz waargenomen. | |||
De zichtbaarheid buiten is redelijk in de schaduw dankzij de relatief heldere achtergrondverlichting van 500 nit en de matte overlay. In direct zonlicht worden de kleuren echter te veel uitgewassen.


Voorstelling - Alles inzetten op Panther Lake
Testomstandigheden
We hebben Windows en Dell Optimizer ingesteld op de modus Prestaties voordat we de onderstaande benchmarks uitvoerden.
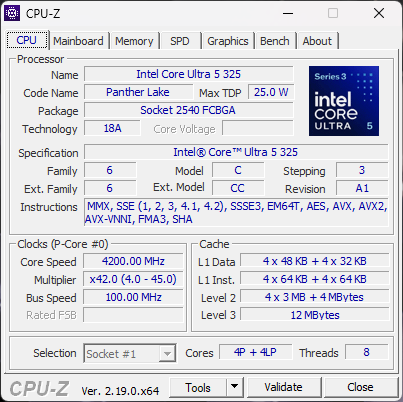
Processor
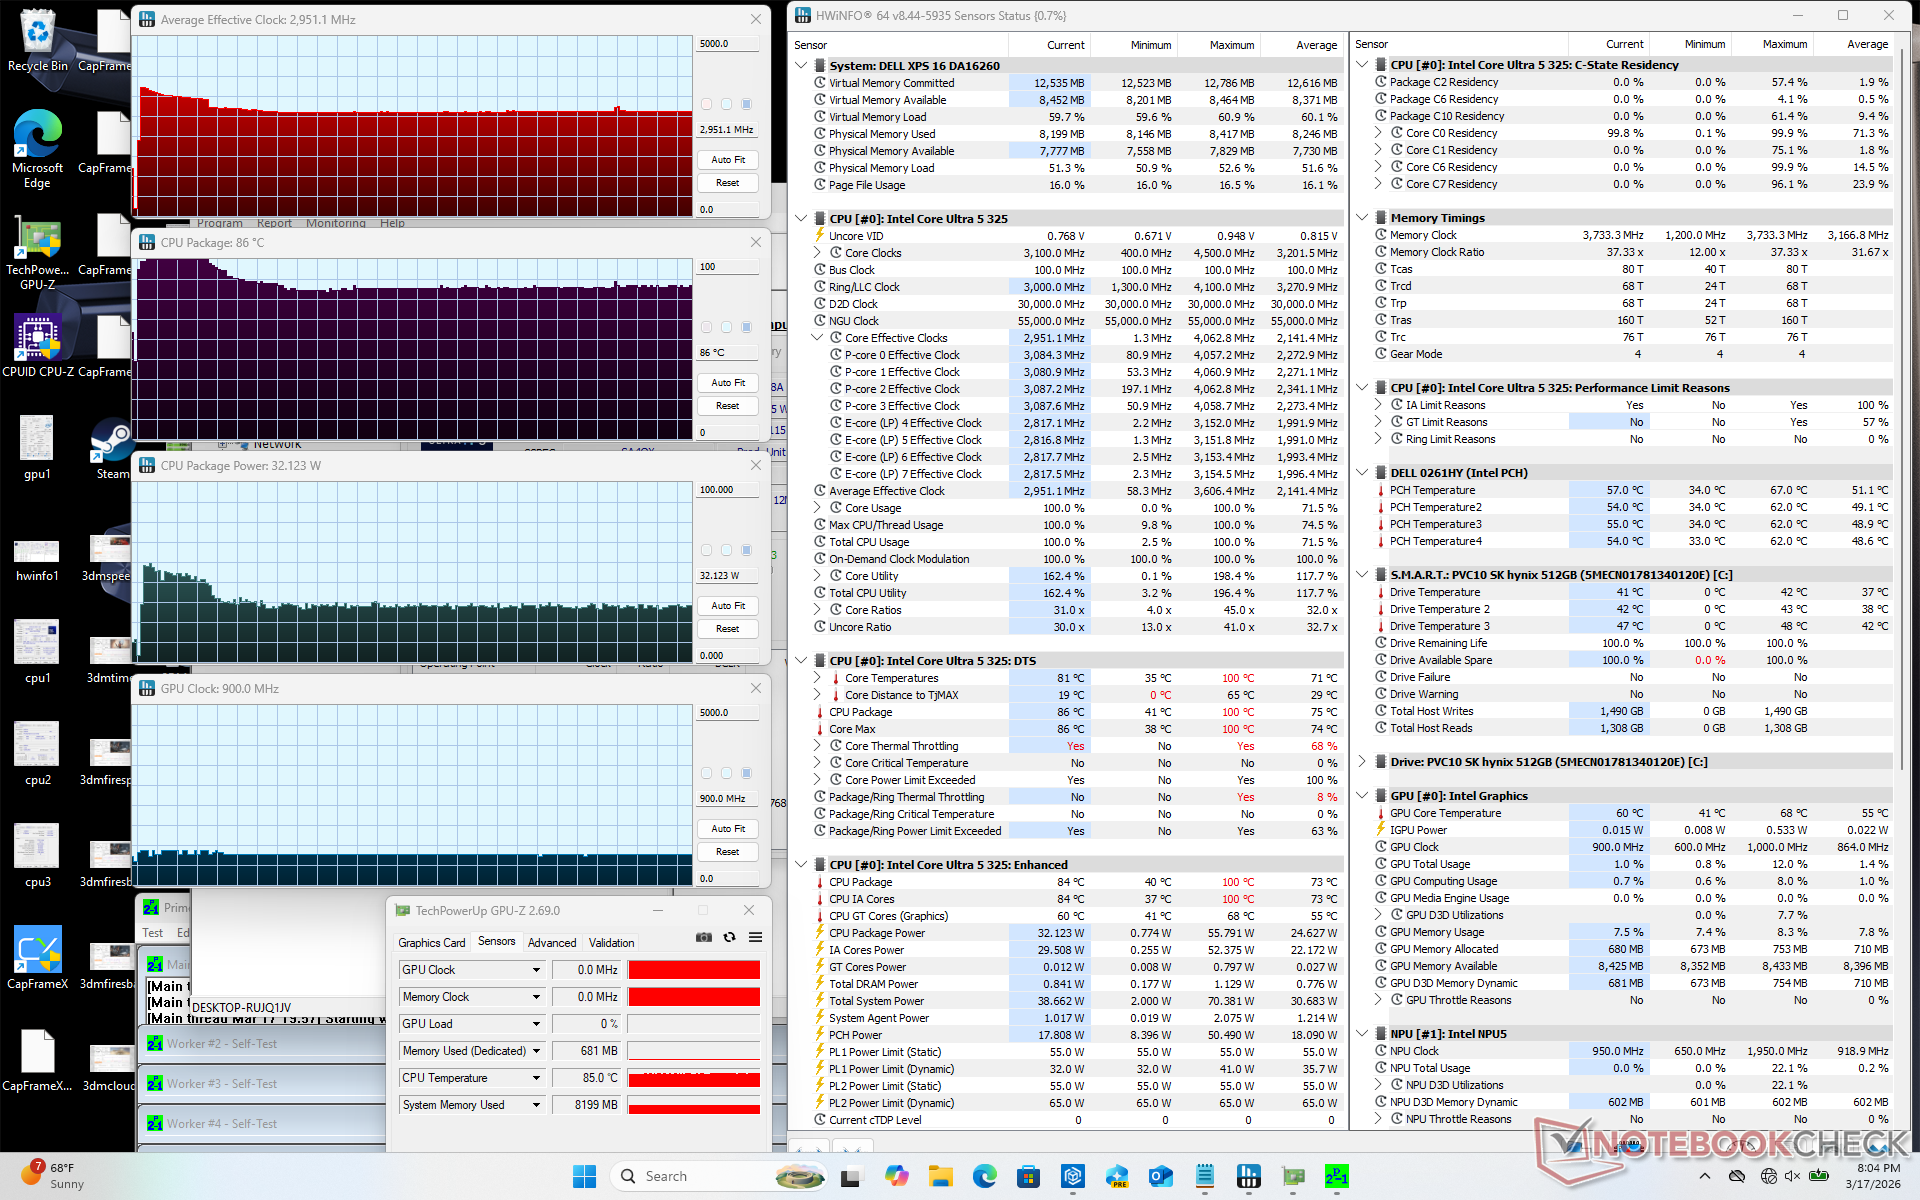
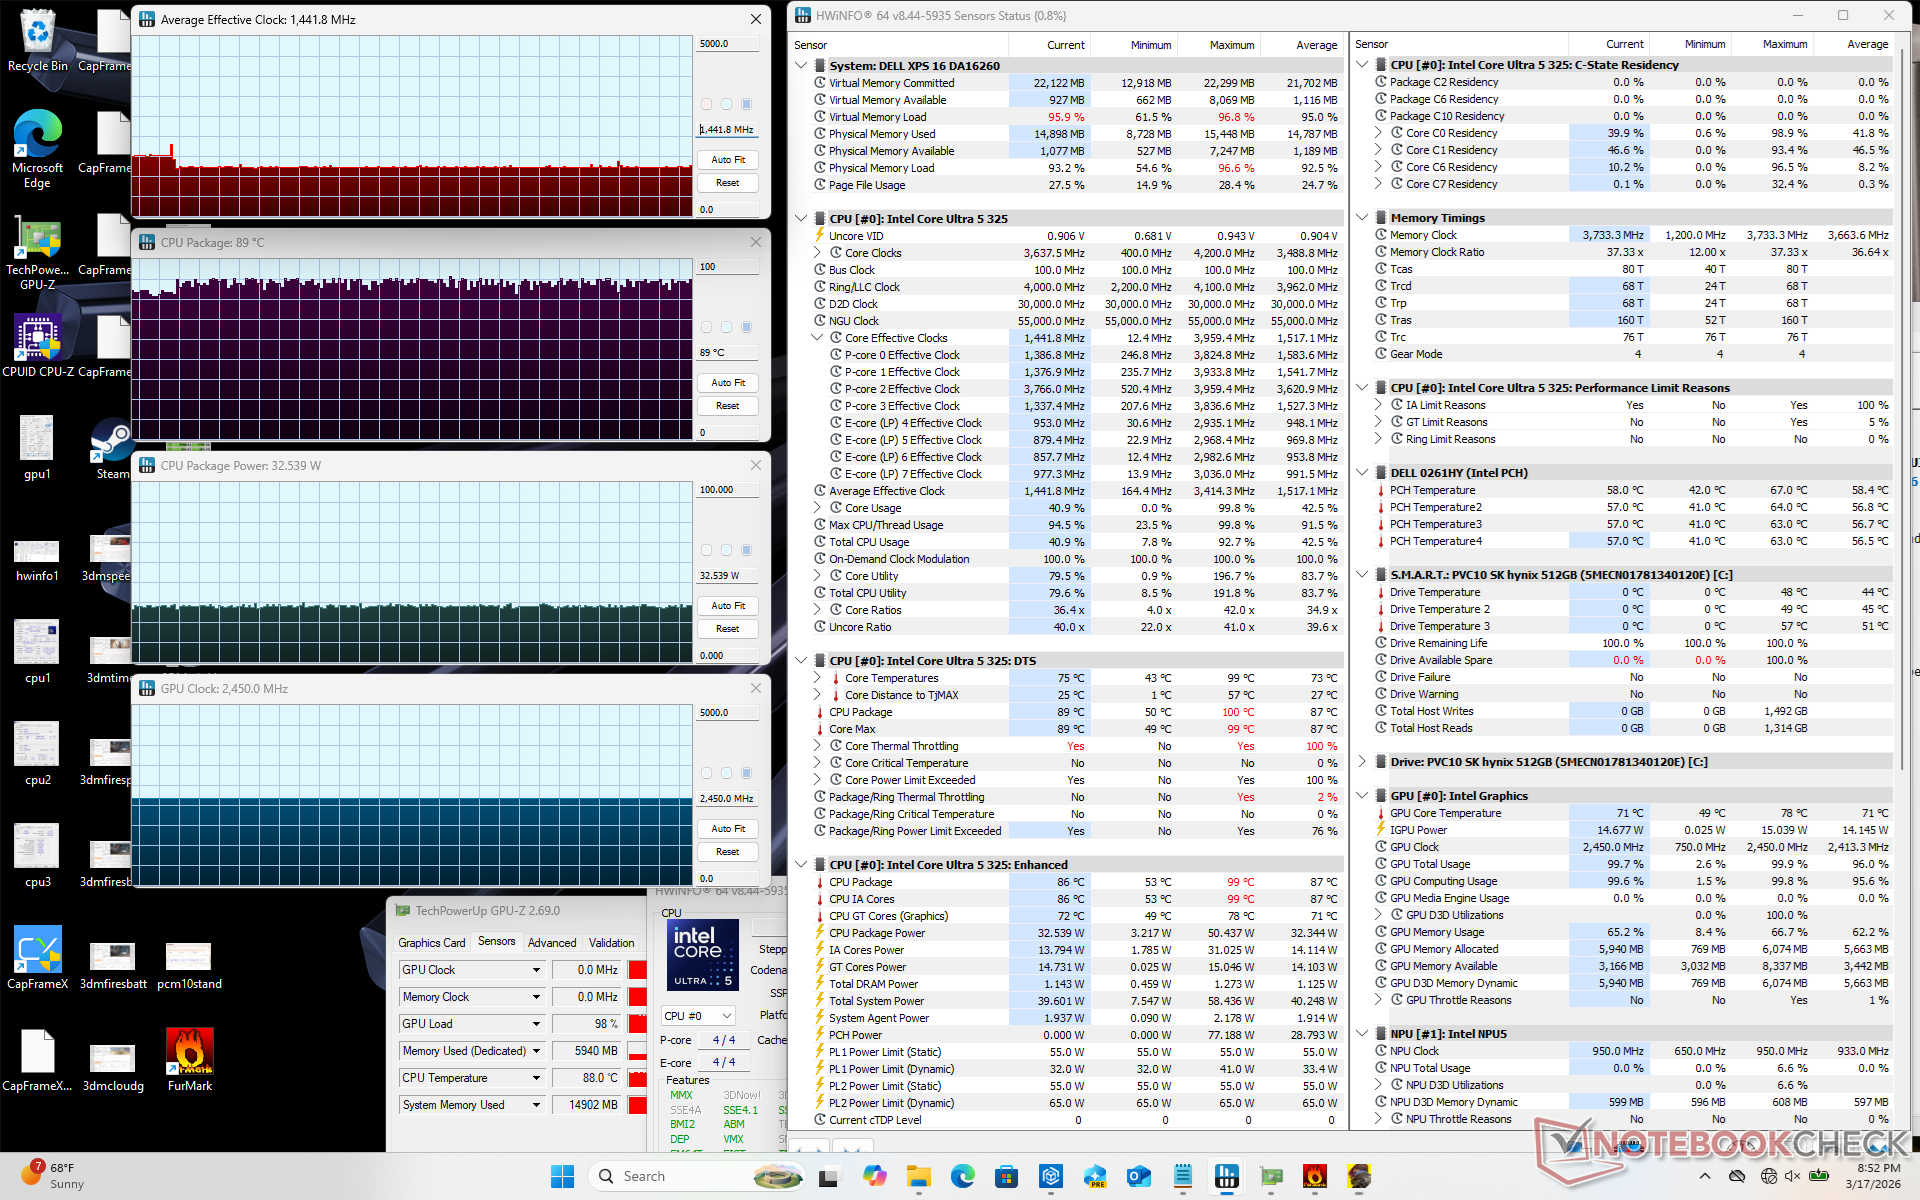
De basis Core Ultra 5 325 is enigszins traag voor een CPU uit de H-serie, aangezien hij slechts 10 procent sneller is dan de ULV Core Ultra 7 258V als het aankomt op multi-thread prestaties. Sterker nog, upgraden van de Core Ultra 5 325 naar de Core Ultra 7 355 configuratie zal de prestaties naar verwachting slechts met ongeveer 5 procent verbeteren, omdat ze beide dezelfde core counts en cachegroottes hebben. Gebruikers zouden moeten upgraden naar de duurdere Core Ultra X7 358H voor een veel significantere toename van 70 procent in de ruwe processorprestaties.
Cinebench R15 meervoudige lus
Cinebench R23: Multi Core | Single Core
Cinebench R20: CPU (Multi Core) | CPU (Single Core)
Cinebench R15: CPU Multi 64Bit | CPU Single 64Bit
Blender: v2.79 BMW27 CPU
7-Zip 18.03: 7z b 4 | 7z b 4 -mmt1
Geekbench 6.6: Multi-Core | Single-Core
Geekbench 5.5: Multi-Core | Single-Core
HWBOT x265 Benchmark v2.2: 4k Preset
LibreOffice : 20 Documents To PDF
R Benchmark 2.5: Overall mean
* ... kleiner is beter
AIDA64: FP32 Ray-Trace | FPU Julia | CPU SHA3 | CPU Queen | FPU SinJulia | FPU Mandel | CPU AES | CPU ZLib | FP64 Ray-Trace | CPU PhotoWorxx | CPU CheckMate
| Performance rating | |
| Asus ZenBook S16 UM5606GA -1! | |
| Lenovo Yoga Pro 9 16IAH10 RTX 5050 -1! | |
| Samsung Galaxy Book6 Ultra -1! | |
| Dell XPS 16 9640 -1! | |
| MSI Prestige 16 AI Evo B2HMG -1! | |
| Dell XPS 16 Core Ultra 5 325 -1! | |
| Gemiddeld Intel Core Ultra 5 325 -1! | |
| AIDA64 / FP32 Ray-Trace | |
| Asus ZenBook S16 UM5606GA (v6.92.6600) | |
| Lenovo Yoga Pro 9 16IAH10 RTX 5050 (v6.92.6600) | |
| Samsung Galaxy Book6 Ultra (v8.20.8100) | |
| MSI Prestige 16 AI Evo B2HMG (v6.92.6600) | |
| Dell XPS 16 9640 (v6.92.6600) | |
| Dell XPS 16 Core Ultra 5 325 (v8.20.8100) | |
| Gemiddeld Intel Core Ultra 5 325 (11016 - 11977, n=2) | |
| AIDA64 / FPU Julia | |
| Lenovo Yoga Pro 9 16IAH10 RTX 5050 (v6.92.6600) | |
| Samsung Galaxy Book6 Ultra (v8.20.8100) | |
| Asus ZenBook S16 UM5606GA (v6.92.6600) | |
| MSI Prestige 16 AI Evo B2HMG (v6.92.6600) | |
| Dell XPS 16 9640 (v6.92.6600) | |
| Dell XPS 16 Core Ultra 5 325 (v8.20.8100) | |
| Gemiddeld Intel Core Ultra 5 325 (57164 - 62102, n=2) | |
| AIDA64 / CPU SHA3 | |
| Samsung Galaxy Book6 Ultra (v8.20.8100) | |
| Lenovo Yoga Pro 9 16IAH10 RTX 5050 (v6.92.6600) | |
| Asus ZenBook S16 UM5606GA (v6.92.6600) | |
| MSI Prestige 16 AI Evo B2HMG (v6.92.6600) | |
| Dell XPS 16 9640 (v6.92.6600) | |
| Dell XPS 16 Core Ultra 5 325 (v8.20.8100) | |
| Gemiddeld Intel Core Ultra 5 325 (2508 - 2718, n=2) | |
| AIDA64 / CPU Queen | |
| Asus ZenBook S16 UM5606GA (v6.92.6600) | |
| Dell XPS 16 9640 (v6.92.6600) | |
| MSI Prestige 16 AI Evo B2HMG (v6.92.6600) | |
| Lenovo Yoga Pro 9 16IAH10 RTX 5050 (v6.92.6600) | |
| AIDA64 / FPU SinJulia | |
| Asus ZenBook S16 UM5606GA (v6.92.6600) | |
| Dell XPS 16 9640 (v6.92.6600) | |
| Lenovo Yoga Pro 9 16IAH10 RTX 5050 (v6.92.6600) | |
| MSI Prestige 16 AI Evo B2HMG (v6.92.6600) | |
| Samsung Galaxy Book6 Ultra (v8.20.8100) | |
| Dell XPS 16 Core Ultra 5 325 (v8.20.8100) | |
| Gemiddeld Intel Core Ultra 5 325 (4409 - 4414, n=2) | |
| AIDA64 / FPU Mandel | |
| Lenovo Yoga Pro 9 16IAH10 RTX 5050 (v6.92.6600) | |
| Samsung Galaxy Book6 Ultra (v8.20.8100) | |
| Asus ZenBook S16 UM5606GA (v6.92.6600) | |
| MSI Prestige 16 AI Evo B2HMG (v6.92.6600) | |
| Dell XPS 16 9640 (v6.92.6600) | |
| Dell XPS 16 Core Ultra 5 325 (v8.20.8100) | |
| Gemiddeld Intel Core Ultra 5 325 (30237 - 33224, n=2) | |
| AIDA64 / CPU AES | |
| Asus ZenBook S16 UM5606GA (v6.92.6600) | |
| Dell XPS 16 9640 (v6.92.6600) | |
| Lenovo Yoga Pro 9 16IAH10 RTX 5050 (v6.92.6600) | |
| MSI Prestige 16 AI Evo B2HMG (v6.92.6600) | |
| Samsung Galaxy Book6 Ultra (v8.20.8100) | |
| Dell XPS 16 Core Ultra 5 325 (v8.20.8100) | |
| Gemiddeld Intel Core Ultra 5 325 (37348 - 37641, n=2) | |
| AIDA64 / CPU ZLib | |
| Lenovo Yoga Pro 9 16IAH10 RTX 5050 (v6.92.6600) | |
| Dell XPS 16 9640 (v6.92.6600) | |
| Samsung Galaxy Book6 Ultra (v8.20.8100) | |
| Asus ZenBook S16 UM5606GA (v6.92.6600) | |
| MSI Prestige 16 AI Evo B2HMG (v6.92.6600) | |
| Dell XPS 16 Core Ultra 5 325 (v8.20.8100) | |
| Gemiddeld Intel Core Ultra 5 325 (596 - 627, n=2) | |
| AIDA64 / FP64 Ray-Trace | |
| Asus ZenBook S16 UM5606GA (v6.92.6600) | |
| Lenovo Yoga Pro 9 16IAH10 RTX 5050 (v6.92.6600) | |
| Samsung Galaxy Book6 Ultra (v8.20.8100) | |
| MSI Prestige 16 AI Evo B2HMG (v6.92.6600) | |
| Dell XPS 16 9640 (v6.92.6600) | |
| Dell XPS 16 Core Ultra 5 325 (v8.20.8100) | |
| Gemiddeld Intel Core Ultra 5 325 (5761 - 6324, n=2) | |
| AIDA64 / CPU PhotoWorxx | |
| Samsung Galaxy Book6 Ultra (v8.20.8100) | |
| Lenovo Yoga Pro 9 16IAH10 RTX 5050 (v6.92.6600) | |
| MSI Prestige 16 AI Evo B2HMG (v6.92.6600) | |
| Dell XPS 16 Core Ultra 5 325 (v8.20.8100) | |
| Gemiddeld Intel Core Ultra 5 325 (53916 - 58393, n=2) | |
| Asus ZenBook S16 UM5606GA (v6.92.6600) | |
| Dell XPS 16 9640 (v6.92.6600) | |
| AIDA64 / CPU CheckMate | |
| Samsung Galaxy Book6 Ultra (v8.20.8100) | |
| Dell XPS 16 Core Ultra 5 325 (v8.20.8100) | |
| Gemiddeld Intel Core Ultra 5 325 (2643 - 2730, n=2) | |
Systeemprestaties
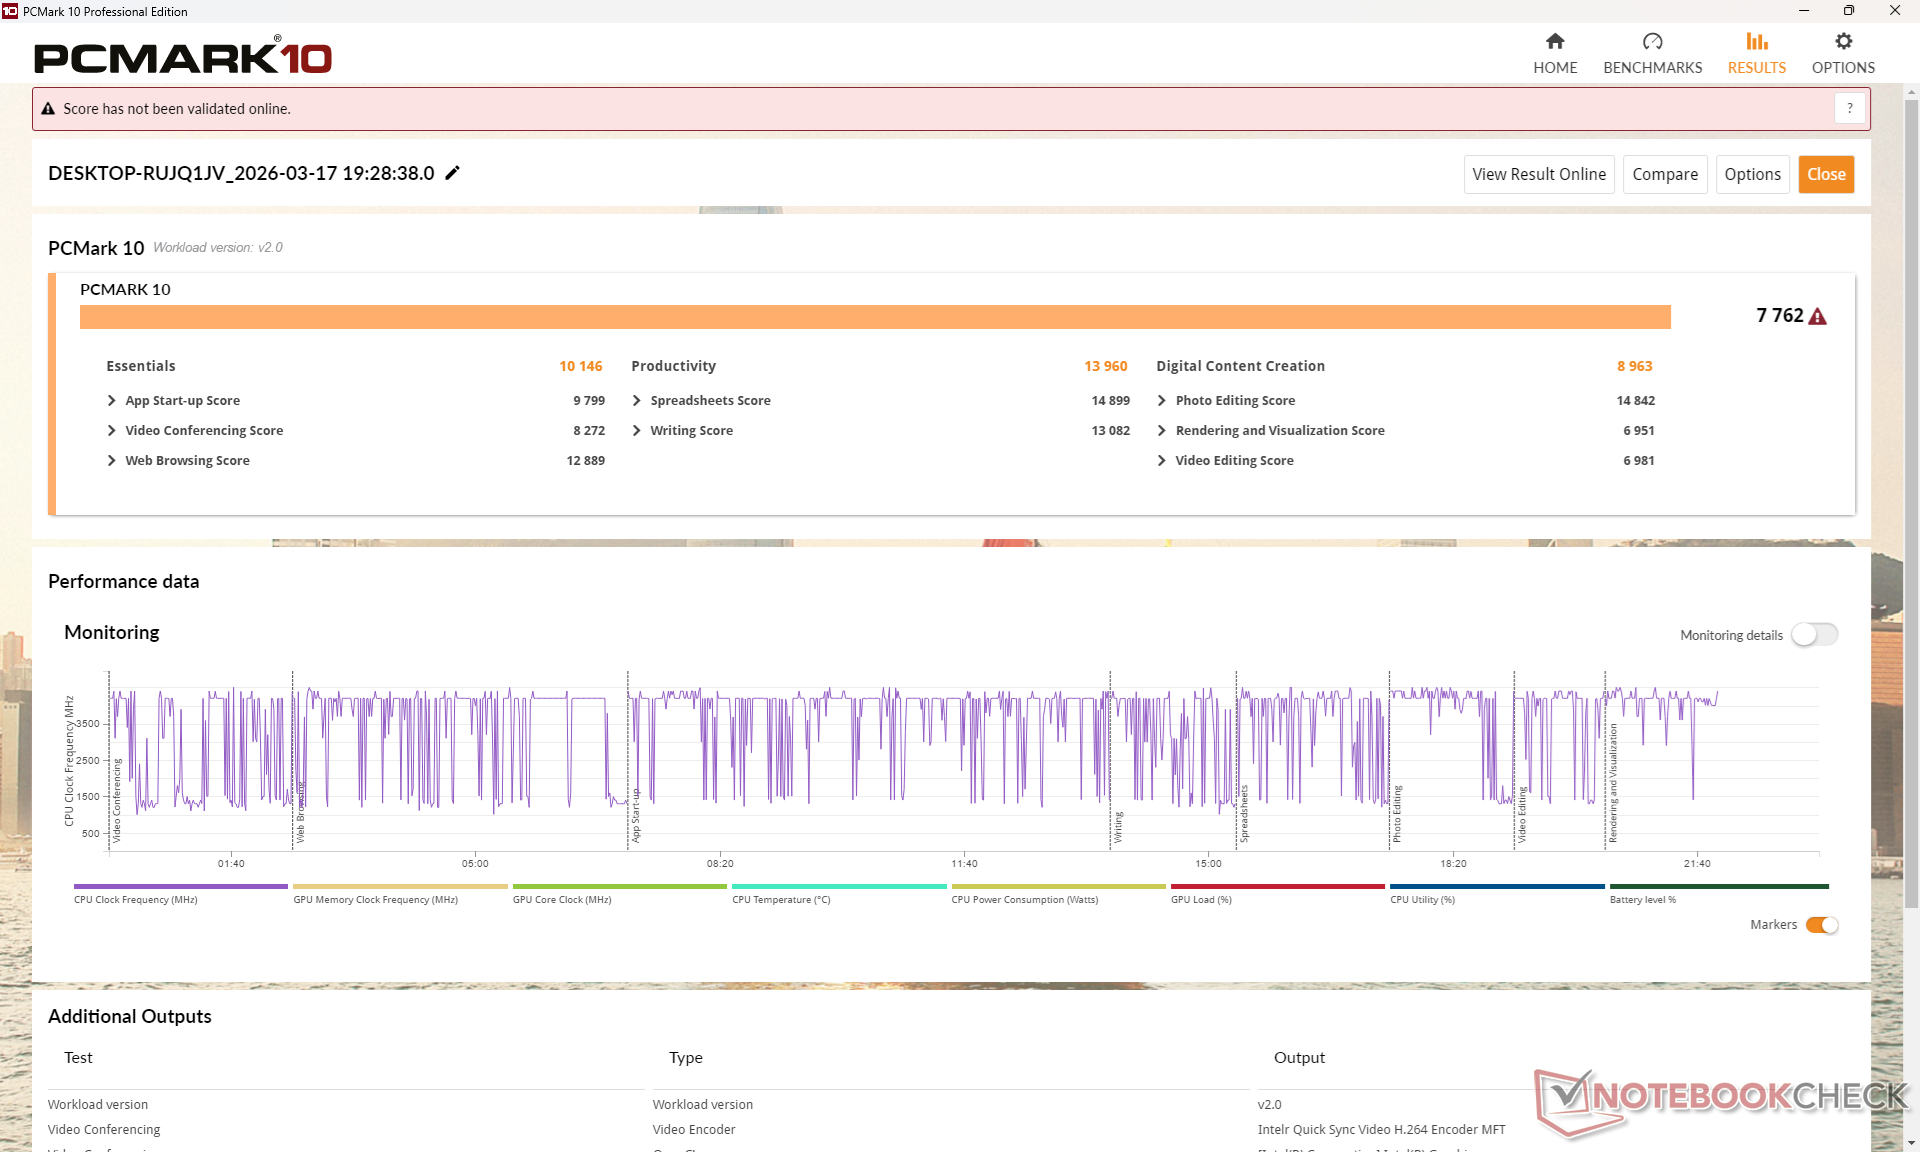
PCMark 10: Score | Essentials | Productivity | Digital Content Creation
CrossMark: Overall | Productivity | Creativity | Responsiveness
WebXPRT 3: Overall
WebXPRT 4: Overall
Mozilla Kraken 1.1: Total
Geekbench AI: Single Precision GPU 1.7 | Half Precision GPU 1.7 | Quantized GPU 1.7
| Performance rating | |
| Lenovo Yoga Pro 9 16IAH10 RTX 5050 | |
| Samsung Galaxy Book6 Ultra | |
| MSI Prestige 16 AI Evo B2HMG -3! | |
| Dell XPS 16 9640 -4! | |
| Asus ZenBook S16 UM5606GA -3! | |
| Gemiddeld Intel Core Ultra 5 325, Intel Graphics 4 Xe3 Panther Lake iGPU | |
| Dell XPS 16 Core Ultra 5 325 | |
| PCMark 10 / Score | |
| Lenovo Yoga Pro 9 16IAH10 RTX 5050 | |
| Samsung Galaxy Book6 Ultra | |
| Asus ZenBook S16 UM5606GA | |
| MSI Prestige 16 AI Evo B2HMG | |
| Dell XPS 16 Core Ultra 5 325 | |
| Gemiddeld Intel Core Ultra 5 325, Intel Graphics 4 Xe3 Panther Lake iGPU (7532 - 7762, n=2) | |
| Dell XPS 16 9640 | |
| PCMark 10 / Essentials | |
| MSI Prestige 16 AI Evo B2HMG | |
| Lenovo Yoga Pro 9 16IAH10 RTX 5050 | |
| Asus ZenBook S16 UM5606GA | |
| Dell XPS 16 9640 | |
| Gemiddeld Intel Core Ultra 5 325, Intel Graphics 4 Xe3 Panther Lake iGPU (10146 - 10402, n=2) | |
| Dell XPS 16 Core Ultra 5 325 | |
| Samsung Galaxy Book6 Ultra | |
| PCMark 10 / Productivity | |
| Samsung Galaxy Book6 Ultra | |
| Lenovo Yoga Pro 9 16IAH10 RTX 5050 | |
| Asus ZenBook S16 UM5606GA | |
| Dell XPS 16 Core Ultra 5 325 | |
| Gemiddeld Intel Core Ultra 5 325, Intel Graphics 4 Xe3 Panther Lake iGPU (12413 - 13960, n=2) | |
| MSI Prestige 16 AI Evo B2HMG | |
| Dell XPS 16 9640 | |
| PCMark 10 / Digital Content Creation | |
| Lenovo Yoga Pro 9 16IAH10 RTX 5050 | |
| Samsung Galaxy Book6 Ultra | |
| MSI Prestige 16 AI Evo B2HMG | |
| Dell XPS 16 9640 | |
| Asus ZenBook S16 UM5606GA | |
| Gemiddeld Intel Core Ultra 5 325, Intel Graphics 4 Xe3 Panther Lake iGPU (8963 - 8979, n=2) | |
| Dell XPS 16 Core Ultra 5 325 | |
| CrossMark / Overall | |
| MSI Prestige 16 AI Evo B2HMG | |
| Lenovo Yoga Pro 9 16IAH10 RTX 5050 | |
| Samsung Galaxy Book6 Ultra | |
| Dell XPS 16 9640 | |
| Gemiddeld Intel Core Ultra 5 325, Intel Graphics 4 Xe3 Panther Lake iGPU (1666 - 1772, n=2) | |
| Dell XPS 16 Core Ultra 5 325 | |
| Asus ZenBook S16 UM5606GA | |
| CrossMark / Productivity | |
| MSI Prestige 16 AI Evo B2HMG | |
| Lenovo Yoga Pro 9 16IAH10 RTX 5050 | |
| Dell XPS 16 9640 | |
| Samsung Galaxy Book6 Ultra | |
| Gemiddeld Intel Core Ultra 5 325, Intel Graphics 4 Xe3 Panther Lake iGPU (1581 - 1715, n=2) | |
| Asus ZenBook S16 UM5606GA | |
| Dell XPS 16 Core Ultra 5 325 | |
| CrossMark / Creativity | |
| MSI Prestige 16 AI Evo B2HMG | |
| Lenovo Yoga Pro 9 16IAH10 RTX 5050 | |
| Samsung Galaxy Book6 Ultra | |
| Dell XPS 16 9640 | |
| Asus ZenBook S16 UM5606GA | |
| Gemiddeld Intel Core Ultra 5 325, Intel Graphics 4 Xe3 Panther Lake iGPU (1889 - 1917, n=2) | |
| Dell XPS 16 Core Ultra 5 325 | |
| CrossMark / Responsiveness | |
| MSI Prestige 16 AI Evo B2HMG | |
| Dell XPS 16 9640 | |
| Samsung Galaxy Book6 Ultra | |
| Lenovo Yoga Pro 9 16IAH10 RTX 5050 | |
| Gemiddeld Intel Core Ultra 5 325, Intel Graphics 4 Xe3 Panther Lake iGPU (1338 - 1544, n=2) | |
| Asus ZenBook S16 UM5606GA | |
| Dell XPS 16 Core Ultra 5 325 | |
| WebXPRT 3 / Overall | |
| MSI Prestige 16 AI Evo B2HMG | |
| Lenovo Yoga Pro 9 16IAH10 RTX 5050 | |
| Samsung Galaxy Book6 Ultra | |
| Asus ZenBook S16 UM5606GA | |
| Gemiddeld Intel Core Ultra 5 325, Intel Graphics 4 Xe3 Panther Lake iGPU (282 - 308, n=2) | |
| Dell XPS 16 9640 | |
| Dell XPS 16 Core Ultra 5 325 | |
| WebXPRT 4 / Overall | |
| MSI Prestige 16 AI Evo B2HMG | |
| Lenovo Yoga Pro 9 16IAH10 RTX 5050 | |
| Samsung Galaxy Book6 Ultra | |
| Gemiddeld Intel Core Ultra 5 325, Intel Graphics 4 Xe3 Panther Lake iGPU (267 - 276, n=2) | |
| Dell XPS 16 Core Ultra 5 325 | |
| Dell XPS 16 9640 | |
| Asus ZenBook S16 UM5606GA | |
| Mozilla Kraken 1.1 / Total | |
| Dell XPS 16 Core Ultra 5 325 | |
| Gemiddeld Intel Core Ultra 5 325, Intel Graphics 4 Xe3 Panther Lake iGPU (492 - 497, n=2) | |
| Asus ZenBook S16 UM5606GA | |
| Samsung Galaxy Book6 Ultra | |
| Lenovo Yoga Pro 9 16IAH10 RTX 5050 | |
| MSI Prestige 16 AI Evo B2HMG | |
| Geekbench AI / Single Precision GPU 1.7 | |
| Samsung Galaxy Book6 Ultra | |
| Lenovo Yoga Pro 9 16IAH10 RTX 5050 | |
| Dell XPS 16 Core Ultra 5 325 | |
| Gemiddeld Intel Core Ultra 5 325, Intel Graphics 4 Xe3 Panther Lake iGPU (n=1) | |
| Geekbench AI / Half Precision GPU 1.7 | |
| Lenovo Yoga Pro 9 16IAH10 RTX 5050 | |
| Samsung Galaxy Book6 Ultra | |
| Dell XPS 16 Core Ultra 5 325 | |
| Gemiddeld Intel Core Ultra 5 325, Intel Graphics 4 Xe3 Panther Lake iGPU (n=1) | |
| Geekbench AI / Quantized GPU 1.7 | |
| Samsung Galaxy Book6 Ultra | |
| Lenovo Yoga Pro 9 16IAH10 RTX 5050 | |
| Dell XPS 16 Core Ultra 5 325 | |
| Gemiddeld Intel Core Ultra 5 325, Intel Graphics 4 Xe3 Panther Lake iGPU (n=1) | |
* ... kleiner is beter
| PCMark 10 Score | 7762 punten | |
Help | ||
| AIDA64 / Memory Copy | |
| Samsung Galaxy Book6 Ultra | |
| Dell XPS 16 Core Ultra 5 325 | |
| Lenovo Yoga Pro 9 16IAH10 RTX 5050 | |
| MSI Prestige 16 AI Evo B2HMG | |
| Asus ZenBook S16 UM5606GA | |
| Gemiddeld Intel Core Ultra 5 325 (89482 - 100226, n=2) | |
| Dell XPS 16 9640 | |
| AIDA64 / Memory Read | |
| Samsung Galaxy Book6 Ultra | |
| Asus ZenBook S16 UM5606GA | |
| Lenovo Yoga Pro 9 16IAH10 RTX 5050 | |
| Dell XPS 16 Core Ultra 5 325 | |
| Dell XPS 16 9640 | |
| Gemiddeld Intel Core Ultra 5 325 (74747 - 86178, n=2) | |
| MSI Prestige 16 AI Evo B2HMG | |
| AIDA64 / Memory Write | |
| Samsung Galaxy Book6 Ultra | |
| Asus ZenBook S16 UM5606GA | |
| Dell XPS 16 Core Ultra 5 325 | |
| Lenovo Yoga Pro 9 16IAH10 RTX 5050 | |
| Gemiddeld Intel Core Ultra 5 325 (92966 - 107858, n=2) | |
| Dell XPS 16 9640 | |
| MSI Prestige 16 AI Evo B2HMG | |
| AIDA64 / Memory Latency | |
| Dell XPS 16 9640 | |
| MSI Prestige 16 AI Evo B2HMG | |
| Lenovo Yoga Pro 9 16IAH10 RTX 5050 | |
| Gemiddeld Intel Core Ultra 5 325 (102 - 108.4, n=2) | |
| Asus ZenBook S16 UM5606GA | |
| Dell XPS 16 Core Ultra 5 325 | |
| Samsung Galaxy Book6 Ultra | |
* ... kleiner is beter
DPC latentie
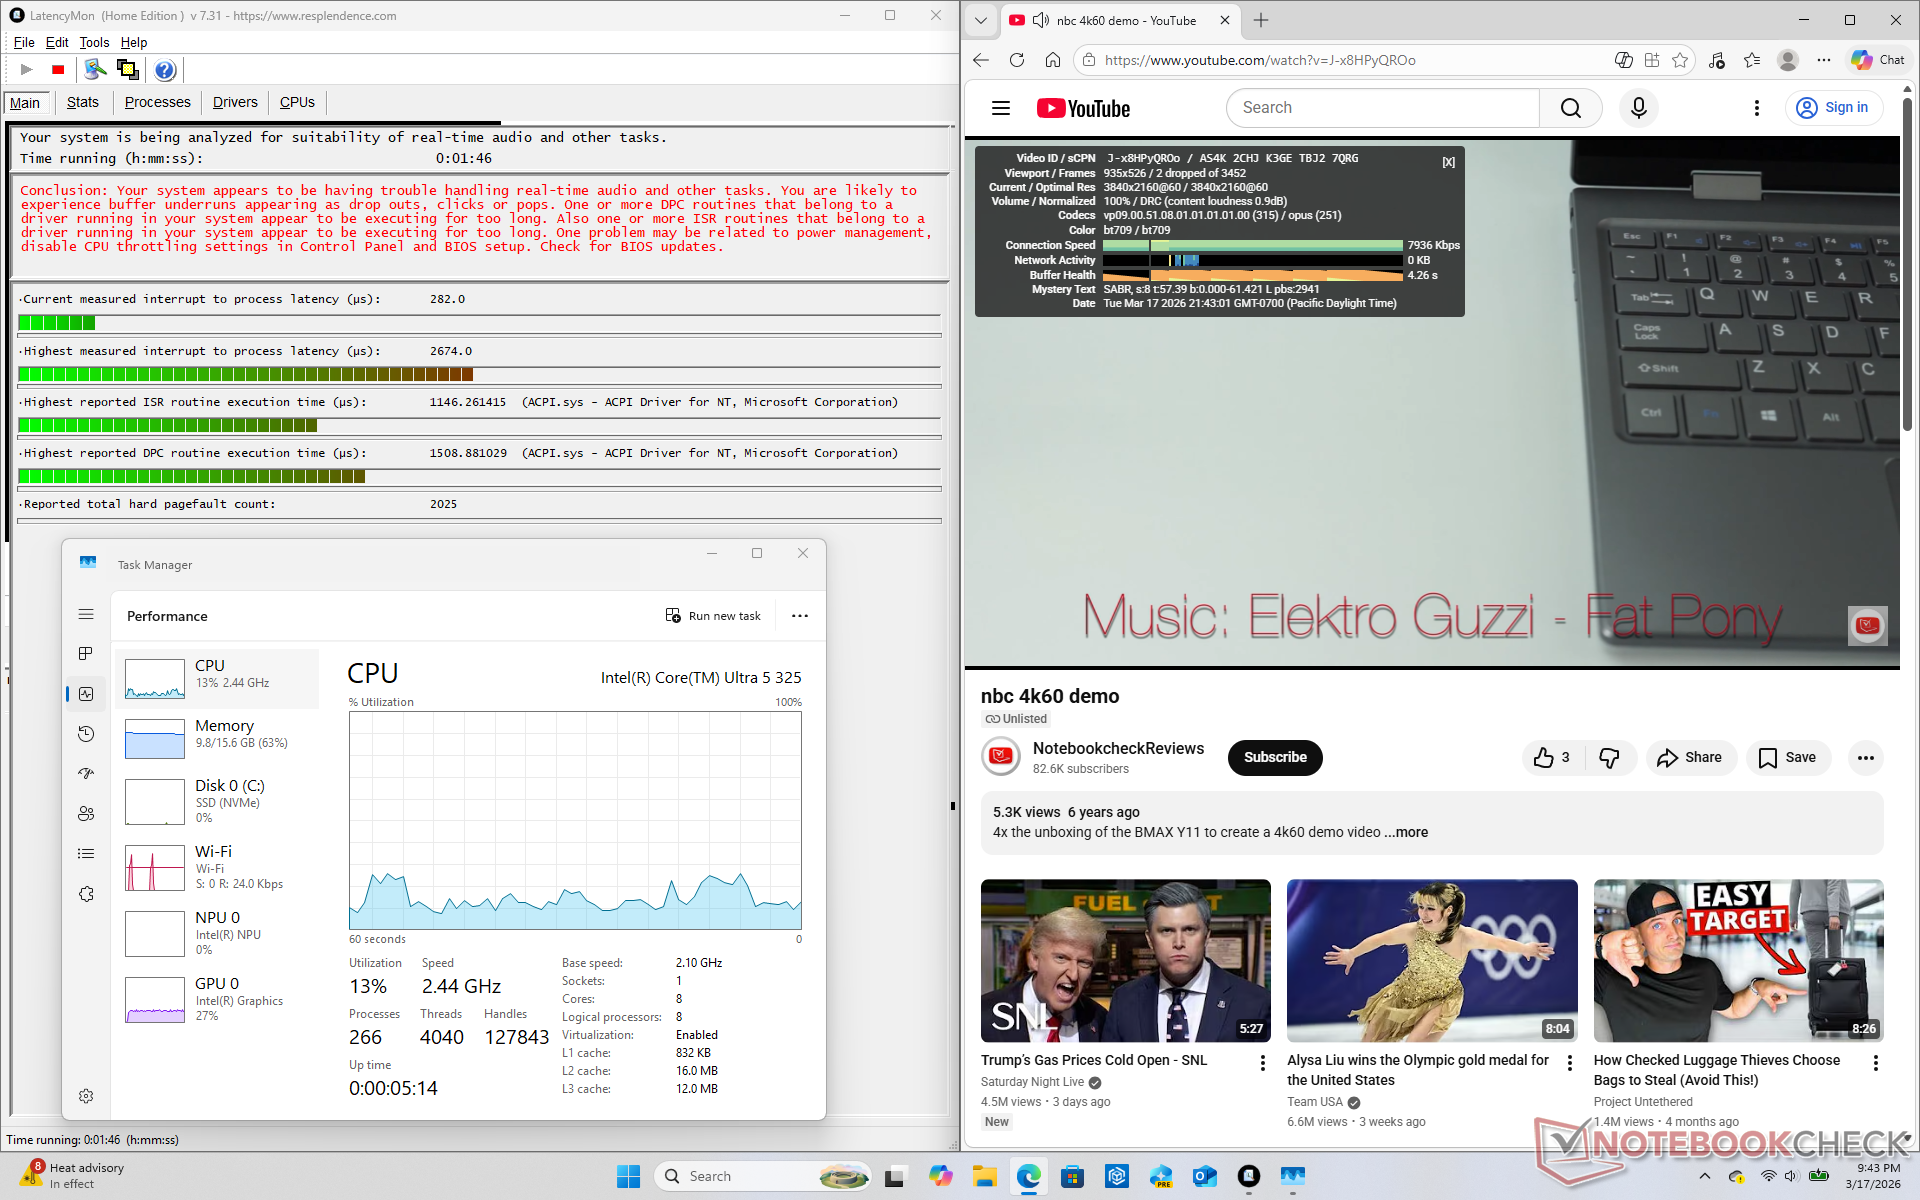
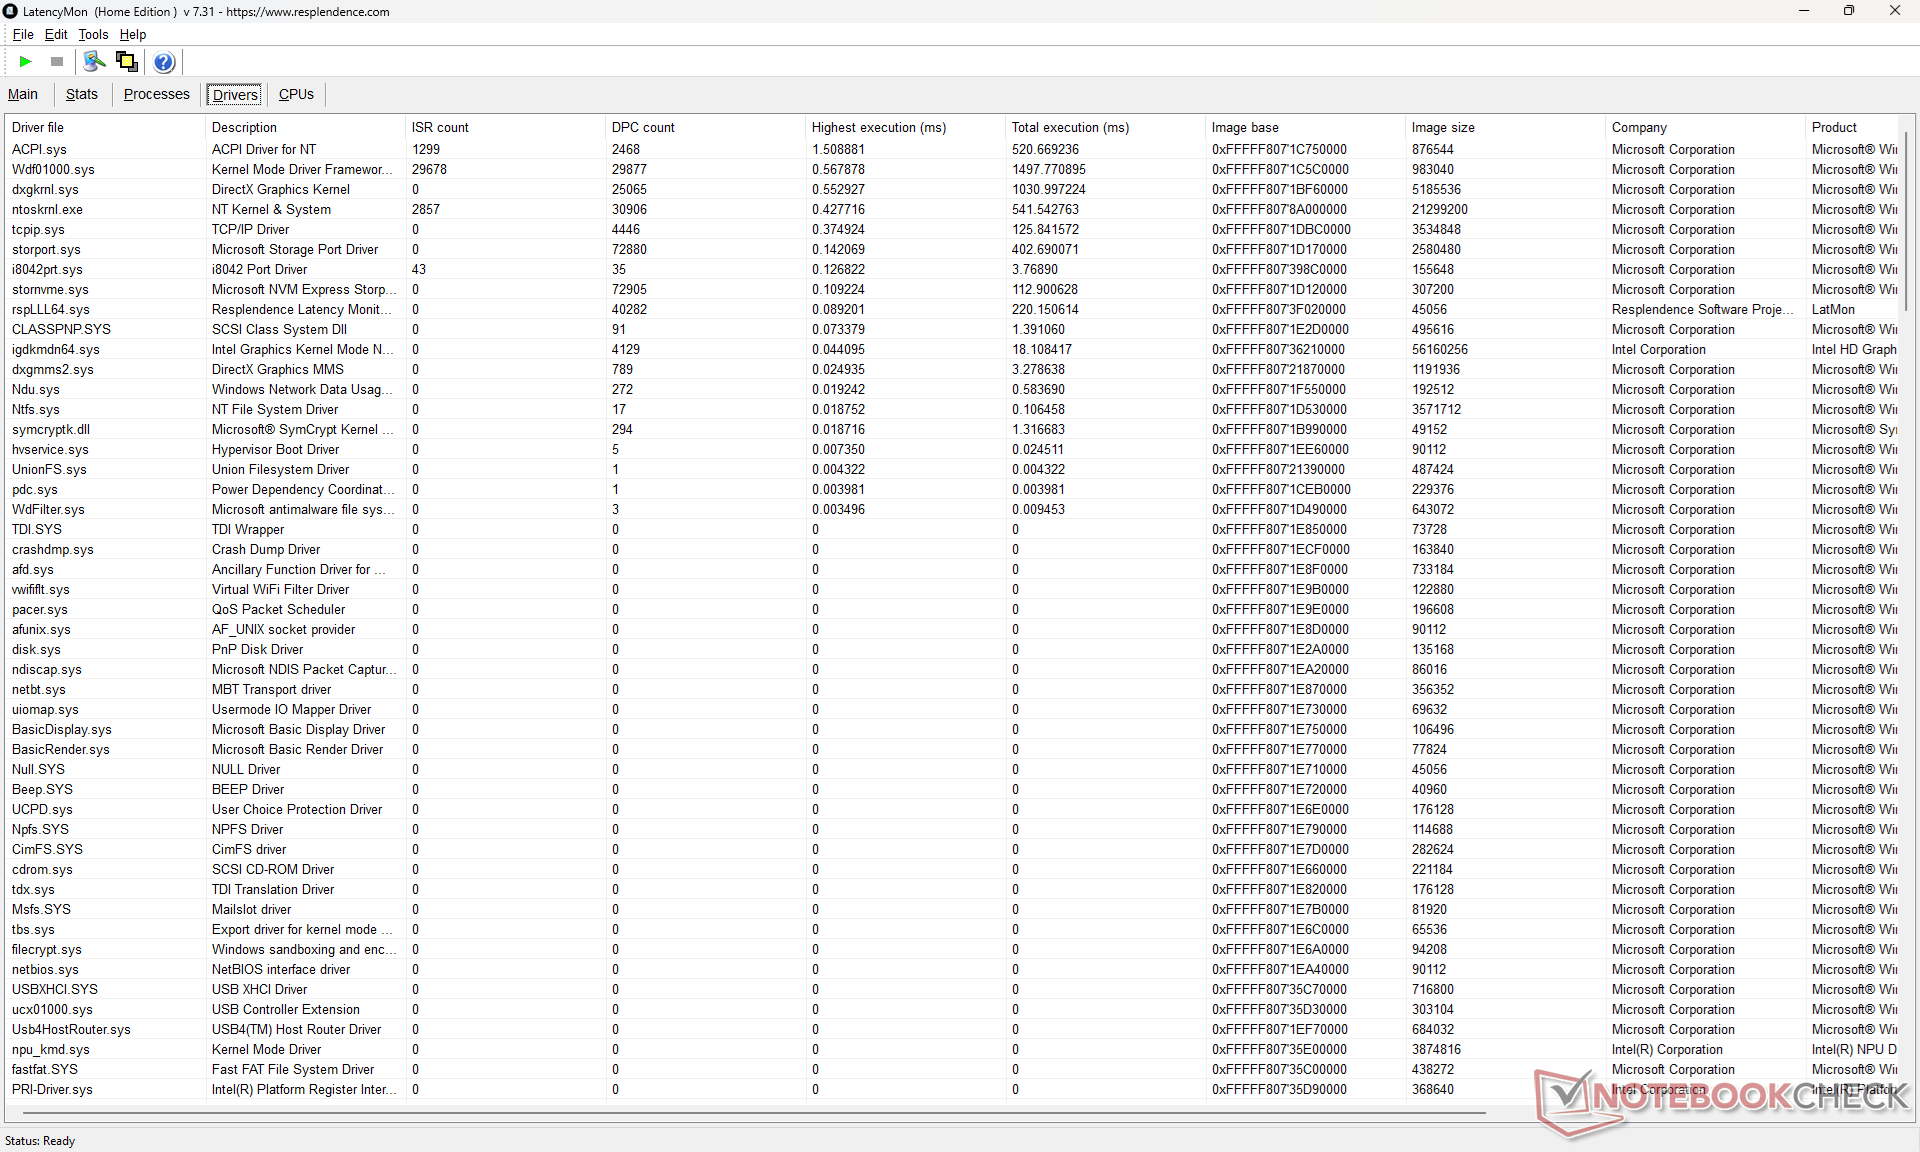
| DPC Latencies / LatencyMon - interrupt to process latency (max), Web, Youtube, Prime95 | |
| Lenovo Yoga Pro 9 16IAH10 RTX 5050 | |
| Dell XPS 16 Core Ultra 5 325 | |
| MSI Prestige 16 AI Evo B2HMG | |
| Dell XPS 16 9640 | |
| Samsung Galaxy Book6 Ultra | |
| Asus ZenBook S16 UM5606GA | |
* ... kleiner is beter
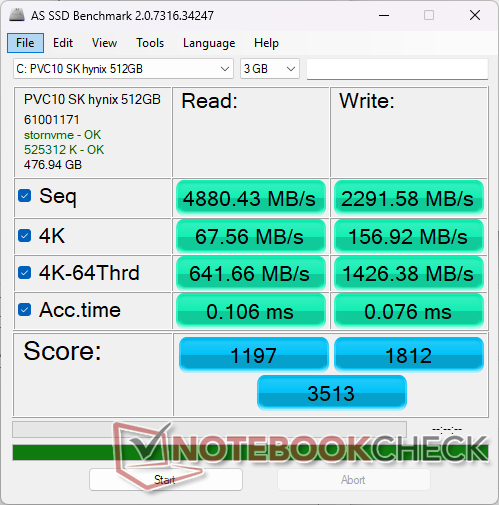
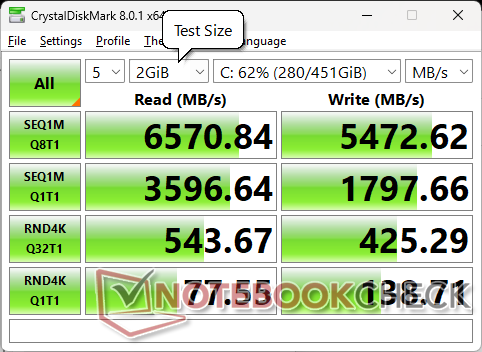
Opslagapparaten
De SK Hynix PVC10 PCIe4 x4 NVMe SSD kan overdrachtsnelheden tot 6600 MB/s aan zonder problemen met throttling, zoals blijkt uit de DiskSpd loop testresultaten hieronder. Merk op dat de XPS 16 in het hogere segment wordt geleverd met optionele PCIe5 SSD's.


| Drive Performance rating - Percent | |
| MSI Prestige 16 AI Evo B2HMG | |
| Dell XPS 16 9640 | |
| Lenovo Yoga Pro 9 16IAH10 RTX 5050 | |
| Asus ZenBook S16 UM5606GA | |
| Samsung Galaxy Book6 Ultra | |
| Dell XPS 16 Core Ultra 5 325 | |
* ... kleiner is beter
Schijf onderdrukken: DiskSpd Leeslus, wachtrijdiepte 8
GPU-prestaties
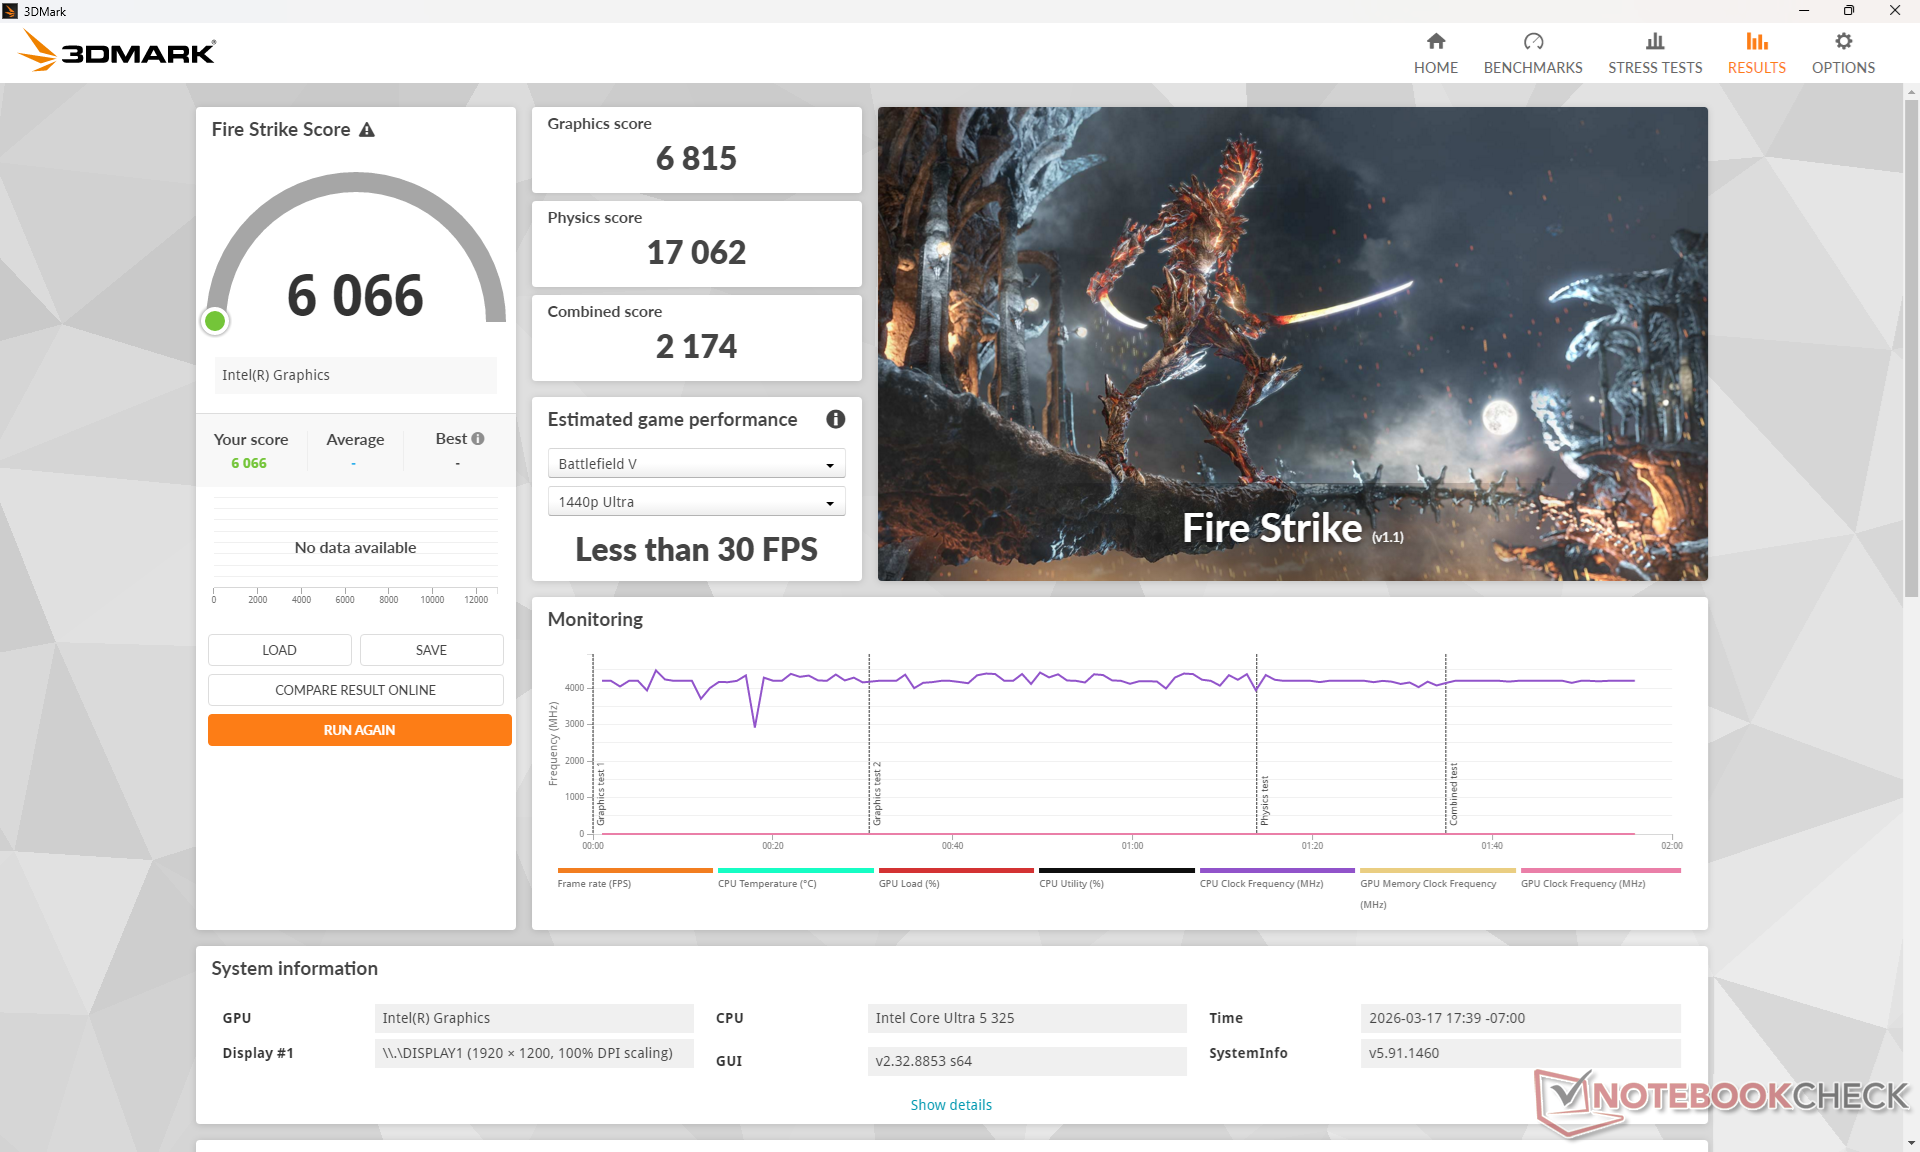
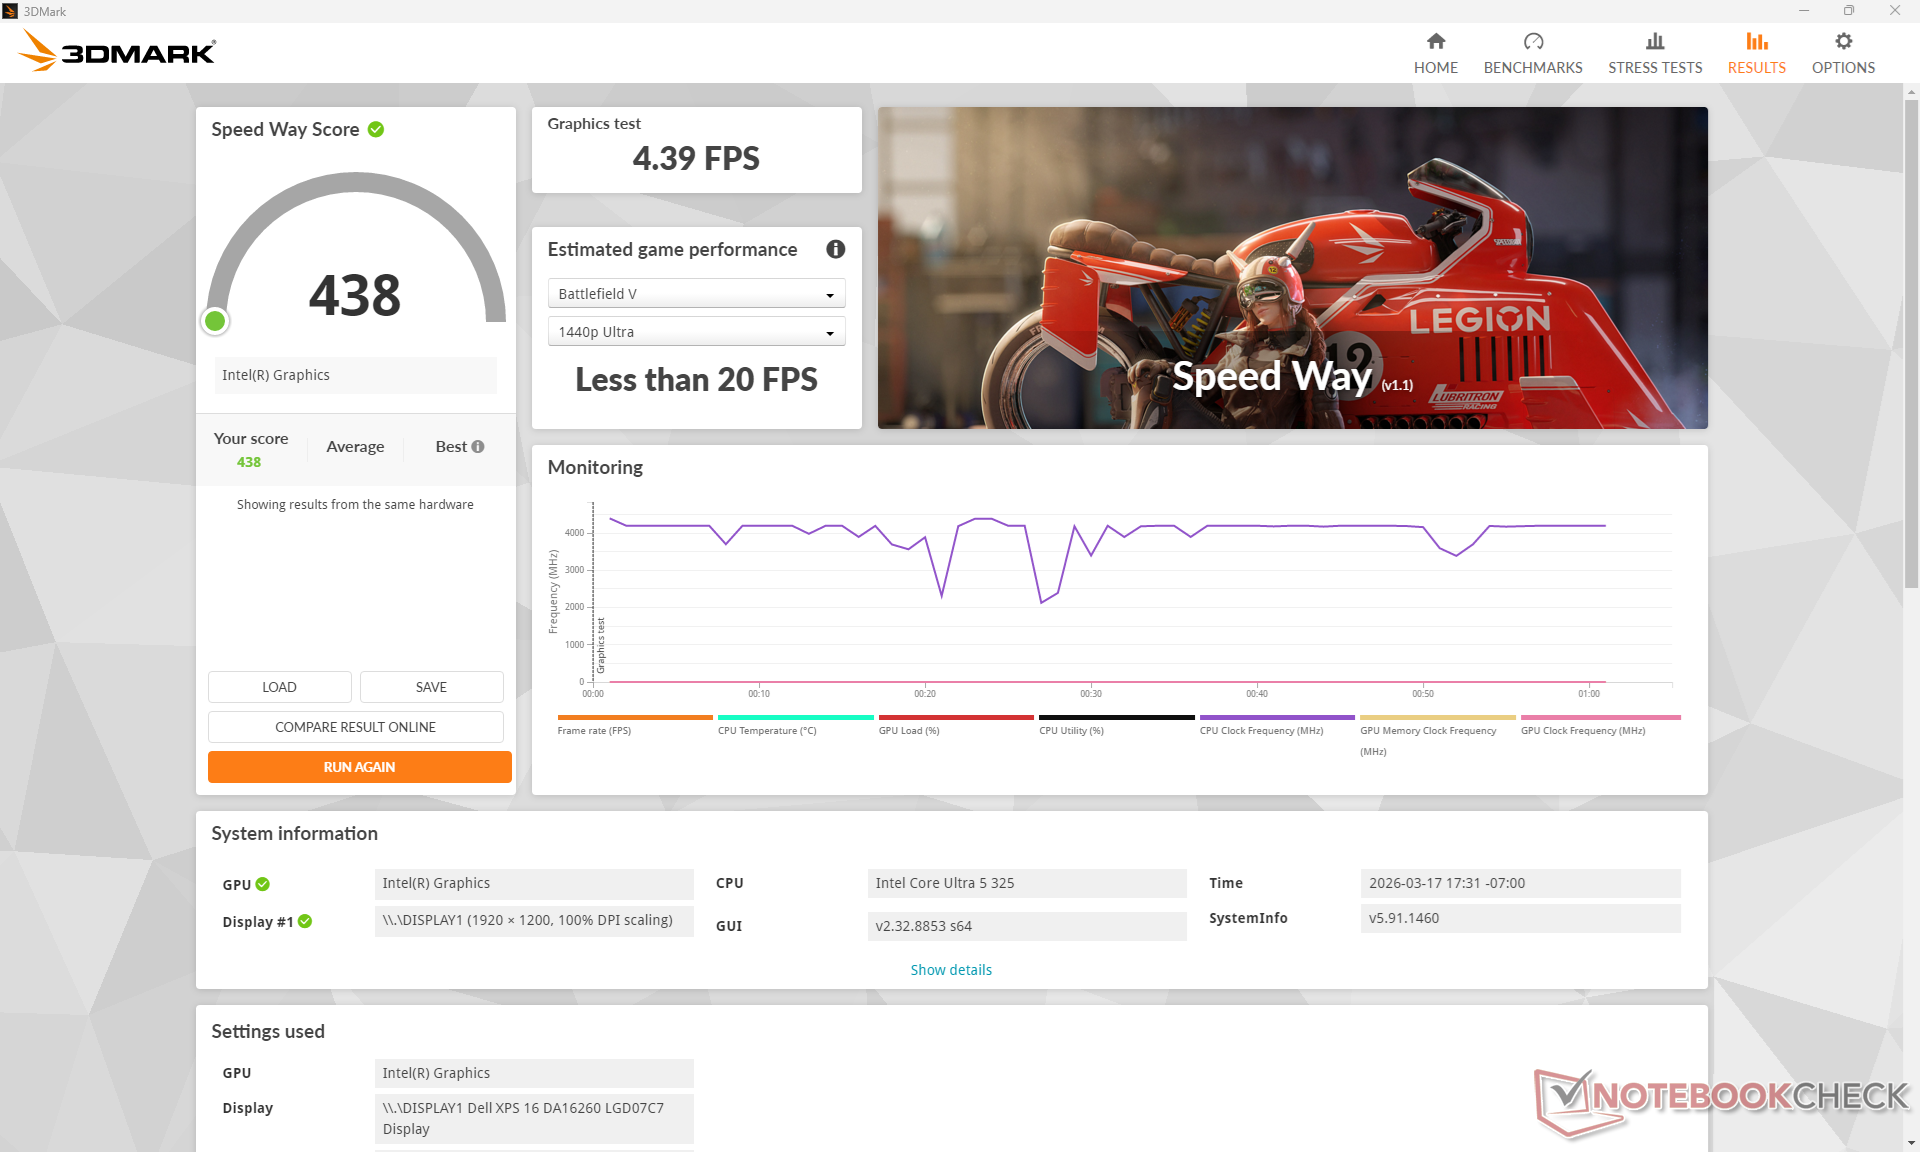
De Panther Lake Xe3 4 is een van de traagste geïntegreerde oplossingen uit de Panther Lake line-up. De prestatieniveaus komen het meest overeen met de twee generaties oude Arc 8 of de AMD Radeon 680M. Upgraden naar de Core Ultra 7 355 configuratie zal de grafische prestaties niet significant verbeteren, omdat de CPU dezelfde Xe3 4 iGPU gebruikt. In plaats daarvan moeten gebruikers upgraden naar de Core Ultra X7 358H met geïntegreerde Arc B390 voor een enorme prestatieverhoging van 2,5x, zoals blijkt uit de onderstaande tabellen.
| Vermogen | Grafische Score | Natuurkunde Score | Gecombineerde Score |
| Prestatiemodus | 6815 | 17062 | 2174 |
| Evenwichtige modus | 6633 (-3%) | 16820 (-1%) | 2039 (-6%) |
| Batterijvermogen | 6480 (-5%) | 17601 (+3%) | 2140 (-2%) |
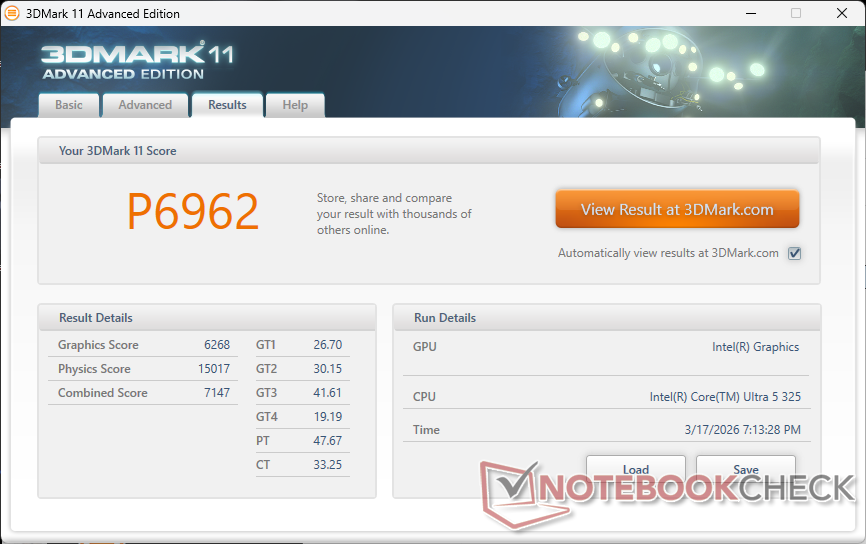
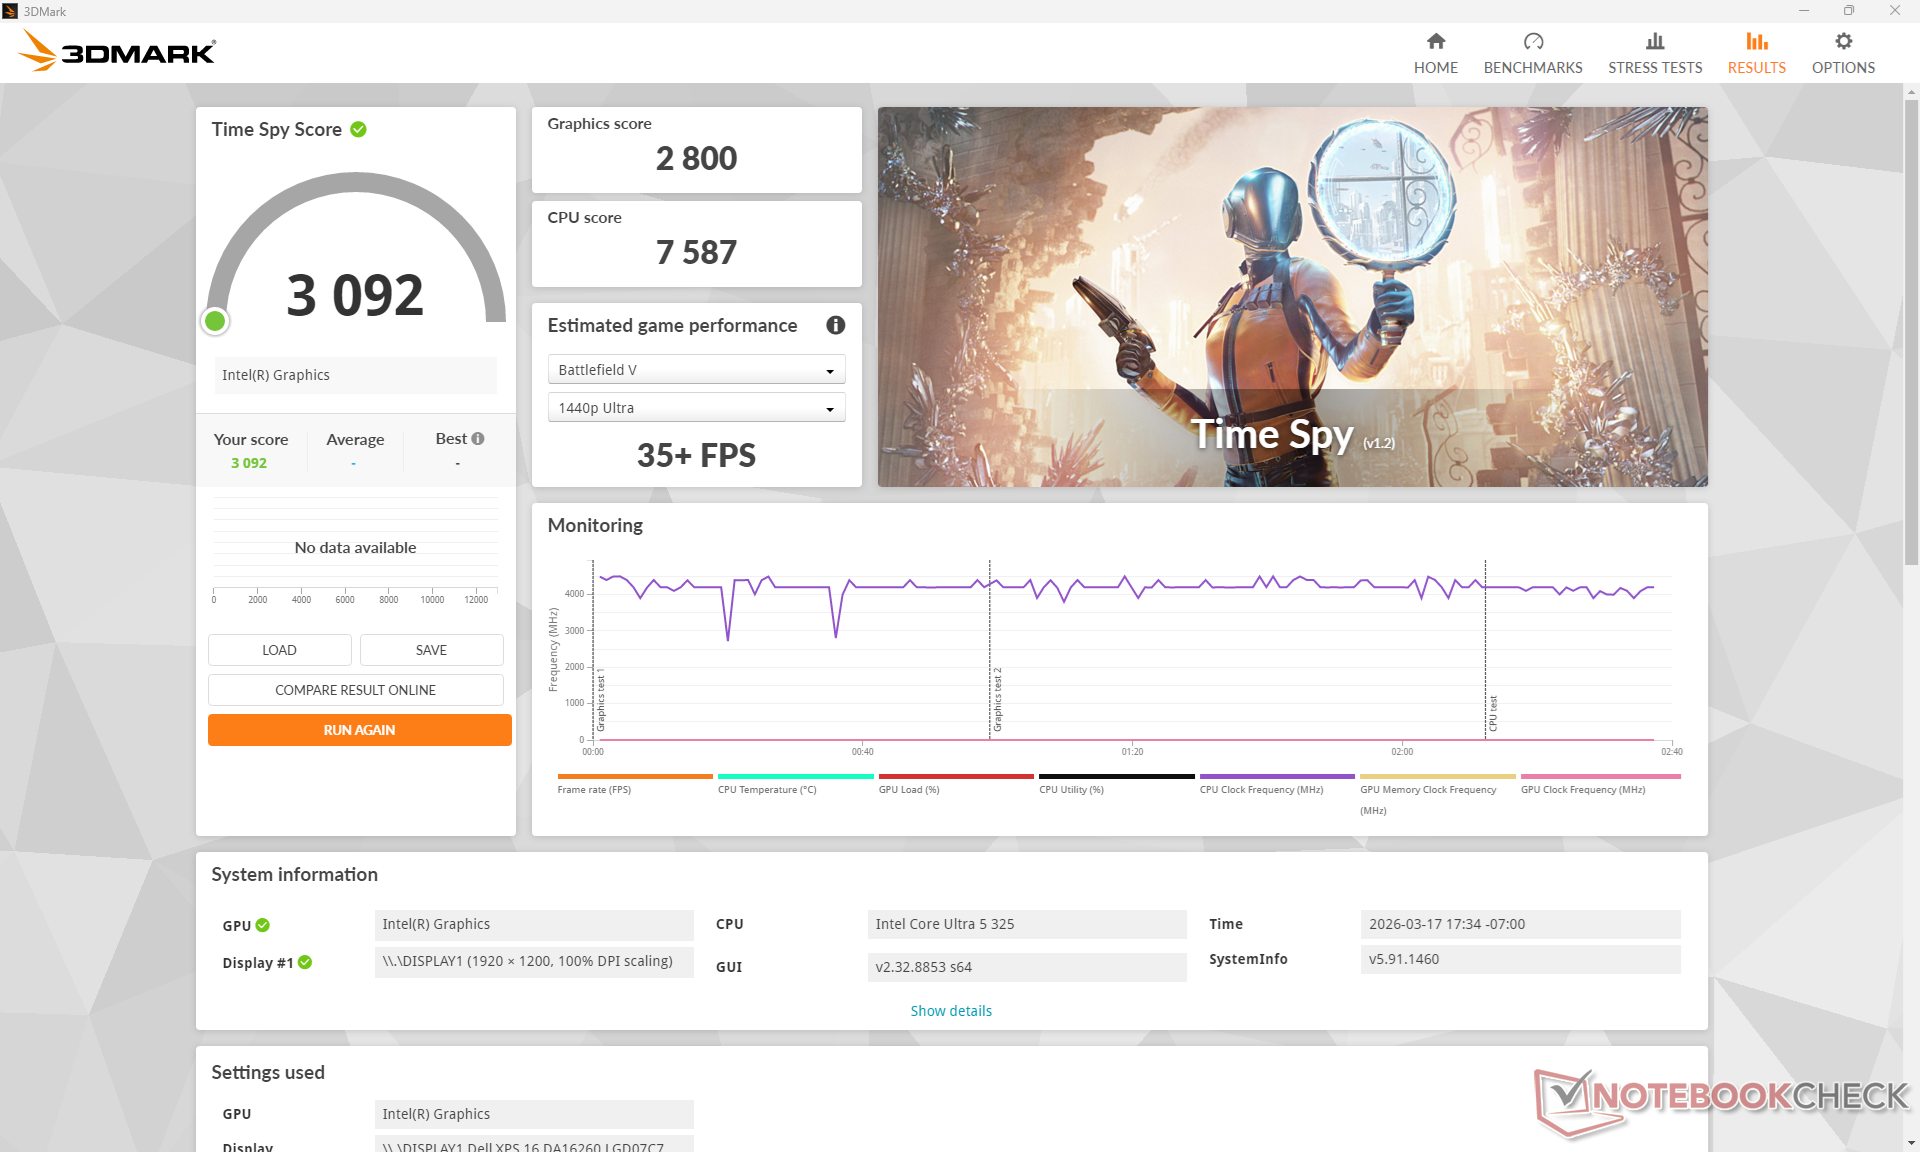
| 3DMark 11 Performance | 6962 punten | |
| 3DMark Cloud Gate Standard Score | 26419 punten | |
| 3DMark Fire Strike Score | 6066 punten | |
| 3DMark Time Spy Score | 3092 punten | |
Help | ||
* ... kleiner is beter
| Performance rating - Percent | |
| Samsung Galaxy Book6 Ultra | |
| Lenovo Yoga Pro 9 16IAH10 RTX 5050 | |
| Dell XPS 16 9640 | |
| Asus ZenBook S16 UM5606GA | |
| MSI Prestige 16 AI Evo B2HMG | |
| Dell XPS 16 Core Ultra 5 325 | |
| Cyberpunk 2077 - 1920x1080 Ultra Preset (FSR off) | |
| Samsung Galaxy Book6 Ultra | |
| Lenovo Yoga Pro 9 16IAH10 RTX 5050 | |
| Dell XPS 16 9640 | |
| MSI Prestige 16 AI Evo B2HMG | |
| Asus ZenBook S16 UM5606GA | |
| Dell XPS 16 Core Ultra 5 325 | |
| Baldur's Gate 3 - 1920x1080 Ultra Preset AA:T | |
| Samsung Galaxy Book6 Ultra | |
| Lenovo Yoga Pro 9 16IAH10 RTX 5050 | |
| Dell XPS 16 9640 | |
| Asus ZenBook S16 UM5606GA | |
| MSI Prestige 16 AI Evo B2HMG | |
| Dell XPS 16 Core Ultra 5 325 | |
| GTA V - 1920x1080 Highest AA:4xMSAA + FX AF:16x | |
| Samsung Galaxy Book6 Ultra | |
| Lenovo Yoga Pro 9 16IAH10 RTX 5050 | |
| Dell XPS 16 9640 | |
| Asus ZenBook S16 UM5606GA | |
| Dell XPS 16 Core Ultra 5 325 | |
| MSI Prestige 16 AI Evo B2HMG | |
| Final Fantasy XV Benchmark - 1920x1080 High Quality | |
| Samsung Galaxy Book6 Ultra | |
| Lenovo Yoga Pro 9 16IAH10 RTX 5050 | |
| Dell XPS 16 9640 | |
| MSI Prestige 16 AI Evo B2HMG | |
| Asus ZenBook S16 UM5606GA | |
| Dell XPS 16 Core Ultra 5 325 | |
| Strange Brigade - 1920x1080 ultra AA:ultra AF:16 | |
| Samsung Galaxy Book6 Ultra | |
| Lenovo Yoga Pro 9 16IAH10 RTX 5050 | |
| Dell XPS 16 9640 | |
| MSI Prestige 16 AI Evo B2HMG | |
| Asus ZenBook S16 UM5606GA | |
| Dell XPS 16 Core Ultra 5 325 | |
| Dota 2 Reborn - 1920x1080 ultra (3/3) best looking | |
| Lenovo Yoga Pro 9 16IAH10 RTX 5050 | |
| Samsung Galaxy Book6 Ultra | |
| Dell XPS 16 9640 | |
| Asus ZenBook S16 UM5606GA | |
| MSI Prestige 16 AI Evo B2HMG | |
| Dell XPS 16 Core Ultra 5 325 | |
| X-Plane 11.11 - 1920x1080 high (fps_test=3) | |
| Lenovo Yoga Pro 9 16IAH10 RTX 5050 | |
| Dell XPS 16 9640 | |
| Dell XPS 16 9640 | |
| Samsung Galaxy Book6 Ultra | |
| Asus ZenBook S16 UM5606GA | |
| MSI Prestige 16 AI Evo B2HMG | |
| Dell XPS 16 Core Ultra 5 325 | |
Cyberpunk 2077 ultra FPS Grafiek
| lage | gem. | hoge | ultra | |
|---|---|---|---|---|
| GTA V (2015) | 162.4 | 158.1 | 51.8 | 20.8 |
| Dota 2 Reborn (2015) | 102.9 | 89 | 72.6 | 68.4 |
| Final Fantasy XV Benchmark (2018) | 66.3 | 35.4 | 25.1 | |
| X-Plane 11.11 (2018) | 37.8 | 30.6 | 22.9 | |
| Strange Brigade (2018) | 107.3 | 38.2 | 35.9 | 43.3 |
| Baldur's Gate 3 (2023) | 27.4 | 22.2 | 19 | 18.7 |
| Cyberpunk 2077 (2023) | 35.2 | 27 | 23.8 | 19.9 |
| F1 24 (2024) | 55.6 | 52.7 | 40.8 | 13.2 |
Uitstoot - Stiller, maar nog steeds behoorlijk warm
Systeemgeluid
Het ventilatorgeluid is in vrijwel alle scenario's veel stiller dan dat van de uitgaande Dell 16 Premium. Het systeem is in staat om langere tijd stil of onhoorbaar te blijven in vergelijking met de meeste andere laptops. Het geluid van de ventilator wordt bijvoorbeeld pas hoorbaar tijdens het uitvoeren van 3DMark06 na meer dan tweederde van de eerste benchmarkscène, terwijl het geluid veel eerder en luider zou worden op de ZenBook S16.
Het ventilatorgeluid tijdens het gamen ligt tussen de 38 en 44 dB(A), wat nog steeds stiller is dan het model van vorig jaar of de eerder genoemde Asus onder vergelijkbare omstandigheden.


Geluidsniveau
| Onbelast |
| 22.9 / 22.9 / 23.9 dB (A) |
| Belasting |
| 34.8 / 43.3 dB (A) |
 | ||
30 dB stil 40 dB(A) hoorbaar 50 dB(A) luid |
||
min: | ||
| Dell XPS 16 Core Ultra 5 325 Ultra 5 325, Intel Graphics 4 Xe3 PTL | Dell XPS 16 9640 Ultra 7 155H, GeForce RTX 4070 Laptop GPU | Lenovo Yoga Pro 9 16IAH10 RTX 5050 Ultra 9 285H, GeForce RTX 5050 Laptop | Samsung Galaxy Book6 Ultra Ultra 7 356H, GeForce RTX 5070 Laptop | Asus ZenBook S16 UM5606GA Ryzen AI 9 465, Radeon 880M | MSI Prestige 16 AI Evo B2HMG Ultra 9 285H, Arc 140T | |
|---|---|---|---|---|---|---|
| Noise | -11% | -12% | -12% | -15% | -5% | |
| uit / omgeving * (dB) | 22.8 | 24.5 -7% | 24.6 -8% | 25.1 -10% | 24.9 -9% | 23.6 -4% |
| Idle Minimum * (dB) | 22.9 | 24.5 -7% | 24.6 -7% | 25.1 -10% | 24.9 -9% | 23.6 -3% |
| Idle Average * (dB) | 22.9 | 24.5 -7% | 24.6 -7% | 25.1 -10% | 24.9 -9% | 23.6 -3% |
| Idle Maximum * (dB) | 23.9 | 27.5 -15% | 26.8 -12% | 25.1 -5% | 24.9 -4% | 26.2 -10% |
| Load Average * (dB) | 34.8 | 39.6 -14% | 32.8 6% | 36.9 -6% | 45.7 -31% | 37.1 -7% |
| Cyberpunk 2077 ultra * (dB) | 38 | 51.8 -36% | 48.5 -28% | 49 -29% | 42.1 -11% | |
| Load Maximum * (dB) | 43.3 | 49.7 -15% | 51.8 -20% | 48.5 -12% | 50.4 -16% | 42.1 3% |
| Witcher 3 ultra * (dB) | 49.7 |
* ... kleiner is beter
Temperatuur
De oppervlaktetemperaturen zijn warmer dan verwacht, vooral omdat de nieuwe XPS 16 geen discrete graphics heeft. Hete plekken kunnen oplopen tot meer dan 43 C bij veeleisende belastingen zoals games, vergeleken met slechts 37 C op de zwaardere XPS 16 van vorig jaar Dell 16 Premium met discrete GeForce RTX 5070 graphics.


(±) De maximumtemperatuur aan de bovenzijde bedraagt 43.8 °C / 111 F, vergeleken met het gemiddelde van 36.8 °C / 98 F, variërend van 21 tot 71 °C voor de klasse Multimedia.
(±) De bodem warmt op tot een maximum van 42 °C / 108 F, vergeleken met een gemiddelde van 39.1 °C / 102 F
(+) Bij onbelast gebruik bedraagt de gemiddelde temperatuur voor de bovenzijde 22.4 °C / 72 F, vergeleken met het apparaatgemiddelde van 31.3 °C / 88 F.
(±) 3: The average temperature for the upper side is 35.3 °C / 96 F, compared to the average of 31.3 °C / 88 F for the class Multimedia.
(+) De palmsteunen en het touchpad zijn met een maximum van ###max## °C / 88.9 F koeler dan de huidtemperatuur en voelen daarom koel aan.
(-) De gemiddelde temperatuur van de handpalmsteun van soortgelijke toestellen bedroeg 28.7 °C / 83.7 F (-2.9 °C / -5.2 F).


| Dell XPS 16 Core Ultra 5 325 Ultra 5 325, Intel Graphics 4 Xe3 PTL | Dell XPS 16 9640 Ultra 7 155H, GeForce RTX 4070 Laptop GPU | Lenovo Yoga Pro 9 16IAH10 RTX 5050 Ultra 9 285H, GeForce RTX 5050 Laptop | Samsung Galaxy Book6 Ultra Ultra 7 356H, GeForce RTX 5070 Laptop | Asus ZenBook S16 UM5606GA Ryzen AI 9 465, Radeon 880M | MSI Prestige 16 AI Evo B2HMG Ultra 9 285H, Arc 140T | |
|---|---|---|---|---|---|---|
| Heat | -4% | -9% | -8% | -9% | -13% | |
| Maximum Upper Side * (°C) | 43.8 | 39.4 10% | 34.4 21% | 42.7 3% | 43.4 1% | 48.1 -10% |
| Maximum Bottom * (°C) | 42 | 36.9 12% | 41.4 1% | 49.1 -17% | 46.2 -10% | 51.6 -23% |
| Idle Upper Side * (°C) | 23.2 | 28.2 -22% | 28.6 -23% | 25.4 -9% | 26.5 -14% | 25.9 -12% |
| Idle Bottom * (°C) | 23.6 | 27.4 -16% | 31.8 -35% | 25.5 -8% | 27 -14% | 25.2 -7% |
* ... kleiner is beter
Stresstest
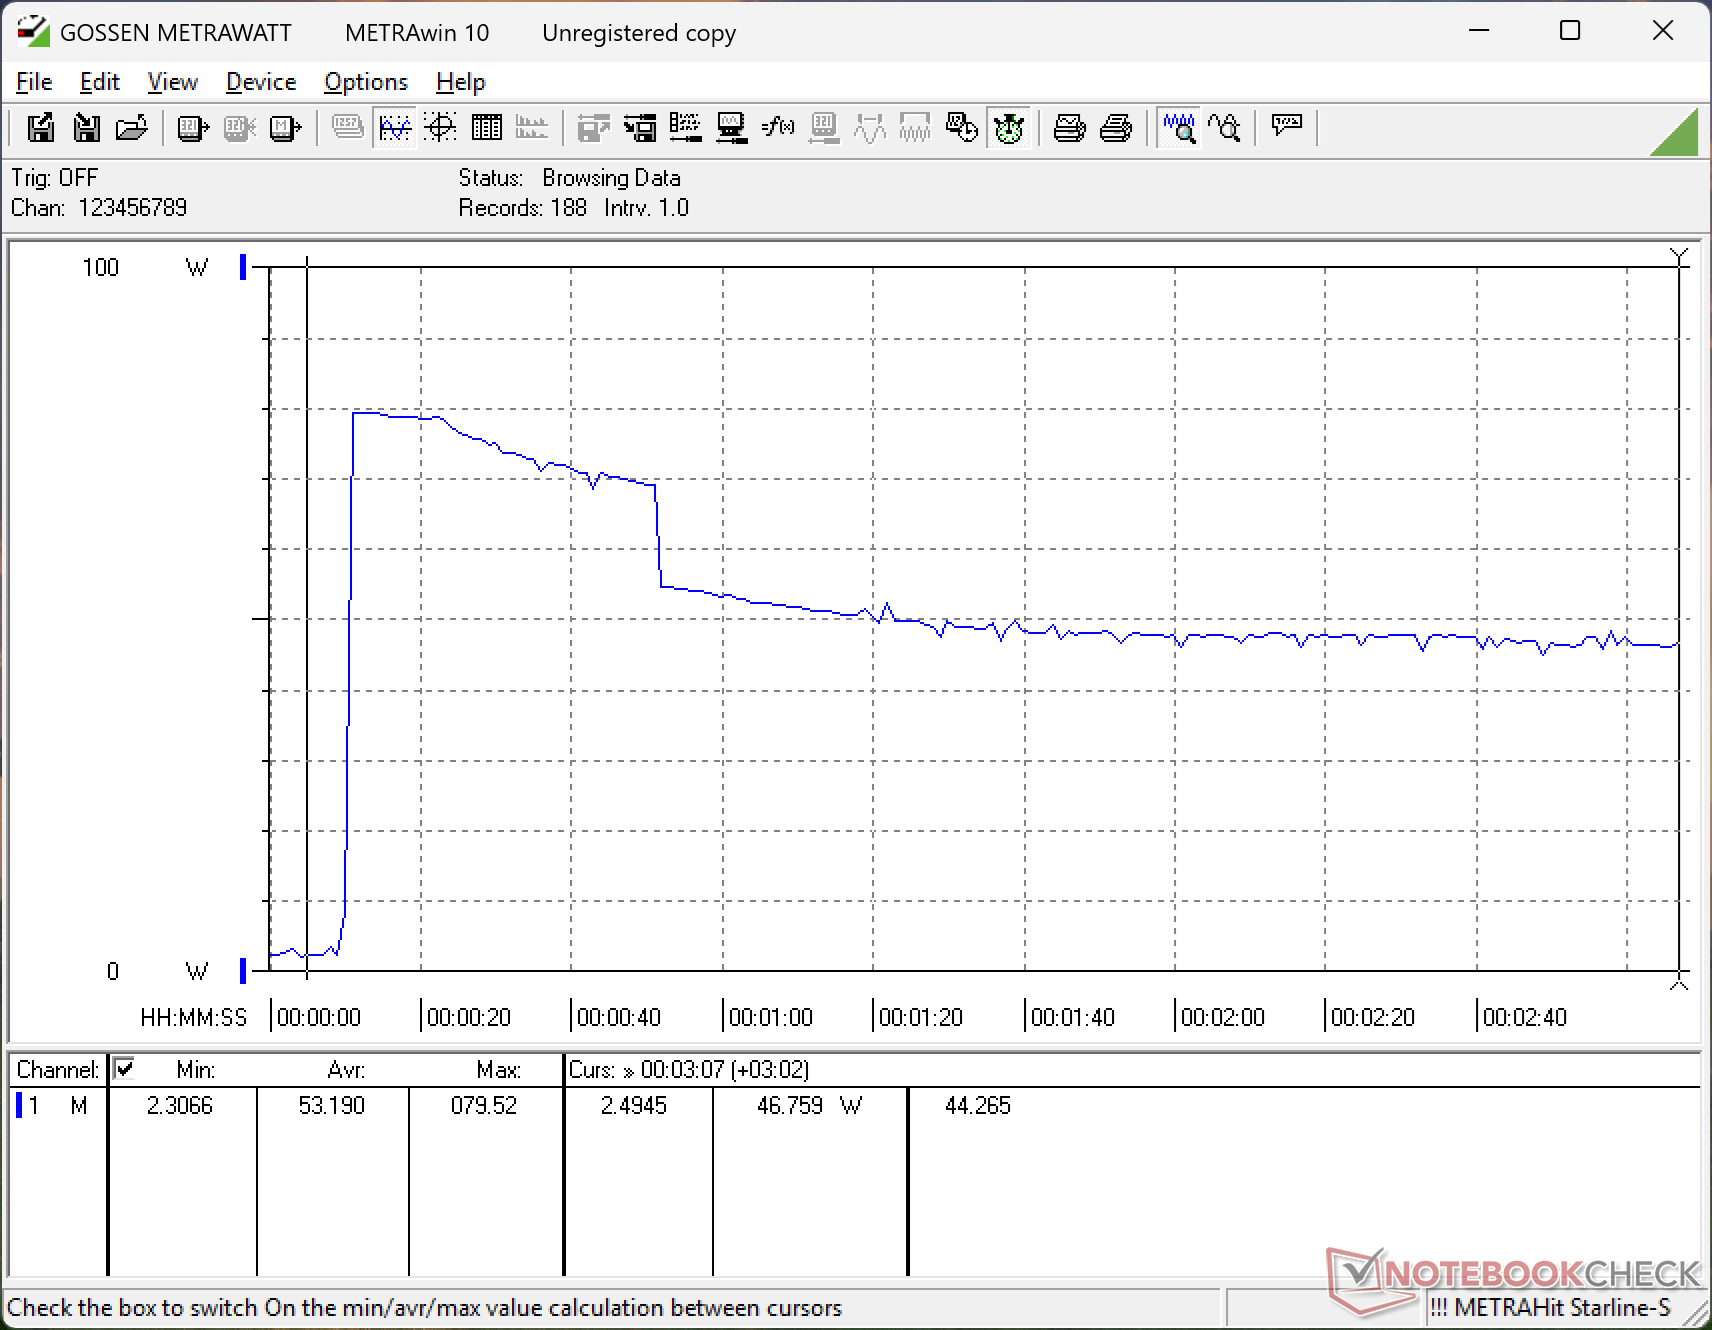
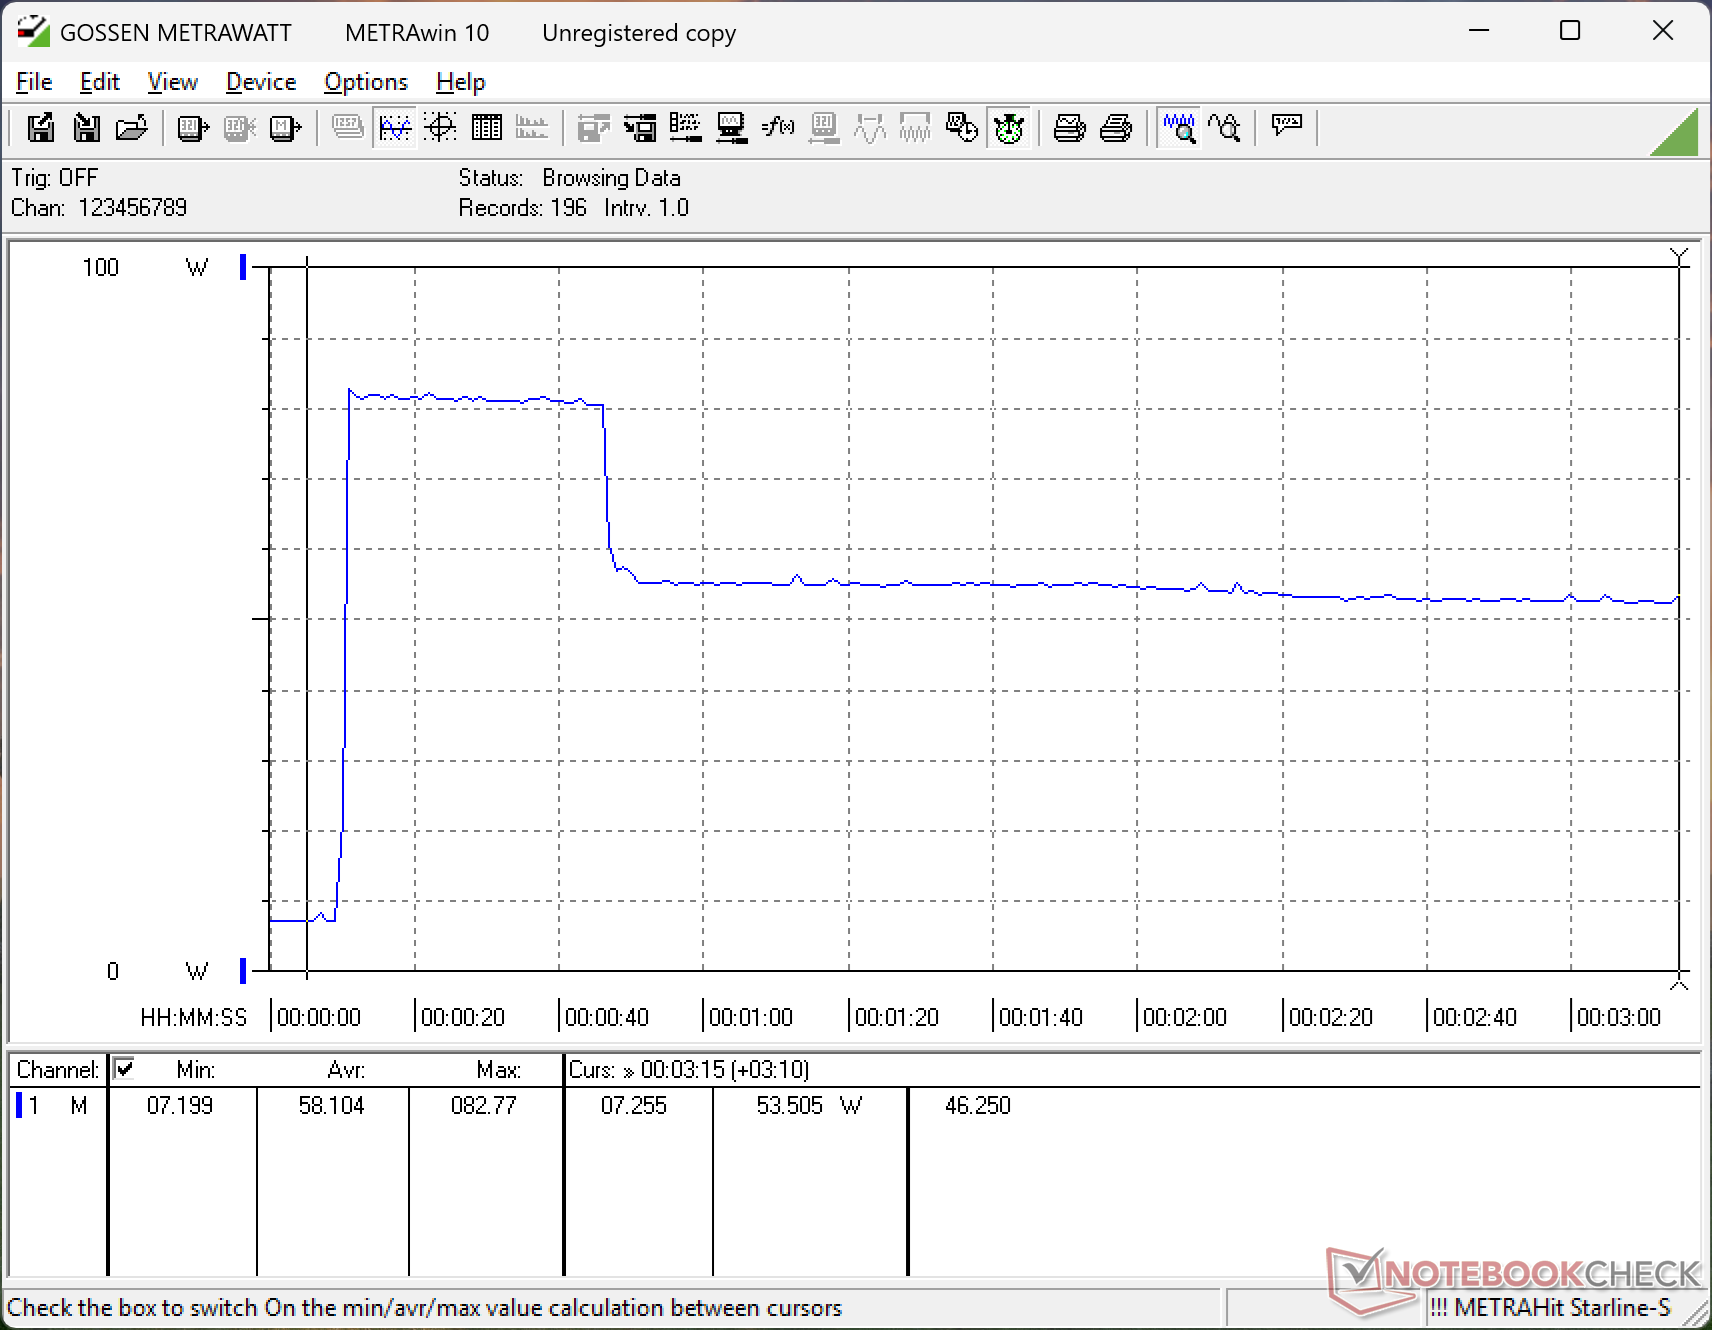
De processor kan behoorlijk warm worden wanneer deze onder druk staat. Tijdens het uitvoeren van Prime95, bijvoorbeeld, steeg de CPU naar 3,6 GHz, 54 W en 100 C gedurende slechts een paar seconden, voordat hij daalde en zich stabiliseerde op 3,0 GHz en 32 W om een redelijkere kerntemperatuur van 86 C te handhaven. Ter vergelijking, de Core Ultra 7 in de Dell 16 Premium uit 2025 zou zich stabiliseren bij een warmere temperatuur van 93 C onder vergelijkbare omstandigheden. Het is waarschijnlijk dat de nieuwe XPS 16 ook zou stabiliseren bij kerntemperaturen boven de 90 C wanneer deze geconfigureerd zou zijn met de veel snellere Core Ultra X7 in plaats van onze Core Ultra 5.
Bij het draaien van Cyberpunk 2077 voor een meer gebalanceerde CPU-GPU belasting, stabiliseerde de kerntemperatuur op een zeer aangename 89 C, vergeleken met 75 C op de 2025 XPS 16 met de snellere GeForce RTX grafische processor. De over het algemeen warmere kerntemperaturen zijn waarschijnlijk verantwoordelijk voor de hierboven genoemde warmere oppervlaktetemperaturen.

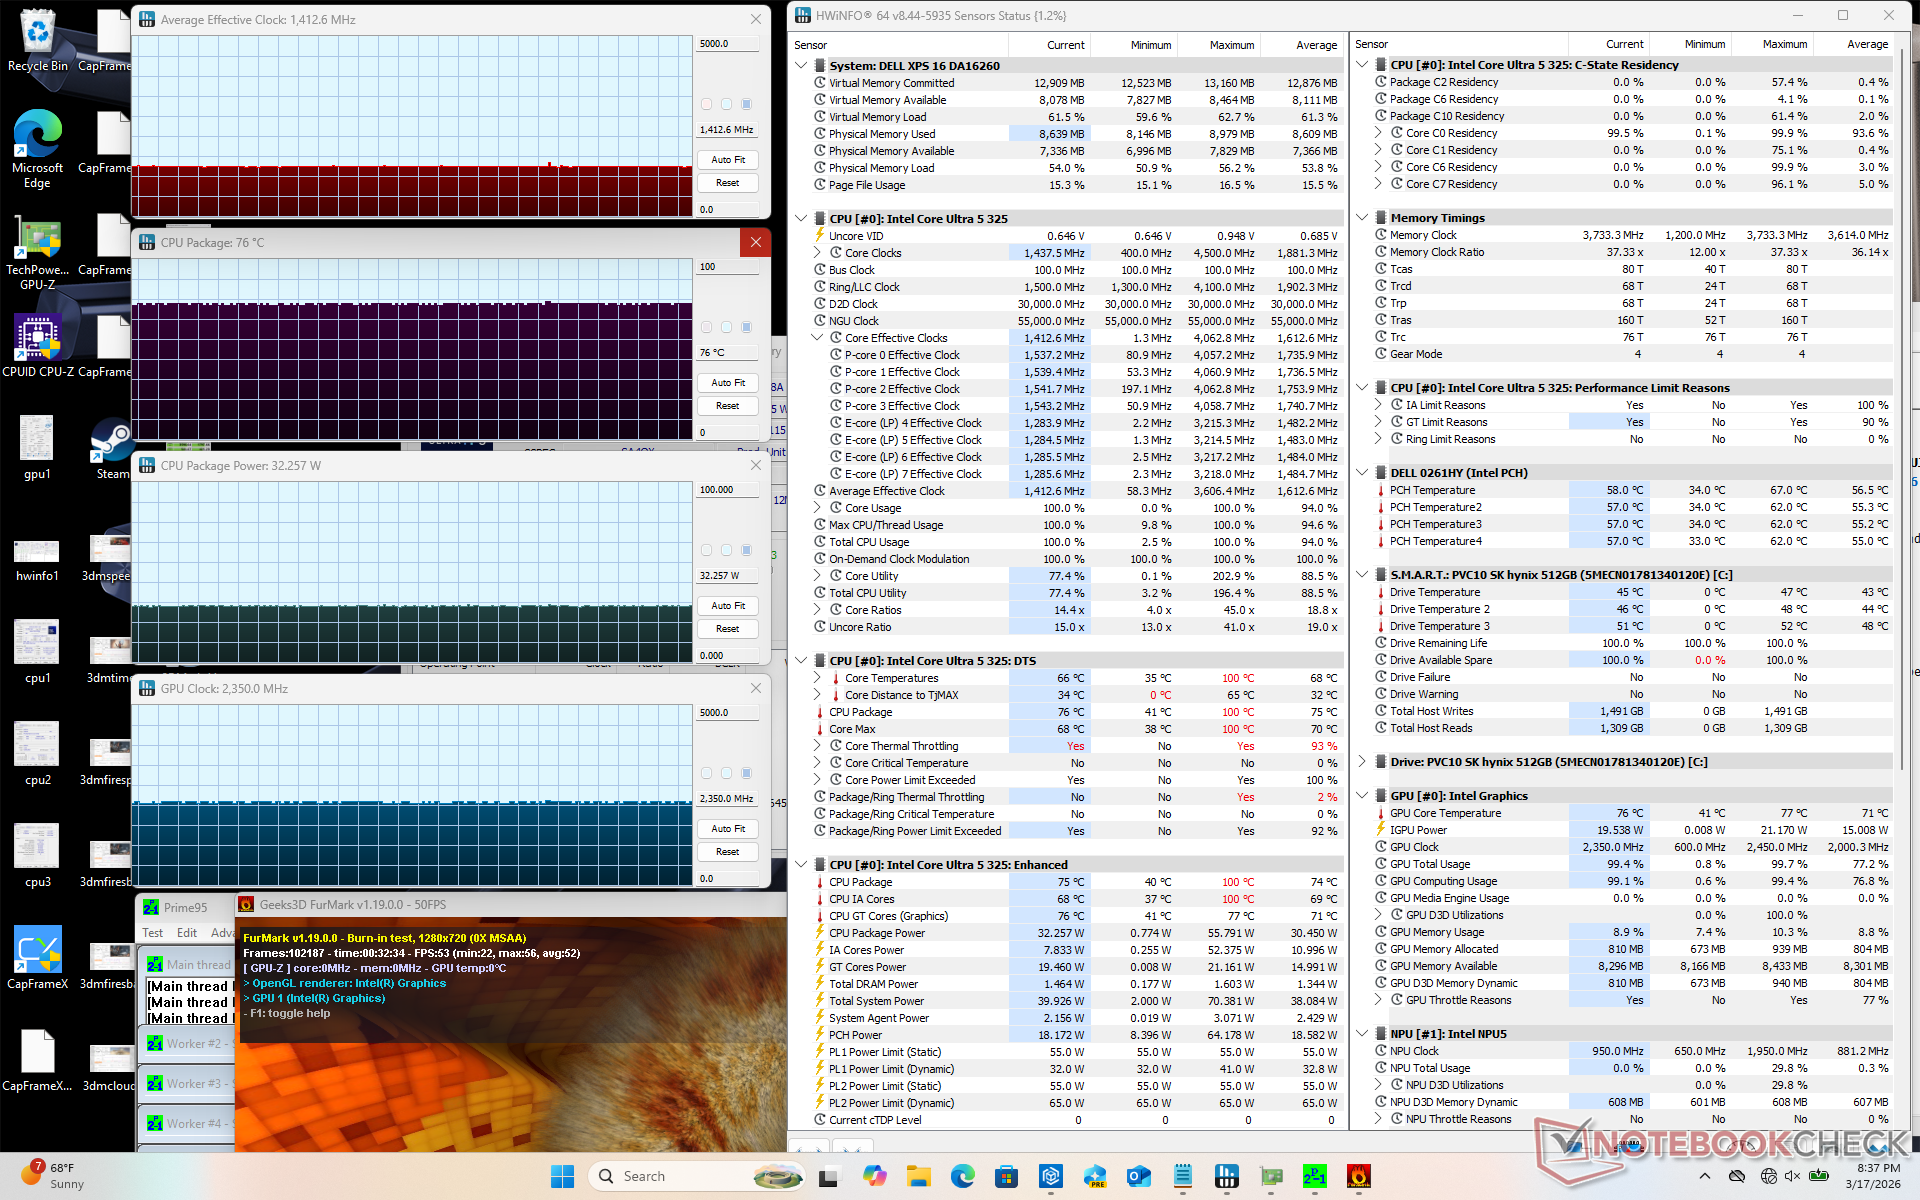
| Gemiddelde CPU-klok (GHz) | GPU-klok (MHz) | Gemiddelde CPU-temperatuur (°C) | |
| Inactief systeem | -- | -- | 47 |
| Prime95 Stress | 3.0 | -- | 86 |
| Prime95 + FurMark Stress | 1.4 | 2350 | 76 |
| Cyberpunk 2077 Stress | 1.4 | 2450 | 89 |
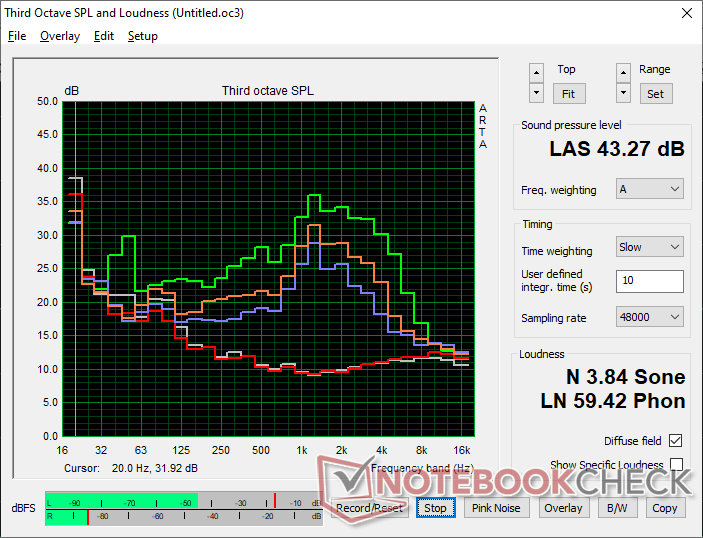
Luidsprekers

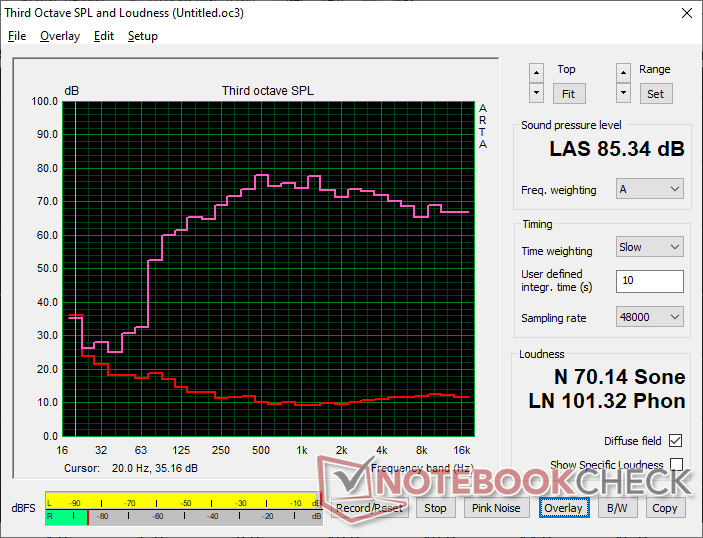
Dell XPS 16 Core Ultra 5 325 audioanalyse
(+) | luidsprekers kunnen relatief luid spelen (85.3 dB)
Bas 100 - 315 Hz
(±) | verminderde zeebaars - gemiddeld 6.1% lager dan de mediaan
(+) | de lage tonen zijn lineair (5.6% delta naar de vorige frequentie)
Midden 400 - 2000 Hz
(+) | evenwichtige middens - slechts 3.2% verwijderd van de mediaan
(+) | de middentonen zijn lineair (4.6% delta ten opzichte van de vorige frequentie)
Hoog 2 - 16 kHz
(+) | evenwichtige hoogtepunten - slechts 2.4% verwijderd van de mediaan
(+) | de hoge tonen zijn lineair (3.3% delta naar de vorige frequentie)
Algemeen 100 - 16.000 Hz
(+) | het totale geluid is lineair (7% verschil met de mediaan)
Vergeleken met dezelfde klasse
» 5% van alle geteste apparaten in deze klasse waren beter, 1% vergelijkbaar, 94% slechter
» De beste had een delta van 5%, het gemiddelde was 17%, de slechtste was 45%
Vergeleken met alle geteste toestellen
» 1% van alle geteste apparaten waren beter, 0% gelijk, 99% slechter
» De beste had een delta van 4%, het gemiddelde was 24%, de slechtste was 134%
Apple MacBook Pro 16 2021 M1 Pro audioanalyse
(+) | luidsprekers kunnen relatief luid spelen (84.7 dB)
Bas 100 - 315 Hz
(+) | goede baars - slechts 3.8% verwijderd van de mediaan
(+) | de lage tonen zijn lineair (5.2% delta naar de vorige frequentie)
Midden 400 - 2000 Hz
(+) | evenwichtige middens - slechts 1.3% verwijderd van de mediaan
(+) | de middentonen zijn lineair (2.1% delta ten opzichte van de vorige frequentie)
Hoog 2 - 16 kHz
(+) | evenwichtige hoogtepunten - slechts 1.9% verwijderd van de mediaan
(+) | de hoge tonen zijn lineair (2.7% delta naar de vorige frequentie)
Algemeen 100 - 16.000 Hz
(+) | het totale geluid is lineair (4.6% verschil met de mediaan)
Vergeleken met dezelfde klasse
» 0% van alle geteste apparaten in deze klasse waren beter, 0% vergelijkbaar, 100% slechter
» De beste had een delta van 5%, het gemiddelde was 17%, de slechtste was 45%
Vergeleken met alle geteste toestellen
» 0% van alle geteste apparaten waren beter, 0% gelijk, 100% slechter
» De beste had een delta van 4%, het gemiddelde was 24%, de slechtste was 134%
Energiebeheer - Panther Lake is de koning van efficiëntie
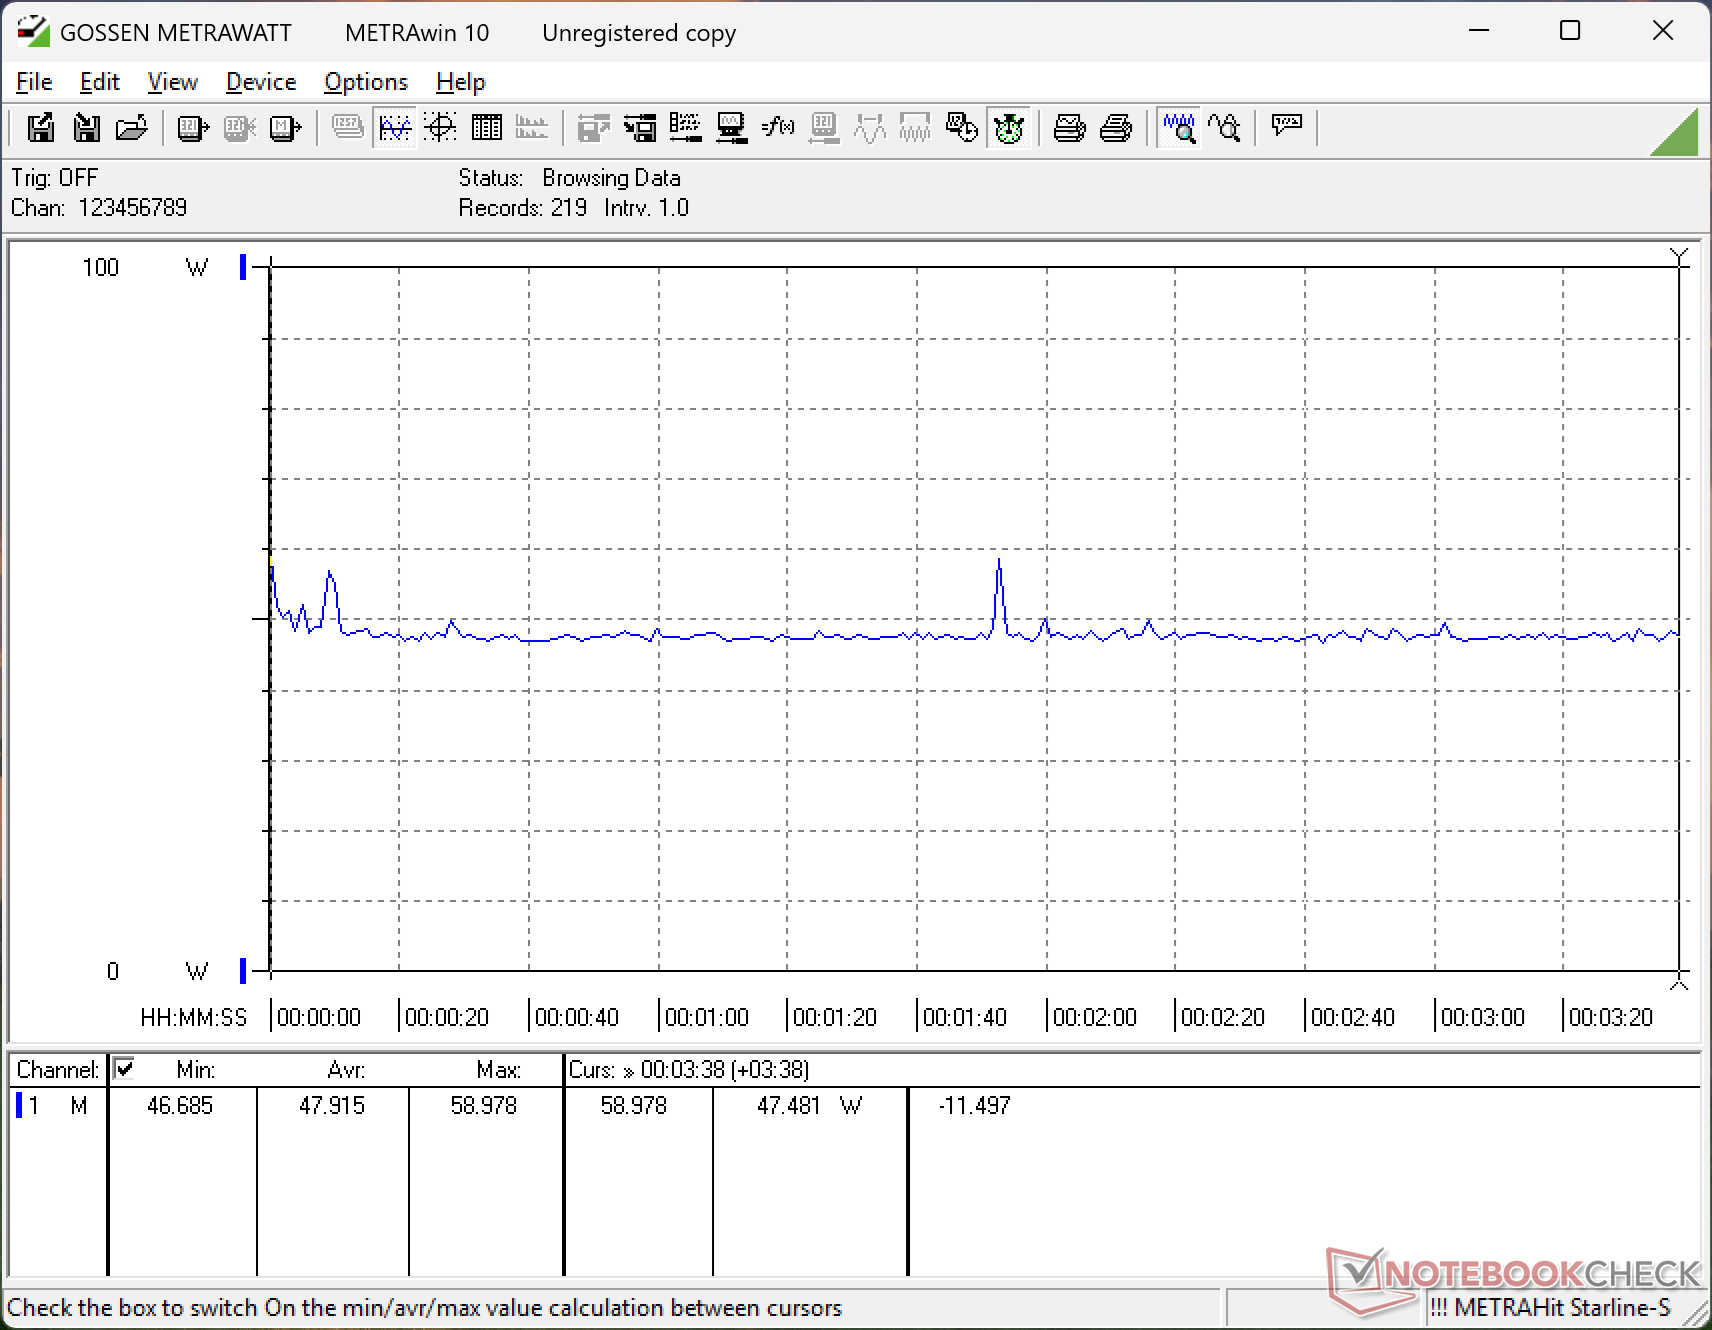
Stroomverbruik
Panther Lake gebruikt de efficiëntie van Lunar Lake-V met de ruwe prestaties van Arrow Lake-H voor het beste van twee werelden. Stationair draaien op de desktop bij de laagste helderheidsinstelling zou slechts 1,3 W verbruiken, wat extreem laag is, vooral voor een 16-inch vormfactor. Het verbruik blijft zeer laag, net onder de 50 W, bij het draaien van games door het ontbreken van een discrete GPU. Als hij in plaats daarvan geconfigureerd zou zijn met de Core Ultra X7, zou het verbruik tijdens het gamen slechts een paar watt hoger zijn, gebaseerd op onze tijd met de XPS 14 voor enkele van de hoogste prestaties-per-watt cijfers van alle iGPU-laptops.
We zijn in staat om een tijdelijke maximale stroomopname van 83 W te registreren van de kleine (~10,2 x 5,5 x 2,2 cm) 100 W universele USB-C wisselstroomadapter wanneer de CPU volledig belast wordt.
| Uit / Standby | |
| Inactief | |
| Belasting |
|
Key:
min: | |
| Dell XPS 16 Core Ultra 5 325 Ultra 5 325, Intel Graphics 4 Xe3 PTL, SK hynix PVC10 HFS512GEM4X182N, IPS, 1920x1200, 16" | Dell 16 Premium DA16250 Ultra 7 255H, GeForce RTX 5070 Laptop, Kioxia BG6 KBG6AZNV1T02, OLED, 3840x2400, 16.3" | Lenovo Yoga Pro 9 16IAH10 RTX 5050 Ultra 9 285H, GeForce RTX 5050 Laptop, WD PC SN7100S SDFPMSL-1T00-1101, OLED, 2880x1800, 16" | Samsung Galaxy Book6 Ultra Ultra 7 356H, GeForce RTX 5070 Laptop, Samsung PM9C1b MZVL81T0HFLB-00BH1, OLED, 2880x1800, 16" | Asus ZenBook S16 UM5606GA Ryzen AI 9 465, Radeon 880M, SanDisk PC SN5100S, OLED, 2880x1800, 16" | MSI Prestige 16 AI Evo B2HMG Ultra 9 285H, Arc 140T, Micron 2500 1TB MTFDKBA1T0QGN, IPS, 2560x1600, 16" | |
|---|---|---|---|---|---|---|
| Power Consumption | -225% | -261% | -119% | -65% | -93% | |
| Idle Minimum * (Watt) | 1.3 | 6.5 -400% | 6.8 -423% | 4.4 -238% | 3.7 -185% | 4.4 -238% |
| Idle Average * (Watt) | 4.5 | 8.1 -80% | 20.1 -347% | 6.4 -42% | 7.4 -64% | 9.2 -104% |
| Idle Maximum * (Watt) | 4.6 | 33 -617% | 21.6 -370% | 7.1 -54% | 9.5 -107% | 9.5 -107% |
| Load Average * (Watt) | 36.5 | 88.9 -144% | 87.6 -140% | 55.1 -51% | 57.9 -59% | 66.9 -83% |
| Cyberpunk 2077 ultra external monitor * (Watt) | 45.4 | 108.9 -140% | 147.9 -226% | 133 -193% | 57 -26% | 67.4 -48% |
| Cyberpunk 2077 ultra * (Watt) | 47.9 | 108.7 -127% | 148.2 -209% | 134.3 -180% | 58.5 -22% | 68.8 -44% |
| Load Maximum * (Watt) | 82.8 | 138.3 -67% | 173.5 -110% | 143.9 -74% | 76.9 7% | 102.9 -24% |
* ... kleiner is beter
Stroomverbruik Cyberpunk / Stresstest
Stroomverbruik externe monitor
Levensduur batterij

Dell adverteert met een batterijlevensduur tot 31 uur op basis van hun interne WLAN-testcriteria. Bij het testen onder onze eigen WLAN-omstandigheden konden we echter een looptijd van bijna 27 uur noteren, wat nog steeds waanzinnig indrukwekkend is aangezien de batterijcapaciteit van 70 Wh eigenlijk aan de kleine kant is voor een 16-inch vormfactor.
| Dell XPS 16 Core Ultra 5 325 Ultra 5 325, Intel Graphics 4 Xe3 PTL, 70 Wh | Dell XPS 16 9640 Ultra 7 155H, GeForce RTX 4070 Laptop GPU, 99.5 Wh | Lenovo Yoga Pro 9 16IAH10 RTX 5050 Ultra 9 285H, GeForce RTX 5050 Laptop, 84 Wh | Samsung Galaxy Book6 Ultra Ultra 7 356H, GeForce RTX 5070 Laptop, 80.2 Wh | Asus ZenBook S16 UM5606GA Ryzen AI 9 465, Radeon 880M, 83 Wh | MSI Prestige 16 AI Evo B2HMG Ultra 9 285H, Arc 140T, 99.9 Wh | |
|---|---|---|---|---|---|---|
| Batterijduur | -61% | -60% | -37% | -51% | -38% | |
| WiFi v1.3 (h) | 26.6 | 10.5 -61% | 10.7 -60% | 16.8 -37% | 13.1 -51% | 16.5 -38% |
| H.264 (h) | 16.5 | 20.8 | ||||
| Load (h) | 1.5 | 2.4 |
Notebookcheck Beoordeling
De 2026 XPS 16 offert discrete GPU-opties op voor een slanker, lichter, stiller, duurzamer en efficiënter ontwerp.
Dell XPS 16 Core Ultra 5 325
- 20-03-2026 v8
Allen Ngo
 Total Sustainability Score:
 Potentiële concurrenten in vergelijking
Afbeelding | Model / recensie | prijs | Gewicht | Hoogte | Scherm |
|---|---|---|---|---|---|
1. 84.2%  | Dell XPS 16 Core Ultra 5 325 Intel Core Ultra 5 325 ⎘ Intel Graphics 4 Xe3 Panther Lake iGPU ⎘ 16 GB Geheugen, 512 GB SSD | Amazon: 1. $2,799.00 Dell Premium 16 (XPS 16 2025... 2. $2,499.99 Dell Premium 16 (XPS 16 2025... 3. $2,599.00 Dell Premium 16 (XPS 16 2025... Catalogusprijs: 1600 USD | 1.7 kg | 15.4 mm | 16.00" 1920x1200 142 PPI IPS |
2. 87.9%  | Dell 16 Premium DA16250 Intel Core Ultra 7 255H ⎘ NVIDIA GeForce RTX 5070 Laptop ⎘ 32 GB Geheugen, 1024 GB SSD | Amazon: Catalogusprijs: 3300 USD | 2.3 kg | 18.7 mm | 16.30" 3840x2400 278 PPI OLED |
3. 88.8%  | Lenovo Yoga Pro 9 16IAH10 RTX 5050 Intel Core Ultra 9 285H ⎘ NVIDIA GeForce RTX 5050 Laptop ⎘ 32 GB Geheugen, 1024 GB SSD | Amazon: Catalogusprijs: 1800 USD | 2 kg | 17.9 mm | 16.00" 2880x1800 212 PPI OLED |
4. 90.7%  | Samsung Galaxy Book6 Ultra Intel Core Ultra 7 356H ⎘ NVIDIA GeForce RTX 5070 Laptop ⎘ 32 GB Geheugen, 1000 GB SSD | Amazon: Catalogusprijs: 3599€ | 1.9 kg | 15.4 mm | 16.00" 2880x1800 212 PPI OLED |
5. 86.6%  | Asus ZenBook S16 UM5606GA AMD Ryzen AI 9 465 ⎘ AMD Radeon 880M ⎘ 32 GB Geheugen, 1024 GB SSD | Amazon: Catalogusprijs: 1799€ | 1.5 kg | 12.9 mm | 16.00" 2880x1800 212 PPI OLED |
6. 82.8%  | MSI Prestige 16 AI Evo B2HMG Intel Core Ultra 9 285H ⎘ Intel Arc Graphics 140T ⎘ 32 GB Geheugen, 1024 GB SSD | Amazon: 1. $1,479.00 MSI Prestige 16 AI+ Evo 16" ... 2. $1,099.49 msi Prestige 13 AI Evo Lapto... 3. $1,414.25 MSI Prestige 14 AI+ EVO PRE1... | 1.6 kg | 18.95 mm | 16.00" 2560x1600 189 PPI IPS |
Transparantie
De selectie van te beoordelen apparaten wordt gemaakt door onze redactie. Het proefexemplaar werd door de auteur op eigen kosten vrijelijk aangekocht. De kredietverstrekker had geen invloed op deze recensie, noch ontving de fabrikant vóór publicatie een exemplaar van deze recensie. Er bestond geen verplichting om deze recensie te publiceren. Als onafhankelijk mediabedrijf is Notebookcheck niet onderworpen aan het gezag van fabrikanten, detailhandelaren of uitgevers.
[transparency_disclaimer]Dit is hoe Notebookcheck test
Elk jaar beoordeelt Notebookcheck onafhankelijk honderden laptops en smartphones met behulp van gestandaardiseerde procedures om ervoor te zorgen dat alle resultaten vergelijkbaar zijn. We hebben onze testmethoden al zo'n 20 jaar voortdurend ontwikkeld en daarbij de industriestandaard bepaald. In onze testlaboratoria wordt gebruik gemaakt van hoogwaardige meetapparatuur door ervaren technici en redacteuren. Deze tests omvatten een validatieproces in meerdere fasen. Ons complexe beoordelingssysteem is gebaseerd op honderden goed onderbouwde metingen en benchmarks, waardoor de objectiviteit behouden blijft. Meer informatie over onze testmethoden kunt u hier vinden.

