Verdict - Snel, maar kan sneller
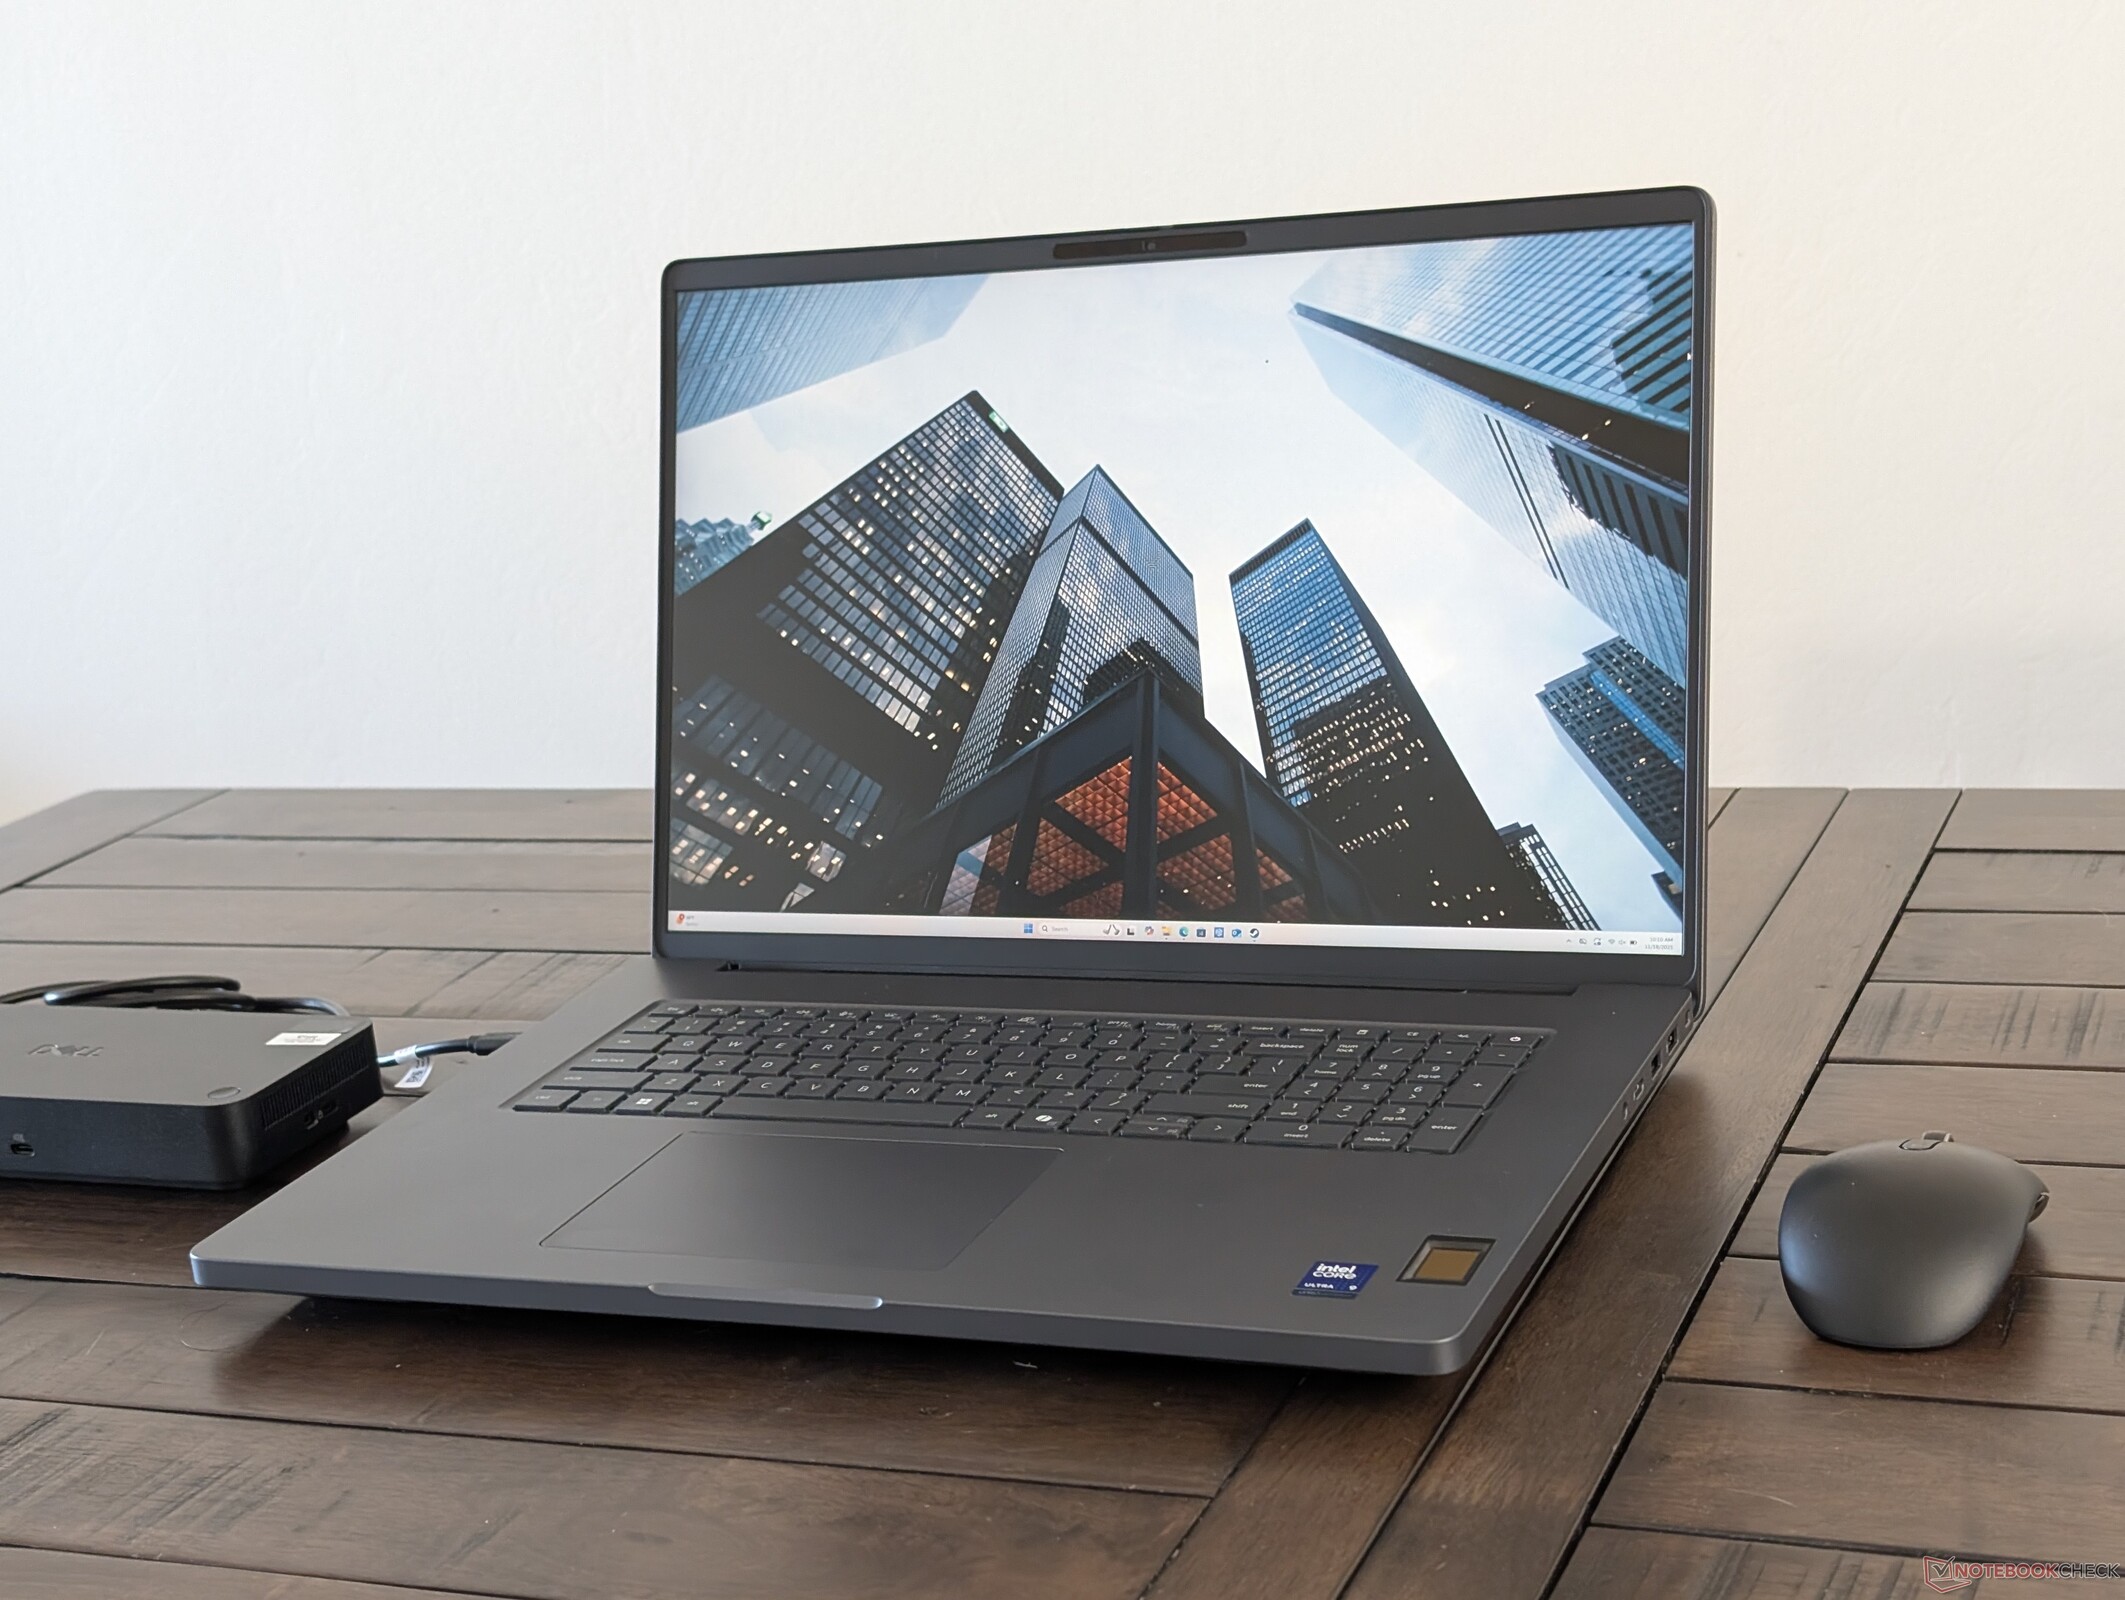
De Dell Pro Max 18 Plus is een indrukwekkend en goed gebouwd stuk hardware dat zijn viercijferige startprijzen weerspiegelt. De unieke onderdelen zoals CAMM2, DGFF en modulaire USB-C poorten voor betere repareerbaarheid helpen om het model te onderscheiden van de concurrentie. Dit is geen gaming-laptop die omgetoverd is tot werkstation, maar een laptop die van de grond af specifiek geoptimaliseerd is voor professionele werklasten. Qua prestaties is de Dell met gemak een van de snelste mobiele werkstations met zijn Arrow Lake-HX CPU, 175 W Nvidia Pro RTX 5000 Blackwell GPU en ruime 128 tot 256 GB RAM waar AI-toepassingen gebruik van kunnen maken. Het hele systeem wordt gevoed door een universele 280 USB-C wisselstroomadapter, wat nog een opmerkelijke eigenschap is die we nog niet hebben gezien bij grote concurrenten.
Hoe geweldig de bouwkwaliteit en hardware ook zijn, de prestaties kunnen nog steeds iets beter. De CPU wordt te warm met ongeveer 100 C wanneer deze wordt belast, wat de Turbo Boost-prestaties beïnvloedt. Functies zoals de koeloplossing, het toetsenbord en de poortopties blijven in wezen hetzelfde als op de kleinere Dell Pro Max 16 Plus ondanks de verschillen in grootte. Met name het gebrek aan schermopties kan gebruikers teleurstellen, vooral omdat het 16-inch model wordt geleverd met ten minste drie panelen om uit te kiezen, waaronder 4K OLED.
Andere nadelen zijn het ontbreken van RGB-verlichting per toets of speciale muisknoppen, die beide beschikbaar zijn op de HP ZBook Fury G1i 18, maar dit zijn relatief kleine deukjes op een verder solide DTR workstation.
Pro
Contra
Prijs en beschikbaarheid
- $1,799.95Dell Pro 16 Plus PB16250 (Replaces Latitude 5550) AI Business Notebook 16" FHD+ Intel Ultra 7-265U, 32GB DDR5 RAM, 512GB SSD PCIe, Wi-Fi 6E, BT, Backlit Keyboard, HD Webcam, RJ-45, Win 11 Pro - Silver
- $1,599.95Dell Pro 16 Plus PB16250 Business Laptop 16" FHD+ Intel Ultra 7-265U, Oemgenuine Customized Laptop, 16GB / 32GB / 64GB RAM, 512GB / 1TB / 2TB SSD, Wi-Fi 6E, Backlit Keyboard, Webcam, RJ-45, Win 11 Pro
- $54.99165W USB-C Gan Laptop Charger Compatible with Dell Pro Max 16 18 Plus MB16250 MB18250, Pro Max 16 Premium MA16250, Precision 5680 5690 Laptop Type C AC Adapter Power Cord
De Dell Pro Max 18 Plus is de opvolger van de oudere generatie mobiele werkstations uit de Precision serie. Hoewel het een van de snelste en grootste modellen in de Dell line-up is, is het gebouwd op hetzelfde platform als de kleinere 16 inch Dell Pro Max 16 Plus en dus delen de twee modellen veel fysieke kenmerken. De meeste van onze opmerkingen over de Dell Pro Max 16 Plus zijn vervolgens ook van toepassing op het 18-inch model.
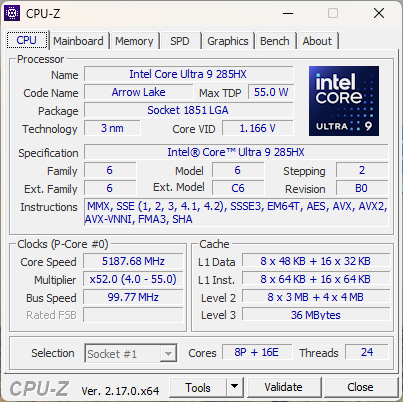
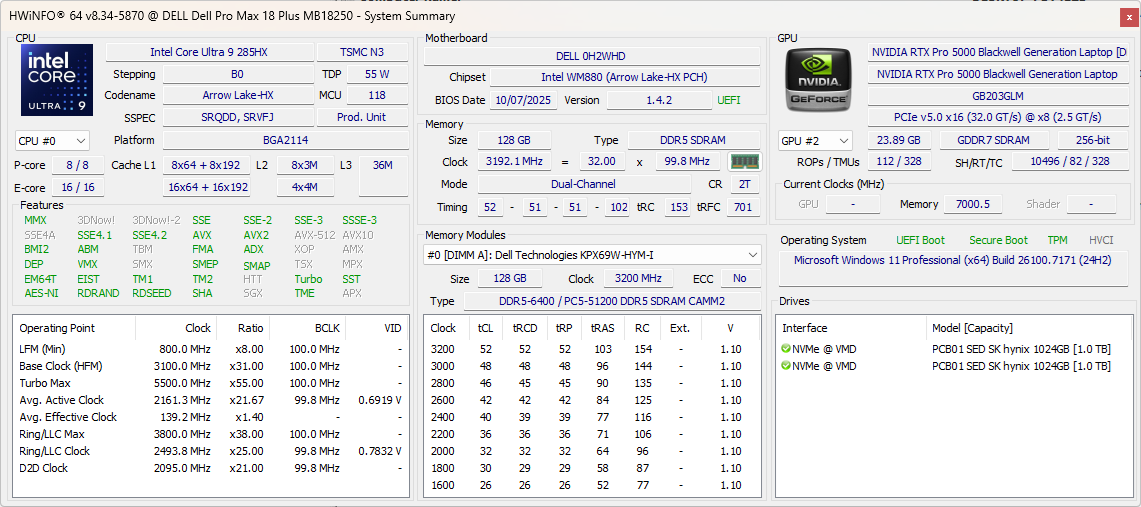
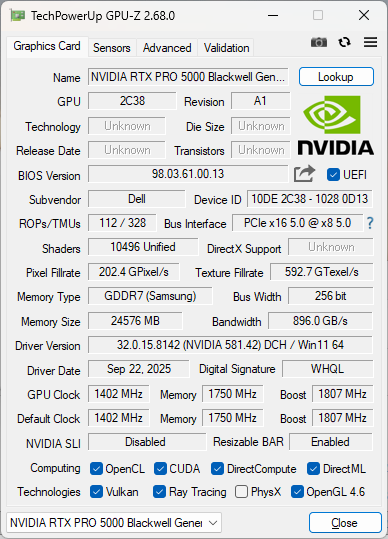
Onze testunit is een configuratie in het hogere segment met de Arrow Lake-HX Core Ultra 9 285HX vPro CPU, 175 W Nvidia RTX Pro 5000 Blackwell GPU en twee PCIe5 SSD's in RAID 0 voor ruim boven de $6000. Alle opties worden verder geleverd met hetzelfde QHD+ 1600p non-touch beeldscherm.
Er zijn maar weinig alternatieven, aangezien 18-inch DTR-werkstations zeldzaam zijn. De HP ZBook Fury G1i 18 is een belangrijke concurrent.
Meer Dell beoordelingen:
Specificaties
Behuizing - MIL-STD goedgekeurd
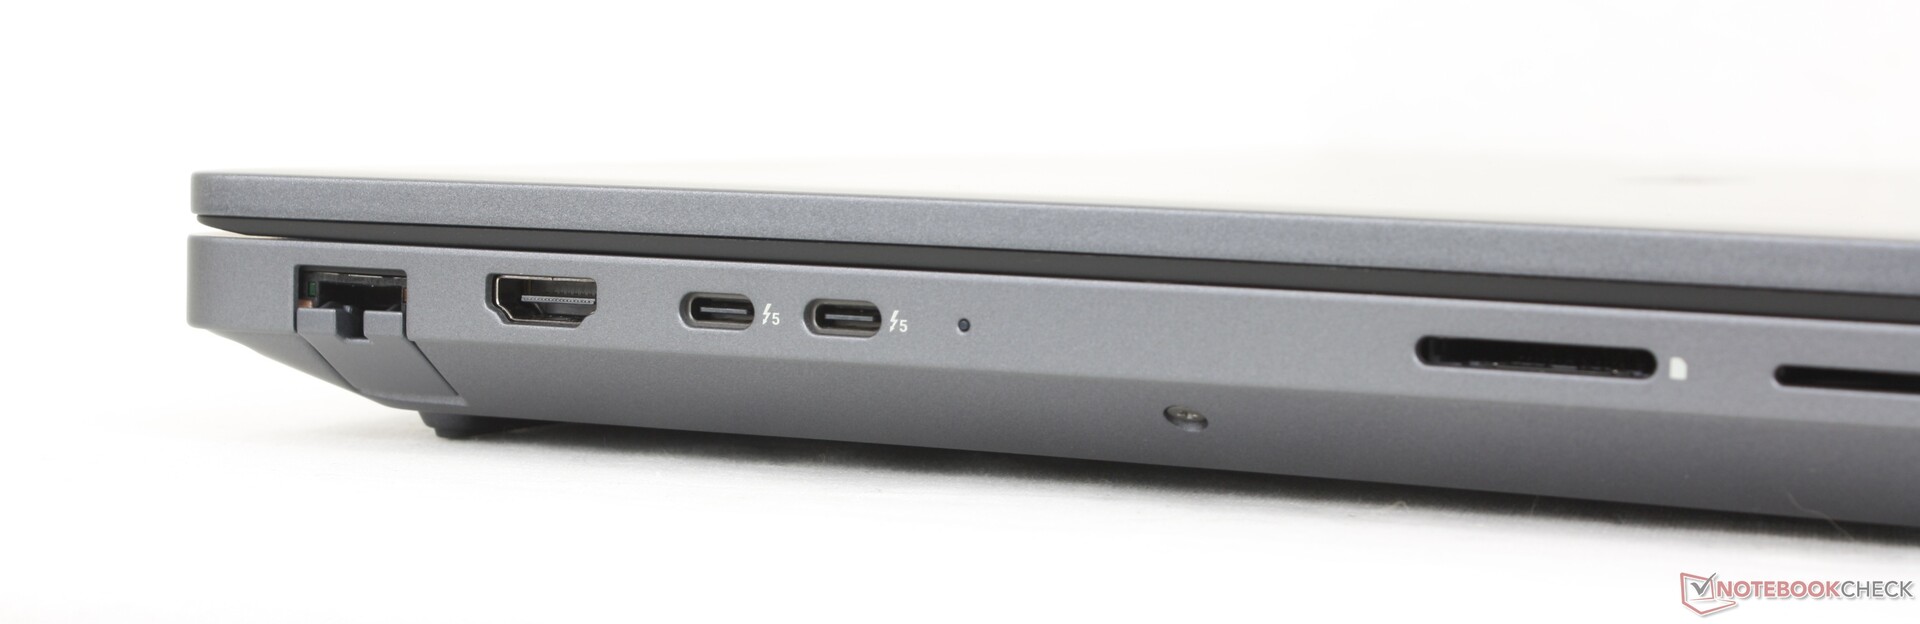
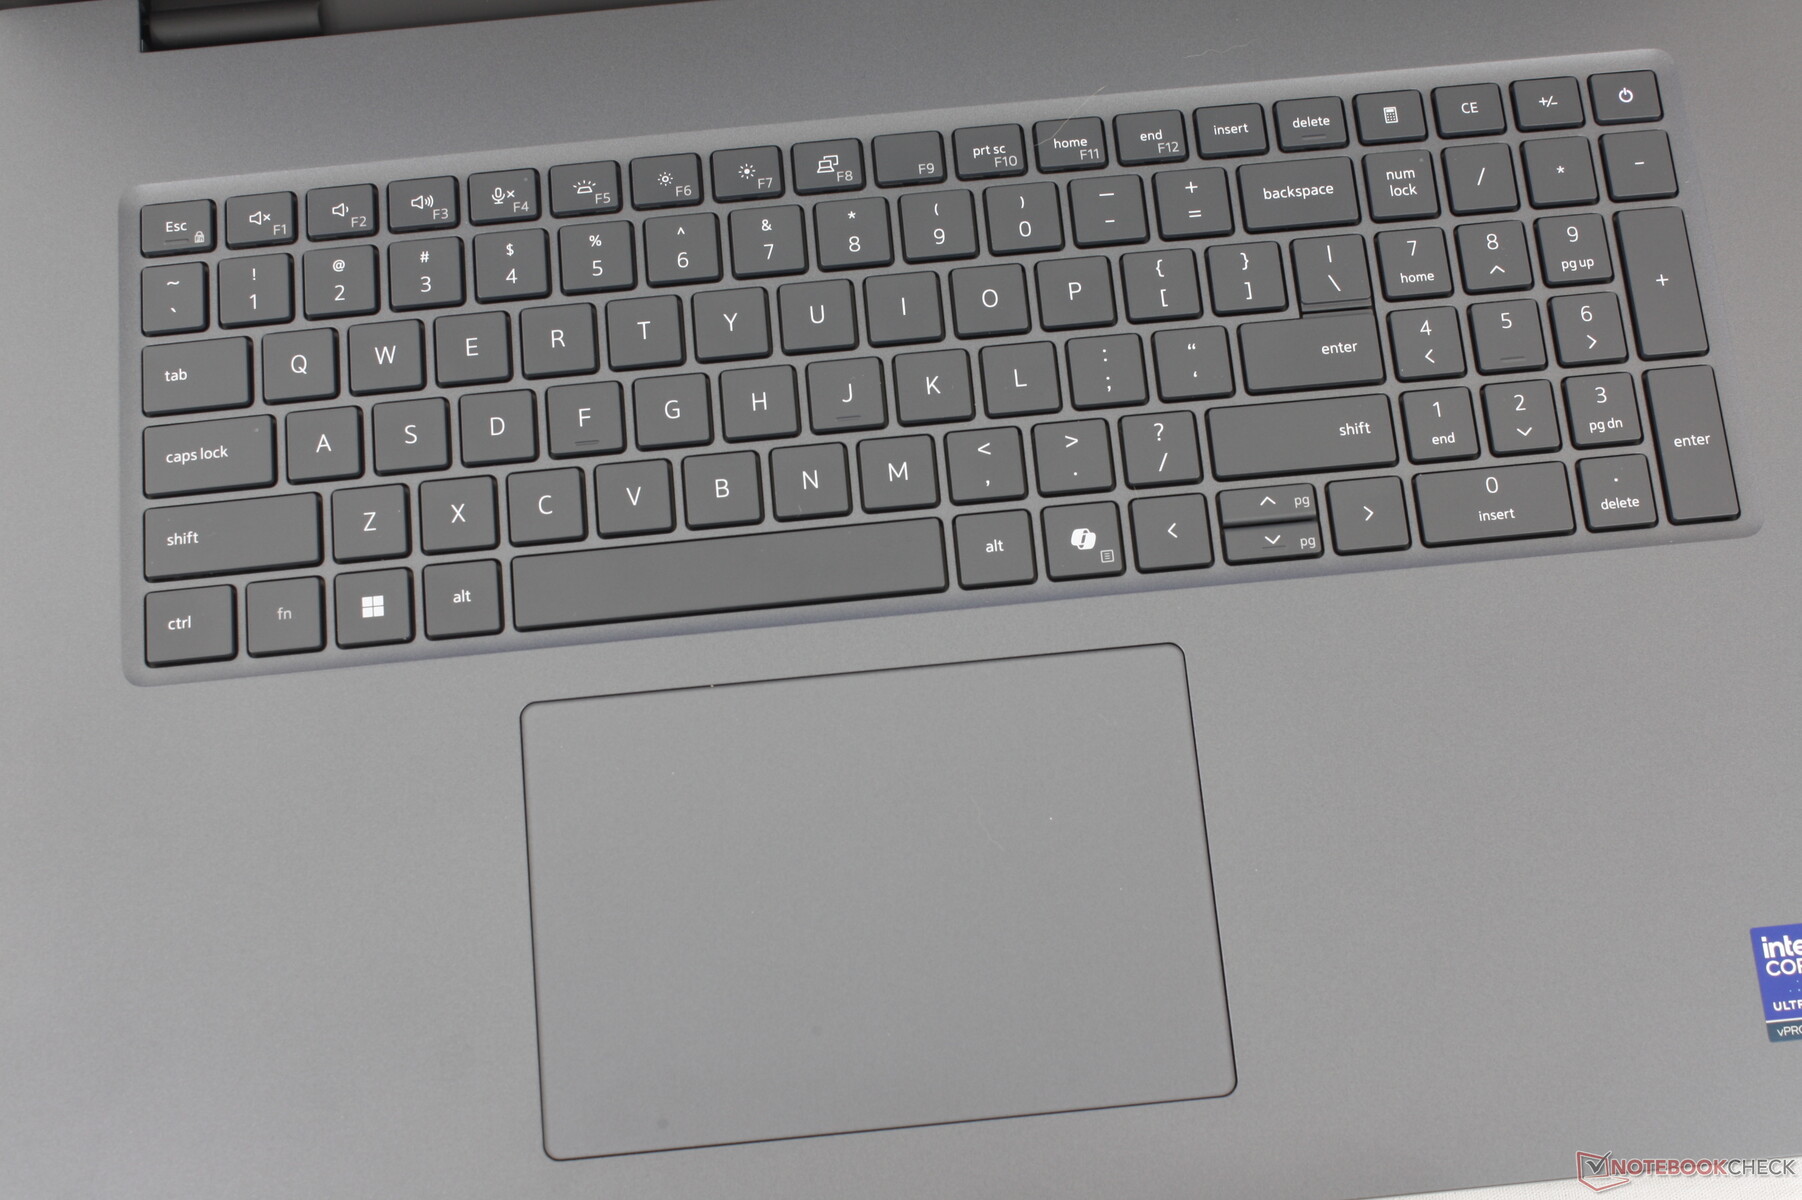
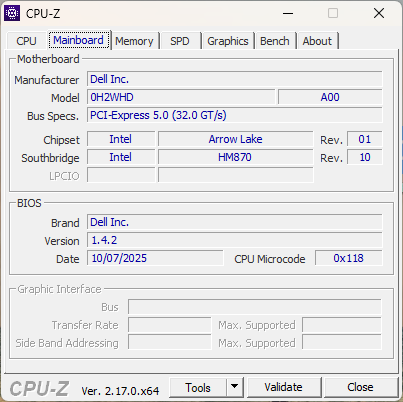
Het chassis is in wezen een vergrote versie van de 16-inch Dell Pro Max 16 Plus met een gewichtstoename van bijna 30 procent. De meeste fysieke kenmerken zoals het toetsenbord, clickpad en zelfs poorten blijven identiek, met slechts kleine verschillen in het moederbord.

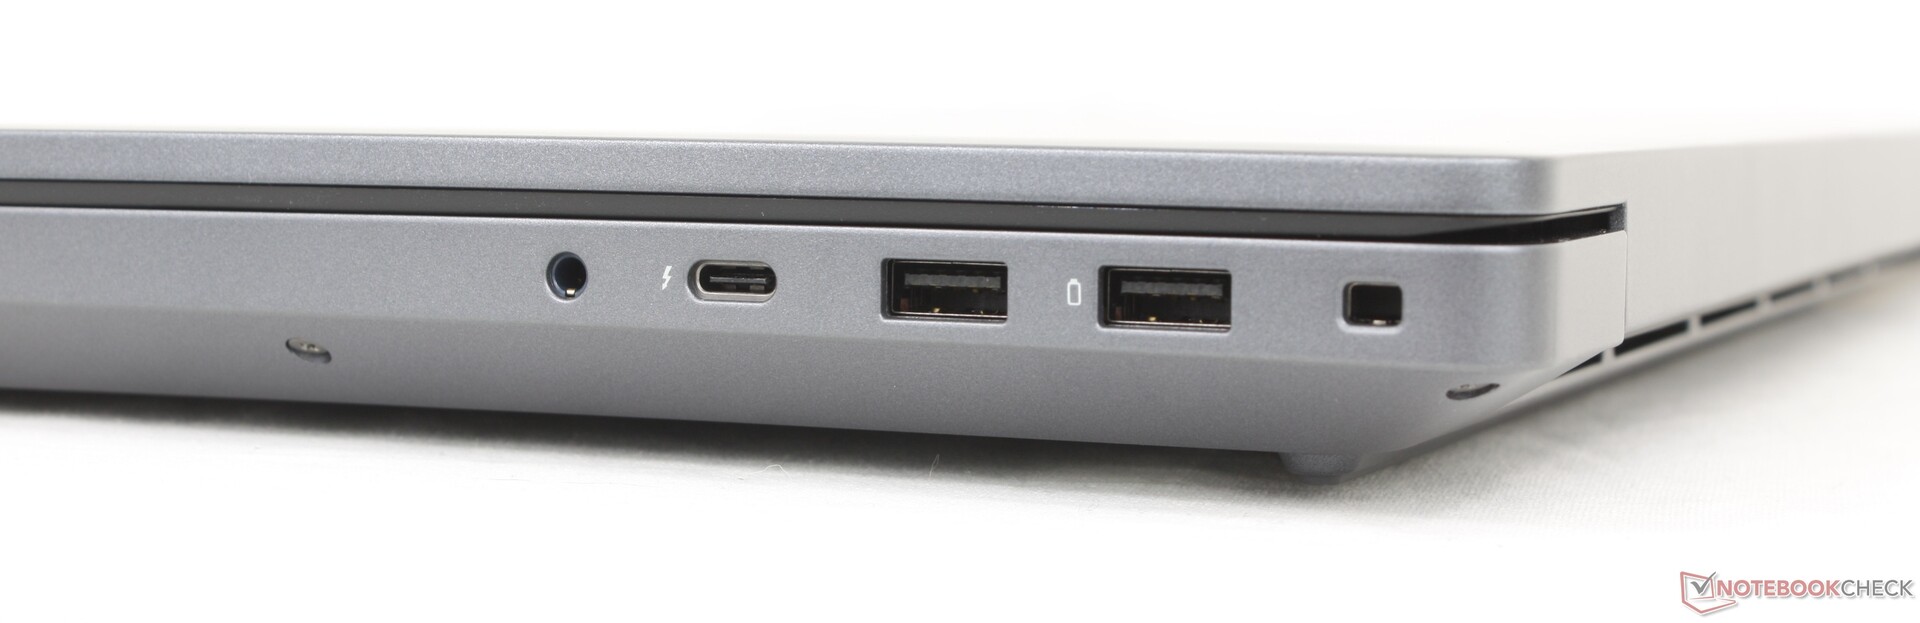
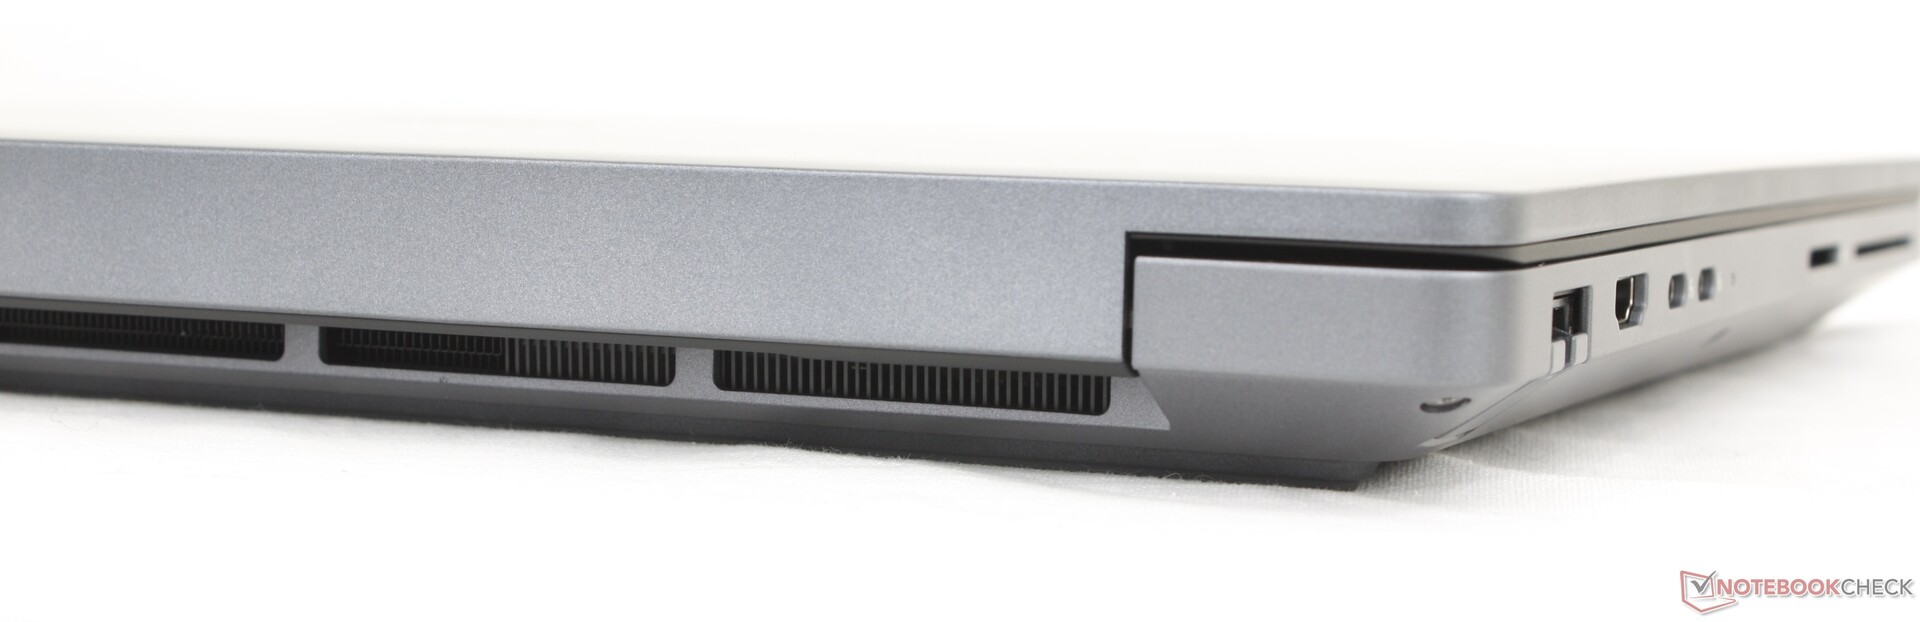
Connectiviteit
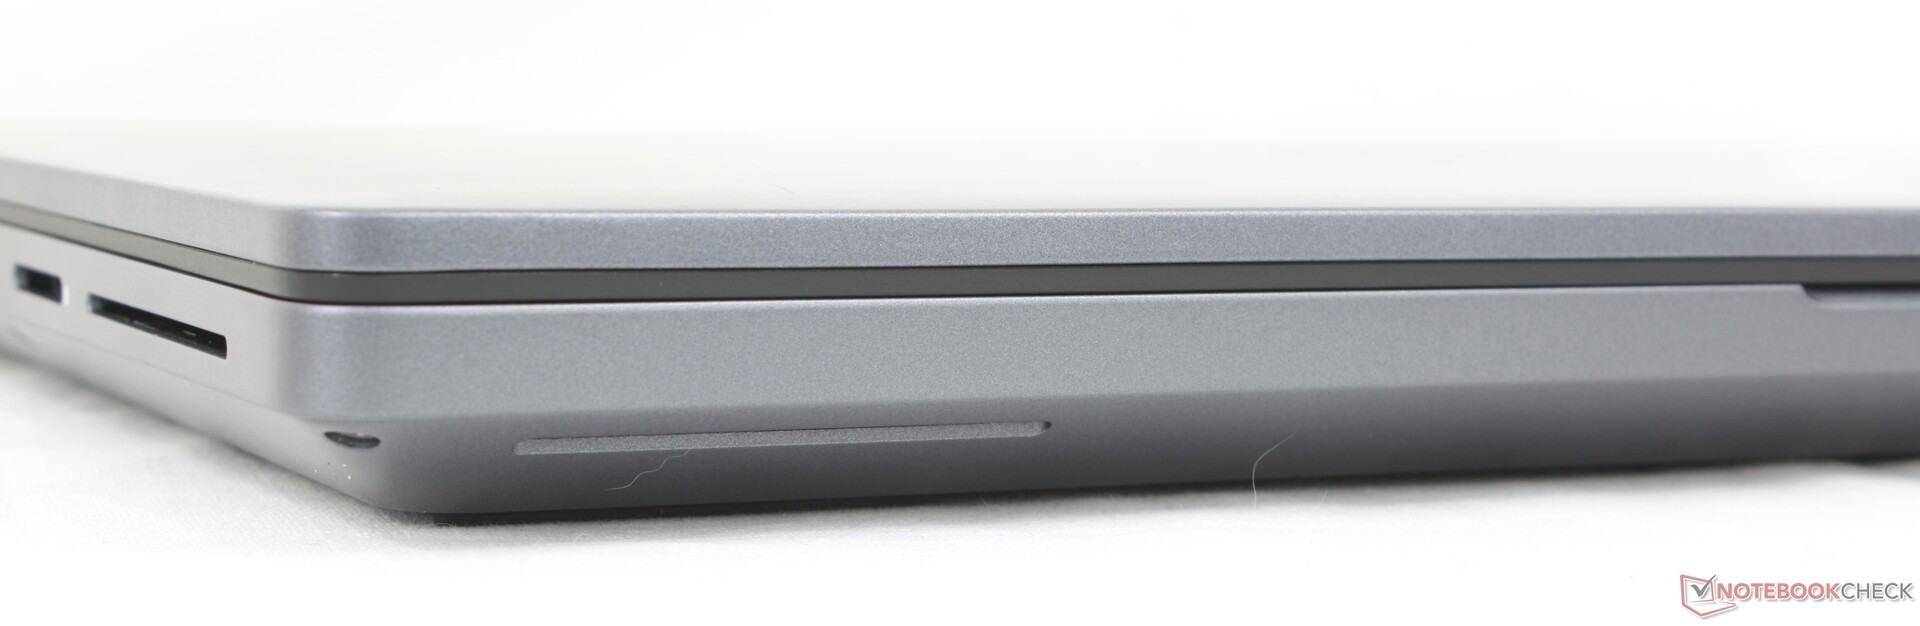
SD-kaartlezer
| SD Card Reader | |
| average JPG Copy Test (av. of 3 runs) | |
| HP ZBook X G1i 16 (Toshiba Exceria Pro SDXC 64 GB UHS-II) | |
| Dell Pro Max 18 Plus MB18250 (Toshiba Exceria Pro SDXC 64 GB UHS-II) | |
| Schenker Key 18 Pro M25 RTX 5090 (Angelbird AV Pro V60) | |
| Dell Pro Max 16 Plus (Toshiba Exceria Pro SDXC 64 GB UHS-II) | |
| maximum AS SSD Seq Read Test (1GB) | |
| HP ZBook X G1i 16 (Toshiba Exceria Pro SDXC 64 GB UHS-II) | |
| Dell Pro Max 18 Plus MB18250 (Toshiba Exceria Pro SDXC 64 GB UHS-II) | |
| Dell Pro Max 16 Plus (Toshiba Exceria Pro SDXC 64 GB UHS-II) | |
| Schenker Key 18 Pro M25 RTX 5090 (Angelbird AV Pro V60) | |
Communicatie
Webcam
De IR-webcam met 8 MP is een optionele upgrade ten opzichte van de standaardwebcam met 2 MP.


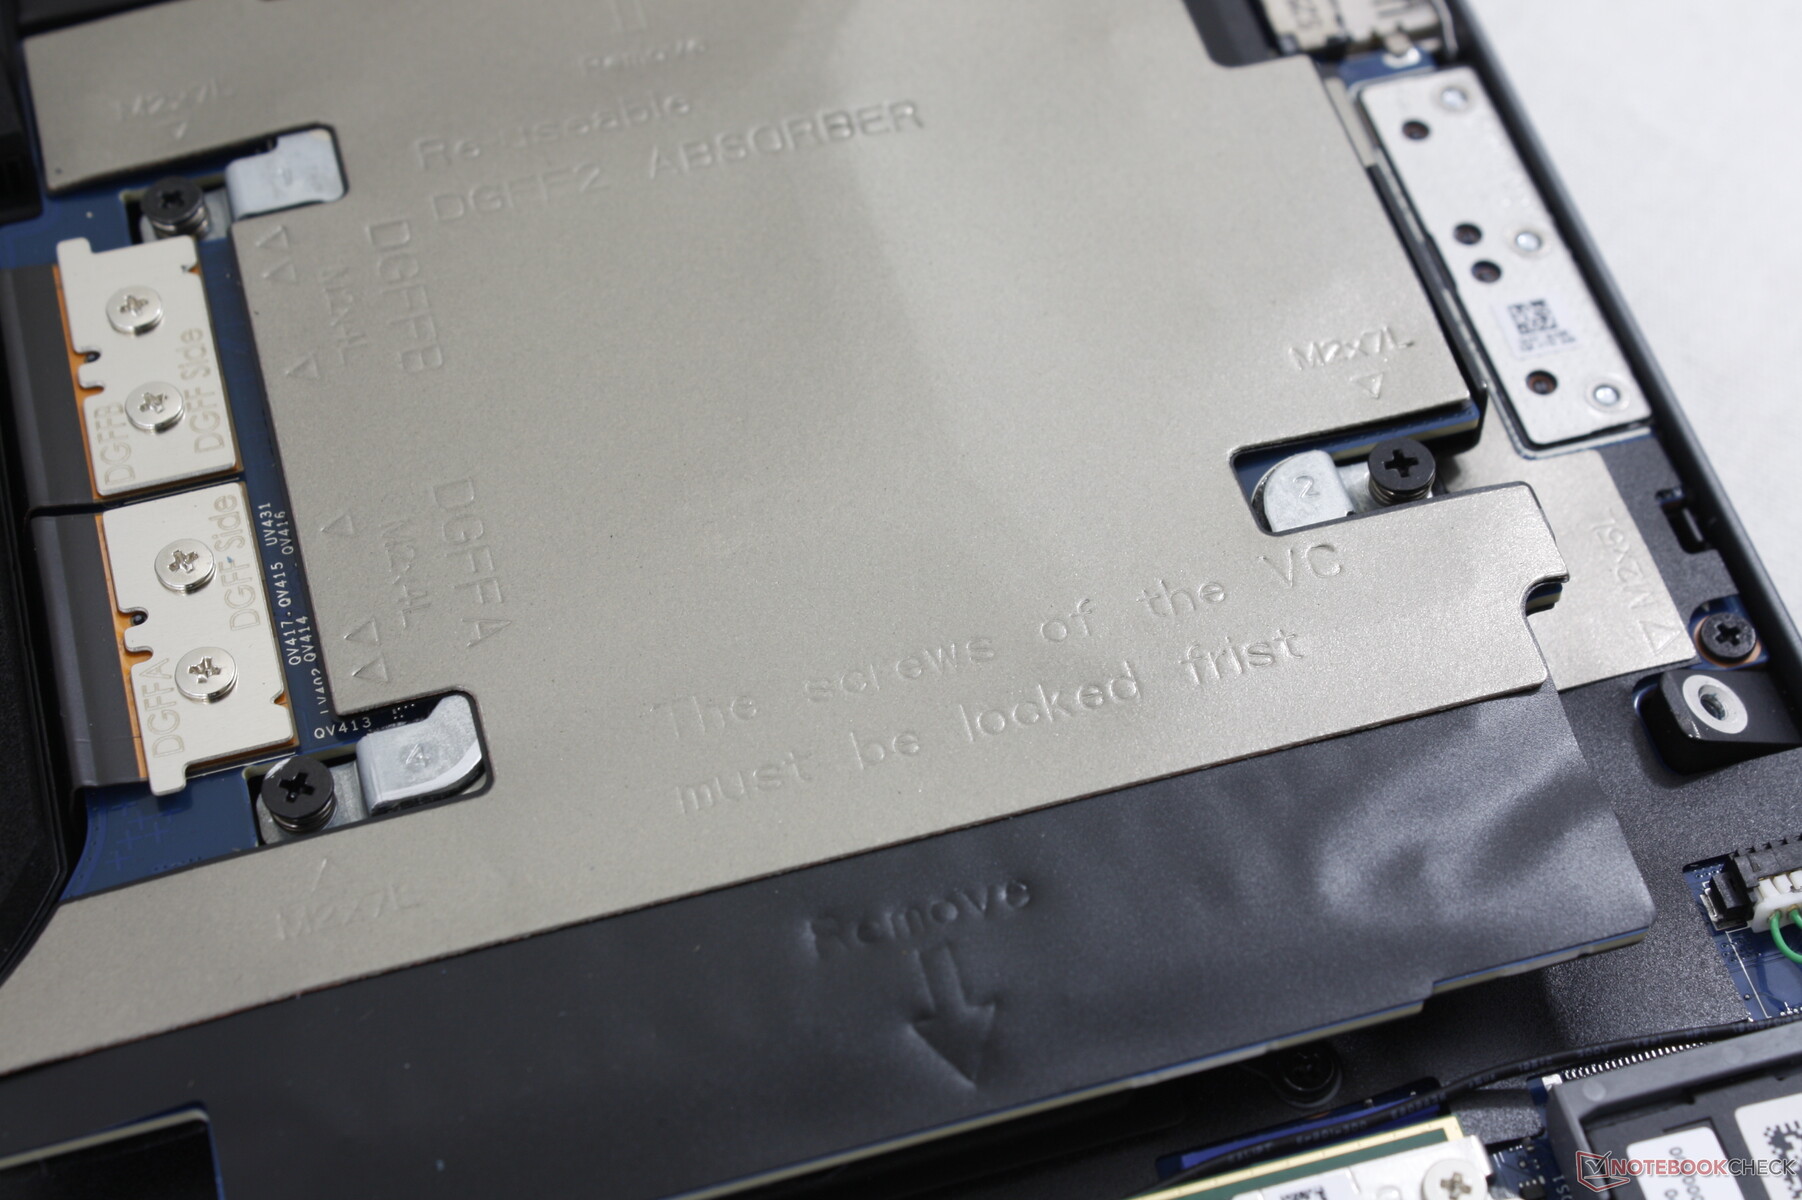
Onderhoud
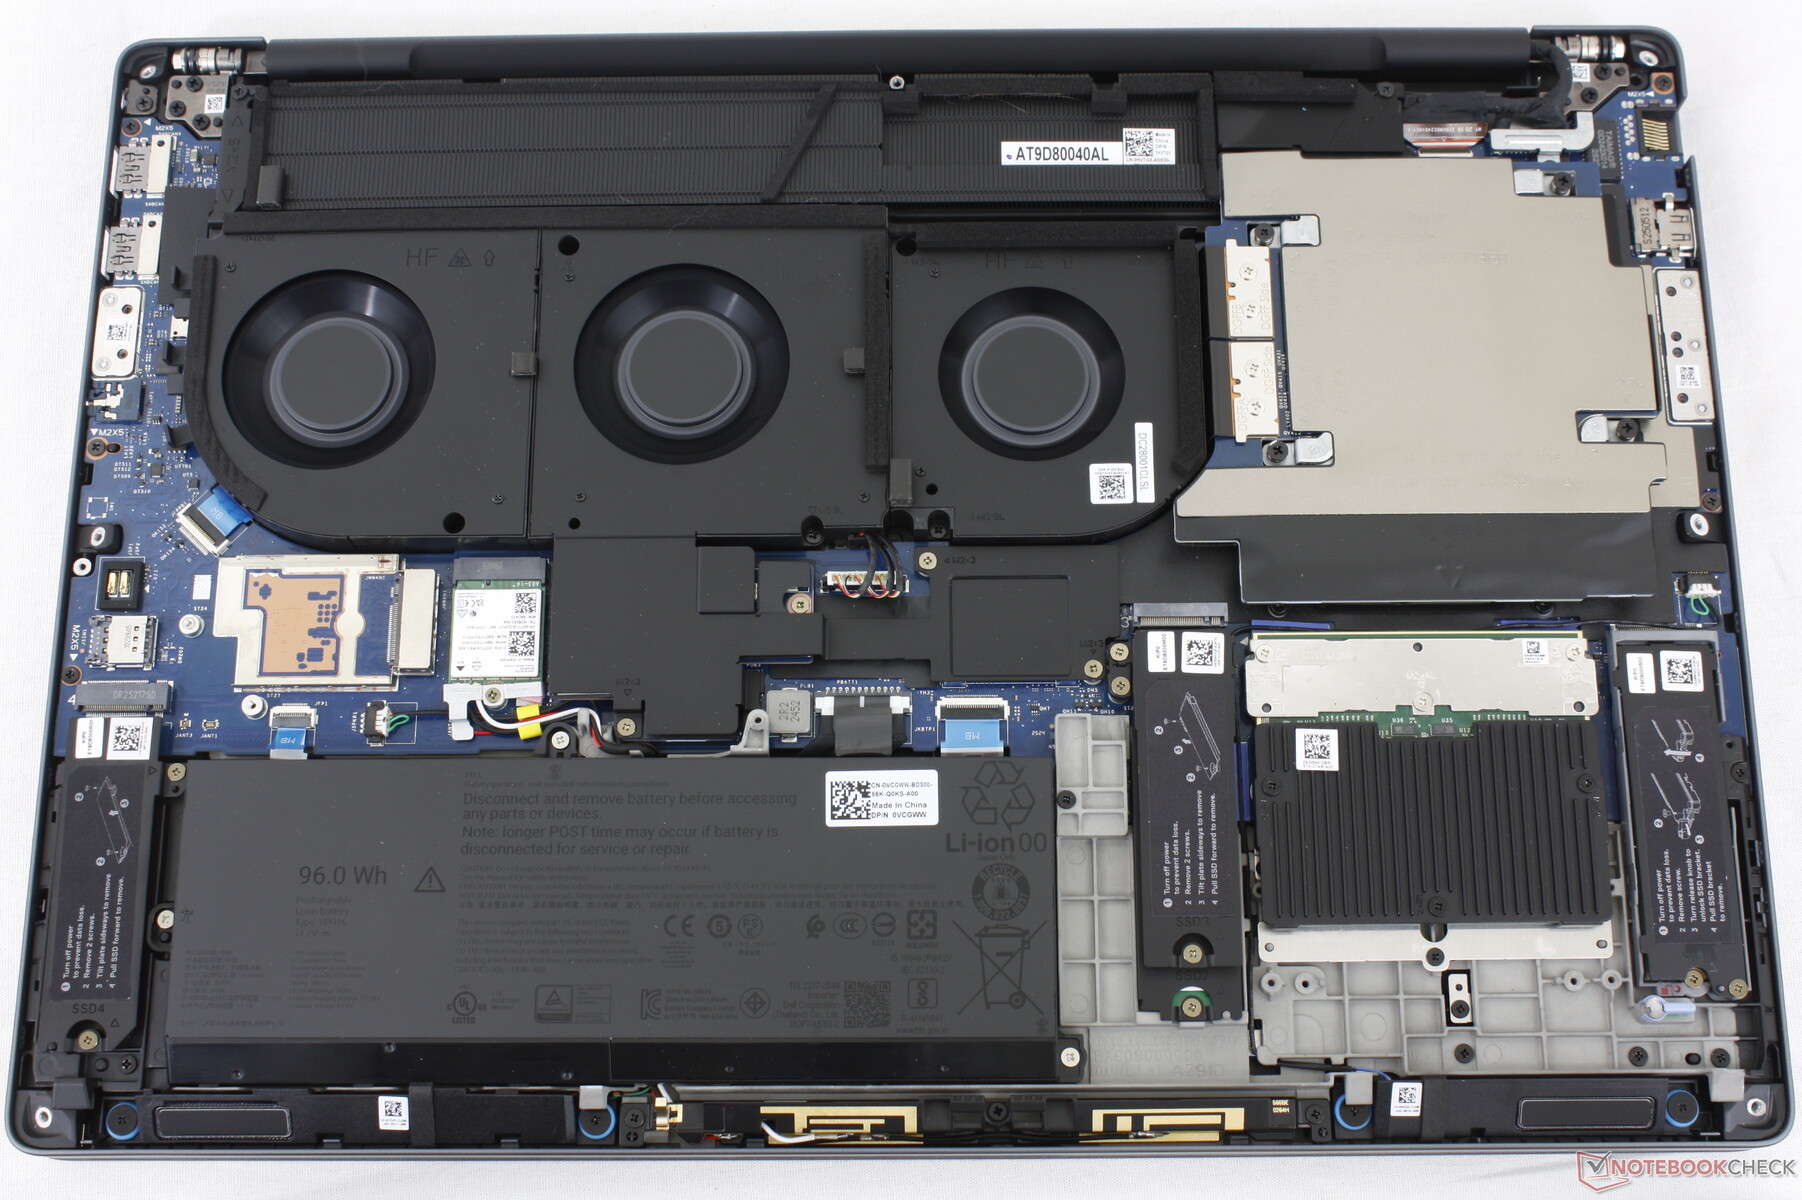
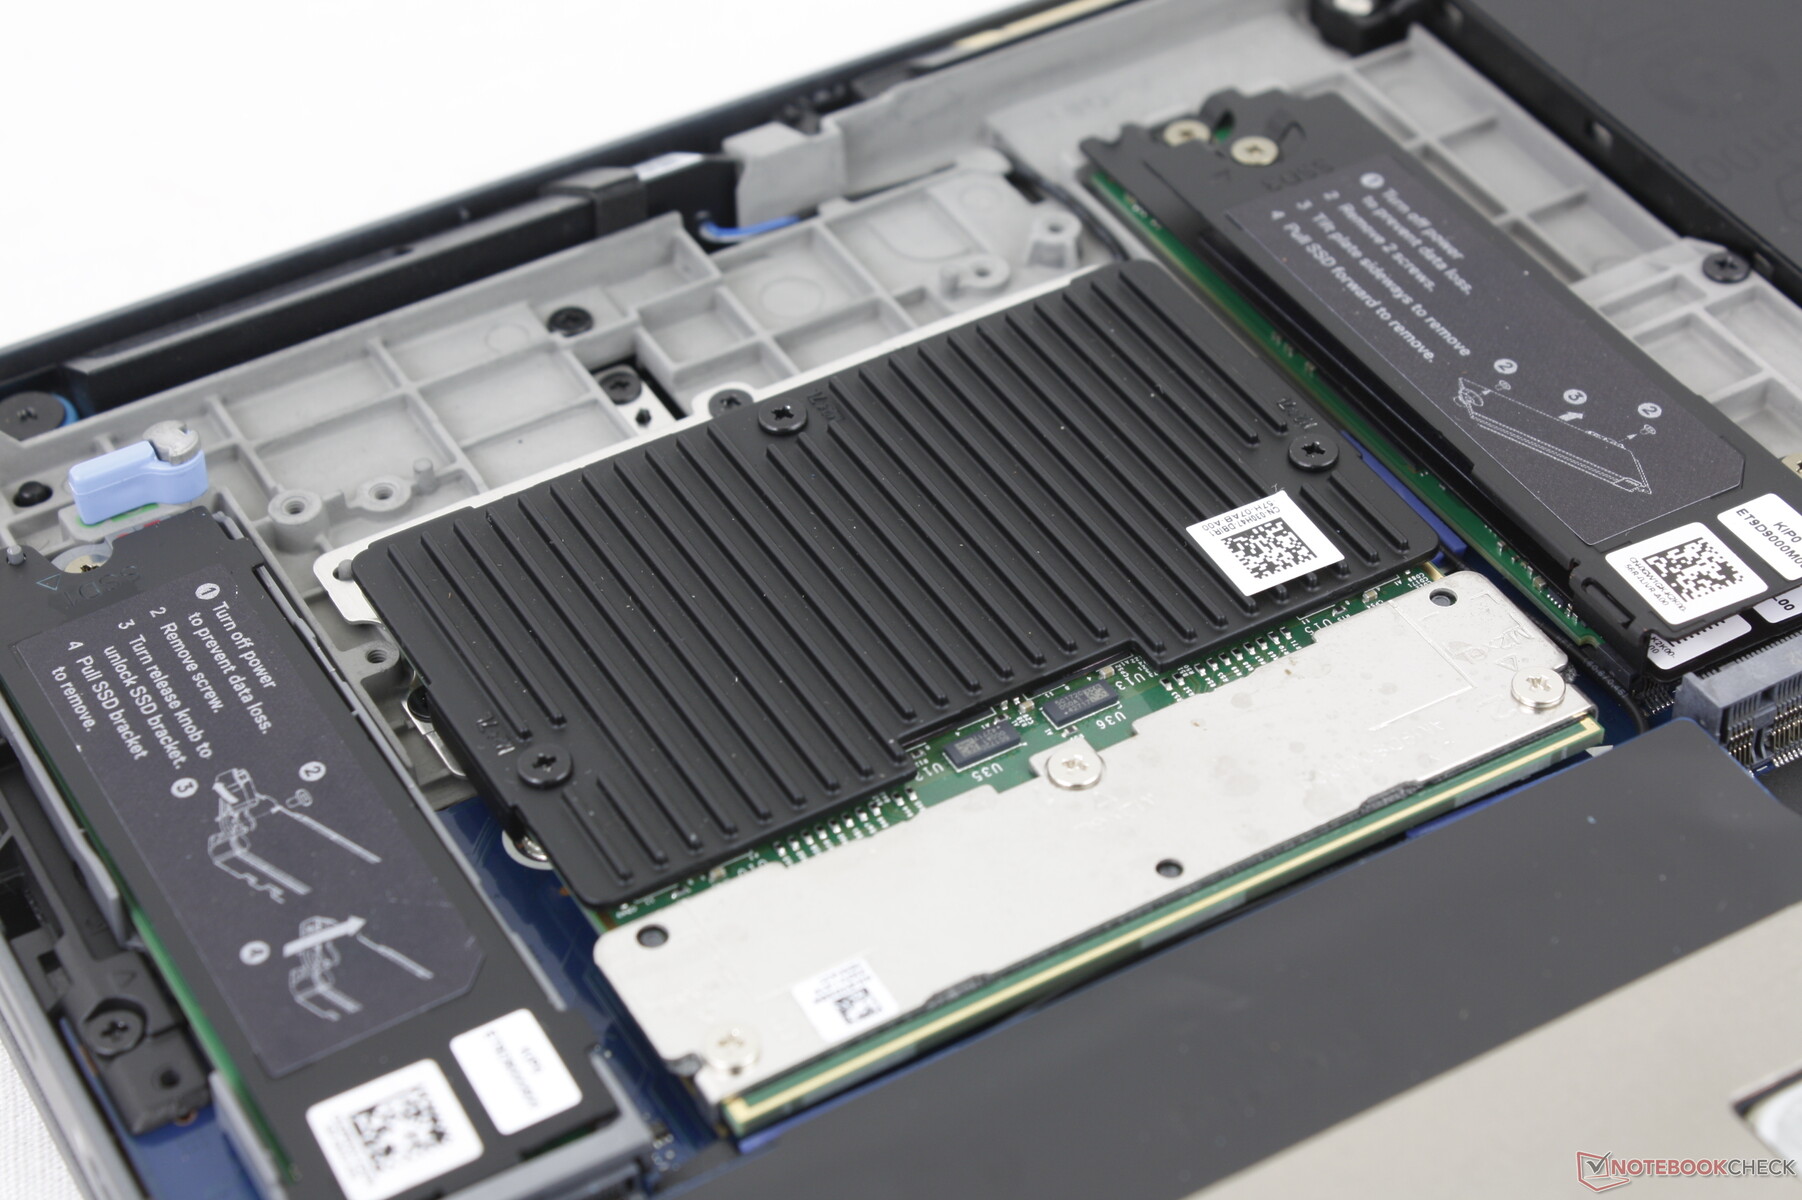
Als u het onderpaneel verwijdert, ziet u twee M.2 2280 PCIe5 x4 SSD-sleuven, de CAMM2 RAM-sleuf, een verwijderbare WLAN-module, een DGFF GPU en een WAN-sleuf. Er is een CAMM2-naar-SODIMM-adapter beschikbaar als gebruikers de voorkeur geven aan de oudere standaard.
Duurzaamheid
Er werd ongeveer 90 procent gerecycled magnesium gebruikt voor de boven- en onderkant, 30 tot 50 procent gerecycled plastic voor de palmsteunen en onderkant bumpers, en 50 procent gerecycled kobalt voor de batterij. De verpakking is volledig van papier en recyclebaar.
Accessoires en garantie
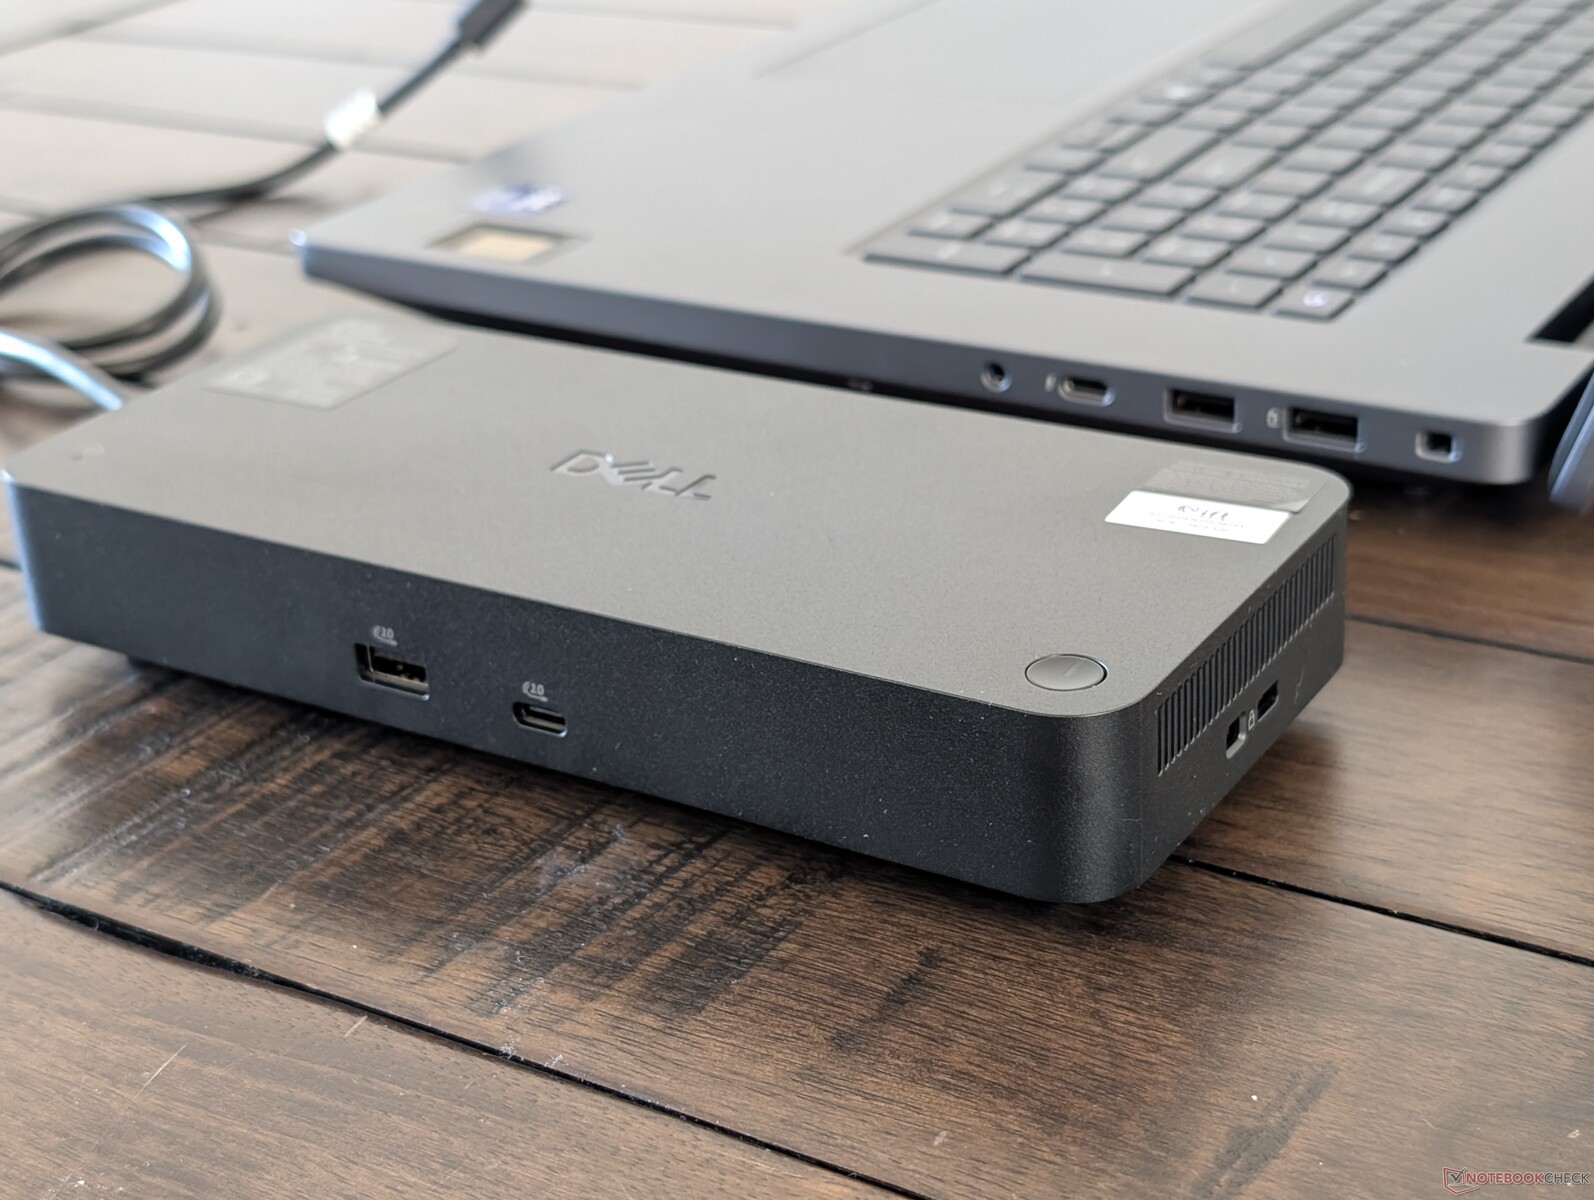
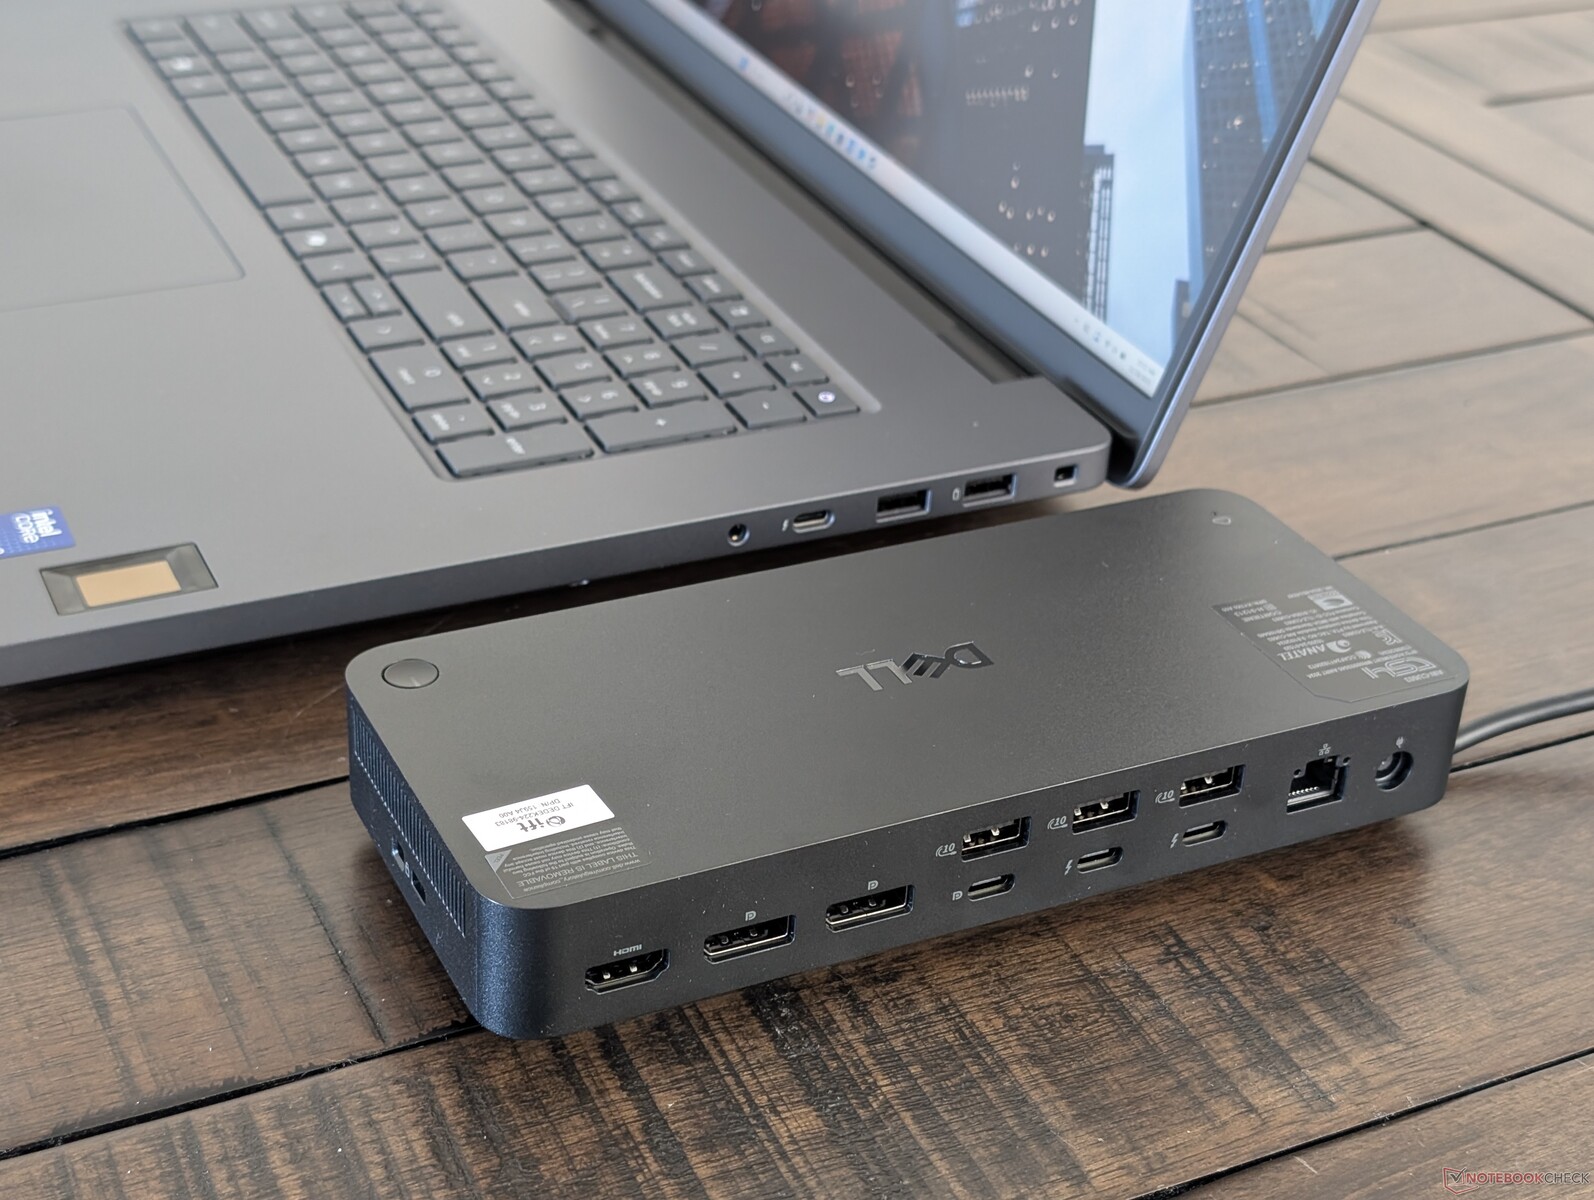
Optionele extra's zijn onder andere de Dell Pro Thunderbolt 5 Smart Dock zoals hieronder afgebeeld. Het dockingstation is een oplossing met één kabel en biedt zowel stroomdoorvoer (tot 300 W) als extra poorten voor de laptop. Het wordt echter geleverd met een eigen AC-adapter, die net zo groot is als het dockingstation zelf.
Een beperkte fabrieksgarantie van drie jaar is standaard voor de laptop en het optionele dockingstation.
Invoerapparaten
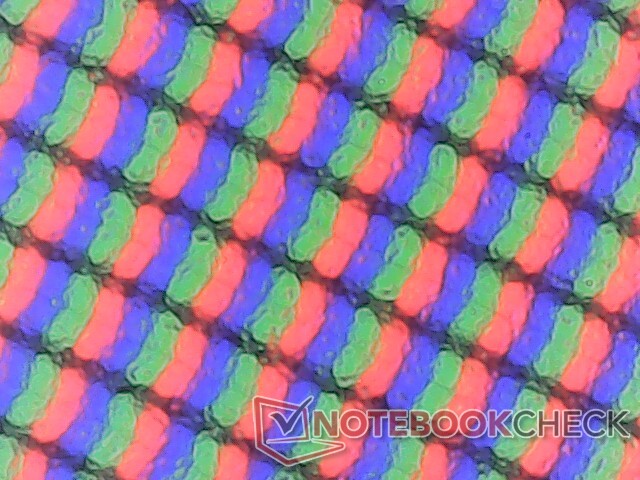
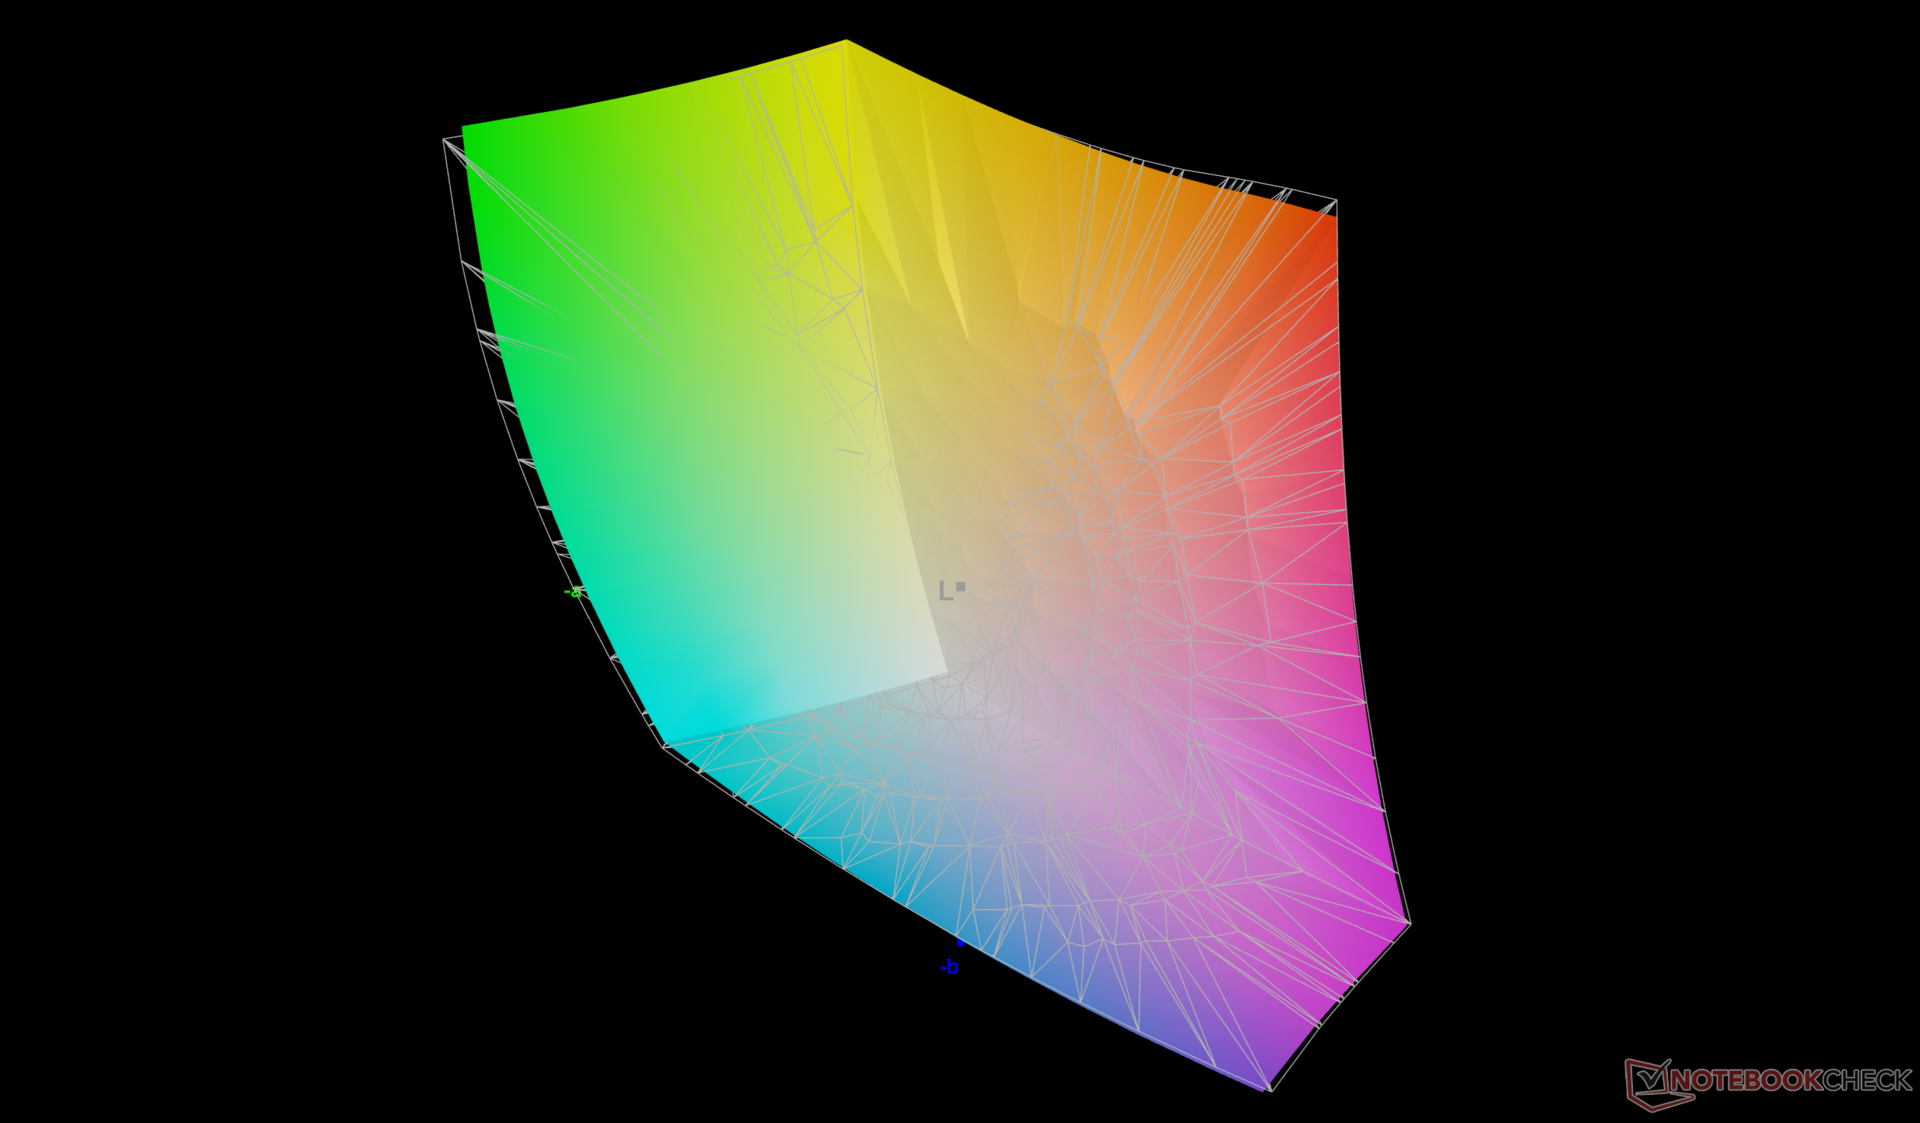
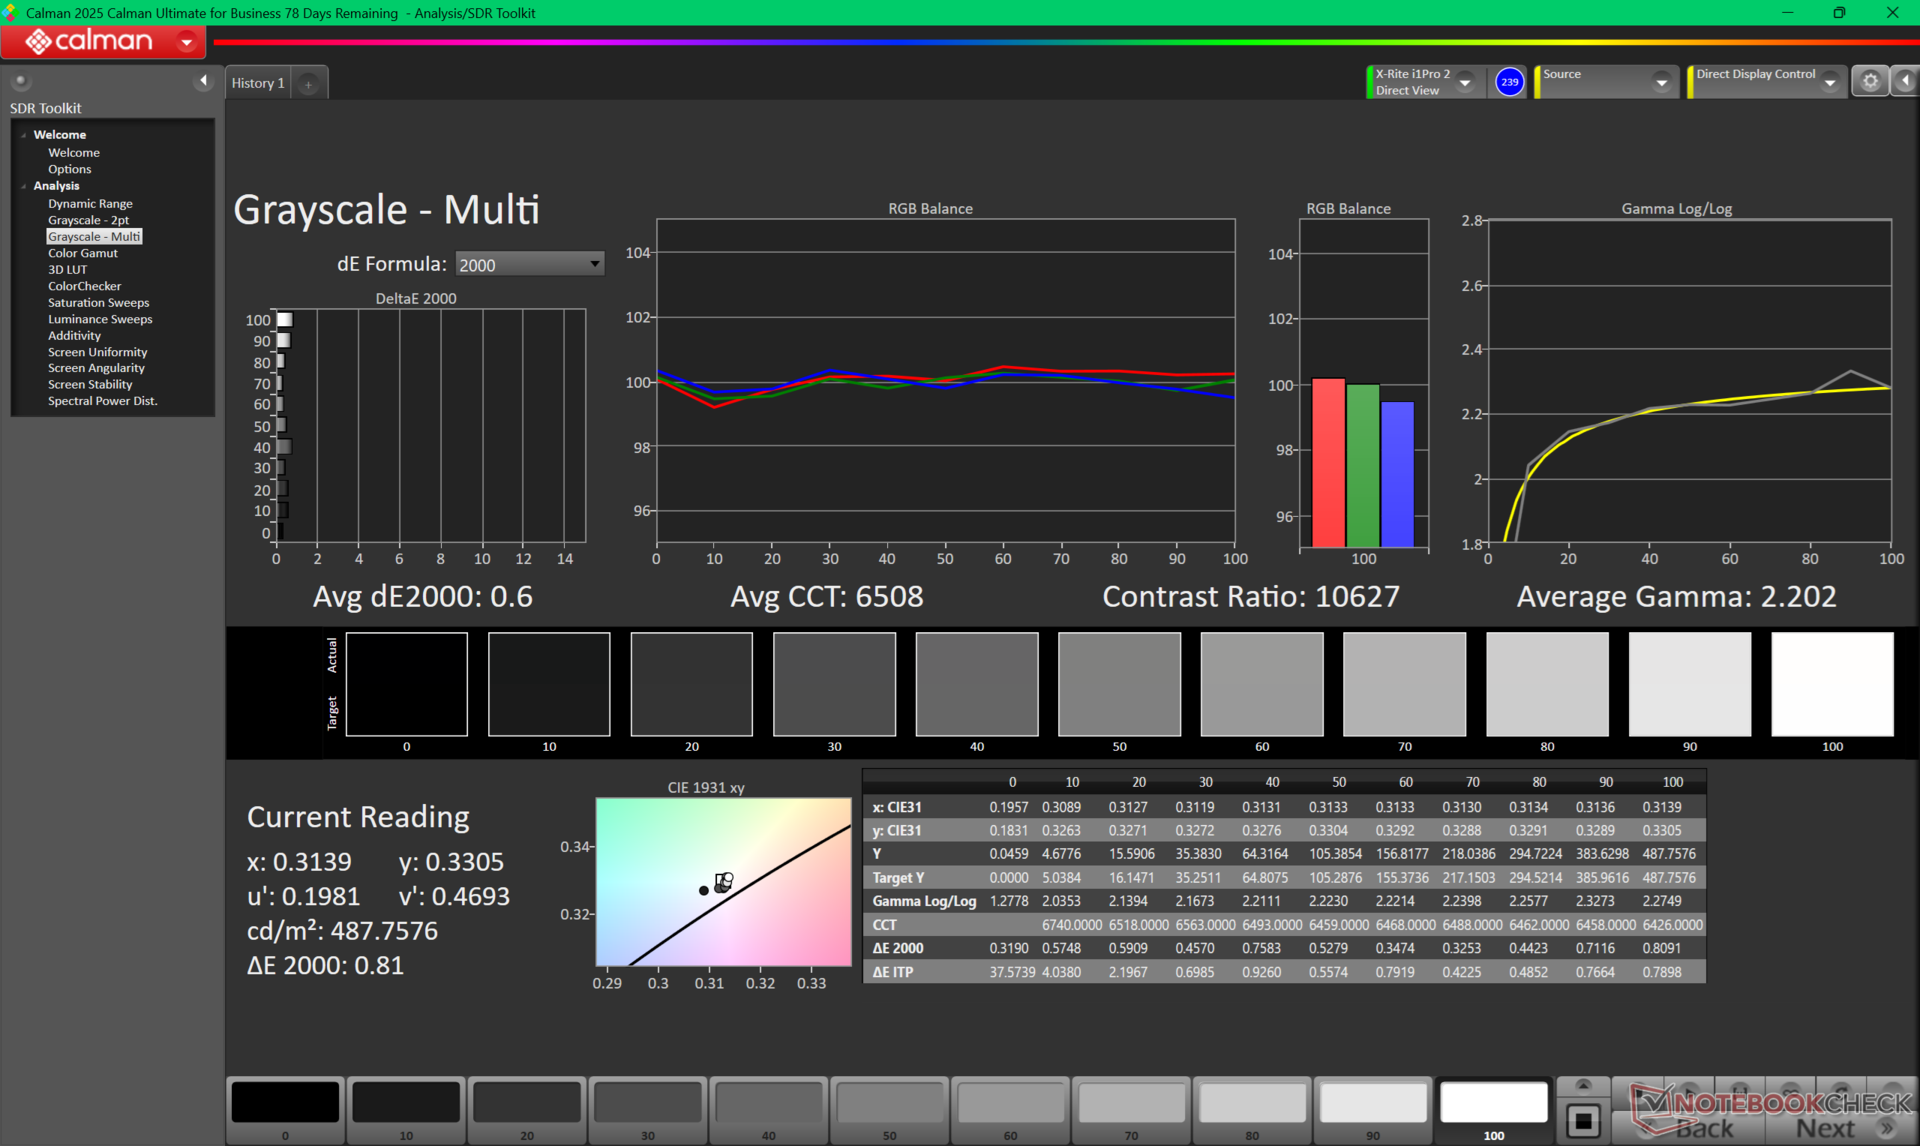
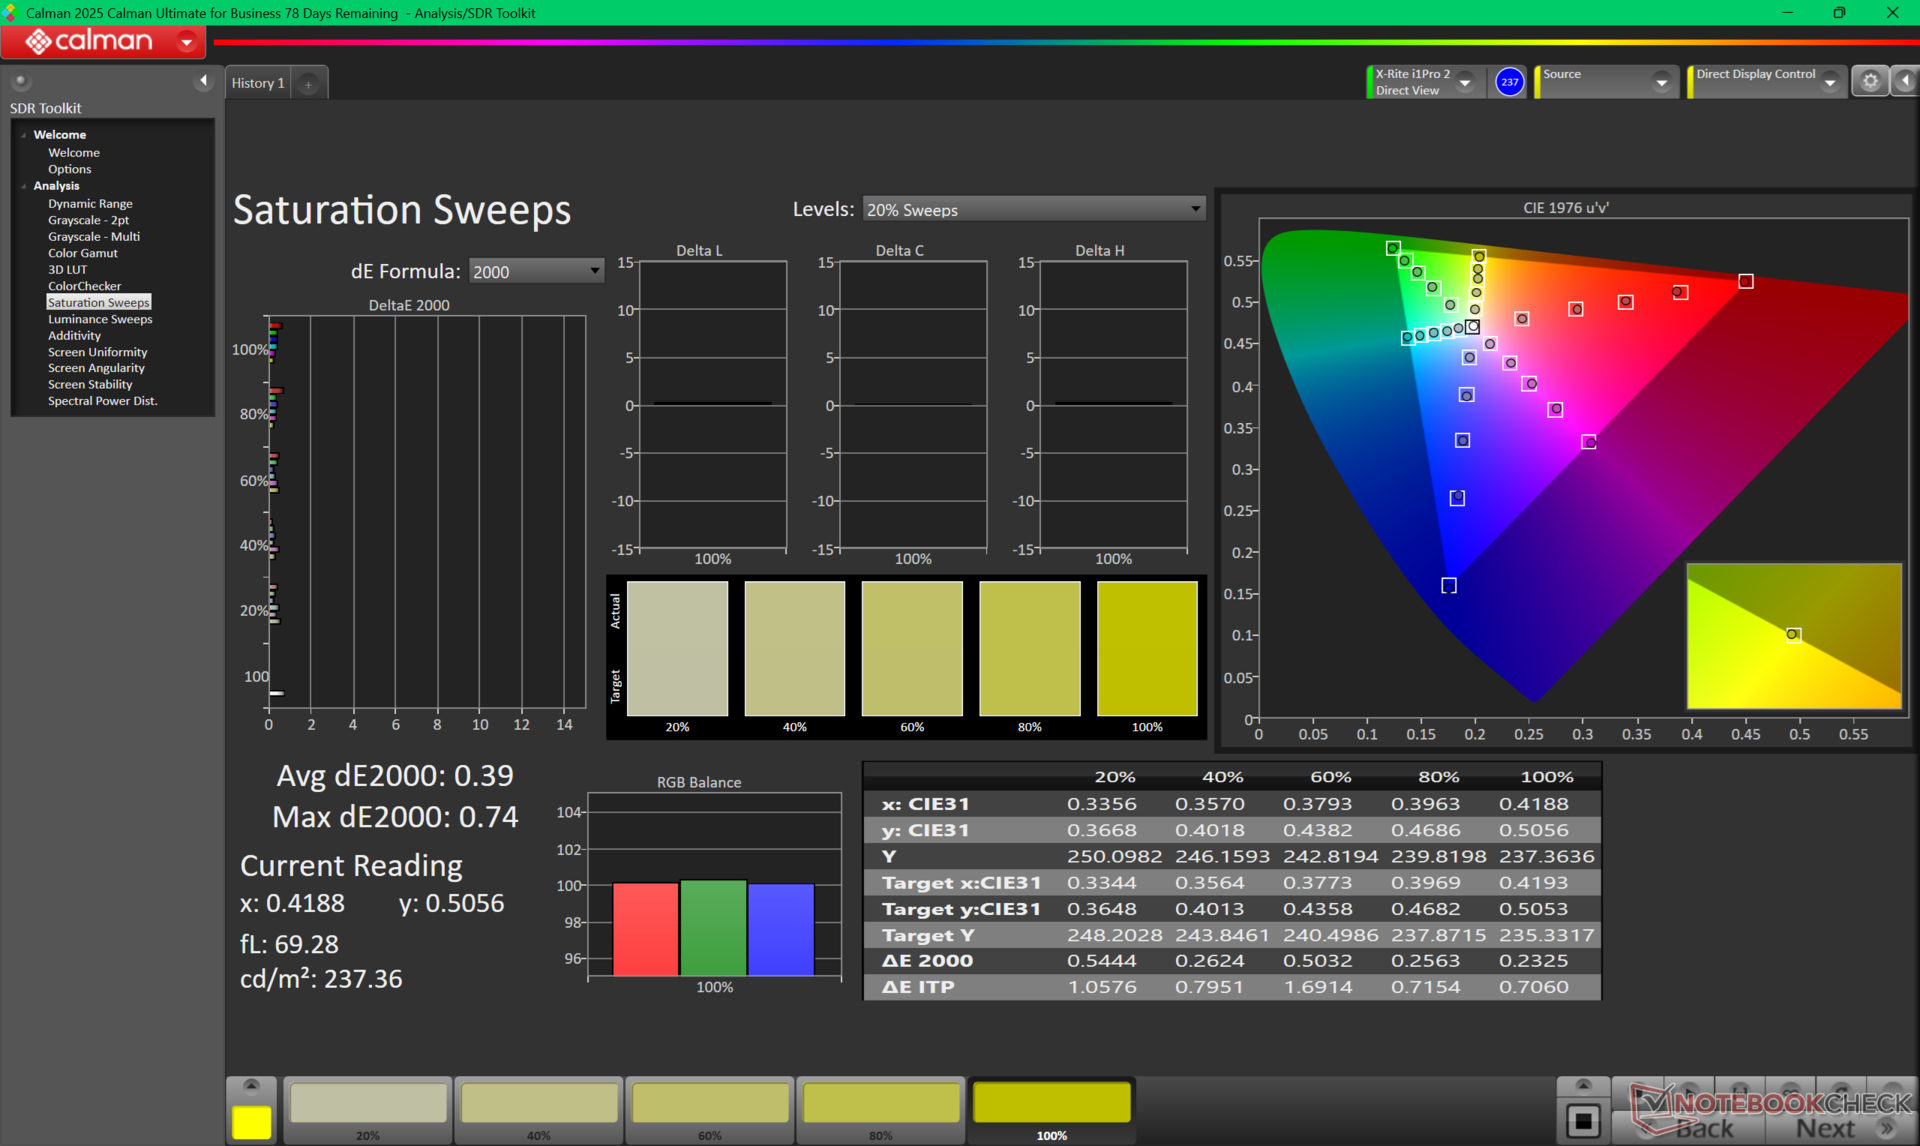
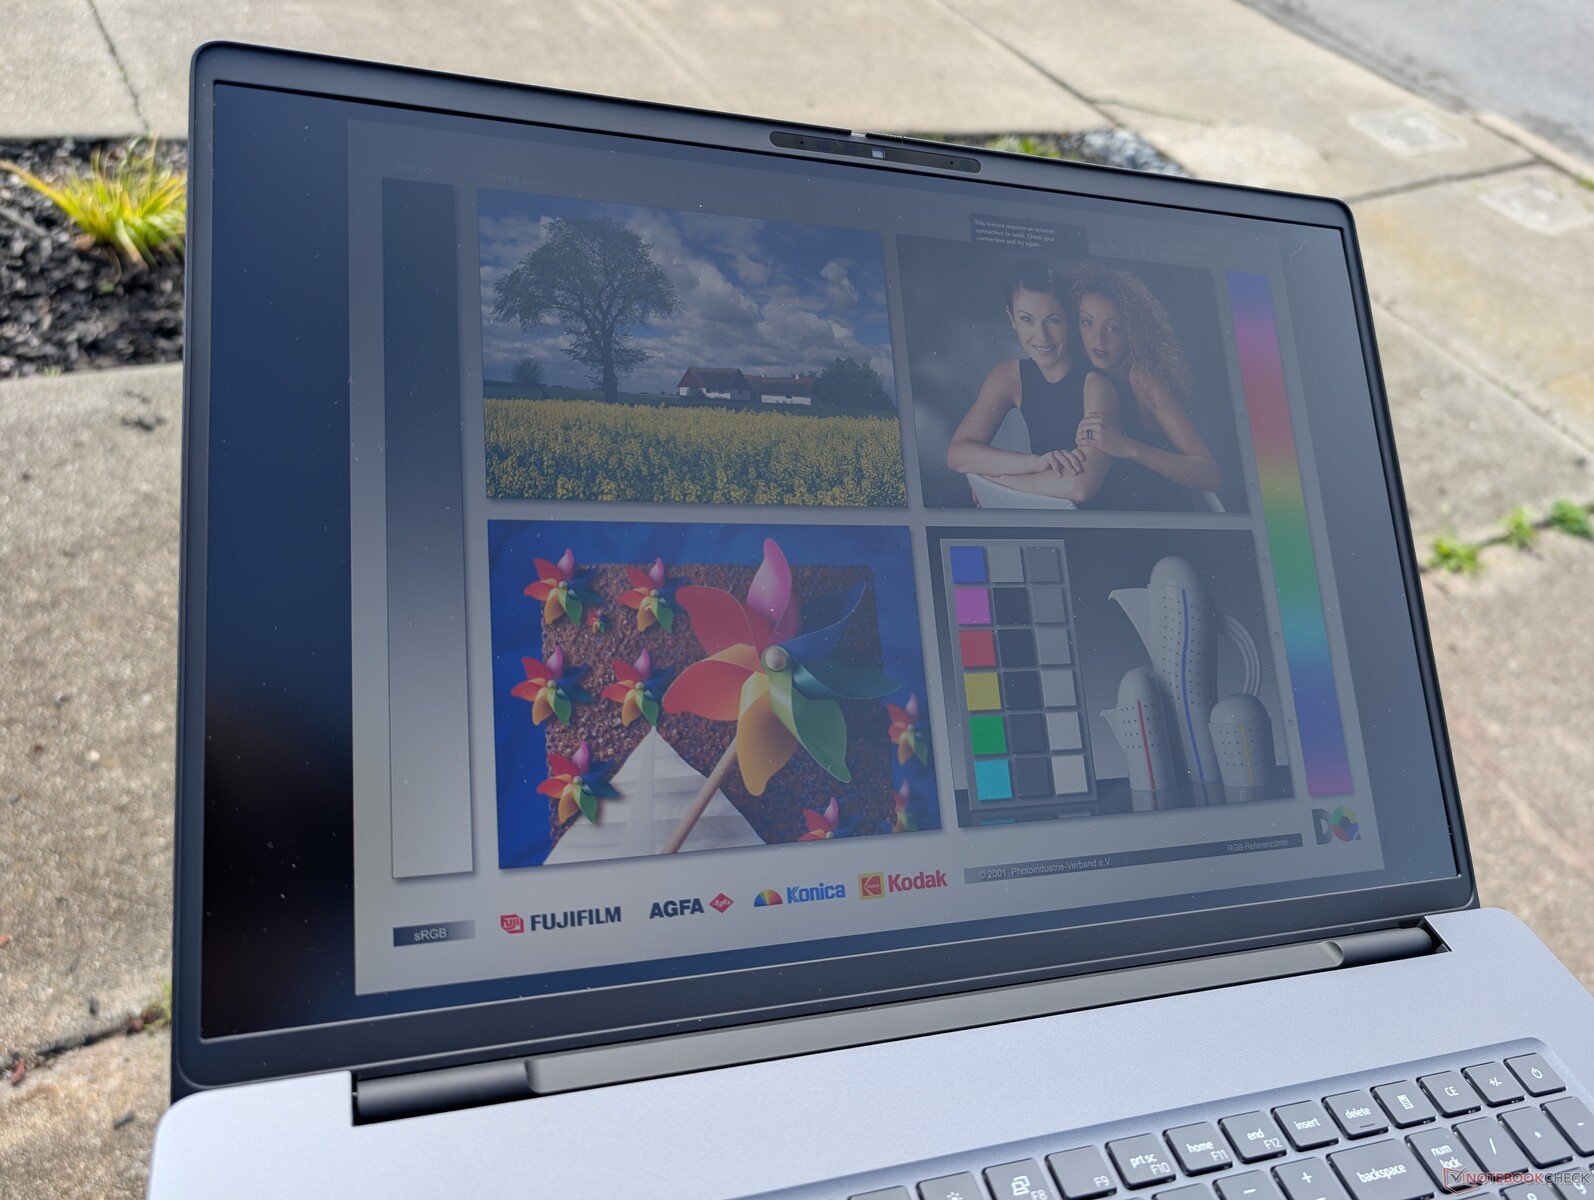
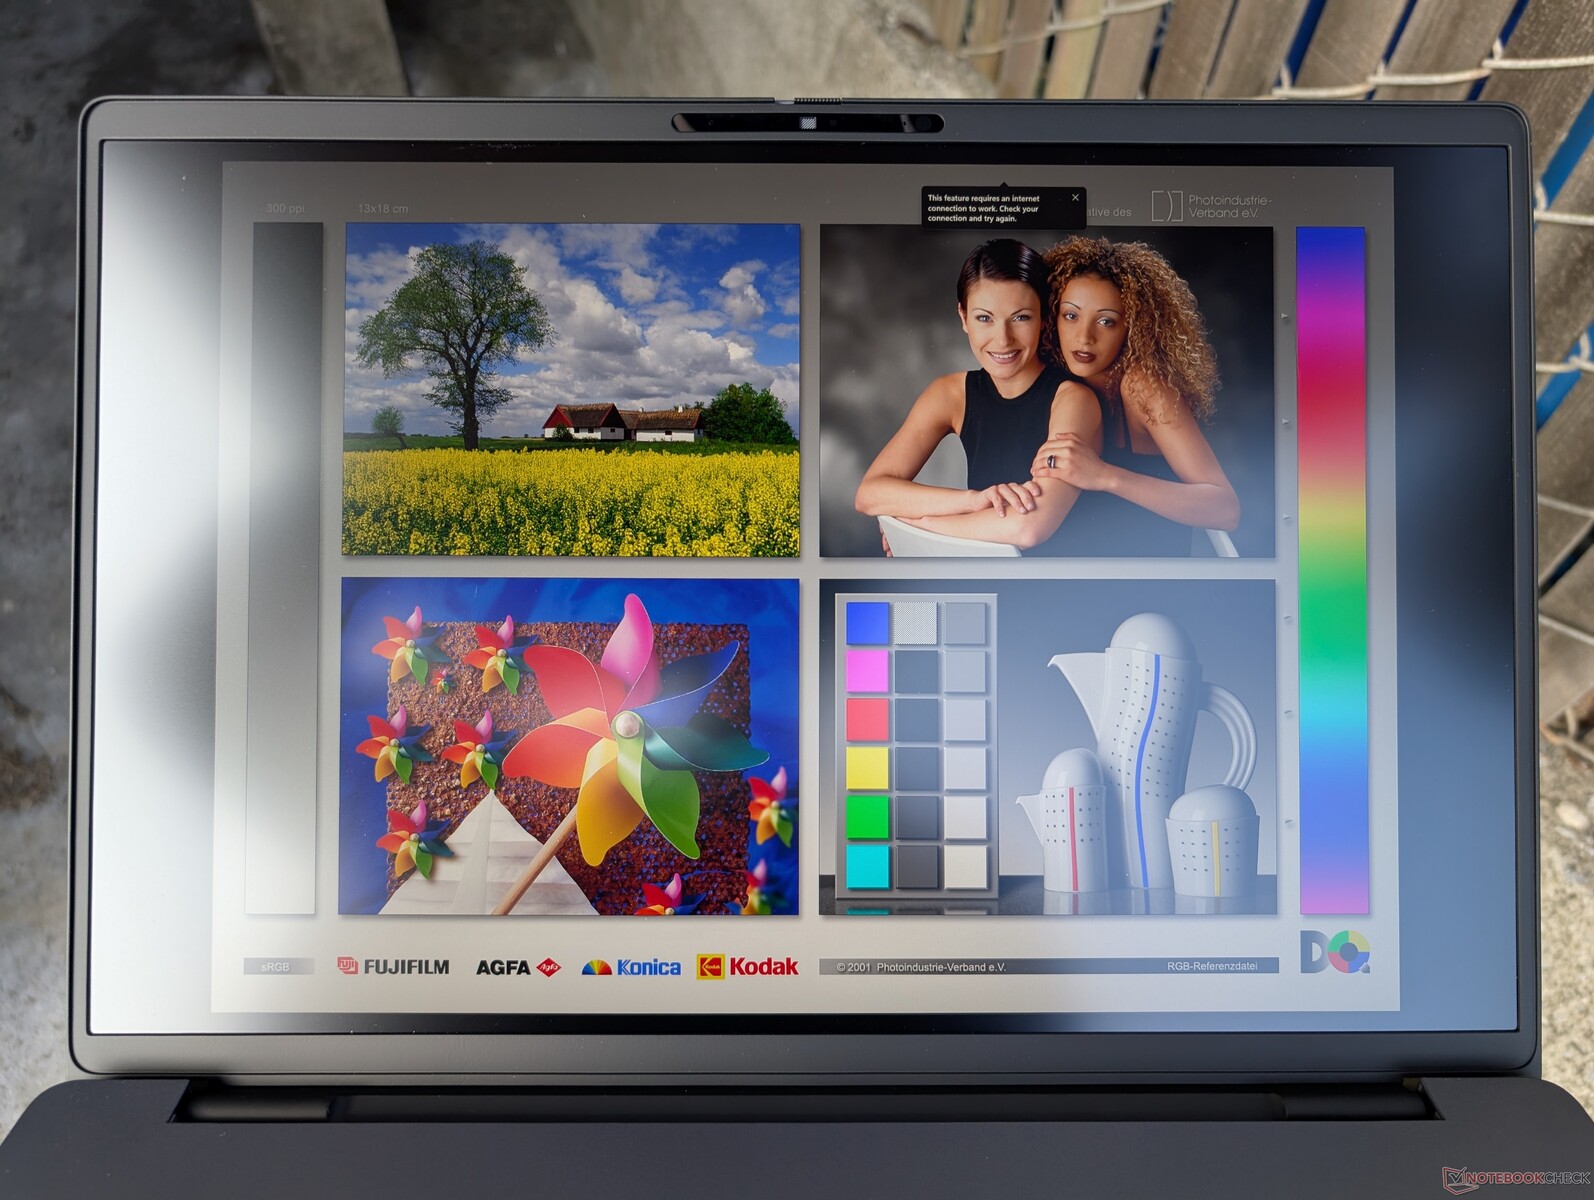
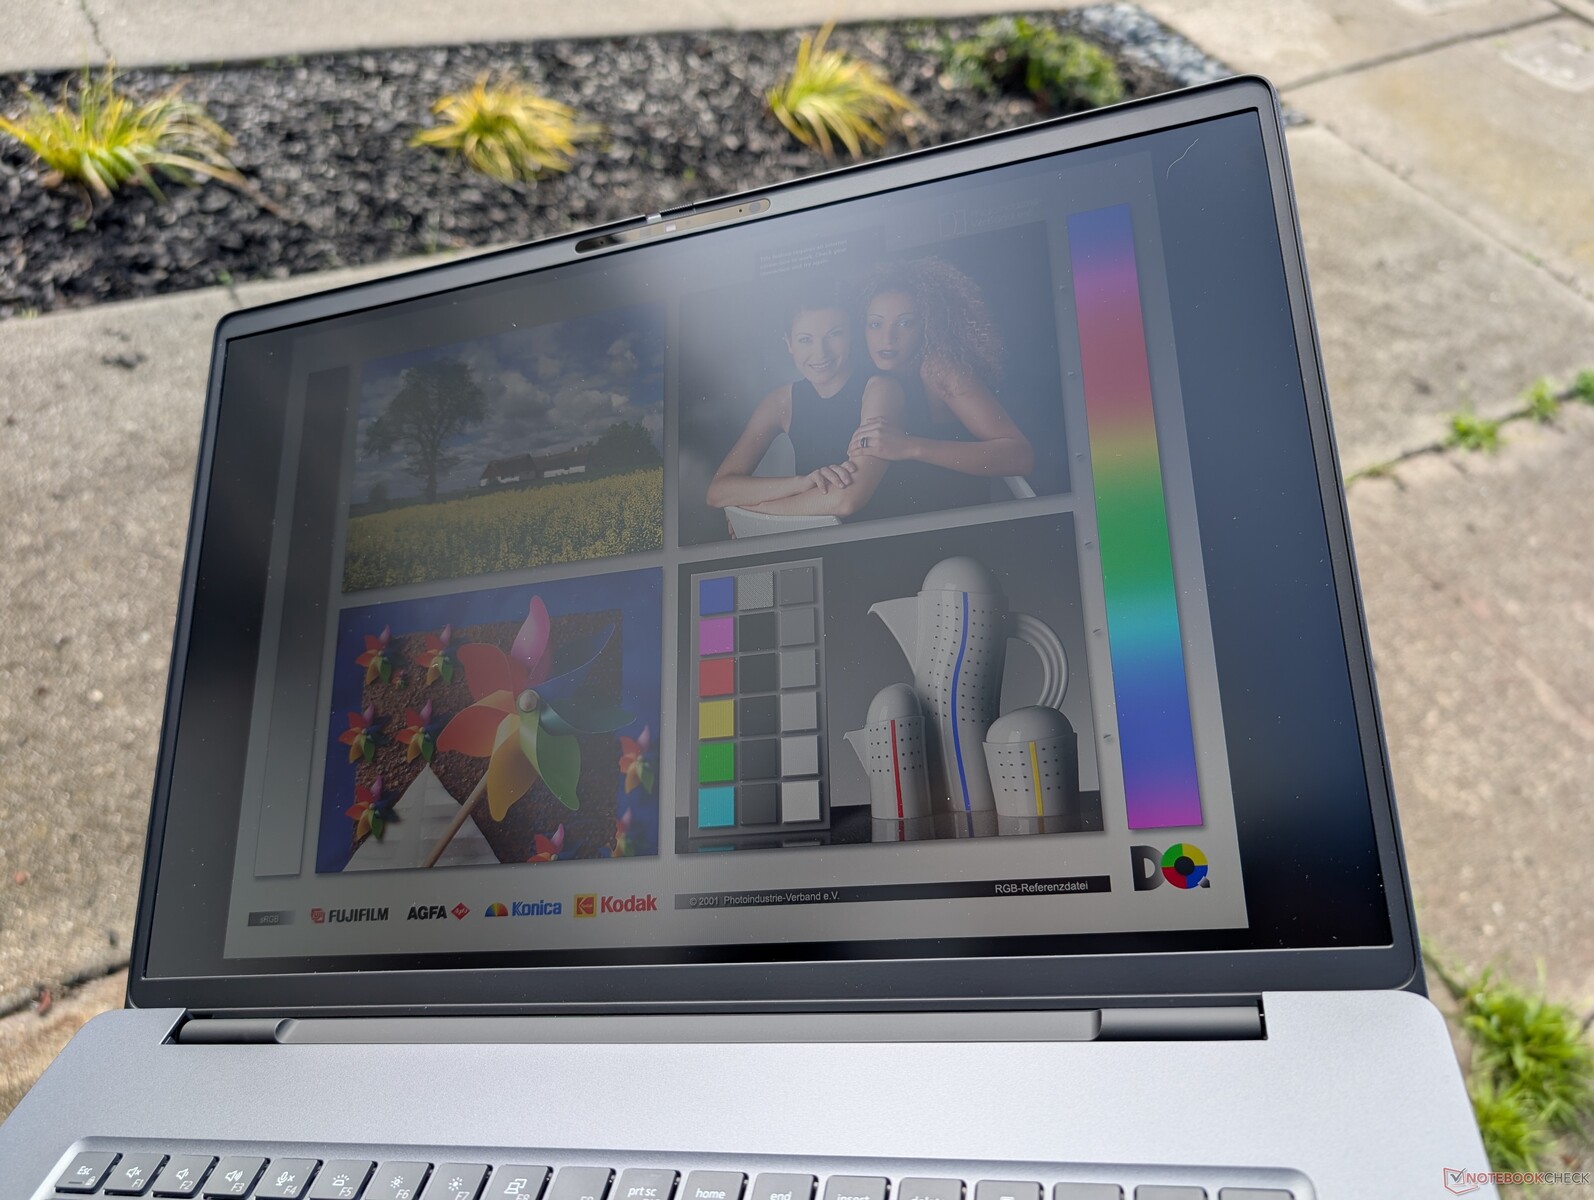
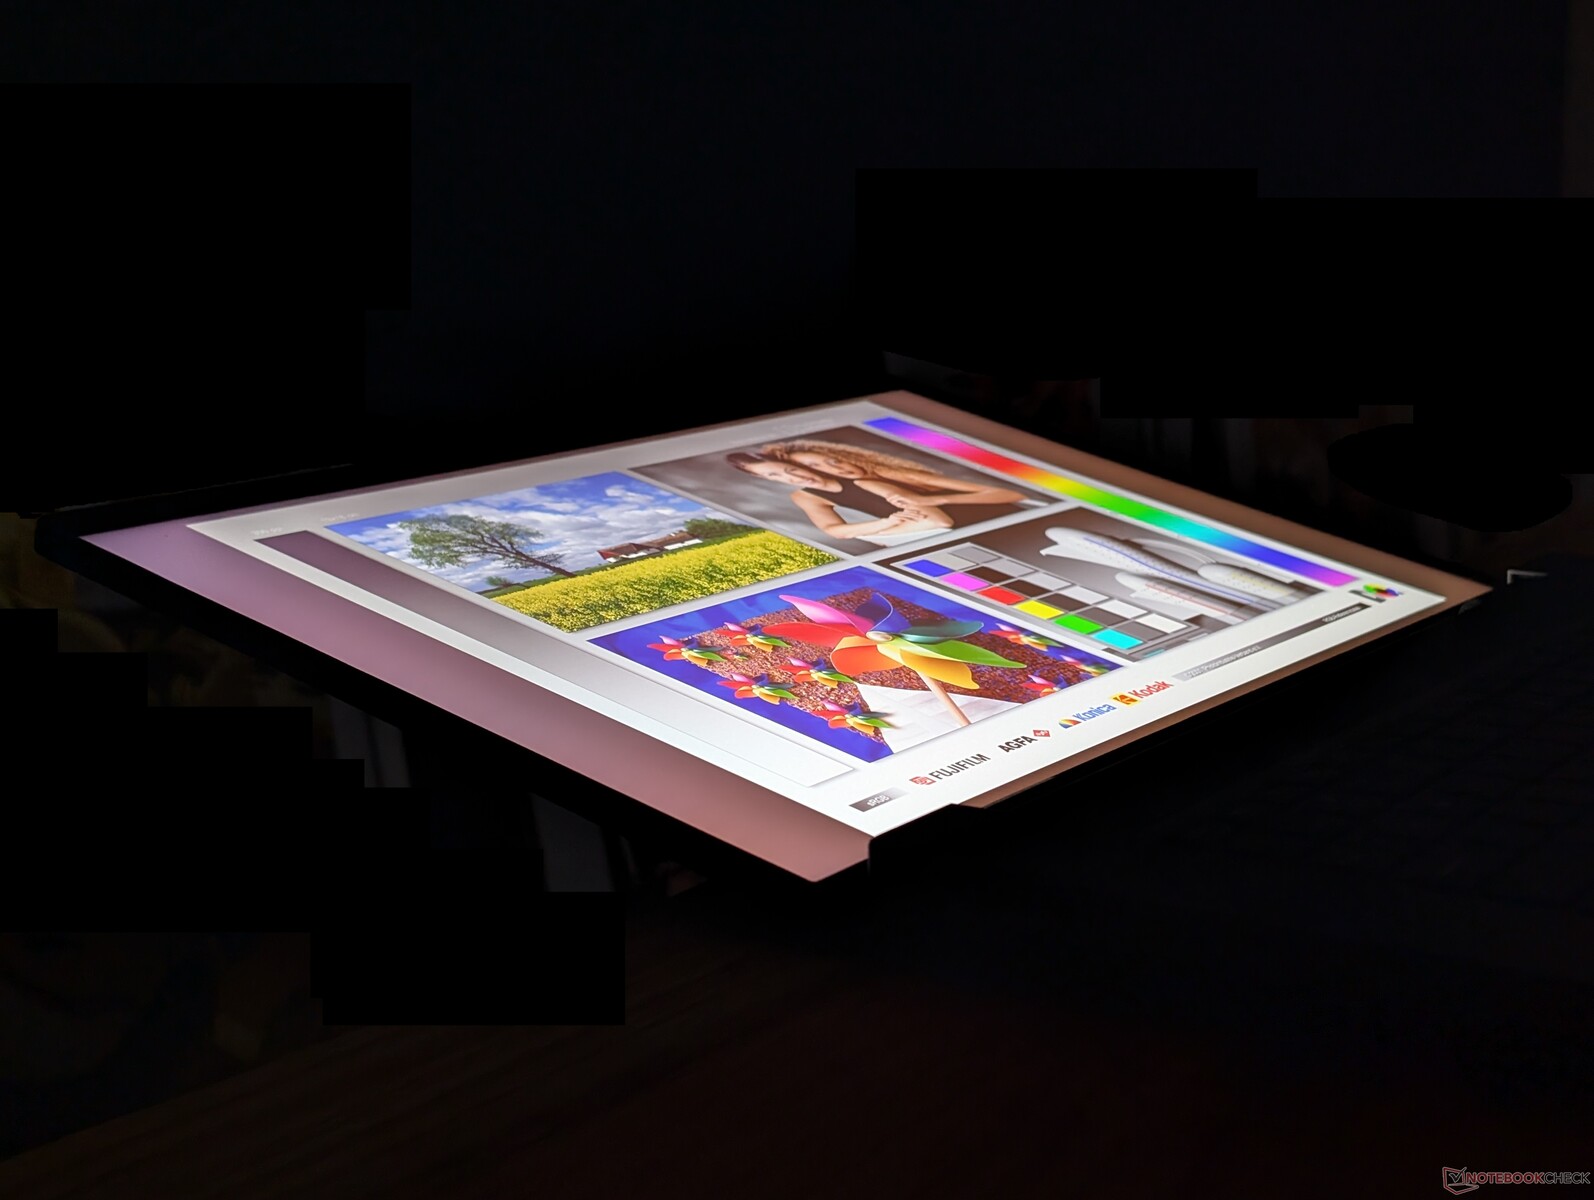
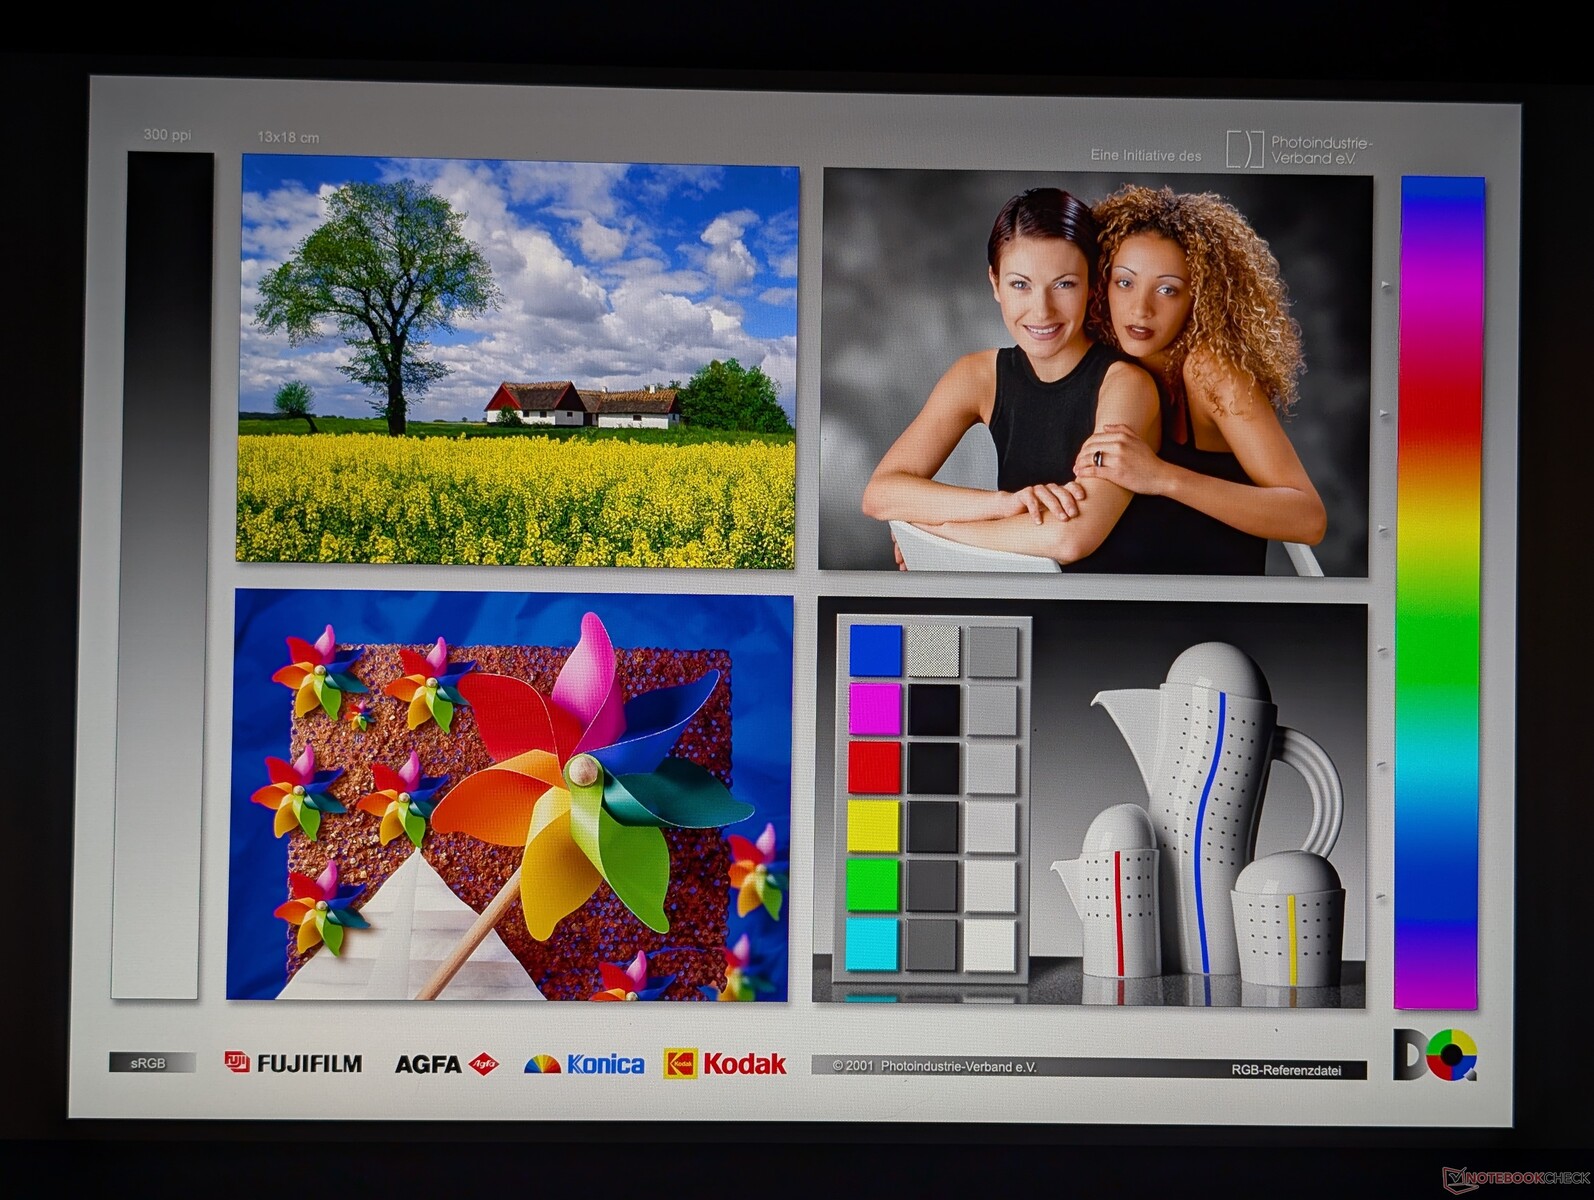
Beeldscherm - P3 kleuren en 120 Hz met IPS
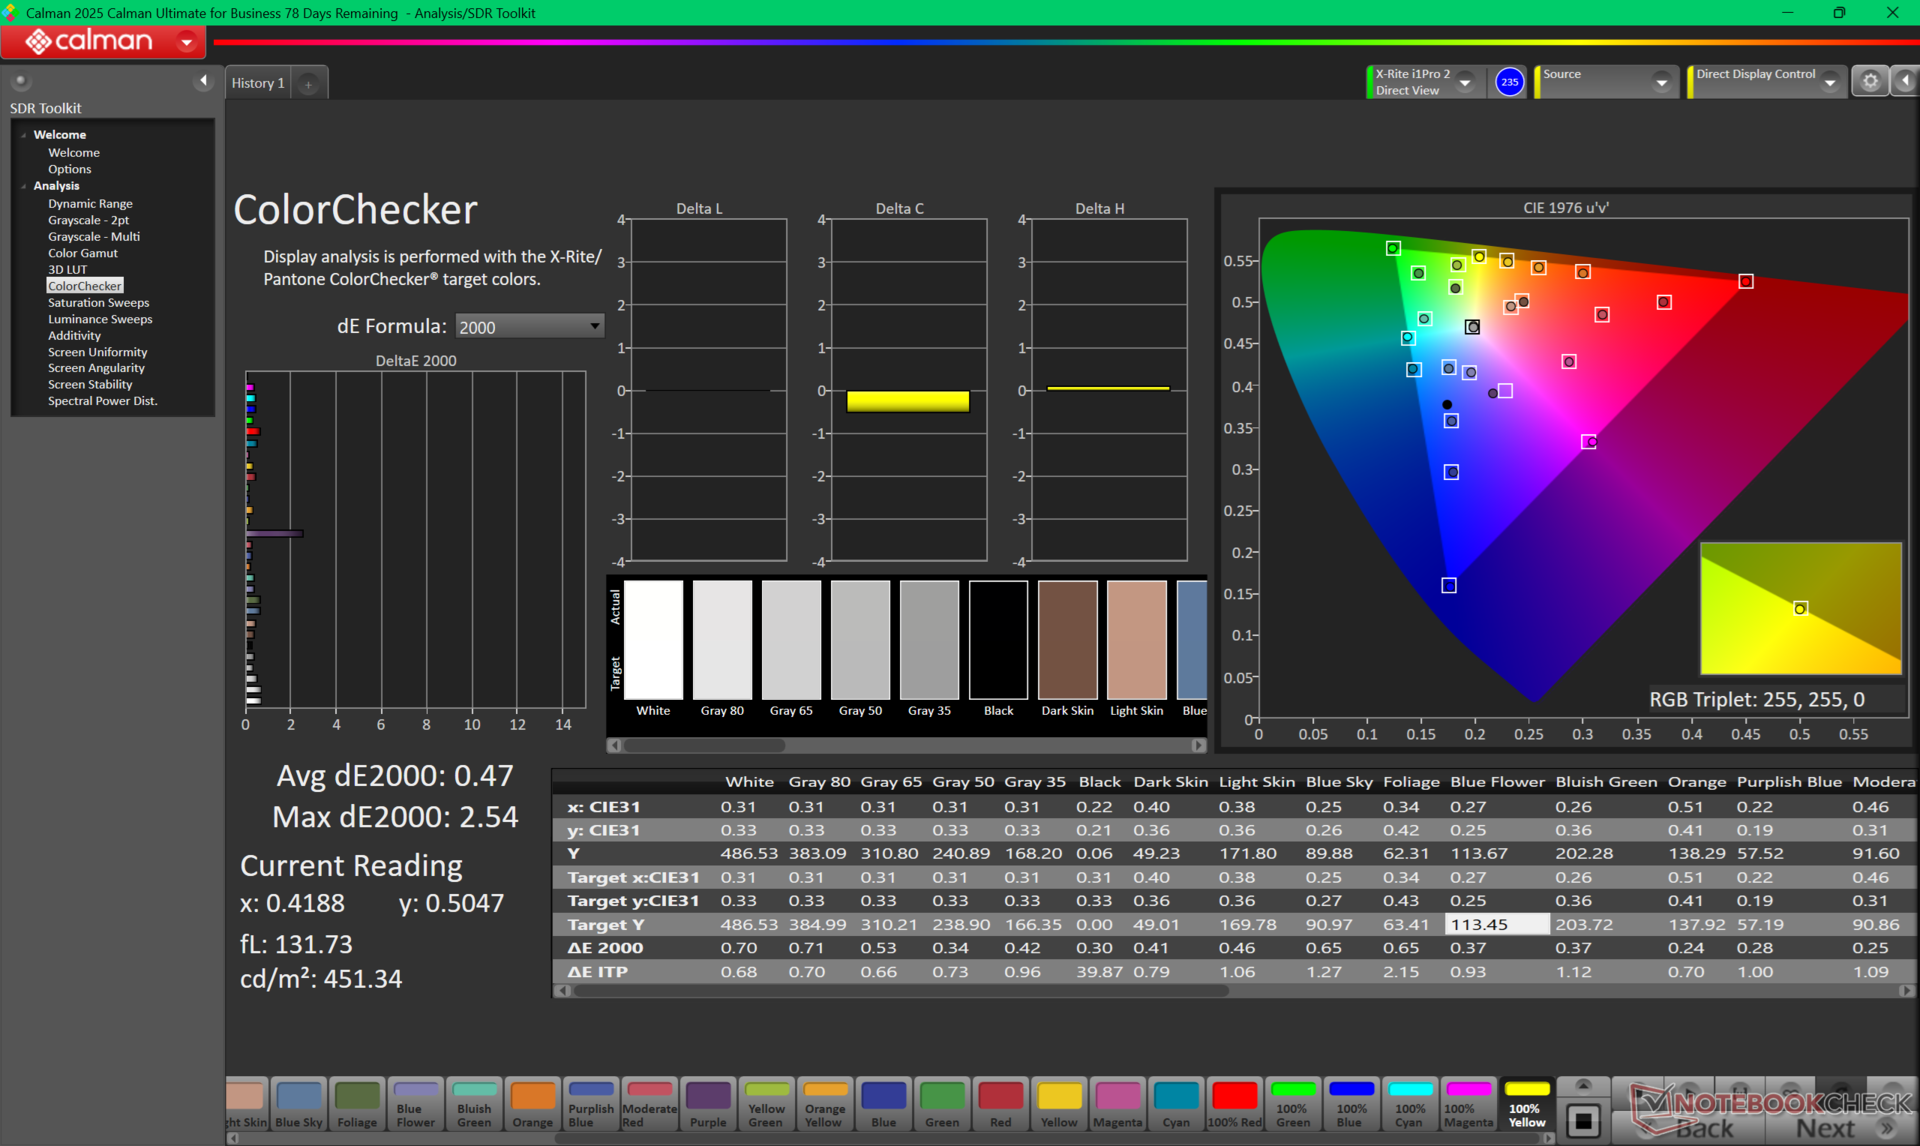
Dell biedt op dit moment slechts één paneeloptie voor alle configuraties, terwijl andere 18-inch laptops zoals de Schenker Key 18 Pro mogelijk 4K-opties met een hogere resolutie bieden. Het beeldscherm is verder uitstekend en een van de beste IPS-schermen die we op een 18-inch laptop hebben gezien wat betreft kleurdekking, contrastverhouding en helderheid. Desondanks kunnen functies zoals HDR-ondersteuning en responstijden niet tippen aan de huidige OLED-producten.
| |||||||||||||||||||||||||
Helderheidsverdeling: 91 %
Helderheid in Batterij-modus: 528.8 cd/m²
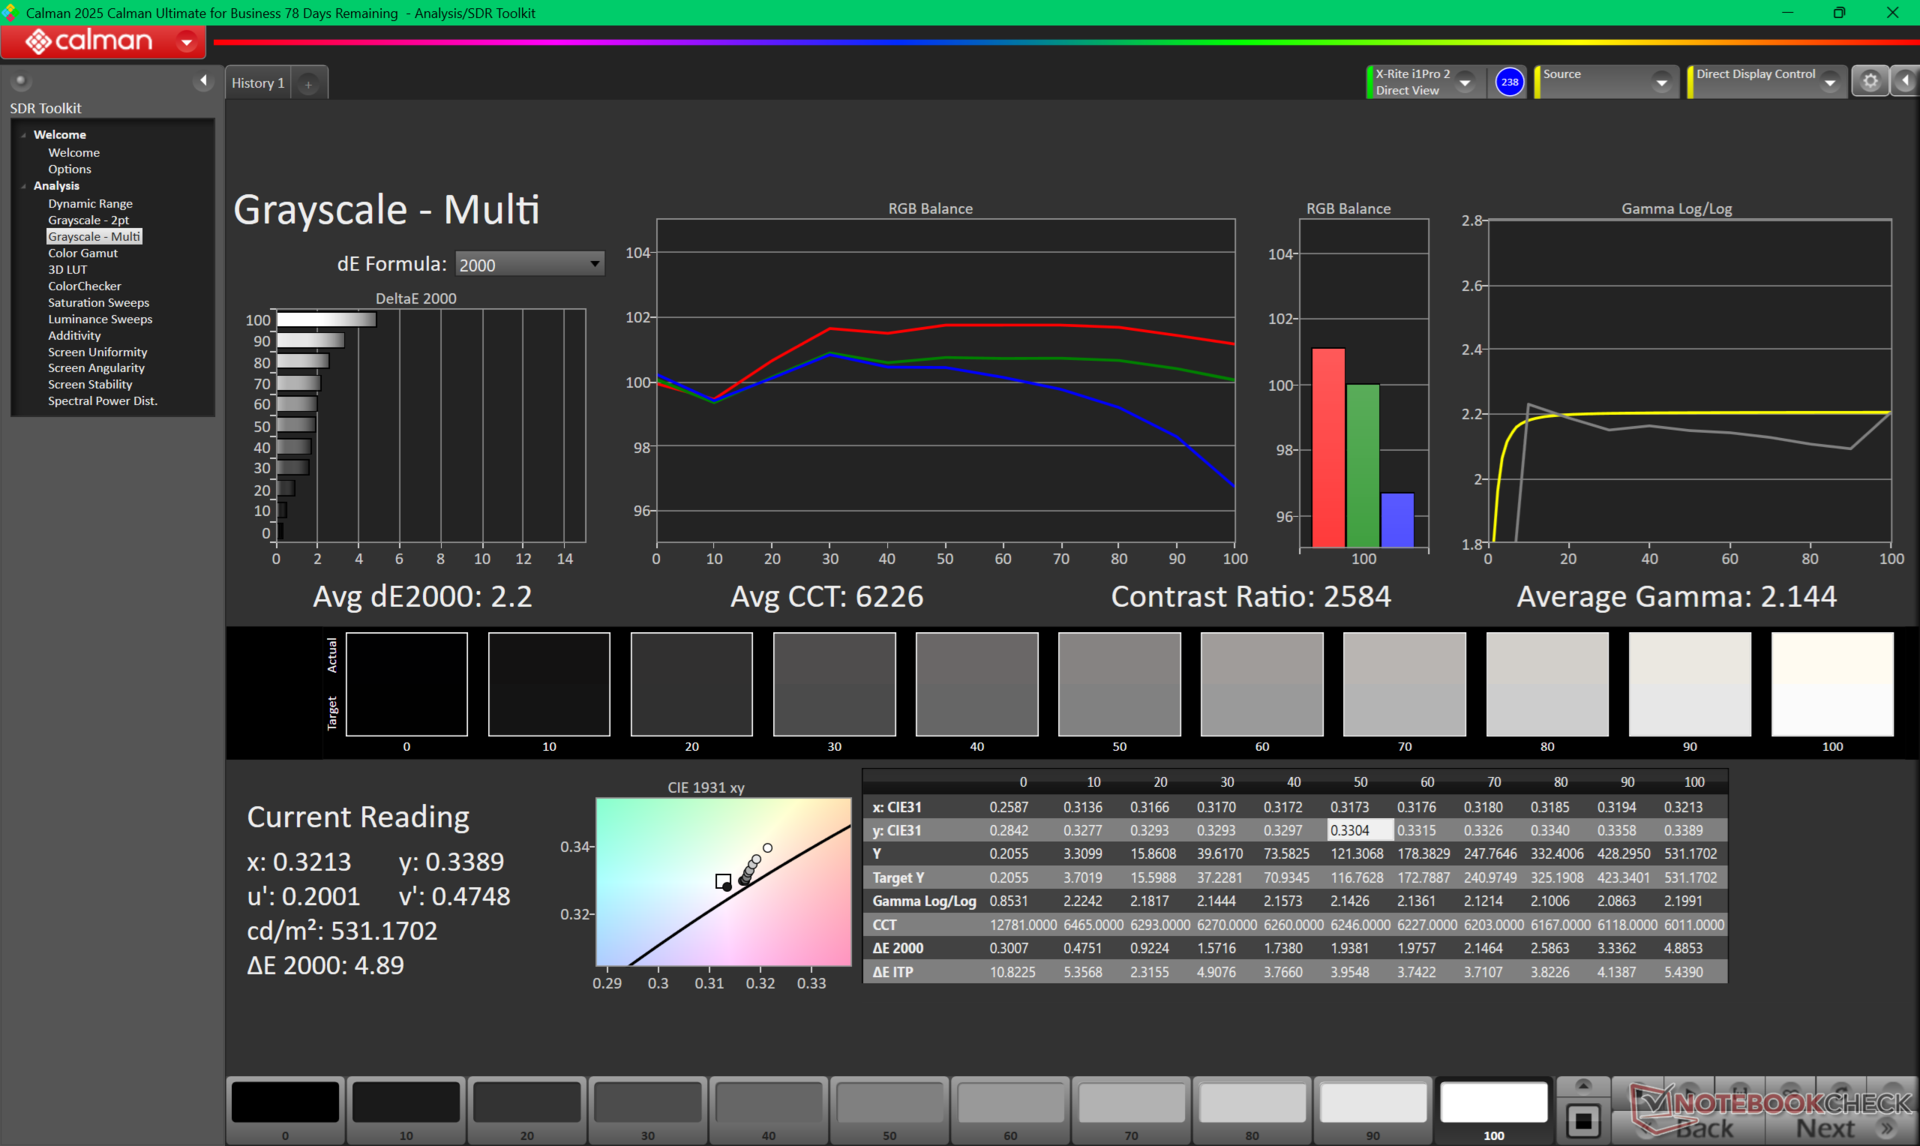
Contrast: 2404:1 (Zwart: 0.22 cd/m²)
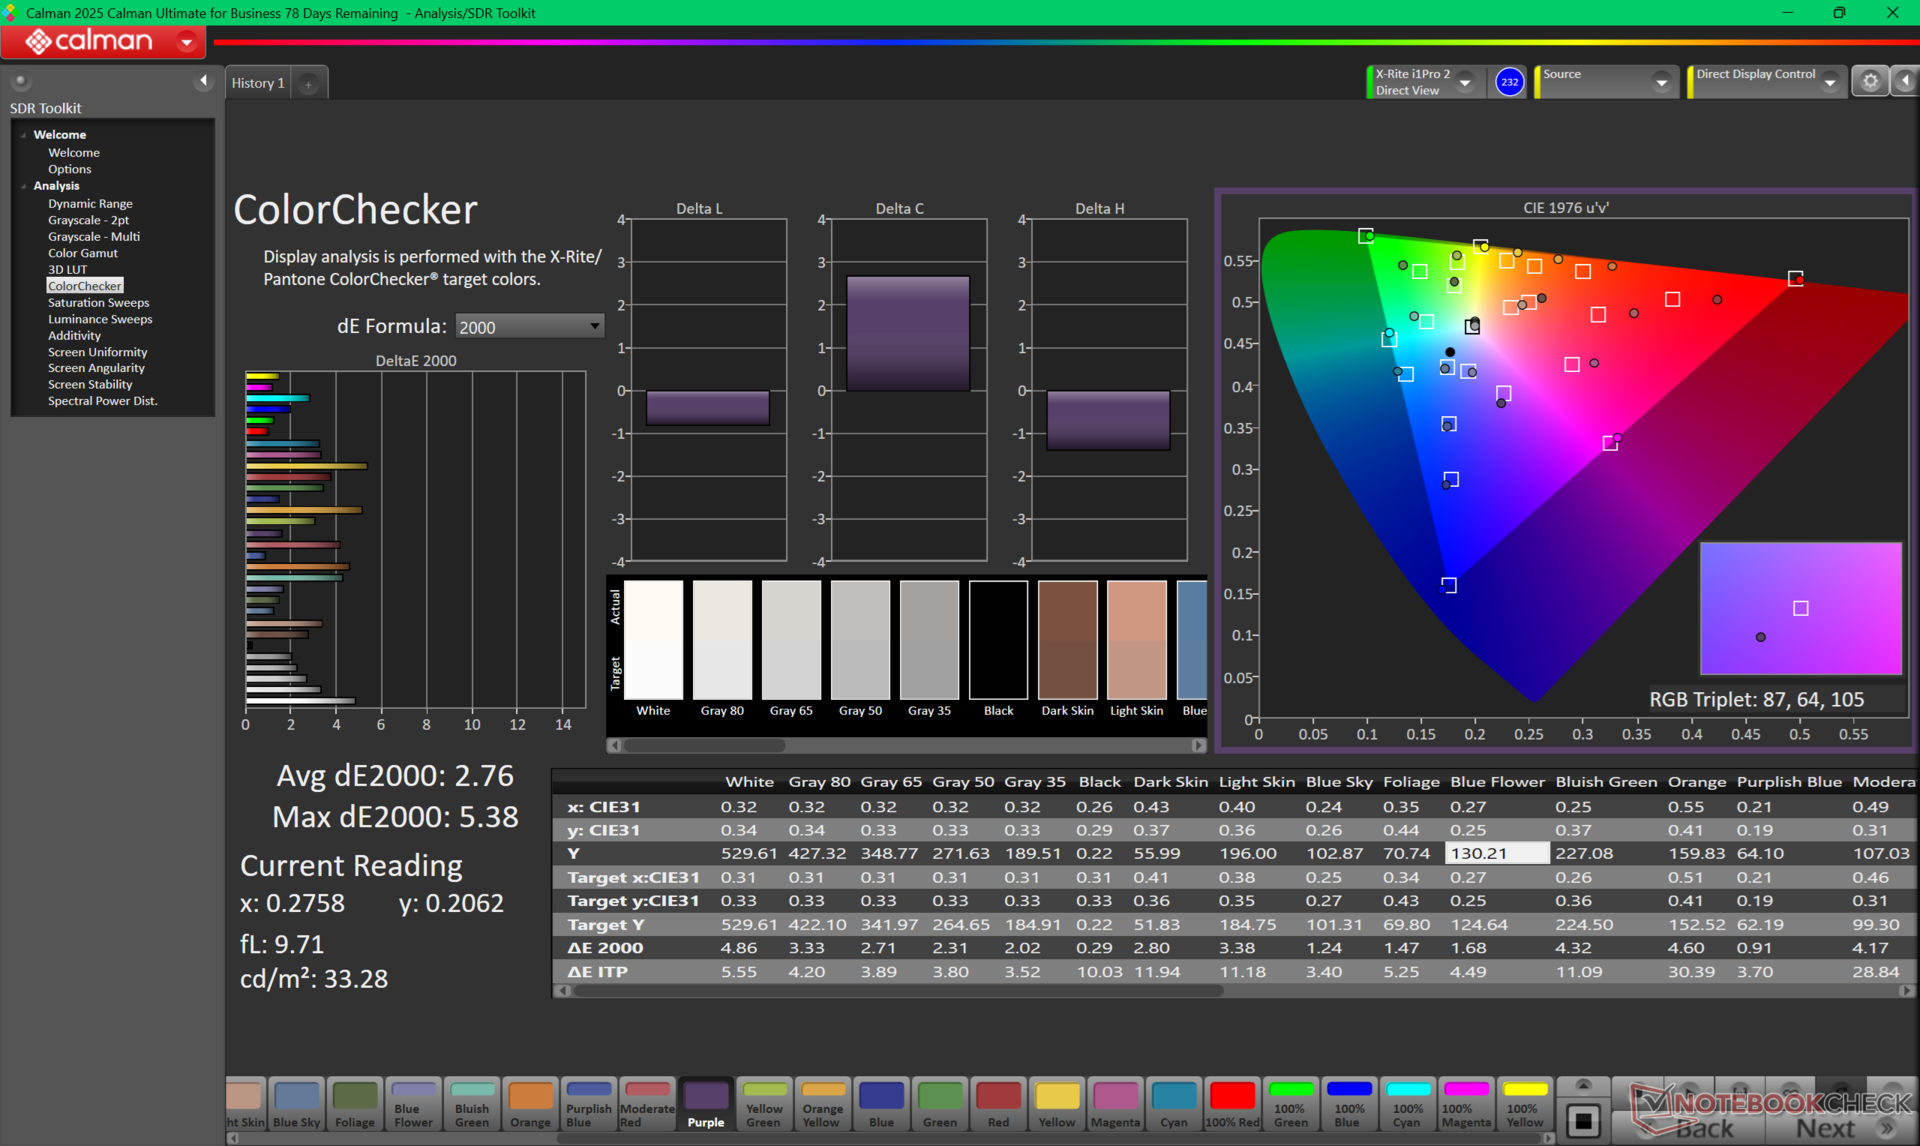
ΔE ColorChecker Calman: 2.76 | ∀{0.5-29.43 Ø4.72}
calibrated: 0.47
ΔE Greyscale Calman: 2.2 | ∀{0.09-98 Ø4.97}
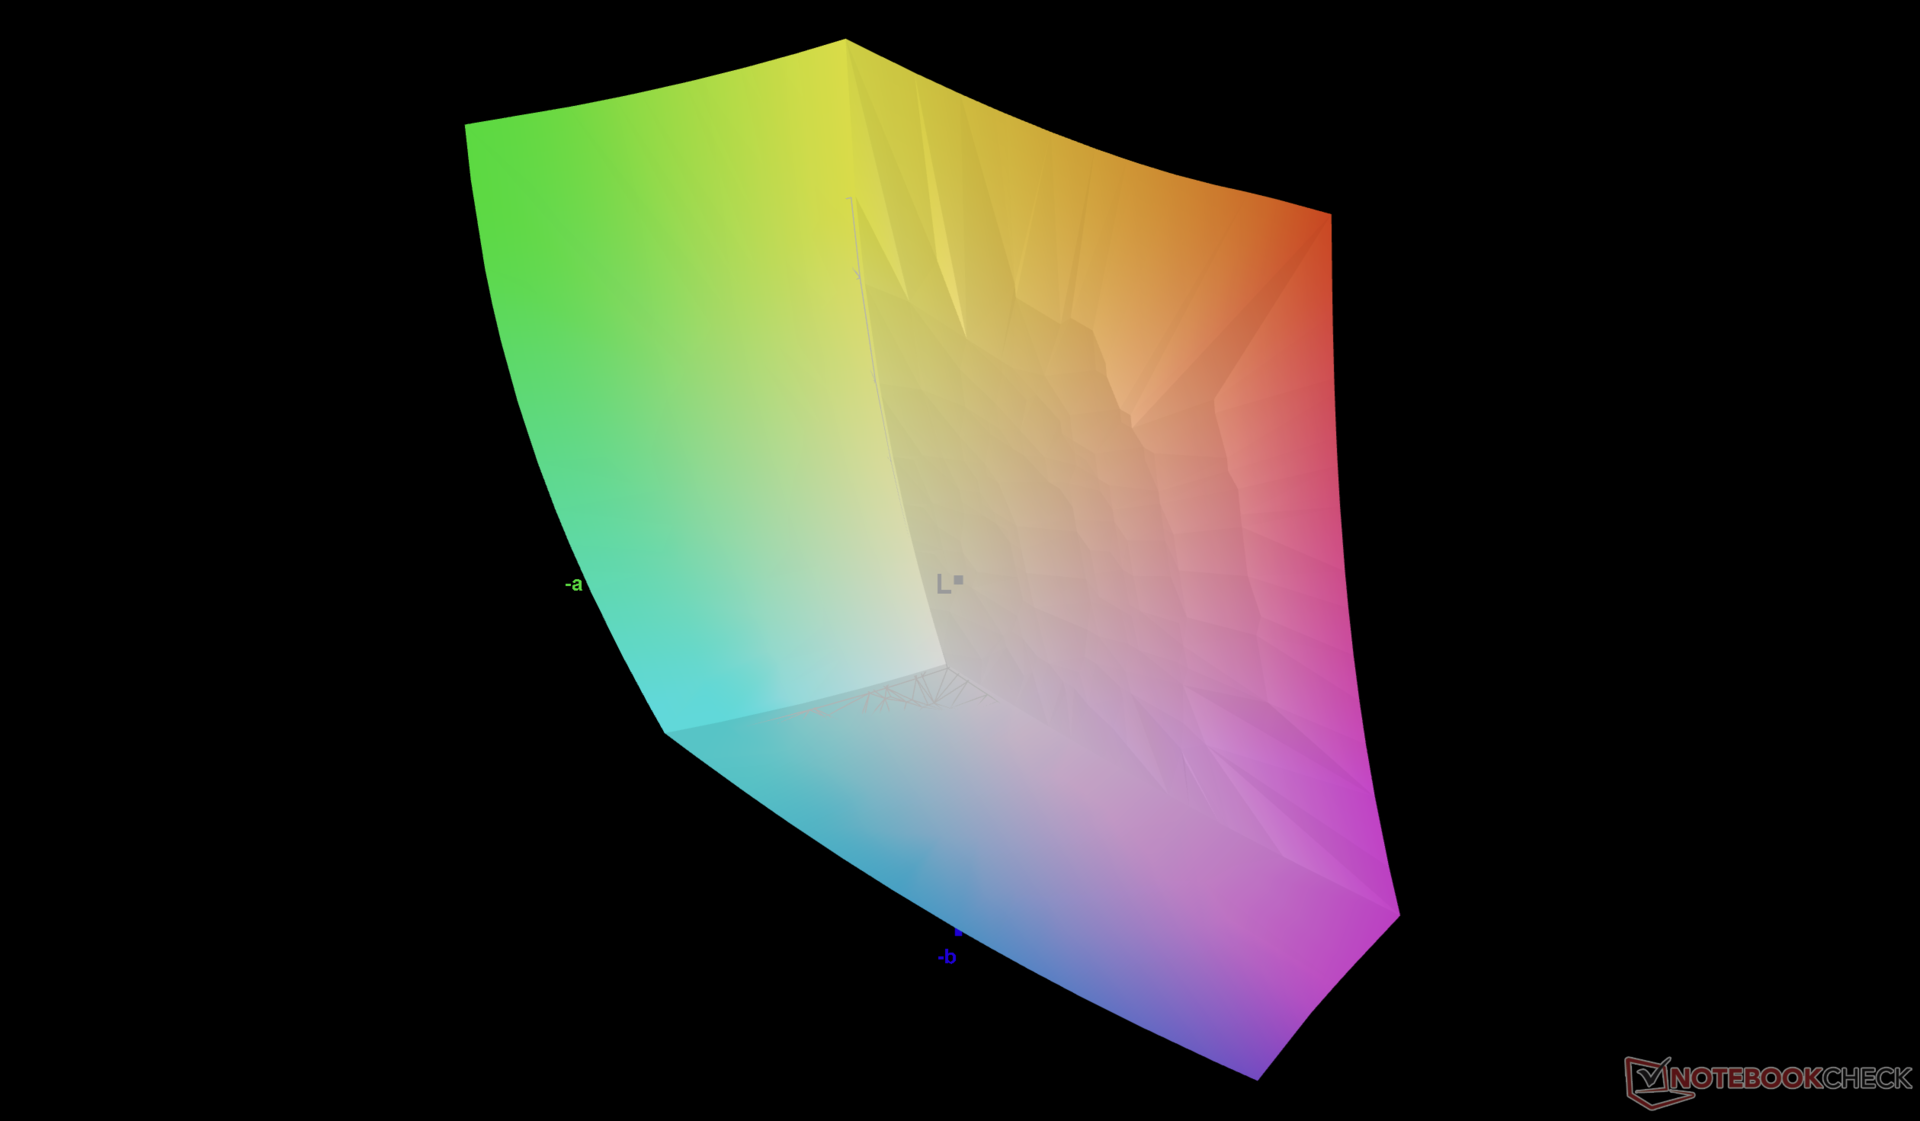
85.9% AdobeRGB 1998 (Argyll 3D)
99.9% sRGB (Argyll 3D)
97.7% Display P3 (Argyll 3D)
Gamma: 2.14
CCT: 2584 K
| Dell Pro Max 18 Plus MB18250 BOE NE18NZ7, IPS, 2560x1600, 18", 120 Hz | Schenker Key 18 Pro M25 RTX 5090 LQ180D1JW01, IPS, 3840x2400, 18", 200 Hz | HP ZBook X G1i 16 LG Philips LGD07B3, IPS, 2560x1600, 16", 120 Hz | HP ZBook Studio 16 G11 AUO87A8, IPS, 3840x2400, 16", 120 Hz | Lenovo ThinkPad P16s Gen 4 21RX000YGE N160JCA-GT1, IPS LED, 1920x1200, 16", 60 Hz | Dell Pro Max 16 Plus Samsung 160HC01, OLED, 3840x2400, 16", 120 Hz | |
|---|---|---|---|---|---|---|
| Display | -2% | 5% | 0% | -19% | 1% | |
| Display P3 Coverage (%) | 97.7 | 90.5 -7% | 97.2 -1% | 97.7 0% | 65.8 -33% | 97.3 0% |
| sRGB Coverage (%) | 99.9 | 100 0% | 100 0% | 99.9 0% | 96.8 -3% | 100 0% |
| AdobeRGB 1998 Coverage (%) | 85.9 | 87.4 2% | 99.9 16% | 85.7 0% | 67.8 -21% | 88.8 3% |
| Response Times | 86% | -2% | 64% | 25% | 98% | |
| Response Time Grey 50% / Grey 80% * (ms) | 39.9 ? | 5.2 ? 87% | 45.5 ? -14% | 14.2 ? 64% | 29.4 ? 26% | 0.63 ? 98% |
| Response Time Black / White * (ms) | 29.4 ? | 4.3 ? 85% | 26.1 ? 11% | 10.6 ? 64% | 22.4 ? 24% | 0.89 ? 97% |
| PWM Frequency (Hz) | 26536 ? | 479.9 ? | ||||
| PWM Amplitude * (%) | 47 | 28 | ||||
| Screen | -34% | -46% | -33% | -36% | 4% | |
| Brightness middle (cd/m²) | 528.8 | 529 0% | 461.8 -13% | 404.3 -24% | 540 2% | 530.9 0% |
| Brightness (cd/m²) | 515 | 513 0% | 427 -17% | 405 -21% | 516 0% | 540 5% |
| Brightness Distribution (%) | 91 | 95 4% | 88 -3% | 92 1% | 93 2% | 95 4% |
| Black Level * (cd/m²) | 0.22 | 0.31 -41% | 0.46 -109% | 0.28 -27% | 0.37 -68% | |
| Contrast (:1) | 2404 | 1706 -29% | 1004 -58% | 1444 -40% | 1459 -39% | |
| Colorchecker dE 2000 * | 2.76 | 2.7 2% | 4.08 -48% | 2.63 5% | 3.4 -23% | 2.42 12% |
| Colorchecker dE 2000 max. * | 5.38 | 7.8 -45% | 8.1 -51% | 4.48 17% | 5.6 -4% | 5.76 -7% |
| Colorchecker dE 2000 calibrated * | 0.47 | 0.8 -70% | 0.75 -60% | 1.46 -211% | 0.9 -91% | 0.7 -49% |
| Greyscale dE 2000 * | 2.2 | 4.9 -123% | 3.5 -59% | 2.1 5% | 4.5 -105% | 0.8 64% |
| Gamma | 2.14 103% | 2.23 99% | 2.15 102% | 2.3 96% | 2.51 88% | 2.23 99% |
| CCT | 2584 252% | 6997 93% | 6715 97% | 6810 95% | 6294 103% | 6488 100% |
| Totaal Gemiddelde (Programma / Instellingen) | 17% /
-10% | -14% /
-29% | 10% /
-12% | -10% /
-24% | 34% /
19% |
* ... kleiner is beter
Responstijd Scherm
| ↔ Responstijd Zwart naar Wit | ||
|---|---|---|
| 29.4 ms ... stijging ↗ en daling ↘ gecombineerd | ↗ 13.9 ms stijging | 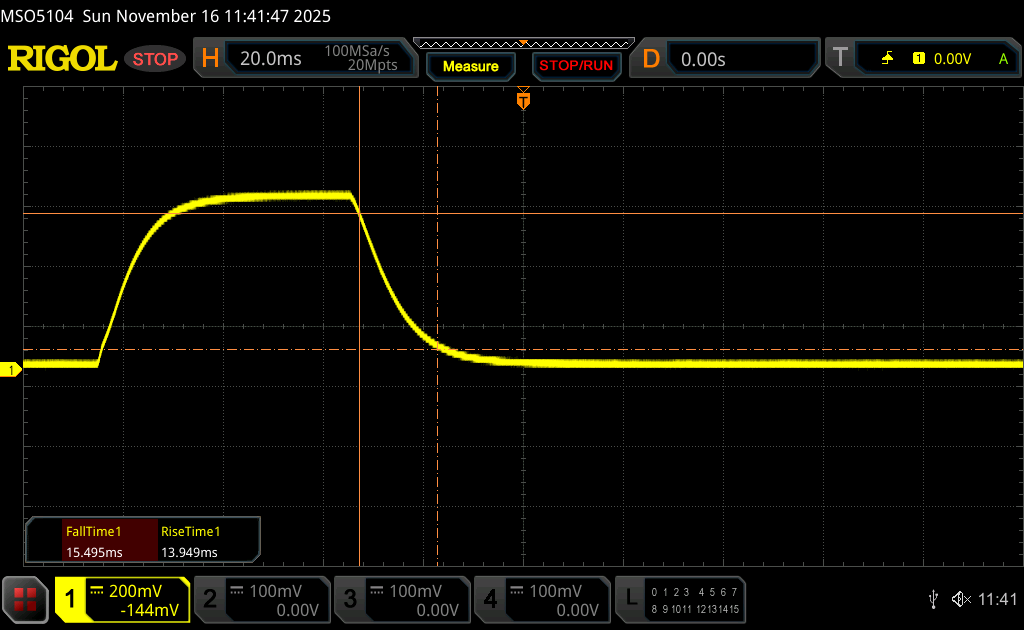 |
| ↘ 15.5 ms daling | ||
| Het scherm vertoonde relatief trage responstijden in onze tests en is misschien te traag voor games. Ter vergelijking: alle testtoestellen variëren van 0.1 (minimum) tot 240 (maximum) ms. » 79 % van alle toestellen zijn beter. Dit betekent dat de gemeten responstijd slechter is dan het gemiddelde (19.8 ms) van alle geteste toestellen. | ||
| ↔ Responstijd 50% Grijs naar 80% Grijs | ||
| 39.9 ms ... stijging ↗ en daling ↘ gecombineerd | ↗ 17.7 ms stijging | 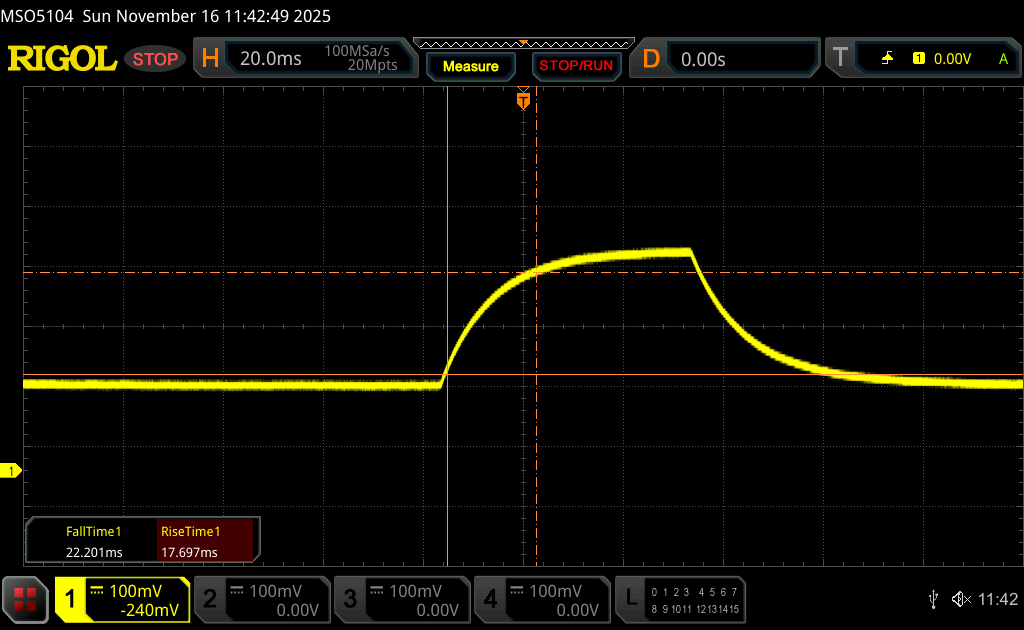 |
| ↘ 22.2 ms daling | ||
| Het scherm vertoonde trage responstijden in onze tests en is misschien te traag voor games. Ter vergelijking: alle testtoestellen variëren van 0.165 (minimum) tot 636 (maximum) ms. » 61 % van alle toestellen zijn beter. Dit betekent dat de gemeten responstijd slechter is dan het gemiddelde (31 ms) van alle geteste toestellen. | ||
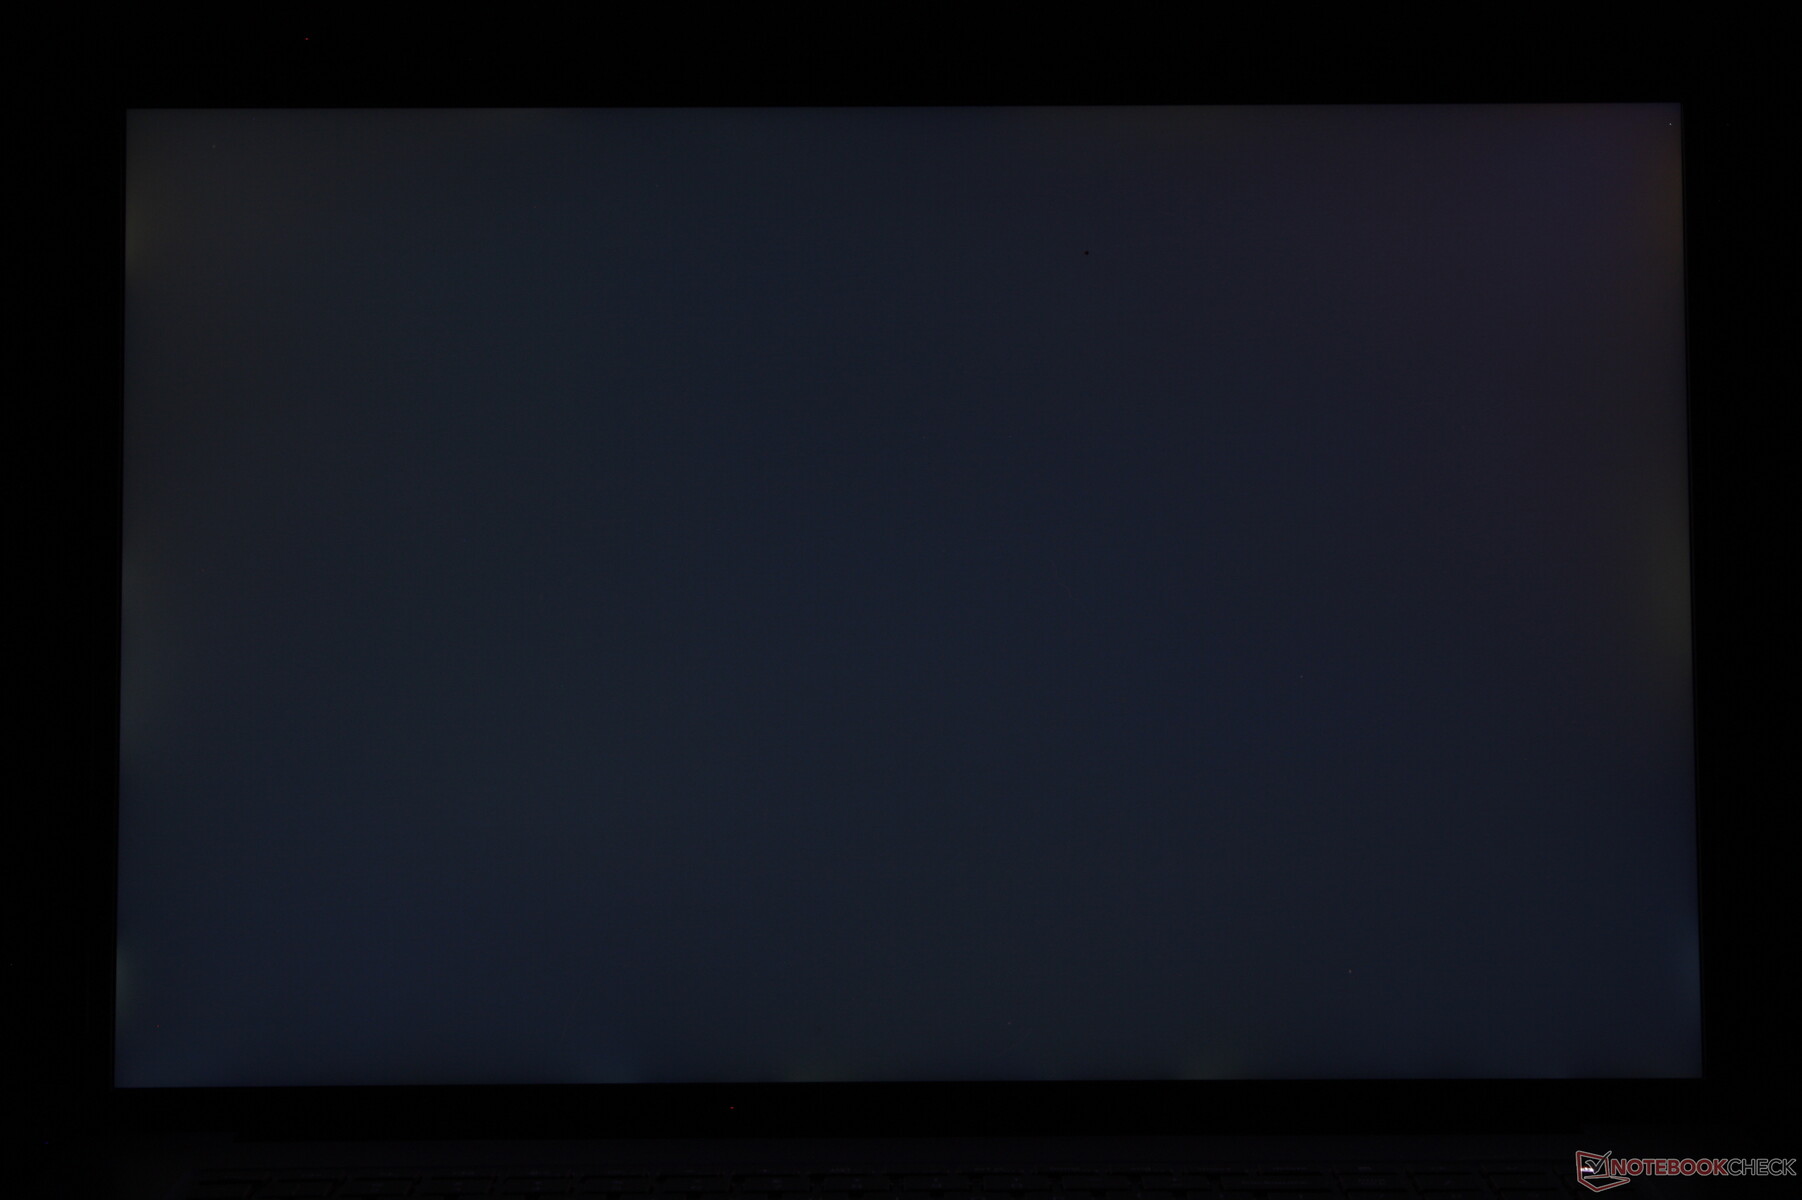
Screen Flickering / PWM (Pulse-Width Modulation)
| Screen flickering / PWM niet waargenomen | 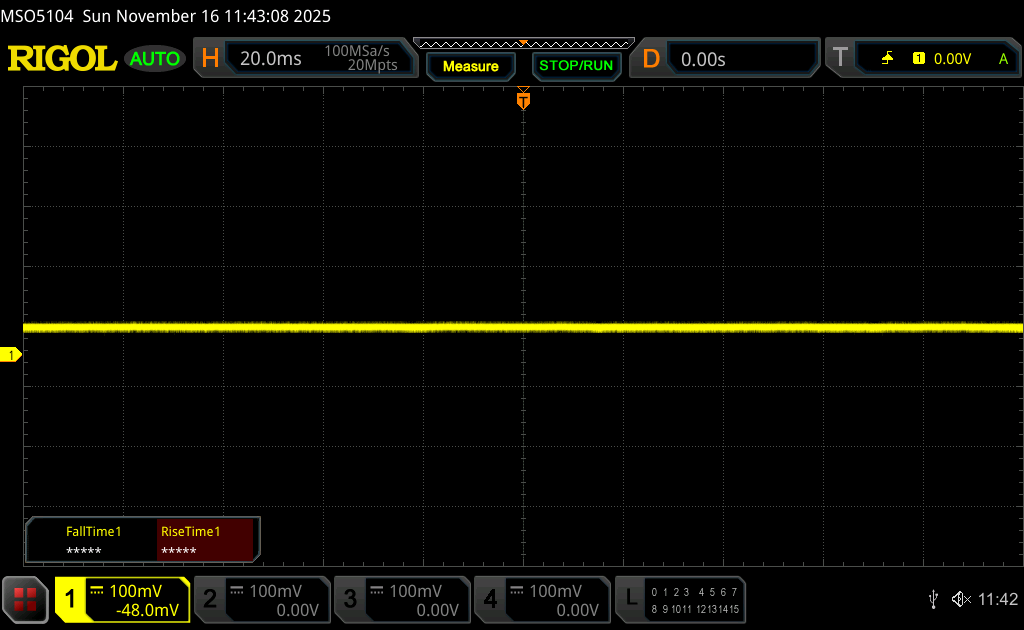 | ||
Ter vergelijking: 52 % van alle geteste toestellen maakten geen gebruik van PWM om de schermhelderheid te verlagen. Als het wel werd gebruikt, werd een gemiddelde van 7781 (minimum: 5 - maximum: 343500) Hz waargenomen. | |||

Prestaties
Testomstandigheden
We hebben Dell Optimizer en Nvidia Control Panel ingesteld op respectievelijk de modus Prestaties en de modus Discrete graphics voordat we de onderstaande benchmarks uitvoerden. Advanced Optimus wordt ondersteund om te schakelen tussen iGPU- en dGPU-modi zonder opnieuw op te starten.
Processor
De CPU-prestaties zijn uitstekend, maar niet perfect. Bij het uitvoeren van CineBench R15 xT in een lus, bijvoorbeeld, presteerde onze Core Ultra 9 285HX initiële score na verloop van tijd met ongeveer 15 procent dalen, zoals de grafiek hieronder laat zien, vanwege de beperkte duurzaamheid van Turbo Boost.
Cinebench R15 meervoudige lus
Cinebench R23: Multi Core | Single Core
Cinebench R20: CPU (Multi Core) | CPU (Single Core)
Cinebench R15: CPU Multi 64Bit | CPU Single 64Bit
Blender: v2.79 BMW27 CPU
7-Zip 18.03: 7z b 4 | 7z b 4 -mmt1
Geekbench 6.7: Multi-Core | Single-Core
Geekbench 5.5: Multi-Core | Single-Core
HWBOT x265 Benchmark v2.2: 4k Preset
LibreOffice : 20 Documents To PDF
R Benchmark 2.5: Overall mean
| CPU Performance rating | |
| Dell Pro Max 18 Plus MB18250 | |
| Gemiddeld Intel Core Ultra 9 285HX | |
| Dell Pro Max 16 Plus | |
| Schenker Key 18 Pro M25 RTX 5090 | |
| HP ZBook Fury 16 G10 | |
| Lenovo ThinkPad P16 Gen 2 | |
| HP ZBook X G1i 16 | |
| Lenovo ThinkPad P16s Gen 4 21RX000YGE | |
| HP ZBook Studio 16 G11 | |
| Dell Precision 7000 7670 Performance -2! | |
| Cinebench R23 / Multi Core | |
| Dell Pro Max 18 Plus MB18250 | |
| Gemiddeld Intel Core Ultra 9 285HX (34955 - 40117, n=6) | |
| Schenker Key 18 Pro M25 RTX 5090 | |
| Dell Pro Max 16 Plus | |
| Lenovo ThinkPad P16 Gen 2 | |
| HP ZBook Fury 16 G10 | |
| HP ZBook X G1i 16 | |
| Lenovo ThinkPad P16s Gen 4 21RX000YGE | |
| HP ZBook Studio 16 G11 | |
| Dell Precision 7000 7670 Performance | |
| Cinebench R23 / Single Core | |
| Schenker Key 18 Pro M25 RTX 5090 | |
| Gemiddeld Intel Core Ultra 9 285HX (2057 - 2303, n=6) | |
| Dell Pro Max 18 Plus MB18250 | |
| HP ZBook Fury 16 G10 | |
| Lenovo ThinkPad P16 Gen 2 | |
| Dell Pro Max 16 Plus | |
| HP ZBook X G1i 16 | |
| Lenovo ThinkPad P16s Gen 4 21RX000YGE | |
| HP ZBook Studio 16 G11 | |
| Dell Precision 7000 7670 Performance | |
| Cinebench R20 / CPU (Multi Core) | |
| Dell Pro Max 18 Plus MB18250 | |
| Gemiddeld Intel Core Ultra 9 285HX (13152 - 15751, n=6) | |
| Schenker Key 18 Pro M25 RTX 5090 | |
| Dell Pro Max 16 Plus | |
| Lenovo ThinkPad P16 Gen 2 | |
| HP ZBook Fury 16 G10 | |
| HP ZBook X G1i 16 | |
| Lenovo ThinkPad P16s Gen 4 21RX000YGE | |
| HP ZBook Studio 16 G11 | |
| Dell Precision 7000 7670 Performance | |
| Cinebench R20 / CPU (Single Core) | |
| Schenker Key 18 Pro M25 RTX 5090 | |
| Gemiddeld Intel Core Ultra 9 285HX (799 - 884, n=6) | |
| Dell Pro Max 18 Plus MB18250 | |
| HP ZBook Fury 16 G10 | |
| Dell Pro Max 16 Plus | |
| Lenovo ThinkPad P16s Gen 4 21RX000YGE | |
| Lenovo ThinkPad P16 Gen 2 | |
| HP ZBook X G1i 16 | |
| Dell Precision 7000 7670 Performance | |
| HP ZBook Studio 16 G11 | |
| Cinebench R15 / CPU Multi 64Bit | |
| Dell Pro Max 18 Plus MB18250 | |
| Gemiddeld Intel Core Ultra 9 285HX (5427 - 6232, n=6) | |
| Schenker Key 18 Pro M25 RTX 5090 | |
| Dell Pro Max 16 Plus | |
| Lenovo ThinkPad P16 Gen 2 | |
| HP ZBook Fury 16 G10 | |
| HP ZBook X G1i 16 | |
| Lenovo ThinkPad P16s Gen 4 21RX000YGE | |
| HP ZBook Studio 16 G11 | |
| Dell Precision 7000 7670 Performance | |
| Cinebench R15 / CPU Single 64Bit | |
| Schenker Key 18 Pro M25 RTX 5090 | |
| Gemiddeld Intel Core Ultra 9 285HX (307 - 340, n=6) | |
| Dell Pro Max 18 Plus MB18250 | |
| Lenovo ThinkPad P16s Gen 4 21RX000YGE | |
| Dell Pro Max 16 Plus | |
| HP ZBook X G1i 16 | |
| HP ZBook Fury 16 G10 | |
| Lenovo ThinkPad P16 Gen 2 | |
| Dell Precision 7000 7670 Performance | |
| HP ZBook Studio 16 G11 | |
| Blender / v2.79 BMW27 CPU | |
| Dell Precision 7000 7670 Performance | |
| HP ZBook Studio 16 G11 | |
| Lenovo ThinkPad P16s Gen 4 21RX000YGE | |
| HP ZBook X G1i 16 | |
| HP ZBook Fury 16 G10 | |
| Lenovo ThinkPad P16 Gen 2 | |
| Dell Pro Max 16 Plus | |
| Gemiddeld Intel Core Ultra 9 285HX (83 - 103, n=6) | |
| Dell Pro Max 18 Plus MB18250 | |
| Schenker Key 18 Pro M25 RTX 5090 | |
| 7-Zip 18.03 / 7z b 4 -mmt1 | |
| Lenovo ThinkPad P16 Gen 2 | |
| Dell Pro Max 18 Plus MB18250 | |
| HP ZBook Fury 16 G10 | |
| Gemiddeld Intel Core Ultra 9 285HX (6422 - 6822, n=6) | |
| Dell Pro Max 16 Plus | |
| Lenovo ThinkPad P16s Gen 4 21RX000YGE | |
| HP ZBook X G1i 16 | |
| Schenker Key 18 Pro M25 RTX 5090 | |
| Dell Precision 7000 7670 Performance | |
| HP ZBook Studio 16 G11 | |
| Geekbench 6.7 / Multi-Core | |
| Dell Pro Max 18 Plus MB18250 | |
| Dell Pro Max 16 Plus | |
| Gemiddeld Intel Core Ultra 9 285HX (18212 - 22104, n=6) | |
| HP ZBook X G1i 16 | |
| Schenker Key 18 Pro M25 RTX 5090 | |
| Lenovo ThinkPad P16 Gen 2 | |
| HP ZBook Fury 16 G10 | |
| Lenovo ThinkPad P16s Gen 4 21RX000YGE | |
| HP ZBook Studio 16 G11 | |
| Geekbench 6.7 / Single-Core | |
| Dell Pro Max 18 Plus MB18250 | |
| Gemiddeld Intel Core Ultra 9 285HX (2907 - 3088, n=6) | |
| HP ZBook Fury 16 G10 | |
| Lenovo ThinkPad P16s Gen 4 21RX000YGE | |
| HP ZBook X G1i 16 | |
| Dell Pro Max 16 Plus | |
| Lenovo ThinkPad P16 Gen 2 | |
| Schenker Key 18 Pro M25 RTX 5090 | |
| HP ZBook Studio 16 G11 | |
| Geekbench 5.5 / Multi-Core | |
| Dell Pro Max 18 Plus MB18250 | |
| Dell Pro Max 16 Plus | |
| Gemiddeld Intel Core Ultra 9 285HX (18992 - 27010, n=6) | |
| Schenker Key 18 Pro M25 RTX 5090 | |
| Lenovo ThinkPad P16 Gen 2 | |
| HP ZBook Fury 16 G10 | |
| HP ZBook X G1i 16 | |
| Lenovo ThinkPad P16s Gen 4 21RX000YGE | |
| Dell Precision 7000 7670 Performance | |
| HP ZBook Studio 16 G11 | |
| Geekbench 5.5 / Single-Core | |
| Dell Pro Max 18 Plus MB18250 | |
| Gemiddeld Intel Core Ultra 9 285HX (2121 - 2232, n=6) | |
| Lenovo ThinkPad P16s Gen 4 21RX000YGE | |
| Dell Pro Max 16 Plus | |
| HP ZBook Fury 16 G10 | |
| Schenker Key 18 Pro M25 RTX 5090 | |
| HP ZBook X G1i 16 | |
| Lenovo ThinkPad P16 Gen 2 | |
| Dell Precision 7000 7670 Performance | |
| HP ZBook Studio 16 G11 | |
| HWBOT x265 Benchmark v2.2 / 4k Preset | |
| Dell Pro Max 18 Plus MB18250 | |
| Gemiddeld Intel Core Ultra 9 285HX (35.3 - 44.3, n=6) | |
| Schenker Key 18 Pro M25 RTX 5090 | |
| Dell Pro Max 16 Plus | |
| HP ZBook Fury 16 G10 | |
| HP ZBook X G1i 16 | |
| Lenovo ThinkPad P16 Gen 2 | |
| Lenovo ThinkPad P16s Gen 4 21RX000YGE | |
| HP ZBook Studio 16 G11 | |
| Dell Precision 7000 7670 Performance | |
| LibreOffice / 20 Documents To PDF | |
| Lenovo ThinkPad P16s Gen 4 21RX000YGE | |
| Lenovo ThinkPad P16 Gen 2 | |
| HP ZBook Studio 16 G11 | |
| Dell Precision 7000 7670 Performance | |
| HP ZBook Fury 16 G10 | |
| Gemiddeld Intel Core Ultra 9 285HX (38 - 49.1, n=6) | |
| Dell Pro Max 16 Plus | |
| HP ZBook X G1i 16 | |
| Dell Pro Max 18 Plus MB18250 | |
| Schenker Key 18 Pro M25 RTX 5090 | |
| R Benchmark 2.5 / Overall mean | |
| Lenovo ThinkPad P16s Gen 4 21RX000YGE | |
| HP ZBook Studio 16 G11 | |
| Dell Precision 7000 7670 Performance | |
| Schenker Key 18 Pro M25 RTX 5090 | |
| Dell Pro Max 16 Plus | |
| HP ZBook X G1i 16 | |
| Gemiddeld Intel Core Ultra 9 285HX (0.4012 - 0.4444, n=6) | |
| Dell Pro Max 18 Plus MB18250 | |
| Lenovo ThinkPad P16 Gen 2 | |
| HP ZBook Fury 16 G10 | |
* ... kleiner is beter
AIDA64: FP32 Ray-Trace | FPU Julia | CPU SHA3 | CPU Queen | FPU SinJulia | FPU Mandel | CPU AES | CPU ZLib | FP64 Ray-Trace | CPU PhotoWorxx
| Performance rating | |
| Dell Pro Max 18 Plus MB18250 | |
| Schenker Key 18 Pro M25 RTX 5090 | |
| Gemiddeld Intel Core Ultra 9 285HX | |
| Dell Pro Max 16 Plus | |
| Lenovo ThinkPad P16s Gen 4 21RX000YGE | |
| HP ZBook Studio 16 G11 | |
| AIDA64 / FP32 Ray-Trace | |
| Schenker Key 18 Pro M25 RTX 5090 | |
| Dell Pro Max 18 Plus MB18250 | |
| Gemiddeld Intel Core Ultra 9 285HX (29076 - 42341, n=6) | |
| Dell Pro Max 16 Plus | |
| Lenovo ThinkPad P16s Gen 4 21RX000YGE | |
| HP ZBook Studio 16 G11 | |
| AIDA64 / FPU Julia | |
| Schenker Key 18 Pro M25 RTX 5090 | |
| Gemiddeld Intel Core Ultra 9 285HX (161276 - 210885, n=6) | |
| Dell Pro Max 18 Plus MB18250 | |
| Dell Pro Max 16 Plus | |
| Lenovo ThinkPad P16s Gen 4 21RX000YGE | |
| HP ZBook Studio 16 G11 | |
| AIDA64 / CPU SHA3 | |
| Schenker Key 18 Pro M25 RTX 5090 | |
| Dell Pro Max 18 Plus MB18250 | |
| Gemiddeld Intel Core Ultra 9 285HX (7757 - 9815, n=6) | |
| Dell Pro Max 16 Plus | |
| Lenovo ThinkPad P16s Gen 4 21RX000YGE | |
| HP ZBook Studio 16 G11 | |
| AIDA64 / CPU Queen | |
| Gemiddeld Intel Core Ultra 9 285HX (134345 - 141681, n=6) | |
| Dell Pro Max 18 Plus MB18250 | |
| Dell Pro Max 16 Plus | |
| Schenker Key 18 Pro M25 RTX 5090 | |
| Lenovo ThinkPad P16s Gen 4 21RX000YGE | |
| HP ZBook Studio 16 G11 | |
| AIDA64 / FPU SinJulia | |
| Lenovo ThinkPad P16s Gen 4 21RX000YGE | |
| Schenker Key 18 Pro M25 RTX 5090 | |
| Dell Pro Max 18 Plus MB18250 | |
| Gemiddeld Intel Core Ultra 9 285HX (12559 - 14431, n=6) | |
| Dell Pro Max 16 Plus | |
| HP ZBook Studio 16 G11 | |
| AIDA64 / FPU Mandel | |
| Schenker Key 18 Pro M25 RTX 5090 | |
| Gemiddeld Intel Core Ultra 9 285HX (84053 - 108922, n=6) | |
| Dell Pro Max 18 Plus MB18250 | |
| Dell Pro Max 16 Plus | |
| Lenovo ThinkPad P16s Gen 4 21RX000YGE | |
| HP ZBook Studio 16 G11 | |
| AIDA64 / CPU AES | |
| Schenker Key 18 Pro M25 RTX 5090 | |
| Dell Pro Max 18 Plus MB18250 | |
| Gemiddeld Intel Core Ultra 9 285HX (119553 - 134195, n=6) | |
| Dell Pro Max 16 Plus | |
| Lenovo ThinkPad P16s Gen 4 21RX000YGE | |
| HP ZBook Studio 16 G11 | |
| AIDA64 / CPU ZLib | |
| Dell Pro Max 18 Plus MB18250 | |
| Schenker Key 18 Pro M25 RTX 5090 | |
| Gemiddeld Intel Core Ultra 9 285HX (1886 - 2267, n=6) | |
| Dell Pro Max 16 Plus | |
| Lenovo ThinkPad P16s Gen 4 21RX000YGE | |
| HP ZBook Studio 16 G11 | |
| AIDA64 / FP64 Ray-Trace | |
| Schenker Key 18 Pro M25 RTX 5090 | |
| Gemiddeld Intel Core Ultra 9 285HX (15059 - 22312, n=6) | |
| Dell Pro Max 18 Plus MB18250 | |
| Dell Pro Max 16 Plus | |
| Lenovo ThinkPad P16s Gen 4 21RX000YGE | |
| HP ZBook Studio 16 G11 | |
| AIDA64 / CPU PhotoWorxx | |
| Dell Pro Max 16 Plus | |
| Dell Pro Max 18 Plus MB18250 | |
| HP ZBook Studio 16 G11 | |
| Gemiddeld Intel Core Ultra 9 285HX (39232 - 62611, n=6) | |
| Lenovo ThinkPad P16s Gen 4 21RX000YGE | |
| Schenker Key 18 Pro M25 RTX 5090 | |
Stresstest
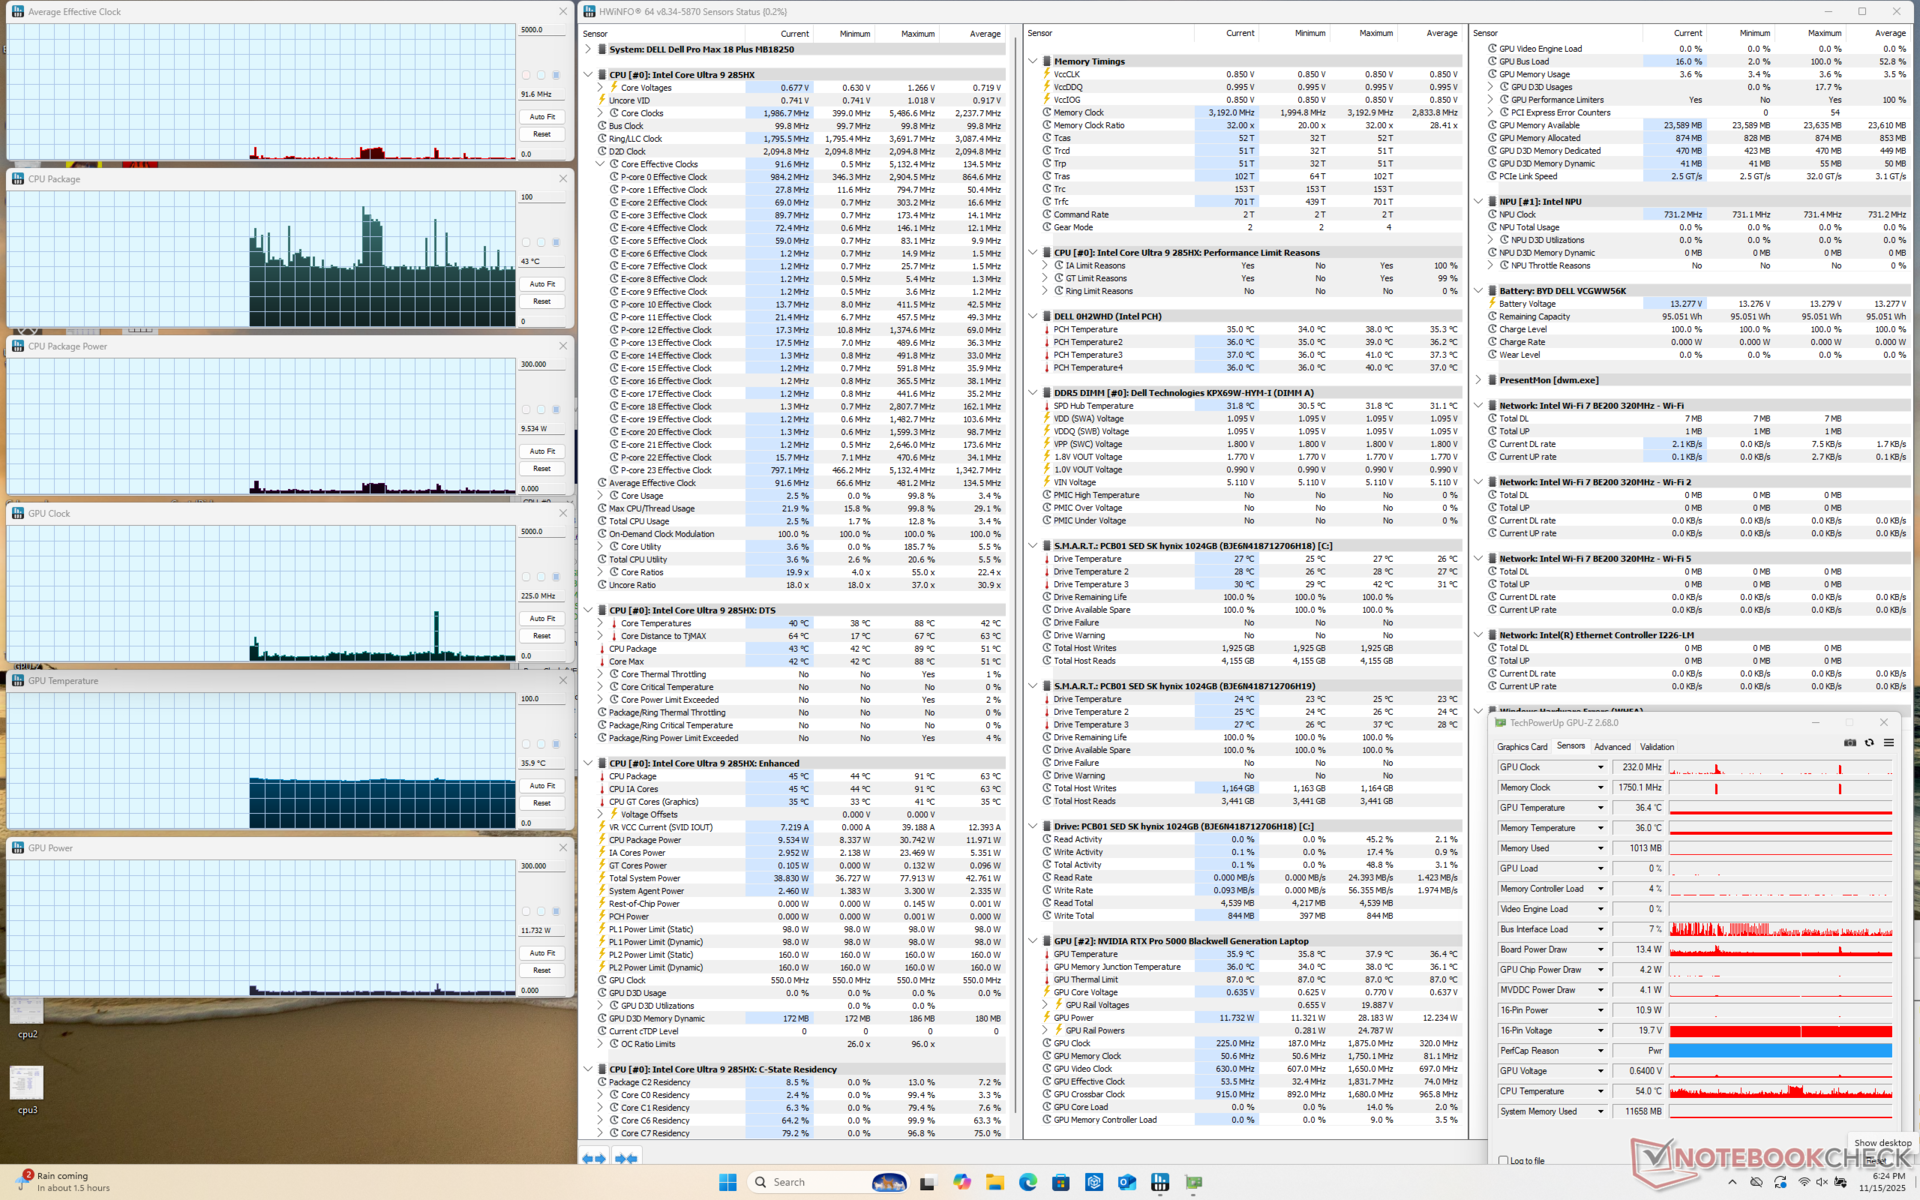
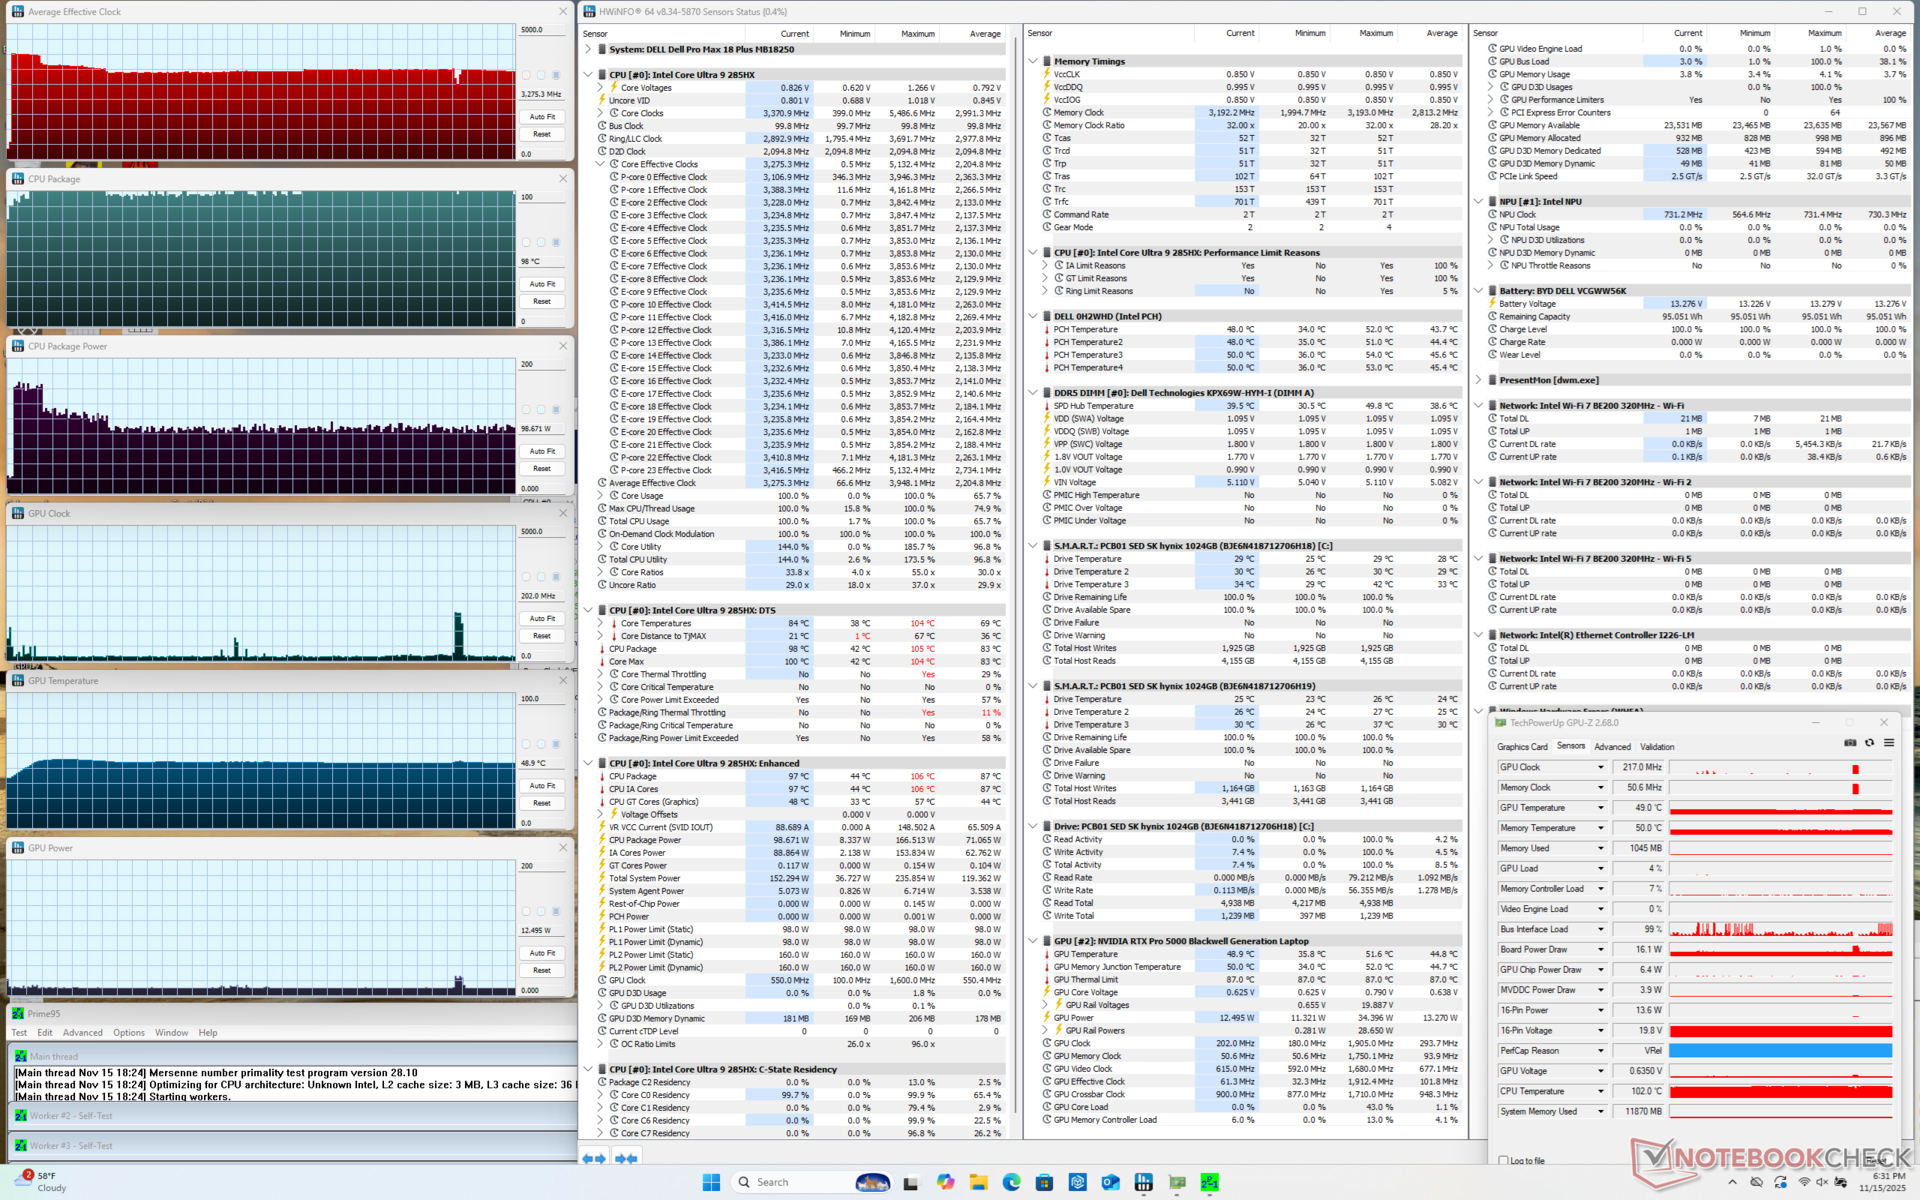
Tijdens het uitvoeren van Prime95 stress, steeg de CPU naar 4 GHz, 160 W en iets meer dan 100 C (!) voordat hij daalde en zich stabiliseerde op 3,2 GHz, 99 W en 98 C. De kortstondige Turbo Boost vult onze hierboven genoemde CineBench R15 xT loop-waarnemingen aan.
De CPU-temperaturen bleven erg warm met ~100 C bij het uitvoeren van andere veeleisende belastingen zoals games, vergeleken met slechts 77 C op de oudere Prestaties Dell Precision 7670.
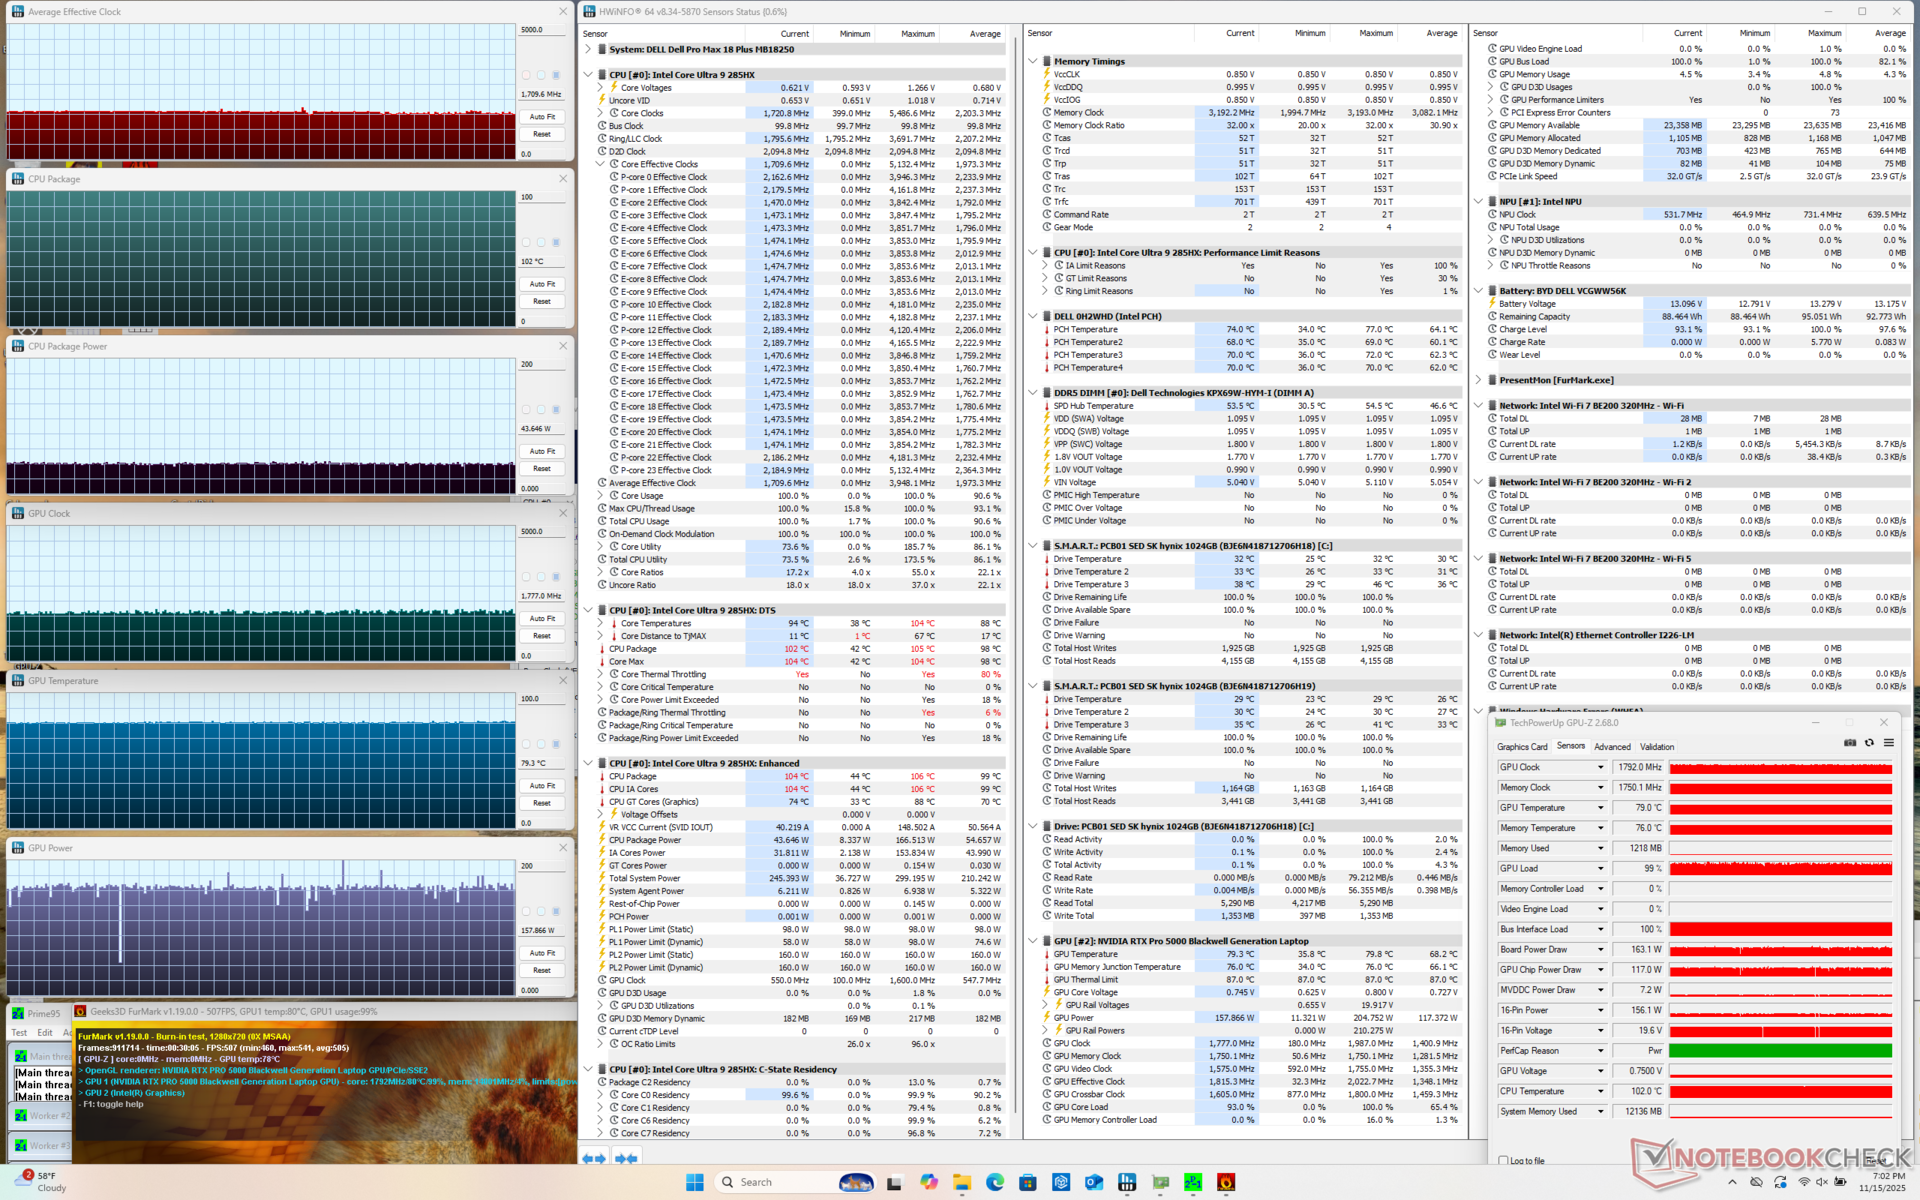
Merk op dat de stroomopname en kloksnelheden van de GPU-kaart iets afnemen als de Balanced-modus wordt gebruikt in plaats van de Performance-modus, zoals de onderstaande screenshots laten zien.
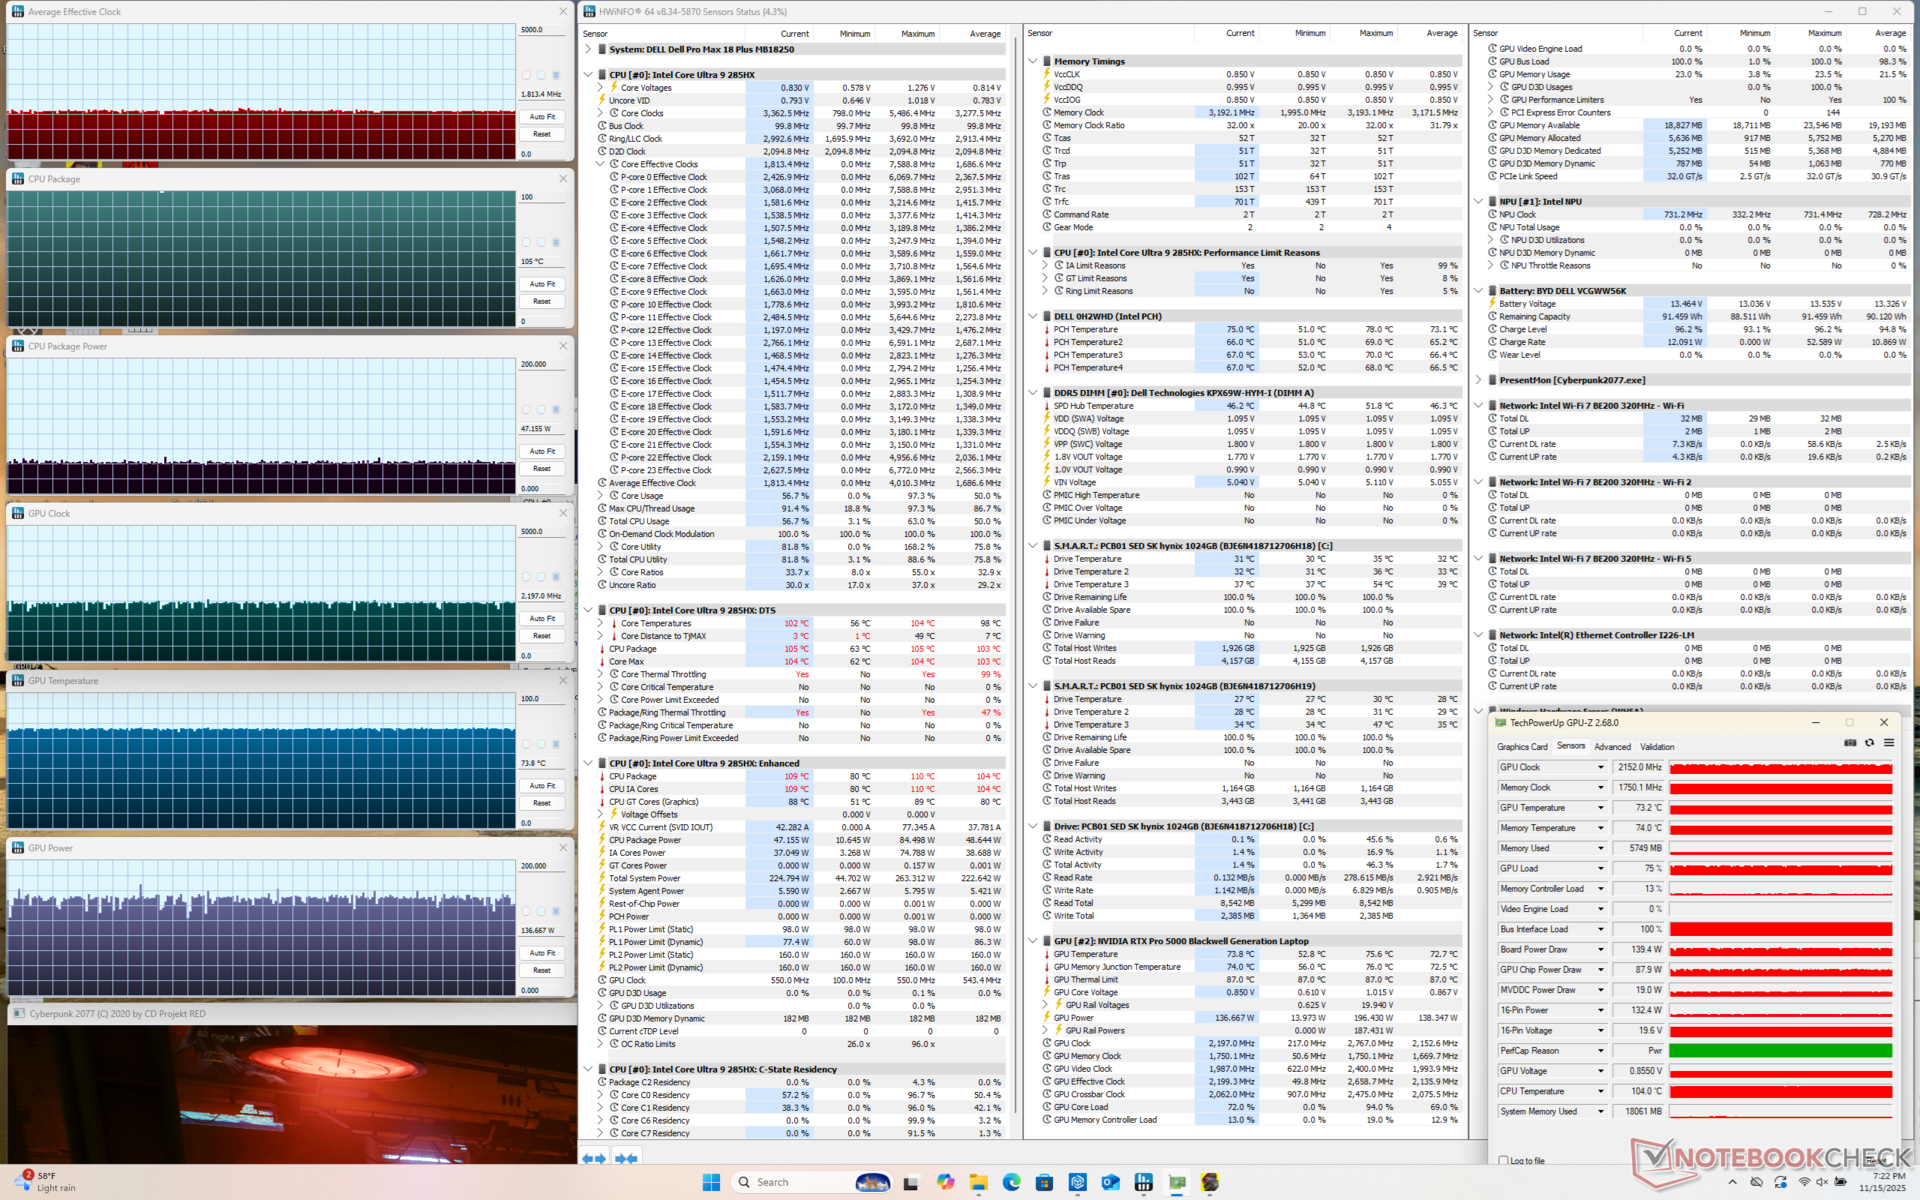
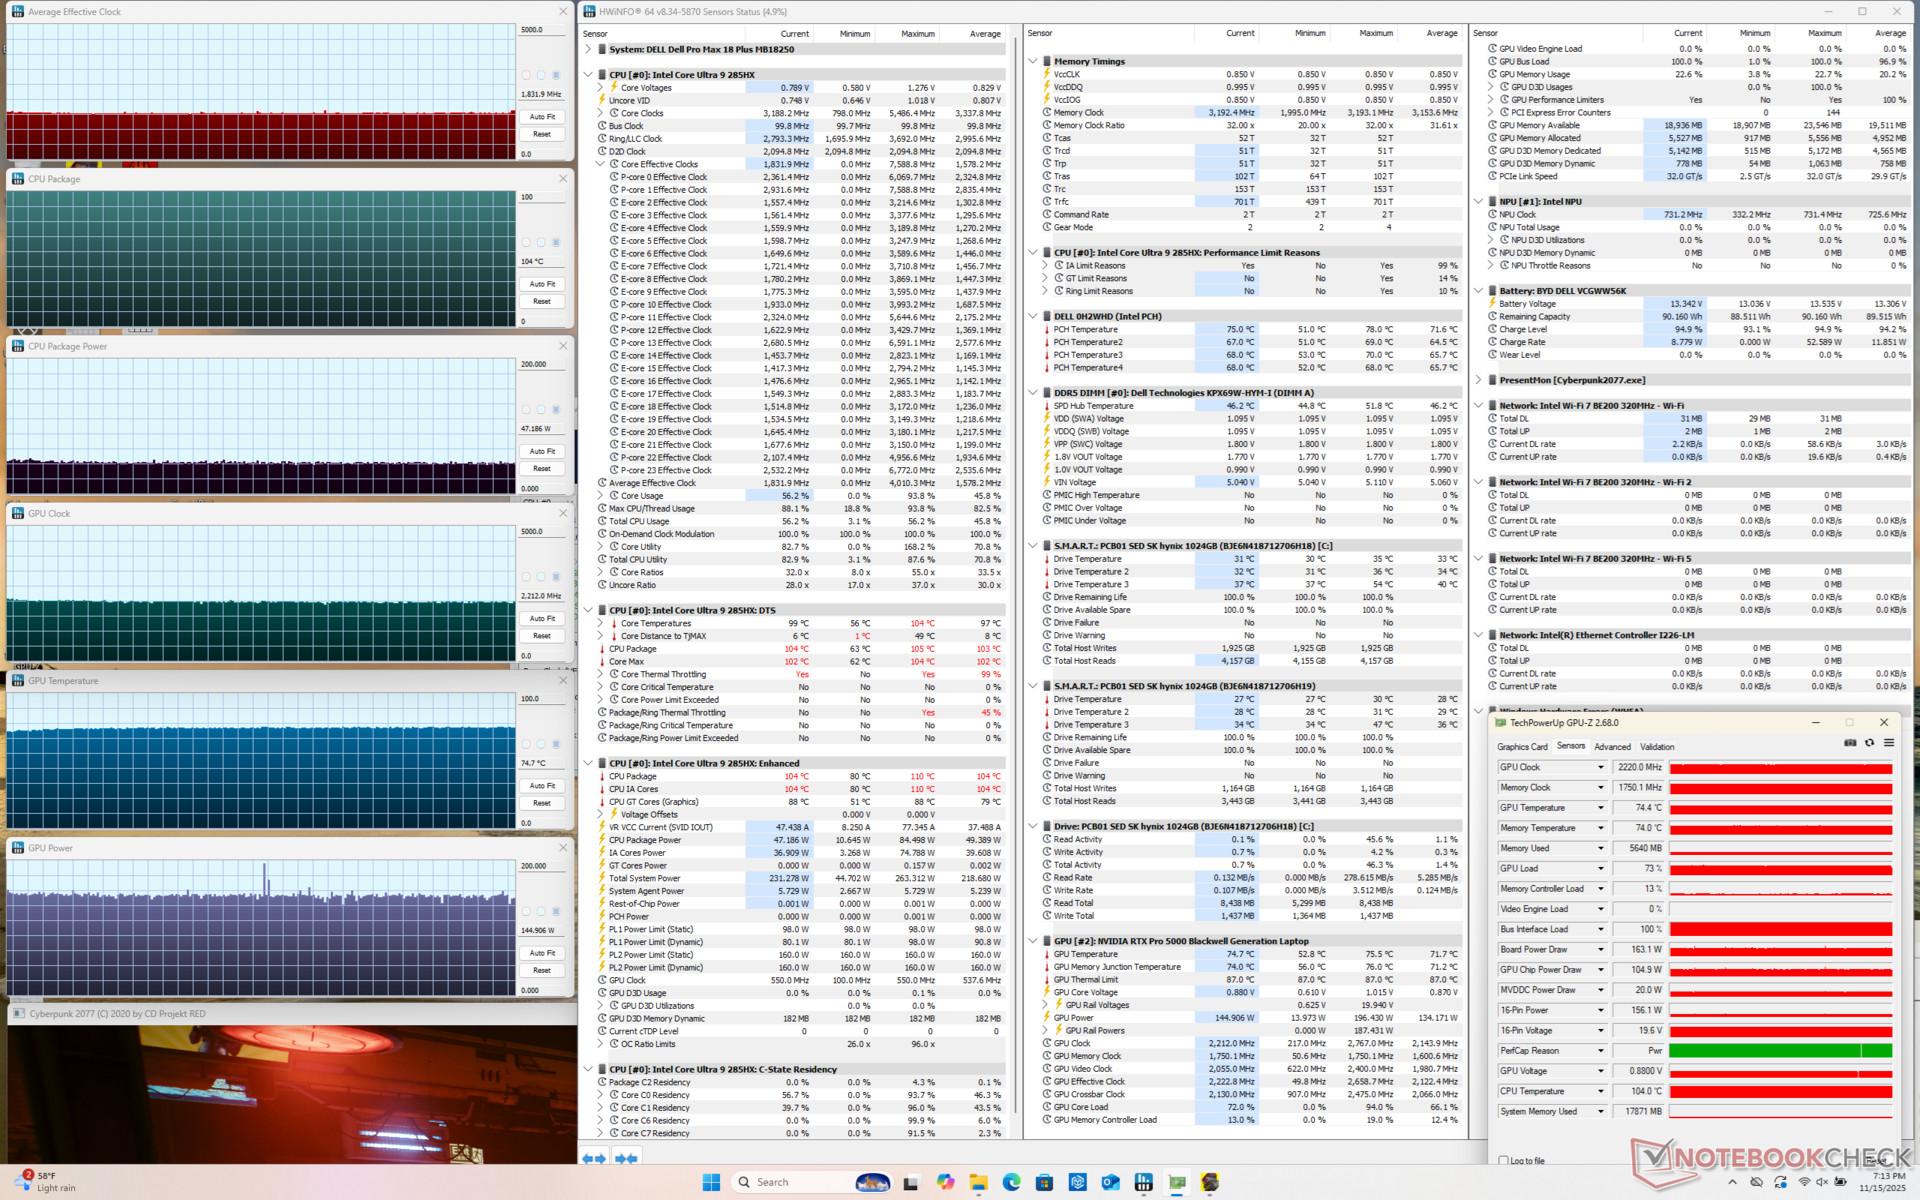
| Gemiddelde CPU-klok (GHz) | GPU-klok (MHz) | Gemiddelde CPU-temperatuur (°C) | Gemiddelde GPU-temperatuur (°C) | |
| Inactief systeem | -- | 225 | 43 | 36 |
| Prime95-stress | 3.3 | -- | 99 | 49 |
| Prime95 + FurMark Stress | 1.7 | 1777 | 102 | 79 |
| Cyberpunk 2077 Stress (evenwichtige modus) | 1.8 | 2197 | 105 | 74 |
| Cyberpunk 2077 Stress (Prestatiemodus) | 1.8 | 2212 | 104 | 75 |
Systeemprestaties
PCMark 10 slaagde er niet in om te voltooien, ongeacht de GPU-instellingen, en daarom worden de scores hieronder niet vermeld.
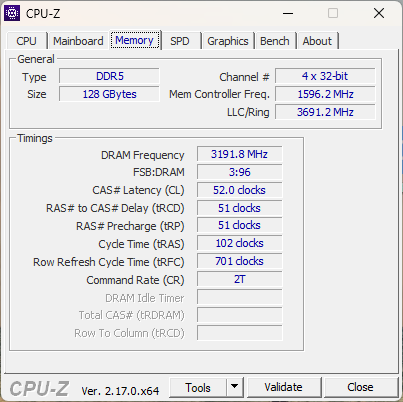
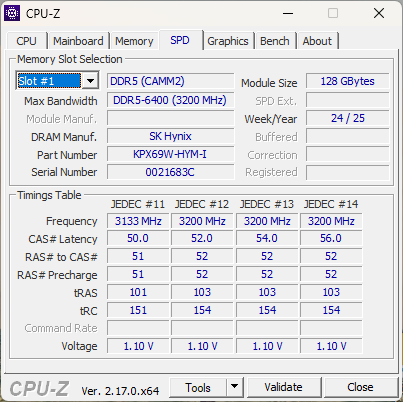
AIDA64 geheugenscores zijn erg hoog, vooral voor een laptop met 128 GB RAM dankzij de CAMM2 vormfactor. De nieuwe standaard is ontworpen om veel van de beperkingen van de verouderende SODIMM-connector te overwinnen.
CrossMark: Overall | Productivity | Creativity | Responsiveness
WebXPRT 3: Overall
WebXPRT 4: Overall
Mozilla Kraken 1.1: Total
| Performance rating | |
| Dell Pro Max 18 Plus MB18250 | |
| Gemiddeld Intel Core Ultra 9 285HX, NVIDIA RTX PRO 5000 Blackwell Generation Laptop | |
| Dell Pro Max 16 Plus | |
| Schenker Key 18 Pro M25 RTX 5090 | |
| HP ZBook X G1i 16 | |
| HP ZBook Studio 16 G11 | |
| Lenovo ThinkPad P16s Gen 4 21RX000YGE | |
| CrossMark / Overall | |
| Dell Pro Max 18 Plus MB18250 | |
| Dell Pro Max 16 Plus | |
| Gemiddeld Intel Core Ultra 9 285HX, NVIDIA RTX PRO 5000 Blackwell Generation Laptop (2142 - 2267, n=3) | |
| Schenker Key 18 Pro M25 RTX 5090 | |
| HP ZBook X G1i 16 | |
| HP ZBook Studio 16 G11 | |
| Lenovo ThinkPad P16s Gen 4 21RX000YGE | |
| CrossMark / Productivity | |
| Gemiddeld Intel Core Ultra 9 285HX, NVIDIA RTX PRO 5000 Blackwell Generation Laptop (2016 - 2028, n=3) | |
| Dell Pro Max 16 Plus | |
| Dell Pro Max 18 Plus MB18250 | |
| Schenker Key 18 Pro M25 RTX 5090 | |
| HP ZBook X G1i 16 | |
| HP ZBook Studio 16 G11 | |
| Lenovo ThinkPad P16s Gen 4 21RX000YGE | |
| CrossMark / Creativity | |
| Dell Pro Max 18 Plus MB18250 | |
| Dell Pro Max 16 Plus | |
| Gemiddeld Intel Core Ultra 9 285HX, NVIDIA RTX PRO 5000 Blackwell Generation Laptop (2395 - 2725, n=3) | |
| HP ZBook X G1i 16 | |
| Schenker Key 18 Pro M25 RTX 5090 | |
| HP ZBook Studio 16 G11 | |
| Lenovo ThinkPad P16s Gen 4 21RX000YGE | |
| CrossMark / Responsiveness | |
| Schenker Key 18 Pro M25 RTX 5090 | |
| Dell Pro Max 18 Plus MB18250 | |
| Gemiddeld Intel Core Ultra 9 285HX, NVIDIA RTX PRO 5000 Blackwell Generation Laptop (1806 - 1858, n=3) | |
| Dell Pro Max 16 Plus | |
| HP ZBook X G1i 16 | |
| HP ZBook Studio 16 G11 | |
| Lenovo ThinkPad P16s Gen 4 21RX000YGE | |
| WebXPRT 3 / Overall | |
| Dell Pro Max 18 Plus MB18250 | |
| Gemiddeld Intel Core Ultra 9 285HX, NVIDIA RTX PRO 5000 Blackwell Generation Laptop (327 - 360, n=3) | |
| Schenker Key 18 Pro M25 RTX 5090 | |
| Dell Pro Max 16 Plus | |
| HP ZBook X G1i 16 | |
| Lenovo ThinkPad P16s Gen 4 21RX000YGE | |
| HP ZBook Studio 16 G11 | |
| WebXPRT 4 / Overall | |
| Schenker Key 18 Pro M25 RTX 5090 | |
| Gemiddeld Intel Core Ultra 9 285HX, NVIDIA RTX PRO 5000 Blackwell Generation Laptop (306 - 323, n=3) | |
| Dell Pro Max 16 Plus | |
| Dell Pro Max 18 Plus MB18250 | |
| HP ZBook X G1i 16 | |
| HP ZBook Studio 16 G11 | |
| Lenovo ThinkPad P16s Gen 4 21RX000YGE | |
| Mozilla Kraken 1.1 / Total | |
| HP ZBook Studio 16 G11 | |
| Lenovo ThinkPad P16s Gen 4 21RX000YGE | |
| HP ZBook X G1i 16 | |
| Dell Pro Max 18 Plus MB18250 | |
| Dell Pro Max 16 Plus | |
| Gemiddeld Intel Core Ultra 9 285HX, NVIDIA RTX PRO 5000 Blackwell Generation Laptop (411 - 439, n=3) | |
| Schenker Key 18 Pro M25 RTX 5090 | |
* ... kleiner is beter
| AIDA64 / Memory Copy | |
| Dell Pro Max 16 Plus | |
| Dell Pro Max 18 Plus MB18250 | |
| Gemiddeld Intel Core Ultra 9 285HX (63431 - 93933, n=6) | |
| HP ZBook Studio 16 G11 | |
| Lenovo ThinkPad P16s Gen 4 21RX000YGE | |
| Schenker Key 18 Pro M25 RTX 5090 | |
| AIDA64 / Memory Read | |
| Dell Pro Max 16 Plus | |
| Dell Pro Max 18 Plus MB18250 | |
| Lenovo ThinkPad P16s Gen 4 21RX000YGE | |
| Gemiddeld Intel Core Ultra 9 285HX (67084 - 97565, n=6) | |
| HP ZBook Studio 16 G11 | |
| Schenker Key 18 Pro M25 RTX 5090 | |
| AIDA64 / Memory Write | |
| Dell Pro Max 18 Plus MB18250 | |
| Dell Pro Max 16 Plus | |
| Lenovo ThinkPad P16s Gen 4 21RX000YGE | |
| Gemiddeld Intel Core Ultra 9 285HX (64112 - 89691, n=6) | |
| HP ZBook Studio 16 G11 | |
| Schenker Key 18 Pro M25 RTX 5090 | |
| AIDA64 / Memory Latency | |
| Schenker Key 18 Pro M25 RTX 5090 | |
| Gemiddeld Intel Core Ultra 9 285HX (104.8 - 151.7, n=6) | |
| HP ZBook Studio 16 G11 | |
| Dell Pro Max 16 Plus | |
| Dell Pro Max 18 Plus MB18250 | |
| Lenovo ThinkPad P16s Gen 4 21RX000YGE | |
* ... kleiner is beter
DPC latentie
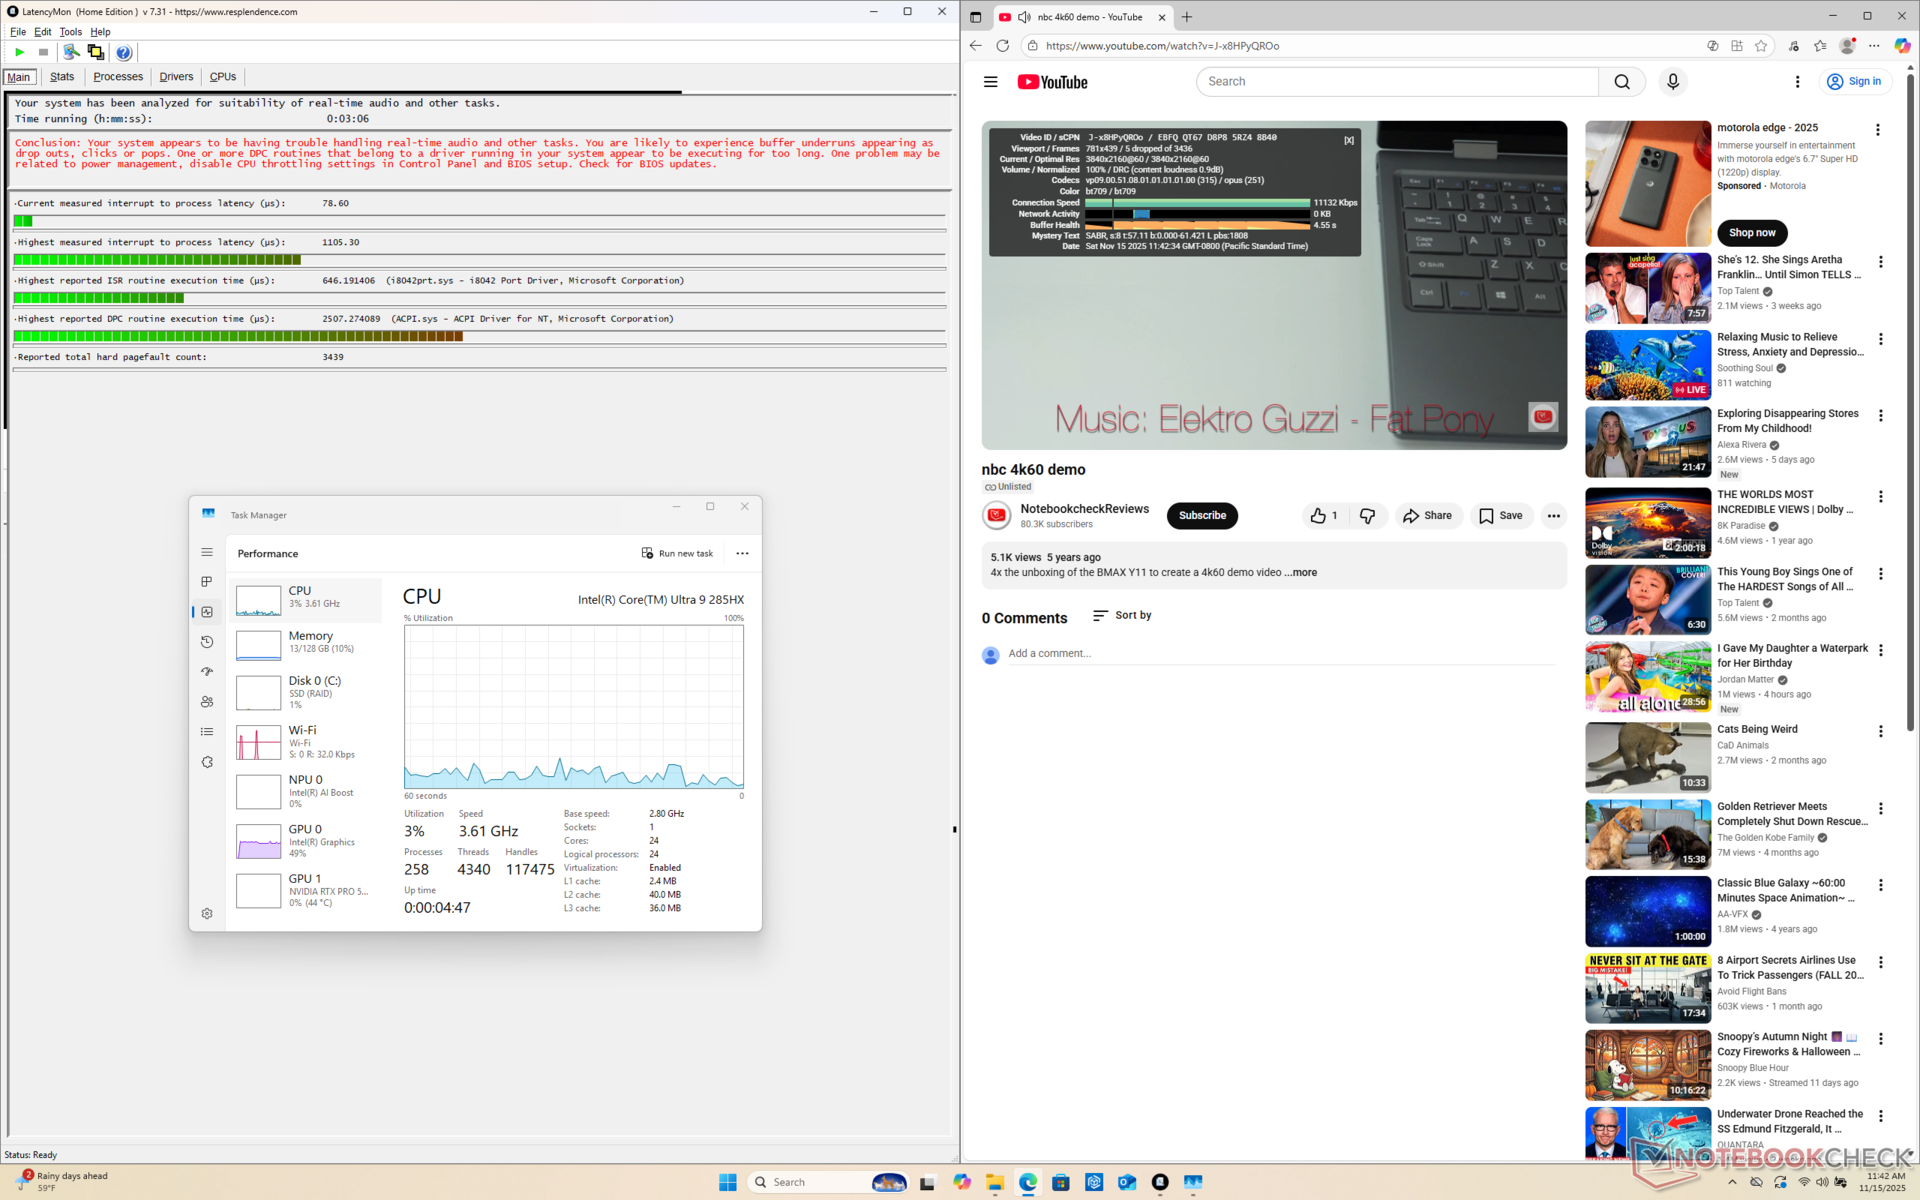
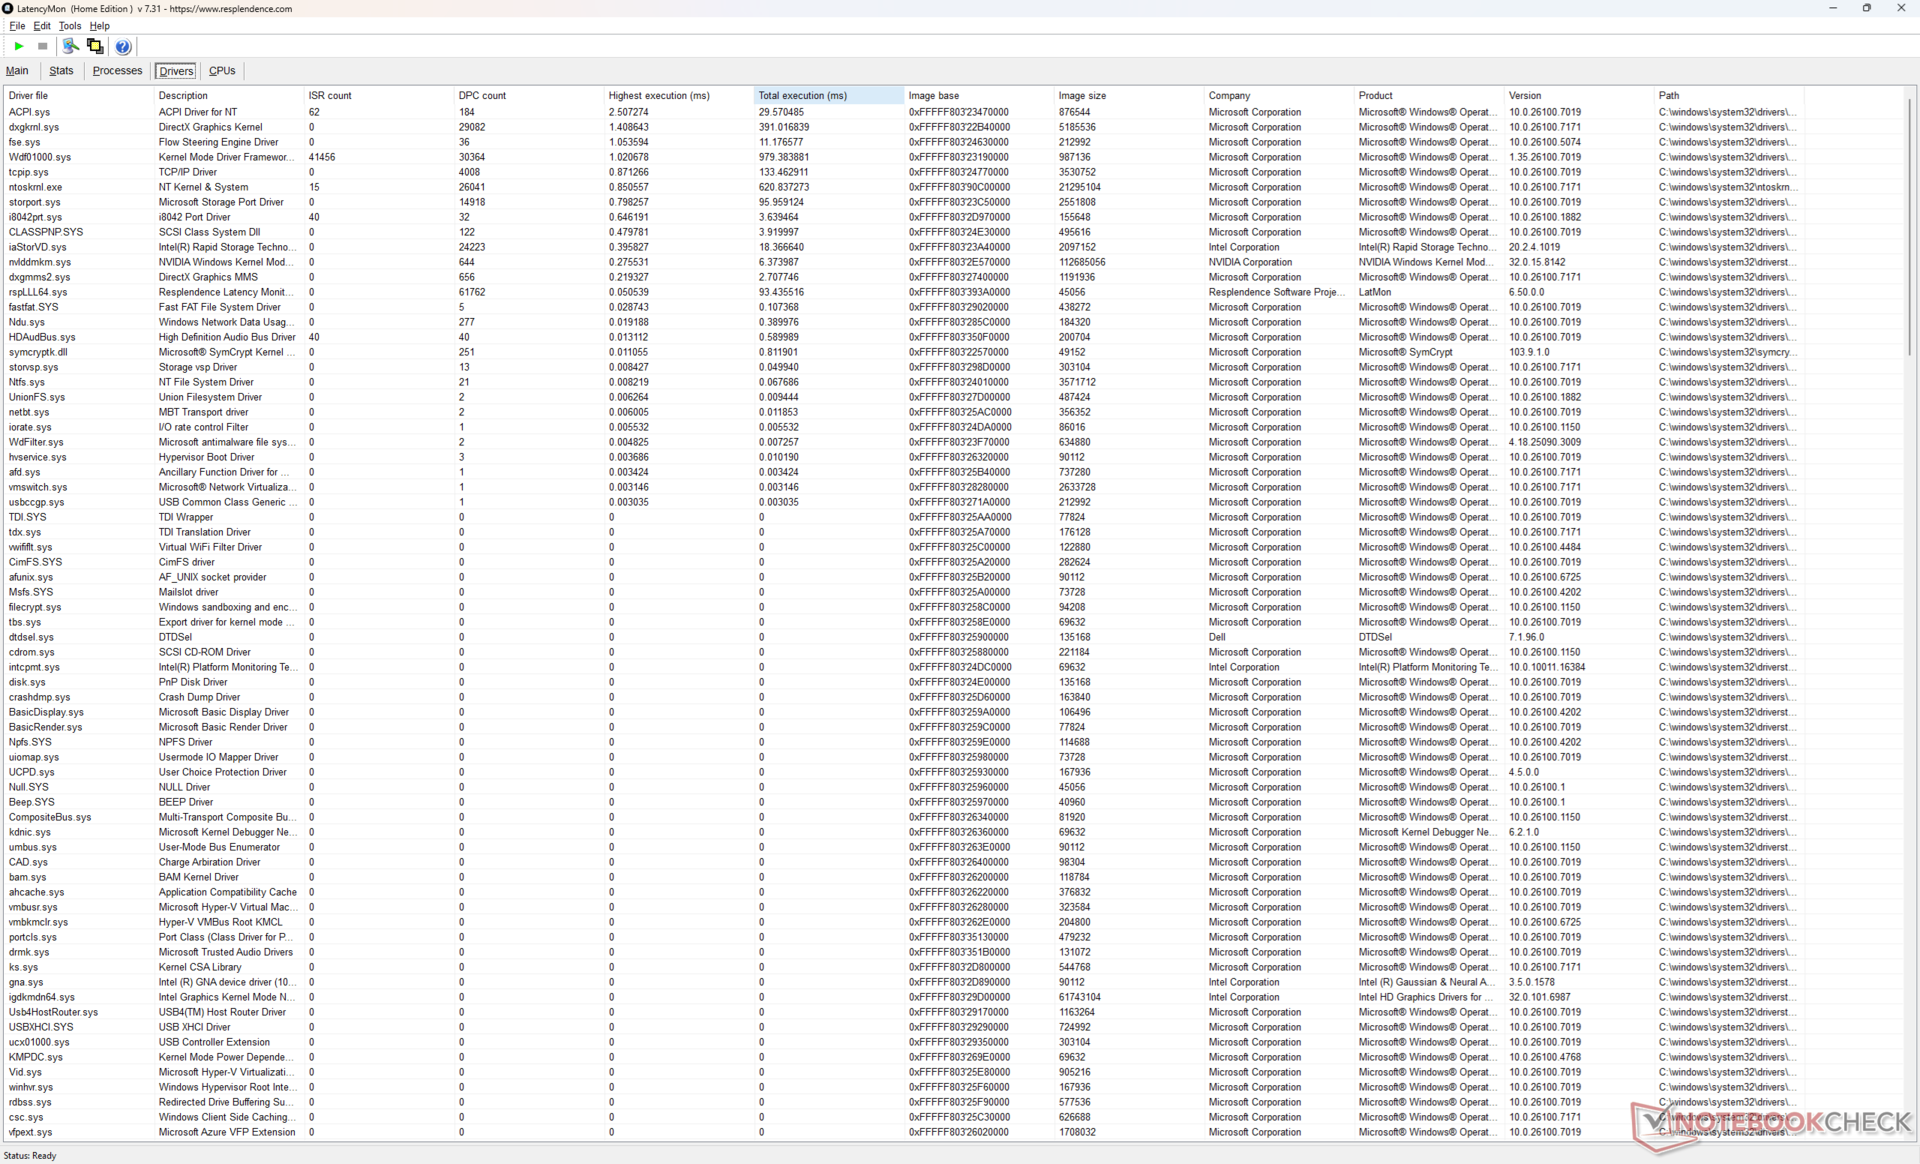
| DPC Latencies / LatencyMon - interrupt to process latency (max), Web, Youtube, Prime95 | |
| Schenker Key 18 Pro M25 RTX 5090 | |
| Dell Pro Max 16 Plus | |
| HP ZBook Studio 16 G11 | |
| Dell Pro Max 18 Plus MB18250 | |
| Lenovo ThinkPad P16s Gen 4 21RX000YGE | |
| HP ZBook X G1i 16 | |
* ... kleiner is beter
Opslagapparaten
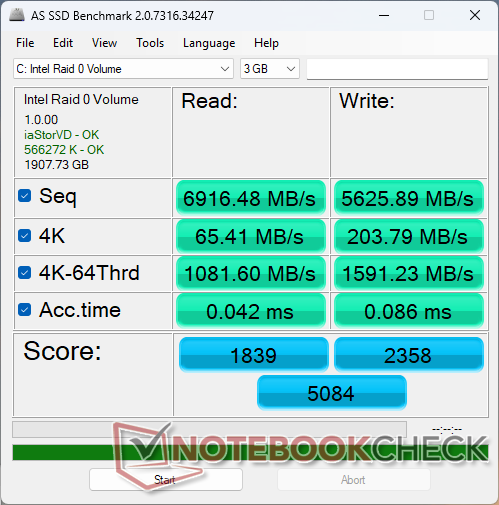
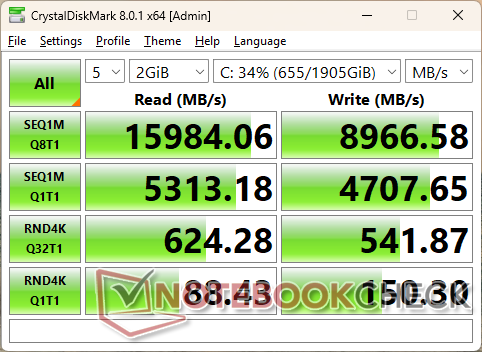
Onze testunit draait op twee SK hynix PCB01 PCIe5 SSD's in RAID 0-configuratie. Een enkele schijf kan overdrachtsnelheden bereiken van ~16000 MB/s, zij het slechts enkele minuten per keer, volgens onze DiskSpd loop-testresultaten hieronder.

| Drive Performance rating - Percent | |
| Schenker Key 18 Pro M25 RTX 5090 | |
| HP ZBook X G1i 16 | |
| Dell Pro Max 16 Plus | |
| Dell Pro Max 18 Plus MB18250 | |
| Lenovo ThinkPad P16s Gen 4 21RX000YGE | |
| HP ZBook Studio 16 G11 | |
* ... kleiner is beter
Schijf onderdrukken: DiskSpd Leeslus, wachtrijdiepte 8
GPU-prestaties
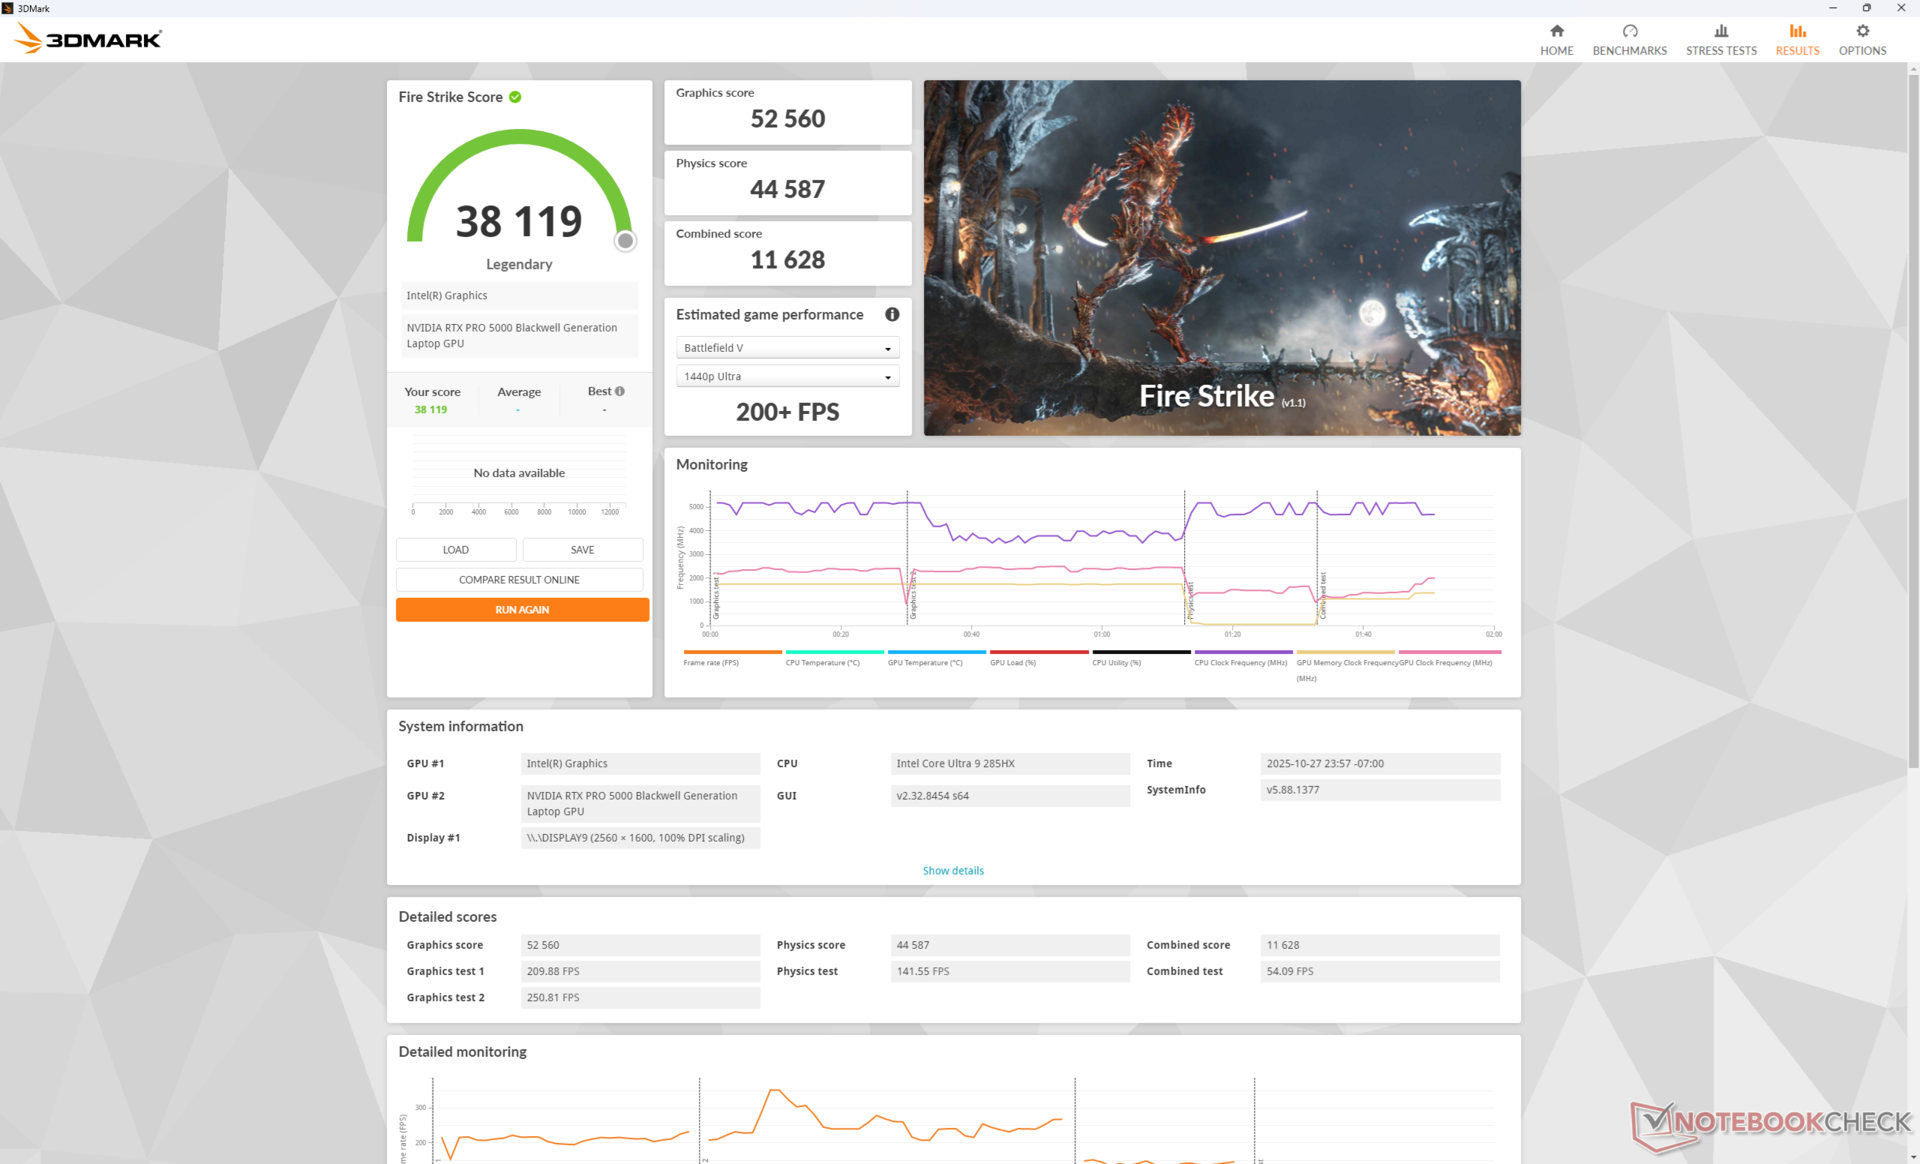
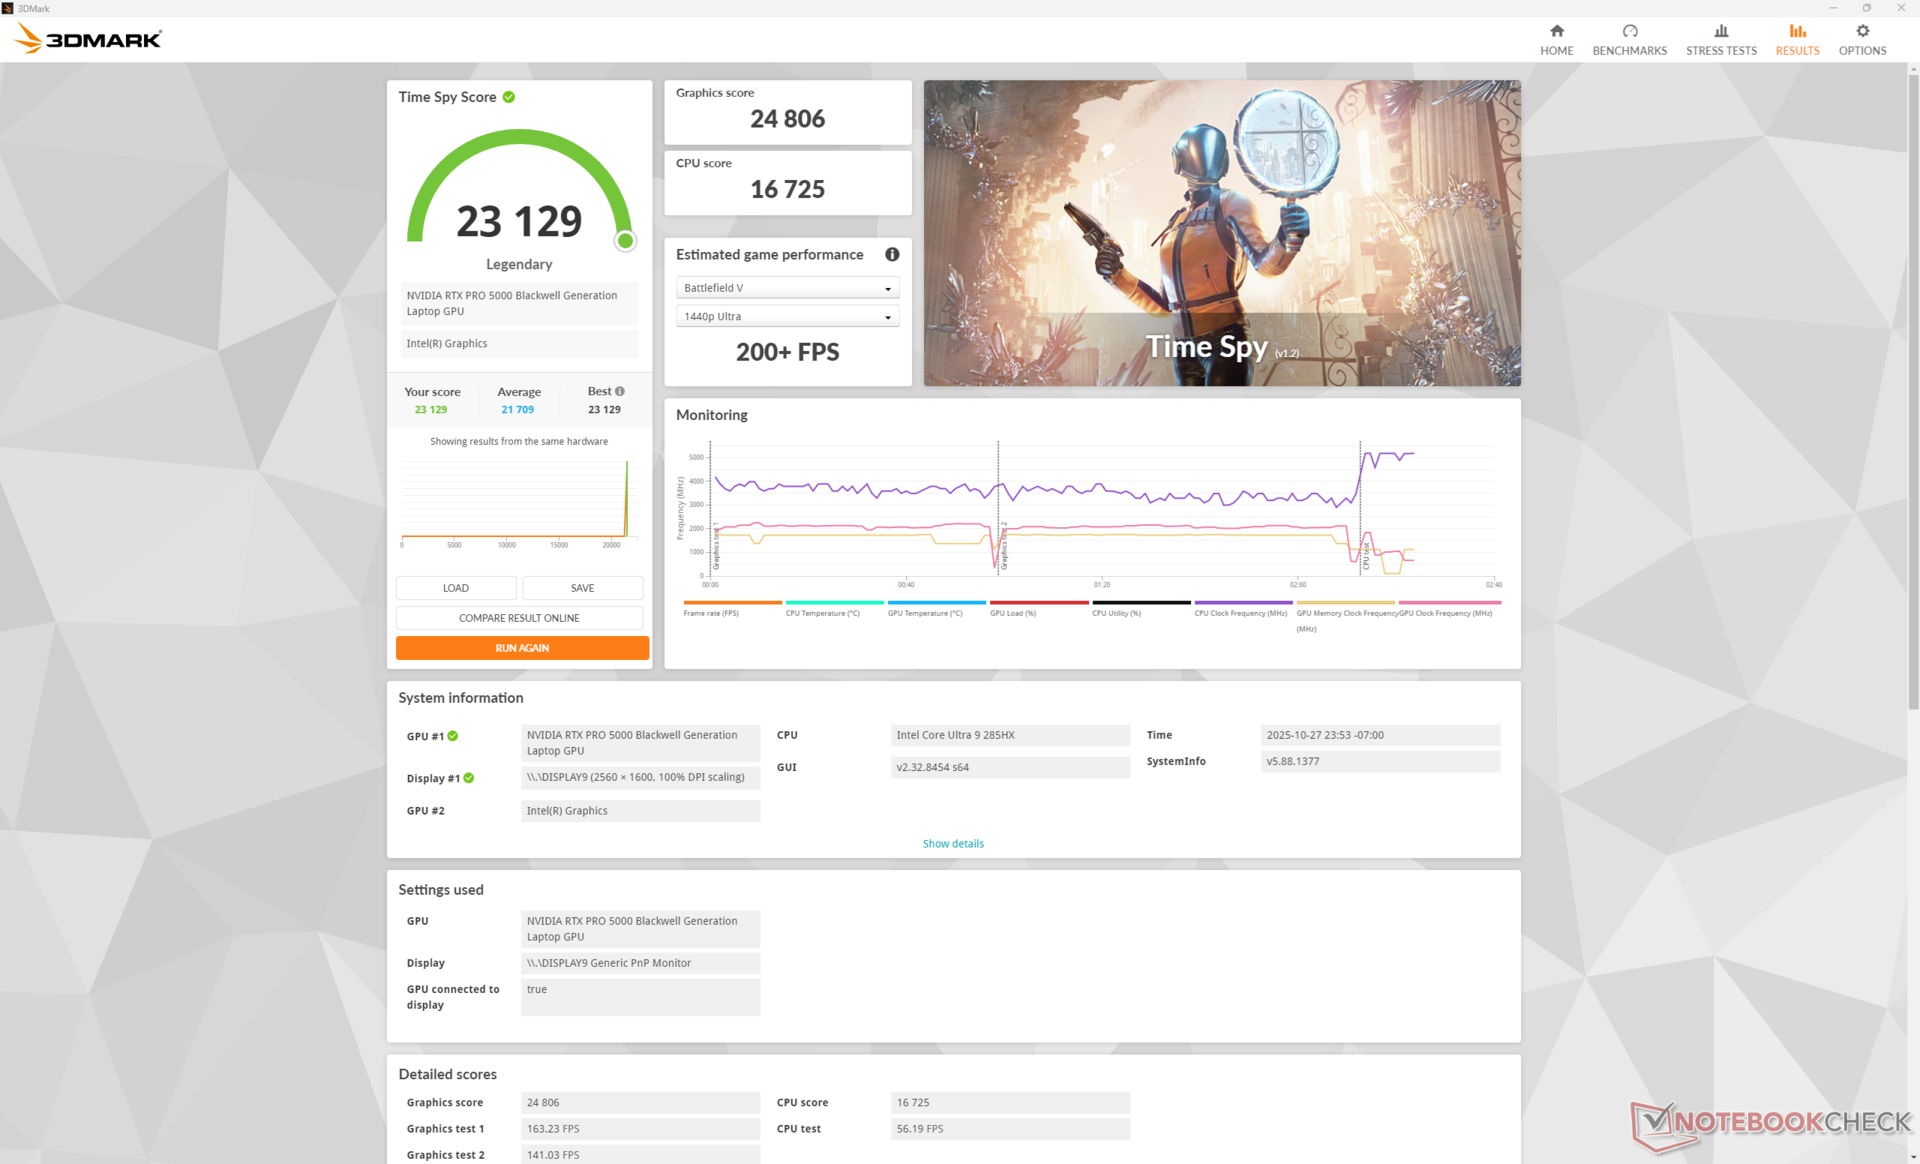
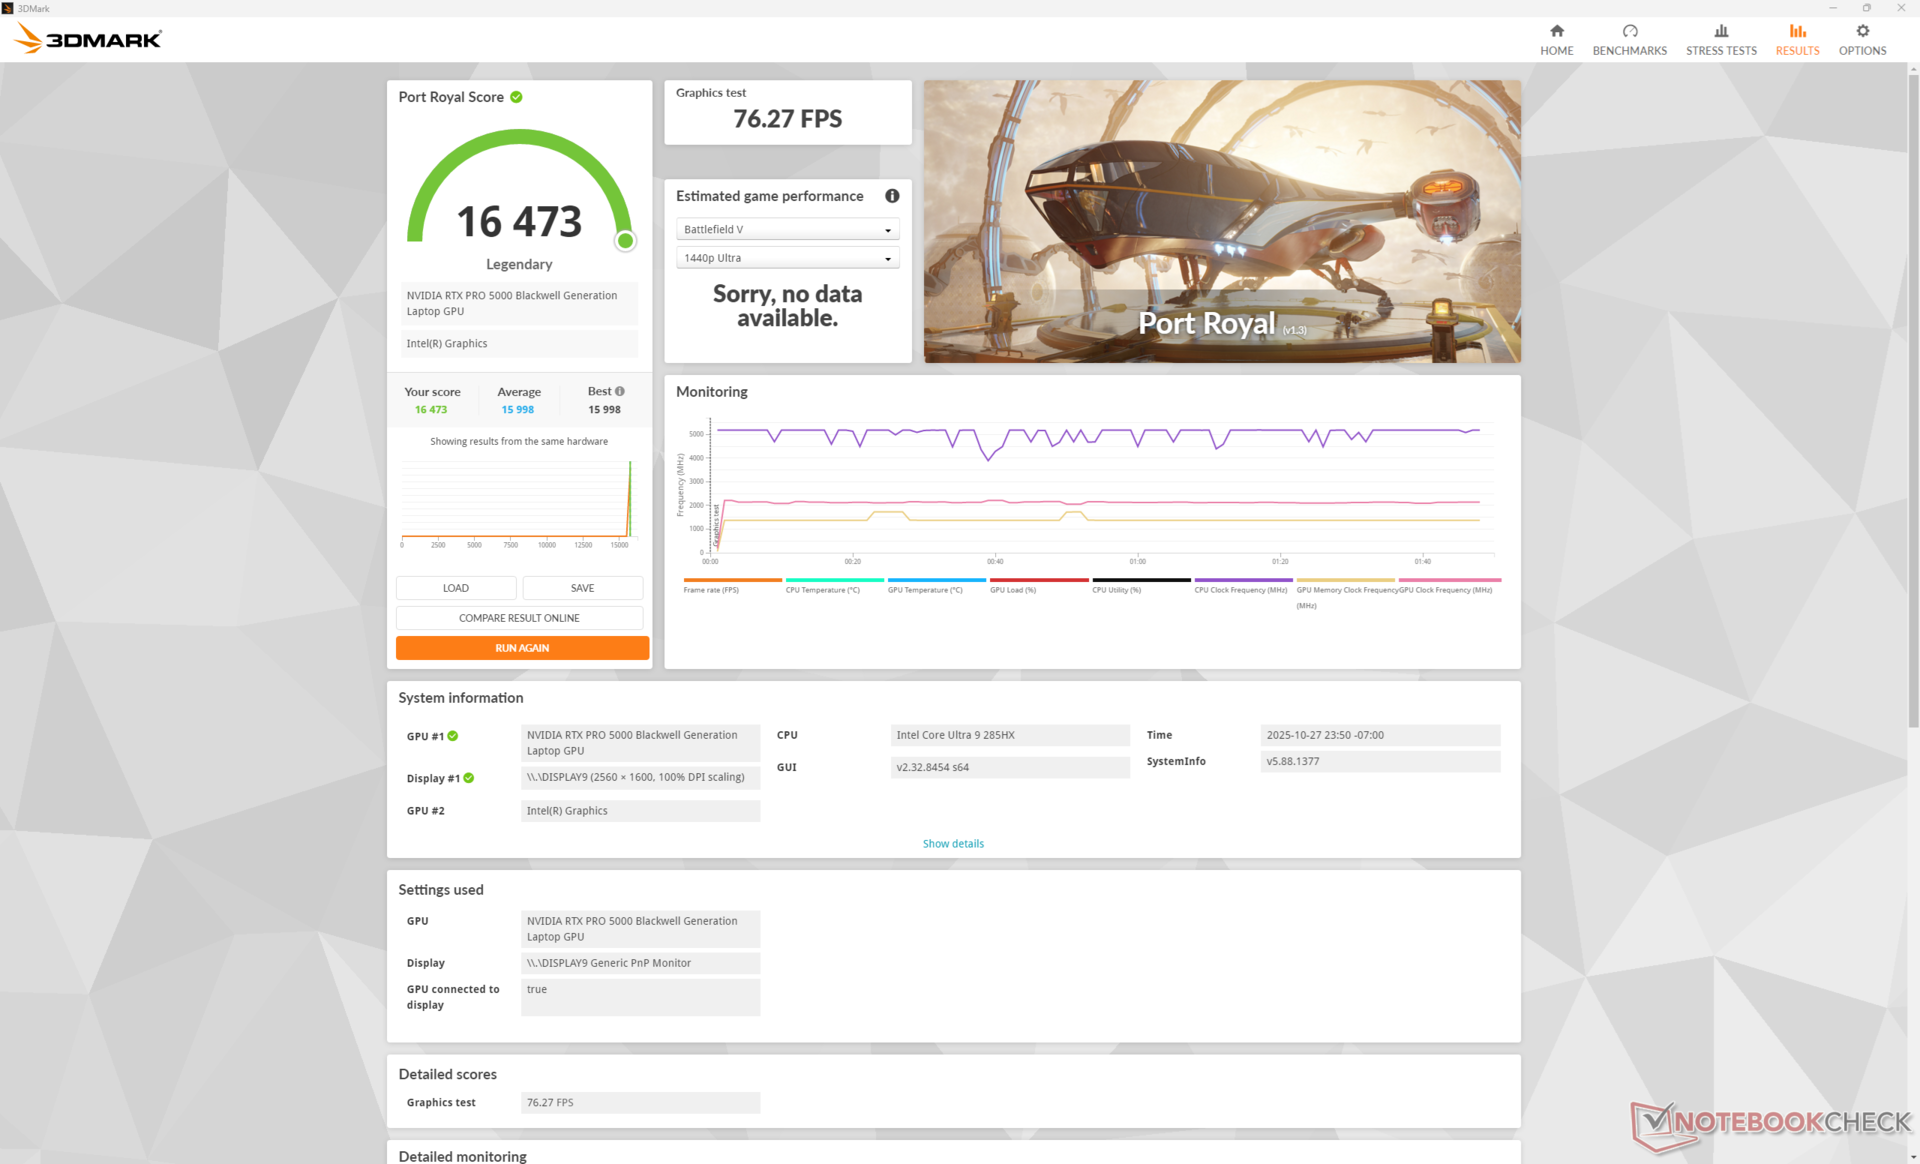
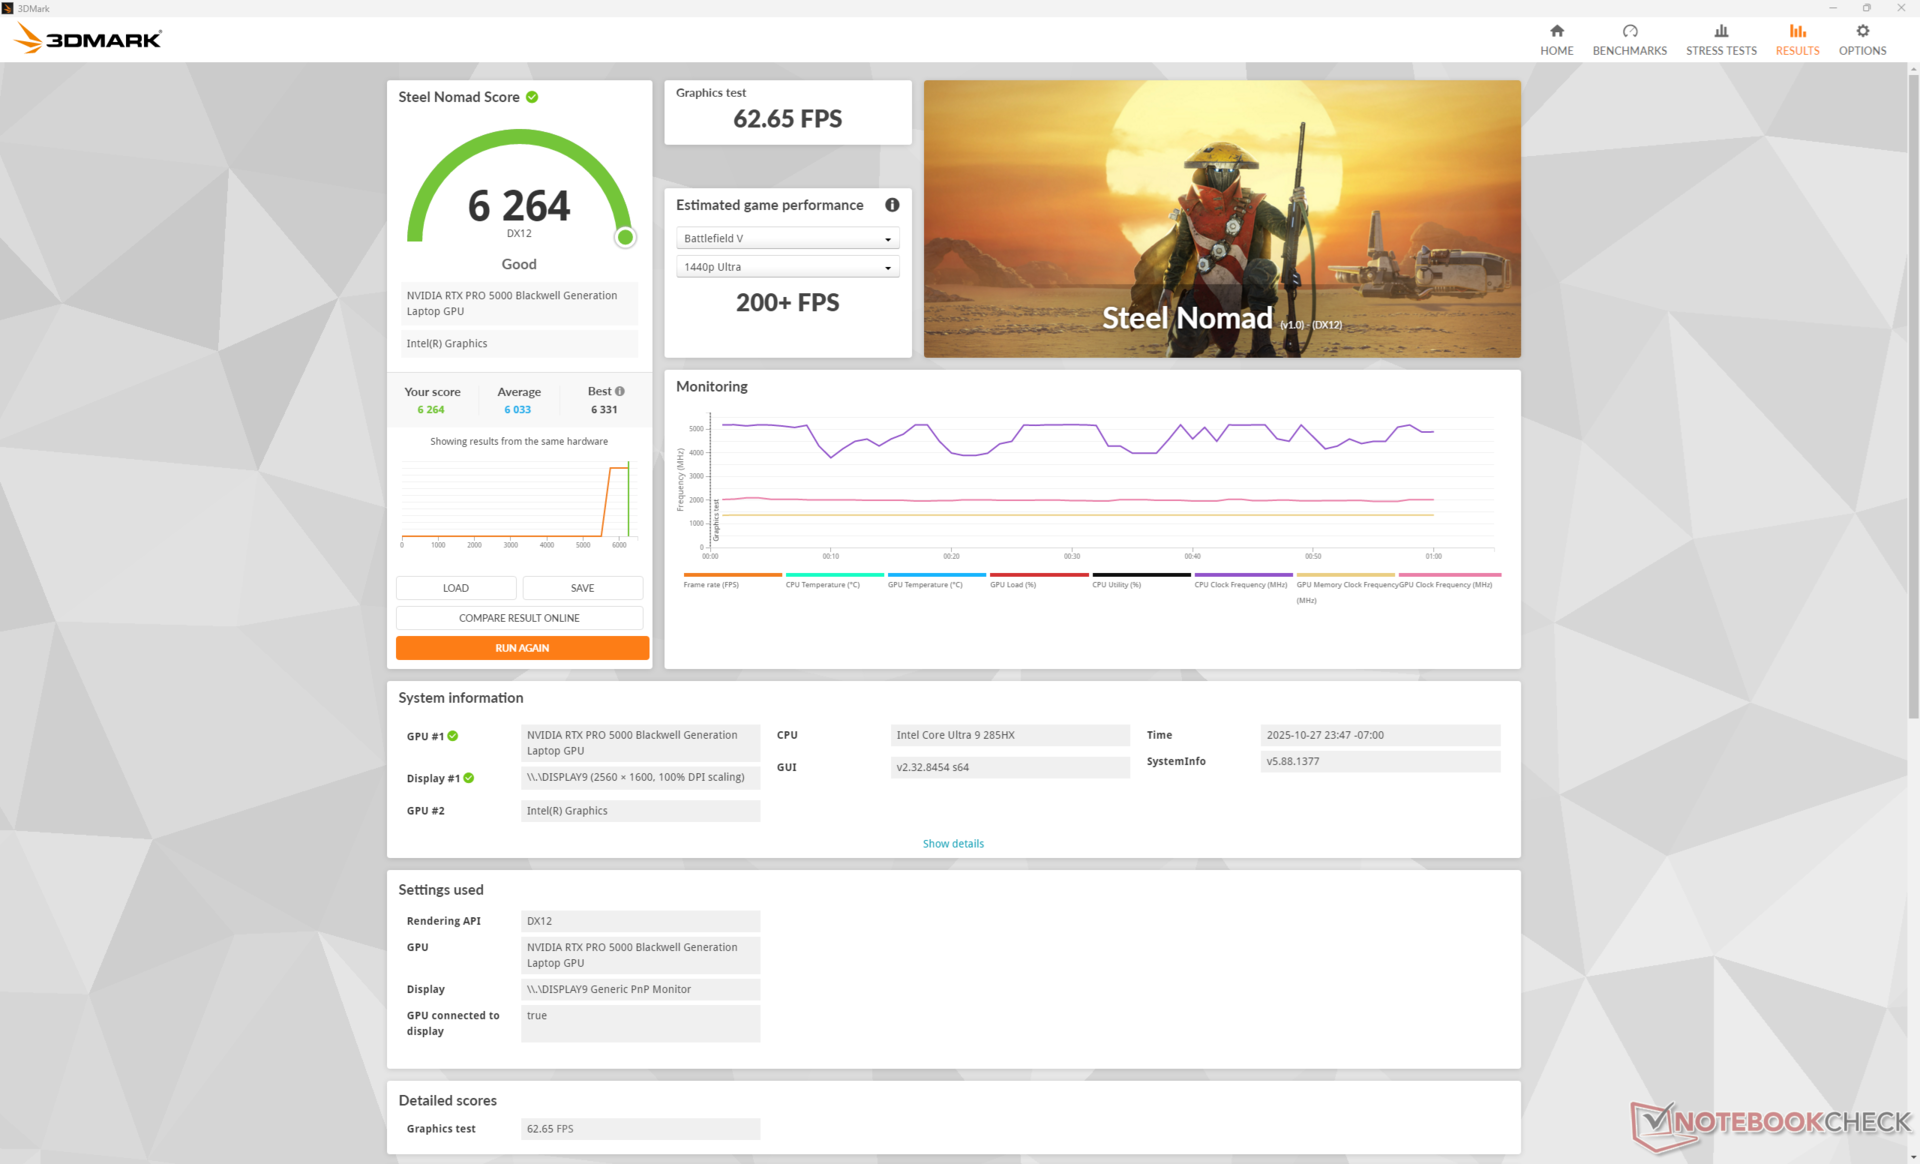
De grafische prestaties zijn met slechts een paar procentpunten net iets sneller dan op de Dell Pro Max 16 Plus met dezelfde GPU. Het gemiddelde stroomverbruik van de GPU-kaart is ongeveer 163 W in de modus Prestaties, wat dicht bij het maximum van 175 W ligt.
| Vermogensprofiel | Grafische Score | Fysica Score | Gecombineerde Score |
| Prestatiemodus | 52560 | 44587 | 11628 |
| Evenwichtige modus | 47593 (-10%) | 47039 (+6%) | 11029 (-5%) |
| Batterijvermogen | 22941 (-56%) | 32131 (-28%) | 6944 (-40%) |
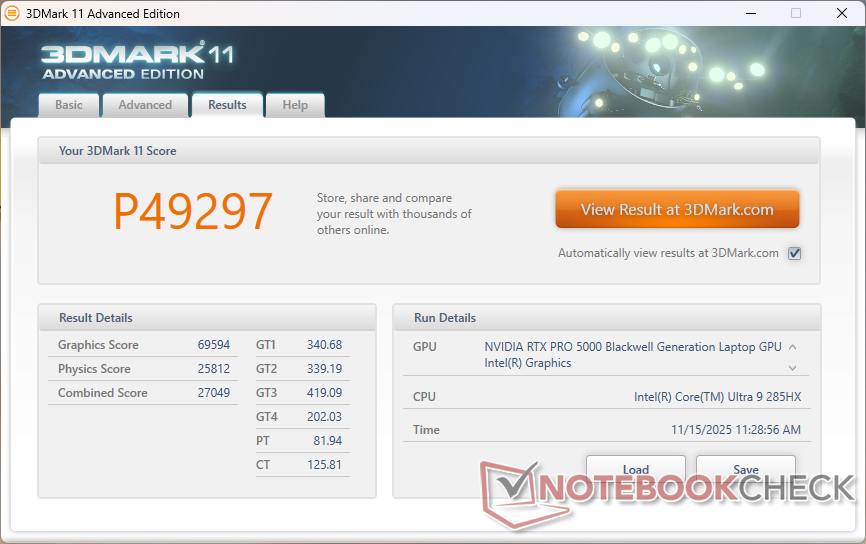
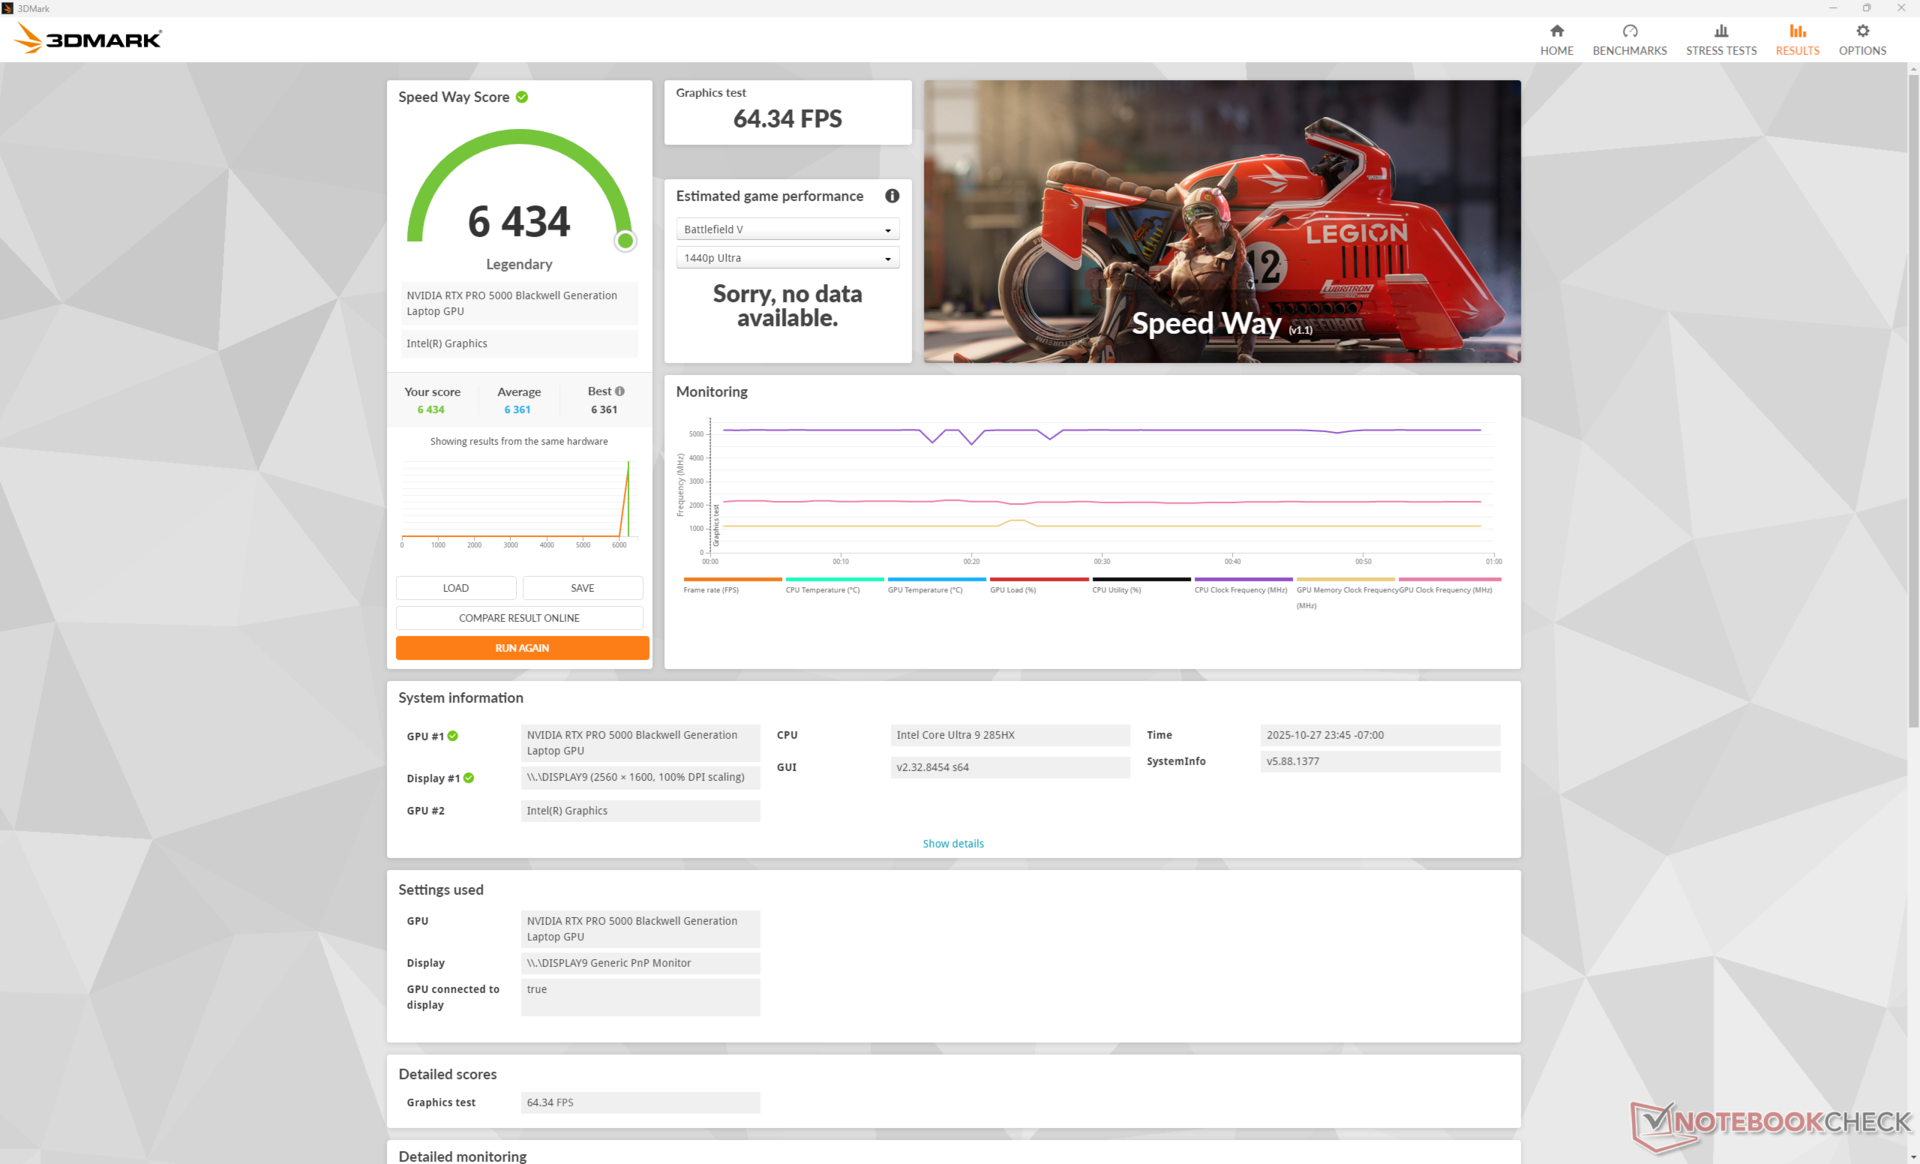
| 3DMark 11 Performance | 49297 punten | |
| 3DMark Cloud Gate Standard Score | 67936 punten | |
| 3DMark Fire Strike Score | 38119 punten | |
| 3DMark Time Spy Score | 23129 punten | |
| 3DMark Steel Nomad Score | 6264 punten | |
Help | ||
* ... kleiner is beter
| Performance rating - Percent | |
| Dell Pro Max 18 Plus MB18250 | |
| Schenker Key 18 Pro M25 RTX 5090 | |
| Dell Pro Max 16 Plus | |
| HP ZBook X G1i 16 | |
| HP ZBook Studio 16 G11 | |
| Lenovo ThinkPad P16s Gen 4 21RX000YGE -1! | |
| Cyberpunk 2077 - 1920x1080 Ultra Preset (FSR off) | |
| Dell Pro Max 18 Plus MB18250 | |
| Schenker Key 18 Pro M25 RTX 5090 | |
| Dell Pro Max 16 Plus | |
| HP ZBook X G1i 16 | |
| HP ZBook Studio 16 G11 | |
| Lenovo ThinkPad P16s Gen 4 21RX000YGE | |
| Baldur's Gate 3 - 1920x1080 Ultra Preset AA:T | |
| Dell Pro Max 18 Plus MB18250 | |
| Dell Pro Max 16 Plus | |
| Schenker Key 18 Pro M25 RTX 5090 | |
| HP ZBook Studio 16 G11 | |
| HP ZBook X G1i 16 | |
| Lenovo ThinkPad P16s Gen 4 21RX000YGE | |
| GTA V - 1920x1080 Highest AA:4xMSAA + FX AF:16x | |
| Dell Pro Max 18 Plus MB18250 | |
| Schenker Key 18 Pro M25 RTX 5090 | |
| Dell Pro Max 16 Plus | |
| HP ZBook X G1i 16 | |
| HP ZBook Studio 16 G11 | |
| Lenovo ThinkPad P16s Gen 4 21RX000YGE | |
| Final Fantasy XV Benchmark - 1920x1080 High Quality | |
| Dell Pro Max 18 Plus MB18250 | |
| Dell Pro Max 16 Plus | |
| Schenker Key 18 Pro M25 RTX 5090 | |
| HP ZBook X G1i 16 | |
| HP ZBook Studio 16 G11 | |
| Lenovo ThinkPad P16s Gen 4 21RX000YGE | |
| Strange Brigade - 1920x1080 ultra AA:ultra AF:16 | |
| Dell Pro Max 18 Plus MB18250 | |
| Schenker Key 18 Pro M25 RTX 5090 | |
| Dell Pro Max 16 Plus | |
| HP ZBook Studio 16 G11 | |
| HP ZBook X G1i 16 | |
| Dota 2 Reborn - 1920x1080 ultra (3/3) best looking | |
| Dell Pro Max 16 Plus | |
| Dell Pro Max 18 Plus MB18250 | |
| Schenker Key 18 Pro M25 RTX 5090 | |
| HP ZBook Studio 16 G11 | |
| HP ZBook X G1i 16 | |
| Lenovo ThinkPad P16s Gen 4 21RX000YGE | |
| X-Plane 11.11 - 1920x1080 high (fps_test=3) | |
| Dell Pro Max 18 Plus MB18250 | |
| Dell Pro Max 16 Plus | |
| Schenker Key 18 Pro M25 RTX 5090 | |
| HP ZBook Studio 16 G11 | |
| HP ZBook X G1i 16 | |
| Lenovo ThinkPad P16s Gen 4 21RX000YGE | |
| Dota 2 Reborn - 3840x2160 ultra (3/3) best looking | |
| HP ZBook Fury 16 G10 | |
| Schenker Key 18 Pro M25 RTX 5090 | |
| Dell Pro Max 18 Plus MB18250 | |
| Gemiddeld NVIDIA RTX PRO 5000 Blackwell Generation Laptop (143.9 - 149.4, n=3) | |
| Dell Pro Max 16 Plus | |
| Dell Precision 7000 7670 Performance | |
Cyberpunk 2077 ultra FPS Grafiek
| lage | gem. | hoge | ultra | QHD DLSS | QHD | 4K DLSS | 4K FSR | 4K | |
|---|---|---|---|---|---|---|---|---|---|
| GTA V (2015) | 186.7 | 185.8 | 178.3 | 156.1 | 152.6 | ||||
| Dota 2 Reborn (2015) | 219 | 179.8 | 182 | 163.9 | 149.4 | ||||
| Final Fantasy XV Benchmark (2018) | 233 | 232 | 197.6 | 156.9 | 101.5 | ||||
| X-Plane 11.11 (2018) | 154.4 | 133.2 | 104.2 | 94.4 | |||||
| Strange Brigade (2018) | 548 | 442 | 426 | 418 | 351 | 188.7 | |||
| Baldur's Gate 3 (2023) | 253 | 238 | 212 | 205 | 198.2 | 150.3 | 126.3 | 85.9 | |
| Cyberpunk 2077 (2023) | 176 | 174.3 | 161.4 | 152.4 | 130.3 | 116.7 | |||
| F1 24 (2024) | 338 | 322 | 322 | 147.7 | 148.6 | 101.8 | 85.7 | 83.6 | 50.2 |
Uitstoot
Systeemgeluid
De drie interne ventilatoren zijn bijna altijd actief, waardoor het systeem in de meeste gevallen nooit echt stil is. Toch zijn ze in een normaal kantoor bijna onhoorbaar tijdens de meeste lage tot gemiddelde werkbelastingen en ze worden pas merkbaar bij veel hogere belastingen. We halen bijna 54 dB(A) bij het draaien van games of vergelijkbare belastingen in de Balanced modus of Performance modus.
Misschien is het niet toevallig dat het gedrag en de metingen van de ventilator erg lijken op wat we hebben geregistreerd op de Dell Pro Max 16 Plus.
Geluidsniveau
| Onbelast |
| 27.1 / 27.1 / 27.1 dB (A) |
| Belasting |
| 38 / 53.8 dB (A) |
 | ||
30 dB stil 40 dB(A) hoorbaar 50 dB(A) luid |
||
min: | ||
| Dell Pro Max 18 Plus MB18250 Ultra 9 285HX, RTX PRO 5000 Blackwell Generation Laptop | Schenker Key 18 Pro M25 RTX 5090 Ultra 9 275HX, GeForce RTX 5090 Laptop | HP ZBook X G1i 16 Ultra 7 265H, RTX PRO 2000 Blackwell Generation Laptop | HP ZBook Studio 16 G11 Ultra 9 185H, RTX 3000 Ada Generation Laptop | Lenovo ThinkPad P16s Gen 4 21RX000YGE Ryzen AI 9 HX PRO 370, Radeon 890M | Dell Pro Max 16 Plus Ultra 9 285HX, RTX PRO 5000 Blackwell Generation Laptop | |
|---|---|---|---|---|---|---|
| Noise | -3% | 9% | 6% | -0% | -6% | |
| uit / omgeving * (dB) | 23.1 | 23.9 -3% | 23.7 -3% | 23.8 -3% | 25.9 -12% | 23.2 -0% |
| Idle Minimum * (dB) | 27.1 | 25.2 7% | 23.7 13% | 23.8 12% | 25.9 4% | 26.7 1% |
| Idle Average * (dB) | 27.1 | 25.2 7% | 23.7 13% | 26.4 3% | 25.9 4% | 30.5 -13% |
| Idle Maximum * (dB) | 27.1 | 25.2 7% | 23.7 13% | 26.4 3% | 28.5 -5% | 34 -25% |
| Load Average * (dB) | 38 | 47.8 -26% | 32.7 14% | 33.7 11% | 42.9 -13% | 39.8 -5% |
| Cyberpunk 2077 ultra * (dB) | 53.8 | 54.4 -1% | 50.9 5% | 46.1 14% | 48.7 9% | 54.3 -1% |
| Load Maximum * (dB) | 53.8 | 58.6 -9% | 48 11% | 53.2 1% | 48.5 10% | 54.3 -1% |
* ... kleiner is beter
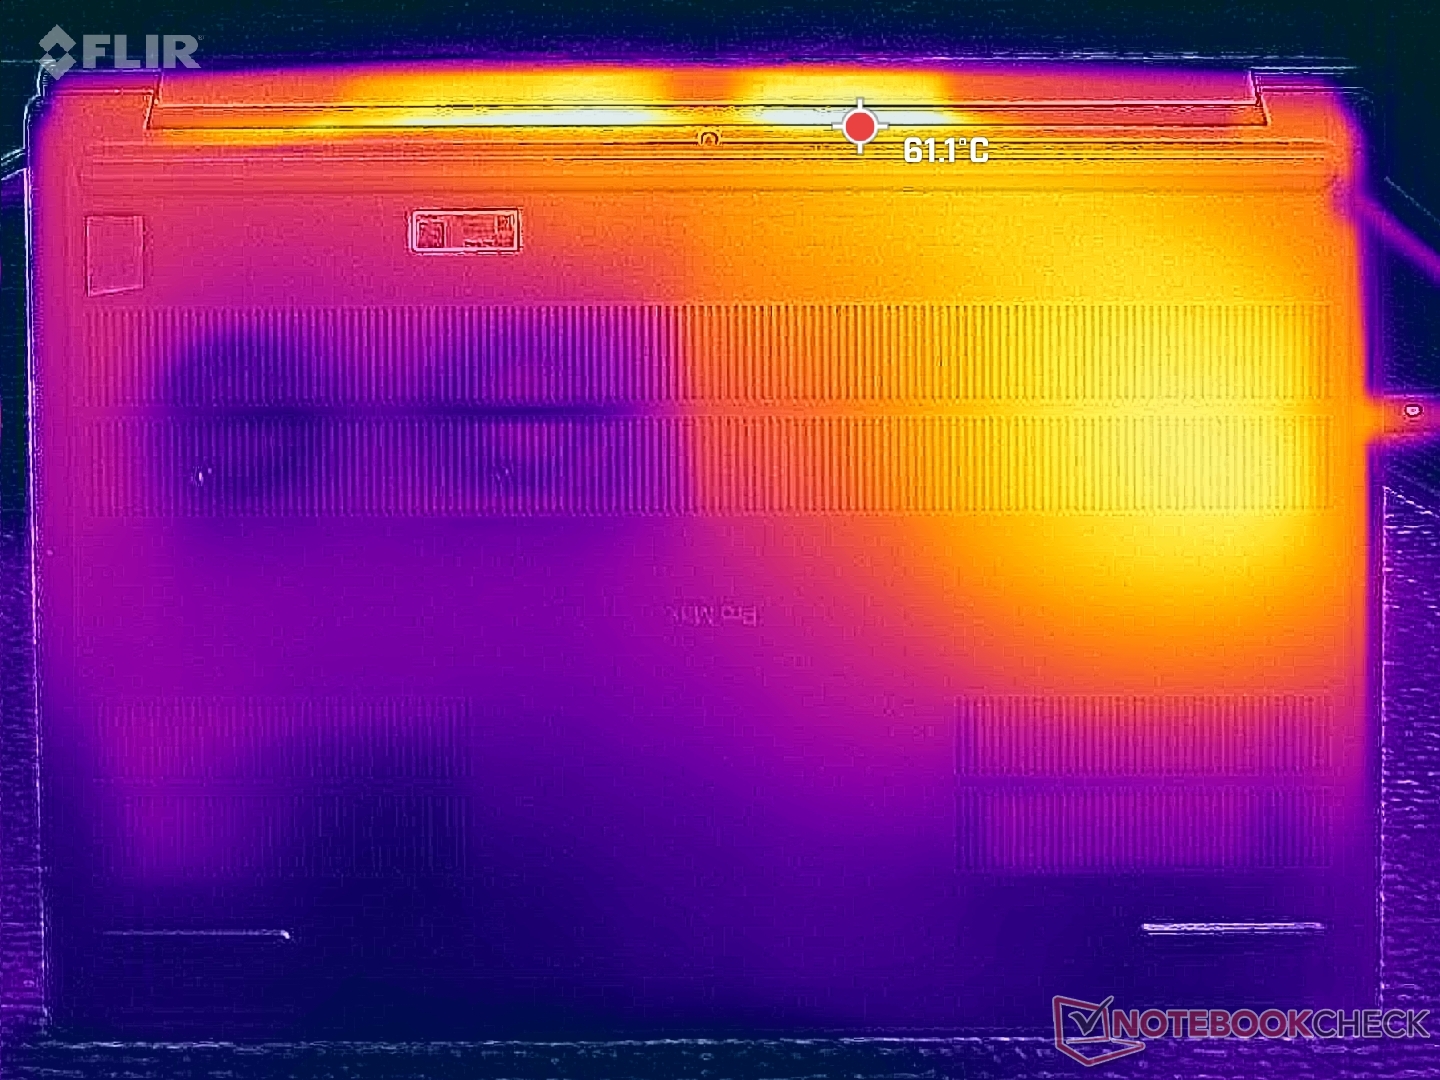
Temperatuur
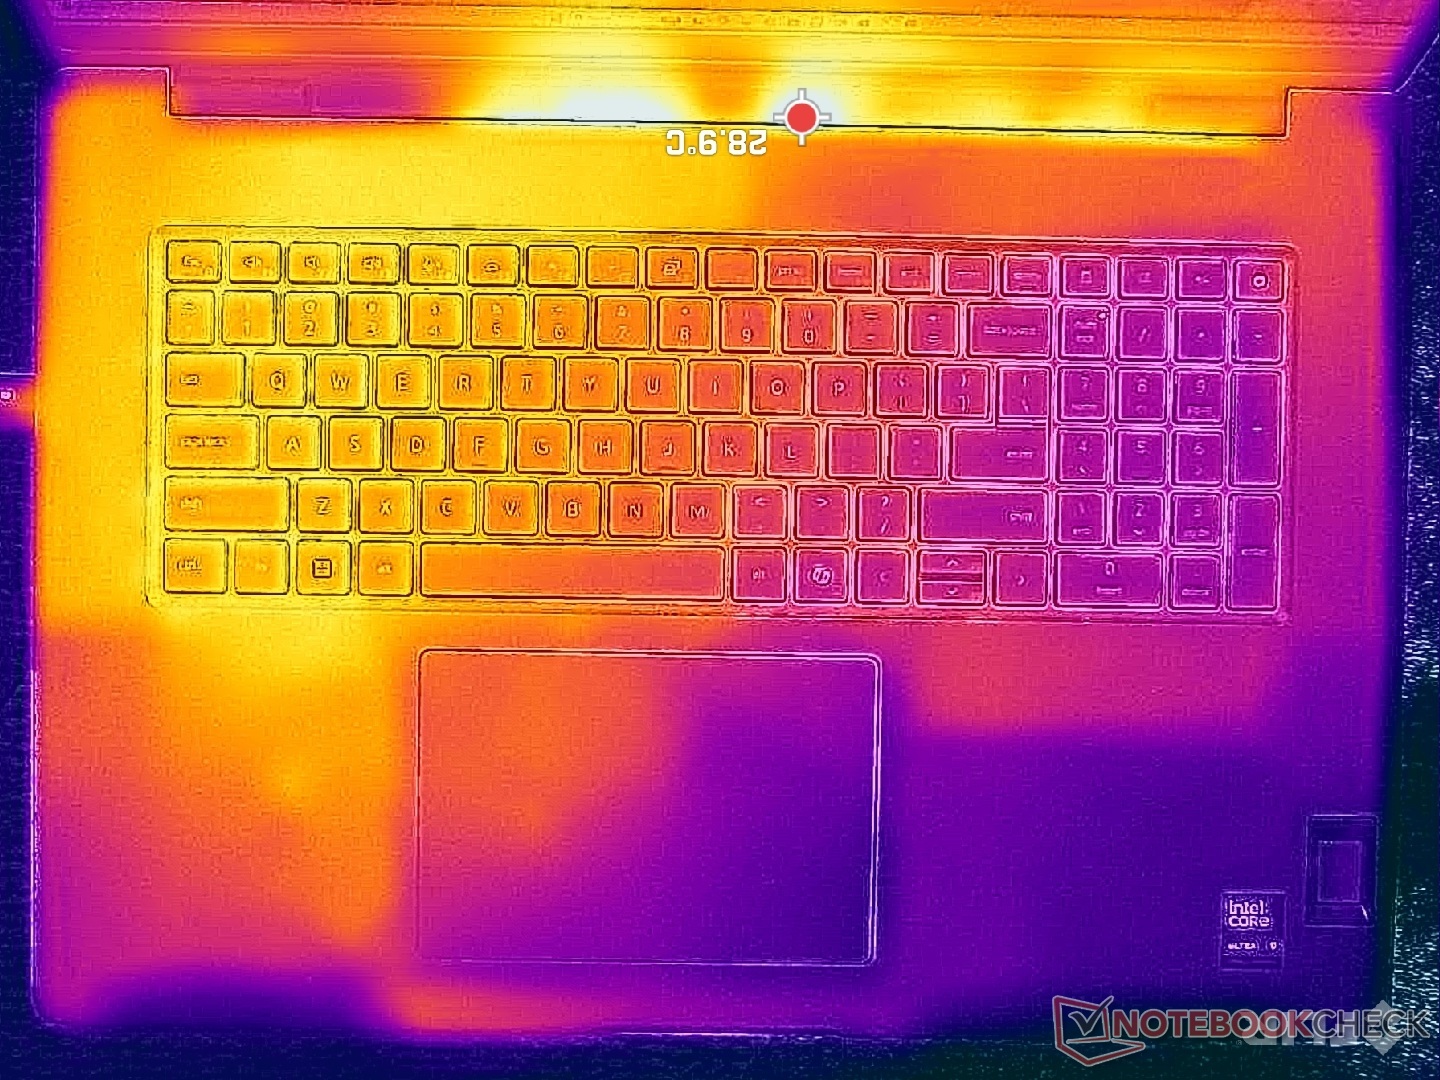
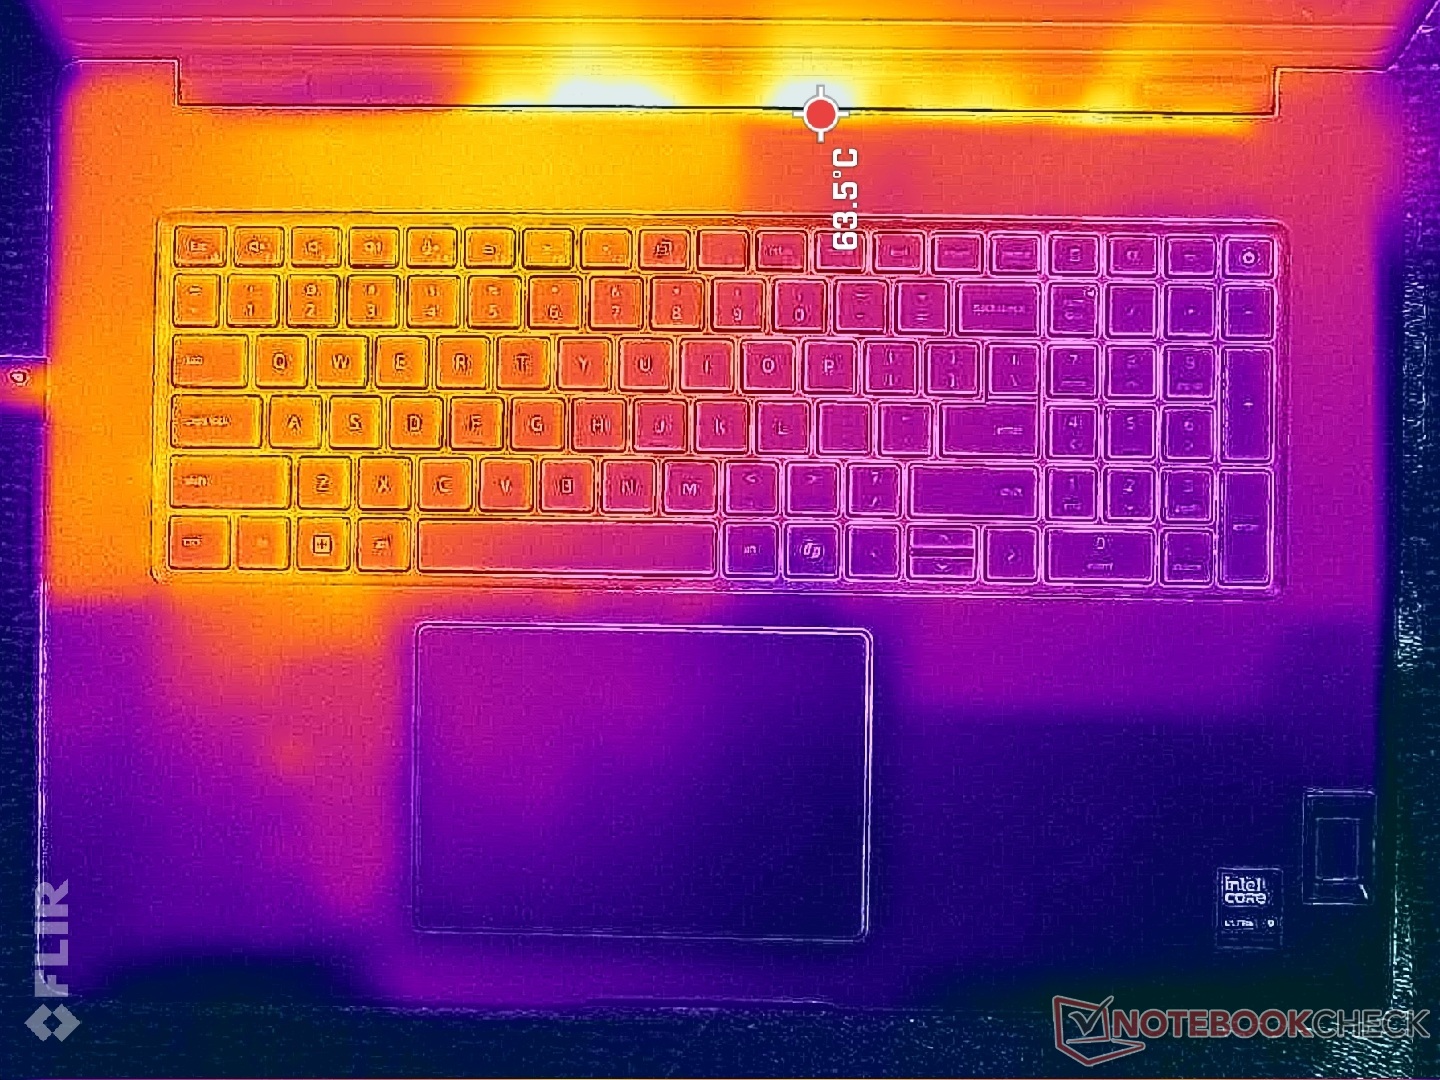
De oppervlaktetemperaturen zijn warmer op de linkerhelft van het systeem dan op de rechterhelft, waar hete plekken 43 C tot 47 C kunnen bereiken bij belasting.
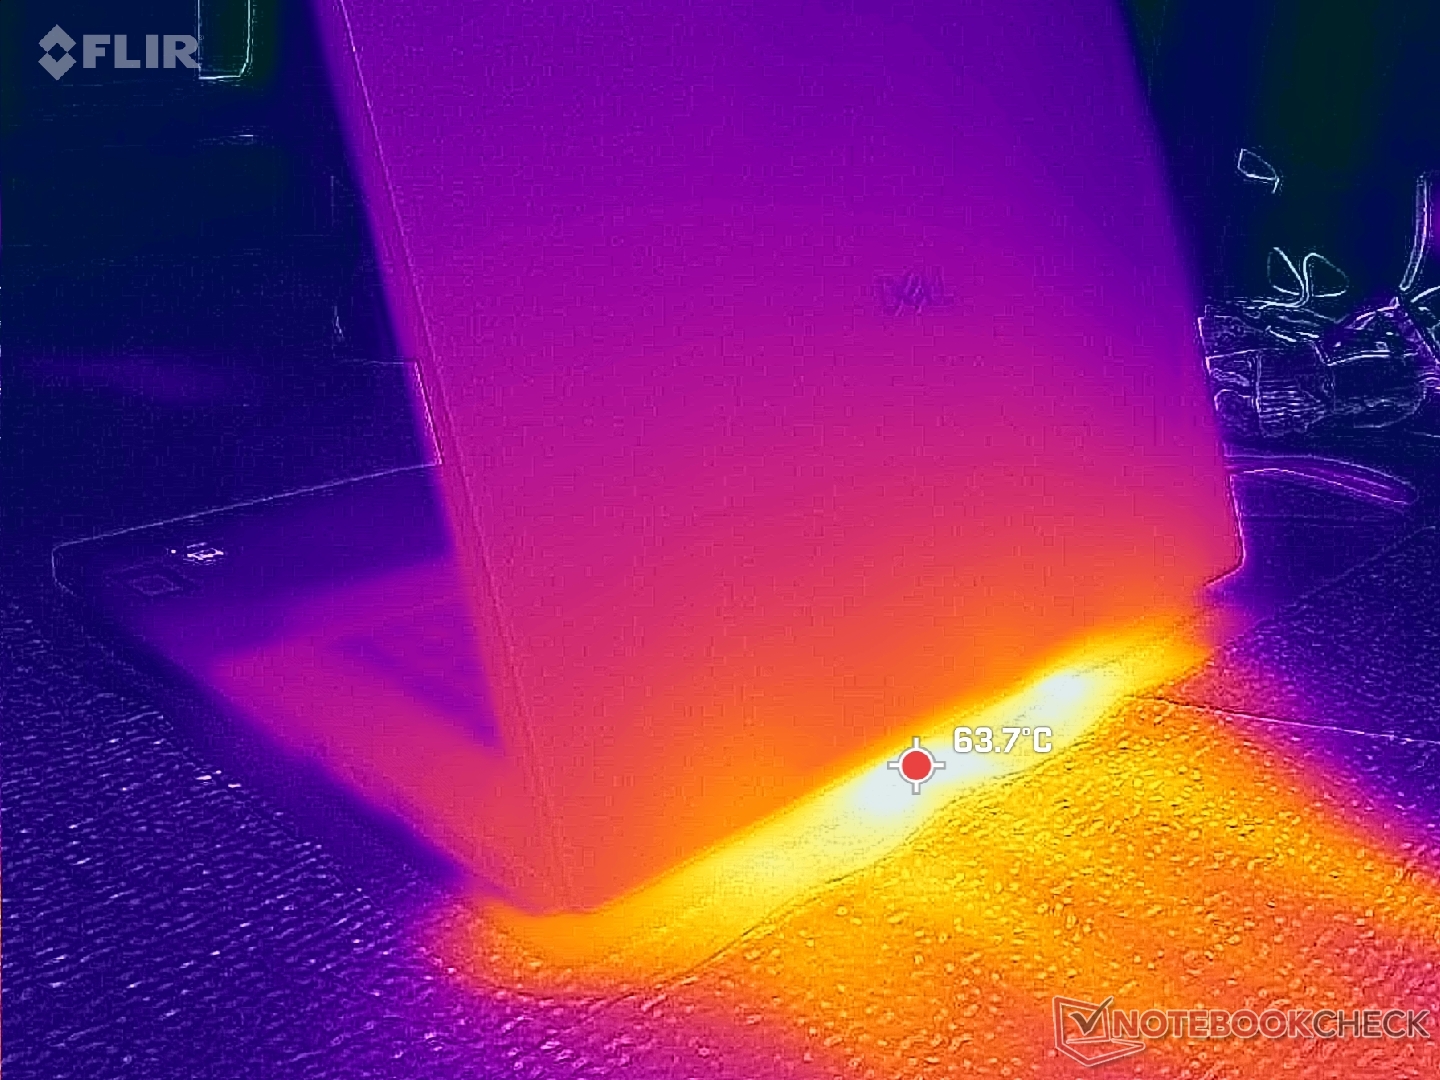
(±) De maximumtemperatuur aan de bovenzijde bedraagt 44.8 °C / 113 F, vergeleken met het gemiddelde van 38.2 °C / 101 F, variërend van 22.2 tot 69.8 °C voor de klasse Workstation.
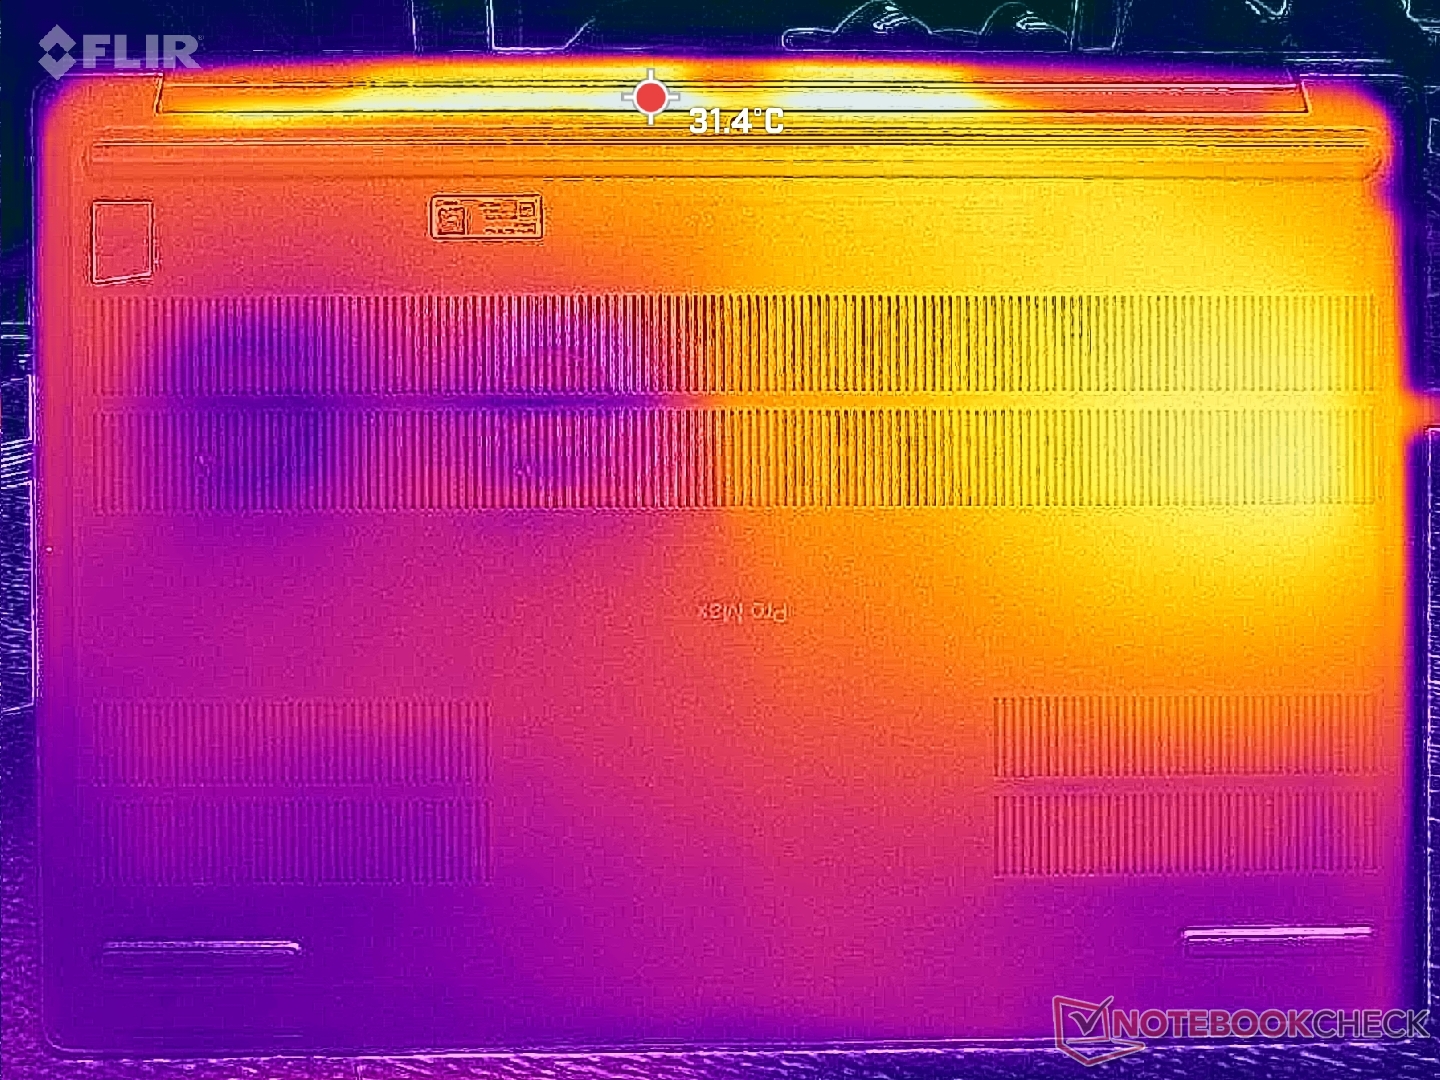
(-) De bodem warmt op tot een maximum van 47 °C / 117 F, vergeleken met een gemiddelde van 41.1 °C / 106 F
(+) Bij onbelast gebruik bedraagt de gemiddelde temperatuur voor de bovenzijde 29.3 °C / 85 F, vergeleken met het apparaatgemiddelde van 32 °C / 90 F.
(+) De handpalmsteunen en het touchpad bereiken maximaal de huidtemperatuur (32.8 °C / 91 F) en zijn dus niet heet.
(-) De gemiddelde temperatuur van de handpalmsteun van soortgelijke toestellen bedroeg 27.8 °C / 82 F (-5 °C / -9 F).
| Dell Pro Max 18 Plus MB18250 Ultra 9 285HX, RTX PRO 5000 Blackwell Generation Laptop | Schenker Key 18 Pro M25 RTX 5090 Ultra 9 275HX, GeForce RTX 5090 Laptop | HP ZBook X G1i 16 Ultra 7 265H, RTX PRO 2000 Blackwell Generation Laptop | HP ZBook Studio 16 G11 Ultra 9 185H, RTX 3000 Ada Generation Laptop | Lenovo ThinkPad P16s Gen 4 21RX000YGE Ryzen AI 9 HX PRO 370, Radeon 890M | Dell Pro Max 16 Plus Ultra 9 285HX, RTX PRO 5000 Blackwell Generation Laptop | |
|---|---|---|---|---|---|---|
| Heat | -1% | 10% | 1% | -16% | 1% | |
| Maximum Upper Side * (°C) | 44.8 | 47.5 -6% | 36 20% | 36.6 18% | 50.6 -13% | 40.4 10% |
| Maximum Bottom * (°C) | 47 | 52.8 -12% | 39.4 16% | 47.8 -2% | 54.3 -16% | 45.6 3% |
| Idle Upper Side * (°C) | 31.8 | 28.5 10% | 30.4 4% | 31.4 1% | 35.3 -11% | 32.8 -3% |
| Idle Bottom * (°C) | 31.4 | 30.1 4% | 31.8 -1% | 35.6 -13% | 38.5 -23% | 33 -5% |
* ... kleiner is beter
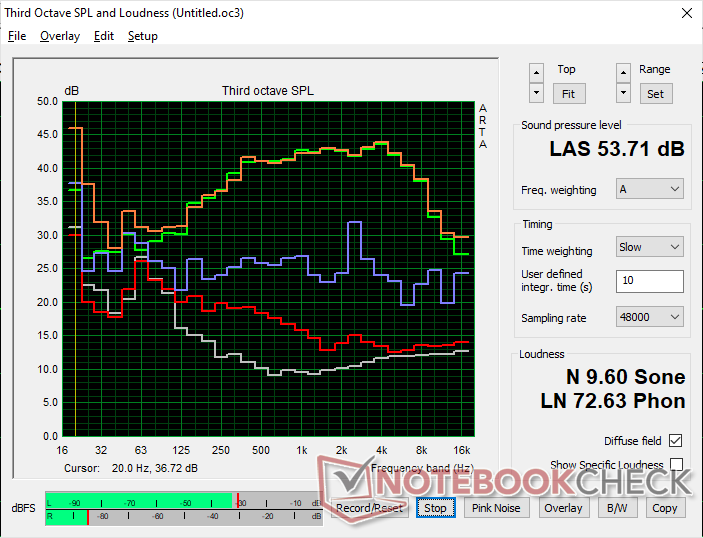
Luidsprekers
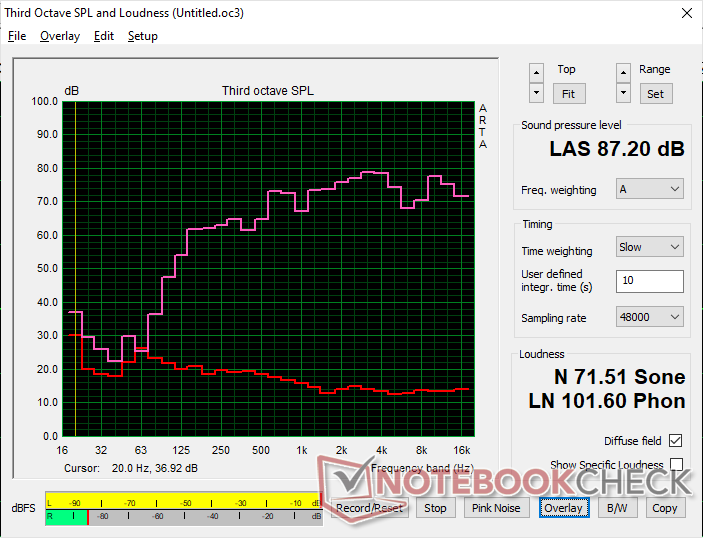
Dell Pro Max 18 Plus MB18250 audioanalyse
(+) | luidsprekers kunnen relatief luid spelen (87.2 dB)
Bas 100 - 315 Hz
(±) | verminderde zeebaars - gemiddeld 12.8% lager dan de mediaan
(±) | lineariteit van de lage tonen is gemiddeld (8.4% delta ten opzichte van de vorige frequentie)
Midden 400 - 2000 Hz
(+) | evenwichtige middens - slechts 4% verwijderd van de mediaan
(+) | de middentonen zijn lineair (6.6% delta ten opzichte van de vorige frequentie)
Hoog 2 - 16 kHz
(+) | evenwichtige hoogtepunten - slechts 4.7% verwijderd van de mediaan
(+) | de hoge tonen zijn lineair (5.9% delta naar de vorige frequentie)
Algemeen 100 - 16.000 Hz
(+) | het totale geluid is lineair (11.4% verschil met de mediaan)
Vergeleken met dezelfde klasse
» 13% van alle geteste apparaten in deze klasse waren beter, 4% vergelijkbaar, 83% slechter
» De beste had een delta van 7%, het gemiddelde was 17%, de slechtste was 35%
Vergeleken met alle geteste toestellen
» 7% van alle geteste apparaten waren beter, 2% gelijk, 91% slechter
» De beste had een delta van 4%, het gemiddelde was 24%, de slechtste was 134%
Apple MacBook Pro 16 2021 M1 Pro audioanalyse
(+) | luidsprekers kunnen relatief luid spelen (84.7 dB)
Bas 100 - 315 Hz
(+) | goede baars - slechts 3.8% verwijderd van de mediaan
(+) | de lage tonen zijn lineair (5.2% delta naar de vorige frequentie)
Midden 400 - 2000 Hz
(+) | evenwichtige middens - slechts 1.3% verwijderd van de mediaan
(+) | de middentonen zijn lineair (2.1% delta ten opzichte van de vorige frequentie)
Hoog 2 - 16 kHz
(+) | evenwichtige hoogtepunten - slechts 1.9% verwijderd van de mediaan
(+) | de hoge tonen zijn lineair (2.7% delta naar de vorige frequentie)
Algemeen 100 - 16.000 Hz
(+) | het totale geluid is lineair (4.6% verschil met de mediaan)
Vergeleken met dezelfde klasse
» 0% van alle geteste apparaten in deze klasse waren beter, 0% vergelijkbaar, 100% slechter
» De beste had een delta van 5%, het gemiddelde was 17%, de slechtste was 45%
Vergeleken met alle geteste toestellen
» 0% van alle geteste apparaten waren beter, 0% gelijk, 100% slechter
» De beste had een delta van 4%, het gemiddelde was 24%, de slechtste was 134%
Energiebeheer
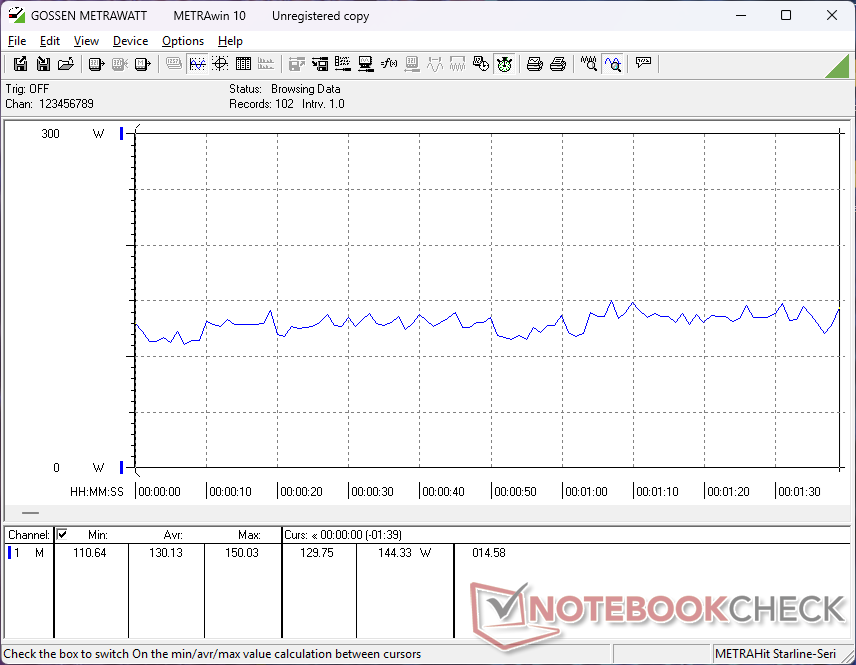
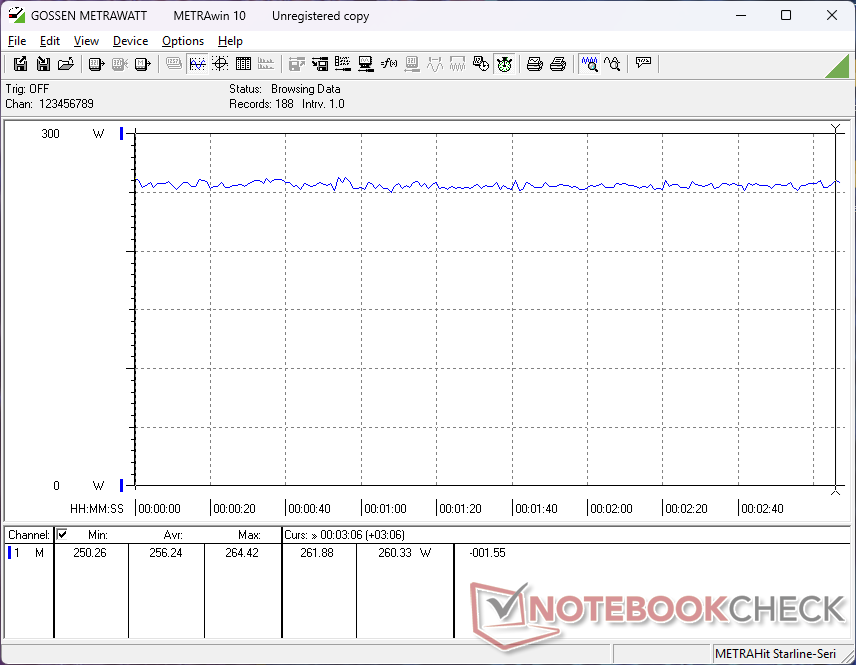
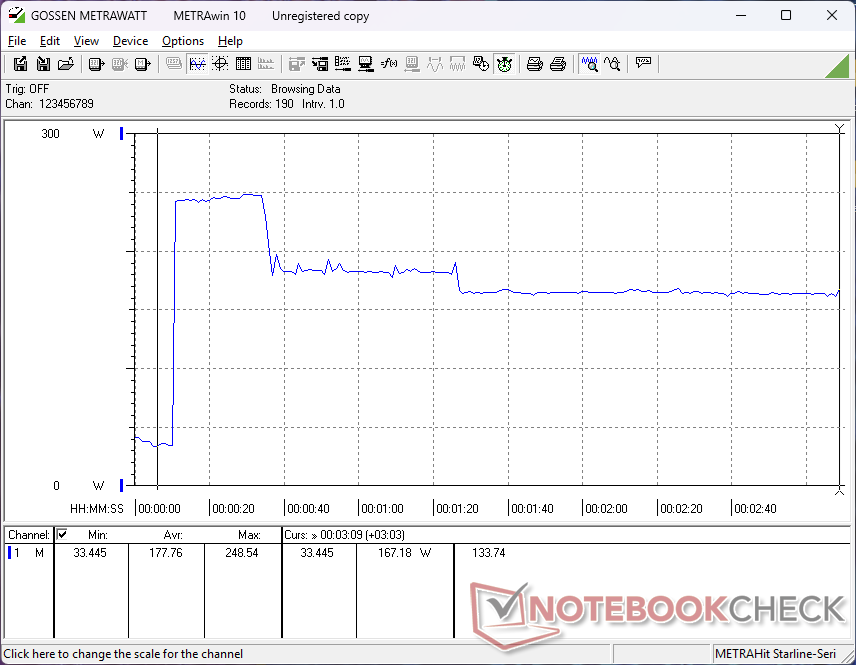
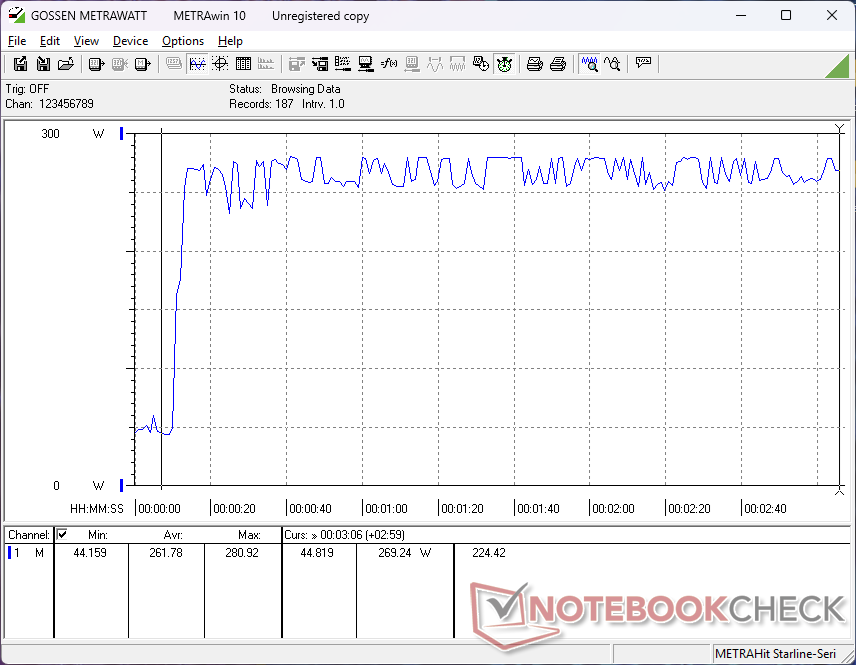
Stroomverbruik
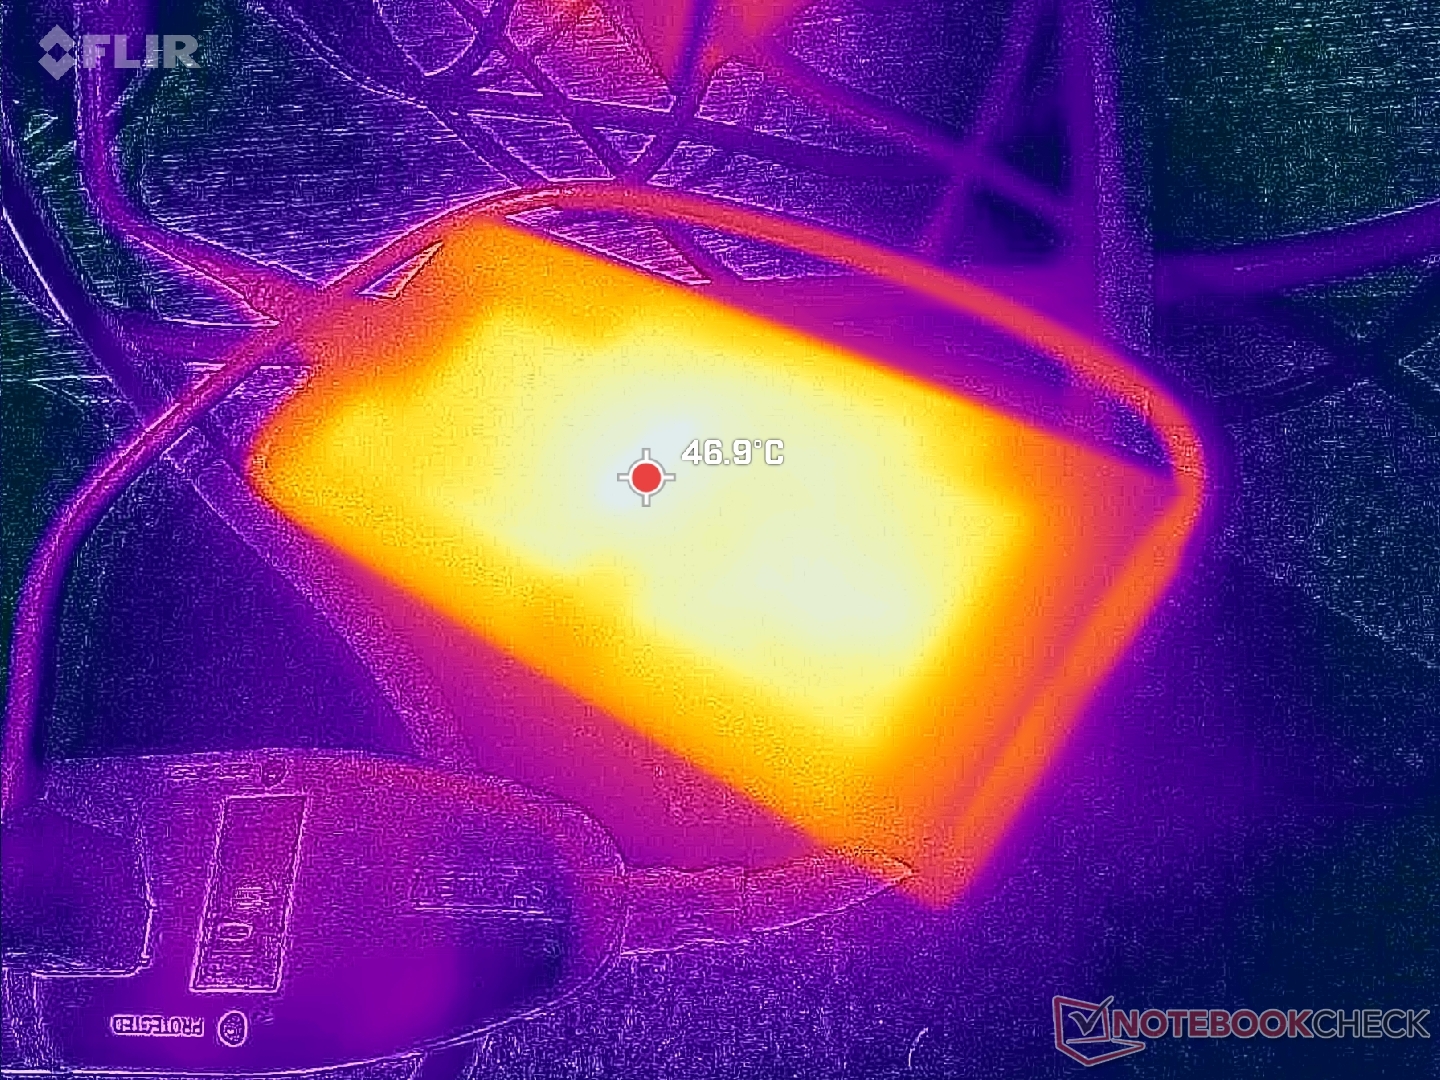
Bij inactiviteit kan het verbruik oplopen van 6 W tot 32 W bij de maximale helderheidsinstelling met de actieve discrete GPU. Dit minimum is lager dan bij de meeste andere 18-inch laptops, wat de relatief lange batterijlevensduur in de volgende sectie verklaart.
Het uitvoeren van veeleisende belastingen zoals Cyberpunk 2077 vraagt bijna 260 W van de 280 W (~16,2 x 7,8 x 2,3 cm) USB-C wisselstroomadapter. Verwacht dat de oplaadsnelheden erg traag zullen zijn als er veeleisende belastingen tegelijkertijd worden uitgevoerd. Ter vergelijking: de HP ZBook Fury G1i 18 wordt geleverd met een grotere 330 W netadapter voor mogelijk hogere prestatiemaxima en snellere oplaadsnelheden.
| Uit / Standby | |
| Inactief | |
| Belasting |
|
Key:
min: | |
| Dell Pro Max 18 Plus MB18250 Ultra 9 285HX, RTX PRO 5000 Blackwell Generation Laptop, , IPS, 2560x1600, 18" | Schenker Key 18 Pro M25 RTX 5090 Ultra 9 275HX, GeForce RTX 5090 Laptop, Samsung 9100 Pro 4 TB, IPS, 3840x2400, 18" | HP ZBook X G1i 16 Ultra 7 265H, RTX PRO 2000 Blackwell Generation Laptop, Samsung PM9A1 MZVL22T0HBLB, IPS, 2560x1600, 16" | HP ZBook Studio 16 G11 Ultra 9 185H, RTX 3000 Ada Generation Laptop, Kioxia XG8 KXG80ZNV1T02, IPS, 3840x2400, 16" | Lenovo ThinkPad P16 Gen 2 i7-14700HX, RTX 4000 Ada Generation Laptop, SK hynix PC801 HFS001TEJ9X162N, IPS, 2560x1600, 16" | Dell Pro Max 16 Plus Ultra 9 285HX, RTX PRO 5000 Blackwell Generation Laptop, SK hynix PCB01 HFS001TFM9X186N, OLED, 3840x2400, 16" | |
|---|---|---|---|---|---|---|
| Power Consumption | -38% | 49% | 4% | 7% | -97% | |
| Idle Minimum * (Watt) | 6.1 | 14 -130% | 4.1 33% | 14 -130% | 7.9 -30% | 35.1 -475% |
| Idle Average * (Watt) | 15.2 | 21.9 -44% | 9 41% | 22.4 -47% | 13.1 14% | 39.2 -158% |
| Idle Maximum * (Watt) | 32.4 | 22.3 31% | 9.4 71% | 25.7 21% | 24.2 25% | 56 -73% |
| Load Average * (Watt) | 130.1 | 149.5 -15% | 86.7 33% | 90.2 31% | 127.4 2% | 130.2 -0% |
| Cyberpunk 2077 ultra external monitor * (Watt) | 252 | 336 -33% | 102 60% | 120.3 52% | 219 13% | 213 15% |
| Cyberpunk 2077 ultra * (Watt) | 256 | 333 -30% | 106.1 59% | 125.4 51% | 225 12% | 229 11% |
| Load Maximum * (Watt) | 280.9 | 415.4 -48% | 152.9 46% | 142 49% | 248.5 12% | 285.2 -2% |
* ... kleiner is beter
Stroomverbruik Cyberpunk / Stresstest
Stroomverbruik externe monitor
Levensduur batterij
De looptijden zijn verrassend lang bij surfen op het web in de geïntegreerde grafische modus en het gebalanceerde energieprofiel. We zijn in staat om er meer dan 9 uur echt gebruik uit te persen, wat uren langer is dan wat we hebben vastgelegd op de Lenovo ThinkPad P16 of HP ZBook Studio 16 G11.
| Dell Pro Max 18 Plus MB18250 Ultra 9 285HX, RTX PRO 5000 Blackwell Generation Laptop, 96 Wh | Schenker Key 18 Pro M25 RTX 5090 Ultra 9 275HX, GeForce RTX 5090 Laptop, 98 Wh | HP ZBook X G1i 16 Ultra 7 265H, RTX PRO 2000 Blackwell Generation Laptop, 83 Wh | HP ZBook Studio 16 G11 Ultra 9 185H, RTX 3000 Ada Generation Laptop, 86 Wh | Lenovo ThinkPad P16 Gen 2 i7-14700HX, RTX 4000 Ada Generation Laptop, 94 Wh | Dell Pro Max 16 Plus Ultra 9 285HX, RTX PRO 5000 Blackwell Generation Laptop, 96 Wh | |
|---|---|---|---|---|---|---|
| Batterijduur | ||||||
| WiFi v1.3 (h) | 9.3 | 5.8 -38% | 12.5 34% | 4.8 -48% | 2.5 -73% | 3.6 -61% |
Notebookcheck Beoordeling
Dell's grootste mobiele workstation tot nu toe is ook een van de beste en snelste, maar het heeft vreemd genoeg minder beeldschermopties dan op de kleinere 16-inch tegenhanger.
Dell Pro Max 18 Plus MB18250
- 19-11-2025 v8
Allen Ngo
 Total Sustainability Score:
 Potentiële concurrenten in vergelijking
Afbeelding | Model / recensie | prijs | Gewicht | Hoogte | Scherm |
|---|---|---|---|---|---|
1. 88.9%  | Dell Pro Max 18 Plus MB18250 Intel Core Ultra 9 285HX ⎘ NVIDIA RTX PRO 5000 Blackwell Generation Laptop ⎘ 128 GB Geheugen | Amazon: Catalogusprijs: 6000 USD | 3.6 kg | 30.2 mm | 18.00" 2560x1600 168 PPI IPS |
2. 84.6%  | Schenker Key 18 Pro M25 RTX 5090 Intel Core Ultra 9 275HX ⎘ NVIDIA GeForce RTX 5090 Laptop ⎘ 256 GB Geheugen, 4096 GB SSD | Amazon: Catalogusprijs: 6400€ | 4.1 kg | 29.5 mm | 18.00" 3840x2400 252 PPI IPS |
3. 87.4%  | HP ZBook X G1i 16 Intel Core Ultra 7 265H ⎘ NVIDIA RTX PRO 2000 Blackwell Generation Laptop ⎘ 64 GB Geheugen, 2048 GB SSD | Amazon: Catalogusprijs: 2700 USD | 2.2 kg | 23 mm | 16.00" 2560x1600 189 PPI IPS |
4. 84.2%  | HP ZBook Studio 16 G11 Intel Core Ultra 9 185H ⎘ NVIDIA RTX 3000 Ada Generation Laptop ⎘ 64 GB Geheugen, 1024 GB SSD | Amazon: Catalogusprijs: 4300 USD | 1.8 kg | 19 mm | 16.00" 3840x2400 283 PPI IPS |
5. 82%  | Lenovo ThinkPad P16s Gen 4 21RX000YGE AMD Ryzen AI 9 HX PRO 370 ⎘ AMD Radeon 890M ⎘ 64 GB Geheugen, 1024 GB SSD | Amazon: Catalogusprijs: 2440 Euro | 2 kg | 23 mm | 16.00" 1920x1200 142 PPI IPS LED |
6. 88.4%  | Dell Pro Max 16 Plus Intel Core Ultra 9 285HX ⎘ NVIDIA RTX PRO 5000 Blackwell Generation Laptop ⎘ 128 GB Geheugen, SSD | Amazon: Catalogusprijs: 5000 USD | 2.8 kg | 30.9 mm | 16.00" 3840x2400 283 PPI OLED |
Transparantie
De selectie van te beoordelen apparaten wordt gemaakt door onze redactie. Het testexemplaar werd ten behoeve van deze beoordeling door de fabrikant of detailhandelaar in bruikleen aan de auteur verstrekt. De kredietverstrekker had geen invloed op deze recensie, noch ontving de fabrikant vóór publicatie een exemplaar van deze recensie. Er bestond geen verplichting om deze recensie te publiceren. Als onafhankelijk mediabedrijf is Notebookcheck niet onderworpen aan het gezag van fabrikanten, detailhandelaren of uitgevers.
[transparency_disclaimer]Dit is hoe Notebookcheck test
Elk jaar beoordeelt Notebookcheck onafhankelijk honderden laptops en smartphones met behulp van gestandaardiseerde procedures om ervoor te zorgen dat alle resultaten vergelijkbaar zijn. We hebben onze testmethoden al zo'n 20 jaar voortdurend ontwikkeld en daarbij de industriestandaard bepaald. In onze testlaboratoria wordt gebruik gemaakt van hoogwaardige meetapparatuur door ervaren technici en redacteuren. Deze tests omvatten een validatieproces in meerdere fasen. Ons complexe beoordelingssysteem is gebaseerd op honderden goed onderbouwde metingen en benchmarks, waardoor de objectiviteit behouden blijft. Meer informatie over onze testmethoden kunt u hier vinden.

